


![[[@Hill2019-ik]](https://doi.org/10.1038/s41467-019-12486-x)](https://media.springernature.com/full/springer-static/image/art%3A10.1038%2Fs41467-019-12486-x/MediaObjects/41467_2019_12486_Fig1_HTML.png)


- Multiple structural, functional methods
- Different levels of spatial & temporal analysis
- Functional tools have different strengths & weaknesses
2019-11-17 09:30:49
Prelude
Announcements
Today’s topics
- Wrap-up on structural methods
- Functional methods
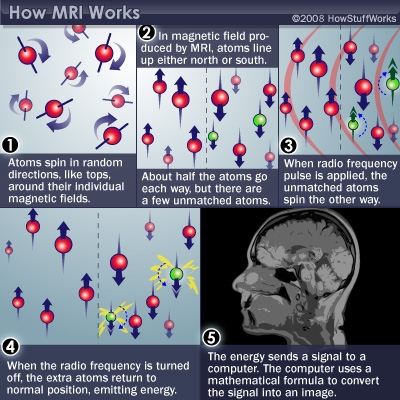
Magnetic Resonance Imaging (MRI)
- Magnetic resonance a property of some isotopes and complex molecules
- Hydrogen (\(H\)), common in water & fat, is one
- In magnetic field, \(H\) atoms absorb and release radio frequency (RF) energy
- \(H\) atoms align with strong magnetic field
- Applying RF pulse perturbs alignment
- Rate/timing of realignment varies by tissue
- Realignment gives off radio frequency (RF) signals
- Strength of RF ~ density of \(H\) (or other target)
- K-space (frequency/phase) -> anatomical space
MRI
Structural MRI
- Tissue density/type differences
- Gray matter (nerve cells & dendrites) vs. white matter (axon fibers)
- Spectroscopy (specific metabolites)
- Region sizes/volumes
Aside about Fourier analysis/synthesis
- Fourier analysis (complex signal -> frequencies in that signal)
- Fourier synthesis (frequencies in signal -> composite of those frequencies)
- In MRI, \(K\) space is frequency of magnetic resonance; image space is what we see


Voxel-based morphometry (VBM)
Volume differences in schizophrenic patients vs. controls 
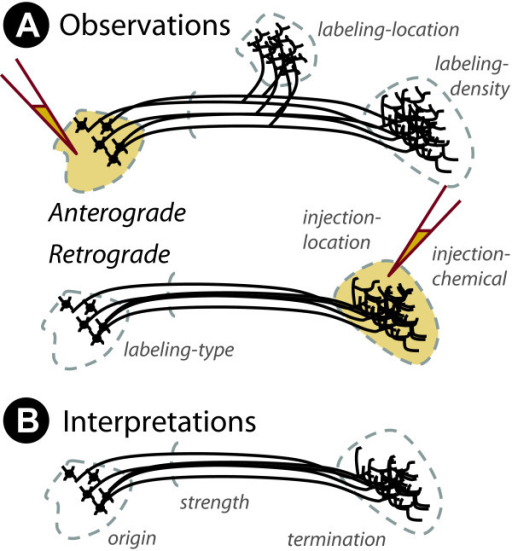
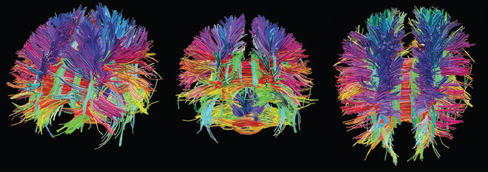
What is the wiring diagram (“connectome”)?

Retrograde (output -> input) vs. anterograde (input -> output) tracers
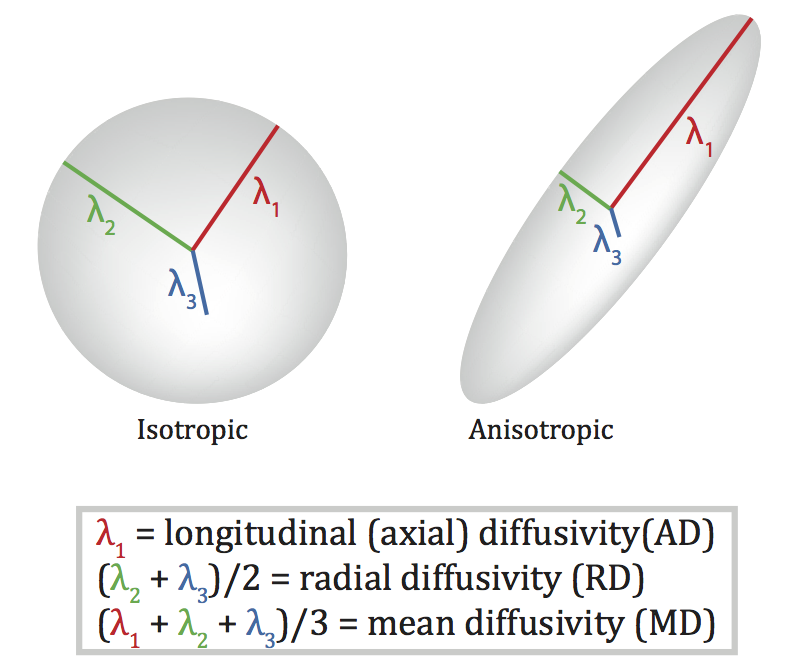
Diffusion Tensor Imaging (DTI)
- Structural MRI technique
- Diffusion tensor: measurement of spatial pattern of \(H_2O\) diffusion in small volume
- Uniform (“isotropic”) vs. non-uniform (“anisotropic”)
- Strong anisotropy suggests large # of axons with similar orientations (fiber tracts)

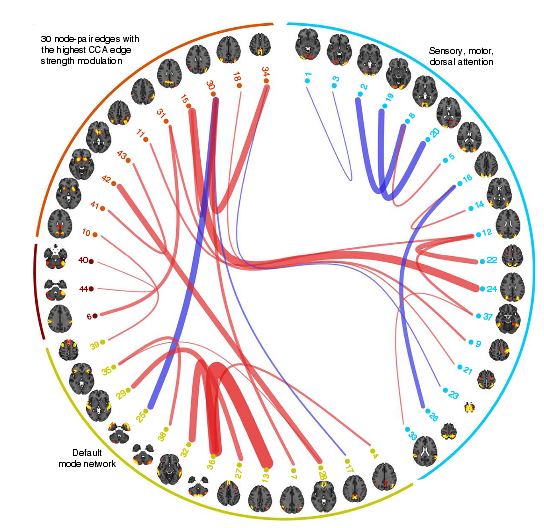
Connectome as matrix
Functional methods
- Recording from the brain
- Interfering with the brain
- Stimulating the brain
- Simulating the brain
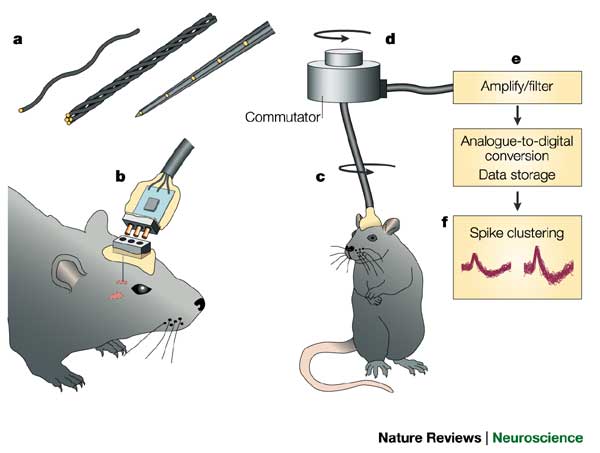
Recording from the brain
- Single/multi unit recording
- Microelectrodes
- Small numbers of nerve cells
Single/multi-unit Recording
Single/multi-unit recording
- What does neuron X respond to?
- Great temporal (ms), spatial resolution (um)
- Invasive
- Rarely suitable for humans, but…
Electrocorticography (ECoG)

Single-cell studies ask…
- How does firing frequency, timing vary with behavior?
Combinations of micro and meso-scale methods
Positron Emission Tomography (PET)
Positron Emission Tomography (PET)
- Radioactive tracers (glucose, oxygen)
- Positron decay activates paired detectors
- Tomographic techniques reconstruct 3D geometry
- Experimental condition - control
- Average across individuals
More on PET
- Temporal (~ s) and spatial (mm-cm) resolution worse than fMRI
- Radioactive exposures + mildly invasive
- Dose < airline crew exposure in 1 yr
Functional Magnetic Resonance Imaging (fMRI)
- Neural activity -> local \(O_2\) consumption increase
- Blood Oxygen Level Dependent (BOLD) response
- Oxygenated vs. deoxygenated hemoglobin ≠ magnetic susceptibility
- How do regional blood \(O_2\) levels (& flow & volume) vary with behavior X?
- MRI “signals” relate to the speed (1/T) of “relaxation” of the perturbed nuclei to their state of alignment with the main (\(B_0\)) magnetic field.
- Imaging protocols emphasize different time constants of this relaxation (\(T1\), \(T2\), \(T2^*\)); \(T^2*\) for BOLD imaging
Evaluating fMRI
- Non-invasive, but expensive
- Moderate but improving (mm) spatial, temporal (~sec) resolution
- Spatial limits due to
- field strength (@ 3T \(~3mm^3\) voxel)
- Physiology of hemodynamic response
- Temporal limits due to
- Hemodynamic Response Function (HRF): ~ 1s delay plus 3-6 s ramp-up
- Speed of image acquisition
- Indirect measure of neural activity
Hemodynamic Response Function (HRF)
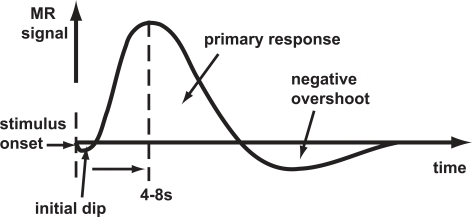
Generate “predicted” BOLD response to event; compare to actual
Higher field strengths (3 Tesla vs. 7 Tesla)
Multi-modal whole brain methods
I want some power…
“Assuming a realistic range of prior probabilities for null hypotheses, false report probability is likely to exceed 50% for the whole literature.”
- Solution
- Make data, materials (analysis code) more widely and openly available
- OpenNeuro.org, Human Connectome Project, Databrary.or, etc.
- Increases sample size, improves detection of small effects
Functional Near-infrared Spectroscopy (fNIRS)
- Near infrared light penetrates scalp and skull, refracted by brain tissue
- Returned signal altered by blood \(O_2\) levels
- Time course (temporal resolution) ~ BOLD fMRI; spatial resolution low
Source: https://nirx.net
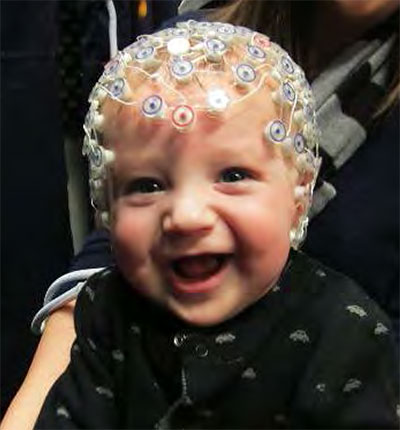
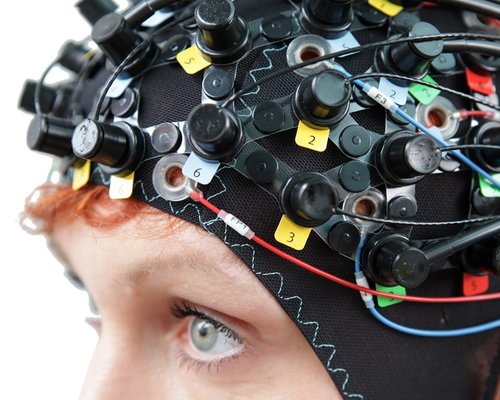
Electroencephalography (EEG)
- How does it work?
- Electrodes on scalp or brain surface
- What do we measure?
- Voltage differences between source and reference electrode
- Combined activity of huge # of neurons
How does EEG arise?
- Current/voltage gradients between apical (near surface) dendrites and basal (deeper) dendrites and cell body/soma

Collecting EEG
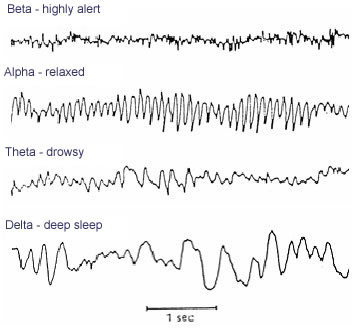
EEG
- High temporal, poor spatial resolution
- Analyze activity in different ‘bands’ of frequencies
- LOW: deep sleep (delta or \(\delta\) band)
- MIDDLE: Quiet, alert state (alpha \(\alpha\) band)
- HIGHER: Sensorimotor activity reflecting observed actions? (mu or \(\mu\) band), (Hobson & Bishop, 2017)
- HIGHER STILL: “Binding” information across senses or plasticity? (gamma or \(\gamma\) band), (Amo et al., 2017)
Event-related potentials (ERPs)
- EEGs time-locked to some event
- …Averaged over many such events (trials)

Brain Computer Interface (BCI)
Magneto-encephalography (MEG)
- Like EEG, but measuring magnetic fields
- High temporal resolution
- Magnetic fields propagate w/o distortion
- But are orthogonal to electric field
- Requires shielded chamber (to keep out strong magnetic fields)
- ++ cost vs. EEG
MEG

Figure 1. A paediatric MEG system: a Experimental setup for three participants age 2- (left), 5- (centre) and 24-years (right). OPMs, housed in a modified bike helmet, measured the MEG signal. b Time-frequency spectra from a single (synthesised gradiometer) channel. Changes in neural oscillations are shown; blue indicates a reduction in oscillatory amplitude relative to baseline; yellow indicates an increase. Note reduction in beta (13–30 Hz) and mu (8–13 Hz) amplitude. c The spatial signature of beta modulation during the period of tactile stimulation (0 s < t < 2 s) (blue overlay)
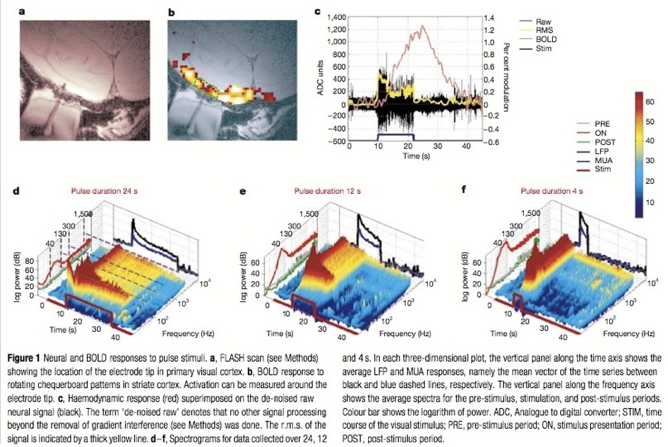
How do EEG/MEG and fMRI relate?
How do EEG/MEG and fMRI relate?
- BOLD fMRI likely reflects presynaptic input to area
- EEG/MEG likely reflects postsynaptic response to those inputs
- (Logothetis et al., 2001) and (Logothetis & Wandell, 2004)
Manipulating the brain
- Interfering with it
- Stimulating it
Interfering with the brain
- Nature’s“experiments”
- Stroke, head injury, tumor
- Neuropsychology
Phineas Gage
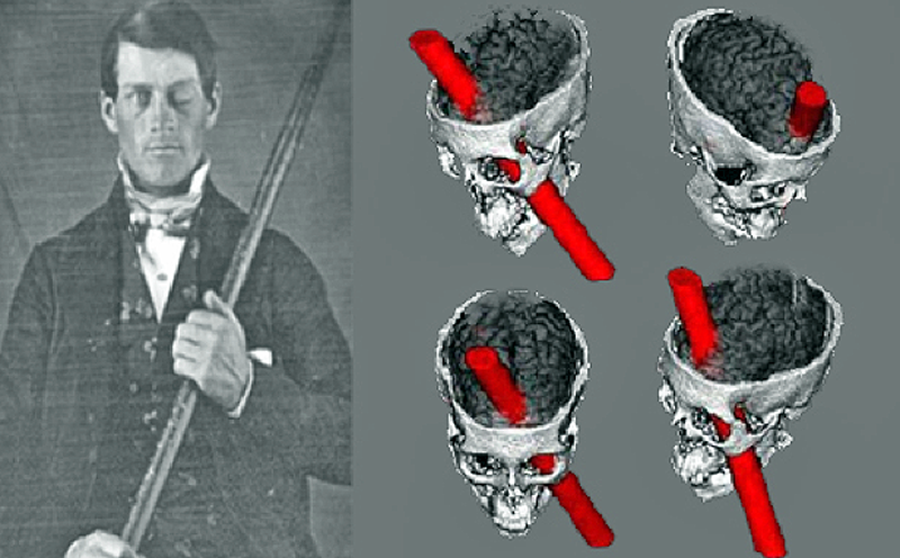

Evaluating neuropsychological methods
- Logic: IF damage to area X impairs performance, THEN region critical for behavior Y
- Double dissociation: Damage to area Z leaves behavior Y intact
- Weak spatial/temporal resolution
Stimulating the brain
- Electrical (Direct Current Stimulation - DCS)
- Pharmacological
- Magnetic (Transcranial magnetic stimulation - TMS)
Stimulating the brain
- Spatial/temporal resolution?
- Assume stimulation mimics natural activity?
Deep brain stimulation as therapy
- Depression
- Epilepsy
- Parkinson’s Disease
Optogenetics
- Gene splicing techniques insert light-sensitive molecules into neuronal membranes
- Application of light at specific wavelengths alters neuronal function
- Cell-type specific and temporally precise control
- Mimics brain activity
Simulating the brain
- Computer/mathematical models of brain function
- Example: neural networks
- Cheap, noninvasive, can be stimulated or “lesioned”
Main points
References
Amo, C., De Santiago, L., Zarza Luciáñez, D., León Alonso-Cortés, J. M., Alonso-Alonso, M., Barea, R., & Boquete, L. (2017). Induced gamma band activity from EEG as a possible index of training-related brain plasticity in motor tasks. PloS One, 12(10), e0186008. https://doi.org/10.1371/journal.pone.0186008
Barson, D., Hamodi, A. S., Shen, X., Lur, G., Constable, R. T., Cardin, J. A., … Higley, M. J. (2019). Simultaneous mesoscopic and two-photon imaging of neuronal activity in cortical circuits. Nature Methods. https://doi.org/10.1038/s41592-019-0625-2
Fultz, N. E., Bonmassar, G., Setsompop, K., Stickgold, R. A., Rosen, B. R., Polimeni, J. R., & Lewis, L. D. (2019). Coupled electrophysiological, hemodynamic, and cerebrospinal fluid oscillations in human sleep. Science, 366(6465), 628–631. https://doi.org/10.1126/science.aax5440
Hill, R. M., Boto, E., Holmes, N., Hartley, C., Seedat, Z. A., Leggett, J., … Brookes, M. J. (2019). A tool for functional brain imaging with lifespan compliance. Nature Communications, 10(1), 4785. https://doi.org/10.1038/s41467-019-12486-x
Hobson, H. M., & Bishop, D. V. M. (2017). The interpretation of mu suppression as an index of mirror neuron activity: Past, present and future. Royal Society Open Science, 4(3), 160662. https://doi.org/10.1098/rsos.160662
Logothetis, N. K., Pauls, J., Augath, M., Trinath, T., & Oeltermann, A. (2001). Neurophysiological investigation of the basis of the fMRI signal. Nature, 412(6843), 150–157. https://doi.org/10.1038/35084005
Logothetis, N. K., & Wandell, B. A. (2004). Interpreting the BOLD signal. Annu. Rev. Physiol., 66(1), 735–769. https://doi.org/10.1146/annurev.physiol.66.082602.092845
Pomarol-Clotet, E., Canales-Rodrı'guez, E. J., Salvador, R., Sarró, S., Gomar, J. J., Vila, F., … McKenna, P. J. (2010). Medial prefrontal cortex pathology in schizophrenia as revealed by convergent findings from multimodal imaging. Mol. Psychiatry, 15(8), 823–830. https://doi.org/10.1038/mp.2009.146
Sladky, R., Baldinger, P., Kranz, G. S., Tröstl, J., Höflich, A., Lanzenberger, R., … Windischberger, C. (2013). High-resolution functional MRI of the human amygdala at 7 T. European Journal of Radiology, 82(5), 728–733. https://doi.org/10.1016/j.ejrad.2011.09.025