Methods in Cognitive and Affective Neuroscience
Rick Gilmore
2019-09-10 16:04:40
Evaluating methods
What are we measuring?
- Structure
- Activity
- Why not function?
What is question are we asking?
- Structure X -> Structure Y
- Structure X -> Function Y
Strengths & Weaknesses
- Cost
- Invasiveness
- Spatial/temporal resolution
Spatial resolution


Types
- Structural
- Anatomy
- Connectivity/connectome
- Activity/Functional
- What does it do?
- Physiology
Structural methods
Cellular
- Cell/axon stains
- Cellular types, distribution, concentration, microanatomy
- Connectivity
Golgi stain – whole cells, but small %
 https://connectomethebook.com/wp-content/uploads/2011/11/Brainforest17_1119.jpg

 https://wam.umn.edu/calendar/cajal/
Camillo Golgi


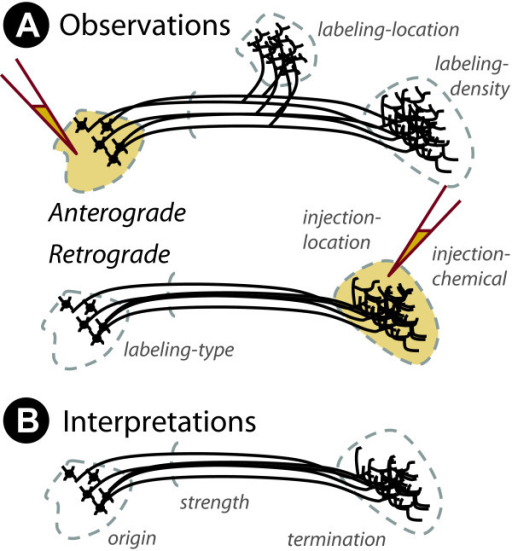
Tracers
- Retrograde (output -> input)
- Anterograde (input -> output)
 https://openi.nlm.nih.gov/imgs/512/348/3176268/3176268_1471-2105-12-351-2.png
Evaluating cellular techniques
- Invasive (in humans post-mortem only)
- High spatial resolution, but poor/coarse temporal
- Why?
Mapping large-scale structures
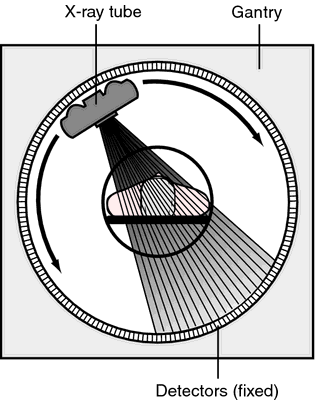
Computed axial tomography (CAT), CT
- Computed Tomography (CT)
- X-ray based
 https://img.tfd.com/mk/T/X2604-T-22.png
Tomography
 https://static.howstuffworks.com/gif/cat-scan-pineapple.jpg

Magnetic Resonance Imaging (MRI)
- Magnetic resonance a property of some isotopes and complex molecules
- Hydrogen (\(H\)), common in water & fat, is one
- In magnetic field, \(H\) atoms absorb and release radio frequency (RF) energy
- \(H\) atoms align with strong magnetic field

https://s.hswstatic.com/gif/mri-steps.jpg
- Applying RF pulse perturbs alignment
- Rate/timing of realignment varies by tissue
- Realignment gives off radio frequency (RF) signals
- Strength of RF ~ density of \(H\) (or other target)
- K-space (frequency/phase) -> anatomical space
Structural MRI
- Tissue density/type differences
- Gray matter (nerve cells & dendrites) vs. white matter (axon fibers)
- Region sizes/volumes

Spectroscopy (specific metabolites)

Voxel-based morphometry (VBM)
- Quantitative analyses of size/volume
- Example: volume differences in schizophrenic patients vs. controls using statistical maps of size differences

Diffusion Tensor Imaging (DTI)
- Structural MRI technique
- Diffusion tensor: measurement of spatial pattern of \(H_2O\) diffusion in small volume
- Uniform (“isotropic”) vs. non-uniform (“anisotropic”)
- Strong anisotropy suggests large # of axons with similar orientations (fiber tracts)

- Fractional Anisotropy (FA), radial diffusivity (RD), mean diffusivity (MD) measures of “non-uniformity” of diffusion tensor
- Connecting tensors or fiber tract tracing


Connectome
- What is the wiring diagram?


Functional (activity) methods
- Recording from the brain
- Interfering with the brain
- Stimulating the brain
- Simulating the brain
Recording from the brain
Single/multi unit recording
- Microelectrodes
- Small numbers of nerve cells

https://www.nature.com/nrn/journal/v5/n11/images/nrn1535-i1.jpg
- What does neuron X respond to?
- High temporal (ms) + spatial resolution (um)
- Invasive
- Rarely suitable for humans, but…
Electrocorticography (ECoG)**

Single-cell studies ask…
- How does firing frequency, timing vary with behavior?
Positron Emission Tomography (PET)
- Radioactive tracers (glucose, oxygen)
- Positron decay activates paired detectors
- Tomographic techniques reconstruct 3D geometry
- Experimental condition - control
- Average across individuals
- Temporal (~ s) and spatial (mm-cm) resolution worse than fMRI
- Radioactive exposures + mildly invasive
- Dose < airline crew exposure in 1 yr
Functional Magnetic Resonance Imaging (fMRI)
- Neural activity -> local \(O_2\) consumption increase
- Blood Oxygen Level Dependent (BOLD) response
Oxygenated vs. deoxygenated hemoglobin ≠ magnetic susceptibility
- How do regional blood \(O_2\) levels (& flow & volume) vary with behavior X?
- MRI “signals” relate to the speed (1/T) of “relaxation” of the perturbed nuclei to their state of alignment with the main (\(B_0\)) magnetic field.
Imaging protocols emphasize different time constants of this relaxation (\(T^1\), \(T^2\), \(T^{2*}\)); \(T^{2*}\) for BOLD imaging
Evaluating fMRI
- Non-invasive, but expensive
- Moderate but improving (mm) spatial, temporal (~sec) resolution
- Spatial limits due to
- field strength (@ 3T \(~3mm^3\) voxel)
- Physiology of hemodynamic response
- Temporal limits due to
- Hemodynamic Response Function (HRF): ~ 1s delay plus 3-6 s ramp-up
- Speed of image acquisition (\(TR\) is time of image acquisition, usually 2-3s for whole brain studies)
- Indirect measure of neural activity
Hemodynamic Response Function (HRF)

Typical analysis…
Generate “predicted” BOLD response to event; compare to actual

Average across individual participants and plot statistical maps (in color space) on top of structural image.

Effects of higher field strengths (3 Tesla vs. 7 Tesla)
 (Sladky et al., 2013)
Functional Near-infrared Spectroscopy (fNIRS or NIRS)
- Near infrared light penetrates scalp and skull, refracted by brain tissue
- Returned signal altered by blood \(O_2\) levels
- Time course (temporal resolution) ~ BOLD fMRI; spatial resolution low


Source: https://nirx.net
Electroencephalography (EEG)

- How does it work?
- Electrodes on scalp or brain surface
- What do we measure?
- Voltage differences between source and reference electrode
- Combined activity of huge # of neurons
- Thought to arise from current/voltage gradients between apical (near surface) dendrites and basal (deeper) dendrites and cell body/soma

 https://sfari.org/images/images-2013-folder/images-sfn-2013/20131110sfneeg
- High temporal, poor spatial resolution
- Analyze activity in different ‘bands’ of frequencies
- LOW: deep sleep (delta or \(\delta\) band)
- MIDDLE: Quiet, alert state (alpha \(\alpha\) band)
- HIGHER: Sensorimotor activity reflecting observed actions? (mu or \(\mu\) band), (Hobson & Bishop, 2017)
- HIGHER STILL: “Binding” information across senses or plasticity? (gamma or \(\gamma\) band), (Amo et al., 2017)
Analyze in frequency domains
 https://www.peakmind.co.uk/images/frequency.jpg

Event-related potentials (ERPs)
- EEGs time-locked to some event
- …Averaged over many such events (trials)

Brain Computer Interface (BCI)
- May rely on EEG/ERP or electrocorticographic methods

Magneto-encephalography (MEG)
- Like EEG, but measuring magnetic fields
- High temporal resolution
- Magnetic fields propagate w/o distortion
- But are orthogonal to electric field
- Requires shielded chamber (to keep out strong magnetic fields)
- ++ cost vs. EEG


- BOLD fMRI likely reflects presynaptic input to area
- EEG/MEG likely reflects postsynaptic response to those inputs
- (Logothetis et al., 2001) and (Logothetis & Wandell, 2004)


