PSY 511
Methods
Rick Gilmore
2020-09-09 07:44:23
- Neuroscience methods
- Structural methods
- Functional methods
- Recording from the brain
- Functional Magnetic Resonance Imaging (fMRI)
- Manipulating the brain
- Stimulating the brain
- Simulating the brain
- References
Neuroscience methods
Evaluating methods
What are we measuring?
- Structure
- Activity
- Why not function?
What is the question?
- Structure X -> Structure Y
- Structure X -> Function Y
Evaluating methods
Strengths & Weaknesses
- Cost
- Invasiveness
- Spatial/temporal resolution
Spatial resolution

…and temporal resolution

Types of methods
- Structural
- Anatomy
- Connectivity/connectome
- Functional
- What does it do?
- Physiology/Activity
Structural methods
Mapping microstructure
- Cell/axon stains
- Cellular distribution, concentration, microanatomy
Golgi stain
- whole cells, but small %


Nissl stain
- Only cell bodies
- Cell density ~ color intensity


Evaluating micro/cellular techniques
- Invasive (in humans post-mortem only)
- High spatial resolution, but poor/coarse temporal
Mapping macro-structures
Computed axial tomography (CAT), CT
- X-ray based

Tomography


Here’s a CT image of two brains, the one on the right has an intracerebral hemorrhage.
Magnetic Resonance Imaging (MRI)
What it measures/how it works
- Magnetic resonance a property of some isotopes and complex molecules
- Hydrogen (\(H\)), common in water & fat, is one
- In magnetic field, \(H\) atoms absorb and release radio frequency (RF) energy
- \(H\) atoms align with strong magnetic field
- Applying RF pulse perturbs alignment
- Rate/timing of realignment varies by tissue
- Realignment gives off radio frequency (RF) signals
- Strength of RF ~ density of \(H\) (or other target)
- K-space (frequency/phase) -> anatomical space

Structural MRI
- Tissue density/type differences
- Gray matter (nerve cells & dendrites) vs. white matter (axon fibers)

MR Spectroscopy (specific metabolites)

- Region sizes/volumes
Voxel-based morphometry (VBM)
- MRI technique for measuring brain sizes/volumes
![[[@Pomarol-Clotet2010-tq]](https://dx.doi.org/10.1038/mp.2009.146)](data:image/png;base64,iVBORw0KGgoAAAANSUhEUgAAAe4AAAF3CAIAAADsHD+KAACAAElEQVR42ux9B1wTy/a/7/d/VymBUKzYld4ChJIECL333nvvvfdepIh0UBRUsCuoCAKKioqKWFERFcXe9drb9X92NwnBcp/3vVu81+znGA+byWYzO/Od7zlz5sykXz5+BPmAHu9/+QD6mzfvPnz4CDrIh4+/ICd/AQ1eP759+/7t+3fYGeTkR0RYOktn6Sydpf+1+iTk748f379//xEA/eMvL1+/un377uDgyc6u3Xt69164OPzoyWPA8Tdv3gCOv3v34d2H99glEOxnVSVLZ+ksnaX/8Tqm/BqUIzj+4SP2ev3mjU1bNickJDk5uZhbWoB4eHjk5eX19e3/+eefX7988/49gvuMi7KEJSxhCUv+NHn39bdoUP7u/S+v37xrXN1ka28nIyOnqaltbGqirasjKSkpLy8fGho6NDT05tVrAPLXb99gxJwlLGEJS1jyZ+L4f4byN2/fj14d8/T2kiJIa2vrrlrV1Lt/37a2Vm9vXxlpgqKi4oYNG548eQJkHnAc86FjnhkWSWcJS1jCkj9UMC/KN0D5Lx+AlV++chVYeXllRWvr9nv3Hjx68vjSlctJSSmK8kqioqIrV6589OjRy5cvGTjOLF88yRKWsIQlLPm9oPw/OFg+IiEriM/k+csXDx8/Ghg8vmnTlqqqmqzs3KjoWF1dfWlpGYDympoagPJ3795hESysymUJS1jCku9HJgHev3+P+EweP33SvK7F0dmJSlVXVVWjqmnYOzgBlEtKSouIiFRXVwOUA+6zoJwlLGEJS75HKEciyj987N13wNraVlxc0tDQsLy8fOfOnSdPnszKylFWVhUTEwNW/uDRQ8w/zqo1lrCEJSz5vqAciDag+Zu37yurashkZRkZufz8/NHR0ZcvXz5//rywsIhEogArr6+vf/j4EfM8JwvTWcISlrDku2HlHz++eff252cvamrrlZWVCQRCUnLqwPETFy9ebGhoMDY2FROTkJOTAyh/9Pgp4lv53CXPwnSWsIQlLPnLofzt+3fAyru691haWkpISJDIyk7Orra2tjY2NpoauhISUgSCbEFBwZ279wHKX75+xRxXzvKbs4QlLGHJ9wDlH35+/gygHEh3247t/oEBBgZGZmYWnt5eq5oaG1etjYiIsrG1zyvIv3795rt3HwD3WXycJSxhCUu+OyjH0BkY99NnPw+dP3fs2PHDhw+fH77w8PGjx4+fXr06dvrsmcujV169evP69VvWUk+WsIQlLPkeHSyIj+Xt2w8fPgBWI37z589AwbIkIhAP2P3hA6KiEejMrJwlLGEJS74wf/Yb00Wx5Fvqk/n4/N1JGF5jmREBvjE0B3n7/s2Hj++xVLdQ5Jdf3tNT3bJqliUsYQkLyr8zKAeYfvXqxevXL98hc5/vMA4OJP3l6xfvPrzFsPuXD4Dur16/fAXnodiHD+++/ngQD/p/9zh/Bx2++peP9PPv6ecn3M/n/n1WIk2WztJ/iw6s7v2X9F/Qv9+B0Pc/+A36J9/1OWx9f/qfgnUf3r1//xbJrPL+AzJV+RZZ0InWHIAw4PW7V69eIUs8MSh/AzD9+iV8AN6gPY/3ANqvoTQWdQ6s/c3rlwiUv3n14f1beB87/43Hh99Q9vc63tPlmwa07+/+/04Hq35+pPp//xWhvQuggcoHuvJNOush/kptI1D+/i3AM4AykmTlHQbibzCIhjOA5lCVCJS/R7YGeoMJGl74DoAb09EVQQiUf3j/+uO7t/AWyMdf3qJv/WdhPOmP35P88s039n3e/3dYk6yqYNU/k7z9H3SWfFaZH99hwMsQtMYAjd+8e/v61cvnTx4/BLiehPnB4RVh3G9ef3z/DgQUKEf/2HtUGf8TvQrjum9+XUdG3V/efHv5P0x/x/RzMB/R+8/f/Y7v/zvVWfXzo9U/4MM3l3/zxT448fwb1nP8xjrE4BsT0IFev3zxDOTF85/hXQTKgajDez8/uv/wwZ1HD+8+unf34d07D+7fBXn44N7jRw8A9R89vA8vT58+fvbsKbw+QY5HmMBfT+n6187/vjpNvrH84ye/rcy3lGfp/63++PFDEPj/CaowdNbv+nv9rqdf65tPH4P8/KvCXOZb+jUmfw62fF/tgY5FyEUePQBwBogGTH6KngFMhtcXz54DMQeGirJywPh3r08PHtu5Y1tnx47OjnaQjl07d7Xv2LWzvatzd/furk706O7u7tm7p3tPT/f4sbuna1z/2vm/Sv+G++zu6drT3b3nM/27uH+W/v3r31ub/2t/b09PF8ge9JWh74HT6IEqXcxl0Avupve+7p7xa044/8nx47Sxrq4u7Pd27e7Y3bkLMLlzVwec3L17dzvonZ0nT558++bVx/dvJgFRf/bzo7s3x1IT40hKRGlpSSkpKRn0IBAIUlKIEAiyUtIyUtJy0gSiNEEWhIAIQVoGFWmkJPYn83lMZz7/5+gyMnIMHblbmU/vRwpumek8Wl6W6Tqyf/49s/S/r/7FNvaP1P/TbyR8rjMfXyvDqMPPyzOhDU2Y8ecHaGOygE6MmpGmHTJSKOjCK1Fe0dfXt79v35vnTyYBJQfefmts1N/bY9pUPg4ONnZ2dhwOx8nJCQobGwcnJxcnjpuDk4udgxsV3OQp7FOmIG/By2S2KYgCZ9jZkHNsHNj5P1SH/5jPM+4BDviTnZ2TUWYKnP/ssz9NmQw/YTJ6CjnLgfvk/j+5Pktn6b+if97GfjSdjemYMmXKZOSFHZVv1ifUIRut8zLqFhX6d43rP0Q9Az5xcnFwAL5NQSGOExAYAWQc52QOdm48r6Gh4dGD+z68fIL6yt+8eP38aWig36yZ0+EznBxsOE7kE+xTkPoGTAdkB7zDIBIUTuTgAgEV/YsLFU7G+T9Cx2EHxxfKIPfEwVyGE7tn+p1z0Iqz4xifRT7BQSuJFfgzfwtLZ+l/R525j9C6FfQpdhw3jgu6EiI4HL00N+Oz0DdxOO7P+yCjL6OfGv8uYI6f9Ue0d3NwMf/549Q/hmkY7WRjR85zcfPguPCA8jgefiMjo5PHDn9882wSuiL/w4c3r0OCA2fOnIkyWzYE+Tk4MSjHnhl6noNtMjJYoFfnRh4PFw7FT25UsOOP1aGJcOPwdJiecB6E1pLYORDBqoD54ODCyjDKY02Qiwv5DfSB4M/7LSydpf+99C/0d7RPAfgy5Gt9jX4V/BfPM5eHXsnUebEy3JjC0H+0+oeKRd0lgMMIDeXm5gFijkG5iYnZqYEjH98+n/QRTcLy4c3bkKDgGTNmYFCIuFRwyMALzBwZDblQnQ0dYDmQAhirhcuycbAzdHZOjj9UR1oSQgdoRBsd6mnsAGEB7Mh55E8UymllULLAQTtw42yCidFj12eUwfQ/+rewdJb+t9aZ+wvdtEX6FII3aH9ESTQno9/RyqAsnv5JLoAUep9F0PyTPjhRx9E/i2Oc//X7BDrK/k+pZ9pQx8GJOlk4ESjnQn4dnmeqkZHJkb59H9+8pEH5L2/fBQcGAZRjvhQoCvCNoPoUNmSwZYJyDOKxweHP/EnIraM66udBRyg6rNOaxfjjRxz+DFhnOugwzU4b39hpBzbWcXxjE2HpLJ2lY70FwwHmvoNOPmGQzdzvsMLs2HlQGLDO0LE++8X+yID7T77rB4FyZPKSbv2wTUagHI/nBSsFQJGHl9/AwODw/r00B8v792/fvH4ZGOA3ffp0zEfBhR5YfQL5BWSHB8Q+hQO5HBceMXa48HAS/gdBcR+P6aD8cfq4ccd8HodDPSTYjX3ZSEGGJS4cVh77aXDP2Mj2R98zS//H6zhQ6O3qx/rtOFqfwlzbWJ9CAYSd5g1HCoz7Obm5cbx4HhA48HguROEGGOHmhQM9DzpWh0i3xKNC77PcyMGD6T9UG4P/gIkD/CI/nxM3+d8/sU1mx8qwQZ3z8evr6x/a1/PxzVMalL9+9QKgfNq0aZhbHKsvZOaBA4dBOcKFJ7PTEJP2HX/2z0OGD7S5II8cTxtUMCjHhhbm7gRlGE2NcR3ss1izYFyH1gRZ8MTSWVD+P/RN+AcHYMjMmcAJp4PCx8eDoDV6gDJv3hzBRYsXL1y0aNECENAXLVg4Dz1mzxKYNWPmtGn8/Py8PDx8n/TH31q3/yS4B0D+6aefPoFyjM4yoPxgbzcNypGMLe/eBAX6I9OenByYtwubQQYox2ARCQ/6iQ25BCcPByf+CzPaNJ3zk9nn36p/dcYc1WnTL/QyGJRDQ+HnhwaEtAZ+Xj7Mh06LbEEPms+ODXHhYcc0/qmzZ8+G1oYi/oRrIt+Fyh9x//+88n+E/mfe8x/xXd8UAfId1P/vFc2CelmQvglILCgoSCBISUhIiImJAV4DfAvMmT1rtsDs2bMWLJgnIiICb4mICImKCouLigkLCs2bO3u2wMwZ06ZDzwVyjqI/AuU0/ME6I/P9f6VvfhIVw9D/l3pg/q6vyR/d3hiOKTwXQDk3gDDiHQGIRx3OeB4+IyOjY4f2Iw4WWprKN6+DgwJmzJiBxXUiDqzPoPyn/zcZ8d1w4tk5uBlTiBN8OpzjbunPzv830ymffPaTaRP4rfDYYfwXFhaWlpaWlyMqyMtJS0nAUM/HN5URZYg5/TG/OQxrfHx8CxcuhGYkI00QFRVFfUrcn30v4mX776ZDv1b+V/S/e/n/yQ/I+bVprv+6znGfnJ/QZuj6H10///G3/BH1/206c9vGfeU+cV+ffvzytCdmvAsICACGgwBkL1iwYO7c2SBAuhcvXiwktFhcXFRWVlZOTgYT6LCyBBkJcVEg5wvmzReYOQvo/KxZM+AiMCQAPwO0YkPDqFEg+nLfZMacrz3rCf76b+iz4774T+vqC/L5dX7f9oa5SWBYwqAcKDkC63hepHI42AHKTUxMjvf3YVCO5lJ8/QpYOeAadglspMV80wyGS5uaRpcLfS3e84s6nfZ+EifOfIZ2Hp3VZMdGVEzHfjZz8BP8ErgJoNXQAmRlpNWoKhbmpna21h7urt5eHk6O9qbGJnIysjOnz8Bzcc+fO09UWATaE+KN48YDC1BSUjI1Nba3s7G1sTIy1IcrgC2CTvAitB1esZkc+pCIY0ydY4/ka2yFPqWDo/1e9P5p77LjvlY/zPIt9fknlP/GZ8qk0+L0v0ZbGEFsjLkNWhOf+L1YzAP2fDFhrBX4dG0BZmlx4RjRSthEGSc797fUA/Nv/K2/91vq85Pr/6HP67/TOaCi2LlppJXRvFEdx4GnRxDQAxDZcUyCVTiO8VwQbsTDO3uWAPAnocWCoiJCgNdAuoFdLVqEOFMA1uXl5TXVNaCvWVtZQD91dLCzt7e1sbWwsbaEnqunp6OqqkxSVAJkl5eXU1JSUFQgAs0SExGdO3cuWNtM3RBbv8iJBibSwAFxo+O4ePC0KA0s9A6rQG52LjS8HWPoWNwd8gsx1ytzn8VaLxYFRyN2UEUceHqM3Pi3IyE3bJwTejpa5tfbwP/WH2nRQRiqML4XuSO4RV4eAwO9I329aDAiElX+4d2rlxiUM5N8zF/DCP5DHTfjUP4rt/s5lNM+S5tQxTOD+/gSHiSSiRODcm4cHpvdZjhSkOkRPA8g+NxZAoLz5hHFRLVIinbG+j5ODlFB/nGRYSkJsclJcbExERFBQZbGxjIionP4pwovWCAtLjZ/3hwY8IUEF2lraTg7O4aFhURFhocEBwL66+lqS0tKAVWHr4MRDwN0ZihngAtzsBTztOpngVa4//g4fxPE/Mnlf7vOyVQPX4ZyLD6YMZ8xHtiKfgqLF8agHF6xrjKO73Qoxy7BONDIVE5G90YGYDb4CP6Profv/3l9QrM+6Y8AUnQox2M9jtFuEZREoBxP54O0TyFPhw2HQ4AMI8kIQ0Tc39x4wPGZU6fNmzMXCBMYxPJEWYBjIlGWSCQqKCgoK5N1dLSsLCyho/n7+YSFBkeEh0ZHRURGhISEBkAH9PP1dnF2NDc3NTIw1NXW0dfXNTY2NDE2NNDX1dJUB1QXExMTEJiDRCigFB29ASS+Dr4ahJeXd+rUqdOm8mFQDr0XWSaChLcjoAz3jOfEYUtkkIhkJEKGjQv1sWJ9+BMoZ9QVA8oZDXh8IJnCgUEE1noxKPt2evRfPV8m+sv0LgPKodL6D+wdh3IGK8ecKl+EchrD+oyVf63pjLuTJtBwpvMcOObbZebpjCgUDDvhgcGwLy8jq0SUVybK6ikp2amp+hvpJbk6Zgf7l2WmlRfkVZWVLCstLMzLLMxMC3J3NaaQBPl4FvDxCs0WmDmVX1hosYY6NTDALzU1uaAwZ0lhbnZ6SkJMpJuro462JqA8NE2soaBh9FyYBYDxdBphREdC5iUSCJqgFYL8bhznJ7/xV9DtRxCaccrOzRwwSotRQ9kN00iPG+f1TBxwQtdiY8cWE6LrJZBpRuaIJlobAxji5Pn1av8W+PvnyziR4kKHUh7GEMiAeBpCoXNIDOsHHioeapmLeyofP5AqwHEQ0OfNnS1DkKKqKgP1NjczAgECDvYxWMnhYSHJ8XH52VlF+XklhXnFBblFS/IK8rOzs9JyMtIT4xMA311dnGxsbKysrOzsbLy8PHy83X08XKFjWlma6+vpKMorAMefMWMGLw4QnHf61GnA1sG8FhcVkxSXAAH+vnjhojlzBASgo0+disXDADcHHOfH88AdIuiLDgPQ8rAV3vCLMECfaE0yRcGjPxTr3XAlDtq7bPQ1KzhG/XzS3ji+ov/uwoByMGv6D/R8fPvzr0E5Ft3xP0L5F6cO6OGoDDuamdmNL+TFHHCzZ88mSElrqalbGBnZGRk56emGmuhn21lWuTk3hwU3J0RvLMhbu7S4qbq8sa6isiinIic13c8z2sLEXo6gMm+OCB9+wTR+ioKck51tRnpqcVF+ZcXS6vKl0KrystKjwoLB4qOQlQQFBaG5TJ8KgsyjI/FSXDwYlDPMT5rrBfsVXF+A8h9TxvGUyZoZh3I2WujxuJ8KtVLH+QXKBz/xZU1Ac3YatxpvG2iwGhoPR5+1RifkWVD+HyfrUNqKNtrxOsFj8I3WPzfzM8UiKLDKBwTn4+aayoPHcJyfl48bDTUE3BRcvFCNqgLwDdjt7+cVFOgbGhIUFxudmpKUn5dTUlhQXlpSWVYCna5qWSlIeWkRgun5ednpGTHRkcDZHRwc7Ozs3N1dg4ICoEvGRISGhQb6+ng4OznA8KCsrCwqKjp/7oKF8xeJi4srKSlpqmsAizfQA0qqp6WhqaqsQlJSkJKSEBISWjB/7uwZ06dz46Zzss9gnzyNYzLPT//CT/4XD9tP3BxTeHm4ublopj/qosExRqxPoBzaEq2iaIjHGNKYTJaJUD5hSvaPh3LEV05j5SiUY5svfwLlGAP9L1j5l78VvQJtGS7du8LoutgqJlSwfouOe2i0yaxZsyQlJTXU1B3s7P29vaID/BJ9PFPsLSsdrevMDNYa6zebGCy3MN6ZFLe1IHfXyvrODaubK4tX56SUejlW2ZkXGmjZLZojxzlZaia/lb5uXFhIbeWyVctrm5tWgqysq66pKMvNTIuJCLe1sdLQUFNAnXQSYuLQIBYunD9HYDYYcfQ0AFyfLFymM3Sa35bJF/xjkfGvNlmsnXDgx1d2IAiOOmon5ND4opXG5MOltQeadc9YVUiDJIw9MUHSD24MfQsEjFMQHBqNxoHnmIjgNKMcJVKYN3zm9BnQHQRmzZg1czrocIZmueJwM2fOlJMlWFqYBfl5J8ZGpSbGgb0LNLx0SeGysuLqqmV1VZX11VU11eUg0AFBANMrSovKi4uhGCC+i7OjtbW1o6Ojn59PbGx0enJCVlpySnJcTHRYeHCAu5uLqakpmUyWlpaRk5OnUqlWVhYuLi4+Pj5+vt4+3p6erm52NrZA4U1NjAz0ddUoSiRpSeLCuYqzp8rwsUniJi2ePGnuT5PmcEziY/8/XhwbLxct+dK475fWr3HjkwQolCOzhZgJSIsLHB/+Gc3sT2pvTO2cGcqBcRowoPz3dbB82dame8DHORTTjCKWDACDctpiMCQJDG7BvIVEItHY2NjV2SUmLCw1KqIwJnxFbMRqP7cOX6dtRlptapRtqqRmdeXjidEHC3MHV684tmH1zvKCrsLkdb72Wx2M1xhTU2QFvcTmmoot8DHVz4oOW11bvWFt47aN61o3rV+/prGpoX5pUUFGSjL8dsxnB4O8mipVSUlBVpYAttu8OXOBdKAPfgKUMwKwaDyRfp4eCsqCcvpJBMq5Md6NKGxc7MjyYR46hR/vURP8uUwMHfHUoDgOrQLLDkSPnsLRp+nwn7BLlvxHKOfgxoOgfRnP7BRmeFTA6Jk2bZqAABLgO3uWwIJ58xctWAiEd/68OdApgJVj84zQ6BctWgSU3M3VGah0ZmoSWLolhXllxUXV5csAu+vrqhrqalfU1tTVVmJQXldVXgdovqy0srQ0LyszNjLCwd7W3NwcoDww0D8pKQHYVWFuVnZWalpqQkJMZIC/r729vaamJpmsrKamZmpq7O3tGRQUFBkZDow+KjI8PDjE39vH08PN3dnJxd7G1sjARoPipiYfp09K0pNL0JGK15UI15VyUxGWFeCYMXkS/+RJfGyT8eycWEYXpuWHOEbIAxfdwsMSVzFB+V/UxiZCOQca1cOA8iN9e74VyhkL5f8bKEcNasRNgdUWuqTisytwsrFNpvmz2NhhzBcWFNLW1IJHGOgfEBcVmRUXVxoXVebv2eLvttXedK+VQaeqQpe89AGq0l5d6kEX6y5ft5NFWcfL83ZnhB9KCdxqp9VmQNxpRFxvJNdopZKkSYg1U88N8lxfU7Z1zaruHa37One1t27ZvL4ZGlZxUSFYgrHQEkMCfDzcgaEbGxtqaqpTSGQpCWlowWBRAj1nQDbD4GKes0XeRR/8Dwvl9GgBjC/z0IZtsFI/gVoOPBeOl7G8i5Y5D0VwbNUuw9rFog6wYR6LRqD5atg4JyzmZuNkjnth9n6yGPrXoBz1JHN/Mgyj8xk0Mj59+lTAaDQQBSB8noiQsJSEpLS0JBJHKCMrKiwCKI8ursMLLRbU1dHy9/NJjo8rygcQLywvLapaVrq8phLgu66+Cl6rKssqK5ZWlJdWlpUgaA5/Li0qKypIS4oPCfA3MzU2NDSEzh4SEpSSklSQk1mUn5Obk5GVmZqSnBgWGuzm5mZkZARoDq+uLk6REWHA5eEtkOSkuMSEuPCwkJDgwEBfL39XZx9zoygjjUwD0ip7tc2uqlu8yHviDHYlGNb5KDsS8ET8JDH2SYvY/43/17+4prBjISu02RrU+0ybCuaYMMIxZnS+PBf49fCtP+oholAOd/ubofx/YeXIj5+CQDk6c0iD8s8qgpOdPjUBvRcahzpVzd3VLTw0DJ5TZkJiWUryqsS4tYGe3T7Oeyx1D+tRexUle2VEB1QV+jXJ/SY6B2zNxrITb5RlnEoPGkp0a7eUa9WZv9tEsMNKrMOdVGctV+2hVxvmtm1ZfsfahsOd7Ud79+zdtXP71k0rltdUV1UAmuflZoJlFxMR7uvj5ehgZ2JipK2pQ1IENJcE03L61GlAz2mBE0y+MyyAHwuKwswx5vicCfbHPxjKaQSZPrwhJ/GfQDnGoDnRwIDPoRydjeBkTrrASIWGoTk9PRMXkuGDDYscZacFxqGGHW1KgwXlv8nBQp/jGU9Rx8EJxGX27FmCgotE0ENIaLGYmIgsQUaFoqyuTtXX19XV1iErkSTExJEAcF4+6K36ejqAHqmJCcUF+ctKloAgkF1TUVtXCQJQDiBevqwEg/KairJagPXSJSUFuYmxUT7enojDW0/PwcEhLCwkKzMdcBxs5fy8LIBy4FjAu728vCwsLPT19eHV28sjIT4WzkNJKJCZkZKWmhwbEwVoHuznHeLqlOhgWeduudZBs92Z0u0i2+tHOJlGHczS3JuoVu9KyLMgpBop2suJLOLi4J0CRiLHeEAtfWEOsyucNjPMhadnXcUxQznDQPxLniMDyv8sBwt9pgsdAGnJaWkWNyft+liMMDSjmdNnSEqKwygNDxgB8Yy0gpzs4qzM8oT4TQkxzQ4WO/U1upTleonih4gS/UTJARX5Y1SFHhJhF4nQb6l7xFn/kKtWv7vyoL/SiSCZy0mUKxnU4zGKe8Mo24I0mwNNWzPDNxdnDu7efu7IgSP79nR37Fy3rrmpaVV9XU19NbS0IrANYZyHYR/sNTsbez0dfQUFhYULF4KdCTJjxjQ8nothjo1P5dEdBf9gX/l/nMYZZzf0oYs2jcZwjtOZDhYhi4bwszNNh6ITmxMcbshUG329LhdtCod2TRx94GeEn3P/euUz3vpHDqu/EoxITx1OqwRahlGuCcmfsQyFCBmfOm3h/AXCwoLi4qLSklKA4EDDyWQlbS0NC3NTezsbZycHFwdHMxNTDXWqiLAgoLmgoCC8C6w8JSEeWHlxUX5pSWHZ0pLKimXVNeUVlUvLly0tLSmCk4jrvHwp4mCpXla+dEl+dkZYkL+dnQ2VqqKjo+Pi4hITHZmXlYlcBJA8NzsnOzM7PQ0IuJ+fn6WlpbGxsa2tLXxRRkpyZnoGgENGZgpIWnpSQnw09NkgD/cgK4tEE71mF+M2a0qPHeF0iNJQIvFOpc71Ss1zhSoDGept/kobvLSyjEmq82cs5Ofj58IjS29ofv/xwGLaxAy9jY2n/ZpIQD+Z7PmHQznGuWisHDXfsKhPBoFiJLDl5eUVExHV0dHy8/VOiostzM0pXVJYubS4prCgJiF2W0zYOjO9dhWlblnJHmnRPnnJPiWZflXFwxqkTqJ4u4zIAQ3iAQO5Q9YyB51EzkYRzqZKjJUr3awin8oQP5Ig0xWm0BaksTfLr7Mk5dzurSNHD5zo39/b3bl16+b161saVzU0rqgDNIemBvQcxnwY5H29fWytbdTU1ERFRefNnT1/3hxkLnSOwNSpU7nw3MwGPj0JHI4RQc8cy/GPh3LGZNEXYsxRKKetYWPnZp7eRMwwbF0xbc0FBxazjC0Bw/g4tgsB6pblYsyWA7vHpsonhBNgIepc+E9iaX6UIKKvGP5Yfv/PWTltRQ2yTRgblAE4w1ZBL164SERIGGg4kSirTKZoqKlraKhpa2uaGBsCiAMjBpvV39vHzckZkJ2kpCCIHqoqFC9Pd+izS/JylxTmFhbkLCnMB0u3pKSobFkx4Dj8CVJSXIA5WKorSkuL8rLSkr08XY2MDBRJCrq6ukC9gW4DdYOLAJRDeQTNM9IB3318fICPA5Tb2dmFBPhD/8xIS89IT81ITwZWnp6WlJIQGxsaHOLkEKSvm6xB3mytuduC2GcvfiFS7mKazMPl6ndXqF4qJV7II+0JlNzhQ6myVbYhiqjLSsqIi4NVAQMSs3MPbZPjQncRszEvhfsk1cePwcrp7nIsWAXxbKJTWGyTp6DIjlQf4r/n4120aJGWlhbQ4eSkBBiZa8vLV9RUNtXVrK6sWJmS1Bkfvc5Aq01Bdg9RpgfxkpN71CldmpTdGuRDhpoDBho9ZPEO0tyTToQTwaKPG7R+3qr9rtfwY5/p7fWUGw3UwUz5/mTN3iTLHRm+lzrWXTved+54/7FDB7p2t7fv3L5l88YtG1o2NK9e27gKzMGypUXACJIS4wP8/KENEYlEgHLBxQtlCBIyspJgN8yfPxcGHuzxI1thYLBCt8V+KCiZCPGooYo+ayx9MAbNzAudUQ7IYNOcDAcLba3dFE4uNhwmGE/Hcp8iHQxtmFiuD8yxzrAA6M4BbEnRF0ILJqx5+SeaTV+EcsZ2DYyQO0b6OYSLs7Hz8nDPnDFt7uw5AGdCQsgSTTExMQKBoKSkoKWlAfANeA1iaWHmYGPt7+0FJDomIjQ6PCw0MMDD3VVXV1taWhqgnERSdHK0h/PAqQF/s7My0pEjNTs7My8vJz83D07m5mYvWVIAPat8WcnSooLs9BRgS+ZmJhQKhUQhm5mZhIeHIlZ4fi42DBQBoudkAFhHhIe6ugLiG+nr6wMrDwkITE9OATTPzczIy0rPzUzLTUU87mEuTt6a6hEUpTwyYZuB4j5zmcMOopfiiJfz5F5u0H+8Tv1WA+lmJfVwtPT+cOqGAIMIczVvG1MbcxOAQmVlMlgh8+fPR1gaNp2LWiqMNWi0ZQ0c49va/IUg/ldC+YS172DKTZ7Chgq2NAurlWnTpklJSVmYmQcHBUCDKC8uXllbu7qhvrlheUttzZqczJ7UhBZjvc2Kcu1KsltJclvUSC0aKo2aKi3a1G5rowErw10U0TaFaYNuooMxi59t03m2X+PVSe0PZwzudCrd26p8qlhyMIO8P0F3R7LTaHvTzRN9IyePnj5+5ND+vb3dXbvad7S3bd22af3GlubGFcvr66rKEHddbmxMFDQjFRUVxGMoKkwmyWuoq6irqSooEBcvXgxoztj+Asuz/APyQY7PEzNgLIYd252Qk+FMw2oGyZTHxc3Hg8Ym8/Mi6ZO48Yz4cQTKp7DjJ7PzTGHDT56CZ2fHFuzBpSazTWG0SWzBJ923Tk/LTN9l5nN76MeEcuZF+czPCOp/4fwFYAEjizOJsuKi0LSRlCnAyqEPAq4BRpubmzrY2yKL7O1sQHFzcgz294sKC06IiUyMjYmNjIB+amVlQSaTYQCQlSVA+dCQoOz0tKzMdEDk9NS01NTUlJSktLQU0NNSUjMApgvyoFuBFOXnJMZGubo4qahQZGVlVdWoDg52SOxKThZ0usKCPCDyQO1RX3kCXNbZ2RloO/A8a2vrQF+/lIT4jKSkouzMkuzM4rTkkoToNE/XaGPDIHnZMk3VFh1Kt4HiQWOpI3ZCo4mKV/JlX27We7pZ/cFa5Tu1KsfiJQ9FqbaGGac56sX6OIX4eII9Ad9uYKAH3VxcXHzmzJnc3IwpLtRwBD4+hY0+NzO+BcJf29n/Aigfz1vCTtvWiG0yZlMj5jP0ZeAFIPPnzSHKycDgHx8dVVJYUF9ZuXHt2m0b123fuH5nS/OWpSX7ivLXO9tu1tPqtjLZamPSYm9R52DTEujXGR95KCHsalLYARuVbpNFlxOVLi2TfXPQ6P2wwavLmm8uaT0/pfHmqP7YetJorVZfqvqOROvrnY33zh6+fuH05aHTp08cHTx6uL9v38F9e3q7OwHUt2xY3wzkfGU90HPg5uHh4QYGBgQCNHIJLU11YCg21uYmxvrQ4oGP8PFPQ/ZRxdHyJKCb1U2Y8PxxDHxa2iCEiXOii+nZGbkjEJrDzQWjNRheEmLiCkR5ComsTlVTo6qoKJMBTYAVTkdWdXDh2Tl5p7BNnfzTHC4OAU423sn/xqMXhAMGzlmzZwqJCEpISIiKigqJCM+YNZ2Pj4+xJJhplxkcI1vFjzixybS+mtlGQUPRkLWai+bN1dPSNtY30FCnIpUPPGXxYuCkAGTQqo2NDR3srb08XRFfip+Pt7ens7Oji7Ojn693ZERISkIsIClITHSku5uLnp4ekulQTFRDQwOgOSEmOjUxIS01GbA7KSExOjoyLCwkNDQ0LCwsMiIMzNzM1CQQUMD41tPRBVIP/UrPQN/d3R0QPycnKz8/FwQUGA9SU5Li42LgNsAyVlVVpVKp5ubmvp4eCVFRKVERWdER2WGBhUG+FX4exdYmBZrUDDGh1SS5dlX5PWqSR40kBuzFLkQQzqWLPV6j9nC9ytMN6vfqVQaTpI7GU9tCdLOddNKC3ONCA+KiwoH4+/h4wf0bGxmQSYowpE2fPhML8hlv23Qop+1Khi0J/OuCX/8SVo5loMeiMjlpUI5ecO4cAaKEmKqcDJUgqSIlrkGUc7GyTIyJBEq+vKpqc0tLe+uW7h1tPVu3tFWV7ykpbHJzaDLR3+xovcLRstLLucTXuzE1saM4b39+yqWCuP1u6l02gqM55JF6wqvjeu+u6r28rvb8qtqzC2rvzhrcbCVfb9Q6lKW2I8n8euequ2cO3bx4dmxk6OLQqaFTgycHjgz0HwRA7+vdu2t72/atmxA0X15fVlyUnJgEZh2YkHJyMtramkBSvNyc3ZzswTYETgFojuflwXK7/5hx5cxQPsHPSM9Xg8fz8k3lX7h4kYyMjJqamqG+ga21jYuTs4ebO/RnoHt2VubaaipEaYl506fys7NN/fe/ZWZPtyTLmyjKiEzl4Zn8E3CiqXz8IiJCYAzp6GgZGRno6eloaKgBGQQYghGCBuboIlLMAvicpf5wS7foi8sZ3hXkWXBxCy5arKVGtTQ109LQJEhLiopAFQoBHAOqUigUqFh7e1sfb/eQYP+w0ODwsJCgoAB3d1eAOR9vT4DypMRYBKyTEhPiYwHoLS0t5eTkFixaCK8W5qbhwUHA2aFAanJKQlw8QKSvrzfAtJubGzxr4NfR4WFwWbiUkaE+QUoaxg/4XjMzM19vH+howN6zszMBx9PTkdgV+IqQ4EA7W2tNTU15eWT4NzMy9HFxig8MyAz0zw/wXurjVuPhuNnPbYeL9XZzw2YFwnZ5qW5FiX0UkePGkgO2oufCpIZShB82qT5qUX6yXu3+crVTSdKD8Wq7gnVKHLWLgj2yQgMy42JSY6PjwkJiQ4ODvDxcbKy0VShEKakFAnN4ubi5kDSwSBoKVNgYq45/RCinT7PgmWd++fn5gaCpkhTsDXR9DfWCdbV8VJUdlUnexoahXh55mWmA5msaGjY2r96+fl3HunV7mlYOrKzblRy7PdRvV3zE2sTohoyU5QU5m2sqe5vqjtYV3ajN7AvU6XEXulaqPNpMfHFS++11vadjqk9HVZ+cV3l7Ru9WG+XWGt0TRbq9ec63e9bcH+q/feX87asXxy4PXx25cHHo9LnTp86cGDx5rP/Qvj17uzpaN29oWd0ExDwvN9vLywPsO2VlZYByMDb9vT1AoHGbmhhB84KeMFNgFheeG4Zt+JnMUMJItfObUiD9LZb/cEyESFpsCX3HdD4e3mnT+AUEZoLZDgwa+jn0RjBooD9DM4uNiUpJTgTulpmakpYYlxwZHuzh4mFpoqsgLT5zqsBPk7RE5mR52ad52KkKzuWb8tM8gVkkJQUba0tvL7foKCSmGDACruPkaGtibAhvYTk6eHj4mPKKcE/IavRZogyOb1vQ/3df6M80I43UyYJ581WVVYCFgH0pJ0sAKIfREdowVUVVXV0dKLaVlRW0dgBQeEZQz3ExsRERYRhjhWcXFhoIUJ6clJCBOFCSoRiwdVVVZbCQgJjDOO3u6gaPBgqkJyNADLqnp7u9vb2ZhTkwawcHB0d7BytLcz1dbTBzkTwZ06cDRgNVCvQPABafnJyM+tjT4mPjoqMiAgP8nJ0coDCZTFZSUNSkqtqbmwY6Oia7uxR7OpfZW9RbGtRpkbfqq3XoqvRokHtIhP0KkntlhfrIggPGYgP2IiPRshczpG7VKN5aoXi/SeV2ufKxcJH+AOJ2B/k6S5V6H4cl3m7FEaGlcTFLk+JLEmKXxEZlBAcE2do46GhrEWSk58yZzcU1jZ2dj20KD9tkbvbJgOY4+h5J3xJB9E+DckZ+EqxJ4fF4MTERbXU1DyvLFDeXEg/XJk/3RnfnJdYWKTZWYc72qdFRS7Iy6svL1tRWb6qr6lhZf6ix/tya+mOlOX05yfuL87YuLV5fXblxVUPnhrVHNq05s6bi3uq8A2FaXV6LxyqVr66Xe3Fa++WY1pNrKk8vqzw/T/1wxuDuNpVbjbqniw335bnd3tt891z/ndELd66N3Lx66cbopSvD5y6eGzp/6tTQyePHDh04uG/PztYtG1uaV9TWFBcVQpM1MzGFlgpQbmtjBSaev7eXj4c7tDMkKktNHeghGPtYuC6j24znuWWKRf3bQQPHN0A8kx8J8VnPmDYduB7AhJKSAhA9AHFsAQhY6NA/oY/nZGcWFuSVFBYU5+cUZ2WUZ6QURYUWBrjH2RiZEESE2SbpCs/K9rTNcLOhLhaYxfETRY5gb20RGxmWlpqQn5dZkJ+blZmekZ4cG4P0doB4eASSkpKLFwvNn78QhJ9/Gi+ej+Hs+pYh6p8E5RPumWnmACpEUlzCyMAQSTqoKK8gLwcorKurbWpsYmUB9NrS2traxcUlICAAIBhwHMHWxKSEhLjAQH83V2eQ4KAAAOgkQGokeiQV4B6IOZIpWpawWEhQVlbWxMTE18crMSEOaHtSXGxUZDg8dDs7GyMjI1300NfVg2EDcByGeSy9koqKCnD2iLDwtJRUdLI0HZSYKKDvId5egBDmmhpqUAbu2drU1N/FKdHdrcDdudnHbYOd2Q5Lvc1qcu0qhL2qMr0k8QNKogcVhffJL9hHnj9gKnzUafFwnMxIluSNCoXrNcQHK6j3ytSOBQofdZfZbUnYbqe5y895uYt9vb/P6qiw9clxIGviIutCApe4OmXZ2EToaDsRZXUFF8nNmraIi2022/9Nn/J/vFN+4uFkoPnfH8o5Jy6+Z0SDjSc4njDRRHOwsE3BTZmCrDSFfm6srxPg5pITEtQSF1dtYdGgpdmkpVGurV7t4pDo4hDj65USGV6YnFCZnlSfGLUmPmxbXPD+1IjtQS4bfJ1O1ZUf3tDc27qlt23rQOf2K93bjtdmny8MHojW7Y+QvNOgdrNV6dlJ9WeXqE+vUF5f0bh7kPiwg3SxWvJcvuKhRPUd8VZDm2qGD+6+func/Vtjt65fuT02ev3KyNilS1cuXBg5dwaI+bHDfXt279retm3VyhWVFcuSEuN9vLwN9PQx/4CzvUOgr09oYEBIgD80ZSAsZmYm8vJyc+bNRTwt9Jw7TFtkTMhrTMujiwpzzO/3s4QEm07E8sVjiUAZviN080Zu5sBkxrPm45s6d/48GRkZDXWqsZGBtZWFg721k6M9EDcPd9cAf9/YyIj87KyS4oKqyrK6qvKG2qqV1RXLi/NX5aTWRQZuivYrszMIVpE2WMRPmsGmIyqgsXgWcSaeIrLA1cokPiJo6ZK88qVL6mvKl9fXVlWWl5YU5mSnpScnhIYEAMqAhaSno6ujpa2lpQX2E5A4sN9FREQALKDJYWEbjGUgzLn46cPteNAkPY6Yk5EA9rt21DAv6WZa5YB5xrHQIGQCA4dbtGAhEHAYWZWUlJSVycBLLMxN4QF5ebr7eHt6e3p5uLl7e3sja+IjwuLjYqDZAygDXgOCA8Tb2dlBGUBnQHOg5MC7E2NjAHGh/evoaIlJiIKdDRTb3NwUkARzmsPH4VKAyDDcAuLA44FBFx6NoOAiXn4eMM2htYBdFRoSlBAXn5WRmZuThcWSwzAAUO7u5mJlZWFkZACA7uroEOjplhLkVxTgs9TGbK2pziZ1xQ51uSN65KM6igPa8se1ZY9qSg5oS542kT5lJTXkIX0mUGwkVWYkV3JsGfHqUsKVAsLlFNlBb9FBJ8JeffEufcU2XZU1OmqrjfQaLQzX2JiCrLIwbDAxqNXXrtRQK6ZSclQU0tSVPAjCBgtnmIvPN5MVkZzFzzv530haLjwPIyUJFpvPWN/A2BiHOX03s3n0vUA5IyMBIyUWrQOgEM9go8wxA9jmmYDjoIsKLtalqgQ6O+SGBjbERPUmp6zRN1hLJLYQifVkxQ1ujsUuDvEOtlF2VnGO1iW+rs2RPl3x/gdivY/Fera6Gq91NhleVXmmve34nq7B3p4L+7ruHmgfqEg5k+01GK15LFrqfqP6re2KTwepz0ZUX1xW/eWSzr1u4v1NpPNLJIbSFA9GUlvDzU+urTjTvePq+dO3x67cuXn1zo1rN69evnZpeOzyxdGL58+fPnFy4AgQ865d7aubVtXWVEHzigwNAwKOsAMtLXtrm2B/v5iI8OT4OGjuMdGRUHW2ttZgoiKuczweSweGLbtgJBGjuZjQEHtGYvTvkeXRt64ezxfPjqNt6ErbJxdPzz/OxchhCURYWFgYMMLY2BiMFTBcAvy9Q4L9oWbApoG+ChCQkhC/tGhJRXlpfV3Vyvqa9Y0Nm1bWbq4o3lWUtSXad1+s1yprlUxtCT/SPI15bMIck4TZJ2kKzXDRIGYEuS5JDK9bmre8snT1qvr1a5vQNbrLiovyCnIyUxKQbg/mv4uTMwwbrsAf3VwcHeyg/0MrB9McbgxaPLYTPDZhxdy2kU1rkS3IcZ9A+Sf6FzPhfRccnCk1Aj3bPgcj+z9jJ/u5c+cChqpT1chksqqqKoCvLbpbC5g1YaHB8Iz8fZHkVP7+/iEhIYC/gOCA5iBAzwHKXZ1dbGxs4BXKQoNPSU4EpIb2HxcV6e/nZWNrQSIBQAtCVQPTd3JygGvCu0iBWED7IC9PVwd7NOOVsQmguYyM9MLFC6AwlUqFJwVlgInn5+WAvQWvMN7DxaHBwBjg4GAHAoNNREhgQkRoYVxETURgtZ3pBmPtLRSpLrLEST2FU/oKpwyIJwykj+qLDhiLnLGXPu0qcTZQ8nSk8KVsqeEC8WvlsqOlMhczJS7Gy57yFD9lJ31AU2ifutQuslSrsuwObXKbLqXNUHW7gco2XfI2bcpWdfJmVfI6Zfk1asT1lhql+vLJapI5Fio5jgYmssIL8Gzck/8fskyQEzeeKHAcyumbWtBfmWNdfseJtN+ZlU9o6DQo58HSHyM58Ni4GEFm0MJ4uHkXLZyvo6rsY2WR7Oa0zMd9rbd7t6fnRlXqZlnZgwZ6+22tdjjZ1Nua5ZroxmlSwinSudryK8yUN1lS9rpo7nfT7HBU3+xmdL917d2BQ2NnTo6dGbx8aM+dfW2HiqKPJjr0BZL2BS4GVn53O/n5cY0XF6gPjss/61e+3Cx6pVLyZKLQYKhsrw95o5dhX3n2gQ2rhwYOj148e/vG6L1b129eu3LtyvDY6MXrVwDNz106f2bw6OEDe/dsWteyeuXyksI8YCK2NlbAygHKXRzsgXQAd8DSBhUtKcjNyYiLjYSuAD1EWBjQfHz9BfqkaVlYGWkMaGtf2djRWMzvjpUzYrcZSWWxTJBY22BqD0gWfz4+vgULFkhLSkEXtTAzh0qICguFPpyRkpiZmpSRkoz0+aS4tNRE6KK1lRXL66vXrF65af2aXVvWd61r3LYkc29O3CY3o53O1HZX0joPhbZUsxRnorzAJMrsSWFGsqU+xk3JPvWpoWvLctfWL2vfun73rrZtm9bDk6mrraysgNEhLyszNT4uCiAGHhMwQaCLSXHRwBhhLPH0cIG7UpRXAs6IpqjGIiM5GTtSfZ5V8Wsx2t8nK+egJ4n8PK8RNm/BNnkK/HAxMREgIsA2qFR1U1NTAFCwk2IiQlMTaYAL8B0WFhIRFh4ZHhERERYZGR6F5quKjQwDoHd3dbOxsra3tQPEh/PAYGBgBu4cHx0BIOvt5WZgoCclJSUgICAiIqSvrwsja3x0VHJ8DFwfHkp0VERIaEBwkJ+vjxdgOhRWVqUgESmmZnAGOD7wcehHSwpzC/KzC6E7pSBr8eEtT3cPsBhgNADzKyclsTQloT4+cm2gZ5enY4+Z5mFDUr824Zi29CkjmZPmUmcdCGdcpEYC5S5ESAMBH8mRvlGpOFYrd72OeL1cHqB8JFbmuKvIKSuJg2qCh6kSB1Wl+tRk+nUVD+sr9BspoUI+pEfao0LoIUv1KEt1aUr12avscKCsd1Fu8dFZ5qzpRhKRE+CZzvYTLxrTiWWOpC1VY6Mt+EZy/+JouwrTKC+Ok5ZVmON7hXIMkiYst6PjONtk2q4utCXaUzjmzppJkSM4GeikONvV+rlvD/bd4+M24OqyS4XaSiAcNzcddHXs83Da5WKzzdWqyVqvQleu0UR2rZHoRv353Tbi+5xlOl0Ut3rqPt7V/OTMsbsXz98bOTfa33t9z5b9hVGH4+16/Ul7/BbcWU69v53yakDz3Xmtx0dIz/apjCwXHSmSOhElPOhL2OeqtMVVb39+4p4VVSd6u64MDd65eeXuzbHrY1duXLt0/erwjdHh61cuAJoDlh/p29e6eUNz08qy4kIACGj9urq6wDqBLACOFxfkIl6CulqAp6WlS/JyM6FFQtODmp03bw6W2J6xod2EhdRsOIaDBcu5+D2mW2KCclq+FDRKBzPbYYjC3poxYwa6QoSkrallaW7h4eIMOA49PDczY0leNlQR1AsAbXZWGkhRfl59dVXDitqNLWu2b9mwt23DoY2rOgqTjmWHbnNQ3mEj1u0l0RYsMlBn0ZipYSA7yUx60jJf8qYY431L/FpzgndWZG1fWdG7fXNfz67dO1vbtmxctbJ+OZpvobgIhgkkohkQobAgB4WDrLys9MyMZGRJd2iYk529loYmMFM8Fw9mbWCrjhnzGRMzLP6tpjcn5NSekFYaW+ECJWbPniUlJQE2k4aGhomJCZBrGHFjIyPAoEGjA1PSkhKhhcfERMVGIzQckBdBc1QA7sODg7w9vQDHba1tPNzcsYlNjJUnxESiaej8gehQSOSFCxfOmjWDQJAyMTYEvh8XFY4FL8LF4UHAcAtfCufdUM+JtaWVm4srjBMZ6anog0O2pMjPy0KeZVIijCIw2MDIAQUSY2NyMlJzM1KLUpPK46KWebls9HTYbqVzwJy6X1vqsJb4SVPpE9YS5z0IZ30lLkRJnU8UH8mXHF4qfn2l3PVGmbEGwli13HC2+HCc9IDr4kErsT7NRYfUhfrVRfs1xQb1pQaNpE6YEkBOmsgO6skeoIgcVhE7oCp4QHvxMUeZPk/i/mDlNn/lEnOxeF0JF5IwZfHsxdP4+LmRhQyMJMzsSFQyukEdumUOgvKIzsPYpgaH4/6OoXyi4Ynlx0ASmU7BYYKly4COwcvFLS0saKFODjbSLLM3abLW32Gp16mr1quuuodM6SSTRv18byRE7bU1bzdU36otv0FDoseRctCXNBhFORUjP5xCGclUPxit0hFtcr+z6cGpQ/cunwe5e+7E4xN9p1cWXSqLPByhuS9Q6E6t6r3NpJeH1F8Nqt/ulr3bJj9cKTqSJ3U8WOi4p2SPpfRGM1JnhNe2jIRDG9ecPtD9+M7Ys8cP7t+79fDB7VvXL928evH66LmxkSGA8qMH97VtXt/S1FC6JB8alpOjvaWlpYuLCxCWsqUlDXXVAEmb16/bsmH9hubVK2qrKsuWQvsODPABGxMLUqTnc+BkZn/c7HjmjVq+sHLss9zEf7IwhVSOm4dY06EnJkSa7PSpM6QkJNVUqWA4Q+UAEYNeCiY59DqwV8pLi0CWlSxZWlSAYGsBkiMJgHdlQ13b1g2d2zYe2r7p5NZV+5fEns0L2B+gejBIanSpxvAK5ScHXU63W1Ykzq2NWrS3UHuwwLQnTndruFl3QfT2spyDrRsOd7b3dXf2dOyE+m9pblq1sm5FQ21NbUVNdTmME5g0NtQ21FfV1iALd0sKC2Iiwp2dHORkZGfPmsOURpG2mdw31vl3C/GY+4uTqW/i6Kmy4OdNnToVcJxEUgSb0szMDEPPuKjI9OSk7PSUnOx0GGth6AU8RcKKkpB0gyiPDgPIDg9DnC2gBPj5O9o7WFqaOzraA1AgnvS4WMTBGBMDlwKsd3N1RuILpSVnzpwOAmhubGQAJ0MDA8A6AhAHUykjPRlsNWSRfUxEUKAvtBb4ILBvGIPzcnIx7wqyLjQzA9AfrgpfhK5LQshBVlpqTkZmflp6YXJCaVRYY3jAOlervQ6GnZrS+zXFjhtLDtqIXwoiXoySGc2UGy2SvtdIurtZ4XmP2pMu8qMdSg82UC6XSo1mE4/7Lj7lIn7UTOi4mdhJS8nT1tLnnOTOOslgMuQoO2QjN2AkMWAgMWgmedxObDhYfihW8WKO9kCm1u449bYYg2JHZQ8VccqimfOn8kznw/PgsXxMnAw0x7g5bbkDGh2LOWE+iar6LnzlX4RyRs4NDMqxVwzHp/PxCs+brSEn4W+oVmBv0Opr1Wqu2qVH2k2R2qso00tW7KKqjIWH3UxL2m1jslOHvIUstIkscNRN9ni41FCW7PlC6YtlxJEyysEMUkey4d09DffPHroDOH7lwsNLQ0/OHjm9pmK0LuVQpO5+f7HblWr315NfH9B6e1Tz9i7ZO5vkh5eJXsyVHggVPu4p3m0h0mYi2x/p0ZkUfmxV7ZmO1qdjIy8f3Hty//aTh3du37gMUH7t0rkrw2dODRw6tK9nK4B0Q11BTiY0aHc3F3d395CQkJSUpOqqijWrVgAxbG9rBdm+dVPL6lUrqquBUECrtbO1hJ4zfeYM5j0/aXEs7NxYKmROxs6K3z+Uo54HIH1sHOyMDIjTpk0TExFHEhHb2UCfBHQICw2GAQ+6JfDxiqXFgKLYrjGlJcgibLCdAcprK5etWF4DA2TPtg0nd24abW08Xhw5nOd2OIJ0OFbkVpPq1c1KP58we3jW5nSH2vlW7bMr1C+WafeGK3SE6AwURfQsyxxoXTfY3XFs394De7ratmzesqFlXcvq5rWNjU0rVjc1ALKvX7cGzmxoaVrf3Ni4ajngO9wGIAjcpIY6VVhQCIg5bWUpB5JYA5kbnFjnnzg0GUn2GUkIvrdwQ2w6mrF7GTOUA4KALUIkympoqIFB6eaGDLdAugErczLS0dWVMMrmgYKstk9DFsRnpCSnAEjHIqnAsd04kdDPgEAnJycLCzNrWys0wDwsPjoKCSGPj0+IiooICfbz8oSWoKJMnj9/Lg8P99SpfNLSkro6WjDGB/v7AD0HKEc3gUtFt5VArg9jQEIMkqs2JzuzIC9/SUEhoDlyJ+lpcGX4amDl6EgQhkF5Rlo6gubpqcWpCcuiQstdrNqczVq1ZfZoSPQbiA3Yio6EEi/ES18plLlSKXlvizx0/58PUx4fVLjfQ7y3XeFClfDIEsljoQsGvBYdtl9wxG7hcSehEy4ipzzFT3uLgZzxkDjjJnnaQbLfTPCImTBccMBN+EIUYShJarRE5WwR5XiB+tFsg82B6vmWih4UCS1JYYLQ4nkCszAg52CfgkE5Yo5zcmAuVsbsBWNtzXfFytGdRyZuZkrftpibFgmAeg+gk8BANJWfV0pokZaCpIsGMdNadbkDtcNFvddS6bARcb+qeJ+S1D6K/G511ZvJCWMFWb3+rgecTDv0ZTr0F9zM0LpTo/Z6t9H7ftOXfUY/95gMr9EfWO7680DL40vHbl86d/Pi2cdXh58MnxrZsfbBhqUHIw33eItezlW8Wiv78y61F73UW62Em81yY/WyN8qVLiQTLkTK9btK7reV63JQ3+JkdDgv5VBd6Z1jBx6NDD29dfXpvRv3bo7eHrs0fPYkUPK93bt2bNsMXBsoOZiHwUEBQEwiwsKhPZUUL2lc1bB5fXPXrh37UHrY3rZ1/dqmVcvrS5cUAqXw9/MyMTGCpgxoTtuaBNtAB/M4cfIw0OHL+dX+WihH4YA+ScvBNnkKMiSje3Vy8+CB4s2YMWPWrFnInJWKqpODY2RoCHROYFKFuTlFSwqWlZUiIF5RWlFeCnZKRXnZ0tLi4iKklwJVrywrqasq37y6sau5cU/t0hOVGX1JjscT9YcyVc6UEJ7tNXh4WP3lJYMX14zvDWk/Oq4/tk31ZoPm3jDRniCVs8VhB8rThru2jfTvv3ji+Omj/Xu7dnftam/f2bpzx7a21s07Wjd17NwGsmvH1vbtW7Zv27hxQzMw9OW1FTmZKWGhgYAsYiKifDz8fHx8vLy8PNy8iPePnfMT9/fn2+Myn/8+V/COz8cwCTzHmTNnSkhIkMlKhob6Lk7OYSGhMTFAkOPTU9OwaUYs0RXoAOUwDAOMIv6W1OTkpATAU0BbGJ4BykODQ2AYsIDDyhI4TWhIEBg6KJQnpsQBLEcE+HuDWaavpyMhIcbLi8d2FwKdSlWxMDcFeg5DCJJnPApZ958cj0lcSgJiBMD3Ylm0aPlbkpOgUfn7+nl5eWGdDj4CJ+HG4PbyMtPyU5MLosOKfVw2etltMqJ06ckcMhI/aic6EiV/MU3merXCjbWyLw5Qnx6jvB1WfzWs/HJI5cVR1dutxLtrScMF4pcypM/Fip+LFruUSLiULDOaRrySKncxnjASLXshWPqCH+Gkq+gpN4lzATJDkdLX8knXlik+ata+s0ZjtIZ6qUS7J1Rxi7dGibV6kK6qtSZVmSizcME8GLpoWSbRA3WtcDOWrTHo0e/YeH7PuPLPoRyLdkApOW3dHT8vn8iiefoUWX9jaq6z9sZggx2elL3OcgesJA4bix/UFD6sLL5PWWaXuspoUsKFguz2YK8uN/N2C4UOswX3i3Uerdf8OGj6ccTy7Tnjd6etL28zOLHG7enJlqejxwDHr1048/DqxccjZ0c7Nz3eUtMXadLtKj6SrnRlmdzP29Rfdqvd3Sp3e638jRXEGzWKwzlSFxJljvmIHHaS7LaQ2mFBGcqMHKrKe9K74/np/tfXhl/cGn144/Lt0UtDJweO9R/Y2bpl3ZpGgGagKtBwoWFBN0hNTgEcry5ftm7N6m2b1u/t6jjY27N3965d27cBK2+oqwVbPj0tCYxHZ2dHbW1N6EW8/HxIZlF2GpRjCbsZUP4dsnJG1nU0/oED3buHA8txIiAgMH/+/IULFwotFpQnyhoZGAJvSoqLLsrPKSsuqlpWVlVZXltTUV9dUVtVVl21rLJiKSB7cfGSAuB9uQj7Ky8tqq0o29rY0Lt6Ze/S7DNFsUdizI/FqJzPJ5+ukXx6SPvxWbXnY5qPx6hPrlCfD2vf7FB6sF6jN2JRT6D8uSK/vmUJl7o3XznWd+n0yXODA0cOHDjU27t/Txc8iK7d7T27d/b2dIB0dWzvbG8FTN+6ZQNQ9Yb6quyM5OAgPy1NdREh4Wn8U6Gdw2gkMHP29Kkz6N5Mbua8JVhu/fGdzpkXcH+fUM7xBTTH8/AJCQkpKipqaWnY29sCLEZHRsXHx6alpWQBvUWzXCEeavTpoOm/ESgHVg4C0In4uGNjAMqBxYeHhnl5eNra2gKYuzg7ArPBoDw5PgHgGMqEBPv7+Xqbm5mQkIXv8wHHZ8+ePWeOgJDQYpKSgp6utpWluYc7kgwgPCwEnRFFcDw5MQkJQk9NBtKNjSWA7HA1KAZGAHydmwsSYxMVFgr8HT6CrCNNjEtPik+LCE31cKp1t1tporbLmNRrKnkQWHkMcThL+maD/PXNhBcD1Kenya+vUl9cJb8cVX4+pHJ7j9ydNvlz1cIXy8TP5goO5QhfLJS4WCh2uVgSlAtZYhdTpIaixIdCJU74Cp3wERkKlxxKlLhaKn+tTu7RJpVHW6m3GsnXSpUPBEn0BKiuddHOtDUItbW0MzUgKRGFBJFJdQaUg45s+07PnIoE9aNmE/t3B+U4TsaybMYui8y5jzGmA4fQwnl6FHkfI2qek2ZLkF5vtNZgvNq5WMrFCNKlYMopO+mTxsQusthmEuFkREhvStzGcP/OcI9WZ7UOR5FbpZq311HfnzR5P2L67Kzu61Pmw1t0Bhqdnw42A5TfGx2+d+3Sg9HhBxdOndm86lrDkt0+ujusBc9Gyp7LlHy0lvpoq/KNdTI3muRuNSncaVQCNL+1jHQ5k3glntRrK9xhInXEx+RQmNO50pSzy0tv7N5yta/z9rnBG8NDg0cO9e7tAt69rKQ4JioaqIGLiwtUDjS4ovw84OlrV61o27wBWPvh/XuPHzzQt7d7d/vOdS1rG1csr1haWliQA20bcci4I+ncJCUl+fmnMScUo/nL6KycFvD3p0M51rw+CXdlTt3JeO7QCObMmSMqKqqgoEAhK8nJEuRlCDra6g72tokJMWChA2Qvr6lubmoE02RD82psp73l9dUA6+XlZfn5+VnQS7MyADjKS0uWVyzb0dQw0NLYlR7ZH+e8z5u8z0/s0lLKcJP0y9P6L0e1H4+pPByjPB1TfXlZ8+5ehcet6kfTRQ7HkUaqA/vrU8cOt18fGrg3BvbT6MjQ0LlTg6cGjgwePQyj7/H+vqMH9x3ev2fv7vau9u0w1rY0N9XAwFuyJDIixNHRXklJAUlrKS4uJydHoZDAqiDKyomLiqGbuPJi8D0+t0Fbos3kRaRvbvedJk6gd09apmUwonj5AcpVVVUtLcxgJIuLi8nISIMHkQmQnZmVC4LGceflZuZkI9s4pKUmpicnpCXFw2tGSiKG6YCtcUgESmSgf4Crq6uVlRUW/YLBa2JsXEJcPLb+1t/Px87WWk9PR01NVYWiTFYiycvLgUAlK8orkMlkbW1tU1NTLAgSrhAUEBgcGASjQkgIEsmO7u4WiixHcnOBjqOmpkZVV9PX17Wzs0HLe4cE+IcFBYYEB4YE+AZ7e4Y62MabGSSryKzWk9trLX/IWfJigsJwvtS9jZS7XfKvh7V+vqT89Crl6XXSszHK8yvKT89Sng+q3elUeNBOubWReGezwsNWMggAxcONlJvLiTcqFIYzxEeSpE+FCZ8OF7mQJDWcI3FrhRLQwVddGj93qD7cqHynVvVIhPjhEOVt3tolLqa5Qd6Rfl721hZqVJXFCxfRVjCgBhG0IS4u+sYpdHclc5rc7wDKudCN5znGM3SP70iCFKVBOdb/VeRlnQ3Vs1yNWoKNe6J0+2Mp59JIIxkKl1Llx5IpJz0kT1gROpWFWhTEj4YFbouNXB7i0xzs2uKp0+ZKuLHM4Eaz2rtBi18uWj47ZfT8qMWFDfrHGlwwB8uDayP3xy7fvnTh3vlTgxsaLjcU7/LS224peiqUeD6F8Gil+uON1Otr5BAoX6N4e63CzUb5Wyvkr5QQruYo7nWe3WE8r9+J0u+ldyHVd6gw5s7mFTd2b3p0pv/W+dODh/q6dndUV1dmpKX7eHlbWlvZO9qFhQaDDVhesgRwfMPapvbWLUDGjx7cf+rI4f4Dvb3dXRs3rGtZ3VRfXQXIAWgOFAPJs+ztqaeHBGlNmzYDqxkuNhxm1DPNN3D8JVA+nv6bPu1BXyiArW6gjTHQVoCGKykp6enomhkZmuvr6lBI2mQFG2M9bzenvOy0irKi5TWVMIxtWteydeM6ANBtG9dBFa1ZtQLboQmgPBuQIysDaGBlaemqyvKeNSsvrGvojvc5EmrR60rY57tgtELp4jrCi3N6L65rAY7fv056coPyYpR654D8o3bVY3nC/alKl+sDjjSk3hzouHnhxIPb1x/euTk6cnHk3Jnzp0+AIXVi4PCJo4dQKN/b07GzY/u2jS1r4B6WlRXnZaUDyzM3N0UWqVMousAQkX1+nYDxWVlY6uvqAdoILVzEi+fDc3Fj+dOx/NSfxBd9n1DOiH9nBJLRIo648GARioiIaGqqu7o4xESHAyhjGU5gTC3IyQXBXOQgGenJqSkJIIDjmACaZ6amIB7q9NSkxHiA2dDgEG9PLzs7O4ByJLVWaAhAOeB4YnwCFvSCbZBrbW1paWluY2VtC/+sLc3MTMB609XW0dDQgEFFXV0dAN3AQM/U1BhZYmqO/AOwRpaSuTiB6QDloYC8vLy0DIEgKwMcH82Wrm9tZQbjBLAHELiylZmpjZ6ulRLRXnRegYr4DhuF/S6E4UTFi0sID7ep3u9VfD+q+/MV1cfXyY9vkp7eJD+9Tnl8ifT0vMqtw7J3+xTGugg3ugh3e+Xv7ZV/sEfhfqfi2DqpGw2E8wVCF9JFBqMWnIxbfD5T9EKx6K0m4p1NMm8PaL7Yo/ZwC+X+ctWjkaJHg0k7fbTL3c1KIgLSIoOD/bztra3UlCnCixbycuHAnuXj4uDj5uTBsQNXQtb609H8d9xQ7HeE8vGNXWguFyaIh6JgXgF9szXSiXexLPcxbQ3QOharfjJZ8V6N7s+r9e7XqT2u0LoQKXPeXaFbS3Sjqsz+IO+VwQF5ns55LhblTtrr3BSPJlOP5ROurVO9voM62qZ8fYt2/zKVrnyL23sabp3qfTh26fHtGzdHhm+eOTG0Y+O19XV98e59/hqDYUqDUeI3yim3G0ij9dIgNxvlbjbLPdxKerJV+fF6ypMm9YsZhAuR8v2u0vtsCD22Sjsd1U7lhAxWZ93e3zZ6rG9gf2/XrvbS0tKoqCgbGxsdPW0HJ/vYmCggd7UVZQBSWze0AOnb39N5aqD//InjZwaPDfQf7Nq1Y+fWrYDmq1cuB2irLl9alJ8D1AYavamxiaS4FB7Py8HOTfe3jjvJ/yooZ060xJxjHR4iImi43rRp00RFhYFigXXs6eriaW/nZWbqqKHqpE72Mtb1d7AuzsqoqyxraVq5qbm5o62tp7O9c2fb7p1tMNQBpq+BuqivLSoqzM3NBUAvLshfVVW5ta6yq6r4REXuvgjHY4F6A/7yRyKF7jaqXmslvrio8/ym5qNbyg9vk5/cVH55Xe3pCcqrPp2TZeLH85WHl/v2/X/m3gI4riPr+877PLubxDE74CSbbMAo5tFII5YstCywmHHEzMzMzMzMzMzMzGCxDEkWKt/pe2Wtd/d9q77KQnaqSx5LI+lqbvev/+f0gST7xe6ypdGeg52N04O97fW1jeWF5TlUE21iuH+wp7Mdq21ZUVIM+wqWRRQOPAIdB8h48uQJLy/Kb0R5p9aWmAJ1tDIzxd0CHES2h/cffPk5akFwYRRjlfDedaP/t6ryi7KjeGePy26LcPtQL5fHj0VFhfXIWu4u9rClBQZcVAMHuQEmJjDdw90VzE17OxtbO0tbG3QOiZWxtXRxsAVJjlznKJwEPokCz1GukIqSkoKilqY6CGQ7K3M7W2sHe1sc5SbGhigSXEMNPsKbbKBPhtcbGujin1RWVgTGP336VEhIiJefBwW4kzjYiWxEIoGNRMQKH5LY2YmMzAwgfeCyKSkfs7AwkdiJfLzcsPsC/UVEROB74aOAgAAXvJzIwvr4AceXt22ID/Pk2JrUGMesGCc9KQ6K2A+aWf64zI+j/GyX7WwX0fx0g4hE+jLpfJHjeJb9dJZ0NsfxaoHrhznuHyZ5jtsIJ9Wsa8lU65E0c34P5/0frUbRrCdSvShiPKpi/LGD81Uz6aiIdS+e1G/+GFBeS+aP05GKtjPzd7JxdbCxMDaQl5bgYma89+knH//2f27/73u3fvPejd+8d/v931773/+5+sH7YPb9dx174t6VS5T/jff8ok8gOjRHVVYePRAW4DdWVww0VE3SFa/R5hy14hhzpj9I4X1dLIgcIMk8sw7Us2TmpiePCrhom/Q1InU1rOSkjcT5TZ8whUox1lnzdLqxLaYKrxaIrBSJruVJtwcKVLk/32xM3xhqBVV+ure9uTi3PjUyVl0ym5/U5KjTZSY2ZMI+Yk6zHUTajWNfi6ZbjaHdTWfYyqE9qmQ5rmWFuwX21GIE5YIXfafm162yf6gW+6pc4sGIg+xgoOl+U+5Gb9NYZ3NLfU1wcLCZmRmYk4ByVXUVECbR4SGJMZH5WenlRfmg+zpbGgEfCxNji5Oocktna9NFgdyM1NTEuJT4mOiw4EBfLyc7a7KWJg8X9/ff30dHH1gfAByXH/3N49fxlf9ddW88nQGLVLly9+5dampKWEWggwx0dcwM9cw11ZxVlXyUZAKVJH0UJR2UZBP9vFCdnKwMUOLwnrQ21gHN2+trm6oqQBcX5WVnpaVGhIeGBoeEBwdFBwYUxkW1JkcNRvsvhDqBJB/S5xoyoh2yvbebRVyvpX+1yHe+zXWyf4Hy1xucrybYf+zlH496PBLINpes1Z5oM9NWuDjSfbyzeXLwYm9rc2d9ZX1pHrT56EBvf2dnQ011RXlpbg7o8dTI0JBAXx8zU2NAD57TD7LOkKwLShPuS0iwfyiAzcPdwd5aS1MVVB4HO4mKigp2L7wJBo7yi1DF/26UX3RiwgKirrxzcHX79m0AIuhfMyN9bw9n+KsjQ4PCw0LCQoMjQoLhz/f3gzfA1dnRydbaBhWkNTPE+x2bmhgA1l0c7HGUOzvZOdnZ2lmh/pka6qrwfqKIRn3UhgIgDtsAfjQKlivgGyCOl1SEz1iYG1tamODx6SYmRnp6uhoaGkpKSjIy0rha5+Xh4uBgZ+dgI5FIyKPCSWJjYyUSiSQSG4hxuHLYemWeS4G6B0MKHs+wh7CwMND8CXwzMyP342/1WCnCxZlKFOgGzJjGXKiOcjgP6lj/siD0eoX7bIvjfI/9ZJftdIeIj5MtttNN0tEa8Xid7WSD/WyT9Gqd4/Uy10E/w3ELy1rOo7VUytnw7+Yj760mUa5lPD6ooD+sYfihneNVA+kgl/VFDOeAKaCcWKcnmKgnk+BiGeLu6OXq6GJjZaCmoiTEL8ZII0R5n/HTm1+//x7h3ldsj+599/Gtj377WzD4cJb+q4D+L0A57ry/mNAwud/2Vr9s+Xr9+s2vv/6ak4NdTUHB09w4xcEkTVusQoV11II46kRzlMn7qoL/rJjzJItr0YNuwZTQJkFZIshUp6cWoqWiJy2u8IRLS5gUoC5Uai/T7Ck9FCU3niS/kKe1lG8wnGjQE2d7PFh7uDD2Yn3pxcbq0tT4zHDfaEvNeHlOo5/1kLtGjyFnt87jRQfGJU/6RV9q2F034ulW0ylO69nO2omveznf9HCfN3Cdl/AtBtHOu9ENmVL0GdJNuD4d8tPYqY5daiqe7mrqbm6Ij4txdnaGmQeGooaGGqiPsKDAmIhQwHROWhoI89rKspH+noWJ0Y2F2aXZyb7uNqBYQX52ZkZKclIcvAxvLwfaHJaEqqIS0Pzu3S/Q6QemfFHG9dtcyl+xCOo/5i7iSP/004+pqSgE+HmVlRRgYthamtmbGlurKAQoycTJP8uUEU2UFPIUE0yxs04N8ivLyaopKWprrOtoaezpbOlvb+ltRe9hfVV5WVFhVmZ6WkpqRkJcfmxkSbBPZ4BrjYFii6ZwlwpbrwbdjD3jlB/FUQVpq5Xx5RLP6TYHcPxom/VglflskXA6yvJDL89cEtVMFPdskmZzrMVQTfpkd9Ph1vrR/t7hwf7h3vbW2vLy/ExfV2dLQ31hQV5OdmZMTFRkeIS7qxsQBCx3UREhmO5glYMGB3QlxsakJcVnpSVnpCTGRwPT/AFboBzB8gDz/9GjR7AK3rWW/nqQ8N+Kcjz2H/eroPzbm7fwnqi3bt3AVbmpoR5I8pAAX5jA0VERkRFh0eER4cEhWKKyp5uLq4OdvbW1pZGRAVlHFy/JAoLaxsIcDBcwX3CUO4AtgyXTA8oV5VFzOOA1QBx50i3NTU2NzUwNTYz1QZvD5y1NTazNzUCqw8Kxt7UD3MMTLFbdyNhIz8gQiK8NvwVml5ycjLy8rLysHPxY+C/e7wLumrqaiq6Ohh5ZB6afATb0dMlweTqg8TXVYUdRU1JUeC4hK8CpzEZnzPJt1JPvWrTp+sweL4fQr6RTnXazvxhmernOdb7NebxFONhkAaAf7xDxcbTNBnPsGIP7+Q7p5QbpdIbwcpR41MZ4XM+8U0SzX0x/VMl8VMt40sh03MB4UkcAs349jn7Nl7lT+16XJmOdjmCCjkyCk1WYh6u/OwqqcdTXsVV8bicl7CYpKP3w94x3PjBXeGahJMP64Lurv/kfuCNwm373uw9wAvzz3SL/NceeH77r8XknJQHHE+gaWlpaKclnxno6Yc62+e62OTqSVYqEMVO2cUea4yy+H6oFTks4QJgveNHOm7G0SlKViTDVGagHa6vryUrJigpqyYh56ysl2ajlOihV+2k0hun0p1gOZTh0Jzl1pvofjnUdr87trS3DmJscHR3o6W2q6SjMLPGy6nHTbSfzdqlSL1gwL9gzLLrRLvpQrcfQraZRnTYST7oI5yMkGEc9bKetnItpFAuRlMNu9/odKEe9+PoD5LYrw5aacud6mgY7mjPSk2GiW1iY6YKBqKNjbmqGZXj6xUVFJseiI77SwryB3o7ZiRFA+cr8dE9Ha11tZU52ekpyYkJ8dEpCLAy89bOfl6eRHllORhYsx88++xxvlXtpwfy6ieDvOu8uktqvXf3yyy9pqCmFBAVQULChPixgJ1srN2tLexWFMDmJdEmh0qf8FRKCKZKi1W4OOf7eVdkZDWUlYKb0dbbCezLc1zXS0znY2dbZWNdYXQ00L8rLLclMb0lPbA/3ngxwrFMWaH7O0q1I06V5f8aVdjr8wWE922Ynw+kK5yXKX6wwnS4QToZZXndzLaTQzEfzziWoNYTod+VFDjaU7SwtHOxsnh4eHL/Y3V5fWZ6f6+lob6ivBY4nJyeGh4f6+fjCLcPzVsCwkHkuYayv6+XmHB4YmJ2ampuZVpibBUYDTnN3Nyc8bwAUH0hCoDnM4f9bMOJ/rYPlI7xCBHAcrvzLz79AjZmuwjq/fu/ePRERlHjp5+UOKAdtAbsc0DwmIjIyNAxr1uPr5eHp6uzi4GBnZmZioKcPkARUq2PlWUCJI4472jo52uP592RdbWVFJZjMKsqKoN/xGoqg6M3NTTEBbozHoVuYIJrjKLezscWyPW3whE9rK0A8ejEQHyS8jq6Gnr427pABBMETfR1tPW0tsq6moYGuCXYiiqoIWJpbmlvAQJGRmOo3MdA30tMxUFPQERMw5KaLlWKu0SK2G9LN+bIuxtGdNnMf9LC9WeY7W+U4XGU9XCcglO/BYMU+4k9YT/ZYz3ZZT7dYjxaYgeYv+ukOOxm36yh362iOm5mOWhiOmxkQzatYjgqI6+F0K24s3ar3etRYGrQEk7QRysM9XEN8vPxdnV2NdL3V5YKUnsYoierSfMV84z0lThoVASLDt59ff///XLv6AW4q3bhx67/RV/43CRTYhV6/eg3Vtufjgy3Xycoi0ce9PsQ7V1uyQpp5RA95sfcTOE6LuE6LOF7m8YFwXjBjaRB7WMBP02SiHW2kZwLTRFrChKwR6GCR5GOf6WdbGulSnejVVxY3WZ8x3ZQ32151vj7/an97fX52aWpidgJQ3luRl5MZEZhsa9Rkp1Uly1Yrem9UjXacTDltSTVp93AhiGI+9sFxE/Goj/jDAs+bZd6zOc5XUzwvh3je9AocN/AfVYgtZz6bSVNfKfedrk5Z7m+Z6G2vqy4DLgeH+Lu6OhsZGYEiMDEyBjvUy9MdgB4fHQXQbm+pHxvsXp6bmJsea2qsLS0pio+PjYyMjImOTI6PS09OSktCrYjCg4NgQsMaACOfgoIC3v23hX9/ZZRfFkR79wj07t27DAwMwgL8qooKgD/QYs72dh5OTj6O9k4qihFSEnEcrAUEhnISczY/R6udRZazXUlibEVudmtDbXdb0+hQ7/TYEOxwc2PDEwO9I319o/39g93dneXFk4WZlVY6rWTpFhnWNmmqER2aIbP7W3Gsm3kMPwzznc1wnK6TjnfY0RrbIR4sM53NEw/7mM5aSVNRj8b9iEPeTyudFRqiXBsz42f7e1Znp4DjJwd7B7tb62tLPd3t9XU1GempsI/6+njBnQIkPRMXE3zCL/FMFJQgcDwpLjozNaW6vKy2orShuqK+srIwOzszJREY5+LsiBzBqqqCgoJMLIzffo9HI1zWs/wI6xz93xhXfjmXbty48dlnn/0BHl99DTT//O6nML799lt+fn6wOdzdXN6iPBQszriY2OjIqIjw0JDgQH9fP29P5DQH6Q1S2kBXR01FVVFREQ8Gx0shOjg42Nvbgy5HZ5sqKtLS0rKyz3V1tVGAuZWFjbU50NnGAmX5WyCmmwHHzY1RehF8FfnhsexQe2sLOytzsPDgo4ONJfw0FBljjuQ8nlaKZZYawfeaGRnCLYPPw0+A18BWYYXFRMJPhu9Cu4K1FRgN8BudrS0cyBrOSpIZ+jIFGjyVOoQOC+Z+d+q1dNblYvqzYZ7DSSLQ/GSDHZT44Q7rwTbhaIcFBjyBcbyL/XeTBazA02XW0zmWl9PEowGGoz6Gs36W8z6W03YkzPeK6PbSCfPelAtWDB2y9zvl6Bs1BBM1pGPtzUNcnQI83Lwc7Fz0tb1VJMPknmSoCbjz3Bf56j3mu+8x/uH939967+b1/7l2/QOwmm7evvXf4mC5VN+XBWz/mgWKPT658zE9HY2EhATcYzc7m9QA7+aIwDwt6UpJlhEt5lFzyqN4nvNc3leF/G9yBJfcGRZMifWiD/L4aJtMdWLNDE3VVVTknxvqaXk62UT5eyaH+uTEheYnh7dU5PQ3lw+31U73tZ1srb082Fuem54bG5keGx7u7yvISIvz94q10K+30i6TYK0RuD8iRzuiRjFlTDlm+WDen2I2+t5RE3G/n+XVMtfZBtfRCvvJMsf5IvebOf7DQe6DTuG5EpHRPJX5as+p+pSVoba5ke72ppqaypLkpNjQkADQHbraOuqqGgB0sBbBSIclkZaa2NpUO9LfuTgzNj0xXF9XVVBQEBMTExYWFhcbnZqYkJ2ehvlaQJmHu7k6wyyUl5NhZSHcvn37bckqvGHu9V9Lj/+jpwU0HRUVlaiwiIqCvJHuRbkl4Li/q0ugk72HslKclEQykVBMR1XJRFPICcvGMNXCuCA6rDQ9rbkaHQWPDPYAyuenxhYnx2ZHh2GvXVucW5mZGm+u2azMrTKUb1bi7XhO3yV7f9zw8ZDdN1sZTBvlNG+muI7mWWG9Iem0SwCz93CFcL5AOuxhPmvkmAx5OOHJMuYu3Ooo2xvp3JwYPtXeuDg2cri7dXqwh4T51lpfbyeockB5fFwUcBlEm+xzGZjlIsKCykpyjg42Qf5e6ckJ+dkZTXXVHc0NMNrra0sLcnMzUsFywiOOwAITExNjIxEpqCi//PKri4q+GMo/+vDK9as38Bjh/7ZKlnBFwHGwpfA+y48ePIRBRfn43vffgq7i4uAEKDs62AX6eqHsrZiIpMRY0BgwS2FmgjAPCghEMeaeHm5Ojm4ODoBImOdKSkoK8rJgqaDsUCsLQLmjI9DYCpS4mpqalJSUpOQzTU11PPEHF9oAViszYzzdH1hsaogSgFFNLksrVGcRh7gFnuRp4Whrhel05HgBhY47auDnwHMwBeAasC3BBL4dCG5tbQkDVAV8CT9ofVu10cLZzsrJ3NhBQzFMWy5ElitOjpCrxVRnTj8dTlrOYPuhV/TlCO+bRf6zVa7TTY6TLbbDLQI+Xmyx7G8yH2yygAmIPrPBfLxGOFlhOV8k7I/RHI3Sn40xnw+znHTQA8p38+m2k5jn3WjmTRk7pR50yjA1qAomqD+PtTEPcLTzcnJwsjBzJKv7q0lGK/CU6vJlqTN6Sn5j8/yemvA3NN++9/u7733z7a1btz688tHv/jEe8ZfNqH9ZDZa/QflFW1709LtvvuXm5IJpAPfG18U1KzSoLTq0iCxf95w0oMjQo/XdXjDnaTLPdgTLViBh0oxqXIuhSZy6RJSlyUIn1sLAVk9LW0NZl6wJEPFxdw7z844I9I4MCchMSSjJz4Qrnhkf3t9aO9rbWlucXZ6eGB/qa2ttzEpNjPXzjDbVrTVVr5Rgr+d7PCpNP6pENaZLMWr6/UoI7XIKxZs+rtNJNtRUaJvjeIfjeJN0ssEJWD9d5juee3Y4rXM46X62lH283L63NLYxPzE12j/Y11mUn5WSEAuKRp+sp6SgCKrNwszc09UF9F1BTmZvV+vkyMDC9Pjk6BCo8rKysszMzLTU5JwMZMLnpKdkpiaB/R4WGowOl+xRP0OhJ4L37j3AS1Ph+da47+zfCggc1nhtZazz7BV0AHsVRdTg9azx7AbYhnH/OCxgMH1B+Lg52fuDYe7jFeTiHGZn4y0vkyIhVsDD0UwiNLLQl3MSuk3IiUa6GcF+ufFxxdmZZYV5bY11fZ1tizOT60vz81PjC9MTR9ubx9trZwsTfx5srjaQblBghU193JB63YewEk37spH7uI/4aoHjZIUIVjAsKrB5AeVna2wv50lbjdQvyphngh7PujI3qFFUqLDWmCpk2xoMlxdP9XRuriwebG+/Pjs+OtwbhU21tSkrLRlMIsAWQFlcXFxI6AmIR9B3IcH+cMvKiwvqq8r7u9qH+3uGB7r7OlurSosKsjPgS6BPnRztDQz0nj+XEhAQYGVlpaam/eKL39+6cRMl9//ufazCxpXLLNAr+BnjO3m8KEUbWyn4idEvL4eLHXpf9kp9t979RT2mKzeuvHNkjR9TgxanhgctFS093tdNUFREiJODnZ6WjpGeQfypKDDR290lKiw4JjoMDBcQ5rExUfBegUiPDA0JDQwI9vUN8PIK8PYA8wUoqa9Pxo8oQYObmppaWVnZwcMW5dNraWhKS0qJiAhJSUmoqCjBK42NDY2MDMCsAbLrkXVgoLBxVN9YD1Q2QBnh+AL3IKWB6RaXRXTxOrr4RxhIdFsj0Y0hHlVnRB4bUOuosJcZnn2KZy3Z29va2sEPsXSyMnc20fc10vLTlvVXFY3R4C0zF2hz4ujzop+NZZzLojrt5z4cYTtd4jheZTvdZscc5aDQ2Y520XN0FoqiXNjOtonnW8RXW8SX68TXK2wvZ1leTjDvt1O9qKNfy6Jaj6GfsqeY1KVuEfqmRZSmRo4vSvFZmKmBq5mxlZGBsY6mmYqst5JonDJ3vSn3iJdgTwj/WL5qSaTEU9JvKL95j47iytef//bqlfeufvQ+Zo6/Mz3eaU3z6/jK8cbnyK+C1+D+AEVuUTx6LCIkrKWlAfttoIdndlhwS3hQia58w3OOPln6PpX7+17cp5ECG76sa66sY/o0o2qEegnGfEmOelvDOFszR2MDYwMdA0NduIWgrWBWebg7g2KCOZeRkdbV2TozMbq7ufZiex1QDib22GBva0tDdlpSSpBfnIV+g7lmtQSpkY8SUD6iSDmq83jY+NvlENrVTMpXg1wnM+zH6+xgwoOdhQz5HY6jbdLBOs+LFfGTTcOTdf9Xu2XnO0O7q1PrCxPzUyNjw31lxXmAck8PF5S4rKKqrq4O08jbyyM9OamkIBf3lS/MTkyNDbc019fUVBUXFRTlZYPWKy/Kz8tMSwOSh4cE+Pu6ujiBpNHV1BAXe0ZNSXMhzLH38MaNW1ev/ic8sFhh7g+weo0fXZabv0T5nTu3KCkeCWBtkmAdgnUMe4+nq1OQr1e4r3ekm1OKk0OMsnyRjHgVH3s3N7GJQFPNxdyprx6lqZTs5ZoVE5mXlgJYrKssa2tomB4dRWbT5Bgw/Wx/53x/64f1mZ/HO6qMpOuUCSMGLOOW1BvhLCup1K97uY9HCadL7MihucF8sMV0ukM432E7X2V7M8+xWUe9X8w8G/h40ZWpTubrSkmKOm2RbAPlsfyMqaa6nbnZo421P54evz7emxmHnbcVNlEgFKBcW1sbC3Z4qqamAuZ/QkwkbKtwba0NYEj1jI/0jw71DvV21pQXFxdkpybGgT6F+WZiYqSsrCgtLS0kJMTDw8PIyHj/+3s4zVF5jYv68hcox31TKBX2d1dh4NU2sFYdV/5JlOOFbvCfhmdvvC0Tfx1twFjSyYcX1XqRHvj6mz/Q0dExMNAxMtJzcXFISkqCaEDte6Sl+Li4mRmZeHi4YEmCaRIREhgdFRofFxkXCyMaPsZEh0eHhwHKQ/z8AOWBWEVJ0C6WluZkMlkZ3g5lJS0dbRMTE2trhF3gMmh2yWcSfHx8vLzc4uJi8BKQ5zC0NNVBBKiqKMFHuAAdbU1URMVYH3ee4J50KzPTt2S3ABWOhrUl3nwOf3LxeYtL9wsq5mVqanwZFYMkPwwzVIHA2gbtEKjAi6WZi7mhu6mOp56Kt7p4HFm40IS3zYFz2IdlMoLmVbPQeS//D7NPXi/xvN7kebnFdbaFJN3JFgmenG2ij+jwc5t0vsX+aof9DYwttpMFxuNpxt0uqr1GmpWsx6sxtJN2D6d0aJoFvmkSpqmS4QuVEfHUVjPTVNNQVtBUlDNWlPZQEolT4WixJM0H8c8k8mzWyg8Xy8e6M3tYMLlY8MqJU3/z5ftXP3zvCl4P9+1J9S8r0/av85Xj0Sxvo1ZwBfHxxx8zMDCA8QUbtaujQ7CnR4a/d423W7GWbIsMV78UXe9z9F7MGtOPkimGtam7Fak65JhHTWW7Hci9kT4FIQEBbi5g0dvaWqMqms6O8BHdZmsbMAKTkhJamhvHhwdA7m1vLC/NTy1Mj44Ndnd3NNeU5lekxue72/Y4mzTKcbc8oR57zjCmTDltSD1u83ArjmU1n/rVKO/5IhdmwpPQwRpsyLvsB9vEF9s8LzaeHW4a7G8EHO2UHmwNrM2PA8dBtXW1NYP0TkyIAZSjbDcDA5hYsK+AgivIz22oqZwYGVyZn15bnluamx4c6Onram9pqG2uq6osKSjJz8lIBvUTEeCDKnZamBijpSX7/Am/IKD8zp07l7my/4G2zu+0ULgIGMcf77+PWmbDNIL95PvvvwWOa2qoGBmSQUnBKsIzqn09XIM93CLsrXNszVNln5aKcNZxM7Sy0zQTqWp5mKsVxH2e8kdamcb7emYnxqMA87zsytKSno72saH++Znx1YWZ073tly+2X65O/TzV2eFB7rEWmXd7suBLPMnmfVFB+NME//kcx/k66WgD2bmYd4UA4uh4junVJNtuPe2LIua5gAcLznRd6vc7lBj6DMSrTZSn02PmKotfzk79tLb009bq663lvcXpudGB4rzs5Pg4FydnQ0NDRUVFoAyoRbh9wPHivKyW+urutiaw5KZGB2GM9/c21VZWlBYkJ0QDzGC+AUdAV8KdAioBkiSePeUkcTx68PD2bazIJYbyy+zcy9SKdyvH/asqKWIoR5X2UPlG3AP2tuULfBXFSWIbBmqveOsmJTUFCwsTgcDMzc2ppChrbGTg4mAPtqO5sYGyvBwPNyeJxCYhIQ6q2c/XMzTEPzYmHCAeHxcFExTVyQkLBZSjMHNPD3x4erjBdghznkzWB47DgMkPRAVdDMNIT/+5lDQ3NzeS/wJP4DlY4aqqyijkXFFeUUFOXk5GQUEBPqnxNsbcxNgQWGzyFseIyGZvveq4C8XSCoaVlYWFhRkmxHG/OQI3fC/8RUAnfBjo6xgaofJtlwNeAzuElZmxk7Wpi6WxI1nZV1c6WlekwlKo2Zq915FuKph+LoF6v4a408p0PsV5PM32conzfIXrZBGPMSfCOJplOZxhPJhjPFpier3Nho8362xvFthfj5IOapj2s1mnnR7N6NM1PUEor5bl9xUXMHgqLCcsJPqET1Zc1FRZJkDjWZI6qdWKbTmCZzWL87RLbqtLZaRWobVYoavSJMJLhub+BzevvXflw9+8G3T0jxUT/189df/1KL84acFDVq5dxQuXwxT/7LPPQMhISEjo6Gg5WFsEOjqmubtUO1lXqEt1yHAPPmMclKCZUKIf12AcUKXrVWFuVmCuV+QcctRt97HpSAgrTYiOD4dZ5YcKXXp7gjTADTozMzMfH5/Y2Oimxtqxwb71pbmt1cXFuUkA7sRw70B3e2tNeWthVnWg67i3dZM8D6B8XIZ+TJVixpRqwv7+RiLjUiHl6RjX6Qon7MN4BgqOcjCyDnf59jefvdgy2NsIONwte7E1tDI/CVobuNxYW5WelhQdFeHh7moDUgHLKwkO8gPjtKy0EKg9Pz2xsTy/ubKwhmpwDY8P9fe0t7Q11lYU5xflIs8M2LMgbGH2g06ReS7Fx8NLYGZ99OAxoBwLB/7o79ot/fv0OG45vdOhCj1++9vfvv/bD25cu/7NH74isDDISj2DxQ8ax9YG2b+ActhKPV0c/V2comzNy2xN8mSFqkVYm7goWzketnI+buRjqJERCBXlTrYwjHFxSIkMhd0LBYcU5IGNAibLzOQIbHXH+9vnB9tnazM/TXd3BFn0usnO+IothnCeFD45qmX/aZL/1QLXyw2O400UuAIoP9lmAZQfzTK+nmLfb6A7LGOZCbw/70Ldq/19nyrNiIFQl7HCTkrYXnH2zyMDP0+P/jw7/tPi5OuVuY2p8aqigoyUZG9PL6CCrq6unp6unZ1NkJ93HsoGyMNRDpbc5MjAxHA/hvKq8pL8pPiokGB/QDnMNyQdLFENbkCWtpYa2Cg8XNwUFCimBVfKl2vhEuV4Cbm/QzmurP8JlKMcpcvY9qvvVD3EhT+WxoWOW8CcomOgZWNjBY0sLSVuZmro7uwU4OMN+trdyd7MyBA2JJDqfAK8KipKzk4OQYG+OMqB4zBiYyIiQ0PAcgz09fHz8vTxcPd2d8Pzhhzs7M1NzYyNjWFfBKsU8GppagLDWN9ATkZW6IkgSgB+ilrKaairggyHAU8A6Ijm8vKK6CEPVhEe2ghEBpTj4toME9q4vgZe4zRHp5qW5vAl+CIamJY3w/Q4fC+WbYTFt2BWO+7MwQdwHoBvhh2xovrpRjp22gquqqKx2sJ5ZK5mC/YhZ9ZJf2Ax93YJ8U3Pkx9H+P88K/KXOeE/zQj/OPnkhzH+N6N8L0c5Xo6TTieJZ/OE15vswHHc2fJqhe31DMdBM+pENub6/aQhVZPwV80i1OVS3HacjDKsTPwszHyc7M/FhG00lcJ1ZVK1uNqsWNejeTZz2H8akF2oE0nx/CLS8cvBas28CHnGb9/77MZ7N6/+L1Zh+eq7FTd/tWNPPO4Qc/pcwWNX4DW3b99+9OgRWKawAAzU1ey0NEN0NAp1VKqeP+kUZevmo+7ifdTO/6BJmGKMLDhhLTvhojnibryTH7tSlTdeU9xeUVqen4uVlUVhfIEBPoASE7SZm3h7e4Ph3NxUBygHegLKAbjL0xMz4wDQvuGOlpHa8rYo/8VQ1xZF3mZBynE5ujENikV7ukVf6v1c4kYN/dkM1+k6J87xF1ssLzYI+5uEF5tsBzv8B5sSx9tG+5uBx/sVx3tjqwtTgPL66oqc7MzQkCAfL293d1fYV/x8vUG7pabEwxW2NtYNdHesLc7uri7trC8DzYHlE8OAr1Yw4eEFGSmJESHB3l4eKBRXUwsM0if8AszMzNTUtN98890ndz697Or5n3GtvOscuIhnx7fkK1e/uPs5Mz2NmCCftqK8o7mpi721iyOKG7OxNgemuzrY+DvaxduZNzqblcjwNYgxjssQZ+QIYxKMQ1JsDc/Y00VJ6TqK/rrqke7O0cEBwIjUxITSwrz6usrxkd6l2ckX2+uHu5svd1b+vDG9UZ+5V+I/ESo/Hcyzlca1ls/wso/zZIz11TrHKZi0u2yn+0RclYNEejlBBFV+UM60mUS3FcYyYfFoQp+uQ466/jlrg5JgrZp0p7luqzm53dmqJcD15UjPzuTocGdHQ001TBXY++0c7B0c7Pz8fOKiwuF6qiuKWxtqOpob4MYN9nYN9XUP9nQCyitKCsF4Cg4KAH55uDh6u7v4ebqBLeXtBcoUtZoDNgkJCdHQ0Hz88ad/k2PxDy3ZLvNm3+1M9MtrqnyIt6fBkA0/9u2ie1szAwn2W7duffXVlyDJ+fl4wOYz0tPx9nAODw5IiIlEhzRB/n5e7npkLXFxMW5erqdPnxoY6Lm5OkZGhADBcZRHR4WFh4Vc1rkFLe/h4gyvgYGKI749YMSTgODdAIYCmgHfsMbho7a6mpEeGfW5NUKd/3Dg6pF1yDq6KPhbXV1DQ0NHSxsgjGqtYJWQsdQhU1yS484T2CwuP4n4/g7KcTsAVWe5+KqhmbmRuQX6EvZL0W8ElAPq4TlebNnCWN/GUMdBV8lXSzpB71mVhUSlLmujPvWAHc2Ay4OFaLrFROrNPKbNPAYYG9kMiymUS6kUKzmUW6XUJ13EoyHGV0tsZ2uspxuEo3Xmk3XWl4vsp0Os580cqzG0a24snTLftUvQ5AkymTA8Eqd+xE1PI8rHoy4j7WVMTjJRzSHzd1mTlkM5VlKZX7aLTxZzBhv9nwC93/TnilcEC4tTv8fw9W+/uvn+jSvv47nEvzjq4V+G8rf4/uAS5bjvB34C0JyTjSgpIEAWFfGXla7WVGyQ4OsUYu3kpW3hoa7lpSnlp+s1lO2y1erytuwJcd2uL9nqa57rbQUig8FbU16cn5OemhiHCyVz1KfKFBYk2IPtzQ0gpjBVPo+jHJgLlvJoV9tkU013fMhyuHuLMl+jEOWoPM2IxqNlZ/qFAMr9IuJmPf3ZHOfpJgfovr+ifB0+Eo93BE62np/tmhxthpztVhxtj2wsTk6ND5WXFSUnJsEW4uLi4uXhGRjgFxUZitpN5GWWFxd0dzSDuIMr2Vtb3l9fga1lbnIUVHlHS2Nt5UVzZ1gY9va2enp6qsqoJxnggJOTk0AgUlFQ/+Grb25ev/WfkeSXKEd23NWr76SXIkfZ9evXv//D17xEJhVxQSt1BT9rEz9Hazd7S0dbhHJrKzMgO6A80cGy1dm0QpanWZRuTol9UY19Uo5x7Dlr61PmSgmOcrKir7KMr4VxgIcr3LXo8DDQ5pUVxUNDXXPTY7sbKwc7G+f7W2+2F7f7al40Jg+HaUwEi6wnCqxnsL7uEDgbJP24woNclrts2JknjnKGkzHCRv3jrQra9QyarXgmMLAmTClbZb5tePqg6glltRBToyRPo4xgvdrzKjOdnwY6jqfH50eG+jrbMtJTo6KifH1Rzb/IiLC0pPjK0qKaypKm+qo2rJhld3sLWF3wysaaSribsZFhIcGgSr0Cfb3AKIwMCYgKD4JtG8sGdQVqAI8EBQWpqGju3PkE76D0d97tdwsXv+PUuv7LUP5XpYZ3qMEb577Npv7wbRls1B7o8y/AYiCR2MRQdr6Ok511cIB3dHgI/MmwgoDmYBfCrVRXVxUWFhQQEFBWVgYuwz3CQhKjYMAT0Ct4oXDQK6jdvbOjs5Odi7M9SHg8HhxvYAu0BVCSdYHeKirKKFTRkKxramhgaWxsZWYMdgyurC8cIyamgFcko/X09MkI7nge/1u/uRk+EJ0xmiM3uqXphTY3t8BfgwIZrSzREaiNLXY0aonmpI05PLFH+UYmuKjHlT4od6TZ9dAlAc2t9LXstJU8NKRitcTjZYnFaqytRqydFvST7oQZb8a1SOJqBMs6jDDCvB/tQiDtWhTDRgr9y3pOoPkPc1znS0SAODq8WWM5WSEejbGcdrOvplGtBTB2qvyh/Tl1Lj+1FcMDdQK9DDeHqrSkkYZaoJVJqrlmjo5glyXnajDPWgLry3rRFw3ig6ksQ6lsC3mSwzHS0TrMBqK0jz+58gnKUPh/tvb9/2PP/StaT1y/9ncoxw8/8Y7mgIa7d+9SPXpIoqF+zsxozcaS+YSzko/QwE3fKkioFWOrVxCuUJPs8bBuCXDuSYkYL805nhx6tbm4MT8xOzbQ19na3lRXVpibnZ4CawmsPHR0bmsdFhoMn+ntagUZDhIYhPDK4szSLMjn0anRocGO5tGG6u6E8JVor3YN4bZntCNKtCPaj1Y9mFbDaVEmYTMThnIS2O+HOygICVB+CFb8Nul8W/B8U/bFPHln2vNwKX9vqWtndXp5YbKyoiQpKcnDw8vBwcHf1y8mIhyEdl5mWkVxfm1FCVzn5GDf+sLUzvLc5tIMCPnRga6ejtbKirK8vJyIiAg/Pz/YA2xsbMxgqhoZozlN1gHzU15WTlhQiMDM8uWXX966cfuitNZ/oI3vRWXdq0AiIAG6WddQRsmnn9yh+u4bUVZ6XREuL1XJcGMNN30NdysTJ1gtWEKHu4t9sKtTupt9r7ctjvIFVdKyBvu4DO3oM4YG3scVAvTlquIe0qIuupoOZiaw/v29vZLiovNyM3p72qfHR7bWlnc3116dHPxwuPOX3YWfl7r7IowGvcT7HZj7XR+spDAsFVK8Guc6WyaBMEexK7us5zusx8vMrxbYdzqowLbdr2A8yCeuRNBt+BNmrehnDAl9z6m7xem6xJg6xVirREiFKpI/D3f/vLGyt4DCZhob6kqLS7IyMrMy0/Nys0GS11agCuZV5UVVZcU18LyitLG2CiR5dVlxcX5eXGw03N+osNCYiFC48uT4mPTkhNSUhMQEFBsb9NIAAIAASURBVOYBmAOiaWtpiImI0tHQ3r37xSWvP7zI9bqo43/14jD5stkI5nj5RWXO3h5Kv0X5ZVbnReej9wHpN65df3j/ATMzo6CgAJgOzvZ2QX7egO+E+NiU5ESYrjDSEmNDg3zBulJSUhAREZGUlDQ01Pfxdgeax0ahgvIo6TMYBSOC9enm4gocR5EhIMOxQ0g8zgRoDk8Al3q6ZA01dYC4lqa6IVnb0tTIxsIUH5hfzuqvESlWlrjoxt3cuCcE5fuYGKMIFhsL3ImHqiFifhU77HjMyRH1ZYU/xMXBHvYPGK6ODi4OyD5whOEAmwqyF+F74edjAS1mWFAjNqwtsGh05D03NzawMjW0NtC201Zx15ANVZcoNH5ebiBSrcdZq8XUpkPTTaboJj/u0n7YpX6/Ue7LNtWveg2/67f6djaYYi75/lkP++Eo85tNTmQpwtggncyxvZngftnCeZ7LM2r5aEiLMf/J42BuOm8QQHLSDoZ6LpbmQXbmcUYaCfLc9TrEUWuWKR/6o1yB3TyexWTW5USOyVDSkAdfLpnd8RkL6+9vfnHt/etXPvzbem3/UMDjP6bK35ZGRCjHS63fuXPn66+/pnj0mIWZkY+ZSZbAbMXGmsjLVsjHUszHki/AEsPHHC7KFSH/tMDFujDYuyEzubeqZHtm/HR3bXtlDiT2YE9Hd1sT6smTmgQ2r7OzM8wpuJEw5/KzMwb7OgHlyMGyvgQoX0AOlhH4psH21sG6qraE8Nlo7yZtsdbnTEMqdMM6j9Y8mdci6I7LSbvNzOfzXOdbHChnd4cFVPnBJuvxJvvZFufrdZEfVhWOJ3ReDLsfT2TsTzftLY2tzY9XVZYCyr28vJycnAL9A2IjI7LSUguyM8pLEMp7O1omBrvX5icB5RuL04szY8MDnW2tjSUlRdnZmaHhYf7+/vC9np6eHrAbeMA/mP8RZqKFpa6m1lNRMVQu8c7HWJ/Jf3N7T7yiy0UPYhTEAg/82PPjm9cefvUlx+PvVIjUTk85MsgyhTa6PrpKnhaGrtaWzvZo5Xi5O4V7umV7Off7OpY/520QoplVZl9QZx+TpR98xljHQ1n6hLFIRdxZUshKTdFcXxdUlZuTI4hBQGF3VyuO8v3tjZenBz+eHv18tv/z1kRPlH2fp2KHOVunJdViBMtiGtVPw09eznOiakfbCOUwjteYXy6zbfVS7nbS7tTR7JUzrqWgrruLHnQrNoQhxUdDUpQDItTdgnRVAkwF8mI/j/b9vLt5sr6yuTiHnT/Xw7ZaXY5GTXlJXSU8KSkpzAGLr6QgFwZienkJUD4nOzMxIS4hJhpGYmwU6Fk8rR8VOk+OT05KAF0PihX+Lm11DT4e3sePKfGEvUuj6t36oPi6eFuQC7W6/eV9JN7Gs7/dLXBNjlWQRyhHzQAoH1NwcLDLykgDv2AHjQgJhH0Irjk1JQmvTJCZkhAdERzg42lkSJaWlnz69CkodHd31wB/JN5BkgPKgwODUFy5tw+g3NnZ0cbGyhwrmQIgvgwZhCfwK7Q1tcDExDv/AS7xTB888Qf0Mg59PO7b0dbG1hL1IcL0sj6MC++KsRF8HiSCgz16MR64YocJf9SOzsXBzdUR72QEMg72FRcnZxhOTg5oYDSHb0SuP8sLwQ70x20IeIKCFC2wHcQUMxTMjC0NdKw0lJzU5EJ15ELlnkRIEVOeEypVSHXKhHol5jp5uloZutKnD8qlHjSoUbTpPR5zpZsJpzpr5DnrI/1xTeDVJicg4nSddLbM+XqG81UP13kZ96jj98P6NKVC93OfEfN1FIN11QKszXztbQJtzCMM1CNkeCvVOQfN2CcdGQ9j+Y8SBTYjSatBpBlPjhFHwXwNdicxFrav73x1E63Jyy7t//cWNP8ZVY4ddX6I6zv4zO2P73z33TdMTAy4zw5VR1NWslVRDlRVKNJTqyUrl2vJZao993su7Cr3zFlNLtDWLNrHMy8lqba4cHZ4cGtpfmV+em5ytKcdBfUBtWFGgk6wxxQCQDAtNbGipHCkv3txBp00bqwuAPhnJ8eG+3v6uzs6GmpbSouqYkL6o3waTOQ6NXkH1ZkGtR8vudIvh9Du5RM2aujPpzhB953gZ2s7RHTItkY8XeLYHWR/0SE0nSs4mqI0W+A2XhqzMdS6ON5XX1MOmg4sdBcXJz8/n/CwEBA7YLTm52UBCJobqgd72lZmR4HjAPSF6VF04tlcV1iUCyiHPSAxPiE5MSklKTk9LQX2AFhUIPTio8LDAgIA6GCl8vFy37/3HdzLv8q6f5vfHM/qxl3kuLK7hjTkR7+/dY3luy8VmR668jPFPGUrUnpSYaIUoP7cz9zQ28HGx8MV5Fuwn1eMr1e+j9ugr1OeKFsxx+NuMfqepzQdotStokwdcgK16s/KzLQD9NTs9LVNDZARDYszKNAX/t6+7jYwm3Y2Vg/2Ng/3t472ts62Vt4sjk3mRS8murZbinWaEwedaIf8vj+uI+11ovTO4zUCXsoO5PmrTfaTeZbzOfbzMeKPA9x75Qz7uYTVMPoNb1YwucaUqYel6IbEmVuekSq0ZH+eHfn5eP/1i53TvW1UYGt6emSgf6Crq7Olsa2hoaq0CO4aXFJKQjwMuI+5mWn52VkFOdm5ORnZWWnYfzPgeV5uZlFhPj4K8nPzc2GSJoM2D/D3BZTAxBYWFr537x5YVLjuRuEr+PE1vmSuXrQMxcZHv/jY88rbiON3atxfqHIM7ldu3LgBsolAIMBKBrDCtUVHRYAZATsooBw2J/gb4e/NSk2CnSkxLtLD3VlXV1tKSkpWXg5UMKypsCD/8OCAyNAgHOVeXh4w1Z0cHAGFcBNReLierjFWUAWvsQV2CehxdTUVHS0sydPcxAFB/CKdBz+9BDkPXMaxi5Ma5f5YWliZXThV4PVAeVAJLg62uPTGAI1kOKwLfOD9KPBdwdoSBbWYIoe64YVn3FgPj2ABuY8OY02N0e/FtgQc5ShAASWgoguzMjWyMtK3M9RxIWu4qMv6qklHa0oW6MsVa0uWa0sUqQsXqYoUKD8pUOXPViAUKtJWalI0m323FMe8VkD3pymhN4u8r9d532zwvVrmejXL+bKf600D71IwzbITa5sCVZMCqUxNLFpDNs7BItzFIcjeMtREJ1BOOEeRu0qevkODYtqCftacdsyYYsCAulmLpkyVNUCIRoX+HtWdq9/f/fSTWzfR4TaWmoDp4Ru/kq8cO83H9d21G9fvP3wA6kBRQQ5mANwYdzcXDwe7QFubEGO9JEPtNAP1ZH3VeGNtX30NL1MDTxuzADeXsEA/EA6VJYXjQ33A8aVZVHi6E/M1A/5Q3IiHm52dHdDc28sDXgkaCl65MD1+gfLpscnRIeB4Z2sTmM+VeTkFkcHVga65erINWoJdGqx9WpRLTgzL/rT72axb5Qyvx/heL/Gcr5NQObRt9tNN0ukS+5s53r020kHlk5kYruHAZ/PJdhPZIdu9TWujfW111QX52SEhQW5uLjDLgeZgJcBVwaYCC76htqK/q2V1bmJ9YQoufnZqtKcbobykNB9oDkZ9bnZOUUFhcVFBRXlxZWlRWVF+aUEurKvEmEg/L0+YfBLPntLT0dy8fgPvLfnu6ce/HOjwK/CIciw/CP6Dyij//tYNwjdfKDI88hXnKFcXrZLnqZPnbdCXDVaRDLI0CnR2CA3whdUeHRaUFBJYEuzXH+yZ8Ywnl5u+6Smx+RlLgwRrjSRHo6ZUrpZsmjnZ14TsYGoISg31l7GygPcKdi/Y3uYmx/a30LEn0PzF9sb+ysLh3PhUWdZCZmirg0q7hWCPDaHf9dFBKdd+M8urWY6zFbbTLcTxk21W2HcPVwiny8SzWbbX4xw7dbQH5SwrsdQbQYRRgwcT6lQD0pTDEkztUpy1OnI/zwz+fLTz08Heqxd7h1sbO2uww05ODA/0dbZ1NDWVFcDNzEiIiYwOD4uJCI+PjgDMZaam5GYijuPbM7pHJQXlZUUV5aWg6MvLSkpLikqLS7IzYS9OjooMDwr0x2vQ8/DwPLz/6PpVVJLlw/evfvC7Dy9DPNHejAURvhOH/s+GkF6iHP2WKxeNIpEbk4oKrgSUE1yVl6c7khopCelpSSnJiXGxyMJISYjNBGGempSaFBsc5AdyG7XmkZfT1dUFUAb4eAf7+4UFBaISib5+3t6ejo72oL8BkbCKtTTVgd36QHPsOBH+alUVJRVlRSTJ9VC/TVDioMcB08BxPMgEhLwVgNvW2hE7L8VTfmA42KCsfZS772AHFpunqwt2uOoI0hunOVLx2EdUfxEVabS2NLfA3d8GBgaG+OMiGFEXzAv8iNVQ3wCuBB7weRSwaGyIAhktLCwtLXGfOx69jrBubgJ/lQ1Z21Fb1UVd3l/lua+MmI+UoJc4v4c4n/tTbscnLFbsDz15HyRKU9bq0U77sy8nsfyl/9mfxoX/uCD848KTH+YFfpzk/6Gf94dGvo0ohnU3Yo/yo25FlnpF/nRV8Wx7sxhnuxBHay99TQshki8/fYowVYs83agW84ga/aAaXY8Gc4UiS5QIveqDz2iu/u831z785tNPPrvzMV4HAu8A9esce6KvX2R4Iu/AF198QSKxqSjLg93k7e4SFxUO6gCwlZ+SlBcdnhvoWxjiUxIZAKjNjgzNio/NTIxPio1KiouGxdNSXzPe3zM/PrI4OTY1OtRaX19eXBQXExvoj7wrMC1Q755A/8LcrKbaqqnRwdVZhM7VhZnJkYGh3q7G2qrK0hKQVFlJCQmBPkmutnFk+RoDqRZ1UrsK5ZQ5zZTj49VI+uU06uNW9qMB1vM5jpMl1uNl1vNFjoNhwnkf53wG5Ww4fav5w1oy04i3dk+E83pz+XJ/R19LU01FaQzIsQA/V1dnV1dXMEvBCo2NjYadBn7vQHf7+tLM5gqqlz09NdHb09Xe1tTYUF1fV9nWjGoE9na2wU4z0Nsx2NPR3lTXUl9dnJcFgAv294H5qqykwM3J9cXdz/+x3uy/uOfyR9dRAhcWP44FsSKf7r27d7kefq/ESOnMSZsiRqiWZKsTZaoWIzSTZaO15GMcraJ8POMiw4B9GckJecmJDenJU9mpnW62/baGkw4G004GY47kQReTsTCvKj/XDF+3CG9XbzdnsJFtbGxcXFxio2OK8rKH+7rgtr7YWMU6RWy92F7fmJvZnBrfGe457mmYSPGbj7XudRHtd2VaSiQs5lMhd+QyytQAju+tMe6vMIHxBJsu2Lk/rfIf9bK8bOfczmTcj2afsqCcIdP1S1EMitN1y3A160r/3F37x7nRn4/2/3R6/Ob48NXB4e7K6sr8zDCYBg0NORnpCfHRgQGopztwC3YaENogXTMz0kCGw3YLAqKprhoswramehh4tV64y3VVlTDBYEtG9R2TEkNDgkCmaKir8nJyffn5729cu/22k+2H2Br5EHeJvB1X/6kO6x9eZgO8WyQDofzmzetgBBMIzM/ExfS0tbzcQGIHZqQkw7aUmZEC8xOMyJDgwMiIMNT0Css6hj8/KCgAeKeqrqaoqAh61sPF2dfTI9DXB4Uh+np7eXnhVVZgMwarEdgNH/EgQpDz6urqilh3CB1tdQA31p7NGnNbW+HdnI0Ryk3MzVGSvYODHcoJwZzduOh2sLvQ6Hg9Fhz0oLjNTc3w40o9XbIOPLS08QcKJCXrmBjrg9iH17s4O/piYUWwdkID/aLCgsGYCAzwA5EHPwp3/hgbG4N4RydTJuhK4DnsB7h3CCUlmRrZmBjZGhnYG+g462k5aak6aqrAcNJRc9VTd9RSsJEVdpMRiFTiLdAk1ejTt1k9mI9knE+m3qlg3alhOWhiO2xk3a9gOswjboYxbHoSJ8i0I6osNeKM2VLcKZryPloq7kZka01lAzF+Oz7mKEHGamnWKoGH9UKPGp8xVMkQ85X4vcQ45BkpKT65/dlHH31269ant+/g5ZQve0Ne+RVU+UcfXary69evP3r0SFLyGbzv7m6OIf4+iVhmXVF+VlVRfkl2WlFqfEl6YnlWSklmclFGWnFedlEOKiAI/K2vruhpb54a6l+YHF6aQlW/W+rqyoqKoyOjvL29HVAJH1sfb0+QUQD9tsba2YmR9fmZzcU5oPnEcH9/VzvQtrAgDyxK1PbLywNsnABthRJjhRoN/lZlhikj5mkr2o0g5vU4hpc1PC87uH6c4Hszi2ylN7M8p/0cP3bwLyfQzvsytuk9rtdkHvbQ6g1z2mipWOlHDShg8wCBExEe6unpDtocyXMfT4A7rP+Whlrg1Nri9PrSHGwrE+OjnZ3tgHKAeHtL/WBPG3wVbAg0RvpHB3o6WxoQygtQKT4/X0+YXqB6xEREKR49frdS2r/JwQIoR0nn2Iy5ce36V5/f5aSj1XrC6y8nnqkoWibDWy/BXiXCVClOajNRTzHRTvZwTAjyT42NBo7nZ6Wjrsp5WQP5WTW+rg2utp2eth2eVi2elk0+Dl3xYeUxoekRwTEhgcAOHx8fFzdXT0/vhISEosLcscHelZlJQPnR9gag/GBnA27f6vTk2vjQZl9rb0bYUIxTs5NUvyv3UjTHUibdn8aevJnnQhVHt9gO1pn211mOd9jPdkjnWxw/rPEe9DOdtbNvZjHsxSKUz+nSDUg87hej6XvO0ab97Oem4j+O9vz8YvsvJ4c/nBwBzQ83t9aX5uG9b66vS01JiowMd/dwdnN19vRwA3KByo6Pi4FbCTYWoBymYntzA1h4aAPuQq2I4DnWNbQBaF5VVlqQnwsSHvY2sFRQOZ3nMrTUdJ988hlSVe9fxICjKAAUlnBB838yReiC43+t+vLXx83bNygoHnFykkCSmxkZgp0XGRoCRgagHJYWoDwsFAS3D2ggWDuwGMGoTU2MA5sSIKunp6egoEDW0QWqgjpGGZ6+PqDQQdc7OTkAcfGIQxRtYmSIqmKZoSZtmpqasAGoqiqT9bTwVnCoTwWGclDiZni1QjMz+I817vu2dwCaY8EwDvAcc7Zb4aUNUcgJyG1sv9BUR04beTkZOTk5uCplZXSgitd1AdXv5+Ue5OcN4AZ1mJYYm5WamJeZCgPWEQiFfKxTVWxMRBhKRfFGaU2O9mB5wJUg21Bf38jICBPp5hZYqMxFXCPGdGuwHQ31rYz0zY30bEz1bU30rXRU7VXlbCV4fJ8y52iwNRgyTnuTFsKIB7n8B4U8Z+V852Xcx7kcR8mk7QDCthtpWo9uSpW1WZSuSpq7lKzkqyzrqKVmqq5ElhazEuMPEucplOHPE2QqFmEukeRKk+QOeMZjLMgpz01ipaYEjt+6dv3jm6hROBZXhsYHvwLK32lZCzvJZ599TiSwwg2A+xoU6JsQHQF6HN7u0oKcqtLClprK1rqKvtaGgfam9rrK5uoKIHJrQy0In56O1tmpUdDXwOX1hSlUeXxkCGxhEEEx0ZF+Pr7urm4ghEFZwFwExTTU2wlc2Fqah7E0Owl87GprLi3MA+MXNAjsz+5O9s6mJu66amlGahlyvNWyLH1qDENaFDNW1NNOj1Yi6JaSKV9UsbxoYn7RynzSzrZfyXxQxD7h82DchrrfhNBtJrya4DyfF/tiqGN3enx2dHiop6ekuBAWBog4MD+9vN38A7wTEmMKcrK725onhntBla8szkyNDQ/097a1NsMf1dXaCGO0r2NioBdANjbYDVjv7mhurKusqSzBu1LgefygYhTlFVhZCF988ft3E/f/DTT/CDvSwDO/kWHOSE0tJyjooqaYaqxdbqhWq/28Qe0pjBotmRYH00w78/yIoLyE2Pz0lILsdLiJdWUl3Q11Y831w+XF4yV5q/Vlq42lM1UF45X5M801A41V5QWoX1BCQlx0bExYVGRMXGxxcWFba+P81NjGwtzu6jKi+d7WEebFXpqdGu/tHm6ra89P7kz2q3ZVGvB8OupJGAy4d9bIcdRPQGG8q8TdRfq9ZUbUKGAb9Qd4s8pzOESEzXgrg2Evim3OknZBl7lX6H433+NecWKLgsBKqNtMRuyfF6d+3Nn48RjR/GBnc3Vxoauzvba6Ji4uxt/f18bOGpY6LHgPd1fYeIDmgHhAeWVFCQjwvq72wYHuybHBmfFhEAowwcCcGsA8eLBzV5eXVABC0lMSY6MAMYAGUWEREDHIqfLBhX8ci+O68U60ydVfEMHyLsovyg5fCLeLfI4bt25+/fXvmZgYhISeqKurWlqYYDmcQehUBkiXmwkmSHR4WICfv6e7B0y2uNhosCdAs2Nzzxtgra6qBgw11DdwsrP18XCHncDf2wutIDcXV0cHVHQQi0N1sLGE4WiL9e3U08OCxNUA65h3xRI/rsRjXVACvY05PIe31wYrX25lYYm5uQHuyOMBD3iO4g6NgbTG+lhKrbamlo6GJs5u0PVYaycnYHdMeAiAOzcjpbKkoLaiBDQQGLU97Y2DHc0j3W1DvbDRNvV3tQ0PdKNCOt1tnW2NDbUVtVWlIB/TkuLhb3R2doTfBToduV8M9fHruQhwNDe5DLyxtQTEG5uaGFiYGFobG9gZkJ20lH3UJCIUeQo0OGvJLM2GtD1WlAO2jyddKKddKeacKebtqeetaOaN6CfU6MZkGBv5KOuestdqyfspSNupK5uoqxgqK9grywapKeQZqBXqKMDI11eJIyv4aMibKUirSz0T4uO+980fwDq+eePax7fvXL967e9KE/5n2zTjPwvTC/fuPRAREoad3MXZPiTYH2QLoDwnPbkwJ6OsMLehuhzuBCpj3d2O2hG0oXvQ19kGKwRuw+Lc5ObKAgjbjQVUGwvoCSivLi+DyRcI1PT0QuHk8bF5WelAyZH+7rW56e3lhY1ldEYKshfWGGzOsBrB1IJJCNPLXJ9spqLgpijpxsuYKkjbKs/cr0I7Y8g4Y0m35ktYDWE4zec5q+A+r+UCkX5UyHGUzjXtQjNqzjhkxtNhJbGQ5D1ZlLwz2rs5h8IcRwb64WJysjNBmPv5e8EVhYQGpKLCXjmg2iZH+kCVw1Y0NtTf29PV3NQAJjnsUl1N9UNd7cPdHdhf2tzVWt/aVAvWQ3lxAfAOZD6sOl8fL1T2VkdXUODJ/fsPLytq/Tt8LPipKo4Y3IR6wstDVpD30tOOMNDMNNDI01XM15LL11HM0VMpdbZKdrUtTYopyUwty8suL8qrryprAOOppWmgtXmouWGksXaxp32pv2Omu3mqs2l2oGtisLOpvgLMpuysjNT0lNT0tOzs7Pr62qG+brhN28uLe2srO+vLIMlfbG8szU1Pjo6A2m2sKinPTCiL9sp1VO9ylx1w4R72oTmv4jvrJP15ge/NCufBHNPuHOPxGvFkne3VBvePq/wnA+xv2ni301lehHPNmdAtqBN6BB518VD3inN0KDyZ97GZiAv+8+zoT1urPx7t/3B0AL9ueX6uva2lvLw8MjLS29fLHJauhRkACLQ5KFa4rWDPgZKtqiwFrTDY1wkm1Nz02OIMylcAmsOUG+zp7Glv6USduCsBKzCr4SZGhASChtVQV2VnJ4LAwjj+0Vt3+fXLaJN/XpW/i/ILx+a1q5989ikuycXFxQCHwFwsuDAQ/pbMjJTC3Ky8rMy4qMjgwCAQQ0Bz2LHwksspYLuGBvl6egA61VRUtTQ0AcogzAHlIMx9fTw8PVB+kLO9HXbqiFwoMADlgD99rAEQKoVooIeXtUJpsbbW+LCzt4JhY3OReY+yOo0RtfEochvM5QKS3wULSsGCDtHADznhAsKDA6LCQgEdsNmACizJyawpKayvKGqqKgctCBwHeQRLCZYViCQYQPPhvo7xoZ6x4Z6RwS7Unruzub+jqb2pBoADaj0pMRYPWDA3R+elptj1wBYCF4MfkGKhkKi+rimYIFj8IrwGCXZ9LWdtFQdp/ihF/hw1njIdjkZ9Yo8RYdyCdcqCedaccc6EacGQZZHMOqXIOCnF3MJN0SzCWq8i4SshaqMgY6iirK+qbK2p6qyu7Keh6Kci6ykv6a783EVDwVFPw9pAl6ypJv1MnJaG6tNP7ty8fuOzTz6Fj38TofSfRzn+mjt3PiEws6gpKXq5OcNmGBUZmpgQlxQXDQPmTXpyQnF+TmVpEWyYQISO5lpsO20BrAPcYcBSGR/qBxoCoMH0np8a72xuBurBpAwNDQ0ODo6ICMvOzoSf0N/dMT2BwhB31le215ZB3I0O9nW1tRbm5iQlxgPxYYbYWFmj0powueE9ZaeN4GOokCA0S9B2y1B3KT7q0XzQR/5uwZ12KZB2PZIexrI/7Yo3c5/+w05N2lFbyV4Pna3ylM3uxt25ya3VxanJcUB5bWVFQX42qqUSHgojPi4KlkptRSmIbuQUmh2HNQ+GeU11Jeh3MBHgUqvLimGARAB2A+BKCnLhW0CPg6CDNwRWVGJsDJi9qBWZjbWSojwbG9vt27ffjS39G6C/2xzuFzaKw2o9XLsJtwzuLycnp6qikouNVaSXe1awb0V4UFNsaFtseHNMaEt8ZE9+ZmtJbktlaVtddWNNZWNNRVNtZUt9DYz22pruxvqhlubFsaGV6TE0piZgLEyPzk4Njwz2tDTXN9RXV1VV1NfVDPb2zEyMAsH3t9Z2N+CWLa0tzi7MTILyba6vy0hJTIqNTAoPTPBxjDRTLrOWKSYz1RrfW4phWc6m+eMQ35sJzlezHKj8GVYf49UC14/TfMet7KeV3HP+FIv2DEOKD0ae0Tay3qtlfdz5lKtJVrDFSLXGyfx0oP1ofuKHw72fTo4Od0GVz4G1VFpaGhIW6untYWJmDGsbZKmHi2Owv09YaDDmLk8BlLc1140N98EcW///eHsL8KqyNGt4vpGuwr2QggIK9yARCJCEQAiQECHu7h7i7u6eEOIuxN3d3RMSnEAEraoe+Wb+tc9OAlXd09PVf8/Hs+s+l9Ql95yz97vetfZ+ZXoUV4s1CUwHsvd0tNJkIjhpMHdMMagf5hG0F4ggJiZ2+PBhOMiVoldr121aCUlkzif/f7Ly355RYSqZrtmsN2/eEBcXB70l4SjOjvBMuBesMVgcjOJhdBTkrLOjk4OdvZenO9Yb7DEuKgprD37I3MQYrFxBTl5LUx3Q5mhrBZ3h4eKI4ero4GRna2drTTZGSICgpZ2VOWgsPqmkKA8RoKmpDg4LPktPFJdjyUnyDkAcsAj+rqmpqa+rB8oOmo+vA0Zj/cMKoH6K8h7BpsqK8uEaq0qL6NKqrSipK8MoJqO8sL6iqKGSvAcLJB+oKCWjsqSusgyw3lBdDkbYUl8NzdTeUk8wpKOpv61xoJ2wisGuluG+DghieF9M68PYqKBAX1wnkQKaWmDoWADwN1ASeG7Gy2Ve6M9JGKOelrWetr2mYpCuUoyOdJL2vQQ5rnyFq/n3zpQIHy259WPtrQNdwqd7BE/1CrD08LHUcR6vunY+X+i6M+9lgzs31e+J6KuqWOnrO5uYuN838bYwddTTtdbVsjbUdrQg9XiN9LSV5GSvXrq4f+++zRs3bduyFa8rDe+X3f+Gv6YSy98jGHHdhlXLsbR79+7n57upr63ly7QNxDoBocYawuMLDvLDcicVX1OSgIbQpiWF2dBBdZWlmAxMCd60NtR0tzVDcb+YmngyNjIxNNRQUw0lC6IdHBwMNA8NDU5NTS7Ky+loaRwZ7Hk6vQTlT6bGwYUB5RnpqdD1Hh5u9rZ2pKnVfRMbU2NLDRXt65eDRG6ki/LkCV8ied4SF+rkzzcpnRw3uzhjz/7CleO1B+e0HdtjK842NZY6JY4uG/lGd+Pp0vQn7Y0k62dmanCgD1BeXlwA24iJJh3GIsJDIVSBzkC3kd726dH+sUFSNgCfeZSbjetMTkrITE3CAC8AM4LOpSXLMYDgYBzMrmUc3oMl+Xl5ujlhorVv377NdCD7AuW/2mP5O/T5XGpwgak8ePCgkJCQvraOt6trRIBvYkRIdmx0YUJsWUpCeWpieVpSbV5OXWlBdRlJn6kgUE7RvKi6rJi07iwtbq6uhHga7u8BUmPiZiZGpydHHk8Mjo/0Awo7W5saG2o6WprHhkghrdnnM29fPgWUA9Mfjw0N9XXD7eXn5cIp+ni4+rjau1sZO2pIRmqJRsuwZSsfHfO58iSS7b/qBP69jZ/sm/fy/tx/7ZcB3n8f4PvP7tsfSrg/Z90Ydzw9ZcLWKXay/c65sksn8jjPVokLFCuIlZpqFTlbLXQ1L0wM/bL45t/eL5JKyFPjTLB/bkBQoKOzgzFTkw980N3ZgTDBkCBmfSZANAHKSZn1kd4XT5kEtPFhQDnuCNqitbGuqa4aaIIHgtnHSk5OeBAW5A/IA8Cxs7Nv3bp1pWwphXKmoP+3f6YB9+8rp0V2aZjMuyUoxxziu06ePM7DwyUsfFdOTk5fXx9M2MXFyc/XG5wGiPkoMy07PQ0LNTwsBOIPduHu6hbs7xcTEZoQE4OFFx4cYG9tAZZNI8QN9HVBvd2c7MHGAOhg6C4OlDpTKLcGlBvr61AoJwVV1FXBYe8b6dMuECtQft+U8F+yaaKqqqdHcBwrHF+alZqUn50BsoxFRcMBmutrWhrJAJkD0e5oqG2ursBorCxrqCiFcYGMl+XlFOYSbvQoKzMrMx1mnpmRlp2VAWPEFJQW5mEusJZaGkjXqp6Wxr7WBoLmnY3DPS2TQz0wTHKW1kIayGC+4E6gNmjrUTgbQ0NDY/KHhDjSEEkSc8lU+MKtWZgY2ujr2Gmr2CtJOckKu4nwRkvyJYpczrzL/oiPpfzG6bbbF7r5zvXdONd37UITx4lGbraKu9d9uS6aXefWErhlqKxkbWToYG7haGnuYG1hZ2FBgy+dHSBBLKFvNFSU+a7xHjtydOvmbVs3b9m0YeOvug9+Vezhfx3KV2p34P2ZU6fhZHDFYYF+NPgJ1ACGCo7gSPINyFEh1pmPrweQPSY6LO5hNOAMA/QBeAcOW1lc3NXSMtTTM9LXN9jd3VhbU1ZUSBOvvb29/fx8EhLi8nOyAeVgTEANYAco+fQEoLyzob42LTU5JiYKH6O5auS43NwUM2GjJO0rfy9U4lbAzYvht9ij7lxIFjlfKX+xXOxopciefrWTI9osjRI/1IgeaFJgq9XgHwuy6Yn1n6wunO5qezU9+erZzNjo4GBvF4gYaDWgPCyUJNEBlLGMQApGB7pAyXvaGxtrKnAjMBBfX2+a/ezp4YLbh7z19fYhw8cr0NcnIiQY3AR3DaDHcsQrmB1+q4O9LWjO2fMsYHa/6tlMcq42rmHqU69e9auddCK6v2Xql32z0kR4qezqmi+J4yuVOmgRDxJqtGvXbg4ODhUVFVtLiwAfbyin7LTkvKz0ykLI2CLANF6B2lVlxWWlhaUlRSXF+bhZECjQKMqkygrzygsLq0tL66oq21qb4epAtJ88HsN4OjX26vn06xczb18/m3tF4g5nXz7BePPiKVzvi6lxsCfYXlpq4oMH0VgSUNzgegaayqYqUnbSd5zunM1WvlijdaZBb/+w67Fh30MvEs89S2F5lnbmaQZez75MYh33O/HY9Vy35qF+OZYKrn0lnMdaxG5VK0qOeLn0hfkt1ld+7O/6r7lX//V58Y8f5v71w+L8C1IJGV+anZ0dFBTk4eVuzWCTl5urn68n5jQh/iF8cGHRo6bG2t6uVsD38+mxV08nn09PTAyTwsXtbU2tjQ24WTwTiEWQDKBSblZqWnJcYmwUE4lkelfwzvHjx2mq8xK7Ajdfv46Wvvv2D6u++ZdvV6LN/pqKd/TgZLnU2uqVCpp4Wb9xw6FDB65c4RS6K6CmqgymaWVhaW9v7+npCYWBRRj/ICozLRH8l/QlfEBOZWjKMdgxCNaDyAiGWMSEBPuDRsDeSRksFSUDfW0ba3Nwc3g4LxcGykkkEtkwYfI2jQ11tTTUVQHlsrKyWD8ARJoxT5iTBfkA3gAoFRQUJKWldHS0ggL9QVng+1trya4IRnt9TWdjXVdrI1QO9HRnRzNwFgK9pbYclA5ADxWbnpwAowj09XJ3sgfkgeUoKyrJSstAfNxjmjSToHgxcRkpaVw2XBEcibOTA4AFd12QkwkH0FpX0d1SBxwf6+8cH+ga6m0f6G7FANKBkeBjPh7uJsaGOjo65FDUQN/IyIg6JLP7RsZGTNEuLU3c7H09bXNdTUttNRstFXdt5VBtpRh16Th5kYjrbMV3ruazH686f6z2zOHmc8c7Lp1rvnS+hPNC0rXLPte51TjYDSTEzLU0XWysHK2t4ezhQmDjLs72ri4OSxVS1TVEhITZWdl27/oeUM5sl2+gUYmkowBM+69rOvj3hPItmzZf5ryor63h6eIYEx7CBOo+AKEG2fHx9rS3t7W0tISMgZaxtbV2dLL18HTx9nEP8PcGZw8PC4qKDE1JjofXrauoACR2t7ZiNFSRsqOwMZr7DjiMj3/IQHkzaODjiWFA+ZPJscfjY4ByWBkNXwkODvT39QOauzg7wvXZmZncV1EwkxSSPX+Cb/sG3g3/LLRrrf7p3TF3LmQJni2+fbhHga1fia1O+GiF4Mlapev5asKNPrY10f4jtaXjPR0vZqZePHk8OToEmgYqASgHiIcGh0RHRiXFPYSnaa6rHhvsHR/q6WiuhZHjlnGduEdyzmNEollJAy1LK2tLG4hU+DNXF6cgP9+IEFKZBDhekJuVl5MOOMDa8vRwg9Dj5r66Y8eOr5zzr6CcFrBeBuil/dM/hfJVzIR9DeW02jX+xzfffINPHjtxnJ+fH0bo7uxEFHdsVE52emFBXmVFWU11ZW1NFQbeV1WWV5SXlpeVAM0JfDNQXlKQDyyDPCrKyy/OLyguKqirrW5uaoB2mRobhlp6+WRq7tWz+Tcv3i/Mvp+bXZh9+fbVcyD77PMneJ7PJkahocCkHjKNN80s7oMcqaooKcpKaciKG0oK2gheeaR+u1LlUoPqqREL1nGHs6+CL70Ku/g6khnhl16HcE45np+wZO9SYemWYs+/cjiD82SRxN10ZdmGAJ+62KgnrY1vRgf/7d3cf/3rp3/9vPjvn94vvHz27PE4/C50QEREBPw9XAh8LeYiNCQgIf4BeEBRYX5lRUlnRwvdvoOAgJJ4Pj0JVUFSj5vrofyqy8vg22h+QG5GKlheekp8clxMoJ+ns72NtJQYKysr2TFfQ8uLr6VpdASKv11DQs7/+duVund/DZQv5wGs/g2Uw+42b91y+vRJPr7rMtLiwF8LM3MnB0c3F1csfvAnrFLYIKA8Oz0FKy0+LgZU3draGuQTnwSsg0+ArePGoZ5Bmc2MjTQ11EC0tTRVwakpN/d0dgb62DKhILR3D9azvp4WPIeCvKy0tDTwGgydQjnZBDc3ZTq66YORQCUoKSnZ2FjhK8Cp25vqe1ubBjpa+9vpAXJ9d1tTd3sLoByKmhDz+sqGalIUGkYBPYFbID1etEkX3GvcPHiqJ06cOHjwMKT/nr0/7P5hz549ezHwV4hLuE82NjYeHh4AvZ6Orre7W2xUeHFeNhxDf1cLQBxka2KwG4A+2tcGtt7ZUof/mxz3AD4MjgdQrqGlyaC5Aa1PYGpCOtgZ6uoY6Gga6WlDiJjo65jp69ga6DpqqbmqKrhIiNhfuxTHz5PCcb6ElaWG5WQTy8lujnNt7Oeq2c4Vc11JusFrc4nDTkzUVkXZ197Oy8mBRtA7Otg5Odo6O9k52tpQKBcTvXf5Eue+H/Zu27IVY8O6jSvnIgTKv8Lxv4Dpf7/KiGvW4FIEBfjhzEHJUxMePspOy88lCghrCOIOaO7k5GRjQ0o6LHl4JhMMP6BpuHZ2NiSLMiAwJSE+NzMDjA9ynqmJkYpFidXp6e7h4+OVmBhf+Ci3s7VlbLBvenzk6fgo0Pwx9Hx3B5Rvbk5GUuLDiPDQAD9/Hy9vIKOHuzNWpLmBrq6ClNBltjO7th1a+83FH7bLc5zxF+PPlL9Tq8xfJcpRJXi2QeJSldz1VkvNUnvT1vioruKc0Y4GqDM4DPz+EVLdpbO+qgwGTFRpYFBYWBiQqCjvUUN1xWAnCTSsrSiBmwkLCcWdGpkYa2lpqamp0Rw5aExdXV3oXxMTEysrKxgS4AOcND8nE1K9soyUyc7OSI4MDYK7FhMTxardsAlSaxXN1KZoTjdGVsZKXWMK5X/aMpiWP/4NK6e/DcKck5MTjAbiGSoBNp+elgTejYshe8GtjZ0dbWChXW2tGC0NgDASkFNXWcbstBQX5+cBy7KzSPYjBjwofEBpcUlLc2NfV/vzmanZF0/fz7/5+O7t5/cLHxcXFt7Mzs++fP38yetnM5iv8aG+2opSzDKmCTwRVgREkJGRkpK8pyYvaSArbi3Kn6UpliXGUSByulrqZK3MwValQ+3KP3ZrHOzRPNSpfqBL7Ui99I+1EsdKhU6WC7AWCFxJFuRNlJeK0NEsCA8rz8gY6Gh7PDYMTQBf8sdP7wDlH9++nnsxPdgDHV+FC8ZCio6OfBBD/DEIYGFeVnlxAfh4R3vz1OQonDcueOHNqzcvn+H9yEB/H1McDc+HHFnnZePewXZJc6ikh0nxpLZJkL+Xh4ujmqritWvXdu/eTffHqXOlrSGW3O1S76HfkTrwpXHuVzvm0G379+/nvMQhKSEG/uRkB3nh7O/tFezvBxYMiwOlgC1ggcEMM1ITYIaQiaDkWJYGBgaOjo4wSXyMNhDHwoOZ0Iwn+FSQ3PtG+rT5HxAH8sXc0szCwoKeZIJxA/Tl5WQkJcUxa2DoBkwWKN2dIP9XUxMgDsIOAodfDjwFcIMJjfT3QNxA3cJa8TyB452tTc31NdCyVaX5tHbeo6z0BzERgYH+Nna22ro6omL3uLmvHTt2bMeunVAh9Lie9NkgY/3Sg2WeMLjOho2bt+/YdeTIMXb2i9evXwdbh4wAZ4JQbqit6Gqtnx4fnJkcwHjxeBiw3t3cAPqf9DAGPsPMzExXH2ZKqqgzPe1I5irJSjUEoGuRmlwGJPvfwsTQ2lDfUlvDUknOVPC2t+Dth7f4au7err16sfUiazPLybbzZ1rZztewX8g4yxLMzhZ89469qIiPqbG3rY2HswM9RqZFbMDzNNTU8Rghqi6yc/ywe8+mDRsxwMph2kttfJZn/3/s+vv3gXL65/ChA5ISoh6uDhHBAWmJcaQ4SREhbpmpScnxsYBjaDra0tvRkUi2pTI9FvdpVWI9A12sGHCKqIjI1MSEvOwMPOVHmakws7DQQPwrDzd3QHlSYjzQE1p+fKgftkpwfGwYlBkro725AQyX2d8gDWfBQbBYvTxdPdxd8eC01JRvXuM6jAe2bfP5Y0fEeDgtRG/7i9/OlBfME+ctEOEuk72dpXA330wn1cGyOiWhtaJouIdkk06ND4Fpjg72YS02VJdTKPf39w8JCQEQ4K8AuP721p72ZtDMnIx0oDyoDEQaTS/GyiDNsfT0gON4JZzIwgI3gyskIcy5WZD89TXlZcV5QPOHMeQYSl1NiYODbdOWzQyx+4YmXi33h/hTKGfY37drvkoe+ZPaHWtXCN1Sr4kffvgBlBwGCa2HbwQJgtqgXS6725pBlGBvGKCiAz3dUMH4YUdzQ2sDrK4SKAxWWpyfS6A8PTU1JQl89lFudkFefkN9LaaGVln5sPD20/u5FSgHLALfXz2dhgOG46VFg93c3LACYPZgcHKy0ooKcnqaqmYaqpYyonGaMokSfKkil/NE2crEzjVKn2uXYumUPN0ldaZThqVD5lzNvTNFIufSBVjT7l5NEOHzFeRzFhcFlMYHBz/Kym5vbx8bHX754snC25e/fH73r58JlL+bfcb0J2mDNwI3T09LyUpLBXbgyVdXFMNd4caBNc+fTQPH380tuZ9n04+H+/vwECiUk32VnEx4PqxM6M742EiM2MjQAF8PuGF1ddXbt28fOHBguWbhmj8T0b/69+d5fnldcsYw2jNnztzku66qomB539jH0yXYzxumFxkaEhUWSih5PIkrx6UW4XGkkTLLxBDum+nokN1hBwc72FRYaDCgFnIQr0F+3uCMerraqkwDIB1tTSszE1tLCwcba5L2aUGh3BzEHEsaTBzzJUkCwMVVlBXxr2i5Wrzq6mqrqKnKKcjji2DvoGLAcZBxTDrFcayo3p6u7q42MAaSnl1TAYZUXpQLHCe7VUnxkREh/v6+Dg4OMCL8KikpKVpGFBLkyKHDu3bspC1wVy/Lmm9XrWEKua9dUTkbNmza+t22ffv2gcuLi4kCOlNTEspL8kHPxwa7pyf6n4z3g6WN9nV0MifYeDjACtwaTJYmixIxbXafqdJlYGKgS3OjSC0XU1LvhZRz0dLQlbhnePOGEw9XquCt4utXG65wNJw92X6BpZPtXOv588WnTmVdYsu9JxwqLhxlpOdnZupuY+UIn3ifqUSmqa6sqCQlISksJIhJPH/2HO5rwzqSskdwfM2varCs2P7/cg2WJfax6uiRQxB6WFLRYcHZacmgr5ikptqqmvISULnSgkeg2AU5mUzoN9ltJmWRvSHgHOG6TeDM8Zjum9hYWQN+SYRvTCSeL6nMGRkKZk1TOQDlKcmJpYV5sMbJkUFyyDZGWvZMjJA6tD3tLQBTmCVWAxw72aP39QZoAlgxSXh2uMlDB3/c+/0ujgvn5USFrdQUfXWUM8x0Ckw0ykw06uxN8u1Miv09CqPDW8tLelrrobInRgem8S0TJNxibLC3sa4SbDQsLMTLy8vHxwekBo4Kt0aOaKor4LfghHBfnp6epHiWsyMZLk529qSQG1wX5K2tra2zoxNJ1ggLoYmFDfXVpK55FdkiTE54EBkWCIl64wYvHj6eLQPTq5azB39Twmz9F9tmGrkt7678tjDmr4o6MfU6jh89JiEmDqLh7e5CXG9yHOalspQUfQVk40nC6iBExob7JoYHSD7tKIn0B5EZIKHxjXA/1eUl8EMwVMwI/GtGRtqjnNzKirK2psZn05Pzr198YFj5h8U3i6DDr18A3AHls2Dso4MDvR34t7GxMXgaYIhY01DrNC/c1uK+i6W5m5HuQwujJGONBHWZOEn+QoVbhcIXy+9ceMT5Yy773kKeI4U3T5VL88QLXY6RuBkuIxyoIGkrcc9MXtZCWxtLKjw0rLiwCFcy9+o53MlPHxd+/rDw+d3cp8XZhdlnL59M4daA2pBxbcyObWdbIy4J8/vk8djLZ4/fzb/+/G6eQPncm2dPZx5PjfV0t3e0NNZWllWCk2enZaUngYljcUaHh2CA0oYF+Xu6OkFZqqgo3b179/jxkzCqpVjyX8Px761jvJqEjm5YFlhrlqF81c6d22lOENP21j48yC8qNOgBOaCKio2KhAFkpCRjdsqL8rE+M5ITANbOTg73TUyNDY2wFr28PAIDSK5NTEQoOX6PexAbRWyStMHT01dWVsSNAJcBW0vBiFYWlhDRhJabGDJIJCsjJXZPBENWWkZTnbbuBHqTrs0SUuKKivI21paPsjJhF70dLdCsfZ2toOGgXH1dnRhdbc20x1ZBTkZuRkp6UhykPClbFveAVHB8QO4iMiIMzoYpuuvq7GQHUqyrri4jJiZ4i5/z4iXabZWJ3F3DdDckW090M4rW+6T1h7dv33727FkBAQFNDRVfL1eoqJZ6kupBBPdQ76uZ8WePyclNVXkRiFSAjyfNisKypIHnpMouIzVI1wtDQ7plSlqSGhsYqqno3hMxE+CPFBfKFbrVyM9beepYw+njvewXOljP1p49Vc56Np/7UgL/tRgZCQcJUXsNNQNVZXVFRRkJcX6+m7w8127wXsckXrrEceLY8e+2blsq9sC0hWSOW5Y43HIb9/99KKebsEePHpUQF4HGBJQDTsuL8lrqq2EqzXXVTbWV4LONleX15aU1JMIjc3n/LjY8nDBod3cCfFhGDnb27q5u4NP4IWaRKbnpZWdLFpOri5Ofnw8IIH7BQHcHjZd4PP4Fyvu72uFgSwpzszOS4x5G49+SkG0PNycnJ8hCTU3127f5odR+/PFHyFJ5aQkLPR0XA+1QU70IQ9JcOMHcKM7eKjc8uCA5oaWmsqu9aXCge3yYQPnM5BiIP4XywoLckFBywRi4SPDZvKx0GAwGKHliQhzEB64TtAKmEuDvvTIA3/D8ePX3Iz4AlpOVmQpkAKAASiAAARMp8TDGAGtzU4E7t3bs2IHHzdRJWUVLJq206F2B8pX905W6HCtQTpOAf10QdQnKN23adPYMCygw2Fygrxfmi+7aw0cCzUFOAdaUn44O9QJ5SdDn9OSzidGnY4MTg91DvZ2Ae+jisqJ8iJKM9GRMSmZm+jKU1wPKgaEf5mfJRvkC4eNvXz1/Q08+n888HhsCbuY9ynrwINrOzg5WA4Wuqaqir61BW5e52dk43zf2MzP2M9D2VlVwlxCIkRWKE+bNuMMVd+l0wsWTabwXUm5dzpAR9BG64SImYC0uZC4joSMloaOkYKSj42jvAM2Uk50JGgGPAhCnUE7H+7mXi29ePp0ex7IhN9jbxQj/7smxwSeTo7i8N6+ewv0Ayt/Pv3n75vUMkHxyFBQS0wTvVU4SPVPTU+LBxOF1w4MDAOIhAb54jNA3oK7Kqkri4uLs7OyghLTP7ddq6U9x/H+G9aUKi0yd27W08duqTZs2nDhxTET4roaKsqOtjZ+nW1RoIKAcfgUICDRPfBiL1ZifTTYqS/JzU5lUJvBrs/smMCXQ89CQgIiQwBimYMZS/dsHMTER4b6eHgBtDQ0NJSUFDQ014Je1uRmtUU6hHBpajylTLiMteU9UGKQSnEBJgbTuBL6rqKjg9gUF78AT+Hi4VzD528BxmmNFoXwQUq+7o7O1CSoQEgf0BW4GF4OBiwGIk2O2hzEp8bEpCQ9pmQEG2cPBcsIC/XxdnZ3trE309OBCuLi4jh8/vnnz5qV2hr86UVi9ooqAWjTUR1pKzNHBBtMHFMK8Px7pe/F4lKQbDJJekhXFj7JSE4HmACLargg6g0I5HfhjbLz0VzP8P20NLXlZbWEBJ+E70YI3K+/cLGY5UXPmWCcHSzvb6frzx+rYTlZePl9488ojKRFfodv2kqIadwXEbt28wcV1/gwLbJCdlY2N7cL582ePHj6yfdt3K/0DgMjMwfmqL32+1v0/2GBhckzx8/379/PfvGFqqAehiZmApqsqLYQ5Ac2725pIvGd7K0ZvaxN4EDRXSyNJtSgrLQScMTlp4OqRYYBJJoTck/kDGYj1Y8gcqjg52gMcszLTsQKGeruACCQ1dGIUIAsoB88a7OnAuqkhxImUqooIJ8WXvTxB6Z3MTO9jXfLz8x0+fJhAOedFJUV5q/vGnnY24a6OsZ5u8Z7uqUH+mZGhRRkplYV55LKbSDtKKOsnU5NPZiZhz7D2pvoq8OjgEH8nJwdHRxKiCz0bFxWVEheXkhAfHRkFPhgSEkSQ+gFRFbgpoGTCwyiQOFpsDyw+K43Qpfzs9MqyQnAW4CYeCFxdRWkBLvthVJidlTksZNeuXUuRDwxM/yZ6gfZQJQcjXx11/oUMMVqMicZO7Nixi4ONHSwYCjrI1wvUjNTrSIjPzEjLzckqLiqoKCkG7wZ49XS0AnafP5l8+/LZ3KtnC3h9/oSGEoKww9s1k70hJrilrBA43tLc2N/dwUD5s3dvX2HMv36K9xiASCaCBcR3oL+nHSIgOioCImylxRcNHrCztXZ1JPVbfJwcAp2dfK0t3XU0/DWVvMTu+gryBd65/uCeQJqqTLq2SqK+pr+2qouOuq2OBryysZ62trqKoa4OcAdeFkIBEu3lE5KL9NP7+Z/eL/zx07tfPjPj0/tP7+aB13OzzxdJdM1TekK78PYlZARYPF4/Ls7BA716+RTzDncO3MHUQ6EXPcrOTEkE+jyICsVzI83poS293LASsB4srS109XXU1NQE7wjASrds3rhUToseOP+5o04afv6XWfnq5e0y2vgNNo21cfXyFVVlFSuz+wE+3gDxuOiIB5ERUWGhNC4lPTmpIJeU7SVhfFkZsZFhQX6+JKueKYIYFOibGBeNNUm0BSmdGPkwNiYp7iH+IdYz0ByEVIMegWporpQuwT83ZjLytbQ0sHgA5XfvCoAeCQnelRSXwF+lpSQA63zXb/Dd4AWshwf5N9dVwfaB4wM9nVhLGGSDhemuBSsGOnu5OWtpqtLKXMpKCqTMi5bmfSNDEgJoTuoqO9lZuzk54mO+nm7B/j4h/t7QH5GBfqEBvvihpYWpuprSlcsc4JFbtmwh9rJ2zQq3JX/W0AOkpYwtMHQWFhZxMVE8B5hnaUHuILOJiiX96unkzMTQUG87YVSJse5uTliKNMcJr/Qs1AScnDTHYKp0mRjpa2tp4hFJiFqKC4VLClfLSRRfOl/Hfqrr6rkeHpZRgYv9t9nqr54sv3om9dLpMB52Nz4u9asXpbiv8nFe5Dh3juPCeW6uK1xcV0DMWc9fOHTgIPzNSqXSL0p62f1Tcva/C+WrmGN6iB0sX0AkaEJUWDDQHOu+soSieW1Xa1NfaxsG0BxSi8xud3tfd1tbcx0IKfhgUV4OkC6JHEZFBwcHg8G6uLiABejr62oxfV2ZJUjYFnQZoJw0RJ4c+xrKwRbxRbWkP2N2Zloi6aUZgnUOwu9kaQ7lrSnIBIoByi9eZMe6AZBBmQZ5eUQE+D0MDUmKikyJjQHnwsXAx7Q01AKrhvp6ZyYnZqYnoLKnxofoBktgkC+gHGrazdUZlxQVFh4bBVyKDAwMpMHv+EtyUhxuB2I8LycdXi0nPbnoURakLlhSRXE+zbWBWMGaxpPpbGmoqywFUgDK46LDbS3NREWEYK5MPPLS3uivohfWLEE5aMhfhvJfd7FZWhbff/899KmqihK0uZ8XTRiJoiH/6Wkp+Xm5hQV5FeWltZVlQPPujuaZqdFXT6dnnz8B8L17TWqnkByfx2Mjgz3kkTfU1NRW1NVXNTbU4a+jg32Aa+AjcPz93OuF2WdMYufTt6+fYbx5MT09PkihHJ6b1FBdbthIOjEyiZd4qp4ebv7eXqTDpLOLHSBeWUHlBo8CB7vm1ctmt/jc5aU9VRTdtNTsdTVtjUkdalqHT5tJ+AY1dnFxiouLhUufHh8Bmn9+N/fzh8WfPxIc/+NP73/6/P7zp3c/fVgk+z/zs7jOxblXQHb89edPixhAc2D94tvXsy8IlI8N9Xe0ENlEulWQ2vnxQAGs8IiQ4GB/ohoB5XAegHJbYvwm4A1yMrLXeXm2f7d1w7r1X2KHfp0d/deOldoYy1C+fv36gwcP3rrJT4zC3o6QCSb/DpMYER4KVg5QzkhJxu2TDhv5OXnpqcB6KEJKMGEOcEJAKwz4pIT4B4ByWoGZEnPclI2FOcxfRkYK3gKyiWwpMDVjae8IoLyKsiIAUUDg9s2bN+7cui18V0jsngj4B95f4byMezfS04bA7GRoHOwdCwOUHFBODjw7WxtrKgpys+ztrOAAwEn379976NCB0ydPnWM5y3aBlYvzEs+Vyzd4rt7muyEscAfkH0AP6WZirA9w93R1CvB2Dw3wgR4K8vN2d3OEM7hzm//EiRNbv9sGjFr75c/6lXh8Zr9lNS07CkDn4eHB7TyIiWhlaui/fkY6fwHKn4wP9raRqQb9gnq2srKiZQZo5w2avLr0xxBIrqGqKKcmLWkqI+4jI54nL5nNzVZ1laX92umuW6dGxVkHRc813ThUw3Mo/9LBtGssCUI8jnycxrd55fl5hW/wit7mlxAVgbIREhKE/8ONA5owuWtXr1m/dqUe/RdV95d7fv4+KKcknwlxXb0cI7cUI7Fhw6bt23cCKPn5bqooKUOhMBkBpCBiXhYReuVF+bXl5U01NRS8oLYA5RC2kDYYeN9NMv8qwNKzszKSkhKA5h5u7vCH2qR/lAbs3dPdIywsBCgDnB0d6KUR5cBZusfCQHkXfnldNdAyKys1KS4mEssSBISEQtrZYBXiqbGcPrN3zw/sbBdABCCRXBzsA7y8Qvz8IoKCHkaFJ8fH5udkFhflMTVh6nvb2/u7uyZHRyYnRibGicMACS0qzCdhUk5O9EAfrhus393Vjf6BkgCUg+MAqmD5kAhYtY1VJc01ZR2N1dAiUCd9bc2QJnhD3ne29TDn+CAphY+yISQhM00MdG/yXd+9ezeZVnqguXbFS6/+08M0us31VXe3pZ+vX7+Rrt2lg37q29et27NnzyWOi3gCpF4HDMPHG3CAZ4WVvVS5Oz35UW4msABXhUcB8wOcwXG+mp4Emr+fmwXPBfCB1b588WRifHh0bGBkuA/sFTPyYmaKoeHPF9+8BM8F251/TZjv25czgHW8gpUv7ZU/iLa3tSNlUQ2W8rmtLO87O9l5MQWECeH18QYjszA21lNTlhS4LcHHpykubqaq7GSo72Fp5mxh5mh+35zU0CCnbVD9urrahka61jaElScnJ1aWljweH4EH+rjwFtAMMo7xx18+/fLz519+/vjHzx/wV+A7MP3zh/mfPi7Q8Ym+vp/DlcP3TE+OwDkBypvqquHjCx/lpicnAMppD0wsLeC4i7M9dT+gcm6ujpCPsHJQ1FMnj8Mymfla9VX+54bVv7O0zhIkrV7LVFhaC+525coVeGJSOsbbC+t2ZXOZyVcIy0xNycvOoN2R8AYyAqjn4e5K27ZA2mKi01ITiV6MjQY1Dgn2Dw0OgaAEqSdN4wJ8HWws8UiBsxISEoqKijRy3NzEmMEvNTVVRWAr2MatW7d4eXmvcfPw8ly7xsPFdfUyGxvb2bNneXl5wJdT4mP721uwwvH02pubCCuHmXc0g7iA34Bm3bp1c9+P+2mXBZL9tGY9SThcR143bdgIRwiiCnCHguTm5ua/fUtI5C68CwAUFMTR1srNyT7Ax9PP283ZwRo/wdVeYGPdsm0r2Yn6ds1KXf61pDvWRvLk12yk1cDxumnTFoCVsPBdzBcmFPpyeKD75ZOJWSbpYWZsAE6ovLgAS9THx8fS0tKMyQelWf4M9zAAxWTCZ2WUpSUN5WWdFaVjZEUzRXibxbk6hFh6RE+OKpwdVWWZ0GAdVWJtEztVK8KSyX8mVuBisMQdcxF+E3kpA1VlAy3SUAkIJy0tzcfHh5vdtWMnjWBZ2o77KpxhNUkf+W+7jP0OKKfZZcvnNqu/Ol1dz+yuHLhw7jy0wl3BO3im+rp68GFeHp5hQYEk0C0p/lFmWmFOTllBAR5QLdNQsau1Ef4ZVBpQDkyHXsdPwIVJRmU2oWxYcwBKWjYBmO7l5RUZGQ4kBZ6ODfYByp89nngyQaCcsnIIN9LvAaQ3JxPegBybhAYxLRk9HextARYgDoDyPd/vxqXiIo30dCEgfDzcoT0BHPh8YkIsE1udW1VZ2lRX29PWBijHLweOT44NTgwPwFWUFhaEhgQ52jsYGhoCPnB5oPxMzVsnDw8PTDyuPDUxrqwoHzjexpT76Wyqwehpb4QDI0dA7S0koraNonlLZ0sjqbFemIfLhl35+XoqKshxcnLu3LkTi5oJEF9FmNly1xhGsP8qBXQFypfb8q39OrtkzXLA1tIP16/btft7VtbzJIhNTwe4gyeA22fyV4MfRIYlxT3A4qZVB2geHUwRApmef0KKLsy+/Ok9wbsPC2/n516/evl05snkk5mJ5zNTb17Q7ZTn8yDvr1/MzxIoZ0qTEyhffIM3M2DlQ/1d+OWggXiMVmbmENQkMMD8vo21OeluweB4aGAAaJGLE2lsraGuLCx0R4D/lqKsnKG2to3FfdpZxt7awsJ0qR8kEyakg3c2thbunm6pqcmVFWUzk2O4JFwthXLw8Z9/+vDzT59++rwE5eSHHwgT/xrKMQDucEWzoPQTw7+BchIMEhsFJML6JIW9PVwA5QBKXx8PDH9vD293F7AE8FY21vNMDYY1jBH9Csr/tt6e5FesXwcfDxCEeXq5OYf4+yQwm8vQoABxCuXZ6SmEkRSQyPecDBITAvIBB0kLh+F9THQ4bgLEBdMdHR6C5+zn4xvoT+4o2N8HQs3e2grUB95IUFBQTExMXU2FlCXR1SFbChoMgEmT0Augz+XLly+yc4BRXjh/Fq7r6NGjx44dA5RbW5kByrHCezta25sbWhsb8Aw7mYpX7U118C64EpZzZzZt2fzNqm+XMx6YjndMnCWMFCQd2hF0VeD2HREREQkpSVl5EqjOaHRtczNjMHRXRztXFwe4f6wEaBRRUeHTp0/v2LGLlPYD6jHARwHqV1COsWo90PzAgQNAc1wJfB7Q/NnMGJb365mpl1Ojo71dcDn4OdSqC+nKa2VsbEybKN03MSXHovq6pPmGrIyijKSOorylooyPtHDcPd56Oe6meyfapY8MapwY0D08fv/0iOHJdsUDzTKHCwUO5N278EhVIExJ2F9byU5L1Qoi0oA0mNZQURYREsb9/rB7Dyl8v+brIONlS2eq4f8doHxlg+WriKilX7F//37uq1zy0lJaasqGurQevLauri5UCG4ektnHwxW8ICok5GEkOVvHGspITiBnMnm5DRVl7fW1Q13tlJ6Pk7qCzU31Vfm5oIYJpPmWu6uDg52rq2tkZGRKSlJVZXlXWzMJXxkdAk8ElE+NjIAP0mDEytIiulEDa8OaDg8OCPT18vF2d3QgQh6SkIWF5fvvvz9z5oyY6D09LU0sWRghDNLXxwvfBVaTkhyfmZFSUpxPKnYxW3uActjz+Ai5NtBqENXIiDAwcdydtra2jh5xM46OjrhOmgL6KCsT8AekHuzrHB3qnRgdgJeCxyIbSp2tnW2NWCJtjbUt9dXNDdVMr6FiYATsDYwYHAFgxM/PR69z05aNhFIzXHqlmPCSSa9lMoCwRjfQOsPrvmoStvbr1jPrKHYwH8brxs2bDhw6eOnSpXv3RNTUVExNjW2tbdxcXKFUwYIhrmHbwAVIbzx/uq0PRICoqodSqa8Z7OnEwycBKgtvCRT+/PnTx/efPi5+AE9fnPu0OIfXxbevF9++WVyYW1iYm1+YfTf/GvQclJyBcpJyCb8LV5ecSIIRabUcKzOCzi7OjiRNMSyYBjsDLt3dXHCFGpoqggL8t/lvyUrL6GpqAPQd7K0ZG3YgUa0WlrAuUmePFFY1AGAByrOyMurrqmZfPMUlQUN8fr+AAdRmxntmMO/fvSNA/37u8weyS042yj/M//zTe2A6PNDrZ1MTw+QMprWhBmsSMqsgJzON1LOMBiAGBPh5eXl4ebt5e7kG+JOu9uQUMSIkMiTA2Z6cm4Gowh8v4/jqpWiEvy4t6Osy5UzU6Rq65w5bPXXqhJycDBRMSKBPTHhwYmw0E+gVDmmFNY/nBhzHlJH4ouzM9LSUxIS4iHCQGkLMweLxeAHlIOb4oR+TkwwLdbAjydh2TLsfPFAaLScifJeLi4vk3YiJgoFqqqoAcVSU5WWkxcGKbt+6Cas/f/bc6eMnjhw4uH/fD+DR27dvP3To0HU+XjjUlISHNBWoobq8oaaSQHlbY0tjTUNFaXRYMMg1KMWSyv921drlNQrNcfz40SuXL8FVKMhI4zKIFzHUxzKg+Shko8PMCIPWyTWjZbygj62IkhAQuH3y5MkNGzYsh7Ks9M9bCsyloX5MRW4S6IIJgrDAXWekJkDVw8bfvHgy/+IpxltA+2AvjDTuIbi5F02FIcPM3MTIGFAOuFNVVFCVl9dQkDNVkvFQFI9XvNNmINCueq5H9/gTx/NPfM6+j+VajOF6HXTpuRtnr/7pDq2L5YqXs5X4HqqLeapIuxvogBKa6+kaapLIHF6uqwd/PEBK3TJVSwll+7rG/f8SlH8p87RuLVQVBJedpZmni0OAtzuA28nRFo9YXV1dWVlRU4P0i7KxtoStggCCAgDyHkRGANCzUpPKCvNqSoo6GuqAdHiOkyMDQL2ezqaK0gKsyIckQooEmQYFBSUkxOXmZjc31QFNHo8NPx0fecakek4OD9NWcOBNRUxKEak4yMSxk+5WXu7gTXa2llidQncFTp0ifXWhre7cuaOlpmpjYQ44AF5glQf4k0Ix+EagOb67pqJ0BcqnxocolJOuEdUVsBw/L09rSyt6JGJrawt7AAaBHGWkkACbptpK2P/IYM/4SD9e+3vIqQDwgFbgxMquqyyFeqgqJ8VMSpg4ZQhkECL4G1lZae5rXOzs7FiRO3ZtZyLQ/hKU06OeX5XfWg5D/HbVl/MMiuPA/R/27QXlhzSWkZFRUVECk4VyBJrb29rRPjKgw7D2pUACprY1MD07PQ2EFPgL2QT1A7b67u3rnz++++NnwnDBc4HmYL4YFMrn55ag/O3cq8WFWQrlzAbL0yePx8aG+stKi9PS0nx8/OAU8SThU92dnUgJ1tCQ+JhIwBN5IEF+AHegs7KK/K3bN4AdWGYQpMAaiAlMGYYjObOwJdbF9AmDwePv3r5eWCq4VCiDT4tv/zsoJz959+4zLpuA+Bt65vnh/RygHG/evHr6fHpsuK+D1E+urYTGAs8F/0hNeAgoh4gJIjnFnv4B3kGBPtB/TNwFGQ+jwrzcnQAuUKgHDx6kE/clFOF3QvnSbNKucqtXb9my5dIlDlAlENKo8CB8F2nwFh0JXKZQjsuAFRTn5+ZlZ2RlpqckJybEPwTQM1kd3qFMRY3oqLCoyFBYIh4jLerN1KM1Wyk8q6muoaQoLyhwm26YwCcBzcFASYanlJioiKDAnVu817jZWdmOHz22b/ee7zZv2bRxPTASKuTHH3/k5r6KiYBTgQsEB68pL66rLMN0gL5g5deUFEJMSEqKb/1uGxgokzmF/1ZjjW7bshVPjIvrClwFnAdEAK25SENoSJMAB5L47uBoY2dPXA4TVUL2OphORkTY4V9du3Zt3759QKr/BsrXMkXk1y2FEqwlrXLu3hXw9nKrrymH2QLKZ5/PYCy+eg7aAfqFeYd+wfdSX0Kog6mxEXPMDt+mqaysKS9nJCvhIiv0UOlms9HNVq3TPfePPvZlmY44MZ/FPpvB+jzu3LPQc33WR3qNWOoUTlWrcpdoiTxUFQ/VVvHQUHbQUDGTl1UQuM3HefHY/r1bNxIoxyUz0Ur0OhkEBpT/XTZYvi6O+nVg3Lbt34mKisIUH0SEZicnFOemF+Vnp6YkhIeHYpXo6ekpKpI2JbKysqQssooKmCAevbGxITwhgAPrD3ZbmEUq7MBmgONAcyAg4A8su6qytLgoLzMrNSMjrbysBKthuK97anTo2QSp8oExPT4yRpJ3upuYuqPgtmAcpNWsL3DJxZXUj7ACf9HX08LSxIrcv//A5s1bISPANbA0TQz0SVMSe1usaTemzRuoFokWz0iDMYBH9Hd3gfIzUN4PKO/vagPLAFeNjYoEkQcTBy+DSUNqAO9wC6CuuIuR/u6J4f4lrcCU0auuKgPTLyzIyclOI5XyM5Kz0pOAChnJ8RDIIHSuLk6QtHJyckIiwoJCd7G2eHi4Tpw6CRK9AsRf7bGuobWwaazxCsR/XRd7ZWtlLSPq12/YBCTfsm3r2bNnSLdVJWWsftJPwMiA6Q9AEkCA5gBW4KOPNynigfuig+juwKDIcNK4nSTiFuUDzafHh0k+5+LCzx/JlsXnTx8AjhTK5+cIlL9bnH//buHd4ltAJIj5+7mX869JEMuz6UmoHLjE/Pz8yMhoOGkfL+8AH18IAnjfxIcxoL14JkAcL09XmCuwW05e6voN7pt812WZrVKQR+B+SAC5NjhRPDraGB4DSw4zEhoaXFZWAk/88snU/OvnDJqTPZbPzCt5wwwQ9s9L7+foYMJXZt8vvAKOYwYHejF55UCi4rwcyEQQ8vSkeHiaB5FhESGBJBIxNJAp/xmOdZeVmohpxWdSEmMD/cieHq4W6oocZDHnHEw/9TV/W3FEysrxS4A7N2/wgYL4e3vEMrvkWIpA6rCwEIhFEPDs9BSoh9IC0oQ6LTURWi/u4QNgPZ5nRGhAeIg/0ByYjufm5OAIBKdsF2/gUCnPNTY0wtpQV1ORkhSHmZwmf05evnwJrpQcbEIc3boJuATbOHHi2O7du7Zs2ryMj2s2rFuPK7xw4QKcrruzQ25GSnlBdmVhHlRdTTkpdgh8yE1NsrpvfOUKJ1blcksNugO4fteOnXhigoKCigpyIOMmxjBPU0dbm5Vkd1q9xN3D2cPTBQaOn2PdampqysvKAV5ocVoZGSlc267v9yw96q9F6trlLEomMJfuSYKb7927FyI1JNgfj470S3g88fr5k7cvn716+nhmYoTJDawAUmGlwVhIWztTE2C5oYGOgY62vrqqjpyskfhdT0n+eHnuJoMrA1as414sP+Xzfaq6+p89/P/ezfe5kfunimuLaVwvA6906J5oVbmQJ3QmWYgzSVYo4N4td5E7Vreva3JzCpw/fWL3zm3MgQEJRGYo2tcBrF93Mvi7QTndkyU1Ng/8CHIH4EyOe/AoLbm6JA+OF08kPS0pjCnGBoTSUFNXVJTH45aSkhAXvyciIiQiIiIlJaWlpUXqXvr6wkKKHmW1NYLxtU+Nkg2N0aFestfS0gibr6woKS8ram2sg4fE/306Tsg4cBw+k0L5UG8XzdAhKb9BvphpEsVoYcaU9dHR0VYHm8AqPMdy9rvvduBx4L5YWVlFRYSIYjDQw1ImjQRtrOD2aQtmcBno07am+t7OjtHBgamxYQrl8DTES+dlpyYmxEQs1UeEAoD94PpBtwH0wHF8kny4jxzlNuLKyotKSwpyczIyM1JSkuMwkhJjExNiYf/ArPAg0ihDX18f3u7evXuSkpJ4nhrqqjCky5cv7/x+17r1G1eg/DfVDZeK1q5Zu8LWv4bylYw4CuUbNm3cv3/vdV4eUmTDyNDWkjTGBQhaW5OYYZgE3oDhkjoezCEeU/bAFQZDhqsbABeYHh8Xm52VgfsaHeh59/YVYBFQDm4OKKdHiB8/LCzMzwLNyZbLBwY638+9n3vNRLO8oHnwU5OjrS0NZWVl8fEkYCksLCwyNAzPE3InMyUxNzV5ueupE8AFcyQuIcLFzQkaKCMtib9ipjxd3UIDgyDv4FDB5Smag487OTlAw0VHR9bWVGBVgFtRKF/C7q9w/OvBfGAZzRdn376cefZ4gjQCba4rL8kHjsN5w++S+YqNBiaCg2NEMB3ywHDxw9SEWMAW0BNonpYcF+TnDbXHVDDnpKleS1C+avXfWhlxDe1lAdJ6T0jYyc4WX4HHBX0A/Qkox3gQE5Wexhx4FpLMSVwJ9CWgHEKTxKhEhxEcDyLpNjSHA1KM9mMDlYELpxltTiRjj9gOqfavpSElIYlbOHr08KFDB1gvnOPhvgqGcfXqZaoa9+7ds3nzRhAN2iaJNBdcv2HHd9vxv6BITA31IBry0lOqivIrSwprK0rry0sKs9LjI8OU5KSPHDlEVuW6jZs24HdsognrO7fvgg6QkJDALDMn4cbQ0+Bjbk6k4q6b65dB0Nzd1ZMkADqCLwJbJMTE8cBJgI266s2bN44cO7px0xaCV8tQvmp5Y4GZC9oqZxVlQiTT4uxZcHwQMpIpNjX+9tVzjFlSamIaOANcykhJhHCnJ5/mJsamJgYkEVRfxxiXKi/jKCsaryqcr87Taswx4HBmJOjkh3Lu982cvwxzfxy88q7z4rvGy3N5HK9jODsMDnSqnCi9c6hEmL1BVaRYXiRLVjhB8m7AvTva3JcufP/dtlWrNjIRLL+B8r98VP67N1iWUhWWw+PwL0+cOIFPBvh4Z4CS52R2EAHe3tvV2tpSDx5Kik+Fh4B9w6kyGQpGwFYY5J07d65d571xk09SWgqSDowMOrG06FFjXeVQfxdYMGT48+mJmSkSzT3Q2wFUBDjimb6YmSRVbSfHaOkV0kizrxvkt7K0iCTNB5E61Cb3jZkuJwpycjLEeYiJ8vPdvHjxIsg4LVWDmcNl457Bm4CbWloaOjo6BgYGpqamDg4OICwArEdZ6fXVFR1NTf2dnYO9pIjrcH8PMP3x2BBcTnVpaV52VnZ6Gr4UoI9lSv3QSH8PBj7ZRlp7luP2IVCA2uCz5KAsyBeS3MfXA8PX19vTyxUGD3+Dq5WRkxWTEFdQUNDR0bK1sXCyszbU1RISEsR1btmybd1XGylfpwXRRPCVro9fH4quQDnxAaTv20ZQ8jNnTkG62ljc93J1CvT1IrktAaRYo4uLE0zCgVGvuCRq1bS8Nc1TpQ2y8QGoFtxLVVlpd1szpOjim1eAb3p+iPH5/VLsBwbIOOXpwEfgOIn5e/Nqfvblm5cvnj2dGejvbWlqLsjLz87OTiMJ9Ong+4W5WdVlRdXFBRArD6PCne1tTA0NYJ/CwncvXeLgvsolJyuNxQa57ersEh4axpxsh4QF+ZNwQDcn8DXYNshpclJCZ0cLFsnPzEY5kPoTs49PRQOwm5J0cuDJDLrxQpKJ3s//tDg7PdoPHAeLhL4ExcbKjAoLBnZD7cHNw57BasHgoCFwATTmBx4oLysdMEq2NVKTgPK4Ei1Ndb7rN/bu+WEZPmjOx+9uC0VO7daQyQXBB2mVk5IE4cUF0Hhw0hIghgQjgl4AwJm+0jkFjzLTU+LBGGIfRADEMaIiIWO86GYjkJqWeMP8YqL9/XyC/HwDfX2Y4QVb9vX0gO4BI4YkAg0/derEjh3f7f1h9+lTJ86DELGcPnr0KNg3yAGpH7FELEiDYcA60Hz/vh+A+4ICt4319bzcXOOiI6C08Fjg8Py93LCwL3Kwbdu2DQvy+527aEVA/CuAyY8//ggdAHOAIwHPcLC3xrR6u7v4eLj6eblDiND9UnALsA3mqJk4cvAwPGppKQkwNlywvrYGTB72vmv39xs3bmZyL1bRTLvVzLE/3YMGFFBAp62ucTuioqLwdC31NaDhZA0zRXggKH/6uPD25dO6yrLk+FjQCNLIzph0HbIxN7ExNrTUULGWlfCQ4M9RvV0gy1Kvc2QmgO1J4vmfW3k/9l751yc3fp7h+WmK55ehax/quD7m8ky4nho3Pd8gerBO8HQF35ki3rNZ3Czp1y4kCVyzuHyBbcu6rf/4DxtJPM/alcNPel5CInxoKM4yN/9VM/f/GcpXco6ZbXEaV74cXEV27s6dY8EnYUxg1qWPsruaSN0cULb+nvbmBrI19igzFVMITQqeBU0a7OftaGtFci8F7rCxX+S5dl1RURHrPjwsKO9RZk1lCf4hKDCgHKhNOgRNDo0N9+AXkh40T6YgeZ5PTwLHgapkjJL+PoDyCvj7tFSYmYOTvZ6BrrKyMugt6D/JYuC/dYXzMsvpM5gteoJEoZzvBi+mX1lZUU1NRUNDQ1dX19jY2NbWFhcDTQoUplDe19Ex0NMNbj462AfnAcFFDuXJKVhJeTGpLVVdVgwdjtsFZweOD/Z29Xa21UJKFOST09eoMMhwrDlgpY2tBW2aRerPWFkamxqBUKioqICPS8vKKKkoGxkZODqQNgi+Hq4WpkZYmuzsrNu3b2dO4dd9FWi4BNbf/AtpuLx0zE0DAEi04prluMMNlJLT2OQdO3bgtynLy7k52Qf6eNK2ywCp5Xo1pHHMCg0HzwW8UyjHBZO25ffv47K9vT2jI6NKS0i/NBAWJp1ycSUUBED5YfENzGDxzUuyrfGRbE8Dykn9k7cg5rOLb9/MvX716uXzkeHBrs728tKykuJCUr8l9xEeV0VxQX1VWW1pUXpSHMgv1omRni60NijexYvsVy9fkZWWAVUEEuHaIsLA4qMfREbgLkBRgeYYQCWgW2ZGGmYB6+eXj4sYK1D+kRkrDP3PQvmnudmJgV44qrLCPIgtAoJh5NAF8I1HBOCgh+RwgeHBQfh2QDksPDXhYW5GKtYMaUaRRsqiAQ0BK3cFBA8dOIiZYOADfvfbVSsHGL8ngoXGp8OUQYfh26BXwAwolIOMw9kwZaKT8SgB5TnZ6Xk56alJD+PjomOiwx5EhWJEhAd5uDuRSqEWprR1srO9A+nL7O0J/xQaGAA0B4gH+HhSKMf/srxvDNOGnGVlPb9nz/fbtm7et3fP0SOHDh7YT1OR6X7ucj7OmpW21IDm/Xv3AfOFBO9qaWhCATBxYt7wzaqKctd4uPbt+wHYsnfvXjycfT/shQMAcgFMSP6OuLiZ6X16tObibO/r6QYEB8IG+8PfeGPA2WAKKJoz2tEFNwXpr6KsqKqihAs2MdBVU5K/cYP34OFD27ZtX4HyJVa+gYSH/uEPpNQwiRWhBGj1auj1W7duebu6NlaWg5NBzAHK516/mHv7CssYgrK9qS4nI9XZyY4JYdGzMjZwMNFzM9J1VZVzkxAIFuMqVeUplTtSp7NnJuLs48xTH7q45gbYPz3l+vDsysfpK59Hr4Kkv8/nGvc8OWnO0nxvb5Pgodrrh2quHS7mPFh49XjOTQ5HtmNX1v9h5z/8w7Y1pFTYUjIB7Ru1eh0TrLkBaP47oPw//uM//v2Xn7EQ4TnXLCc1LMuTpf1ZWuJg586dgHI8QaAD1nRWaiJMsbOlAaA21NtORndzd0tNW30l6eFZWlRRnA+4h3wOCQ6E773Bxw8ol5eXd3d3jYmJKigkUYDtTOzHxOjA44lhvE6N9s9MDD2dGgOOv3w6/Wx68snUJI0lJ6x8fGRsqH+orxfQmZudExoc4uruYmRiiF8ODyEvJ0OS0MTFcHuXOEirDiwaDFw2G9uFe6LCuEfT+4b0NNySqdQIfgo4AK3Lz8kk6Y5tbUM9hGXjWwDlEyODNCNpYngAY5wZE0NDEwNkRwX+BgjS0kDqoKYmpwDyPNzc4cZ1tNWlpSWhD/AqryinqqoK+JaTV5SQkpSUkoHX0dbWtrGx8fT0hGWCxZNuFcnxIf4+1uZmgoJ3ICZojgNFcALrTMFbTMo336z65g9rVv/ZmojMoGhOs0N37959+zY/wBG2ARyPZVo7kZryTBuj0ECS7eLn60mD6mAtXh6e7q5EwBI0Nyc4bmdn5+fnB+woKy2GowaUL8y+pNk3BMTn3+CvMIAPC3RDg0mbfAcYfftx4c2H+VngO/7v7IunmEemQtlAd1dHW2tzTXVlXVVlc31dS10diecpeAQeB+8Hewatgz+DM4buvnLlipiYGOQzbMnR3oEWGYb/BnQyrfWimEK1ieVlRZgCLB5cHr73M7NF/mvIXnqPy6abQnSQU1Cw8oW34xBVjXU56SmguiQDyN0NAt/RwY64NxcXDw83+DM/MNlAfyxj+GmwkOjwMMrQgapxUVEgwMAgcDdM+6kTJ0l0+ZrVKwTo9zagWLFYcExubm6gFWQuHAwpUvSQ1JEmEQTpSblMH4bMjBQaaEjaVMXHREeFhoeQiwG9NTczpkeIdnY2uAtANq4TIywoEAuASXfygSSFT3fEqjW7r6+tBT96+xYULfuxY0f2fL97+7bvtn+3ddPG9Qx2b/iqLPtSfA5TDYoJRNm8bc+evadOncLE4Zpv8F7nvcbNxnr+8KEDu3fv2r9/7+HDhw8ePPjD7r1EKDM5EJAv8HyGBnoOTKM4J0d7eCysVVwnFkMwA+J4D98DwoG5cHJywHB1dXZzc8E/MdDXBUHEwwEHMtLTlhC/h6/evfsHWvCAqAfGZGicOd0oplEiMCI82CNHjqmpqEaFhHQ21o/2dj2fnqDVMRcX3rx/NwdWDoZaU1EKmmVraWYBKNdRt1OTD9BUDJAWDBO99lCEtUqZtcv07KD78Z8q+BabLr8b4pyf4Pjw4srHl1d/fsn9eZx7ofHiYv7lcZ9jU7YsPcqH++RO9Yid6JM4MyR3sVfqUoUgW+DFoyJbvj32z/+w7Z/+z8ZvvmV2zDd8KWS9XMDnT3F8pajD74ZyKhgB5SCMp0+fFBMTNTLUh9uERVWUFtRWlMCDMTHUTYDygc7GvvbGjsbqtrrqhopSyOfstKToqAgwUFHmj7a2JlZ+XFxsYdGjmuryDtDb/i4C4kw09+OxoSeTw6DngPIXTMMgQPnUGGHlM0y2J8B0uL8PWJD/KC8yPAJmZmtvY2JiQkrL6mqDxGmpqcpLS926yX/m1OnNGzdhSg8c2A+nDTcOUCA9ruwh5WzJ0YqTA/457DM9LaUoLwdQDgI+zBSWAo4DzTEomkMNTI+PMPstw49HR6dHhiaG+0f6u2kp1OKigocPYiHETYyMFRTk+Piu37x5A09JSUmB6TVlbGBgoKOjp6mlo6OrT2NgaDcy0Dp8Lyk9lpMJqPVyc4Y3On36NKUS5KD/K5imggkLcanl428ikVegfDm1BC5BSEgQ/AXMKyI4ADoJ0BMbFf6ASaUClIPyAMrBPRn6SfbKAeV0G5q0XrS3BZAFBwcDO+BxezpalzZYmMgQwPe7uVkaS/6RbGssAEMplBNMX3iD8e7tK1o29tXz6elJEkIKuQNuXl9X09JQ39bU2NbQAK1TnJeDawPzBegY6urIykjx8fGxsrJevXoVlE1TQw2z5uTgiMfFpKdnFeZmAXbh/7Kz0sBJG+qrejpbns1MwPyII/kz7PvL+98MEugy/wasvLOlEcgIKIdXAz8lUROkY4Cjq6urt7e3j4+Xr693AFNmZ6VDVkRIMOCVRGqHhgaRY3cXE2N9eVm5s2fPbt68+Vua2rVq1d8A5SvWu2nzVl5eXqxqJqsrCFAO3x8fF5OSSKAcD4GUNkpNfBgXzZx2Rj+IjQwNC4A3cnW0Y/ZVTK2tLHAjmFM8XlKoPTAAgiMsiLByPx9fsvXs5AC2bm1uYWKgr6akCEC8yXedg4PtxIljgNptW7bSNjfLW7drllMZlnORmcNPeoa5adMWIOm+/Qf2/bgfwH3o0KE9e/bs3LkdUH7w4I8HDhwAvGzeuIXm7MBJgGzBVGktRnJw5WCHJw8nRMLeSOqvB94zgfxuFMpdmEEaprs629laA8phXzBqU0MDcxNDaBdeXh58Ly5jqWYRI0/pBW/YsIlS0j+An3+7+ocf9vHz8zs7OoEW9Le3jA32AspBON6+eflucf7Tx0Us3ZGezsqSwgBvDwczU3NNFQcVuUA12Rx95UINiRIV/lIFtkbtU712J/oCD36s557r5JgbZXszxUa6ir+6/NMrnp+neCiUj/oembQ/3a32Y4/ikT65Y31yJ8ZU2Qfl2WuFzz0SYvfkYhE7sn/vN/+y4V/+eeN6Yr+0OMefVu/5jbD7M1D+n//5n4Dyf/v5J0A56Uy2bi1Fcxpsv5RGvBQoswZzw8JymoeH6949EX09HagPkBSgQ3pyQk5mSmnRo9qKos6WuoHO5qHu1oGO1o6G2obq8vQUkrNgYmKER6+jowWXStp+ZqcDIMCnYIdg5QBxACUM/snjsZmpUbByPFwS/DA+Mjk8PDYwMDbYN8mgKhABONve3FRVUZmWkgp2HxxMNjToRgHEF3Q6BBHmmIeLe9euXZs2bTp16oSEpCgszdXFAZgF/IJZgmQxvY3CwfUgVKvKijuYqlK4mOGBbjL6ukeB6UO9xMGMj8CRkMoBAHRcwxCD450kG4LUzktPww3aWttISkpe5ea6fJVTWPguMBTQHBMRSgD0QXRkZGRoaDheE+MT0lPTSgsLqspKmUJ9TeQpVZRlJCdEhATq62ldusTBFLxdSjP5WqF/3Yxm9a/rddC4F5AdUjRu9Sr43yNHjsCdgCrCtuk+Lyjkg5gIuFUSqeLn6+XmSlqtOzliHp0cbTEvTna2GIAw2IuPl7c/43GzszJwm7hlrG+G874DAi7Mz2IApt++fkaSJ98vkA0NBso/LtDxhpbWIlUSXzyBb6ZV4Gl1jr7ONppLwmS95kaFhZLi2mam8MTQVdevX6eNBeTk5OALLSzMYMl4hkAufL6+qry5rpr2A+tsa8QEYc0szr369H7uj5+XjmS/5uDLUP7+07vFryIUl8fC26cTQ4OdbSX5uTSzgR6rQuy7ezjjqmhNNLwCYgB+dGOH7row/YX9SHKTtxfmGoCipKDIzs4OO2JY+d/YDW6l7N+WLVvwKIBZ4KdYGzA00qIzJjLhQWRKPKluCDuCZgoLC2FiJX39/L3c3J1IxKG1pY21ub0difik4UlYn7hU0C8sBlwuXA8gEi4bxMJQ30BLQxNSW+yeyC3+65c5L549ewZAvH3bDhKRvZJTwrTUoMfvtC01reK5jtnlIzvTDNfesHHzd9t37toFTbj7+++/hwHu2rl9547vgN34FXTDGph15vRJKTERa3NTEuhnaGRmTCoyYu1hNZLlx+yMYxZIr3Z3Uu+apNbCwME1SCSODby+upoKwwyFISZIVwdjQ0kJMU5OTviMzVu3fGHl69cRt8qEzGBSYCKgOHfv3oWHK2D6Y5A28TMTZHfl7au3b16DlZM1szgHrVZXWRbs7elgpG8hI+YrIxJ573qeOG/u7XMloqfbdS70WZ96EcfxPO/s/x2/+dM09/tnnIvPLwLHgeYfn17+OMz5svLsbBbbkNfBcfsTQ4ZHhvVOjBmwjOqfHde7MKzO2iB+ukbiYqoYlw7biX3/9A+b/ukfNzAFb7+A+GqS5fTfFX74H1g5hXIKEBTKKddbw/B5YOKxY8cANIBy+DTAlrq6KtwpljuJHI+JSE8jPd6A3T3tjYByjG6mPHFqYhzWk4GBHj5vaWEGkkgyhnIyYY1tzXW9Xa1Az/GRZf47PsR0CxqB8T99PEHqIA4NjfT1jfT3jDMcGQNo3t0OYlebm5OVmpIEIw8PC2E6KfuR7QJPN6A5hJugwG1MG+zh/PmzikqyEEr4X4EBPnA/EeGhUZGhuObEhNjM1JSyovzayrLO1qa+bgLlGBAKzFZ498hgD4XyaSaqfZo5eoVfwf+CEAGRL87PherHt1tbWomJiV3husp/+6aaqjK+62FUeE568lKLwoxMIHhmekZR3qOKkuLm+howwYHujuHujt7WJkB5ZkpidESwsZHe1auXyVpcbmXwZWqZzut08+TrGvy/YeVMnZZVsKkTJ05gjrDE8UzAIvGMcL9RkSQOB5YMMCKnnQ72JBSEactLgsBsbZzt7QjEe3iGBAVHRIRlpKeWFOT3dnbMTIx+mH8DHAcmfng/Pz/3+s3si9evCJQzTHwePB1vAN/4GMb7+Tfv5l9T5j736jk98IDKGe7v6e/uoPlT8J1Mw8wseJqlKvOa6iCG165dA5TfuHFDUVERy8bS0hxOGqyTnGdUlVH/h8nC78FCAI6/ej718d0sLBBQzsS8v/+yhfJrKKcRiis4Tnb8388/nxqB3VaVFmKmIiPCVhL0ff08mTNPX38/H7Jp7u7m6eri5uoIQgCswSX5eLgCZPE0mb1mRzhvQDkHBweg66vY/78dysHuwcqhVPAtAGKalEQaoD+ITHoYHR8TGRNBWhX6+ZEMZ3BVqExbO9L0jtmvsMWl4sIIEw8OxKA6DKwcaE4+7+JkaWmpq6urpqIqKy2Dx85/88aVy5fOnT0DEgD9TXdClqB87Xpg9PKx5zoK5SSmkIFysv38LdNBac1GGj0Farx581bQ8K1bt34Hbr9lE/QxEBy/k2x4bt/Bw31VS03ZwtSIlFdUUtbW1DI3MbWxMKeLEN6IHsW7OrsAzQmAYzBQ7urmaG1jDqEmJycD9QYg0tPSxM2A2gPche8KXb58GSv/ux3b14HWrCZhIUzhIoLq27Z/d571HGgoFEByfGxHM9laIQmfz59godKC9Vi65BBl/vVEf1dVQZ6PrZWDioK7pGCSwt18ad4asUultw5W3tvXaXC0x/XAy8wLLyrP/PKY++NTzncvLi285Hj3+hLQfAnKK868zmQd9j407nS8z/TQoPHRkfunRkzPDBueGdI91yR7skYOUH5Vj+MUoHzjP/6fDWtW/6oJAQPl/1228J+HckLM//jLCpTTXXZ6/rtm7VJgHJ7Lvn37rly5IioiJC4mKiIiIigoKCAgAAmsqqoKxu3gYBcaEgAxDmhrqC0b6G4l7fW6W/G8QHawdIyNjUHJMUngF3lZaRXF+a0NNUx5llagOTC0t6ejr7dzsLeLbGuQrPERkHRSN3xgYKinh6BeXxeAgOxWjwziTU9He0NNNamhm5UOb4G5gcwEQEP2AkYhLaUkxY8fP45JZWdnVVFVsLMy9/Nyp3HB4Kfk8CoxDmKikIlIaaqrhj7o7wLEkA5BdAz2dADT4WbgYzAeM3ssU6T+bR8uoK+rvaOlubK05FFuZkR4MGwDCC4kJKigIGdhfh8mBwkM6KG1uvBJJpu5GTeCf/54bOgpbnBk8PHwwDBTOg4fhloHlHNxXYEBMJVvVi/1fmMI3iqmICWxpXVfWlJ8TdVpcVSa1bZhw4aTJ09KSEiA05FywV6eIQFQIQHAKVqH0tXV1ZFsCNvbMn9sbEjBYUhOfBgfA+KTouTpqWWlxbjs6YlxEHCaIvTzxw9QoKAwc7PP6fiw+AY4TrEb7BhMnMn/JARnfo4ce755+YK0hXtMemaODffBUwKF4Yzhz2jzEHh3cAIjQ33AioiQMKyRlZUVUK6iomJgpG9vb4v1QwrmZGe0NdbS4vX/H2nvAVbltW0Nf//3nO+cRI0t0VgSNXZ6772DdJDekV4VRKqgoiBYEKUpgiAIUgW7IKD03jsoIF061uTcc+8/1ruAmJxyT+7lWc9+NpvN3m9Za8wx55pzTCJH/KqHxDcnR+amRz8sTi3Hwb+o7fztWMpN/ALKyb8szsxOjmI9w7SUFhdiLlH5e6JVFX2NqTu7DOwjeRRnTsPyBQUCKH1pGyy4gMAQmETQSRBhksxnaMgnwL9h43erlqtU/mheOUjrSp4SAFFaWtrR1g5QBVCG7xkTeTnuGpG3jYlk/KrQ86SA9uRJP/LjQxLt/XxoRAVmBhycqf+KAnGB/cZzvEIr9WGtccFdXZ0BiLq6ugBEOTkZsDQuLg6wWkw/yr4ZcXCykY5XgO8sbKw7du0EOJO9OJou+QUrX+6gBOhZt1KNTPUKyQetX0tyWJgWaCwHDurqaAGCbSwtwKs1NTWNDY3gGcAW+p3wCvDxZlLL/Uk135ng8wyIgy+GkvDfGVzrE17HXJwdQZtg57S0tGAAYOFwNUAF7GyPgJsz4X4RFha27dt/3ML87N69W0CAT0NDzc/XCwuzvKSws6lmbKBnauT1wuTY/BTpYjj3dpzUCg2+et3R3F5T8TAtJTrktIeBVpCWYpS2dK6+5DM9gTJ9rnorjnq3g4ORAkMpvCSFvEvywxvJhVGx2TERDED54rjECpRPZPN3XtrfE8LaEcDaE8A5cEYAo++kQI+3cK2TUIGtdJyOiLUg24//7/9b96f/uxbO9FKS8a955X+MlQPK//bzZ5rBsgLlfwEvWILyDXiyfsO3gAZcOMxXXEd7OxsjI6NDhw4pKCkC0M3NzY8dc79wIQykJjsrvajgUUNtWXdLHQaoKwg4VgXmGt6DZQl2kHWXlH3CTYaDA2pGRlVpTXV5bU0FLblkwK7jdQ/ZCMVzKnkMmgwApeS9Cy82NQILSp4/eXQ/B3wNBiM15VbCTVLQAWjAhDYzM+Hk5Nz+4w+AcnMLY18vD0A8hXJ4qSm3bqalJObnku5FgPKyF4UUyplBhPOb6yraGglJ72ako0gVaHcH2flsb+liUhUZPKouLnhGpBtukr0vX6/jjg42To62cABvxsVmpafiY3F2RLWZKGWToA3gjOB4f/cwOD7Opa25vZ7UFWWlpcAI4drCXoLOUFU8RuDw160zsoT+Dsq/rNqnCYsUyuFCYZ3gToGmwW8FFoCMg2DiJxQ+6zki7H7qix/izIaeu3ghDD57akoyaWF8P4+RP6wdHRoEYaFQ/undItCQVHgyciszb0cplDOtG+CijgDKZyYngPVzs29npt9OThAof/P6FaCcWEGskxbSrqi+ugJGDtB5JzkR9wUYBCi3srDUUFPHOuTj41NSUrK1tSVJPqcCcVSA8vs5GXVlLzAT6Ab44ABpqE0PgGiUU6ms3yH18uNSZPzvAyyLM8SZmBrv72prIv2GHhBN9ju37yQD0K+TBt1M7AIkHZDNtGr0B5rTnTpgOoF1ZpcY3o+VpTlgkZefbwXK/2juypdQDhO+fv1GERExCzPzUwEkjnz18qXoK2RcvRQOFwF2N8CPpI6eOHHC29vb35eQcVrMjMuFJYCFFnM1Mi6KhF8YVh5BckIuhl0ICYbvRa42k/cJbismJgak+xLHMYXw7QS11234dtN3WEe4HWBvUlJS3NzcRPptzTcUymmnFNrXlMnmXkuhnGa+0VA1g+ZrwM23bP5+25atvNw8wG77I9YAdFgRwIj+YT3bIza0mw+gGRR7BcpDg8/S8mxcAUxjXHwiyWtji7mtoaEBRx9Gi7Qti4kmCk6uLvhYnJeBnr6GmqasrDwOWF5eHqdpb28LTwXvfJyfA/I00N06+aYfUD73dow4kVMTC5Pjb98MYFU2g1g9zLseGnzSyuy4inS8kcp9c0Uw6JeGbBWm+xpcDjT57xlM4B28x/mxTWa+R2x+mARVZidEZ8ZFMEi4fFB0oUt0rIhr7B5P+5U93WGsrYH7u4M4Xp8TwHgVLNTlJ1TqLJBmwn9MZLf87i2b//R/1v75T7Qq9X8F5SQf8efPABGaV/5lz+8lvFizduu2H0RFRY9YkX7t58+eDjlD8qOtrCzU1A7BNqqqqlqYmwb4e4O+pN1Ovp+fU1VeQkvzMcBJHz7Ih7cOBDlz5hQABWCannI7+246nGusHDLu5wIQnz7ML3zyENjX1tDAdIBrxwLDEyAgw8obOpube9vbKS8GvhNlRLDi/CzSl4Tk1SaCTwFDIy6EY7EZGxvC1YK3y8PDZWRk4HXsKBYAbYRINe9TkuJXWPnL4md11WXERSCjkg6wcho6J0FzBr7bAcf0kUnBBEDXVJSCzeFDMu/cjoq4iPkHa+fq7ALQvJ2cALRqZLZS8eYV2ZmudtKvB88B4i01leXPnxU+yE+8HgPyZWpiJCgouHXrdpq1QknNsgjiNyulWysNCn6fyrJ6LdO++WvwoP3798PKYlrT5ui4ICA1JGMhPPzixYvg5pcvk8fIyMirV6/ExETF34hLTriJ+0IlEqvKXgBt4SENveqfm3q7MD/7/t0CiWAsklg5M/tJHRCJujDp22DlM9PjQHOgPGB9ZnpiYX56YWZ69u0kzAAwd/h1Hzwtqm3QyQidvCwqyEwjHBgn7uPtSWp0TU1AqUDJeXh48ATLj5p/ysrhzNWUEygn+xavSIhz/M1rcOqF6YlPi7MfmKN6Nzv1u03OFUHEf7jtiYP85ecPv+D/p8bwaTRuBl8KUxFm5m76HVo8eY0p3L/MhDJIYlwwieSCkpNO6oFEF+a4pzt8MrByLBNMOZrIS8X/mLLPPxZgoVJ/oMNc3LyAOU8mlIx1BxQOO3saiBZAwsXeXswP0DyQYP3ZC6EhgPtrERcxgONMlwyyw8kE9Inkd0R46KXz5075+xw/6m5pYaatpSEtLSkiLMjDzcnCcmDHjh82btzI9LRZt23bNg42diD4T3t27967R1ZWFu+nUrfADn4+ni1bNtNkRHp2K+mwy72u1tBAH0GQ9eu2bt26d89PnBxsAnz8osIiqkqKjrY2WCOG+gY4BgC6uZmJI9MUl7YMJQlUPidwVU/6+gX5U6tJAi/g7KQsw97W2NgYrBxOG+YzONzjB7nwpULOnQY6Mf053Y4SUT4XmAf8ODs7grDjruGy3LmdcC8zvbTgCVww6nlTbAGnrHxZ/PzJQ/w15vKFU16eNmrKTrKiATI8KRoiz/QFy824Oz2EegP4J6MlxlPF3r+UX6iX+o9hlfejsrPDYtMjIhTHp8eEF0DMR8Q+vJKYruafKRTuT2B7Hc3VG8b5KpT3TZjQmzCRgXMifUHiElbKPAAAgABJREFUVcclU22kLXi3C/z47aZVXxFKvtzbkzZrZuB3zR+G8v/468+uLk4rrHz1SqycJrEwUojysmQzHdMIBh/mHRMLVxwOGuwq7J6OjhYsKiwnaWiSfZekplSWYcX2dhD1ZyxaeOvR0dfOM/tIcOHB35NuJcCLv5N6Oz0tFX/NykyjwkCkzrO2tqulBZANNAeNbWcE7DtbGvFiX0cHXgGwgj6D1xc9ffggNzMr7TaW+q3EG3Gx14DU4WGhmOuHD+vs27dvw7cbybanni5uMPxKwFd01FVaang7MT47I/V+TiZuIdg9wGUFyuurylagnEAPUwr0RQPMOhgSYDEe6SR4cv8eJgEpWQw95+Ro7+zohNO8nXzrRUlhE9PnkLQ6JPmadc0N1RgtjTVUFaAGNuRhXn5GOlxmquPBsJ4d69ZvXMMoMywnmC8LelApY2adL/cVWvOlGNMKlINh4daYmRrjroHIgPaePhWIKwP4vnr1alTU1etxMQApQBWOM+1OCizr/dysx/m5ZcWFOCniBrXUD/b3TIwMvZ+fIwHo94sUFoGVizNv30+T7c2lavh5ops4PzMxOzMBTMdzQOS7RWDlHMzASp/Pof6evu42WLIO2o+g8CnW4a34GyFnSOYcKdM1NlJSlOfl5cVFUD2kjOWNhQ2sBEVIIfrJ6bhiuIZDr3uGB/tG37yCRwwHGVD+YX4aR0W2XmeYWOcXrPxLkk7tEH1OSToO8uOHhb9+fgduDqsw2NcFP6mxsqyM6WlyPzcHVwbXJz7+Okg67VgGQI+4cBGHxGyHhmBKEzn7AB83V9InE8wG8EeK1BmBw/8BlK9ozeMWs7KzgQuDrvocPxbg4xXo540BmCOptCdIve6pwCDYlbBzJOuDphsCwTFirpJkFSoCSl8BlF8MPRt6JsjvhKeLgz1WhIKCHGlqw8vNcnD/rl07aFuyDRs2gHTDK1I7pKqqcggeEriFpoYa3DvQAmMjAxNjQ8xS/BfevmbVrzoza5YT3r5IpyOVKAcOHJCRkdLT1rA0NXKwsXVxcDzq4gzeHXQyECvFislCwY0G+B5les5g0N5s5PGYh7fXCVpy6XPcEy9iMgNztLV1AeV4J1ZxfvbdJ/dzwQngOcHbAJpj+BNHyRNo7uho7+TkgH9kthB8r1wMS4iLBuuCx/zkQR5DHx88zLtH9C9vXMcFxDKxNDHUlJFU42LxlhFI1JZ4pCtYfJi90vxAtzdvTzDnWKLwcBbvbJXkZKPQuyGZuRGJmVFRIDhwfGqCQPnsmMjimPjCa9G3dXwzJYKvbrO+jgWUcwDKh84LDoeIvDot3B0gVnpMPNFa0ph/J8+O7zdvWMt0ivm75lPfrPn6m7VfrfkjUP7XX34fYKHlJyvSTgcPHtTS0IRVxAwGpU1OuAE7D68H/q++vr6svJycgry1tSVsJqYOSHdmxp0nj+9XV5EuMzTKDIB+/Cgfbuv16KuMfn9oePh50MOIiAgQw9hYovgBTM/NzHhZ9Ly2sqKztWU5BbCrp6O9q60Vj8BxjJ6OVhBGcOGHTI01SdK6QTqqYJmRJKvw86eCiP+Imbh7925SH8R6EBPXw80Vdgg+AfxNQHkio98PY56bmQ63urSkAKy8saayrY50ySAxlnrSDAWgA0QDBydFrXXVVMATfgaAiESHKkqB4+UlhQWP7j+8lw1We+XKFaaNt9tVJsexqrIUIE74eyPeW1Rc8AR071F+LiwW7FZORlpuRhrREIuI8PU6jnUClgROysLCsun7zYADws0ZNF/1xQ+11ZSV01oh2i2IQjkjAvcVrfmG6wpvCYQRBCf4zKmwsFCwy+uxccm3klJTknMy7sIrwrnTphP1VeWwjh0Nda86Wod6ukYHyXYQo7tCwtC0JohkIn4xPuF1Co7z07SZA1E1mZ1iIHKGkdyaXZwlKE/6ww0PAsqJIHh7U2dLXX3VyxdFT0l306jIs6dOensedba3gVMiLSXBxsaCIS8nY2d7hLQo8/WmFAF3qrGuErx+ZKj/7fib8ZFXb0cHFt6OkHTyhWl6MLSbxO+o9+9+fbdS08/86ZeP7/766f3PHxZ/fj9P0uHHhkf6e8AhmNtdXvS84NnTxw/u5wHWYe2y794h4ZfU2yAisIK0jJ4GYcCVvU94GBrowaVYt2E9TQylciV/uOCTtpVZs3r7jz/IyMgA72yOWMBrWem+RFt2kHofpm4TKyrmKulmRTbzGcUYanJoiW/s1QgSW78YBkZ/+mQA0BB0GPQLDgQOlfUgy9bvt6xnfkDGgbyYgVg71kTS1VBOTkZEROiwrjZJ87W3JR1Zba2NjfRwm7Zt/R6MgSiPL3eLJ6dMFVYYhx4cHybZyFCfyNgF+sOlCD8bAqsD7wGgyXT8Os3IF/vRYn34+qeZlu4rPUXhk9E+GIB1HDaRmTU3BWvU0NCytLTEv2SlpYDJFT7Oe5ifjYlEdVpIEvqpQD8f32PuRwk5Jz1IHagqMm0wTTWWqYCtm4uro72DmYmplpYWnA9hYUEBbnaBPTuVd28NEmfP0hYp0uOtMeNsdmJ9Hcw/dJVvLl96ukjsQ4f8bK/E4qjU7BgJrdDoytSE0OyE8Oy40PyYyLs34gtd4os1EqM5vKPJgt2hbH1nuLv8OHq8uds9uZqP8r10E4+3lDTi/4n9x80bGAk2qni6Eg6hdG3V2nX/LpT/53/+J4Vyp99COQ2BLRXprv2GjY3tsI4uzB0mB0DwTjIRMYTvBsfHzs5OXVMDaA76AC8Mr1yJILGF3JwsLIOK8hfdXW0gdw01lZUvi3DdSZX2jVgimx8ZERlxhfm5Gh0dDYZI8eXF88K6qkoK5bSfZ28n4LudQnkvk4xIGlc8ewoun5yUGBuzBOIRoNxMlhVMK04Hk3X79h9p1BiOIaAcjjzeQ+Rto66tFGFjcRY+eVj2grT3ZPY8GRxvqF4KcDNQTkVrySmUlpSVFAO6S549I1lxRYWlRQUlTF92nBkWNjgvKERAQADW+f38nEZQckYrEXaCSvICvrOZtGhGCDse/4KZh8mKlYMFo6SkAFqHtbR1+zZ4pmvXbVi93E+Vpicu6Uj8HZSvRFrxKxPoJA3aDQz0sP6JrsWZU1TXF9QSOI7rRrV5ceQwSKSvaXMd6e/RRRQoR1/1jg+8mhobBpumuExp7Lu5paTDpSDG3NznxUVavk/L5ZeSEWenyB7jIpFnIXSeoPnU1PgI08y+b6Cvm4HyBvg9Lwqf3L51A/wR69zrmJujgw2wQ0pSHM7+/v17ARY2lhYAL6w6CuX52RlElqejaWSgZ/xN/+TI65mxwbm3Iyus/PO7+c+MYu3fU/LfbX6uyDri4AHiQHM8fn43R0tV374ZGBno6+tshStWX10F4/3i+TPMN5hh8DjcxPyc7MyMdJhqzFjMwBvXo2Njrl66eB42ydbGUlJSfMu2rRTKqXTU/0CDhf5s2bJFVEQIsxfoaW5mBCwDFSWiNKHBDOO+SAk4BhGKiSUSMVQ0BveauL9k55OE14Hjl8NCSJ6uBykqhrvGxMcF2NnZGclsUo4E2y8kJITpp6goD4/Wzha4aSzPbIeCCdG+zAQKnR3MjPQlJcR+2L4VpJvuajJovvbXvrJMdxr4xDhy8D8mj/PcxfOhwPFQ4kMQ9V2ij8bUc5KziIiIY7p94oBB8mgzdy8vpk7Vl+jGAMophQclx7GBktvbk8SVu6BiWWlEjvhe5o3Yq/gKrCYA+umgU/BaANPMYTuAJdhZW+Dq4RMszMypPJSurraqqiosJUwaTA5sGJjfgT27RNj3q3Hut+XaE6PA/UiHr9SAo/EIR4v7wdfnecCvZx9LTL0UWuySnHsltjAmOTshvgzlQlOTgtPjAjMMlM8Nic53iy7UiY/l8U4ki/SGcPYH8HYd4+o6xtPqxtfoKlziIh1rLq3Pt4t1++b1pAHH2hUoX9pjYNLSAOX/boDlH0I584lfU3tLWTkHBwdu56kAf1z3tNu37mWmgw7fSU6KvHL5zKnTtra2pMuRory6uqqlJdkCPXcumCgI3krIuJsKZkrqJ9uau5sbmmvK6sqLSwoew30Fycogopy3EhMTk5ISCY5n3wUmVrwsBmgCr/u7OwaZzkGve3te9ff2dJPNLtJAub2lrOQ5iBKgEDQTZBNfR4vBghgR1KNu7ubmRNto0+Yt4Lb7DuzX1taENca9h0Nw7erlaCa8cDM+9k4qaVhMuhW/fN5QS9JL2hrrWprrm5vqMDqZvHJQcnBqgAh4K5Z0weNH93KzAYVEkiU9nZarEFi+eQNGKTQs5PLli0DMwiePSTp2J1FMBGoBN7Hm4aHDlpA6lBBSh+Lp6Qn+bmFhYWhoqKujhSuMFQtaJ88UO4DZrV6KPC5ls6xmcmN/Hyv/jcbxGprxsmnTJkCArY01vPJrVy7ciLkG64vjhDcAjxJ+T+WLF8QFaazr72ob6O8afUOaus1OjtII+CIt4GRAnPbGBFIDMd8zwWiMT+8A4u8/v3/3+f0CZeu0UJ5CJAlfvGNiMgsA+jlSPjc5Oj42MjL4auhVLymg7WjFt5cVF2IuwayCQ53wOgYoh18iLi6OFQUfX1RYBEvO3dkJBCL87Nk7SQkPM+82V5T0NVaO9LZMDHTPTbxZYHCcZrLjAH4Bs/6w+M9AfGWQIP7yoL09yRkx/4XHnxfm3k1NAtDnJ0bnxkfhnQy/7lves6mnHltTLfD9BSYhaeX86P697PTM9Ns3r0dFRVw44eGOtbB3/z6AI4kX/2XVr3fnn5R7/K63Jy3No2uQ+pRystKgyRoaavBa4KbA8uGeAr4BXvFx1xLjyUyGKwx2dT0mEl4vEcyIjMBMI0AfeRn4eCH07NlTQcdcXUC2Dh1SxkXm5eUFju/atYtJEFz3448/wgIB3UxMjDQ1NQGXuB1HrM2VSZNhCdq5BebW5/gxNydHfR1tCXFRdjYWRm57HU2cXSJ/y32vvv9+K6wyOAoIOKwO5VhMEgrZw8ThYU6mJiVg4WSkJYNcZ6enYn6SMClO6SrJGjpzGp4H6fN57nSgz3FPGBIb6yOAF3NzU1IZ5HEUJwW7BUeEdNZNuH7tMlEgINqZZ8/6+/t7eR4H+ttbW9iZm9iZGNgYGVgbG5oa6uHg1VRVZGWlQcDhlIDnAcRBHVgO7udhZ5HgZFNlP+Auxn1Rjj9HXaDcSKjWnKvdhavbh/1NBN9APPtcgehUBf/7fsnZAVFCycdEmOiKEBkTgm9H+aZGBfDiwojExwGZjy2yo/f4Rq8L1R39qcF2/0vdHWUG+6useMqPCD+2k7msL6HJuXP3t+uZWqZvvuwJQT1yOlb9ffztXwdYAOWk2vO3UL7cM+8bTk5OA/3DFMrhYD7Izbqfk5mdlhYfGwPrChYMX/gw0/1PS4u0cTp61O3M6SAgJvCr4NkjIjoIftpY195QBTSvryipKi0ufvbo2cN8+PiA++ys9Lxsoqf6/CmpEYdvC7wGlNPCfUA5Rn9fFzgdrd0H3D++nw/0BJQDx0/Bn2KSsbwZp8nOxlZPT4+fn3/jt0RCcs++vVgJro4OcOgAo1cjLzGuaAxmP6D8XhbpBE2TEQmUN9UDypuaCZQzFqipq7URaxgLGFBeUvj02aOHWZl3s4hwVlJaUlLKrUS6M4afK1cuA8cTiaJLRjWj7Ih/x4cUFjzGWdIgPq7VcU93Z2dHa2trILi2ro6mthZYhqmxCa6hm5O9o62NrqYGOPX6jRuoJgOTZbxqJXz2D6H8y36AzEL6XkpCkrQNOukHiMEKgeEEjpMSm6KC6vKyhuoKmt/5qrfjzUDvxOjg9Pgws405wdRqvv1y83CRiUGT7p0TowQ3Z2eWofwDk5449/dQ/uH9IqOeuEDz0Kfejk2Mj74ZGsANfQ1Pq7sD3k9VyfOM5FugY8Amb8+jro52gCpxUbFdO3Zu/m4TLzePga4Oroafl0dYUOCdmGtPUxLbCh4MlBbMdNTN9LYtLkdXPswQFQEc2M/vF8Cv/1soh7sA64JBoZyEhr40XYtzn+ZmiDLXzNuFyfFpprspSPpIfw/JOOpsJbLM7c2w7gTQy0sqYN4f5j28l5WceD326mXYTiMjAxY21qVyrT9//fdQ/q/bNK9ezk2iC3DHj9sFBfikpSWVlRVh7MFIgoMCoiIvxly7DCjHzb11M5aqIQLT8Qrp8cYULjFl+heB4xEXzoM5+HodB47DHkgyjdywogmOk/j4uu++2wxaCroD3oqho0Nor6ODHTwMrGh5eVkzU2NPdze/E54wVHCVDqkoAaYxRISEQeqp10hxfCUwy8rKamSoH3wmkMRSLoZTshUcHMwU0J6PiY5MunmdCJNlpN5NJ5FrommTlXb3ThL1+ImsDZbq5QskET48lPhtxz0c7R3s7W0d7G1hk5iOYGdJqJapgboeFRkRHgr6T+R8mfaNwHpCxk2N7fW0fc2MvIz07HQ1TTXUdVVVFORlQXQ4OdnZOTlwHQQE+GQkRJWkJPTkZOwVZbykReM15B8cln2pJ1ZjwFtnxtrhytntzzF4hWcwAVAuPFXB+75ffHZQhEI5xq9QPsJPoXxuRPT9oMznNvmRbL6RaOFax70NFqwvtPcX6XEWW4o/tZHNtDkUfFhajXvvnk0bKZT/WhXMaJtShdQ/llf+Gyj/dRqt+XpZkw+3CqwcUH76ZMCViAu47o/zc4uePnr+5GH23Tu49CDgIFa4xLq6ugr4UVLUM9CHBwRshSkGzKWn3IZbCuxuqChtqansYECEqROpZrYNi7AeMKrLSmqrSlsaa9qbG0g3n55OsPKh/h5aoQMcJ8j+itTpkMDz00dAKDi2TMwtiES+jh8/duyYs7MzDLeamhrQ8FtA+Zq1O3fuVFRUtD9ijdsfcu705QgidMcoaVxLuUVyNmBCsB7rqytaGmrx1a0tZLTTCv7WRqxbqqzbXF9D0h8LC6j5AaEAF0+6GX/zRnxCQsKthER4IfAtigue4PBwdljtRIm/4AnsGS4RjA0Q3MzMBNyHaV5+SElJSfmQioGBgYOdo89xrzOBJ+EC+x0/bmFijMVGtMtpOQZVQ6Rs7p9A+VKvvjUb6L3bvn27nIwsGBxc/tRbN+E6PLl/D84QrnBdZRmJI+EWMFIzoMljw68nJ4anxkfmGdJN8kCmJpblqAhGzzEUFWN2coxCOTAaUP5xkaSZk7qhOTKYcso5DAbol9QTiWALI4QLYk7yWAb6yXjd215fU1daRLYXrl4JCfT383B3d7K3MDaQERPbs3PHt+vWssGXUlNxsrbwc3cO9/ZMPO3/KDy4JCK4Jjq8Nyu563HOXF/7/OjQJ1iOBZIbjvHx3eySl/BP8lWWYiyLS8R8Dq7G7OTs1NjyeU39qt8yP81I4E4xScfjU2ODb4dfDfW2DzBjsKetq5XsoDTVljdUvigrflr0lIiCYUYFnvS1sDBjZWcjOf5//hrjXzTb/YdQ/sWGNsHEDevWsx5kERTkB5pra2k4OzlgkgCsqeguyaxNvAHwAzFnBHaiAGpRDIIDAS+HE0kZzAGPY65UX4XBcX4ONvafdu4C5WdSXNfv3rOPRuRh+91cnS2YHzyHV6fB/OAJLEGg74mjLo7AARUybZVIdaiS8sH9B2APaPNCKjq4du3anT/uUFc75HHMHQScqb0POXXqlP/JAIBsWFgYKDkMD1WSAZRnZxExGSLJkJcF/yaHgZTbifFAc6IqHHMtNioC3NzP1xtmzI3JcvE74QUnAwz/VNBJHx+fgAC/0GDC3/FicFCgv68faRno7Oh8xMpBX8dZQ/mymWHIYXVXRRkzGUk1SQlFaWkRYUFQPRERETk5OU0NNXN9XQf9w146Wuc1DsUoSt1TEn8mz/dSmaNRn6fJkq3bg7snEFDONXiTY/aZCFj5x36phUFSow/UnhwWAIIDyqfHBCeH+fCcFgp9fCP3oVH21W32/vO8hQZbS3QOFGhy5eoKpxhIxepLhxsouqlJy3Ds3bl5A5NR/oWOJu0XRgXG/0nrkv9m2/NLKF9qEbksncPJzmGkR6AcRhJ+0MN72WWFz8qfF9DMDVx08M3jnsesrKzgnQGhwDSNjY0dHByYakNSOJ6adCsnIw0EpgL8t6YCpIxGM1prq0h315qypirSqxvkt72lHhhK9bMolA8Ax3u7gOPDgwTK8Rzu+YvCp/APMH0jLi/FxwHlrq6uRELW2FhFRQX+I5xc0i5j0yYxEVHgI2bA6VMBYeHn8C+MksZl/Dst3C988pB6A62NJK7S3tZEoyuActJWor2lncldgXtR/qLkyYO8vHtZTOvb2ziv20nJaal37qbfAcEnLSwYHKetqMGCc3OyMHcDAwOOHLHS1z8M/wD0SkVVWV1dHfTHxMQExxzg5x8eEnop7Dx8ydP+/vZWVnCBmfL9JSj/NRq+9htalPwPoZyUhzHFvtt/2IE5StZS8JmUxHhQHtI4G+dY/gKHBzoJswQo72prBpSPDPVPjL+ZnhidmyLBCgD3wuQYwfQZkk2IV2ZIqGFkZvQNhTxANoVyWo9Dofz97OzfQzkNdwDKSbkQk5I4QuIVvW+6OzurSttLCh4lxmVGXor09Qp1d/aztXQ11NMSE+b58Yetf/l/bFu+05MVP2qif8beMtbDKTvAo/Z8QNM5n7Zw/5HbUT1ZiR+6GhbevPpMdl9naZNoQPm/SD38HTGn3JwqO+IEaeINDRYtqYPNTNKMY2D9xOjrsaG+V92Ej2M+YFYwRKSirvJFXXnxy+cEyjNSSZM/cBrgIKAct+bPf/rL/x7K132zFswXk1lYWFD1kDIpFPD1AVJTMQYiTc4MQDnILME+pvNy5MUworjJxI4BgoBpbU0taUkpfAgXFwc+cP3adUvZJ2vXH2A5iGkJvAbbBfkFGcIiIgENhqHr6+u7Ozud9D0BKIfnBCjX0tIC4zYxNjykrAKr8N13361AOWjfjz/+qKykQFuJ4duJKPqpU0FBQWfOnDl37lxExKXoqCswP3duJ5DeHRmpuTl3aeoaoDwv5y7majpT8Uf6Hy1D+cUw0kAK85luWuIKgPcEBQb4+pxgJDx9cdlhsWjuirfXCXy7s72dg7mpg66Gl5piho1ZiqFOiIq8u6yUjqiwkoS4lJiolBSpWjc00LMyM3YxN/E3Nb5spHfXQPe+ilyxvMhLSfZyeZZmfa5mK/a+E7yA8teXud7Ec80+EZkuEwCUzw8QvJ4ZFf0nUC75YUj2Q6NcXwL7QIhgof6uZ9qcuVpCNzTFQ9TFvVTEnVSk9WVFBFn2bFrPJDl9/avnvdRyYO36JT79h0qEfoXy5QDLb3W5VrOzsq1AOWwm4LvkyaOakiKMkoInAHdQ75AQpguMk4O1NQloAdZtbGwcaLqoG5NEEXz66rXLiQnx4PL3c3OKnj0uLSqoryoDmnc11/a01r/uaSPZYN1tNHcFID4IJt7b9bqHlAu9edUDNAf0vO7rJB1BS57DNmBCgGJjymLeeHgcdXS0t7a2xuRTUlDEMW9cv4G6e/AfdbQ1SVKXtyfTKJLsjcAAgCzHxkQRFM7NBOMGMSdQ3tbY3UGED2kyOJYuldYC8FEJkfIXRWDxQP/CR4+KnjwpLngGfK8sLaFRC0Ynsr6qtAQ4fivxZsTlix4eHpaW8FXVlBTlDx1SBiu3srKAt4g5d5qpf7keHYVlmUgEAsPOnznjZGeLecaU76/9sk32qlVLfHwZymmi0RKUk0TmNRsolG/b/iN4FuY9HBZ8bFpS0v2cTNhd2L+y4kJad9pcT46zr6t9oL8LNnJieHByeHhqjAyC3bRj59tJPJkeH8EAjuM5w9ZBb+c/LSwsM/EZysqXanDmZz7Tbvfvl/LQgY+0Knp8eHB0sL+3ubGruqz5yf2O3PSSK+GPzgQmuznFHLE4b6BzUk3Zlp9b7Yct/H/6P1Ib11jxsnorS1811021M7pjpPrEWDVdhveOPF+Fh2VxsOdM1fO3XS1/e7fwt8/4WsKd//px8eePC3Tbk7JvjJVSIIzPNJmSybp5x4gNkATKqTFiwxgNmXlm23b2LWlPSmqgxkeoHBhV0m9uqMYMqSp7gQlQWlz4ouhpceFj+JpEAfR+bloKiQwE+Puami+xclKu9ee/MBj3zb8ZZqHZC6tXrVsRa8WLWJh79+6Fowbn0tLS/ISXJ93Evh5HErFuxkXfZGQvGa20aMyla5cuRYSHAvxOnww85k5aSMMLlJWWERIQ5OHi3rt7z3cbv11KkmE6Qe/dvw9Q7uRojzf7+RCFbqwUwDrAnbRGsbTC0jpz0i/Axwuet4mRsbmpmZ3tEQrlwoJCHBxsjDLzGprLKCjA52hrE3buLOYepnfQyUA/Pz8QZ5pyg2MmOJ6aBB4GHACa52Teycu6S2K29zJzs9Jy7qamJRPVeNK5KToSuB8XfeVqRDg+kKQYMgktpLifafOK58eYH2/S/dvVzsYWg/SLc7Czs7ZwNDd21Vb3VpDM0tVMFBO4Jip4VkbMmJ9HXVJMRV4GfoOuru4Ra0snW2sPM+NwY8NLctKZslLPJIVKxXmqJNmqFA+0G/O023L2efH1BHD2nWfvu8oyls0z/JRjoV10qpt/Zkhoalh4alSIJiNSNJ8eEQKUz49KLL6WeVcj0x51sDdQoNiY5bGheI6lRrSlzgVHC29LYwcTPX21Q3ycbJu+20hbCH39a2LxaqqK+pe/fP3VV6v+4UbLvwvlK8mhv0I5Ozug/GxgIKA85dbN7PTUZ/n3Xj55XFNSXFVS9CiPpN9eY2Stgs+c8vc7QXtNkV587q6w7eTe29m5uDn7n/QDf8ftTLqVkJmRDkAnmXClxURVsamOlkG+6u2guStvXvUCyof7ukmNe08H00iIiZV3NFdXkMBFVjohQoSVkxoTL3d3V1vbI7Aih3V05WXl4ElgylJzd/DgQbiEmH/ubk7eJzxoffNKXkfK7aTsrHSgc3XZC9qls7uDxlWauttIkyDgOJXxonnltZVlWM+A/vLiYpqSyJQbkIjKUtoi6fRb+DDvXkz0NZARW1tbEBlQAFx3sACsB9KvMugULgVpiB4bBXcSNASPcJzDgoNBKKSlpQHlK60nfi0RWrXU4fZ3UL5U/8mwcrxh0+YtYmJimNAgL1jeqYmJuXfvAs0LHz+A4al4+aKmohxQ3tHc8Kq7g257jr8ZmBwZWoHyeUaVgtTfT44x8eIlfKdQTlj5wgKY+FLUYomVT1NW+3G5Nmepw/3iHDgvYHGMyQzpb2kYqCrrfZA9npveERHadjaowsOlwOnIQxuze+bGtzQORcpKnBPmPi/GF6+tmGGm9czJpNzVtNBQoUxX6p7Y3hypgzWu+mVn3OYqHk11Nf/H4vx/fHoHcg0o//n9/AqU061XjKWaz3cEzZcSFplXvoRymnM5NzuJgefkrKfG3o6/mRgZGh7oJ+1JO5ppOVhZyXNMPCab5QFNTH6cn/uI6deK23cjJhp31sDIEFAOVvWX//cV7WO5AuUrPOlfi9ziJtK8bCa8uRbO5Q8//EDFDEhl9VE3wCIoQlwsAXHMH9IwOm7peQym1IXwC6EhoK4eR49ZmltoaqrLyEiJCAmDQe/e9RMtucTAeqcgsmPXTkVFeSCA5zGPwICTgScJZvocJ+nnFmbmmK4nvb3PBASc8DgGoLSysMQjphYpkVdWIQ3jVJR4eblpmei6det4ebiOWJjDkGDu0a5V3t6kaRdpG33pAqlES7pJtZ2zGXFHrGJQwwdMgIWgecadO0k3qbdNm6nGMsktYDlLaeP+vsDxIH8/AuweR93B1N3cnJ0dLS3MdLV1DPUNmB7Tlg6WZq4mBsc0lIOkRfJVFTP4uNJFBZKU5R0FeU1kJQ3UDunraGMx2lpZulpb+hobxBjp35SRfCwlVibKWyXCUSvFWqN0oNOMt82Go9eTp8uPo+8cZ88VlvEsvuGnnIttYoDy6UHBqWFBWhy0AuUzo8KzY2ILI5IfXst9rFLojGTt9hd8qseWoSsab6R6xlT3rLvTMXtbWytzDXVVFhYmPPX7/PElKCcyjl+t+sfamf99gGU5GZFqLS61PV2zFlCop63l7308NPhUXFRkUnwcnKC8u2ng5lVFz2tJit5zOqFhbNNTbyUlEK0fAu3nznq6u2FCGBsbWx2xdDvq6nOCoBgADiw+PPw8UW6Jj3uYnw2S3lRbSQMagPLh131wxoEvU2CLQ6/HBwHrXXgdMIq1dDc9BYT3GsldCiEinV6esMTwBoyNcXf01VXVFORlAeWbN35L27Pu3r1bTFRYV0fLwtzY3s6aEJCjbsD0s8FBkZfCQWdIMWF2RsGj+/ASOoE1vXALOmhlJlVtBJR3drR04JU2UsdPaHs7gL65q6mhq4mozbTX1zRVlddVlsJdgLcBSg4oh9EKOXvuiJW1uroqWICpISk6PX3SL+ICaXOanHATdvFeZtrj/BzM4LTkRPjFwUGBmJSioqLrN274TW/P1csN4b4h/he14St9aX8nkbpx43c8PDxmZiaY7lciLgBibicm3L19Oy8TnmxewWOAUQEAHUaorZGohvV1tuJ8qdQnjbSQjioMlAO+iS45kTpZqu0kAeVFkomIQWPleJFpNDFOG7C9HX0zOTL4fo6I386SOn4yqHb5+JvXEz3ts83VLy4EV/m6pymIZ4kJ5YsJ3RMXypMQvi8ujMdsMb4H8iJ58kJ5CgJ5SvyPVYUK1ASKD/GUqnLU6PBWGAq1nDCoDnFZrHo409n4/i0p9aRdJkj++3sy8OSXjx9+/vz+86elHJuPywPEHJj+fuHXCtXZmYkFJlBOt0DxHEf7dnIUl2IA957xwzC9wTkA3Lk5WRl309LTwCESEm7ewCRMuhkPPxXzBxQSGOpxzB3u174D+79hHOTfJR78OwGWb5jeMb8m9jGmmvYwg4HX1tYGyz7hdQzzBM5oJKO0dS3iMk3GZRQcz1P9cSCakQEhzsBxYWFB4Pj2rdtAboDm4qJicFvFxUV37dqBJY+ZBizGbIH3fObUabBpUiUfRNaVi7Oj13EPeIqk1t/NHavM3dUNnB2sCBZCU1MTTjBWE1YWlhulTT/++KOivIKrs4sPbbrCtB4EPcfhMd1cE5KTEm8n38ITGD/Mf2B6zt07uRmkux5YeUZqUjzp1xtO9jkd7b28PC+EniUN+a5GXAoLOXf6FOzMCdJr09nN1RFH4urq6ujoaED6KZKcQmVFJQtzU4cjlvamxu76Ov6HFC5ICheoyt/n47gvzJcpL+UnxOOuLIcjtjLQN9XXP2Jk6KSnc+KQ0g015QwJ0ediAqV8bFXCrK0KPM0anF3mfO3WnJ0unB2erD2n2Hsus0zmCIw/5/3QKTnXL7wwKgYCzux5LpV6EoY+IjI3Ij43KPGhV+5jmXzHJbYWD967ijuTtESS7U1CHCxPex71hOExNVGQk9+xYwctpweUr1q7bhl7l7yxlerZ/1Gs/LdQvlJ3tG/fPtgQb8+j504HYuqQHu3xcXdu3Xqck1tW+AwkubGmEvgF0geGfi87Petuyt2UpJsxMTGRl6lOoYOD3dGjbv7+vuDCpHlNSAiVHg4LC42IuIS7m52V8aKkEA4s6E9PewuF8rFlKB8b6BnqJfX6YLv5edk3rsfCwp86Fejjc8LV1dn2iI2xoZGurramhpqWmrq6yiFFBTmwg03rv/vmK1KjsXPnTvh9zF6NpomxPrAStALTISjQLzwkODry8o2Ya+kpSfnZGRUvikCxX/e0EQWYjhZAdn9POxFo7Gzr7mrr6iTdJ/Ar1jgNBPW1tfS2NrU31TTXlIGK04sAkwDK9uBeLjjIhbBwR3sHzHUMsBUsD9LfK+IiTB3WP+mrl5cNDz0vKx1Qjska6OdrbGTAz8+/bsP6FYVbxldaxzC730A5vU1fdnSlL65bRxon6enp4cpfvBCKpZF443pKApGBzMnIfJR//+nDRyWFBM3rKstop2nYLfhDtGUtFSInkQfScHmCwjSNpNNGa4R0LywsQ/kM3R7EG2iA5TdQ/nacfBTsweQYXpwc7Hvb2bRYW1oZ7Nd41CZXnOcRD/tzPo4ifs5iAa4Sfq4SQc4iIfYyKd6XsjzFMhzPZVlfKnO8VGYpV2Op0NhbZ8JRZcXTFqBZE2a7WJMz3VH1buLNxwUaLZmmpUzMWASUf/704dNHkp64ki5JM+I/MpVENDNnfu4toByH96UcGEzO5Ogb8HG4gM111dXlL8EecEOzMtPgfdJWPvC3oqOuYsBMAs0TE64DfkBcgGuysrLgufQe0dX47yuxrMTKlw3AEpSDu7GyskpISABATYwNXZztmVJ+os6IQaQZGVXYU0Fg1D5HXVxtbaz1DutoqKnLSEmLiAhxc3P+tIvoj+/asVNKUhzs1czU+LCutpCQwNatW9euXbt3726QazBuMC1QflLLGhJy2t/f25NqBgSDCB9zJxSY5gXCnGhpaRgaGmKCAXOBnqLCIrATOGBYHRyquro6nFFPphiHaJGHnAXxwrUCfaHVVeSi3bhODWHmndtw9AEaGHduJwDHYYz09Q+D8IMCwocmBatXLl0OC4GNARkCO8T3HnV3JjFxRycLCwumi9Cen376SVJcwkjvsL2ZqYuxYYC+bvRhjVQl6QpVxSfcrM+FeAuV5eLkJC/paHhpqrnq6thqadocUnFTlA9RUczROPRITLBUhK+Kn71a8ECrIheBclO+dkuOTkfOjqOsPYFsvRcPvs0Sevtc4FOH5EKf6CKz7bmkvkLIuMjUsPDMG9HZAdF3/dJ/7VT5uVi5/Sxbmzt/hsKeRC3x2y7WZ53tAklhkrOpiZGkpOSWLVuohw1KvgLlK8LC3yxvfv59Duu/gnJAG+MiLeW0LqW4fbXk1+/atUtOVtrezoaJTpwICgyggg/pKbef5d9rqCijYq21pS9KCp4UPLlPNqMz01MS4+Njrl06T9p+UP17OIBJN0lHq1vxN6KuRcJQEzXikLMXL16MiopKTU29n5dfXVXR0dIIQjQy1E/ynd8Mjg/0A8p72xoaqityMtLgVwYEBLi4uFhZWZiaGuvp6Wqqa6goKQO+lRTlNQ6paKoewhkCu7d+twX27pvVa8BEBAT45OVlD6kqqqkr62hrmhjoW1maw4B5HXM76XsCpAOU6np01MO8nIoXz7vbmgZ6STc4qoZI9cpf93UC7F73dpHM6K5WMjpIFQkRFCkvefn86f3cLCalJ4l2dQHjwBTE5HOyszXQ1dHV1IApxkSEbQs7fzY68grehkkMSg7ozyZdbG7iKsFnBOhzcHBg9ZI24Ux+Ie31R6Gc7HwuQTndLVmzJLtDoZzklRPRhb1796uqqoI9wfO4HB6GrwO1YRZPQkrybUBSViap9nz26D7Ziy4tqq0qJdWtLY093e04U1IWPzo4PzOxompCYt9AyeVNReD4L+/f//XTe1JguTBDlVj++unjLx/fUVgE8wVokiL+2UkKnfNjIzOve16/eDr5IKM24GiXq+VLOaFyEd46MT6MWlGeGhHuCgHWCiGWBhnuOnnOBlWeOjX2VkO+FmOubkf+bjfefl9S9NxzQb0l2mq69MZY4+P5kc4Ps2P4LmJF3s/TZERiZt5/+PThI6NdPr84O7Okok5CQ3O0JggDZwTcX5J1JLoxTIiceA/DsGeviSpvW1VZKXCc7Mqk3sbEu3olkoiRMbkTNEYXci4YrOLypbDQkDMww+ZmJoKCpJUlDXl/uRT/QDLi6vUr5pnOAfzQGIuqqsrhwzqmZoZYsMc9jwFGga3g4Jg2pGexnQ3gWP+wHlxAeTnQcWkhAbLPCaT+duP6Ld9v4ufjMTbSc3Gwd3d2gtUB9WFnZcMEAqbATujq6gJ/PTw8ltA89CxoB+gFlkbgSX9aswNSjFUD7DYyMiJNtJn234621lh6u3/aifn5l6+/Wrd+I7+gwGF9PbA3/BVsCf5zfBzJt0m4GQd+ExsTFRsdQx5jouDcYLHcTU0Gl8KSwSz19TkBU8HPz8soGgrgu7CIgOPng08F+nm7OtoRwRYXJzjWgHIHO3ssfw4OttWrvyaVcRycyvJyRhpqtmrKPkpyadpqdwS5nvBxVorwVooJFksI5cpJJCnLB0mKBqgoHpeXdRHk9+HnuSTAkychWiTMVyHI3STO2yzJ0yjD0aDE2qzD2mTE0mbD3urK0unP2n3+wGgK7+gD7vfN4nNdIu9GJYmQFklJJCK3c8MiC8PiCwMS0x0iM7Wi448Fx2+L1nvsrbPiylNhTTksl+Zhf97dydfd1cXBFnaUj49vw4ZvaciUsnIqRUm9MdoT7g+z8r/9/Jl0Efp286+UnikjpG0k8bG40/y8fPh6skvgaIuLiFsbHhYKRwk0vL68tLWWqJNXlRQRYp6fi6lPxELjokE/zzMCQEAT3CTcs2wmhxQuFWnrdYO0QQAxD7sQDv8QxjozM7Os9EULo363rLNBoHz0VS9oY035SwBleHg4cBzmWgvEQEMNQ+2QKk2QIlsZmhraWhpqqmRDZtumrYDydd+sPbBvP7gJTLeikqysnCRmOd6Mt5HGzVYWmNkebq5gH7BP2XfTi589Jn24+7owaBIk0W/q7yF5kH0E2anudntLPbzv+qpyUuvylJw1Thl0A3yNGZExVyPAmPCx1uZmWmqqsDQ4Nsx+rLpTQf5YHrBn+BcYANgPihRAB8xROEAHDx5kpES/WbNqHb2pNMCy1D77i0rCFSineeUUyvF8x45dcnJyYGf4LqbXIpFYwlFh8cCnSUiIT7mdlJ6WShTN7ucWPX9S8bKYNIVoqoPzAUcEV35ybAgo/J5k+81SwvsbKH83//P7hZ8/LpCYxiJp6QlqvALlsAE0Zs0w36nPH+Y/z88svHn1vqd1+EnufGZSm5djn61RpTR/tShZPI3iXPWiHPWibCBE1SIHm+TYGxXZm9Q56rUPtpiwNVuxdB/j6vJm6w3m6w4V6Loq33zj8HTZhfGGu+9GGt5NDX6YJ51F379bEhj4OD8PKP/4/sP7xXfv5+doHs4XaZRkS5Zm13xcyponaI6TJRrrcCPGxt6ODePWd7W1VpeXFT17zOzKJFyJuAQcB43w8/X2OOaOASTF8zOnia7WyQAfvAIzDH8IXhHVm15p8fWHoXzVuhU9Frq8N27cyMLCQvWODA2JZ+lgb0sEf5wcMKlInb2JEf6krqqmpKAI4gX2LSYiCmjbs+en77/ftHHDuj27d8lIS1pZmh5zdQKDOX7UHdwcbHrDuvXff/+9jIyMvr6+lZUVfFxQacyZa5cvXLl0Hkv4Qvh5rHcfRuLK1+c4kNTMzMTG+gjYMdg6hVfQIzbWg0RVcdXXgHIBIUEDI0NAP4wBCHVsVETCjej4G9E3rkfHxTJijZFX8YiVglcABaShXcINIMali+E4I21tzQMH9oHgw5+G9fLx9iL6+gG+OHKbIxY436Purrj4pKDfwVFVSRmntmoViTZu37aFj5NNQZDPSJDXR4T/oYbKPT625zyslC6UifIWy4o+U1NIlpdK1dVM0laPlZe+JS2eISJQLCpYysdVLcDZLMbfJMHdIM3ZoMDWos3ebMDacYSj3Zm114+jJ4R1PIl/Ipfnc4PsYpvYpyHpxSHx+WGJ+SHxhUGxxdcSn17LfeqRe98k975MbiZHauamXKMLW70F/z0V7mQ9heRj9sEudifcnB1sjuAeHTjAQtNU6Pr9XWCNrvp/Ok/+hcgthfIvQWGlszvNFYWFlJKSAG5ixsB0e3l5nTlzCoiQn5NZXvIclLyyuJBKi8HAXo+LwbwnWZ/eXrSd9pWLFxKuxwC28B4gfs3L4pInD5/m5dxNSYKhvn499vr16ykpKdmZWaUvS5rra2hmBZVMGht6NTLQ11xXBX6E2+/rS5IENAiEqwHM4Uge1tHV19GFpcFzQwM9PALchYWFt2zeihPZuH4DBxs7ZraysqKSkoK4uKiIiIioqChoCHxh2ABAJ2AdJN3j6DHg6b2su411lX2draT9BZNFswLr7c0NzfV1THb5UxwMzuXZw/wH97JxyiAXcDtOnz6NK+PpSfiLNxPSAy/W0dKWk5HF8chKy8CHIC04fE6cDz0HPx3s+F5udm5OVvKtpJioaH9/fxcnZxz8vn0HyH39ellZacXjXoZypp3rr6x8zRd3jRTbfbNm27Zt8OCwwmEeQs6dvnTxPO0gQ9SgIi4R9YLYazgAmJDMjDtPnzwoLiqsq60GlPf3kbzPqfGR2akxsOlfwGE/LAL7CPOdm1qYnsB4N0sav31+N/fz+9lPi9NEg4W8PknjGzPTS3FzJm2RRK7/9mHxb7NTozUV44X3XwZ61bnblGjKVSmJlotyVAqztsnztykyQ54PbKhRjr1Dna9Vm6fbjL/TmqfXlbfXi2s8XHwsUuhtouR4stRAkkxPmvrEyxNDlZHT/QWzwy2fFyY/LE6RI2ToOU2IBJAzEmCLJM2GFKxOvZshyTYfF+ivb2nRE61ipf1IMeaYnd6ZyYnRocGBvt66qsqykuKs9DQYaSBacPBpD4b/wkZaW1uCBeM5bPNxksPnaGlpiRn14487iZP0NUHkZZ71BwdwfBnKV+4vlvrmzVtA5VRUQMwPg3rrYcrr6oLQMDUKCrKy0uISwmKiwhLiolJiohIiwnw8vPCnN2/+bvv2rXt37xHg4QZ3BhujYZMAHy+QGFWVQ3t+2r1jxw/g8LSHPZxIzNyQM6eJHsC1CKZaJ+zkyZMB/r7+fj5Um9DGxpowkgD/0NOng/x9PN1dTE2MwPZojjkcCCo3DwMQceH8zdgo4Pitm0vpkrSYEx751cgIpsLjyvW4a3GxVyOvXDx39hSsiLGhEcjWDz9sowXnMI0aaupkv83IQOWQgpS0GJY+JjauPBiYm5Ojtroay8H9G9aTOOS6tWu2bli7f8MapS0b3X7aniclVCzCXSnM2Swt0CjJVynM/lKE45kIZ74w9wNpsfsyEvfEhR6K8D/iYi/iYC9lZ6viYm0Q5KoX4q4VY6uVOggy0aLL1mnN1eHI1uPN2XuGbSSGd/g253yhyNuXAnPNotMtwvNd4rNtonOtIvh1oVZyoVR6KIN3MJ6v9fTB1mPsJXp7SnS57mmJJhipxTjb+NhauNpaw0fHtdqyZduvkRNaFrK0ild/mc7w7zaEW8lgwS387rvNv1HIZT6LKu1RFwye46FDyqamxvb29t7e3iEhZxMT4vOyM8BKma5mT0igIJ2gGu4TcBzXGtbbysoCxhP+WnxsFN4M2l5X9rK5uqL6ZWHZsydA8/zsjNzM9MyM9Lx7OY8fPaiqJJ5+/3JmxQqU11aWPXp4/+LFcLej7vqGBtra2iARcL4wNY9YWFqYmIJigGVjANOB8sBrQDnOAlAObgKeAqquwlRJAFVxLkJCQniPhJi4pDhQnXRxAx8BKci4c7uusrS3o4WkPxI078YY6CV9MGBjQNMKHj96lJ8HG4bTgf+RmZYC9wLgiLnu7u5uaW2FJX3kyBHi7VpZYF5itQBV8V3S0tJYe1gGfn4+YedDGGGDtAf38zBSb6dcj40LOhno6uyC91MoX/GKVsCaFu6v6HuslBXQV2jZJ+4Xft+8eTNO0NzU7GSAH6NhHUr7Ml+4EHbp0oUrERdiY4h6QWpKMtNi4kFJ8fPGhrr2thaqA042P6fHgdGfGOr6bn6KxJEnSOkjxoq07C8f8NcpwDpT8T9B0xDJdiKj30JyFt8t4hP+tjj7X2/HJl8UzOel1Xg4NFvpVx+SrJUVLBdmqRQ52KrA16rESwdwHGyoVZOnVZe7y4qv3Zaj5zh3lzfr6BXB0ViBtyki4+kiA+mi/XdlZyuchyvPznRnTb4q+zw//PMHguM4TjLmpimUMxnui0s4zog40rRxWgY1NTw4PTI0Ozm8QPIsx+hJkXoosus7MT78ZuhVPyx3VVkpbjQcUFjBc+eCjx1zX4FyWGVQSKLnd8wdz/X09HDNN367adVyF5g/GmBZev9voZzmF9NKgl27dmMuAb5BXzQ1NZWVlTGpRIDfoiKY1MIi/KDiclKSGCIC/HBGQWxBybk42QHzCjKyykoKWDI+xz2pjhVILtwI/HXf/p9ERAWwgmi4JsDHG2+4FnH5OlOnQzjKqUCsaNohhMY3iBTM2eDzZ84Ayo+5upiZmArw8ePraNsTLE/S/fHMKZB6IDigPCkhjpG9uwr4xvRj2l5fZtpeX4mOIph+PjT4hJcn1iCoDPyJH7aTID4MAwALPJKTnWP//v1btn2/ecsmFhZGbfGwDugtvvqIhfkhRQX4BJu+/W7tV1+t+9P/PbDqTzYHdodxHSiQES4V5qgS4WiU4sKoEj1YIXzgpfDBYmH2ElGeFyJ8L4R4XvJxFXOwlrGxVrCxVXOyNwpwNwhw1wlz1kqwtKhytupwdJnzdNlx9h3n6Q/gIvPwBv+7fOmFAvGPFbLvqqQ/NSh8rJf/WCX3sUL+U4nixwfKw9dFhy9LNHtyNzgKPNfnfqQrnKIlGaGvesnJztPGytrMWF5WDmcE2/zVymYYUy/yRURk1W8EOf5NKF+q9mSgfKmx5/IGGumputzFBtAAJgs64Orq6ufjGxZ6HgSZqJPnZBY+yHv+MP9+ZnrOnZREIrN16eypk+5uLgb6hxUVFTHhcHvghMLqwlEFjaVFNKSVREMtMB2jqbaqsYZ0fqAKVj3tza97OkCHRwdJgAUDUF5ZWgICC9pra28HKDc0NHSws4eLh8kHEoEnLs6O4Av4LisLSwMDPUxx8COsjW83bMRkVZCXBfuGPVdUlIebCUCXlpaUl5fFZZWWlBIVFZaTIw4mgA9zt/jZ47a66sHujje9XW9IoXl7V2sTcLykuADmBEwWNgynf/XyJdLvMYT0FAWbwKoGdhsZGZB0HSsre3tboLm1pZWBnj6z3a+OpU73goCn8TdiQOfhvIPdFz55mHEnNelmPKjQMfej8JF/+uknkvZLY+XLLWlWsll+sz2ydMtXf9lOF5Cwfv1Gdk4OHR0dX19vulEBKGfQnBBz3AsK5TiX7KwMUPKqyvKuznbw0Lmpt4vT09PjI2/BS5msofam+qa6apjSmgqiConH5obqzpYGWLiRoX7SVPPdHC33JyGX92QjlKaUEHZM6uCnFwb6PrY1VFwMrvdxzVcQeSbCXSLAVsp/sFqErU6SvUWRp0WFjGZl7lpZ1lrZg41q7I1arG0WnC32bK8CBAbO8kzEiUzcEpzPlZjNF5/IFx19ID1dajr40n2w9sqrpux3U90/vxt/N7vkLuAAVspNYV0olBPVw8lRMAPMJbKh3dzYWFkGm026ANJNgo7Wwf6e4dd9M3Sfdnri7dgwKAX+VAL/Ky8Ht+xq5KVgEhL3JoFaNxcgONFf9fbCIPl5BgagCBs2freydfFHW0/8jpVTDfrVy23TGbnB7w4ePAjqoQQerqAgKSnNyyfAzc3Lw8PDz8+LaQw+qywvJykqcvDAPqzZTZs2AeNAxo30DmNoqmuAzrs7u5A+rgG+x4+6UjVK2AAMHW1NYPRJ3xPBQQFnTwVhesfHXEuKj4u6EoGZee70KfzJzdXR1cXhhNex82dPR4SHhp8jlwPobqhvICosAna/Z89PAAoTExNcGUA2yYVNSqByK8kJN8DnMPGirkVg+eBJTOzVa1Gkyy6YDVxVMzMznBcvL+++PXtJB3pmf4im3zKx36UkPFiLrVu3cnKyy8pI4aTcnZ3gFthbWyhISe3bvm3bV3+W2LwhUlE6V1HipYJIq4pIm6JAnSRrvQw7nWath/ibFPlKBQ+UCbBVCHAwQRWhFhHhOh6eGg7OWi6OWh72emHOOnH2JiUuTMXWw+xNRgfabFnbXFh6/Tj7gtmHIrkHY7nfJPIMJHGN3OEfTubriWbtvsLacu5Akx/LC9udz832PNDZl6/L88xaKc9aI8laL8zK6KyLg/uRI9rqGtycXCRKzpzLl7156R7JcmAN577unyVB/XMo//kXR0dHUrX1WygnrJzJY6EibQBHIFSAn//5EJIUcSv+RlZaSn723YfZGXhMS07EXY+9GnHlYlhQIGmJffiwjqy8nLyiAu4rbDjQBHj1OD+3qrSksaZiWZmokgjAN9R2NTVgdfV1tmKZ4ZG0T33VOzb0epJksJHlV1VekpOdCUcPnBdrBg7XUTd30AdMSpLBSgoGyOYPoNDFydnmiBUIOLgt7jpsNQ83J6BcS1Md1FtdXVX1kDKGpoaajo6WtqaWihKojaSUlASsjpeXF8gI3AsYmKGujuH+zoHu1v6utk7Sgq6qsOBx/r28pMRbcXExYWGhoCr4UqxqWBHYQjuYkSNWeHRycCSL/MRxqgmDPwLTMcBT8CKoyo3r0XdTk4sKHlWUFpWWFBQ9fQRv5vbNm6A5OAOwkh07dhAJrb+s+jubvATlDJovQTkTTl3KRV2KoZN2Xuv37jsA1/vEiRMUypnoShjtHA8SFBdL1CjTUu/k5mS9KClqqKl+1dM9MjgwP00CERNv3oz093Y0N9RXlb8sKoDJgQ17fD//fv49jOdPH5WVPG+qr2pvqSc94QhKkm4sNID+cVlLFlBOXpmbeT/Y80tTZfVZ31ZXq6eSPM/5WMr4DpYLHMBqqZViJQtMlbv5EFeLCledHEut/IEGddZ67YOtluzNDiy9J7n7znFO3BAeT+KfvSc2+1Dk7UPBicdis2U6Q8XWgxWnXtXe+jjR+PPc8Me5cabgfnolq518O5HHAtceg4c3/Lq3p5Psc1SXv2Q2OPKePMgjwaWCZ7gCeJH2IxwBgRgZoj2m4RqCWJS9KHz6KC81+eb1uCj4N+fOnmEypknJeFBgAOgqGADmHuYkHL5Nm75fWXj/Gyj/NWj2hcwWBhYwLD0nJycHB8fBg6w7d+3euRMv7AFp5eLikISbKSbCynJgy/ebwGq3bdsmIiyor6frZGdrf8QaTzDlwYGC/P2A175eHqTfsTbJG5CVkwRnNzTQw3w+E+gPKMdCuBkbhZPGYg87dxbYHejn7e7mRFK//H0uhJ4FlIcGn8EaxIfD+1SQk4c5ERDgk5WVtbAww5IHWN+Kj6M4fjs5IeXWTRJjYYQkqQ5S3PWoqOgrYOi4pB4eHuDysIXbt28nxaikz9xqBs1X0z0hCmGrqCIs6ZEB1/M7GCo9ba3jR91hVE56eVrqaEvs+0lp84ZbitJP5UQrZATalATbFPnrZVjr5Vlb1bja1LnbNQDoYOj7q0VYqgXYavg5mkT5m0SEq3l5Krl5Kjk5qrk56oW46yW4QDKaVdhbdbha9NnbLTk67LheeQq88uEdDhZ8Eyo4GiE8Gikyfk1iNEK8P5ivJ4iv1Zun3p2/0ILzsTFfuhZ/gqZIsrn6davDF60Mg45Y+Ls6OVsfUZRX2Lt3P6kgW+4U9hsoX0WV1FZTKP8DrPw/fwfl36z5MsCy6uu1yy37vqFQDqgCEkVeunjrRmxackJW2u3MO7duJ1xndjgvXw4PIxrEp4N8fUjtrKGhvooqaRoHbujs7Ajgi4mOTCU9BO6C4zx7dJ9U5ZS/rGeKJHtaGl93tg31dIIFj77qA4JPDg9PjpI6Q3Bz0EMsp4y7aYGBAQ4ODkeOELgMOhkIYw5sgh8QceE85hZmWyhpd0XEd0jwjl8QZ7t9K5nNh1SUjAz1TU3BmA0xX02MDS0tTGxtLG2tLPGrhoaGvLy8soqqk5MTiDYWOSjbQGfLyKsujIHezo7m+obqCkAYoPx2UvKNG3HwtX18fOzt7U1NTeEEgIxjVRx1cTwV4MvodoVhggI9qX46pjWOCpBKeUpuZnrhY5LDDjR8WfwMH5tx5zYmPSa0m4srTMvWrd//Kq+zJLHE0PAv5JZWmPgKxC9vVlN14rWbv98K78PFxQVAEx4WChN79fKF6MgrsdeuUhxPukW0iAHQ1eVloN5D/T2ALlx5AHpTXW11aemDnJz0lNs3rsdGR10l/YauRDJtK6JgyRJu3khPA6NPf/nieV1VOfDxdU8nEJOJycx+/jBP8rs/LPzHz+//88P856Ge/2oqe+xkWqQtXyYvUCPF2yon0CzH26bM16rE3azM2aTC2ajMVq9wEKNWYX+LNnuTPlunDWe7K9urU3z9IVzD0XzDN3lJKth9obkC0Znn4jPFyuNFBq8KHLuehy68Ll4c7fgwPQpKTqPzZJ92cXZhcmwGEN7d3tnWWFnxorS48Mnj+zBFpKFEYgI5qSuXIyMjoq5ei4uLI3XIWRmP8vNqKspbG+vA0EcH+0cHezEBmuuqKl48J73i7qYBgOCPXQgjdxYuDq7q5XDimYGowooDyL799ltGKXD1HyrZX/2PBPC+3A5d9dsyorVrSMLDilIHbVSyceNGTg42djYWzHmQGLwNnAA8HfPcw835hIe7vR1Bc2sriwCSFhzo73cCzoSxkYGZqaGBvg6RlFBRIgnm7q5wM4HmZKXH30i8EYuZExpCOoLiNH19jtOsduA73uPt6YEThxnT0z0MV4F0cpeSPmJtifeQrOWb14HgSbfiKZRjkt+Mv465h0dMv6Tkmxi3Em+CpGN14MDkZKV37djJSHStXs68WKprX2nDgr9iXcO04UU8YTlACgBP+njFXroQHRzkbajrKcqXr6WSL8BRzHOwVpitXoK9U5W/Q5O3S0+gy4C/x0iw11C4T0+4R0OkTpKjWpjjOce+Il6OKgnRMhGhZ5xsJZwslXzslYJsDdKcjXLsQP8Wbc5mPfYWQ44mI5YGkwN1pnurzXfXWO2tNP+pWG97kc62pxrbnmjvKjLlKrAUe2qvkm+nmWCudtFEPdLR6pK7fYi7Y4Cbs4u9ja6mFhsbB4w95ce/70DAQPmqL1j5H8hg+dt/LkE5kBFTcAnKl8gdgfJVy53dAfTi4uJAK1xxQCcIeEZyYkZqYlpyPG40WB5eB7b6+/qBHxOuegzOhBXQXF1TgyY5wQm9dPE87i7ZsE5Nysy4k3cvp7CANDKupdnNjXXdzQ0rUP52ZIRC+djQK5D0ypdFedkZ50PPeXkSrRWw3bBQ0pCI5DMxJcu0WwosSnjIOXAlHCoOGBYeDAWU3ED/MCaKvZ0NrBF5csTa2cmOpKY6kToxfX19VVVVTS2YHGeg3hMGygd72sYHe8liHujram1sqa+B7Xny4OHdtHTMwoiIS6dPnyYqtTAGxkamTL+eAB+vy2EhhM7ERWPW0s16fCDTjO0sDg0v3k1JevYwr7ToWUNtRV01SZDA16WnJMF/h7XDjZCRkSEJp6tXr2gyrEA51WT4Mtjym2JfBj6oFAZehBMnICBgbW0NwxZyLhigwwhbk4RoXDQgV2pK8oP7eUXPnpLex23No696MQZ6uzpbW0oKnz/Mu5d0M/7a1Suwl+dguJgfPAkJIV3laLVhws043MRnjx5WlZXiQ0B7p8beAM0plOPxv375+F+fFn8Z6v2vppeP7Q1LNGUqZfnqpXng87Yq8TIOL1fzIY4WVc4GZZYGJdZ6pYN1KgdadNkaDVlBgtpdWfuDeMHK31zjH7rBO50pOpUnPP9MbL5AfLZQ4e0zrcEnFr1P/T/0PV540/RplhSjflxcoGKNH2bevn0zgJkDF7C8rOTxo/z8vFxgcWrq7eswTteiMH/OnglmFEJO49RwUjcY0XzgffmLkq42EuWDW4bR0UhaPoF85GVnAXfiYmJpz2tcnGjSMTn84vlzYLiYWgL8vBs2bFgJfP37uSv/TZe4L7Q4lip7mQrSFQEm/PUvX3+1dv263bt3/bB9KxY50xx54759+0hrPTtr4Dg49fGjrmAwOE6mf4W/n6+Xq4sT5r+dLbxJKz09XXV1dbIzb2PNcPOTIGcUynGaWHqkEZ23Z4C/N9UcvxB6Hp+Bd5LGFHb2hvoGMjJSrKwHhQWFsMTOnQ6Mi4LvHpeccAPzBGiOJxTKMfeo9lzaneSMu6l300kmbnxsFP7F3dkJq3X/3n3g4zTAuyw1tWqlmdbS829IvGUVk7wPi6UgI+3paH895NRN/+NRhlpFBjr3ediKuQ6Ad8P561ITatfg6zgs0KEv0G0kiNFjKNKpJVQtxVEmxvWEly1PkOeBtFiOqECuEM9jIZ4iYZ5SUc5qKa4GWa7WQ/ytajzt2nxtOrxNWlwNupx1ehxVBlw1pnwVRryFmizP1FkeqrI90OF9YCp9x1guwVydFOgfMQqwMDrt5nDK09XvqNsxF0dQSTExsa3/P3tfAV7llW59/zszhRCBBNdSXKKQBAgSNCHEE+Lu7p4Qd3d3d3dXoiSBAAluBQqVmem1uTLz91/72+ccAu102v5zO3PvzHm+h56kOckne693rb3fd72bt7KrQN5dC4nETPYqB8qBvdyrVv+IDJY/fPN/P4TyZR2Jlu2f8vCt5hcXFzc00ANkg9kh2JYX5ZUW5BRkp2MoAykgNr2Zl7+/f0BAAMDU29vT1dWZbP3p6hoYGFhamnM6k1HJD5gDOaqpKG2ur+lobujtaO3vagdiPlm88+bTZ5+/Ih5PpGTj1TOg+a0bkwM9nYUFOYzld3RiYmJREemiACghfXkaaptqK+sqS4GJiBb4ATALGRmZw4cPHz8mwQhMMw93ZwxEsuTB9A/EOA4M8AVjxU+C6QOO9fQNPTw8khLj+7rbFmauv3py782nj9++fPbZi6cPF28vLszPTo1Pjl3v68FkbwMnxaCERnF3d8fH7Wxsict+RGhhTgYxI6yuaKytItVr5SV0BEOe11SWdLY09HW2jg32jo8OXB8e6O/rAklsqKmmoImbY2hoCPxdv379Ks4+GLtMn1C9VVx0MXyZ2ORdnsBERj8bPvBZYv+voUHcboMC4qMjiD9RdiYIdVFBYWUlCaXg1KSH5+156KGn9xYe3pkjTr5traWFRZDV+JS3pxduGJOT40G6c3l5+fh40ebu+L8IUbjVKQmJFSWluN6J0SGwe9yxr798TVeuf/+7fwYr/+bzl9/cneq00SdQfkFs+pwIcHxeFiDO4LgyKce4qSSIN6A/C1eFF/XE7hiL3Lc9sugk9Nhf7GGI8OM40ccpQp+VHv+sSvKrppNfNp94XS/1ovrsYumV+QrLf7/X+PXTmf/8+s1//AvLLeCrN6+A4xgzIApACgwVqIoE6Ea8oqKB4MH+1+iKHHFztbCAurJzsPfx8QkLC8vOzCorKe3paAcTB4g/uD3z4PYsqR4YHRrs7aEdJwBGBTlEjOZlpqUlxuHeeru7QOqBFJOCAPbCFxW1P74h3IcNK1huDWyTFlaSIvv3U3KHscG7mm/Dhg0c9rp6Nf+ePXtkLl0ARwYrh14M8APJIsU1gOPQsMDgENLAHkDv6GDDWMYThg5yra+rZ2NlDU6G5ws4ppkntAqEWqmApDNdIUOvgaC5ONtbg/cbycpcPHDgADifiJAw/mJkaFBmCvElz8vKxKjDHUMULC0pwnwAgpN6/doq6okIjQ6l3lBdTvIHUhLxCzVUVcDNCZqv4uEssPAwTnIU1nnYL1rzjJsAISItdcxBTyvOzjJTT71PR71FQqRX9OCA8N6hI/vmLxy5cVnsxhXRGXnhaUWhGSXhOSWxWfmjYxdEh2WO9Sueb1S6XK+hWqYq36anMair1q90aeyK9LD0kfFTIpOnhKZOC06dFZo6LzwsfXDwwsEBedEeFclBg4sDhjJdOhe6DS73W6p12Wm1upvl2xmnO1kmutpHujsGODv4ujp5ODtYmBiSgiwJye3btzOGwFSxvWPlrG5wy/ZIODH7B7ee+IZgOYVyPIN3MMFeLn9XOM67WkhIBLiAyJwUR2rBAU9MgX4a6B4oZxjmR2gwWFtUVFQ0XlERUGQhoQEurixrFENDffB0uv3t6GjPgEtUfjbpsUmci8tL6qvKm+uqJ0YGb8/NQOkDzWmh4NvXpOB7aYGYYAD0MZEQ0kuKCyGH21qbwWqH+7oRBkB1WxtqGmsqMfIgDDFLL8vIioqKMrm0huAjEJTEejDoGu0aFRUZGhsTAcoc4O8HOLaxs8VkBtHOzkobGey5Mz9FutW8fPr60yevnz95tHSH2mnNTk2OjwxDqmMU1lZWgOFifPv6+nq6ewAdILTzMlMB5Q3VFc0N1U31VRivtIytsaaivaluqLd9pJ90hSbW54DM1uba2urK0hIM94T4WIQZ3OH9+/evXiPwLSjn40A5h60vh3LymJYxNfp+48aNcnJyuOe427QAmjHBKKgoLyVLK+3N0EO0ofaju/OL81PzkyNdrY311VVpKal4fDgfR3s8LjuID6A5rhFoziRbutCuWgD0kODAmIjI3Mys8uKivq72ybHR54/uf/7q6W8+f0ksrv75t7//519/8/bTb+7OdNoZDqldGL90ZPqc8JyMKAPlQvOKQgyIC80rC95UEbqlLgQlu2hw5B2U+x15GCT2NPoI0PxNntTbEqkvq05+WXPqdanUp8Vn7+Vevl1q8e93a//5ydR/MVBOS5nAA3AaGEuQHdnZ2Qj8wSFhQUEhgWDggUH+fteAQW5OjtT/DzwDbEPf0ABjwNPTE2ifmZ5RW1PV2dY4NTZw+8b4fZalLWkjhftWCWbPeOaQYjeAT3wMnrubq6OqitLePbsolLNTBn4clHPaMX4bylctM2bgQDn7S5IuTLr5rOZjWc7SpTfe1Vu3bpc6foJWGmMK+HmBwRASExYaCImMaevn62lvZwUoxzeJAYaNlakxabZjaW6Bp49hA8FNbV5AvBIS4gDoyUnERBfRC1DOmAS4mhnpX5G5dPDAPkYKrBEVFrG0MMM9yUpNzE5Pw9jGqKM+B4By4HhdVTnmaQtjiAgcBw/DfCEdegtzC7IzEqOj/Tw8Th6T3LRh8/JMLUaLcNP1Q9olcSV5rWKXpq/aJCAguGP7ZcGDDlKSNRoq1aeONR870iou1HlcZERGaujysUGFYwNKx4dUjg+rHcMxqnKyR/54u+LZOjW5LFXFDD2tJJ2rKVrKuRqKJYoyrUoXuy9KjUhLXD8pNiYlcv202Kj0kf7zRztlxNuUT1eqSFdoXS7Rli/QuVKkq1JirpNvpZfrbBVrbxXp7hzi7uLv4eoJ6upIKhkxB6FUdmzbztITLMXGkhrfhvJ3TPqHQ/l/fUPaCNEMFlq4z8mCYKCBrW5IixDuTz7ZfenSJcxq4CCzspGCIIoDgTcjPRkISJfA8MwQhKG+QTNpz0PinGlrDUA3xTAxMQGoGxjo4Ttebq4RQUEQa7GRESD2ibEx4Psg6V2tTcAXyNsvP/uUVH6/ffnFm09fvSBdC27emAL6jA31g21Njg3PTIzdmBidnRybGOwb7u4A50UwAJRTNwyZi5eOiIqBleDqoC6TGMMKSMXM1CQMTcbhlpQRZ6SnYoxGkW70UeAOzU118zcmnj5YhBSgRY+A8qf375N6/aU7DxZvU1+tibHBob5uAHpZaSHuRkRYOMZ9SLA/2AqYRRFDwytKC2rKi1vqq3FiAPHJ4d7p0X5AeUtjDXRlMemglJefnwtyh0+B4Nvb2cjLy2/ZsoXoZW4+mrfAMqFnGyrQMsJvrZ9SpzuW6zHdsiZlory8x44dM9DTx5SLCgtm1i5zAVKNDXUQBKCZd2/OgpIjbgGnBnvIDUSERiC85usH4Ux2ay3McFaMZQ1ph4jZjhjp6EAWppzt7ajMCgoITIxPAPwhQrQ1Nc/PTD+4ewt37+3zJ1+9evHbz1784fWzb+7O9jhbjGpfHpeVnL4geuOi8OwloQUFETDxu+pit9VFQcZxECjXFLqpI3xT//Ato4Nz5vvuuYkseQnd8xdeChZ8EkMA/XGCyIME4btRgneixO8kyc7lmPxhqel3L2b/4zevf/dPTNujX3/xjLFPaW9uAnaAW0Amuri4uLm4QmEgIOEqMM1cHOxxFeCPenp66urqqupqmtoaZmZmiOsMhCUV5Ge3NtUOdLfTXXribTs/3UOL4KrKq8uKS/IJlCfFRoUGBlhZmkufPoPYCeaI+cK1YhWnWPontGn+nnV2TqjmlJDw8fBuBWZv38rPv5om8HH8W9byrxMSEjp//qyiwhVdHQ0zU0OEHMAvSExKcjyxb2OswHFDAgKuQUlDpCJUg2kBg/C4AwP94+OIoRVGBSY4pjztHZqaGBcTSfr7eLg4GhsZnD4ltfuTXTgNUM41AvyQlYiRCTGR+VmYZaS0Oy83s6gwF8Ge6ShbTSxtmfY1mK3AdHozMSEgYStKiotzczGD9DU1BQ8JMZsBLJpCySzj+cx46tKFJs4B7rKSi/cXv9z8q4/O7dgWdOFsoYp8haJc8UXp4ounc89I5p6TLLosVXTlZIny6XKVUxWqp2vVL3Waa7ZYGzQ4WafZmKU4Oya5OSU4WCdZmWQa6zWYGbRrKQ8qXmg9eqhD7FD3CdGOc8cHNOW7ja72OpmW2xgVOpjnOlrnuNvleThneTmneDhFuTkGujh6Otq7EJNdcyNDfRVlxZMnT0KsbNqwEQ91JeOaROu32Xycj+NgSPY5ufg4qvrHQTll5f/5n/9uY2NFF1g4HUwolLNCIgPlCJLi4uLm5uZ43gjOgO/8vCy6elCQT9bCQFWqykjXStLmLT8XaJ6WmkgKmv39MFwwRJydHe3s7IDmTMaeNpiCk52tuzOpmvNwcYWWD/QPyMxIg/iavj4Msf/rz57/5vPXX33+ioHyx58+fQQwXVyYvzU7fXNmktqCA8pvjA2P9nb1tDcDNDEsEFrA9zFRL56/AIJwWfYSwCjE3zcjOYH2mC4tyK0qLapjJF5DDWlLB75AWQNYf39P+51bN54/uoe/SLy8Xz17+/I5sU1/eI90wLm/+GiJdJO5OTMxNTbc2UoSzHNziHcY5j8mCfgO+AjGekZKYm5WanFBNpRjR3Pt+HDv3MQw0Lyvm1mcycvJzExPT0/NyADfIXWh+KypidGZM2fWriXG8Su42dnEDDGnbnkspzTOmhr3+25qTCeX5R2F8E1IbIUr8l5upEMm9fBqqqvFaY+TPKJxxv1xfn56bHJ0sL2lHnQJ0xtBBWCNuGtMGgSb4L2HuzNYG3mITIkdwjCGKkFzJwdMeJDcmKjopKSkooLC2uoaEHOybfhw6fWTh1++fA4o//1nL765d6vbw3bEUHlY7vjExSMzF0VnLglSKAeO39YQoTg+pya4HMpvmh247yxy3130ga/oA3/Rp6GST8MknoRLPA4TXww6ejtI6k6c6mym9e/vdfzby5uA8n/7mnQW/e0Xbx6QXt4T9XU1eXl5oaGhkE0ODqRnr5ODI84Zl4BRh1CEK0GsQqgDlCsoySsqK2hpaVlZEULKeCDHVVWWtjTg2fWDLizemgU3H+nv7u/CraoBiwSU52elI0b6eHtqaWlQuwXiPr1i5cqPuH4ClH/AuL+3/+c7Is+/es3+vfv27NklILCG4XfLoVyAgfLztLxZQ1PV3MIYwA3RjAdNuoAClCPCQ0iLn2DSri0kCPDtx1QDYdri+wB9jOSS/Bw60/EvyQ1PjIsMC/R0ddLSVDtxXJK0bObhJQGMi1TPnzp1CjcQ7KSYsegAmgMoSO+38rJmNhNva6xrqq2iOF7P+CMSJz6mBwAIVl5mmpOtlaT4Mda+Lhv+OBuhzIYQHw87q4f+L96VPNy/WsHzD/+46Rf/eIx/zaV1axTX8svxrcIhw/0rWZ6PLq9eKbdmhdxaLqX1q4z3b3OWPBymdDHBQDPDyTrcwSbGzzvW3zfc0y3KzTnKxjLd3ChPQ7lJVb7qpHjdSYnG86fLZc6WqCvk6qnl2Zol21smujnFe7jE+3rG+XpHensEurt6Oto5WJEepBhFYOLSZ04JCwpt27aNxFcuIihY7XlpS17GFniZ3w7Z6vzpUE5LhP7zP35nzXiwcKCcNnpnF4JzffTRRyt+tRJf7t69W01NDRwtLioc9BYCkyaNVpQUEhfy+hoQ6p72FjwthF8EYQB6OrQ6oecJiUmxoL0YLc7OzkZGBqqqypg/uto6iOpmTCcqKysre3v7kJAQDDLg8uz40Ksn92hBCoj5l0wXGwjnNy+fP3m4eP/OTWL8Mj3e39XW3lRHmo+U5BfmEfvmhBjih4k5evrkKcFDhy9dPE+hPDcjtbwor6m2srWhBr8fH7w+1Dc+PEBbLfd2tvV3d5AFh/npZ4/v0ZY3L54+AKCDYBJ/3XukSTTFPtLpjSjuCWKC2NmKUZiTnhLsf42uvRK/UFdHstEfEhAXG1leXAAajjsOKMcfBV6mpCRFRob7+/v7+HmHMP5itPiCVD8fJv6oGKsr2b23WVDObg73TogBzbn4vhMCOLv/+Hl+/rXHJCQtTEz9vDxT4+PzMzMxhfCYpsaGaCbo3Mz4YB+xi8J54u7hnHHyCCra2pqGhvrWVhYAPk8vV28fd5p5acfk7wPKgYMuziQ9JjgwKDI8Ii4mNjU5Bcqst6djYnwEYQ/37bdvXv3rV59/80+//ublw/G44BvuloOqZ8fkjk1cEpm8eHju8uFZ+cOUks9fPUxwXIPkrtw1ErttJHzHVPC2uSAxM7ITWnIWXnQRuuskdMdReN7m4A3rQ5M2ImNOJ25GG8xke/7fJ9f/6/MH//LFi3/6grQTevPsMWI8pBugAfEyKCjAy8sDp21nY0vQ3NGegXIHV0c7DAywJ2NDo6tXryoqysvKXpKXl9PR1rQ0NQFOBQX6p6clgaPg5uAW3Z6bhnyZGx+dHBroaWlqrqsqLcgBGpI29rZ2Z8+e3bRpEzNRVwHKae+nn7btyWFnHxT9L9/EoihGM5HXCawFlO/YvnXtWn7ajJflRb6Ke+P6DXj64IbaWhr6emRz3tzc1N3NBcIaUEuaO6cyO7dJCdQdDFM1KTEWgxYSlrZRBo4XZGdUlhRWlRaWFBAFCTJub2elcVXl3NlTBw/sWbeWn14vp68swgYkKmYEPgUQAEPC0CJd32oqIWg6WhoRCdub6huYluWVpUWg5Ezhfh4Ag/RywV/JTHNzssf8Xb2an3WxDFgv70m/ZdPmffv27d69d9PmrWvWkD4tOA1erlW8K7j4fvmLjb/6FQB96y/+z/Zf/COObf/IvPnlP+z45S92/Or/7PjVP3yy8hdHNghcET6kc/akuaqipZ6OHViLjaWHg52/m2u0l0e8i2OalWmdnUWzqUG7qX6rpXGxqV6OjWmCnUWSl2uMl1uoh3uQp3uAp7svdKq1tZmRvoaqCogjTvvo0aO79uymVmXv9jaZF24R27qW+1tQ/i6EU0H+k6DcyuIDKGcttjCPZwVev1qJ93Tt1d7aKjI0KDWRdOHBA6CxmkJ5b0frUG8X/u1oaQaag6RjJjBmcqSTLARaSnIiYMvCwkxLR1NDQwPaFuwPgQSywN7eFpTJz88vIT4W0Rs4++zh3c9fPQUrp858pAzvzavPXz1/+oBAOWQvuGRzQ3VNeQmCClQCNGNSYnxEeGigny/A6LjkMQzx8+ekbW2sAv28s9NIKiRmIIYRoHy4u2NqeODG2Mj0yNDEyACYF1j2nfkb9xdvEQR//gTHy2eEmL969gg4fv/OrQUSPCaAgLTh0dz42GgvOFpbTXkx2FnQNR9AAxAQWADZDo0JNAfTwR1oqq8aGewZBQI01BYXFwLHcZkIaXYOtq7uLiBBiAEIZufPntuyZRvBYm5mWZxu9fCt4fQMouVahKq8D+XsXNR3UE7VKB00B/btV1dVg0yJi4jA1IUcQfDD9c6Mj4Bsjo8OdLUTbYF7CH3g5+sJqqqvp4ULMWIsJHFuHp4uQHNAAKnDIvuEZoByZoHFISjQD9cIVp4YT+AgNze7q7ttbHTw0T3imgso/+cv3nzzL19/8/bFZHbijTDPbn35YTXpsSsS4zKHZ68IzikI3lYXvqUpNK9BcPymluCs1sE7hsK3jQTvmhA0X7QSWbIWXbIVuWd3ZNFGbNFSfM5YZMb4yJT16WEnuZuJTjMFkX94Mf/7L58yUP4pBszrp/fxjEYGeivKiyF6ECwB5RhdgHKy7u9gh4AEpACUO9hbY+RjqGhpaNI+ljKXLiCgGuvr4AfATDGcMG6bGmv7utqh/27PTFKvIUA5xFZhTiZmARioqbGJqKgonhXz1EjHCVre9WPXylnwvZKXHMugfHkaAjVKomyUQjmo966dn2zcsG7D+rUCzIufn2A6WXjZvOXM6ZMG+rpWjMcAhImbmwuiL9hDYmwU6QKaSHJ5GSOH9JzszOysDEQvzCPaj422gS5i0q4qivMx3+OiIjG2L5w/+8mu7WvWgF6sAN5woByvjz/+WPuqemJsDGYEGF5ZaTE0OvAaOE7bbAHH25rr6Po4QIOQ8ZJCsutQkEdyWkqKS4gNXwqezplTpzlQzt7gZe307tzxsdyli6Tm1tgEiHTkyJEd27YLrOGn+6LcK1byfLSSd8UKHAI8PGtXcfOv5FqzahU/Nzfer+PmWcvNhfizbhXXJj7ej9evFdm/9+QxSTx6ZaYXtoWJMQDd197O19Q4ykgvUlM1Tks1RudqsL5miI25n72Vv7sT4NuFkBpLcHDwUQUFBehpYWHSaQ/3n3c1U8DJVkicHEqyTk48bN/bg6RJOBRsOQtrLGn9oxrC/eEPfwCUg0hu2LDh3ZYaExPon6H+uewCcbL2qq+t4+vpERkalhwfl5qYBBZMCsMyM/AM8KiG+7qAEdPXR4YZ227ABFmFaKiuJb63pDkI8f9zc8E0cnR09Pb2Dgi4FhoWGBkREhUVEQFZGxkRFxeH+IxHfn9x/u3rp//0mze//erNZ5+SNWugw5P7d5m+yVM9Ha0I9UBw4g3r74fp6uHhBqkLyQ+Gq6mhLnRYcMuWLSeljjPNCV3xYxigOMmKoiKcCwRyG6ZoW8vM6DCVzwDrJ/cXgePEyev5E0LMXzx59fIZ6Pn8zOTE6BB1Cqtj7JVJX57G+o4GohNBWzIS4nw9iNvnpUsXLp6/oKQojzFBfMcCAoBuNdXlba0NECv5eTlAB+A45L6RibGmthY5SJMtJWlp6R07dtCxSz0Zlpd90xyG97NWvp/ZsTQ4hv5a/nWS4hLgZSDmkcHBUCeVZYV4LrTWtLujua66rLoCajgtMSHG3c2J9ojR09OhSUe+TL6KNy13smVa5dqYg5KTIm9v98AA34jwYErr8pkEx7bW5sHerjtMXwuyd/3Zy3/9/M3v37765um9bxauLyUG3fOzmdaTvXH15ITsoYnL++9oit7RE71jKLpkKLagL7ygL3jb4PCCIesAoOPAm1sGgvO6wnNaIv3y+7tUhG55at0Is/uP603/enf8m69fffNvXxEnlt9+Dih/8XhpZnK4v6+zrLwoOzszKioqODjQxcUJII65h7iOgITzd7a3QdCytiJbOFpaGpjGEHDU4MFAR9vBxhq3KyYinFQ1lxfjuSP8D3a2gQF0tzWDSOJ+xUeFQ/8B2i7LyG7YsImjn2il9E/LYPnRB1l54Nm4dt2WzRs/3rFt3569hw4dAl3FyAclP3TgoKzMRXMzI2cnO+ZJhRJP89jo6OhIvIfsCA0MCLrmx6RyeeNLYpwbEwE0z85KLSzILinMgdJFxCpk2hWBD11VV92/fz9JuORht8dYycX1S0A5uWQMWYQ0xHhwefw84dpFBaSiuKoc8I3pAyrTWFdZU1lCW09g/uJNBSHvBWWlwP1CvGccVVMcbCyljp8gxmScTVwSvQgCgo8ry1+JjQgZ7GnraG4A+Fzz9tLT0ZWXu4JxvmfX7jV8q1k1olyr+Fax9vw4B+mgRN+v5GJ1cuHhxUcQCTZv3IQ7JiYiCtCQOXtWQ/6KiaKCjaqynZqSrZqSiZqinpqitrqyurKCotwVEC8pKSkREZFDhwR37mQhOKc1xAcpCX8MlH9i2cEfg/Lf//t3QDnH64OtDqim4z1w4ABumbO9Q4CvX3R4RGxkVFRYOBnxSYlAc5A7sHIgI6AWJHdsuG90qHeot7OzpQHMtBiYl5IYGhLkDcBl0haJw21sJFgAabYJOpBCutYnJSWBujY31S3ennvz6gmg/OvffkEXOl48vv9o6fbC/PSNyettTfWlJQUx0STdFXTDysbS2pZQe7ILb2IEpfPJJ5+sXbtW/KgYUBUkKyIkkGZAZqen4VQxOkEHGmuIFeLYYN8dxied9C1icBx8/NXzZy+eP3729OGTB/cnx0b7ejvLy0vBXDIzyKZ8ZWlJdWkp0YZF+cQXPyrcxcEWfPwMMQU4rSivYGigBxwMDg7Oy8uhUN7UWI+Pg71eu3YNlNzCwsLIyEhFRQVk8MSJYwcPHsQMYW2DMJ4MHDMmVsYVg+8/Acox2z/evlP69BlQM0APLh9CisyupnrSCgcEqaoU4J6TmYJn4ebqSJaP9XURlgB8uAREx2sMkLs4OePeWlmb2dpYUC/JkGD/sNDA6KgwWj6Kp1ZZUdbZ0YIovjA383Dx9mcvnn7+6sXXb1//7u3r//vZ82+eLi7kJ96L9btuoTylc25MXnj8yoHbWmILeqJ3jUQWjUVvGwgt6B8CJb9jLAT4xpdg6IB4YP1tHdF5DdEZNYl+paPtGqfngmynk4P+feH6757d++Zffv3N7/7pd7/9/OsvX3/24hHEHAPlXZVVxF4cI4rJMiLOhbakbTtpggOkdrQlUG5laWpMFjc1VJQVAeXSZ05heuhqauD/4qpjIyPSk5PKi8nOSmdLY3dzQwdJe60CUU1Pige0uTs74VkfPizEz7+W6ifOYhfjX/TfC+V0RwRotW4N/7YtWw/s33tEVAxwJi4ufvjwYUhSUREhQLmpiQGgHA8LTCk+juRjhjE+vXiypBGPoz1mjT3jC8Y4noZTXwfIEdpnjnR/Tk9JiosGSiDYrV+//qOVK9hl4Iz4Iw2piRDEAD4rfRoxHj9PO7owUF4ErgAoB44DHxpqK6rKi6rKiimO4w3gm6B5GflmJQPlWamJ1uYmEkfFiT8oO8GDaV5MrNsRrkwMdMvyM+/fnLoxNgxRDgUQSewzfBFFwOEEBQWZD/Kxd4y+O8H/XSYYZ82Km8RFPj4+4Mb2rdsO7j8gLix8RlL8vNSxi6dOnJE6JikBnD+8/8BusO/Nm7euXb+OUi4ehmbR6s1vJwr/haGcw8o5DcnoMvzGjZuPSUgiBmIEMJPcB5gecI2MksSEuMoK0sD+xsQY3ZO8OTtJMj16u8BhEYrB+xJIL5DQoKCA+PhYMvmL8iC+yHYHc1RVlhcUFBQWFtbU1HS0t87PTT17vPjrL17+9iuSXf7m06dg5VDus1Pj4yPDDTXVEGUYlG5ubpaWliZmxmYWpjY2VubmppA8wNPNmzfyreEFSbly5bIp4+rlydB20Eyywut/LT46KiMluaaivLWxYXp89O7NWVLxSED8CUD86ZMHjx/du3XzBgkbrY2VleWx8TEIP+7u7ohDwUEBESGk5UpYEOm3gjGEgEH2Os6dvXhRRkNDy8rKys/PJzIyEgAHhd7b097e3lpSUpSRkYFvcor+DQ318SnE9o2bN9FFreUF+gztWvWuKowpi/gRUM6s2370yxV8PKv37Nl35bKctaVVSFBwdFQEpDQECiZPFdhQYW5JfjbAKTYmnLJyXIuhgY6dlbmbk6OPh7uvu7uLgz31U7UwN7axNgeUB/iSikHMfNKoKDu9ID8b7BU6GmpppL/n5swEQiOE1Oevnn/58vmXL569Wrz1+e2Zr2eG/muo6W6o4yN3vTntU/NaEg9NpB5aHafs+6b+wVsGhxZNRRZNxW7qHrqpdWj+KrGNvqUmclNVdPjSwX65I7dstWav2f1bb+3XU4PfvH76X19+9uuXL/AnfkN8Y54+f7SIEAIaAWVQX1eFiEt8xpMToQVxwrgKkkhubgoubm1uRkvGELS0NbVUVZQuXjh3+uQpUGwdjat2VpZ+nm7RYcEp8TGIcsAXQAaOkvyc/MzM5NhYYIeHiyMCNnQqcJxkGTE+8ux84XeNQf5bD5qtBF4JriosKCR1/OQ56bN4SUkdB6BLSooDyo0MdSFBQgL8oJ8QdzEBiU+vqzNUlz5TAK1vaACxBeFCCz6gsaAdcdNwEK+h5MTIiDCgPAaAipIyJhToJzmYRR7KM+hGzubNm4GkUSEhuGOIdhhghQU54FuY+yDjdbWVtTUVeCRg39RjmR7MlwUVpQWA+IriglKmM6KupjqQlDaA5uAPLnPDuvV7d+/RvqqamxJ/d3rs1vjISFdHT0tjIwJDSWFBRmpUWDBo3LZt2+id+f6uqstbIZPpxg7AdNEDmmAtv8CmDRu3btm0Z/cnBw/sO3Bg38c7t67fKACsJ+vgbJuTdxsY7zvTcv76XyOUE3OPXbtlL8lgApDcBhdXHw9PHy9vAAQCPsQUZBSFckzmG1NjIwOk5IQsmudlY85jrJCcbgZKELQba9n9thvrWprrwcTr62pqq2vaWlp7utsZKL/35dsXgPIv3jx/+/LZi6cPHi7dmZkeHxsiliyI+VCLTKqZE8mgcnJwZVLlzE3NZGRkwMpX86/Zu3fvhQsX9HS1qb8zZjImMP6FygbXBBaXFOA0aiZGSXc0CuWkMfzTR8DxB/fvzgLIhwca6quLigrCIkIRNmxsbEhNkJ2NPXMQFy1j4sCpoqIEUFZUVtLU1LawsMJPIsyAEiI+tbc1DQ5044qqqioKCvJIrWA8y8nd3c0FuCkpKblh08Zlef2rOLZZNImItdb2I6GcZlNgdGKEAW4EBYVlZWXtbGwReuNiYrPSUkG78FwKstPz8QWQPCIU9I2Uv2qog5lamho529q6OzriIOsQAD0DPTx3MFlAOfHxCAlAbIaiysvNxKSlCxHd7S3DfV1zU9cXb829Il39nuB4/ujewvTEwvXBJ6M9X/U3zoa53fcwnNE+Pacu/shY6oG5JHAcZJxZSAGUiy2ZiC3oCN7SFASOk3xzFbF5ZfEh2SPdSqfmvWwmo679erTn7c2p3376GDj+2dPHn794Cu7/xetnEG0IyRgeAz2dGFqI05BQJN80HuAb4unqgjGAC8SFQHlQN03guJqKqvyVy2dOnzwueYx4EauqAOi93ZzDg/wToiNyM1LB+wAxJTR/Iz4ewwacHR8/e0Yaw2wVu3p+Fbtc6+eEcpqnvE5grYiQMBjMpQsXL1+WgdQDoBPjLZmL+npaTnbWQddI6CVN1QL9yd6MuSlZ2VNT1dDShDrEDAJYYwrTQlYMj9joGOJMkBgPcKft7emuPgiBkJAQbebJWdAHjgMvwEhwe5PjosvycgDlGFr5eVklxfnVFcX1NeXAcchTMDZ8p6S4sKK8FDK3gkB5MYHykkLC1kuLygrzoADwOMCLaX8VZvyTK6UrIevXrjt1/JiPq31nQ/VwV2tfS1NnY119RVFNcV5JTmZ0RLDc5YsIKhwo51Dy7+bmtJiWU+K+kpvjLcxKj8Gxmm/7xzuEhYWhno9LSRwRFwGmE8BcFgY4v+FdctGqv2YoZ9/QwwcPXbp0AfhFfSZBMENDg8HKKZRPjAzOjI9OMr2MO9qba2uqMJdioiPJ/p6bS2CgP34SjxMMrr+7Y3So9/pIPytJfPI63oBxT46NkirEuzcBAaB1X715iePLz16+ePLw4dLi9NTE2Ogg8BEIi0GQk01aWGCuAopoq2hgtJaWFgYWFBDDyq9ARgDfTUyMNDTUwb+gptXVVU1NjV2cnPFZKGic6q0bU08fLAHEnz68Ry3xbt6YIr4r9TXF+Tm4BOK74ullZ2cHEWBgoAdVrqqqrKBwhSC4oqKmpqaurratra2HmzuwEj+clpYC3dDa0jAy2DM7fR3EvxeUtaUBkFdamJeTmZLONMyjHgOAco6/ynsDi0kxpCZZGFI/EMrZC6lkKZP7o1W8K0myM2jG3r37IRpIt18nZ7BUhJPYyDAgeGxEaGjgNT8vT7BUjatqGCKYS8TtwNDAwsTYxEAf74F39L4BCp3sSHUrnfxpqYmkQUxBNq3+QFTuam/CJWMMPL5399nDpQe4ldMTCNtQAH3VpTerCrrcraYtNQcuiY6c37+kKbmoR7B7yUyU4eai90yPLJkcXdAh26FzSofn5IUmLx4ev3zkjpnqnIvpvzWVfTnU+fXi/MulW1PDA9eH+hEzPn14j1gwfvnm9s2Zqesj3V1tHczOBqC8KC+XqRqLiQ0Ph/YHGAG8VVVVFcmLmGXKy10B/J05c0pC4qiosAhmK5gKLtnJ1srXwzXIzxvcPCYiHBoO/wIHfTEGbGx1tLQhT7du3kLZ2apvhdKfUCL0E5dZqGki48sPKMeDw2NSU1XGsL948aIsY5Jlb23h6+kW4Ot1zdsDiIwnqKKqcEVeBgMYkwIKm+k2FZmZmsT0eY4Cc2fcJiLwHpQcE9zBkXgi4rMYrvj9wkKHQZA57igYlvxrBaSlpXF/mFSxfOA4RgUOEuNLCTFnlHcZ4LuwkC68lJSVlILoYPaRTMcCpp1QaREeFqYw7YnBbCBzMcvZxL6fn5dv8/oNgM+1AmuOi4sZ6Woh3EYEBxC3jIQYHFGhgZYWJiIiQqSf0Qqub9//5Rkj39EVhLJy/M2PuN530SFL9cQF5NAhYWgfocPUeJJTw8EJAMt/4Z/UBD8TlFMBxSkXeldISrZ0uDZt2iQhIYFZjZkPDX7NzycmJio9LQUzubutGbNrfHiAbHv2djZhBleWI7YDwR1Jk09rb2/PuNjIosJcMDjisTfUS7qRzU6DTN1dmF2YnwaA4sCbh/duv3h8/82nT0mt0NtXX715BZb36N7S7I3p62NDgMVO0jqXlNsQ67WCXLqulxQXi6FgZmpMXNa27cB5AmQtzAgTh6LENMYopy6JxsaGFMorS4vGmSrTF48fPH/84PF9ItJvEXfyYeA4Rhi4GOnDmxBHEwcxsm1srAwMdQAE588T+qOgoGBqampvbxsQcI0WN+PXgpJgvIKljg0TH8HZqXHqMgjhT7cZ05Pi/H08Qeoh0imUf8C2PoDyH75Wzh5M5OOkwekKsnWOF99q/t179uHPKSsrg5tCwSDs4YrAMd2dnWysiIIGLQU5xVy6cP4sxsoVOVn8i/fE2P3kKVyvmpoKztnZyQH3gTFDjyYbZTnpxSX5ZGG0qryprrqzrXG4r/vO/A3g+N2bNxApSWZqckJxalJ7aky9g9m4uVbfhSNDZw4sqUre1RJbMjwK+L5rJLJkKHbP6Mg9A/EFLeHbGiJzikLzcqLXzwsPXZJYsNYd97J921r9oK/tzsQwuAKUGW4mnt3SwtxXr168fv4YIXNokDSAxcAAdpQVFYKVZ6UlE7e1EMLKCRKpKOEqjh8/jrGBf4HIR8WOgGnu3bt7185PDh04KHFUXElRHmEMZNbLzTnQzxthjzZeIM9dj6yJHT16dMuWLSCJJGtiWabg8rz+nwfK6UGzy6VOHAOUX1VXBc1SU1OTJa9L6moqpiYG1FELqgtzFt+Rk5NVUr4CjcU0kfAhBXRMNkssKcgnpniRZB8rmri0h4XgWZtbGJuZG2HAYJwALmVlzh8+dIC5dgJzK1dxAelwY/ER8PGK4oKC/OzsrDS68lZeks9AObOcUlZSxHRqxtTAwZTOFiLc0sxmfDAjJRlkiGTl8vACyiEr8YYD5RvXrsMfxffXrObds/uTE8clMTgRq2wsTB1trYz1dSCtNm7cuIrd/PY7cfw7GTpngYXE4BWrON0CqHMJjVh04Z629WKaRPDSRRXavO2DPq5/LVD+AStffqIQU7RvLFiNpYVZ0DU/QDOeGSCvram+v6udSUZsrKutZta+8/JyszHhnZl1YWhSQgGC/IG5eHJgcCBQxFqPWad+9ewRSNzje3cgk588XHz+hHzn7ctnmKW/+ezlr9++fs30QSd2KDcmp6eug7lTLg8OCFEP+GhprCnMzYLqt7ezgbrct+8AmALpWMhs39GkNEhLKEpQcpwSlCNYfVNt1ezk2P07t14+ffTiCf4+Eekj/T0gdpkZKSCeiQkkCRejjbatwjfDw4I8PdxwOeA+Fy5cAMsDWwcm4idzwEqYdoVtzXVdbc29Xa2DfZ0kGXGwD1A+xFSYIIzlM97u7s4OmFe4mSA1HPt5rvfggItWFlC/5h8F5VQnkmlAhT/bfohvzerNW7cAvHBzlJSUNNSvXlVTV5RHWLooLCy6e/de6FPg1K5du/bt2QuAwL87d+78ePvOTz7euW/fPnFxcdBYbU0tRC8nJwfcB9zGsPCg+IRoZnWVVQlcXVo61Ns1Mzo0OTqI+xAfF+V/zdfL3jrazizLUL3PUK3llHC3xL6ps0KTsgeA5re1iZvobQ2hOZUDs0qH55UF55WEbyqKzV2R6Dl+oF1abNHTdjLM52FT9WhTTTbQOTY6ICgQ6gd0YWJk4M7sxMz4EAQBVHxuXmZWdlpqWiKeHahlRHgwFIePhztEJO72yZMn9u7fs2XbVoz5jRs3b964Zf3aDcRsj4fsegGdgQVCgofOSp9WUpTT1FAn+Tw6uiAEuFenpc+IiR3dtv1j3EOau83UdjLlMcuA4+eBcrrOu4pVV0KaCkCJQi7TRHIwliuX5S7LXlJUuAKlRReUoEqZDlxXwMdNTYw8XByhzJJio7JSkzAa46MjSOe1a8TcAjIaoTclITY0MICUjJkZGhnrWTFJTc72Nrqa6lKSEsBTchOYcSsmJmZrY0UTVzC1KZRnk4LPzLLiPNK6vbKccPDy0pKSInCvslKSpFjOLI4XMyVIkKoleXkRIcG6urrbtm3DTeRa+RHF0NW8a9bw8ePR8BEgJemPeOGSiV0BLy8/P//WLZswQDdv2gBoWrECSMyzdu365V2cPsDZ72zUxxikcLGqjbjYqyVcy8ro6QRksJ05+JavyP+oltx/4QUWTvk4/tfHn+y8dOkSInxYUCDwCyy7trKss7Wpt6OlvakOlKi0pAhKitQ0pqVgZFhbW2pqXoVOB8iCBWSkJAJzSdVAWxMUMejbp08efvbiCWmOfHeBovnTR0tg5YByuqkFKP/sxdMXTx4u3b45Pzd9Y2ZifmZyYW7mNt5PjOIAmvd0tpQU5iQlxmLwAacOHRKExrSxIcvioSEBwF9MaTc3F0dHR+A4eFZsZASGXUt9zc2Zicf37pJ8x6ePSPfO2ZmB7g5EIzBxSjyh0SvLCmvKS2hFAyl4Cw1xtLXR0tAEmqurqzs4OACqAGQYu2Sdoam2r7ttoLeju6O5o70JAgJw1tPR2tvZBoivY1WlRkArIBKQ6hJWSgAv9dDheG6wk0FXsbCY58ehA6dvNx2CHMFIhgL/WkDS7t279+/ff2DfwT179u34+JMNGzcLCKwjCQB8lIOAdq7B9MCcIW94ieUezvbAvv0nTpy4JCtDdswsLAlD9/IIDg7kqPLUlIT87KzOFnDzrrHBbkTZ2JgI3HA7EyNfE/14A/VWY+36c8c6TwhdP0vKhW6rHb1zlVTw31ETnVMQvCF3eF5BeEFBbF7+yA05ie4zIs2XTtzydxuMCp6qKW8pK8YfAk9283CHDGqor4beuTU9Nn19sLGukniuJcXGxUeFRxB2ifiKKE5b/wDjpKSOg32v27B+DUm/Xosr5QPb42bVu7P9T0gyxq5dOw8dOiAoeEhYVEQYulpYaP/BAxj2a9dt4OVjmayyVnLZPiHvSvV+Fijn9ALlOLEg+p48eRLwraoCXaEgJ3tZVuYidJWCvBy+lpeXIx1uSUMYRUOGjwf7+zKrE7FEd6YkRkWGBwUF+fr64r6BjwPKE2IiMcE9XJytrcwgQ42ZUgM7K3MjPe1zp0+tFVhDoXz9+vUXz1+AfOGUDQIgGJ/NAACAAElEQVTKQe/A2KiXHEkhr6qoqa6srCwvLS0meYflJHeFuJkX5JJ9CPxbmFeYne3n5YkJRZgND4FsCuXAcf7VAgJr+DlQTsgNu2U5VQYsUzkeno8++ohSlh8CrO8DOjfHCo2928S2jGebUNKaG5okzun78z19OP96oZzErpXkPWYCNCbifHBQAJAOwE2qhBpq2xprSWFYYU5GenJcXExEBEaCP+AbvICOMAR2L09XkozMuCFXl5cA3UDcFm/NLt6eIwsRk2NzU9dx3JqbAjt++mAJhP1LBso/h4h+8fTx/cXFu7duzs/cmr0xNz0xNzN+Y2oMjGx8uBfQCcAFjgBczp07JyQkAv7oaO8ACAdugmJEh4dAOeIA4qSmEItHwM3IQC/g+9PHjxEqXj1/Qnp4To53NDWVFpeEh4cHBwZhWOfnpLfUV3a1Nna3NYFWYwhmJif7eXiYmZgqKyuD6ZiZmYGfAvpzc7KgTgZ6cVH9xJu3vgocJJvxpaELgrQ0GWcCnqimqgyYWLNGgMI0K16yIj8fh02zbz73ez7mP+CR06RGHo7jObOASxdb3o1OjuRiN3elm/jLDlabC7KMyLAhpqONwIZNGw8JHqaLy9AlBgYG5qakRxqouq+PFx48rhSX39/TCrKMWY177mxt6WyoG6CnUWZh2KqrNq6lMHJR8vp54YmzhybPH5y6cGD6PI5DU+cOLlw5cvMyKfGfkj12x1h90tb4QUb8SGZyRUJMbHAgoNnKysrT0xNho6mueqS/e2ZsYLCnIys9CRoxwN8PodrCwszY2FhbW1tBQeHUqVOgjTt27ACbpiySxbPYU5dFrhllzd74IpsT+Hnu1WtIF10crNIPvnd+08TTgkXIP1gnXe5S+d8K5ayQz7QyQARCYD4mKX7xrLTMRVLkcOnieVmyCUq6ZZ05c+b8+fOk96E5sT6ODA0CH89MSQSIg5pgPpJmAz4+YOWksp/krsRHRYZCQ/t4uDo72ZkY6xvr65kaGhgb6Wlpqp06eQLYSvUi/qiRoX5SfFRZYS7Hl5zYcGaTRCmMeZC2+roacCO680lzEPH9EgbEaypKq8uKCokBYxyiBbQFD7tnMYVpKEvaVIg+LGZBg4c6iFHOwcDUu3I5JqF89Y+/pe9s6VhEm26cvmc5y822ZeT7Y703/8dAOWlBy+Q+79675/JlGWpYUVSYj8eDB9ZUW1lZUlCUn0V4a0QYSJO7mwseM3gBoBxyFVHd3c0pOOhaXFQk8B4PsgNgiqk4OTo1SYxEocqH+7qH+rvGhvumGcL+aOkOQParN68A6G9fvXjyYOnuHULMZ6cmmW3SwYmxwetDPUO97YDyitICUGMnR3sOlON9aOA1xugqIZ3xdaO5VhhqGEw97S1jQ/337y68ekqSoF9/+uTO/Mzc+FhLXV1hYWFMTExkeERmagrGaFdr/UB3Ow4QbVxsXkZGgK+PhZk5oByEB0Dm4uwI0AeUNzMmiNPj/RD+DE/MS0mBfI1NS0shXmNpyeA7OCUIUunTZ0hj32W5qDzsyM/JV/0gR/VHPXL8Hgrl1EyOrr9zsV7v4TW7YxTvB/tCy6GcfpZOG8Jn16wm2nbzNpB6MbGj4IOAD3VVNWb71xpKKIddjoQ7RtRSXLSni6ODqbGz9tVw3avZ2mqdBld75M+OXj4xdk5k4qzQpLTgtLTgjXPCc+dE7shKLMhIgLMPnRefM9fqszcbT4ypi49JCgry83QDGFlbWwcFBKYnJzWTnrEtwHEoIcbBLcDOzkZHR0tWVvb06dMSEhKCgoLbt28nBrCr+Vg3kOm9yYFyBnm5mJVZFpRzMX1UWX21eMmxjJHxsctjWFDObozwYcb3zwDlHKs1Or1xcps3byaaSUIcQ+vCOVK/evHCObzHQTd1gJXuzk5QxokxkWmJcZnM0kpCfHRMdGSgf4CXl1dgYGAss/UFdQshGxTox2yWOlqYG5sZGZoY6OvraSkrKYgfOcq/eg3GA0SbhMRRRweb1KTY8qIcsBxAOWYBhXLSn4AN5bU1VbU1FYzXShFdh8H0x7+A8toKQv8iQgKhIXbu3MkJUayqSFq4z5AJdgtjFpRzjArID7O78Kykj4/7x1rG08HxLqeQhem0rxML37mX22D9nAj+Z4Zy9jgmLAD3EZMErAdslDqogeTigRTkZkCvIcgTFeztiV8OBGc202XB4l1dnLy83QDlMRHhmId0OQJ0HgeUcllpcXERMWQoKszFI6+vrurr6rw+PLB0++bLp49AzH/zxZvnjx/gSyD4QE9na2MdSBmxk60rb26oxBsm6zHe0cEOBEREROzKZTkw9PDggOy05KLczOK8rGKms0lJcSHkXmtjw+jgwMzE2MOlO6+fP3nz6bNXzx7dujE5MdjfUFWVnwsITklPTQNjaK6rQryZGEHM6MffhTzMy8rE0LeyslBWVQKU6+joAL8SKCtvbURomZsevjExilPKz8vB3MAMCQkJQtgLDQkC3IBXqigpQxEDE5fdZ7L8x2rbyqoe5PlR8P3+Tg7Pu/z05a57XB+4pBIrH7rbw/GF4HQsoqGFhhPOgg87G5eb2gNRCsNHusJv2L1796FDh/C49fR0SM/1hJjykvzmhmqEtNKi3NjIMF8PVztjQxcdjTA9jRobs05jrUl9lYGLx0bPHR09KTQudfjGGdE5abEbp0WmTop0HNnXfFxk3tGi29OxJTo8LSjQ1dbaxsIc2g4cAkKHOqMRE56ifLBLqAETY8MLFy5A62zatAmRBvOSoi7NfSZgzVj7A8o5TdeW90d972ArlVXvhVLOL+Ti9F/9ADV+HihneWeyCSwNz6RJ97r1+/bslRA7ckrqpPSZUydPnpCUOIpDWvq0hoa6k51tqL9/VGhQMrPVGR8dFRtJLKmhPr29vRnT9hCIS3CdaCbrjFZQe7g42lmZW5gYg5Crq6mclT598OBBjFXch23btslfuQydXZiXSaAcojMrPSszlTopElbOtJrBXMZBi/UrSopLCwuo6QqGBTUGSIyNsraywINbzb+GDF7q8ExZ9gqWbzBTjsRF7zmTmsFL7UCpyqSm0FxMtvjKZdTkhz+IDwyE2fSF+wNjjO93r/yfw8pXUV8bro9WrsCnQHwweQIDaMVNIkAcmJ6RQroYI84HBfqDq+rpatOMPXMzE0y2wABfCDdgfX5mJp50fXUF4LgKj7SoICMjLTE+gea0pqclARYhyrraWudnJh8u3v7i9ae//fLty2ePgbwTo0N9Xe3UkQcRHngBAgiyDCEPamxvZwMOAqUGNYDgAS1ZkJ0BZl1VWlhdVozJX1dV2dzU0N3eNjk2Ojc98fj+IqD8sxfEG4D0nenrwc8UMWv9gGwMvrbG2utDUAnDFMrLy0oA8aAwpuYmaldV1dTUjIyMHB3tk0jiSk53e8v4cO/89Njs5FhLI8mBwSkFBQX4+pJmF7gDUCraWhpMdQk/R85zFvsojrOHMvdy8fgTBON745jru9GcdyVrq4eP5/ug/B2csdCNm2OoC5RkSkW4aDTat2/fuXPSNjZWGADZWWnEUKmipLqiODsjOSIk2MnWytpAz0lLPdZYt8hEd8DKoEdNtu/K2YHzx0fOHp08Kz5z+uiklOiYlGi3lFjjhRNT7g713q55gX5Bri60ugf4Eh0ehucCSl5fXlpRXEAyOwP9TU2NZWRkSA+E9RvpNibNymctLrEzE7hW8nIk8wdQ/oHtyfv2/+81suEw+m8L7Z+NlS9vELhy5UpKs/AQ1wms3bdrt4iQsLj4ETExkUMH9wsePnic6fPp6ugQHhgYHuQfEx6Ce4jHAW6Bw8/H19PTE9gNtpEUF0t6GQYFuLo642C8SwmUmxsbaVxVk5W5KCYqTJuJg5IDfMH0GQNF2pEml0J5RnoyJiNZBC8pABnHjMNRW1mGCYupxdA1kmBOHG5Li4oLsv2veV+5chmqggXCy5f7mGfHSROkqE0tcOmzYPxjeThugvjECq6VP7X1x5+A8h/oXvlXDeV0O45T/kBl3cef7MSkJV2mXF1CAvxDgv2ZCsB4CDRamhEWGgwGqqWlpampaWNtifkWGxOBZ1yen9tSU9XR1NTZ2gJ2XMzgOBgBqIGTEyn58fb2DAoKSklJwiPvaG8dGxp89uAB0BzHp08fTY+P9rO6YpJ1eeA+qTbOTEtLIsVpuKIzZ86IiYkpKlxxd3OKCgtmmrEVNtVWttfXdrY0drU1Dw32ToyOLMwR95Xnj+599vTRpw/vPb67MDU80NvRigFH+hDmZpcU5DfXEzPFqbGhm5PXxwZ7gdQ4paSkJGdXF0C5gZG+qampi4sL4ll2VkZ1eVl/d8fk6CBwHNDf09kCToqRjbkBduPk5ACA09PRPX3y1PbtH7MzPt+t9y1vN7HMjeendRdjlau8Y9/LOpUshzA8Wj6u9zfi2ds7tDSJbpm+W09nH8sZyqplL1wGZPLp0yd1dLR8vN1JUw4QNOIKS1JPrnl62lmaWerpeBrqpzlY9wR6jV9zmXaz7dVRGVGT7TkjPnBcpFN4X5vYwUUT7Sl785FArzJ/71BneycrC+C4s71NamJcUW5Wa0NNR0MtgnRSXLStjZWKiorEMclPdu3hZQq+yfRmrMNpOSKUx8qPWOnGdPWTLmEtTxpbno3Ax7Oa550q4l6WQcS9rD/ZHy3R+vnWylmt2d9t2VFCILCGf8e27RBJUH7btmzdvnUbNLSSgqK9NWnTHHTNJyyIeLCAW+DLa34+oBdurs6IkZGhIcB3P19vDGkb5kV8JW0tLcyNmZSty1JSx3fv/gS/EzgO3IAC83BxZnIQ8ytLmK0gkuWVjAPzsTg/h3YOwryoqSAL5aXkZwowrYqL8kDgaitK8WMg9Vc1VA4c2s/Dx8tZyGKzRm4O4DDLKmvomiELZ5ktUM7cIfX9jMU/L7v36Z80t/g+KP+udh9MaCGWZz9nsumfv9qTyhbOMGWWpMimh4LCFRMjYzxRP1/PyIgQQDnEL6AwMyONGEj5eltaWurp6VlamGHoYOIhdINM9be3jvZ2D/R0A80Rn6mPHQaQGV4Wpo7ODqC90dHR+H5tTVVPR+fiTbLMQq1uwdOH+7oR5KmVbnJSXGpKQgb5L8mExR+iZjeAclcXh+jwkIKczIqSQuqMSJrPdXdcHxu6MTmxuDD/aOk2yPhnzx48Wbp17+bs6EAvsB5DDSeflpaCq4Bo6G5rnhgZmBsfHR/oxXtAeXx8PMa+hZW5ra21q6srog7AGlcBFUlKnwb7gOYkk7yzpb2lPj8vE6IVUG5lZaGpefXCOdLAkJpzchKh3ssU4uZdbqj2U7dW3kE5a/hyr6F2esuqirkZvsrygH5XC8aGrXd1BZSksyMNC8o55IX9Wp5yA4YlISEBNIcwiosKB3HLSU9JT0wMCwqEzDfW07bU1w2wMS/0da3xca1xssm/qlijKld36VS79MnG40caz0hOWhl2OJg3B3qn+3h42lnZWpgCsn08XHMyUovzskgLwJKCxJhITw83BQUFYVHif4A5zLhq8HAWQFjbAGQRiYULFMo5GQjfWaHH2md7//XePeH+EKw/yGD52aCcE0c5UM5gDA/wTEBAYN26dUwmH//WrVulpaUNDfS83d38fTwB5TTD55q3l5+XJ9Szs5ODj4c7kB1f4pHZ29pZWFiYm5tbW1lYWZqbGOtra2vKyl6SlBTfvWsnYgO4P7i5hoYGPlKcm1tZUghlDCgHucrOSuVAOSC7vKwIUI6DoeT5mFz4MbyBqoaSToiJtLG1EJc8ukaAH2yaojkHyj+ovmEZ/LKhnO7f0GfBR21EGUDnYedu/WQo/yAhnZOYuBzK/yLE/M8D5au+1XoOjId/rcDhw4cvXjiHUeLkaBseFgS1C2EFyoznhAcWHxfl7u5qYmJkbm4KWAelQijuaWkEyV2aJyYnY0P9eNigtGQR2cHO0FCflGIyTWpA6oHmmZmZ5aVl14eH7t6ae/v6+ddfvn20dGdmYqy1sQ7omZKciD9Bqj0hDoODEC1MjA1PnDghJCSkKK+AQQmWAaaAMyHe071dU9dH5qYnlm7ffLh058mDpWcPyfF06c7CNGko0d7cUFVWnpSQGBpKepaC44NHNNZWgY/PT4yN9XUD6AtysuNiYiFInZ2dA/0DYqIjc3NIUzRISGKa2NpEMsoZD3RQ+M62RrKnk5IMKDc0NIRc2LNnH+4eGCJnaNIc2PcWXtnTcpkx5ncvofzRp/5tv2Pqjvt+AtayZnKrlrF4Cg2rOO8Zrsf4rPLws7gPJVCswUA87tm1zrx0GxC8GDiCsXFO+iyECBABSBHg64OQb2FuqqujZair5eNslxUZVJ+W2JgQnetoU2Jlkq0iV6J4pUpZvlpTpdPNtsrLuSYuLCn4mq2FiZGeLvQfYnN8NJ51uJ+Xu6OtlZqq4tkzJPFUYO36d9uAzH2jfZdYRdg8/MsUyWpeJqRxDIGXMy829L+7/0yvAL4/eeffLc78Wds0/7CCT9rskpduCb57v7zfEB8fSPr582dx8zEpKB8HagO2XR0dbKzNcVATYJIgRPx2iFuDmakx7jn+NTYy0NbSAHwcPyaxf9+eHVu24gBbAtzHRkaU5ueTVW+SmlKcl5uZn5Oem5UKKC/Kyy4qJGssmB34XzT7sITJIge1AhXDz+BvQdlv2LSRBcqchSOu9/zZSS3Se03g6JLgas7Y46wckARNLr7vZ83fhvLleyfsrUFWgwgeJulz+fhZ3ibi2637fkjY+KuAcnZ+G5uj8fKs27BeVERITVUZvwpQDv6FZ1ZbVVpTWQJAB7IH+PtZW1uamZl4eXmkJMTXVZb1tjbdmhpfWpibnb4+MtBbXVUGNARNcHZ2BHV1cnIArAOZ42Kj4+Li0tPTC/MLenu6ZqfGXz57/Ou3rx/fuwti3tHSWF5WkpqSlBAfDShHeIc8BNEwMtSXlDwuLCwKRenq7AIoz83MwJDqaG8GUUYMWJibebB4+/H9RdoYiLT7mp0CWAN8qyrLc7Kyg4ND3d3dHRxIXh1dNhno6cSZjvZ2gZWD48fHxZAukX4+eJOTnYlBTJpd0U5X9TUN9dUtzfUsY8/aKtpxFBB29epVBBjw8eWacXlfK04yHAdKOJ4ePxbKv2Ngvd8KlpXlwmpgzsvZHlyetcI5h3eigXsNayl/WabN8gwtzmIRTXzEl5s2bBY8JHRcktQiqquqqaupKCrKy8nJKisrWluZhQd4Z8RG5kRFhNpZBRno2EtLOUgedZc67n/5fJqVSbyjTXKQT4Cnm56uprKikqqqqr6eDlQXTYs6KXV8755dpBMb72oSGtnbgJwQyJEaVJFwtnkxG9+H7PfWRj+4/9+1zcXNasn4YbbPX2otlRWSl9ux0cQPTmY0fYjCwoK47UBnJ0d7CuLEJBJoynSAob1TKI7jAIJbmppYm5vhPeiRnq72FTlZqRPHDh86sHPbdhzi4uJ2dnYJMdEVRUUsKC8vpS2HgObgT4wXOTHVKisqJEdhXgnTyYvkrhTnAfQxzTEY9h88QNOCiJxil8hx1D+biTPNypnlctbcYQIVw4T4OORyFTPOV30X1P4QeH2/5GfZqGZDOV2s4+bi+0Ez7q8cyjlrpqxMcyandcumzadOnjDQ10W0B2kC2EFtNdRWNNVXUS9sqGALCzMgdVRYKKJxX2fr7bnpe7fnp8aJjx1wsCA/NzDgGpDXz8c3OiqCaeIMIVaA72dkpGVnZlWWV7Q0N85NTz1aXHx6//6Duwv9TCFPVmZ6YkIciHlyfAzIGuKBgYGeuLikiIiYoqKil4cn2Dp+G6JLT0crePftuZnbN2fu3114CDhfIMnsvV2tpItFRWl5cUFaanJYSKiNjY2WlpaKioqZiSm+TE5Mam9uGu7rHu7u7GlvLs7LToyNARmBwsCn2prqh/u6rg/1dbY0NNZUYigD3HHOODFS85aeEhsZFurvb2FiDIW7cfMmDoj/pTbB/1LHli1bPv4YovwT0MN9B/ZLSEioAM3NTVwdbDzsbDxsrW31tDXPnVE4IqZ1UspaWd7Xwviag62Xg525sYGMzMUjR44cOHiYWnLv2kmWawXW8FOr1W/V73F/38LUsvSy71wr/573/3MPumgmICCwZ8+eY8ckZGUuqiuraF/V0NRQ5xy6utpGRgYg4wiWUFGkYYWNtbM9adMBNIfsRjSVPnNKSPDQnl27N2/cIikp6eHmnp6cVMlQ7MaGGhAX0lCitAi8m7SmKcijGYdAcNJYjti3ZdCewJiqRoa6UAkYCWvXr6NmIR8YV7DWwZctHH34HL/zYr9FWf43HX/mBRbO/jJlQNSgALML4wMCDWAKYo6ADFZeX1NemJcJYg5hbWNlDaSOjAirqSjv7Wi9dWPy7sLs2HAfzUXJy81GiPb29AoPDctISa4qK22oqiIdzkuLyQ5kdk5FWXljQ9349dGl2wukdfLSHdD5loZ60PmU5ETSDjwe8EoMOfX0CJSLih5RUlLy9HQHawBNwPDq72qfHB2am7oOKUB6hM7PTowT+8ZGkrCSD46QlZkKgh8cHAjZSF0stDW1fL19EuMTGmqqcc5drY2tDTV5pBaFNM3KyUxpaazp72obH+6dGulra6ytrSglHDw5MSYmCpICnD0O5xTkD/qjpChPCoIE+P9Se99/4YPZa2FxXpKkw7d161ZiCKOkAIoNmm2ora0sJ3f8yBGhPXvFBQ9dOnlCT13FRF9HT0sTo1ZQUHDDxs18q/l5afrmSro2QtvPcn9nJsnfofy9g5fkENMUI+iYvXv3iggJSxwVPyYhKXX8hPTpM5dlZDHmDQ31Qc9tbayA444OdqRdlKODE6i7tbmxkYGivMLJE1J7d+8BjuM4efKkj7dnZmpSTTlpMVFfV9VQU0krgBiTW9LmjVZyAsfzMtM4DgHX/LygAE6dkjokeHjDpo202Iet8Pjowtd3QvnyPLo/Ctl/h/I/AeXMUGCpSPZ6FqdomKmXXXXgwAFVVWWMgLDQwMTYKAKgJQVFuaQuJjiIdEEElIeHhQCfu9tbpsdH52bG+7rbWhvrgPsJ8bH+/sT9PCUpuby4qKu1Ccjb3dbc3txQWVpSXFhUUlRcWlra09U9dX3syYP7r549XpibGRsaBNZnZoD4x5FSv1DSRFxXV/cooPyIGE7Gx9cjJSEWY6uptmqotxPceaS/m5TUd7X1dLTXV9eUlhQlJyVEhIeGhgSFhwVFRoSEBPvb2lpraKhfuHAONMTV0SkmIhxcu7qMJMDSahfgM8YlRGJfd8vU2MD85MjESB9tDgcRQPpLuLq4uZHDxcUJo1ZNRVVUVHT9+vWcJLa/PTTn5izgsAv5Vu/atQvc/PzZc2fPSJ+SOglw+Xj7jnUCazdtXL/3k53iR8XOMeUtCIGbN2+lOfg0Q5zg+EereFbQhX6y9s1CbXbv079IJd7/DCxgLwTh1lF7k02btuzZs+/48eMKCgpGRkbg40BwZycH0DJXFyccLg62Vpam0NwyMjJiYmJbt27nXy2w+5M9crKXQb9yM9NqGF/M+uoKUJnyonxqq1KUR0CcNEFNTcSU8XJztre2wi9RkJeDLDh48ODmrVvAbFgSn5eVU/Su7fKHyX+rfmiNxd+h/AdC+fKcVuqpTXyFmJ+EUBI7ekRDQ8PbywOQTZIOi/Lys0g0Dg8OcHZ0ghwDaALKu9qaAeVgx90dzRBl2VlpYOsAPlBgUGwgL6nDHOwb6u0a7OkECoPIA7LLyspaW5uHBvvv370DKL9/59b0+PWa6krQ9rSkRArl4PXa2tpiR8RxJmpqKr5+noByMIWW+urBno7hvq7ertb2tqaW5sbm+oaSgsKMtHRaH+Hn54MIhN8RHxfl4+1ubm6qoHBFSUHRzsqabpySdLocUv6EsITLgdQoLcoFlM+MDcyODyFClBbkZiQlhQQEOjs7m5qbQasaGOjp6Gjh92CebNq06YOymr81KF+W9UEGDBAZ6Lx582ay5vLxri2bSMtdZuuS9RIQENix7WP8r/UkT5xvuREQne3LnY/eY2r/qyfz/8+xfBGDk2mDA3dYQuIYVKy5qZmDjbWbEwFxN1dnHCS5xd7GysxYW0vj9OnTe/fu5+dfK7BmvaiwmOZVDSJ5czJrK0oolEPfljNlnEzXX5KmAgQAlAf4egHBJSWOAsGhxkjPLE7eLSeDkJ4brc7/FpT/iGrnv0P5nyoR4qEwxKk042Hf+ncKl4dv4+ZNImKiKipK0GhRYcHpSXFpibHJcdERIYGe7h4+Pj6xMVEV5cXg2uPDAxMjA021leXFBVGRocQN2cIMAyg1JamytGiwr/PGBOkth2Okvwf0vLaSGNVXV1cChWenJh/cXWBaxN0BwQdSg/inJiYAc708PDU1NYHjRyXE1dVV/a550RXt1qZahI3ONmKAWlZaSPpHZ2UnxMSGBIXa25O+WNeu+cbGRORkpgCvE+MioQGBwoByQ30Db3c34usdGUYsKbzdXZkM3OSkuMKCnJ7Olsmh/uFuYpGdkwFKHo1wZWpqqqyqAgpz5syZY8dIvzfagpl6fXywIPA3crDGD5sVcvKFaU4CLQNh6ly42A0NVtLt03edHFgZJlxMzjg39U5h+QAvS5z8Y9amf+tknO4gcqD8/bqbdQLrj0ueuKqmbmtp5ebk7OPh6enh5uXp7uPh7uHiDCg3NzZQUVaEsoQ8AjhsXL/p/OlzYDlZaakkt7iqvI45KCvH9CKtgkpLqsrIl8ABkPE9e/YwdlcrybGCaxUXK0mcZqdwKpM5RsHfvS35N/9A/zxQzlq3+tZyOa2jo/CEAIuYDUWsqqqKeB4VGpQQHUGWiwP93F3dvLw8oqMiiCNuYx1I9/WhvsaaCsTwAH8fSwszQCdOBrQXrHyov2tuavzuzdmlhXnS9xnst6G2prq8praisaFudGTg1uw046F4B8ydtEvOycxMTQHlB5RfvXpV9IjYUYkjV6+q+fkSVg4ob26obmuua66vKQFbyMtJS0tJiIsHH/fx8XNwcHJxISs/pGitMKeypCAnPTkmOpzY6SkpY3xDcvr6eFzz9nB3c3FwsHN2dvT19WZqO7MgL0Z6Ontbm0FJEhPiQgODHO2dDA0N2X24hXfv3r16Nat7Fsu1YyU39Tj+G2TlHFrNMYHhwDTNoqHMnTP2PsgMYfLEGdsTblrdw029DGne2E82OfjbgfJ305ZVYkPQHHdyw7qNJ0+c0tXUcrCx9XR1u+btA2FNmnQz2YqAcmN9HTnZy4cPH163jnhn7t29T11ZBf8rNzOjrDCvnmm7TOvy2V09SyiUl+TnIB7IXLyED9LIvWIlDw5qn8BJYP3A2+R/yf7EX23hPisPlw3lnAQdug3FaU2LpwVpDCqKP0bKrD1cAYJenq6O9g5ubi5hoaT2sr6qbKCjtb+rrbqsKCcjFRCpcVXt0qULOtqaxM8hN6u/p31u6vqDu7ee3bv78PbNhdlpUnDT0VxfR5oEtrc1DfV1L8xOLS3MzYyPDPZ0AqwB0VGR4RiCamoqYmJiEhJHAeWA4KS4aAQPEgaqySpNSkpSdHRkcHDgNV8/MGhnZ2c3Nze8z0hPpWVEXc21EIx5Wen4VdqaWlcuy11VVzUyMjA2MjAzM7G0NMdVBAQEJCbGA8qb6qrbm+orSwrx86TlioenpbmFvq6enJwc+PiuXbuY6vxVy1tJMGFv9d8alJP+GUwGPS/TO43ru6vp3sH3t41/30t8ZOdQczxO/3/8av5GIIDt7bOGd5mepnMWrPzEMSnNqxpAA3dnF38fcBUfP/zr6QFW7mRnraN9VVpaGuMZILJt27Yzp07bWttEhoaAgENDg8c01FbUVZcBykk9Z0lBVWVpDcPQs9NTTA0NRISEP6j6+baT+PI1tPc2sZfly/39+DNAOZtXfgeUU1bFGRb0h/Hav3+/vNwVczMTFwd7ZycHPHvw9PDgIKAeEJx6xpYTA40kRwc7RUV5KanjykoKAf5+WZmpvV2t09eH79688ejOrQcL83fmbwCxB/s6m5tq6+uqWlua+rs7gPVL8zdI5c5gHyC1oqQ4NiYKqlBVRQlKUEJCAuHBx9s9MTaKQnllBWliEhcXExoa7O0NBenu4uTs5OREXIRCQvNyszH4ECz62hsbqsvLi/IiQgIB3yAjly/LIDxoapJGiDY2VtAWISEhqanJ+Xk5jB9kFahHZmpSaEiAh7uruakZgXLZywgnGzdufK+oeiXtNUXymv/mhuByzxDqlcEm5pzyqOUWYPg2qf3jGNK+m+o8HAc7Tm8XToX936f690AASfhjVcOyTBc4JQsCAuskxSXUVFStLM1dHBy93T1ASnB4u7u5YnJamYPNSEpKbtqyWUBgjYiIkKqyCjh7UlxseTFJJ6dQXltVWl5WBNVbVlrI+B0SSp4cH3NFThbo/15BLLt55rcB+oOi+b9D+X9LMiLXt8LpskoEVgUUJ5EI74HmO3fuPHVKCuOA9MbV08dAgdpKiInMTkuqLCHxPD0tJToqwtLSUkZG5uTpUyoqSgDZlNQE4DXTvr17YmTg5swEWPn8zCSxXunr6uxoa2lubPt/7H0HWBVJ1vY+z/fPCJdLDgIqoggoKiIiQck5KyIISBIk55yj5BwFFVEMmHPOaQzjOGkn55kNszvf7rfJGZWg/G919e17CTrO7s6oY/dz5k7Z1O3uW13nrfecOnXq8KGrF86+ef3q+3def/PWa2dOHgGqot/k5WYvX+YFS3DRokW4b05Gel1VJVCeJtjc0tuD2xUU5KWSLZ0TM9LS0SPB5clc687txw7txx1vkLX7B2E3tDXXYewh27E7Onp5ea1evTohIQF0BaS+raW1d/MmmJAk01tfb3c7qH9FQU5mYkIcmaN39zAxXkS9ihPs+McsYXgJoVzALfegK0UlcgBwMM1lE2NzQzJLe7il2LISy7Jp8l6J7I//JSj/1U6aiRO00j1xxN1SVl5BUXn27NlOTk5rwkMTY2Mo94JASeJio3HS2ckBFQAU0Ghvb2/8CTgOQxbsmwSu7NpxYO/OHX09fVt7+nf2AdyZbZe3tDfV5WdnGM6fC+ihqYO5PiAlLV4NN0F4Lj99/XPHlUs2Ohc8RAPChKJFVpI748Ggnj59OlDV0dF+mZd3eGgY7LXayvL2pvrejV2be7ob6msLCwvDw8M9PDxc3V2CggJKSooA5Xt27zhx5CDQ/MLZE69dOX/r2uXXr1+99dqVSxfPnjt7+uTRI4DyS2fO3Lp88c7Na7dvXgWUHzmwF4CamZHm4e4Kg2DBggUrfJbBQiSr0bb1Hdq3mzpY6F6j6ekEy0Hhy8tKaNIYjAS4CLnX5Qvnj4P972pvqc/OIp4fZu+VZWvWrMnKylhXUdLa1rihez0uhR5MkhNs6aH7WmSkJNLdakBwNDU1uWgBnlBIroXj0nWJE+BJZGEcBeVcDLgkL5MIXBudyJeH8qeGcolslwJRk06ZqmVhYeHn5wszGmgeH8dKZEQ4VMDCzHzatGkg1yjg5LqS4o4WkgkVOgXNgiIcJCSc7NtJJjx3bIHZvWtbT31VOTgc0J/FE8axxvHxMVgxSll4KP+FlgiN2/NbsunZ1DMCeZr7FIeyqoquvh4MNNDVyLDQ7PSU4vycuqp1jQ01FetKwIsjI9egD4WGBoMF42T3ho6tfT1kV7nent7NZDd34OyFMycvnTvNbJJ5/uzJEyeOHD5z4vj5U8evX75w7fK540f2oy81VFeARNjYWGlpac2ZM8fL0x0WYkNN5Y6tm3EF2uc62ptpAs9M4rgvIWn2ejYAkTFs4Dpv3Lr29s3rV86cPH5oX++m9agQHhbi7u4OKI+NiaqqXNfW2rildyNdpsykZuze0NlRU1FWlJcdFhrk6uJkOG++iooKjaGm/lwWd2QUnm3S+mcOJVwiVpqIjQVuNn2SkO7dLk7dxTgB6G4D45eEjE77xWv407b/JCY55JgYbdqYCgpKurq6VlZW4CLBqwPDg4mEhQaDDzGJg2bJyyvO0Tfw81kOhepqI3sfQnGIg3H/HnwC07f1baZQvq8fpuqm3g2d6SnxS5aY04X1HAwJRIkERP5GbkNkuccsspcX8oD+X4fyUautJEn66FGUuhGkpUQVZIWKykqg50Bzby+P6Ig1aUnxpYV51etKy8uKAOUY59FpkpISSorzu9a3ga3DUgOOd7S3NjU1dHa2927eRLZyPwb4PgocP3bo4OH9+4Dmp44eOnfyGNj0nv6+7b2bcE1cB0bA5Mka6JcwGJMS43GXLRtJmpS9/dsBwc1NdUVFBdnZmQX52U2NtZu6yWY3dAHRjSsXwPHfvHX98umTJw7v37qpu7G2CggOi8HT0zM6KpJCec8m0onRlSEdLRh6SHI+VIMROneOgaKiIo2vown2uMgNunPNS+z1k+F2L+KgnN21XFbC383kdaE231jWNoE+81D+E4JBx6SulNRiKui60BoLc1MwEgA6BGTI2pJsNIE/AetNTczio6M6Wxo3rW/fyuziQqF8/24SU0DWdvZtgbV6YPeO/t5NLfXV/iuWzZgxg5uypjAkxcahSo+Bci7wdIy/hbX4X8410j8TlAslZiro4iCaPI+qGZMzT1EwmrBz6ZloH9LQ0DAwmO3oYOfv5wsjLjczrSAnMzs9jbHjQnNzMloaatFFdm7bTEIGN22oqqooKCrMzs0pKyltaW7s6e7s37aFrgzesaVn9/ate1BmNsxkXByEkru6uurPma2pOXXmzJmWlpZg+rhFa0Ptxq62vs0bMUjU1lSVlBSBmAODt2/dhG538siBC2S/iAu3rl1648bVOzdfu3zuNEl1u3kjLpuUGOvp6e7i4gR6XlpYUF9d1Vxf11JX11hbA8OisCAHo8XKFb42VtbotfLy8hSvaNZAgWD0dJwoFOzlXCIkZuUCCUe55CpiUfowMp0gIyt2p0pMHTMycYorCab5RGfLS2m2Syb+FU01j53fQsMqyMlPmzYFSrpw4UITExNjo4U6M2YqKyuj/ZUUlO1t7fKy0rdu6oKZSzWRQPkBYuzu2U2WfYCSg53v37W9s6UhPTlp8SITcHkOyiWHc8kUZjSRFpevf6z1zyQo5qF8DJRjuL159fyPQDlNbfM4KJdIeSPea5z1HjBxZmOWltHriBLmycDY0tGZscTCDGieEBOdmZqEV46hHpyXRpuQTaS2be7f3gvkra+rKSwuSkxOIkt48guAwhsZOkBkUzfNsgZqvInZ+BhDAozBxWamc+fPAzumu6h4e3umJMSCmLc3N4Dvg+avKy8tLi6sr6vasL51765tB/f1nzp68PwpMsX62qVzN69evHXt8oXTJ44f2g8u39pYBwMCloS9vS0emNkXsaCitITsP52Xm5GeGrEmzNvTa+ECI3V1dS6OgqYYE9mMY3cCElIf1MvMyhkoZzNuywrH5NmgMRUCTgTiZLMiHBdwqwH/TSh/Ka0irp3ZSDMRlEtsFsgmaSGJztVUJ6trqqpOpolk0f7Kiiquzi6lBTnbezcCx8mE/04STUDDEJkdgkhe6/0obNtSUVLo67NCW3sm3UmVm88Qv0eJZM5czvHxjlzGMvsltvJ4ueLKRfswyXLb1EpPkqKr8rgkv5K5+WkeYcmc1/RreKGampoLFswHPQ9Y5RcWEhoeGhYVuTY3J6uhprJ3w/ptmzfs3r4FpLurvaWmujI+Ph51QlaTRD9Az8KCPABpZVkpCHJdVWVRYT5O4s8uTs6mpqaAbydHex8vTw8XklvZcqmFz3JvjBNZmemomZOdmZqajE9Q8s0bO9ELjx7ae+LoAZpkHMIUjh3ejy66fUNnW2NNZXJ8jIe7q7m5qaO9Q1BA4NqISDwqHtjX1wf4vnDhAh0dHfzW//mfV+gGEszOOwLxzu4Se2PSJOCUiYgQ58kw9Ksqs/MHRF0VuOhmocSKFfQlys5oLDm3xym3qxHXh0alWJpgf86nKb907S+Zm55NiisaDunOmZz7hXIRIsyiHqlXJ0FUlFS9PDxrK8p2besFcO/ds4tsA7S3/9D+XYByujkBQBzsCrZsUOAqw3nzceVJr8pIZMmXoaud5WUV6NagY/KrjNuAUJZLncbuzvISva+fAuWPhh8ODkwA5YSYMxDMbbYkI8pUzm0LK8ruz75+kjtYlD1DEsrppgpcZZGfTpom4Zo+ffrixYudnJyWey8DUqelpFaVl3W3t/R0deza0kPW3XR1tDU1AqkBnSuW+yxfvjwgwD8sNBhcOGptRFJifGJ8Av3TkiVL9PT0DAwMrC2tVgcFJMXEhAcH2louXWhkuHSJuaeHG/oWScHMHKkpSdVVZG0n2RF01zZmG9l+dEr0zn17d+Ozf1tfHxMSW11eEhcVQfYzXLjA3NTMzcUV9wINxzMvWrRo5iwdOQV5ZpW5YNIkaXGmbxqhwbQn3Rd8LJSPcby8TFAuEHlXOE8dZWfinezpGQrfotzoNKsf56kTxURLS+bpfgmh+enLrGKyXinJ8+zSP9r+jJYy+fIYSGXX5UpJA8rByqGn9VXroJh7+3cymkKyIRIHy+7tgPKdWzeDfm3oaC0uKrCzs1NWVmW2xmbdZezuTgyU0zUBEgmKfwTKqW+dh3J2OJQRKCoquru5vP7axZGhu78ZeTTycGh44ME9QDlZySIr3klPIu0OnZ2QkRw5CXIxKkk3t6ajN+frlCxz9SWSssvQoYKekWY2CAVDNzQ0tLS0XuXnHxcTW1KQ31Bd0dnSCExf39rU2lBbUpAL1Pb384V9B6Q2W2y6aKGxsRH+M16wYKGBwTx9/TnTp8/Q1Jyqq6u7eJEJkNfLxcXV0WGJqdlsPf2Z2jN0dWYB5QG+ZIJ++fLIiPDsrLTy4oL66or6uqrGhjqSI7elqaW1AYJCQ31txboyDCFJcdF+Pt5LLMwwTujN0p87Z97cuXNxl6lTtYhbnPGJy8sryskqiQYtoZjUjGofyWNsW0m24UtRZmT8+Z/aJmP628vbnjL/Trs9Tn9Fb4ewMzmhLLM+maxSBiv3X+lXX1nZ39e7e8f2A3t2Hzyw5/ChfUcP7gMT2ruTbLi8bfPGgpzsZcuWaWlPx5foDCddDUCDJsbv1PGU7+5leL+jqAzr1RAvgsP4x80bAcpBT+/cvDIy8E8C5WDlgPL4iaCc821Rj4gkNHPMnXVlSgSEjQ4OGzXCCEanwBeMcoaSJ9PS0l60aLG7qxvdJnRdSWFdVWVtZXllaVF+dkZyfEzAKj8MREstlsBw09aarq42WUVFRUlJRUFBSW2yhqqaOiCV/nz0PKGUtCybzBqjEMw5RTUVVQ0NDQAyruDt5QFenxwfl5uTlZebDSkqzC8uLiwtLS4pKywvK8E/szLTY2OiVvmvtLO1njNnDpoIrAS9WVlZmdyCTR4iTSMuZIWKo/YSZJjF6PaR4Yax8W3Fl/nyL19+nP6KiBeT2UaG8mgC5arKakEBgQ01ldu39JBFnrtI1Mqhg2TbLCYn4vb+vs1d7W2RayJMTExgrUqLwlG4hV2j7LBx22Lw5TEMXShxjHGOKSgoeLi7vnHjMutgGR4eFkM5l0FUIpKXm1lmLy3H7t9Iw4F/vCwcteEZu82gaEdtLsUlO/vBHGDW8+bNW2JuAdQGBQheHRgRGhISGLDKd4WXm6u9nQ0IstG8uTOmawOaFeUV8EUuQQ/r12OE5gmiXjYYBUoKihqTNZUUlPEtMPSFC4zA7sHxfZYtx12CgoLCQ8MiIsLXro1YGx0JlMd9fX19HB3tQf61tbXpWjWpV6UnvSI16ZVXIaQ8SZrN5AcDUIpknhGvSJRj/bw0e+eY83yZLz//ZTazDSAcPX0SdEmgrq4ZGhxC0mBs29y/rW9XP4laObB/N1mu0U+2zO7ubAEHcnBwUFOfDBXkAthEF2TTZnFzJLK8XjyhTGaGpCgZxWjKCM19Rvxd8vLyri5O1y+fZVi5CMoTRFCO70umrBvjw6LxS3RP4Z8A5exIwqa6p9NTXJok8etk4q9psBrINej29OnT5xnMNTFeZG5qBvi2MDc1XbxokbGR4fy582brz9DW0pisriDHLkciSCotyukxeudsGmkzTUNzjr6B1tTpU9U1UNaaOg2ADnaPi1taWjo5OXm4uXvhWObt4UXiDq2slpqZLdbTm6WmpkZbQJSIVYqSFBq5RScAyI2k5djEv6KF6ZKrFnko58svIpTQMBeSWF6KTNNPmTItPDy8tam2fztxsOzds4tsG3Rgz2EC5dt2bu0BYQfWGxjMI/lzJk2iKT3GQ/mYNCzjhxBuy28eyjko52LwKezQYEQxlD8cGh6890NibAyZ9uSSHMmItwZm9xFm/VxCbtpKNN/JTkc8rkygeRIlyOJRhWOyDH2mh0BSiC+eOqGFcjgw/gDZJ6uqUcGhqqyirKgkLydkfHnyXMJYyX2yZUnQI2vQ4Yepq00GdmtrTQeOa6iqqSgp4wpqKpOnaEzV0tKaOXOmjo4ucYbr6c6cpQMarqGhoagoL6fAuEokNooVHQLRPt9st5OTVQIBF619GN8mMj/aVnz5R8si3yvfJr9EGdghKyO27tHHZ8ycFRMTs76tmYTw7t11+NC+Qwf3Hj6099jBvQf37NzeuyklOdHCwkJZRY3CP4zXV//fK2yAG7v9E3O8yqo/385PKBOzRk5yaY54nQraUkFJEYzzxpULIwN3xVCeHB8HfOQ29WAX14q+KRTKjZoCHeeef0KZQjZN7kpHFTLC0FAWNuWWeJd3ugUBPiVTL4kDHwU0hl3AeJKE4OMURCmUUzSnnxRkcZ78ia6YZ4YpeVk5JQVFCPmuDHEC0h27JffVflVqEu1g+LeUYBLh2RxxEMVZopcKmSTZklBOlzZIS1gzEsPhU7UVX+bLz1VZMhc83YtVT39OXFxcR0sjODibBmPvziMH9wDK9+7c1t3RvjowaPZsA1kS5yb76quvTmIOOvfGwRCld1zgygTTfRKrVV7yd0GhfGx2GjIPR6Dczc3l1rVLI4PfEyjHMTT4ICE+VlVVlfNcM9BNkmFyO0twUE5nUUWIKTdRWShRh4FUOTnZiQ6O5wJN6RkZZtsKurGInII8NTQktywQ+9yJk0e8FYactKwc0+1QoD531ukhJcMtLaHTBdRPR3EZQE/2nRIFRbHUXhS/zKYEETerOPSNTvuzbIXz+4vivejwwPoEJ2oTifkD4RPq8GW+3Z5tmeE6Mpz1qaioONtgTkxMVGNt1ebuDma/t429m9Zv20KW6XW2NOblZltaWqqqqQs5P7tYW9ndgqC2dE9XWYmdPPk2H1+mWT/pljUyzAILumyT6/+Acm9vz7dv3xBD+fDQAIVylgiL/DWSeRBp7kPJ5Rjjd/qQXKbBbQsw4cEtHRL546TZLWCYsWS8n120q4Asl3Nn1FokZhtAUGISr/IqswMy1xyCUSvcWEYvkXtAtERCILF1MrPTCr2wKF5eYlUhjUKRpqYCoRgCaQm/v1DymccsXXncMpanqc+X+fIvX6a2LNVNfAJWZs6c6e+/MjMjpby4oLKsuLysqLSkoKqyrKq8JDM1ZZWfv66uLpnnF+WUlxPt2MktLeS2BxGf4dv8ce0/OusnhXLqpSARLEqKXl4e77xxk0D5o5GHjx4NUyinezVNkhJQ7wrNJT2JWfYi4cWWkiT/kht3jTEQOOjksFsyIE8SzsYE6gEZIcTLwaRwk3pVmojIn87MbcpI+KPF+z1So4xj4hLPMDp2dSI/Pr36RGUBtwkZZ2aKwnKElF+QaH1yGxm64nlsO4xLb/DvGVxce/7K6j/NdZ7mu7/W9nlW9TmVISpAV3S/OumV//l/6MZqamrTpk2ZMWM6J9raWtO1pk7R0AQdFE2kyYgWAwq5HaDo5mKsd1XsYHkqh+RL+76YeYVJ1FVF5/8mvUJ2Rn3llUkYI729vd976zZl5Q8hdLWnkpISgTDRal26yg6Ec9Lo2Ug21RFNYCYjmp8UlaUFY/xfQoqAbLDqOCjnwlo5KKd3x/AhQnPRQCJNov2kBXKTZIQQDs3H9YYJy6J+yYwTEoPBqGlJqUlCIuxMrICu3pSWTOckFAu38pB+ssPVaDV4/LM9zTPzZb787Mt0+oqmMHwF+PHKqxzlImRIwAqAhm6+LJ7eZGbtuM3c6WJA7moUTMZEyvFtPr5MRr1JLJRTzwRACfLKq1JoVS8vr3fv3Bp5QOLKHw4NPhh+8ENSYryqqjL4prwiMYik8KqAVrJyUsR1Icss/ZLjQqSZ7BnMjkKyJJMG8zmqLMNm2BBtVSESXGrUsiAZ+fHnyftmbiolZPwtoj0HBHLyzPXJLdh7CeTYtWriwviypDBjAP1F4ueUFAXusbmdVthlb6L0/KIfjksJJG4k5FbNifZSUJCQMdef8Dxf5svPW5ntpdzSHkqAWFUl+ijHsiIyUUXM5UnU2ygg2wO9AvBnHJ/QWRSgetBBWp+pyaoqo1YKXI6dcfr4Urc/EJLDFonN/ORJg8vJCxUUPT09f/vm6yyUPxwevH/3H6kpCeqTlUHfwc0VyUEWogPWOVFQUMIpBSVF8k/ybyX2TwpKCorKXFledB4VGKGHksLo8xOVxcf46zA3VBx/njyo4sT1xWVGuPOyo+tL3p07L4ciPUP/Sn81FXl50Xk5ppnkmRkdeYnzE9/3x88/TZk2BV+fr/+L1IdqKyqpABOoOsihpxOlIycVlZUoJqD/M4qoTPWdKIIcgY8JMYGcZw/Fn4gPL6O+sKgriUX0vBKBYiUV5WXLGFbOBCM+vH/v+3/89bvGusplni6uTraeLo5Otlb2VktcHGxdHOxdHR2cnewcHWyc7e2YMhEUuPLjRLIOLUvK487TO3J1nBztx9RHBWd7PIyNi50dHgkFV0c7F2dHpoIdhNZ3crSVLEPY6zM1xz8Dfiyu4+bk+Lj7ujs7ubo4QFBwdyYFF2d7Ufuwddyc7HGSu+/oduCezelx7fNjZSe+Pl//l63vBI0gPZ/ROyc7a0cgg52No4Odo60N1RrmpA3+ymEFTro5OEA4RcZFxuj1j2LCY3TnpWv/8W2FhgXukdfhaO/m6pyTkfr+228M32eg/OHDoZGhB++8eevsiUNXL5y6ff3K1bOnzh8/cuXMySvnT1+9cObKxTOXL5y+cv7MtYvnrl48d+3S+dcunScbsF06/wR5jX7SavjWxbPM5zl6ESrXHiNj7sVdE2cunzt96exJRk4xchJXZu9y+RzkNVGBLUueF13k6oWzkCuMXGXlDOQa8yd6nntO9vdeufjalfPXr164ceUifjvK5LIXyWUl2wTnSTUUJNqBfSSuLHn+6csXL/L1+fq/cH0IlBFKR3UE6nbx7CkqzF/PUWVk9Rp1Lp0FXIh06izV5atiLTsrqV9QE6opVDg9mkB3GP19Od8XaS6mDWkjv3b+7JUzp3Dm5tVL+OsbN1/78x+/Hhm+zyS5fTQ8Mjxw7+7ffvjH/w7+8PdHAz88fPDDyP3vR/A5eO/RkEgG7xORKD8c/GHM+eGh+5Ax9YfZK3wvvtTjBdekQv+JR6TXGWau83Dgnvi+o79FbzQ8LL7LqLJEZe467K8YIP/EFYYHvpe8Mq2DB0B9DHXsb5G4Jveo9FuSn+KHHxLfaJRM1J5PLo/gYX7Kd59tffQc0nn+g+v/m231grTPC9P+UI0H3+NzhNEFrlfjk4q4jApDD9g+L6GVVL+AKoyQ60jq11il+Ol68Wt9v2KAAsLQtiLI/P2je9+P3CcF8n4H7v3wz7/d+9ffHz0coHHlD1EavHcXaD54/1/DD34Yuv89vgx8H3lEBH8deTRIhZbxyZ2ULEieZ/80MjQyMkivI5JBkQxMeB7feogO8fAB+Se+Ts+T6wyxFxRfYXB0HUa4MndN5rtsNa5AZJgpD0s+PPsTJO8y4fUZeTj8gPvJ7A9nKotOsq3HlIeZwtDjGvPHzz8cJG/k4QtQn54nn8P/wfV/7vMvTns+q/anVyAATTCavdqYygx7u0e0lbuphIIwuvxA8nlYEdeh2jc0Bkb49zumKdiv40Uw4yvDMgfw+eD7f/7w/b8ejQz+5hFh5TiGfwkZGSTyuD/9Ms8wSh5JfD7v9xp5yer/3DLC1/+PvzvCrEqhhZF/8zo/lw7+Wvv/iMSlRIVHD0eGCZQ/pGBO/v3oZygPQ56uTOTneQa+zJf5Ml/+dZZh70NYKOeFF154+akCBBlT4OVZCQ/lvPDCCy88lPPCCy+88MJDOS+88MILLzyU88ILL7zwUM5DOS+88PJvCYcePIzwUM4LL7zwwgsP5bzwwgsvPJTzUM4LL7zwwkM5L7zwwgsvPJTzwgsvvPDCQzkvvPDCCw/lo6Ccz6XACy+88PLiQfmICMopiA89HEYBn3zT8MILL7y8OFD+iEmVODIyMDQ4/Gjo/sC94eHhoaEhnp7zwgsvvLxIUP7w4UOyAQWh5+Ic4oPAc56b88ILL7y8QA4W4Dho+P2BB5x3haYzH1ObnyPlhRdeeHlOpz2pALgfDA4Ax//1/V1Q8glRm4dyXnjhhZfnN4IFn8Q7zpx6MDAEWs43DS+88MLLiwTlxC0+/OjbP3339e++gfzjn3cB5cwsKD/zyQsvvPDy4rDyoaGHx4+fLCktz8nNv3T56vc/3OegnAd0XnjhhZcXA8ofPBisr280XrR4lq5+e8f6v/7f3yWnPWmw+YQTobzwwgsvvDwPUP6QsvKWljZTU1MjI6PO9d1/+evfgNqDw0P4G44f7t8DSQeg43MMT+cnQnnhhRdefmkBcD8aGQvlhG4PP2pubjU3N9fX19+xo/+P3/758y+/+OiTjz/77Itvv/3zg8GB+wMP7j24L0nMeRDnhRdeeHl+oJxMe4Jy19c3WllZzZ07d/367s2btxQUFgeHhK1dG11bW//2u+9QHCeumMEBSVY+TK7JYzovvPDCy88lQ4w8+TwL5QODw/UNTVZLLefPnbd8+QpTU/P5hkaGCxbOmqVnYbE0LSP9t++/97hgc1544YUXXp4xlAOcBwYGHgwMNTW3mpua6c3SNTOzSExIXd+1YcPGntDQcENDowULFjQ3N3/33V8ePRqhPhYe03nhhRdenqdpz0fDFM2bmlpMTU319PTi4xPffvvd+w8Gh4YfnThxytXVFSfDwsI++uiThw8JhR8TpMiHtfDCCy+8PPMIlsGhoYGhoSHwbjMzszlz5rS1dfzlr3+jS/m/+uqrwMDA2bNnW1lZ3b59Z3BwmOZp4RGcF1544eXnF3GKQ1pmo04eDT98OMScJOeHRoZ/MzIydPfuP+//cK+podHc3HzBggWHDx/9/gcyyTkwNAi2vnbt2rlz5xoYGFy+fPnu3buS6RL5aBZeeOGFl58VygGuwO1hUO6hgeFHZMKSIPjDoeHhQZLUFqD+aGhwZIg4WADld//5r4a6RnNTMyMjo4MHD9+794BC+Z///L+hoaHGxsa2trZvvPEGkJ2Bclx9hBslyKUeDY8fPR5fnrD+I1H50c9Q/5FE/Z/peX7q7+Xr8/X5+s+k/k8tP8vnpw7w4aGBu//6x4MH95jKTBzio2GcBL4DzYdI2MoAmfZEjR/u3musb7IwM5+jPzs7O/fDDz8mYS1Dg6dPn3Vz85g/f35ERMQHH3yAbw0OPhh6SEYDlMnI8GiIFkRlejy5/DPVp3UGJqrPhMP/0s/D1+fr8/Wfw/oPX6Dnp1AOTg6Mvn//B46hM/D8gEI5Q8+HCJRDhpi4cuort7GxKy+vOHny5Llz51JTUxcuXGhotKCuru6bb74aGLgPKCdoznwSGbo3JCqIy2PqTFj+ReuT43l6Hr4+X5+v/0zrS2LX8/n8A4NEhgaA5jgePHgA+KWwPvDg3sD9B4MPBoDblLk/ZHzlDEMn055ktaehoeHSpVbW1rbOzs5OTk5z587FmdUhwTdu3MCYQIYCRrjC0PD9icuSdR5X/uXqk+N5eh6+Pl+fr8/Xf2L9QQa1hgeZGc6HhIwysP4IcM0APaXkI+zub4MslIPR79y+IyQkZOXKlXV1DVlZOR5enjZ2tm5ubomJiUeOHPnb3/5GmTwl83QooKPBuPIjUXn4MecfPf78I74+X5+vz9fn64vKE8zzgaQzIDw8QjF2ZOjhCOMrJ4PAwODHH350+eKlCxcu/O53v/vww4+Pnzyxa8/uEydOvP32299//z3GBDB8iubU9S4OjmFmUZ/FdMSTy0+e6uTLfJkv8+Xnuswu6Xw4CmM5f7qIod8bfviAhfK7d//5w/f/uvevf37/j78PDtwHq2e/T6CQ0HcA/Q93v//+7j8fPLhHBoSfHhf5NDXHx07+ezGY/63nefwTji3zwsuvO675p2rHz3H9/1x/X0Shmy3joGydOF5E5YePBh4OP7j3wz8HHnz/iDpYgOOD9364f/cf//rbX4Yf/AC8xpdpuCGpP/xw4P6DgQf3gPL3733PTLY+fDT6GH+GsxRE8pTHT63/U7/7n1yfP/jjZTt+bn35z/FhWOLz13aIl+/QUBb62x8OMct4BoHjkAf37w4O/DAywkSwPBweHBl68ODuPwZ/+NfI8MAj6oUhtcmXRwDrw0OPBgeGH9wnq4qYiJefKEM/c/2f+t3/5Pq88PKyydBzdv2hceVftUZTNGZXYQ6OPBwkv5dsJ3EfAigfGb4/Qlk5GPfQvbtvvX7j/Knj504dv3Tu7LmzpyHnz525cOb0xbNnIDh/9jj508Wzp86fO0VPoiBRJjLR+Z+7/Lj7Pqvn4ct8mS//kuVTFJR+Rb9LErvOcOchF86chOD3ApnPnD5+4fzZO2/c/Ptf/zQydP83gPm7//rb3777trwo39HWytR4IcTcZNFiE2OTRQtNjEkBssjYaPFCI/rXcbKIEfEZ8sVFY8oLIKPP458Lnlx/9F3Gn3ncdx93fcln+KnP8zTXH1v+qc/P1+frP8/1f+7+/3Pro6i86DnR9yddXwJUAbyLFyw0NzY2W2TM/hOyyATVzE3NkhLj33r9+qP7/yQ5WAYefP/3v/w5JSFWQ11NWupVgfQkoYw0RCAQ4ENGRkYokME/SVkgJZCSxictsyItYIU784uLrDSR8WVeeOGFl1HyrMHqqR5PJMBb6UlSQilpKgBngsD0TwKBUCj09HB79/Ubj374x2/oAv+h+/dSEuJVVJTwPVoDh7RAKC0NIJeTlZUHoKMsYL4uQw5ZGfEhWf5FDzzkz1qfP/iDP56zQ5qRp1VqwkfHHrIvyC/Fc8oCb199VUrqVWkW1qXxPyEDxeRTXl7R09Pzvbdujwx+T9JpDQzcB5THxUYTKJeRwiErKyuUlQf6SzFQjrKAuS4E+M6VgeoMsP9CZTw//W2PqSPzU69Jv/JMfgtf5st8+cm6ycHZf11PhUK5FwYHZGQJC2ewm2HSAg6BcVJOXtHDw+PdO7dGBu7+hoYSPhx4kBAfq6amQpEfUC6nIE88KVJg6HL47USYJpBhRMjIY8tM/fHlxws9xn1X4prk6SWuj59KCjjJ1icH+5yiL4pFdE0ZUVVZmSc9z+Oe/6f+Xr4+X//XVP9xOvs0+vu464/67qhqUFJOT3/i9Z9cllEYg2lU6L2eu/ZnRBbEWkrA4DnBPfwTn5MmScvJKXh5MKwcUD4yMsIka7kfHxcDKIfxQlm5rDwzcJHRgR0lUCaeFoqqohFj4vLoUYU7/3iRMCge/10YB7KMoEgZOjeiiqCcfIN+i45d7ACAXy4nS38/qjFzAGwvYcY6FuXpe5VlKtPXTKH/cUPLj1snT9M+fH2+/nNQ/3FQwvpTn6izo8oStIm9BVUxBjo4+J4QyiVVTOQshrrKUi8KV1nAeomZrwCn5Ag0c1yVXkQg8k7Q3yi+OM5L4+JCxkEhLZDCv9lHpZgwiqE/B++LTE2KfgttW/xeDsoVFJQ83F1vX7/CQjlZjs9AuaqqqujNMfjIwB8l9vRVSTbT0wsMAelJ7AwqfQ0ih7sM+z4EsswLk6XtiwNDEL0vyngbTEFGhMVy1DuGa0ozpgftTMQpBLJOhAC0NCMyAnn6vplhgBz4BwwPqVeZSQFiugjxOvF26XXYIQEtiAeQkryyHB1L2H420RD1dIMWL7w8W5kYmrneS3VcKNY1ok0iSGVdrNIi3ZQmDllWoynbHeu4YJWd/ScZMeTk5OWJMsrLKlDoJGdkFRiWJstigoAq6STBK9IUdmVF+osKUpNewV9lGXhnzslT+JvEPAlUnjI5ZnqPHEw1QgHxhAJo+iQB1J84oKUEDC4JGcCRIngyifowBGw7cI0j/gnPy7ujDmcFBQU3V+db1y6NDP7r54dyAXMFZtZVdAjHPJYklHN1mKaUoVE05L1SV4+4ixCoJV9keDR6g7KyMqwKVVVlRUVFypqlRYybEg3aD2TY4VuopKCoqqyCT/QnyQ7HjgRkcoVlBOLnHP12me4iO4qA8EjBywsO5dw/RwHZaCiXoZAt0mWhiN8QZZSXU4JSySsQ9wjhQEIKtSgAwSerqk2bMnXatGlTpkyZqjlNY7Lm5MmTNTU11dU0VJRU8T0FOXk5IREZEqwhJSslBOxSKKcEjkEwEtHBBtcJOQtAhgnLEFImzkG5BKOXI1gkzSo7q/LM76LDkiRGvWhQfuGXgHJRk7HRM2O6kSSIMwGQQjZ+RgD6LM8aU8z4zMzhCiWvRidwVVRU1NXVZ2rPMJg9Z6GRodGC+fr6+hoaGviRdBggTFyOJfLkjEBKVUVJe/q02fq6cw1m6+rMwq/m7C+WgzCWBMPWRR52wSgZ++t4KOflhZIx3Vjy/ARTjmL6JeGpEPmaZURuTBSgaOrqanp6s2bpzJg+TQt4DU1UV5usoqSspKSkpqY2Q1vLYI6+AXR1jv6cOXNmz56txxzQ3ykamqBWqKmsqKIgp8jGpVBMkBbb4vi3nCwL6CzsSrPUkDOpRZrInZHhoJllfvKK+D/ndOV+skQwzPP+Bp8BlIv8UD8Byhk3iLwklDPEXIYZPxmiLZCBBaioqDxt2nQAt4WFhaO9wzIv75W+PhAvD09zc3MdHR2wAFTTmKw+ffo0EHY55tDUmGw4f66NtaWri5O7mwsKc+cYEDRnnDByskrECmNYORiBUMCab2OgfEI14IWXFwjKnwDxIt4jlLSSqZKKCTgzn8RSH+K/JQ4Q8CodnRkLFy4Ao5o7d+6sWbNmzAB6T4doaWmBjOvp6iwwnDd//lyIIXPMnz/fwMBg1kwdTXUNdRXVycoqqspqEFyK0V95ovXSlGMJ2JUuTPA1jcwjvHuUP13I0nPhqHhEyaGIuo8YdykNs+Z4Nw/lT3aUs80qy42cE0G5jHgEplDOuvaFonh24qIhK5WEQjy9morqVM0ps/X0rZZaeri5rw4Mil0blZGSmpuZkZWZnpaSijN2djZaWlMxzuvr6qHfAM0VlZWmTdcyNzf1W7k8MiI0MTYqPjoyKNDPydEe7EBZRU1WTkHSGy4nLctNjXLPRh07RCawuV6MTsALL09wpHD9nE4jUR8FUVXGFc46nUVRZCjDMlZWVtZkDm2QboZxE6I9cybge6rWNBTmzZtnbGxkYWFma2Pl6GDn5Gjr7GTn7OSAsp2t9RILMxPjRfgeTGRgut4s/dl6c1AgvF5jqpKCsog7y0i4QUQPKSMjcvIIabw5PUn+KS2QBycUsjrLkHcZOuMKEBexctZTStuB9cHyUP64W0rMaI9qJgkfnAzbdQQslEtOb1JPmZKCIuAb3QKwu2C+oYWZubOjEyA7PjYuNzunrKi4pmJdfXUFpKpyXWpySvDqQPQefEVbW1tXV0dTU33KtKnmS8xCQlbnZKeXFxdUlBaVFOakJcWHBgVaW1ppa89UUlYllhczJ05ntKmDhevirCuNrskSz7hyw5IM47/jAYKXFwbHx0C5iKaIHBfMlCDna5YVhZBRpyWlXMrKqlOnTgUB19ObNW+egSFDunFAT/FpbGxsZWXl5uayYsXykOCgiDVhUWsjoqPWQNZGrgkPC8FJ3xXL3V3dbKysl1ossVyy1MbK1sHO3s7Gdom5hbHRQp0Zs9TU1BmVZMYVgruyomgWGuZAMVogJyeklrcsmRIVMLGMBN8FDIsnk5w0GoRx6FM0R2UaqS0j8qzyUP7EYZ9aNOO+K8kCmFVMAu7WYnwUkvlumGboFugTLk7OoOEQn2XLw1YHZaQklxYWNNXVtjc3dbW3behs6+5obWtqLC4qAJq7ubjq6+tPIYeGlvY09Co/P9+iwvzGhprOtsbOloaW+uqyovystNSVvj4mJiZa2tPVJmsoKqkoKioS97qAnSMFEeCEBkhxXvtR86W844WXFxfWRVP9LGUhvV2GRnTQKBFZURgYVAO8SkVJGaIorzBZVQ1Qrquru9DIcOkScyurpTY2VjY2Nvb29q6urit8loWFBiclxmdmpBXn50BbISUFuUV52QU52XlZmRkpibFr14B4eXt5uLu5eHm6+/msCAoIDAzw9/X18XT3gOU9f/58IABux0A0ca4S01xNjfCzKRpTNDSJc0ZdDaJGHDNKioryBM2p5gqkKNwDypkF8HJS0mTVDIVykfuFC6uT5XzrPJQ/FZRzrjdm2JfhbCV6E5wmgUKMY27yZA3AMXqGl5dXcHBw5JqItRGRa8LC8ZkYG1OUl1tVXgL47unu6tu8cfuWnq09GzZ0doChFxcWoUOYmpoCyNXUVWcb6Ds6OiYkxNXVVm7o7ti6uXvrpq6ervbmuuqK0pKY6LVeXh4mposxYOjo6IDI41voo6rKKnh0Auh4/9KC8VAuqQk8lPPy4gp1Y46BcupgoeybuMPl5YEdwHFl8B0lZRKoIktgXV1dHWhrZ2sN4A5Y5RcUFBDMEPC42OiM9FSQp+qqisbaqram+rYG8KcalBtqKusrK6vLS0oL82AZg6r7rVwBeg4Ej1oTkRQXC/QHcwdtx2knJ6fFixfrzdIl86LKipPVVKChDOU3Mjc3BXk3NzUDFTMwMNDTmz1jho6GxhR5eRKZRqNcMPbgBwLHFVWmqWnqyitpCGQURGtNWKcKjVqRZOXPZQTL8wnljGuF+ijozAm3MlOKiVjFCwCe4hV6e3oBwRMT4rKzMvKzs3Iy0tNAuZMT8VlWWtxcX9O7sWvH1s37d+88sKd/765t23o3tTc31FRXoic5OtpraU2dPFl14cIF6Gdg6+1tTTu2bzm4r//A3p27d/Rt6uporq/DNaOjIleuXAG+j2EDA8CCBTAT5+nr6k1V11CWJytfZcUJbmTE/sSniAp4DvvBM6R+fCM8FwFt1LEpkCcLLwSyNAhkjK+cnkcBeAHgBrOBqKmoQmisIWO2CpUUlMF+rK2tYdoCkZOT4jLSk7MyU/PzsgDTdVWV0C9YzBvXt2/esL6nuxOmMwRm8frWJhApULHs9BR8EWOAv5/vmvDQ1MQksHVwdjB2ADr+hLHBzc3FzMxsFjlmzpmjb2Fh5uLiBCKPm+Jbvj4rvL29XV087e3dzc3tDQ2XzJw5b4qm9mS1KcrkUJWTVRYK1QyMbM2tls/SN31VWklGqEADlFn/uKxwgiBpCTTnoZxZagW7TE5BRmKFpESnEbIB2iIop0sMlJQUdHV1li61wJgcExWN11pYkAfgBoMuKcjPzYFhlpaVmb6uvLS1sQ5MfNf2rccO7zt+ZP/hA7sB0J2tLfV1NakpSZ6envr6ujNmTMe7DwpchfrrO1v37N5x4uiBk8cOHjmwF2PApq71lWWlOdnp6IWk3wSu8vb2tLOzsVyydPEik3kGc7U0p6gqKskzfZd2X4kJcp6V/5yBFo/RJX5I+M+hnAb5keAQiX5L5vlF0SDysgoKcopg4hoaGlM1p2hNnYbPKRokBlxRXknkfpTFP42NjWE0r41cAz0tKc6vrCgFQsP8BfsGqVrf1gpDGVoGKIcA0zesb13f3tTV1gyGXl1Rkp6cAAQHIq/yXxkZEZ6Vll5aSKayyosLoOlgbDExUYGBq2BVL1q0yMTE2MpqKTQUxB93TIiPBcmLj42LiU4IDY1duSrW1T3MzjnY0maFqbmTsfGSeXONdGbqT52qp6o+x9TS38U7doGJq5RQ/VWBrMQqcTawktNrcYTx89rTnh0rlwzeFMiK7DjSmaQFchTuWZGTVZ2sNmfOHAd7W1hbeE94nZUV5VWV6+rrqprqqmsry/GOC3Iy83KzcbK1paFva8/+PTvOnjp6+dypcyePHj24b+P6zpaGxqyMzBUrVuJSM3RmWlpaBgetBlXfuKHz6KG9qPnapXOXz585vH/fjm3bW5tbCI0vKy7Ky8YAEBERvmLFcnd3dzs7OzB00PPp07RATJgJcXEuF/ECXDppzqgEjzL/FbDm5eeDcsq4OfgWWZlCiZciVFJSmjZlKro9DU2ZrjVVZ6b2zJkzZ83U0daaMVlJTRGsllnprqk51cLCIigoCIoDPW1qrO1ob+7saOla39bd1Q6rF8rY0921cUNXz6YNmzau39DdsbGrDWi+sbMVFnFNRVlKcjz4k8+y5X5+frGxsfl5OdQhA00He8vLg82cCtT28fGxJoelu7trSHAQCDtgvjA3pyAvPye7IDOzNDqhZPWaMjffHBefTCfvBFevNZ7eqz08fAlVt/DQn+9ibrvWwSt17kIPKRnNSQJ5JhiRYeWiPE7jA6af2/75bKBcIG6RUVBOI0aJpSOi5ApKipM11E1MTNzdXCLWhKWnJQFcy0oLqyrLMMgDyiF49zDc8rMzAPFg2U2N9Vu3bNq3a8el86duXLlw6dzpU8eOo9s0NnRkphf5+q42mGs0TUt7qZVlWFgYhXKQ92sXz75x4+rrr105ffzIvj17N23Y2N3R3tJQ21ADSlEEchEdvRa9c9myZQ4ODosXL56jP1tTXQPtg7ajoVE0VpVdxC9a1jRGJXjh5fmEcsnVmxTWRYkr5OSghcDxadPQ52fr6U9nDn29WUYL5oMUg9ksWmgyZ9bs6Zpayooq0AUAvZWVVUhICAAX1KqxqbatvYmDcgigHNLd1Qk0h/aR850tEEB5W3Md9C0uNnrFch93VzdAeUJCQnFRAUxqgHxd1bryshKY49B01AkICHAih4Ovrw+1AIry8kuKSstLqvLyKpMzqiMS6latbXFZVeO8qtLFr9AnICskPCMsNDEkON7HP9HWZa3DsiznZdmLl6zSnGaooqopr6hAUwhQpzm1M8avfeGhfIIOxPng6IwK9dDRmXEBs+hgyrSphoaGYMSxMZGFBdm1VWXNDdWtjXWNDTUY7Wuq1+HFlxRjJM4AyoMFFBXmA517NnXt7d9+9eK5N29dv37l6rmzV1vbt5VXbIhPqfTxjzM0tp4+U9/SyiY8PKKqonJ9Z/uJIwevXz7/7p1bb98G+J89duRoX1/f1i2bwRp6uju7AOn11QX52cnJiaDn/v4rYdDNnTsXnXvq1KnouBqTNZWUVMYsGuaCt34SlL8MnPQpG+Rx1X7064LR6RPGLMHlM+SM10S6rIajUzSPBT2UlZXRyWdM19bX1WMCxGfr6MyYP3/u4sWL7OxsXF2dvbw8XJ1dbKysFy8y0dLSUlRUhF7A5A0PDwW2gk3XN1QzUN4GRQNqQzZ0doAn4Z/MmQ6g/Pr2JuJgaW8BXgO4w0KDXZxIlLmf36rU1FTAd1NdbTMzO1q9rhQmOHh6clJCyOpgDzeYyq6rAnyB7GVFxWUl5RVlNRXrWrPyW2LS21ZGtXiEdzoGdTgEtLqsqluxujxsbVl0TEFsXFHo2mJPv2zXlfng7E4eURaWHoYLFs2cqT1t2hQm3IXh5NDgSVI0+HJUaMY4nX0e1PbngvKn+G0yonh+dunBGCiHKKuqzJ8/H6NuQnw0kLSutqKzrX5jV8vG9e2drU3NTbXA8dISQpnxXvG0CXHxOVnZIOYY7fu3bbly4fxbt9947drrx0/dKqnaFpXe4R9Z5eGfbmTuMWv2Ijt75zVrIivXVXS0tx4/fOD65QsfvHn7vbdu37x2+eyZU/v27t69a2f/zu07+3q3bOoGlYARUFJSlJGRFhMThd4DPqKjowMDU09Pb+6cebNm6k6ePBlDumihv4xEHC6/SuiXcG3/1GvyUM45T8S0g6amELBZroDjwGV9fX2A+Py58xYuMFq00NjExNjScgm0EgQrKHAVYDc0OAQkGmfmzTOYMmUKOPvSpRahocHZWRkEyuuqGhprWpob21qboWvtbU2drS2Q9raW1pYmnFnf1kxCgdsa25rqq8pLwOV9lntbW1oBylevXp2dmQW21lBTTU3kmnWl6xjuBmUPCgp2c/Xy8FwevDo8KTGtuGhdWUldaXlrQdH62LS2VfGdrhGdzuGb7UO3OIVscg5sXRZcGxhWFh1bkpFZG5tc4x+SvzK41C+0KDA03T9grZf3cgxOpqYmuro6Ghoa+O10LvfliiuXGQ3cP6ZULB8XpTyUYn1zUjLcEEdi9hUVtLW18UYDA/xLC/MwJm/satvS07l96wZmZrKjo6URQzRoeFpqclRUJFhAVOTatJRUjOqgAP3b+q5dufrm7XfPX3pr+8E7UbnbPCLbHVbX2vnlG1kH6M9f6ujkvjYiqqaisqOt/dihgzeuXPzo7Tc/ef+dd968dePqpVPHDoOqHz247xBAfUff9m29nR3NhDNUryvIzw1eHWhtbT1nzhzgOAYbc3NzCwsLWA/ox8z8D2ua0UVD3Oq4iZcbMDEDE5RfGkCXTEH85Awh/940Mp2aFjuCRe0skCEyvuZLGncoCjTE7weEaUxWBxmHAs6aNcvAwMDIyBAYR+HVydHe3c3F12dFRPia+OiolIR4oGp4aNgq/5WWSy1QGVBuungR1DYrLRUmci10rKK0qqqipqaqvq6msaEOFBt2blNjfUN9bXtzAxS5s6WhvakOpBsYHRMVTWekXFxcIiPC83KzK0qL8Cdii9dW1VVUEDs8vyAhPsU/MMLeeYWbR1BYeHpaekVRcVthcWdWfldMWuey8CYn8PG1Wxyj+11j9rqu3eka2u0eVO/lXxQWWVhY1Jqd2xifuC4uqSohqTwxuSAxKT0mJiYkZPVKXx/8QHNzU0PDebq6urC5geljdPb5dJn+d6BcKMux0cfas2NmzEVZiYWSqyW5FUAw09TU1GbPno1mjVoTWltZDhq+fUvPnv6+A3tJiOG23k3g5ni1ML7SU9Oio9euWRMWvTYqMz2jrLS4u6tz367+Wzdev33n486tJ9OqDy9P3e4U32e3dqN9SI2ZS6zBQjtXN++4mPjG2rquzvXHDx8ClH/623c+/+i9Tz589/133nzt8gWyaffpE6eOHT1yYP++XTu2btm4uQd2YXNdbXVSYry3p9fChQtBWEDPHR0dPTw8nJycjI2NZ0yfKS+rQONwuflPrq2o4TYeyiXztD3n4EtXjog2MRGOSav0ZGuMy1VEXz3es5qaurq65tRpUP8Z2toz8Tl1qhbOMA4rWXojfEVBThHCxAWL+xjOKyurqpNDU0VFRUFBieuE3LOJVgPKcMMAiZ4SKgplFOiUjDiNJRdD/YLjMtVQTpskPQOPE7Ap/HBlRSVNdQ3QEa2p03R1ZgHIgOPgK+jVYNnOzo7LvZf5LFu+fJnXCp9lQQGBsdExaUmJORnpWWnpNEYQEE+t1QWG85Z5eybHx0E/q6vKYSiXMUfFurLKivKainVUwNmb6qrbm+ohLfU1qIzrrFy50pQ5li3zSkyIKS0pAGMDHwcrR+XG6urKsvKCvMLYuOSVq6Id3MKcPWL9VxdERNfGpbTHpnauSeryj+5yCVlvt6bXMX6PY9wB+8h+l8gdzsGdboF1K0PL18aV5BfWlxQ35OdVF+TX5OdX5eYU5WbnZWRkJCcnxsZEhYasxjiEu2MsAUXD4ASDW1FRWbIxx2jEjyHeCwXlNLiQyWAgkJwBl0y4MxrKmWvJM2lVGEo+adIknAEdINPis2bp6+uCC7g4O8ZEhtdXretub9m7cxto8smjh0CZ9/Zv79u8EaZZbU0Vxu2UlKT4+NikhMTC/AJA7ba+zYcO7r/9xtu33/k6sWiTzZpm26R+2/QDDql7XOK6FnsmzzNx8fb2T0lKbW1s2rihCwT85tVLn3343tdffPzH333x+68/e//dO++8cRMnX7t48cKZ02dOHD20bzdu2ruxq6u9DXdcExYOkjJv3jy8bPRa8PSQ4KBlXt5LzC2gCWgOGQHrZaMLmtlWoj44yT4hYJCF+pRkFKSlZGmasOcqpIRLmSBicHhIWXbds5SIsJCeoCCUVRyVw53NVU1fOd39hGY3lVVXV9OZMRPD4ZIlSzAWuru6ebp7uLm4Oto70NxnGM5pciQgPrNAd4qKkjKTqp50LfxVS0tr7lzitF28yATYga8wPi5FBpukaHYOKnT3GbqlALfWXEYi8yWbX0maW6H2QgO6DLV02aFLIlqMDmyiDSFZ9yZahCzO1JllZLjA1GQxWlJflyQmxOgKNVy4yNjW3s7d083ff2VoMGhrMGAOBJxmyMhOTyvMzaKrNFOS4wMDVtrYWM0hh769nU1kWChZzFlSBCgnYF5C3KEwo4vz88C+i/Kyy4sLateta6qtAo5XlhXjaoGrAmDvzl9giMEjODgoMyOlppLgOAR6DY5fX11VWliUnZmzZk2CT0CC87Jkl+V5rr5l7v41ngEN3qtbPII7XEI2uK7d7hizyzP9mHvKMYeonW6Rvc5BjctCKiLjq1MzKvLyykpLKqsqajGgVFVUV6+rKCvCQ+VkZKSlp5HQdQB6DNhheKjfyhWuLk5mpiYgbehdaCs2Y5dEpi1xdhop2aexqiXB8L/oZP+vOVjYJT8TTfeNgXKRd0WG2eyDTVwJNcNDaGtrQS3BxF1dne3tba2tLT093CJCV+M1d7Y07mRW/QDNIQf37kKZ4eadeMfoIoUFeeglsOA6O1qA42fPnr3zzifX3/9LUu1hm+RtdkVnrIrOLs0+bJ/Ya+SZMWexxzKfkPTUrJaGxk0buzE23Lp2+fOP3geU/+H3X/75j19//sn7H7/39rt3br156/qNy5evXjwHuAea0ztWlpVi2AD6gDtYWVmBp6yNXIN3HxYaDOZibrZ4utZUIAdVGFlZifzIErmSOSgXO6kE8ugNNPn9c+hRpW+cgTw5muVZtIWIUATl4ugjNsm7KCMdSYQBW0sJ7FlFQ2PyzJnaJouN8KL9fFeGhgajp8FOB4lLTIiDFq1evdrBwWH+/PmwzAglV1CaMWMGSCKGefQznAGsGxoaOjjY+fr6rA4KCA5Y5eezHD0YsK6npweWjr6EXkUWeUhPkmTlHF0Vb/Er2iORcbDIy0jLjcqZ98JOY04I5UyIAXX9SVNUwhnguL2tnaerm4uDo+niRfPnGQDKSfJCbW3wcVtbWx/fFUFBARER4bB6IRFrwkibB63GW+OgvCAnMzs9JTIi1MPdFa9GV1fHzGyxv59vZkZaQX4u1BNQXlxYhHJWWiq4PN41w+hTgaAg45DczIyI8DUYyPHeAeV2dja4UVZmanVFCYxyJjK9Aib4upLinKzshISkVUGR7ssi7dwT7JcVOqyodVzR7OLf5bSqy35Vt13QZofwHQ5r97gmHHKLP+CwZovj6mZbn8LlgbkxiaWZmaXFReXryspxwarKdSSsubysrKgQAJKdlYEHzkxNyUhPhaQnJ4Gl4zEwelFlB8sU+VtG+RXYwA1puV8FlIu6i9j3PaoOsWclGBC7ARvH3CdP1pg9e7a9vT2GQQ4W6crd0JDA/LwsjMY93V3Ex7Jz28E9/UcP7D12eN/Bff37du0AU+7uaG1vbmhrqt+8YT2Z8Lx0+c03P7h254uD1/+Y2HnFruS0XePrSxtfNys5Y5e5x3BZ/nzr4JWrkzIzClobWjb3bDx54tjNa5c/+eC3X33+0Z/+8NV3f/j6d1988sWnH3zy4bufvP/uu3def/PmzUtnzpw6eqi/rxe3q6uqzMnIBAxZWS21tFzi5emO943mIo+9OsjDxRlorjNTW1VZRSjyr3BtwmxcN2oXbVEjkC5BNy55vqBcIkyNcwoRBwWXHFVaKLnQecymVmT6mpk9o4nP5hnMReMwS7q9yEK+lKSc7EyoU20l8YFCV8tKi/Nz82Kiov38/IyNjTSmaMrKy5E1KVOnKsoroc8AqYEvoG/JSQmABjC7koJc4EhCzNqgwFUU0GfNmjllisZkNbKRiLyckGayphMzTP8clT9H/OueYq7ihZgsHbU8bfSqabbPycqQoDuhAJxjiYWZt7sbOq2VhTlwfPZsPYZWz1m4cAEotpeXR3h4KMZXtDYEI25cbHQoyHnQ6uioSOAyyDXUk3xmZyTFRQO+AeKwkGCwOjs74z0CE4uLCkClC3PzcjOzEmPjIsPCQ4MCoSnQ9MT4hMx0wobDQ8MAl4bz5tNx2t3NBTfNzkpbV15M/DOlxQDf/Pz83Oyc5MSksLAwd4/lFpZeC839zJ3SHFbUO65od165ycFvs8OqXrvALQ6hOx3C+wmgh/bZ+rcsdk6fZxHo6rUmPj47L6cQ12MWpuCztLysqLSkoCA/OzcniyI4JCszHSS9KC8XoxT6Z1pqclxMrP9KP7CH+fPnampqkqxbQmkRlrM6AlNVKJAftScwXQUpubxo3PY1z2kEi2j3jfFQPsaYFXB+SerxxIt3dXVdsyYMuo1GRMuiBWHpkGRpROETMGY21FR3tDT2dHdu2di1Z0ffof27gOYnDh84vG/3/j079vT37e3ffvzwgdOnTty6+eZrtz9dv/Nqevv5FZVnl1Resmh9Z0n3Bya1V+2LTpiGNlv4ZPmG5aSkFTc3tm3a0HPsyNFrly5+8O5bX3760be//xJQ/vsvPwWsA81B1T9+750P3n779WvXLp45iZFjZ19vS0NteXERkAjGF3EjOjmAp6BnEzSPjAgJDPBd4e3kaGu0YP4UDU2aa028uF8oI9pSTsxzJZOIcpE8z08m64mhXLx1n4zku6aBpCiTbUBUJ0/TIskxlixZAqLt4uLi5uK6zMsbNDoudi0UBnyNWdXVtL6tGSNxc1NDY0NdTVV1QV5+amqyt7enkZGRihoJ3seBe03VnGJivAjDPL5bX12BF4EhHJ8gbqWFeVlpyVFrI7y9PKxtlgDQ0f4Gs+fo683Snj5NU1MdnVlRUZHZOJCgOcF3KelRrf0rgnJ25b0ElEN5yWk2ryHpkVM01W2sLX283B1tbcxNFhkyScPRbhYWFtbW1oAtEufnvxIEJSU5EQ0O4AZjBaATYh4YFLkmIiMlmaTBys8uzs8BPU9PTogMC3V0sDMwMJg5S8fc3HzVqlWAfoy4RXn5BTm5gPL46JhwJuJlmbcncB/XAYjj09XZZdFCYxheGPhhDYDD4aa5ORmAcgzwJcWFJSUlubm5qckpUVFRvr6+NraOxiZ2hibeS5xTCZT7djv49jr4bbEP2G4f0OcYvMM+ZIf96l7HwG6b5RXzzEOn6Sy1d/SJi0nEiAJqDxCvWFdSWlZYXJKPQQZ8nOTCTkmiAm6el5sNKCfuoCIAfS4AKSkuHh3PlXCFxeAljMnIbGZEDG85LpRz1LzRuOi+UUm8nzcoZ/m4KJKJA6NRGylxu7uK8pYQpySTZQ23gL55uLkDtQHiFevK6mqrG+pr6+tqMHJiPCTLcONiAOtoa1TAa2ioquoF++7bfPLIgQunT1w+d/rqhTOQ1y5feOP2rbfe/O2Fy2/3H3k7pni3Q+JWy9zjhuWXzTZ8uHTbFyatdxxqri2J27I0qMo7tCQ6obipoWtDd++hg8fOnj735uu3gea/++LTb7/58k+/++r3X33+zReffvXZx1988iEA/a3Xb1y/cvHIgb0wC9Z3tjbX16CrrfT1sba2BEkEhcTzoxOgc8NyBD2JDAv2XeZtZmoyffp0RnWEAvF2dGyqB+psobsgcbAyQeAq7SvPNs5EIAkNxCfObqwqWkbBWOviJ8fwrKOja2xsYm/vCOwGiYuMCIfAiIbEgHBlZ4Jttbe1bNzQ2bt5w7beTVt7NmzZ1L1xQ9f6zva6uhooMBP36a6rq6ukpET2MVBSNjZa6LNseX52FgwjmGKbujq29HRt7unGG2lqrIXaw9KPjYkMCgpYsYJM0Pl4eQLZMeLa2lgtNjE2MJgNtk53cyUpdCZJcXtRPd2M/QsTGjT6fYkUkCxGJ84u6PwkaSm0BoAJ/Bd2EhrWbLGpnZ2Nm5vL8uVkz5YVK1b4+/uHBoeAkEINAW3F+XloeaghxkuAL/4EraSQR93f2elpSXGxPsu9AXYg5gB02Nl4F+npqWBmUF58HRXwRXQJF2dHZ2dHIDgJS7exImxXXQPvRVVVGZYuiD8Gj4LCnHUVJcAEsHJAeWZ2VlxcXGBgoIeHB6Dc2trVziHAxbeAOFh8u+18euxX9gLHHQJ32Adtg9j5b7Bb2WTlnmNgtHyy5lwHe3dYCbmZGegmxFdTXlpaWlxURKLU8aNoQHNcXExyciLMhLy8HIwfqIa7g23AZARDh2qHh4WgX2GoW7BggZaWtpqaOjOBRLe8EIjj0DljSMK9LBy9yv15hHLKzlh0loDysUF4Ihxng8OkyY1h0Dk7OqFzoCPA5GlqrO9a3wFl7u7q7OxoQzuCjxN6vjYiLCwEdABltGlrYwPQ/Mj+PedOHrt++cKta5fv3Lz29hu3Pnjv/Q/e/3xD79Hcqn3LE3ut4ndaFp41qrxu2vOpWd8Xhq13rKpfM0vetTS8wz6w3D+ssLCso66xZ0vfgT17jl2+dP3tN+58/dnHgPLv/vAN0Px3X3729eefgJ7j5AfvvPnW7ZtnTx47dHDvlt6NwBF04uDgIHRWGxublSsJecHYDrZeWVZKEwkA1gMD/O1t7YDmoKjULcttEy5Ccznx9njPJZSPT7ogmsKVZyx1kgOaW+xFdx5A/9bV1V+yxNLT0zs0NBRYAAsaykwSIqVBr9MywcdLizFaA7iB4zt3bN29ow9jJI373NLb09zcWFNdicqrV4csMjajMS26OrNcnJzjo6Oq15V2NDds3dS9o69n765tu/q3bcUg0NXeUE+yOMDeB/QkxMcCNUioXHwsTPXIiNDVQf5AGSurpXqzdNVUVNkJQKbHSsb+/zqgfMz74jZso/PwUGR1TQ0QcHt726VLzAHllkuWuru6rVy5gqYwhMUZHByMd0cSjsYncCwVqgeEhbYGrgoICgiEJZqRnoqTJQX5+GshkyFlTUgw0NnQ0BBovnDhQowNUVGRwEpwW5orKT42Dt+FyeXoaA8KD8sAjEdHZwazjaesrq6Op6c73hoUH/hZWUWcIcAB4G5GRkZsbCyYvje+7Om9zNt/VUCif3iF+6p6Z7/1dr6b7PwIlNsH7XAK2em4us/ev9N2ecVi66iZejaTJ+vY2jiGBAehS0A3iaFQmI8jJycvIz0nLjYpIjJmdTAsBPCMGPTRwsJ8iuOVleuqqyuB5qWFxFmAr4O0waz09PS0tbUHWYF2AydJaIN4I1CZCW245x3KWX+QeLdTbtqT5iERr+rkdiGhvgVcS1tby8Z2aVDgqpyMVFCqlub6nu6u/m19/Tv7oJ/Q8C4Y3k0N6EbRa6NAxzw83GDxQTMJoWtu2rNzx4kjh0GW33z9xvvvvPnx++99/ukXH3/4TVV9X1hSh0NIi2l4j3XBWeOq1xZv+GDR1s/mtdyxqL1hnn1saewWM79qp4DyNamtyYUbSmq31bXt3L3vLND8sw8++MNXn//591/98evPf//lp998/vEfvvoE5S8/+eCj997Bvc6cPr571/atWzbjTUfFRDu5OIOVo3thVGeWpVWTJQ8dLY0NNbWVFej3eHI7Ozt9/Tl0/wq6fZ3k7uDc3qHMJoUKz2m6pdHbhlBKzqSrEHIRETgDENfS0jIyMrK2tALzCgsh3nBwMZAaKANhN+XrQLAIjteT1Bx9W3t29vUCxA/s3nns0P5jh/cdOrgHrx4DeWtjE9QtJibN1tZ9mpbO1CnaixeZYmjMzUxrrqve2Nm2e/vWA3t3njx28PjhAwf37tmxvQ8koLWlqbqqAnwKilpWVAgbjlAwRgoLcjLSk4FT3p5eC+YbggOyqdBEUD4q64iEW+nFSos2KsRgXL4jOl+nMUVzsZmplY21xdIlS5aYOzjYLfP2BMzFREekpSZSfgrQjIqKwf9Tk1OAv0BhjMTkMyMVoymgnE5Zg1qB54KVEy9EXg7KibExq4MCrDFk6unNmDFj0WLjFSt9wHbz83MLi3Kp7xRIjdEC3H+5J2wmBytL87kGszU1NadNm2ZhQXaDwR2hTZUVpbU1FQ01JHYF/8SwQVYGBQT6+foHB4VFR8YnJBZHxtV6BVW7rGp38N9kF9DrsHq7Y3C/S9gul9BttiubLd2yZxm4K6nqqalpWVvb+q5YHhe1Nj05CSwhMz0jLS0jMSk9MiotKCTRZ1WUh0/ICr/QNRExaWlpZeTuJNFTVVVFbW11XU3turLywvwifAtdOi42Gh0J5gUaAUzUxMRk5kwwdDW67p9LhCDarvKX6Ev/HSgnPFtajk6FSUI53XmPojn1oXPfxYUmT1Y1MjJcvswjam14UWFuXW0lgHv7lt6De3cd3r8H5PfgAejnls09G6Gc6E9MnmIHDPIwvtBvwOm29W05tG/vjatXwMc//fCDrz779I9f/+HrL787cuxW++Yrfgmbl6zpsc49ZVp1fXHX+8ZbPp6//h3T5jfMis5Yph+0CN9gG9y0PLozIKk7NHV9VGZnQ8e+Q4fOffDO+998/slffv/1t998AQQHjn/7zWd/+t3n33z+4acf/fbG1UsXzpzcs3sHoBwvOzo2xsPL09XVNYJZy9DcVLehEz+hZ1vf5p5NXd0d7XVVlcVFBWvCwh0dHWfM0BHtRiSQ3B2cUnUaGQIoH/OmnwOSOArKaZ4Zujkffb9k12wpKfxTVXXynDlzzMzMYP+ii+NXQ2PRLIDU5vq6tqZGjMr1tXVQS0hjE4Fy2DcYFvf2bz+0d9f50yfOnzt55jSJ5N+0YWN7W3dhYU1sQqGzZ7DebBPtGXpWVjYgRADlzhZik+Erp44evHzu1KVzp08ePXLwwD7QedD8luZG3IZZftKEIbW9uaGztQnS2lhXX1dVXJSXkpzo5eEJA1lRUZHGHnCsXLxT5QsL5eM9+9wWCmy4hVCoq68HHLe0tgKQQ6f8/VeGh4UkJcZmZaYW5GfRCcCUlJSEhISkhESoHp0JhNEJFM5OTyH7JgYE+vqsCAjwB0YDdgklLyBoXsAkFAVb9/J0ByXX1tbWm61ra2+DmqmpyTk5WQWFOTRWBAMGqq0NDwkNWrXCx8vO1tLExNjCwgJ0LTY2GgQf1i3AtK62urG2BnoE9oZngIkAAAVFiI2OS0/Jzs+rTstpDYpuWr6myyFgg33gFkC5fXC/c2i/c8hWe7/GJc7J03Vt5BW1dGbq29nYkqiK8DAMNozXFkNSQkhYwqrQNK9Vqe4rU1x84j1WRIWsSYINWVYG2lFZWQlCXldRWbduXX1RUWVuLp4hHwNAWkoqAJ3k1k5KjowIxwhhbW05d+5cdXV1un/FqBVt3HoFaeFzDeUC0Qo6QsxHGRTinfekRRuosqs2ZIUqKkpz5ujb2lhhAIdq4Z2BkkOxodWnjh0+d+r4udPHzp46evjAbjB0/AmvHwgOQATDxfug+Wx7N2/at3f3zWtXf/vWm7//4ou//PG7v3z7179++49PP/nL9dv/G5e/2yZso2X60cVll0w73jXc9N68De+adb+9uPqSVck58/hdlpG9jpE9btG9LuHrXUPqstft7Ntx6u0773396af/+7uv/vLt13/8+lNA+Z9//8Wf/vDFN19+9PlH773+2uWLZ07s6e8DUoP6RUdH+/r6BgQE4KWCeHZ3tPZt3ohnPnpoLwjjnh19II9AEFAVjOBWSy1BOqg6ca1BprzpVJs0hkR5yAQRI88ayrkcFKI4cXb/LbqxFplFlJ40WU1FX18fBgo0HIQLtghQIDs9Dby4vrKyo6WZGCutTYDXxoY64CyGPfyzd9P6bb2bDu3bfeTA3luvXbl18+rVKxfOnT29dcvOzq7+rILW0LhK15XJC0xdZ8ya72DvAk1GV+np7gSXP3X00LVzp9+6ce2NG9eA5qdPHcMQC5Nuy6aNmzauxwva2kNc8JAdWzdv27Jx88bOjevbYTatKykEpYLuAWjkhPLSkwTMxibieZ1R6icjKy+r8Jw4uP4j7zmj6mTphobG/Plzzc1Nly5d6uLkDDMXHDMtKbEgJxPjXHlZYWlJEeHXubkZGRkkvCQ9NZ0RwmQz0jJSEgHlAFNQKz8/P6hAemoaqtNo4IK8fFTDEA5T297edvZsPc2pU0hwmq0dVADwjSuDwgP6Yauhe9DYRDK9Eejns9wbmLh6dSBAvzi/oHpdRVUFCScnrLxiHfQdA0BiQhygE2MAUDQ3u6CspK64pD0lqzM4cbNzcLdDEMvKiYMluMfev97KPUl/voOO3gITE1OM33iq8NAwGlUZGhoeGLjGyzfSwz/T2a/Qxb/MdVWpm292SGRBWkZpWWnNulLQ8bayytbC8rbCss7sgub0nLr0rIrU1Nz0tGz8ZPzekoJ8tE9c7NqAVb4uLk7gB+qaGoy1KieZ8HWMjOJnj50afXYOFmYxtOy4aBZpkQHOwgHup6Kmqqc3a+lSi+Xey9CmOVnZeGEdHW3g4Ef27zl/6vjFcycvnD0BND98aB/MbcBhxboyvD/wX2tra28vDwyJ6HCA8kMH91+/cvXdO+988/nvvvnyu88++dOXX/zf+x/+35Wb38Xm7QKUW6cdXlRybnHHW/M3vWO09bfmW98zbnnNovLSorSDS2N2O0T3O8Xssg3Z4BzSnlG+b/OWk7dvvvPFR5/87x+/+dt3v//uD19CgOPf/v7zzz5+9/2337h0Fgb93r7eDeB36Nbox+Hh4dAEPExLQy2wY++ubWdOHsGTnzhKQmtAHte3NoFIovLKlStMTU3JuC2ka1iYpYyiWGa8PHmBAkQ4SeY5hHJuyQ91sIj2Mqerb4SKCnK6s2ZaWi4B+UK3IXNcuXkY6oDjoFSt9fXrW1oA5eDI4OY401BfTXKftjRu3rAeg99+xrvy1u2bb791+/r1axcvXN3cd6C+82B8/qZVCS1OAXkLLZfPWbDU1c0bJAg9YeOGzv5tW86eOHLz0vn377z+/p3bt69fvXbp/PFjh44ePHBgz25g+t49OzGaYliFhYfrH9zX37+9F7COkbW2sjwhPtrd3RU2hJICIebEfSyykAQyYruYGkzc8qIX2GnO6B2GXCUlJQMDA1PT/0/dW0fHdaVpv9+dudNxzJY5cezYSYyJmS1mZpZKzCWpxMzMLFWpxMzMzMxoZo6dpDsz0/3dte4f99lnS4qT21+vnpkk06N1lldZKjh1zt6/93n3fuGykNAtWRkpPR1dSwszssHo6RES4B8WGhgRTnIyMZ59fX298eNF1kPc3V1p+gwUt7ODHdnVNzPR1tSCjjEyMoLCxVOYwDMv3Hd3VxK9R0KJlBUvXjx/+PDhPXv2fH36jKy0DHQbKVLtRjrG4BPpZikOfATH0Y6s6lhb2tnBOXAJCQiMDo+IioiMj41j6uaR8rZAuYO9nbWVBZt5jr9vQHhYTGhIkptPigmHJ8tKkTbKFdfPF9cvBNOlDLiS2lGiCuwLV+UuXxaUlpbGp5sxOeHM51gZG5lra5tIKRrLaPlIakdI6oihXY0AAIAASURBVMZL68TLaofrmIbbO8X6+Cb6+yYFBmc4eKaYcRLNOMlm9olmDrEW9qFWtl6guaenN1kCCg6C0+nt5WbPJnn/8vLy169fP3To0J49+6ASaMj1WoXUTVt+ovn6OtjfjHL5/VG+jfyBtN+mAWrrSfy/6EZPT520V96z+/TXZ6CJNDXULMzMYdL9/PySkpKy+LyK8tKW+pq+zraBnk64212drXW1lWXlRbzMVMx83D8lJbJ3rCAnD8WHW1tUmN9UVz82OL48e2d8ZLWrZ7Wp83ZD592Oodc1XW+M3CtuGWfdcK4979d+LWP2cuHSteo7gjV3r+XMCKZOXPRqFrSvFbEoFzUrFNLPENdL5ASUcTPrRwan7q3efvfq2R/fvXz35unbV0/fvHzy/Mn9udkJyEaIx6K8bJAIA5fks9hYcTgOGMGklWhGClwKIGm4rxvP7OlobWmoL8zNyUxPCQ0huWSmpsYyMjLHT57YuVPgo48+3vQHsjiO4+OPNsoYbdvyh83k+IcKRlz/WWuySm/39m1MM7Dte/cIHNi/98jhQ1cuX4SJBSJ9vN2jo8IIwePj0hJIPwFeSgo3OZmbmgR200oaeAIOGD/8Egq6qrIUrtjy/MzK8uLk1Fzf0FxyTgs7tETfs0CFzZcwDDsvqvf1ZTE5RTUQhdYlBsq7WhsnB/vuLc7dX4KVnZ6bGh/s7err6uxqa+1oacT17+1oxViC9QX08f4YSjC0+EScAMY2Zt2pM6d3796NL7JRrBjGlS4W/SJL+X9QutAv1sepR0W+F9N8+NNPP7106RI4Li0tqa2lYWtpAVUEo4vZFBEeimsLUUWScYKCaYw//uRHkE4yISE/wXEne1sc4KmerraampqOjo6luQX+4uXpTsrPengS+Lu7YrayDHVFRYUhyWEp9+3Ze+rESTERURgAK8x6Rw5YHODvC2TD3pMdSKhcZlMUn8LUXQmOiYiMZsq2QJXTLB43Jw4mHZQTuI/nwN5ERURHhMf7ByXbuHNVTBPlTfjietmiOlli2lxJvRQZrRAJRVthMVVpGUVtbW3wGy+HZwB7APfO1MQSKBeTYUmo+0K/S2qnSWilS2klKeknmNqkOLlxXT0y7d0ytcyTJHVjJHVjpfXjZA3C1U1D9E3d7Oy93N1JuB1sDM4tKNDXy5OsoWOO45pAscFefvLJJ7t27abRihvpab8ICaFZx/9IKN/GxFdu2flhgze6kLq2PMSsruL3EAWQQlJSUrSJBCx9gB+5H3xeFjxjcBCSHCgc6OoCB2uqKwHr7BxeYlJseFgQRo+ioryEhAQ8Owh53OPy0rL2praRvqmRwRV+VodXWLVTcI1jUC0ntMUhrFPOpuCGWb6wT/vViAHBnGXB6ns36+4J1t+9XjIvnDl70aflpn0VOC5mnCPJSpc1THAJKObx6wZ6x1bnF799+ez92xc43r15/vLZw/v3VoYGe7ramvPzshITYry83TY4TlJMIyOyuGn4E0Df2dI4PtQ/MTJIXP7mJnwpHjcVI9HHx8vW1lpPT09ETPSrr04ICOyhOQWU4x8eUOX/aCjf2C6jhWR27toNL/Lw4UNwrU6dPH761ImLF85JSYpj6mJAQ9nBi2LaxKTl8bkF2ZkFWVk5mTxaAY22CqFtZYD79GQSjFhTXY5ruzw/d/v23cHRhZruhUBuh5pHobxbqYJTsZhJ3Flxg6+vSMorabq6wk5E4CXF+TmdbbjUffeX5h+tLt9fXbq7vDA9PjI5OjI62Dcy0ItjFP/29wz3dXW3NQHlVWXFMAA4h7CgQBNjlqio6IlTJ48cOXLs2DFMPBDn2OdHDx48SBbQt/5UtGRj6P4PRflPaWjbtu7dv+/EiROQjWJiIlqa6tbmZlDZpF2yPwnOY3q5RJH8+IjI0OAQ/IYeJNve35dueLpy7F0c2QA64MAy1Ae21NXVTYyM4S0B3xsop8VKLcyNlZXkLl26AFUOibd3956vvvqKZEcrq5iZmNIeMgE+vsH+ATgBvJbYDC8SIcNkfgXSIi3EukSQUtYQ7/Y21nDNmXwlvNYVUy88NCw0NNwvIIbjkWRgm6BmyZU2SJPW50rrpZIy5RoessoW8oq6mhrE+aA9I2EqiMFwdrGzdTQ0tpFWtJDWChLXSZLUyZTUyZbU5ikacjVN0liWacbWGboWGbKsDEmjTEmjLEkjroxRkpJJlJ6Jj509TtV/bSefODEkyYg6Debm5rgscAKYvdAvd+/eS2m+UbaMptT9g6L8g/XTtS0j5oxpF+N1lG/fiX+++OILERERQwM9fOcgP9+IkNDE2DhuSkZxYUlVZTmUOJl7vb09bR1VZeX5uXmpySkYWri1uAF4laKCnIqyojHLKCwkNCM9tba6prdrsK66L69wiO1RrGCSKcrKFGLxruum39Dl3TDOvWZbLhU+JJg0LVR4R7j2wc36O0C5YPmqeM4yUH7LtkTSNEvRNEPLKk3POiEosji/oAnTf2lm7s3zJ+/fvPzu7at3r1+QLP6lufa2JojH+LgoLy8PY1MjfX1dKysLTy/X2JgICL2SglxIcojBwZ6O6bGhqTHI8s621uaS4sLsrMyEhLiIsHBPT0+gn8ViycrKnznzDWj+8zZ4m3+eD/YPVHFtbSeH2TbbtWvH4c+PXLh0EX6VpAQMkzDtqq6mqowBA5ECU5edxS3MzSovyq8qLaopL6ksLSkpyC/IyU5PS0mIj6WxZVQDpqYk5WRmtDTUDnR3LC0sLi8/KGscDsnrM4ttk/KukvSuk/WoFLdIvihtevaatIKq9oco72htAMof3F56cv/Oi0ePnj64e29l8fbi3NLs1OLM5OzEyPTYMMzqCG5JawNUAu4RfKSY6HDAAmrgxo0b+BY3b16XkZHCoIJLoSgrd/P6DYjHPbtJu2Fa7+V/aunan6eikBDEnTs+P3b0woVzUMr4vhbmpq4cRx8PsjASEEASIMkGX3QkaI77QkK5Sc2UACLPg4JpYQw/L3cPF467s6ObkwPmL+mYrKkJbBnqG5A1Fhdnb3c3b3ePQF8/vCckqp2tpY62OrMncXjfvn1Mjbw9MP9XL1+RkZKGU25ubko2VNzcaetOwBrnA5rj5YG+PlC7OA0og/DgIPwJFCYhI4b6piZGZK+VEN8DTgM8B3+/EA/vKFunGBY7QckoWpEVK6cTJqPpKaVopaDM0tYygOUAx2lIpbcXiXCHD+Dq4mll46ai4yinHw4JL6WbI6qZBZrLGWTJ6SbL6yTIaCdK6qSI6mXKWJRKm5dImRfImvOUzOP0LQIdOH6+fkGRkZHRcGIiw8MjgoNDSHkZd1c3F2cOjW+hpXqPHz++d+9+CsaNCpR/VZX/F7fZf41tz/WtsA+HEdnE27xlLe2FkQk7du08dJhEGuEWYhz4e3vBb0pNTMri8gqy82sqKiHDh/q6J4eHh3v721o683KL09KyQ0KjMNhsrGxxMyDkdXW0SC8hJ+eUpOT8vJymhuaertHk1Gon/zIN20JJ82IxmxoJdr2ITaWQZaUou+6mU71oSN/VqOGr3NlrRYtCtXduVd+5XjAvlDb5DafihkmmmnWmuVO2W0ChX0hhelZTeUXX8ODM0vTSi0dP3rx4DpR/++r5o3u35+emmhpriwpzQ8MCrW2tVNVV1DRU7exsMMa4aYl52dyq8qKG2oqu9iZowLnJ0bnJMahCOPuwT3AseNx02CRMEroLb2VlBZrjHhOnfm0d9qf16PVuiv9IURDrPQ/37BHAtLx27ZqcnIy2lhomqqqKkoy0JGioq6sNiZcQE83NSCGGraSwvqq8ua6qtaEWd7auqrKivBRWDewGKaC2mErWUdyMtOL8vN7OtvHBwZWlO/PLTxLzOvQDK+T860R8msX922S86sWsUi7LWQDlcooaDg4cXMMsfgY+orO1CSh/eGfl+cOHb549g/UF0/Hf1YXZ5bkpGFRwvL+rHTelrqq8oqQ4G/5RShKmMcaSnJzcTcFbElKSOjpaZOHV2RFiE6JPX1tLRkIcrsbhQ58J7Nz1PzfM/IMhtIVqrJ0Cu06ePgXTpaysaMTSc3F2AB8hp8jqCtR3UDDUxsYCC0V5YKA/eE4VOoEm7dXl5gx5DrBCIBsY6EGV6+vq2VrbuDlxvNxcgXIIbaq97NnWhgY68nIyV69ePn/+PDyfEye+wvH16TOXL166desGRpGaiir4TLo529li/ICDAC7eHIaBxMMwB0APCQ/LASWnIC+rqqqsp6djaWmOX+L5JA3V3dPNzY/t6G9sF6Rq5K2i7yOr5iSrai0pr6+qqm/MMmECEEl0PGi7dvj6eXr4Ojr56Zl6qZjESeikiGtnAeUS2nx5fZ6CbqKiXoKMToqEToaYYZ60ZbmkWbmkeZGMRbayeQLLIogDT8ZvLeQ8KioiIjIEKA9gfBdoc5wSzCQ+VFtTS1RY5NSpM5TmtALlX0X5fz1i6tdIEWISgjcqPtNFlZ+tGDDKHS75xYsXYamYrE73qMhQiFn43cW5+RVFJS11Dd2trRNDQ3MTUwN9ww0NPYkpBf4h6TaOAQZG1vCPdLR04cfhlHBr4XBh/tfVVre2dHZ1TnqH5KlYc4XNcm9Ylkq4tMp5dct4dkg6t0i6tYp6tAoHdF8PG7yWNHmVPy1ccVu4/M6NzCnR+IFvLPhXtSNZ9lxP/4KElLoMfktOQWdOYXtb++Ts1OrjO49fPn0GYf7ty2f37yzNTI/XVJfzszK8fdwNWPpyCrLqmhpOTo5x0WH5Obyy4jxwvLGhuqezhelGNLE0OzkzTiRhR3NDfXVFUV52DpeblZ6ekZREwhP9/C3MyBYuU51nLy2zhSu7fesOHL+9O7/lP1A/fX0Hm4k13H3i+Jck1VtV2dzYyNbSzMrMGOyDxMPsMjU1xkxOTUzI5WdChtdVlgHiHc31kNswaR0trc1NDfBR+Hx+fHx8bGw0juTEJBKDVFY6Pjy0MDVze/nh7NLriMxOZY8KKb8WCf9uKf9OJb9mCZu0izJmZy5LSEgr2VhZQyFm8tIKC3LaWhtHB/se3l19+fjxu5cv379+8ezhXdAcwnxxZmJssBccb6mvAcfz87LA8fho0qHGxMREQUFBRkZGXlHOyIQFcYehmBgXGRsREh4cAB7hq4HmVy5dPnrk8x07dv1UBfevUPIf+Ni4iXT7ipRR2HnqzGloZD1dTY69tb+POylMGB5GlwgIr4PIvxtLK1SVQ/PCA8YTyG/8/Zg8IFJxheKVNlPW19OxsbYEiDEAPF3JjjfsJXCG34C/GuqqSoryoDAOWRkpeHIYQvDkoOpwCAkJMTWi5aDwYBLgcJMCL4bgr5G1pRUsBHQPTC+8KAkJsUuXLly+TBwpKSkpakLw/mZmJpbkx9rUzFrHwEpJw1RO2VRESktEQkVKVkVDXQdzjcO2w52FmcFXoDkHfj6kCJiLW5CpdaCWeZKUfqqkXraYFl9KK1VWK0ZBO0xJN1xOO0ZCOwmqHJJcwqRY0qxQzjxbzSLRxCrI1SUoICBoLfA8PDQ0JCDAn3xrEqzp4QZ3Ae8OawSVAHKJi4qd+Oq4gIAAKa63ZfsGyknq3z8UytezyLYz7gMoDlW5Y2PTlmYACuzZferUKcg3WHJSuDIyNCU5Pi+LV5oPjhfVlld2t7YP9w4O9Y709060tI0WV/R5BWaa2kWqGbjJKRooKqnr6ehzHBwxjeGiZ3Ez6qurutpae3sGB4dWfKPKFdjZYg6Vos5Nkp4dsr494q4tog71Ek4N4i71Iu5NN7zbSBmWpFFB/qxIzsLN+AHR4LZvDJOuqwbpWyW4+WTHJNYkcZsDIosdfbPS87t7ehcf3Hv99PGLty9fAOWP7q7MT080NtSACD6+HixjQwUleW1tbSiC2KjQPH5acUF2bVVpXW1FW2vDQE8nHPy7y/O3F2dXZqb6OttaGmpLC/MKsrJyebxsblpqYhykK4y3ubk5xvEXX3wF1/fjtcBmJljid0H5etnxjzfKYP3NVhhbMBLOnDklJipMyqdYWjg72Ls42DnYWJoYGqirqVALjZmckZJckJNdW1nRVFvV2dLY29FCFqwH+of6evv7eurraspKSnm8jPT0VC43PZtPYknbm5uW5xcerj6cn30wPPE6ILVX2b1WzK3llnODqGujtGu1hEXyBSmT4+cFRURkMC0xDzF4IMwh9Xs6WlcWZoHvd6+ev3sFYf74+aP7UOWksV93O+xoVVkx0zYkKTmeJJpZW1urqKhQEFhYmAUE+MXFRmfz0kmcYnpyWlJ8REigr7u7kb6egpw8aH7kyBFaqPrDxcNfVP38Bw1cYerkUIiTtc1tO6DKz5w5IykhZmVp6u3hHB7iHx1OtiuioyKInxQeEcbUFQ9kVq5J7ZEAPx+IYm9CPVIPCwrd3y/AxzvQ1wvyHKhihKeZgb423GXcfVq7HCinyUQkr9fRgZQkMtQHnY2NDMF9c1DZhCyS4CUYNlDluBfi4uKiosL4R1JcQkoCYCe/wAPcAhhd+E8SYuI3btw4d+6bE6eO0yoxgsJCeCGeAFFPKjSoKqsqqygqKkpJy94QFLt8WfDM2Stfn7t8S1BUSUnF1NgEkp86DYG+PtCCJG7S18/b08/dPdCKHaxjGSetEwthLqGdrMpK1jGJ1WEFahn4q+qFyOtGShokSxlni7PyJYzzpYwyVM0TLOzCvL3DgwJINS5csgCS+u8OrNGFeHcPZyh+GpyDS+HowIbJEREShhe+a9dGzf21nsYElb9SHsOvuO257SP8/MsfmFZSTDQLU7IVPgVe8vmxo8LCwrDePh7ukREhGenJ+dlZ5cVF9ZWVDVVVTXX1w31DE+Pzjc1DBSW9WQUDibw+E/sMeZ1gaQ13cRl9JSUtMxPz0MCA9OSkopyc6rJiONeDvT1Tk3Mzs08CYmsU2LmKXm3yvj1yfr1yfj0inDpxdoWCc52yS60Eu/SmXflN94YbAR2iscOSieNCgR2ibjWXdOOvKwdpmiZYOmd6h1f5JbQaOPOlTGIdw2vTCwcn514+ffoOwhwof3xvFSq7s62xorwYbpQt20ZbV4s0FHfkhAX5p6fE0zDnstJC4L67vWVpbhr0f3L/9v3VxeG+rrameqC8MDcnL4ufk5mRxU0D7yBz3N1d4d1jjB48eHArEzuxedO2Lb9H64lf/vzUloEsiu8kaUoMueiww5927xI4dYK0AdFjYg0ZgePm5eLCsbXFxFRWVFJWUoA+gt/NS0suzs9prq8Bx2HG8PWnx4ZIlOHU+PTUWG9PR1trc1lpcXERSeitLi/rbm8bHhp49uT5q+fft7bO5pfPOQS3yttXidjVCtnVCNtVSNsVixvFnxXSP3Li8pUrpPkvMAH6gM64HXB5ZiZG768ugePvXz/H8erZ49XFOXwcbkRjbQ1UPzcjBdIBsxe40dDQkJGTVVJSAtP9/HzwJtlZ3PKS/MqywpLCnILszJT4mKiwYMx8eP1yMrKXLzM03yGwUZeYXpMNE4ihvm3HWn2hXzYV+ZXSi9Zih9bcgi2/bPlCj+3b1oNEN4rWrW3Ybluvkg+OnD59WkFeluNoFxzgTXvkxkWFx8eR2NC4qEiyuxgSCpQz6ez4cXd25kA/OXOc6JYmOBjq7x8a6Bfs7+Pv6QmUO9hambIIl8FoDtvGlUNojrEBjjtxyHo6vChLCzMSOmJjC2kM3ONwssdf2LY2VrgjNGFSSQl+khSQLSwoBNENWF+7cvXGtevXr1+9evXypQsXzzE/V69Dxd+SkpLAk+HU0hr3ioryMAngl7iYiKCg4MXLl86c+eb4iVNfHT/5zdnzwA7ZmDVmwYfAuPXxcPX0IFUPg8lySICnR4CtfaCeWaicdoicToSyQZSxdZy9c4K9Yyh+b2wZSNZqDCIkDRLF9XmShnwpwxRl4xhz21Afnwi8nOwJ+/l6kAIudtZWZtCp+GKurs7+/r6AFXP4Aei4hjpa2vCHjh49Am3+YQIRRfkHkS2/zA79W17Xz0u//WrbnmuZLx9t2r6VeQ6T/EnP7MCBAxcuXcQsgrsRGRqSnBSXk80rLSxoqKnuammBeBro7h8enBmdeJCW1eYWVG7hUmDMKVRiJUtqhsvrBsqrkJghOxs2hlpWenpZQUFNeUl3W/NAT/f8zPLi0mu/6Co56xwZp1pJ50ZpN+i4WjGbAlnbPAOPKnOfajV2rpgZT8S68KZ9mahXk0RAp4hLg6R9xS39VCH1WGWjFHWLDB2HXD33EmVOoTQ7X9uz0jqgPK9mcmnl2asXr79/++rV04dQ2X3dbfXVFRDVAUH+NnbWFhYWDmxSuS08jCTrw+XPzeNXVZe1tzUtzEw+uL0EjkPMAyi1NRXZWZmZvAz4+EB5Lp+LBxDmkDk2NlbAytdff71334G12PwP6mX/d6F86+Yd1EmgXsIegd1nTp3GPIGYovG8sMekaJy3F5AHb1hJQRGjB3YacxvCtiCH31hb1dZY19/VTptfL8xOrCzOgLDjY0NDuI5Ms73WlgZwfHJ0ZH5u5sXzN48e/hCTWMf2LFOzLBQ3LhKxqBS1rhSxLJa0yJMwiD55VW33wRNnz15VVlaG041LB/rASYL57O/ugAZ//uje2xePvnvz4u2LJ7C8uAVdbc11tdW47EmJ8XB+MZM1NNRkZaWh3WAPAKaE+OjCPH5FaUFLYw0O+FUVxQWZ6SlJcdHe7iTJBYgRExOBDDz0yac7t+/aKB674SBTj3MD5X+1qsavkd23ZQPlG9U0f4Hy9Tn4Ux18ptTKzg97NgHlGGlAOcRjSIAvUE5jQxMTYpISY+G1JMaS6BUIcyhW6Axw3NaWJO7b2dmBULCgUJohAT+hHLbc2cHOzJRloK9LkkVtrYBycA3Dw93NyYUxA3g5kI2XOzs4kgBEZxc8wcPFFQ/wBJwJJpG1JWE6ZDvNICV9n2WlZaSkQWryQEYKNpVU3ZIlq+RaWhr6+rqGhvrk0Dcw0NPHp+M3cBYh8+lroepv3rx56dKls2fPwhiLioqSWAkjQ7a1hROHjZOGpfHz8vbz9PVw9WHbeZlaBmgZ+euYBOubB9k4hHp6xfh4hXp6BrMdfHSN3GS13IVVfCR04iT1kqT145RZYYYm3g4O3m6upKQMvgUMFS6CoQFpc4ov6+LiFBjgFx4cRBavQgJJhTcPNysLSw111UuXSPor6bfDjAqaevZhkOJ62uB/E8o3soHpOGOqEOxY68PFvOTL419JSEjAn4UxTIqL5WekFuVl11SU9nV1jg4OzE7MLC/c6x9YqWxadgmu1rDKFdFIElFLvKUcLaQUrKgfrKZtz2JZcxycgD9ajrymrKy1vr6rrXVhduX2nfe+4RVyZjxxq2IxyyIFx3J1p2INdqamdYq1R46jb66BbYKicYykUaKwcZqQRY6wZelN4yJR48JbmhlC6umiWhkiehliptlgPWyAtFu9lFOZApsfxuvqHV4Gyv/0/i203tNHd0kgREsjHPasrMzg4EA3NzcMcYxDZxcSVx4bG52enlpeXtrS3AhJeGdpbnWBlN9qbmooLS9LTU9LTU7hcdNx/vnZmQU52RkpqfBtIXZMjIwx1I59+QVpw0R7Tv4uKN/8i8Xfj9favP08G23L7t27T586Aa9cX1sLqsrLzRn+NRxtiBFMbPARKMdMExMTU1FRgQQDDKCCcXOb66r6OluH+rsIx+dngNcHd5fh3SzOTIyP9I8N902Nk/JnD+/eefzowfNn3969/6ODe7acfoqwFu+GdraoUamwcamIUYGYEU9MO/yLs/Jbdxw+duy04M1bICwQAE2VnJRAllmqK/BB95dnXz2+/cObJ9+9fAZ/aHl+Bja1sqKM7LJGRYBKTOCQNAmm1taEYAS24B5VVxS31FcP9rQNwKo0ktYiuDvc1KTAAJLCZ8QygH9/7doVeCT79+6jJSg2ilJ8vGWtcNIGXn+H+/WzbNsPlPjPUL5+Z/F4146dOEi/js1bdm7f8c0ZgnJ8feAYFosmbaWmJMBLxrcmRYZjSYY8SISRiYtMIGVmZmxqYm5uzmazaa2VID9vinJfd5KuiecYGugBrDTaj2xXenrQCHEg25XjBOfVxcnZxcmVlj3xdPfw8iABJDT5yNPVDc9xcXTA6HKwtcGbQODDMJBFc0MWHpDVcCMWKEmXaAB9mAcYWlIt1dbOzmatbKo1YGlhhr+SQmAGepoaavimkPD0R1xcFJTX0iTyHM/E82FL8NE4K0cHVzbb09LG09rO19E5yN09ONAvPCgA7kegu4evuaWLqo7dLWkzKQ0fKe1gGW1/BT0PDV22sbGthbkNLouhoSEkgqqaImwQ9VmhdYKDAqBZo0NDo8ND4LjDm8HFxLmRHeDLVz45cHDHNty8rUA5rSpI9xc35t3aIt7fbmTxG6GcKpQPav4RmtOz2rNv76Url9XVVWGj4Y+kJyfB44Vn3dJQP9DTOzkyNTt9e2HuRX7JkHNgtZZdgaxJPhPhnymmAVUepaIbqK7DZhla2Ns5wMqlJSVC1QKFZUWFeJOh/rGpyQeB4WWqVjxJ0yxp8xyX2IHkwtnwlBbvkALvwEzfoAw2J8qMHaNnHadikQziS5nmixjmi+nlierkiGhni+vnC7PypenCumuLlHuLqEO5tF1uILerrWfm6YNn716+/P7tyzcvnyzNT02ODLY21gEQAHNocIiDA9vExMjUjAWgh4QEJSYnlJQUtTY2gOBAOZ4/MTLc2FhfXFrCzeTxMrg52fzC3CyYsaK83Mz0NOgg3GOoEjUVmOtLAnt201Wp/y6Ur1VDY7rPUL0Jjp848ZWEuKiBvradlSVmMpR4eHBAVFgoiQ9jKlbCFEEuCQmRtUvMPRA2Lja6qDC3urykvaW+t6sVyF6Ynri/unT/ztLDeysP75D2TLeX5+7dXnx4d/XVs8evX7148fzdnXt/cvTIkTdIFtXliejypY0LJI0LJVh8KYM0Sa3gk+cUtm7/7MD+z86fPSctJYHZDjUE6EBRwrQ31VYuTo08ubsAlP/w5tnLJw/uLC90tDfjTgH34eGhUJea2lrSslLKyopwhHHZob5BbQh3mIHpkb6J4X44C/AVSAdwfkZEeDBAg7mnpqYiIiIEB/+Lo8f27dnLMHFNlROqrncb/51RvoHvDzyqn6LI6DPJBpWAwGefHsKxd5cAzhxMh02SkZYEcIFy6HHgGwePmwqfkpeWzIh0eDsRoSFBPt7ucE1cHNlwHI2MjAxYhqampgAoiTj0cgPNA7y86M4edCg4DrEMpw2P4Zl5u5MSmKRgi6ubm5MzrYVJ0v45Ts7Ozq6uazSn2aG0iDkj1Un7HrL8wnHAB9nbkfIvG/0u4P+x7axAJLatHX6/FiHOcSLvv94vAr/BQV5iZ2tDGh0YwVNUVyWumBRZgxeXlZFSVVHS0dEyNmZBdrAZS4APsrfj2LOdHTluHuSM/EOCQkEqsgLu42fv4KJvaCOjaCylYiehbCetbq+szdbQMtPTNdLTM9DQ0ICTB50qISWurCIPHwGfTvKbQoMBq9jw8KiwYFxq2D9cFtg8nA/ci3PfnP304CdkB2P7LhLmwBSk+7BQxFpK0e+P8rW4SKZHJelQvGWtGS7eF88/duwY/B0Dlr6Hh1tkRBg3Iy0/O6uprr69qaOvY2h0cL67Z7GuedktuEbZNFNcny+imyWmmy2pl61gxNMwiddhBWrr2BoZmNlZ2kIMQvQlJsQlJyZx0zOy+VlNDa09XRPR8eXW7oVKphkKJukphUv9o9/W1I3zs2pi4jIjIpJ8/KLcPKNsOZEsu3gl43gpg3QJ/RwcUob5UoaFksalouZlSu6dCj69Uh4dsu7tIrYl4uYZXglNDW0g8t3nDx/+8O3rH96/hjC/uzwP+dZcXwMipyYmgCaGxCnUNLcw9g/wjo+PLS0tbm9umJscu704Oz8zPjY0CFVeWVleUJBXWJBXWlhQVkSquQLlvLRUOBn+3h7uziReXkRE5LPPPtuxTWDr74Hyvxa4RgsEMhVfGZST4grwxzEBdEm4HukF4+/ng0keHRWRGBsFuQHpihkFYaKgoACUC4kIU4MdFOifxeeREKOqcli+kYHe6bHhu8sLgPizh7dfPbr/4vH950/uv37x+NvXz3549+aHd98+ffRybv6Zk3u6ujHdgIrDrVQw4coaJsrqR0mquZ06J7Vtx6f79631gTNk6dJYpqjIcJCorDhvbLD77uLkH98+/fHdy29fPn3y8E5/d0dtTVVKcmJoaLClpTmkk6KiPJxxUCYmIrQ4LxsO1kBvx+TIwNLs5ML06HBfV1dbc2Upbg6fqbrlC/UHnQVxB2N29coleCcH9x/YtUNgo1TchwXj/v7mFf+liKP1EION3wMEtDQbLTJMO5ts374dbsThQ599QX6OHvnsMJTggX37v/ySBCCBKWBxRjJp90FRnp3FhcCCzIIwJ13tI0KhJUMDfP283DE+SediI5BLD6Yaj92cHDBug3y98C+8NGCXNPzS0NTUVDczJZWqPF1dMKxJczWmPRBdSCHSG7B1IrVc6BodadND+nziU7xpqidsAD6OBBficHXzcCOBfYxJIMsylNdgtzOj9F3JWg2xFngVLQOABxsd3ZgVecJ0a3MzzC/ocWUlBTBOWlJKRkaKKHQN0p4Ujhe0PJhO9gPc3P38/IKCgkKYPqT+zN6vh4cH246jp2eqoGIgo8RS0TLXNbQ2hJ9gZKKjowNPFDoGJJeTk4Exw1yAs+7r6027YsHBiQwNggcDuNMoe0gQfW0dCTHxs19/c/DgQRoeAm8JVna9G9d/JELpN0D5zk0fb9+0aefmj3dt/piskpPdTtL3bNuuXWTTHIYLbpq3t3dERAQvIzMvp7CstLastLm6ZgDMTeF1eoQ1aNjkET1ukC+iXyBukCvFytFnF7DdcuydYu1sPW2t7Z3YHBIGG+gfzKQtJMTFg+b1tQ0DvROtbdOF1fNWniVKpmmxmaOtXferqvuLCmqTkzJiYuIiIqJCQ6I8vKPsXeM1jMPl9eMldZLFtZKk9DIk9fj4LBGTIjmnFhm3dgmnZinHegnrIhnz9MDklvau6bvL954/fPzm+ZM3zx+DDkA5WWWpr4Ggy0hJBhTMzExg4e3YViGhAampyXW11X1d7SvzM8DWyvz0zMRoV2drS3N9fV1VQ01lbWUZbUIEY0Y82ZBACB8MOJaerqS4BNngZjBBgk9/d5R/GDy6Y8cu3OaTp0/JyMhAaMAhxVTE7PLzITmBoGdcFJEbIcH+7m5ObLYtxjQGtLikBGaIubkpngmAAg0wXVWVpeDjYE8nhDnM27P7Ky8fklJlr589evvq6fu3L75/R5KwHtx7ODV1OyIqz9GTZ8xO1rNOwKFlHqOsH6Sg5SUqY/7lies7duw/fPhzUrdHTdHM3AjyB7SFOMjkZcBAjg71riyM//H98x+/e/vDt69gJ8ZH+tubm/DXmJgoSEuynKpLUrfDggIhP2srSmFmxob6ZydGVhdmcLPGh/pA/5qKUrgUMFeB/gGkYY2FGU1L0VBXhaa7eOHc0SPHmF3Qn2hO6hVvXp8LvyXKP4wW2+jVScvVbRRooyvj+/aRFtinT546efL411+fvnzx0sXzF06dOoUxdv3aFWhDIBjITqc0z0jhZ6bjfkFe0NXzhJhI0DwmPDgi2J/JSHeBfGWxWHo6umAf09KTg6Hr6+nm6UqCx0lpQDV1eDwQvLhipAELk1HJtOVxpInyHLY9Vdkw9kAtg3uCaUhyHw9PJnPHg+KY1rUnKaPuHvQxfg9Y06gYd2cXumhD120Ymrv8AuW0ShcOF0cHnB+si42FqakJaQGroqwIlIuJiUCmQyBjxOKcod+BfpgfP1/PwEB/oJx2F6L9g/CednZ2ZuY25ha2tuR7OEH3g/7Q/Xp6OrBg0OY0zt3BwQHoB8qDmULnIQH06jnR/jm4UHAWcLF0tLTx6dBJ+/cewODZvUuASoSNorh/V6PwXx3l4PjHW3ft3nfk8OfnDnxy6uOP9370h+2bPtrx8SbiAx448AmJJVdTs7S0hLcSHhadlprFz65ITCuLSqwKia8JSmix9CxTss4XMsgSZeWJGRWKGZF2fDLGWRYepUER5ZFR2YGB0V5ePj5eJKkXppt0bHJyCg4OTkyMr6mqHugeenjv3eqD/9c7qknJPN01uj29cKSwvL+yoi03uyAjLT0tLSU5OTUiOsk3ONnYKgR0EFP2vSXrLqYSJK4RLaGXKmqULW1bJc1uELOqFrcsk7cu0rbLTs3p7x9Yur/64NmDR0/u33l0dwUHUN4D1V1TmcvnpiTEY7RhiNszO0LxcTF8Po/2CL23uvTsIZHwy3NTQMxQfxfUX29XK+R8dVVZQX4uP5MLBvn5krVmc2MjCAZoJZJkyJR2+q1RzvT92PJ/RPnmrUA5XATobMx5aC6aI4eJ5eXlERDgF06yNMkRGRFCO2lZWVlgPigoyMFmQ7vBy44ID02KiwUdCnL4MGCt9fWjA73z4yOPby+/fHD7uxek6uT7t8/A3Pevn7998fTuyur01EJBQU1yWpl/CM/DN5ntFGHFDtRlOSupmt8UUvz889P79n5CAzDMzUiDQE+mCVFsbHRWVmZZaTG0//LCNJynH3/49sfv333/9iW8ot7Ojvy8nOTkREcnBygmCwtik+Kjo7J56c0N1T0drdPjI4uzU7eX52Bmppkt2frqipLiQpir4MAgku3BpHuQhGxbGyOWnpIiKZZ0+PBhpgjXll80sP6t8wA+bIm+eR3lpG0N07mG+geYn9BPQDa8eOD70qULwBYJMVJUkpQQu3D+LC2VA6ZASSTHx0GJw1GGF5XLz8L9ykxPSU2MS46LToiOiI8JjwoPiggOgIT39HAhCUHM7iJojlHhynH0cnN1d3Z0drADvjU11IBIeXlZXW0dPBNPgI2nKxjWTPd6W0sra0tmhYRNGjSD5i7ODjgo9OlFZpJF11BOV9JJ8ifzS3wWxTRQToQ5s5ACOwGg4zHFN1micSUH4M5EuOOZHDdHRwbothw22YAFteFpKSrISElJCAndEhYWxAOcPM4Z70MSX5kaBj+rP+PlwdSGdIHiBqkxKqDf4XBg8tLVedoJEi/Hc/AETBNfpkgkYEUjW+hzHGytXBzZOHAacAjExMSOf/kV9LiAgMCnnx7EiCIO1nq5iJ9ad/3dud//NZTDLGzdtXnbntNnb4pL6l27obp915f/1z/t+ed/2fMv/7Jr65Zdn35y5Pz5i3JyCqYmli7O3t6+UZFxebEp1S7B+cbu2bqu+doeZYqcMgm7KhHrajGrShGzUgmzEinTQnlTrqN/eWJqbSavNDWFFx8fHxMdCbcF7ADKQU9fX1+oraqqqt6O/tWVl3P3/rd3Qoc8O1fTvdzUpzAxr6OucaCmqr68tKy0pKiwIC8llRsWmWTLCdRhed4SMz13RUtQ0kZeO0DJKE7KKEPGskjGqoIkdJkWaTlU2PvV5ZZOdfUs37397NXT1y8ePXp87/a9lYWF6fG25jr44JgAURGRUKmY6n5+Ppj5mAxAQG9PF5T404f3Xj558PjeKl4yNzk6OdI32NPW3dbUWFtVUV6KZyYlxmOI4IuQKhZKiuA4VNOXXxzdJ7CbKQi85TetVP5XUb7WTOcj8un79+8/f/68kpIS/GVMDIxvUluDGcLe3p5QHIA4CV+LjYwIJyndeA4ZnXBjtbSg0PEqjH78BTSH6CvKy64qKelqbRrt7b67MPv83gpQ/v41JPmzP757zbT4eLg0Nzs+OlZeVs3nF0ZEJAUFxbi7BmDA2No4GbEsZWWUvj5z/tixL69duQqUONjbkOYypCpyfEZ6Ku5vbU3V5OjIneUFoPxff3j/b3/87k/v395bWQSpa6orc3Oz/QP9MMcwFTE5M9PTivNz2lvq4T+NDw9MjQ3PT0/MT42RlKLuDhieosJ8pjh2MG2RgcdwlgnOXJ2sLE0x7W/evPnVF18Smq+Fi2z5oEfr1t8gSPyXPXLXkkq2bv2w8iht8wKJd+zYsUuXLkGJ37x+Q1ZWmniNNqQEFQabmKjwtauXxcVEDPS1vb3c8L0wknENGZRnZvO4/IxUUoiY7H9GQZvHRoVGhQaFBfmHBPgCuyAXrDtutIWFGUgK2Qt5TtmEywKbATjKychCvBszmTvmpmYmRsbGzA4mac9jTLZPYfgBFrycBpOQaovMsaammdUVWhidopzocVfSVnStZjqJfnGifTjpujmR/I7Mcgp5T1JDnPYghbHBvx5O9LE9DhIwY29nZ0sCTiA+5ORkcM6gubS0pI62Jr4d3hYfTRsMkW6iDMp9vGHSGQvBdN4gdQW8vD3dPWgPOeqC4PeYJnSMkZ0BZw6HaU9hYszS1SEpVMRZsbf18XCFK4NvYWtrra6ujvH8ySef7Ny5fc8egf179+3dveevlCbetOX3RPm+U1/fEhLXvSaod/gL0f2Hbhw4fH3vJ2e3bjkosOvg8a9O37opoqZmwDLhmNkEOfjwOaHl2q55YuwcIU6xoGv1daeaG04Nt5yaRTlNJNvevETJrpjFKQiJqy8obK0ory8rKYe2ysnMSE6Kw7zClYJhh92Li4urrq7t7RnpHblTNfDKNr5HwqPmukOBkE1qaG53a89Md2dfR1t7S3MjCUrLzExITPX0DDQ15wgKK53+RlBEXEtb351lGa1pmapgypcwzodPIM7KN3BtcAluT8gYzikcnJp++ublH18/ffnk3r3luenRwT6otsLcHOqAk0S40OCE+GjQobyspKG+enRkYHl+5vXzJ9++fEo6EN1bXp2bmJ8Y6utsbm2oKS3My83JSkhIAA0dHNgY6/DvMK8glL4+c+rw4UN7BHZjNn7oXv0WaKAo36j8t9Zq+aP11NzNW44dPSIkeJOWzYMgCvDxxGimG1kYq/7+viB4Ulz0WjOHyLBgfx8MUIgUCzNzloEhVBstZAoHE9BPS03MyeQBkaD54uTYo9Wld8+fQIx//45I8hePHzx9cGdpdmpsaLChvraoqCQpKSU2Oi7QPwiWEvIHygtoEBYWPXv2LK6VBVnAcYqNichISc7J5hcV5uJV3e1ti7Mz928v//DuzY9/+uEv//rHv/z4A9757spib09HXV0NhHlUTHRUVBQ8OXhFNRWl3e0t+NPgQM9wfx9u6+TIAFN1q7mqjDQVod2OYK1J/4qUhAx807hofFPgD7MX5kRUVPTzzz8X2LmbOsU/9bnfyCT6NVOHtmyEFXzYK5IMlY82bVtv/UF9ZNLG+vLla9eugeMKcvIk2N/DDTciyM8XgNPX1sA1vHnjGuQzhHOwf0BKQmJaajLcRNwjOCuZvDR839TEBNxfUvgsii74hoQGBgCpgCPUpampsbm5qY2NFZM07wQi46001NRxTeCySIpL4LG+vi6LZYDBAPmph/sHra6jA4/NwMAAaMfLwTIHR1tHjh3dwCQrJhwHZnfUeaPcFahNVTbZL+Ws7WriHIjKxrBwsMUwI6EszAGsEyfA1po8trOh+6W01y5QDu/B1cWR8h0nDLFMl/jV1FTExUWFhYVlZGTU1VSYrhS2ZM3Hi+QQ0VQpoIZ6CX5enpCSNFOUlHNncvRpPUhYelJRy9cbJLcnFbVMWSyWqqoqTCnACjtnZ2VJa/dDIOBtXV2dYeFkZWXPnDkDju8U2AE/+NChQ9u3b/+pzct657Wf6p7/nzK0f5218i27tkAK7D26/9DFE2cVrgqbick7iys6XbllsE3g+B827d0t8MmJ42evXpeSVbZQ0vdTs0pWtc+Vd60Qdq8V9OsQDOm9Fdx3M6BP0LdX2K1TyL5exKrMPKg9JmuiufPeQP98Z3tPW2tzVWUpOJieRsp3QAg7OtoHBvonJibW1zV3do4m8BttohpUQtpEQ7qv+jaK+ZSFlk10jq4O9I9ierY3N9FUkdTkFD+/AHu2k7SUwo3rwoqKsMMurp5JzgEFunbZcqZ5ksYE5YqWJVo2RaaORVbOuUUVE8uLr58/fP3swaPFmUmoNpxGakoSEWz+AXAUUpLjc7J5JQX5+IiOlsapyVFow7cvSboKUP74zuLyzNjs2EBLfXVVaRFUT0pScmhoqJeXF2YCxrqqqrI8pIGo8NWrl0+ePM7EL+/47VfGf6bK17IVPloLs4OsO3P6pKiIEFBuY2EOQUQaITJSgmglT3d8d8zwtKR4OOM48IAUrQ0PAfFJjK2V9Zq/6UB6tGOU48m4Ykzrvlr4KEA55TiO7968fPX00YvH9+9Alk+MdrU119dVgaS4UImxxEhAD/p6kkgSUAlaGNfKxtoSdgVGPYubAew21FRCXI8ODtxeWHh07/Z7GN737/784w9//tP3sKbPHt+bmx7r7+sqLMzPzc3lQ3vmZldWlOBVuFmdrU1trY1dba3Ael8ncZtaG2orSmBvs+PjYmJjoqD6wbUsbloOL42XSvpm4JTghQAQhoaGgoKCXx77isab/8b9nv5/CyzrKCfJ1ZvWuruA9HAU4C6A40JCQvKycmYmprhlkB2kfxOzNwMfX1dTA+MNahTi2s3FNT46JiU5MZNHMteAci4sZFIc3Cnagw02m3IcX5vpbAl0cwBfNlMqFrcbfCTd0axtwGp8IoCoqqwCfJPETnNTqHKcgylR5iAbS1/fUF9fHw9MTIyINmdbEZo7sAmjIcyZ1hZkm5Q0MPoJ62Rxg251cgjBycqMowNYjIMEpTOLODgfezs2echgndSwZa+BnsQ42uOZtkS5420dIdvtaWYmKTxgaqyurorThh3CZYGLbKirh/fBlaHhkqQCu48XXccnuRR+XrTkr4/PWtYobbgBrwUoxwMwGicA0yUrL3dLSJDUmZGVNtTVgdMAS4CLCYkQHBiEdwABNDU1Yfy++OLojl3bQVpalZPWzKGtn3/qyPYzbf5boXwnaL5py57/9U97D34ueFPaUU4nAoegnOunX0oI7P9m0+b9e/Z8fvTLK1dFDURUfcUMk0XMsmXcm8T8u6VjpyUT54XjpkVjp0UjJyRDR0XcWsUcqh3jR7Nr7s4s/evDB+8XphfHh4daGmuqy0t43FTQk1TBd3bBFUlPTWuob+3um+cE5Qpap8lG9oglTd2IGZCObg2pm++auj88NDHQ3d/e2NxQVQUpnZ6WAgxhPCgqKouIiGlr6TvYu4SEpcYkVps78ZXMsqSNCyWMioT1ckX1ssX1eRK6iUEJXVUNCyvLr54/erk4PY1pDz+ULK34kU4rmAOkbUJFcUN1BdAA0C/OTj24s0JR/uzhXbrAMjrQU1FaAK8iMSEuPDzcB/rI3d3R0RFDz9LSHJyCdFFTJcss586dg8O11jTuN0wKZ+4mMzjW0ojXj+1bd3z26aFLFy5KSIhpa2uam5mQyePqvBZI4OHmx+zOk42BTNLnPi+Xn5fF52ekZ6YlwyWnfV6YzXprEubFJvMHUgVyuLAgr6GGNJd4AO387evvv3393fs337199eb5k9fPHj1YXlidnR7p7yE1DGsqiTTOzuRmpEEUgyOYsdqaWlJSUmqqynjPAH9vpnFgdmNtFXBMti4nx2BBH95dxZXHe4Ljf/nx+z+9f/X9W5IQsLIw29nR0tRYD+cMEr65qY7kKDXWNNVVQ57jgKfVVFuFA2dYWliQn5cF0ZCRksjPSM3iZxTm8Yvzsopy+Tgl8C45KQGuGAQZ4CUsKHTks8Mf3qyNhc5fFeu/zPCkpR02UE6jkjFsPjlw8PzZcyIiIgoKCob6Bl4enlFhpNIRTpusnCTFQzw62tkqyJP+LSTl1dIKWGFSPci2J/7FHKFN+yIjwsKZRH6m5zhZYIHvFehLCrDArgOFzGI3hy5ZWFmQVp/Qnnq62qYsQ5hbEk3ItnWwJQJ5Lejb3IIk7TM/oDxQbm1rZW+/pspdmLBzV+bH2dkZs4NmmZKPcOYwTS+cnBjikyczJoRk+jg5EIlNNs8cGVmP19k7MHqcOWztbC3t2dYkipHBPdl3tSf2ABaJrrzj0zEBYXvk5OTERWHgRGWlZTDYzEyN8VawInRRBaIEXibZWaXbs0yRr0DftUWYgADQwBfDEr/Em1tYmCkqyuMuXL16Fd6tirKipamRt5szCcCLCI8KI9swfn4+HCc23AJJSfELF84dPLh/9+7d+/YdwA9oTntWrI2in3cdog11fxuU06YTW/f88x/2Hj0pLqTgIq0dLa0TL64eDqxfvKF9+OjlY19e+ua8hLCMhaRWsDgrTcg0T8K1RdS7WzRsRDhq4kbk2M2oSaHIcbGwcSGvThHneg3PBvuQhsKamcmJ+7MTcxsoh0QKxSzCNHJzx2jLzc7p7Ogbm7zvHlEsZp8pHd4lkjBxPbpfKqrFv3KqeXi5q7O/rbG1try8oggzMRNyA64NrLecDLnQurq6uN2R4XDoy2ycU5RYSdKGPFkIc4NcUYN8CaMCSVaOoXO5Z2hNXdPs4ty9uYmp/s5O+KEY5LDJsAqky3AOv7KskIRDNNQCQ0yL0SW6wPLk/u27y/MTowP9Pe1lRfl4ISgAqIUxP2A6LWOE98EIgFJgGerKykjB4RIQ2PM71B/fSB3ecN+A9X179p88fkLw5i04hjo6WhjlG6VBaegYzpZZc0iCdC0qJLUKyouLivPzinKzoOnSk5NoggkJ8uWQjrrwo2F64YjAKwIo56enHt1dBcd/ePfm/bvXwO5rEh305Nm92w9XluYmx8ZH+nu7WtubG8qLgdSchPhYwAjvBsdcXl5eS1Od6R7lm5FOGu/VVZV3NNeP9HdPjAwuzEyuLs49f/zg25fPfvzu7b/98PZfv3+Df5mufg9wX8aHBwZ6OiHhocHbW+pJbmdJIW0XB0+rsqQQTK8upzsrOaA5TEVxfk5JcR7MMG4x/sUpFeRnZ/F5iUzJYrBDX1fv+tVrBw9++uHqykbS/G+H8vU0TlK6jsbPkGygXbu/PPYFzkdaWhpOA7gGFsO+AuXgOJQE6U0YFw2gQCbjYkKKYgpgKkWHh3FT4WCl4chIT4UvgsmFLwiOhwSTvhCkeiITekgLaVGae5HcfCLJAWUw2phZWLO0MAO+XTmO64GDHLr8jVHEMBboZkM525Ie0FY2dtbAJf5E0Ozq7M4s3zFrzS4cDmdtpYVUPXQlXYzcXNyY2EYqLLw8yeHt7uLpuha8+FPgI7Pyziya21Px7mBvQxU7jVWHaaEJn7TNBU4ApwPLp6amRgrCiIqJi4koKSmQLQFzEkrPYU6SlnChKy1094gWlSQFI9c3SGnDDSh9FRUlWVlZGRkpdTUVUxNDZwc7XDRYxIiQ4PBg4uV4e7nBI4FUgjoRI905ju/fvx938NNPPz106JDAzt1/J8p/1pL7V4kr/8PH2z/asu/YKcEb0jZSGiGyOknSWgmy2pEyau4SUobwWtTULTT0nFUMQqUNE4QNeRJ2NZKubWJeXcK+vcKBA4LBw8LhY6Lh4zd8um+5t9ywLhIzTQtMbmvrmB0bnhoeHGpsqCkvK4qLj/L398UdhZ0ETUoK8sdHp+YWHoYklGq45SgHt0pG9EtG9yuENvoXj9R1T9fVNleWlhXl5ACjoExcbCQut7W1tYSExK1bt7S1tXFfo6MSMtKL7J2iNVlh6ibJ2pbZMnpcMd0sSUOy2CJhwFUwSEjh946PrM5Pzo709WFKgFYwqrh/iUmx/Mz0ksKc8qJ8CP/WxrrJ0aHVhdmXTx4SpXl7aWlueqivu6O9ubioICebz03PgOqB2CRpn9lEzwJ/UEOpicRzx6CElQZGP/vsyG+9xkIThWmTsw307NlDOgNcu3JVRkoaXiecYlwrSCRMMFLPOph0C4uJDmfWHDLKigoryotrayoA6LqKCuhomCvgD+BIiI/GyIZ/CppgZGNewQBQlC/OTD65f4dB+bfv3719/+Y1UP72xdNXTx89f3RvdWEGbg2uIS4a3SKG3wM3n6IcSlNHWxPvFhoSANWcl8Wrqyxrqq8C+od6u6bHhqkdhTP0p7evIMnB8f/9p3f498fvXj99cOfR6vLS1ASeRk0F7BAUNwZFWhLUdzosPflGJcVlpcWlJSSGkvYKb6yrJEctE0taQ06ppLiQDKe0FGAOwk5DjWxe7SH71Wt1+f9DW1V/57YnjRn/MFmfNnJarx+wmQYgfn36jIgQqUUOWkEzMgEqZIEI3w7jjxlv3JS4OE9XF2OWEVijoqJia2uLm4XrzEtLxYHbh9GYEBMbGRpG28IBWP7eXjR4DAfZEvT2WEM5xwkQhMrGuKVZlNDCUMpebrRwOQkMJwGFZEnZjcSTUHVNxPMa1znMLqXbOsepBPb0WFvNo3uJVALjASkyzpQapyRlYtI9gUha5Zx0Cl3fLF1rJ+3p4u7hTEvmErlub89kA5HPdWRcAXqQAgOgOVNhHFoBglpKCoQQo1Xs4XsZGRmC6XZW1s4OxETRT4coDA4iYhyXiAhzf7J6DvMDZ9TMzERPT8dAX5fUVbexgNnA1A7w8Q72DyC1JvFiskzFxp8sTU3gxygryV27evHYsWPQcAcPHvz888/37t7HEHz75k3bft51aMtGUv1v1dtz09Ydm7YI7Nj7xYFjQheEzMVVg2U0o2W0wrSMQ03MvF2cg729Ity9Yh3d0vRt02SN06XM86RsysXsqgXZdSJu7cLePSJBw8Kho7cCBiUDB27aV4hYZIbwBnqHbg/1j3V3doEa2Tm8yKhQHx8vqHJcOAARenBkaHR56X5jxxS3atomtkXaq0LMvUTaOcuX11pa11tSXFGUl5vL50J0xJHugAHwy6Adbt68eeXKFU1NTQyniLDItNSsqJjMwPC8sPja8IQ2Qxu+nF6avHGunGmBFCtLxiApOWdkeurh8uzi1MgIFBxkSyApH+cXFRWRlBjL40LykJIykHVw9lfmZ0ClV08f3lmam5+eGOzt6mhvraqqqCiD5CsuLyupKoNTXw5FiYNx8Msh9XhpyWFB/k72bHlZuTNnvtmxY9fPdfSvvNJCmhJ/UL5n85Ztn3zyCRwCUWESuAaFAr2AyQZ95O3tjS8bGRkOQ4gvSxor87m4qrWVFQBcS0Nte1M9jpb6GoCP2RPOAjtiY0jGoAdJ+CDNZfCYFJevq16em3764C6pYvj61ds3r968eP7iyUNYPvzy0d2V5QXS1G10sA/+DZywwoI84sdEhmOy6ejoQEVipuENMXmAYChNyGQ8rbWptrO1aYhpwgdLcH918f0L0pcVqvwvf/z2z4w8h5P09umj+0sL81NjfUwsUW5OZkpyfGRESGxkBGnml5pCcrhKiqoqy6uryvAE2iscZ4ID79/R0tja0tRQX1uHZxQXkRhHnFtEJK2UdOrESbJo/vFaANmvXXF+y19FOcYFLR6wlam3cvTo0SuXLsOxMzTQI5UkIiMYrZ0C8QGIF+bm4K6RLV0uF44OoEMzFY2NjXGD4uNiYNLw/IyURFq5E4qe1ignnQw93JhlDw5dcPDxcGUyM52BRXNzcyMjI3DcytIcHMfvwXGAngYR0gR9ZqmZ0Bb0pzR3Xj+caClBRnp7eq41nVg3G65+vp40koQUviI7kF4B/t708VrtRh9PZiPHg1qOn2LSmbfyxol7MoKdEeBE7FMj4sCmizAweDTihboX+I2NtaWJiZGGhpqcPIk9x3SQkpCUk5NRVVUG0+F80BpEeHOm6Pn60rkXMVf4BKJdbO2srS3hc5AIHzcnfAucJIwfLiONe8GUoHXEzExZFibGpixDPV1NKUnR82fPHTjwCeQUhDkTb779vwflJDRqm8AfPhb4X/+859Ojt26KW8tr+Clq+xhbhXp6xcVHc9OS+SlJOUnJJW6+PH3bFGWzNAUT0mPphmGukE21MKdZ0qdfPHhUOnxSMXxc3K1J1qEwlD80MHqvv2e4pak5L5ePiRdCEqeIlcZYBD2rSkomRkZXllYfP357+/GP4RmNeh48RbsERYsI39hifn41jwe9lQpnHH46WcfwdMPlU1KUP3f263PnzsGfsmfbwjdKiEssLCirqGhpaR1vbV9w987WNk0wYOfqO5TIs9LljZLTCybm557eW76zMj3T1lhHI1jwQlqzH6wB3DFbIOtGBnqXZqcgDJ8+Iu3JZiZGgfLurrauztbu9jYcvZ0dA90dw33dw31dQ72dfZ1tXW2tQAPkEr6Up6ubprrG9es3d+4U+DvWSbb/11T5trX20Fu3Q9DBtikpKBob6NtaWtDgKlwxfLuIiLC4uJiUVNK5lGnwllFelFddVgx2dzQ3MGVsW4e62nH0tDcDknXVZbB2TEEP3C9IQy/YvIiICPglzfU1MG+4OO9fP//21fM3L56+ef7k+aP74Dh+DwrjcgHHJKmqoRYCHy5LUlx0RHgwRJO6ujot80KCl8CpmCimMDq3OD+HtGOurmxrbcR1nhgdWJ6bevPk4bcvH//p+9f//sf3f/7Td//2wzs8+Nd3b57eXcVfezpb6mor09JSYInJkhGzgokRAr8BKIdlhQAHvgd6OpnIlkEc40P9MBW032xHSzPcC5gQuAWQsbhrwISMtOTRI5+DsnSyfYjyrTSVg3Qw3/GfXhD7Bcq3Me1zMRlJHh7ziXv37j537htRESEtTVVHO+u4qHBealIOLx1HVkZqVnp6Pp9fnJuLKVNWUIBLB+MKa62qqgpBA7JE4i6TPjAJsJGJCWTLl4RjBgcGBJKWmyAdm822sSEL30zsnSPuCGQQCVhi9jABJkwlmjeEA7iiAHVnHGgaIb6e/kP/6oQ3cXXj4KALJh8uXFANTkYO6fzpS/JOAwNCAvxp0zhfb7INSUO7yQoJx9HZwd7RjmzMAM1rdOY40cUZqvQ3DryI1IGh6yoM1uk6O/UMXFwdnV0c6Oo5y1BfXU1FXp60nxQWFhQUvIkH6qpqMFrUYhHL5OlKgxRJWCTblq4a2THBMySd1dsdmh0nHx4cQHbvfUhwOhwX+EPaWhqaGmqQ7VDlNhbmlqZGEOZCtwRPfHV8N/Pz6cFDB/Z9SsoifbSZxiOs1zcnQUq/4Vo5HV47tu/+eNP2f/qnrTsFjl64oqyu62JhF+bplxQfy+NzcwuyC0uKykuL63JyG5N5LbHcvljuhIlrrbhBrrBxqaBZhSinRdS9S9SjW8K9U4xTI2WXF8Tt7x5YGR4Y72zvyMnmwW2HTcb9xghLiosF/lrr65dmZu6trjx59PTJk2+7BuZKm0ZTCtrjuDVJ3DIeLz8xMTE6OjIklDSBJcPR2kpTVQXD/ejnh0+ePAmHHVICf8IgzuLy8nMLyssIEzL5tQmp9Um8nqTsUUvXfC3zpPS8wdmZ+w9v34esG+hux2xPS02GIoM09/f3DWO2AfNySZHuqbHRu8vzUOVPHq7Oz5D12cHenu6ujv6+nrGh4amx8dnxcSjTxZmJqdH+8f6eASi+lkZ8lyw+D7MLKGfp6ctISR89+gVtevALXtNyd+Qxs4IGcf2fAzqzBreGm/3793/zzTeqKkrwMDFAgTZMbHwjON2pKUnpGcmZ/PT8vKySgtyK4oLKkoJ6iNa1WuStMEv4FjMjg7OjQzMEeX2DPR3QsNDLZJ85OQnvk5gYz+VyoWdhwO6tLLx88uDdK1I6+CVZVLlPW7jBm2H65zU2NtSUFOdD2kMeJsfHhAb6QfhgAkhLS1+/fl1OTs7S0hIzH6CBcsxISSYuEdl9za6swM0rh+KeGh2EtXj74tGPP3z7bz+8x/Hvf/zuLz9+/+fv3z28szw3OdpQX11SXBgbGw1vg6QFeHmGBwcBXjxuOuwxaZpRVd7b2QYbDNOyME1qgcE8z06MTo4O4TxxQ2F91zuFFuAcYNeBRRFhwcOHPmP2kz/etumnxuprHIfV/M/XvFxT5WtbU2t1azcK25KSh0ePHrl69bKigoyNtXmgrxdMKe2qmssskXOTk0Fz0uYlP680n6SogdqALFgMlANbeBwWFJgYS6ok4sBdCwsNBsc9vVwBIEDKwsICAtzSwgxMsMdEsiTRKSTWkIkxB/6Y2rYudPGasn4tYoQJGKeRfFCmIBoYR//18iZrIJT1FNxgNQ0BpMEhzL9kCYUpteiCM8EbMuqZhNCw2Wv4pvmc7PXAFQJ0ZkGcdmSm58AYDye8x9rh6syUbOGs7bi6MPurTvY4SNoK2eQhtXnhcMAdVFZWhEIXFxfHxNRQVzU1McLHEfsBgNtZwRCSlGASomNgwnSqw1sxkelewUF+gDgpp4VvzoSxwmGCPYDjq6amQsooWlqQ2jLWFsYGuhBSly9egiQHiw998hloToqgfLwhC7ast0peLxfxm6Ccqdq8a4fAR3/Y8n//86Zduw5euSJmZGLv4RUWG5vKTecX5xdUlZU21ze0NLW2tfa2tE5W1c/ml9+28WyUNsgV0S8QNiwWs6oRs60TZddL4LAtl7TM8k/t7uxbGh2a7O/ty8nJgoOPK4Jby7QfSoEyAkowxx7cXn7x5PHzpy8e3H+yuPKgp3+ivqk7M7sgLS2DRH8H+sM44/bDOdJlqh9cPH/hwL79R44ckZSUxF2BaY0KC8aEZFITc4vzimoqG+rru2vrhuqapkMiS+zd03KKuibGFu+v3MZnTQz3Q5dlZ2UmxieEBocEBgaGh4fHx8cWFRU01jfMTZHyts8f3Xl4b2l6YnhwoK+3u6evp394cGRqdHphenFpZuHB6iqYMj3eNzHY3dNa39pQA/BRlHu5uVubW8BmX7hwAVeeKUy2jVpjkgmymeTywZGnsYM4Pv4Igm3HX6X536LGBym/uHGwauKiYlAH0BrR4SEwmfBj+JlcqFQ4QwX52YUFOVWVJZDbjTUVTbWVbY21tBb5YE/n2GAfCL4yNbEM5M1MwkTNT41Njg22NdcBiAU5fJJ7kpMFdPZ1tQOjz+6vvCY7k0+ZHhH3ntwnEeVAJA0YhSgGlEl2LllXIZ1ZoHqcHex0tDWvXbt29vw5TCfMGDAiKNA/PJT0k4NsT0uKx3gAnnCe7c0NcHce3V15/ezRj9+9/ffv3v35ewjz7/+ff/vTX354D0MyPTZcUV6MswoODqb1uOH1Q/TBtaLFBkiZtqqKno724f4+Wmzg/uoi7A0MME4VL6dWB18HTgaMd342CXcBKXR1tc+fP7tz+45Nf/ho8798vNE/a9vWXfRqf9Ci9z9nejfTbMBt660kyHtvJyw/ePDg11+fFmW6guAmRoYGwX8qyuWX5pLAG6hyDG9uaho3Iw2XFyYZrgw8nsiIEEBHD7NCW5M2aIyPjsLdB8rho1CUQzWT+og2ViSy0NyUKTtOAkIsLUxALm1tTVLXwdoS+AOpSacFN7L2AqVMly9o8g7IDpD5e3uQvVOyIuG5vlTijcd0Ox2SyI+J14bo9vIiSbY/VTy3trS2hOiysGBiG2E58In2dmywGB/HWAhPplgjuBkI24/H/qTZMzFCOFX7NeKTrOy1qBgnZ9Dcg2E6hbgTh00hTkNfmOUXkmcPADK1IU3wTUnGv7SkvJwMaG6ob2BmaozDiGUAca2lqQ40a2ips4z07NhWAA6+DnHZgwJok2sYJ5giKBLocSBbRUkZdwpficO2c3VwgBdlY2FqoKMrJiL61VdfCQgIAFA4oNpok0g6l2ljHwblW3+zhnAbbQqYcXb8+EkFeRWOo2twcCh0cSYvA0MHEga+d1NdbWtzR3vLaFJynYNXqbpZroROtrB2rqB2vhirVMy4TNS0FIeUZaGMGTc4taMfqrxvpL21DUMQrh/TsyMAow3zFpN/dKB3dWH20d3Vl08ePn/84P7t1ZWF+e7Ortra2oyMjLhYqHhfDAjcGBsraygIDTV1ESHhc9+c3bdn74EDB27duoFxjKEGk4lBDJ2SmU5CawsL8kqKSmuqG5saeivK24tL2kaGF+8s3Xt0h/SNnJkc6e/rAnRIcY+o6IiIiJiYmJSUpJqaKlB7YX728b1VHKtLsxPjo0ODY01N/x9v3x1X5bVt+8+7ib1rjBpNTGLsvSuKXREVAWnSkY703nvvvffee++9d5AiIhZEsGtMzrnn3rwxv4Ucb+65p717Hr8vOxtks7+91ppjjrnWnGOW5RXUlJQ1V1d1lZe1lJfUN9a3tDTQ4VtpUS7wESMDAgtwcXFytrOy1tPSxpI9d+7M5s2blyLU4aaT9WaiR26cCSM4KF8wb/E/I7/1GZQjmjt54thtUREQH0SClIEX4g/4BjXGjeHKTAXbTcrjFL0B0MUF2bjtiuKC6rLiusoyDsrr+tqaMS5AvaG+LgQlA0D0RoQj1HMDM16Ul1teXNTV2gRMfPpgaPrR+OtnT4DmnBBCT311RWlhAUaAtf30pHxNO9gA7dAa6KipKoK8XDh/Fv5m8w/fHz9+HCySVeUZGRjC/LmsACtXe3va7w70TUtNxB32d7VhCl5OPXk3PQUo//XNK9pmefF8pLerpb4GfiXAz9/c3JzlLwN6WCCCdw8PDgKUIzSrqa5sb2xEuACnOz7STyfYnW3dbc2tDbUNNZX4aJUUQmSBTySQDkMQliUWEkz9242biDp9MVs6y5Qt2NbK36tD/ZdwnPbf5y9YsmC2hdjiT3vlmHmY7nfffXfw4P4rVy4pyEgD2uCPsYwB4kmxkQnR4SDmcHVgHt4UHgVEh4fAHvHo5+UOuGHl+FR4paPtaGvj6GADzgRWjgEBlBsY0l4EVUhy+dqzOeDaGlQwKS8rKSnBeCisjLqrGRkCW411dVnqN0sD5xrraFK3B0O9OT4OZGcpKNzFnYrqg3LTjgcwR5lDT9AsACV1IJKWlJORZWIABlwpJqeI6c6iKMQZ1PUlLhrhVHoyXazNSyg5MEqmh0/ickt0NGezaOhdgN5M5JbpKWppqlHpKaWrUzBBuy6fgTttnqgoyUtLiQkLCd68ISx0U0T4FtNJByIjnGXHpFev8WFA4DBYGR13LjpbEMRV8Gtg3dLWiqAQG3BWLosLZAXEHH//6hW+A/v2r1u3bsWy5SuXryBZ80V/LuX//wTl7J3w7ddfrz9+/KSstAy8q7Ozo3+Ad0gwuEAohjs5Pi4lKTkns6gwv8XCJl5A1v+MSNAZschTItG4eMViecWiz0rEnhYLE1CKldKK8o+obKzrryuvK8jJhb0EBvhxnavswBkRgJcXF8AsYWyA8scktkelfb2dbcVFeWlpKT4+XphvI0N9JpiJmSDxtltCp0/z7NyxbdXK5atXrTh0cL/A9RvysgqYOEtzKwc7Rw83dyx3LmYPTUlOzM7MKi8qa6huvD84Mj48PD5yD4bd3dFcV1uRnpEcGRnuDeTxdMd7wUIKCvIaG+oGB/pYp+Dezo7mpvbK6o7QmPyAqOKwxNqY1JaQ6IqQyPz0zArge3Z2bnp6ekJCQkxMTGR4VHhohI+Xr6eLh62lFXBKWFgQFG/Filml6cUssCJ0WMSdhCz+pGLI7Xf/41yPrYalS5d///33WIuI8pztrH08XGHhmCmG4NnpKTkZqeCeuTnp+Xl0DAjOW1KQixEuKyoEb62izhIVmIVObiMCcwH2+nD0HmAUsA7sa2usa2mobWuqx79i6EDDQZZnHk+8mqQ2eyODfQhiCnNzELEBRt1cXO1t7WADMFfYF2ZNWUUBNOfGjWtHjx4GWm3YsOHAgQNXrlxBzItgH4SJbJI7VgULc3GwB50EMUc00NpQA6fy4snE22dPP76aAR/H47upyeGeTvie+LgYrljMnMEH0AdsztXFAZ6AbbBkpmc01jf0tLVhHp+M3cP1cGgAvqqzpaGptrKuqhw4XlqSX5CTSScDXN4O5dRbWQJ3YIqkcjdvtp6ek5xd+gnKF/z9ehr/fb4Wz1u0ZP7iOShf9OnYc+XqFdt2bAUvATFUU1IAJ3V1tIsICQSUp8RH4+IU2H1dXZyoVsiXcswpyTImEk8AdWDQjF1iwMGO4Rc9XBwZlLM0WRMDfZY/rsM1ROY2nXVBckFXgbDAXCDdp072s1DOqVlx1ZXceaOJAeE4+wW8lssqISLMqi4Zf4efUFK6oyAvy8TLJG+LykrelpWRAv3He7HIydXRAbbPco0yUpLzudMasAo6raks486fyvGkqrSwvCgfU4PVm5oUiw+LmfVwdwY7NjQ01NDQUFWlxMS76hosb51dDNCZkACdgupo4GJKL7hPIukqykrycrIyt6WlxDFcpKguLQkuCLYOVAHJuHDpooSEhKamJqI9c4ozLBCyW1KJG9aZDpYrPh316JC8jQiYUn30tD6JOKrdVVXCDwH0iI9/+IE0IRDerVyxjJz1glllpM87Df0LoXzevAVs3/bHH3/i5+fH+nBzcgSPxiCGBPsF+HvRybivt79vUFhYUkRUsbZJ7OXbAeeloi/JJJ27nXBOPP6MaOw50eizItTxWs0szzOouqJqqL9zpLm2EcAB80PIjxUGyhAaEpCYEFNdXoJod6ivGwj7aGzk0RgdnXW1NxUW5KSmJAFknexszUnTbXYjTJVklyUvXbq0d/ee1StXrVi+dOf2HefOIlySkJVWV1M10tY2tTC3tbd3pLxpP5+42MiM1AQsi+7mhonhwSfjowApROh93W0N9VU5uRkJiTEBAX6wjeDgQMB6aWlxWys1UgCUd7W1V1fVp2SUhMaUaVlGSemFS+pHyxgl3NYOu2MY6uCXGRhTEJ6QH5aQFRybHhKVFhyeHB6ZFhwc7+8b4e8T7OzsiqV24cKFtWvXzJJxbi9l3peL/+3/LPri/yz98oslHIjT7srnlWB/Z2XKXMi2fv16oCRWGIJflpoCEP+Ul0IEHMBNB33FecVFVBtJVwm+zS8tKQKVLivKx08qiopqKysaa6s6W5t6uf0uDBSm4/Ho8MT94Yf3hx89GJ2cGHs+8WDq8Tiu6UeUfQhSzqX3VMBJs9ItEyNjSkVnZVPyClwTSGlRMSH+q1eOHzuyZcuWb775ZteuXadOneLjo8aqrKUvfocFqrTlbW8NNwzThY8B7E6OD7968ggg/uubl0DzD9NT9/tpgwXLIzQ4xM6O3IapqTHbI/bz9aSeRHGxFEYUFPZ0dY8MDiDam348hr/zcLgPkUdbY21dZSnheGFeQX5WTjZlKKbExxBY+Hl7u7toa6gjgMB9smblTBdlrpHb/yuUcx2dGJTPliNx9rjpu42g5GCFEuKiACM7K/M5KIefSUuOA2qDpDs7UZ44t4/kASaEH8ZEUG0XIBKEERADQAdygcC6OdkD9HGxZEQrDBKnSkib2iZGZrSFbchysTFFCgpyQOG5UhpO6VCPywuks01KfdElnRYjPe3ZNBLuaBH/CkznMgsN5gRPGJOlzXEzI0Q5zvZ2nq5UTU0RRlQ46HY2p5mMIA/jj7VXzoWGtRWlDRVlrbXViNGb66pwtdRXc4fVNbiaQcRqSfASL0lNSaA6Xg83MAYuJ16LqwJV1/oviYl3PyG7Bhbjpx1/dcbZMb/c5vgdgAmwkeUviooIX7xw7uTJk2fPn8OyhKsAlNM+kakpFfIbG9Ipnaoaq3rlRLVUKN2eGwHqZK2jxTS28McpzZxrXbBuLalrfbVm1VI6Sac1Myvm8V9zzP81yYjzF3755XywvH379sFfWZub+Xt7hQT4kqpDAKbDlcSw7BytrV2tbYMs7RMl1UIuSgRdlk28JJ9yTirpglQSr0jUaaHQM8LBZ4R8DG3z0zI7Bnoejfbfb6mrAwEEdgPKQYExE0wJr6aivKO5ARH6g5F7wIuJ+0ME5W3NiHspH9nX293ZCYEz1gq7aMtPSfnmDcEjh45/tXotRmrbth0nT17kuyolIqonIW0mo2CuqWNvamprZ+fg7uoWGRECl15TWQIa/nBscOrpA5DN4f7uwZ7O5qa6vPyslNSEIHipQJ+IyJDY+JiKirKO9ubx0SHw96aG5ryCWme/FD2HtKvKgSflAo8rhh+/E3lENpBHwVfaKlnbI8vMP9c8MMfUN9PKN9vON8fZL8fFM83NIz4kODXAL9LYyFxMRHzbT1vhloncfbFo/hdLFy5et2HT7o3f7lm4YC1gnfrwcoqGrPPBXz///Dy0Z4KoeNyxYwfX6VHDwcaSUgxJzyQd1kJ2UpJfWVYI2KqsKMFVXka5N5iIstJi4HhJcWFBfi6YD36fyBEhflFdbXVzU8MAt+U1RUVSj14/f/7mBV1vX0xxCogPuF1ygvKJsZGmutrc7BxvTy9baxsYAIl7fIqpGSODneBRQuTWlQvnDx7Yt+XH73fu3An6A39848YNQYGbiFYRaYmLk4AXwi9TEyNPD+pRhQAC9BnzNf1o/OeX09wGy6sPL6bH7w10tzVnZabHREW7ubk5Oto7OTl4upKETlhoYHJSHBg9bL6qsnxk+N7j8QdUOzr15Mn48P17PZ0tdYCG6rIiqjDKz2GfHYELJdTHRkUEYyF4gnveEhbETS5ZQuTmz4Lmf/nrrwmW/k/Hnp/adc3KeK1atWr79q2neE5gHkESabfQwgwuDYMQGxGakZyQkZJI5WnhwQg7gI+2NhZurs7R4WFwP7htEHbAJcBUSuo2vsCLgcVAcGd7BzcnZ/wmngPrueNKY3aRJglVtGki1qW9a3lZVU4UkJXPzOrWGs1uoYBJ6dzV0FBXJWVEFaXZEIq4vw24v6+nW3CANyupxR3GRIdzXVnobAZzMVuFm5UOSlFWmAtSVV9eAlc6x77rq8oaK8ubqiqaqsqbER3WVLbX17Q31YFr9be3DPZ09He19Xe1DHS343kfiEZ9FXx8dlYaHDZGA+yB20yn8AKf5dO2vjbiCfDlT3votFl/F8ScSz9nEM9pAFDlEdsYwRIFMT979iy4FxYkPizla85mwRvq6elwkiwKnGLBbTV1Eq7hcnVoiNiRABPpxQDitVzrAp4ff/xxFfcFXGaa5rPbHrPHnv9KKF/IdRpds2bNmdO8mDDAaFQIbcnB84MggJKD6lpb2RsbOSmpO0soed+QDbwgFXHlTsplxbRz0gnnJeLOi0WcEwm+KO5/SdTN0Co5Obm6vbG7u7UTzhbIApQJDgpwc3NxdnUKDg1KTkqoqa7s4qrAGZSDCSKoB5TDFDPSU0OCqe6Geltxy9fG2hxDhkkRvCl6/NiZr9ZsXLZsxU9bdvKcvn71hsoNYdNrwpY3RM1xb/qGdtZW1H0cbwfmUlVe1NHacH+498nEyOgg4Xh/VzugPCs7LS4+yj/A28/fKzomPDk5saKypL254V5v11Bvb2VFXVxyuYZZuKBm5EWtJF79bF7zsnPWVadMi08aZV20zOG3Sr9hnXLDMvmmeeIt0yQh3WgxzQgJVf87Gj5Obsl+/sm2tu5YPzwnTq5ZtZoinn9b9sW/rV7x1a4TZ8R5zomvXrtj3rwVC+YvmWsZ/DdFVn+3S4vpo13ykyexdECCYFfxcVHpaUkg3ZS8UVVaX1OOpU9XY21Lc319XVVdVSVINEvIAZrn5ZIIe1pqYjqHF5kZaUWF+QD6tqbGga4u4rNPnrx78eLdq5n3r1+8fzUNKJ96PDZFcjYPKPuwv6ekID8uJt7KwlpXV1dampp4gRviEYCOYBPkhR1Y4bmYsBDvaZ69e3bt2bOHh4cHYZ+goKCI8C3RWyKiordw4VXEzTU1QDwx7bifitIChFCIpfDWv7x7/ccPH/7w9jXuanSwDyQgJys7KioKnCAsNDg2MiI1MSEjPbm4KA+m3tJQ29XZ/vjRw5lnky+mnr549mS2are+Gu6hojgffis3JyMrMxW+nEtiiUqIjgCUB3h7WJkZw7APHz4II2Q28t+h/LNv/2Eon9Mrn+Xpixd/++23hw7u57tyCbE5O0IAzs6VUOH24JxSE+OAkp4elNZpaWGCIfL384FVgpsDyoP9fZydqMuSDPcF3AExt7e2cXFwBJQ72NsiaplVleJyBFkaNSNGTPUQIw9GSXKynwQeWFY4ABEzosxtm7BsRfwpb3c36s8eG5ubkVqYk1GST5FfRUkhRh7cGQsP5KmqsqSmupxlf1ZXFINVYNjxy0VZ6bkZKbmc7n9GcjxijvSk+MzEeDzPTAFnT2J/kNoQVpY21lRgytqbahBVI6Lq7WjqaW/sbKM0pIaaSpYz6+/nBV9FiTFg6ExLHWiupQk0n91m0aLdc1bNxDRnGJrP8nQtNe27Kvj44mIi165du3LlChw5tebQ05lNbDc21NXVhoOEmxQSEhITE1Hj0tJJkIsLPuZkAOAvEf3gjyPK4efn279/PyJmlpjI+n/+TgjvXwblrLvvwsWbNm26dpUfE+/n5Q0LYRWA8VHhlPzk42tn62pk7C6l4HBF3PWiZPB5qeiLCkmX7iSfkYziFQ29dDv4qoTPTRlPIRknS4fYxIQCxEYtDfV11WVlxXmAcoThLi5OTi6OIWHBYOW1NVW91A25H+Rrbn8WMTuWBWgXTDTQ18/Hwx3uFyvVxcGeig81DcXE7pw5J/j9j/vXrNm4bduBU2eE+W/qXBK0uiBkf1HIWlbFXc/QxcbaGfElg3KwsK7WxrGh/on7g4ByIHVfVzugLTMjBfG4r4+Xt7dnbGx0RmZKRXkxwjrcUndre35+ZUhcuaRuyDmViIumhWdsqk67NJ/17j7u2nLEqfagQ8Uhh9L9Vnn7LXP3GWYc0U09rBx7Qj7ilJjPFQlPPasUe5ckF9dIczO7a1evf/fd9/PmY4Q3rNt4ZMteofM39c/fuLv6m4NfzFtFKW6zFZsL/yG9bNbsDSjAx3dZWUkeJA6WT5w0MwWG1FBbAfrZ0VwLdtPT3tzf006VO+1NLBuvub4OmF5VVpqfl0MEJzGW9UWCc8Ww5+fm1VdXdTY3Px0ff/ns+cc3bz4Qjs/MQfnkxOizhyMYTwxjXlZmcGCIvr4hws/b4hKSYuKyklKKcrIAcQSzrOCb9se0NOWlpYBWRw4fPHbsGLiP0E1BYu4yUtTFUZIUmvByBLAqKkqmpsYg2nBL+XmZA70dmLUPr2cA5f/+y4c/vH8/8/Tpk/H74Gfg3dlZGXD5qSlJWWnpxfm0cdRQX93R0jg80AtmABAnoZjnk9OTj8eGBxFqIHJvANjkU4Np+DxEfvHxsYmxMTER4THhIYByhJ5gr8CskyePr1u3jmUlMnUUlkzGNlvmfyaK+w9BOfz14s/aMXMdQpbu2rXr7JnToiKC8nJS2joagFErS3OmRomAmEE57hZzFODj6e7mxEpsgNGYccSdgHJgureXm5GxnrKyopSU1J07d/R0dPFBQJyZDAtoECuE4ToG0BdYJzgpIAyzgAsfmW0asHIEtsHCivUp3UBKClOE57aWZpEhgQDfssK86uJCEGpALUYVVoPwuqO5HjiLq621AY8IhUnFgVI/wcjhN5NACsOD/OGPnO1tSLjKxNDEQNdYV9dYTxtP4ETx992c7FmXcHzwotxMvBJT1lZX3dvaBCgf7GkDPb/X39Xf3YG5BrAU5JJYqZebs7W5GZBaVZn265lwkJ4WU1Qn+Rd23kYKYkxj4FPmojagXIsUFrEUb926hUgRDpX1aTHUN2DFsWDld+7Ii4iIgH9g3bLOn1RDy10cpptYWVgyRWWsd9yAsLDgqVOnNm/evGrVCsDvsiXLZ6uyPx1x/WuhnC2vbdu2SUrcdnF2DA0MYN07czPTCnMys1JS4mOTAgNjXTyS79wNvCzudUky7JJM1CXZaD75yIuSgefFPK5Le4kqeMiouChqONu7hEdFJmZlZGIW83PS4UHDgvy93akCzd7eNjg4EFBeX12BYHlkoBe48GB4AGg+1NfV09FKWWJ5OZQTEhTs7+1FYO5sj0AREY+OlqmEpDr/Ddl9B8+tXf/D7t3HL1+RErilx3fLlk/M5aqYg5Kmr7mVr7ubn5+PP3NFtRWlnS0N9+/1wVWMDvYOD/YM9nV2djTn5qQDykl4yM0lNDQYOIhoABFfW0NDc11LUkqxW3CxqFbEaeXY86alp62reZxbjru1H3Zr2+fWst+7Y79v50H/ziP+XYfdW045N/GYlp3RyeORjT57219UMVBR3cvJJdrFyVdaWnb3nn3zF638asPeI7wyvNeM+MTtz93UX7Hh0JcLv6KMhnkLqT3gEtZe9ffVQ3MCT7/Te2LPd+3aIyIiDJt0cbYLDvJLTUlgRfC1FSWwMUB5X2czlj6Gd2xk4P5wP7wmKO29vu7u9rbWxoaKkmLwKQK1BPjdGKqTTEM4TP1a2xsbAeVg5a+fP3/74jkA8eUUpaw8f/IAaP780X2WFJgQH+vl4a2jo6esqAR+Jy8to6akDH7HZShTc3dWEoJvVRXvCNyg7hynT5+GwcByKChWncsVk2da2KClOjpaFhZmIaEBYNkUTt3refti6sObl3/4+R2IOddx+8n4yL2Bnu6mRoQaNYjtGmqq8XGA73AvQO2nEw8A3yQtMP1sZvLxs0eY+T4Yf2NtFbheaUEOCB0WBlNiAEcJCwoM4zS+EQIC48BAz57lhR1SFumn9rsMyikTaSF11/p/2WD5lJ9KOanffPPN8eOk1qSkKAdkAeDafpKS54SFSTmSwqY0ypIKCfAFMTczNQTcE5pj3YYEgPEQMQ/yw6tAD5WVlTGYeARagSQCXTjVdnMrS0oSNCFdV2ND/AF9OvZkUE7neDJSGirKDPjm2j7gd6iFN6khUlKHn683KF1xXnZdWXEHsLuhrru5EQgOHG9rrANqw8qA5q1NtbS7XVeOoKoUQJucgNCB6vsszIGY8OjXr125eOHc6VPHjx87cvjQgQN7dh/at/fA/r14fuL40XNnebkA5aaCvLSxvg5APzTAJyk2CrAOqo636OtshQkP9HfDOeMJq/zIzwagx8C9wVWpqFCKBC6mDENxhr4By+FhMgNzIl/cv5KqF4Ab8A1KQXt9YiKsV7WB3mzFE6AcDENcXBxQfvOGAHwbK35m+jas3Tkr6Lc0t8DfxKjCKnl5eX/66SeC8lUrVq1YSWckbPPjr+YZ/69tsODJ3r17FeTkAXCIobLT00oLC2DwlcXFFUXwxOVh4dm2bumSakEXxX34ZcNEVaLF1SMk1EOE7ngJyjpIqTgqadira1rp6Fk7OnoG+gfFR0dxNSmxyXHRoDwuDra2NhYIEhETpiRT1xhAOeD14dAArA1oDpAFlMONlxXlkzJ4KPVsw824u5EPMDIy0dIyEr+tck1ADlC+bt0PB/fz3BSQFRHTunXbQlTGUVzOQcfQz97Rz883KCQoGH8BXABRHrcj3w0sY4g2NNDZ09OSl5sRGRXqDj/h4gT+DlrKRXZF9dU1pcUNPgGZRo5Z15TCee9EXzIqOmdRftG15YJXJ49H+2HPjmMhg4ciRg7Fjh2PGzseOnjev++Mbf1Fk7KT8jFnJQOE7wTIqro6u0V6ewXdvavFc4p30bKv120+xntN+6KoA5+k65mbBss2HJ636Kt582mjfAmZ9uK/wsrn1M//rNi3aMmKFauOHDkGBIThebo6BQX6coIqyYUF2eXFBSAsTfVVYOID3e1jQwMPx4YAaOCzpC0+NgLeOgAjqK/B4MAMwPvgyTgoT8vPzqqpKIc/e3p/bOrRo5dTT4Hj3C45ddSbekqPzycewOmCcEVFhru5uGpqagLKle4ozmlcUDmJqRlICuv+YGpopK6sQof7Z3nPnzuDGJZpfbB0NxJcVVNRuaOIhccSvPByUM6E+GiAAt7ozQw1oyAo//kd6DmiBKpOGh8fvTc41N8DjB7s7h4e6B+91/9k4v7Uk4nXM1NAf7zq9bOnU48fPhkfhePp7WzDegMp5xIQU7E24MgBhaQ/5etDjMGFSyTV0QWUX+W7vG/fvrVr184ddbL8IuZK5837S22d/x4o/+QE2F75qlVrduzYgRgFYAoIQLQOAwFpBePx9fEIDPCODA1KTYzjSmGT8QirASYSCt+9q6uri6El3ZXAoJjoSDglPAcHB+4Ax+Xk5IBl+E14U3trK5YZbW5uykE5tcgBhFFvHEUFyduUlQ48h6/l2itTVgbpW+nQ1oSiIm0Q468hUKCe3XnZzdWVbY2gCK0IXnva2rpaWtqbm9qaEO01wLUjFmysqaDTiKK89KS4hOgIDCzWgIaGBqKuc+fOHTpwcNOmb9asWbN8+VL2tWQJgGvF8uUrWdounq5cveLr9Ws3b/724IF9FK8ICSBiAFuHxyotysWqJlIyOjj+YBirenSo795gT3NTLUADCwb+xphrwsl29tmOChOEITmwT7X+7JiU201ilx5+iHkXE71FBZx35PEtFfcb0X4UnqirURvra9euCggIYJ3jhQ421o62VlQ9ZGVO6rjmZnQaYWQIHoOXi4oIn+U9s+2nrdSKYtnStatWs3qC+X8ro+GfgXIOHf4LlLO3AZSDHIGVg0RnpCQW5eXWVVU31zZWFNUUFjS5eWco6obfkPO7LOmjYpzm4FPmHVzh6pdr7Zpg4RBq4xTk4ORnbeNoZWnnaE+S/0xlFGwi2N8Hn5yrAjAFmsOE8MdhqBzQ9E8MUx43cHZooBthe1NdNesFA0+L4ABW5uri5OhgB1Kho2skLql46arojz8d+Prr744fOy0mIqeibKSl42xo6mdmEejoFObjHRwRRlIV2ekpRXnZrY3ULX64vwez/mB0ENfIve7+nnaw8oiIMOC4oyPlwIEB5WakYrHmZOUnxBfqGgeLqQZclPI7KxNyXiX+jGYSj07aKcO8o6ZFB6wqeHx79/v37Q3s3x/Ye8Cj7aRj3UnjwvPaGReVooTVwq088gPCCgKCEv18ArGKLl3mW7pyw7rNR3ivaV0QseGXcj4nqPfV5qPzF6+d9yWdhMzlnv/dVeAURa1d9/XJk6fuyCuA/1KPR3/vmOjwxITo9LREQFVxfg6CDIAXSFNfZ9tATyd1VX40DhB8PjkBRH78YHSYw0HERhht0POC/NyigsLq8jJYZl9Hx7OJCfBf4Pjr6cmZyUeAcrwQ1/SzR6DnIPsgudQN2cUVsMKUpjXV1A11KWWNaiusrJ0cKIkCPtjc2OSuqhrs5OLF81cunxcXE1ZTVZxjf7o61IIA5go0hxlQ+biBHvw3/nhNZUlPe/PrZ0/ev5r55f2bX9+/+fiWEszfv5pm9Bz38/TR2OTEA3w0+JiX00+B4++pOvTFq+dPXz59/Gx8bOL+EO4WnJ1V7WNwqPlnVHgkpjzABzjOpMAR9iFMRoAMk5EQF714/sL27dsxNVzj5MUsQGY+lcv1mvdPQDkr2masHKj13XffHzt2DHE93hFQy/YWYDK4wLJDgv0AXoyVZ2WmMijHbVLmiaoq0NzMxBSD7+fji/AVASgcU5AfCYTp6OgAfCnFUE3FUFcHEMPE/8xMiZEbcTkqVMyprsKgXET4loSYuLKCvJY6dxLIFUzS9ovSHSmp2/hTgDOYIbAS7BvcC9aEq7u19XMcb6wFiFfWlBezPfGs1KS4yLCokBBvd9LbwN3KyMiA1YKr7tq14/vvv/vqq9UYW8rF5EaFXXgOL7mAfjafKumWLVuzavU3G9Zt37oN8Rzw0UBfG6aKFV5clIvAuqezZaC3A9x85F4vAq+OlsbKipK42Eh4NXYYoPFJk50V+s8Kgd2lxnLaGqp6mmrGelrcpa17V03lDsUo0lK3Gc8gxQJDOvk0MgTlUJWVlRYQuH7t2jVpaWkAPatpsjI3YqLBlGbHFawqyctJ3hZFAHqK58QP33+3evmyZYsWrly6jEH5wv8aZP+rNlgwiHi+c+dOcVExLCysp8yUxOLc3LrK2raGrpzs2ojYWl2rFME7gYJKIdIaYc4+xenZbYVFLZnZFXGJWTExKdExieERUf7+/l5ePiClMGOsPKAwyAKr+sOAsrxXGFFGcjzcO7B7bKSPUXI4W8zKPdCnxtr6qjIsCJgcZ26eYJ3g8ubU4EP/tqT0+Qt83363ZcM3m3h5z0pJyunqGJmb2bm6+nt5BPt5BwX7UTSQnhSPvwDTxQQP9nQO9XWD/uONYNiYeEBYbk5GeHiok5MDqZQ42MCK0hLjstMzEuLTg0Nz5FQ9rkq68sv6CSoECSmH3FQNuaoWwqcew6sWf1gj9aJT0wnHplOeHTxubUctS3mN864bZYgZJSoYRutYxkQn1eTn1cVEJuBOQEivXxdYsXrD2o27j/FK8PCp8V67e/yi9JpNexcsXjN/HqEDE73k5ugvi7TMpR7+uZ5r8dK1X6/n4eEBlTAx0PVwdcD9k+hSZGh8XFRKQnxWWir4dVlpMSg2nFlXW/PD+8OAPLDs1y+e4Xr5fPLJwzEw9F6ucIbK2WuqGuprYZZ9XZ0wjBng+PQzOjZ8Toj57AlR8udPH+HnQHb4YPgJvJ2Hm7uBgQFL+YKlYPVjiu3tbDCwVPHvSXtqVmbmQHnQP8TO169dlZGWgCHhts2NjagmxYghi5qaEni9Iims6mrTFl9IAKYPkfuryScAbqrdf/uWWPnbF7jw7buX029fPX81MwkCzq53L5+/ez3987uXgPKXU09ePJmYfDCKSWfttsljFeenpyWB6gIlQ7nELOC4uzNu1hG+x8LMHK4XBg8QBLqdPH4C/JHNCxOkZZskv4Py2byjv9Xc+c9V+6RnuwhB1a7dey9fvqygoADU4Arc3HFHAE2wn/DgAE7yjEvgy0jOzaJzQuA7hkVHhzLwMESWFmYYYT8vz4gQkj2IBXSGhcInWVqasyNQ/GVAEkkhGhlylfSGrJyHy58jRGO1RUJCN4GS8tK0x3JXQ4U7D7zL/oKYmJi6urqPt2dqYkJ3ewuiH06yohV+ETje2dzcBibeWNdSX1NfVV6D4c3PKcjOAG4kx8fhrsKCAsHKAQKUqGpsiNuGq4Yjv3Gd7+wZniOHD+7cuf277zevWrOaVb2S4i99UbUF+z8bagzd8uXLN2zYsHfv7mv8fLhzVxf7osKchtoybguxjSLOh2NY4ff6umurSvOy0gEawBkuWYVaW1BfaX3WVFrHUE9TR0NJR0XOQEXWWFXeTEPZXFPdCFQdoaW8jKzMbVb7yk4+yf9xSTyKd2SFhW6AmAsLC8JNYsVyg6kL74LPRYLpEmKIO28C7vnx6U7v37dn4zfrly1dzCklLeKgfCE77v6XNYTjyjvnTtU3bdqE+4BfcrC2iA4LTk9MLMjOLy9u9PFJ0zSKvqUYyC/lo2yU7BVSkVfU3dYy2NXR29rcUl9XAzbHJUVkpqQkxcXEBvoHeHtS0gtwHLOora1J7aM01PAc9CcmIjQ3I6WzpWF0qOfBKGUxA8rBmoHs96gyp76ptrK0ICc3M40d0GOVu7s52Vibm5oa37kjf+XKlS1btmARIGSTlZYBfCDY9HQHo/HDBW6SFBuVmYJ4MKuipBDLDlDOoXkX3oXr8EmFSAA7BKeOjo6WxFlMXR3twoODoiIifX1DnVwipRTsBCQd1Y3jrZyz3PyKfUIqPMMqbf0qxbSjzyqGndNOOaULkp51yiCDRyv+hl6CVVBdaGp7Uk57ek5DYXFDQW5JXFR0qL8/KLPA9Rur16xfuPjr1et3rPlm79pvD6zdtGfeknULFi6bE6clsdNFC//OXHIWqX29ft2JEydkZaSM9XVw84jKg/y8gQWAgOhwSq9OS0rMyaZCzaqy0rqq8h4q5uyaAKA/fsDYK0AZ0PyY2rkN37/XP9TfNzjQN3pv8OH9UfwQWA8of/OCsJLxcaLzTyZecvstmCagf2xMBGImREus4g6UFlQRPAD+GyCOaJcKWxwdQAwB0GDl/FevYK1j3cPGwGXAaEjs39xIT5/oEhWUKysxKHd2onofQDncDCIDpsTy4dUrIDhw/P2bGXry+gU1dH49DZKOi5M4nwGOf3xPbSs4Vv7oyThBeX9XW3tzAxYDVZ+lkso5CWlhvLzcPOkgxs7OxhYX9WngpARBGgDncDybN2/m7IJ9zecuyhyd22D5s8bO34LyzwB9IYKw9eupiba4uDg+LN40wMebS/wNAvzROgyj7UHcJyXzZacByoHpcDx2ttb6XI0PwNHN1ZGbcX/8fkR4cHRUWExEOL6F0dH2rpKyvCx1FqbMOQN9CxNjBuUsT5wl5MHMEX8ICgrgAhKBmKsoK1CTB1VloJWwyC3cHowrIT4WQRugvL+zE2QcBgW/yKAcOI6orqqsGKaaycU6TI8an4LpOEbDoiJCcHv4IQzZ388LntPVydbW0ow1IJSQELtw6fzBwwc2fbdx1apVX3755bx5X7BI6FOS7mwwhB+CyH/99de7dm5HbAdQ9vdxz0lPLivMReiGaP7+EEcH+7v7OlvLMdGJsV7uTnZW5mxxGjCFdANtcz0NYzUZcyVxE6kbltI3beRErOUlzBWktWRvK8tIykvfVlWhY0+WZc9UeUHMNdSVxUSFrl69cuHCuRs3rsly4rcILuGcsLCvc10hwcRPHD/Kc/L40SOHcJMb1n/NoJy13qawe/HfEMH/XykRmv3CL+/ds4vkkpWV3R3p8DM5LiU3s8LGNvqWvCe/tLeIgrelY1pyak1H29C93sHhgV4MH50pd7V1UrZKVVFhfl5ObnRkFIASaA4eARagoqKELzhIDA1sOyEmMj8rrbutaWyEtnHHR4cwDaOEJmDlXe1N9Y11lWXFefnZGfHREWBPAf7egAzqoW5rAZdw/Tr/tm3bvvvuO8RrcrLSoIF4F2BHYIBfgL8vTDQpLhqMvjA3C+EeHAOmGTS8v6cdt/pgeBAMHYsyIyUZ/sbBwcGM05sHrIA/+Hr72Du4Wlp7ySqaSclbO7gmhUXkZ6bX5OXWF5d0pGY361tFSOkEimqHCGmHCutH4JIyjNQwj0zIbKttGGpru9fW2ltZWY0hiIkOx+jBo9+4dn3Dho3z5i+ZN2/Zv81b/n/mLZ+/aPX8+csXzF/CigW42r/Ff0cGC8MTJuJBxUEIz8XFReEg7aws3ZwcEczC58Fg8L4wpISYaE6JN7Uwlyo8G2urWEHWg9HB6WePgI9vZ2YIqUG9nz2Zevxw8tE4KY8/fjzz9On05GNg/csX0y9miMLPTD2emXyICy+EGwC1B/1paqxNTIgBXoPxMbkMxEzm5uaAG08Pt9nGNwG+rg5U56WqeOeWsOBVvsu0Ua6oxOIzaysSjLawNDE0ojoL1rMGGIp/BQPABwH4ggO+mZkCar99CbyeYfBNeP3uNV3vX3EMHUA/M4vj717/+uHtrz+/gQeamXz8+MHoGFZVZwsH5cWFBTmAcnBMEFiEe4jWqWuaPfUPwerCbYOkgyA72VmbGuiK3xLcs3snU9HggHwebQN8doD5j+qVf6oCWwCOuWPb9uv81AMIowfwBWEJCw3GFRocEhZCerbAbjDxgpxMBJfgPYB1JiIPmIanwU2S3lZYMC44b8AlKe1EhkVQib83fIO+tg51WJaRms0Z/5Qnjpni1L3VANlgReDdAgLXYVBglNJSt+XlqDhTXk4G3/Lz8+Nf8Y4I70C6+zrb+jo6gODAcQwmd87Z2NpQCxzHAouNiYI34o4B6QAQ9ghGjjGGg4G/R6QIk8dFFflRobERpPKP4AOuFAGxiamBmrrSFb4Lhw7uB/yxTa258yGgE6PnrJACj3CEiJbA0IUEBRBwYI1VlhQiMgBLe/yAuqs/GhsGHIEOpifFhQX6Ac257XJtI30tI20lKy1ZVy2JKCPpOB2xRE3ReHXRGA1JXyVxQ/GbSqKC8hKic+nzLLscLhBDh0HD+GBMjh49evLkcT5ayQKIMG7RQPHx8p7at28Pbungwf3Hjh48cnj/vl07N2/8ZsXypbPF3ouX/i9DOX4PUL5kybLf7ZXjHUjNP4fZrAAAgABJREFUa8OGrVu3Hj92BOxJVvK2ruZda3MzFyf3AL8YE9PAW3IuMhrBJlZxkZGlhbnVDdX1rfX1bc11PZ1N9/o7EOZg+Hq7WtvbmgDpebnZqSlJmODgoADK5NfT09DQ0NHRwcoAD0KEW5KfPdjTMX7/3sQDqicElI9wyRWI4FoaautIkToblATTD5cOdAZkYH3Y2llq3FUBiUBotnHjRtBSydviWKZ2tkRSsNbBXOD542IjWdPI4rzs1oYaIhQ97QO9bfeHe2lHvq8bAFGQkw1/4+LiYmJipK6uirjSyowYpY2NnYODl7WVh42tf3RUVkZqQWVJdX1VQ2NNc0Ndd25eQ0pOc2Zpb0bZQFJBV3Jhd1Juc3JGTUN9b1tzV1NtY21lBVxIRnpSRHgQTBQM9NSpUxSns7LdhUvnL1jCZPa4vIhZ3vE/6Rd/LoTLfoc7Jl26cuXKH3/8EUtKRESY63qsa2Vm7mRHMqeg54iIMeyRoSGkohdLOmjpyUmsSBo22dpUS+l6o0MvJifphPAl7TuzBm9UDTQ9DeikZm/PJ2emp2amJzlMfAQcp/SVpw8B64B+TBYmOiU5Hm8E7Oa2FPVNjIzxnMzYzzcK+EKSfj6ARbBCRTlZwZvX+C9fEBMU1FBSMtbVhYHhnxzsrWxtLGDMXANhDe7k7S6eg9cDlWory+Daf+HQmdLbXxEZB14DqQmvuYvg+y3tqICqMxz/48f3f/j4lpocTU5OjI7iVkEkm+pqy4oKC/KxLBOYIjHWCSkIujjDC1JBPCfFBVgExPh4gDhaKcpJnzxxZMWKZczRYgLJ1v7nmfrrbpgJ5zJWvm7dupPHT8hLS8H/IdykWvaIkKjI8IjwUOA4Lrjh2eKa/Jyi3MwM3HFUOMtR0dXVtrEwxwgjaE6MiaRN/9A5Vk4lILh/T1cnWC6iHBlpSRkuWYgqNg1mBV25WnZOk0SecuyA4wCma/x8QEZREUHAk7DAjQvnz545c0ZaWhqDU11WDCMCUQN2dzQ3EI63NXdT6WwdlhP8DfiTltZdWCIA6NKFi9eu8sNhS0lKcLWRciqqd2CzsC8DHU2mYM7KWT1cHP18PcHS8Oju5gjEREwAZ8+pfq9lOM6Q6lOFJPOjzIlSZAOGfnD/ASlxMbDDlPgY3ExHQ+3DIcqFm7g/NH6vv7OxrrqsCP8U7OdtbWZkoX/XVO22m5Z4mK5gqbVEmeG1ch2+fJWLOcr8MQr81rcu6IpcVRC+oa4gB+hjrJwpqlsY65voayvJSQle4zuwZ+e+XduPHzvEd+WCkOB1IaGbGEBQdR6eE7io38XFs+fPnT594vieHdu/3bhp5fIVmHfYLLVvXrzo/8de+TfffHP48GFMg7iYCGYFiwCxg7q6up6ukZmJo66ek5yKg7aBn7srIvfCguxCuGLS9S8tqK0q7Wxr7O1oAZQP9XUBK0cHe4HFWIVZacmI9D3cXa2trY2M6PQcoSxccUZqQmVJAX4ZgfyjB6OMlcPkBinpu5MJ1+XmkGodCe2HhwIvGJTTabi6qqDATZAazPeRI0eowZiGOlNbBHSCvGNh4UVcC4JEGAPYKOh/X3cbwAdQDk7KYghKkkmMd3V3MTIxVFSSQ7DJFePqgVM4O7l7e/mHBkdkpueUFRS11NWRREkbWElPD17ade/++NTYxHT/0ETvwP3W1t7mxraOts7WxgYwFHggBASJCdH+fp4gXJjm/fv3L1+5ggU9nzeIYiyDQcOseuLnraE+XQs/9SdjbcPwwqWLl2GJnDh2HOGepKQEYmFNLneKpKlo39/O3dkB9BzsjHZRuZYFMdGRXIedWAB6aWEerHGwp/PZo/G5vQuWOc5xW/oWuPni+RO2Xf56enL66TignIqDnoyDmAPZ79/rgz3DjMPDQki2iatAgZ+GUfl4uAPH46PCo0kN3Ic7JtGDVd+4zsd/6byUoICeory1rpabjZWboy1mzYEqWEzNSHprNkUMQT2mEgiFlTA62PfHn9/9+sv7t2/orgDrDMp/ef/m57evPrx/jUe22UKnndxzgvKf3yGemJ58+mCESplAJBtra0oLC+BlMQjgB0GBvr5+np5epCCIaAwBDbcnEIbbxiOGDhCPdXXxwrm1a9cwnvgpk3DJPyU0P5u8yMqCfvrpJ9iq5l11SwsTrJOI0ABEnwzKQ0KCwsJC4uNisrMyYGJUlZqTnpIYA/bNeh4ZGBg42dliZnGfVPMREx4e4o+/EBMZgt+hLAN/H38vYKOdnqY6+DXMWV5WjuugxmXm6eoAp/DWWPCysrLCwsJYRRcvnr908fxVDtDxiE997OhhHh6eO/IK/p6eTRTP1bXUV3MFO3WgAt0dzT3tpIIAxoXYC0zo8NEjmzZt+uqrrwCvYISgWT9yX9u2/bR7984DB/bhD549c/ry5YvAPqA8Hcka6NjbWXm4O8OngoHBfTrb28CX3xISBprjL83tFsxtTHEudHZH68sv57Pq9M3ffnfx/AV8KDi2ioLc0b7uh0ODzyfGsbwp/7ivu7mmrDgrNdDFxs3krpuWRIKJSIHZtWYrvmrNg7Wq+4qktpVIHcxT4I2SOe8hc+OuwGUNKQldNRVqu2FkABy3MTG0NdKx1lHTlZOQunrp+K6f9v304/FD+6/yXRQTJ3lhCXFRURFhYaGbwCKMtoT4LXhE8JZzp0/hg6xb+zUMlqqEOLWG2U68fz+U/yf39R9/+BW+d9WqVUwTmS1Hlj/+u2FasWrlkWNHJSVug1452NsCNGGfpFivo6Oqqq6qoq2kqKeoYgZAt7Fw83L1CfChgn4spuR46rwFaAemN9ZUdDTXjgyQFh2IEKa8sgyIn8W4uZubm6urc1BQAAIu/DLWBOBgYmwEUA5WPjY8OHqvn/UuQCCcn5dFHRoptTzQ34/6ToCmAccRWuITwd9s+eFHrJs9u3Zf57sC9oFBR6SG22ZHbXhRSHBgXCxts1SWFmEJ4n4A5SP3ukeHeoYGuhEQ4B7S05J8fLysbCy1uJQ4oAnACM6AEhkT4nIy0qtKi1prq5hqIP4CdSNrbGxqaGxtbmlubq6pqaquqmBNasBcSotyczJTEBdHh1N3GxAQECJ46QOH9n//4w8cMf9UOvhZyQmbF/b4Xyb1MyhfxBXiLvwkyLVm1epDBw6KiYhSAR6XKgumpsvp9GMc8BGAjS4OtghTaMPay9vHy3tWuNzfOzwsCLMGQIfXGe7veTJ+/91LqqX85d2rT9sU1OoBcPly+umLqad4fDPz9O2LyXcvn+GRbbY8n5y4j8nqaMXkJsTHIghwc3UG9nm5OoX7+8aHBmfER2XGRcWFBoT6edhZGhvq3FWQlhDmv8J/+tidqxcNRQXNpMV8zQx87KwD6eDRjfpyUfNJU9bbxQ4BkZ8PgvGe9panY6NwM+9wSx/egHSTy3kzAygHWAO7ge+/fHz3hw9v387MvJ6Z/pnyW17hE4GSP370YGx4qLO1rbm+rry4oCgvNystFdEJky5hUI4Lb4Q1xvWQ4rqDJscD6+FF/L29gH2I/7Zu3bJ8+XIK7TlGyE4s/lFR4jlGiXmEoYKCAALwSREWREYEx0aFEqHmKAugPDIyPCkxPj8POJ6Xn50Feg7qHezvByg3MTGxNLfAUOOG8RL8PDoiOCTQB1dwgDccZ6Cvl7+3B6Dc283J1IDS+QlihIRZ9xxS/dbR1qYCXCVShrp9W0BAAPB6+jQP72meUzwn2G7vkcMH9+zeefLkSfxiqL9/a211R3M9Q/Om+ioE4oBy/KS2oiQrPcnUxADR4eqv1jBpsE+yrotYriHCx2++Wb99+9bDBw+dOc176dIF/utXhYSE8NZ37shraqnh5Zh9uHOQdFAQBBxwNrfFJY4dOb569VezHesXzgqQMRrEyp4/b6UNKNi3Zy8iP08XR4SebXU1E8Mk6/T4wejkg9EHA52DTdVFMYFp7qbR+qIlloLNtpf67E7dd+S5b3O032h/t86ROpVjeYqnA8V59K8c077FryV720JPx8bEyM7UwFFPw0lL0VVF2lDwotLZw1e3f3dh5483Th2REb6up6FkpKWho6qkqaqkraGqqabKacKoIrxQkJG+KXCd99TpHzZ/z0St2W7qX1fW/MusHFDOWPknKF/Cjss4YaDFiz9pJbMcoA0bv7kucANOGzbPNdOJxspG4GNvZ6OmpiYjrSBxW1ZKSvnOHU01ZYw/JdWDiAFbgVlhoYEgoZjUsuKchtqK3q5W8KBhakfQibkHZwe/TklODMVCDQrAGsW3jQ01/T3tIMgkvTI2gscHI/fA5UGfQcQAEKkpSYDxkAA4bE+gMyeNa42lr6ejKycje/7sOYpcVizbtnXLxbPnMIVYoFgEgACSwHZyZPQctkHZ4gW59VVlFDEMdA8PdgHNhwY6h/s7sRDB2WE8zs6OJJpjZGxjbQmHAbADgYXlV5eWIoTsa2kabOdUvNtbOpqaGmqqa6ory8tLS0uLCwry8guyc7LTwJvystNgcng7hMZgeXA5UrSzRj0GeXlPHT588Pvvv2d4zZ3RL5wLuuf6y/y3a8HskTfnhud/OQ9feCXmDzQEYSzHa/TYjrOFuTGnCEEpwyZcZTbrjmRvTwPiaO9AJX82VrhcuANJRC0Z6amdrU1wn29fPf/1/es/fHiD6+c3RMzx5OP7Vy+e07Y4sPvNy8kPb6eB79w+xktQ9aknE3hhX1c7IJLV5QJoQAYj/HzSIkILEyLLU2JLEyNSgjwiPRxs9dWNVeWVxG4InzsheGS3ucCFADnhQEXRaGONUDuz6ACv8CA/OB7WZYZEzO1tMQuA17TkOCyhqYdjb59PvnnxnOWVs6yVP/5CPP3N65k3r6fx5E8fP76Znn4x9QxQDrdEYcSzR7jD7q6OyvKK0pKi9LSUtCQKEMEqaBMjFPfrw6L70MCAuChSWE1Lis9OS87LTAPi4ydBAZRIKi4uum/fHpjWZ3O04Pfx09+1b86qPWniEU1evHgRhuniYE8SoTGkcQjnAfIRGOAHKI+NjYa9FBXmF+VRt6PUlASsSRgmTMDS0pz2gjw9okMJ/dnhLWsb5Ori4O7shMXv5mTv6eoEZDQ3NgD15r96BasFaK4kLwe4IT0pqsSXQ9gtKirKz88PtnH8+FFA7f59e4DgW38Cmf5+8+bNR48eBTBF+Ae01FSBgAPKmxuq66sr2prqwbdaaiorC/NAC25LiH377bcAIMrCWrBg6WJK0WFrGzj+ww8/HNi/99xZ3uv81yjrUUJCRkaGNLzk5GdrC3QoFMbSpam3sWbl73pamuK3REDUaEeBG3mwb0qh5iRFZ5kQ0Zr58774ktkFXMj27duFBAW83JwRxjC91anHD5+N358cHXjc1dibm9AW6VRgJlJvdbnL9uSA06GpoFNP/Y89cD04ZAN6/lOFyv5kiQM+QsedJa4ait+00VRxMtBx1r/ro6UQrSufriMTfvuSv9BpF/7j5ld5zISuGN4WsNdWdjHQdNLXtDfSsTXRNzeabXWkzenbwCFduXR5x7btK5ev+iSDunCuXcw/0EXot//4C1A+j7ZrPyW0cR1M6Nsli7du3wYnCSaOuQGTBfyVFWEZpWKROTs5GBkYqqioSUvJS0nKUdsRCbHbt8UluRxMFWVFA31daiXh75WaFFuQmwG/TUkjvZzsdXd7T2cLflJdVcYpfmRUlJfW11X19nTcH+6feDDMWDkeiZUP9lLVSkUpEduoCKxdLE17qm0wNjKkFlCYeER8N65dx7IDM8Xtf7vpmxNHjkqIiGJ1wpnD9kyNTSxNSaTCwcHO398Xy70gJ7O6rAhOAs6DQ/MeADqgHEsTUUNaUiLiWk9P8H53mDdsBlQdOE4ygS2NoOEDbS093PFOQ01lTUU5NVjIyUpPT8WVmpqckpqQmBSTEB+FOJe4np8vGBNWp5ycjKjoLSYUhSjs+g0+GAbWJVvunzq7L5rr8vc7OPgMMlj50KI5lb4Vy5Yf2LdfTPQWXCnbzZizZEcHOr6zsCCZfKoqtrbkLq6ZuKW5kZEB03uztbUOCPADm26orx3o6Xw1M8lVxgMEX3BN7qeJnr99QVA+9eTj25lf37/kGiU/53bMH796Ponr+ZOJx6NDbfWVNSWFOSmJ6fEx6TERedGhWf5uBX5OhT42uR4WyXZ6kaZq9grCllLX1a4cv7l3k+jOrz34DydIXUiQ40vQEA/VV47zsI328wjz8/b1cMXHwWIDVOFDgUkU5mSMDfW+fPro/czUhxfP/+Pnd//54d2Hmcl3M0///eObP8HhcOkruNVf37959+LFm5kpbjOd0hCfTFBxP5xuVkYmYBHwHRESGhwYRDGeL8UouDBuDMqZymBqYlxmCqXkZ6ZSO1n8spmJKebx2LEjIH2fqU4v+CeOPckZc19AnJ9++gmghuUKwA0J8GV73MBx3FtgoH9oSBDoDnwPllleVnZmahoCCSxL/CsICgYHKzXQ1yciKAhhsR+XSmnvYG1tY25uMdcKmbTngONa6iqw0DO8p44cOnyW94yYsJCyAnUvA2HEz0VuCd24cQNO5cSJY3BX27duA0XY+M36NWtW4WLbrUDbQB9PTHFdeSHX/rAMJgP7Bd9qqCjNS0sG0wLRpsyT+fPYiv10yrcYYSiwFe8uePMGawBNx9pccRN1jdA3mOvxZkL1p9R6FDEliQeQgoq2zl3Nm9eu7965izMZDr4WEJQzKJzN0Of0TGYt6JPgs6iIMOL3ypJC2C/VxN0feTjQM9nVNFKSfD/Vq9FJstPpSr/TsWHPAzOxJ6fjjj2PPf4s7MQ9p/19VsdqtY7lqZwJEj1lfv2Uo7yIg4KEi4JYqKJQpoZwtZZwsfS5Qskz2ZK8saK8vrd4bYVOO0nzuysKu6tIuNyVd9ZXt9DVNOOkgKnFgroGoJKPj2/Xjp1frVjDmlJxd76U22BZ+PdD+X/89p9/ApRrqPxlKKdXcsX6mIAVK1YcPHhQR0cLoS7AuyA7HdPWUl9TVVpUmJOJdYaQjTr2GhpqapK3UbwjLysrjdgTswjWefXqlTsKMlZmxmFB/qCllaVFAD5Svr7XOzrUB4CmGs7OFqA08LGrjdKGANyPxkfowHN8dPzByPiD+yPDAwDZlsaaipJC2BXoCRgllialuHLBoLy0DLycwPUbPDw8XEddRFvzsOb27t5DDS2lpHFjGmrqmhokcUnnFRYWHh4e4cFBoN6VJQVU8tvddq+/a2SgZ4Qr+cW3mOzSwgKYTXR0JGuUAy8CpgnU7u1sG+juGOxs629vpeMd+KLSYuA44guqXIqOjIgIi4qKiIwOC48IgqVx4YMbuDBuQEJMHHErCAgreLmroSIrc5taxG36lo5xPp3Lz+29sv7upIC6eOnnHWeYbVA5yaKlc5Jb4HSnT58Gq4JVB/h4c7lrAXh/RNYkQsDJJwHS6XKwoyQ7ILe1NdMQ19fXNzIyMre0AJjFxMSQBk5nG6Cc9KpoX2Xm/SuqkwRqM8WV11OPfvv4+rdf3nx8Ofl++ikIMjjOu+lnH2eefXz++O2j0ZGWmu6qgrrc5KrM+Jq06PbUyFp/+zYfixZn3QY79XpbtUpLxXTNW4lqAkG3T7tc3+tyZUuq2IFMkf1pogdKtASzjGTzPcxTfJySwwJiaU/DgzUzC/LzRogDB/z4wdCb549/fvEMN/Dbz69/+/Dy47OHP089xC399scPlIlICYjP6cyTS0bEhfuffjrxcGwIk1hcVBAfH4+Z8vX15hQ53RHhYYhwebq6+Hi4Bvh4kgBhZBgulvyH+YV3B5MAxGM2lZUVz5zj/WbTRmr6w5JBOUXi/y51+0kI93+SQlvIUqUB5QcOHMD0AWr9fdxDg4hthIeFAKnBPEhsOSIsLTU5OysNvCczPSMlKZk1ZooA2FNVqgfuOdiP9lKA427uTja062JEfTK55g/UN1mHCnzAvpUVKE8OQeGePXv27aPKSSHB6+BhEqAXoreu8fNdvnThFM8J3A+8y/r164EDy5YtwbV8+dING9cfOLRfRkYK7L4kJ7OqOBeADnysLi+rrqqoqypHUAussLWxAqPHh/ryyy+ZXg2W8dLFy/CntmzZwnPy+K2bAvAciOV1NdX1dLmMQE58CtQbw8ta3VP5kpmJHnceC8SH1eDm4eruyMpcPn8BVsO1z17yud433ojRoCXcFxNC4Mj70i0/fo9PFxESWF1WzG2w3J8Y7H/U1dxflDSc7tXkIdPlxtfncXTIf9/z1GOTmYee5xx+nnn8YcTBUa8jrcZ7GrSPp4gf9Bc6Eixz1VvsSoTs9XyV61VK55vv8NaK7asR3VMusrtI/FCe3MkU2dOZGvzZWkIpd29Fakr43JWx01Ay17lrok9trFWVqTSB7/IVQPnalV8tmb94rmB4wYL/DSifz517zibDclCO5QXSAc9Muyuebinx0UW5mWCsvR2tXa1NeFJRnJ+flY6FDmrDSA2IgIuzvYGhDmYaXv3IkUPnz5/FuDvb24BlADrhA3ram4HgoN7jI4P37/UBQ4kRD/QyEUQw8ccPRwHlwPQHY8MPxkYB5YiIW5tqgaRM5QoLFDgoJyuNlScsdFNY4CYg+9y5c1iU327cBOc/b94XK1dSUtfli5eA8iDsyopKTOuSasdNTNxcXEMC/HMz0/ARAOW9Xa24pZEB6g2Gm6Es1MHB9uYmIFpJcWFhQR71X64opW6QXAr2UF8XooRmOgPPz8nOjIuNprg70B9YQ8rRdjYElPZW1nZYkWYsXQkLUVpSCpaC+4ET4oplKEMDi1hC5Na+PXuXL185Z/Bsg+vPO4CLfg/lXH4LGT87KmHIzklo8SFA8XID5NGJRVR4UGRYINDc39uLiRwAr/DZqTjLycHR0dEeXtHWmqSUjIzNzMysbKx9/X3iYmKpX1pnC7g2aO9HyvMDFNIhJ2mevHj+66sX//5qamak98VQ1+vR3tcP7v1h+ukfXky+fjj8brRvvK54tCyzOyu6LTWkNSW4Ncm/McKlJ8Kp1la5xVy6TutajfrlBi3+Wk2+CvULRSpnitVPF6gfr9I62ap9okX9SJ3y4dq750t1blbY3U13MCyOCs5LjE5LjEU8Fh8XNVcJDBz/9fXUrzOPf528/6S99llT+URd8cPm8j9NP/z3N9O/vJmG+3kz8/TNzDOWjIiLKwSdevboQU1lCYgtcNyfE3HjdKXsMA6cAKydm5MjSLGflztDc3ZFh4exVGhQY1Y5qampwcd/5cctWxdxZ1bM6c77Yv6cvvzfD+XzvyQsB1fl5eXFUiFj8fcOC/ab21oBJY+MDAefyMvKzMd/GWkgGWDo8XExgPKosFBWOA0H4O/ljpt3crS1srLAtBrSl765JfVjw7eIvaglAkeC5OVkBASuHzt2bMeOHXv37DrFc4zvyqUb1/mB4xfOnyUc378XOP71118DPrgokApbgeZffb1m156dN25cMzHQTYgOz01NKiEFfFK2gJkUc929I4IDYGvbt29lpT2MKS9fumLl8lXr1q3bv5/kHuWkJDWU7xjqaBrr61A/OUvaD7SzskS0jYlgcSQ92tsilMSw4IYlb4vjUUtdTVNN9bao2NGDh9atXY/74jSHZ/eaP+URzVJybkt9dvsLFgX0BHREhwWDjT0aGZoaG30xNviqv+FlY8pIotFErMxoyNmHccdeFZ96WXn8Y/vZn5t4Z4pPTKXyDLjv7bM6Uqq4O1vuaJIkT8TNY6nip6rkeVvuHO+8c7Bbfg+uVtmdLYoHWjWO1WvyNBlcaNC9XHb3Sqb69XAVQRfl2+aq8vpqKky4XOim4Pmz5yhBA1DO6dzO9Wv7Z6D8dxssbMF92uljGbILMJE8J05iHL3dXdIS40pzswB8gz2d9/q6AXl43lJfDYdMolppyeCtyZxUP0iBjbUlMOvEiRNHjx4VukE5nvQXkuKL87JaG2p6O1ru3+sZv38PFyB7YmzkMeKdh2NPnzyk9r4PR+nnIwN4nEtGpGbtRfkMyuHAqdcEFwneFLgOPn71Ct/58+cB5RvWYWoXzpsHVr5mz67dgHiqhuA0QDRUVFnRrbmpGYgYSCsH5QUdzQ2ALUD5cH8PrqH+HriQRw/ogBZRAitaQ0je3d5yj+pC+/A7fZ1tjTWVlcXFlEgTRwnUwAPwffx9FRXKyaXm3BrKisryrHMK90WbTkqKCvAlro5UgRkc4B3g6+FgY4m1hXldv/4bVrxLZxWLl85fTHWbTC+N1XzObrlwJ5xzFWKL5pJYFi/96cctWCKIQBFbhwZQzl9MZEh0RDATIkZsAL6JC8QT/gY3zCCMtlkt6FwRVgTLIQ2chPim2qr+rraXkw8B5T+/nMYFHH/1fJI6as48/+3Dq99eP3/WUjVVX/ihs+Zdf8tvLyZ+e/Pk40jnH7urH6SFjsV53Y90GY1wfBTv9jDeeTTU/GGQYaP+9da7Zysl95SJb62S3lEts7NCemuZ9I+1ajtqNLZ1mu7vszg4YHG4z+hog9qhGtVzrRZy1Xba/clhDRlxVbmp5QVZhXmZZaWFWHhPxkd/eTP1p9fP/jQ1/tuD3vGc2EfJoY9SQx7mxv32sP8/nj/84+vnH9/OHs++f/3iw5uX715x2eW0x/KouqIQ3DYkJMjHx8ve0Q7slasFM8dwAMpdHOzBN2lP2d3V28vDx5u22DDFwUEBoSEBQYG+gHh7awvgIaBwx87dS7iO26w1NknPf7ngd3kIfx3KWed1PPnuu++uXr1qakKixOFB/nDAcMZ40yBua4Ul0RbkAMpzgOOpKUlAdnCIqMjQ6PAQ/DLIOPgWJxdjyRJAqYzF1BgfDW6bkhU4cKTtNXMzc2Mjfe27iABYl7Iffti8ZcsPhw8eOs1z6gzvqZMnjh3cfwABLmCX8uT+LA6DZbYQBH3z5m9Pn+aRlZFyd3aIiwzNyyRJWwS4LE0rKzUJq/r6dX6mVIMo+auVK1YvX7Z86bIVy6gyE5ggLCikrqykp6UBEMf9kG6Jgx0VgTs5YvyxOGmJOpC0A57DM1maGqkqUiQhLiYCVoTBV7mjcOXCRax52MncKcXc5iQMhJ1AICb44ot5rOk5vl21YiUcla2FaUN1xXBP1/TDB++ePf7Ds+FfhsonCpynczTHY/gep/C8qz73quXkH0bOv+vjmWk8Ml16fDBi5z3P/eVq35Yr7y6VP5gvdqBYZF/97d1tcrvaFbb33d3Td3dHl+b2Ns0dbVo7m7V2tensb9E4UHlnb5na6UJ9wXAtCWslcW0FKWUFWRBQPr7LGOSftvzw1cpVDMqXLlm5iGsEOJfS+vud1b8I5f/5P0D5ZzoAs6nlGzduPHbkKFgthjss0C8pNrK8KK+6vKSloRYUtZuTXOhpaWqpr6mtKEXYArQtzM1KTooLDw3T09EVEBC4cuWKtMRteFrEgKBUgPKm2srOlrqhPpLlezA6yKAcCP7k8Tgu2h+/PwS2zhXuD7D0FXB24GllaVFSXDQWNzVT57TZmFwywBqEV/SWyOnTp9nUYs5AUeGEpCQltO5qIr401qcaZYRv8DGAsCA/f5As3GpNeUlnS2NvJ22wDPV1D/Z2Aa/vj1JrAkQJpC0Fv8X1QsNzeJT79/qB40D/kvwc4Dj8AZARUQusQlREWFBQQExMBJCtqCSnpq6kxEE5Vjz+VUtTw9TEwM3VESZHYl4piZkpCalJsQBZgClufuvW7Ys46s2K7xcs4QD9s5rP2YNQrhUZ22D9HMqXLFkGJy8mIorw09vdLcjXC/MVERoAcsdqYn08qFDe0dYGZkP1GtaWdggbrKyZQp6TnS1QHg4G95aXmUaCkQNdYL7g4GyDgoln0RbK1NOf79/7Q19rZ4RXV6DD/TjvsdSg/+iu+Pfeysf50c9SfJstFRsNxBp1hBu0b7YaCzWbCHZaCPRZ8Hfpn+7ROdSns79fd989/X1DBvuGjfcNme594HBo2GnfQ59DE/5HH/kee+h2ouXu9iblQ7WK58rUBbu8raoDnTsK0lrK87ta6/t72h+NjyBceDs18cvk+LvBto8NRWXGKpV3JdtMlRttdF4Wpz5rKPvt1bPfPr4lbRYul/zjz2/fwiG9efn2+eTU47GWeqoyA8cHmrt5gMQ60CEwcNzJAV6WXc4c/OELj/RzFycAureXGwIvkBIbC1NMqJCgwN69ewFQc1DOmvn9rhfM34DyhbMKDXv27Ll16xamA5NFpT3cFR4WgpA3Jjo8LTUxM5UqALKzMgDlyUkJrFqSFdTgJbgrdkRsYqDPVMVJCcPBjraMPNzAXRCW4cIHAVxyKV8muprUJB7YvXXrlq+//uq7Td/u3rkLZHzP7p2wo/VfrwNwfDp7/3SMs3jh0iWL8Mt79uy6eOEcqAmGApFfQnREUnwUIic4FYQECDR37Ni2fOWKNatWg11tWPsV9T9bSJseMEzE63Iysoa6ejBJOEXcDAuGcHt0wOPhzlQ9aPwROtJHcHS2s4bvoQ6corcU78hTleZdDfFbwkcOHcZ9Mvj7lAy6aLb1+YIFQG9c+DkCApbrhXvYuX2HmpJiflZ6a231w8H+5w9HPzwefjtQMZxpP5Gq1u3Lcy9i/4tSnummYx9Hz74f5Xk/fOpd75npyhMvs3iHPPYPWh9pUdvbLL+/XnxHy+2t/Wq7B3V2PbQ9Ou54+L7jgftOB8dcDow5Hxq1PzhieaBLb3+bwclqg6uxWoLG4pdkBa+I36JquFOnTu7bu3vTxg2rli2nVkIgcIuWf37//xCU//x7KGev5Pb7ZhMpFi/dtOm7gwcPUu2Z0h0MeoC3e2pCbFZaallRYWVFWX1dTWdzc39nJ6KV7rbmjpbmxtqaqrJSrDYE6WZmFrKysqCjelqaCPARBmanp5QW5LTUVHY21iFGBr0dGwJYDwE3H02MAccfPyIA5Tr8drMEQWA6rtHBXjqKrCgFMcHKdnS0ZxpArHAWa1dHWxOr6uYNgUMHDq5YtpJNGP/VK5p3VcE34UgAYVgu8PDubi6+nl7R4RHgniUF+XUVFV1cqzMG2Xjs7+4YHRlkKe24Pe4G+qnz5/AgqzvtIlmS2uz0NDgDrD8TI2MREZELFy6cOXPm+rWruA0EjFjfICbmZobUvtZQD5yCZK18PAGU8GfUy6a0CAFBcUF2TEQo4gxlRaVDh44sW7biz8C95M+6tWyDhTEOLmFxwWxR12dQjtfu2rULnAVQTqodnm7Bfl5B/l4g/j4eruCYLs72tjYWiGFB2ixZn1kLS1ygaRgWvCTAhxoZk7pOXvZgZ9vESP+7madMugQ4SNmHYLhTT/705OGHzoY/Vua1WWm1Givcc7g75K7/W0nUf5ZFPwqzeOytWynHWy52sPTWjtJb28oltpVLb61T3dWgsb3LaE+fyY4h2z3DdrvHnPY+cN437rbvodeBJ8GHH0cdfBx/YDLp8NPYI5PhJ5oNf2hWoZf/X9beM6yqbNsW/fHeu7uiWavKClaVWXLOWTCiiIIIEgzkHCVnECSDKAqCZFAEMYFKzhkWOecMixzU2iWvjTmRcp997rmnznf5Rq1aBGHOMcdovfU+em89+6JAk4tuVYDDWG5GR3H2YAfpBA0cJy7CUN9iX/tMZcHiy5TU80fTj/IWXTxWdO3ceJT/YHrsGtj6EnNtdWntw+rHD+8/vF+ly4jwb8cGexk1FSUFuWmPk2NjY0JvhwQHB/v7r8fKA3ypI1ZPD8Jh3cnwcIPb4gL7B8QBpmDgB7CojI0MLpw/x83NTccf6ETS9VSEf6vh+q8zWKhYGUlD1NDQAMbCusdEEn1aujgoLjYGzm7646SMtGT4kU/SHj1+lEILDJCqn/DQO5QSEUwRsJvm4yANeMq4C1KlHOhHhdGDqcyc4MAg0naRFK26OJibGV3RunxMTpqF9eB332///rude34mSd8gcLt2fb/5k7fxqY/wlzTbBUpu3bLpl59/ZGVlpTvVmZkaujs7AR9cHGwN9LXhKAOndu/+/vvd3+39/dfff9uzY/tWKpBEzt44OdlVVVXMTc1cHYmiN2bV3+cmfZ1YqPAdMWhPiPRJh+NIVdv6ero53LAy1tfR0lTTuXoFkGJlaXpFS0PuqOyhAwfxa+mErk8ZveuHSXSCNREN3kKKcb74X1/iGe37fa+musaT1BTgSQejbrirdWWka7m1sO2xd2+sXo2fSEs412y2FLNM5J8Dx1f6JVaHpFd6ZJi14sslR4fiBQZChCsM99dcYy1TO1ildaDdkqPdgX04WHgglG/oHv/gPZ7BSJ7B+7z9t7n7AnlaXDnqHfhyLUQe6MoYneBTkBY6flRKWEiAi4MTM/PD97vgstByWhsyD38Pyv/TAMuGu0fHXvGB+z98+LCQkJC0tDQICEDKztoCLhVw+UFkVEJ8LFbV65evKouLGdXVREynrra6vKw4Py81Jenu3bvW1tbXrl0zNTXG0wLqYe5ysl6U5r6tLS1iVJZRRUMN4LldbSQm3t/XBTTHIBEVipK3NtW1t9TRR5EY4InwiUAYk5MS7kWQjHLY8AB/H2yt9WwWO9urVzRlpI7u/v5HuHLAdOAasN7H0w1LJDSQrObw26Sv9MP79x8nJmY+Sct787qsoIAU+FDl+3QXIbwHXpNwOYXjcB26WptoHAcxbwctrCgtzM3B7TyMisQ6MzU1PXbsGGbp5MmTmCJKRjk0KTY6JZ4UItP103HRkaBUcALggZYU5pD02+oKuDLFBW8fp8TDfQYuiItLbt26/VNR8uflWt98nu1AYTiVbE4qDL+hOR2toQgoV1Y6b2JsCGqGpR/oRzRRMWBFwNe8vdxIjraLA4Xm5FgJk4ZHA2CKuB0Wff9eUlzs00eP4FpRubek3Rpd7740x5ybZZJqz6nxd1Mja4M9tfcCGR42BVfkC9WOVl4/XmlwssNNvcNTvd7mTKP5sYor/FVa7E0GXM0mnB02PB0OPO3OnK2ubEOhQsPh/JMxwhPRQgN3uDD6wzn6ItgnUwTHMnjn88Tn80UXcyWWs2UH7vEN3xIv1jhQeJGj9JpcrvmlsYzolqy0sY6GyYFu5vjw3NTY/Ojg6lD3QlXBn1mPX1w4+kaat1CGL/eEcJ2JRqmL5YfqwoWOxuXJ0WXm1Oriwsry4urK0vvlpaXZafzbod5OuF/F+TkvX2UmJsY/fBh9P+IevD2SvhJIJG3h6Xt7rYO4i5Ozs6MTyWd1caa7VsFDBSsEN5SXPwVW/jmU/1sV7v8ZyuktikcvKiqqra0N2IIXRbIJo8kAjmPBg8GkpZJBy8dTZzNRtPhBaMCtAB8v8AY8Uzs7IlgGl8vL0xX7lHKzgrDsKZ/sFtkFITBVXlThlSO2p56ejpqqCqCch5fj972/kByVHTu/++47ioyvs4fP+iFQMRaqrylet23dvHv37iNHjvDx8UhKioNpYshIS3Jzcezb+9uvv+z57bc9Bw7s27v3t107t4PI4y6xoPHp8eNyVKGGrbszcQ1pGkFBeQB1kX+xcuA4OZsnt+MOKgZ6BJKkp3tN7/o1SvjezNhID+4sIeY//riRqUHLTNL5XRu1MvQ2+cf/9wXouZCAoJWFZe7r7LqqcrDG8f6e2d5WZkNeR5pf90Ojck+xen+uwSTBvmdc83XizGahxT7x2S7R+XbxpVrpkQy+kUjBOuv9DMPDtdcO1usdaLdl73RjG78nPBLNP5EsMPFIkPlUBGMmTWQ6UWQgXKDTV7DARuCBjsRVyYOyAqyignz8fDxsLKyYo90/fAekolk5Xbn6Waz/vwPlH9f+Cyj/rAnZl3RUC94Qyd4/eUrx3FmAI0kxtLQCW4HZBGUAPwAgVpQUM2qrwM0Bc2VF+fD+bt++bW5ufvX6NVtbGzwhmusV570FTDRUlNURKK9pYzA6WpoJmne2dne19fd1DvR39fa0AzdpKG9pJuEOkoreymioLq8qLSTNAdIfUxH5GHLac+8uDeu08hEesPypM7/+8hvuC9iqqXEZ7Immw0ArktEReRe+akpc3PMnT15mPi3MfVNeXEBnzhA0xyvJTqlpb6oHiMN+dFERlc5WwHobEQ9obcQFw1zBIyHaA9Ex8AEtLS3PKJyVkZFRUyNVVKQnQFJ89vOMnKzneM16Rnoiv36VCQSn+xDRZgN+RlNdVWVZIagWYNTM1FhSUpqcfH7x9V9CWutu+3qLg6+++KvrGC3a8BeU/4Mk7bIcPgJCBP8JvAw3Dj8XMI1dAVPn60UadAC4YXs8qVNZLy/KpfUjPCjp4cMnKYkvnz6Bo1BdRo61x4f6ZyZGl+dn3i3NL83NLszP0jonf06NrfW2vrI1zrlyNkdeKO8UZ5ECe6ESe5kmd+k17kItlhLNw5Xah6v19nfac3a6cPbf4gM36fLn6AhgmU4Um0oVWngqgTEcxz0YzdEXydr94PD0M4HxbO7FKtHFWtGlOol3VTJTT4WZsVLFur8Uqe5/rcz2Ql1qKNavJT1mur12eqCLOn2dWJgYfjfcs1JdtJad9lpJLl+Kr0CQNVeEvfic3NvrqgvZTyYq8ucHu+bGBok8yxzzjw/vMAisz89Mjw2N9PfguWOtPn+WDkZCdL0fkq6Ed8NCaSgBkJCzUFc3IA6RbSA9BByJwhdRnrI2MtQHbzh58jgHB8emLZu/pnngp7331d/v1Lxl63ZJSUl9fX1A2Ccoj4KNAWECMUpLSXyUFJ+Y8BCr92FMJBlRkXdCSdwM1MGDuKikd4STkwOADw+ddEAO9FunL/A6ggjhDbjl5e3l6u5G3FkrKxs9fROVSxpnz54DUePn5z106MAvP/0MZNnwBekzm6/+ksX/iq6o/PIfX5AQ31frkZaff/6ZKt08fOTIIWD3Tz/t/vmn3WDi+/b9/ssvP+3cuXOj0g2YLiIsCCoN8o4pBZHH1cJ0+fuAbZBVSntF8Bl8SJjcg4rtu+MRkKY0eOfmQhNzzDz+szIztrEwvXblKog5/vrWrVs3Tvg2gvubNpEBTAeg0Uejhw4duqyqBuwCUoGxjQySDuNj7Yyx6lzGo4CWGPMi96NVN4U674l1J/DNFUvP1Yotd0vN94gv90ouNouPvOIeTeCvd/it0eJAne4+htEBUPJOLxawk/Ekfmam0NQLvoVcETLeii48lxiOEegLEymw54vWF7squf+kKIeUuJCoiBA/Lx8r65Hff/91165dGzk233y1+XMo/28ce378z/PKNzp/0wGWHTuIw372rLwm1VH3ivpluJOnT504c+a0qsolIwNDwFZwUEDU/UiSEv5JZbCJqsmEGxh5P8LW1lbfUM/e3hbLKC05ARCc/yYLzBpsFKBWU15SU1FOiRqXNNZVA7jXzzl72kHMwX9bgeYtBMdJhLq9paWxtrG2sjw/p+AtyYN8npH2KCkRCz0aDkLkPfCpIF9fO2srZcXzBw4c+OGHH4SFhWkoJ70XiH7THUrw835SXAyI/cuMjOwXmUV5b2koxwVg4OKBYnAX6N6vbY1E/5aKkhM0b29bh/L66qqiQkDA07SU1Mi7ET4+Pnp6enCNjYwMsOaS4x++yEgry3tbWVJQXVaEAX+C9HlorCXC6K1NuB0io9xCjFNFcf6TR4lAf7ByCQmJbdt20IdmdPD006ai+hJ8VgW6fjr/CcrJec4/vsKKPXhgH5iRlqY6ybm0siRE0t2VBHlJdh0hO+BoVGFn6N274ZGR94AXmA08GnhLcDbxXHCpuLC+zrbp8ZEFSgecYN/C/OLCHN3D8yNzdK235a2TWeF1xeLzIpWKvA0qPAwNrnYDgTYTvhZTrmZz9g5brg5njpEgweEwgfEo4fEYwaEoADfXZIrAxBO+uVci8y/FJtP5x1P5BuLYBxLZmNmCE3lc71olVjrEFjtEl1sl50rEVrOPNbjsazRnK9FiL7guMXLPpS05bLmtZmmo+8McUTdcnZn45/jAfFn+H8+TXylI54nzFPOzFgqw5csKv7wov5bzfLmh/CNz5I85oqhFbNLq4rvV5dmpyZnJMdzI7OTYQHcHbrailEhBwK7DS8NygvuIx3EvPJQKi/tj6ojOLRXMpQyhC3wa4CbJjdPVxu7g4+Pbun3bBpTT+v5/F8pJMHfbDkA5KQ4iiaSBuIYHUfdpKAcrBxmPB3GIjoKxweO7TwrkQoi98XAnwgZUe2XgOBAQmAgEp4Mq1BMP+VRw6+3h7nTDhmT1GRuZX7tmrKZpePqshozsOX5+cU4O3n379m3bspU+HqSvatOmLZ8O4jZtsPL14vIv189s4AsCXLZv3/79998D04HdGOCbv+75+ccffwCGEOVx6gNQy8pyGF6jtbkJnHtrczMMYAiIuZcbSLcHTTLw5qaHJ33auV7C5kEnGBFPwsba/OoVdQARfo+Zkb6nq5OVmanyBSVRYZHf9vy6Y9t2OrNrA9PXnQjq/HPLtq3s7Ozql1XvhAS+epLSXl8x3NU8N9ozO9i52Ne80lE+XfJo7m1YZ6ROR5hSa6B0x12hgWShgZfci02Scx0iywOSK91SM6VCM8/Fmn33tbuwAM2brQ61O7F23mQZieIZSuCcfsnPzOZdLBHGmM8XXHglPBLP139XqNCJP8lCxvIc/+UzUipKCufPnjl1gshscXNz/v7775RXRxnLL76ltAe++RslQh8/fvzw/t+qPSk//duvt1CP8ws8GDFRYYC4laU5CUlbml27qgViLisrc+zYMSUlJdBzTDF1mJkCWAQit9Lh5oaa1y+fJSXGe3t7WtlY29vbA03ioh+AmL95+Qz+O9UO+G1BDknvy8enuW8o3fryjuaG3o4mGsphMIGbQM/2thYQdgwC7oxaWq88N/tFNjl1JO3K4qIJlAOhgv187G2sVS4owUQDykE01C6p2tnagK6HhQbSEq8ALzB6cJyXmem4yA0oB1OGV9FYQwSXm2sq2wg9r8KfI/q3jSSoQhep0ief+OGqsuI3r56/SE9PjH2IbYW9BCw2Nzd1c3OJi31A1F2oLkjUhNSBgPd0ktYWtJ5MTzsR22xvqK0sySvOy05NisWug7cO24MtQbPvr77c9M3XWz5FKv+lCpQWU90oIKLjs3he+PTA/r3Hj8lisZoYG8KFdHZ0wgbANsaWBtmkMuruEVnEhLjUlISM9EeYBIA4nkhtRQnuuquJnEyM9JNuO8DxlcWZFUqaCoC+sjBLFb4zP85Org20Z7lYvNW/kH9JslyZt0mTv+kaT6+5UJc1X7cdX5cD14C3wIA/92SU8GSs8HSKyPQjURCW8SS+iUf8E094FrJFFl+LzzwTZqYLDyRwDCSxM98ITxXxfuiSXh2QnO8VnusWm6kTeVcq1xJyoN2FrUKPpVxPePKudX+C/1pr2T+HutcWZ9beLX+Yn/44OcQszX33NOHFGem3IpzFfCxFfCzZotyZCsfWcl98aKlZW5xaW5kn0jHz0/SN0Brr75ZJnwrm+Mj4UB/pIlRbVZyfAzoCCpJBuprExMcQ9RKSQHI7BFNHaxtQ2Zw3KWUYUtZgaWGioXEZBnj37t2finVplbu/q8FCoHz79p2ElevpkOUa5E83qgf7Tnj4gKipUA3q7kfcCwoK8KfySW/evOnq6kxJjdvSxdW4KlArWGuSYx6GCw4klpuKO2MD0pF0OBPXruqqq+srKOmdVTY7ds5IROrSgcPCP/10YMf276lj268p9krIA3D8282UzNOnVmIE1in5ZVpmljJd6ykSYBKwBCD1wNPvdu7atWPnNupjyxag+VZKufdHaSkJAx1tzBspXr+qpatNGrPh+l0dnchwcaJhnQwC5e70+TNxjzzc8C1YUAtzYzVVZRkZKfhDpoZ6sE+g9rrXrgIcwfcPHzz0/a7v/toa5MJwM1+AmIP/AhC0r2sF3fQseP64ueDlVHPZQlf1hyHGn0ONa+NNawOVa43P1yriR5PsB+7qNLjJtd4S77oj0JPEtVQrPdNCoHy5R2KuVmQ2R6w5dF/7TZZGu/3NdodanQ+23TwEsoLFPPmSj5nDs1IuslwmvFQkspQtCgo/ECFa4ir0xO6kh6asmaaSgfZV7StagCbwAAkJMXBz7HosAGJBv/zmb0M5PuBs6v9nrHyj4ghO08kTx2DDwURu+WJOPZzsbID+iooKMjIyJ0+e1FBXA1BimSTFxWY8TikkfTKpsEljHRg3kBrrLzg40MuLZAJgeT2MjHiUGEdqoNMeA+wAJdg5GPDrgeZVpYWwAZ0t9X2dJN+cUFdAZ3tzZ0dbT3dnb08HDeX4MUB59kvSVpQWP6IKlMPJIYm3xw1Li/PnFPf9vnfnzu08PFykcM7a0svTFQzrTmhQ5N3bQHO63AP/POv5U1wkoLyOOvZkUF2sGDWVzTVVrVSYBTdCWaba5obaddpOxWHwk7BbuIo3L15g5+OmQPzxh0xMjG7Y2YDwPklNKsnPqaP6WuCX4Fc1M2oa66sYlDA/mC9pCpyXnfUs7UVG6oP74W6ujheVL4DfwdvaaDC2cRJCP8INxabPoZzKTSRQDqQH/WE5ckjhrDysAtH6cXTCtJPyv/AwuCPAJnjomHY6Xl9YkFNZUVJPOVLtTZjz1uHuDniakyMDpFHD9ATB7qW55aVZGsRpHH83x/xzbnJtvG/kdRoz9U6drSbD9HSVJl+VBlubAXeLMSc5ArJh63Xj6vFhn4gUGnsoOJEoOJEsMJrAgzGSwDmUyD6ZzsvMEBxPFQC+90axdz9gGX/KN/aac7VFcrFLZGFAdKFffLFT4s+mE9gb4PW15oeqjXgZ9mcrPbWHn0YO5L/8c2Lww+zEH7iS6ZHl2uK1109eKhzNFeMuF+asEOHKl+J7qXRirfAlgfK58T/mZ//SLqd0tQDrq0uzq7Rmy8wkbnm4rxsOE117DK8R5g0L7PnTx5lpKXiUj1KTU5ITMeJiY0gfwojbd+/cDvAHyLiZmxmB3NDe/Wf9OTf9TZHbb+hzOVFR0evXrpDl+klfHn8L5gQDfxGI7O/v7+5OVBYcHe0dqQ8wcTfS8JMc5sPSwORgo2GE3w4GmlNR8kBaAhrrwdzcUuuKzrnzmmfO6x8/YyJ33kbmnI2wzPXDbMd3fX/wm6+30w7+JxK9/dfff/t9394ffty9Zet2OtJCMuhB9egf+3I9DEhORP/xBR1Ap183f7tl+9YdwHGs5x07MMj7I4cOX1A4a2ZkiHsErcY+vayqBjwhyTZW1k529utRfjd36szZDSaTyGz4ENtJ6/DA0TTQ1z5/nkSEgIOOttb374YCf8Duda5eUVY8d0xWjp+Xb+/evd99991Wqq0ccAAgzsfHo6qqApuREh8DHGe8Te98ndSUfrstPXQg+/7Qm/uDWeHDL4IHUj2H4p3aArUb3S4UGAtUWHPVebI03T04UyI6Xsu71C+x3Ce+1Ca+WC7Z9fBIbzhHm8fhdneWds8jHX6Hh2K4B5JZmW/5Z/J5liuEFkv4ma+5p5/y90VydgcKFd7gT7c+Gah/1kFf09rM2MLISO+6NlGLPHGMl5f7++93YR5p3/rvQfnH/w2UbyjzkRqHb75hYWHBMiVZrv4+oSEBWFv+Pl6ODjeoECFJ4sZsgop6urrFRN5PSox9nf0C1KahppKk9DHqwHRysl8mJyeGhYXQ6QFYoBFhwaAb1Ln8/YexUfAZExOIwEVu9ktsoabqiq7mup72xt6Ols62dQrc1QYySyr4SX+f+uqywtw80kSIdE4BI6a3FpxNUvPi4W5ubHT65Kk9P/+CG+bk5FS6oEig3M35U0fEEDAdgFpKAtHDomLlOYSVk47dVaSRFaXPiTekmJMKsADKmynshg2htZgZNfgZoq9fTPVGoRuj3A0NAmUwNjaGFxIeHvYkJbGiIK+xqryNir+D88KZKC/KKynIJY5ITtbrV5m4h/TUxOS4KH9fT3Cl48ePc3Fx/Pbbb6Awf/WU+VdQ2Cjd2qja34BysHLsFm5ublVVVTMzEw8PN0wIPPHIu3foHqpPHye/fJpW8DartCCnvqa8kVHT1dky0N0x0t8zNtg7MdxPp4XMTY0vzzFXFuZpDkvplhAtLXoAyv+Ym16bGXvfxVhrKKgPtG1wuZKnJVykxt6gzdWsy9FhxNVuztHnxNvnyTN5VwRoDmI+GS8wGseHMRjNMRzNPpHEN5XIPx4rMPFAZCCMqy+MaypBeCyD948GudV2yfdD0qtD0u8HZNY6T40+5Z6MFam3PVRrwl6qL5hverI9wqU59d4f/S3vJ4f+nBtfYw7/0VS59jbjuaJ0rgRXhTgZRccEs1VOAsr/aK39c3r4/ex6R6E55jjevKPSE4ma+bpo4tT89Pjs5BjmYaC3gxJTI0SkopS0bMfDynvzmpTyZr3MfvH8KckBTEiIj6Gj6uEhgYAYAJMAPy8tiEYHwchu/DslQvS+w3MnGSzqakRh38s9JOAWyAc2HelfS+VyeLi5uzg5kwacVNMDuj8q2CtAHD+80S4O8P0XK6elev19wNltbe11dI0ULmjJnNA8esZc7rzLMSVvmXPu0qesRKWv/raP7+uvt28Csd60lQS16cJ6KSlZWVlBQX5SKPTj7m+o0Dlh5VR9/F+aIXDiqcwQutKSjqcDzbds2rx967ad23dg4IOLk11VWclITxc4Di54XO4YmBb4KfaslZkp/GncOKg3nWwGKAcrp0RjvKkMS0cAt5mp4dWrWufOnT11iuSJBfp6J8RE4n4xG2D3YDCaGiQIfOyYrJCQAA8XNxcHp5iYmKKiIgwG5hDueH1ZfndFfm9u2sirqLow88bbhr3RZr0PjTsj9bojdLvCrnQHarS4KdbfkM29fqTIaG+p/Z6KoJ/GCgSGq7mWhyUWB8VW+mRWGEe7U1n7o7g6brF0+LC2eh9sDzg0HMc98Ih1Jo9/ppB7uUJgoVhg+iXvVKpgbyhnt7dQoTl/pvmpO0bKbqba9tYWN8zNjfX1tDTVz545DV/hhx++I3JjX9IFsd/8X2DlG1AOuwqHCLigpkrav4UE+5PTQqpGHxbS1MTg0kUVOTk5uDmXLl20MDPHOgNqwC99AX5NdfkDfnU0N9RXlZWWFDzNeAyPntCKgFt0QgU5hAkNuBsRdj/yTlw8KXzIe5NVUVzQUlsFH7+PgvKOVgYd1mhraqTzScBqQcmzXmQ8fgQ34AHR/KS0KbBkwUeIC+bkCFdLRkoa/h3mhZ2dHc8V697H020Dyu/fC499GJUcD1a+fuyJvwv4pqGcRvNGqp6ThnJsbBgnIDiNwrg7QCFAubwov+BtNizQsyeP0pLjQwP94ORaWVk5OzvHREe9yEhjVALHazEPsBMFdN1EWjLMD1je45T4pPjo+GiiHQ0cNzczxDRicWPPsLOzUsdEmz4h9aZ/TV/Z6Cj0VzEbvanokigRERFdXW0wNcLEo+4nJyWkP0oFDX/94mlhTjb8CBgVmKLOFkZvV+vIYM/4EBB8iDk+PDNBqiKp/HEihQgoX56fo8tq6JL3xRlA/OTKzNS7mekPs1N/Tg6tDbVP5j6afXanwfNqs+25susCFZqclZosFVcONhixN1gc6XDl7PRkGwziAV4P3OEavMs9eJdrMIJj+C4HvtJ5k6Xbg6PBeh/Dal+b+6EW//2TGQIjbzgXm8UX2sWW2sTeNcoMZ3KNJwi1ebC02/OW63HnG0p03bnRnBiyNtq5tjDxfnr4j7HepZqiP7NTs5Tl8o/yVkhwlEtw4M0rZbm1nIyl+rL34/3LUxO0+O3E6ADMFRF6XCRxf7qNHLFVS+QruNPZ6bHJsUHMyQAlxkn7ha2NjBZGQ1UlaVNJtwh/lvkkIz0NgA4PDw6+laW5jLTkTz/9tNGy+d/17f47eeXffrsZ5OOC4nn8QqxkLFq6TIkUD7uTdnS2NqRHAp0wjl3p7kpS9EjXt9BgCsEDMYjwYXAQGWFBtDws6Wjn7W5vb29sYnlB5brc6atSp42kFZyOXfSTuxhw9JyX9BlbMZlrBw4L79r1y2+/7t/3+37cC/wM7CN1tcvql1Wp5gmSHBwcu3/8mUgUUKz8U9olkT3ZuOXPgn7kEH7Xjp2//rLn4P4DLIePsLEekT0qTYl2GaooXwQRPHn8xEUlZUA5vmJhYkzLZhGtN+qE2cXZHoOcizo7uTnZA8etzIxJx7hLFxUvnNPS0sJ+j4+OTCddISNgADA1FuamlhZmpEZPV1tLSwOUX+Oyur6+vpMTaVwFzyYp9kHZ68y6F8mM5JDOGKcCO/kyh6NtfvIdgfJdAafafU4wnKQYtpKNNyQbrYXrbbib3Dj6I/n7HnOtNsvNdYgsDkvMD4svD0gvNkn3PWUfSuDpDGHpDmBv8zvcdfvIaDLP6Auu5QqRxUqBpSrBhULBkcfsI7G8Hb6czY58r65xJOvIhekpuRhfc7xhaWdpaWJAjs3PyJ8ClIOV02mU6zI1f+/Y8+PaP/94b2CgtwHldMHoJz3Vr0HxBAT4YOXg8gArsXDhnlPyngGYYn1dPUUFYlpPnDiBKcMKw4/dvRuelBj/6llm3utXpI09abQGLKsuKcx5++o5iOHDqHuUzCaRKwoNDb57705k5L3ExHiQnYIcouvSVFfV3cwAlHe3kYNBOnelnT4qbGmspfAUUPgw5gGYb3AwiV0SpSs/X7+bPq6OTjDsWpfVxUTEt23ZDmhjY2MDlOOLsOqhQURSg3RHvEd0dGkoB8Zhc9JQzqCgvK6ioqGKvKFzzIHjeAMcJ1Kob18Dj1+9JA2O8yjFiTcvn2U9yyD643ExgQG+zs7wd+1xMfgKPPSWWpJqid9WUVREumQkPKQaX5H2BZF3b5M9RqnTGRjqXFJVUlRUOImlfVxOWEjgl19+oYUjaBmJjXZitHv7r0dqX693n6Eyjn744QdpKQksaFr4DM+LDoUDweHKwC2AY0H0CRh1vR2tYKBjw32UABYRql1gEhwn6oaANhIZn1+YYQLviPYhIH4KfJaUv6/MTK/OMldnp/9cmFmbHV9qq1ytzWq679Tib5itI5mlwZ+txpl9ma1Ym7tcl63RjKvFimPQnb/fi7v/Fs9QIO9IKP9oGN9QIM/gTd52W9Z2c/a6q/tqNfc1Gh6us9w3dJdvIIHjXfnR1TrJlQaJDzUy45k8U8nCXbc4etwES3WP5OsLdoSZNiUGrI13ri1NLU8OvxvumqvI++eLpLcXjxUf56+QYiuVYs09ypWlLPtn1uOFmuL3o30L46MflheA16NDvfA/cI90aGVhmrQAhbl6/24JY2V5fnlpbn5uep45PTU2OjFC+uFNDA+MDvYN9/d0UiW+WCcg7HCqAOhUo/AYUARwyVMnTsKdolt/fPOP/4EGy2a62hN+8OnTp+Gi2Vlb0QWQdAs60nLT2pI6srJxtr/h7uwAoKfl0rCbSBwm/DbpKB0SANZFl6diz2KEYl1SOv6mZlaqGvrSxzVIN/DzrrLK/rIqwXiVkHdk51f77kf+n35h4+EWPip97Ki0LDcnDz8vn9I5RTBfwA1c2/OKCsePyYIbAUfoBFk6aeqT5gmdrbiufIJvbtr0zf79e+GsyMnKXFA4q3rpIkghEJYoeTncAOwQLbmLKteuXMUXQagJCluaY9A9Nuk6VbrvKAbuGhitq3Od6CwpKFy4cMHczCQm8n7Go2RwJjidXh6eDuTIwI6k8VB6VQB0MyNjMxNTsCtXV6LHEHTrZuTtwBfx915HeBUGWzQGaWcZ8BaacTS7C7Z6Cnb4CLW48FcYHa4yYq01YWVYsbe5c7QGHhlLExzN4f2j/8TKsPT8sNjssOh8n9h8k0Tfc/bhZN6O8CNdoaztQYc6Iw6Np/OMZXGs1Iks1xIon88XHErmGI7ka3bnrL8h+OQyV8xVuTAjdVdjHRrKaVZ++tQJHh4uOsCyoZH396D84z//fP9u5TO98k0benv0I9m6dbOwsCD+GBYTlgjddgevibHRwES4dYb6BsrKyidPnjwrfwZTDDLo4uIU6B9A0hOT4qkmTAVUx4nKxtpyRmUZAAWA/jwjDcD9JDUlJSWJHvBZn2ekF5JYeRE4LIHyTlICShrxtTeDHPV3tWMAfeqoXrrYQJH3I/z9b3l7e7u5kcMQqujc0ZYIjpHqOz4e/q1bt+MW4CHCf7lhSVrSBPp5041u70Xcjn5wLzH2YcbjFDBqONF01/lmKiDeUl/fRAXNKe1GUsQPKK+vrqgoLyX9wl48TX+SSjNr0IHHSfGkTCP6PswDaR7mdxNvMEW404aK0qbqCtiet1mvcHe4YHJm4O1GhDEcSFmTkaEuKMZltUtY0yqqF0EirlzRJD2lTp1gZWWlD/3/Sm771BlyvdcE3nz5V+xlA8p3794NKMc0wHQBynElJCz+5hWdSFNXWdpQW0FUwxrrMZ+DfZ1gqdPjI1RiHxEcJxX5c9N0NBk4Pjc9MT8zQbo2k3p98mOkSSaTibE0M/N+fgbcfGmo411PzUh+CjPrwWCc91C009D9G0N3LYdC9If9NEu1eUq1DjEM2ZpMjrRasbRYH+5y5uxyZu90Yuuy42zQPcDQPFx+Zk/56d+rlfaXaf7c6cLeFnho8ong5Eue6Rxe5lvwGs6xeP523yNdbjx1FlxV1hJ9ESYdyf5r461rC+Mf5yfWpoeYpW9XM2Kzzsvky3LWHOeqOcmZf4r7jdqxtbz0VUbZPycGV5lEZn1xboq6FyohndSvTuEuFmdnyM3OM4Hgiwsz5A1zcm56anqcNKYYGegd6e+mhSXAKjBvpAiOCO/kgwHAAcUMB/v7Odo7yJ86vQHl6/HJr/5F4fb/WLhPp5n++uuvUlJSmuoahgZ6VAmMOc1VgVIAKSAyfGIwgCA/H3iBYUGBd8NCqVPZ4IjbYfgUixBQTsLl4WF3Ae3BJP3GxcnZysJaVf366fPa4id0ZRSd5C76SSsFSSsFSCu4Cckas3Ce+W43Gyur4Bn58+pqGkrnlSllctFLSspGerp01OL6tStYq5LiEj/+sJvW76SX3+ehpE/Cy1/t2LWdk5P9ovIF3AUumwiquLrQFcW4fl9YIVfHjd6Y9JktzKEtpYBoZmZiRrUHIM1gLc3Bw6zMTPGpgb4upkXhzNkzZ85cuXIFvw1bD0QKkAInnXRq9PSk2w3CX8GvJR0EDQyNDUkjZlNDPUtDPScLI58bpsE22klOV146nK9wO1HrLMRw5+kPFuoP4evx5+n25qm3PNBgcajR5nCz8+HeUM7eGHZmjshYOf9Sv9TckOjciAhzUHiuV3SmSXj4DedoOl/r7X3ttw/3R3EMJLJNvOCeyONabhBeqhdcqOCfyxMYTOQcjBBocOautpN6a3461vhikPE1ByNtEis3MdbXvg6PB6CMuSIgvCG88u23fzPA8ufHP1ZXDHX/pfXEevsCaj1u27YFUE5YubMTVklackLWs/SXT9My01LALyPuhmPKjIwMVFSU5eXlwc3Pnj17/fp1rDzQZHBPojj4JquyrJBRV06KNlsYLQ01DdXlgJUyogf75u2bV2C4AMes50+zX2SWFuQCUlsaatubADQkHxFbCIBOdG4xurv7OtuwkYrzcx6lJkY/iPTz84WDiV1EG2EbC3O4aVh2gEIONs5t23ZgRvbv3w8qAXx3dbTzv+kZ4udHlv7dMLDj+JgoUgOdmUaqdcqKSCI5ieQ0ALtbqWrP9pYG2r/Gm08tL169eJ6RmpKQmEC0D2MfEA0jWuoo/DapPALdfvYkNe/186aaMngkQPNS4kOQMiLQZAcHO0NDPD4t9cuk9zbh4CdOYF0qXbygrXvdnOqPg+erclGJj49vy7at6+fvn5pL/HvHmc843beEH3311ffffy8lKU5YuYdr7IP7jxLjsp8/zXv7CjxyXUOmtoJo+TY1DHR3DPV1j48NTU4Mz0wRKKcGCSXTPYNI1jZAjTmO7wL+6AgMqZacnQHKY6xQp6CLk0Mrox3M1rIFRt5ceeZcWfpsYfJMTuxEevB0vOurK8JZF45UaLDXaBxuvMbC0D3cYcHRbsnWZsHabspeo76/RvlAsexPhVI/lZ78tfjcjy2WrI3O+0aieQeT2EczODEGk1gHH3I2+xzo8GBvsOWqt5Mcvm/ck+KzNtSwNju4tjK9NjvGLHq9/CTmhYJkjjRb4xk+xjnegrNc2Rpya4UZ71sq16ZHNmLlQHOM6YlhOs+SJMvPEOzGtzYGbnl2anxinFByWLuezpa25vqm+pramor66ipMY0VpQVlxHt2SEA8XUG5rcwNQ/uuvv9NGF1b2U67R32vvia333c5d/Hw8cCU1LqsTATid63TPExJBBq+kTjXDQoNJRCWcNBwHGcd6vhNOzjnB0CldgQD4zUQl5nbwLV9Sswocv35F78QpVdkzhnJKzscvBciqhBIcV/Tgk9I9wiXPK3BSUFD6qMyJy5c19HR0QcuoPhMEykmPT31dA6qFuhbplCKzZ88euIyfayxvZLCQ885vvt605Vs2NhZlpXNuTvb+PjdJ/kyAP96QKnySKOm9EWXFG9gk8krRoJvegGHnGzeszc3NTUxMsIwJ3FtZmsIg6MI70FJVuQTWSALfBgZwNUjBXWZ6bjaRCYmKvOdPmpE507nntjcsjU30iQiSvq6Rnrb+1ctGGkrWmop2l096XpZOtTr5xk6q3IWvxY+3I4RjMJKn/x5XVwh7jz9ng+M+hsMBhtP+Jq+9/VFs/Y9YZ8pFJur4FgckZoaEZsdEAeUzPYKzLcIj+ZxjmTyM23ta7uwbSuAcSmObfMM9Uci+3CCEQUN5fzz7wF3+KkeuIrujj0xOB+hecNBWNbyqrnf9CpCK1o+SPSrNzsq2dfO2jfj2f9HL97/SK/8PUE4LUdLJmIByISEBQLmHi/Od4GAayvPfvMjJygSapyTEYlVh1ig0Vzl+/PjRo0fh+1zR0sADIOWOd8IAl6R/5sunpUW5pBtyXRU9GmurSOu/8pKKksLy4gKMqtLC+qoy0OF2IlbV2NfZugHleAPcAZqDSOIHKkuLwIZI/VFYCFbGhgUGXutdv3ZZ7SIcOpBxmpX//PPPEhJiWAeOttY+Hq4BN29i490OC8Lqj4mMgOuQmZ5akJsN+4CrWg/mUO1DSQJ4K2MDyhl1lbhaWKbXoPFpKakpSUBzImQUG/Mw5gFdr/EkLTn7eUZpwZu68vzG6lJ4IVhkT9NSQZfg/Zmaml69qnVeSRFewskTx6hsTllMl4aWprGxoSORSHSj7sX6itZlERERKk+ZDoX/C2T/76F8XVdPVFiE7ssMu5KaEAuD+ubV86L8N3RPgLrqMtwLrbvfB2I+0DM+Njg1PjQzQYfLgdrgrWN4TzNx0nN5cohmsiDpy/NzGKuLC/QgmS1z0yvM4fmh9uXB5qWe2tWemj8H6z/2Va/WZf+z5HFbsEWPq2aZKn/leZY6pUO1lw606bC3GrC2GrG3GXDUqx9kqLBUnd5XfepAzbmDlRd/67Bib3E5NPqAfziRi/mKnBqRLN1Mob5IzsEwfoYja62tQPPN83WBBvNFKTO1OWtDbWuD7avVBWtZqetQrsDPuMBbqSZcrH/mfXbCYnX+2vzk2gqpCVqaJ4krNJpTXSmm5ql2QoSqT48Ri0WFkgD0k6NDPd3tWG6N9eSsG6u3qDA3Nyc7N+cNPDPM55usZ3jF2k5NTAjw9bGxsoZvSqCcUs2m/ae/2xCOiPZ9/c22LVvZWI+Af4B+Kl9QUlNVARiBmdLiJLSoFn0+hPWPgU8xsJ6B6Vjb/n6+gQG+tKBjcJAfXGdnRyc9HUPlC5oCogqiJ4xklT2PXwo5qhQgcdYVfJxHWJlP8MTJkxfOyCvKy59VU1ODmw6qKCUhCShXu6hibkzayFCNm40uqShLSkoeOnQI22pDmIVG8/XOwKT4+KvdP/14/LicjYVpsB9pHUU3R73p4U5Rcq8QKvEh8k7og/vhWKJUamwk1e6OTl4I8vHxBiI7UZL6xOG2t8OfxlUBiC5dVFFUOAdLY21lAW8jOeZBcvS99PgH6bGR0WFBt329gjxdAz1c3O2sbE31LA2umepoGl9XM9JUNrh4wlbthPtlWS8VoWA1rufWojU+Em2hAhNJYhNpQguvxJlPRYYTebHwOgNZuzFCWPsiWKef8k/l8i43ic+0CS0MiTNHhJkjgsxBweku/tkWwalS3uk3fH2JhwaSWaef8U1mcy2VC85W8S42CIKVz5fzzeXzjz3hHo4SLHPifGkjFXZVylpFTueighrpj6qMoXRB8Yz8KbjRrEdYaH2Yz+q6v/6rGed/69jz/QcDPf1/CbBQ7iFVnPINiKGwMEkqpxQhQh5R5YtFuVnFedmvX6QDpO7fC8e6gQEEd4Azdfr0aSLDrXKJEi0jbQl9vTwB6LEPozKfpr3NelFWlE91ba4EBaYHXYmDV1DF1iYitQjo7GprJlK3VFCFYHpX21BX+1BXBwCdlJKWl2AX4a9HRYSTbrkerk6OtiDkJgb617VIo0JJCbFDBw5SET3SCIqfnxeLAM/ezcnRy80Vq4o+JsJmiIt9kJaa8Db7eUl+DqOmspVR29HcQOerUOIwDXSAnobymnKiZgsm9uo5KU1Kf5Ka9nh9ZDxOwQBLw+Q215Y21ZTUlReWFeY+SUnE+iRhSmMTVVVVeC3HT54AFz+ncOa8ogLpy6Gja2trCxAP8PfBxrvl7eHh4qivdx0bZseunZ/UJP6q2v/3SsL1RJdPEql4lIL8Aph/uKvY4QkPY0gQKZNICebn5ZSWFNDNunCDuK/ujmawzuGBbjp3Ba/Tw4PMkaHpMYwBejDHB4HjM1PDhNLOTr9bWny/TGrfP6wsv19eoFvXv1+YXpoaXpkYWBnvezfZt7Y4urYw+udQ68e2sqFHd6buuRWpipXJs1efPlx19kCzBnvLddZWffY2fXaG1qGGy4crFH+vOrevSnlvufqeFtsjje57SQloypGp19zMPN6ZfL7ZN1TM8QFfrdO+OluOegeJWufzzMd+E1kP11pL1jqr1+oK1t48fnFe+q0MS5MiX6MyL+OKaKWR/IcXkQslL9ZmR9ZWFv9YnH+3OEsrEJDezUtzdINpDMpcEYuF24RVGx/ph7+CdQgcB4iDfWO9wXeEQ/b82dMnRFo2OSP9UTpRpo8HWfG76WlpYSYrK7tnz29f/6WTs+lvU/JPzvWvv/4Cb/iotMyJY8eBXDrXtSlJUT+SjBR5L+p+JKmHux9B6rzCbtNKW3ilm0eD22JLkur8IFL6jGVgamymclFT9pgyB+854WPmRy/cPK7iL3fBS0BSd+8ROWGx0+fOXVJX11RRvggHEZyMUhsl6lrSklKaapetzUkTQRsbK319fexucXFRbChuTq5ffvqZVmKh6igpJkh1HANocHNzg895ODsE+HgR4TZPd4oou1JVnR5hgX7R9+7Ewi2Ovk/kt6i04LSURLwC0IHsQHPwa1/fm7gXDGwf+NwkF55qbAQzA2aGvRzs4x0TEhgXeDM10OuJv1eKt1O8m22cm22Us2WQpe5NQ00XbRV7rfPWqicsL0hYK/CFXZFMNjqaZiSaacpd5MTZEszTGcUxmyXOfCu4XCqxWCg6msk1lsrdE3mk9z5L/wPWoUT2+Rzh2VK+1XaJhW6R+SHR2WHh6WGB6QGB6S6+xTbBmUqe+SLB4Qy20UyOqde8M4W8q/XCiw38SwwBvM6Wc88W8Y1ncg89FCh0Zku3lvRQFdZWkFA6Iyd/+ri8vDwm89y5c/KnT0qIix48eHDz5s0bevdUN7uv/mYGy/sPeEKfQzl9jkEfpoMYCouKwK8B1oBaJsZGP32cUpiTXVb4tig/O/9tNjl+jLoHJ46IOVhZgAzq6enp6+rRHhkgCY4RHoOzkwOW173wUKIF+CgZvBboWZz3prKkoKG6FHQYoEm3oaA1T3powtjTCewmId2ejuHujr7ONqAPkQQozIM/Rfr/RoSHBtzydndxsrMxBZBTgSd4pvAMDx88RIrWqJNbdnZWRUUFXAkRtrW9AVO/Xv0Y4EdUQ2OigMu52S9hIWBR2hrr6AALYJ0u2Sd1nq0MWBpcJ8g7ALow73VBzuu83PVBclrAeQtz6iqLm+oq2hqqGDVlMHhZzzLu3wm/6e2JP419Aq/l2LFj2C3gFJgiMB1HBzuschArkjgcSQTwiBwSpXYrLS1N90Ik8hFffE0/kb+SEelY+WcQTzcuoJqE7ODi4MSCh2MEn4nqSBmbmpLwNOPxi+eZb99k0/IvlSXwgcoJPadabQx0tw/1do4O9IwN9k2PkVjKeuh8ZgRjcWac7lW/sjCPATK+kdlChAZJPh+RNFmYGF6cHFqcHv5zZWZtefaPycG14Y6lsqw/X8S+uSiZJ8dWdeJI1alDzWqcTZqsbXqcYOUtemzNOixN11kbtVlbTdmabxwZCuLri2CfeSE0ncO7Uiu2XC86Xy24WCE2mc3HTBdtD2Tp9OKuteGqsZbsuHWlKdhyIvP+dFbiGvA6K/m1skyeHHv9Ga7681y1agKlV2X6Qm1b44P/2V3/bqTv3QzJpCSUfHZ6dXFuaXGWOT2+AeWEiY8Njg33jQz2wBGEc1ZVVoyJgtkG9YYDGh8XDcP/8GF0FKA06u7D2CgqgSoCq9rT1QmrXUJM/Mcff94A8Q1l+b/Zppn8y507d7KxsQgJCEqKS5w+eer61Wtg5SHBgXfCwwDl0VEPgOOA75joqOhocj2kbgjEnJa39fchaE7EykngWFfPSElJXUb2goiECq+Yhvgp26OKHlJnHISk9Y9wnN57QODUqfPXrlwHn8M2B45raWmYGhoAiIEUJNvv6jW7G7bg9VZWFhoaGljDUlIS+JaMlPSRQ4cB5SAQdKobUdffsnnT5q100zVcMJzgW15EO4Wotjk6Ac1xSeAr98NDgeAp8TGPEmNJr9RUovUIZgbO8Tg5gfQHiyZ9NsLvhFBiwiG4HTtbGwsLMzMzE9BzDOz3IC+PIFcnf0uTe5Z6D82uJplcidVReah7IdlMLdb44h1d+eArx3xUJX3UxP01xW+p84ZqcmaYiZQ4S5e5Cjf6CbWH8Y6mCI0/41+pkFqoFFmsEl6uEpsrFJh/IzL2mAD6cBLH2BNO5lt+ZjHPYqMQs4VvtldwdlBkbkRkblh4eVDsXbfYZDnHdBH3+GsOjIkcjqlizvfNYistggsMXgyg+XK10Hy+8HS6RJkPT4b90RvneVRPCCnKH5OXPyV/9sx56gM+Olj5/v37KRnhbzdatP8NKP+49ufa2p//AcqpI2kQ8/W8qG07tgsKC1Gs3PlOaBCJvSbF52S/LMp7W1lahEGiDY8SYUfDKVU2by83Ilfh6oypB1Rdv3YFsKWqqnL1qpalpTkwFACKFUmndac/Tsp6kQHWA3QmirId5JwTZHygpxM4Tlp6dnWR0d0x1NsFWAeqNjfUloAjZWdlPIZjG4e1G+TrCxprZ20BICe9wy+qKJyVFxMTgcOyfes2sp82b4bFwxLUVNcwMjDEVVGKcTfcKNkH7I3oB5FP0h5lPX9WTpJYyikEbyR65VRnOCqlvRlmpqWxtqmhGr42WC0G7r2qsrS6qqymuqy+phxfpwTcq9ubSLpOXXUZeFz6o9QgP38HO3s4rfC+wdrOnDmNTWJhYurm5AwQp7vh0N5lckIMXrEVMdX6wAUpyR3f/7CeqUKX//yDEsL+DMo/d74ooQUC5bjfw4cPX7hwwcTEyM+PpIfiBkm6TlJcSkpSRsYTUMvsrOf5b0m8BZYJt9xUV03EKTtbCEPv72FOEHRbXphamZ9anpvEeLfIBI5TNHyJoPncHB1Pp0MxdCd7vJkbH5mfGF2cGl97t4Dxx8z4x+nBD61Va8UvMlXkXh1lLTnGUnHiUKMKB0P9CEC8xZCtxYS12ZSlyfxIk+XBDmeWFu+Dg9FcfcmszCLBqUruxQ5RDGYT/0y90GQhuLlwTyRLbxBntc2BanNuxg3ZGnul0Ujn0Ti/tdxHa5nRuRelCo9x1slz1p1lr77AXaIm1uJyvTbYYaW+YKGr6f30KNU9g0RXVpdmQczXoytT4zOTY5OjQxMjg7h9LL/Wxnq4aMV58GSegy0mx8dF3r1zJ5w05aFb6wWH+N+5S/Kg8EVgk4O9jZamOi83z87tu+jz542m738fyr+lG9/8/PPPHGzsIkLCcnJyWlpaWLTYOOG3g2E8SMMgwPeDyATShYNIVpADm/BQOlYOKCedT7xvOjo6G5vdUFC+Ki5zkU/4orC0jvhJK+nTTlKn7biFNXf8wL/ru8M8PCIXlVR0tXXMKZTEPtXWvmZubHRV68qZ0/JYRcb6BkBhFydnIyMjbK5TJ06ekT8F/xvfxeWBJ9EVyHStA6B879798CTAXdzdnGipHyJwR2RhnLy8SNJkxN3wh5ERKfEPgeOAjiekwV4aKRLMfAJGhU/hJcfFkhuMehAR/eBe5P1wcHQioXXD0trG3NrKDJvd08XhtpfrHTvLUB21ZH3VTJ1zWVflM1TEnqqLvTaUfWUo9Uxf/ImOYNJVnhQd3mdWIpk2vK/suYpduWu8Oat9D7fdZeuOZWNmCTHz+d81Si0zxOZrhcAbVislVovEmc/5pp+SguSJDF4sudkC/tU68TmG4Eqv+OKAxOKwxMKw2PtRqfc9oqOlhyaL2MZyWTBG81jGi1nftQkvtvDNNHJi4M1CvcBSmdjcC+kKf/50h6OWCpxqp0RULpxSU1UmfQsuqwMeLyicBSvfu3cvrQj/P4Tyj/8G5RQrJ1D+xRfkeBrPhoeP97LaJUeHG7SGyYN7d9JSkp9lZhTk54LGgqKSDjoZjzMeJaWCucREYfaj75MCel8fb7Dg69evq6urwzOCUXW0dyCyRG4ufrd8qKgfUOYe6ZP56hkYEK0VDq+W5KtQrZmHe3tH+/tH+vpGB3oHu7vrq6uKi/Lg1cbFxtCCiF5urk52tlZmpnq619Qvq6hcVFK+oHT2rDyIAyc7x3c7d5EMzU2bfv/9dzExsXNnFcg50rUr8B+NjQ2tqf7FuBL8KvzC1JQkWIiy4jwAMVwEIrrbSQqUaOEX+j2t7YWLbG1htLY0tbU2t7c1tbY04CsNtRWA8uqygpryYtKnNOc1WHBqYkKwfwAN5SDj8KfgHtpaWXq5uIX6k1AmtiXgG2QkMz0Vhg3GCbiAPYAdBWdoK67/E5R/8b++/A9Q/uW/Rl02ugjhfuneBTo61z093ek6T7B+mE/44DExD5JAhVITYQtfZj59++p5aQFh6LT6DaB8FKwciAyuvcBcXZiZnx4ndJs5AQJOQiuLiyQRmzm5OjOB8X5u6t3s5B/zs+/nZ4CSKzPTC+OjpD3bzDi+uzw5vDLWv9rVsFadV3JDt1r7bKk8b/lpFsZF9kYNlnZDTtDwdhuODjvWXi+uXl/2oQieoVjOmSyhiTyelWaxhU7hhQGRuT5hZofgXJsos1Z4pUJi8infdKJIqxdrqwNvtRFvlaFEi8OlVlftmQi3pRDHHHmhoqPstSc4a0+zlZ/hKFQSbHG+VhNot1CRPdNa825qhOppx1xZnMHdwZmgEnVm5pnTc9NTdGtprDqQiUZKif4tFQqH0wl/1A8sxdPV2ckOGwHA7ehk632TSN36+nh6erjAi1I4c3bf73tJuJPKrSaP4+/Hyj/bukSr5MC+/aQJvZTUZVU1uLZEeiHYH5gN7AYrxxuS2AoX4S7pD3X/DjkCDfQPuHXrlqeXr729u7a+tYqWpZyCoaisjqCUgdhJG+mzjmLHrfnEru4/fPT/+X93bd78g5iIpNpFFWN9PTtr0kLTxNgQjjWoBqCc3i/YXESly94B3raqyiWlC4oaqpcw4CvAaQCXpLrRbqY7XpFEWEkpQ30DIuLmReIqbpSkpIODnZubm58fCRDFRT/Amgf7Bmp/4uOP4WJnPiWATtdbJMYRdyfiHlm09yLC7oQE+nq5Y/LNLYwtzI0dbC3dbW1u2ZjeN9ULVzrxSEXm7WXJIjXRYnW+Eh2eJntJhpNYo5tEg5tojbtQjadgW7hUe6RkT5z4YLzw+CORsTT+6ZcC02/4lspEZyr4lhqEMZjlvDPF/GNZHBPPeEZSOUaSuAfjOYYSOEdSucDN4RFiTc5WC03XCc60CE+38s218y+28c/UsS/U8yzU8s7WcE9VcTDruT70ii13Cy108S1287/vF3vfLjZbIjz9VLLEm+eJvcyNC7w6SrLXtS6CdxoY6METuqKphSkVFRHas2fPxtHxRjba36j2/Pi/D7BQpZ7E0rJzcigrncdjxmxSZ83+QOrE+ITsV6Scp6GitL6iqODty7zXL1+/ePryaRogKT01KeFhzL2IOze9vG1sbE1NScNsPFS6LQggnhY88/HxBm2MiLgTF/cQPLGwIKe2pgKECCwY/v5wXzdAfHxwcGJkeGyof6Cnu6y0GD+GZxwQ4Ofi4mJra2tqbKJDVb7iCkF4wRSwo+C8yMhIcXNy7dqxkz6T2fPLTwL8vMePySqeO6usrAzTAqw0NNTH9iACcrd8cA0xMTG0HBhYKrZyb0cLtjSuhMR8OpoB5XilZcq7Olv7ejt7e7r6uoj3AKzHNYOVwwzk52Tlv82G15L1/Gk6Vcp/OzgIrAROq5KSEh2FxCr39fC4GxKC7UfWdEo8LOHrV5kvMmEi40FbHB3sLl++zMcvuH3HrnUZI5Jx/Om5fEmdqm2w8q++/YyVf003u/rxxx9B5eCjYM6BQWFBpGyEqvoLoTvgPIyJjI97+PhRCmmf9PoVfKzayrKm+pr+vq7RwQFQ1IV5JpHQWpidGx9ljo/MTY0D7N4tzn0APQcgTg78wRz8c3p4bW58bX5ibWFqbZHUf36YZc6NDMyN9iyM9y1O9C+OD86P9c73NK8yykp8HeqsrxVeECs7y9V0ibuRlPhztJqydjlwdLgdGQjh7L/LPpbCO5rJNV8mwqzmXe0j3Gd+VHR2WHQKjm2PCLNJcLlefOo17+xT0Y4Alm533krdQxVXuer1pRhGZybc9KYcdAvl+IvFWeqOcdWcYi86xZZ7XqjJRbsyyIFZkT3ZVL06PfqOlLDO0vWr9Fidn1+amVmYnp4aGcFigxfY09bGqK6uKi3CQ3z8KAmEw9/P19mJZEkB6Wiwg8dja2vjBIxysLOxscJykpGS3rFt56fWfZvoPpP/Aw0WPMdN32ym1+2vv+zh4eIGZQMLNjU08PH0CPb3Je39KClQXFjE3bD7d8JJBsvtELzeDg3zuxXk4R1kZuN5Vc9ZXtlS7oKdjKKT9BlXidOu0mc9AOW8ole27uL55ts9//jH1s2bdgjyC6lfUgUNp8osbXGPoF/W5hbXr14DYdS+dp1qCuFid8NWR4e067qqoa577ar6JRVQb0lxCWDQoQMHt2/fSfcB/umnny4onAO78nB28HQlaiqUrIA90NzT3SM4MAhXmxQXm5IQ/yg1Oe1x6pO0FDq0Aj7+MjMdDj6g41FyXEJsFECcTgnDbd67HYwbh20AjNhYm7s63HC/YR1gZpBqohOvKPX8rEDuObYipSMVWofLDfa3e/C0enN0BfO0h3K3hbG33GEdTBUcTOefeiM89UZgtlB4vlhorpRkCr5rEFluEFptFF2tF12uEFkoEBt+xDacyDUSyz38gGc4khdj9AH/aAzfVLLgVLrIQo7kfJH4Yo3kXJ3QQpPwUqvgQjPvQgvPcjv/fAvPRAPbdAvX8pDI/AD/XD/fwqDAHyNS/+ySnskXYaYdLXHjSbc75qEhZaahYKZ/zcLEmPKCjDHDwC4BAb7du3dvHH1/LjD+3zr23IBy+tiT0vOlkvy/+PpTk1liFA4cOIB/Y6Cva3uDtOh2trcDHQ4PDwcQkCZqpUXNteVVpfnlRXkkJeh5OnGaUhIB5SAOgYFEesXb25tyrEhfxMRYovFG95wNCAjwwcct36CgAHiLKcmJRYW5wBTSia2jFVAOSj4xNEQat/d144vA8eSkONIy1NpaW1tbQ0Pj0qVLSueJr3fixDE5OVI5dvbMaYWz8njPx8O7c/uOr78kLPXXPT8DymWkJY8flzt58qS8PDxHRQ2Ny3q62kQ70NbGw8PN19c3KioKN1VMzj8rYEsGezpJ4J4K+9B96fBpe9u6MmJnK2C9FT5EPZWHA0DEzn+UFE90d+NjaE0YeDBAUnB/7etXFRUVz507R3J7LC1cHR0Cb/kCXvFjoCGAcgysacArTJ2lpSUcWzZ2zi1bt9OdfwHlJOT1CcpJoR0tTv/Vtxs6LTQNpFn5999/Ly4ujo0HOnXL2wsGGDsBTpW/383goADSQp4QuvtJifH46/CpAOV1VeUtjDpw0rGhwZnJCbByQB6we3ZybHpsmEpoGVmaGl0Z75torZhmFMwx8hcYRXP1BXN1RTN1hVP1xSu9zav9nYvdzfNdDaNNpaPNVR+ZIx/nJ/45NbQ22DmW9XguPixXVaboNGfdBY46VZYWHfZmU5YeV85uX7axaL6xJG7mK4GpXJ6FOsEpBvdiv8jskNDMqNDcOKnIWB6WmGsXft8iNVPAP/dKpPcu24Aff6M5a5MBT50mb52aKENFpumCTJ7QkWKBQw1HeWqOc1UoCBSryy0kBI6/jPuzp+HdSO8fC1RZEMmXn6KDKnPTE7MTE8yxsenRUdwmFhscQaB5K6OOUVMJk4yncu9+OBY8HiIMPywxvDoMXV1toDkcTXNzU7xXVFTg5yUNQ9bJ0BdUPuL/CMrpfUdD+fe7vuNgYxcXEwFB0da6bm9t5+HmHhQAwxxKBXzCSFZiyO2QoNsB/iG3/IIB4lb2Pvrm3krXnBW0PGWV3aWVfY9eDJJVCpZR9JM66ypxylJcRuv3/YI7dvzy7TdbSZcSFlZlxfNmRob2Npbuzg5YmdjgDjdsTQ2NdLV1zEyNQcnBh83NTLS1r5F8RH09A51rF88rAsrPnyNpGMfljh0+zEJrBO3atUtOWga/zcXOzs3JEYYBfMuRKsT39vS6E0pUgBJjSVAoMSEuOSkBA1sGK58G9My0VEBHcgK2TlhggK+ri4ObqyNcH5JYGUYqAamWzfYu9jdcLUw9tbVSDDQfX5B6c463Rp27QZujz1Gw14drJl58JlmE+Vh4Kl1oKpN/8iXfQpEo+MG7eon3DPF3DWLLtcIYK3VCq/V4FQGsz+UJgIyPp/J1R7D03GbvDGTvuMXe5HGk0ZOjzpWtzp293ou93oe1NZyrI5J1NJ1nJItzvkJwtoZ3qYl/sZV3qYsfNHymm3e2l39xRHhumJ+MQYHVAfFlhlhXKmtnhOAba+5Uq5NBhucd9NXtLGA4SQEU0Bwm8/z5c5ycJHOarumhoXxDyPrvsXIKyrd9++3XGz2faB0AWijy559/FBESBi8Ay9PVuW5saASGAiYbHxcNIllZUsCoKaspLwSUv3757GnGY/jvwPEoIHdYCGl9Sx10gIHiCT19nAKig59Je5wMHKHRHBjq53sLnldU1P03r7OqykqBKd1tzUDS0d5u4Pj4UN8ASHJjLbxd2Gp7O2vc/wVF0PAzZ6kPKqX9GMYZ+VPnFRXgsJw8ISvEx7sTNwUU3ESUAoWFBCQlxcHWJSUlJSQkZGVlQN5hBtTVLl+5csXAyNDC0hqeKQAO0FZbUdLf1TLY00Fi96Q6iWS4431nR0trC4NuMIRX0NiG2orykvxiqlQEyxHWCzcSEhIUEkzUi4L9/bA3YC3IiqcyNc+dOwv7AVDwcHeFeaMKqRJJwVTGYxgA/HWAr5GREW7q0GGWzVu2rbuu/wbl690L18WM/upn+DVVC7ptx3Z+fn7VSxdJcxZvEgcI8r/p7+vp7+MFTP/UnfIu6RmSmpKTnQUrzKitaW9uApABzmanSASZVp4aG+4b6u8aHegZ7mmb7G5a7KiaKns+W5C0nBu3mpu4+jZ+JTt+Pit+5k3iGiN/raX0j+bSD01FEyUvxsrfkD6fy0ySCDg+sFJd9PH1o9fqx/NOctWc46hVZmnV5WgyOdLrwd0TwDqVSEKT2FEzJdyLjQLMFp75fsHZIYH5MWGMpXHx96PSK91if7RJzRUJLr4WHYzkGAnmb7vB1mbMU63MUqvAXS7NUSXOVch1qJTrYKMEX70cb6WCWMmVM2uvk5eq3qxN9nxgjpFkxNn1Gs7hflK9OTLQO0rGuv4MtdhIU1nY7LamhpLCnJcvnsY8jLwTHuLl5gwqAyyDVcYuwBtwKjxHvOpoX5M/fZIdpnfLtvVsvK82/c+g/PNMJDzszZu/ZWE5jN13XO6EipIG3EhraxdPD1//W4A2ioP7Bfj5hXt4hzt5373hfsfEPlTN4Kb8NR9ZdT8ZzRDpy+FSahHSqndklENAyaXkrSXkrh0/oXZUWp6DnWf37p8AB7/99huWJYyTjYWph4sj3WPLw8XVxsISOG5vd8MLaOpgZ2RkoK+vi5VsYWJIunSRLrqnr2poGusbaKiqiQiJgphj+eEXwjZgA5KOEDZW9MAixC/x97kJng1+B08UlCUulqhO0nKPdLAF2yfjUXJqQmxcdCTIB0AGNlJH57qDvW2Ar0/E7TD4lDdvepGu0zaWtsb69uoXo65fTFCWfKXEW6/D32TOORIkOhLFv/xKevmt+EKuyGy+EDOfb6qId6FGZJEh/KFd6s926Y+tMh8aJP+ok/pQI/2+Uup9+dH5N6JzmRIjsfyj9wW7bnF0eXG2uXK1uvJV23KX3hDIteR/ayn0xkIgx4KnzJGn3oNt8D7vUBLXfL4obMAyQ2S5WWC1V2SpTxA0fH5IkFqxgnOjQosjoh8Gjy5XSzVHsdT7CT415n9ocirIRM3VVNfxhqUTzLKtlbW5GWZeQUHhCCvLpk1bKEnaL9fD5f9ZwvF/I8Ciqwcop3j4N/Qa+vLLf3xN///Lf2zfvpX1CAv8R2CmuroapveGtY2Xp3v0g3vA1pL8t9VlRaVFuflvswHQcfHRt8OBYLCoTtbWlqbmRjdsLMCjI8KDwdazn2cU55FMDwz8/NM04D4ALDo66kFszEO8z8uFp1/R2sgAlPd3tRMoH+gdG+zubiNaiDAGAf4+cG9VLiqdlQeSn1FWVlZRUcErWDYWEFwVVWUlvJ44fpSfm2vH9q3wVwHoRw4flJQQO3ZMVvqolJiYmCD54BcVFcZNgVyQBErFc6pq6lZWVn63fLCkCnOyu4k043o+O6C8t6u5o7W+qbEOBLysKJ9W5c1985JWzst4nAJ+fS/iDti9vb29FfmwgN+NicJa19S4fPIE6S4kICAAE3Lp0kWQO6xvHx9vGsozn6ThN8CNId1KnR0N9Q1wSfv2HaDb/tJQTuuOEuD+BOWfd3ragHK6nvDbzZtIjetZeWwkD3dnQsYDfEKD1luCYUvA5ERTbhAeAXC8pqK0o5mBO50cHgY/HRsYGOzt+v9JewuwOLNsXXjuf2a6EyLEreMdIcGtcHcIBHcppCigCikBCnd3d3d3d3eXQAjEpZNOOtPd0+OTu/b3AZ0599z/nvTh2Q9Nk6Tqq73Xfte79l7rXRCFbKwtTk8Mo8Xqbh9ob+qpKpitSh9KYE5Hk+eCLOb9Lea8TedYZlPuJuNeVk+yg54Ux7yoSH5enrScGbqUG/uP+aG/r8/9aXXmp/nxD70tf67J7zVTHdAQmNXhmzW4u2LHvUTl2A7mfxTL+bZc5LsGgR8HxX6YAKYj+mFdCFg58JofsFj14w7h50fiH5cJQKbedQl8aBZ9ms3zKomw4cG5SRWc078zp84zLsYxKcw5Q+CdI/BOCXGPiXD2Kwi26St+6q39cX7w/aPlV9sbWIPWxZmJ8cnRkZGBfhiwlJOjQ/Mz4yvz09sb6Fjv3avn716jyiBwYEvzUxAmglXD4qLeDhFhLNSonobrn+Di4PADxclBV+c+QDnM+0FUznUYW4XfkFeOR1eHseZQSF0QoPzatStCAoJKiur3tcxNTF1sSCw6M8TXJygyHFhSjH9QtLtvAtk90dI9zcQjU5+eqU5JlSNlyDsWKjpVKjlUKpPK5Sxy5fRjxVSYKprOBsYUoqWjtZWNhoYGFxfXsRPHT54+JSQkoK2tZU0092S4AQdPiEE9H4CJA4Kj49CwUCDXrq7OEH+wPBkMVyqucW2sbwC27cVwdyTZa6jdu3btW9wCIb4XFBSEzUilOAL0gzMIDQyAuUuNj8/LyMD1pdH5fnYm0DIIW8Hq99G8tqK0MDcLolWAOWtrK3l54F2yRCIRCD660U2Mh/3l5eUJ7sSdSva2NUshGRdZqfXYysxQRJc8eF+nS7wqFv7boMIvozIfRwgfxwl/mkXpT3+cE/txXvyHKdEPI6IvWnleNwk+qeZ7UiX8rE7qaaXURrbIahJhJpB7xpcX4HuKKTjNFBn3kBhgyJRaC2WbC2eai6Qa8qZp3y4zuTnkcncliPtBPMebGsKrVn7E6OeEf1wX/mFT+I9PCUA+AMTfvyK8f05AdzzLEt8PyU2n8I5HyFe5KSSRtaJdbAIZzoE+LB8Myj3oNJhMNTW16ze+xeVt987HD30xlP/jX//865//AlAOeIdlMx7dI/kH8JpPgHLMnq5JSkreu6duZWUBQOPn5Q1hOzjP5rpqIKRjeN1mR2tFeXF2diZ4Ti8vL/CoRiaGxqZGFCd7QBNAkNrKsq7WJkxja2Z5Aam8DvZ2AZFvrq9DRfy11Q31taMjQ4uzM0APt1AXzfWX2w8Byt883XqAUhAHYdUhUoM1hngWBmCira21gz2ZZGtnTbS0BIJtagb8F1VRqqnABjh14iRsqzNnTgFTUFJQhOcHJAVKDpAqLCwMcA58R1pSSlpaGiwGJtTGxgaQFPZtT3vz5tI8RswfwPaGJ9l+uLK2PLM4OzWMZTXU11VhVUKlEIKgBLWCPOBI8MHdUBxKsoJpsjCD57S3IxEtrSCgUVVRkhSXgAHuBFwPPDO8EbDystJCmMOO5gZMRCIPomZwgeCr4FFv3br1a4/zPSnR/6Ov0C6U4ydj+/o58MPFixfhw8JegigVtZJJiE5PicfFlYBj5uVmFhXmw5x3trYAli3PTT3ZWHv9+NH7l8/fvXz55CHeD2MUgKwJ1ga8TWFuWXZ6UUxgcyS9ga7XTZHvtRLsN+MfMOLr1+Pt0ebr1Bfa9LXYDLZ/GuP2NIa+5Eda8qd+6qz8NNL2abj900DLp/aqT5VZ4yZKIwDl2jxzenfXbLmXnDh2ggQfRXG+Lxf/vpHw46AE2n7L4n9cI/zlifQvT8V/2hH5eVvkT5siv2yI/3GW8Kdx8Xetgu9rRZ9l8L9OEH3ozr1FFZ7TvbOgxjMsfGNU4OaCBP+imMAoL8cg3+1uSZ6m+/KfehvezwxsL4yvzaM2noO9ED+BoUE0Ug4DFhHioa7OloHejoVZdEcCDP27V0/fv3359uVT8GRAILDVLgfQSU6KCw0JALBDNeghqNcaVnzuBeAO3AKgHIjVbhuQL286cWivoBfP1MahHHD9/Pnzd+5wysioaWjaaBvQdU08SJQQVxdfL1agj08ElRFuQ0vWpqYqueTK0kuk6KWS7tXi9BppZqM8vVnZtUnZsUbGPFNSO5hPiqimZePgQKdR6TRnF7BPSWkJMJITJ05w8/KA8cNHALpNd6OFhYTi3U2x3lKR4WEh4LrAkADQ/bxYNGeqtRXRxMTEhmjNpDN8WZ7waqYGJjxcvHgLUMCjy1evKCrK29nZwL8ClxAXGZaaEJuZGJ+H6fRCgA7hOCYqgL5DdAimCGiOuiMV5WekJAK2wJNArHAZNbC4pKyszKDRU5KQWDy4FnQ360RmUBw8SJZB1obxZsp1trJjLmKLLP7vMqW+KyOGX7/PAACAAElEQVT8a1TlrxPyP42L/TgpCgT8lzmZn6ek/zwl//OQ/I9tsk/zBJ5ki26kENZSZdey1ZcyNEejFEZClFpdCe2uEp1u0p0ucl105WaaSr69nIc6r63MbRtpDkuhy/Z8Z0Jlv2kh3p1hcC0F3n5VIPyqWuBjvxhY7M8r4h/WBH98Ivr+qfAPL0U/vBL74wupj4+kvpuWftGlOhAn2uCvnOig5GWpEeBi749Vt/h4e3iykJyOhbmplJTEuXPn9hpFHNwvL/gyKIevv/3lr+iA5eTxwxid++zonQ1LbkMNLa5cuQIeEvVUpbkG+PjGRUVDvFNZWgQA1N3WjKvEwa4AgABECw4OpNFosNiq6ioaGmpEKzN/Py+wCbyD++hAL4AEQvP5GUDzualx+D47OTE/PbUwP7u8tLC5tvoEiPA2kgd58wTr0vTkIbBD2IdAWlksD7BC/KTbyckBiL+XJ8uD6Y7EFigQAjrYWqNaWD1dbcBNTFyQ7dy5M3w8vKrKKsBSASKxxFh0zCIvLw/4riivICcjKyEhAb8Bdk9zcwFra6mvXp+fefxwFaAcHbNsruFVf4Bu4Hsa6qvxbDDssBJpzgG/9vf3ZXowSGQ7IBHwhPB4YMowsYDaNtZWpiZGOve1YYD7gceGXQEUA+hJW1P9QEcbjM6WxorigrysTIAJCGy1NDVu3ryJ96/Cb7T3jsL/H1C+V3d3BLYoeF8HoP9eHnFR4cDHITDCJLaR/gy4n7LS4va2lqG+3uW56e215eeP1l/tbD16sLK+NA+/BIgHAC/Iz05JRhWDsHwp0WEZAe61AQ5dnvpTDMVVV4kHFPFZc55ZQ54pPe5xfd41suI6RWPZUWOFrDmoJ9mvJ7PuSlxzJy8xyEs00qSN4Zy51oSW1PQ9wQVt3nl9zhUrriXynS0vno2QOy+zhV4U879tFHzTzv9hhPBuQvDnNcmfHoh+XBb4cQmlB3ycFER5u238L8q5XxUIbidwPw0XXnW++4DEP63FMa/MNSPNNSvOuSortCpLGBa40yfI0a8k3mqs8bwse6KqoKOutKm2EjXDhI8Ey5aUjMAqOjI2NhoWAiYEK2Gr6e1sA0BfX14ASv7yySNY97XF2aH+rs7WJrB2CENhuYG0QtSJtRaKxsvTYDXBPXNz8+JpAvtQ/qXJiAfZsN4OGKjjIrkw2NnZz527wM8vIa9ioanH0DBg6Zn7GJvSzMzdTCw89IiBanYJSi7FMqwGpegRmegRudhx+chRGb9uJVaXvEudskOZnHmS1H1PQSljPQMbiCgQhjAZTk5OmlraN+9wHT1+hoNT4N59QxNzWxtbB3uSE4vlHRURCbiZmpiQmBAH6ImOvHGlFE8P2GVAm+zs7GiubninU3eam7WFJUFI5NSJ07gRAscEGkEi2QLsxkcjyfXcjNT8rPQclGOTiLoaIZ2vxKSkhJSUJAB0mFgg40DUAOXBQYLnAPbDz8+P5OTYj0L0YGRg6OPlHegfgHdShQ3uaGfNcLDzsjGNtNKsc1DpIYtOUjmfRAg/SeP92CDxoZkALv9dO4Lad52izxuEn1WLPcglrCcRRll3h5g8XXSBKqpwJUOuiCaX76qQ76SQZSefZSuXaiGdaiGTTlSMt1LyM5InKovoywobKIiZSAvaSNwN1xTopsjO0AkLXlzPUghP8/i+bxZ510X4YVTk+xmBP26KvH8k9PEFdrryQubHTbmdHon1apWaANE0N8UgkibD1tDD2cHdzRmXRaPRnZ0cybDTubk5jx7drwRk29c6/QIo/4Tnlf/tL/CKWAOLw5+F7Wx4nyf4D1jVlWtXAZcBm/wDkKJCVlpqcW5uXWUZQHNLYw2QlpLSgoKCPKRIHoMk4lyozgYGBgpKgJayhgY63h6M6KgwgI/Gusq+7raJ0QGUhT09gXUBRcIseG0nqpN+iCqD0Anm8x282x6C8sePIP4FfIEdCHNgbmlhZGQAIOXhwQwKCkANKgP88VCXyWS6uiJMJ1pZAGTjShHAawT5BVDVnM59GEiL5x46ndHVRQcyhro6ulqaigpyAOjwR/b2drBLa8qLl6cnttYXgZij0xVMNh11gBwbwgRYyrMyMhMTE8PCQnz9wLe6OjtTyBCGkGwhSoDv4FJQ+x4GEl+GgbsZYOhkkj2V6uTr6x0VGQ44DhM41NU+3t8z3N3R3dYEUJ6fmRkeHATuRPOe+o0bN1DtHBvbfoOxfQniz6F8v3Ro9/R8T4IHPjgvLy94FE8GPTo8JCk2KjsdGFAaXosEawFI3dfVOT02DPMPOP5yZ+Ppw1V0+jDUD/FTUV5ufBzQMlQr6OPjBdQ+zM87xpNa6m3T5aU376H4iCX1mCm5ZMW5aMo1ZwiDZ8VCZMVcclaPMKcj1iV5q0P09ogSYURFYlBRdFCe0Mp/u53v5pyS8JK60LI23wKCcp5luztbHkhX60WS8PNMgbflIhC3/tAl8aFf9JcZdEP147Twj5NCPwzzfxgQfN3M86ZW4Gkez7MMgYfhPNuBgssOd9es+WY0b8+pcM3L8S7L8T1QIqwoEgaEOdpF73bdl6+x0BlLiaxKjMpPQ2XiqUmx8XGo6W9QQCAwACawSsA2JurOAUsJk1NRUtzf3TExMryFXdXA0sPkTI8NDPZ1ojO00kKgkEDOgcdgSdxIUTYqLBgMz9BQH7jzkT1Wvvf1hdWeuz1F8I5rbBANwyIi33z02KWrt8VldDV0XVQNPFV1PZTvuahq0RW1WbLG4aLEVFG3KsGALunUBULStETSrHzslHxgj5Jns5xDgbpDtpJpmJIuXUrRyMjUlsn0wNbT29WVpqNvxiUgfeoSDwefwj19R1Mbdyt7lo09jc5ghYZEpqamAnNCKcURkX5+fjBF8K9gwoCb2NoQXV2oeHVbcFCAO5MO/ElKQvL82XOAGBAKCwgIaN/XpFLIQMkzUpKBG+VnZ4BtZ6ei6hPULjw2Ggk3YlAOMeJuV42UxJjocMBxBzJJS+seNzc3Jid35PTpswJ8gvraOob6BuqqahBVy0hJ62hrUWytPe2tYu1N2uhG3dZik3Z8Oz4iTyOFfiiQ/r5Y7F0Z4ftKsZ8a5D/WKOzkSq6kyQ8EivX5yFTZC1TYiObbSIUaiHgbSTANJZmmCkwjJYahIs1QwVlb1lVX3kVHwVFX0U5X1VJHw8pQx9bUgGys46KrHG2u1EHXGGNKLXkLP4sTf5Iq9KFC6n295A/d4u+HRX5ZkwQ0/9MLyR9fif/8XPqPywoPW6THc5XTXQm+NnIsB2OGkzXNxZHp5gozBpwYKJ25OdLngNhjr48gG35At994778L5f/859/3oRwX5cJLhH4Vjz+IU33UpllNTQUQCnxmSkI8LEwF1gqytgJlgAI0JCTGxMREwX4ICkS3QwDlpsYmQMkVFOTA7VAdSAH+3rAJSgpy66rLANDbmus6WhoHejonhvuBBy3OTiENwo1VQHMk8PTi6Xcvn715+eTty2ffw89Pd4Aqjgz0p6Wkenl52TuQwal4erpjF6pxeLMrcCGAjxGoSDgA0AeIrZmpMVgDfK7r168DQ7+vqQUhpImxITwYDJhEa2trsq2NHdGCaG4GaK6ipAwQb2NjA6FldVnx0tT4owdLqC/d1gMY25vrEEZMToy0taLGA6gjV1w8MHHAAsBuMzMzIyMjMzMT1D/I0z0wyDc8LCg+Gom9oIaQ4aGosayXd4Cff0hIEPAd4CCtqL60dWZkcGF8CNC8twOT/83ODgsKhH2iqqIEfmi/cTgsCgTveMz0OZQjHEftJtjw2sJ9KMe7pF+7dg0CEYqTA7xmYkwk2jA5GXgmYlVZcVNdNaD20uwkMHGA8u31xZX5yc62RsBxYOIQVgMLQzbn5gKfEeLBQB/PSKZjHsOshX5vylXqgYvwFlVkyeLusgnXA3PBB2bCczrcMxo8Eyo8o8q8M5oi0xriPVI8XWI8w/Iio3IifSJc/cKcswqCswp8Sxp8C9rcK6a8K8S7W678m0yenSDBnXDeJ3H8WwncSNioiPdto/B3rQLfdwi+7xL42E340EEAHH9dIrSVyLkTzbfuw7XJ4F8mca8S+afu351W5x1X4B2T5xuR4x9WEBrRkOrXV56g2TW5Uxoig9JCAmLCg2MjQoBBg0/y80VNG1ydXWAvEYmWREsrkq0dheIIqwneq6S4sK62enx4aHF6emtlaXN1cXFmbGp0EAlFNNTBnxbkZBfm5sAKYnncibAjYFuqq6tfwdRX8M7uu3Htl2pp/TuU43dX6H8PH2U/cfYut6S8qqWaPlNVh6Ws6Smr4SWpGSRHzBCjlIsH9grETBCyVgXSFgVjx6XCBoRdykSsU3g0vaT0WMoGdDUde3llXQNDMzc3OkC5v18wjelnZOkipWnPq2gtouWmZBGgTY4ydY6xoYUzfOP8QxOT0/Jz8suS03KjYtMCQ2KDgqJYXv5urkwIfAHN0XVoaDAuoc5k0GyI1gpy8nhz52+vXZeXk7G0MAGbAUoOnKCoMB/mDeKhnIx0mDGgSrhsBkTw6IAFJVMmA8SHhiCvAIxbW1tLVlb69u3bWFSKsulOsZ+8cuHy1ctXvjl/AXb02bNn79zmUJCSMlZXYRlplZMNKvUI7YY8sxTCNI130V9gPoh3MZx/Ppx/NpRvKlCw250vz+ZuuPb1KD3eaH3RaEPpZJKuj5mWq8k9J1NNsqkO2VTXwczAycKAamXkYm0Gw8na3MnGysne1sXJ0Y3qyKTY+5Is4ux066j3eimSC+5ia96CawFcD6O4wWIf5/HuVNz5fojwdorvr09l/vRc4i9PFf44pzRTJNyXpBpHkWISVZhORLqzI9A7mC4kp+5CBdsDs4GPudd5im1PcOXIF0P5v/71D4BypFe+D+W7qem7V6j7b3DhwgV1NRX4a5GhQTDpxfk5EG9WlReVFeVnpibFx0UGh/jDTvD2RnmpXuhmiI7Svc1R2zrwzzbWVvD0WAdx1FUS4ims7UNhc31NV3vT2HAfunqam1pdmt3ZQjmISCEaG9+/ef3u1XOs7+Ly1Nhobk5WcHAwjUaju9FCg0Ng40F0lpeVCQMvkcCr3WIjw/y8PMj2dqKiBHBCd+8itXvAcQgMITqzJyGpOSDREGO6USmwVPC/piZGmhr3YBCJxKioqMqSwpWZScDxxw9XAcefbW9CrLC6ODc9NdaBKQYgqfTUZLBmAG6AchMzUwMjQysrC4xxo4wd1A86MyUvMw2CSsBu8HMo6zIahfN5udk1FaVDvV0z48OzE0MLE6Njfd1dbc1ACeGDBPsHAPgqyMtCMIHZ8UE8QsJlLvbldfZY+VG8mAtB+eHjGNYf2mfxJ0+fUlBQAA4VACAVHYFE0vNyMGnffPCmXa2NsxMj60tz8Bm3N1aRJsHYYHlZUWZGSnCQH97WjupEQfWxSJ2OHshyD6PZ57oat7hojjtKrZEJD0liqya8q4Z8O5YS2+aS02p3x5W5++U4uxT5JoyVxkzVSyS5S0R5mpQl21Wkm2SEOyT4R+QEx6V5ltQEl7QE1gwF10z5dhxEt6lCT5iExyzCY2+hHX+hZxGEZ7HC3+dLvi0S/VAj/qFO7KdmyZ+apd+UCr8pEN2K5HoUwP+AzrNFFV6zFli1EB6/zzusJdyuItisIlyrRKhVkeg0v99sZ9Qb6F7sw0wN8A739fb39vLzYvmy0F0Ty5OBCSEjpT0I5A119SB+B1uF0ApIAEBMXk4uqoDr7l6dnd5YnFtfmMLEmXt7OzuQhlpRPoyS4nzwi2ADmDIoVVZW9vSZc3jRFr59fkP6yudQ/ll/YUTzjxw9ce6bG3yC8gpqtqraTJX7fjL3gsS1Y2Xty8QYzVIxU8JpS+JFjyRy1giRg3J+LSLWSQRdz1viBpJq5tpGZH1DG01UJW5Apbp4s/wCA2NdPKL07ILlieGC5pECNsnC5ExJpxxl1xxjj1xqYBEjuCAkoSoxpyk6rSYottgnJNs3JJ3mGUZ1ZTk5uoAXBGqCKWSFAnUDZw82BuSDg4MD+AcfHx9ghZ2tVUigT1Ji7K95hzBl2UjzKzkpbleANy0dotsc7HdAxcDk4HVUVFREhAl3Oe7AzsXk/Y4c/vrQgf/4+tBXbPh1EV5Zys5+/PzpM3evXjYQE47QU03TkizWIXTay7U7SrS5iLfSxDs8pNvdZRqcxeqcZfLtJGmKNw34zxuL3Xa4J+2sq+JBNHCxMqZam5GJpkQzI1szExLRgmJv6+pEdqM40J2daDDcqIBaGPK6+NCdw13JCSSDcjv1LpLsEk1m0YV/weXOGotz3Y/zYRTPdjrP+2ZxQPNPW0r/fCr/6anGL1PqM1mEnhi1eIoC00aLSbFjYkcrqHsGwxWoAzA/MTGxc+cu7Eto4S1lfguUIxz/x9/++pdfwKZPnz6Nt/rd7/K+p9OETOrs6TOy0jIw0eHBARBXAhyj9PCi3IKcTFiYyIgQ/wBvH19P1MnJzxclogYGAaoDm7O1tTY3NbMwMwcAhXlBQp1+vli1Zzi8Dl4g09xQjZeS93W1Iznc2amXT7bfvnr+7u2bH969fYtB+aPN1YWZSaBLSKMcNaeNxo7YcuqqKlsa6lsbG5C4VXVFTUU5sABAz9BAPxdnCi5SAyEM7FgqxRFPjUKS9p7uwO4BdtHpgSeqiQA0x58TbD0lKbmhugKgHED8xeMtGE93UDcZiBsW5qdHRwYGB3ramuprKysAecEowYe5ukK4hMpGQlGH3BjU16Igu6q0sKa8pBq1SC8sLMwvKMgDs66uqgBf0N/Vjjch6u9q62lvbqmvaaipho+THJ/A8vAkWlkICwqdOnUGA2u2/WaJ/5UaIkpS3P3fX6X49qRajh7h5efT19MB/xodHgKsHPhRdRXKfRzp74aA4MHC7PrSzNLs+PTYEOLjNRXAx0OC/V1dnOzt7WxsiA72ZJqrG8yPt5e7vwfDh2yZZK9XS7k/RFYcMxOaNBYc0eIc1eCZvCcwdo9/QIVnQFVo2VZ7jmryMSvyp9K0H8uzPpZkfZ+f+kNu6o+ZCX9OCB2+JzsiIzAlyzMuzzl7j39Gm3dCh3vcgHPCjHvCnGeKyDdhwzVqd3fU4fYii2/Bj/NRHP9OIs+LLMFXOcKPU3mfxQs98OXc8hBYtL27YMozpHFzQJNzhayxRDP5OS8a3vFdUerLgrS1jNiRpPCacL9EH48AVPACQZoLBLaeDLo7EzanK9Zs3gmcOIRuAOXaWvd1dO5bWJjBL8HthYWFAcQA9PR1tk0N9YMlrM5OLUxPTIwMt7Y04cXlZaWFgEDALsGcjI2Nb926dfzEKXC74Fax7saHfwOaw18/wr7fbOTwry2iEJQfO3zk+MkzV65cF7zDo8FNsJbWDJU2TJd3rBX3aFNIWiKkrwhmLIsmzfCz6kXImddlyDeEdURkdQxM7ChUGpXiZmRkoqWlbWNLZjL9WQHJdu4pqg4JUs75cv6tYsFdUpFDMuH9sgGt6v716u6F2ow8M68Ca79iM/dMI1q6oUuyATXWjBpu4xzgwgxm+YRGRAL2RkPohvIUnSiW5hbq6vfExGV4BUQIYrIa97SdHBxjYyJgitD9BNh/QR6EMkAj8vKzcnOzs7NzM9Jz0tPzMzKK0lMLUlNyYqITPT18iETUo/zy5ctAVPHDJXRlcOAwGlhvuc9jU9gRZ44c5ThzSvXbSzQZoQzzez0B5N4QUrOvaYq1rJfKLarENxTxiww5DpoKv4Usn76ssJm6AslY18nKzIVEBOB2JNnY2lhaWZpbW8CwtLOxhZiD4ujkTKGCxbi5udDpqAMGGIynCznI3iqeqFNvr9ViQhi3ElpxEFpy4Fly4lh0vrPieXcl+PZ2Fs/jyrt/mpD6cVrk5ymZ961yQ2Hczf6KWYz7XvZGXnSqlzvdx5vl7cEAJwF4qKqqysFxd78WAadouJz1PvZ+gZzWP/7xj7/8+U84lH9WZXQYrzrbV+c6fvykkJCQiYkRcJCE+Fhc7BsWJjsrA6A8OioM3ewH+wPQR4UFx0WFx0RH4qcK4NOAnltZWFpbEWGmIJKF90LtUVgeuARuQX42KqhBfhtJowE5HR3oefxw/e3rZyi1+f3b71+/ePV8B9j62tI8YD3gNYA1YGhlaQmWE9023NcNjGmwtwtp1zU1VpeXQdAALw7bFbgtNzensrIihAXwjqEhQahdXFBASEhQWERoZHQEPCc8OXgXDzoNltCF6uzj5QukrK2hYW1u5snWxutnj18/f/JsZ2vn4YMH68tImmNuen4GNdDo7WitRceneQB/QM+9ULNFj4iIMGAiwH/LCnNrK0rqq8obayqRbmJ9LYyOlkb4CCjnZ7BvuK+rrxvgswpwoaqstLysJDM9Izoyys3F1UBPHzwQrDF22LUnH3/g4H9RyPv/L6Z65PDFy9/AJIBdBgX6pqclQZALSNTV2gTYvTw9sYk6r05BVARPBYECrCl4ZXd3hp2djaWlOQQZYNlMOqplAIfHYrjRrU3DiXoF9rrtjpotxhJteqKN6oItqkJNykKNKkL1aiL1WtKzHuSpUPefeur/NjvwaXv10/bK3xbG/z47+mmq/1NnQ7eBRr+s0Ig075As57Aqf+89oTYN/kYN3hZtwWZtwTZDQrOBUJ0Bb60RT7st/4Ajz7KP0HoA35No4Wdxgk8i+Z+GEgDHt1wEZ0xuT+pyNctcbVDiXHC3mAunf5rt+bQ+9Y/V6T8tjK+31Q5XFBbGRcQE+sNjg1N3dCTj+xMpIeNldlQnZ0d7awtTJCeiqaGhoaarqw12An8Kbj42FmnJNtRUgqOdmxyFuVpBavWTfV2dwM2b6mrBYsGLhwQHOjrYQ+hz+uwZQBmswe4BbKUOfa6T82VQvjf2r71wpobdix49cOjUV4euHDktLq7iI2ucqkiplWK2qSYsSCYtiSXPy8aMEVxLBY1DD1ySPHWRV05RE7DbE5gLwwNQ0kDfxNzKwcE1yMknQ989X8I5n8+9VjJpWiRzQTRvDRi9YPyYaMQAF6NKgFYuyiwXp5cIU7IFyRmC9mnCdonyjskG9FRHv0yPkPTQ2Kzo6OTgwBBPdw8nBwrRiqRrYKmiaSEup0eQ0lbVMgf/kRifkJmRBrsboBwLB3OKMEJTWFicl1eRml4Wl1oRn14Xm1wdk1geGZPrD7GCM0NVVR3YPTs7+4EDBzAoR1n2AOXH2U8cZwf4OgaAjpfFobJYtkMnDrJdOnRQ+PI5K3nxWFfryijPihiPKKqpoQQH4eIh7pO/F714TJnnxn05UdP7aiQLUyrZzo1CprtQGK5UvJcF0Dg7ohUMQCcyyd7JngxQABgFFgIMAAwGsWkKyZ9onGim2WGv0aXLP2bAvW4rtEriWbC5PW93a9n59pLHzY2ou5sZt37slPhjr/gvvXIfyuX73O+0uCuWeZkHOJoBr/d2pwElBz4Bb2piZEwgEM5fuHjo8LF92bXPpPF2M9b+b3byX0P53//8C7w0zsr3qwdxKN/PjgAz5eTkvnfvHp3uBrCFXfqnI60VTAsiIz0ZYCID67yck5EKA5YQDB04C5JLZDDBb8McwUzZEK0B1nGNSneaC6A/uAHw3ijzCVNlKSnIBexbmB7fWl9++/IpXmQIsA5o/nxna21xDu9wj1e1IPXt8REYE8MDIwO94AYAygEWi/KyI0LQiTOgGC8vN+xSWC14EngLdEKXkpSRkZaVk5lXkFtYkANhclZaalJcbERYOCBpanJKU139UE/PxsoiqlF6uvPy6c6LJ9sQGDzeQWX6EB/AsyHBrKnxge4OQOcylNqQjnkFJDoRHRWBNypCKbS5WUDuKivKWpobu5HaSd/U6BA4HmDlSOe6EpXEIi0kLB8GTD8sJBQQR1NT89KlS3gJ+O6NNtvuvcgXQTksOTv7ET5ebksLMyAXMM85GengOcCBjA/1zY2hjkIwnfAszfU1eIDl4+0BqGeGJNCMIQiDhUMJD1hHLk8ajWZL9LM2THU0KXMyriJp19jcb3c06XIy63Um9rvZDrk7DHq7rGTELZVlv58d+Xlr9W+vn/z9zdOfn2z+srX66eHyp4n+VlOdbjnChAJhVE1snaw/5WQ8zbKd9rIfdrftZxDbqCYNDvqlFioZ+uJp97jK9O8MOwjNUHgeeQlv+wluevI8ZPAtk+4uWXBN63PN6Aut2mvMupn8WJX+fVclUi3/7vGHrdWni1MjrXWtFUVZCXFRoUEsJip1cXCwB7e0203GBWE6DuU2lih7FaAc/L2amoqxkQFAM4PBCA8PT0yIAwyCZRrq7QRuDtMFawdQ3tnaAjYG64UnxhkbG/Lw8bIfP7abF4y1nP9PkmdfBOVo52FymOgGDD9p2Tt4QaztIPv/9/uTB47yiKt6yhsny5PKpFwa5YOHJcJGJUMHFPzbxe0zhO8z/+M457mLHGqqmhBXod5D3j5ubnR7krOhuZMRKUDHJVGJWSwd1C4YNSoECF76SLByR7h8hy9vXShzhT9xkpA4JpM8LpcyppA0LBPXLxfTKx3aIeldo+VXpc3IMqYlOnklevlF+XgHMmhMZ4oLmexqbEm9b+SioOUkd89J1wLcfkBiQlpKCso1RMJY2Tlg46WlpcUlZegIPqOa6ZNh45psQ8u0o+UQqcmO9JTA8PzQ8DQPdz8jY1NObq4zZ87glg+uEaAca7DHhp8cYAIVqDkDOn45cBDm/QTb1zcvnFGTFvVwtE6PDEgN96OTLBTE+K6eZr96gp3n22vyUmKmhnq7HURpzh7uNNQgFbsKwupXSTAAlGC6AMqpDkjVleLkAB4fTIXmTHUn2wVYm6Ra3e9z1Ok1EBrT44GgcN70zoo15wrp7hqVc4Vx+0HQ3c14jg814m+qhL8rE32RLNlhf7OeIldMNwt0MAcoZ7pSwSuAgYGZycjIXL9+/Sj78YP/Hr1BnA1jD3v/21D+r3/963Moxxj9Ebzs+PChY5/LM4ENXb16XUpG2pHiFBgYCFYOnAWCpuLiwqKigqLCXBjAT6tKi6rKilHNen4ufv0N5h7oH+DN8oJZgy3k4kSxI1qbmhiZm5lYEy1hO6GCCw8mHfvy8PCIiYkCBBzs6VianXz9bAco+btXz78HNMdU6wBJtx6srizMLsxML8+j3sdYa64xwPHBPthiSIy0HKX0pYcF+cOLK8jJ8/LyApTDB4TfJMfHAMoDfKJy4aqy+roqPMG4sryiqKAQrK0gL7+yFOV1AFN99GD1xc7O8+1tNB7v4JWBL54+erqDEiUfbS4/WJ6fHBkY6e9uqa+uKS/JTN3N3vHz8Q0JQoCOur3Ex4EpFxcVtDaiQ5XZ0eGFidGh3i7gxQDxuTlZWDuYeLxFOsSr/r5+ttY2SKn81KndsAvb1bvdwr4QyvHw/PLFS2oqqmCmyAfHRVeUFDbVVo70dI4N9iK13r7upsZaCC/A98TGhIOVE4mWhob6sEZ2ttawZBDNeHt5ImkOsHp7OyDmLKJhuB2i53G2Rvl0cokntcqPXhPk3hjp3xofNlFeMN1U+3Zz+aeXz/768R2MP7159ucXO59ebH9anGw20+1SEBtXFhvSlF6iEzvoNp0hjI4Ir4YQj+pAZi7TIYViFWyq5awgTBK4EiR+uc1CZNSKf8tN/BGdsOnMu+HIP2fCsWDANaPHN2kktuNrux7N+Od48y+rk5/++ObTj9+/3tncXJzphaiqojQjOSEmItzf2weXuoaQHwaiWphKKvwAexWMED6pFhLtUUBdU7TuA9ugUByDgwNjYmLwpobdbU0wXYDmMF2wcM111WBFYP8QoYKHUFFRunj50ufNFH/VzfhtrBy7Edm7Pv28jRy2PQ8e/fqrU0dP8kuoMmUN4hVsiqXJFcqeXQo+nfJezaqMSgnzCIKaI9uJ21evcqmraoI5oXpLH19vL38m3Y9I9tIlhys6pogyKyXjxvhSF/hLtwWqHwvXPxesfsZb8ggGT+G6UMGKROmKbNmCSvWKQvmCfMm8VNa0UESXTHCHuGuRglOanlO0q0eUNwtYuTed5kGhuBtbuKkb0BR0mMoGvib24W7uUYmJuckpmamp6VlZObm5iJeXlVYXltal5tSFJNWbUtJVLRPVbbPUiVmKJvHaNsnuIZXRidXJqSUBgWF6egZ8fALYTT4i5gDlB39/4Kvff33gq4OYrhzbruAzphh6CGj7wQOwE65e/EZWQtTe0iyQBY/lqnNP9fqlC6fYD186f05IkF9DXdXc2MiRZAeU3MeT6cvyhOHlTvdkuIFt010QZLtSdvk4PvZYuasn1SHI3irZRr/VQafTUGzEQGDWEKCcc92Ob5XEDVC+5sax6c+5EXnnu0KxN0UiL7NEnkSJt1ndqrGRKXIxCSSZe7lR3CgOqKmDkZG0tPSNWzexxjJH9m5W2Pabo/4WVg5Q/s9//vNvf/3z51C+DxD7UI7nKZ88dYabl8fCyhJwGeh2eloKQDm6mEbXGoWV2GFCe1N9Z2tTa2NdXW01BFMAVUCBU5IArxLxzLbQwCCmGw0wwtBAz0BfFwG6tZW9vR0Jy+NzcHDw8fEBQKyvrgCIfLKx9ub5Y2Dl77979Q4wHavB29Ou29xYXXmwvDA5OtTf3YHAqAZdq8AeA0hKTYwL9PWCOEBSXIKbGwUT4AqBp8PvAcjw4/WO9ubeno7B3h58dHV0drS1d3d2DfX1zk9PrS7OPXm0+frpU8DxZ48QoD/b2YLfPH70YGtjZWtj6cHq3PrS3OzECExlb0dTS31NYU5mamICeCwUnTlR6G5YL11fv6gIpLxYU1He2dI4OdgPiACzBLQOIpvwsBCAg8AAn/DggMjQoAAfb5qrm56O7l5XzyOH9zIidmv0/8+zs/8XlMMXBKTcnFya99Th2cCfwfwU52W11FR2NNf3tDfDetVUl8O0QFAVFRnq6uJkZWUBTBOl7jrY49V6MFDHW6ozMBeqnbUbycqDbBPi5hTp7pLs75ke7FUYG1KaFF2bldxWnDvW0jDV3/14beXNk50P3736+O71h9dPPz57/I/tjU9z460W+t1KEgMKIp3qEgOOprlkk0yWc6YfMyWAlRrgHevFCKNT3W3MiGoKFmLcfrI8BVqCTZqcs1ZC8zaCc9Z8C1b8UwZc07q8w/d4BvREdkKd1tMCPm3PfHr75C/vXn588/Lxw/W15bneLtS5CWsmnhQeHOLv58OgI6Xr/cAZuDkFy/knWlmAEWpp3VNQUpSTkwOfZ2FmDn8UEOAXGRkJESfwEsDuzpaGnvZG9KrobjobnSlGgttz1dG5D1zh6DGsyPOzTkD7JT9sv/Xa83Mo36sewjb2waN/+MPxI8e5JFVdFPQj5c0zZKxy5R1L5Skl8g5ZcsTY62Jmp66KHjh04fSpi+KiErraOrDdYO2YDJaHR6CrZ6wJI13aKUvAs14ibYknZ52z+BFP2TZv6UPe4k3O/AecBRu8pZsC5Q9EalbFqxdk6uYlq+eka5YB2cWyZuUSJyVY9erMUgPnJDorHodyJ0cXAwMrEXGNm7zqfDJERT1vQ7soZ2ZiSlp1akZ5Vl5VVl5ldm5lDvyQW5OQUcsKL7HxLNZ2ylO1L1ayK1W0LpE1yVI0zzRwzKG4Z0YnlCUkZPn6+hsaGgN9xG8Ojh5m35cOxse+Xg1WAo1XwKC/ePrkqds3bynKyqgqKggK8J05fRLmDsb58+e5uO4CIGioqRvr65FtbVycUBdsPy+Wn5cH3gba24MByA7bBE8yge/uDFSwjaJShluQs32svVmFk1GbndokSXnCVHDahHvFmnvZlhOD8rsbPpybYZyvM8VeZBJepIg+DpZsN+eotpbNJRv4WpsynRzsiFZgaRISEte+vQ44juWnoYvJr7/+GofyfWm83w7lYN8Iyv+r8xqkK493Bzl67Or1a9ra2gxXl+jwEFygde8ILLeivLixurqvowOgsL+7q6uttbYSqaxgndLy0F/LzsLTS2DuYCNB/G5oaIjrmDs4ovYUMCD+ZbFYQGnBQ8C22VxdRPWHb168f/sSNQf47tWHt69hvEHqWjsA5cvzM31d7c31dcCy4S1Qc6zEhISY6OioME8POtHSiiAkjLTA1NQgYooICkoDKC8uAChva0LHHcDlJ0cGp8dHZifHZibGp8cn5qaml2aQcjei5I8fvX72+OUTxMqRxNKjze2NtY3VJVSnOj8OY2F2bGZyaGq0v7+rpbOxvqwwLyMlGZgrKu80MjIxMQH/RKE4g3OKjo4sKy1ua6wb6eka7OmsqyyDmCUo0B+MBnUEd3WGKfVk0PE6OnlZOex0ZTe58POM8i+F8l01j68PgH3z8fFYmJuCsSbERGamJJYWoKN8iCea62uw1i0FMHXga+FhgKiam5rBd1gRDzoNs3ImPCHitWQSzCSN6uhJd40M9I8LC06JiUxPiCrKTq0ozG6sKumorxrv65wbG97CGod+9+Lpu1fP3r968v7xoz9vrHyaGmq31O9TkeqXJzSrirfZG8VZG0bSHAPo1CBP92CWZ5CXp587nUYm2Rro2qjIhusqJasRilW4+kxEBsyFRyyFRsyEBg34h/UFuzX5unVFdiJdV3MiPr1c+/Tz24+vn32HBB5WVpdQUU9HS2Nxfk56ahp+OwfeiEGjA3qjKjLssAWGPckWoNzMzERbWwugHFX8qirj3dcC/H0jI8JyMpCqPqxXY01Fc10VkBXgCtnpaVFhob7ePrDQ4qJiZ8+e3TsMOfJriRC+j74Uyn+FbHSOgOkgHd6PrvZqPo4e/PrEmXPcYvK2Cjr+Ckax8iYJipZJsmaR8qaBMvfdTl0l/K+vT//hADv70ZPgZuTlZcHfmJqakuwcKS6eTh6xRu454tQCTo8G0cxVntxNnuLHgoVbgrnrhMw14cwVwdw18bJNscp1sZpFybo5sepJ8ZoZmYZVmep16YJlueQpKZ96PVapJS2J6RXLcvenOFJ17usKCoiePHnlwJGrV2/LyWq6GtiGOzJTI5MaY1KbEnPb47Ja4jKa49JbolJb/WNbbDxLNSlFyk7lytQ6adsKWetyOctiecsCZfM0Y3JyaExlelpJYnwKg8YUFhQ6fvwk6nJ5+Pi+WMVu0u2hY6h44jA7VpG+O1c4ZB07ehwM/sK582dOncZpKF43d/LkyQsXLt64cQMplElKAabD6uNNU/0hZsFynOC7r48nDJzBsLAvb28WbIEgQHMH6xRHsyI7nS4HzX4L8UkLwSVbviW7fSjn3gjlep4q8ixF6Fmi+KMA8Q4LzmpruQw7HRcDLaKhvrqyEg8Pz5UrV44fP77fRRnfoVgRz6F9YeTfclaOugj97S+wS8+cOce2h+P7156Y0zu4q+9xhP3UmdNSUlK2VpaoSWZoUHI86gaLUv0xDWWAg46WZoDyiZHhsaFB/FQR3fg3NwJJry5HVSdZaakhwYEAYdiOcqChamCmvx+qNUCVPkGoa1RYSCjQeWBVS7OTQMwBC/D2kiiV5cVTGECQtx6sT4+PDfZ2watmZaJzakz8hAWzj4ImFtPRwU5fV4+Dg+ObSxchdgYnHOjtHRsRmo2OsLPKi4sgcAYUa29uGO7vGR8eADRfnJ15sILUyfHsQ6TLiFqtb798DH5j4+Ha8sz4COqw3tLQUF8FAXxLY01Ha11Hcy3s85ryktyM1LioSEAB4EEQqqNKaGNjW1uSu7t7WFgIxCiNNZU9LU1AyQEOYNLA1eOlTIAdJsaGZkaGBjraCnLywClgkfabwO1fbeMW+aVQjtd5weIBK5GQEIM38qC7Bvv74M0VgWDCw2AKjpkpCfGwBOBaLM0tjAwM8fsMNyoFQNyN6gh83BpPwbazgccGtgIrBRAJwVZyUlxOdjq4c2D3rU21A90oOWd5bmprfQV8IaD5y+2Hj1cXtwe7v2+sbDC416FAGFYV69aW7aaYJ9gaB1Ds3CmO4MboLq5uVGcEr+Zmpga6VBODWDvzcqplG9VkmkWc97PaCCNthZMfhzs8CSKN26mN2auvhVGn04M+PV/99ON3717svNh+gDf9GOjtgGgDQp+C/NzUZFR1AFYHGxPsHHUUs7KAz4jaipmZGBkZ6OvrqqmpSMvKiIuLKyrImRjoQxSMy0jBv8xJTynKzSrGZiknA3XOjAgJho+PnK68/NXL19ARORsWJWO7Zq9E6OhvhnIcuIFn7jO1/VoBPDhjO3j8CPvlb66JcQgYymp6yuv4cknYnedQO39T5upt8UPs3xzARO3Bivj4+BTkZdXVkcqQrp6xiRWF6Balw8yX9qzlDeoRy9vkznnIlbkukLzAFTTEG9DP7dfNHdIvkjZFyJmSrl4CSi5ROytWPStaNiuSPyOcNCod3a/kU030L6V4pdAYwbZEsrqqBtdd7jOnzn/91eE//IH90PFr/BKGKvpMfetQS2qKhUuWNTOfyMiD71ZuuSaO2UaUfE37AgVymRq9VYXeLutQp0CqlbOpULApgwhD1y45KLomK7OyMKc4KiJaRUn5/Plv0EyysaMjXwzE9+6Q8JtPxLjxg0eAwt2zl6/Z4Ac8Kf9z/Xc8WkKd0Y4fP3PmzLUrV0UJIvfUNRCgU5zwBCeAdUAPpEfv4wXBnK+vr5+fn6+vN/xviI9XmAcj2tU+zcm0iqzTZqM4QZaadxCZdxRcduNfcefd8Od7EMb7LFnscTJhO1Z8zU+qmcifbyHD0pS6J8ovLsB388Z1cCf7ahyokBuJXeE4fnCvCdzh/wGU//VvOJT/J2j4XP4cn0EIJAUEBAz09GF7B/r6RIaGhIcFRYQHAwuG/ZydldHSUD/Q0w08d25yDAgv0F4YAH+Y0EoNfj0YGYFRJAYNTymJj47A+8kixxAbgycaZmdmAamfmRgFdvz25bMf3r4Cbv7m+RPUgOLxw62NlbWlecDx5qaGtNTk8NAwJFzu6ozcA5mEumtTyBbmxioqKkhi4tRJcD8AQxBMhQT4o+6ISYlArCB2BngFsgzOpq+3c3JiZGF+euPByvb22rPHG6+eorptGM93Hr7c3tpaWVqemx7oRqkLhVi/FoC+wtys8pL8yrLCksIcAESs+08gvJGqsgqQNVlZacAIW2sb2PbwMQtzc2orSlGDjppKAL642GhcSsKOCE+KzmqVFBQlxMQ5bt05efzUPpvea5a9718Pf+kBy36HFzDh8+fP8vMj6XkXZ0dAcwitUhPjMlOTYCB5kahICBSAiRsYGGhpaRno69pYWwGCU8ioug/8jZGhPgwLCzMH7GIwOHgfyhPwycTaXVZ1dzQDks5Njm4uLbzaQe5we215ZXJ8srZyPTepUluxSZZvREN8QF922NUi29Es0tnOi2pPsbd1sLEjmlvA+2rf1zTU1aEQzUMpdhkMcjGT1BxA7QpznUrxWkz338wJ3kn3G2KaTtAMF0OdxpL9Pj1b+fv7F6+fPNzZXFtAVVyDvZ1tsKxVleXgs4FZ411Q/H39gJUDjgN8gw3DALoKAa+GhpqcnAyBQBAUFJSWktDR1oJFYTFpQT4+8ZGRSDwkJTEjJRE+JnzYoIBAJp1hZQE4rnjl6vXdrlsHD35ekbvLGdnYf2MXITxhaU/sFD9Yw84Zdl+cDYj5weMH2M4fO8MjpUhU1CBfvinzB7ZLfzh4+vDhMwcPIC8CzhuYKUSl9zXUDfXBXRnqGFgaWtIMneNU6AWinnXc4cMieVuCOQ/5U5YlomcFGG0iLk3C1DpBRqNs1KBE0qhS+Yps9bJs7Yp01Yp4wZx4+oRwWKe8f+M9j0JbVoYJkaGlZUwQErl06QrqSIlahLOhOzb2czfvSqnpudw3C1Izi1KwTFGyy1El56uS8tSs8xTMMhTMcuSJhbKkqnuePeru3XLUJnlyHUC5om25omWONik1MKYmK6e6tLgiNTEJ1uLq1atsuNLk4V01UFyXH+txdgR496VvYJdfxIrVj3799UEYX311AKAcP3jBBG2O7Op1o4k9vLteh5FICQL0a9dERETUVdVMjIzxyyGIlCEY9XBnoOti7MsPg/Jgf79wX59wT3qsi12GvUGFndqwi9oIRWrMWWLKXWyOJbwSJLweKfw4RWo7RXIjVnraX77YQjBYi6DNc/3q8aNnjx9nP4KnV2JPwnYA2+Ns+4ri+PHR/4yV/1+gHJ+yAwcO/Cq6eBi1p5GWlrYhWqMkcUwZzs+XFRjgA7F5UkIikvVobpgeG16ZmVycmZifGh8b6gcob2uqb6itKMjNAMgG9AfIQL3QYqJzMzMgCgaIryotqiwpLCsqBMjLycouLUY62pOjQw9WFoGM//ThHcpjefns+c7W40cPgHrNT0/g7daA3gb4+bu5uQG+2NgQYTHwIiAAHXhOCH7B/fDz89/XuoekZd1cIYYK8PHG23jDM8fGRKHz0NLirs7W0ZGB1ZX5hw+Xnz1ef76z8fLJQ8BxQIftjbWFaVTOjlqJ5mQBfnl5eXp5u2PBRCAAInyi0JAAcOZAV3V17ivKK8hISQMVAtRwoToH+gcABGBHrlU97c2tjXUF+dl4eVFIgC9ABjACKzNTMCYIh8+fvYCv4oGvvoaBN3jbLwvaLxH672aw4Ie2e5gCVnTmzClAc+CeOBOB2Qjy8w0K9AUzRTW6zhSYNyUlJXB+EJiDg9HX04EBO0pVRQn+lZKiPACfqakxmUz28PDAezAB58VVc4uLCirKi+tqUf/i/u6OmeGRRyur22sr8+Oj/a3NFTERnQHMOiPVHnXRUQ3RQR2pCVezSmeLbA+nEDdHGpnkaGtrYoDEr+XlZOCtnUhIQy7Jz6Mg1KclI2awMGmpsWCrs2y7tXirMqXDy2bMy2oy2KEzkvlxZeTjs83HGyitCN4XeAOsVGVFGVBycLvgpRAEB/p7s7wc7MmA4srKinIysjJIRU1SSkZSTEwE5uTOnTs3b97k5eGCd9fX1nQk2cCWhvkJ9vWFZYJ/DtYOIA6+WVdbT0xMAnCc/diJg2y70IApjH+Wh/A/gPL9bKW9Fhb7+Su7wgyIkx48euBr9kNHLty6I87JI3Ph4p1Dh06yHz15nP0EOyasCIB36fwFBRlZIArwqe1JTtZkhqlDiKJNpKhTnlzUiGDSPCH3ISHzgUDEpIRvv6Bdhbh1qaRNkTi5WMajXsS3RSJ2SDR1TDRzUjR9ihDbJx7aJkwvknbKkLUMllC3vnWXcPnSt6jjBHYtv69UcOz4aSGCvD012COwxNGn6r5buRKlSt25TtG+XMW2VNYkR94kV8GySN6uRp3eqUxrlwEct6+VIZbJE8sVrfN07TNDk1oKihrLCsuT4uK1te5fuXQZfV4sERPPEdrrinP41o2bKgrylqYmxkYGsJJ3bnOcO3P22LETePMcTMMGL8v4rHZ9V5OObf8eAjjy6dOnL1745ua3NwT4+MHOASvgBWGDODrYU6lUwBaamwsMFtPdm8n0obkGOdtHkwyy7dS7GDrtFIVSomAvS2U6TH0xRn0pXmUzQ2MzQ20tTbM/QI0mcVr6/Fe3jx049vvfH90rC9mPlfFDFVhivO0UPn77WTkO5VQnCn7Ash/oHcZimX393H2jPHHiFBcXl7a2tp2dDTrkpbuB+wJoCw0NBkINm7mlASmYr85OQYgNCAhQDrsLqGhpSUFKcjyQI6CuIcH+uIJ5dVkx7Dog7K2NDTDgh9rKsuryMsBo+HlqbBhB+Xevf/rhw/vvXgGmo/xuiNsXZ2YxWavG2irgSsDKIXZG0itUKp5tRqU6mZubQvx7/vx5dvYjXFx3VZQVrSzNYW2QuhUJDfjBxYXq7u4eGRmenp7aUF871Ne9ujT7aHP56c4DAPEXj8FtrG1tLK2vzI8N9/V0tBYX5aGDEZaHk5MDiWRLJpOo2DU3kvECR2INgIzaiqqpqWlqapoYG6JmHUxGVFgoIF1VWXFXU/1Ib3tfZysQ+bzcTJgBiEgiQ4OCfL2AngNZBlZ4+vRZ/FIbS2vblcHBGoCgwPDL2/7upjft9ZlEG+DUqVPAYri5ueVl5QC4UQUsydbejmRiYgJhuJiY2N27d8Fh3759k4+PR0hAEAaYOCcnJwcHB3wXEhICrAeiB3PIoNGDA4OiwyMSYmJhZlB+an5uaVlhWVlJY0Ndf2fn+tz86uz0eH9Pc2V5oie90IlYY6w+oCU5oU4Y0RJfcjEZ8CB1hHum+9AD6FSaI9lITx9AFp5BTU0F/LG3Oz0hLCQ3Ka6zpmSivXZzqndndvjBQMtMdU65J6nfjzwU6FQf5LIz3PrdxvyjlVkIBcBTYhfgMMPZ6Mo9IR67O4kAVsVk0MzNTBQV5eFzcdy6DVv322+/BdJ3+fJlsBNwcidOHDt75tTtWzdECELgvcxMTOEZICjBbcbCwkJXV1dUVPTOHc5z5y7AvOLJgrBBDhzYPwxh/zyl7LNLji9ar19VMPF9jgdku3VDGHRih59HYTufPPnNhfPXvrlw9fz5b65evvLtlasXz50/ffzEqWPH4QOCX7S2MHdzcWUwvajuoRa0ZBGLaC7HQunEWb7URd6MVbG0VeHAIWn3diGzXBnzTCXLDEWrVDXnIhl6lWJwj3hwr0zsqHREv6RPo7JXuRw5XtYiQFDR8sK3AkeOnT9y+Dh6MCx1Er6Am6Pz6FNnlBTv+QXEx6c0sqKbDd1rlKnVatRaJbtSZasCFfMcTasCNcsCeasSDedWVecWWVKNAqlW1roch3IDx5yYtM6y0laA8oTo+Hvqmt+cv3gU674C74VXYOHQDIQaYDfA0z07OSE+Kpzh6gKYriwvJ0oQuctx59KlSydOnNitvN1tcb4X6eyrGrEdwncWrmUEccyZEye/OX/h22vXwc5FRQkKCnKwkfErPSJsE1s7FKTa27pYGTON1GIs1RqZxnlEOS/l24k2suWemtXe6vUBao0Bim3BcoOx2s0B2jocbBf/8LtzbAfZEYoe2RfbwF01dsBy6D91m/oV038DK//X3/6+f1a+q72HEfD9vOb9G3k27Azu7NnzEI3q6OgAC3bC1Oi9vVkAiEmJ8bCH9nOWJ0cGRlGGYBMALiBXUmIskHcvlgewG+CwmRkppYV5QOEhFgYMHR0cGB8eAsQcHuge7EXN7OGH5YXph5sP3r1988ePH9B4/xa1hcN6UADf7+9qh39eXV5SnJ+HpO4SEqPRnkWd5kJDgtzcXAwMDG7cuAH7k4eHS11NxdLCzNaGCICO+hPq6evp6RkbG9vY2Hh5eUVHRwKJgydZXZiFl3/2eOPZ9ubTRxsPHywuzE5MjA60tjTUVJdnZWXExcX4+HjhjWPg31pZWcEy6+pqA4vUvKcOOG5hbkq0tILND24cKZKHhmSloaxNiEtGe7vmJ4amx4a62tGcwHMX5GRmpiYlxkT6sjzBE+xW8R469rkJ4oX72MHfb8EF/KIMY3b4WeGubwY7uHDuPBg9QLOIiDDEmDw8PEBLL1xAGhewLY+dYD+Fvs6cPnkG/nMc+4IwFrYQzKqIMAFgQl9XDzWacXEFwuvvhyKzqKgImCIY2VkZYAyDPZ1jfd1AyeuKC2Pozhm2xmV6Kr2akp1SnG2yPPOOBqOepLnsqOr4kMQgb38Phq2VpYa6qrSUBEA5WBcQIoiBMpITwAuO9nXMj/VPD/U2luQVxobEUazqWPZ9UcyacI+VnoZH82Mzwz0Q9ECQBx4F/AqQBqDSqGmCOxMIB8Rk4FzlZKU5Oe+cO3fmxLHjx46yAyNjx74wkGTD+R78wflzZ7g47xCEhCXFJWSA70mKw9Lw8fHB/GBTcRL3i/vleLvZhxh8fzbnR3cT5r5QIvFzFUwcyg99JtCFuxAMhnZJHDBxAHFYSgF+XkFePu47d29d//bG1WvcnFwaaupgV57uLH//cFZImq1foYRTJq9HvWTWqmDeJmfaknDcLJ9HqyS1VtoyR8s6i+xeTvWusPMq1WGUyFLyRSnFYm7lEi4lSrRCY49cbVKomIr15duih4+dR2rsbOwYyO6ycuyi/gi4RmNDs9jotJS0avfgYm1Kpqx1uqJ1lrJVppplmi2zmu7XYk4pVrXMViQWyFsXy9mUydtWytlUyFmVyVlm65GzwhKa83JrC7MKo0KjFeQUcXKDTyCetweTc+LYSSCUzo4OVQV58yMDAx2t5UX52ampEUGojADYiaYGUuOCldqDzsO70PnZFy4mvA/lMJlH2Xa3G9gGmPr582fBzd+6dYubm1NCQgyibQidNdVU78lJ6Uvze+opFNLNfDQJiteOSF5lU7p9RPHmAWWOr9Tv/M5S+OssF7kCpo46B/up//gdxG5H2Q59bgOfry9qUbKbbPpvaI7nzn8ZlP/zr3/ZP2DZvUDYg/L93+xXgeKzicuXGxsb4uX4AZgOEWBWTUVpR3P9SE/nSH/3IFbI04Dq28uAH4WFBgO8Ojk5MZl0YOUQ+AI57e5oBhwfHxuanRxbnp+BAHllfnpxZhJINzCsB6sL248efv/uO8Dxn378+PPH99+/efniyfb68gKudQ6OoqO5oQXj8uVlJfl5OXlZmRnpqcCCAVkAamH7wb4lEIT09e7b2VrBfgbvCvQT/BD4W/hubm7OZDIjIsLgIfs6OtYW5x4/RKcruEY5PMDk2GBPd3tVZXlhYX5qanJiIirshM/r4Y5EPGCfQMCuoqKE9ycCKke2t4MJgXcHdxIXG5mWFI93pO3rbpseHliZmVyYHgcvhTqN1VQCVc/LSk+Njw/y87WzsxMRFT8Nq7BftoslWqEDLgzKf1sH9/2Wr3vq84fwClLsvujocfZjOEYDhYHvx44d/byT1P7B2v774ld57OzHz54+d+3KdQhp8UwA7ILX2tmZQqfTWSyWn59PTHQk2ENzXXVfS1Nfc31DUWGKJzOXbFWip9qlId0oylEjeWfEXr+TYTuRFd2cEZsRHRwd4ufsRDLU05KXEVdWkrMimrm6OoNzzs1Ihb0K1B58ISx3amxUqCeNYa4fRzYvD2QUhfss9LUsTw70tjXUVZcBYwBn7u3luSt6TLI3MzIGLysrIyXIL3D54iUsYf/w/nk03tseP6JGJ6w4+h5Bd4bIj505A9E37Gpg6ydPHMMPuPai4F0d+V+3HOxJ3Gt+NvZD5v/2AcvuudnnrByru/61iB8/HNjjbmxAJ69fvSYgICAuLi4lIQm0FMIobq678HlhaawsLN3dPf2DIr0jMm2DSqTo+dx+jVKFDwhl2zyZyyIxUzwutZKkMjmzVEO7NN+gqojoKq/APAvnBDXrCCWbaEW7OPiuR4kjMeIs7b2kFbWv3LgLQIfb5z4kYVZzGL9opTo4piZnpKYWuvskmVPjNSwjtaxj9G3jTUhxrKDKqLhmN/c8E/sULWKymlWmqg1i6ArWFTDkzbP0SGnBMbXZGZU56bn+vkEiImK440R4tNuNHj4v+5lTZ+HzMt1c26rLn68tL0+O97Q0grEV5mSCtcRGhvl4egDsXrlyBb+Oxm+lcRzDnvk/98/cTTE4cOjrPxw4+PsDh7FQGIUaR47CwK9JL168fPvmLc67HLy3b0hx3TBXFA2wvG8ixnX18P869dXvTn/9uxO//91p4OD/8TvBU78LsZTLdDNSvnnq5P/63fEDB4+gHXf0s5PPw/uno2Azu1D+7/eUXwzlqEroLyivHOto/BkH/3co33UUmOXDvJw4cQrWDIgtgKOvjycwIKBCgFmNdZXdbU097Y2dLY1APKurKoqLCvJycmOiolksD6THYm5OpToFByFWXl6S39Zc193VNjoyMI8UZZefbK3tbK48erCysbK4vjT3aGPt6fbD714+e//dK6DkP75/+wOWibj1YBVwH53C93WBzxgb7Bvp7+nv7gDm21SHEn8B04Ehuri4QDgMATTgrDXRnOZGxbUlHR0diUSimZmZpaUlmUz29/eFeKKpsX58cHBrfQVA/OmjdeDmGysLi3OTSKi6ogz4eEpachpWxYpaqaWnpCbGAVrBC6LmWDr3IWxXVlYE3gc4HhLgnxyP+mcWFeYCWDfX18DH7O9qg6edGOgdG0QdeXo6WnEpj6y05MTYGG8Pd0BDjjuceNugvc5B+HKy7Zvdb4PyvSQtts84yN654QH8XnT/62scyvH71d0Ur4O/Fo7hmtq4diaYJpAXMBsgYvz8/FJSqKsGeEcLCwukP+zOAGdWlJvVUFHa01jbUVVeHBVW6cUotTRs1ldvuy/XpK807efcE+IxV5U30lBemp2UGBXibE801VRREhVQkRaztTRlebonJ8WVFeZBIAOTVlOOOgiiXgeO9s5E0yAnu4LwgNqs5Om+trHejgog5BmpQYG+TAYNeJm+ng4E4LLSMkICgrdu3Dx/9hyupr0rU4XHOp+pVuHtVj5nbTiJw+eF7eDXh/B6/F8ronH8/wys/x3K8eX7cig/9LmcDsb0cdQ+tF/5iecj4xlKMADKr125KigoKCsrq6SgqKQoD8GHmChBQkwcoBx2HI3O9PYLZYWmWgfkqHjliwTVS2VNCxes8GctSsZO8bvWStoVy5kmm9qnh0TUxseXR8cU+AZnuvqk0P0zaQFZzj7/u73vAK/iurb+3/9i1CuiqCF6F010NSTUhRACBKiBeu+9od577+2q915QAYHoxdg47kkcx35JXpL3f++9xLEd13+dOXPnjgQ47sFG9zufvtHcuXPnzpyzztr77L12eWBMYWh0RnBYvLOLh46OHp44TBkh25VmoVxSCpMfqOvFmOj66pqG2uaSMkFqblNSTltqfmdB+VBRxWCdYKKtfbq0vDczrwvsOz53/Ixv/THPFlOPNmO3FjD3M16lqTkddTWdNeW14aERtDCTmJiE+BIx/EyCYFIS6HWwFGGInDt9qjI/9/bMFCMsOjo22Ef0jhpqasqLczMzTtmcXLduHRU84LKmuT7PjilhoCcrUcc8MhlxYBwZL2TmZkcNjU+SBeNRVVm5deO6A9s3Gu3XPKGjpbN5zUoZCQUJMTlJMVmJJfLiS+T//f9sXyaWcMGqMNDJeIu6/L/9H+klS6TFpPhQLlrlomj+GJQLUwK/CZR//vnnFMqVFJcyAT0SvEU20bqNkNmRDioujh8pt2nLZhBbfDAjhUQlNtVVd7YKRgaJ0uH4SC9wnOZ8AuLBkWHq+vv705LKPt6esHpLSwoa6qv7ejvHRgdvXL0Mrvrum68xK42EDgPNqYI5oPw/3//tX/5Aglj+9pf//CtTMvg3bxE9ljs3rgEW79+ae+XebXz8we3rwEo8UfLVrc1gc0FBQYd1tDdsWm9qbuLt5RYdFQY2HR8fGxMdSfO2gwL9oyLD83KzweWZep43f/Pmq++/8zbQHBfw2ssP7t+5DkJdXVmVl5eXk5cLNMck0drSiNbYUFNdRWTycQZi0JHiouaAcvzLOlXqqvu7O8aH+nFJ0+MjaFNjw5jhJkeHQC3RQCJwcqIrmZMdGOBnZmamoqYqtMfJi0vRYoj5N+V37Hm4eFs++xDGtEozWXMMhIuJ4VuwQcT+aTVRGi3Di6bg2A318TFRXySOivrfl69cobZKfdOmTZg+gSYXzjuGh4aVFRW2NtaN93WCPXWVFfZkJBRfOFN+0rzc2rjU1qI/PqQ7K/HmUOeNiYGOpqqS7JQQV4cIexufY0aOpoYBFxwvRkdUlBRifGIiHAcfLy0kMoTMykR4kH96XExrdfloV9utmSnc5LqqyrzczMAAH3u7s/q6elu3blVXV1+5UgWXJiesq0dnJk5vkvos2cLK2CdJyyoSzWgaJ04hgD/XMUArStdiQFYEu1ISwvIgrHPs20L509+dn/ErRbFGVVll9+6dBgb6lhZmMEEsLMyOGukbGh6xtDS3szsbHBwcF58Un1bol1xxOr7CKLHxSO7w/uLL+0uuH8m/uTe4V9+nzdCx3N67OiG1KytHUFhQl5UDWC/JyCnNzC1LySiOT8wKj4gNCyP1AMCB9PV1V61SA3wzNUilWHeTpKSqquoZ21NZqUkCUkeiprGhpbquraauq66hp7N7vKd/oq9vordnpKO9v7l1sLFtrLR+3De61i6g8ZhHralrtbVXpVtQeXZ+e111c0VJqbenz/r1G3HyJb8Qk3hhiQwT9QEMUpSVU4QxKae4Y7umi4NDcW5uSz0M3/b+blLiubtNAChPS0o0NTHC9VCVQS6ai09fqOoZNXQY20yepLWT4DHOkGWfI6urw/zFY9ZYpbJ35zbtvTu092ge0Ny2XkNtmYI8fd6ykhIy//5v6xQlz5vp+p0yPbBORf6Ff5fF+F0iOb/PPCFsQZoH7pw36ZtB+T8+/hBjA/SKxjlSBYkFi2zcb+N0E1XV1XT0dJ0vODERftmgRN3tLaNDveMj/f09rYD1uqrystLi/DySoBESHAh2ALw7cdyaFISNCMnJTgeaNwvquzpbp8ZHMK++8dKDX70OMn6flosD7/4l0e178a1XX37njUd/fPftv7z/7v/+6Q///Reikwigf0DiHWeB4L+8fwft4d2bJA2d5Pn1dbe3USjX1tXZsm2zxTFzXx8imA7rAftxQXjSSYlxaamJ2AaO48rB8X/58B7xrrxLalr++tVHjK7ptKC+Ji8nNzk5OSsrC9yc1G8b6iOMuqcDVw7qjTNgYjh71s7S0srW1hZ2PW4IoLy9uXFybHju8hQshqvTl4Z6u7paWgS1tbABWxpqwTTRcPLC3Ky42OizZ07DYATTYYOTeJaQMP5U6ltAOQe79DyMQ1NOGAUhyQWbCsOW2czeebrnQkVGNtVwvpXGrsVTVwzDbPATAOvqair6ejr25+zw04pyszoaqocFNf3lBT05yZVBXnkX7BJsLGNtrTJ93YsTovua60Z6W1vry4szkqLcz5eGeGe62gfYWAU52cWFBTfUVMLOGujtaGqsvRgf6+vr6+npiTk4KzMd2D3Q3THS3w2shyGWnpwCk+iEtdWhAwcBbfgZXIDg/DQrnl3CubmZJHs6h5IPsjEjbMQIX6eQ3jd6P5npkIgMs6U/qK+cVmcWosB3hHIuz4P3rhQXY04dPoDUZUuVtm3ZCuvzmKU5zJFTp2ysrCxhJJmbm2Lby8sjJCQsIjbJNzr1THCyoV/iHt/UXVGVelkDJhmjhhHdpv4CE+dia6ccV9+CkLCslJS8lOTMnJy8wsJCkJikpBR8HHfez49UXsZNdnV1xnetW7MWTJleGyUBsNTxbkVxQXN9Nak1UVNdW11XV9tUXydob+/s6uppaWlpbmI0tRoFbe09Dc39JTVDifmDjkHVZ/0rAxLb0nI76hv7BY2tGKHHj1nB+qcmoCzxzZOVSXk5GUA5iDlurLyswrpVaw109ezOngOCRYWFpiRcTEuMiwj2P3fWVlNTk/VHSUovqGQ/bzrkhDGEmUSy0nI0oZSbj2lkMLWB0OhqCui58jIlgLiCHC5KlixfypIrlBETU5J4Yf0Kua2qSmpyEnJiL0gzMePUsfPVUC7Ng3J+tubXq+3JKCNyUE7X4umQxjTFCS2yK6oSJKaVDc6XkwVKAppjY6LyszMA5eCYg32dIObdHU0tjXXgU8Dx9LSU+LgowLe1tbWRkdFxK0s3V+fgID/AKFAMFjET9NI/OzXx0u0bjx7cATTfvTl379b1e7duYgP/AqNfuX/zd2+/+od3fvU/f/nj//zXn37/H+++++u3Ht67fefm1Xu358CmH969BXp+/crUtZlLmE4wkVAox2SzTXPrseOWfr7eqSlEOgYmAo1qyM3JKMjPLi8uoLLp+C4wfZz2P979DVg/oPzhretXpycwIZGom9TUnJycxsb6vq72mUtjV6YmJ8ZJDby6+qriogL0bwcHJ0C5jY0Nunt8bFxVZTlA//LkOGYXmA64qq62ZvTskoJ8THv40tqK0obqiuryktTEeNBMo6MGMFpxn4mrjpSS4KWHUDeLOMv+eOLDX6/GmAQXTkq6L7opSZBj/ZtsFBR5lkRDVQ5NQpIrLCcrcsiyKCYtgjbGgUvhkhsSFAqZr5NQUV6hq60Dbh4bEVpbkDVaXTJTUzRdntebmVgWFRbh5OBnZxvk7pwYEdZUVd7dUt/eWF2ekxHh6lgU5J3m4uB73MLf/kxCZBgoQW9XK/6WFOcHBPgRn5iHJ2PCV4CCwaYe7OmoKi3MTE3xdHVDbwRTU1FRY+xT0drAvIhv0e+S4hvXbHlr5lYwoCFH2QzVt2KnN+YWcVYLM03KcFAuySxhUdlhbuGaE6f7es4xKZ4evfQTGTqNSVgAPYC2NRqrtQ8dtjI3Ay8GE0dXNDU1NTIyBEl3dLDDAPTx9Xfx9LW2d9Y/abf3pJO2T8y5HIFzfu+5hGb7yHpbn4Kz7pkXPFO8fOPi4zNSk9NooR/YrAkX4/x9/S5ccAKCw5alElQwQPfu3UuLHFA7Zvny5SbGR2GS1lWWgawIGqrxjGqqqhvq6gHfXR2d7a1tGOzA8rra6vraus7ObqB5a+dIddNIcGypd3hBSn5LZXVnR2ufoL4hPDhIT0cXT1BMTII8FJK4LwXEBB9XUlyKJ0FlWBgvn4KysqqGhobW7j2GerrGBkd0Dx3ENCMvr8g6BoVR/zzZYfY+0xAPLtwDv4I8fyZgBo9SQlxGGP3CEmS+/jCNEF/yixfEl0hwBfxwYcROEn9BVmKJjPgLAFAFGba6Ome78B1TdHlcuC0t2v8toJzTYKE6ZKJycgw74ynzyfB9PcRjLiWptHzpvn37aPZNQU5mVVkxEasS1NGnWFaUn52eBl4WFOh77uwpmHuGhoYwfsFhoyJDCUdOT6koKa6vqwGJHh3oHe7rGiCC44TR43m3tgja21qAgONDfTMTI6DqoMz//V9//OB//t+f//A+iDloO/AXwArTm4QzDpCsS7S+7rbWlsbs7MzAwEBdXV3Nndutra3QBTMz0qhuTGtTIxomm5ZmUhx2qK8b8I/JA0bAe+/86g/v/ZaUpnvtlduzMxPD/Y21VbQOYV1dTV9vJ468MTsDCo/vBZTX1FYUFuSFh4UAyq2srC0tLd3d3SPCwkmdoMba6UsjuNH3b12F9QBeWVdbCS6ZnpyAlpuRmpdFtgMDfPA8Vq9epaioyGe+IgbBNgIZnNrOt/GY8xgBlzfIJwiSItkmmfk6bfM10DlGz8s+JejGVj/h1pHEly1btmf3zuMWpr5OZ4uDfSoC3WuCvHuyUiqSEyJ9fT2cndwunA/09UHPaaypaKwqqcjNvOjnFWp32s306HlL0xA356ToiJam2s62porSAgCKpyfurntkRBgpEV5fA7MG1A9vxceEuzg56hzWBpxhYPPBmosheSyqR5qzVOZLVj22/QRZK9EN4TtYKJ/ix7HM41/fmJWLtucHq7EhdCKXC8P9lyoobt+6DVhmbWmBKY2I9pqbm5gYmZkaWx0zg7FykuRDHTc0MTWxPH7M3um0X5hXamFYfkNccXtiYXtyfktydkNsYkl4ZEpsXFJGWjoYT0lBLnoprExgt4e7q739OarMA/KBSdrExITJ32Fr32zevNnT1QX2qKCuGqZnQ20FiFp1VQWAGzycFsVG6+xoa2ttRsPoBri3tXc3tfRW1LSXVLVX13diUNZX1uZnZznZncPP4aL16dQIxKShR3TdTlKC9W5TyoJeCILMHiDNj/B7/E4+5bnzdW8oO36CY3Pe2bjoF2588di3FD/QiL9UzosfZ51y/MilhaujX9/BMl9Oi11aoUxEtFzAr1wjhBvcjjVr1piZmeDpApUwJpm0+Eqmmk8hSHdORmpCbFRoSICjw1mYezgSPQBDkSbX5GZmVJWVEvG5rg6i+MqYyXjwNAQFrbysBF2hvbkR7wJq33z10f/70x8++N//+ssf3vvje78F8t65cW1sdLinuxPdAqCMI9tbGtCaBHVZWRmAcm1tbc2dO2xsrGGSw3SorazoamsFm+vtbMOcAYo90NNJNMQvjb5079brr7z0+9+986ffvwduDii/MTM5OtCDyQmXUVVVAUIB7AbRvj135faN2StTEwTKqwlnDwzwc7BzJHVDbWy8vb1B0nHx+CBOcO/m7MN714DmJEOqoQamQFJiXGxMRGJcdPLF2NjIMHs72/37tJYtY9J5cY+FsvqU03HJYBTKv52b5YdsrCOCQLmwMDHtMzSlBZ1q57atZocPBFtbJJ61zna2r42NyCPrll4AX1dnFx8v74yU5MqSwvrykoqC3PjQYE+Hs2csTe2srQI93S5GR5ByGQ3VedlpdDHTzcUV/QcUgaRfFuTiZmIuPGljpX34oJqKKpPDLS0aY1IyP/vGRZKAD65SU9+/R8voiIG5sREGOUAcNPnoUQMAurGRoaGB/pEjeqDqp06dcnP3DAiNiEvNSMstLiyrKSypLCquyMsrS0rOiIlNiI9PyM7MolCOUZOenEQltsHu0VxdiHgDNsxNzTB3UsRQUFA4fPhwWFAgbE3iKK+pBJmrqiSS1yBDZP2/s7Wno72vqxPjvLMDFK2VLS3U0dbc0tbY1Cpobm9ubm1rFFSVlCTExpiZmK5atYpaVxTQSU1EaRnA9ALHLx0Rjz/ubxm5+83v/1Ppwg/3pV+97Pn1oJyuAlGLg41Xw2xsffwYRhTMXmA3ELw4PwedgKTjF+UX5WalJV0EMadiF26uztFREegdRLalohxPd3hoYGx0cGJkGNN1U0NjYX5BempaTFR0RERETEwUrXQBxBwc6JmdvvTGKy+9/87bf/797/7z/Xexfe/WTZKf3dHZQGpRkK5TXV5SX1dVU1OVnJri4+Nz6NAhQDn6LkwBzDR1VZWwAAZ7Okl16YFeUOyp8RFG9HzuzV++9NtfvQm+j/bbt994/dGLwPfBvk6Q66rKclDy9jbB5Njw9StTD+/efPHezSvT4zhDaUkBTXZ3tCcS3y4uLpGRJE2/tgZzRvPs1PgDQPnd6w9uk1jynu728rIi/PbwsKDgIL8Af293twtHDHRAyeXkZGiqBe67BOce5S28MJRc9tstfv6gXYrPWKWYhHXONUnrZCyVk121VOHwGnWrHVvsDmp5HbdwPX3q9PHjluYWIInnHZ1If0hJLMhOz05LDg3wveBwDkTexuqYl5tzVFhwVloyiCHmPPQcdDPwTdxqQAn+hYUHcrB//141NRVw0gX5lo85mn+2UM5ZVyCka9RX7du9R19bB8AN+CYITqzhIzQ63sBA39b2lKeHW3x0FHopRhbVUKLsG+MuPjYuOjo6OTmxOD8PVnVRflZOZkp6YmJsZESwvx+mUidHexBz/D1je0pfVw/TJzXKNDQ0Tp08kZYYDxxvaajFoMGYxXikhWRh/gLKezs7QJ44KCfEq7mR6vULBI0tLQIY4p0tTSX5Ob7ePnv27FFUVGJyO2lcIOGRpGy19DyMnsdwv3XixU/uoX9fUM6urjK3WHyJGEbR7t278Wj9fHxjY6IAbTnZmUDqqrLihuryypICIDt4qJcXKfUJVhUTHZmbmVZTWdLaWDc21D89NX555tL01CUgsqCxKTc3NzY2HtzWzc3N19c3LJQkiaC34TGDmz+4fePXrz768/u/+cv777716qMX794BK+/o6KipqSkvLy0uyS8rLayuKquqqkpITPb09N6//yCFcliIBTnZ4AhAWED56EDv+PAAKPa1y1MP7tx89PDu22+88rtfv/Xn37+HeeJXr7/y6MHdqbFhkPd6snpbAluhs1XA1I6YwQTyEklgJLUjMF3B8Cepns4unu4eIUHBKcwwoHJ612Yu3b9+lXj/b1ydvjSC43GyvNxsEEySsQIkMjdav3GNwlJ5esMpwyWrysKVCYkFXleJZxGVOPc9ped0nYq6F2VlyYoQLNXlUhLLxcVUJCU1167evW0bbGcwAAxXU1NzLw9PIAWst7ioSF9PDyCCwRE9mokKQ56Uh46P8ff2OGFtdXD/gd0792jt3qOlpbVzJ0m1B4IsX76cRN08Xar/5z28GSiX4zzySxWU1q1Zu3vnrkMHDh7R0z9qYAj41tXVBo4f0de1sLBwYarspqUm5uWSQYq+WpibA+pNNJYvJkRFRcXFxcCiBSVH387JTktJjk++GI8HFBYE6uECSk5x3OqYxf69+5YrLcOXyssr7tixAzNEflZ6O1nSr2usI9XAq6rLqqsrGxvrW1obGShvo627o5lWNWhtqm+qrwLu06gwID7AHfM6BuzqtWuEJeMZ4GImDLKoKCXNf7JcqZx/Yef/8TvY9wDlrCg+F3IvwdZMoWhuZXnMw40kyKSnpZQU5zfUE7UpPNemumrM+VGR4e6kWqQLgAzkvaWpdqi36/bc7MP7t27fmrs6e7mvp1cgEOTl5UVGRtO4by9PdxwMcMTcADzFI780Mnhvbvb9X7/+5/d++95v3nrz1UdTkxM9Xd3V1dUlJUVMxGBmSXEhXjExcS4ublpa+zQ1NSkrZ/w5xd3tLfhewPTVmUlGDfEuTvLOr17/zduvgYy/89brb7368r2b167NTOJI4HhuTgYuAPgLRg8svnxp7MU7N0DMCWfv6QSdQT/HyYMCAsFosrMyqMJ1fzfRTZyZGAExn7s8OTszMTE6MNDTCauzID8Xt8jJyQHW7oZN6xWVFFgVC1kZ0Uo6Gy8kWmR+xvwq85ZVuarEvOLR0nT9lin1IiPHFKaUkSD1AeTB25k0S6p9sX37DktLIk3n4e7s7nwBOK6npwdc2LFdEzzSxvoEOCDepTiurqqmKL8UwCGnII85gnPmCAMu5Z4Tp8qCWYqGPXCLusuWrVi9ejW6Pe6YrjZRmNHC7Ld7p/bhg0S4nylFnZ2VhpFSVJibn5eTmZqCRpQjY6JgU9L0LnRs8C2mWndIdHhYREhwSICvn5e7uxupG4PHgblhy6bN1Cu9YoWygf4RzMSVJYUdgGNBfUNtBaC8sqoUUF5fX9vc0gAm3tPRijGF1tnW1NHSBBwH4wE44C+QnfGv1oJsAYsOHDpIyzIwafpMDKIwm/Sx2rbs2s9z9ei/H1bOhtlLkkAFEmhBvbcSkiorlfdp7T135iwMMczwYMfNAlKCGTMwoA0zfGJCPCnacsEZwJednoIHOTbYB5b92ssPHt4DmF8bHOhrbW0GHIMauLu7w4iODA0CI8PBDM0vqKwoIwEkk6NA2/9klAsBwVcuT2IOqK2uAZRnkVjD9MKCHFK9OzLy/PnzmGDQp0+fPk2+NCsD8wGpzTbQOzt96cbVy688vP/mL18Ggv/uHVJTAjj++qOHL794h6pdE7HD4sLY2GgSlhsXAwhGb5sYHgDFfvHm3Oyl4eHujvKiPCKJFRV2MSY6PzursrSEOnAA+viW0cE+NFge42NDgwM9uHj0VAye0JAgzC7glVR+XqiUJM0PQKRQztdnYMnvM9arqLyRqHCgNJs5Ir5EgovGYWLkpemYJLaHjAxXgFhZWXnv3r0mJkYWFmbGRob79mmtX792BfPauHEj1XsxMTE5dOjQpk2bSFoKDX2j+rGS0kuWiBPZfhLzK7kwBePn7lqh90FSGDnD+bhgCSkqKmlokMT9Pbt279yxfcvmjRvXb9i7Rws3OTg4EGCdkZmSmZWak5uRxcgbgKwkJV6MYMqXk7qJmWngPamJCQB90A5018AAv0BfL7ByF+fztqdOGxsfxWS7Sk2dfh8MrFM2JzEf1FaUdrY0tgsayIJZdSUpu8hAOYkvaAdYt1LI7mCE81qbGplKBtWAArJ2hU/WVuVkpJ84br1qtQZZNCKxQFwGgNQTofz5edbfP5TTQDR25VcYMEfqqEpJr16lYWigj4ednBQPPBU01QHH8YTw8CiEgWK7ubiCwKYlJcKSAiy+dO/2GwDUW3Nzl6f6u7uaBY2A8vj4eHSg+OiIwtys6rLi+iqSYAkUBpTjABDeOzevvvHKA4rm927PTU+MNzcJ8C7YBPg+sRYz02ER2tvb79qzGwzv7NmzOCEuoLqqor+vZ3Js+Oa1Ky/eJeucb736CI1ILd6/dffGNRoPA/oAplCQnx0fH+vm5nLmzBlXV9fYmChcRmerYHZq4vbclamxgaGu9sqSgsyMFHCc8uIigPjIQP/U+BhJPBvq7+8jKivg9XW1lU2NpDoHempRXjbGDKjN0aNHVVVVaSoKF788D8rnp598uwJjPwIr5Hz6NAGSn1shI84KD7ClS0gYnwwD/FJc3g3eAGqvXbsaYMOE8cjT0SpN5QFWrMCoXrdunbq6unDaI+Y8rYjIOfqYlTESkycMn/35+1XmRV8IMwalePXaFRSWwohZtwa3dg2JgF6xEoALiweWcXh4aGLixeSUi+kZySkpKbAmAd8x0ZEhIUEYoRfjo9OSLibGxUaSmMMgX28fGMdoPh7ubq7OjvYOML61tQ/heeGcsLeWLl2Kf/29vSpKCgV1VR2tjaBupF5uNQZtaVVVRW1tNcHrlkZS5La1BX8ZL7kAYxmtrRU7BcRpXleN7z3v6LRrx04aR8hqB/EkFkSiBfMf7uPP+me+QPLdoZztKxwFoNmlNBuKKQG6detma2srGGUAuOoqkiYDewrISILGyovj42K8vLyCgoLSUpPxLCmUv/nyi+C5wEfMzIKmBhDwhPiLODIrPam2oqSltqqjsY5qJAFJMcO3twnmZqd++fDOH999+0/v/fqVF+9enZlub2sBCwBxBqHIz0nHt0eEhzo6Omppae3atcPe/hz+LSzIQ68C95+eGL19/SpMAUA52qMX7710j2QDUV0UdKz6OlK5EVQlLCzk7Flbc3NzTAbg9bAMAM5T4yOg7WPDPb0dLWVF+VmZqcVFeY21NRMjw1emJq/PXsG0BCjv6e7E15WWFsNcqKwoKS0pAGdPT04KCwkFJd+9WwtQxa590xsrSUPMZJm4b1F8sWjEPntQLpIEEmYC0+Aq7BQTo6pvrN69FFOFinMi8TS+JakeE6mkLicnKkUNXi8uyZjV7FsyMkyhAab2vDQTMMOHcn5S27xUoJ/1qGZ7hVDHQ0oUO0/cEfKyJARbSUkJNxCTHOPO2m5nZ0d9LIkJsakpCRhrMVFEqhoDhAqdxsZExMdFRWHLn5TMc3d183Bx9XBxdoVBfcHJ7uw5MzOzAwf2bdiwTkN91XKlZcrKK0xMDWMiQkHXWppqKZQ31NfW1FSBlQPKsQFkx04Mb4x6YHdri6BF0NzS3MRAeRPwAcS8urwE36dzWFtJcRmbr8DTSGFHCiuoyyaic549ilSLrPwbQzk16KiRywoXMCQL/AtT9O7dO+0dzoSHBQHjgHSkPkNzI/GC1VSkp6WEhoaGhBD3N1B7bLDv9tzsK/du37oyjW0ymVdVZmakUaczHi0Y/Xh/z+RQP97t6wJctzY0NMAoA+DOTIy8+ej+f/zmjbdfe/Towd2xoUH0j9KSItDevOy09LSkiPBg9Nrdu8HK0X3Pgm4wsd71w0N91y5P3b05BzQHN78+OwNknxjuh3mHSwUo5+VmE3afnQmqQqEcBj4JGHdzwQxUVVaKKWdwoLuzoxmMG8w9Lz+rrr6qt7Pj9vW5l+7fwzkxLWECQ2/OxrQEvhMTBabDBCASrzo4/t69e1VU1B5L9hEycaEaLbuiwmuAMMlnbc2NdAA5KZH2iKz0fP10UWYdU6eULu3ycxdpggmni8JlqAr1Z8SFMinUlSNF43xEqTokslhCqIsl/1z5yiWpr4mv48Erz81mLcpwavWySstWaGtr2546Db4dEx2OFh0eFh4cFBoSFODvCxAg5QlD/AMCfQJ8vL3dYZG6ork7uwDNAeVUVdTCwgI0HKRt/dp1aiqqoP22p08kX4wlXu8mUnsABBwY3dSEwVpXz2A6xj7eJeXRWxgcb8abxLtCVjub6gEOsL8xNI7o6aurrqJOOZ6+DZ31yRI6hfLnbUXkh4JyCSqrxHQdaWEv4exlfEZVXU1fnyT0J1yMY0K5y2gxLbDm9PTU0PCw4NCQZAbKRwd6b8zOkAr0k+PDfV0kgru4iBCEsPCcLFIRYrC3a2Z0+Oqlceqy6OvpbW4SNDbU9ZByPL0P79781euvMGIpL06Nj3V1tsOgKyzIyc4iyzWhIQFnbc/AWKOsHIYC1QkgOT5XL9+eIwUxrkxNXL40OjrQ09/VVlddBlzGhcH2TEtLobrqsDrxQ45ZWKKhHyclXiwpyAWPaO9orqurAePOzEwHXqPLYnbB3PDyg7uYG/AV6ND4vampyaT0HVH+d/X2cvNwdz175rSurq7GmtWgqOISUnxdlIUPbAGIC2Fd8hnrUnx1QF66hMyCRHmWm/NqVPJT2viSYax8FU9jmhFHEZOQEJOSkhCeQVqYASgKyHvcV/48DnIW0OcLAAhzwYGGa9as0dXWsbc76+vjERLsHxYUGORHQNzD3dnN1dnTww1E3NPLFTju6eoC+kJqubi4erm5418SvuLgePyYlZ6u9g7NbRvXb1BVVtm0aQPOlpZ0kSRtEerdQMNR0ARNdRgaGClg5eA9tMgMWjOJVqyB8YttJi28GJdx8oTN1q1bFeQUmSUWcV5yDQvlNA1tXunqRSj/TlAO5iQmTYXLOfVE4e1mrePVq1fr6Bw+7+QAMy0vK728KL+ytAgPLCsrIzIqBmgOrARwD/V2zU6N3wYvHiGFzEHDQdsJO/D2ycrIrK+rGR0hqZUPbsw9uH0D/P3K1GRvT1dnB9GzBTW+fmX60YM7RHjr9V/evHZ1fGwEc31FeXEBk9UQHOR3yubkTs0dsBIcHe2jIkPxFuyD8eEBfOnk+NDIQC9ZTG9pbKypqC4ryk5PIcqoocEREWEAaFB4cPz8vBwYmo72Dui+dudgaoRkpCSCuRcVFaSmpwD1ExISgNdVlaUdLU3Tl0ZIpj8mmc62mopS8tmwEAwPmxPHj1mampsZGRro79m9c9WqVXIK8iyf4isXzveJ85sk3zf9rEG5iGXLcEGTdOBRNwhrCDM1NISA/rTqOfPWCUQEE2DOQDlpwiJ5XKYcP+mZS9Z4bokbB+VsESKeAh8ds0BzdXX1ffv2GRsZomeesT1le/rkqZMnTp08jr8AZafzds4ujkBtAuteHv5+YOi+gb4+aD4e7i4XnG2sT+jr6ezcsX3DuvWqqqrbtm1xdj5PYtIaakGxMaa6OlvROjtagOYYkvWkknt1U2MtiDltDSSBqKq2sgKwgDnA39vLzNR4x3ZNUixCnIpuSnOF3IQzPcme40d5LUL5d132JI6UJRJshBwzXCVFsk2sepycnJyamhqsMEcHOxLakZUOMltSkA9WHh0TFxkdRaF8sKfz6qUxQPnkUH9PewsOAJi6urq6ubllZGRgMh8dHWZEE2+/8dKDl+7dAu0dGxpkczvbW0nJsVtzIObvvPXagzs3r1yeBsrjUwUFeVmZqUGBvjY2Njt27NirtZsogcREVVaUoasBwSfHhqlWOOlV1RWYaTDfJMRGkVWeoIDo6EhMBjRLraa6PDkpwcfH5yR5nUDPjouKBFtPSkoIjwwLDw+Pjo7GNpkkWhomR/tnp0ZhXgDWy4ry01IT/XxJ6qK5sRG6Pi4DLIYpAS4qLsMpFD4Ryp9NJj6v0eryQgETfgEzEmwop0DdIMz0T6iW+BIxyrZErl5eqtG8xSthdJ0kO0lQKTu2FiLVtJtX3mF+tM9z2aQWlCTmLxVwyjBUZEZp+TLQc01NTS0trX179xzYv5cEnh/Rs7Q0P8OUb3Vzc/H29gSrCgjwCwzwA8EK9vfz9/YAxJ+wtkJ/3rplE8a4srIyqJKXl0dBTia4NqgSeExfVzsa0Bz2a3NzU2NjPXC8saGmsa6yvqqstqIEpK2ytASGL6xeMCTjo0bbtmxdsWw5maSFmifUccdZe0Qeh7fWsgjl31O2p5gkV2lICDSMbiQtHc2WLJBUUVE5dHA/HhUsuJSEOFJcMSYqODiYVPhNTqyrKgd8Tw0PzE1NEP2rxrrM1BRvTy/gr62tbVxcXFlF6dDQwLXLU6+8eO/NX7701qsvv/ryizevESWrgf7evt7uiZHB2ZmJRw9uvfHKQxxz79b1sVGSMlpeVgJsDg4KwKnQWffv03K+4ISvrigvJZk7TD8j0tYVJcTTzQihJMZFg30TzduoiPSMZJAIkknU29Xb0wGYTky86ODggF5ua3vKw90V3drHx8vdk2QwRUZGAsrLy4paBXUD3e3DfYBxEhubmZESHRXm6eHieO6sqYkR7sOG9WuB40RthyqWLHAsCEGcAj23hMXh3VcXiPoXdilSbJ4yJmZSF14no7AolOhiHCBsSUOu1iInb8SvUs+HclJvjHcf5pcLkF5QtYevZbEI5Y8rLHL3ii2uhg15OXlFWndEQWmpgrqaCvi1gYH+6dMnXV2d0cNDQoJgpMKyDA0JwmgK9vfx9XSDqQ34wJjSWKVGxLtVVQ/rHMIxMFXBkzpbBf3dHWjg5u1tAs5pTjwtNZW1VaXZGcnR4SE4j4vz+ZM21pgSdmhug5XAFHqmgr0yXIkVvtUlTZMTFqH8e3OwML4qVieMJY/yHJRzEQuUpOPzK1euxJx/kpFAAZhGRoT5+/sHBpJKabCt2gUN4/290+Mj/V3tjdXVyRfj0VHQmUxMTEJDQwsL8wcGyBLlI0D5q49+89brb732Ctj3jauzEyPDQ339IwP9RAbr9hxwHO3h3VvTRKy8p6a6srAgDx3xxIkTYOX79++FAYj5v6y0GDSciWxthX1XWlKUlZmOSQVv4cLo8j3+LSrMRRcEbR8d7MPXkCyh3GxPT3dLq2Pm5uanT4Oz4OVAiuF5+8RERaekJGGSoMKQXe2CqsoSnCEpkTjrPb2IVIWJ8dE9u3YvX75ceD+laeTPggomfP/4AseFCMqfOQ0WGaFinJywUBlbLoMVy6VGMZNNRqf5eTJhQijn/15O1Uua56LhmDtfsPTxsraL8D3/Na/QAakczWUVCQOL6XMhkpmysqtXr8Loszt32tvLDQM2PCwkLDwoMioUSB0cHBgY4OPh7nzurC3wd8uWTUuXKgB/N23aZG5uGhsbjcHV3izoaG8G+4GJ3d1BIg6B4E2N9UQar4kkDWHIhwT7Wx2zgBGAgQmzAIMC8wE6CpPkJcmLRJo3PTNrI4tQ/r1COTfk2FFKmoJwsElx+tfc2hQtSrBzx/bjVmTZ0NPDzdnZ2cPDLTI0CBZZfWVlT1vbUE8PcLC0sABd5+TJE9rah44ePQrCm5GR1tbaTDULgeavPXqI9vKDuw/u3L46Mz05MoYPAnCvkCjv2Zfv30G7PjszOTYqaGooKSlC57Oystq+ffvevXvOn3eMiiRqhaAGNOWsrqqyqDAfhgJwHN8L9oEDEhPicRm1NRVUARGzyNWZye4ukrsfHh56yva0samJhYXFmTNncELcscjwiJzszKKigtYWkJEukBF0ZTB0zBA4m3+A9/kL9kQ+++B+9Frcd24U8QQtRbrJFLxobAaXxM+XTPpW+tc/cGOEQBlROkYMllnSZKqqSSyY/mkIC+dQEik+PsbKJXnBl1zEDv8Yfgy+qEghLYUhIbUI5U+DcimhSDK3JkGhnD4X4PL69WuNjQydHe0Cfb1CAwMwLsIjggHlkZHhGE0B/t7OFxysjx8DJVdRWUmDRA8c2Adak5uTxYj+t2Gw9FJpUgEJIBbU19TX1TAR5U2A8uysNAwHUtmHlXKSEOYcSNOqh8yVkDAkQA+v3Aqr0iol6kuLUP59sHKq3icjq4hJkjSh5/fxMAyyX1YGX4mJd8uWLfr6uidOHLe1PXXhglNYkH9ORmpVWWmboKmjvbWqsjwvJzc4MOj48WM4zMzMxM/PBwQZUzqo9605Uvnzpft3Xrp/7+G9uy/evXXj6uWZSxMg4AM93VPjY3MzMw/vECi/ee3K5clLYAGlpcUBQf7Hjlls3rxxz55d6G3g3YDpxprKvs42YgQw0rWJTIYbuilMyPi4mMyMNFwJuuDIQO/lS2M4241rM4P4QHN9fFwU4NvU3AwvOzs7by+PiPBQzAQgI7U1VejBoPBU3LG8uCArLRXvent7YmbSOay9dvUaSj241GqqmyEhRoKv+XrZVI7qcYfDswvlVA9dQkqakXmmv4WkAItLitZpWT84jTmRoXV7uGo+bA0a2misC9M4iKe1Gek2iU2nXY4Xn06rLFEo5773OXawfBWUs2YQW9xRkkYHMUvVBJe3bN5oZmrset4hNNAvMjQEIyIuLgaMOyoqKoREK3qfd7IDp961U5P252VKikcNj/j7+aDPY0BRLznYFcYXLauCnY0NdZ2tgq5WQU15CWjT4cOHMWe88IKY+BIxtiiPFKs7xEU3MZAizdS0ojLCUlxlq39WZWkRyr+Rg4UlTWwc61fn1AlZPJlq1dTUNDW36egcBsCBnl+Mic5OTyvKywWkgtsmJST6+fiePn3a2trK0dEeHSg/L6ehvhZTfV9XJwjvAMmG752eGAdTBvsGMR8fHhodHEAbHxycuzx1a24WPHry0jgmgIKCPB8fL0PDI7AZd+7UtLc7i65ZnJ8nhPI2QUM16HNCQjxwHC02JgrMorSkqLWpEd1xanzk+pXp23NXrl+dHh3qhbWYmZHi6+ttaXUMUH7+/Pnw4KC8LCL20sCkLIHpo2EOqKsqT02Mj4kI9/J0xw/R0tqtpqKKeY8fucH5AYUqSFIL0j1YZiq9UGuCq0Tx0wiAe5J6Iqe1vVDC8OtohTN96Qm60rzol8Vlz6+G8vmjlblvTLVMjHEg7MYN6xgodwr298F4gZGacDEuJgZIHhVNaij62dvZgravW7eGlrHevWuHo4NdYlw0uj2NXaGOcgwxGqmCne3NAiZOrCk3I9XBzn7t2rWM5ockKVsswaoePtHC4PTE+frs86zY5/hZf3/Znt8wWI1GIOB0SkpKGzZsAO8+Y3sqMMAvITYmMzUpNzMNf5MvxgcFBDo5OQEoAwL8srOI9FVLYx1MM/ytraloqK9uaWwY7ie5mrPTl65MTQLKhwb7wc1Bh2cujQHip6fGLo0O1ddV5eVmg/sfPHhQRUVl65ZNp0/ZAHxL8giU93a0DnW1N9dXV5YWobOGh4eiJSVeLC0pqK+uGGCqcWJiAI7fvXEVrHxsuK+nsyU3JwOIf/yElYmJCXHXhAWXFOTWVJSzPbVV0NpYV11WzFR3i/Tx9jxuZQkcV1ZeoSAnT2vZiEuIqtfzKj/wywg8F0p+i+1fvrbBL7/AvUC2VqmpGxzRO29vF+jrExESfDE+FsQ8KjIcFi11GJ62PXHo0IGVK1cy3pj1psYmwf5+GckJTbWVHc0NfZ2tA93t4EmU1gjqMXiJ4gpIOqAciI/jV6xQZstECEshL7LsnwaUcxmhXAQCOsG6desOHNhnc+I4KfIZGnQxJpIROA0PDQny8vIKDAwEF6isKAGCtzWTTDCaHJ+akkQcIGWlmOoHe7uA6SMD/QP9vQP93cOM+PggYLhdgOPzsogAyzFL823btuFHrV+3xsLc1N/bKzs1tSQ/p7m+pr2hFqS8tDAP58R34bTAcarpMz0+Ahy/e+Pag9vX79+au31jFlDe39NekJ8VFR12+swpY2Nju3NnIkIC8S1lRYW4Hkw5OFVxXnZqQlxEeCjxw5gYbd26WWn5UmYFgQ0LW1BoTbjyKbkI5YvtXw7lzDINUVPZv3ffmZM2Ph7u/n4+oYwkC9XSCvD3dXZxNDMz2bFjBw5TVlY+cuSIl5t7ZmpKcX4OSHhvRwtAHGje1S6AzSuor4FxDB4Ght7T3lJbUerr6bFTcwdNx6V1kEnxTMlFKP+psPL5wWS09wDN0RV27dplbmrm6nIhNDAgJiI0OjwkBHadjxfIL8hybWVZu6Chq5WsfYP/piQnRkSEoaWlJhczy4x0gQWtB0Sgu4OKIAsaqqvLS2Ijw5wvOIE+bN60YZW6KrEDdPUuONgnx8UV5WbVl5eCm1eWFBbkZCYnJQDNcULwcZwBU8KVqYnrszN3bly7f+v6vZtzN65exiSBDlpalHsxPvrcuTMGBgYkIMfPOz0pPocp6sZMMwlJ8XF+vt729vYHDx/CN1LtJ3o/RXUFOS8KvTniUvMNzMW22H5UKGfTAoQaywoKClu3bgXvwfABmocE+AcG+Pj7eQEcPD3c0Pl1dA6vXbsWQKGpuY2mjADHaXXcvq52ECwauwISVl9X09hQQ8LMO1oxkGF5n7C2golMPfU0OWARyn9aUC4nJS3Ph3LWaywjDbDbtGmTgf6Rkyds3J0v+Hm5+3i7e3q6h4QE0ahz9ABSua2jFbCem5MVFhbi5+fj6+sNmpCUeJGEjhTmlhTnFRflVpQUghcDmlMT40NDAs6dtTUw0N+1a8ee3Tv379Pap7UXzczoqJeb68WoqKzUpJz0lIyUxMS4WLSstNSaivK2pvqR/h5SGW5yfHpq/Mrlybkr09ieGh9BB+1uEwDKExNi7R3O6Ovr4/a5nncAmoObR4QHBwX6urk6nzmNLzXYuXvXShVlOXlF3CVxSQnSyOqNBBdryI+/pjJkNABrsS22H1H+TFiLUgjlXJSRqqrqgf17rY5ZONmd83R1AYK7uZ53cT5/9sxpExOjLVs2KSoqqqurm5kax0dHlRbkggOhgVcN9XVjpAz0dALWwccbG0jh3DaGjZUX5QcF+u/du1dUloSBcuHaxiKU/xSgnHMXcPoYlBTgOvAOIA/dAiaboYH+qZMnLpx3dHV1BmSnpSYSlbVGWG2tdAmlrLQwLjYatNfJwdHBwcHDzR2dA1w+Pi4yKTE2PRmkOCYsNNDVxcna2vrw4cM7d2pqHz5oY2XheM4WdEBH+9ChffstTIwv2NmFBQREhYREhAQTb2BMNPgCSHpHc+NQbxdZQR0bGWPaxPjo6MjQ6MhAR3szLIP87Iy42Miz507p6Ojo6upaHz9GrpbRijt9yubIET0YGarqanIK8jTyhCuJwCqK0Hv4GJSLM2mLi11zsf3ISpaiYESeOAS6ItBBQ0PjwIEDpsYmtqdPOtifszt3xtbmpPFRoz179gAicCSY+3knh/zsrJqysoaa6sbamt6erpGBfkA5GhNO3tAsIAGIHc0NzfXVGJ62tqdWrdagEvNM6q8kLVS7KIz102HlvGJm/MfGFs1hHA5ycnIA9J2aO/R0tS0szJycHADTmakpJQX56CjNDbVN9VWVFSWpKQlhocEOdvakmri5xTFLc3AH6+MWJ22sbG1OWFtaGBsZArJ37969Zcu2LVu2WFqYuV047+/t4eRof9TwyN5du/fs2Hl4L6HnOPikjTUsxAB/38S46KLcrMqSwtqK0rqqyob6WvrCBozEmurygvzsorzs6Kgwby83S0tzWsviwIF9IP5HDQy1Dx3Gv8rKK2Tl5fBDxcDCJSXY6Ur4YtMUhXp+fGWSp2uSLLbF9kNDuQwfyiWExbUxHsHNNbdtP3zwkL6unr6ejvaBg/h3xYoVJPNLVv7gwYOwjOurq5rr6tqbiG5tX2/3UF8vExzcCepDJchhywrqqkoLcrzcnPfv3091h4QyDFKLQgs/PVZOziCEcq46NRspLCwyR75JTk5FRQUM3djY+Ny5c0Dt5KSEkuJCWuy1uCgvPS0pOjwELBgobHTU4NDB/bsA/5rbtm7dvHnThtWrNFapqWuor1JZqbps2YqVK1euXbt6547te0gRFc11a9auXL5CUV5hpdKytas0tm7ctE9rr6mJEchFaGBA8sV4zBy5mRl5WUDt/MKCPLZ8bV4uddrgAIA+GArge+PmTeoaq9asW7tuw3oNDZKuRlS2hUXyOPTmQTkTPS3FQrmkrFC1RqjZvQjli+3HxHEJCal51TloY+L3acwrRfOlS39R9P4AAA02SURBVJdhPK5jXhrqq5ctXU5zMuUVlhoYGMRHRxEdxMbGDoGgu70NOD7U09Pf3dXT3Q4oZwoGNfe0N9dXlWWlJsGEVVZWJiRGSp5fq3Zh8KgwiWmxPbtQztfNEOn78BKIhRUIZKkO1/bt29FdTp885e3lERIcGBkRghYcRNR8nB0dAOUg4Af27wWCa2ior1ixbNlSJVIukinhKqz1R6X35Ui2r6ycghwpFiwtKaUkr7BMQVFJkRRYAcaDreNsmB7wRT7engE+vsH+AXThPjKUtPDgAF9PN9fzpLaktvah9evXKiotpeIVpLykrDznSOEnlItkAjlJIxqU+Zje4ROXfRapymL7QaFcghcXywlFcPo2IuFJZjzSqmFcSpHi0mWWlpYZKcltTfWEkjc1dba29HZ29Hd29nV1dne19fR24C+p3tnckJuRgrEDRi8npyA5H6yfoCm0COXPBJQ/5TFISslJSHIypPMC73hheVK0zC6XzYgHr6ysumnTlgMHDhgZHgWM2jJSnLY2J04cszQzNdbT1dbS0tq6dSsoAy5bXl6RnIqqfNDkNSYJmOYWiouLE2UnWVmguYaqyhp1NZXly1YsVwKF375128H9BwyPGJibmp04bn3mpI3jubNAdjdXUjMFnB1M/LiV5VEDQ63dezQ0NIgrnHoYhdmYfCgn8E2qu/FEX4UkaB6Us5+Vpvd5MRF5sf2IUC7JKVEvKAPCh3IqeUZkrRgFNBo7SEcx2LqVlVVWWmqboIGIrpAab4JeJoOaqGgxUN7X2wEob6yrDA8LOnrUYMWKFSySCGuQMkkVUpz03hMW2CSf3brkPxko5x7z9wXlTEq3PH14gFd+fv8CPQ1aClJUxIC40RXAuNeuXrN582ZQ9R3bNXdt18Qkv23L1o0bN65Zs4aUfFRQ4KrJcCKZXHcUVqJha8ysWb1q29bNm9atVVNVVl6xUk1FdfUqjU0bNuLke/bs2b9PS0f7kKGBPhpxER4+iD1bNm/EYSTTR4pRAWTWMMXExGhNTl6imgzVTiGqBtIKVNXv8axF6flQvigPtNh+/IzQJ0I5p1jJjR06oBh1YknONbp8+UobG5ucjPT2ZlISCIDe0dJEUvaB5t0kOBho3tfdVltVmpqScPz4sXUb1lMRNMJpJDA8FIAGRH0BI/4pUM5TiVlsz1JcOZU0Y3I+aTCilDACSWoBlFOXurBYqCS1BFkdehkS9Kogp0ibovxS/F2qoKSoqAS4l5GSp6p49Hh+JRq2a0qxQh5Llyqoq6uqq6qtWLZcCScgr6V4KZGXInYC31WVVfAClcAuZp6Q4dT+WIU/ptIgyzL4VTdl5aTkiDtHRlZRWkaBX7ztMSiXFObYLYTyRe/KYvtBIWCBEIJQRoJjP/Ma0BashSzl0w4vJYNxARM5PzujvYWAOAPoTT2dLWDlgz2dAPHertbejpbi/BxPD7dde3bLySsuEZOgC2ZcQRKicSgtzQvuWnw0PxUol5PleKgwHnGeBjq/UjuvfLtQRop1YrDqd5yoHq0aw/QSGW41nFN94wxGGSlpUcVIaQlGDlmGONYZr4tQDox5MajM13/gxHv5UE4T8UUSRcKAcUA5bVLS8lT7959COVd2drF3LrYfBwI4dcnHtXGkJUXqLdy/ompEzPBXVla2O3eGg3K0zrYmwDdwfKCbaCK2NNTUVZaGBvjq6ekpLl0mMa/sn1DYkhHM4lw9i8/le4DyL7744keAclYzj1l0EZXllRbJS0kypWaFRty8Sijz8tOE/nRq9DHMnQkXEUK5NK/iOC3zSjMqGfCVEGI02U/KQooO5hYhpRfUmZQSFjnj6kzy43DmQ7kCZeJST75LUgvVJen3CqF8AZrPY0/zyu8utsX2XaH88UKDXyHFJSEpEh/GR2CwOjrYFeZmtQtIXj5RPWxr7mW8K4yQVqugrqogO+PMSZsN69ZjyFDRWv56EhWtXYTyH5yVc8tx3xeU02LEzDkl+GyUnl8EYawCpyQH3zQKRYYWVucKpDH+u4V+cF7ZAa67cLrYnCIzjXqkUM4v6SstrGfG+vSFmtq8ajVsEC4nSCu6Zgn2s6zsnLSsuFA5i7UYaGkFSXY5lA/lMk+vVbgI5Yvth2hcUCwXS86Hcm5siqiGcNzJCFPbVFVVzzs5FOVldzQ3cCBOk4NI1a2OlpL8nGBf34N7tRTk5MmSEqNlL7I+hRWmhDb6omjtd4JyM1NjAuWf/o2F8s//8fE3qiIkmuGfXIBqnj+OhuRRKCcdQ1pkrNHlSo6hc9/FwRxD6OUZmWp5KaHS99NqGLI9lZ6HKVTGperQbko6EKOfzuogc+5q/Ex+FRtpNqJGWPaXLY+Aj4sYNJ3S6GKvcHpjoVxSQkjkJZiFHWkuJeqfQfm8+/YdtyWFSrmLx/8rj3+aeO9j2z/a9fMtQjL05p9H5GzkQTlLuZimpqbmfMGpMC+zq7Whq13Q39Pe19tJs/aHeru621uy0pLtbE+vXqXBhL6wS6YYyBQHqGnLmOkMHxLiCR2zP//+/w37wwJnF78EEMfK7964+uUnHxAox+vjD/5GoZxqhvBXt4k6q7g4l/ZCGOv8SAz2Mc93Gjzmj5NaEHjHZTw+Xh1GFMz3GDuQml/JiC1dJP2E750Hl7zXE7+LsoYnXv+8bv04W6FlIngllUVDghGwFU05VOnia9+37749P/Bx8fh/0fHzy21/xfa/5PoJwxBW5+H6J7/Ps2X5hNtgVOvWrfP28igpzOlpb+7rJsEq3V1tAz2dw33dPe0tDTWVwf5+B/btByVn16iYNS0hbgiJv3DNjFoJrOX9PPT/b9IfKL4R5BSXIJU6JCToc6H3DfdTUVHR6pjF/VtzX35MHCyff/HFZ59+9KG/nw8RWJBaqKnNQLkkjQyhjPhxaCP7//lPkv7hYOurt58Kx1/vs//8eFrg5nv93sXtn8k2f4jKSM8brk875lm6fjYaQLiGJCcnt3XzFj9fb8bB0tjT0drb2UaLB/V1dAhqawtysk/aWG/euEleltTn5MIE+OtYnOUtJRLafV76w9No5VO3GXcwGxIqhHJuzUNeYam5uTnHyj//+KO///1//8fPy1NeTgYfAJcUXyIh9oI4s1rIhH8wHFNGSnbJL15Ao2J+olyDZ3t7XmTVT+SaF7d/1tv8pfUfeyx8423WSSJOuSH2qCqrGB3Rt7c96X7B0dPlvJfrBW83Zz9PNy8Xlwt2diePW23dsmkpU26FNBKQIC1Mw5aiaUHCVD6J521scveE2S/+tY5nHLUyEuISL/yCgjNX7hzIjpnV3NTsxTs3CCsHJf/oww8+/Ot/+3u5L5WTFv/Fv0vjOJD5F5ZILnlBSoychZ4U+7ETB2C/tLgYbZgsnrT9gqTEPz3mRz2eac/Q9Swev3j8d9j+TtfzNZpovEiJLQGIECgA9AgHvrykpKKM5DJ5mRVyMstlpVfISasoyi1XkMUe7JeTEpd64QX6WfFf/Bv+0iYrKUHARPgvGv5d8NXPQ38Q3tsXvuKzaDJiYjLMg5CRwI3CU/i/C+4YuaXSMmamxjevXv7y478TX/kn//joH3//IDst2dRQ/4j2Qf1Dhwx1dGgz0NY21D1soKtzVF/PSE/vqK4u/iUN7zIbBk/ePmSgd4g98qnH/KjHM+0Zup7F45+v47/BZ3/w6+GP36dszxsvR/W0CQ7oaR/ROWR0RJfiAIAC+49qHzI4sP/ooQNGOodM9HSM8a6+joHOIRwPMDEx0MM1YA8aDsYZ8BY9J05FPs40w+esPxh+jf6AZqRDGj57RJfcatzbo/o6uG+4h7j5tBnq6YYE+L/+6OGXn3zIQPnH//jy00+uXZ4Z6u2anZqYm5m5Nj19aXh4enxkdmJsdmr8CnZemb4xO3NjZur69OTc1MS1yQkcybTxJ22PP2X/v+B4po0z7Zm4nsXjn8vjx69MjtF29dL45UtjX+883/P1cP/+s+15x89MjOCC5y5PXZuZxPalkcGr05ewTf5OTlweA0qMXp++NDd1aWZ0eGpsGB+ZHBrAxhXmV2M/Pksb0AN7CKRMjuGzwBMGTJ6X/oCGp3/1EvrAGL8/4EY96bOkXZ2euHxpFLf69tzsrWuXyUfGR6ZHBmdGh3DY1ZnpW3PXfv8f737x+T8IlH/xxRdffvHZJx/+/eMP/vfTjz74/KOPPvsYPP2vn3z4t09JIxufffz3zz76gDbsFG3z9nwq3PkMbn/2DF/b4vbPfPtjdhzRofQJRtbf//qT+y2ff/x3tE8++iuQ4VNm56fMwGfbx3/7jPt3/n4OLj5nMYT8S7GFt/N56Q/CniDsDx/R7b89hld/++LDD76gh31MbikQ+PN/fMgcTxv9yIf/+PjDzz7/+MsvP2WDEb/44jOg+Zdffk7aZ5+Ktj/HxqfsNjmG2UMb/5hnefvzn8h1Lm7/bLc/ZbY/YYbSpz/Z3yK8/i+esv8JnxXu5zdyPIczP0E8+R6w6Ov0B7qf3vBPmHvOHf8J03ifYtr/B0XNaRyql/tQAAAAAElFTkSuQmCC)
- Volume differences in schizophrenics vs. controls
- Colored portions are statistical maps placed on top of a base structural map. - Maps provide information about the comparison in brain volumes between patients and controls in those areas
Mapping the wiring diagram (“connectome”)


Retrograde (output -> input) vs. anterograde (input -> output) tracers

http://openi.nlm.nih.gov/imgs/512/348/3176268/3176268_1471-2105-12-351-2.png
Diffusion Tensor Imaging (DTI)
- Structural MRI technique
- Diffusion tensor: measurement of spatial pattern of \(H_2O\) diffusion in small volume
- Uniform (“isotropic”) vs. non-uniform (“anisotropic”)
- Strong anisotropy suggests large # of axons with similar orientations (fiber tracts)


Visualizing the connectome


Functional methods
- Recording from the brain
- Interfering with the brain
- Stimulating the brain
- Simulating the brain
Recording from the brain
Single/multi-unit Recording
- Microelectrodes + amplification
- Small numbers of nerve cells

- What does neuron X respond to?
- How does firing frequency, timing vary with behavior?
- Great temporal (ms), spatial resolution (um)
- Invasive
- Rarely suitable for humans, but…
Electrocorticography (ECoG)

Grid electrodes: (A) Craniotomy performed for electrocorticography (ECoG) grid electrode placement in epilepsy surgery candidate at Comprehensive Epilepsy Program, Florida Hospital for Children, Orlando, Florida, United States. (B) ECoG electrode grids placed directly on the brain surface. They will be used during presurgical monitoring for localizing seizure onset zone. The same electrodes are stimulated during electrical cortical stimulation mapping for identification of eloquent cortex. The ECoG signal recorded from these grids is separated in a different stream and used for real-time functional mapping (RTFM). (C) 3D reconstruction of the brain with overlaid grid electrodes. This reconstruction is used for creating RTFM montage.
Story about child who underwent ECoG surgery.
Positron Emission Tomography (PET)
- Radioactive tracers (glucose, oxygen)
- Positron decay activates paired detectors
- Tomographic techniques reconstruct 3D geometry
- Experimental condition - control
- Average across individuals
- Temporal (~ s) and spatial (mm-cm) resolution worse than fMRI
- Radioactive exposures + mildly invasive
- Dose < airline crew exposure in 1 yr
Functional Magnetic Resonance Imaging (fMRI)
- Neural activity -> local \(O_2\) consumption increase
- Blood Oxygen Level Dependent (BOLD) response
- Oxygenated vs. deoxygenated hemoglobin ≠ magnetic susceptibility
- How do regional blood \(O_2\) levels (& flow & volume) vary with behavior X?
- MRI “signals” relate to the speed (1/T) of “relaxation” of the perturbed nuclei to their state of alignment with the main (\(B_0\)) magnetic field.
- Imaging protocols emphasize different time constants of this relaxation (\(T1\), \(T2\), \(T2^*\)); \(T^2*\) for BOLD imaging
Evaluating fMRI
- Non-invasive, but expensive
- Moderate but improving (mm) spatial, temporal (~sec) resolution
- Spatial limits due to
- field strength (@ 3T \(~3mm^3\) voxel)
- Physiology of hemodynamic response
- Temporal limits due to
- Hemodynamic Response Function (HRF): ~ 1s delay plus 3-6 s ramp-up
- Speed of image acquisition
- Indirect measure of neural activity
Hemodynamic Response Function (HRF)

Generate “predicted” BOLD response to event; compare to actual

Higher field strengths (3 Tesla vs. 7 Tesla)
![[[@Sladky2013-bu]](https://dx.doi.org/10.1016/j.ejrad.2011.09.025)](data:image/jpeg;base64,/9j/4AAQSkZJRgABAQEB9AH0AAD/2wBDAAIBAQEBAQIBAQECAgICAgQDAgICAgUEBAMEBgUGBgYFBgYGBwkIBgcJBwYGCAsICQoKCgoKBggLDAsKDAkKCgr/2wBDAQICAgICAgUDAwUKBwYHCgoKCgoKCgoKCgoKCgoKCgoKCgoKCgoKCgoKCgoKCgoKCgoKCgoKCgoKCgoKCgoKCgr/wAARCAHbAugDASIAAhEBAxEB/8QAHgABAAICAgMBAAAAAAAAAAAAAAYHBQgDBAEJCgL/xABrEAAABQMCAwQBCg4OBQgIBAcBAgMEBQAGBxESCBMhCRQiMRUWGBkjMkFRWJW2Fxo3ODlZYXSRl5jU1dYkM0JSVldxdnd4gaG00wpDU7HSNFVicnOTssFEVGaCksLR8CU1Y4M2RkiUlqLx/8QAGwEBAQADAQEBAAAAAAAAAAAAAAECAwQFBgf/xABHEQACAQIEBAMEBwYDBwIHAAAAAQIDEQQSITEFQVFhBiJxEzKBkRRCUmKhsdEHFSOSwfAzcoIWJFODstLhNFRDY3Ois8Lx/9oADAMBAAIRAxEAPwD3+UpSgFKUoBSlKAUpSgFKUoBSlKAUpSgFKUoBSlKAV60+OWX7VzF/FjZGA+HbtQGMhcWXrwer23YSuDIjlWtbKBxVdPXT4yqh1E2yRiJEEyYHcKiBQ2ju09llUPbfBN6L7Ri5e0EuDJvpRxKYyZ2Xb1sHhtgQjVN0LpdQrnnG5orK6GEoJE26abjVVoRn47QPGfEre2EFrh4b+MOWxLJ2qweykg+irTj5QZciTYxitzleFMVIu4uu4ga9a0f4I+PjiM4cezatbtS+O3jEunLaGSGSUNa2KGtnw0cITi8iog3Ki7SKjrqRuoJhVECFIJzaGEpQH2hZFtL1f4+nbE9Id09Nwzph3rlczk85Iye/bqG7TdrpqGummoVprNdilatx9lRYfZrzucBcv8bybaXti/T2iiokEk3eLuElVoxZZRNZESuFEjoHVEDlMPUNdKqtbUNO5FnH+kL4YtjC1/Xdk/AUzAX3j264S35Wwy3fEvGyy8uBzMXBZhFcWRWglSVFRcxwKlyxAwaiGuI4ju1Tz3fPDRYGTsZY7nsUTK3E7aVmzwruo2bjpuKeLjzxYSKAKtnaChNCCokIHTMUQ1L0EZRBdjLk5pgO9LDecT1jRt1XfcEY/OvanDzAR9uAzZAfSLdRQAY0g2WMoY6nOcCbeUgp7AAwKRfFv+j6tbGx49gXXEZER8pL52tjI8gztDHRY2Aaehd+yPZRpXpgbc7mG5i/MN1AntYgXQXlJ5ie5h7bSHwZxRtcH5H4RrxibUeZOa2I1vmWm45m4dyLgxSJu20QsqV65jhMYNHpCimYoCJdw6FHeavWddH+j33NcOVLgvJvxZ28gwlM8pZQavXmIEHdwKOCvCufRjqVF6RVZmTaJUyEKnoY28ddNg+zGo7ciq/MUpSoUUpSgFKUoBSlKAUpSgFKUoBSlKAUpSgFKUoBSlKAUpSgFKUoCkePg/FiGE0A4Sck2/ZL4s4greV7TkV6QVgbfTIoo9dM2YpnI7dgBCARJQNogY3v7apzsTuMbMXGXgfIc1lPL8dkBC0MrStuWnf7aCRiXk7GIERMk6eRyYF7msIqG8Bk0hEgFHYHujXTxucNWYOJCxLfRwFxOzeKrvtK62s9ETccko5ZPxRA5TMJFmVZIHjRUD+JMxg0MUhuumgxrs9eBK4ODhPI9+ZRzIW+8g5bvM1yXtPM4EsWyBblgkkg2aFUU5aZCgPiMcxjiYREfIKulia3NK5y1O1cje1WiuzrR7Y+7PRsnhJW/Rub6Etu85JUsodkDQEeRoJdpd+/drqOmnv1a+R/9IDwthzLtw2JKYbuCbsLHt9IWPf2WE7gi0AaTO9NFZROLMsDty2SVOBVF0ybSju2gbQu7YuW4GAlO05iu0c+igKYxmGVLB9RvoTXmb5I77vve+d0038vlckfLdv/AHNa2XP2DCKvEleGR7BzjZkfY+QMinvG5oK4MGQ05OIOljlUeNGUs+5nd2y5wEdhkD8rUdnUxhG6MlmiWwXbcWvevGDOcMeN+F25rji7ZyWax7guKJuSMUkmj8htizv0GCvfjxyZ9dzwpNm0hhABEu2oLg3tSuISwrIz3cl74vufL8lBcY112BZUfFgwimUFDNCtzoA/kVSpN2bZMDHKC7gwnOdQpRE3US9nPXYP3FxCcTxcx31xQwK8ITJLa7mj76ErJK8WBEFSKJxKE+gumcWhRIBSCoic5C6BqIhuHxkzsF5i6pN/dFucTkGu+c8TNy5bQhryxiSXgj+mG6KAx7tgd6UHZ2wJb0nAnJ1Ob2ouuoPKPMbPdnXx62R2iWBHea7Ost9bq0PdT+3J+FeyDZ4DWQaCTmlSctjnRcpCChDFWIO0wG1Cr5rXLsz+AV72eGJrxxa7zClenqryXK3cEglaycR3Uz0qO5tyUllExAopCIGTBIuhtATKBQrY2sWVXsKUpQopSlAKUpQClKUApSlAKUpQClKUApSlAKUpQClKUApSlAKUpQClKUApSlAKUpQClKUApSlAKUpQClKUApSlAK0avyNvXg8v+5Liu3MDi6YR9ORcnPpOpRaNbNOdLOjR/pB48dKot+YquQiqqJEkgbRBURREHCKZN5a/PIRHePKL7Z7vw+697r8NCNXI5hvJcfmbE1tZbiYh3Htblg2sm3ZPylBZAiyRVAIfaIlEQA3mURKPmAiAgNVPcHaK4egOJ65eFhHGWUJmUs5iyXumftbHT6XjIxV2h3hs2UOyIqtzTpCBw2pCTToJwEBAL9rUzg6+ygcY/wB/WD83qAtn16OJP4D5a/EPdn6Mp69HEn8B8tfiHuz9GVbVKuhdSpfXo4k/gPlr8Q92foynr0cSfwHy1+Ie7P0ZVtUpoNSpfXo4k/gPlr8Q92foynr0cSfwHy1+Ie7P0ZVtUpoNSpfXo4k/gPlr8Q92foynr0cSfwHy1+Ie7P0ZVtUpoNSpfXo4k/gPlr8Q92foynr0cSfwHy1+Ie7P0ZVtUpoNSpfXo4k/gPlr8Q92foynr0cSfwHy1+Ie7P0ZVtUpoNSpfXo4k/gPlr8Q92foynr0cSfwHy1+Ie7P0ZVtUpoNSpfXo4k/gPlr8Q92foynr0cSfwHy1+Ie7P0ZVtUpoNSpfXo4k/gPlr8Q92foynr0cSfwHy1+Ie7P0ZVtUpoNSpfXo4k/gPlr8Q92foynr0cSfwHy1+Ie7P0ZVtUpoNSpfXo4k/gPlr8Q92foynr0cSfwHy1+Ie7P0ZVtUpoNSpfXo4k/gPlr8Q92foynr0cSfwHy1+Ie7P0ZVtUpoNSpfXo4k/gPlr8Q92foynr0cSfwHy1+Ie7P0ZVtUpoNSpfXo4k/gPlr8Q92foynr0cSfwHy1+Ie7P0ZVtUpoNSpfXo4k/gPlr8Q92foyue2OMjCd05Dg8WJIXrFzVyqOE4JC5sYT0Qk8OggdwqQi71kkluKkmc+0TgIgUdAEatOqI4lvruOHD+d9w/NuQpoTUveteuJDtJcOcNmbk+Hd9ifLF7Xb6mELgdxmMcaP58WUes4XborLi1IYE96rdYoAP7z3tQ12FrUyzfs5GQf6rlrfOGcoGTht2jmCF26a6uLc9omOQDGRU4X76EyYiHuR2w4hqHl0EQ+ARrk9kXwJ/Ftnj8l6+/0NV70poXUoj2RfAn8W2ePyXr7/Q1PZF8CfxbZ4/Jevv8AQ1XvSmg1KI9kXwJ/Ftnj8l6+/wBDU9kXwJ/Ftnj8l6+/0NV70poNSiPZF8CfxbZ4/Jevv9DU9kXwJ/Ftnj8l6+/0NV70poNSiPZF8CfxbZ4/Jevv9DU9kXwJ/Ftnj8l6+/0NV70poNSiPZF8CfxbZ4/Jevv9DU9kXwJ/Ftnj8l6+/wBDVe9KaDUoj2RfAn8W2ePyXr7/AENT2RfAn8W2ePyXr7/Q1XvSmg1KI9kXwJ/Ftnj8l6+/0NT2RfAn8W2ePyXr7/Q1XvSmg1KI9kXwJ/Ftnj8l6+/0NT2RfAn8W2ePyXr7/Q1XvSmg1KI9kXwJ/Ftnj8l6+/0NT2RfAn8W2ePyXr7/AENV70poNSiPZF8CfxbZ4/Jevv8AQ1PZF8CfxbZ4/Jevv9DVe9KaDUoj2RfAn8W2ePyXr7/Q1PZF8CfxbZ4/Jevv9DVe9KaDUoj2RfAn8W2ePyXr7/Q1PZF8CfxbZ4/Jevv9DVe9KaDUoj2RfAn8W2ePyXr7/Q1PZF8CfxbZ4/Jevv8AQ1XvSmg1KI9kXwJ/Ftnj8l6+/wBDVl8a8dGBMqZMjcQQrHIcTPzDVy4iWt6YduW3k3hG5SmW5S8pHt0jmIU5REoHE2g+VXBVEZ3+vnwF94Xf/gmlNCal70pSoUUpSgFKUoBSlKAUpSgFKUoBSlKAUpSgFKUoBSlKAUpSgFKUoBSlKAUpSgFKh9iZ/wAMZQyFdWKsdZIi5ufsgzUl2sIxwCwxSrgVwSRWOXUhVdW6u5LXeQCgJilAxdcIpxfcPKOYVsFOL9OlcDd4dkqZWHeEjyvSM+/HZekBSBoLorTVwLYFeaCQCcSbQEQAsutTODr7KBxj/f1g/N6rwwVxUYN4kjPk8Q3Y6fKMGbV6qk/gnsedVk65ndXqJXaKQuGq3KV5blIDJKcs+047R0o/g6+ygcY/39YPzeoQ2zpSlCilKUApSlAKUpQClK4nT1mxJzXrpNEv75U4FD++hUm3ZHLSsb6s7Q/hVHf/AN6n/wDWuyzmIqQ/5BJIL9NfaVim6f2DUUovZmUqdSKu4tfA7NKUqmApSlAKUpQClKUApSlAKUpQClKUApSlAKojiW+u44cP533D825Cr3qiOJb67jhw/nfcPzbkKqDL3rUyzfs5GQf6rlrfOGcrbOtTLN+zkZB/quWt84ZyhGbZ0pSoUUpSgFKUoBSlKAUpSgFKUoBSlKAUpSgFKUoBSlKAUpSgFKUoBSlKAUpSgFURnf6+fAX3hd/+CaVe9URnf6+fAX3hd/8AgmlVBl70pSoBSlKAUpSgFKUoBSlKAUpSgFKUoBSlKAUpSgFKUoBSlKAUpSgFKUoBSlKApiJxZkjHPEXmDPVq2bHyidyWPbza24osmVqaQkGBpc6qSpxIYEQMLxuAKiBvMw6eHrR2VOB/PuUpG4OHxWHZMLMl8sTF7FyInMEMuRB9FukgZFagAKg5I7dCTdryu7JgIH3jyg3YpVuSxrdwi4cz3G5WJlbOGP4y1DwmJ4WyWkbGzSb0JBdqsus5elMmUAI2ETpFQKcAV0FUTkT6ANS8PXDdhTKXbC8VGWb9sdOQuG2HdgFgpEz1dMWoBEIOwACEUKQ3t7VA/iKP7Xp5CIDvXWpnB19lA4x/v6wfm9S4NkUcUY/QlW82lbpQdNbiWnUFe8KeCQVaqtFF9N2giKCyhNo+EN2oAAgAhwMsK4xjkmqLO1iEKyiZGMah3lUdjV8qks6T6n68xRBI2o9S7NCiACIDKaVCkUcYQxa7ZO45xahDIvoNhDuid6W9sZMlFlGqOu/UAIZdUdweId/iEdA07K+KMfuZF1LL26Uzh7cTeddKd4U8cgg3RbJL6btAEqTdEm0PCOzUQERERkVKAjsVijH8I8YyEXbpUlo2Skn7E4OFB5Th+sos7U6mHXmKKqG0HUC7tCgUAAAx48PuHxtMLHGzSeigs31KA072tp6H5fL7ru37tNvTfrv/AOlUypQEdlsUY/nXr6RlbdKstJSEa+enFwoHNcMFk12h+hgAOWokQ2gaAbboYDAIhXXkLAxbbR0rrkIlFsMdcC88k5Ucqe1v1myrVRbTd1EyK6pNmgl8eoF1ABCTO3bdi1Ueu1SppJEE6qhh0ApQDURGtfcpZKeX5LCm3OdONQOPdUBH3X/TN90f7g6fDror140Y35nq8J4VV4pXyrSK3f8ARd2dG7pWyVkm8LY1plYMWEPIRLRYzhQyvc3qiSjpINTDtBQ6CQ6jqcNnhMXUQGDSmNbLmyuSy8Qdz3uLZRzgVniphO1aKKKN09d2oAQyqg6h1Hd1EQANM4YxSlExhAAANREfeqDXZxOcPdkLGa3PmS3m6xB0O3LJEVVKP3SJiYwf2hXiV8XbzVJ2Xd2P1LhfAV/hYKg5v7sXKXxsmzPq45staQXlFYQouHM2lLrqc5TxPUm6bcium7QBBJJMu33Ph1ENRERReOrNhXrSQjIUElmD1+7aKAuoIprPFjrOT9Tdd6hzG0HoGuhdA6VXfr9eEzzDLqIh8IRLz/JrLQvGFwvz5gIwzlbxBN5A8fA397/9XbXKsdhG7KrH+Zfqe5U8M8epRzTwVVLvTl+hMmNj23G2wezGbZwWLUtH1LnZGfrGIMTsEndepxHbtEQ3e76+6qakvNm9dvXd0WmykjyUlHSD9QyiqR1nLBVJZopqQwFAU1EUzaAXQ23xAICIDEIG7rUupEHNr3PHySYhqCjB6msXT4dSCNZGuyGIqJXjI+bxPCMDUbjWoq/pZ/0ZZMBfWFBkGcjIWQ5YumVxOJ1ssRwdUicgugs3VX90AiJknCxdolEob9QABABDPQdt8N8hHs4uLKxKiygn8M0QVfLJmIxenRO5RADmAR3mbojuHUwbPCIajrTFK6Y46qt9TxK/hTh9TWm3H8V+Ov4mwrnDeLZlF0Li2k1iP4uOjnIg6V0UasVlVmifQ/QE1FlTah1Nv0MIgAAHZVxRj9eXXnVbdKLt1cSM6ut3hTxSCTRNoRfTdoAggkmTaHhHbqIaiIjryxl5WLNvjJNw3N8KCxiD/cNZxhlzI0d0QupwYPgXKVT/AMYDXRHHwe6PJq+EMSv8Oon6pr9S6ofFGP4CQZSkRbpUV497Ju2agOFB5a0g4M4eH0EwgPMVOY2g6gXXQoFDpWPLw+4fJaZ7HLZpAilLNJah2nfFtBhypmTK13b92gFOYN+u/r7qq8ZcQ9/NhDvJGLgA8+Y3EB//ANRCpjZPEDCzzpOMuJl6PWUHaRcFNyRh+AR01L/bqH3a3QxdGbtex5mJ8PcUw0HNxul0d/w3JFKYox/MuX7yTt0qqkpKx0k+MLhQOa6YqIqtFOhunLOgkOgaAbZ4gEBHU2xRj9o9ZyLe3SlWj7hczrQ/eFPa5Bwiugsv7rQRMm5XLtHUoczUAAQAQkQCAhqA0rpPEIkngvFSUU0hE7SIDVhbz6CaJd6W9rj3hkTOUNd+ogcW6I7h1MGzoIajrzSOGsaSxnR5C2CKC9j41i6EXKob27BdVw0J0N05aqyhtQ6m3aGEwAABJ6UBHVMUY/VmVrgUt0ovF7iTnVVu8KeKQTZkZEX03aag3TInt02+HXTdqNIfE+PoGQZykTbpUV2DmTcNFAcKDy1JBwLl4bQTCA8xYRPoOoF8i7Q6VIqUBDS8P2ICWsrZRbNIEWtZ6Vqqte9raGiEyHIRru37tAKocN+u/r7ryrISOKMfy7l+8kbdKopKTDCVfGFwoHNdsjonaq9DdNhm6I6BoUdniAdR1kVKAjrTFGP2Lxk/a26Ui0dcDubZn7woPLfuU1011upuomI5XDaOpQ5nQAEA0ojOOKMf2fxf8K7m3LdK2Pb8tc8VEGBwobu7Na33KiiQbjDu3GbIjqbUwbOghqOuzNURxLfXccOH877h+bchVRGXvXr8zXwb8PnGJ2191wHEDa0rKNYXhmtpxHEirvlIgyah5+bKYTGj3KBlA0AOhxMAeYAA17A61Ms37ORkH+q5a3zhnKIM2IaYSxuxYHjG0Q7KipIRr05RmXZhFdgCANTairqAFBsjuLrtU2jzAPvPu7LLFVjx7tk+axrkqsdPPJloY0o4MBXjoi5FjiAqCByiDlbRM2qZNwCUpRITbIqVCkQDBOMQgW1tBDPO5tLXdW8gn6cebgj3HK5qYn5u4xx5KeiwiKpdB2nLuNr2pPENgzDh26kIt0Y71KNTciSWckAxWDgzhqAAVQALtUOYTCGgqAO1TeUAKElpQEdHFVjjMjPjGue9DcITgn9KONvfu5gz37eZt28gNvK05e7x7d/ir8xWJLDhXTR7HRjkijEskVsJ5VycCg/cFcOtQMoIG3KlAS7teWHhT2FES1JKUBD/AKA2MPU+4tf0M97k6tVtbiyfpx5uGOQBQEkwPzd4HAFVNVgEFTahuOO0unefYqsiRdvnruOcmUkZxlMOxLKOCgZ40BAEDgAKABCgDdHVMuiZ9o7ym3n3SKlAR1hiqx4x0xeso1yVSOm3su0E0o4MBXbvn884gZQQOU3eFdEzakJuDYUuwu3ojgXF424haYwz3uLa1HFtop+nXm4I1YEwUTE/N3icQSJosIiqXQdpw3G1mFKAjcriWxJt27fSMY6Oq+GMFyJJVyQDdwcC4a6AVQALtVERNt05geFTeXw1+gxVY4TJZ8I1z3otwmnCn9KONvfhZizE+3mbdvIES8rTl7vHt3+KpFSgIzGYgsGHXaOY+LdEOybySDYTSzk+0j9cjh0AgZQQMJlEyiUR1FMAEqYkKIgPWNgnGRoRzbowzzujy2WlvuCem3m40e25vJTA/N3FOHPU1WAQVPqG45tpdJfSgI67xVY7529fOY5yKsjPtJp2Yso4KBnrYiCaJwAFAAhQK2RAUi6Jn2iJimE5xMjsVWPFOmDxjGuSqRsw/lGYmlHBgI6eGWM4OIGUEDlMLhXRM2pCbgAhSgUu2RUoCGmwFi09ro2aaFe+j0LQVthJL0683hGKEIQ6Qqc7eKglTJ7eJucGgiBwEREe/L4nsWdfO5KTjXJ1ny8Ys5MSUckAx49wDhqIAVQAKBVQ1MBQAFA8KgHL4akdKAjpMVWOSZSnyxrnvSNwqTiZ/SjnaD47M7Mx9vM2iTkKGLyhDlgYQOBQOAGDijsO4/iVGqrGLdFMyYSTNuJpd0fai/XTXdFHcoO4TKJEEph1MmACVMSFMYBk9KAiJ8G40UiXcIeHed2fW6yg3JPTbvcZi0FYUEwNzdxTlFwrqqUQUPuDeY20uncc4qsd28eP141yKshcLacdGCUcABnzdFBFI4ACmhSgRsiApF0TMJRMYomOcTSKlAR2MxTY8O5YO4+NclUjJaQkmYnlHBwI5fKLKOTCBlBA5TGcKiUhtSJgYAIUgFKAY4+AMVqWmnZBoV76NSs09qkRCeegcIoyZUzJcznbxU2kKHPE3OAQ1BTUREZnSgI7MYqseekHkpKRrk6795GOnRiSjggGVj3BXDUQKVQAKBVSgJilACqB4VAOURLRPFNjpS6E6SNc95b3ErOInGUciUHyjRRmc4l5m0SCgqcvKEBTARA4FA5SmCRUoCLsMNY9jAagzinRe5RkjHtt0u6Ntbvlkl3JR3KjuEyiKYlOOpkwASpiQpjAPGtg/Gy8e7ilYh4KD6BYQzkoTTsBMyZnWO3IBgV1KYpl1dVCiCh9wAcxgKUAllKAjrjFVjun7uSWjXIrPribzjkwSjgAM+QQRQSOAApoUgJt0gFIoAmYSiYxRMcwmpnJ9qQdm8auB4i3myiSCxr6fKFVdKLCK7pNFysbcoYwgAqqqCBQHaQBApQKUpShsRVEZ3+vnwF94Xf/AIJpVQZe9KUqAUpSgFKUoBSlKAUpSgFKUoBSlKAUpSgFKUoBSlKAUpSgFKUoBSlKAUpSgFK0N4Tc3P4/K1gX7dmfJR1JXXb99SGaoefvBVaPt4Y6RQIRTuyyooxRGapjMw5ZUinIcwqcwxQOE7yBYka442JaYsPKt/RqOOLWUvK+gdZQnFIhy8eEdJx0cLAXJ2ybYpWzp0smmjqXY0AobVDFG2Jc23rUzg6+ygcY/wB/WD83qxfZf3Bcdt3HKYUvq9xvSdJju3Lhe3rGZimLsYPAci7R02yI7WKpzoKLByCkIsmco7SgkBa6XCcOVvZieLEIVO3xs/bZXpwzo6/pIHXqfL3fkAUOUKWnM37h3e52+/TmL3N1KUpUKKUpQClKx113E0tS3nU88ENrdIRKXX3ZvIpf7R0Co2krsyhCVSajFXb0RXHELfwgJbFjFveBSQMUf7Sk/wDmH+z7tavZo4jYrG0u2x5Z1vr3Te0kTWNtmOOAGKX/AGy5x6IJB5iY3+7UQ/XE7n647WdtbNsBiWXyBd65yQrI3UjcBHxvFvPakmGo9egiGnkA6c+BMAwOFIZd0u8PL3PLn59yXM8Dc4frj1N4h6lTAfckDoABqOo6jXy2KxNXFYhwpO1t307Lv+C3fJH73wHgmA4DwinicdHNm9ynezqPZyk1qqaemmsmnGLVnJQ9pwyZDy9pNcVOUXj9NYQN6i7YcnZxSBf9moYogo4H/pCIaDqACIaVYdnYGwrj9Iqdm4rgY8xA0BZGLT5o/wAqggJjf2iNS2uwziJWQ/5BGOF+v+pRMb/cFY08JQg7qN31er+bNuN4/wASxNPJOrkp8oR8kF/pVl8Xdvm2zqkSSTICREylKUNAKAaAAfBWGmsZ43uQgp3Dj+EflN7or2KRVAemn7oo+90qYBYt7CnzgtCT26a7u4qf/Sus5t6fZhq8g3iQB581scv+8K6ZUm1aUTx6OOjTnelVs+0tfwZTtw8EfDBcKvegxSzjXIDqm6g11WJ0x+EOSYofhAax3rUb2tgeZiniqvqI0D2ttMrpSzcn3ATXKAgH3N1XOICUdBDQfgGlcjwWEbuoJPqtH81Y96n4l47GKjKu5x6TtUj/ACzUl+BS4IcdtkF0Te2LfLcgeaqa0W8P/wDDuSDWv2biay3bBRHJnCFeTUClATK2y4by5A8tR9rMUQD+zWrlpU+jVI+5UkvWz/NX/Ez/AHzha3/qcHSk+sc1N/KElBfyFOtOPDhuBx3C5rokbedgOhmlwQLpscv8oimJQ/DUwgOIjAt0FAYDMtsORHyTJNoAf+0omAQ/BUteMWUi3M0kGaS6Rw0OksmBimD7oD0GojcPDpgO6hMa4MM2y5ObXcqaFRBQddf3YFA3vj7/AL9MuOj9aL+DX9X+RPa+GKu9KrT9Jwmvk4Qf/wBzJYxk42TS58bIIOCD5HQVA4fhAa56qF/wI8LDxQzlpjAseuI6lcRUo6bGIOuuoctUA/u6VjJLh/zfiFL09w6ZnlpQqGp1LQvh53xq6L/s0lx0OgPwddBHTUQDWjrYqGs6d1913fyaX4XMo8P4Finkw+LcZPb2tPJH0zRnUt6tJdWlqbr4DyKrMMxs6YcCZw2JuZqHHqdIP3P3RL/u/kqyq0g4auJFhkjdNR8Y5hbkt16CFwW4/wCi7FcPMg/v0zBrtOHQwa+Q6gG60NLNJ2KbzDA+5FykVRMfuCHkP3a+g4fioYmgmnc/IfGHAq/BeJuNSGW+66PfS2jTTTTWjTutDs0pSu8+RFKUoBSlKAVRHEt9dxw4fzvuH5tyFXvVEcS313HDh/O+4fm3IVUGXvWplm/ZyMg/1XLW+cM5W2devzNbrjRa9tddhuDKDxe+kB4Zra9NlydKyLVEqPp+b2CgLFBYxj7tdQMABppoNERnsDpXVhBmTQrQ1xkalkRap9/KyMYyILbQ3gmJgAwk3a6CIAOmmoV2qhRSlKAUpSgFKUoBSlKAUpSgFKUoBSlKAUpSgFKUoBSlKAUpSgFKUoBSlKAVRGd/r58BfeF3/wCCaVe9URnf6+fAX3hd/wDgmlVBl70pSoBSlKAUpSgFKUoBSlKAUpSgFKUoBSlKAUpSgFKUoBSlKAUpSgNGe20sji0ybD4ixxw93hlW37bn7xfR15zeHXp20oydrR6qcMq4WTEDpRwSBkxcn1ApU+oiA7Rqs/8AR7neVnNzZaPe0lxDyrEbes9J0+4gpB6s4j59NB/6WjGXegDegkscpuYQAEQVTKcB2lMbrds1h3hhwTfLfiCyHf8AxXT915JfuAi8f4XycuzQTRjYznvHKbcRKmgik2bCqoICIiY4m06mEJV2Dd4Y/uCTyxFWVY3ENBHQYWu9WS4gMgBNLOUHaT9ZsuwJuNyUTpiBjKgO1bcQA6omrL6pj9Y9iNKUrEyMGnjLG6L6YlEcfwhHNwpgnPuSRSIKSZQKJQK4Nt1WACiIaH16CIVlUIyObO15BtHoprutveliJAB1toaF3CHU2gdA18grnpQGHs7HlgY7auGOP7Hh4JB45M4dow8ak2Iusb3ShwTKAGOPvmHqNaycHX2UDjH+/rB+b1bZ1qZwdfZQOMf7+sH5vUIbZ0pShRSlKAVQ/Gzm23MXWa5kbjf8mOhmgvpESj1Ob3KSQfCYwjoAe+Jy1eb563jmSr92cCpIpmUUMPvFANRH8Feu3N0044s+KxPGqoipbFmOU5q7yeabp6YNWbIf3xSlDeYo9BANB6gFeVxbFSoYfLD3paL++i3fZM+8/Z9wSlxXjDr4nShQjnm10XJd5O0Y/elHkc3C7ji4nKkhxG5Xa6XdeRCqEbKBr6IjvNBmTX3Ph2mP5CJtNQ1ARHY/H+H7hvgCv1B7kw1/5SqTUVP+oX3/AOXoFZfDeIi3GJbnuZuPcSj+xm5uneBD3x/6If3/AMnndKaaaKYJJEApShoUpQ0AA+CtWA4dGnSWbb8W+bfqej4s8ZVsVjp+xspbae7CKVowivuqy+Gt3cjVtYgsW2SlMhDkdLB5uHoAobX7gD0D+wKkqaZEiAmmQClANAKUNAAK/VK9iMIwVoqx+cVsRXxE81WTk+7FKUrI0nVewkNJAISMS2cAPmCyBTa/hCsJI4gxzJ6ita6CYj77cTJ6f2FEAqS0rFwhLdXN1LE4ij/hza9G0V5I8N1nONTR8o+bG94BMU5Q/sENf76wUhwzShB//C7oQUD3gXbiT+8BNVwUrTLC0JfVPSpcf4tS2qt+qT/NXKGe8PuRGojyG7Rx/wBi6AP/ABgFYt1iTIzMRKrajg2nvpCU/wD4RGtjaVqeAovZs74eLOIx96MX8H+prC4sy72gaubWkUw08zMjgH+6seokoicU1UzFMHmUwaDW11dCctiAuVsLSdiUXJRDoKhOpf5B8w/srXLh6t5ZHbR8XyzfxaWnZ/r+p68eJyzJzHs804ssXMTGl7eS2XVHIBp6ZiNQFUpg8hUTAN5TD5AX39pQrcLhFylCZDsBFWCkiumS7dN9FrF/dt1Q3eXvaCPUB6gJtPeqP5bw4rZ5TyEeQXUStqVQFC7hR16bT/CUfLX+wfu698Etzetl4jpThpknYkhzmNM2cZQ3T0a4OILtg/7FbUwB5iAiYeleTTzcO4ir6Rno/wDN1+P5pdT73HOh4y8HT9m81bDLNF83TT1i+9Nu6+5KX1Yo3/pTz6hSvpz8OFKUoBSlKAVRHEt9dxw4fzvuH5tyFXvVEcS313HDh/O+4fm3IVUGXvWplm/ZyMg/1XLW+cM5W2damWb9nIyD/Vctb5wzlCM2zpSlQopSlAKUpQClKUApSlAKUpQClKUApSlAKUpQClKUApSlAKUpQClKUApSlAKojO/18+AvvC7/APBNKveqIzv9fPgL7wu//BNKqDL3pSlQClKUApSlAKUpQClKUApSlAKUpQClKUApSlAKUpQClKUApSlAesfta+JOad8UOOsRXt2ZOWLuc27kJI+J7wsi/WUea53CkcKr9gVEwGUOzUbd4QdEOAFFJM4icgCA12uwHsuHx9lXOePrgxJma0rwtWPtSIcR+Z77ZzLlnCESkDRrFkDZJME2iJBU2nHeU/M2lNqmcAlfb6yGNrfs7Dlzv47N6GRW2QFksUXFgWMavplhJKM1AWRM2cLJg4SWQA4GTLqYQTHUQKBwNRHZP8cmCMIcTtz2hnGxeKt5lbKN3Qtr3jk7OlmNGTZnI8hQYeIOk1cH9HlVKsoKJRKIKCpru2h4cvqmPM9vVKUrEyNe8C8cE9mDI9uQs7iJtC2tkJnNusb3AhcYunEglGOU0j97bC3TK0FdJTvCIEVXAUyGA4pnACjgXfaTQkZxM3vhuZj7GYW7Ya7xOTk3t/qkm3ndYZOTcC1jO4CktsBQxBJ3sqmxFVXZtKADmrC4B3eOZxORtzP8ym1tqHnmGLmRoVmYLUGVXKsqrqYog9MjsKkgCpQKRHcQ4KiYT138kcECmZr4BTLma5aesVC4nM4yshzGNyik6XYLsjImeFAFTNSkcrnIloBwMYAFUyZQTq6E1O3wycVl95ivJTHuXMNtLNmHVkRl3wbdhcoyZHEW9UWTBNYwtkOS7ROkAKplBRP24gkVP4ttF8N+eMUY77XritxreN2Azm7geWAaHZCyXU7wAw6LYPGQgkL7c4RL4hD3evkAiF+8NfCS7wTcy163fmKVvaXStKOtWGeyceg2FlDsjrHSTMVEABVwodYTLLjoBxTT2kTAug1jwdfZQOMf7+sH5vU5jU2WSyTZS8khEJTYC4cTisOin3dTxPU26jk6Wu3QNEUlDbh8I7dAHUQAeFrlnH71Nss1uADldxr6Qbj3VUN7dmqmk5P1L02HWTDQeo7tSgIAIhI6VCkbWy7jtu0cvlriAEmcQylHJ+6q+Bo7OqRup7jrvMioG0PEG3xAGoa9hbJNlN3ziNWmgBdpOIw7gnd1PA9VQSXTS126DqkskbcHhDdoIgICAZylAUFxq8W2O8N8P8jdqc6VVV0tIMWDcUlCi5cs1TorIBqXp7eTla+Q6iJREOtUNwFWbaUFi0t35AuXc4lYRS+71kxbKiZRFYvNEQAC7tCk0LsDxeEwgGo6V3uMiYdcTXG3a/DnDgZzCWQVOcuREnUqzrdtaNze9qKgiYSj5lAPgrc3H1nNbItlCGRABV03ulQD3ag+Y/ye8H3ACvDpxWP4nKo/cp+Vev1v0+D6n6nisTLwl4IoYODtXxf8WfVQ2pr5XnbZ5oPkcbrINiW8o4iHEsVAY13HsV0StlNElXipEWpA0LoO86hC6h0LrqYQABGv2jkmynEg3i0psBXdTi0Ogn3dTxPUkFXCiWu3QNEkVDbh8I7dAEREAHOUr3D8sepG2+W8eumzZ2hcIGTeRT2Sbm7qr42rRRJNwp7npsMsmGg+Id3hAQAdPLnLePWaDlw4uECkZxbKRcD3VUdjZ2oom3U6F67zoqBoHUNviAAENZHSgMGtkmykJBeKVmwBw2nEoddPu6nheqt03BEtdug6pKpm3B4Q3aCICAgCMyTZUw8aMI2bBRV89ftGhO7qBzFmSx0XJdRKABsUIYuo6AbTUoiGg1nKUBFAzbjAbbG7gugPRwWqFyC47mt/+WCQTg427N3uQEdmm/8A6Nd+RyRZUS5eM5CaBNRhIMWTsvd1B5a7xRNJsToXrvOqmGoagXdqYQABEM5SgMGhkmynL1tHIzYGWdzi8O3J3dTxvUUVV1EtdugaJoKm3D4R26AIiIAPWSy9jtdk2kUriAUXkO8lWx+6q+No0OkRwrps1DYZZINo+Id3QB0HSS0oCOu8sY/YFcnd3ABAaRzF84/Yyo7G7xVRJsfoXrvOkoGgdS7dTAACAjzK5JspGTWh1JoAct5xOHWT7up4XqjZN0RLXboOqKpD7vchu0EdQEAzlKAwcXkmypp60joybBVZ87kGzUnd1A3qsljIOi6iUADYoUxdR0A2mpdQ610S5txga2z3eW6A9HJ2qW5Due5rdIwxDHBxt2bvclMOzTf09zUqpQEenr7x+VORhp2TIJWr9lGyCJ26hgKu9Okm3T6F67zLJhqGoF3amENBENEe0CiYzHbiFzRZD4ziVse6lwjtrY4GetyJqjIMxEQAA2oIqmEwiBfaR0HUxdfYfUPzbjtlkax3UWuyIuqmicU0jl1BUol0OkIe+Bi6hp8OlcHEcIsXhpRW/J9+Xyep9Z4N8Qz8O8bp15a027Ti9nF6ST7OLcX2ZgsL8S2L8iYjt6/mV1Aq2lLXcTCC/dldVGbXkgusIbdQ056I7R8Q8zoA6DpLH2VbBjTOCPZ8CC0YsHjgO7KjsRerKItj9C9d6iShdA6l26mAAEBHVXssLzeY/l714OLldqGcWbJC4t864juXi1xFREQEfdCACJR06F2AFbl1nw/E/SsJGo9Hs10a0a+Zz+LeDfuHxBXwkXeF1KD+1TmlKEvjFr02MGpkmykpVWFUmwB0jOEh1Eu7qdHp2pHZUtdunVBQh92u3rprrqFeIvJNlTL1rHRs2CqzxeQRbE7uoG87FcUHQaiUADYqAl69DeZdwdaztK7D5sipc2YxPbql2FucPR6Vrp3Eo47mt0jDkMcq+3Zu6lIYdmm/p7nyrvP8k2VGOHjV7NAQ8fKMo52Xu6g8ty7MkVun0L13iukGoagG7xCGg6ZylAYNtkmynjpoybTYGVfTTmJal7uoG94gRZRVLqXptK3VHcOhR2dBERDWiM8ZIsq6OL7hbQgpoFzzU1c0lGB3dQvOapW86Iop4iht0MukGhtBHf0AdB02TqiOJb67jhw/nfcPzbkKqIy969fma+NDhg4M+2uuy4eJzLzC0WU3wzW03il37ddQHCpJ+bMcocpM4gIAID10869gdamWb9nIyD/Vctb5wzlEGbENM44pfsDyjS82526chGsTqAmpoDiQBAWafufNUHSGnvBzA1066dllljHkg7ZMWV0IqLSM88hWRAIf21+1IudwgHh90QrZcREentY6CPTWRUqFIgGe8QjBNrmC923cHlruribOeUpopFtuVz3IeHXaTnJah7rxhoA9a7UpmHGsM4dtZS60EVGKUaq7KZM/tZJBwZuzEdC/61UhiBp5CHXQOtSWlAR0csY8CZG3xuhHvgXEEEKGw+vpHuYPe7+503d3EFNfLTprr0r8xWX8bTbpoyirrQWVfFkzNCFTP7YEe4Bu8ENS/wCqVMUg6+Yj01DrUkpQEP8Ao+4f9T7i6vVw29HtbVbXI4c8pTaSKXBQUXQht12mBFTQPdeAdQDpXefZYx5Gu3zF7c6KasbOMoZ8QSH9qfOwQFugPh90cHKGgh0DmBqIddJFSgI6wyxjyTdMWTC6EVFZKbexDEgEP7c9Z8/vKIal8yd2X1EentY6CPTXoDn7DwW4hdo3y29HObUcXMg65Sm08SgCZlXWm3XaUFUx003eINA86mIiBQ1MOgB5iNdBzdFtMh0eXAyREPeVdEL/ALxqNpbmUYTm7RVzFSuXsbwbt2wlbqQRWYjGA7IZM+qfpBwLZnroX/WrAJA08h89A61+gyxjwZktvhdCPfD3EaCKhsPqMiDMXot/c6bu7gKmvloGmuvSu0bIdiFESmvGMAQHqHfSf/WuZO8rRWHajdEccdNdCvSD/wCdTPDqbHh8Qt4P5MxcZmLGkyu0bRl2ILHfN5JdoUqZ/bE49cjd4YNS/wCqVUIQdfMTdNQ611hz1iIsI5uMb3bdyZ2y0uFy45SmicY65vIcj4ddp+QroHuvAOoB0qUt37F2Xc1eJKB8JFAH/dXNWRpaa3I67yxjxg7esHd0IkWjp9pCPSCQ+qT90RBRBAenujlcoCAh09sDUQ66I7LGO5Z0wZR10Iqqycw/imBCkP7c8ZGWK6RDUvmmLdYBEeg8sdBHprIqUBDTcQOHCWujehr6bBFr2grdKLzlKbTQ6RCHO70267AKoQdNN3i8q78vlvHUC/dxkvdKKC7BeMRdpmIcRSUkHANmRR0L/rVhAgfAPnoHWpHSgI6TLGO1JhK3yXQiLxa4VIJJDYfU0iRmd6Zv7nTcDdM6mvloXz16VxR2ZcYy6jVKOu5BUz1hJPWoFTP7YgwXTbvDhqXySVWTIPviJw01DUak9KAiR87YkTiXc4e9WwNGNusp12ty1NE454KxWzgfDrtOLdYAAOocsdQDpr23OWMeM3j2Pc3QiRaPuFtBPCCQ+qUi4RQWRbj090ZNygYBDpooGoh10kVKAjsZlnHcy5YM4y6EVlZSWkIxgQqZ/bnbFRZJ2kGpfNM7dYoiPQeWOgj01xx+ITDSdpp3ye+2wRKtmnutN7ylNpoYiZVDPNNuuwCHKOmm7r5VM6UBHZjLOO4CQeRUvdCKDiPeRjR4kZM4iktIOCtmZB0L5qrGKQNOgCPXQOtE8sY7Wl0IFO6ERdubhVgkEAIfU8im0UeHb+503A3SUU18tCj116VIqUBF2GacXygNRYXegoD2MkZFromf2xqwWSQdqhqXyTUWSKPviJw0AQ1rjWznidvHu5Va9G5W7GBYzTtXlqaJsHp1iNVx8PuVDN1gAA6hsHUA6ayylAR1xljHjV+7jHF0IlXYXE3gnaYkPqnIroIuEm4+H3RknCJwEOmigaiA6gFM5Puy3b041cDzFryhHjZE19MVVUyiAFcNU0WzhPqAdSLIqEH3tSDpqGg1sRVEZ3+vnwF94Xf/AIJpVRC96UpUKKUpQClKUApSlAKUpQClKUApSlAKUpQClKUApSlAKUpQClKUBof25kfbEJbGJ81qZGypj26LHu948tXKuN8eDc7a2DKszIOBlGQDqZosicU9QAR1DTQQExRq7gW4N+Gni7nG/ECHawlz1ez3KVt3zfz6IYMow8iEAi4LERykYmbmR6CK7gFjbiaqCmBRAuu4Li7bnNBcVY5x7AG4s8r449U9zrshgsH2eSVui6ilbioZu0OYQFoCRQFQypdR6lDQdaozs5uAPs1OJS9Esx4YwBxJWFkfGF9wd0yGTcyNnjKcuhfeuYWx1nSihHLdUqB03JEyJ+FUgagJgEMl7pg/ePalSlKxMxSoraWdMK39fEzjKxst21M3Hbpts/Axc4gu8jh3bRBdEhxOlobwjuANB6efSuMuf8FnysbBJcy2sN7EQFY1ohPt/SQEBMFRMLbfzNOWIH9z7kQN5daAl1amcHX2UDjH+/rB+b1X9iHiR4eOIE0gXA+drPvQYnlelQtS5Wsh3Pmb+XzeQobl7uWfbu012G08hqgeDr7KBxj/AH9YPzeoQ2zpSlCisBlPIMFijG85ku5nZUGEFFrPXShveKmQTafdEdNAD4RrP1qh2l83KZWkrC4HLOXN37Is2VzcQpGEBbwzQwKKiYQ6l3nAoAPv7DBXJjsQ8LhZTirvZLrJ6JfFtHveGOEw43xyjhajy07uVSX2acE51JfCCbXV2Rjuy4xZOz0BN8VeRmRgm8gTCktosGpk0T6g2IA++UiIgIf9qPwVuBWNs61ouybXYWpCtiJNWDYiKJCF0AAAPgDyrJUwOGWDwsaW7W76vm/iy+J+Nz8Q8brY1rLGTtCPKMFpCK7RikhSldC47ptqzopSdu24WMWxS/bXki7IgkT+U5xAA/DXU2krs8KMJTkoxV2+R36VE1M5YoPjNfMURejWXtpvuA0rAAeRIoJVeUYEwbAoZUQU8IgQBHUB+Cuti7PVmZhtmQu2zIe4ys48wlN6Wtd4wVcCBN/tKblIh1fg1KAgI9POtftqLkoqSu1da7rr6HW+G8QVGdV0pKMJZZPK7KX2W+T7bk1pVd4c4iWeZJh3DtsOZCtsWjYFhc3jaascit4gLsTOcfEbrrp8Go1+re4i4C4slfQwJjW/GTkXLhAkpJ2W8bxxxRA4mMDo5ATEpgIOw2uh9S6a6hWKxNCSTUt9EbanCOJ0atSnKk7wWaXOyte7t2LCpVe3RxP4jszJieJLjeTSEwsu1RRFO1ZBZqc7gSgkHeU0DIhqJigIicALr4hDrXPlvibwJgZ+1jMxZQi7dWeoCs0LJqGICpANtEQHTTz0Dz9+q8Rh0m3NWWj1Wj79DGPCOKzqU6ccPNyqLNFKMm5K17xVtVbW6J3SsBdGVcZWREMbgvXIUJDMZNQicc7lpRJsm5OYu4pCGUMAGMJeoAHXQNa77O7LXkYNK54+42C8auBeRIIvCGQU3G2l2qAO0dTDtDQeo9K2Z4N2vqcrw+IjTVRweVuydnZvon1MhSuNs8aPExWZuk1SAOgnTOBg1/lCuQBAQ1AayNTTQpSlCClKUBpLxmxSnCdxaWDxiQqRkoRw+CDvESdCgxcnDQ5vgBNYd3v9FCh71broLpOUCOEDgYihQMQwD0EB8hqA8UWDYPiKwdcGKZtIBCTj1CNlNoCKSu0dhw198DaCH3QAfeqvOzSzNN5P4cULKvxXS7sev1bZudE5tT81sO1JX4RA6Wwd3kIgbTyryqC+icRnS+rU8y/zLSS+Ks/mfe8Tqf7Q+DsPjd62DfsanV0p3lSl/plng33guhsJSlK9U+CFKUoBVEcS313HDh/O+4fm3IVe9URxLfXccOH877h+bchVQZe9amWb9nIyD/Vctb5wzlbZ1qZZv2cjIP8AVctb5wzlCM2zpSlQopSlAKUqGZnzVaOGrZcTtxyrVDlIGVEzpcE00iB/rFDCPhKH9/kH3MZzhTi5SdkjfhsLiMZXjRoRcpSdklzJHcd0wVpsBkZ6QIgn+5Aw+I4/AUPMR/kqor/4oVmLRZzFnaxLFMBE8hIqlASh8PiHYX+3WtV7m4o898Uk0ubhzt1NOKFQU1L/ALpROm0ANdBBk203Lae8YQAuoaGD367Vp8B8BeUilN5fl7jybMJju3S6ync0Te/y2qQgmQo/vTbgr5+rxWviXlwkbrq9F8Hq38Fbufr2B8A8L4JTVXj1dRn/AMNLPNesbxjHupyUvuGYv3tAMEIPjsJ3OJZl110aQ4LP9R+AAblMQPwhWAJxmW6+Ppb2C8oypBARBZlZSuzQB011UMX/AOwq/LI4Wpe3GJWNn45jINsAaAk2RRbl/wDhJ1/uqTocN98qF1VkY1P7grHH/cStP0XilTWUkv8AS/zb/oeg+O+BcEslKk3brVjb+WFNW/mZqt676d7uLoOEnLOwDbdPU0nu1/6vN10+7ppXL68VsgVNST4bMtNSnEAMdSyzGAg6a6DtUER/sCtqPW1Xn/zzGf8AeKf8Ffk/DZepSiJJaMMPvBzVA/8Akp9A4j9t/wAqD8W+DpafR0vSpP8Aqmashxz4ZZCBrghrxhxATAYZKz3hNhg8wHaQ3X/7HSspCdoZw4KCVOPz73IwgGhHBHbYQ1D/AKZC/wD0rYpbh3yCl7gzBTpr4HI/+ZQrFS/Dhej8gkkrNZPS6B0UUROHTyDQw0+i8VhtJfyv+ki/v3wJiFadKS/58LfKVH+pAIDjoxy/ApofiegVRHTQi1xoCbr5BtUNrr9zSppBcV8pJ7Qiclw0jrroCSzdTXTz9xUanOCm1JIpgm+HC33XTQwmgWig6a6+YFEfOolM9njhF8Imf8MDUnjEdWsWqkGv/wC1p0/uq5uLw5J/GS/ozB0f2eYrnKP+mlP/APaBerXiPvogAJ20asA9dRQMGv4D13UeJi4i6d4txmfp12KHL1+HrrWr7ns5cBs9xmmKJuMECbDGaTMil/Jr7b/vrrH4GLDYKENF3vkWMMUm39iXi7IJi9OniEenT3qv0visd4L+b9YmH+zvgGv7taXxpJf9NZm2aHE6uAADiziD++Ej4Q/3krKRPEla7pQqctDu2mvmcggoUP5dNB/AFaZqcHBW6R0I/iXy401MIplC8hMBOuvkZMREP5Rr8qcPnEDbe5zj7i8nVDlHUrW6ohs/TU/6JjABDF/lL+CquJ8Qg/NTb9HH/wAGqfgjwhXVqWLUX96NVfkp/kewiDuGEuVkEhBSSTlIfMyZupR+AQ8wH7g13a9eFscXGbuGy4ED8RtipRzAygJFve1jKOYxTUdAByiYBUQAenUdQ1HpppqG8mI8uWtl210LhtyRbrAokVQe7LAoQxTeRyGDoYg+8IV6mC4lRxjcVpJbp6P5P++58J4m8GcS8OKNeVp0Je7OLUovtdXV+q0a5pErpSleifHilKUApSlAKojO/wBfPgL7wu//AATSr3qiM7/Xz4C+8Lv/AME0qoMvelKVAKUpQClKUApSlAKUpQClKUApSlAKUpQClKUApSlAKUpQClKUB62v9IZyDGYylOG27rg4mHGHIxnkyTUe5LgbXVlJuFAYZyQotU0yG1RVFTkLl/dFWIO05SGCp12Kef8AHmcy5LGwu1CvTiS9FjDd7G77CUg/U7zO/beVvQS53P5Zt2m7Z3Yvlu61L2jnbT8RGGeNOR4D8a2ZjbEqaBG/cM159cyJISSBVukqczEjdtyxMmKok3qKimJ0zAbTTSrV7AOe4i868J7jjc4lOLGUyLNZTdKESgjMGzSLtkkZIyLQCM0WwFIArl2qHNtKJgKkA67dw52tExveRvhSlKwMjRvh2x5mfGN24+Ca4e7rI4wrbV8luuWatW+t1LP3qKrdKPMKxQdneil3w24SFTOQhVRIoOgd64LNyFkbiXlYqS4bryty2rZveTnLPLb0O2IncU6aLXaemX0osuYUSGKsqmigmiGm1I6pzlHkE3WpVuSxqr2ddmZax7LvLHRjMkMsZw9hwbGHZZWbMU5FrMI94TcoNhakJubkblagYdBRFTqgIl5lQ/hSxotL9svxW5TLke52hIZKzGZrXZyJCRMgK8AQQXcoimJlFk9miZgOUCgc2oDr03arUzg6+ygcY/39YPzeqX1FjbOlKUKcbp02YtlHjxciSSRBOoooYAKQoBqIiI+QAHv1qxwOxyvEXnG/uPadSMZhLuzW5jcFSiGyGaHEp1y6+QLKgY2nvCB/hrO9oZkG5Jq3ILg/xTIGTu/LL0Y0yyICJo2GL1fvDaeRQS1IGugjvNp1LV546sG1cS4/iMc2cxIziIGNSZsUungSTIBQEw++I6aiPviIiPnXnS/3rHKP1aWr/wAzWi/0p3+K6H2NBvgXhadXatjfJHqqEJeeX/MqRUE+lOonpIzdQTOXEZjbADBgN5OHruUmVjI2/bcIyM7kZZYum4jdAnU2m4uph0IXcG4wahXVy1JZdyJYMd61e9LYRGYd8tzdrtTvibBptMBnDZJPUjlUDABSlMcCAI6jqACFTC1LYPb9uxMRLzTiaexbBNsaakiJ95cmAhSnVOJClADHEuptoAAj71dUp1Kl409NvM1dfDVX0+H5HhUcPhcMoVsU8yu06cZOM9ObeWSinLS3vNJ6K6kRPKNn5Wy7bMMhYGWpHHqLgoLTvd4Zu4kTJHIAggmdUTJt1CiIgY4EU6+Wmmo5VzhawbgsKJx3kmHSvNnEFRFFa8GyT9VZZIgkKuoJybTK6CbU+0BHcPwjUspWXsabk5PW/Xb5bL4Gn944qNKFOm1FQbaypKV31mkpO3K7dlojqw0JD27HpxEBFNmLRENEWrRAqSZA8+hSgABXapStqSSsjilKUndu7FKUoQV+HDVs7SFB03IqQfMihAMA/wBg1+6UGxibpsOyL4ZpR962fFzCCCm9FCUj03BEzaabilUKIAOnTUPerpTeIcV3JYRsWT2OYR1bJgKBrfWi0hZCBVAUL7Tt2dDgBvLz6+dSOlYOnCV7pam+GKxNJRUJtZXdWb0fVdH3WpErQwRh7H1jSWM7Ex1FQ1vy5lzSERFtQQQWFZME1B2k003EAA6adACoUHALwnJ2+a12mLlGzA7lFcUGVwyCGiiRVCpiBk3AGAABU/QB0HXqHQNLipWuWFw00lKCdtFotjspcb4zQnKdLE1IuTTk1OSba2bs9WuTepEi4UshDFA4YjlZlnCckU0zNbjekeJlFXmjtd83vADuHz5munh8uldfHWEmGKbEkLIs+/LoXF6Kp0JO4p5eVctFDpgUDJmdGPoUohuAnud2uodRqa0rL2NLMpKKulb4dDS+I490pU5VG4ylnabunL7TT3fVvfmV7hm1uIKxzykdmrLcVeccmmmaGkWttdwkPM4qFcFSOZJTQOWBRTIQR8WoeVdzC3ELijP8Q4k8bXKDhdgtyZeIdonbvoxbrqk5bqACiJtQEPEGg6DoIh1qbVhXFlQTKWkrytq3oprcciwK2VmTx5RVVAm4UirGLtOomUxhHbuDzHTTWsY050sqg/Kr3vdvtq3+ZuqYvDY32tTEQtUllyuCjCCto7wjFLVa3jazWzvpmq1NvxsbhB7QSFy02MDeyc3FTgbl16JNJ5IoiyXH4BVDckGv744j5VeGAb4zbcjCTtrPmMUoOdg3BETysU4BWLmkzAIlctBMYVCB08SSgbiCIBqbXUPPFJgG3uJrBc/h24DFSGTaCMc+EPEyeE8aDgoh1ASKAUR08y7g98a5sVCWKwyqUl54vNG+mq5PpdXi/U9ngeJpcC4zPCY6SdCtF0qri1NZJ2anFp2bhLLUiusUnbVFg0qleBTPc7mnDpoDJKYtr9sh8eAvpiobxlfIeDvHvakWKAKAYA0ERMAagWrqrroVoYijGpDZ/wB29VszwuKcOxPCOIVcHiPfg2nbVPo0+cZKzi9mmmtxSlK2nAKojiW+u44cP533D825Cr3qiOJb67jhw/nfcPzbkKqDL3r1+Zr4Z3vEt2112Q7PiSyhjcYvhmtpYXmMbiRjlnu+fmy7FzKt1gOQumoAABoIj1GvYHWplm/ZyMg/1XLW+cM5REZtTCRgwsM0hzSLp4LRqmiLt6oB1l9pQLvUMAABjm01EdA1ER6BXapSoUUpVf8AEpxJY34W8ZOclZGfm2FNyYyMbBudSboweBugTzMcw/2AGojoAVhUqU6NNzm7Jbs6cFgsXxHFww2Gg51JtKMVq23skdTil4oMbcK+NXF+X/LEIoICSOYE0Mu7WH3JEyagJx106B/aIBqIaiWHw6Z3477yLlriXjl2sADkHELYqyolboh+4VfCH7appoIIh0KA6CAeItWLw/cJWU+ITKBOL7jZa8qVNqNn2MVTchANR6l1Dy5whoIm91r16Dpt2zZr29FOUrWYOGiC5Wwqox6ahQOCRRAonAnntATAAjppqIfDXjfR6vFZKpiE40uUeb7y/pH567fo64vgPAmHlhOEyVXHNfxK61jT6wotb22lVW70g8usodY3DxY1ps0UXjMjwyCZSJIimBEEgANAKVMOmgeWg6/yBU7atGrJErZm3IkmUNCpplAoB/IAVXlscQMreWVl8cweB74SjWLhwhIXfLRibKOIoluAOVzlCrOCmMXaB00xL1A2ol61+ptlxVvcspGgrgsNhYyLtAyhHEY8cyrpEClFZPUFU0UTCbeBTaKaBtEQHqWvShOjCH8KLavbRfrbTufF4qhxHE4h/TqqjLLn80uXJWje0n9lpPm7LUsWlV7lnE2V8gzzd7ZXEvP2XHJtipuI2FhY5cVlAOYwq810gqYoiUQLoHh8IDp565XKWLZDJkM0iGeWbrtYzZUTneWs7QQWcAJdu04qoqBp7/hAB19+trqT81oPTbbX01/OxxRwuFtScsRHzXzaTvC32vKk78srl3sS2lQuZw24mMQIYlLl682h0UUUxupnLJkl1OWcDbjLikJRMbTQw7OoCIdK8WZh6RszGsjjv6Mt4y6z4i5UbjnJBBeRZiomBAFJQESl1IIby7iG8QjrqHSmepmtl0t1W/Qjw+D9i5Kss2a1sstY/bva3w3JrSoJhbDt0YmLIJ3Dnu772K9FMUQuszMwsxLu3csW7dIfFqGoGEweANNNR14rFxbl+176UuK5uJSYuKGORcCW7IW/HokSE5gFMSrIIkVHYGpdDCO7UNeoVFUqNRvB6+mnrr+VzKpg8LGdRRxEWopWdqiz6bR8mjW3myro7FgUqun+POIhXLQ3bG8RjJG0zOkjjaC1kIqHBEoE5iYPAXKfUwgYQMJB27/IdAr9ZZt3idk5sr7COU7Qh2BWJSqR9x2iu+OdwBziY4LJPEdhRKJA27DCAlEdeugR1ZqLeR6Ptr3Wu3rZ9jKOAw0qsIfSqdpK7dqlov7Mv4d83+VSj94sOlQ7LbbPTiEbfQImLSayRVBF56rI50uioTToBO7qpmIOvvju6e9XmQLnsuKGxIpa0lL4BBHvh3CTosUZXUOaJCgYVQLprtAREddNaydVqTWV6fj6dzTHCRnShP2sfM7Wu7x7y0sl3TZLjIImHU6RRH4RKFdF7alsSJBI/t5ksA/7RqQf/Ko3ZKnEGGN36uRmlnDd4A4GLQhHLoI0wgT2gFTqkFUNT+7EpR0KPQBEOvFiCR4jXrqUTz1bFnR6SYo+hlLTmHTrn67+bzQXQS2ae17dN2uptdNA1ntIycU4vXt+fQ2PB1qMak41Y/w3bSau9bXitHJd0ttTqXxw32LdUeu0ZNStgcJmIq3UJzW6pRDQSnIbXUBDpp5fcrTi7MX5t7Nm9hyjhuKdylhHcirP2ciJlQZkEdVHLERH3OnU6I+916dDE3GxjmfI133m5sjIHDZc9pKIoKLoS7p6yeRzghTlKBQWbrGMVQ27UCGIA6AYfeqSs7oxpkwZS2Iu5IiaPGuTNJdk0eprHZrlEQMmqUoiKRwEB6DoIaV5+IweGxiU6byTWztZp+jtp1XM+v4R4l4z4dqTw2MgsRhppe0puSnFxezzxckpL6sr3i9uafRwhmqwuIDHEfk7HE2k+jpBIDFOkbUUze+QweYGAeggOgh5CACAhUurS3J2Fco9nvkiQ4nOGKCcTthyS3PyJj9sAbykDXc9al8iqFARMIBoA6denWtrMPZgx7nnHcblPF1xIycNKoAo3cJD1KPkZM5fMhyjqUxR6gICFb8Hi51JOjXWWpHdcmvtR7fk9Hyv5fiHgOGwdKPEeGTdTB1HaMn71OW7pVVymuT2nHzR+soyalKV3nygpSlAKojO/wBfPgL7wu//AATSr3qiM7/Xz4C+8Lv/AME0qoMvelKVAKUpQClKUApSlAKUpQClKUApSlAKUpQClKUApSlAKUpQClKUBEsswOC8gsGmHs5RFqTTa6DqosLXupBs4JLGSSMqoRNuuAguJEymOYClESlKJh0ABGqv4PeCHgV4LMm5Dj+ECz4i1pi504p3e1qQ84dVNoCfe+6LAzOobuYKAq4ANpSEOCXQPANerztg7TLena1Wv9HTgd4jZqL9KLtIGXw7NuFi3THEt1RUO4JlOmVB4i5MpzykMAigicxhEBAo7odihizAmPnGT5XEPBjxF4skpI0ME5LcQ5FhdTpEweggmzOq4V3Eb6qicA26d5T13ahtytZGN7s3wpSlYmQpWovCzxJZ8vPJmM7mv7IhZeEzJFXU8JafodqgW1hjnaXdCIKpJlWUAEDmRcd4OqJlxIYgpF1TGM5Y40OIXGEjcPEQjdvpG24nL0zZKWLixDYCKNWUS6VI6K4BPvQuzumvOH2wUe7KbQS3ACtWxLm8FamcHX2UDjH+/rB+b1Z3g+yvnRzllPFeYstEvcs5iKDvZCTLDtWfo106XcIuGqQNiEAzQ2xMyHM3rBsVA6quoCWlbCy9nbFnafcWI4W4WZHJQvpGwwkAYXQyjfR5QgkygY3ehDmalOobQv8AshDzMFa6lSNKOaV/gm/wV2dWEwlbHVvZUnFPV+aUYLRX96bir9Fe72V2ewCormrNGPeH7GsplbJ86mwiYpAVFTmEN6x/3KSZRHxqHHwlKHmI/wBta43dxf8AacNrfUfW32WR0lweKIgZfKka6FNIEhMVfkp7DKAJwKTYBgN118gqAqcP3Fzn+Ps/OnFJd0dFXZItVntr2jMNG4RNryJTpC3ZFYqOCi9kFkzLnIqoY5Ee7GKcp9SCHHVxOJqUb4anKTfVZUv5rN+i+a3PpuH+H+G4fFRlxnGU6dJPVQnGrOXZey9oorrKWyu4xm1ldjcP2tjtrp7SLjKcDb8tdDZJtBxL1Mxz25B8zRqyIQoCczhY5iHOUpdxjmANoCJgq3ZC3oXjMwc1bXvbt52jESzsFnUK5chHvXrQhzaIuASOYxEViaCZPcU+0dB29Qr949Y5gsbHQ23dFty95yLOJZSBZKcmGBVn8iu4XO4ZgCRCJpA12pGKfTYYqpSkERTGpc4ua/E5F02QxmoogjcLdm2del0A57A7dFRR/tHqUE1Tqo8kfGbkCYPCctXD4T2dLJLWLWqe7k9W272+C0+FraeL8eWJx7xNFZasJr2coNqEKcFlpxpxaUla180m5OydlLM5ZO1rWtuyLeZ2laEE1jIyPQKixYMUCpJIJl8ilKXoAV36jsVc1+PHjFCTxmozScSUig9XGXQU7o3QWUI1cCBepwcplTUAhfElzdp+pRrHDfOWfUn6YDBy3pP1G+k/Q/qia6+luXu9E83XZu3eDvH7V7/lXakkrI+YnOdSblN3b1be7ZM6VHZa5r7ZvXyEZjRR4i3kI1FmuEugn3pBdZMjpfQ3UndkzHUEg+JXl7SdTBRC5r8UkmzVbGaibdW4V2bh16XQHkMCNlVE3+0OpgOqRJHkh4y87ePhKaqYkipUVa3fktVq0WcYgVSVWhZB05RGdbm7u7RURK2aah0MLgh1TgoHhT5Oh+py0d3fkpFu7VbYhVWURh49y2SCcbl7w7WVVK5aaj7kW5CJHFQfCpztCdSmoCVUqOr3Nfico5aI4zUUbJXCizbu/S6AAswM2SUUf7fMoEWOqhyR8ZhR3h4TFpEXNfb18ybymM1GSK7+SReOBl0FO6oILnI0X2l6n7ymUioEDqlzNp+oDQEipUMC+cs+pQZgcHLekws0JMIf1RNdRluWJhiebrs3AbQneP2rrr5VkZS5r7aO3yMbjRR2k3k45BksEuiTvbdZVIjpwAG6kBsQ6igkN4leVtJ1MFASKlR1vc1+KSDRsvjNRJBa4XDNy59LoD3dgRBY6T/aHUwKKkRS5IeMvP3D4SGrqoXjk1SPaOVsOqprrQT926benm493eonRBsy3B0MK5TqmBUPAnyNDdTloCWUqLPrtyQ3I6FniRRwKMXHLtihONy94crLKkdNuvuRbpkTUE4+FXnbSdSjXOrc1+Ell2SWM1DtU7hSZovfS6AAqwM0TVO/2+ZQIuZRDkj4xFLeHhMFASKlR2Hua+3sgybSuM1GSC72TSduRl0FO7IoODJtFtpep+8pAVUCh1S3bT+IBrHFvnLI2oeYNg5YJMtmkkyQ/qia6nlhTMY0TzddgGAwFJ3j9qHdr5ANATOlR2Tua+2jl+lHY0Udpt5aObslQl0Cd7bLKIldOgA3UgNyHVOKZvEryNCdTlo2ua/FXrNBxjNRJFe4XLN2uMugPdmBEVzpP9A6nBRRNFPkh4y94Aw9CGoDIXhasVfNqSVmTouAZSrFVo77o6Ogry1CCQ21RMQMQdBHQxRAQqAWIwuDhbxPNu8zZjk7tgYE5loyVeQx1pNtHlKXRNwZADGdqFHd7aCZTCUAEwCOo1JCXlk80U0eHw0qVytbz546Z+nmwi3fpGRBuw3eRxXA6wgsHgT5Agb3Za5ZG7MitjOiscTKOgSj41ZsITbcneF111SOkOvuRbJETVE4+FXm7SdSjWqdJSlnWkkv7urq520MbUpUHh560pSTa0vp9mTTcW1o2t+aaVjWfNt1W/hzJsR2lXD/ADaFxWPON0InLaMEsC5F2ACBUJQoE81W5hApw03bPDoXxjW2lvz8LdUGzua3JRB9HyDVNyxeNlAOmuicoGIcpg6CUSiAgPwDVZ3Jj2UYWpeFhYrw3C22S5Z5Ru4lyt2arZwkvHpirLLNNSAqAK7mxkDCBz8vmdSmrQ7g54x8p8NVsXdhi/5NRHFwz01C2PmO32Bn8Xb8kQ6oIkTBbcVy3U0BUhd5ypm1TOcdTiThpwxGDquc4/wXrKX1YSel3zSlvtv1u7fZ1KOD8V8LVPCzvjKHlpU3/i16KWkUkrSqUdlZ3lT0yx9nFS9oMrKR8HFuZqWdFQatEDrOVz+5TTIUTGMP3AABGq/wXxW4d4kn8ijh15MybGNSTOacWtp60j3W8TBo3cOEiEcCG3UeWJgABAdetUrwJ5Sh3lhXG5x8hfl7XqvabSfudK/rgOm+Vl1E1QLFlIumkg1TKJNpVESFQEDgPXaI1fjDLS847kWVkQEfNFYzLBo1NH3M0P3hqqdErp1tAwin3cDrCKZvEp3cQL1MWvYVXAuMvZyz392SaS76WbfbVd1yXwdfAcVwtb2eJpOlKPvRlF5lfa+1rrXZ35O2piLAzVmS7snO7OuThNue2oFuKpUrtlZ+JUQcCXUCiVBu6UW2n06CJQEAENwF6gFW58vO/pDtB8DWdK4hfR8CxuWdUjbuUlmiiEkcbaeCZMqBFBXTEomOGpyAA8sdB6hrfrS577XeMkHONDopL3A7ZvF/S6Bu6sU01zIvhAOpwVOmiTlB4yd4ATdCGqiM43Nfcrxf8K6dw40UiiPpa53MsoaXQW9GuyW+5Km0ECftwnKosbmE8JeRoPU5aylVpyk2qaWlvrb9dW9fw7HLGnOK1m3rfl8ttvx7mzNamWb9nIyD/Vctb5wzlbZ1odlHJuX8XdtBfExhvh2kMkP1eGO2SLRMdcDOOOiUJ6dMBxO6MUg6mAC6a9NdR6VzTqRpwcnt2Tf4K7O3DYWrjK6pU2k3f3pRgtE370morbS71eiu2kb40rWSV4tOPsoqkgOy6llRTOUCme5Vh0gUKO3UxdBNrt1NqA6COzprqFQDMGV+10unFbi8mWIrbxeyKsuR81jTnuOeaoEBTYuVJsRQihTiUgAVEiipecBhKUCmEvL9MUtKVOcnySi1f+ZJfie/S8L1/aJYnFYelHnKVenJLW17UpVJ29IvTXY2C4m+L7G3DRHNY2QRcz92zJwRtmyIQObIyiw9CgVMuokT181DBoHXTUdAGsuHfA01fuVn3ExxY3HEXLk6JaF9FWHEvUlmtlIqAYyaJExOId5UAo6rH01EDbREA3VWvZm41tiaxPc+UXyL3JV73DFvi3XcD0isfLxb3kIgEEZZ2qCyaqhVTGBYnLIUChuEPaxraLGeLrS4fop5beFuHVCMabY9Q6zB42KrIqrLGI4FVVQ4qKHbk0VMdUwioB9pBMYBCtH0TH1cRGWMhkt9R7xfJtWs5c97R5JvU9bEcV8PcEwFfB8ErOpUl5XiFGyqRfvRhdqVOnyflc6v1pQh/DfYwjdnERfDyRuDMGLomz4dVNMIGFLLd9kyjqbeo6On7QTUNu1NMTCXrqYfIObEnDBhTCc0+uuxbPAJyUKYsncUm8WeyLopjAYSHcrmOoJNwAOwBAvhDp0qRjcd2hKiyDHjkW/pzugPPSDfaLTuvN77t37tnO9o5enM3ePbs8VfmOuW8Hblsk+xu6akWK/FdU8k3MCAorARuAgU4ibvCYiqXTXlgG1TabQK7Y0IJRz+ZrZu19fgrfA+VrcTxEpVVQ/g06llKEHJRajsneTcuvmb11M9Sov6ssg+hFpH6D73vaduIPko/wBLtNyr44KcyOA/M2gdPaQBVEeUbmBtMOhtO47uO7UHLtJtjxyuRCYaNWypZBuUHLZQERWdgAn1KVETqAJDaHNyB2gO4uu480zlKwbK47tcOWaTrHjlBNeWdtnKppBuYGzZLncl2IAfUxVtiehC6nJzw3gG02nTG8sg+gkZIMPve9qW2s/VjvS7Tck+IBBJHCfmbBUOJjgCoDyg5Y6mDUNQJRSsDI3LeDRy5RY44dOk0RYchYki3IC/OXEjjQDHAS93T0VNrpzAHanuN0r9Bcd3elSshx457uM4LQXnpFvtBoDUVQe7d27YKwAhy9OZuHft2eKgM5SsBH3PeTpZsm9xo6bFVQfnXOeSbGBA6KxSNyCBTiJhcJmMqUQ1AgEEp9phAB643hfwRLh8GInouUoBs9RZel2m5Z4pzOawA3M2lOlsJqqI8s3NDaYdptAJPSsG6uO7UXTtFvjxysmhNNmjZYsg3AHLVQiIqvAAT6lKkZRUopm0UNyBEpRAxdTG47ucuGaTzHjlsRxKPG7pU0i3MDVukZUEHQgU+pirgRMQIXU5OcG8C7TaAZylRU155CC3kpQuHHwvT2wpIKRfphpvTkClIJYwT8zYKhhMYoLAPKDYIiYAENe7J3JdzN46QYY6dO0kVo8rdcki3IDgqy+xwcAMcBKDdP20wDoKgBtT3G6UBnaVgy3HdppRNkbHjkG5pw7Q7z0g32kaA1MqV7t37hIZYCocsA5gGOBxLsATVxMbovRyduV3jJ22BVm/VXMaTbG5CqKyZG6I7TjuFwQx1CmDUpATEpxKYSgIEhqGrcPmFVcptM3ExtFo3azBUEp5q35LhQFExTOCpk9OcAlMIaKbtPMNBABruHu+/Sxrl2XErwy6MG0eINPSzXVd2qKoLMQNv2lOiBExFQRBM/ODYYdptO04uO7UnTtFHHjlRNGcbtG6wSDcAcNDpImUegAn1KRM6iqYpm0UMKBhKUQMQRxlCE7Zle2vxN9HE4nDZvYzccycXZtXi907bp809GRFWQ4oYXNIsl7Ytafx9KOQKk8avFGcnCF5XUVk1N6bsgnL5kMQwcz3OgVQl/Y6X4cs9T2ReAq5oF9OgKbjJGCRlU0vSaZiAqDpolrq2c7DgYNC7DAPvj4D7Ux9x3a6XZJPceOWpHEk+bulDyDcwNUEVFSoORApxExVykTOUhdTkBYAOBRKYAg962JDZB9C5KvLhVbSdzwkGWdiu8O2PfGMukBFE40jjfoB9+ocwDcjUmom00rixGCdWKyvVO6besf8rt+Duns9NvpODeI4cPrv2lNezlTyThFXhVtqvawckn/mg4Si7VIvOm5dzhy4qcScTtuKy2P5VVCSjzcqetqVS5EjELh0Mk4RN1KIDqG4NSmEB0EdB0sivXt2gdmQdwcZkHI4U4jI+ycqg8hoqNiIRqivIPwduSJrOXHdVOckkigqVQ4OyCmdNMATHqOs1yDxhdpXwq2q6Z5S4KG+TSsX3IbXvZ88Vug5bFTMbvbhomksqkIiBSiAEKUBN5AUNRsKmOw8lDGUnFP3Z2tGS67+Xu3p35HTieA8F4rSjX4BioznL3sPKTVWnL7KlKMYVe2V5/uuzZupStIcu9qbbF42Hblx4Oz5adimfJvy3AhdNuqTMkydEFMGbQrJu6SOU6oCsYVRA6JOXtOYpjFA9nXHmzIF6cHqWUbbzGvb3cIGPfvsiMYuNTTeuQXWQftCtXwqJthTOkXU59Se2l5Zj7TV2Ua+Brxi4V4O+6u24rq7J6el32Pn8bwHxFw5/wC84GtBN5U5QcVKf2It2vLsbIVRGd/r58BfeF3/AOCaV+MRZHl8h4RuWHsziFcXys0mFIsuS413CAozRVaJKi/BJuQrcvdjKnDlKJ7zihuEpinKI0HhC/4q6uNjEMcpxkK5Ukk/VkIN3byHVVj2qaKSKSwejEyFAjghSLACmpigYCjtMBgrbfC5W1Wi39Va+bvHS1l3s+xxSwPFIuWbDTShbO3HSDeyn0b5G+1KUrA0ClKUApSlAKUpQClKUApSlAKUpQClKUApSlAKUpQClKUApSlAevv/AEg1pnZzgyxjWa0ygvjck9JfRTRw7zfTQlGMXCLE3J9sFiD7ld42/uNPf210ewWu7iGyE3ve9bvg8lxuOlbMsVjbrXJrNZudS4GcKDSaWj0lvbCszHRaiJh8J1eYcvUT1aHEv22HDFwr5vncB39hvM0nL28oiR4+tfGbl+wVFVBNcvKXIYCqABVSgOnkYDB71V52SPEg44ue0C4t+IO2rVv2HsqbZ4+TtVpfME4jjgdCPkUHXKRV1KX20gCYSD11II+YVlrlMdMx7BaUpWJkVbHcFnDFETNyz0bitBFzdjB+ymBJIutgN3yvOeptyc3YyBwsAKrd3BLmqFKc+4wAYO+PClw+GzCrno+NWp7oWWM4VeHcrmQFyZr3Mzvuon7uDkzX9ji45fOFH2sT7PDVh0oCBYR4YMFcORXwYZsBKGGRRbt3B++uHBitm4HBu0TMuocUWyIKKcpuntRS5h9hC7h1ong6+ygcY/39YPzerbOtTODr7KBxj/f1g/N6hDbOojm7BOKuIuwnGNcw2g2mIpc4KpkV1Kq1XLrsXQVKIHRWLqO1QggYNR69RqXUrOnUqUpqcG01qmtGiThCpBxkrp8is0skY54bHOOuHq+b8nHj64kFIq3bguQRWNIumyRBBJy6ApSd6VKIiQDAAqimfTU3QbMqOZSxJjrNVq+orJ9rN5eNB83eJt1zGKKbhBUqqSpDkEDEMU5QEBKID5h5CIDhsd8Qtk5GytemFWjN/HXFY7puWRj5REqZnTVdIqiL1vtMbmNzjvJu6CB0jAYCjprvlFV6eeCeZXc9ravRrpuk111vrZaYydKpkk1Z2Ueu2q/C/wDTS7nlKUrlOgUpSgFKUoBSlKAUpSgFKUoBSlKAUpSgFKUoBSlVXl3KuYGObrHwvh+wO9Jyqx5O8rnlWaox8XDoGAqiSahRKB3qxzFImQBHYAGUOUSgGu2jRnWnlj0b100Su/757LU11KkaUbvsvnodfHGdnHEHlm98bw+LiusfWyRWFk7rk1NE5WYA4kdMEWxye3IJEESKLCIFFTUhQOACYJw4xBi5zjMcMK2DE+pP0aEeW3isiFaFbAXaCRUwDQpQDTTTy01DrUjKUpQ0KGn8leaV506vljG0dNL3vpa7vzfpbXRGWH9rQmqmbzp3Ulo1rdWtqrctb8zVFtiPis4FDm9begpk/F5Dif6H0s+2TEGQR1Ese5PqC6QdRBE/i6ABQETCavGE+Jjs1T5KPcLezrexbkIonSfMrttlKCk0zKBocp1DFKQ+7TToc2tbX1H79xPi/KbD0XkvHUHcDcA0KhNRSLoofyAoUdP7K8Z4CpRa9hJWW0ZK6X+V6OP4pckj7iPinCcQjNcUpS9pNWlVoz9nOa/+bBp06vd2hKT1lOTISwwBwq33kcmcIOHjZC4CyKcgEvGT6wgdwQpSlUMVJbln0AChoJRKOgagNQfiUtG1fX38ON+EaF9NKTVwMBc94MIi1LASKmzZu2+7Nru016gAjpoFZGV7LvgJmHPe3HDhEon1ER7g8dNS9dP3KKpQ974OlVtcnBnw1cNnGxw93ThPGSUG/f3HcLV24JJOlxUR9Tz4+3RZU4B4igOoAA9K20YYmM/NSgk3dtSd79bZFr8Tk4jieC1sNeljsTOcY5YxnTioqN/dzLESaj2ULdjcatTLN+zkZB/quWt84Zyts61Ms37ORkH+q5a3zhnK9A+TZtnSlKhToXLbURd1uSNqTaKh2UqyVaPSIuDonOkoQSHAFExKcg7REAMUQMHmAgIa1A8IYMm+HSEm4mLy1eV6xBwKrb0HdUik7cRuwp9zdJ4oBVVSHESAUFzm2bQ0MACNWXStsa1SFJ00/K7XXp+XqtbabGuVKEpqdtVz/v8AqVpw+cTULnlWUt11jq67Pue3wR9UFs3ZDHbqtebvBM6axdyDlIwpqbVElDAIEHXTyqy68HIChBIbXQwaDoIgP4Q8qq/A/DXIYAnZBOBzve07a7puBY+1LukyyRYtXdruQdqlF1s2+EE1FDgHmHvabJrD1XOcfJtaOrv1s/yvy3d1rhH29PLGXm6vb00/O3y6WjSqvxpm/L1x5Pf41yfwtXDayCYrqRN0oy7ORinyCZwAgmUSOCqCpyiBgTOl7xg3DpqORacVPDc9ym5wcnnC2CXi0dg2VthxMJJPhVEoHAhETiB1BEpgHwgP9w1JYTERk4qN7K7y2kkut43X6FjiKLSbdru2umvSzsT+leAUIJxTA4bgDUS69QrzXObhSlKAUpTUB8hoBSscveFpNZZGAcXRHJv3BzEbsjvUwWVMUNTFKQR1MIB1EADpWLufM+H7Jn0rUvPK1txEouQhkI2UnW7dwqU4iUolTUOBjAIgIAIB1EBCs406k3aMW/gYucIq7ZJaVEsqZ6wfgxu1dZozBbFpkfFVMwG455uyF0CQFFTlAscoqbd5NQLrpvL8IVxXdxD4KsHG8fmK9svW7FWpLFQNF3G/lkkmTsq5OYiKaxjbTgcgbi6D1DqFZRw9eSi1BtS0Wj1fRdTF1qUW05LTfXb1JlSoRb/Ehgu7MSOs8Wxk+KkbOZlXM4uJiuKrUpUTiRU24oDqBTAICIah0r84Z4ksJcQ0fKSuFb9b3C3hnBUJBVmgqUqahi7gKAnIXfqHvl1Cq8NiFGUnB2i7N2ej6Po/Uir0HJJSV3qtVquq6k5pVYYP4ll86XC9jo7AGRrbi2jQFUp+9bcCMQdnEwBykkVVO8CbQd2pkil0KPXXQB4sf4n4hk8wv8n5d4jBkIhNRyjb9jW5AJMo5u3ObRNRyooKq7lcCFKOu8hCmE20ogNZyw0qcpRqyUWlezu2+ysnr62sYqupqLppyTe/Tvrb8LnaieLHDVz51W4drJln0/cMeCvp9WEjFXLGDOQom5T10QvJQVNtEoJCbfu6CUK6qGGc4Tee/ooXrxJPyWvFOTGtywrcikmbZQpkRIJpFY4qKvDamMJSlFIhRKQ23UKsxhExcUKwxkcg37yuZZwKCJSc1U3ujm0DxGHQNRHqNdint4U3/Bja8bO9pPu1pp2tqlzJ7GU1/Fd7O6tdeieuvx07HSZ21bsfMu7iYwTNGQf7AfPkWpCrOQIUCl5hwDcfQoAAaiOgAABXdpSudtvc3pJbFfZV4UeGzNwnWyrhC25pwp7p86i0wc/2LlAFA/sNVXq9lfwwRxTJ49lb7s9Mwm9pti/HyJA1110KoocA8/8A761sjSuOpgMFWlmnTi31sr/Pc9/BeKfEnDqKo4bGVYQX1VOWX+W+X8DWxLs4SxigGtzjaz0xKJBKqmN9EWIoGgB1Ko3EPLp5VXUFwfRXDZ2hGGrjZZqvm6lZiIupFRC65RFdJuBGjUdyREkkwIYddB/krdiqIzv9fPgL7wu//BNKlPAYSlUU4x1W2r/U2YzxZ4gx2Fnh69a8J2UvLBN2d1dqKe/cvelKV2HzopSlAKUpQClKUApSlAKUpQClKUApSlAKUpQClKUApSlAKUpQClKUApSojlDD0blQ7I8hfV3Q3cQUAgWvc7mOBbft15vJMHM02+HXy1Np5jQELvvjXxlj/MCmJ5O1LlcoMJiHh7iu5kyQNEwclKnISPZuTmWKtzFjLNw1SSUIn3pEVDJgcBr9cRnGdYvDW/fNrlx7d842grYPcl3yduRyCre3YcpzkM9cisukY5faVzcpuVZYSoKCCYgAa1vePAplJ5fU7a1qX7GLY+va9LTum63k+7cuJ1F3BjH+0JGEokcFdEiWJDKqHIZLVcwFVE5dnb4i+HPi6zveUKe4nmPJyy4+PML+wpKXk2UfIyHfFTEWdlQSOL5ErYGpQbKjyebzjGTU9qFO6E1LGsHixhMmZumMNWhia73DaCfqs5C8xLHhElXTRKoYpf2Z3owbjgluBvt5gGDXQBNVL8INwwDXtWuL+23M20TkXbixFWrBRyUFlkyW+G85CCO4xS6hqIBoGoa1nrf4ILzR4sIbNzu1MXwTeCviXuNa7bRh1G1w3Ek9ZOmxYx/7WBRSILlNQ6orK84zJA3JSENSxjhHsWyJLtb+LnIMjZ0U4n4xSx2sbNrR6Z3jRBW3wFVJJYS70yHEhdxSiAG2hqA6BTQam5FKUqFFQbLLSzcboS/E0nihe4Lmt21HSCQwrRM8m6YgYHB2iInMUDbjpgYCCPUQ6aiOgzmlZ055Jp8ufK65r4mE4542+XZ9TBYxyTZuYcew2UseTScjCT0ek9jHiXkokcuoah5lMHkJR6lEBAdBAaztVTJZNxNww3/Y+AGeOwtyDvV2+RgZSOaJIxaUqJxcdyMBBAU1nG9dQnhApzEMUBEw6Va1bK9LJLNFNRldxvzV2uXPSz7mNKpmWVtOSsnbra4pSlaDaKUpQClKUApSlAKUpQClKUApSlAKUpQEQz1ke4MSYfn8h2jjyUuyWjmImirchm5lV37o5gTSSACgIlKJzF3n00IQDHHoUa7WHWmUGOLIBtmqYjn92li0vVC6iWootjOxLqoCRREfCAiJQHpu010LrtCH4gvHO1/5xv2Tuq3TwFgwblKEtOOkI8SPJZ0lqd1Kbx6g2MJypJAGoHBIVPDroNq101l7GHsWlfRtrV6pWj2td3tz0exopP2s/aJu21ttnv8AHl223FKUrmN4pSlAKojiW+u44cP533D825Cr3qiOJb67jhw/nfcPzbkKqDL3rTRPIVg4+7cC+nV+3xDwiTnhftcjdSXk0mxVTBcE4IgUVDABhAPeCty60huLBGD869t1esZm7DdqXi2j+GG2FWDe6rdbSJGxzXBOAYyZXBDgQRAAARDQRAKIjN227hu8bkdtFyKpKkA6aiZgEpyiGoCAh5gIe/X7riYsWUWyRjIxmk3bN0ipN26CYEIkQoaFKUodCgAAAAAdAAK5ahRSlKAUpSgFY6QtG1JaWaz0rbMe6fMj72T1wzIdVubQQ1IcQ1IOgiGoD741kaVU2tiNJ7lZZc4NeGPO96NMjZZw/GTE8xalbNJdQ6qThNEomMBAOkco6AJziAD5bjfCNdvO3DBiTiPLElyk1nFPQh1jR5oS7JGKEoq7N4mFkukKn7WXTfrt66aajrYVK3xxeLg4uNSSy+7q9L726X7GqWGw8lJOC82+i19epCbswBYF6YvjsQTb65SQ8WRAjVWPvOTaPhBEmwnMeouCuVR090J1DCceptw9a5LdwNj22cVOsLtBnHUC9QXRcllbqkHjs5Ftd4d8XXM4DzHQQUAS/udNKmVKx+kV8uXO7Xvu9+vr3L7GjmzZVe1tuXT0IThjh3xJw/NZFpiq33bEsssmrIGezjx+dUxCiUo7nSyhi6AIhoAgFYbC3BfwucO91vL6wvhiJgJl+1O2dyTUFDLKImOU5ibjmMIFExCmEA8xKGvlVn0rJ4vFSzXqS83vavW21+tu5Fh8OstoLy7aLS/ToQJrws8NDDJQ5mY8P1mI3eLw7sboStlqWQFwcBA6veAJzN4gYwCbdqOo1mJ/DWIrrudO9rpxZbcnMpIkRSl5CDbrOiJlMJikBU5BOBQMIiAa6AI61JaVg69dtNzeitu9unp2MlRopWUVvfbn19ToTdr21cnL9UNvMX/J15PfWhFeXrprpuAdNdA10+AK7CMZHIM045FiiRuiQCJIFTACEKAaAAF8gAA6AAeVc9K13drXM7K9z8pIpIE2IplIX4ChoFfqlKhRSlKAUpSgFKUoBSlKAVRGd/r58BfeF3/4JpV71RGd/r58BfeF3/4JpVQZe9KUqAUpSgFKUoBSlKAUpSgFKUoBSlKAUpSgFKUoBSlKAUpSgFKUoBSlKAUpSgFKUoBWpnB19lA4x/v6wfm9W2damcHX2UDjH+/rB+b1AbZ0pSgFKUoDGXVZdoXyyQjbztiPlm7V8g9bISLMixEnKJwURWKBwECnIcoGKYOoCGoVB8P8SkNk3J964TnbacW7dllyOi0O+XA5n8WoI91k0DAAAoiqACAgGopnKYhuoBrZdVLxGcMq2WbmtfL+NruLauQrNegaGuMGorJuGKhy96jnaRTk7w2VKGu3cUSHKU5TFEB168M8PO9Os7JrR6+V91zT2fNbq9rPnrqtG06SvbddV69VuuXLndW1SsbHXlaUvccjZ8Xc0e5logqRpWMQeEO4ZgqXcmKqYDuTA5epdwBqHUKyVcrTW5vTT2FKUqFFKUoBSlKAUpSgFKUoBSlKAVVXEdc2f/VDZeMcAQSrda4Z0FLlvRwzIs0gYpsJVVwEp+h3DgNEEiiAgG85xENgVMMwXDkS1cZzM/iWwi3PcrdoPoWCUkE2pHS4iBSgdVQQKQhddxh112lECgJhAB6mBLTyhZOJ4iAzTkULquoqZ1pyZTakRRO4VUMoZNEhSl0RT38tPcG7YQu4dda6qGWjH27yuzsovXlvbotN9G9NUnbnq3qS9krrS9167X6vXbbtoTClKVynQKUpQClKUAqiOJb67jhw/nfcPzbkKveqI4lvruOHD+d9w/NuQqoMvetTLN+zkZB/quWt84Zyts61Ms37ORkH+q5a3zhnKEZtnSlKhRSlKAUpSgFKUoBSlKAUpSgFKUoBSlKAUpSgFKUoBSlKAUpSgFKUoBSlKAVRGd/r58BfeF3/AOCaVe9URnf6+fAX3hd/+CaVUGXvSlKgFKUoBSlKAUpSgFKUoBSlKAUpSgFKUoBSlKAUpSgFKUoBSlKAUpSgFRHKFzZkt07IMT4oi7mKsCnfxkrq9Gd3ENuzb+xluZu1Nr7nbtDz16S6lAevbNiMlK8TNwyN/wBlGY5vc5Nx4riEjXmu1mVuFUjBl02ToEygLQohPd82gQDJGLzS+JEB5+0jmMa3xkRjmdpJWhcr+28fPVMf4+vvFryUJdkqSQUKqxj1ucly3aijRJAQImoqQDpLaCmIgb2BUq3JY0AxQxRPxj245Tt5yhmv6P8Ada2RHItFO9BYxo+U9HFcLaaHjuWMGVENRT7yQNgcwqumd4b7Ty/M9r1xXTdk5faQkEzeWAE1BLWwR2pIj6HROIlcCsUUPaSLpdCm6rgfzTApt4q1M4OvsoHGP9/WD83qgsbLpQl9FkkHCt8oHbEnFXK7YIcoCqxM3UIRoBt/hMVYyavO0ETAmJNoAbcHA1t7IySbYrrIzdUyca+RcmCCKXnOVFUzNlwDmeEESFUIKfUFRUAwiXboMjpQpG17dySdo5SQyS2IspEMkGywwJRBF4mdUXLkS8zxlWKZIoJdAT5QiBjb9A7C0JfJ3zhdG+UCIKTiLlugMOURRYlQSIo0E2/xGOqVVQFtAEoKgTaOzUc5SgMHGwl8t3TNWSvlByki/fqvEiw5UxcN1VTmaogO8dgoEMmQT9eaKYmEC7tA6PqXyt6m/R30VmvpL1K9y9Jepwm30rs09I8rm6bN3i7tu097f79SqlAVDkDhKi70z1F8R8Reri37ph3LNJu/h2ZUzPYshwM6jH3i0dorBqJBMAGQPtOUR0EpsdGcSrhrxGk4er/czluSa9xOF7cVl7UDuN0xoMlDd2Zu0VVEyqJKCVUwqCRUSoCHLADiJbvrwJQEQEQ6h5V0qupxy1k5JK0dbZea66X5d9Lbmh0XF3pWjd3em/Xpr3/Mjje3ckJtmybjJDZRROKeoOVAgSlBZ2ookLZyAczwFRIVUop9QU5oCJi7NB8ubeyOog5I2yO3SOpFskWxxgim5LpNRQzlwIczxAsQyRQT6AnyhEDG3aBE5nhoVcZuTzha+esgwiqrlBSXthtPlcQsiVMhSbDNHSapUNxCgAmbikI+eu4REWY2nGUN2t33D7PY1CD7iQruNvKLkBci4A5txyLtlgKBBIJQ2ikIgJdd2htAKhSnKKjUWq1vdWfTn8H+QdWpGLcoPR8rO66/3+JM1oS+jyK7hG+kCNzziTlBuMOURSYlbpkUaCbf4jGWKorztAEoKATaIF3CjIS+WzxotJ3yg6RSev1HaJYcqYuEVVjmapAYDjsFBMSJifrzRJuECa6Bh8yL8QyLNj636Nsxy4FU4SQXi9dokKTQNnKFskcRHXXXdoGmmlcN0suI+RxAxaWfcdmRN+Hatwk372KdPopJbaHP5KQLIqmLu12Cc4aBoJgHyrCNG6i3JK7tvt3aV3YydW0mlFu34+hkAtfK3qbGOHKzX0kNqgyCS9ThNoSuwQGR5XN02btDd2106ab/AH670jC3y4cvFI6+UGyS0gxVZpGiCqC3bpqJmdIiInDeKxCqEA/TlCoBgA23QcBa1j5xWxE9tDJWbWq11PE1io3ZalsJsQZbw8ApNnKjohjE+E4mA3TUoUwnhifxLEyLC6c73nfjiTVIoo8u5dpub6E2iRArRugVMg66iGgjrp1qulTUZPOm07JK+vdaLT1s+wVSbcVkav6adnr+Wncz6EJfRHrZZe+kDoJzi7lygEOUBWYmRVKm0A2/wmIqZJQVtBEwJCXaG/UIO2y/aJr1j8PBxZ2WteKkdIsTQCR2gv3MiGxRNcrUFxUL3dNJfejoO8D7jGJs68+FeD3h74fLkd3ni6ynLaYfMzNXctJXA/kXKqJjlOYgqPF1TaCYhB6D+5D4KlkNiPFVu3K4vO38aW+xmHjhRd3Ks4ZBJyuqp+2KHVKUDmMb90YR1H36yawcZSs5NW00Ude6vLT469jFPEuKuknfXVvTtotf71KuyFxUWBYWVD4Pmc5OkbpdNoho1jWGOJB/3Z2dQ51V1FG6Z0wI4SOkUAOYpUeUYwmHUQLkM45uvjDFytWbeyL+u1KUmSO2yFk2AD8jNiVumkdmsuZchCHOuB1gVMICBVAJtEC7huKlI1MLGUXkbstby3fayVl219Q4YhqSzpdLLZfFu/rp6FURGQs2vsMtcwxOObjfyYGkV/odS0axjJV0RR4YGrc6h3RkG5kEdNTioPOKUDDsMbZXSxOpxe5ExDKkyiRpjy6jwCkVDrcppKiV+CAAWbORE4JAAqmEe47zFAEg1VHfoW5KVi6tPK0oLV3T1ul03tb1TfcyVOeZNzeitbSz77Xv6OxUOCeGO68FRE6m2z7P3LMXHcDGUlbgutIHS6vLMiDlEpAOVJIiqRFEkwSIQqJTlHaoJNTWE3hL6TdtVXF9IKJJTjhy6RCHKUV2JklipNAHf4DEUOicVuonBES7Q3iIZylYVatSvUc5u7f9/wBrkZU6cKUFCKskRklt5MCNatz5MbC5Sg3jZ05CAKALPlDJC3dgXmeAqQFVAUdRBTmgImLs68r6AyGsZwLHIbdAFGTBNuBoQp+SuksoZ0qPtgbgXTMmmBOnKFMTAJt2gSGlazMwakJfRpVV0nfSBWhpwjlJp6HKIkYg1ImZpv39TGXA63O01ADgntEC7h8RcJfTZ61WlL6QdIJLyBnSJYcqYrpqridoQDAcdgoJaJibQeaIbxAnlWdpQEVLbGVQt1SPNlVqMia102acj6nCbSSgFMB5Dlc3QSGMJTd310DbpvHXUO8/hL5XcPVGF8oIJrSjJZkmaIKfu7VMyQuW4jvDeKxSqgCnQU+aAgU2zrnKUBg20JfSbpoq6vpBVJKacuHaQQ5SiuyORYEWgDv8BkzHRMKvUT8kQ2hvEQojPEJfLDi+4Wzz98oPyNZq5kZUicOVHvzo1vOhTcFEDjyQIUixeWG4Dc4B3BsAB2TqiOJb67jhw/nfcPzbkKqIy960JyjYPEPfvbZ3e14euIePx67b8MlsnknchY6c2DxMZ+cApAIdwjyhAdR3AI666aBW+1amWb9nIyD/AFXLW+cM5RBmx7a3clJsjouclNlVhfMFCLhAlKBUEgR70lt5nUVxIsIH/wBVzg0A+wN3YaQl9JOWiju+kFUkpl04dpBDlKLhmcqwINQHf4DJmOiIq9RPyRASl3jpnKVCkXC2soBDIM/ooNu+p284arvfU8TarIn5fJegTm6FKntU1Q1ED8wPGG3r2ZCCv9dZyePv9BuRRNgDYhoUp+SZJYxnRhHmBu56QlTAOnKEu4N+ulZ+lAYMYS+vSougvpDuvpzvINfQ5dQY915fdN+/3XP9u52munte3TxV+Y2Cv5u4bKSV/IOU0yvwcplhipisKqwHaiA8wdnISAUx8+aI7h2aaVnqUBF/UzlL0Ksz+ik176e3EGiL31PE2pyRQU5r4U+boYpxMmIIagBeWPjHd07juEvlVy7UZ3ygimrMNF2aYxBTC3ZkBHntRHf4zKiRYQV6Cnzg0KbYGucpQGDZQl9IuWaj2+kFk0Zd2u8TCHKQXDQ/O7u2Ad47DJb0dVeoqckdSl3jp0htnKXoJFiGUmvfyW2s0Wf+p0m1SSMBOW/5fN0KQglOIt9dDbw8YbesppQGBkoO/XDlypG36g2SUFh3VI0MVQUeUuJ3Wo8wN/PS0TDy5QhuDf5V+ghL69KldDfSHdQnBcma+hy6ix7qKYNN+/3QL6Lc7TXQOXt0HdWcpQGAj4G/0Fmx5C/27giaD8rkhYUpOcdVYpmpwHmDt5CYGTEOvNE24RJpoPXG2soDEOGgZQbA7UgGzVu79TxNEpAnM5z0Sc3xFU3J6IagBOWPiNu6SelAYNzC3yo5dqNr5QSSVmmzhokMQUwoMiERBZqI7/GZQxFjAr0EnOANptgCJhCX0g4ZqP76QXTRlHizxMsOUneGqhlRbtwHeOwUQMkAqdRU5QiJS7+mcpQEVNbGVBt1KPLlVqEiW2FGasj6nCbTyglIBJDlc3QCFMBx7vroO8A3ht692ThL7cvHS0ZfaDZFVaPM1RNDlUFAiS+92UTbw389L2sB6cofGG/yrO0oDBkhL6CVTdHvpAWpZw7lRr6HKAnYi1MmVpv39DAuJVudpqIF5e0AHcHExgMhIHbGf5CbrlTZv03IFhCk5yyqyZmqoe2DtBBMqiYk680VAMIl26DIaUBGTW3k0Y1y3Jk1sDlSDaNmzn1PkEEXxBV7w7EvM8ZVQMkAI6gCfKHQxt/TtOIW+VHTpVvfKCaSs43ctEhiCmFBiVJEqrQR3+MyhyLHBboJAWAu0dgCbOUoDBx8JfLddkpIXyg4TRknyz1MsOUneWyiiotkAHePLFEhkiip1FXlCIgXfoHRPa+VhtokcTKzUJItqmZHkvU4QSmlRIUCyPK5ugEAwGN3bXQd2m/pqMqpQGDlIW+XL50tF3yg1QVdR52qBogqgoJJLgd2mJhOG8V0gMmBtA5Qm3gB9NKJwl9Fk0XKl9IGaknFHKzX0OUBUYi2OmRpv3+ExVzEW52mogQU9oAbcGcpQEdZ2/kREG3fciN1hTj3yTkQgyk5zhVVMzVcPbB2gimVQgk6gqKgGES7dB/CtuZLMxcopZLbFXUhmbdsuMAUQRepmVFw6EvM8ZVSmSAEtQBPlCIGNv6SWlAYNeFvk7xyshfKCaKk4g5bIjEFEUWJUUiqtBNv8ZjqEWUBbQBKCwF2jsARpbKrGdj+NjAyFxTpJFwYL4UTcJswQAiB0kDoI7QMbUU0jJpCfXximJ9CibQNhaojO/18+AvvC7/8E0qojL3pSlQopSlAKUpQClKUApSlAKUpQClKUApSlAKUpQClKUApSlAKUpQClKUApSlAKUpQCtTODr7KBxj/AH9YPzerbOtB0c/z3Bb2knEfdeQuFHONzQuQ/Ue7tadxxiWTn2TgjOH7s4KZZomYiZyq6lEgju6a6aCAiRGb8UrUz2XfH3xGOLP8mqf/AMinsu+PviMcWf5NU/8A5FWzF0bZ0rUz2XfH3xGOLP8AJqn/APIp7Lvj74jHFn+TVP8A+RSzF0bZ0rSuE7Y1Zzkefhp7s6OKVrbDRiwPbs0jw+z6jh+4Pz+9pqId2DklS2N9ptxuZzTdC7Osh9l3x98Rjiz/ACap/wDyKWYujbOlamey74++IxxZ/k1T/wDkU9l3x98Rjiz/ACap/wDyKWYujbOlamey74++IxxZ/k1T/wDkVHkO2NXPlZ3AuOzn4pSWgnb7ddncBeH2fFyrJGXWKs1M37t4UyJFQOCu4dwqmLtDbqKzF0bqUrUz2XfH3xGOLP8AJqn/APIp7Lvj74jHFn+TVP8A+RSzF0bZ0rUz2XfH3xGOLP8AJqn/APIp7Lvj74jHFn+TVP8A+RSzF0bZ0rStXtjVi5VbwKPZz8UprRPb6y7m4B4fZ8HKckC6RU2oN+7eJMyRlTiru6GIBdo7tQkPsu+PviMcWf5NU/8A5FLMXRtnStTPZd8ffEY4s/yap/8AyKey74++IxxZ/k1T/wDkUsxdG2dK1M9l3x98Rjiz/Jqn/wDIqMS/bJSjfLcLAQ3ZvcUTizXMM9WnLiVwDcBHTJ6Q6ANkE23dR5pFCmXEym4NgpFDQd/RZi6N2qVqZ7Lvj74jHFn+TVP/AORT2XfH3xGOLP8AJqn/APIpZi6Ns6VqZ7Lvj74jHFn+TVP/AORT2XfH3xGOLP8AJqn/APIpZi6Ns6VpLdXbJSjHJFqw1pdm9xRP7YfA+9V025wDcCLiK2IlM15KHdR7xzVBMQ3iLsAAN110qT+y74++IxxZ/k1T/wDkUsxdG2dK1M9l3x98Rjiz/Jqn/wDIp7Lvj74jHFn+TVP/AORSzF0bZ1RHEt9dxw4fzvuH5tyFQP2XfH3xGOLP8mqf/wAioc+4xrg4qOM7ADLF3BrniHZW9dky6umdyHiKVgI+OZKwL9AqouHSRUzHFY6RAT1ATCfpSzF0byVqZZv2cjIP9Vy1vnDOVtnWlOW70vbhs7WK4uICY4cMn3ZaVx4AgoBhL4/speYISQazMs4WRV5PVMQScImDd57+nkNEGbrUrWr2TC3/AIlPEr+JOQp7Jhb/AMSniV/EnIUsxdGytK1q9kwt/wCJTxK/iTkKeyYW/wDEp4lfxJyFLMXRsrStQk+1LvUczK24p2d3EIFjltgjlK5gxVIC7NKi4OUzQWuzokCAEUBbf1MYS7emtSj2TC3/AIlPEr+JOQpZi6NlaVrV7Jhb/wASniV/EnIU9kwt/wCJTxK/iTkKWYujZWla1eyYW/8AEp4lfxJyFRg/al3qGZk7cJ2d3EINjjbB3KlzDiqQ72WVBwUpWgNdnVIUBOpzt/QxQLt660sxdG3lK1q9kwt/4lPEr+JOQp7Jhb/xKeJX8SchSzF0bK0rWr2TC3/iU8Sv4k5CnsmFv/Ep4lfxJyFLMXRsrStSX3aj3OllOMgo/s+OIdW0l4J6vKz58TSBXLaQIs2K2bEb7PbE1EjujmU3BsFAhdB5moSH2TC3/iU8Sv4k5ClmLo2VpWtXsmFv/Ep4lfxJyFPZMLf+JTxK/iTkKWYujZWla1eyYW/8SniV/EnIVHpntR7nbZLgYWE7PjiHc2s6jZBS4ZtXE0gm4YOkzNgZpJobB5xVQO6Ex9xeXyCdDb+izF0bbUrWr2TC3/iU8Sv4k5CnsmFv/Ep4lfxJyFLMXRsrStavZMLf+JTxK/iTkKeyYW/8SniV/EnIUsxdGytK1DuntS71Y5JtWGtLs7+IR/a74H3qum3OKpBFxFCREpmvJQ2D3jmqCYhvEXYAAPi10qT+yYW/8SniV/EnIUsxdGytK1q9kwt/4lPEr+JOQp7Jhb/xKeJX8SchSzF0bK1RGd/r58BfeF3/AOCaVgfZMLf+JTxK/iTkKhQcRV8cR/Hbg2RsPhIy9CQcCW5yXdcF+WG5h2kcg4jA5BynW6KnOugmlsDr7bu8ijSzF0blUpSoUUpSgFKUoBSlKAUpSgFKUoBSlKAUpSgFKUoBSlKAUpSgFKUoBSlKAUpSgFKUoBWs1ocZ+VJ3M0KeStC3yY6urLc9jqEMgov6WQkItCQE75YwjyjIKrxT1EEilAxAMioJzbjEJszVOW/wTY0t3NSWYW133Os1Z3O/uaIstw8bjDxs49bqt3ckiUEAcc1Qi7nUh1zolM6WORMpzbgAuOlKUAoIgAaiPQKV+F0E3KB26uu1QolNtMJR0H4BDqH8oUBrVwJcZt/8TUy4YZPLEQb5zbqM1F2key5yIkkmiim3mipJpkSfJkExEzqtQMmVQwam0OTXZiqmwpwjW9h2+UsiyOXL4vWWj7aNb1vur2k2zk8RFmWTWO2SOi3ROuJzoNxOu5Mu4P3dPcqOg62zRhbClKUB0rjfS8ZAPZGAgxk3yDVRRnHA5KiLpUCiJUuYfwk3DoG4ega6jWrNhcbXElm2zsb2/jfHNoQt/Xuwu+VkWs+7cOo6NaQUmnHmbgZESHVWVWdNCc3UCFDnKbDaFTHbOqNl+AnG57Rty3LFyVeloSFrLzgxNzW4/ahIFby7kzmQaGFy2WSMioqKZg9r3kFuiYhymJuGqwJ9w4ZmjuIvh8sfP0REKx7a9bSj5xFgsoBztiumxFuUYwAAGEu/bqAddNamlYXHGPrRxNj6CxZYEQWPgrbh20XDMSHEwN2rdIqSSephER2kIUNRERHTrWaqAV1Zx3JMIV4+hokZB4i1UUasAXKkLlQCiJU95vCTcOgbh6BrqNdqlAafynH/AJ9dcM9k5Ti8RNI+6Loyjcdsy8Y0tyYuZCGbRbqZRFQUYhI7lwcTRqCYnKQCblzG0KUACtlsG5CZ5Zw7bOS2NzxE0nNwjd2MpApqkZuTHIAmMiRb2whN2uhFPGXTabxANQo/B7BRFkx1nYwzRfllKxd0zU62l7ckmplzrSrx08doqou2y7VdEVXagkBRExk9pBIYpgEwznDeJbOwTi6DxDYCDhOIgGBWrMXbkyyymmomUVUN1OocwmOYw+ZjCPv1SK5JqUpUKYfIU1dVuWDOXDYtnGuKbYRDlxDW+V8m1GTdkSMZFqCyogRHmHApOYcQKXdqPQBrVKF47+IeVv03D7FM8dT10Sd8x9tQ99QBXilutXZ4uVk5FosQVROu5YoxJynImsXed82A3IEFCl2lyvjxhlzGFxYrlZ6Vi2tyQjqMdSUG7Bu9bJrpGSMogqJTctUAMIlPoO0dB96qiieAK3IjHkPj1DiCv/bakszkrBk0EYNstabhug4basUm8Ym22KN3S6Cia6KxDJqCAFLqI1dCO5OOFTNUxn3DDe+7mgW0ZMs56agJ9mxXMo3JIxMq7i3ZkTGADCiZdmqYm4N2wxdeutWLUUwlh20sCY0j8XWUq9WZsVHC6z2ScAq6fOnLhRy6dLnAAAyyzhZVY4gBQE6htClDQAldQorqzr2QjYR5IxMOpIukGqijaPSWImZyoUoiVIDHEClEwgBQEwgAa6iIBXarH3bb5bttWTtU8u+jwk49ZoL+MX5TlsChBJzUj6DsULruKbQdDAA6DQGncz2gvE5acPeVvSdh2fcFzW+NrJqrWLFysyygpGTkRbvYd4kz5yzt0yblFwPd9plCnJuRQA5BPshwr5fc5xwvH37JXJDycgd28aSh4SIexybZyg5URO3O0fgDpssmJNiiSwFOU5TdADSoLj3gFj8XYra4gsvijyiwi4gzM1sGYuIZqaEO3OJgFIjeNTSXBQDGKom6IumoBhExN3iqzMGYStnAdkq2bbkvKSij2XeS0xNTa6ajyTfu1zLuHKwpETTAxjnHQiZCJkKBSkIUpQALoRXJlSlKhRSlKAVrPnHjOypjvKV3GtO0bfcWPjKWtmOvcz9Rf0k8Vl1kQUO0EogmmVqg5brCBynFcTHTAUtoHNsxVOZP4JsaZVyqrk6XvC52LeTcw7m6bVjXjcsXcS8U47wwUdlOgdYBSUAmoIKpAqVMhFgVIUC0DLjpSlAKUpQGs2MeM+/ry4vpTCl2lh7ft8tyycNbLeTsucbu5tRmgJzi2klUyxy6mqayvJSOZTkpGNp4DiXZmqjjuEC20Mwx+WZ/Ll8zreDuJ/PWzaU3Kt14yGkniC6CzhA3dwdGAEnToiaSrhRFEq5gSTIBUwJblCK4pSlCng4mKQTEJuEA6F101H4K1WjeOXOdw2lKRI4igrevZ3nf6HNuRsjJnetGgAxSfHeujo7RWErYHKnKTEgGMVNPeXUVK2qqorq4MMY3JAz8YyuO4Yd/N5CTvZvPxbxHvkTNJpIJFXa81FRLby0AIKaqapDlUUKYDFOIVVYjuZPhWzTceb8avZa94VkwuG37rmLbuBGMUOZqo7j3qrUy6G/xAkqVMixSG1MQFdgiYSiYbKqIYNwta+A8fJ4+taRkH5TSL2RkpaYWIo8kn7xyo6dO1zEIQgqKLKqHECEIQu4CkKQhSlCX1CilKUBqxcXHJnKKx3m2bc4QbR09jbJ0JasFEtyu5ozlCQbwqpXqyTAhllhIWVOqKLcpj7EQKGptRq2uEvNEjnbEoXhO3HDyEo2lnTCWTh4GQi+4uET6GbLs5ICumy5QEomIqUo6GKYA2mKI+Lh4V7Rlgvp7b1+3Zbcrft0x9xSE5b0sRFyyfsmbFoiZDemdMUxSj0AOisRVJTcoBymKfbWYwVgu3cDW5JQ8RccxOP52dcTNxXDPrIneyj9YCFMuryEkkSaJppJlIkmmQpEiABQ0q6E1uTalKVCitMry7QziIxZdMxad7Y0suQmFLdK6bW3BSyiq1nybuZjouIjpt0mZVExnYyQLAdIEzFKzcbCKlAFQ3NrXOx+zax7ZmMJvCzrOuRJq1pxFYy8VJuYpMyUgo5I6CVK4ax6Lg74jhMqoLqqKCJ/EcDjoIVWI7k34Z8yZCyDM39jDLzCGJdGO7pRipB/bqaqbGSRcRzSQQcpJLHOdEdjvlGTMc+h0DGAwlMWrVqCYJwJB4KYTx294TlyzV1Tgy9z3PcqjcXsm7Bsg1IY4NUUEEykbtm6RSJJJkAqQDoJjGMad1CoUpSgNQ8m8d3EbiO9rshLhxja0q4jbJuu4Wdk246WezUI2jSKHjF5IyB1EzEkgIUE0iETUIdUEyc8U1TEtbg14groztAXAnf1wQi09Ayqbd9FR1oTME5YEURIon3hnMEI5LvARMRTYBDl9yIiU2mHsjs/7esFrdcRB8SGTyxl5O5R7MR6UlGtji9fHOc7srtsxTec9Mx9UzmXNtAhCDuIUC1PMH8O8ThaVuK7XeQrkvC5brWamnbnupRp3pwm2S5TdAE2Tdu3STTKJxApEiiJlTmMJjGEauhNblhVQvG/xB5ewUNop4+BtDQ0w7eFua/JHHcpdLWCKkkUyCarKMWRWIC5zGDvJ1CopAiIG8ShKvqq8zZw9N8wT0DesJlq7rGuS3EnaEbcNnuGfOFq65IuGyqL5s5bLJnM3QN40TGKZEokMUddYVlHB2ruI8cYvtq4MuPY24pN3aa1xXLLY0lWS8SyiUnazX0mXvjtJVQigt1jg0QBy6TFFZMSHMnqaazvaJ4qt8Z6dXxhfrm0oN/IRid+x0Ii5ipKUZLd3Wj0OWuLgFhc7myZ1kUkFViGTIqYwl3Y5fswsGpNWJLcv694V2WPdsrjloyTa99uNF1IuZNwLpdVsc6Cp3j16sCzIWyqYu1ATOQu0C5Sc7O7ENwnn4eRyDfIWvOv5KSSslrPJoRkZKPl+8uJFvykSuBX7yJ3BAVWVSSWUMdNMg6aXQmp1XXaI2s1nm2OfW6ZKUv5xPLRJseJN4kZFBYkeWRBQ6/pDuPJO1NvKqDkSiYpkhEFQFOolkbtTLYd46jb24e8V3JcTV4vZoyNwu41EsbCFnnrMiLd2QXSbnvHdnQH9pSVTSMokKpilEatDHvBRjyxsiMsxy983Tc94NplxJu7muF017w/VVjyx4EVTat0UCJptiFKRNFNMoG3HMBjnOY0RS7MDCEdBxNn21kW+oi32KNvFlYCPlWoN51WEVSUjl3ZjtjK8wgoIlNyDolVIkQqhTgUNGg1Jjw1caGO+Ke4Z6Gx3aU+g1g11kvTL4zFRs6Ok4O3UIANnSyrVUp0xHkPE26wlHUExADbbgqnsL8FuP8L5fe5vb33dNxTriDVhWTm5nLVZRlHqOCODN+ek3TcOwA6SQFUeKuFSlT0KcNx91w1GFe2opSlCilKUApSlAKUpQClKUApSlAKUpQClKUApSlAKUpQClKUApSlAKUpQCtMs7sM35u7WOO4ebY4u8jY3tiBwIldiTKwTxRQeSR5tZmYzksgxdprE5RSgBDF0ASgIaajrubWprf7Ok7/qmtvnOvVRGTv1oWe/toud/kKw/wBWKetCz39tFzv8hWH+rFXvSlylEetCz39tFzv8hWH+rFPWhZ7+2i53+QrD/Vir3pS4KI9aFnv7aLnf5CsP9WKetCz39tFzv8hWH+rFXvSlwUR60LPf20XO/wAhWH+rFPWhZ7+2i53+QrD/AFYq96UuCiPWhZ7+2i53+QrD/VinrQs9/bRc7/IVh/qxV70pcFEetCz39tFzv8hWH+rFPWhZ7+2i53+QrD/Vir3pS4KI9aFnv7aLnf5CsP8AVinrQs9/bRc7/IVh/qxV70pcFEetCz39tFzv8hWH+rFPWhZ7+2i53+QrD/Vir3pS4KI9aFnv7aLnf5CsP9WKetCz39tFzv8AIVh/qxV70pcFEetCz39tFzv8hWH+rFPWhZ7+2i53+QrD/Vir3pS4KI9aFnv7aLnf5CsP9WKetCz39tFzv8hWH+rFXvSlwUR60LPf20XO/wAhWH+rFPWhZ7+2i53+QrD/AFYq96UuCiPWhZ7+2i53+QrD/VinrQs9/bRc7/IVh/qxV70pcFEetCz39tFzv8hWH+rFPWhZ7+2i53+QrD/Vir3pS4KI9aFnv7aLnf5CsP8AVio1k3FfELgBvbeRUO0GyzdKf0Q7ZjH1v3PB2eDF81fTTNkumoLKBbuC+1ODiUyaxBAwFHUQAQHZyqm4zfqWW/8A0tWN86IyiBbNaMT2PM18YnaT5xxE544sw44tnGNsWYrbkNjGWjGKSikkhIqOTuO8sHBlTbmye0dQ0ATB1DaBd561M4V/stnFr/NPGn+EmaIjJ4HCDnsA09lFzv8AIVh/qxT1oWe/toud/kKw/wBWKvelLlKI9aFnv7aLnf5CsP8AVinrQs9/bRc7/IVh/qxV70pcFEetCz39tFzv8hWH+rFPWhZ7+2i53+QrD/Vir3pS4KI9aFnv7aLnf5CsP9WKetCz39tFzv8AIVh/qxV70pcFEetCz39tFzv8hWH+rFPWhZ7+2i53+QrD/Vir3pS4KI9aFnv7aLnf5CsP9WKetCz39tFzv8hWH+rFXvSlwUR60LPf20XO/wAhWH+rFPWhZ7+2i53+QrD/AFYq96UuCiPWhZ7+2i53+QrD/VinrQs9/bRc7/IVh/qxV70pcFEetCz39tFzv8hWH+rFPWhZ7+2i53+QrD/Vir3pS4KI9aFnv7aLnf5CsP8AVinrQs9/bRc7/IVh/qxV70pcFEetCz39tFzv8hWH+rFPWhZ7+2i53+QrD/Vir3pS4KI9aFnv7aLnf5CsP9WKetCz39tFzv8AIVh/qxV70pcFEetCz39tFzv8hWH+rFPWhZ7+2i53+QrD/Vir3pS4KI9aFnv7aLnf5CsP9WKetCz39tFzv8hWH+rFXvSlwUR60LPf20XO/wAhWH+rFYV3j3POB854lPI8c+Tr5ibqvd5DTdu3fDWqRosgFvTD4hwPGwjRwQ5V2SBgEqoAIAYDFMA1sjVTcRv1YcB/0tPPmhcdS5GWzSlKFFKUoBSlKAUpSgFKUoBSlKAUpSgFKUoBSlKAUpSgFKUoBSlKAUpSgFKUoBStaMXzyOHeM7iKuXKOZ5Va2I2yLUnV3l2SaRWUA3MeeMsRLaRNNBuQiJRERATeHcc5h61rtli/b5j813K+xXfEi44h0szTbGOtMs6sdQbWJbzpRmAsBOKYR4pg0XBXl7BeGDxCqYQG2Jc9kFamt/s6Tv8AqmtvnOvWB7Ne5bDk8sOI7h+yQ/ua0VcMW0+vFw5uJeTKjdKizsFRWOsocUZBRENXKQiU4ctAVClESiOEzNkTLmPe3Gbr4m4fH+QFXnCqUkggwuJjHiwISedqJqGF2oQFAUVImiAE1EoqgYdClMIBe6N66VHZi6b3YvnraMxg5fIt30ai1cklG6YOkV1yJulwAxgEgNkzGVMU2hlAIJUwMYQCiF1XupKt2SuMHJG6twrMl3gyrcQRYlaqqkkBKBtxiHWImgCQe2AKwHEAIUwhCkipUVZ3nkRdFoo6w+7QMvEyDlwQ0y1N3dygqkRs1EQP4jOSHUUKcPAmCIgcSiYoD+XF65GSZO3CGG3aqqEIwdtkAmmgC5drKLFcMgET6FM3KRI4qD4FOeAEERKbQCWUqOOLqvdKSdNEcYOVEEbhbsm7oJVuAOGJ26KikgBRNqUiap1URSH2wwoCYoCUxRHzE3Te714xQksYOWaTmRkkHa55RucGiCCyhGrgQKYRODkhSKFIXUyYKgVQCmKYAAkVKhfq/wAp+pT019Al76S9RvpT0L6fZb/SvL3eiOZv2czd4O8a8n392lZKWuq92L18hG4wcvUm0jGoNHBJRuQHaC6yZHTgAMYBIDZMx1TENoZQExKmBjGABAkVKjje6r3VkmrRXGDlNBa4V2Th0Mq3EEGJGyyicgJQNqYiipEkQSD2worAYQApTCHXbXrkVVo0XXw47SUXhZB05RGaaCLd2ioiVszEQPoYzgp1TlUDwJggIHEBMXUCV0qKu7zyIi3dqtsPO1zoxEe5bJlmWpRcOllVSuWgCJ9CmbkImoZQfAoCwAQTCUwBzr3Ve6cq5ZJYwcqN0rhRZIPAlG4AuxO1SVPIAUTbikIsdRAUh9sMKInABKYoiBI6VHYi6b3fPmLaTxg5ZIuH8ki7cHlG6gNUUFzkariBTCJwcplIqUpdTJgoBVAKYBCsaW/8pDaZpocEvQkgs0JQsL6fZbxlRTEwxHM37OYBgAneNeT113aUBNKVHZW6r3ZO36MdjBy8TbScc3ZrElG5Adt11UiOXIAYwCQGxDqKGIbQygIiCYGExQHw2uq91pBo1Wxg5SRXuFwycuRlG4g2YkQWUTkBKBtTEUUTSSBIvthRcAYwAUhhACR0qJI3tkg8czdK4YeJrrwL945ajNtBFs8ROiDdiJgPoYzgqipgVLqmnyBA4gJi68j68shNyuzM8Qu3Aoxkc4bAWYal7w4XWVI5bBqfwmbJkTUMcfCoCwFTEximAAJTSo4tdd7py67FPGDk7ZK4UmSL0JVuBVWJmiap5ACibcBCLHO3FIQ5gikJwDYYoj5h7pvd/IMmspjFyxRcPJNJ05PKN1AapIODJtVhKQwiYHSQFWKUupkgNtUApgEKAkVKhZL/AMpmtM80bBL0JItmklCQ3p9lvPKimYwxHM37AUAwFJ3gR5I79QNoA1kpS6r3ZuZBKPxg5dptZaObM1SyjcgPGy6iJXLoAMbUhWxFFTmIbQ6gICBAMJi6gSKlRxrdV7rPWbdfGDlJJe4XLJ0uMo3EGrFNFc6UgIAbU5FVE0UwSLqoUXAGMAFIcQ6hL4yUaJZvT4WeFcr26+euWXptpubPkjIghHibftMdcFFRBUoimTkDvENxdQJdSovI3hkBqZ0DHEjp0CLCNWbmLMNSd4WXXUTdIBuP4RbJkTVMYfCoCoFTEximAOVW673JMrMCYwcmakuFNkm+CVbgVRiZmRY0ht3bgIVcxm3KEOYJkxOAbBAaAkdKjkPdV8Pn7NtJ4vcsUV3EmRy5PKtlAbEbuBTaqCUphEwOktFigXUUgHaptN0rHkv7KJrXVmDYKehIktBKTTh/TzPepKGIcTxPM37AUIYpC88R5I8wBA2gDQEzqpuM36llv/0tWN86IypvJXVe7Ry/SY4wcuk20wwas1SyjcgO2qxkQcOwAxtSFbgoqYUzaHU5AgQBE5dal4wbqvdxji0m7nGDlBJxni0Wbtc0q3MDVkncjMyL8QA2pyrGTRICRdVCd4ATAAEPpVuC/K1M4V/stnFr/NPGn+Ema2zr15tM18SeIe114mEuH7gumMuEkrTx56YVir2iYcIjY1lOXvCQWTFbmb1NOXrt5I7tNxdS5kZ7DKViDztyFfqti2UsKJJYjYjnvyOh2wtyqGdbddQKVUTI7B8YiQTAG0QGkdOXI6dt0HtlrNUlV3pFlzPUTAiRJYSIHECjqYFyACgAHUgDtPoPSoUy9KjpbqvcYI8kbGDkHgW8V6SO9KN9xnwlMIx+/dtA4CBS83Xlju1AdAGu28nLlbquyNbKWXKjINEW5yvUS94RUMmCy4AI+EEQOoYSj4j8oQKAiYuoGXpWIRnLlUcNklbLWTIrLLtl1BfIjyGxCKmTdCADqYpzETKBA8ZecAiAAU2nXC5byGObuvobuOerDOXSzX0k31RdJ8vlMxNu0Eyu9TRQPAXlDuENxdQM/SsK8uC6UFVyNLEXcFTbsjpHK/RLzTqrHIumACboKBClUER6HA4FJqICFfs85cpZI7QtlLC3LLlbFd9+R0M2FsVQXW3XUCgqIobPdiJd2m0QGgMvSsRGzlyu3rdu+spZqiqq9Ks4M9ROCJUltiBhAo6jz0/bQAOpA8J9DdK6hLqvc0ErJHxg5K8Jbyb1OOGUb7lHxinE0fv3bQOUSkLzRHljzAEB0AaAkVKxDubuVA7srayllgQkmqDYxXqJe8oKGRBZyGo+EEgOqIkN4jckdoDuLqQnLlVWaprWWsmVaWcNnJxfIj3dsQqwpuh0HxFUFNIAIHjLzwEwBtNoBl6VHzXPegRLd6XGjkXKsG4drsvSbfVF4QEuWyE27aYym9QAUAeWXkjuENxded/PXO2dLIsbHWdJppsjJLFfolBUyq5yLlADG1DkJlKqIj0OB9pNTAIUBmaViDTlyhKmZhZawtglgbA976jtFsLUFRdbdd20FhFvs036hv02da40LhuxQ4FVsBdMBJICJhkEB0FFYCNg6G/9ITEVS/7MA2n0N0oDN0qIGvnJYQzp+XCbwXSNts3zZj6cZ7nD9UVufHAfftKdHYkIqiPKPzw2mHabTuu7pvdB29Qb4wcrJN7gasmi4SrcoOmSiaBln4AJtSFSOosQUjaKGFuIlAQOQRAkVKjsZdV7u3TBF/jBy0Tcy8g2eKmlG5wZtUTrFbOxAptTlcFTSMVMup0+eAHABIbTHKX7lItqpTJMFPTSR7OUlFIb08y3pyhSEMWI5m/YKhjGMXngPJDYIibQQoCZ0qOS91XwyfvG0XjBy+QQdRibVySVbpg5TcOATdKgUxgEoNUhFYwG0FUA2p7jdKEuq9zTKLA+MHJWp7hUZKvvSrcSpMSszrEkBLu3CQy5SNuUAcwDKAcQ2AIgBI6VF468MgujNQfYjdNQWjpJdwJphqfu66C6RGrcdp/ELlM6ipTh4UwREqglMYoDwqXxkksY7dkws8M4Rt9i9atPTbQBcvVjLA4YAbftKdAE0hFU2iZ+eAEERKbQCXUqOubpvdF68QQxg5VSQuJsyauAlG4A5YqIoHVkAATalIkooskKRtFDC3ExQEpyCPiKuq93rpghIYwcs03MrIt3ix5RucGbZBVYrZ0IFNqcrkhEjlIXU6YLgBwKJTAAEjpUMPf2Uy2mnNFwS9GSNZppQ8L6fZbyyoJlMERzN+wVBMIk7xryQ267tBCsjLXVe7J+8bRmMHL5Fu9jEmrkko3IDpJdwVN0sBTGASA1TEyxim0MoBNqYGMIBQEiqpuI36sOA/6WnnzQuOpsndV7mlkGSmMHJGylwrMlnoyrcQRYlaqKkkBKBtwkOsRNuCQBzAFUDiGwphCp813Te8pnDhwbTeMXMYi7yXNLP3Kko3VBisjbE6m3RMUhhFQV01FVQMTUpAQEpxAxigIMvulKUApSlAKUpQClKUApSlAKUpQClKUApSlAKUpQClKUApSlAKUpQClKUApSlANA/DX47s27z3zu5Obs2c3aG7brrpr56a+9X7pQH4QbNmwGBs3InvOJz7CgG4w+Yjp5iPw1qg3+zpO/6prb5zr1tlWprf7Ok7/qmtvnOvVIzbKlKVCilKUApSlAKUpQClKUApSlAKUpQClKUApSlAKUpQClKUApSlAKUpQClKUAqpuM36llv/0tWN86IyrZqpuM36llv/0tWN86IyqtwWzWpnCv9ls4tf5p40/wkzW2damcK/2Wzi1/mnjT/CTNFsyM2zpSlQopSlAKUpQClKUApSlAKUpQClKUApSlAKUpQClKUApSlAKUpQClKUApSlAKqbiN+rDgP+lp580Ljq2aqbiN+rDgP+lp580LjoGWzSlKAUpSgFKUoBSlKAUpSgFKUoBSlKAUpSgFKUoBSlKAUpSgFKUoCl+NntAeF3s9rBjci8T98uYlnMyB2UQ2johw/dO1SJGWU2ItyGNsImQxznEAKUNNRARABw/Az2l/DB2iK92JcNby5HJLL7gE2tPWu5jSgd4VY6RE+8FKKhtiAnNoGgFUTHXxhWqHaycTnCpdvEZZ9gX3HZ0ibow7cqqrySs3DTmbjZmKlI0G8nGgrpyxBwycCjzyCJkT6iACJdK7XYBRgvJ7KV0yWdcj3o8YW9adtMDX1h9S0CtoaPSkEmBQKc5u/uQIKhVV/dABUtRHcGmVtDG7ueyWlKViZGtnD1xrZFyxke0Ebvx7Cx9oZRYzzzHz2OklVXyKca4TIQHpDkAmrlucXBeWOiQkFI28RA9d2/eIPigsTidicUmtTH8jbT9vITMiqykH/pOLgGhPE7WKKXK5p1jookTAwicxziXwoqCXuWbwB2dYc84mbbzTfLdNlFTbCxGZV48U7LLKrlXdqR+5mInUA5CAkLsXAJELyygBDGKawiYBs4uR70ymeWmRlr4t5hCSCychyhYsmgOuUm0OkBVEB3vXComAwm3n3AIaAAXQmpVnABxh3xxWQT13k1lbcNMpQcXKepePYS7R+yRdkVMB1iSbVAVkhMmKabhADoqGSV0OO2oetMRMZ27R2slKNm6rzhSbpNE11ykMup6plx2EAR8RtAEdA66BVz4O4W2uH72kMmXLmO7r8uR7AM4JOau87Lmto1sosqmgUGTZuQxjKLnOoqcplDm26m0KABRE9jywL17eZlN3lY8PLPbd4XG7633knGJLqxjr1SOU+e3OcoiipsOYu8ggbaYQ10EaDkbl0pSoUUpSgFKUoBSlRbIuVISwUO7n/ZL85dUmhDeQfvjD+5D+8axlOMI3k9DdQw9bFVVTpRvJkoMchCic5gAA8xEegVgJTKuPocwpvbpbCYo6CVARVEB/9wBqirsyHdd5LGNLyZ+SI+FqiIlSL/7vv/yjqNQS58r4uspQyV4ZHgoo5Q1MnIS6KJg/sOYBrzavEYw1Wi6s+14f4LrYhpVG3J/Vgrv56/kbOmz3jUphAJVc2nvg0PoP4QrmbZwxo5EA9UIpiPvKtlA/v26VpsrxecMKShkj51toRKIgIlkyGD+wQ6D/AGV3oriY4d5oxSRmcbUUOcNSpjPIFN56e5MYBrljxiDek4v4/wDk9yp+zjEQhmlQrJdXF/8Aabox9/WVKaAxulicTeRO8lA34BHWssmomqQFElAMUQ1AxR1Aa1DiLkt24U+dATzJ8TTXczdEVDT+UojWWYTMvFmA8ZKOW4h5CguYn+4a64cRutV8jwcR4NyNqFVp9JL/APn5G09K13jMy5Hi9Cp3GosUP3LlMqmv9ohr/fWfjuJS6EBAJODZOADzFMTJiP8AeIf3VvjjqL30PKreFuJ0/ctL0f62LppVZMOJmDUAPSdsukh9/kKlUD+/bWWacQOOnP7c7dN/+1aiP/h1rcsRQf1kedU4LxWlvRfw1/K5N6VG2uXsbu9OXdbcuv8AtSmJ/wCIArNRk7CzRBUiJZs6KHmLdcp9PwDWxThLZnFUw2Io/wCJBr1TR2qUpWRpFKUoBSlKAUpSgFVNxm/Ust/+lqxvnRGVbNVNxm/Ust/+lqxvnRGVVuC2a0pwpmDEuK+1w4qksn5Rt22zSFp437gWem0GYudjSX38vmnLv27y66a6bg18wrdatFcccM/DfxDdrjxRr5+4frIvk8NaeOfRB7wtRnJix5rSW5nJFymflb+Wnu26bthdddoaERm9XnSlKhRSlKAUpSgFKUoBSlKAUpSgFKUoBSlKAUpSgFKUoBSlKAUpSgFKUoBSlKAVU3Eb9WHAf9LTz5oXHVs1U3Eb9WHAf9LTz5oXHQMtmlKUApSlAKUpQClKUApSlAKUpQClKUApSlAKUpQClKUApSlAKUpQGjPbZ3XxesYfEWOOGXKN5WLG3neL6JuK8LGhu9vGz88cr6FaqG2mFu2cSApJKLeEChpqYAHrWn+j4Z/yNmy58tJXbxL5XykzY29Z51n+SmSrYtuTR0JAZSFTTURTAyyK23mKk1KcgoBoHL3HjfbVY5uzh94hsfcQl1dpVxJYxxhke+/Rt/v7Ru5UIKzGqUWPIK3aoIGOkZ04SIHMMY5CCZY4kNqABOOwwyWhfOd+IeJxZxj5Zz3iqLXtpKzMh5Kl3DpErsUHpnzJqKySYHOQxkRUVIUoGKZEBKG0p1MvqmP1j2O0pSsTIUqDWHxL4FyfkKWxVYGUoqVuGEFx6QjGqwicvIWBBwJBEAKsCKwgkqKYm5SggQ+0wgFcJOKXh/UzO44eksmsT3k0U2O4MiagqIH7qV3tOcC7CD3cxVdBMA7TFH3woCf1qa3+zpO/6prb5zr1fWGeJPBPEOk/Wwpk+LuIsYCJnncFRESpLAYUVygYA3oqgQ4prF1TU2G2GNtHShW/2dJ3/VNbfOdeqQ2ypSlQopSlAKUrqTk0xt6JcTUkrsRbpic4++P3A+6I9A+6NG0lcsYynJRirtkfynkltYUPohtUkHACDRIf3PwnMHwB/eP9umlmZuKz0dei2PMcW87vm/HGp1otioAJMdfJR2uPhRKGoeHz8g8ICA11+JHPuSs5Zcc4MwXLFbTAlBS67m270rdZjptST94zgwD0DzDqPQdTEnPD9w3QGN4ILKxRbKyx1D8yRkFR3ru1R81l1R01MI6+egB5AAV8xicVXx9d06DtFaN9+iXN9XsttXe37lwPgHC/CfDI4ziiUq00pKneyyvaVSWjjD7MU1KfvXjHK5Vchw5ZjywUJHiQze/Iir1NadkqmYsUw/eKK/tq4fDqIeXQRqUWnwi8NNmEKWGwvBKHKbcC8izB4ru+HevvNrr92tm7e4aljlKrdE9sEfNBkXUQ/wDfN/8ASpUxwPjZmUAViVXAh+6XdH/3FEA/urZS4NG+ZxTfWWr/ABucWO/aTUs6VOtKMPsUlkh8llT9Xdvm2ayNsZ43ZJchnj6DRJrrsSiUShr/ACAWsdJYEwbMJcmVw3azguggHNgG46a+eg7Olbc/Qgxt/BND/wCM/wDxVxr4Yxo4DQ1rpl098i6hf9xq6XwvMrNL+/geLDx4qc80ZVE+qev/AFGj8vwPcLMuqLn6EbNktrqCsU6XaGKOuvTkqFAP/wDnwBXTDg7QhDApjziDyPAgTTltk7jF02Lp5By1ym1D7mtbuO+HvHbnXkovG/8A2ToR0/8AiAaxL3hlhj6jHXQ6T+AFkCn/ANwlrmlwSne6gr9tH81Y9qj+07FSWWeKqNdJ+dfKWZfgab/Qt4ybYIA2xxNQ08BPcNrntEiWofAZVsYDD/LprXkL144bbEpZvCVmXKAe7Pb1zKMxEPuA6IPX+3Strn3DTc6Qj6OnmSwe9zSnTEfwAasO9wPklpqKcSiuAe+i6J/8wgNanwytD3XNfHN/1Zj0afjjhmJ/xoUJ+sFT/wDx+yNaQ4ocnQggS+OD+/Wxum4YMreTKHl76Zy6+Y+9r0/l0E45MRsxAt2Wre0AI6ahMWc6Jt6CPXllP8FbAu8Z3+xEQXtF8OnmKSAnD8Jdax7i355oO11CPEhAdBBRscv+8K1vDY2G1T5xX9Mp2Q4z4ZxK82FX/LrNf9aqlNRvHPwoyhikSzIxRMbTwvWrhvpr8PMTLpU8x/m3HF5PCucZZSiJFymG4AiZdM6pPf6lIbcH9oVk5O3oWWKCczBtXIdBArpsU/l/1gqA33wj8POQExUkcZRzB6A7kZWDRBk6ROHkcqiO0REPe3ah9ysP9/hreMvg4/1kbr+FsSsrjVpp87wqr5ZaV/mbbYfy/wCqvS3LjOUsgUuqKwAAA4APPp7xvf0DzDrVhV614XJeVOEK8Y+3MxXS6n7JeuypQN+Lh+y4pcR9rRfGD3RR8gW/tHpqBfYTja9m1+WqhNpGJzdNjkhB1Aqgeen3BDQQ+4Ne3w3HrFRcJaTjunv/AOfXmfmPjTwpPgVSGKoNToVfdlG+V9d9U1zi0nF9mr5+lKV6h8IKUpQClKUAqpuM36llv/0tWN86IyrZqpuM36llv/0tWN86IyqtwWzWpnCv9ls4tf5p40/wkzW2damcK/2Wzi1/mnjT/CTNFsyM2zpSlQopSlAKUpQClKUApSlAKUpQClKUApSlAKUpQClKUApSlAKUpQClKUApSlAKqbiN+rDgP+lp580Ljq2aqbiN+rDgP+lp580LjoGWzSlKAUpSgFKUoBSlKAUpSgFKUoBSlKAUpSgFKUoBSlKAUpSgFKUoDQDt4Mx3vjhlg6w47iwkMI2nfOQXcVfOSBhmz2NYtCx6qyaLpNdMxdyyqZSJiIlKUd5zjtIIVp5wo8XfFBjHi7Z23hrtNZLNmNYzO9mWHFtUrIYEhrpZzaC6sgRuo2SDkuY0iB1zKpnFMxdmu0BEpt7e25yRbeMMBW/P3Xxq2ZiZmaYVIpDX9jQl1xl5e1gYI9VjtMqO0QA4HRKJy/c1qg+z37VHKkb6hbB4i+ypGx7Fmr/ZW1YeV8f2epEQK0pIiKDZdKKfpJOmiS24SGXIJwADiA9B65LYwfvHtRpSlYmZpXgTCfEnjC4rCay/D7KKJ4Qtu8kSyqE3GB6uF37lIzNJlq5AyYrppiusZ2DcqawJl1OGpy9fK/C5xC3nmu7YjEdn3/Zql53NLHu29HmSEnlryUO4gVGSQpRoOAOk75pWWmjQp0zNzD3k6e0p93KVbksax8G2M81BlxLKOT8KObAbwWHIGySxbuTZORkXrRdysuuj3NZUvdE+YQqJlBIobmq6pJgAbq6ynbGZrm7clJPDmWYu1FkOFQhpJWTtT0qDpM0+6KmQpe8ocoSrGTUE2ptxUxJoXduDeGtTW/2dJ3/VNbfOdegtobKykPfzh47Vir1ZtkFHjA7NFSF5goIprFM7SMbmhvFZIDJlPoHJEwG0U02iRiL+LJILrXqzM1JOKuF24Q2hlGAt1CJtAPzfCoVYyaoraDuKmJNgbt5c7SoUjjWCyYmk2K7yCwVOnGPknRiwG3mulFEzNVwDnDsKiQqpDJ9eaKgG3J7NDeF4HJ52jlNDIjAiykSyQaqmt/cCLxM6ouXIhzw3kVKZIpUtQ5QpGHeffoWSUoDBLQ9/HfuFkL2ZkbnnEXDZAYXUyTAqCRVWgm5viUOqVVQFtA2gqUmw2zcbVHtCeIXKtjhBYMx1d7KVvG4ZZ8myZpRHLDlKKHMgof2wwEKzQMQDnEDAscm7aQNSl2oy5ky3MO43mMlXY/TbMIdio5XVUHp4Q10+7/JWnHArhu6eI+/5fjGyw0WTcXKO2GQW91HxO7ckkX4FFv2w4h7xgHpu0ryOJ1qs3HCUX5p7vpHm/wCi768j9C8D8OwOGhW4/wASjehhrKMXtUqvWMO6XvT7aXTkjOcKPBHe1o40Pb8HkRBBVeIVGSuR5BistIzqgeKQMUVgE6YH/wBSJvIALzNdRraZvZVzwaTlhaNzx8ezM9YKMW4wnMFFBNUhnaZzc0OaddMDkKoOnKE4G0U27Ry8tL2vYdtrTE5JsomJjWwncO3a5EUGyRQ6mMYwgUpQD3xGoflq9c1rW7DueGay7duNSaKJwm5ueFCPYoCQp03AgkQ6jkpwHoVPT4dwAOtdVGjQwNHLFbLkrv5L++p4XEuJcV8UcQdWtOynJ6zklG9ru8pNK9u99klqkSRCIv4r9usverM7ck4s4cIBDaGVYGQVIm0A3N8JyLGSUFbQdxUxJsLv3F4EILJxGrYjjIjBRVOJeoulS2/tBZ4odIWzgA547CIkKqUyWo80VAHeTZobFXfiy6Mq4vjLRvfJczASxAQWmJSwH5o8y6xSCChEznA5yImMIjpru0Avi6Dr+43h+xu1xAfBs01kZ231yHK8TuGYcPV3W5XmmFRdU4qGHf191oHQA0AACujPVb0jpbm+fTZ/P8GeQqGBjTTnVebNZqMb2jzkm5Ru+kdL85IyC8VkVdF4mzyRGpqejGKKJhggP3d2mooZ0uYOeG4qyZkilS6coUxNuU36F5zRl9rv1nbS+WPdFJtFy2RCH3CSPBumRRqJ+b4jmWKoqC+gbSqATYO3ebG454fsL4it6TtPGuOY2Gjpk4nlGjNHaRyYScsRPqPXwBt/krqYp4YsB4NmHE9iPF8bAOnTQGzhWPKYvMSAwGAogJhDoIB72tFKv5bxXfV6emmv4FnT4WlUyVJu1sl4RWbrm/iPJblbPfsSCMiL9QeNFZS9WblBN4/UeIpw3LFdBRYxmiRTc0dhkUxIQx9B5wlE2ie7aHQC3MuhbYsDZQjfSg2qDMsj6mfawl9ggMhye8dUt2hu67vINOb11rE23wx4qtHKS+YLeLPt5dy4cLuUhu2ROyVUXE4qGFodcUOonMIBs0KOglABAK47mwNcc7lFPJUVxF35Eog8bLLWwydszRipEgKApctVsY5SqaDvEpwERMOgh00meso3cNb8ny662+Rn9G4bUq5YV2o5b3nBrzfZSi56dJO3dIlElEX8u4eqRl6s26SsgxVZJqQ3MFu2TUTM6RMPNDmGWIVQhVNC8oVANtU26GN4i/ivWyri9WZ0E5xdw6RCG0FZgZFUqTQDc3wHIqZFQVtB3gkYmwu/cWM5hsfiJuSaaSmFc7xdrt0WokcxktZpZJNyru1BTeC6RyaF6bQEQ6a13sqG4hW8BHDhJCz3kmVUAlS3Uq6boKJ7Q1FIUCqGKbdr0MAgAfDR1WnK8Xp6O/pZ3+aRhDA06ipZa8LzvdNyWS32nKKjryyyl3sZBKByiVi1RVyLHmXThniDpYLe0BZ8cyQtnQF5/gIkUqoGR1HmCqUd5Nmhv28g8lKlcgyyAxRFSPYpNhPA7+U5TVUM6WH24N5VkzJEKn05Qpibcpv2lxsrcmc4TEac8jjCGm70ImTvFvR1xGbszmFTQ3LdLI66ATxeJMNRDTp51j2mVM0N8WPrzuPhpkk7gavSJN7RirjZOlXaQimArEXOdNIADecdphKPtQ/vgo68E7NPa+z/AE37b9iw4ZiKkc0ZQtmyf4lNO/Wzknl19+2T72jJG6t29XEkusN2sBaHm010Wp4MDGJHg2IQ7QT83xHMuCioLaBtKcE9g7d44s2J3Mm6bGud/DvECOZAzwiFvggosiqsYzRMqhVREgoJCVMxuvOMAn0T12h+rLyvP3Lj6Tvi4sL3VbzmMM4D1PSSTZV87BJMDgKJWyyiam8REpA39TB73Qa4MN50aZjVk2qeML1tleL5PORvC3FGHOBTfoKRxESK6bDAbaYdvTX3Qaz2tGbUXz2uv1MlguI4eNSpDam0pOMk0m9tYt3XdXXcprN3B5fE3i6RtpxecdNIPrR7hIlXtzwhIbBA78qXP6pb9pwbgbcTb0VH3QU7wO5GyfgnMMhwfXvkNMiXeGTmxpeQjud32FIuQVWwjvLuWKmVVDf05YKAcCnKkAG3ttG97Nv+J9PWNdcbMseYZPvcW9TcJ7yjoYu4giGoD0EPMPfrVrtGeF+bmbXbZrw82FG6LTeelIYUSjqCoftrfQPNNcmpBL5btoeQ6V5WPw7ouOMw6u47pc481/Vd+zZ+geFeM0+JwqeHOMyywraRlLT2dVaQk+mvll1i9U5RjbZxvEX8R21Uc3qzOinOOHDtIsNtFdgZJYqLQDc3wHIodA4raDvBExdheZuL1iwGUwjWqB8jx4uk4N23duAt3Qqz84pd3dgTn+AiQFWAyOo8zmlHeTZ4o1wjcQEBxM4EgcsQSmgvGoJvkDG1Mg5J4VEzfdAwDVl17FKrCvSjUg7pq6+J+cY/A4rhmNqYTExy1KcnGSfJp2aI8+hMkLGcCwv1igB2TBNsB4Lfyl01lDO1R9uDeVZIyaZSdOUKYm3KbtocikRf4yqrlO9WYNDThHCTUYbUxGANSEM0E/N6nFwB1gW0DQpgT2Dt3jnaVsOQwUXD3+3etVZW9mblBNaQM7RTheWKxFFxM0IBuaOwUEtEzG0HnCG/RP3NdEtuZcC3lGJ8nxoyRrYTaJSAWz7WSWApwO/FLvHVIxhIINtwabBDmju1CV0oDBP4i/ll3p4+9WaCasoyWYpnht4t2iZkhctzDzQ5hlQKsBVfDyuaUdp9mhqm4w4i/k8bWoo7vVmoklnOz13iRYbaK7E9ysgQalHmjsOmYyJhW0HeCJg2F5mpb2qpuM36llv/ANLVjfOiMqrcFs1oFbVg8UV79rnxOn4ceI637ATa2njv02Scx36eF/uaSvK2D35ryNm1TX3e7mB7nb4t/a1M4V/stnFr/NPGn+EmaLmRmz5o+6heKLFuNuCAyZFU0fR2olagiUpkBNv6mFUDKczToBgJtHTcPljH3Ui5QUkLkbrpEWdmcJEjtgqEOqJm5QHeO0U09CGHQeYIbtCe5rJ0qFMEERf4Qxmo3qzF6MGVuR4EN4CvwKYBd8vm9SCYSjyd3TaIbx11DtOo+6VFHJmlyN0iqPWyjUpo7dykCGTFdIR3hvMoUqgAfps5gDtNt0HJ0oDGJR91FXQMtcbcyZJNZVwQI7QVWpiKAmgA7/CYpjJGFTruBMQ2hv1LwBE3x3FBEbxad4JFLorr+iPCo7Ny+U4AvN8JCbVNUtR38wPEXb1zVKAxLqNvBVRYzS6GyRTINColPGbxIoRUxnBxHmBuBRMSEKXpyxKJtT66B+zx91C/OuW5G4NxkyqkQ9HeIGvIAgobt/UwrAZXmadCjs29Nw5Oo1duWLMs8xm7+S5zkvm1ahvOA/d94v8AaIVjKUYK8nY20aFbETyUouT7GSYR91Iu0VZG5G66JFHYrpEjtgqFOrublA28dopJ+Aw6DzB8Xg9zXVLEX+EMo1PerMXpoMjdN4ENoQj8CnAzsU+b1IJhIPJ3BptEN47tQruZ4l5ZUwlgLeQRL7x3SgnEf7C6afhGobPcV0vF7hl8jQ0YAB4uaq3T01HQPd/drlnj8PDdnv4fwpxjE7RSfrd/hc2Acx90qHdC1uRumCj9so1A0du5Lcopc5EfGG8ygFVAD9NnMKO02zxEWF1FVbitcjc5U5JZVyUI7TnNTFVBJAPH4DEEyQip13cowbS79S60evJZ/wAfUB8pMq7kZxeLuyiZhmCDdFIbxCR01Pp9wRCta4nhnz/L9Tsl4H47FXcV8pf9psGaJvsY1BuW82YOiQ66Dhz6H8Kj0wJ8pyBOb4SEEqmqWo7uYHjLt8XM8jrtWcqqMbmbIJGTaAimeN3iQxFjGcCI8wN3NTEpChoHLEom8eu0KbjuJG9jhuTXjXQF8x5P/CYKyzTiZnSf8ttlop8PKWMT/furasbQfM4Knhfi9P6qfxX9bFoGj7q9ImcFuRv3X0mCpW3o7xA17sBBQ37/AHXP1V5mnuR5e393XGjGXkU4CvdbU4bXoCUIrTUVFQM2H9s/1KepDf7UR3eD3NQVrxNxhg/Ztprk/wCyclN/vAKyLbiOsVb9vZSCP/WRKIf3GrYsTQf1jjnwPi1Pek/hZ/kzMjb+VRi3DcuSY8HakC1bNnXqc8KMiQVee8EnP8aagGS2oahy+Wb2w+/w9tzD38o5dqNb1ZppKTbZdmkaF3CgxKmiCzUw80N51DlWMC2gbAWKXYbl6mxbbO2NFx0PNqJD/wDqNFP/ACKNdxDLuOHHuLsbBqGvjAxf94VmqtJ7SRzS4fj4b0pfyv8AQ54+Iv5FwzPI3qzXTSlHqz0hIbYLhoodUWzco80eWZEpkQMrobmikYdpN+heke3MuDbibAmUI0JMtrKNFZH1M6pmlhIUCSAJd46JAYDmFtuHUDAHNDTUcijkWw19ASvCOETeQC8IA/3jWRYy0VJl3xsk3cB8KKxT/wC4ayUovZnPOjWp+/Fr1RipOHv5y9dLRV7M2qCjiPM0RUheaKKSa4GeEE3NDeK6WqZTaByRHfopptoSHv4JVJye9WZmhZxRwq1CF0MdgLU5CNAPzfCcrgSLCtoOpSCnsDdvDO0rI1keYweSERbC/v8AYrgRi/TcgSB2c1wosmZoqHtw7SopFUTMTrzRUA25PbtNxHgMpjHuUE8jR5XKkIzbtXA27qVF+QyouHQk5/jIqBkQKjqHL5Rh3n36Fk1KAwbiIv47p0q3vVmRFScQcNEhhdwosCpIlVaCbmhvOdQqxwW0DYCxS7DcvcbxHRF/IOWZ5O9WbhJKRfKvSJw3LFw1UUVFqgUeaPLMiQyRTKaG5opmNtT36FztKAihrcy4NtkYFyhGhKBapmZ5H1M+1mlxIUAkOT3jokBgMbuu7qAgHNDTUe9JxF/OXjpaLvVm1QUdx52iKkNzRRRTWKZ2mY3NDeK6QGTKbQOSJgPopptHO0oDBJw9/FkkXCl6szNSTirhdsENoZRgLZQhGgH5vhOVcyaoraDuKQU9gbt4VNnGHv1pm7hzWnr1ZvUEcnTBJFFGF5Iulj2tPGbqFNzTcoEkiqpmJobmCqU+pNm017VU3Eb9WHAf9LTz5oXHQMtmlKUApSlAKUpQClKUApSlAKUpQClKUApSlAKUpQClKUApSlAKUpQGgvbsZ8vHAcbhKQgc+2TiCNmr/dsJnL9z2W0uB5bABHLLI9zZLlMYeeokCSiqYapgJBMYpREakPY65+kM6FyL6Q7WaI4o/RYxGwYvGTe3PUzze+67uSAd47xyw019x3QdPdjWU7XDhWzNnFDFmcMG3viC25fEVzP5laYzO2WWiiN3DFRoomYhQFMSiCm4RUABKZNMxDFMXrGexo4k7uzfdmXbKvPiD4eL/d2kMGB3HD5bT1o0aC4GQAQcuViAi7E3IDl8g5wJsU3aby65fVMfrG9dKUrEyFK014T875tuHKGLruvXMElNNcvQ94vZ60XzdoVrbZ418gVuVrykSKplblUFmtzDqcxQ5DGEDh1yFz5Ez+TimkJDGGa5u5I22bjfK5Aj1WDJjaNuwicSodKOO6WTBRWT7yLZcx01jcoFD87kpbCDbEubdVqa3+zpO/6prb5zr1z9ndfGeY+4H+GOKm8Lrlr79QkHcaystcERJRp0HBnKJ1Gp45k25BhXRU3JKCsTaCQpLKACg1F7syMxsjt7YmDd2vcMge4+GJuwQcQsEu7QZG9UTlTmu1EyiVqjoTbzVNC7jFLrqIUsORunSlKhRSlQniLzha/DhhW4cz3ccBawjAyqTcDaGdLiIERQL/0jqGIQPg3aj0AawqVIUqbnN2S1fodGEwuIx2Kp4ahFynNqMUt227JL1ZrVxxSkvxbcSNtcB9kOFDQ0aKU7ktwiYdhUQEDN2ZxD3z9DiHntEBDyGthci5Hxnwk4mbPZNsudIqqbCDhoxvzHku+OA8pq3SD3apxAdA6AUAEREClEQr7s9MBXPjbHT/M2X0wUyJkp8acudRUm07fm+JJoGuolKmQQDb+5HUPeqdYJxxmGOlZ/IufL1JIS88/IdjbcesKkXb7ZLeVFJvvKUx1TFOJlVhAonEQAAAChr5OEhXd67Vp1ef2Ir3U9V8urfJH33H8XwymqfC6dRSwuCsmouzr1ZP8Aizi7PS6aUmtKcIL3pI57kw1ZXElbtpXHnrGiybiMAkgNpv5QV2rd2chdSOE0jch2KYh4ROBigOoh5jVhoIItUSNm6RU00ygUhCF0AoB0AAAPIK/dK9aFOEG2lq93zdup8HXxlfEQjTlJ5I3yxu3GN3dqKbdtfi+bYpSlZnKKUpQClKUApSlAKUpQClKUBCLP4d8OY3yFKZVx5YLOGmplnyJQ0Wc7dB4AG3gdRAggkKmoftuzfoIhroIgOHwjnZnnZK4cd31j57bN124oVvdFsyA80iZFd/JXQXAoEcIKFIYSnLoPQQEAEOtn1gclNr/WsOYDEzuLbXMZgp6FXmW51GveADUgKgQxTbBHpqA+HXXQ2m0eeVP2VnT0ir3SS1v8tb/PW/VetDG/TM0MU3KpLIoVJTl5MrtrveGXS1rxtFxaScZal4dTecC/He/wnKKnTsPMKqj+2ljaAk1mihqoj8BeaXyD3z7SgHnW6Va150xRdXHPwgpPJaxZGyciw65n0I3fF2Kxk0zUMX2pT92ic5BAiodDJnKcKnvBfxFE4msDRl9yTUGdwMjnjLuihLtMxlEB2LpiXzKAjocoD1Apy69da4MBJYes8Ovcl54ej96Pwbv6PsfV+KqdTjHD4cWlb29JqhibNO84pqnVurpqpCLi2tHKm3fzotelKV65+fClKUAqpuM36llv/wBLVjfOiMq2aqbjN+pZb/8AS1Y3zojKq3BbNamcK/2Wzi1/mnjT/CTNbZ1oFbXE7AcOva58TqE3iPJd0DNWnjvlGx9j5/Ola8ppK694FomfkbuYG3fpu2n012jRcyM39pSlQopSlAK4JGSYxDFWSknREUES7lFTjoBQpJybCHYLSkm6Ii3QTE6qqg6AUoeY1ofm/iyyzxj325w9wlrC0gGDnkS99GS5iKJtOqbUoft64gPuvck16eYHrixuOpYKCvrJ7Jbv++b2Pp/DPhbG+JcRLI1CjT1qVJaQgu76vlFXb5JvQsjij7QaybBfBZUQ+eupNz4WdvQCAuJR9r5aJlH2og/CYQ1D3x8qpFJbjTzEPeExhcWxKuok5qZZSWMX3hEB0RJr8A+INfuVZNpcKtncIlnoXUfHV13DNzj0GyysJFGlJuVcGKZQTLKmECIJjsERMcxSF06hqPW9W2J7suLDzR9ZcAxse7npEzrBdLIk0MeG/wAZRIksRI6m3qAlNtAR6gPWvFeHx2Nm3Xk1pfLHT4ZtNfjH47n6VHjPhbwxhoQ4ZSjNSll9tVSldreSp+byrm3Gr0Vn5TU1jwMW1dhwUyZkK/b3W6iojIz6xUNR8wKk32AUPPprUnhOzpwcxIVOP4Y0FA1DQzxgssIiHwiqI/3+dbY2hiq82mKHuO8i5ilJqRkEV0lrkjGSES5QKoXaHIBuGiIk6iU3UwD1EREK/WHMEW9hVORCGvS7ppWUOmZ04uy6XUmcBIBgDZzziCeu4RHYAa9NfINOinwXDZot01ru3Ztfnf5nk4r9pvGfZVI08XK8XaMYOahJdVb2eVdFkv1SNZ/WE4t+Ktb/AP8A4yh/w1j5Ts+MNvFDg74W44onLobu0KKYAH3OWAAA/wAnWtocZcM2IsQXKrdtixswi+WanbqHf3XIvUxTMYphAE3LhQgDqQviAuodQAdBHXiQ4YcXNsuKZtbOLlJOquRXVAt4yIMzmEu3QWnP5Al0/c7Nuoa6a9ay/c9FxV6cd9dtv5dX209TnX7RuIwrTy4urlUbxdpJuXRr2zyx+8nJ/dNRHvZw8P5D89PBEgwOIhooyeP24gIfBsUANaxyvAxZMQABb9/5IgdPcBHXg5IBdB1DQFNwdP8AzrczJfDsyyVeba9j5hyFAqtm5EvR1tXaq0ZKgUxh3HQABIYw7hATaaiAB8AV28x4nvHJabA1m54uayVmJFwOaAbsliOxU2ac4jpBUDbNg7du0fGbUR6aa5cFwyzNUlptZK7/ACt8zso/tN41N0ozxsrSTzZ5VHGDWytabkn1UfVGkfrWshxhdLX4vchojoO30o4bvQDrqHu0wEfw9aDhvi4jx/8AwrjCSckATbU5Ow2hh+5qZM5RH/76VupfGLMkTOLWFoWblxCPuNqk2I6uyVtZs+O85ZNqhzt9U0ymUHxDt0Ao+QaVwMMTX4zxY8h5aZtKZvEU1u4Tq1og2ZgoOvKFRsRUxhAvTUAUATaeZdax/c0FKyzLS+kml6aS3+Fu5uh+0mvKkpVHRk82WzpQk7fbvKhbL/qzfdNMjW1x2sAMDPJ+O5D2vwi+gHSXi6/7NT3+nX+6v0V5x8NVNi0Jih2UShoZJ7IpaD7/ALopta3BxViK+QayBM8w9iu1+eUYtW0I121Ly9vi5pV1lB3bvLaOmlYPFeJcuubgOjnTGWPm0Z3EwpurTuGRVWM53kApRSXSIUpBLvHUDCICBQ0HURDH91zWW05q/du3rudD8eYR+1z4ehNQtqoxjmv9lJwbtzSV10NVy33xvs00zu8CWc9EDaKFZ3adIRD4Q5iYgH4Rr9J8R/EPZqoPr64RbgRRSERF5ac+3kjhoI+IqZdh/LQfhrZtLG2VT5aC3XvD3bidmGdqAFytb/cGeEQADbDC0O2AN4iBQEoKCAbh0MOldPKFpXDad9oQVscN11TkCvyCnuOCuKPHkHObQ25s4ORQSk6CJiiOoCOnlWt4DEwjmVWWjt7t/wAMl7d9u50w8W8GxFWNGpgaPmjmuqmXTpf6Q4qX3GnL7pHuGXtCsdZQeDbfqqO4coeF1FyaBm8myEPPekfQygB74hu/6w+VbPsH7OUZpyEe5IsiqXcmqmbUDB9ytO+KzhCwrddzRdpXFekWyvN6ide1nrR8RjNFFMQDc3ER1W2iIeDUddR0LqGoYPhp4t8j8MuR23DnxeOQM1kHAJW5ewICm2kD66AmqXTRBx++KPQ3vddBU6sPj8RhKvscZa2yktr9Hvb529NEeFxbwnwjxBgXxDw7mU0nKVGXvOK3lTdo50rO6UVJWekknJbzUr8ILouUSOG6pTkUKBiHKOoGAeoCA++FfuvfPyYUpSgFKUoBVTcRv1YcB/0tPPmhcdWzVTcRv1YcB/0tPPmhcdAy2aUpQClKUApSlAKUpQClKUApSlAKUpQClKUApSlAKUpQClKUApSlAerHtMOxy4uc88ZElxi24+s7PtnnBseN4fsrXJMRjGIMk3SSP6PUbOu7GOodMyg88hU9VjbimHxDaX+j1QWUMIcJDrgzzjwc3Riy8caPFFZqTloxuEdchZGQkXKKjJ2gYxXnITKVFQdR2BytBEDAASfjq7X+a4LuKyzuG9hwHZmyA3uAFzup6y7TF2m7ArFVwVGNADgDxdMyYCumIk5SW4+ptu0bG4EuOPK/Ghd99L3LwUZKxJaduIxZLafZTgjRcjNuVwci7KVsImAE0eWhocpzbuf1Aol0rJ3sYq1zY+lKViZFeocJnDE3k7qmUsA2iDq+Gbhpd6wwCAjMN3BhM4SXAS6KEVMImUKPRQw7jbh61wN+DfhMaZIcZhbcNdjp3W7erPHVxlthqD1ZwsBgVVMts3GOcDGAxhHUwGHXzqyaUBDMQcOuB+H9B62wliK37VJI8oHwQcWm3FYqQGBIhhIACJEwMYCE9yQDCBQDUaoBv9nSd/1TW3znXrbKtTW/2dJ3/VNbfOdeqRm2VKUqFFaj5YmoLi34u0bDnZhojivB7pKVvN88cFI1kLgEBBs0Oc/gEiACJjgI6bhEhg8qsbjq4onXD5jpvbNgGQc3/eCh4+z2KqhQKgpt1VfLCboRBuTVQ5zeENA3aBqIRDh34PcG31w9Y6bwmSH1z2uylF7gnRImJG15S5j9XbvmEBRQhFyGMQgjtMBU928CgNeRjKjxVf6LTs7WclffVWXpzl2svrI/QfDmEhwPhb43i3KHtM1OjJRbcbqWeotlmspU6V2k6jlNNexla10sBvJviONny+r1Uk28PHg0sWARRFFvEc1Pa7cH0MPPXV9yBxAAIn4QARHdVlV4KUChoUNK816dOlCnfLzd36/38lofEYrGYjGZPau+SKjFWSSiuSSst223vKTcndtsUpSthyilKUApSlAKUpQClKUApSlAKUpQClKUBW/Ekhn5hBRN88PjhN9IW/Jg5k7QcCkmncTISiRVsCxw1RWAB3pm3AXeUAOBgENKUyOKvBJxasuIdBsZljfLjhvGZAaiYNkLOCAg1kDbREpSKdU1DAO0BExhEREoVtnVJ554arvyxfS7ZW5iythXlCjDX5aMy5Py2pCEUO3kY4dpgRclVEoGLptP4T6gZMBrzcdhpyXtKd8yaa6J7X9GtJW5apX3+y8M8Yw1Gf0XGKMaEoTjU0tKpBtSy3WmeElnouS99KMpZLJXYAgPUBpWtXA9mS7LTuCV4Hs7zQOrwsZHW3ZtQ/S5YMphIi5KOo7lUtOUqXURAxeoiYDiGytdWGxEMVRU46cmuaa3T9DwuNcJr8E4hLDVGpLRxkvdnCSvGce0lr1WqdmmhSlK6DyhVTcZv1LLf/pasb50RlWzVTcZv1LLf/pasb50RlVbgtmtTOFf7LZxa/zTxp/hJmts61M4V/stnFr/ADTxp/hJmi2ZGbZ0pSoUV+V10WyJ3DlYqaaZRMc5zaAUA6iIiPkFFlkWyJ3DhUqaaZRMc5zaAUA6iIiPkFaQcTmcMycccRN4y4ULKlZfG0Y/TYXNcsO6I3VudwJylGPZqqaFTalEfb3PiDYA6AJRAFOPGYyGEp3tmk9ord/+FzfL1sj6Hw74exHH8XlzqlRi17SrJpRgm7LVtJyltGN05PpFSkovxZcVCnF1LyFm2hfats4St9+DS57xbCfn3S86gEdHlIAnWA2ghoQBE/UdNvnsRanCBYF14JtS0bFkLrx/AKtU1peFYokj5B02OnqLJZQNyrXxG9s5ZwMbxAYw67qnXD9hBljvCtpWHelmWqSRt1MqySEFHD3Ni58YAZvztx95SHEnOEQOfxGHTcIVY9ceF4fKUpVsS80pJX0tbnZa6JbW563vc+i454vo0qNLh3BYujRoTlleZSzvZVJeXzVJe9mekfLGCio3ePtO1oKx7XjrMtdiDWNiWSTSPbAoY3KRTIBCF1MIiOhQANRER+EayFKV66SSsj8+nOdSblJ3b1be7YpSlUxFKUoBSlKAUpSgFKUoBSlKAjWVMOYuzdbB7OyxYsdPRxh3FQkG4GFI379M/ukjh7xyCBg94apHj4xQ5vO1GMI+wGF32Y4bi2uE0AYxpuNPqUEHTdDTRwmmG7cUo80NQEupQMA7J0rmxGFpYinKLVs27stbcnfdHtcH47jeD4yjXhJtUm3GOaSSb3ccrWWWid1zSumlY064X81ZQ4RsmtODLi2lzuI18fl4zv12I7JAuuhWK5x6AsAdCiI+IenmIVuLWv8Axl8FTzijexyqV9HTjzCi0nrdlTGUZKtgOYe9tdviav0t5hIsXwn0AihTEEQqA4M4upLhgzGTga4u8lxso9bJpltHIAuyFB4gcuqLaRKI6t3W3Tac3hUDTqI+I/nUK1Th1T2Ff/DvaEm+u0X+Sb9Hyb+w4pw7C+McJ+8+GWeMUXOvRhFq9veqwVrX51IRbWueOmeNPb6lNdaV7R+ailKUAqpuI36sOA/6WnnzQuOrZqpuI36sOA/6WnnzQuOgZbNKVxunTdk2Ueu1ippIpidVQ46AQoBqIiPvAAUG5yUqA2jxTcON/XE1tGyc32xKyj0xitI9hMpKrLCBRMIFKUdR0KUR/kAay+R80Ymw+RoplLIsPb5X4nBkaXfkQBcSbd+3eIbtNxddP3wVrVak45lJW630OyXDuIQrqhKjJTeqjld2uytd7Mk9KwlhZIsLKcENz44vCOnI4FzI99i3ZVkuYXQTF3FEQ1DUOn3awEPxN8PVw3gTH0Fmi2nc4o6M2TiW8ukZwZYuu5PYA67g2jqH3Bo6tJJNyWu2u5jHA42UpxVKTcPeWV+X100+JOqUrS/DfF/nvK3EfcljyGXzRcfC5elLcawDHhxuCQbrsWjwUigpPpK9xRUOmUdyhtCpGHxF6aVtscpuhStQku12tla0TZCJwj5PCBCxXV6lkznhgAbfaK8p692ekN4CkIkEqOnMVKcDEKIAbSRZK7SeFtSJnZe1sHXTIxaEjPQNq3UdRgSOmrgimzxZdiUpnRV0i72DxIFlEyJnUbHKBvEkKizJdGzdK1Uxl2i8tczdlDvMP3BMXrcCkUnE2DEoMEFW514BCWcnM7WfCgdAhFNRUMZMQMqmkBTiO4eRDtWsYSZ1H9vYPvx7DRLCGd3lNcqPSTtwJGSdRhUV01HYKKrIO2bgixECqgUEjGKJ9SgZZi6Np6VR3FpxhuuH/wBI2hYeJp+8LlaWJJXS7Rh+6AlFR7YAIDlfvLhEVdyo6FRR3qHBJTQA0DWpmPauW7YkIgnkq3HkxNSDxkggzYjGw7ZNUbZg5ddBJzIyCabpY4ywCilqmsoPMIVMxW5lzLMXRuVStfpjtArfj5C5pOLwFf0raNoqSDWcvWPZtDNG75lGmkF25kRcA4IUpSi3FcyRUgcCCQnDXdUVY9pSf1RNmrrAV8qvrlNbre1LJBlGJvwPKJTThuus49IiiCaiEUJzENsMgAl3bzGOVJZi6Nq6VqW17USDuu2496XDl6WUecQRdwD64Y+OeFfJo3DGwsiiCTZ+IkMk4kUU95zFAxTismCoEAh83A9ptZMuo5evcBX4wiTx90OLdlXBY4xZ1SAcmbv0EUyPBUSMJimFI64JJnKQxhMQAATLMXRszStP2fapNcgzdoxOIsTOJBKRyg9s+73rafiZFCLFK2XE4RdBdo+Mi59rImJgKYRKCDlMQBTlAeSY67SW0bjt63ppfHV0ycEcbWi7syA3ZMmzCLmJxowXaIKtheHcBr6TYcwUgWTRF4QBUOBFTElhdGzlKoXhe497Y4nbigIRphm77VRvCyFrss19cgsRJLRqC7ZBwcCtnKp0TEUeNtCqgXeVYDF10MAX1QopSlAeqztse07wfCZ6sLg5juOi/sUIQl5qFzdI41t6QJNsGSsUZwxM2dg1OkdIVlEAWKkY59qoDsNsMULp7FfJHDDkEuSvW39o9m3iC7oMP6ZHMar03oHd37k9z70zbac/arzNu/8A5Olrt6a43t0c33/h8+CYG3eLqcwNbd35EdRt6ZTjo5JwzjGxY9VZJFwVQhtDLKplImYRKUvjOcRKQQrT7hl4yuK21eM1AmLe1HufO9gtc92ZYkeZ9azQ8VdrSZbrqyRElkkwFNzGpoHXMsmcUzF2a7QESmztdGN7SPd7SlKwMij8LccNr5lyVHWShjK4IeLudvMOLDuiRUama3ElGOiN3RkyJKmVQ1FQqqQKlKKqO44bRKJa6Fw9oPju0sjv4G57CnmVnR10u7YcZHVO2GOLMNo9R+s3FIFRcAmUiSqXOFPaK6Yp++Uw4HGPAzl/F83Eqw+b7eUjsdwlxMcRNnNoLHNHqSixDpqSQg8L30rVMgIFIj3fmEMYxjAYQ28F8dnTKZGuyXtC68osVcVS99yN4uLYQgjklBkXses1Wbi8FcU+7c5ws7DRAFN4lIJthR3XQmpYnDdxdM+ICfXtKZxHcVlSxrWjrmiWFxKtVDv4d6ZYiDgotllATUKZExVUTiBkxMTzA4DVWNxAO3Sd6j//AEmt/nOvVgcMHC1k3E98HyRmrLMVdUwysSMs6DUhbeUjkyR7NRZUXC5TuFhO5XOqUT7RKmUESgQvUwjr5xG8MGLeLDtl18cZbLLjGpcK7dwX0NNLsFd43E6S/bEDFNptUN7/AEHQQ6hWFRzUG4K79bfjZ/kdOEhhqldRxM3CGt2o5mtNPLmje7st1Za67G+h1U0yCoooUpShqYxh0AAqg+JztGOH7h1jl4mNmy3jdwpGFjaFrqd6cnOH+2MnuBuQBENRP4tPclN5VgHnY/8AArKs1GU3YVxvirnQO4FzkGY0UMicDkESldAUPEAagAABvIQEKk2P+zzwRg/Gx7J4dySFlyick4kmF2M3Hen6LxVBZvvUMvuK5TKmuoBUFgOkUdpgKByFMHI48QrLKnGnfnrK3e1lt8fR7H0FCXg7AVfa1PbYlL6mWFBSs9nNTquzVrpRT1azLcqzhb4R5viitmf4g+Pmxpb1XXe5I3awT1yZslGQqSpFkWqKSR96SahgEFCKCBzgAgYPEYx9w4yMjoWOQiIhgi1aNUSotmzdMCJpJlDQpClDoUoAAAAB0AAqk8SYNyHhnG8ofOV9ushOLfiJVtAurdYOmb93HuuS4cIqNwdHIs7MqgBUlC7RIHhIJAOcK7OCLy4YOKO05Z3i65JRyZCKjoK5IV5KP2clEFaHXUQQct1DlVbL7lVtyugGWAoanUKQunVh+FLB0pOn51GylNJ6t63baT1be6R5/HPFGL8Q4zNX/hxbbp0U/JTSSjlhG7SSjGK0u3a7ZdVKjrjFloOZJ1Kqkf8AOeXChNr7ZdyBe+It0W5BAoKaFT5aCeqIACZjbjmKJjmMKKxbaMK8Yv2Cb/mR0jJPmvNl3Kgc58sos43AZQQOXeqfYQ2pUg0KmBClKAZnjkipUM+gHjn1KeorlS/cPUb6l9PVG95vo7l8vTm83mc7b/6Tu5+vXfr1rIy2LbRmnr5+/TfipIyMa+c8qXcphzmKyazfaUqgAQu9Im8hQAqoalUA5TCAgSKlR1DFlotpJrLJJv8AnM7hXm0dZdyJe+LNlmxxEoqaGT5a6miIgKZTbTlKBiFMHWbYXsRozaMUUpPlsoV/FIbp12Ye7PVEVFwMIq6mPuQT2KjqdMNwEMUDmAQJXSoq7wzYz1B22cJye17ER8YvsnXZR7uyVVVQAogoAlPuWU3qBodUNpVDGApQDsL4stBxKOJlRN/z3VwozawhLuQL3xJqk1IIFBTaVPlIk1RAATMbccSicxjCBIqVHYjFtowb5lIsE34Kx7+SeNubLuVC81+uddxuKZQQOXeobYQwCVIuhUwIUAAMcGA8cltM1lAjL9wNZoWuIeqN7zfRwJimAc3m8znbRH9k7ufr1369aAmdKjspi20Jl2/evk34qSUnHSDrlS7kgc9iqkq32gVQAIXeiTeQuhFQ3FUA4GMAm2LLQav2kkim/wCayuFxNobpdyJe+LoLIKCYoqaHT5bhTREwCmU20xSgYhRACRUqJo4UsNCOaRaaUpyWMC/h2+6ediburw6J1wMYVdTqaoJ7VTCKiYbgIYoHMA/t9hyx5ErojpOSEHkXHR6+ycdE9oYrKrN9u1QNp96x95w0OqG0qgnKUoABKaVHVsWWgvLrziib/vDm4UptUQl3IE74m0TaFECczaVPlJE1RAOWJtTiUTmMYUPi20YKQZSkeR+CzB5Jum/Ol3KheY/cGcOdxTqCBy8ww7CmASpF0KmBCgAUBIqVDCYDxyS1FLKKlL9wVs0lrmD1Rveb6OKmZMABXm8wFtpzfskDc8R0ET6gA1kZPFtoy7mQdvU34nk5aOknfLl3JAFwyURUbiUCqABCbkE96ZdCKhuBQpwOYBAkVKjrXFlotHrN+iR/zGFwuZtvul3Ih3xdFdFQTAKmh09jlXaibVMg7TFKBiEEuMVxLi1g2i7ScPHqQkt6QhI1urcroFlmbkUTuQARV3qqByExBYdVEg3bTFA5tW4KKzx2acZO308zhw85GfWddbVdWYgWaYAZknNmMBlFx1ATJpOCbk1kieA4iU4lESiU0u4GuOW1uLW13MDORvqeyDb3tN2Wm6KZNRFQo7TLpFU0OKQm6aCG5MR2m/cmN5axmXb/AM8P7ZDh5cwlgtUmkZL3bPX2sR3KpR51l2Zo9m1OfYXvCwiossdM6yfhOBgKUoRjPHZY4nyzl+b4mLVyXd1t5KfyTOSh59CXMq1i3TVumgmBGo6FOiYqRBOmYRATaiGmogPFV4bPAVva0GldXlBNPNfazTtGS78tHbS32WG8TYbxBw9cP405NxaVGu1rStvGay5qlKWl7XlFrNDNeUZXDl3iu4asBSbaCzTnS1rZkHiRFWsbLzSKTlZMxxIVQqIm3mIJimDcBdNSm69B05c2cRePcBFihviOuZ2eaVUTYI2zZ8hLqGMmBRNuKyRVFP3QabtNeumug6af4rypknhQzQ2a9o3i1i2bMySadvZmh27ty2cqv3veVEXJyCYpEzKKKimU5CAgHhIQhBEauvDuXuFvNb5xhax4a+1Gji2T2o0lzHklY99GtSLFA6MkiqomChiCcwODKlcG1LuNvAADdh+KcKrOEWpKW0otqMr8rKzt6+ZPkcPFfBfibhsZ1VGNWjbNGrSvUpOPN5k1dr60Woyh9ZItidzzDQWJI7MP0Pb1etJJJBRKGjbRdLyqQKl1AFWZSc1MS/ugMACUeg6VXeeskssrcP8Abl3sLTuKFTUzBZSYMboglo52XbdMYG4UVgAwFH3h00Gs5eGVOEmKy64w5eGW2bG75u4Il6aCWuJwiso9RM3OzKmUDgBAMKKOqRdCK6iByn3mA0D42FMFWkhjzHEjeAN7oe5yteft6FXnnArul1Liag5OCYqDzEQTWXEEzAKRBAolKUUyCXo+k4OUWo2upWvm2+6+/wDdjxHwvi1OUHOlK0oZl5Gs0UruafOKSbutEuZs7WpnCwIey2cWvX/+U8af4SZrbOvX5H8IWHuLPtYOJxhlws2KcDa+PDsPQs84YDqs0kxPvFExd/7Qnpr5dfhGtdR1YwbppN93bn1s/wAi4OngquIUcXUcIa6xipu9tPK5Q3ej82i112PYFuL8IVVmceNjhe4do1Z5k/MUO2cpl1JEM3RXL5UfeArdLcfr5aiAF+EQqvFuyN4HHbYW0lYNwugOqVVXvF/zAgocpAIAiUHQF8igO0AAuvXTWsvE9mPwf2haIWxjCwHdouybxQua3JhdKYR3rkXPteHMdXqYgF6iOhBEoaAOlcyfEKjUbRhfd3crfC0b29Ue5Cn4Owzc51K9a31FCnRzdPO6lbLf/wCnKxU91RHFf2o1ovmcW/kMNYoXOCbUkjHmPNXIXcUROqnuICLbbqIFAwgcdNROXqXZ3hs4ebD4WsQxmGMcKvlIyN3mBaRdiqqqqcwmUOOvQu4wiO0gFKAiOgdR1wFh8KSGNsQzuL4fNF6TjmUhF4yPn7ymTP3McidEU0yFFPkicqZhE4CIgqImEOZoBdvnC+LeICOWnGnEjf1sXIm6fx7yMkrWjH0Wsoq2OUwCukd0smQNUkfCkJSH8YHKIGEB20OF4ehOeIdRTqbXd02r/VVrRXbR+u5hxfxdj+JYKHDKNJUMGpZ40oWaUrWzTn79SdvrSva7UVFWRbNKpbD2SrovHIgWLkDhRyDZbqPfPJlrNSMq2exKypgOkYAcNnR9RMVycSoHTApdNQKApgIckZm/g8lsmDw3tM1xZbui2LqCC2XNyrIvjkWBMypCFUOUy6miJRBQu45NDbTBqbX0JYTEqTio3sru3mSXW8bqx8qsTQcU27XdtdNelnZly0rBO7ItWSduQWO5FVVsxRXInJrFEpGyx1kOhThtHec+4waCoGhTCYCgAcxrIgDyZ5YxXXOUliyRv2ett7wVsVsA7d20Ccsoe16bBNqfbuETVzG8y9KxEbZFvxL1vIMyugVbKvVEuZILHDc7X562pTGEDBv9yAgIJh4SbS9K6hMWWgnBK22VN/3Va3U4Q4DLuBP3MhTlKAH5m4FNFDarAPMEdBEwiAaASKlYh3ZEA+O7UcFdavpJq/cbH6xfbm5kTJbdDeAuqCe4hdCn8W4DbzakLIgGyrVZIrrcylnEkhufrCHeFirFUE2pvETRdTRMdSF8IlKAkLoBl6VHzYxtM8S3hDEf93awTiIRD0s4391WBIFAE+/cZT2kmioiKhfFtMG42vPIWJbsm6WeOyu+Y4TZJqcuRWIGjRc66OgFOAAO85twh1ULoU+4oAAAZmlYg1kW+aVNMiV1zzSwSQ/s9bb3gGoNddm7bs5QB7Xps3ePbv8AFXGhj62WxwUTI81AsgUN0muPR6sC6/mf9+AbP9mHhJtL0oDN0qIGwfj88O6gRSle7vLbZwS4eqB5vFk1FYUQA/N3FV9vU3LAIKn8O85thdO67xbaD129fLpv+ZIXA1mnOyXclAXbdJBNISgCmhE9rZLciXRM47hMUwnOJgJFSo7GYttCJcsHbIj/AHxsvISbXmS7k4d4enWOuJgMoIHJq4U2Jm1ImG0CFKBCgGOPgTHKlqpWYZGX7ijZylsJgFxveb6OOQhDAKvN3ittIXRwJucA6iBwEREQJnSojddl4zNIryV1S6jRaVfRSpuZcCzcqizF0VdqUhQUKAe27QOUoACwDsUA5R21As4Zj4VeGy6YpTK15SjKafTi9wQ8UxCUkHLt0ZqdicSNmoKColy1RDlCXlFOJVNoHADhtpUK1eahTi5N7JJt/ga6lWlSi5Tkkl1di66qviF4K+GzikdsJPNGNW0m9jvC3fpLHQXFPr7UZRISmOnqOoFMIgA9Q0Gsdk+Nn7DtCDuDA2Ap2+pBdk/YN451ex4orNrIHTdLquTvDiYB5iKRS+1nWR1EhAIUxwrhmMC5Iv7h+VgGUq2sC9Zm2YyHkV0ZZ7OtY9szWVOUiQmVbGUV2LqgK/gOYxi7xUBMoVjUwVPEUUq2XJJ21adu7irysuuX0OrA8Xx3CsX7fA1J06sVdSg3F6rZSVlrta/qUsyybxSdnVfC9g5AsO6cmYST2+p672CIPZeCQ2AIouSk6qJJjuLuOBfCACU3+rDarEGb8TZ8tFK+cP37HT0YqAarsV9TJGEPcKEHQ6R/+icAN9yoZaPC1L/Q0n7Ny/nS57nmbjnhlnl0x6/oZw1XBqg2RBqRoYCtypkbpiBQ1Ax9xzgYxjCNWx3Y/wDDtYzgbtwpkfI9n3l31d4N5Mr3duHTlZYwnUByRc5k3CZjmMYSCUOo9BDQNPPWErYBSVGp7SKekXfb7snbTopK/dH1WI4xwXxLklj6P0bENLNVgrwm9nKrSW0mtZTpOzf/AMNttm1wnIBgIJw1HyDXzrFGv6xSz/qUNekSEpzNno0ZJLvG7TXby927XTrpp5V6+4Hs0+KjhQkpGZwdYeNMhek7Vc29JSzt7JRE68YuNOdqqV2CZFjAUvt5VAU1DUBAdRrL5KuKGiMhmzvevYwXY5yG4mI+RkbihxSdLIuWKhVEFUXbQpz67kyFOUAICqepFN5fCOx8S4dTlL2yqRSXOnz6eVyVu6d+xqh4K4zi1D6BWw9fM/q14Rdu8avsppvvBLlc3snsgWFaz0sbc97xEa5OmChG7+SSROYgiIAYCnMAiGoCGv3BquOJB6zSzXw/sFHaRV1srvzoomUADnKW0bi3CAeYgG4uoh5bg+GtYr+4hODi+mKGVcr9nbfs1fjCV9IhCXFYDh0sRwoidudIHC5BIZuVNwscqBgBID6KFTKoBTBzWRnzD+euJThuO0wJf9p3NbWQLjQivVeyemTSZO7ZmFnId4VEUznUVRR2gYROQqZil2lEwDIcT4VVlCnTqNya2t8rf1Ts+xpxfgrxdgMJVxeJwrjSg7N3T9XZO7j95Xj3N9aD16DSldR80fkEkw8iAH9leTEKb3RQH+WvNKA8FIUoaFKAV45ZAHUCh+Cv1TWgFUpanBLB2HkKSvqxs/5KiWsveDi5JK2Gc429GLvHC/PXKKZ2xlOUofXcUFNdBEAEKuutfr17RXGFmPrllgxPf8rZFlSy0bemToiIbKQkK4QNsd8ze5K7WTbG1Kus3brJIiRQDnDlKbRHYygcAHD+GMxxNyZn0SOLJDHwh6S9s9DvTFMsG7b+26lDQ+nT4K4luz7wa8uxxNSMtczmGUlpSYaWWrMB6JYysi3cIPX6KZSAqVZUjt2OhlDJFO5VUImU5t1STHnF/gTKJ56MtG+2C0zbzyXQe22pJNiyJyxztZou4IgKu4UDKoHAiptpRAQERLr0kUBnPE1wTsTZieQYVvckzDJyrK1XEy29JGanIB+Z3cihjGKAeZybidB0MIdaajQq2O7OrEMFHMFrbyBesbcMU6ZOIu8mcq3CSbHbRRYooAJm4oHIdmQCHIdIxTCAH0A5SmL24bs8OHC3rHnsfREfMpR9yQ0PGy4mljKKrljXjl6isKhwEwrKOHa6iqgiIqGOIjpUmurjN4VbOeto2Yz9ahnLm7W9s93ZziDg6Esvv5bVYqZjCicdh+h9um0ddKy+c+InDnDjZzm88u35GRKSUe7dMmLqRRSdSfd0TLKItU1TlFdXYXoQvUREPLWrqNCP8Q3CFYHEZJJzU5eN1W6+Nbz235J5acqRqpJRDsSGXYridM/gEyZTFUJsWTETctQm8+6IXF2bOFZiDkrehL9viCbTSZUJxGKmkTJSLX0TGxIt1kXCCqJii2iWmimwFkz8wyaifNOA2HEcUWE3TBm/ua/Iq2vSkx6MhULlmWbVSSc7EzgRAorCKhhBUng6H1HqUNQ1zbnNmGmd1Sliu8tWylNwcf3+ahlJ5uV1HtNAHvC6Qn3pJaGAd5gAvUOvWl2NCp0uzgwMx9IQkHcV4xtrSTdyC1jsLhEkUVyvGDGKuwIJBVMoLYwhsOoZHmjzuVzfbKkvrLcLfRCg8m8uV9J2+eFNHj3/ANrAYtpJNGu4u3xe1Srvd++ESD029cwlxUYBIwmJ+XyvbkZCw70rU9wyNyMU2Dk/JKqblrc4Q8GpimA+0QMQ3QQDcOSa8QuAnzSUkGWcLQWQg1ESTa6VytTEjzKl3JFXEFNEhOXqUDabg6hrS7GhApHgA4f5SLt2IdIzPJtdq9QiwLJaCBHU3Hzau8dviHvkY1EPLQgHL+61Dp3z2cnDlkHHMdjCeSnAjooLgFgdCUAqqZ5h2Lt0fUSCBhBYQMQDAJQAAKYDhqA2K/4j+HmKs2KyLKZ4sxtb88sCMHOuLoaEZyKgiIARBcVNixtQENCCI9BrGQ3FdhO6cpSGGrOu5CXn4S6UoC4WTFwlui3akWrJJiqBzlExBRSMXVIDiCmpRAOWqKc1GhCIvs7cVMZ4btkMm31JTCl5t7ocyj+WbCotIpxC8McRKRsVMiSseuLc6RCFIAEIZMEzgJh/UF2c2B7aexCMJOXUhBRy0A6fWiWZL6MmH8Kg1QjXzsgp8w66RGLLXYciagtERUIfYFWUy4i+HyStx/eMbnWznERFPTs5SUQudodszcEKJjoqqgptTUKUphEphAQABEQ6VIrVu21b7t1neFkXNHzMTIIgswlIp4Rw3cpj5HTUTESnKPwgIhTUaEBxRwk4jwy+saQsxOSBTHlhO7Pt3vT3mAEa4WYrKAp4Q3qbo5vofpoAG6eLpZ1KUKKUpQHrL7S7iSh4jiAmuD+/O2oxxjR9c8m0fxliXlgVjcDOJjBZFDuTxw5Hu+5VcouSncGIcAOUoFEolEZv2IuSsf5NY33aFq9oTYvEAxstWKWiWlm4IbWY2tBRyEgQ5kwQIBFzOSpmARL1IVAfeV66u9pJwv8AaCXRlLjOxbiTs1JPIkLxBvLXNbWSErpi25Y4kbGsidEFzc1QCrJKFDxJ7RARDXXWvYR2ceUs5X9CXHA5g7NA/Dm2g0o5OFb+qONfknAMVcqm0rFMgJcgEkvd67u8Bp7kayexitWbL0pSsTIUrqOJ6CaS7e33U00Tfu0zHaslHJSrLFL7oxCCO4wB74gHSvErcVvwa7VtNzrNmo+XBFkm6dETM4UHyIQDCG833A1GgO5Wprf7Ok7/AKprb5zr1tGS6bZUmhttO42BpEvumAPCCuHh3e413eXXy8utauN/s6Tv+qa2+c69UM2ypSlQCsTcVrmkYWXbW1IhCSsqwOgWcZtEjroKbDFSW0OUSqCmJtxSnAS9NBDQRrLUqptO6I0mtSrcLy2fsbWPPjxfXVabttbZRWa31FGMzJIsCJCdRy8bHDYzUIBR3bFDJm6iAEANBsO2Lptm9oFrdVnXCylYx8kCrKRjXRF0FyD5GIoQRKYPugNdxy2bvG52jtEiiShBKomoUDFOUQ0EBAfMBD3qpmW4SEsZWpMk4KJ2PxfOTE4lLPdkT32KeKEIcpkDsjqFI3TU36nM25R9SlNqIhoPUnQxM25vJJtWsvL3ulquuia5JJHPatQilFZopPn5u1r6Ppq16sumlVy7yvd+GMDI5H4k4RNeXYFKW4UsdRD6TRDVbYCyKIJi4FMCCVQ+pR2Bv6mAu4czh7OuJs+2MXJOI70bTEIK50TPU01EuWqTTemcipSnTOXUNSmABDXqFa5YetGDqZbxTtmW1+l9vQ2RrUpSUL2k1e3O3oS2lKah8NaDaKUpQClKa0ApSvAmAAEwiAAHmNAeaV0mFy25KvDR0XcDJy4IlzDoN3ZDnKTXTcJQHUA16a+VReU4lOHaDkXkPN57stm8jlTpSDR1dLRNVschtpyqFMoAkEpvCIDoID0GtkaVWbtGLfwMJVKcVdtImtKjNpZow/f1mu8i2JlW25u32Aqg+nYidbuWbflkA6nMWTOJCbCCBjaj4QEBHpWOxJxK8Pue3Ugywlmi2LsViQIMmnb80i7FsBxMBBPyzDtAwkNoPv7RrJ4eulJuDtHfR6evT4kVak2lmWu2u/p1JvSqvxbxU23mLIjqx7LxXkArFmmvzrsmbOcx0WZVI4E5KajoE1FTGHcICRMxNCDqYOgD+LXwxmtXOTvLWS+JCRfQ7Vw4JbNiQMWmwjW7ZQBKUXgiKir1cCiA7xORMDBuKmXyDN4aVNtVnkaV7O930Widn620MFiIzSdNZk3a6tZd9f6XPFr8UTbIOe32Fcd4pueUYQCi7e673VY90io12QupWiZ19pniojoBuSUxSAYoibqOnYsvhMxFZ+aJXiHdN5KdvOTWW7vOXHJqPDxTZTzZsSGHY0QAOmiZQMICIGMarLAADyCvNHiHC6o3gmrPV69b+vSyVrb7sqGbWr5mndabdLfruKUpXMbzgkoyPmGKsZLMUXLZcgkWbuEgORQo+YGKPQQ+4NUReHZmcJFwzal12lZT+yJhTzlLBml4lQPf6ERMCXn19xV/UrRWw2HxCXtYKVuquenw3jXF+DycsDiJ0s2+WTSfZpOzXZ3RrWrwB5NjBP6j+0By831KHLGbfNJI5BAwiHjURA2nX4denn5aQnM3CrmbHEdad7X5xoXlebVnliyw9Bycc0Sbr77jjyeMSFE47RMBw0EOpA11CtyqqbjN+pZb/wDS1Y3zojK0w4dhYTUop6felb5XsenX8XccxOHnRqyg1JNN+xo5rPT3vZ5k+6aZbNamcK/2Wzi1/mnjT/CTNbZ1qZwr/ZbOLX+aeNP8JM13LZnzDNs6UpUKKUpQCuo8gYWQeoST+IbLuGp9zZdZuUx0TeWpTCGpR/krt0pdoNJlZZQ4NuGTM19IZPyTiCNkbjbJppoToHVRdlInrsLzUjlNoG42ga6dRruZw4crZzu4jXs1kC+bfcxSThNq4su9XsQYwK7NwqA2UKVUQ2Bt3gbbqbT3Q62DSuiOLxUXFqb8ui1ei7dDS8Nh2pJwXm3039epA79wYre2LYrFzHM19W/6J7qBbigZwpJR0CKewAXcLJqc3f0MoIl1OYNRHzAeZnh6XY4aXxKnm281XizdZIl6OXjY8wkKhzHBQqnIBHcTXaXVIQApQ1AR61NqVisRVUVG+id9lv8AL8Ni+xp3vblbd7EAwjhG48QQ0nEz3EJfF8nkVCmSe3i5ZqLMdCiXaiLZsiAAOuo7gN1AP5KxmDeHC7MOXM6uGf4qck32k5Yi3JGXm8YKN0DCcpucQGzREwKABRL1MIaGN010ELSpWcsXXlnvbzb6Ll000+FjFYelHLa/l21f66/ErmH4f5eJyyfKR+IrIjxud6u49STyUaGiSgoU4AkCYNQV5ZN+pA5uoCQuoiAaDx33w3DfeS0skmz3kmIBErcCW/BXODaM1SNu3GQBMdwn8jgYwgYA00CrKpRYuupZk9bW2W3y/HcfR6Ljla0vfd7lcZ44bo3PbmMcv8xZGtUYwipSEsS9HESVzzBIOqwIj7aJdnhEfLcbTzrvXzgeFv8AxrFYxlchXuybxIIbJaEvF4wknQpJGSAV3Tc5FFtwGExwMOhjgBhDUAqc0qLFYiMYxUnaO3Yrw9Fyk3H3t+5A4jh5tCFwapgBtdN2qRKrdZE0o5u14pLAVRUyphB8ZQVwMAmECm36lKAFDQAAK7OIsD2PhO2Xlp2dJXK5bP1ea5VuG75CVX3CQCDsVeLqHSDQNdpBKXXUQDUdamdKxlicRKMouTtJ3eu76vuVUKMZJqKulZdl0K1w7wnYhwXdbu9bFVupaSfMO5uFrhvyWlyijvKfQCPnKpSjqUPEAAbTUNdBEK47U4QMGWZltznGDi571RupJ0+UcO7zlHDcqzgFAV2tVHJm5SiCp9CAmBSahtAu0ulnUrOWMxcnJupK8lZ6vVdH1XYxWFwySSgtHdaLR9V3K9ufhN4Z73ygnmq9MF2vMXWgZAzeelYdJw4RMiJRSOQygDsMQSFEpi6CGnQasESEE4HEobgDQBrzStU6tWokpybS0V3ey6LobI06cG3FJX37+opSlazMUpSgFKUoBVTcRv1YcB/0tPPmhcdWzVTcRv1YcB/0tPPmhcdAy2a/DhBN03O2W3bFCCU204lHQQ0HQQ6h/KHWv3SgIVa/D7jKzp5vcsEhOA7amMKIu7uknKeolEo6prODEN0EfdFHQevmADWUv7F1n5MI1TuxORMDMTih6PnHbL3Wmu7uyqe/3IabtdOummo1IaVsdas5qbk7rnd3NapUlHKoq3SxiLKse3sfwvqftojwrbmmU0fSbh2fcbTX2xwc59OgdNdA94KwsVgbG8LdRb0YITQPyOTLlFW6pFRHebXX2k64pCHUfDt0D3g6BUxpRVaqbak9d9d/XqX2dNpKy0202FafXDwvcZFt4cyPwZYuhrDc2RkGZuRWOyDLXE5SfwLGeduXb5NWNKzOV4ugo9cggYHBCKByuZs2m3bg0rWZ2PXzMcDOW8LWNKtpezLPYWlZd+XnfTK7YCRdvp2Xbv42UZtY5RoVkU3OEj5IFTlVUAStiEKUwjuJw4E7NviFaT1uTc/KkaxD6Xg7rWl1rhFvIQ67eAashadxBhzDOEzomRKcXhU+QcxTJiJRTU9hlKt2SyNHbF4D+ImJs3F9uS+GcPM3WJVLTZN5aPlnRnlyN4xVQHK6iwswBqQxFOem3EixhWUWAyxQHeea8enCBmjOM3eMtiizrIuUt+4WfWCuhe8ws0JAKqqLqEfo8to45xTiv7amHLMJmjbQ3mJNraUuLHr6yP2afFMqlKr4/wDUaeWljzKDWYWuI4JNEXpI8ASfMXca7ayTMx2e5RAU01Q5ZQIsHMEU5BkTs++Im8sR5L4fi2Rix2jcY389hskSz50aWcuLhF0ZFuZEjb9iAkDsG6qvMcAZBoiBEwEwcneWlLixqobgBlfXZxeXE4Gzy2bE5GJPs4MERAW7YlnGhSFTQBHlFUK5NvAAEABPxAO7wVXVs9lPfcJZuGbPUjrEBtY9l2HF3e1S5nJfu4WbQkXihC93AFinAq5kxUAomUUHcBNwmrfClLsWRobmfs6+Ka4QuK3cfPbPLC3HJX6ZJNGYCPXZJzrhoqiJ1xjHCotxBFUV2zcyHMU5QiocA1Jyq9m3xDXXzIuVlrXtoklLspR7PQ0yus+ZqjjaQtVwVMvdUwOdF6ui4TUE5eYmdQRBM5AKfe2lLiyNIGPZ75uv7Jll5CyHjzGlrMrRWs5k4ta3JRZ40km8Kq+WF2O9kiBTFM6TK2REo7CgoJlAExShsfwlYUuLAeOp2yriVjh79km656OSizmFJFlJTj2Qbp6GIXacqbkoHKACUD7gATB4htClLi1hSlKhRSlKAUpSgFRHKEtneMOyDC1g2jNlOCnpEbou51FiiIbeXywQj3fM11Pru2bdC6btR2y6lAaA5ksC+5riCulO+sIOz5XuHKOOZXHdyQcI8kWMTCMlIw0kklLi1TI3RRMjNnVTUFEyhHoF5Zu8lKbu9oG4xdnu/AsJ3gy8UvVVYK0XKZQkcN3LNGt5h39ykdGJaNWCgISZ1EjrA5UMiBCJsl9HJeUSt8aVbksaLYkshWze0DLd9h2pNTU3ceR5sL8G7cMJsjwUOEc4BtINZ3kidYDqIMW6Ze8qAqi6MXkInSV2d+9neZW/b5QaeL4S23cWrwzNy3ktOyS6C7aP9UTod7MqSRyrL83lhsUFMu0TDu1AAHdqtTW/2dJ3/VNbfOdelxaxtlSlKhRSlKAUpSgFYu77LtS/rUkbGvKBbyMRLtFG0nHuSbknKJwEp0zh75TAIgIe+A1lKVU3FprdEaUlZkCwjwzYW4cY6RiMLWkpBtZQyZnLYko5XTKJAMBOWRdQ5UgDePQgFAffAdArH4V4aD4VuV5cCfEHk26kXbPu5Im9boCQbN/EUQUT3JAcD+EQ1E46gY2oCOghZtK3yxeJnnzSbzb31bt3epqWHoRy5Y2y7W0t8it4bA15RGW1sln4ocgO4xZ+s5GyXhow0UUFCCUESiDIHJUyCIGKAL67ihqIhqA9fI/DjcmQcmIZCZcUWSrcaIppFNa9uSLFKOVEgiO4wKtFFdTa+LRQNdOmlWhSqsXWU86te1vdjt8t++/cjw1Jxy62vfd/r+GxXmdeHdlngY8H+YshWsRgRQOXYt3LRXeBOJB1VMiG44l2aF6gAAY3nrXav7h7sPKGNIzFV7ylzuY2MBHY5Z3jIMXrgUkTJAZd01XTWXExTCJwOYQOYdxgEQAQnNKxWKxEYxUZNZdVbSzK8PRk5NxTzb9yBwnDXh+DwoPDynAPHlpmIoRSPlpx48VUKdYVxAzhdUy5vbBEQ1P0DQA0AACv3hfhqwZw829JWnhnHLGBjpd0LmSatTKGK4VEgEE5t5jCIiUACpzSjxWJlGUXN2k7tXer6vq+5VQoRkpKKulZaLRdF2INifhk4dMDvF5HCmC7StNy6bFbu3VvW+3aKuEijqBFDpEAxw1DXxCPXr51yqcN/DwrMv7jUwNZhpCVXOtKPzWu0FZ4oYwnMdU/L3KGEwiYRMIiIjr51NKVHicRKbm5u73d3dhUKCioqKsuyMVb1i2VaUMrblqWhFxkescxlmMfHpoonMYAAwiQhQKIiAAA9OoBXYh7ct+3UTN7fg2bFM5txyM2xUimNoAaiBQDUdAD8Fd2la3KUm23uZqMVshSlKxMhSlKAUpSgFKUoBVTcZv1LLf/AKWrG+dEZVs1U3Gb9Sy3/wClqxvnRGVVuC2a9ebSY45IrtdOJgODewcWzaSlp489Uo5IuiRjTIaNZTkd2BmzcczUBW379mm0mm7UdPYZWpnCv9ls4tf5p40/wkzREZtnSlKhRSlKAUpSgFKUoBSlKAUpSgFKUoBSlKAUpSgFKUoBSlKAUpSgFKUoBSlKAVU3Eb9WHAf9LTz5oXHVs1U3Eb9WHAf9LTz5oXHQMtmlK4JSQRio5eTcEMYjdEyhykDqIFDUdNaNpK5UnJ2W5z0qG/RxtP8A9QkP+6J/x0+jjaf/AKhIf90T/jrT9JofaO/91cR/4TJlSob9HG0//UJD/uif8dPo42n/AOoSH/dE/wCOn0mh9ofuriP/AAmTKlcTN0R6zSepFECqplOUDeeghr1rSm0XDfIlhX7xcZm4ub6sq4bXzHNQrVGMuV56KgWzCdOwYxx4RI/dnpnbcjc5hVRUXVF+Bkjl1S27lqee7p2N26VovlHtOM/40xK54gfUJZkjB3CxvP1FW4mLpKQjXMEV2cgyK3MMRVNYGahVQTSSFsqqklqtuEwZqV4nuMgeKyx+HuduiyWSsdmNrGXW5g4JyCEzEu7TlJVNuUizg50VElGahRUA3thyIKbSF5iJrZkujc6levef7Uziot/hkh+IF3adhrv3WKlMjSFrQlvS79RCI5RBQQXc81JBjzTJPB70oY+ggCZGy3KOqaQcR3HzxLW6bKtswQ25aiLW3LqRx1KObfePBdPIyKXec9GSQVVYrOA7u53x65GyqPIMYRX5ZyGWYujeilUPkfOObrNsnDdhW87tlS+snSCUWvccxGrmimSyUO6kXC/dU1yKLGODQ5E0AXIOqgmE+iYgar+DnPmc+JXjNf3Re1ws2MDA4vOzPbEO6edyUlUrlmIp0/S1WBJdNU0QJ0jqpGORFQhSmKIqmUlhc3IpWiF18e/ElabzKjXFtu2odljiFve7pRW7HMg9WfoxEw6bgwQ2rF7vzk0R2qanIgIABUVCjoVKcdnFXaWX72x7GDFzilw5mLCWJpZjx+FvxidnxsyqQ7ZquRR8oYXJQAoKJaGO5VE+wpES2wuje+laHSnaicSZLRk76Z4athu2gbLtFxJxih3bp0vNT84+hESJckdAaJLtSODagKpkhFPaU47iZOY7QPi3Z2gtFN8XRAT8Ndciwm5YtlyDgxmDeNYvSOgt9J4MkiUxn6aCpimcChtIry1COEgpZi6N3qVrjwHZ5y3nWUzDeV63nB3Bb7O9I0LEb220OUiEe5tiGkwTIssJBXIYXwGKc5EzCc6hhAhTETSk/DpxTX5m/Jt8WFc/DDednNbVnCMm8tOqxhkjgMZHPOWqDZ6sYFhM9OIbCmT5ZC6nA4mIEFy56VoRdd4ZQs3O8nnW8b4viWtUM5M4WPvqwcnHcRMO2NKt4wYGStlwoigX28x2qjhBNy4AywOQMGgFLx8EsZna/wCOXzNe0PlF6gS6bx23g6zw9PGbGsnJoNy+hefy9hQRSRAmzQNoH06VbC5v3SvUhbHGZxQynA7iDCq+criNkSBnbauS/rsGROD6Vtl4vCrNCKK+6HnGuJm2MYf270Y9L10PtUsMyPbfSlKhRSlRHKGfsG4ROyTzJmK2LUNJAoMcW4pxBmLkE9u/l805d+3eTXTXTcGvmFAS6lah33xr5Wd33dGUcS3paz/G9i5Csy1V4tGOF0rcRJw0WKz9F6RYCpgkSYbCiUpDFOZssBhEFCinm+OTiJ4icJ5CZP7KRlobHMHaTibvu8mePCTiLIhFwAwqbnzYxCJIJrKnKgVwttOUwJ6FEatiXNoa1Nb/AGdJ3/VNbfOdevNicW+dJ/MFtXe9mYBewbzzbcWOY+2UIc5XjEsY3lOXJC75w80yriHW3J8spQRdJiA7khFSIZRz5hTA/bkpPcz5TgrXRluFMiMYrOSSbYrpRK4HThQpBOIbhKikooIB5FIYfIKWFzeClYOTyVj+GeO46WvKObrsXjBq8RWdlKZFd6sVBmmYBHoZZU5CED90YwAGojRLJePl5FCIRvKOM6czasO3bg6LvUkE26jlRqAa9VSoJKqiTzAiZh8gqFM5So61y5jB8k2XZ37FKkeRr2QamI9IIKtGaiaTpcvXqRJRZIpzeRRUKA+YV4Xy/i1s0cvnGQIkiLOJZyjpUz0gFSZOzqkauDDr0TVOiqUhvIwpmAPIaAkdKwa2S8ft3ziMXvKOI4aTaMO5RM6LuSkFUEnCTUwa9FTIrIqATzEqhR8hCkdkvH8w6ZsYu8o5wtIPnzJkki7KYy7hkqdJ2kUAHqdFRNQhwDqUxDAPlQGcpUV+jhh71OerD6JcL6K9S3ql9IekCcn0Ps39/wB2unI2+Lme506613pLJWP4d27Yyt5RzdZg+Ys3qSzspTIOHqpEWiRgEeh1lFEyEAepjHKAa60BnKVg0cl4+cP28WheUcdy6m1odsgV0XcrIJIKuFGpQ16qlRRVUEnmBUzD5ANcDfL2LnTZs8bX/EnSeRT2TaqFekEFWbQ6SbpwUdeqaR1kinN5FFQoD5hQEjpUdc5dxezRcuHd/RSabOMZSLo53pABJo8UUSarm69CKnRVKQ3kYUzAHkNcy2S8fISC8SteUcVy2m0odwgZ0XenIKt03KbUQ16KmRWSUAnmJVCj5CFAZylYOMyVj+ZeNI+JvKOcLv3j9oySRdlMZddksZF4mUAHqZFUhyHDzKYogPlXRDOGHhtwbwDJcL6KLawXKaQ9IE5IQ4kE4P8AdrpyNoCbme50DXWgJVSsJI5Kx/EOXjOTvKObqx8gxYvk1XZSig5eqJpNETAI9DrKKpFIUephUKAedeEMl4+cvW0c3vKOOu8m14dqiV2UTKyCKKq6rUoa9VSJILHMTzAqRh94aAzlKjaWYcVrsm0kjkGIM3eQ7yWaLFfEEqzFoZIjlyUdeqaRl0QObyKKhdfMK/bvLWMmBXB3t+RSQNI9i+dCo9IHKbPVVEWixuvQiyiSpCG8jGTMAeQ0BIaVg1cl4+RkloZW8o4rtvNpw67cXRd6cgo2I6I1ENeipkFU1QJ5iQ5TeQ0i8l4/mnrWNiLyjnLh86ftmaKLspjLLMVjIPEygA9TIqlMmoH7kwCA6DQGcpUVLnDDx7cPeBclwoxSdrFuU8gEgTklhzEMcr8Ta6cgSlMYFPc6FEda70hkrH8Uu9ayV5RyCkdJMY98RV2UBQdPDpJtEThr4TqnXRKQo9TCoUA8woDOUrBoZLx86dtWLa8o46z6bXh2aRXZRMtIIJLLLNShr1VIm3XOYnmBUjiPuRrrEzJilSNazBMhxAtXsI7mWjgHxNi0e1FIrl0UdeqSQrogc/kXml18woCS0qPvsr40jTOCyF9RaItGbB26BR4QOUg9WUQaKm1HoVZVJQhB8jGIYA1EK5FMl4+SlFIRS8o4HiM2SGVbC6LvJIHakdlaiGvRUW5yKgTz2GA3kNAZylYOMyZj2aetY6JvONcrvVpBFoii7KYyyjFcUHhSgA9RRWAU1A/cmDQdBrpFzfh89vKXaXJUKMYjbCdxqvwkCcokQoUxyPhNroCBikOIKe5ECj16UBKaqbjN+pZb/wDS1Y3zojKnr7JeP4xd41kbyjkVI+UZxr4ijsoCg7dmSK1QOGvhUVMuiBCj1MKpdPMKqbjEyXj57ja1GTS8o5RZ9nOz4hmmR2URWft7lYnXbFDXqqmRuuYxPMASOI+5GqtwXrWpnCv9ls4tf5p40/wkzW2daB2vxicKvCn2ufE624leIW0bFUuC08d+gyXTOosxf8lpKgryuYYN+zmpa6eXML8NFzIzfylYw152mR4pHHuJmC6UkSPURFcNxXZkSrlQEP34pHKoBfPaYB8hoxvK1JJ0gyj7hZrKuVnSTdNNcBFQ7ZUUnBQD3xTUASGD9yIaDUKZOlYMMl4+NDmuAt5RosSQhZg7sHZeWWPMUxiuhNrpyhKUw7/LQBrtOrytRio5ReXCzSMzetmbop1ygKS7gyZUEjfAZQyqYFDzETl086AyVKxiV5Wousg2RuJmZR1JKx7chVw1UdpEUOogX4TlKiqYS+YAmb4BrhDIliCxQkwu6P7u5i15Jut3ou1Rmjy+cuA69Uyc1PcbyDeX4aAzNKxTq+bOYqKpPLmZJGQQarLFO4KAkTcqmSbnH4AUUIchR/dCUQDyr9GvK1CPzxZriZg5JJFjzoc8NxXZkAcAgIfvxRMVTb57RAfKgMnSsYwvK1JR2iwjrhZrrOFHZEEklwEyhmqvJcAAe+KangN+9N0GusXJePlIdS4CXlGixShCTCrsHZeWSPOU5iuhNroCQlIcQP5aFH4KAzlKxrm8rUZnckd3EzTMyft2TsDrlDkuXApAgkb4DnFZICh5jzC6eYV4RvK1HCjdFC4mZzO5JaPalKuAiq7RKqZVAvwnICCwiXzAEjfANAZOlYU2R7CLGoTJrwjgaOYhaVbuBdF2KMUQTFVwA69UyAqnqbyDeX4a5nt7WjHOFWj+5GaKqCbQ6yai4AJCuljIthEPeBRUhiF/fGKIB5UBlKVjBvK1CyIxA3Ez70WSCPM354bwdi3ByCGn7/kCCu3z2Dr5V+Eb8stc4Jo3QxMYxXpgArgo6g0VBF0P/wC0oIEP+9MOg0BlqVGTZnxOWLcTZsiw4M2kE1mnTkXxNiUc5FUG7sw66AkoKKu0/kblm08hrtOcl4/ZuXbJ1eUcmqxmm8Q8TO7KBkX7hNFRBsYNeipyOEDFIPUQVIIe6CgM5SsGwyXj6UcM2sdeUcupISb2OYkSdFEV3bQypHSBOviUSMgsByh1KKRtfIa6Rs34fJbid3HyVChFrWue5EpAZAnKNEEIU53wG10FACnIIqe5ADB160BKaVg5PJmPoV45jpa841suycR6DtFZ2UpkVXy4N2ZDAI9BWWEE0w/dGHQNRoTJePlJRKEJeUcLxebUh0WwOi7zyBGp3Z2oBrqKoN0zqiTzAhBN5BQGcpUfY5XxpJGblj77i1hdsXz1sCb0g81uyWTRdql69SIqqpEOPkUyhQHzCuI+ZMUpx7mWUyHEFbM4VpMO1xfE2IsHRlStnRh16JKigsBD+RhSNp5DQElpWDXyXj9s6dMXF5RxFmU4hDO0jOygZGQWSRWRamDXoqdNwgcpPMSqkH3wpH5Lx9LOGbSMvKOXVkJF8wYkSdFEV3TNRVN2iTr4jonRVKcodSimYB8hoDOUqKmzhh4ltkvA2S4UIpS1jXKSQGQJyTQ5SAcX4G105AFMU3M9zoIDrXek8l4+hnjqOlryjmy7F2wavEVnZSmRWfLFQZpmAR6GWVMUhA/dGMABqNAZyqm4jfqw4D/paefNC46nqeS8fKySMOleUcZ04m1YdBuDsu9SQTbqOlGoBr1VKgkoqJPMCEMbyCqmzjkrH9y5t4dI637yjni8pk6YdRqLZ2U5nKDW1p5ByoQAHxFSVWSIcQ9yZQoD1EKBl61HcuDcpcXXEazE2R5cIR0MYSSMcrczjlG5YKiQBMBN2molAR010qRVwSkejLRy8Y4OYpHCJkzmIPUAMGg6a1jNOUGkbsPUVHEQqNXSafyZor33tDv4PYe+U5T/ACqd97Q7+D2HvlOU/wAqtvfoG2r/AM5SH/eE/wCCn0DbV/5ykP8AvCf8FfPfunEfbl81+h+q/wC3vC//AGlL+SX/AHmoXfe0O/g9h75TlP8AKp33tDf4PYe+U5T/ACq29+gbav8AzlIf94T/AIKfQNtX/nKQ/wC8J/wU/dOI+3L5r9B/t7wv/wBpS/kl/wB5n7GNLmsuIGfI3K/9Ft++laGMKQK8su/YJtBEu7XTXrpprWvb++ey/u3il9PPbPs6VytHXISJNPBYSrh4hKomBAhDPAbCUFkhHlgoJ9Uw6bihWyjJqmxZpM0jCJUUykKJvMQANK0j4eLIzrijiHu9K5bc4gW0dMZumpZk1gErePazhg7fidJwqKv7NBMxDAdQCmAwaDtD3q+iirRsfk1WWeo5JbssK0MldlHkDIc8pbUPjhzcV6NJFrNOHNnFSVuVIm475AqizcoPxHkGOqmQVBPyRMYDbNQzdi587O/iay6FrWilbly3khNtZM/erJXBy2kWbUx2zg6y7YvKXSbqGFM5jAcCKaEHQ+g0hh7F3EJd2B8ScKUtwyXXbr2y8rsrkn72nVI9OPYtGE4rJfsYybo66yrlMCtgKVIAAjlUTiUA0Nsfw844va0OI/Pt53JAKNYy7b3h3tuuznIJXqCNuRbRQ5QAREAKugqTxAA6kEQ6aCOWhgrmcurg74Tb5joiHvPhpsSUZwEQMVCM39qNFUWLAQAO6pEMmJSI9A0TANoCACAANckdwj8LELdD6+Yzh1slvLyUcoxkZIltNgWctlESoqJKG2amKdIpUzAPuiFKU2oAAVrTljhz4r5fJmTrChzXiNgx8Zcl1WLJ25dCTaQeTEzGlaEjmx1lABM7VY8y5JzdqJDPWO0wckRJIuELCOapLhYy3hW5bdc2ancZnzGzphVg5jVDFcRSSBnYRyr98LHYvv1BNUpFTkOsVInM3HC5MbdzH2bnENHRPCXDL2VcMMUO72rbTm3R9EPO4lHwRiiqINXQoFIYf2Kc4plIYegFEQ5cLcVvZ2OHbVtg+7bSj10rTFGHTjLeOxM6hmBVV+QyAUCC6QQKdZQEkN4FA5zAXqIjVsVB5vzFj/BnDKfhFuSw3+NLrtqSum4ZAzEIeIQhQKJyRy6S5zuwdAn3ZMCJl0QcqCtyhAUxwHDli7iEu3BHDXw1XHwy3XabvE8/ETF23dcakem0alj2zghkWfJdKLLquDKAj0TKQEVFhOYPCQ7Ql3cvDEea+zv4g72nsd4pj7XmpqWaP2F0sgsdVIXKLn9lPGzsyzYpTAtz+cokoPtnO3CBt2o2Hd/ChwxX+SULevD5ZsoM26ZuZc723Gyhni7REUGqqhhJqY6SIikQ4jqQgiUBAvSo3wuY4vaxcr57n7sgFWTO7MupS1vLqHIIPWYW1BtBWLtERAOe1cJ6G0HVMR00EBG5KFWxEA4fsEFtx9Z5cL2oETJwDaCkYsLfbA3dRbcFQbsVE9m07dIFlgIkICQnNPtANw6x9/wU8IMpYjHGElwx2K4t6MfLPWEOta7UzdByqAgssUgk0A6gCIHN5nARA2odKs+lQpHrdxHiu0JKYmLUxtBRju4UW6U84j4lFE8iRugDdAq4kKHNBNEASIBtdpAAoaAABWAxjwocL2FLjPeGHeHSx7UllGxmx5O3bVaMnBkTCUTJioimUwlESlES66CJQ+CrApQFeveErhekssBneQ4e7NWvMrxN2Fzq263M97ymQCJuOaJNwrFIAFKrrvAoAACABpWMhOBbgotq/PopW7wiYyYXN35Z76oWdisEn3eVRMKq3PKkB+YcTnExtdTCY2ojqNWrSgIWlw4cPaCXIRwZaBCeiI2K2FttqAdwjlRWj2umz9pbKiKiKfuUjDuIBR60qaUoBSlKAUpSgKxvHg/wNfmXkM23Hbb9SZSdx7xw3Qn3iMe+dMDidi5dMk1QbuVm5hAyaiiZjFEiQ66pJbMXf/Ajw7ZOOHqyjbmcpLRisZLIBfkuUk1HqOVnIsn4A5/ZrcFF19qS28pCLKJFAEjmTG4qUBWEHweYEtzM5s7xNsvk5sJJzJN2p594eNaSDhv3Zw+QYGVFsg5UREyZ1iJgcQUV66qqiemkkyKduk73kAdOE1vpqH/tMvW2lamt/s6Tv+qa2+c69UhtiJSj5lDr59KbCAOoFDz18q80qFPGwn7wPwU2E8tgfgrzSgPGwuuu0PPXyoBSh5FDp5dK80oDxy09NNgaaaaae9QSlHzKHXz6V5pQHjYXXXaHnr5U2E8tgdPLpXmlAeNhP3gfgpsII6iUPPXyrzSgPAFKHkUOnl0py09NNgaaaeXvV5pQHgSlHzKHXz6UAhA6gUPPXyrzSgPGwmmmwOn3KbCfvA/BXmlAeNhBHUSh56+VAKUPIodPLpXmlAeOWnppsDTTTy96glKPmUOvn0rzSgPAEIHkUOg/BTYTTTYHQNPKvNKA8bCfvQ/BTYTXXaGuvwV5pQHgClDqBQ6eXSnLJppsDTTTy96vNKA8bS9fCHXz6VU3GaQgYst/QofVasf3v/aiMq2qqbjN+pZb/wDS1Y3zojKq3BbNalcLaSSna28WvMTKbS08aabg1/8ARJmtta1M4V/stnFr/NPGn+EmaLZkZtltL+9D8FAKAeQBXmlQp42E002h5aeVNoD5gFeaUB42l112h+Cm0vltDy08q80oDxtL+9D8FNpfPQK80oDwBSh5AFNhdNNoeWnlXmlAeNpfgDr502l89ArzSgPG0vltDy08qbS/vQ/BXmlAeNofAFNpf3ofgrzSgPGwn7wPLTyptL+9DqOo9K80oDwBCh5FD8FOWTTTYGmmmmnvV5pQHjYUfMofgpsJrrtDz18q80oDxtKH7kPwU2E/eB+CvNKA8bSj+5Dz18qAQoeRQ/BXmlAeNhNNNgaaaaae9TaX96H4K80oDxsJrrtDz18qqbiMKUMw4C0KHTLL3Tp/7IXHVtVU3Eb9WHAf9LTz5oXHQMtmlKUApSlAKUpQClKUApSlAKUpQClKUApSlAKUpQClKUApSlAKUpQClKUApSlAKUpQCtTW/wBnSd/1TW3znXrbKvRb/pQvGdxOcCPHljXK3CZll5ZlwXBiNaJmJFk0brmcs05RRYiQlcJqFAAUMJtSgAj746BpVSvoRuyPelSvkV+mH+2a+PPPfIEV+aU+mH+2a+PPPfIEV+aVlkZjnR9dVK+RX6Yf7Zr48898gRX5pT6Yf7Zr48898gRX5pTIxnR9covWZXhY4XaQODJCoVAVA3iQBABMBfPQBEA18tRCuWvjzcduT2rLrKzTN7jjDmTXUxt5xBtJgYWN3px666DhZAC922CBlWyBtRLuDlhoIAIgMi+mH+2a+PPPfIEV+aU9mxnR9dVK+RX6Yf7Zr48898gRX5pT6Yf7Zr48898gRX5pTIxnR9dVcSj1mk6TYqu0irrFMZFEygAc4F03CAeYgGoa6eWofDXyNfTD/bNfHnnvkCK/NKj0525XatXJkeAy5N8Ycy4uO1mL9nAShoWNA7NB7yO9EAoNgKYFO7IaiYBEOWGmmo6sjGdH2F0r5Ffph/tmvjzz3yBFfmlPph/tmvjzz3yBFfmlMjGdH11Ur5Ffph/tmvjzz3yBFfmlPph/tmvjzz3yBFfmlMjGdH1yrPWbddJqu7SIq4EQQTOoAGUEA1ECgPUdAAR6e9XLXx6XR25Xas3petsZFufjDmXc1Zrp05tl+eFjSmYquGx2yxigVsBTbkVDkHcAgAG1DQetSH6Yf7Zr48898gRX5pTIxnR9dVK+RX6Yf7Zr48898gRX5pT6Yf7Zr48898gRX5pTIxnR9dVcTh6zaHSTdu0kjLq8tAqigFFQ+gm2l18x0KI6B10Afgr5Gvph/tmvjzz3yBFfmlR2+u3J7VnJcpbU1fHGHMyDqz7gCcttVSFjSixkAbOGoLlArYAMPIdOCaG1LooI6agAgyMZ0fYZSvkV+mH+2a+PPPfIEV+aU+mH+2a+PPPfIEV+aUyMZ0fXVSvkV+mH+2a+PPPfIEV+aU+mH+2a+PPPfIEV+aUyMZ0fXK5es2QEF47SSBVUqaYqqAXecfIoa+Yj7we/XLXx55D7cntWcrow7fIPGHMyRIC4Gk5EFVhY0vdpBqfeguGxsGokN1AB1KPvgNSL6Yf7Zr48898gRX5pTIxnR9dVK+RX6Yf7Zr48898gRX5pT6Yf7Zr48898gRX5pTIxnR9dVVJxpKpIYpgFFlCkKGWrG1MYdA//AIojK+XD6Yf7Zr48898gRX5pVgcIvbAdpHxk8YOHuHTiX4pZa6rLnsuWweXgnUUwRI5M3l2rpEROggRQNqyKR+hg1Emg6gIgLI0M6PqqrUzhX+y2cWv808af4SZrbOvny/0iTj34vOz47UuakODnNj+yFr7x7ArXYZkzbOPSB2hniTcRBykoBNhFDgGzbruER1HrUir6GUnZH0G0r5Ffph/tmvjzz3yBFfmlPph/tmvjzz3yBFfmlXIzHOj66qV8iv0w/wBs18eee+QIr80p9MP9s18eee+QIr80pkYzo+uqlfHay7bntTI7MchxAMuLyYTvCVt5rBSE2ENHCdaPbrLLooCUW2wAKo4WMAgUDDvHURAAAJR9MP8AbNfHnnvkCK/NKZGM6PrqpXyK/TD/AGzXx5575AivzSn0w/2zXx5575AivzSmRjOj66qV8iv0w/2zXx5575AivzSo8HbldqyGVhzeHGHM+qobfCDGY9Cxu/0eC4uORt7ts05oibXbu+7p0pkYzo+wulfIr9MP9s18eee+QIr80p9MP9s18eee+QIr80pkYzo+uqlfIr9MP9s18eee+QIr80p9MP8AbNfHnnvkCK/NKZGM6PrqpXx6Pu3K7VqSylGZsfcYcypdMNBPIWNlxhY0DoMXazZZwgBQbbBA6jNsYREomDlBoIAIgMh+mH+2a+PPPfIEV+aUyMZ0fXVSvkV+mH+2a+PPPfIEV+aU+mH+2a+PPPfIEV+aUyMZ0fXVSvkV+mH+2a+PPPfIEV+aVHrg7crtWrpyDbuVJ/jDmXNwWmk9St6SNCxoGZkdkIRyBSg2Apt5UyAO4B029NKZGM6PsLpXyK/TD/bNfHnnvkCK/NKfTD/bNfHnnvkCK/NKZGM6PrqpXyK/TD/bNfHnnvkCK/NKfTD/AGzXx5575AivzSmRjOj66qV8el2duV2rN83da1+XXxhzLyXsqScSFrvTwsaUzByuzXZKqFArYAMJm7ldPQwCGigiAAIAISH6Yf7Zr48898gRX5pTIxnR9dVK+RX6Yf7Zr48898gRX5pT6Yf7Zr48898gRX5pTIxnR9dVVLxG/VhwH/S08+aFx18t/wBMP9s18eee+QIr80rYfsi+1N4/OO7tSsEYY4s+JCTvK2Gd6OJltEvI1kgQj5vFP+StubopnES7z9BHaO7qA0yNDOmfTHSlKwMxSlKAUpSgFKUoBSlKAUpSgFKUoBSlKAUpSgFKUoBSlKAUpSgP/9k=)
but fMRI underpowered

“Assuming a realistic range of prior probabilities for null hypotheses, false report probability is likely to exceed 50% for the whole literature.”
- Solutions
- Make data, materials (analysis code) more widely and openly available
- OpenNeuro.org, Human Connectome Project, Databrary.org, etc.
- Reuse shared data (e.g., Adolescent Brain & Cognitive Development (ABCD) Study)
- Increases sample size, improves detection of small effects
Functional Near-infrared Spectroscopy (fNIRS)
- Near infrared light penetrates scalp and skull, refracted by brain tissue
- Returned signal altered by blood \(O_2\) levels
- Time course (temporal resolution) ~ BOLD fMRI
- Spatial resolution low
- More suitable for pediatric populations (less susceptible to movement artefact)


Source: https://nirx.net
Electroencephalography (EEG)
- How does it work?
- Electrodes on scalp or brain surface
What does EEG measure?
- Voltage differences between source and reference electrode
- Combined activity of huge # of neurons
- Current/voltage gradients between apical (near surface) dendrites and basal (deeper) dendrites and cell body/soma


Evaluating EEG
- High temporal, poor spatial resolution
- Analyze activity in different ‘bands’ of frequencies
- LOW: deep sleep (delta or \(\delta\) band)
- MIDDLE: Quiet, alert state (alpha \(\alpha\) band)
- HIGHER: Sensorimotor activity reflecting observed actions? (mu or \(\mu\) band), (Hobson & Bishop, 2017)
- HIGHER STILL: “Binding” information across senses or plasticity? (gamma or \(\gamma\) band), (Amo et al., 2017)

Event-related potentials (ERPs)
- EEGs time-locked to some event
- …Averaged over many such events (trials)


Magneto-encephalography (MEG)
- Like EEG, but measuring magnetic fields
- Electrical and magnetic fields orthogonal
- High temporal resolution
- Magnetic fields propagate w/o distortion
- But are orthogonal to electric field
- Requires shielded chamber (to keep out strong magnetic fields)
- ++ cost vs. EEG

![[[@Hill2019-ik]](https://doi.org/10.1038/s41467-019-12486-x)](data:image/png;base64,iVBORw0KGgoAAAANSUhEUgAAB2AAAAkSCAIAAACXsxz1AAAKMGlDQ1BJQ0MgUHJvZmlsZQAAeJydlndUVNcWh8+9d3qhzTAUKUPvvQ0gvTep0kRhmBlgKAMOMzSxIaICEUVEBBVBgiIGjIYisSKKhYBgwR6QIKDEYBRRUXkzslZ05eW9l5ffH2d9a5+99z1n733WugCQvP25vHRYCoA0noAf4uVKj4yKpmP7AQzwAAPMAGCyMjMCQj3DgEg+Hm70TJET+CIIgDd3xCsAN428g+h08P9JmpXBF4jSBInYgs3JZIm4UMSp2YIMsX1GxNT4FDHDKDHzRQcUsbyYExfZ8LPPIjuLmZ3GY4tYfOYMdhpbzD0i3pol5IgY8RdxURaXky3iWyLWTBWmcUX8VhybxmFmAoAiie0CDitJxKYiJvHDQtxEvBQAHCnxK47/igWcHIH4Um7pGbl8bmKSgK7L0qOb2doy6N6c7FSOQGAUxGSlMPlsult6WgaTlwvA4p0/S0ZcW7qoyNZmttbWRubGZl8V6r9u/k2Je7tIr4I/9wyi9X2x/ZVfej0AjFlRbXZ8scXvBaBjMwDy97/YNA8CICnqW/vAV/ehieclSSDIsDMxyc7ONuZyWMbigv6h/+nwN/TV94zF6f4oD92dk8AUpgro4rqx0lPThXx6ZgaTxaEb/XmI/3HgX5/DMISTwOFzeKKIcNGUcXmJonbz2FwBN51H5/L+UxP/YdiftDjXIlEaPgFqrDGQGqAC5Nc+gKIQARJzQLQD/dE3f3w4EL+8CNWJxbn/LOjfs8Jl4iWTm/g5zi0kjM4S8rMW98TPEqABAUgCKlAAKkAD6AIjYA5sgD1wBh7AFwSCMBAFVgEWSAJpgA+yQT7YCIpACdgBdoNqUAsaQBNoASdABzgNLoDL4Dq4AW6DB2AEjIPnYAa8AfMQBGEhMkSBFCBVSAsygMwhBuQIeUD+UAgUBcVBiRAPEkL50CaoBCqHqqE6qAn6HjoFXYCuQoPQPWgUmoJ+h97DCEyCqbAyrA2bwAzYBfaDw+CVcCK8Gs6DC+HtcBVcDx+D2+EL8HX4NjwCP4dnEYAQERqihhghDMQNCUSikQSEj6xDipFKpB5pQbqQXuQmMoJMI+9QGBQFRUcZoexR3qjlKBZqNWodqhRVjTqCakf1oG6iRlEzqE9oMloJbYC2Q/ugI9GJ6Gx0EboS3YhuQ19C30aPo99gMBgaRgdjg/HGRGGSMWswpZj9mFbMecwgZgwzi8ViFbAGWAdsIJaJFWCLsHuxx7DnsEPYcexbHBGnijPHeeKicTxcAa4SdxR3FjeEm8DN46XwWng7fCCejc/Fl+Eb8F34Afw4fp4gTdAhOBDCCMmEjYQqQgvhEuEh4RWRSFQn2hKDiVziBmIV8TjxCnGU+I4kQ9InuZFiSELSdtJh0nnSPdIrMpmsTXYmR5MF5O3kJvJF8mPyWwmKhLGEjwRbYr1EjUS7xJDEC0m8pJaki+QqyTzJSsmTkgOS01J4KW0pNymm1DqpGqlTUsNSs9IUaTPpQOk06VLpo9JXpSdlsDLaMh4ybJlCmUMyF2XGKAhFg+JGYVE2URoolyjjVAxVh+pDTaaWUL+j9lNnZGVkLWXDZXNka2TPyI7QEJo2zYeWSiujnaDdob2XU5ZzkePIbZNrkRuSm5NfIu8sz5Evlm+Vvy3/XoGu4KGQorBToUPhkSJKUV8xWDFb8YDiJcXpJdQl9ktYS4qXnFhyXwlW0lcKUVqjdEipT2lWWUXZSzlDea/yReVpFZqKs0qySoXKWZUpVYqqoypXtUL1nOozuizdhZ5Kr6L30GfUlNS81YRqdWr9avPqOurL1QvUW9UfaRA0GBoJGhUa3RozmqqaAZr5ms2a97XwWgytJK09Wr1ac9o62hHaW7Q7tCd15HV8dPJ0mnUe6pJ1nXRX69br3tLD6DH0UvT2693Qh/Wt9JP0a/QHDGADawOuwX6DQUO0oa0hz7DecNiIZORilGXUbDRqTDP2Ny4w7jB+YaJpEm2y06TX5JOplWmqaYPpAzMZM1+zArMus9/N9c1Z5jXmtyzIFp4W6y06LV5aGlhyLA9Y3rWiWAVYbbHqtvpobWPNt26xnrLRtImz2WczzKAyghiljCu2aFtX2/W2p23f2VnbCexO2P1mb2SfYn/UfnKpzlLO0oalYw7qDkyHOocRR7pjnONBxxEnNSemU73TE2cNZ7Zzo/OEi55Lsssxlxeupq581zbXOTc7t7Vu590Rdy/3Yvd+DxmP5R7VHo891T0TPZs9Z7ysvNZ4nfdGe/t57/Qe9lH2Yfk0+cz42viu9e3xI/mF+lX7PfHX9+f7dwXAAb4BuwIeLtNaxlvWEQgCfQJ3BT4K0glaHfRjMCY4KLgm+GmIWUh+SG8oJTQ29GjomzDXsLKwB8t1lwuXd4dLhseEN4XPRbhHlEeMRJpEro28HqUYxY3qjMZGh0c3Rs+u8Fixe8V4jFVMUcydlTorc1ZeXaW4KnXVmVjJWGbsyTh0XETc0bgPzEBmPXM23id+X/wMy421h/Wc7cyuYE9xHDjlnIkEh4TyhMlEh8RdiVNJTkmVSdNcN24192Wyd3Jt8lxKYMrhlIXUiNTWNFxaXNopngwvhdeTrpKekz6YYZBRlDGy2m717tUzfD9+YyaUuTKzU0AV/Uz1CXWFm4WjWY5ZNVlvs8OzT+ZI5/By+nL1c7flTuR55n27BrWGtaY7Xy1/Y/7oWpe1deugdfHrutdrrC9cP77Ba8ORjYSNKRt/KjAtKC94vSliU1ehcuGGwrHNXpubiySK+EXDW+y31G5FbeVu7d9msW3vtk/F7OJrJaYllSUfSlml174x+6bqm4XtCdv7y6zLDuzA7ODtuLPTaeeRcunyvPKxXQG72ivoFcUVr3fH7r5aaVlZu4ewR7hnpMq/qnOv5t4dez9UJ1XfrnGtad2ntG/bvrn97P1DB5wPtNQq15bUvj/IPXi3zquuvV67vvIQ5lDWoacN4Q293zK+bWpUbCxp/HiYd3jkSMiRniabpqajSkfLmuFmYfPUsZhjN75z/66zxailrpXWWnIcHBcef/Z93Pd3Tvid6D7JONnyg9YP+9oobcXtUHtu+0xHUsdIZ1Tn4CnfU91d9l1tPxr/ePi02umaM7Jnys4SzhaeXTiXd272fMb56QuJF8a6Y7sfXIy8eKsnuKf/kt+lK5c9L1/sdek9d8XhyumrdldPXWNc67hufb29z6qv7Sern9r6rfvbB2wGOm/Y3ugaXDp4dshp6MJN95uXb/ncun572e3BO8vv3B2OGR65y747eS/13sv7WffnH2x4iH5Y/EjqUeVjpcf1P+v93DpiPXJm1H2070nokwdjrLHnv2T+8mG88Cn5aeWE6kTTpPnk6SnPqRvPVjwbf57xfH666FfpX/e90H3xw2/Ov/XNRM6Mv+S/XPi99JXCq8OvLV93zwbNPn6T9mZ+rvitwtsj7xjvet9HvJ+Yz/6A/VD1Ue9j1ye/Tw8X0hYW/gUDmPP8uaxzGQABAABJREFUeNrs/WmzJdl1HQjuvc/x4d77xngxRw6RAzKRIEUmRUhkqZpFsGTVVdalthZ/AaFfINMvoPgLRH7uNgP1rdUmM0Hqri5rs64mKIksiWIRCRBAJpBTRA4xv/GO7n723v3hDO73vheRCVmZwMw8y8BkxIs3Xb/u55y99tproapCxpcFb7311ne/+90//dM/feutt05OTvwH9/b23nzzzTfffPP3fu/33nzzzXyVMjIyMjIyMjIyMjIyMjIyMjIyMjwwE8RfDpycnPyjf/SPvvvd7z770771rW995zvfuX37dr5iGRkZGRkZGRkZGRkZGRkZGRkZGZkg/jLg5OTk137t1+7cufN5Pnlvb+/73/9+5ogzMjIyMjIyMjIyMjIyMjIyMjIyKF+CLwF+93d/93OywxC1xvmiZWRkZGRkZGRkZGRkZGRkZGRkZGQF8Rce3/ve937nd35n44Pedzh9wvmv+vDDD7OIOCMjIyMjIyMjIyMjIyMjIyMj4yuOrCD+wuOf//N/vvGRb3/728fHx38ScXx8fD6b7jPdijMyMjIyMjIyMjIyMjIyMjIyMjK+9MgE8Rceb7311vCvt2/f/s53vjP8yN7e3j/7Z/9s46tOTk7ypcvIyMjIyMjIyMjIyMjIyMjIyPiKw+ZL8EXH3t7et771rfTX3/u937vwc/KFysjIyMjIyMjIyMjIyMjIyMjIyNhAJoi/8PiTP/mTZ3/CnTt3/sk/+Sf5QmVkZGRkZGRkZGRkZGRkZGRkZGRsIBPEXza89dZbd+7ceeutt+7evXvnzp0LE+oyMjIyMjIyMjIyMjIyMjIyMjIyMiATxF8avPXWW3/0R3/03e9+N5sLZ2RkZGRkZGRkZGRkZGRkZGRkZHxOZIL4y4A//MM/zCYSGRkZGRkZGRkZGRkZGRkZGRkZGT8vKF+CLzqezQ7fvn3729/+9ve///18oTIyMjIyMjIyMjIyMjIyMjIyMjI2kBXEX2ycnJz8wR/8wcYHb9++/Y//8T9+8803v/Wtb+VLlJGRkZGRkZGRkZGRkZGRkZGRkfE0ZIL4i43zpsPf/va3v/Od7+Qrk5GRkZGRkZGRkZGRkZGRkZGRkfGZyBYTX2z86Z/+6cZHfv/3f//8p33ve9/L1yojIyMjIyMjIyMjIyMjIyMjIyNjA5kg/mLjzp07Gx+5ffv2+U/71//6X+drlZGRkZGRkZGRkZGRkZGRkZGRkbGBTBB/2XCeMv7e9773h3/4h/nKZGRkZGRkZGRkZGRkZGRkZGRkZGwgE8RfbPz2b//2xkd+93d/N3HEd+7c+af/9J/+zu/8Tr5QGRkZGRkZGRkZGRkZGRkZGRkZGeeRQ+q+2PiH//Af/sEf/MHwI2+99dZLL710+/bt81LijIyMjIyMjIyMjIyMjIyMjIyMjIwhsoL4i40333zzW9/61vmPb7DD3/72t/f29oYf+cEPfpCvXkZGRkZGRkZGRkZGRkZGRkZGxlccmSD+wuNf/at/9eabbz7jE37/93//O9/5zsbnfPe73/3jP/7jfPUyMjIyMjIyMjIyMjIyMjIyMjK+ysgWE1947O3tff/73//jP/7jP/qjP3rrrbfSx2/fvv2tb33r93//92/fvg0Av/d7v7fxhVlEnJGRkZGRkZGRkZGRkZGRkZGR8RUHqmq+Cl8mvPXWWycnJ2+++eaGp0RGRkZGRkZGRkZGRkZGRkZGRkZGxgYyQZyRkZGRkZGRkZGRkZGRkZGRkZGR8RVF9iDOyMjIyMjIyMjIyMjIyMjIyMjIyPiKIhPEGRkZGRkZGRkZGRkZGRkZGRkZGRlfUWSCOCMjIyMjIyMjIyMjIyMjIyMjIyPjK4pMEGdkZGRkZGRkZGRkZGRkZGRkZGRkfEWRCeKMjIyMjIyMjIyMjIyMjIyMjIyMjK8oMkGckZGRkZGRkZGRkZGRkZGRkZGRkfEVRSaIMzIyMjIyMjIyMjIyMjIyMjIyMjK+osgEcUZGRkZGRkZGRkZGRkZGRkZGRkbGVxSZIM7IyMjIyMjIyMjIyMjIyMjIyMjI+IoiE8QZGRkZGRkZGRkZGRkZGRkZGRkZGV9RZII4IyMjIyMjIyMjIyMjIyMjIyMjI+MrikwQZ2RkZGRkZGRkZGRkZGRkZGRkZGR8RWHzJfjiQuUBuE8QCAAEAQBREVQBFBEAFJg/ffund3/y9oO7H02qmogUVEUBAREREFRVVISZRVX9t/V/JlQinK7k44en/9P3/mLWyGu3b/z9v/u3bh3sqjSqnYqwdgoKCACAaEw5uftw/qfff/+jx8eNIpmSgAgJEQFQBRw71k6cM9y9ePXg6y/eeu2Fa9g1IgKghOD/J4gKyKwIiiAKAEgirCq3bt3c3tkiQlExCAgKAIjh/4fLQqoK6eX4T0AEFRXV+HEKlwgAEYlw8OlrQIT0RUSIiAAAqv5FQ/w5IhJ+DoL/FBEVEf9NiAjAf5/wY/wfiMh/EAHQ/xlA42cikogsl0vHXFZVUVbWFmSQnagCGouooEwgCAJKKhqugyoAsIqoigizNE3bdgKAjtWxdCyOtXMds1u17elsdXg2//DB4eHpnNEAIBIqogICGKMK0pVW3nztxd/6tdcv746V2SAaAiRBFARAJQBUUgRAwPCm+P/FV43+3xBB/e8JiKiq6Y3rb+x08QfXKnzPjc8M3xk3rufg3/tP8G+H/xwRCe/W4H3xH1ENH/P/iqAAoqogKoAKMPj2IKj+bkt3oKgoAiswS1XVL7x0+8aNm/PZ/IP3Pzg5eqKuAwRjDKFhEUMGyQASgy5Vr7/40s8+/Ojf/tlf3Ln7yWLeGVMZW4oAIAGiAqjBzgkAkTFEhAAI4u+9+fT4N7752j/4P/0f/s//4LcAOnVAqqCCLKvV6uz0aDQajcpRuP6A6eqCfzREVNUYg4QABOGxBfWXIlx71PiQMYsxJlwyf90gvPEA0LE7PjkR5yg+L6o6nU6nZ2d7+/tVXft3BtGMx1tVWQOgAhpjyBIqGIWmbZ1zhqiwlozBsujmyzvvvT+bTl954/WdS5dEmIzBK38X6st5L/gSQOYfyewDv3D4RcA/tk3TNU0rwsPlFf2/gn8mgEQ+fu+n77z1V+Da0hpElLA5gAr7W00BUcMGKaoCgEQggqIKCmQ6tWfL7v/353/9o3efXL1U/tov3/71X3l1UiIBExgEAiVQIVQiUFAFBCREQgQSQQBFVLRCxczR9/7jD/7srZ/OO7e/O3nt+Wv/42/9+m4pBhUVUdWoGgBEFABAo4SgjCgsrIgCBIAEin4tRlRQERERRTRk/NYNABiXKdW0FRMM1kmNy9nG2rj2VeTXPRERBCQiIARVRVUNlzoeOfxqA4iIFFcgDcsvIIbfMq2uiArAKojIzItF27adU3Ws3HDTth3rspOjWfPep48/fHjYioKxCuhEidCAijgVfvnGwW//7ddfun6pJjGE4X8IoIqEihQ2DUVVv6GTf/Fh7wdRVb+f9Zcurv8Q99x0LAg7O/RrPfYfBwBFRL9gpqUvbHNhde2/xN/D6VuJKMalNRy3RETk5vPPv/j6a6fz+b/4v/7ftra2bt28Wdd12rOYub/siAhxt0G/46gC+GPc4eHho0ePqqq6dfPm1vY2c3f55o3nvv7qc7/0hgCRgoq/cdVrQ4T8dQMFRQVVQX8GUQjHknBTwWqxXC6XXdtOxmODlE5HAKBK/oL0xy2DorJYLtuuZXYC4tjdu39vPJrsbu2RsYpUFGVl69KWZVmWRSGqi+Xq7Oxsd2t7NBo75h/+h/907fr1W6+8bAsrqg4UAA0SDA5RLEJEoIqi8UZVRFQECbe7KhKAf8r7Qx4BAAKHDyIhghICEqYdXwR4Nps1q6Yqyt2dPQVkVQXyZ5xwBEzPUbo3JD1lGLfEeKwLv7Wkp1KHJ1Lgred+047zdvZlwJ/9f/7FJx+8TRRW4/D8xpsCEZGQ4nNERMwMAIaMRTTGGkNFURpjyrIqq0J9pabiRBw7YRYNa4DGZ0FEQMFvLE3TTqenbbtCBBVGgFFVllVprAHkwRF781A9XBU3apYLQeurWcfu8PiInSMy/pdT0OFZXEHPlWZhxwe/2QGSAgIogkN1oCpaK07U3n37Z4vVot6e7F250oowAlhSQCJj0KCiBUVgW5iSbAWmmDV3fvLuyenJlVde2HrhWjepOn9kB1VEUQIq2lb/zf/r//vOOx8DAoV9RGOJp2/+6i/9j//gf7i0v+e6Ttg9fvjIEO7v7Zdl0TaNik7GE0OofgX0da6qqvj1vmvbtm3rUT0ajfxen96ztAfFWgkMUNs0i8WCmS/t7/v9er0W7a8nOz47OxtPxnVVF0WBYZ8FiIWkvz3OTs+sNVuTLTJGVIwxhETh4NT/JgpASIQGkRTUkEkbOqhIenXh/7Cv2MJGoSqKBNbS2dnZ6dlp13UHBwdbW1uFLfwuSUSICCKqqiwGqTIFib79ox+dHZ++/vXX969dhapQUCcMAH4vwXgUAVUQQQT/QLXtsm2aUV1bawnBuW61bNjx6enZcrEwttje2hmPJwCwmK8Wy+XO7u6Vm9fRGo01j/bPIQogrVehqjIsQnFwWlIVBCVV59zx0RG7bmd3d2tntxVFRGOsfxJFxRABIBH51x6utPrdw98nulwu7t2/v7W9s7d/qSgKx6wiRAjhaIVIiESxpt58PNcf3I2bBQH8baBnZ2dHR0fG0JUrV6qqDke5sBF54oKMsdPp6dtvv3Pv/v2/881vXrt2TVWJjDEG0QQKRVWk378GP0tFFRCMf7GAogIAr77+K3kjyARxxi+KIVZQBhW/lMayUCMlJwgIKKrs2lUHSkR+S0hVhnI8p8bCDwKx7Jw4BFAxVQlEbr6YHR2Vp8fHl8dFYYS5VVAnrSKjP48DAVrXNe1quVosVwBEjoAC4xaKDmDpnOssd8tFvVzMXdtg14qI+sIbwRgSBVEUX8r4LyYScarKXSuuA0IR58/U6WjhD+yqiiasxcNVLFG0PUs4qJ/l4jUXNghE8ftcvPih9kuFR6yHYXBi80WjJBJT1R/pRBQAhCittuFAEFg5BAD2NY1y1zaeKQDVbunOprOuc7YoqqqqK1tZY1BVXNiBxO+uqoiswizOua51zjE7ZREWYAEWZeeYu65Ztc2ybVdt0zTNyqkBQCB/mkEAJFGVpiC3WMxc22hnhdlfbyQGVETPX6KgUGSHe4IgXJxB2awK6WZdJ4gTw5iOv+e5YHj6BzW9I4l1UoF1csTX9Coy3OJS+Q2JGBgQxIHkFhFAQBqUfyAqCpIOfP4AqIgsyiIr4cMnj0d1NRqP93Z3VvMpEwm7tm3J3yqmRNGOddF0Hz148sO37/74vQ/uPzyaLxoVsAaqEgyRb5WAgjIqC0s8TfuXqIwEq+VJ05yxWwIwioiwqiJ4SqAT7kAKVYeC4ZACa/UFanpo0HdqYjkTCuHhO6Wqvt8S2iZE/RvqP0cZxIG4ATMi4lrhTlyrbABQFQBF2Am78HpMJD0UQJldC0SFQQQE7owFMqAgyg7EoTBAXP0yvhTbmYiDYc8BUITZNSou1DGJj4sMsr93RZyqsOu0bYkNESqBXwz95uKbogCKIn4xUkRFBBF/VFayy655eHh67/6DZjEb37yxPbYkS25EEFEtACEQASuKIiJSWGgRCcCooO9romWjTq1j17SLxXJVWV01e2DAliU3S3EMqlZVQQlJkQBVEBUEUCSu26BKoNYvKIR+/WERRZTQxwr7TixNIfDlijromSUyjS9qtnkSkAj6vQxRxK/b8TSBw8adsjAiIBEKSmzJwrldz9PngCCoioCAjpld45zrWJ0T1zhuOxblzq8MbbNcNKxCRok8QYzsVBmET0/M4eHR9d3aFKgEaNKLViBSRNVYOyMmTh0igZteadwlLrz7wha/RhzHzWDzosXLNfxk8XvK4JPP9yA96d7vYoiqysxnh0+OH+4A0t7WpCitcudaiOcyERF/NOjfiv41KKuqalVVN154bjQZHR0+bpfztlm6qmBhx42IA1ICRQH1BKgmumbYi/UkpvhFGIftWgVVp+L3EQZKV8A/VSIypN0JARFExTG3Iqygqk7VCXfsWgUBtGAtkhIqqigzIqjfHcSBsqo0zdK5BtSBoopC4OHJ7zEaql9UFQhddkUF/0xL3IhCtZ96GPFtje9NIm09hQwCcbNVAXDqHAirsrBTQFG/vYerJalDMOCsccAtYCKcfMM9ciq+rTvsMfiafcjcZXyhwc51XTtcARIViLhJxaZbSAAZ0VpLRM51xhiWTqQyxngdjAFFQ4zQdZ1zbiBrUGEG/z0USdmAgkjHnaoSwgLYKVdVaci3R9cWqI1l8GnM03m+OBB/iSB2XbNadl3nX8L5VTSsQJhEMJE6DIobIiC/MgmCQ2VUFe0YnLBbrXg6N2S2LkHL6o/ZqqDqUBlECxbrOlJAUSfQzJfLw+O2XTXLVbFcOQucljkgQQMCbcdd155NTxHJGALV2KBmAJ0v5m3TMLOw67qubRtD2HYNIaiIazsuS1904EXcugg717mWOmOQgpBrY0fo7wQy/jDcta1z3QZBvPE2ibAILxcLGv5MYwCJuYuSDgTQ+XwGKvVoVBSFsFNEJQLoCyD/wyUKQZL+ST037N8MY4gMXNQrQPDdOJHOTaeLs7MzVRmPRlVVMjsMAixiFkAAVlQgVWtoOZs+uv/g0cNHt194YTIZK4LjTgM/ke4Z8do30FjbifjaoGsaS6jsCmsNEoLOplNht7U12dneraqRL2i2t7eYHXPXLJfVeMSqiOR5Wn+K88WrQBQUnHsKYrGn0N/GogDM3HWtKvvdEeM7njiByKiEHzUUQLFXLQCohH9VVRZWFUAQVWBOrEL4NdEfu2jtNos7GA6PQOfuFudc2zZlWaYuf/jp4TuE04u15Y0bNz+8c3c2m1+9CuT7BAgi3Le6B63NdLFCn8trqATSg5+RCeKMXyhB7DgoqlABqdfHoFc1xg04FgWEFAVY/Vm0V9zE70q+jlY1hKO62t7eeny8nM+Xp9P5qu2KrUIZNS5ZCBrUoYAE4H9YOg+rZ9/647qnn9BTTL5WD1+t6exOCGtH5aDR9C8nSpJjxQqh3ZyIYk2iZhwea/pu7eBMNpD5bOwIMCDRYL2b2J94dP2z9fxJyneVMe0ToUADBfHazUSqhe0ZkyTMNx2tMdYUiNYxns3nRycnh8cnq6Yx1o7H472d7SuXdrdHtUFQ5bjsR31b+AsCERIgdKiB2kUEIpSgPAeD6JvLwJ4w8KJYxdSIEOGw+YUrrOGHhJo4dpaDFCnVR0Fbq+tHimHzcXi51+rVVAyfe1dwbRdPZS6m15y2riRzWn9uBuonWP+UxD7puR65/0G6cXr2qkRMrHF6KpBUdHo2PTo6vl6Pdi8fMIJbNe1qdXj4iJkRSck0Th4fTx8fnf3sg0+enJ7df3LUMRBSaW1d2IO97VFdk0FAENGOpel42TQsHCRJKqLUupVqp8AKEh6JdG/i4Ib09G9f9g90xBTolf5ZwOEyEYniwfVFXBOipEdO05Mcb8JAhYCeI+KTIl/9MkWpVQ0gKhQOuqgKZA0VFggV1P9oFcVcUX+JEJtLfa3lHPsqpWc8EzsMaVzBa00IiTQty4obRW44P/sFMN6Bft4GEBVo2XYPn5yeTptRZS9f2t7fnRQEIAJq0lkYenlz6Kt4kaWXKCuokioCK6qxxhTWOCSjRGDLnf39Znq2XMxd2wkqe9oaqO140basAoY4cH+IoBXBuLSWcFgqDJawSAAnigrjoy+DOZXwNbgxbDHkyC5ov6kiYKwT40IHXmtJqbm3sVQP99nBShu2a4RY6AQCLqpgAQxCZU1hyIn4F0b+DBB6z9g03cnptG1ZrYX4qvulWPt9Avt9Ou0VGFczPb9RD+mbz5blDD64cSVheDK4iHq+8CPhyhAul4vDhw/Kqj64fKCq1pi4B2naw+P+hsPvkhR5IrK9u2us3b90aXZ6aq2NW2o6hwzfriRDjoMfQ1ZTdfM6Jenj5nXQjdPUUBKI4fdNZ7u0d/tn3I+XUWxDBBl76HyIVytBlHppqIExnirifqVJWpV+hm4eKPpDb3q/+t9T+/si/sB4i4Z1JOq/AJGG1+DZNw8MTr2ba5HiuS4CAmDeAr6MVdr6SMFFH+9vIQy6BkVlx34lR4WiKKy1RIaIrDUAUBRF27Zd16U2AxHF86kag1VVqvJyxU5YVJUVmS2LoXT3D5bGYQ9wQ+F77v7d2LKH+o70vZ+6xWtvbLnZeINUXiB5Lb9vB/uWKBmjiLPWrU4brZ2qADoVVfDdKRW1LGXnlJ04UZambeaLmStQwtAc9qfZXg6L1trBM7hWz/nuXVRkgKoyCzsWw6m2xQGTO3zhibgP22Lci4clyuBS9+fnYYl64R/8f621bds656qqip9Accf0Wmwoy7JZrVarhowtizL9AojoB0ZCxdLvRWGaAvrqWgdthLWRzjRUgwrCvFwu5/OZqo5Hk8nWVmEKzzgTEg7vEVWDRljOTqcPHz2ebG1duX6tGI0EowIaY90ymNpB8hPP4t8UL8t1jg2isrRdO5vORGR7Z2cyHo9GE0LjHCuoIbtcLlnFsSvXlua1mh6evkcPy9AhKxrb84FfGex6eOF7d34b8JuYIWOtnwdFBDSG4nzS8IHDNCngyR1cn5zu3x08v+2EVoEvvnRQFA+efgKFqqqvXL46qkfNqlVRWxbCjEBeAjU8/w4uo/bTVQhJlL5eh2dkgjjjv/zJo+t4ufBNJSAzWOoDHYMiFMdDAhcbTuFhtlSHBVy/uqlBREJP7xRlsb+3V94/XiyXR6dns6aZbJUcTu0mTjGg78shIvkf5FVI/md4sjlVmoEPBfHSDtBw+mfl4CcRjxLhdIQKwF62hWFeQ+I/p8owvBZCSMvZ009p5/bm4Z6NfWttKO/oRSLhCLfxfTSoItf4YU8B+LMEgXiRiwqqoic+BHxjUCnOR0KY1hdCZRBrbFVZVjNfdu/d/fSjTz49mS0Wq4ZBRnV1eX//5Reee/Hm9f2dMWr4/r77ixwmZwX8zLK/PzRZBcSmN3iy2Bo0UZcngHFXCDo5FmCO0nQRRKTwCYPDAgIIgg541cB0g54rQTXuetGdAfuLDkA6kNMgKKCEfWx9vAnXatVYNib1seI5wZgGD5Yk9kqMEwwK/DWfCgm6ON/dFoxq9FjtIWwQx4oE6CdYm+Xq8MnR1t7+3pWr17d2XNPMp2ez1WI2PUO0q44PT+dvf/DJ3U+ffHzv8aprjLGEWBraHdc7k9FzNy7vbE3quiAkZm3bbtm0p/OZk85bmAiDY35w1BJhUZqioDjMqpE6jzxYmCePLy3cCJSa4xoulRnU2UG3BQqgBEndHq8SYmosUVL/+kG7KFLDIaHvmHWdpkHEeOChID1T9KpO8dNcXunpn20iIOSgGkboWxQZXwp6eFAS+Nqs65yfvR0ezXVIdMUv9DOSGrRUCoagF2ol5qd/sMOT4EXwaBVptmo/eXi4WMn1y5PLl3Z3JjWl1pBnscKQaGCxhDB6OaHGoQMB6FSny9Wq7dBYa2si27HMVt1oZ68qa4YnHZ+xOAASJCBzOJ99fP/RsnNkCyEUREumRNiq7XNXL22PSgAOcz9EkOi+nsLSzZpnwP9ubHkbcrZIEOuGvjJZBHmd0ZASjSM0aY4CN7a8UJ2mFiMmchmIyCCx3//Wd9zCmrq0nTgWBUlVKgISoDZte3I6XTWdjmw4U2jsbkmYEKXBVeg7DWsMZ1BIpWbz06q4DZp7jcG56CMXcz3nBMhPIRKVCBy3R48f2cJubU/YT1T0U0nJyyoQ9Jqu3uAHr1arxXxORJcPDixRVVVeGQ+JB4jlnO+2bHLlYbYsFHfxCkRZ9hqxvPHQniNHsD9aEqIqsg6mqgdEWe9BJYqEhijYOfmNTQD8DMw6v9S/lnA49DNhA66WAIEUBs5POtjcBwRtbBylby5Jbe7/SZhRgeJtk1iUC6r988P46797HA9LNJg/LG+4l2R8OQnioZsNXkRCrWsMVdmPVZKICDM7rqqqKMCgJURjbV3Xzrn5fL5arfwWGebkmEGREMrCAlQiLE3jxIEoOmmNK6ylcxKci5izpzdxn8oXh4H6C1fRZ6yf/YHeq/LDtyXyylZQQgIFK6hny9npobt/5lWfzDI4pAKCGhWUMDfUoTSlgdFILAnhBa8UEZGKokjGgIN3R4kQQZ1zXddReL5FRJxzbC0AMDNH0o3gAuGkZ/q8iRCGFSqykalM6Td0XymDV4tv6JHPf8Rau1wunXOq6t9PUAABBMK4yJRFWZX1arVaLValLauqCk078E49utE5xbAmRVI7bN9DNdYaT4yIKuqcWyzm8/mcmbe3t7e3t8uyZGYiQqBQaIRCSRCQ0Mxns9OzKau+8uor1e5O5+dgovlCoClCxRqUAOGoJ4CA1tiyLLumVTJOuqOjw7Pp/NLly5cOLlVl5ViYBQ0hABlD1rhO/DMCQ+ob1+9iHe7Uet5FYZMviIO/RMZvZbr+Zp3/8+ZzoSAq5A1l4t5gyBCR4KaNQ6hXY1XXU/upMYp9L3xtYSEwRMbYZFS1IQeEIAUAa601Zmdrm7tORa0xHPgY8j+S4s2RHDOwV+fFclzBW01mZII44xeJ1Xwxf/CQCm9I6ucsvPgBAckYKhR5vtLWUdBYROmuRjUEXOAw5fcrIgMiolgae/3K5bsf3T86XB0enx1NZ7t7W0AWAFD8okQChALWC7EADAAKAIGqeOPf2Fvyg7GMGrxb/WQLkicsyU+1kDe1i3y3JhGqFxejIfJ8tOgF1juJsNss0s6LiC889gzGDtPhBwftz0S6Qe88eJF6SHt1Fyb6EIOZkh9kBBFEg4DCqhYJUQX8IUGBxFNlgmCq0dnp4sNPHr714/efnJ05gWXXrVaNqFQfP3n/7sPXX3r+b//K1/d3xnVhjDoQJQBhduIHO9V52w7fh1WBJDGLGwwhGEyGwZ74wFCfhc9GAQoqWkRRUVATDJyDbR+qd2fqL4D0w6q4JlToy/hY8wVttfYkbk8V+aY49Y6LQ7of+/1eYU0lh7jZTB3yI0MHQBz4xA1unPBTZO1nwrCTLKJ9gdfr3EElyPmdyOl8cXg6Ndt7VJRUjOwWlTuXlmfzxWx5996jj+8/fu+jh6eLTrDAAgrUkTV7W5MXblzZ392qy8oS7k1qa42yiqsZtJFtAQYiRKuCbcfmPbe1R7/6y6/ffvE5BFFhE4fQkxVj3w3QwfUHP18G2ht3J62D+sOmb4gAUaBYEOPAbG8kMmQyomWzgIgieUpJVVjEidOBTsI/ztHR1C9QNGQcAscTOCYo67IejyBohzGRDRlfvqLaOe4617ZdGnALVm59Cyf0MBSBAMgQEQr2h2lfBnuDGEj6eCINE3bSi+KNYcH5qnl0eNyxXrt65drlS+O6Etf4o3q0rZNkJKeqCkaBAIMDjCooUcd6eHb21+9/evfT+06AyLadPD48/csf/Hh7VL/28gtblw5a5nY5QxCkohP49PDkz37wzuHJVMmYsgYEQ1igXNsZ/8avfeO127eKMPgfjuOqGopA33jzI5O6WeEPFZ0bZQ/GXmuqiy7Qy6DZ+NjaVMygd7chacVo6IeYtGKoIqhgAI035VSvHyUV9gxpXRWTUb3iZdc49nbvvb6FHMvZYrXsmBX8kYIABIEojffSoFmlqn6SCcMbHVc9xWcpep7BEW9cOvgcouOhfOyp1Ipq8tR13Dl265Q2kKHoDqyppBxK6Qc5CvTphx9aawtr9/f3AUC8R1UUjYHPeVBE8huqN5GiVHtiTwnHz8feOQiG/t+DXzGq+we1Mawr0CAdOQedHRxqmsP3ITJVWVPYtrEqC0JCCcJe/wQODLY9m+xzAVA0KO+D7UNwmVRYN55W6D21k1PnQHEe9jDfqOROurYzZILhEg1+6XV+Yc1iYuNYicNTKKyfRfHC80bGV4EyvnDZgQ36WERUnb9TRR1zURRG2TBXVVXXdVlVi8V8uVi2bcssIKJO/M1piMqihDEIgLbAAqLQtF1poCps5JXw2Zzwsx0n4ML8kOhB75W5P9ddTYiExgBRdFIKkTSAIorW0LgGAVPViIbI+E0k/MEYKVALLABLNBaRLa0KXFmwe9vOGNoggEERlIiqsvArWD9SEF8aeWuFuED4H2StQaKubR1Hiw//m58jiI0xxpi2bcuytEVxwZVMpoL+HRZRAGttcBRZW0ZwGLWCiKPRqGmb1M8Kp5T4IrzswqCZTCaI2LbtycnJ7s5uPaqdk2hUMFS8hp8QThjSGyiF8zvoYBoQEdE559h1XbdcLheLxWg8mkz26romJGHxhrzJiUhF/aJsiFbL5dn0zJbFS699bfvKwZIklYcYpDWgvai7H3YJIxxKhDiqa3WOnVuumuV8ubu/d+XaNWNsJ+x9ukJpg+BUBfSCSdK194IQk9embG7lMCw11E9PM7OIloX1bioy2MuGX3v+rkgHCREJZ1QJu4ZvP5RFsTH52icZrFMZ6eHyzaELHYoRoK7rne3to6Mj13V2MllrZyKooD9TsBMRYcc+D8aQYU/oG1of/Vwb6Vsbtw3qufWubkYmiDP+y6NZro6fHKI3BidCQAMGiRRVAKwxW6ZYnpx2iyXBph1eXH3x4o3fc8egRGABL+9vT0bVodLRyfzx4en1G1dLS9y5gtAEztEIKguyAnsDOWHrpwRFBsphUlEA3xF3Khxs2CGSvbCmioo7F6QhysRz+dEjPDfuh32qij7j0PNs460LK8D1Ed0+IOJCb9whSxw4CgAFTE1MX/YQIRnykhnHzhqrUY4WfiISmWLZ6d37D37y7vsPj06EbCfatLJqlJ0uZXVysjg5ObWW3njtpRuX943xGQXCgKze45XBKQipkkaV89qV09A90ESCp91ZAjVP6d1A6pNywqCol+hJrwIekO1DmYH2pV1oG5CCUexdNsKn+bTFNLlCXoFGa1ukYvTfQtjckGJgRJIabZ7MIhe+ttde6DU5eEHqG8b9/YAowXs0epd5lTMaf+WcwtLpatW4Tx8fLjpbjuqqNmROFvrwePXJJ/d/9M67p7N5IwbRWDTqmkltbx1cunqwf+Pypaq0i7PZsllNaotSBoYFoaisACmAoYLIsugrL1x77df+3t/7r7/5wgvXlTvQAW2NSEiWLKFBJWBMU0GIyNr5sbSYoeLPZkSIBASgQcMRNNwUv5JSXAXGNn9QNGLqBg2a7+l+VujJfAj6RYTeW2JN0+aZpgEvMR6NhYWI1Cf3Za+rLx3CgIgIM3dd57Pp0vqP/QSrb1PEvYXIGOvbR4RAPq51YE7T36sbHuMYDCI6lkXTLlddXcG1K5PtcWlCcYqI5DtEZrhBhCgdL3EFEAUUQtO57vHh8Y/e/tnj07YRo4rc8dFJ+1c//Mlqfjaq/oeXnr+5u88PFnNFNIZmq+bJbPnwZPbkdAmmUgJVBmnJuenW5NqVxy89d8MUmMxafIoYWuPXoORFjLhpWXh+fbu4/g81J667svexqxvfR8SXl0Bev6n97uyXjjSi1FcsoihAMd7LIDGpIWASRCFDxpqiMHVtzQKCb4cyUMo+ASe6aN2idayhVO2JxsD7CSKsWZEI9hlqG7mp65zvMEJ2aKm5cV6Ctb6gXDhW/DRZccwveuqnBRNpBRU1xqSwhGjgyH3tJ/16ncIdlBkRV02DbRtEfIhAiIxJwKVJSRvoEYp9NojaJAw6bEyTRDLwTyRvIUZoBy9ZL2TMNz/ieW3P7CMSUogJWs9sUJHxaGQQQYRUJ5MtY/zhULx+KbRfiZLtI3oiSYeFPACCrF/gtN/hhuK+d2gJ5vwYyWsUbVar6dnZ9vYuIolCcrCJZ4L+FHH+HiCiC3MO0y264VycV/6vCM5TP09jW4ftPWZutPEmb5UlYG6aBgDqut7d3q2Ker6YzaZzp9y7oyAaQxaKqq6dKLedYyGBru0sEhnCYPJC0gc5+MHBzRC5Z3PEw1/fEIWCIPkW/Bz3NkapgCmMZR8IpkhoisJWRPvXrm7t7xtr61EtTgwVUVriNyTsLHRWKoaSwQqAIa6LU7dcKTOCsgABpdUirP9krPU8Gaw1dxSQjDF1VVVVqeKAcDQZG4C6HpVFoaJd1yVzmw0v5nShiqI4OjouiqKsKoBnsZQabQWSgniDqRx+BACKoiAk55xzzlpriFjw/ApcVVVRFMvlcjabHR4d7u/vj8fjoSMQDAZJBxdGUr2TEly0f4fIWsvMjx8/9vT3/v7+aFzXdQ2qzKwAxph0PhcRFSHAwhSua588OWThejwqRnUDbMpSACikog/9LFK7jhg1GvyrV0t78n16eraYz+rR6PrNm2iNv3e9iloBDJmOpRPWzyoWeiHN4GoP31CDg5kpRArpsgxY+leKqmtOGoPlfeMZSu18IiqKwnsZA0JRFOEE4gfFLmojbXSpY96Dpqt9IblRWDuZjA+PDu8/uF+W5WTIEUd7DFXtuq5pmieHR/uXDpilbdu0dQ6v3sZ9mLyZBpK5Z1AiGZkgzvgvgsLaUT327R/unLJ20imgot9r2KGZT6dd26ajxlrZNjDSBegLZ1ZNylIinFTVi7du3n7+3ny2OJ2dffLg0a3nb10+2AOjTpwCIZCiUYNgrSlMVRWjUakGq/HY2oJ8IK8xhCoKneu4a7RZbW+PTIEKaohYnJeJogIRIQEP/OdSDAozeyPYpxG7MRBO++n1jTDxAck7LHLOn2GeFlOz8Yc15ci5xImoHuYopw0OEIgApJZAFZw4ICBrHKeCPFa3SAJkqHh4ePSzO598eO9hw0qkk8loZ3v77HQ+PZsvlitRPDxd/ofv/+hsPn/j1dtfe/HWuCylawVU/IiwKAirgpe8KYimfrmCigCiIUPGGD/EDOotblP69ubOFv3OMGp6EVQFDFHgKTAZjWGUKUSvAvUeJBTI6t7IWVMd6ye1Jep6fMVnvHsoyDAWGWKdvEHLR1Ozza06vWtE+PnFHQPuWAfhWCDCKXrQc6gGbSgmLS2W7eHp9P1P7j88Ol00TVHWtqrralxVddu2jx49Ojo6WSxXCgZNYdAq88549NoL128d7E/qyhKAsCEAFWBB41ABkfzIGhpAMCQMoCzdr37j1f/u//LfTbYqgwCMEFVp/u0EAOYg5jeECBRdggV91a+IQL7J77N3QSl4ZAF5rVnw7lg7BYVAH38XIPaTRQoiwAqyMSW3zr8Eg+6oHQg3zcabNQyJr+vas4SiEiOnM75UxXOyHmZmHSQQDkIjB1XnwGLB2KIs62Y2ZRAqbFhlEcUPO3hRofZ+Qggi/j4HEJbpdH54eLZc8XhM25PSGARBEBNyLQ0oqqKfsiOQfkUMvLV37kfonMyWq8PTaSuVgkEiEbdsuuVyMT1+/7VXPrx14/rVa5fn08PT02PV4ng6na5WbEs2DHakYFQU0SisOlYXS5tI0sqQtVz30NeNDe58YbkxP+GzRr0js8iGf36iLOUc34eRkl7T1UReGJJMK9pX+DLGL0ACKhhKTudTP4moMFpYquuqMHOKOiIMvu8KBAK4bOVktux4tyIUUUY1iKziq7M1QpbWzjmqwCIISH4l88soUSquLqR6ewJhGGh+oe/w4P7cKAtDHITqU04suEFD+88XFg2EsoL6LTxlEsZHIJqNwGCiJZlhBZsmAO7fNIpvESr4bnzQe/fcTHT0VR0MSvV2uTBwfMfB7rq5gaZ2oISsVB8+5U+Cvq3iddBxMAf9DsXilVSEQEiKo1HNjoXZFpYAOdl6iuDaoP75HTx08TUFFZ5/KDT0QiUQ96rejQ2UgjIdV8vV44ePt7Z2yroiQzp0a8W1+ZXhafCzCmOMvU/9efWVGV/ITe2cVHP9fu3pMEAcWtwPA6nSDdZ1LSylKEuwRcOszo1G9aguqnKvKorp2dlqsUhUKwBYYyc1GbKz6bztWlDpOjBGSzIGKcwGhgNh3Ds2NMLn9RVDO/f11wIIFom8mEP9jCSmYJwNutPbDqgE1Q+IkjGgsFgu2rY7uHJQF3WNqKqFgnZ8io5rmuxtldtby+XSoPGrmK8VRVRQ1WBn1Aqg+KFH1xp0LEBgjBVQQT8H5DeWQY5kcrvzR9/4CvyptXMqIjaUSIgglqAkIhYiRUIBSd6IaXlBgLqquOua+XKrHgcRcX+uDefzUON4AREDFQaU/CvobxJAECQwGM7Z3sWJhFkEEU0SK22YG/iNqaoqIprPZ6enJ03TbG9vj0YjAPT6La+SVpX4zlAciA0XgYi8i4Y1VkRms9mjR4/u378/mUyuX79+cHBgjDEEKgqE5C07iPzpyG85BskaI+yOT44b1+zs7uzs7pmyFAICNH5YEVN7DvrMb0gDjhCdHFRUrbHj8dZqsbJodyZbZVmuxCERKJK/voIGkZmRxVhjS+ui3Aj7zSFMy/aqr/UiJe0wAuBpewJBVRVRFgQqbGlsgUTEoinPFXsVuvhpL+xzvHsDfNWikuWqAbJ7+1iWI2OsSJiLGm5vOuiCb5rph8Mo9QIqGBpcBJ1ZXY9v3bh1/8GDDz/8cG93f29/b2uyhRbZcRjeJP3oo0/+/M//fD6fb29PEMGHZIqoN/YcbnDrCYoqkmyshlkhmSDOBHHGLw7VaLx3+TILMzM7J06Y47EcVFxnRI0tvbRqqEmBzZpk7XztTd0QUZAKW2xtbx/sHPztVXvp0uUHDx+W1nYOkApjcFTVhTUi0LTcuY6Kcnv/0stf+9rkymLVQlmPqqIyRYGEPmSrc65zzF0jzaJG2aosc2dJz62HSOS1xhjtHMAYoyq9G9+6GCdFZPXT8Z+F9bLtqZ9zvne3cTE3TvmbLhZhxFXFG/3485cPkg2zr6JEaAwYbRgKP2KDwdrB2GLVyqPD06Oz2aLpwFhL+PLtFy7t7S3nq08/ffDxpw8Oj8+E8HC6eu+j+8bag/296mBfhViC5Dr9Jj7zQiHObMZFnQjJYGGMMYQcxUQASUyAAClNPZAy0ncX+vwCheGpBpJdvobouqAmRRW/qyEpiHcbSbyNIngXSvU5FWF3lhC0G4e9vQuSPKO2H1SP5+/zDQLlGf86bOOLqBfQhZ4ziJcQARp/fvJzVEC0aLp7jw/vfPrw3Y/vz1bdqnUIaMiisURWEFdN41oWNQBA/hJ0na2Kva3xqKQCBQDEqYL482g8MQmBV4djoDxQUcQgjEa1tSamcSBIfEi0AyIfQRiMPKLiOg3hgiKBURRECqPYmN4T/2my7nAaJWchD8+fJcNYuG9JaDh5eSkGIqLv+Sd9wEYyj4hn/0mjEltEeoowjgMnOUMQDOYC+8tVTPuzt3Ps4+ngfBalhmTPwFyht1lXa0xVVbMgrtRUlfrKQxRFQZj9/BthHF1h8foj18ly2TqGsipGk8pan5HjCyQfzewVs94lG5JtUjAlBiUFX1wjEoBRIFYKohgyLLTo2o/uPXj45Mne1s293e2mWSwdzxaL+XIpAGgKJatgAATBAJDfYBRJhaW3uVlblDb4yg1WImp7LxYqSnBCBXwKgxnY4QuM7VB1wFZuEsSYDNAjoZbG6cMiFmZU4v6I3lWDvO5HPXkmqkSUXPc6p8cns7Z1UJRIvu+qCGA2AgYwzYsOln2DmowKYLj+XEzlDPuCGzsFrJPF51XbF+1HeK4XP+xy06BLiuFUEHfUkCOvCIqyHi7c9/Xx3PcUQAI/JSyeD1Zf2sZAxcBhEPiJ2V41iBqjKkAgnbeGXUHdtBXRmLOua41Av0uK/zZ9EnLghTGOMoswcJh58gu+kie0i7Jsuk6YvfdyylSNovU4lRy6s/2hcJCkm2wsYT14FuPz63dKGPYAPDvCwovlshpVRVWRMTpkxTU5IOvTCEHf/EC4wFkkaeCTDUbGV4Eg3mgSXPQR3BAhDr9D4q18b08QQYmZurYFVWPsqCrdqGLXOcfBf9zHlhGVxla2UBbnOsfSOrEFhvF21ZBr1v8qn8XsyKBY2+wPSTod9j7nyUhOz+dckjciQCQgJL9sITphAKxskeS9VEG9vyOA5WSkhF7+ElznSEEVTKBZAYgpxpV4LaagT+UGVVH0imkkIlNYIGW/4xB5xjwSXBINBzxHhsCqChSskwjQIFEwnvESCZC4SgQVDJIp7Kiquetc09RlJer7fclTb3AIFgEGAmOM9aRcTKOJb4rPbg1dBkWgqqyWq5W3lkXAZzi/GkNEBeJkuVy2bfvgwYPRaLy3t7c12ZJYVxFGr3VVIkpbJKK32SVUWiyWh4eHjx49YnYHB5evXbs2Ho+NMTGrTbwTlvYDqUAARMYSgsp8PnPc7e7tbG1tF4UBVEJCERxw67B2HkkEABogSKM+CCxqyRZFWdejqqwhin4wJNyGHWl6fOKadlLv2KIQ8LKSuESHgCTB0JEe6qlxo/AXBUFvNkRebM4dI5ItSjLGb5FrjvOwHhoXgoviOLV39wI1ZI0t/GgmETmXlHvrVlPBDNoM6q8QEhDECYRDz6KhXM2bTyjSZLJ1/dqNk5OTxWLRtt1ZPR1PxmVZgkLbdsvl8vDwsKrKF154/vLlS0VhwjFPwxjdMzuguN4pX2sIZWSCOOMX8eZV1Xhv18s02LGyimMWccIAoM6Rc8vZwlaVhMlQera1wlCTEh57MnU1unLlCtnyuVvPfXrvwWw2H43qyfYOYbe9PamrsmkZ5ktYLYuq2BmVt8u9g0YaR9aUhTForAKAMohru86JcNdou4RmYVwjIhri0xR17dCRZuR9nekJYuy9ky4+mgMMd1W48NX9XNhQCg/ox82W+FNOh9GRJ5rupx5i3PSNA2DGTnW1bCtblIUtjDWIIExo29Y9fnIynTVOwBgsrH3l9vPXrxxIx5d3t+rCgn50NF803D08OiuKh8/fuLY9Ho+M8W09TQniqZrE9AI0BB8BEKK1xhoD2vmTRv8FCIgYQsVj31V6DjE2KhMjEM6CqIPg295mY6BE86WaT9aLblPY57WHa6Th6BWziPscxs/agHRAK527T57qIKnPCrQNg8jD1vIgyxc8Zy0snz56/OHH9z749NH9wzNWy6LKgtoJoCAqGSRDwXtb2ZvMOVYxBoG8STT5o4xaG/0ifYoOxol2v2eLIuBq1Z6cnJV1EXIhABDBkvHyfgZSMmAsGBP9NbyAYihmgNgjh3i6xxQNobAm19XkXj0wlFxXF6e+DUKc9U8EcU/k9AIZSKlWyRAyhvlcVHsnm/CML1MpDeiz6ZxzzHyRvA4Hgc6BUPbLirW2ritjDIvrM0VwrUskKqCyHjIdBJmdc4tl4xyUZT0e1YX3cAAcpsn4CkB6tnogv4zn9lT3gpIooH+owCBaxfbew8ef3nvw/NW97a2t5XI5e3I0ny+Xq8aLdCToEgnReB0MB9f7lArjzfkv9jTAc5PLT5copmgRvFDqgQM2d8CMhXiCaKqjG7M4Gw61MHxGkRCHfgZpwsZfSzWIpSFrUgxKzE/37UHVxvHR6bTpuI84x0RWBtkqQe9ZPlwdMJkLpLZZTM/7uYiep13Sp38ffOpZK9H6oZ+2Zs6EUT6siUxMMjzccFOKv8DQlzgYbELKm0hWQOo1VBCrOAzMAobs8bjsaxr3vejFXLR/4vrTgOeoIIyhtDFHCUBUSFE0+HwiDlILsKzKZduGXkgyolznphTSL5te3do1xnRLnDsZYP8c6PA395et67rlYr6zu1vXFRFxYvFT0B3CxU1lHZwxNp8IBM271leLHT5fhTzFdhhTQwHPscOQkhsg6lOYQZWdawFUtSzBGKqrynVds2qdY2ZJD4khqsrSf1XH7ByziFWDhMOU5s/VrNBn/FU3lor+oY0+cn0UiQICGmOtLZKLL4IKSFEUviFqjBnVtffYIaJLV6/4Z6xZrWDDLSZJr5OrMsLAIS5uCkopA0NEXdM2rTZNa41RASCTepbe1kZlWBOnJS2+JpXBCYL640R6+YTWmPF4NDs9a5pme1v7jTI6BQcXhej+Y7wvCMb9r//V+//GVjpUVd11rKzKipbwmT0JRPIuFwDNdDqdnc1Wy+bgwNX1uCwLY4yCRJsL9JrilBTiC43Fcv7o0ePj46O2bXd2tm/cuHHp0iUAZeYkagpmSr5CgeD575n0pnXzxdxYu72zU1VVSjTBdJa7uHcS9/veY8mnTigR2aJEWrWt21IwRGEoTIEQVfTk+OTxw4eT8fa4rskYGQ7AwNoYGgI+O1lu+FWoqKrs2JBPOCR+Gh+6aWkVtwkJMelI5FXz60Gw+OyzxDCmxROyz6Qggr2yKardXauqp6enq9VqtVotl8uqqlS1bdu2bYnwhRdeePHFF3d2dgaSYU16OHhqgNOFp9BMEGeCOOMXePgojBmPjJ8NUQABTxCzspc7Guea1aI4rB2z57QCR5wcd9a9BdPq4+cHRJVFRbQqy1s3rj/3fPHyyy9Np/PVqikKYmgnW9vWFstVS9VitZhagMpUtFPva+HECqPrOlFkZnGtiCuKjkWYjZVSllaWc2jnkbPs69JUnIRuYmi5gjHJWz/qg0IoEa5Xtnohu6dPIX83xEQbjPBnUOrry+JGCmqvBwhhsL3yBYgUiAXmrZs1zXS1alq3mC3Go3pvd2d7Um9XlgwpmqZbPXp8uFy2iAUqVIW5/dzV/a1RYfBgu9yd1FVp/refvOdWsHL86eOTv/7pna3x+MUb102vlEENyl4BIAWVeAd4WStFHbG1BrQd+oaFegcJAEWFw5SwggqCEplQ8kQqj4bKJokS08jreG/ImBRDEJ0ZfCFFSIQUPKa83DqcK5OJtfY3KaWqcb1tuyaBAwWfznde23WBHhye4js5tJ70BGVoF6tKsLpMTtPqRI5OZ3/1w7c/eXxysmw7rJBKQs/thgOTA0SyzALiQBlUmUEcN87NF4udEoy1CBbJEKG1qCheQKYCBgEIVRCQ2HtsoD06nv7VX/x1NapsWZCxoFoUdms8GdXVqCodt4ulQyMCYgyZ6CRMiqpE3lfEv0wvjQhGXr6r4QnpdfpnwN97VsZ7LisEu880Y4e9nqu3VzvfsgnUcEzC0Bh1F9+X8JZ5QzTXOWVR0nwG+XLtZ6Cgzknbts51vkRcO6mnrlzw6Qm2b56rtaaoqpExBbddVA+Gjo3ocDo+yJxQAYiAkIiUsG272XTetlgV9WQ8NkTehg9hMGXvVajBuDUG4MXZSFEhiYPzSGm4IYjg0QLxk6Pjjz/55JXnLr/83I3Ll6/evfd4Nls2qy4wTir+9SASILFq58Tx5jHtPEc5JBE2tnW/SsogcwYGlV/s98XvmZZa9IHjQQwmIYFTAcAQ9YTx2mT92g6JwQ8obeW9klOC6YTGxQNRxSCU1tbWGgRm1iAKC/0AVmhYjqezxjEnB6yYshujAxFMKLuixa3XIw9MDSlZDcqG7OUzaFyA876xQwvjdIJa80FWfMa3jXyiDMStF5pO+HwkDGrinqXQ4Zf5QPm0rAqISLD9DYpdJCBvtQuAioQgPhOB0N/TupaVHq8Ynpsxj53Ai7ghT20nW46klY1dyaDp9+7VLELBQRQJEWX4+VCWpX/iVDU6qw5/taHtU+hJ96EHvpLvN6PkWqzP5L6i0pulWSxms/nLL79c1zVAcMRIZtbpAiSjEjjnSzYgs5/SJ9i8gJk5/nLi2al0F/NKsJHr7Mu3EKKWjqzMnNaKoiisLUajkSopNCKdhKdGAKCsCgXpuq51DTvnuq60BtGCooQiQT/ffahPZ/H8SkXDB+RCss8/aEToo+OYuSisNYWIA4BRMarr2l80a21ZVswOEa+NrgHicrV63DTnRB7nPC+GlUf4nwFEFBDQrutOTqZn08XZbHV0dFIUlh2At3AAkDjMEIofY9i52OLqszab1WpU1/4vhD4mrid8ww6LuDXZmp9Nm7btHKOh0MqENXaY0I96hDk5PzM46EFrX0rF5BtVKIuqtG3Hruu6cVmosg6t9hXOXSKsqrqqRoj40Z2Pnnzwwaef3rt27fr169e2t7cQgYVFxIbueNQGCbcNd1334MHDhw8fTSaTr3/99f1L+4Qhu8yn3WoMMw/6aBGfG0sAhNC13Ww2azt3eW+/KOtkVRBKjM86yHtniD5mSJUMAgIZs2xWJ8dHu1f2CQ3GzBQBWc6XP3vnneVydf2Xb+7s7HQI1BMMcfY1mA8N3VxgI4QgpLiHvAURVVIV0bZri9IWhY2Fofk8XZVUfvp489iMdMziNztzkVfyBkHR+4UORTnD3umapgkig6wAsLW1VZblYj4/OzubTqfHx8ehEzMePffcczs7O6PRaCjOSIOzKfzwM7jrgb9NRiaIM36hIJ/GY0I0lDVG/bw6GFBCKra3zbhWkIHssa9tZD1zOcZ5eHEJKyiLLptudjbDgmxRFkV1cGmfqHDinDadoFMAa8qanHPcNZ1wx27FOl8tu4a7znUdC7O4TtUJiOOOuatAyLWma0Z+pfQ7bBzdD6xwyuVBFBZm54fqrS08n8XCxtD6cigb7bXPcSALtQmcM5E4P7e7XtrRkFhPn7k2/Kt+stOnwyIB+h6m+GkmpCenZ+9/8uDB0cnR2dli2bardmd7cvXK/vUrB68+f2Nve4sVus61jVNBgwakQ8e1QeyW3bIZIb363JXdne2T0+kPP7jbgVl2eufe452tO3tbOwdbNSkrxlGrUPqxSsoHFkQfM+hHocH7EAgGp5Hggyziq3RhSIPOIkwUvbPEuz8g2fVzSSIHPFfuiYVYzftMCH/qEiVCVPCt35CJ3k8lKwAgh2SbPvR80NDXQVrdxZGD596+Zx3iN1jjjXc2FJsKCigSFFkUfg1tmvZn739w59MHC4eMJUKhaBVQwSlLuNJJLQjAIixOmQAMkYnzg0TkR7W8N4nnywn8+6eIZICMAiohEj14cvRv//m/dApkjTHk7XqvXbt89crlG9euGoNN01za39kaj+u6KgtbloWxpjS2LGgyrifjGsknwQMSIpnBHLP4weRkV4lp5jyd2oJlqGDgDjytg3HRUdCexw9PDQhInzEYwukpiMrDwXFoDwoIgIaMMSYN/uWQui9bIS3qQ1eY5QJ791gxxbRtjOwmCAAaskVMzY5cjg7J5WTQACFVG1iIyBhCY1W4aVpRNWTR+7ioIIif1Ef21rgg4p94DEJ9lZCcFWxiREEMokWrPislejgikAA2rVsu2+nZfLlstnd3QGk+X7aNK8ggsroWyQIYRBBAJzJbusY5qGgo4tX1hLS1ccio0toIM3kmeQFpODGaC6VIt0hGaL+poYhfpoZvEBFFI4tN3/ZAPGrfREwCLmZmx6BCCJW147Ksy9KSAegwmkul8DSnsGzdqmtZJBn7GkOiQn26KXAkjxHReH4ZgjUSIob8F5FEVp5nh8/JovFpDO9npt1C7x64QRz3HccLF7EL+9DD88wa5RQk6yhE3hsx2RwCSrASQurL4ZgMoMFyGAC9phgDy5G+rw644GSdiP1GkG6VQRxdEO1G1iB5PQTDb296L4loJkRCNBTiEljEiKoiUT0e4RGJDNo9qgLetRJ6nkZ73S7oUwZgIZEtOFQMoI+73xh8EVXm5WI5m80KG0IFtO8EDSvyPpbH+2Ft1MkwECufZ4UVMkH81Wh9Pi2V7vxiQbEDQT1fNZiaS8NXISkEOUxG+PYIGUIir8BlFvX2LDH6rSjKsnYNNyzcdV1rLSIaGjzR8KwUtc/1Sik80IiJCMYLe5lACAKnp6ePHx+WZXn9+s2trYkIp+FEEem6rus6IlLf5kVAQyJsDBlDqSG3Ln8+7+bR07AAhIQnh4d37tx9770Pj07O5otmuWSECrydlGMgtYbKolJVYwtjbF3W3apJgV0g6k++8+lsazwpixKjad5aFJqq6zoULatya2dHRBxzYSheZ4LAIwMpGKS2a85OTgSg3hqLqI+a9800iAkKGg0iva8VkVGQs9OTrllt72wJez/nfkK1j4+Jd5ICEOKVK1cOLh08evjk3fff+7M//7P9vb2XXrr9/Au39vf20FJRFHEVZNd288V8uVou5w0Afu21r/mYO2b2bDIhEhlMv1Rip4P/jxgywDKfzqZns62d7a3JFnrnKB92Ahsk/lMLN182+H1MRBwLINqiYJE7H93dvXLp2o3r1pSK6hzP5/MH9x50nXvj9Tdu3ripBh24tE0M9E9IZIhMEpZdoNxPpk/xSKMIzE5VrS2stZ9n3caQrOBl5tG/j8Jg5XyxbLuVHw/1nU+/xz2lu4I6lEXhZssmKXIISUFZJLVtVNUWhTW2ruu9S/urVdM2DRGRMUVhq6oSFhYhIt/7TAnGmNJrP2t96/+ad7NMEGf8ojvTwWZdEFARidD3QElRFMia0aioazIWe9O/vrjwbMtATByH8lkEARCYeTY9/fSTD4u6QlOgKct6srt7UIwqVSMsLNCxtsyrznHXrTr4+PGjB0dnh8ez1bJThq7tmqZl7oK1LCGhFuC2S3Mwrl+8doBR1TOMENKBYR8kwRGiMANoUZS2sNy4weFgGEJCg8M+nH/VAw3pBQKfDT3IU8ac+xlZCpE4iVkPLkK9sZeGaBVPIAKgEs2d+/jeox+/f/dnH92fLprGaesEWM2T0/c/vrezNXr42u2vv/rSS88/L8aiIRbpOi4soSA6NiggDsDYwj5/eefv/9ffPGuWnzw8mq3a49nqnQ/u7U52/+6vfG1krB9m8Xabg7lbQgRjUFTSgZP8/QCqwhjUXRD/BVTVhdE0wagxFWEM9ke9uHvNVt+3y1ERfHSA90ageIQh8ENVVsWf4Yg0CMDYBCsLBSVWYAbAEoEpXNhUn2MKwvOff/5gMSzLiaKv6ODtHtAZECPbB05rwc0tHBQSf61IgIUogzAAAxBg2SEens0bIQdWsAQsUMkXuUom3YOqCsIoDoW9zgsUwFgXrCYYGJUdgAQH78iDO+lL3XQ7TZfuvQ8OV13nU58A1Bqqyo/rqqpHlUEAZWOwsFRWZVkU41FdVeVkMt6ejG5cv3z58l5RYmnMzRvXb924Ya2xBo0RREEEdQ7JBsU3RqU0goIgGu2nuqlXCYJXgrO3ZI56azXG+AsaXTICa9e73wzyMw2R6dUo6s3Q/Omwc85YUs1RCF8mdliclzZ1nUSO67yPgQZbF4z1Z5D9GWttYdNjQogUDrUaxIaKiCauxANva2YkZhZlIcC6LOuiNqgqnYoDVULrvyq4FyP52JFg+heHIAQEVQIl6UNWKYg8PQ+Gxk7n89PZ/HQ2f3x44tRO591i3nWNoJL1Ui8MMhxFcEqLlWsapyObVJka+5HnvY/W3GLWh2DOe+pdyI0OP6wqQOsVDqwZ+3ozkETUxqV4TXAqwa85mZ73vyfGbYOELIIlMQiVtVVZmEaCnbPXfKKqogo6ltl80XSTSVX7MWAQRFUl/+0AyQCacH0Alk3HzKBijCnKEkMTK9oSXOQvfL4tMUxdCXXdU9rGSVI8SEpIX3rx94QNQdAFoRCbpVh0MQx6reD/Hmwqgr1vMC1FktTMDLK1nlpFJKMqpCDoY2t9VS8DUtM7/F5YEGLPe+tGhdqz+hiNEREEhEMvXUMybvAURhjYM0t4OFUADFnXtcIuXHYZWEAMeIWQbNv/aMUNr5MkNb7g0mpMcUfx2b2gCsAis/l8PBqRMZ7HDw3aNQ+2tVsIN91aotVo79a13oeglM2bK+mMwW2VBs02eGEK9rdoEE2yJmUWUTAgAA5IDAKSoaIsHHOKUA05E8bUo7pxTdOsOtfZ1hhCtMaXMPS/zytI3vchJuTpnwYC+uTw8Ic//MFksm1t4c95PnTUWmL2vT3H7E2NNJ4DBUCMwTiwr8MycOAEi/0jLmFCcrlsf/DDH7337vuPHh/OF42oIqGhsm1aFkQiRQVhkTCc8ujhg3ffe6+qy92tLRZulivgDoGMKUioabpm1Y7qMRgvxUEzOKf47c2fO6rRaLVazebz3WIXgViEEI1XRImQYkX2ZLFYLhc7e3uT8agVf8xPfhU+QBqGK4cXWlRl4br2ZLm4eu0qFmaDa928/ogmGAqDKeyN525cuX7162+88eknnzx88kiJW9cYYxw7a4xz7Lv1RFSW5aUrl6qyqutRUVi/SgNqiCxBiT4JEN3dfXg9AGhpTbNYLhZzsubylSte/JHeH+31Js9iHtPqGoyXEDrHSlSW1bXrN+fz5YP7j5pVW5QlALiOmWU0Hv/6N//OZLwlqswSOy6qkfHEtV7GuZ842OWDYXCKcVXt2k5FfWahXLCrAAztjhAxxAAmB/1EdmBRFm46bbsuTPtATD0fXBFvDx3pae0vyJr2Jn12OHNq7w+mokJAZA3447OSQTOxdrI1SQcSFlHC1nWFteGqxHNdz5CHRHbQ4aTRReuY5n0tE8QZv3CKGAY+nsPjhaL4Bc2PdaehP0xyCkQdJHmnKl21/2aq3DWr0xNHxnQAp9OVE9zaPbhy7eqVG1eJDDO4tu3atlmtQLjt5OOPP3nv7qeHxzM/Pugcd45VHIKKChokEJLuYFLbK5foxhUkRYa+hBzY8vcrng/NRHXOMTtVa/rEBkhJwBvk4DNKrQvlomnU5Bny4fW23dpBJNGGQ39U7ykZIt99zYvYMt97fPT2B3c+/PThk9N5wypKzgmySsOAOl+2SHdXrdvZ3XeADOBEWLWmYlTXqICiwThQGBGfv3bwK6+/vGqa5YNV07qT6fK9j+699Ny1F67uhlg4ItAo3w2Lex/c4sk9Y9AafybzgqNQ26IPfPfbjAiLeE4T/BGtL48wjpbgkNz3pzOfKEaExhILhIwHr81BcqqrlhUYyHc+obRkQQkMIAqIQIiSMdF4JKnkEhUdLJXXW6nnzx5p4ja978PCXIcWcUMHhJ727pUEIIBowMvTPCnqpX9gBAoBA2r8KURRJTg7a1TjCkgw7Ah1b7SjdF3XgRSlP1d4WQj2dryB5/KD1wpRSixaKFoNxbI6QWm0ad3ZnKNnAxOCNWSQrDXGmrIqK2t2d8eTrcKQFoV5/ZVXXr79kjVUWNjfG1++vHPl8j76DATxhHTIpBd2gYAb9mFCLEhiSSiU1ZGRT4NRA78t8FFgAw7JH+bSOxU6RlGZjKrqXCdSAAhlQ8cvD0Gs7Ng5J8IAlObBB9JLfzyPj2NigUIIB5Eh76OXPAl7GjmOM6D6HoOPYqWBwbqEbhkhGsSoaAxp4dHLAHtXbhAFAs9aoWjgjgk1sHgYGymYouyo6+RsujidLuerTo5OTk6nXccahIxpdiI8aaDQdc45Vi283hMHOujY6Ep7N2pyPVXdoDvPJaptGP0PjSHiqhj5u6ERU3hNA6UtM6dvhYhpQDI9sArJdzMYFiT3YCISVQIRVQQ1BFVZlLYgbFn7uXzPi6tC08nxbHm66gSwbRpDuLs1qqwpwhhDHEICVDLTxerew0fT6QwJ67K6crB/aX+78Knxyv3G7Wd7IrNwgWppfTsYjp0Oifi0h/T6WoTgoyF6YbN5k5JOs8PrZepaZzsNxw4KNgjOJ6HxloTCkvRcoYFK4Z6McbBAQoiKQa1GoVuMifhVH8Hka8phRpaq6Y9AOOT9Y7tWwYcWeE6YkACNIYrCcH8PUNy4I6/tmaDgdYGW0Cbfb9WBJVh8/sMioWsXA85n0PcFrQ6s8zXd1EE4HcgHVRE+PT3d29sjMiFkFUh6T6vo7gwbgUJhoxqYdPXC/P6dGnRh+ocl48vK+n6OMQ7s3XLTfbXWu4o5kEgpzg2QTAjsFRVgUNWiAEPWO3FZY1S0S2dbVQSwxtZV5bjjrnPOdR0ZQmsLYUk1wTMKpfPc2YX/GjxhYnNPz+1BnrNGgFFV7+3tIxIRpesgIs7p+rqqQYEwPNv333DY6tNksO+9/HzCGaI5Pjp7/8O777zzswcPDlX48pW9g8tX9vYOnjw5ffvt98JgWzQ285vOkydP/uIv/nJ6dvaNr3/9ypWDwhZAFM+rVJhCnKoAYUhQT576ae/wqSRFWTjnlsvlqllVdR1i8wAMxIkKx6vFwlq7u7sLiERGfboIBmowRnQkp/VQARVFUZfVwvFqtRwX22E5Q0TC6C6UBjXReyUHaa8qERZFcXBwUBTFpYNLxiIAtF3LjtWKpw6sLcqyqKqqLCpjrLcEEeF4dI+ReV7hE6jUWCQgWGulc6fHJ6vlcu/KVSITunCQfIcx7WXDu2vY1Q6bmiQlihAaa9Hf6OPt7eeef342myL69jkZY4vCjOq6KEsgDBHnmEwlfKHvz3m99dizhoG8EifN5ai2XYeERMGtL2X6pRi6tSGkfrMZxDtE22ZbFM45dpymtQhog/YVkKGpF1I8LvZ54c94QnXYuE1d2/OO/YM++cWP+eeZhPjMHndGJogz/guRw96yCMFPuPUPeuL/gr0boCqDKn7mUHboDIY91qiIdt2yEdCW9e5H9z/8+PHxtLtx69rf/z/+t9evXC2smc2mi8WiaRZVYcW546PDe5/ePzpbEpU++USCbEdVRRAIFdqFcZODyRjJAHKMJ+tpsD4HPXgygrUWQDrn2q4ry4KIrLGinI75zzjTDKPeB+brg/VXhJmNTyPFz2Wgs1Fan2ecfc0jcShJQdGConGiD5+cfP/HP/3ph58ez9slB6d6aw1L17QsSPNGFh89eXI6L8bbz918DqpKrXGNI2O3t3eJjM+JVQUVVpW9cf2bv/xqu5ozdx89OJk15r2PH9x67+ODna2CAMRXhyREIJ3GaSCIE78GyaKxxtjCQKjo/Ix/GMNUBQQCJVUQFmWmsLN7sXrKo1tPK9Koc439V/X9TSIFywqd09lidTqdzRbNbLlyCkFBDLpVl9vjandrPKnL0hokRW+EiWvHwZ7Kjxa6g5yZc1aAaxuYbgrn46gerh09YSgASqdA1ZjuDoRoVdhzRZ3obOWWDALWH/9Igr0iB7NJin1wVY2KZx+2rKIsCNA5Z7UzKLYorZZI1oAJbnKgCGqMKoAKA6rX9lpjjKmtQfFzW+F1+yOipN4PgKILxTuAIrGqmAdniB2AM4g/ffdwb+enKKzcvPH6c//Vb775W791ta79XRE67UGQGWwlUnqHn1GmIcnRBx16X0dm8N37FHCNSRScHqI4fK2DdK7Yj/e3IYB0bSN1RZTVw18eiIhrnetYJGS0DAbYNQZYIoBSX19QaCt4MquwaEhDXqKXVpIihkEEr58UADV+4/QrqL87GZS9DXCs0IPFC5EgauhSKYVYdIhtNkkqSFJjbImmY4SGHUCBPnXch3yoAJATuv/o5ON7T65dvXp8Mn306BG7zsTlRlT9ULBRNKok0iwXzaoFGCMQ+B6vrwoQYzAXivRcJQ44zaeJYTcqsaFncXScV0BVEWUg31n0NjcYFJZBlQbg44O8B5HnD33FFPtBOsjw9gywEopBMIhiiEX9LDGDqoo1NB5Vk1Flp4tV68AY7J99BJWm5cfTdnS4Wi2PTo4Pdyflq8/feP7KbmmsISBEUFEgY2jR6UePT//yJ3eOTqaFLRD4ledvfvOXX7uyO/EprAAy8OUYJDUNysWhFHrI18jAigN1k+2VDZWx6jBUd2hItSEpXSM51sydEQaCZBWNI7Eovm2KKizg4xAVTCSaJdj8sL/3AKzftgg4PkCECkocOx6+xxB9sGMB6Rf74FWPIKpGegsSpUHqX8+IgWecfPPG37kUIobDwcGuRT4hULr66iMOoKDx9jYaVFT182eAEBOcgsIO4wKgklpFvpnSN2Zik0ISYdtzckZUAcSfUVXY8x+ubRez2UsvvFQUJRqT3GwkWigNqC4aNBE0EFK9Mg5Ty1kUQVhS9FSMVgxhThCH6DK+bGXasxzP1qxPo2uab5L4ziQF1WdyrUWDZIiITGGtAjjnRETZe/EpoqASIVljVUBEQZjDDoiEUNU1qyx1zsxd1xXWABSEYQgBdE3SflEg57OUNxjbI4rrjZJ1jjj9YW9/7803f8U52d3Ztdb6oDpQcC4493sHgLSsxi2OREI7DMCnBVxgLOMbX8JKVMwXix/96Cc//NGPj47PtrZ2bt9+/rXXX7l6/fpksvNX3//rt995D5CD9QFI6mwul6ufvfPupx9/8u5P3/1bv/xLL75w6+bVy9ZYP2xU2lJYQMCgUVSINbiuOxaqqrG2GlWsvFwunbAtS+tNkckYIAP65OHD5Wyxf3Cws7PTMfv0Eb8lk/YTKYnG81ysihpjt8Zb3LnFdDHe2jYUL2Ekh/3vFcTnFBp+/p/YCQBYYy9fOtjf23Wua7um6zpVtdZaa40xxptwUazmgqEX4UYYmYZKfSAuAyKqbfng/ieHD56M93YvXb6siBJTRuKLQFgjUjdSGWNcCiAZAvAyFUQAY4AQFNSU5cHVqzu7O23bevc9MoaMMWQZqRUhY32iSVBCYZIPJ63XZvLrWoEfdwwiBPCWY9o0TVVWVVVRTxCT330g5nX3hHJsh6zRLKGEwsl44jrXNA0oGN+PRIwjpTDsICZr7/BTomwGz33vjZN1NMaIejtMD2ucSwMFXz1TzIuIEqp4jbAfTwsNalTUAf8cf7qXXmRkgjjjF3/0iPN92IfERgVHSAXTcNA/1x/DPvBtEDCCCmFvDxao3uWYFQtLhTGr5eqDD+8/fPLkhZdetAA7W+P57Gy5WKhySbUyIyCRMWjIGN/3omDQ6tlsRVRFC0jeXVWCo+RAmQN6frXrTxXS80iRqjuntfncvf2NP1+oRP7P+IbaL6w+KU4ABJQUsXV87/Hx3XuPzxZtx4CAVVVORuNRNVrO5od6Nm9ZFBunh2fNX//0Q1ttVZOtoq5l0ahBUxaqoP6NUj9mJdI1BzujV1+4cXhy+uDJacc8X8HH9x4fvXp7b2JLIumcIqpSv8tE9jRllROCQTi3lSXWAQbqJe/m2G9YwxZltLZOt1w0OUQUAAECLBon82V7NlvePzy69+jw9Gy+WLWsoGQASYXHVXF5f+fqwe7lve0rezujylQUyQZdF3P19bwOcxwSEzIc9Bmww7Cuv1tL+7nwSVu/MVJtLwDGD/A5gXnrnhydzuaNAkViREBUwfPDGHXZDCKeZ41qES9rFN++YBZhB4aUChPfGe1/DT9KHFLvANkPCfRvFQ3SlCVeqzB5JDAIowIANapgVVlUHx4uHj6ac9d2qwWq3L592zFROdZmhRTaz4AI4oIuPt4ACBsrTEoT042cOozeAVEkQGstL4jMssKg8ZNOJeqPdS7QUtlg4stFEDsW0Y1Nqr83YtsyFtGbh1MiY6wlIuytbwcVR7yphn0fHzmSPB9VUdQHfAEpIJpwjAaFYCCXUvECUYxryx8JomPp/JgLxpIEPDUEoOb0bHF4fLZq2sVsulwuCLUuTSvYCXsnX1I1AopkCVEcd10S40ctaJq3TWzwWjnz+Xe9NYISBorGQWxdP2A4cBkekM4UjG6SwgXXutRJ1hy+sWfqDRogchKmKRCR0FpTl8WoKgpL2vR6Xg1EiarCdNk9PFkcHR8fHz452K52tybXL21HX12R0Kg0s6Z9eDy7dzibLVpjdTmbIhZfe/H5y7tbSAQsAHS+3b7pFztce9ZWtl7De97xcig6Hipe4RxP9OzjysX/iuB9lL2R4fA9D0EHYf9GCSctYBHxo9RAA8kQr3/T5IoZHhAMU0cCw0YN4qDqHf5kWHuBvu9HkhzDIIa5xZ+ma1QCBCvklOKLsQtSj0dhLMATYMOUxcG7pL1BdxxWwqFRMAKs6bKTpiuG9QqoACqIoKGubWezaVmWo/HYWCue85Ug3TrXM7ggt137xgPoIBpB9JzFKyY1B4LmzewrUbQ9o7jAZCnRq4oHUspQtPl0N2OM9SfxrnOqQkigICyBtEIiIkMkXnsZyFq0xlRV6bqulSaO7MQ2Z/DB+wwFET41pyraysRBzPOr58ZKWpTlaDR2ToqiiDmWwVqOiAbewbCuMaWB9+oz5kT9Y0WqcHJ89sknn06n862t7VdeeeGNN15/4cUX6vE4JFj7Xm80MkhDEFvbW+Px9ny++PGPf7pcrFaL+U5dH+zvUzBKQGFWVQpx2mk2ot8CMAy/grG2Ho0W83nTNCzCRVEWhbHghOez+eOHj2xRbm/v+EwXpZ7QW5u2g2hTGDI5gABLW1iyq+WSRQsNV17Eh/t4XzaKe+ywRA3jQcLspVmGTF3WZVECgDGmsAXSIKYbY3u6bxtu7H/oh1RDIa9AgOz48PFh17R7u3tVWTXO9Va/6xbb+EyCONKgg4h69KZeAADGUFmPbFmCLzXJAKEqMIj4IPRY1yUnxJ+vnIch4SDOua5rR6NRWZZEJOlkCbjmbjR4dC80pRJWa+2orhGgbVrnXFmW7DgMil5gkhSZYsWLOjdPk/SuPSO9nke199bQVDgO+p19RuI6QdwTzXQBH51d/zJBnPE3qT2d5Ju6VpUAgmN1rCJh/HRgdXfxaogA0e0h7kJe+gEKUJC5duXyi7P24eHJp48WP/zhT0aWbl29pNI1zUrFFeq6DlDBICGgJUJDfp/yzhV+XkaFAYyqUSVRJDAQ0sg1TmB4Uk37kh7Ux7ngcCuKCemfaSWxJv8RufC1+7GsC7/8wh8xFAGdDymOvpl9GSmiBMiKs1X3wcePHp8sO7WqYo1e29/92su3X3rhhcPD43d++sF7d+6fzBYtlq3jD+4+nOwc3Lx+czQ5k+OpEglK49rahD1EAJS1bVejrdHLz12bLhbvfXT/3pO5WvPxwyd37j185bkrB1sVS6OInOY9RYWG7cHA3McqGZPbAoQUFxCVznXOMSIVZQnAyXSyTxFXIBhk0vr3jihW36holOyq1XsPjz++9+jjB48+uv/4eLZatq1jVQYFUiJhMYb2tiZ726MrB9vfeOX5565fvnZpbL23gv8NRZ72rg9DnIbv+JoTC5wTSoThnUH7HTZlrbDRq/CxwYACJIqzJX/6+ORHb79/eHQqaiFszD5QLQ01CwB6zRymH6KAAipcRAcNUXXOEZJBQQ3hBhrjq1mD/5eJvy0hALAXOQIhell3mDDAOCeeps9x0Ab2ohSjyioCYBER1doKzpb88Gj6+Hheb+0AlGE4P7EI3jMFJOrMcK00TgLiwdEmvhGIQdS+8aYBGdWhlSP6uWaTVo4UOeyc89FYmA8jXxawcMednuvS9S6fQerZn5VjClpkhQyZoiBjIBq2qfh5GF/poCIKSz8dLoAGABENWWusNaJOBETAP6E2DPEN61DVQbCVRg9TFT8AIK5zzjlhERUC8RIcJMPivE/OfNGcnM5Pp9P52QmI26rLSW13d8yy7TrmrnXAAiLAakjH4wLYuY6tCU6zF5oVxHjXoRPOhdXyJiO/9nFN8+86CGzZDJ1Lu6Sn/Lydn5e2iigi+JccF9VEEKuEorU3n0BEY6xFUmQRLQ2Ma5yMy3FVnC4aUUGkobJXAI9Pp53TRbNctExni4dPjl9/4YZfUUVRwXvG0tl0dnh8ulg5Buucni26j+89efjk+Lmr+0VlBDq84EIFYjRFnl5U6Sg8i5PwN8Pw+vhLRBceHrydev8JcQ5mQ/q9ZpEfb+WkYIdQ/lLv7wQgYVoFBJGDOxMNzBDi6E/4ptZ/hQYBvZBGsrZX9KZmC/We8Ikw2gwXCjaXRMGBOqqG/V3qXcziN+0jbRH8iO7gSTPWBGkjAQGFIAMdRi/FU2J/lukdw/ro4A1qPmmKxW+n7PXtCGgNPT49uXv37vVr17d2dlrHrN7dis6rzOJS8BSV6LBHvabchw0hfx+cm3ezL1FtlnIy1guEZ7S1NR6s1uwU+q+lGAwcln0yPq+NyNvBq6qwD3oxZMgoMYe6hjlMmxJiWRRcleJc13Wr1aosisJaRMXP0WD8DPYYgtVPf0vrU8lbImKW47Pjo6PjWzdvTba2fEKzfyF+DRFhEQ6kZ3RjGzoBrv9q3o6G4vFAichaOj45+/STe8fHp5cv77/88su/9MvfuHSwDwhtt2KBrmv90MKgSAAAcE4uX7n2937zN05Pzv7dn/67d9794PDJ44rom2/+2rUrV5XFmqJrOnbiR2LiEEPfTksH/I6FCMqyNEjT+Xw+nyNiYW1tC3D83tvvjmz58qvXt7e2Vp0LtOywkN9oIMRl2VpLgIUtUGE+nbmuM4VFxuBmq+rvkKF/ybpz+6C56CtWIkMmhjfAwOykb3T6nIF19j/cj6rB89oLkQzg44cPj48O93f2Lu3th8QCBEgbIg4bq7hBEG+sqKgUO82SGtaYunTk/bkRAJXQ+zkSWj9B4wNGKeiVaZiq+pns8JqbJIKILBeLxWKxs7vtuxp+PMybMGMUKWkkpfGcOrmv+gBVta7rqqratl0sluPRWFWZZf3a6vDQBQDMfCGN/syu0wUMRtq/hmZa/bwTbnyHi68PEQ1JlWc4j2dkgjjjFwC/QaUesdesgip0rXadOKcKomLiqXljPTknpEXwdbVKmHWIq8XWaHTt8qUb16/ef3zn3r37D29c2amLnYktsANS7VbSojpHCsZQOvqHgy+FLDQBATTqXSaR0KCyekmLP7YHaWrQfJAXNqdlK86GaJrKHaZpPz1ZLizNfi2jvsUNw6L3Qvb8PMt8vrN3IePct9cM+rGXecPHZ8snJ1MWKwLOtTf3916/fevXfunVG1cur25cuX5przBvvfPBRw+OZ2AtA92/fziqdp2SrcaCOJ0vzuazcTH2bpegqISq2rbtqLbP3Ti4ffPg8ZNTEFksu4/vPb60vbU1rtBYFGHmQID6xEAcTtIKSHAAIEROh5DeQhHZib+DjPHem6rgaT0YNpP9PJMCikYfLV9bIWFRCdj3P/7wr/76Z58+ODw8mS6cMpQKJWswD1VBpIqFTpcyXU0fH09PT2cv3jr4u7/y2vWD7cpaVE5cow7edH/BBzO8fZV20Zulw4PRegqWek7X15UbWUZrt0SQBYmiPZ21Dw5P37t7/9P7h05N79cJIuKEHQSixEupGdR7XxKDUe5Q2CLU1ppgW4aOgYwUfjIVh79xSCwhn5IlJKrctaAczGa8M3Jwe4gTv4HrjzJjz2QgKCoLF0UBgIx+frkgFDT18Xz50w8+/vP/+MNfXS6Ru6ow29s721tb9aiyRSliAETVQXDXDgnGgbFAIfAiNkqxIf1FXlcbe70DUXIAl+hwghvdHFUgIGutnybbODxnfLF3MVEWhr7+3VxyUx5XKmQ1xVP6gU1ri6KwxnoaGHyOIqTww0ibaYgWTfwoYkhE9CMUioBkUFzcMEWjGjJY7Q0HcQeHZ2H2zHJhjMYZD2PIWOrEiDgF6Bwfn549ePDYyMog721X1tZqSkASBXYsLqTPE6E1Krw6OTnamozrusBwFg92q6k2iIQsxEbUU6v3NcJ9nblYc9TpO68X76frCXjkPZpSlmxfzwx2Z+jHZH1MmQ+6Cd7RviomIINICAUB+8Zq0oEpIOBssXKiosICrdPFslUgJBPc9TEIiBbLZjpbtM4xms5x43i+bKaL1bLtxpX5/GvGeRI5MKB4ganUYLHdTAgEGEy9PGVu6fwmlRjktV+AUBXEOWsLSwWLLlaLEAbr0+S9A0OQ5AYHKYg1f1QYIyCRmlBsK4EKCIMAomXXga/zkVSEQicRaK1mTO6QISJisI32E17rrDFF6V+4lERR7h/blRLpIa/WNWQ8uRsGuL2t8+AOHo4BYew7xGNhP7xPfWQwpNQBb/sCIATgf7OyMNy2y8WiabrJ9rbn2f1/o1e1DN+Kp20/Tz8WpqbLzycnz/giS3j6uTb8nE0AfCrFQ6FDg777ZFSLojBkOue6tgVEEPYrIUVEijBOYAKAQlGWZdex67qua7vWz+9fOEG3yW5v5JBu/J4YyrfkfvsMHtw/jE3TPHr48ODSwXgyZmZhiTrNzlOcItK2raoWZWGt3Shan/qsQVhxBPD4+OTo+LgoiqtXr33jl7++u7ulIMJMwWrAu9exNyiA6NDqnXpv3bz5zV//5t7uzv/8//6fjg5P/92//1+7VfP3v/U7B3t7RVkuFgvnHCIapE4Eow1GutzCQoaMd4sGNYXd3t4uy7JpG9d2s/kcHF+7duWFm89NtnecCBqKvetzY78pszC69vqObFWVo1E9nc981mhvNQtoKCQ9QxyWiAMgYZJRMZVQ5Fe01NxN6zDipqr3onrXbzcCUYRCSCJy987dwhZXrlwpqqJVIWv8piahITjMrumJiUHPDHtSYu1Hk2KQzAOoiKAPPydM4d3BtQ4JDBhUQghHjIsb6Bd3cHuOWEQUyJCorJqVNbauR4jkXCcA3oYIEZR6J6O1dV83e6iD7j6NRiPneLlcIB7EzRQGLHa/O3gbzPQG/TyDzri+e6fHJwwkDTz+IeTcPZ0dvpA7ysgEccbfpKOHqIiiKKGCcniqe5tWx8sVN610DlRgINiAQQjdMA89dB0hRpSp+q6oIHlbyMLS7lZ98+r+O/Xd0+Oze/ceXN4Z7Y4OSlREUWESIhFSNUnrEcwv/CQqsRAZBPEcMQISECirD+HG6HoXbH00kGAUs3FFxLnOuc45Pn+COVezra2tUTClAMD+ZZ47agwdsuCicbDz6/Lwr17mvM4px+MhqhDNlvNHhyeHJ4tObNe50tg3Xrn9jdu3ru/UsDye2PqVW/v4669vTehP//LHx7OF2vLkdPrh3U+cqKHSMT85Ovn0/oNLkxfqumK/4xOBqCijyuXd7W+8evujTx49OFwwmY/vP9nf3RqPymt7Y4XGoIiKIEjYPcOciy+WANDbTnUyCHzp6xpUUBZhkQGHjzEJrrfeH1wZjPEsCISCZjFb3fn00V/81Y/e++TxYsmNA1Ei0lFpx1VhUP2Q+azp5g2vxKChTvDjx0eHx0+Wi9mv/dJrrz53ZVwSAca+5VDpdOG+1YfmrRexa0H2A5ZK4oclufdu3FqDRDs/7AOPj4/evfvw/pOzRycLAYtIyuz1xcICLN7+gsAny/kqnRggisyUAEZlMRnXCKCCosYhGCgYVSgwKRrOagSIKgiABAbRGlsgkLHGOKBgWRacQwV81la6CUOqgqr65ANDagnQOVU0iIqkwEoEWDTi3r/z8GT6v/zJv/1zgzIZFTevX7114+qtm9cOLu+/8MKtUV1aa9Qz+2H8XhF93HxvgJMYE2/z/Rm0lYZUu7ZpV6ulDxCz1LtwEmFZlk2zctywFCbX1V+iDc0/UarBt3uwwFLycogDg6DJEzToiqkoKmsLJKN+Zta3Er2hMKKkyoi8Tp18LJkKgGhVFNuTkaHlcjWfTqf1Tl15/2BPUSJRH+vpvyfHGtKPTQTjflBBUEOEXpTpnYsNWWvFiSIp4rxpHh0ebVc4Ho1qWxTWIhlDZKwRVmUVVQo7pnar1ePHS+FLxuwV5Wcf2FQviES7kA4eCItwmATYU++9IrmXQnrSfL1pGtZbZmbmoigiB5e+g/ajnRjcpsL7piIsGrdmQiwMjQpjvbdyb7GHAMDi2o4FWm8G0jg+mc1XrRMfma4CiCBKiMummy9Xbcdkrb8XVl236lhiEiCBwrk0Ahzo+waXcS14NpXW6bilvZOSt8qUpxJF62L0oSJbn5ntMuyCg5KP4rl06dL2znbbth/cvdN2LQGxoBIQGF/tqyqzilNhBVG0vomnCAbAqC5Vu5heocG9GBEEyFi/D/o7Ic2oDbyZfLoFhC8CZIwpq2HDXRfJArACs4rVAQ+F3s/S/3hC1DBt06vXidA5NizedVmDOjj0RmIUAOhgDBtiTG5yyg52aSn+axDM7GOGyOvLVIyx9z/5dLlY7V+6tH9w4HzYVrrHPTGRtn4wgM+iqC48NPZ+swprk7+IcM5NMuOLCyIxxEEmMNCw+DGywIUhQR+bqAQmKAuoD2kAnyAD6slMJRRCJSBCBgBAEVFAsBYBxY/wh7w1JCJrLSJ0HSSnF1BGlLIwUhWds9J0XddWo1L8dLn3RhvGR0CfQ4nxNJ/ObmtRot4KDQGAvdJZ/G2P/egFKsd8ZVWF0pgbVy9f2tkZjUalQSEjvkOsyKIKwtw5B48fP+k6NxqP9/f3i6JUwbAMah9pkcKqw28JjIiKzKwnJyfT09moHl29enl/fxtRRDtFACxU0NqCCIVL1GH8paoCs2O32pqUf+ebv1qV+L/++V+8++4H//4/fd8x/s5v/zd2NJbp1BeiBknJcgxd64fdepvyoPQgoqKwYx2LY+ecitRFaauyJZDQ2AvLvRn61yCQb1SB+m4WkCqyAJjS1JO6nFnhBqQMQSBrJW1grH1MSFp8EMEEn8BgdzzM/FBRfwtR8KjoDZRClqAKDaZIHYtzrjDGorFAVuD06OTJw8evvPTy3sGBE89TgG/fhTImuN2vGarAek5dKNjjzKHiwJQixpuq18sAxQU52IKhoiHEYH4fCXY934GRcxbB0Ds4AQAhkwKSIjpmx7KzuzeqJ6awHTOAAhogE8N6FEAH9RCRD2Pve8Y0MD8kRBiPJ7PZtOsaJFDHxgT3SBxEPA4J5cGmg0MHxeEfhgwGokHUjTDVsNIQXJRbsanLefYeR0TDEjsTx5kgzvib1aXe/Kuwdh23rXQORQk2nHz7gnwtoSuKdVKytLcI1GiiRiB1YS/v72yN68eHi8PDk8Pjk1vXd0pSEAEVDLnwGgXAGlyL9HwvCwVQEguHAyPH1IweZBwgEQiLqHOubTsW1nXlxbkCazjed65IEwEi7cmyTe3wxvEdBv6o0BPfcP7zQ3kzrA0ongsVV42bzparxjFYUd3e2nrh5tXL+9sFOXEtOK1N8dz1/WVz6/2P782X951q1/FstkDvMiu6arqT03nbidbROVg0HeXKwl472H/xxpWTkzud6uls/vj47OrB7uXdsUHyArTkS48ArKzKngxFRGusIQNy7jqG0tkTzMIiODxGBnGdH6gLX61xBtxnSSma2ar98JP7P37nvU8ePpkvWydExu6Ox5d2trYn9aXdSVWguK5pu8PT6YOj6ZPpshVxDMtGu9Z9+PGDUVVtj8prBzvjyqKKqFKqmjcVS4PerV6oYEhb3+As7D37Y6haqjBTPwYJN5LtvHz2yeHxR/cency7lgnRAMvOZCQATecWiwUZNEjgJOmfBFBAANCJoLBBLC1tj6pRUQ7G5JDD0PeArMfBBUevuyNEMtaO6tIwaKCGPalMIsJRKCnitVDh1OmLXwJB9RJ+362JPBeAKE4Xq/lq+SmwQa0L8/HHD/d3J9eu7F++cunNX/mlF28/d+v5G0VhQbq1hyXeDoAyJAt0g4zRC2QzyRirbZvlclkWJSVnuhB7hdZYQpKOuXOq2bjxS7eZadIo4cAorW9BRdYxsVah+2mKgmwBiCJKhghJ41rWL5G9oVxQIqsCqVZlsTUeWYLVqlmuVm5clgUqSCB//XY2GLkPoSwhDSwp5RWTxY70+6h3jgVAJRDFZedOposC692q8K7JBoFQDbAS9PEkwUuQu47btum6zhZmY9MJ/j+BYJWnHeM3vJL8F553ad/c0cKFTc3iSJINPBOGAxzUTxbj+ia5tjX70f5kG4sDb1lEqEo7qitDoMzaR+YG53tRYAHvjutUV41brloWHVwXFB/NFlRYxjvcioIT5fD+xBDDz3YBjn3Q9dJLFYhgmIGavtlnO28OjJ5T6aWxJZs+8tQSK064qGpVVfV4tH2yc3R8JALheiWhmfhot9Cl8CJ7ADg9PX7y5NH9+x81y4XxAkNCQ2AJUfG5m89dunrV2kJdB17Hq+luWF/kB0xnbO2v2wRHwax/CiQ2zHVoGJyGAYJRSbK99tw7ddJaZiuiaLxX2UYx+4zaNe3g0ufSRvfNMIeDCEiqqEqI7WJ5enrKqju7O2StAAiuGXF95k/8jN4Afp4h/owvxz7GqC36UFNPFoa0LfDxVIqEIMnTABFNCPZI1GuaR+jFnUQaBupDQ8WJGP9lRKRkVNmH3CGhIX96EmKfEKwhWgYUEWxhqsqKWFZmZiriGMpm+17P37RDK6LhvwmAYpy9i3LWDfYNo4MNKBKCNabe2Q7OGRisCH29F1QOqovFcrFYdB2Px1tFUQ42oPWgMV1zn/GPLzvnnFOA0Wi8t7tbFOS4AxHoZ1KNJ/LCmzUYkVcVYQaVqrJfe/Xl2XRxfDw9Ojr6wU/e3tnd+9orr5iigLhw+SVFBlQqrP1X4+8Z9LpKZKzx5r888Oo7v8rCoET2lsyxrlEFQItFXdTj2tcWlDbddQvd2FNbW71SIz6xrufdcgYEbprbSq+RhhxiyKYBtIDq5PGDR4Utdvf368m4g2hjfM67CZ/ZGEtOHYLaTzdt3pGoA4lxONREP2ja1GJfZN5y0brci+kEDIABBJHlctWs2p1Ll5CMsDonAupNtbQndHH9TUukh2yI9P1nj8dj5zpEcK4T8TKajeTXzaPK044HQ3+2oanReuiCwgX350a9rM+8Ns9CZoczQZzxN+UYkhZZiMF0CKLitO20dcAhf0A3nX10cy/qaTZNzm6h4+hjM1VIoSrMpd2d/d3tR0+WJ6dnh8cnq+ZGOS5UHar440uY7fWZKZR6V0GwFQNPvQJaQvkczO815pVgKpJThKggqgqzc65TkFhZDmqqzWabDhe4cw4D2kdprSW5+76lbNgO9N/t4gIw9euSbUMcFIEgZmPR5aqdzpcueAzhwd7e9csHO+MSpUFw4gRBd7eqF5+79uqLtx4+OTmasqh27AyAMQSAjmE6X7Wd+ksCoBKqGN9ypP3dndvP3frgzv3jlTRte3w2OzqbtXx5ZEiJgutDLHl9xLlEq8TCWmMIWaIwQJPTJ2GY3PE+Z35cJ81wxovu6/5ooSV+HpwUbafw8Hj69vt3337/7nzFAqYsi1E9fvHG1ZduXt3dGV3am9SlUXZN0x4enX1479G7Hz96MlsuGtexAtnHx7OfffjxlYO9sq6KsrSBgoT+VoELZqDO6+liKQuxwRAdisOJSzxzup4q33fO+xtHAVG9B/Dp2ezJ8XQl1lYTwBbV3bp+jVXOzqbSrEZ1aYm0ZRARYZ+c0Im2HBrjRWHGpd0e12VhBtQLqLDXPir41kt0mdTer1BVQbSwuD0uO0VVoxqythRQRNiP2ysws+schDRsUEX0p0lVVfRh7uGcqKLKCtqyY9e5piUCC3B0eGZJJ+NiZ2dydHj6G7/5t/evXNqtx36abI0iDk/yOneSzqHRQy8ZyG6+b4jOua7tvNnWsApBIEPGAknbybJTzgTxl3VfOz9eubau4/oxVgFKW1hbAJL0UWkIsD4QEfjm1LoMnzeqq52tiTXQLJvVqg0WFSBhdjIpJ/vpQF1nXyVsdwAGgnS5/yTp9bmiuGp5uljtjksYVb62N15lxRwidZQUQFgVhBBVtetc13UjrWNE+dpVGg6sPLtyGOxluL5Frn3OulP/WsMsWtdFq8zglYl+OGA42j+obYYtNew/lsZLkch7EIiWtpiMamtImk6RgCgszX54IrwNqIDM0HQ8X65ExJq+GxmnNUiRlAjICHrW2EeoEwB6/8LNGwxx81iFT6t2zhsURwZyYDq4XqQhXOBorwNaub9aG2qgQfGmqIKiALpYLNuum4x39g4uT5fLdtlIiAbyN6HvXEiUuiOAcS0eHZ18+OFPf/Ljv/7rH/94OZ+XprC2IERDWBgyhv77//53xnuXt8tKodPQmJdA5WsfGuXVaAh99ybOCw8AQZzmN1TZbBESDl0rksxwWMoTsQgzswjQBdGC51uMQ5pjLdHOUxgaHELCW0vhRaEqAp6enS3mi2pUb+/sKiZziaTt1Z+LHb7IbGT9XY+E0X8G6ZzxN54fbrVrwFvkeREj+Rs+coSe6NPwB0IyJJ75TGbBfrUiUD9NaYgIgQjIU8nB0FtJTfDnolA7YeD+EJGsGCZGdBhzzP1aZYjKsmTmpmn85AchqQoOkiQgDpOsdfEjF7z2ejF1b4M1rIbz5ODxDgfvGDgGqICu49WqGdVji1YGiyWhn4QgBBHRZtWCLtqmga3xmm03DNPwcLCqhx3GsUMEa+14PN7e3k5lmsY/pDQ8DIJuSduXip9n0q5r9/f33njj6w8fPvnhD3/08f0Hf/GXf7m3u7M9GfspNz9qomtUJ57zDx4ShwgAxhgJwxpC6driU9eTYFWQ8tyDPB1tWVSjkf8EwhBkB5ve9zjQDuNnuUasreQXnsKGY17+F7fGGiKjSEhN2zx59Hh3d293b9eWZeu6CwnEz0MmrimR1j848Kyj9TC/gQz5HA16wY8+53uMA55dVS1gYcg17eL0rFku67pGACfKwoJ90MJn7QVr1zOd2uq67roGEbuuTZzB8AtTkOKzr9jw2LC5A64NPcOF7HDaQAeuOD8fwtXOJVkmiDN+8RgMckOYWhBEABYQdl0jrkUVIoKBmV0/59hPveGw9ouySgJPNKkiqQ1zTmrR7GxNXnzh1kf3D6fL1YMnJ0en88noEmmML0Gf+yEx7syHBAU1FVIMUBFmcRxEp/44BAAifvwq6VVCsp6g+FOHiAor+wEVVukdKYMeOEwfy7lEnXVqGEU4Kp/MBkcVLepkGIYgIr5YotCsDCFICjpc9ClZcAlQCH9BFCyKYjprnjw5fPTkCQIbYGPoxpXLW3VBwOw6UGUniKod721vv/nG62enyz97611RURS0agsyiM6Z01nXOr+Qs2qLqKCkSiAEirvj7ddeeuGnP/1g+smRIzqdzR49OZ4vrlc7NQN5eRopBFMPUAEvNkVrqVCwZA04RmK/ocXQGAbpmJ0CIBkkUBYBE6wm+spO+/gmIFUURGM7sUfT+X/665++9c77TcNOoCrNc9cuv/ric7/62svPX71krAAyAlsFS9Y5+PrLL9y+e+8nH9774JPH9x4ft0rGlA8Pp//xh287RCpePpgUtheAh8FSr1ug2FTwsTuwVpQiIHixXzoqDzdM74KcxtSGrmz+eCaiwbzX2ymAsAjZQm2pjtQQy8qS/Df/1TeXi+UH738g8+NXXrppDclK2HEnrhNpRVarbrHqjk+nqrQ1GtWlHRlEZgQiEENqQFFBHIKot4gJj6qqgPjCw5JBUuaOgLdGpGQVLAuCD173k1+i4qtzlq7twBIgcBgAZ0BwnRPxThgszArK6j0xFP0SQQYQRaBldQzdmR6dnHz00feeHJ9dvX7w9TduT7YqIhNkjOEJIuilf4P9xhhF9NNiXsEloIQAFEgEAFJAJIOmwBii7AU4DBLmLIFKtPPpvFlI1TrKG8GXhRKOnoVDLhHV+zIMKhEBGea8p/qkrOqyrJEMqwIga2iNRLs9X9IQoXenAMHYAhMej+qDS3ulwdm0Wy47JGONYbdS9C4y/uemoT+/jgbhqkDaGpQQrTGFNeRUIBqneitydiIKAqvWTecrPtg1RQkgThSNlkgi4pwjAINF7Fj5lEto265t25ChlqYyAYchZgN7wQvUMEMiMjVBh/sdrClkw1+9KNh7R4gwotfK+NMCYRBfBk6zLMuYn75JfiVb93UtcejP+rfCGMPK1tK4LkpjCNSpRC8o1ShvUVE/NaFETetOTmdtxwWRiBIB+rEJnzTIgk78os0CjpEFAUk9H6hpDceLuonaGzXqBXzfRn9grWhen/FMpPk5Q+G1fw0TLNL75/YHj97WWUQYCdDJ8cmxQ7gGcOnq9ZXAJ3fupLY+qCAAgSA4f7pStF1j739y51/+P/7lv/+z//Cjn/z08KgpLVhEEu96qcxSlNXzLz7/8hu/ur1dADYCosIUNAMYaBAcBDmFgjKu9YMLEn2ahFW9NeTQgJUGAe/JikgVCAe5o6qWSEUdi3Hszx3+x13gjR0bhRJI3bV3gZAUFJUUdX1+mWOqLrq2fXj/gahsb2/v7+87YacAZKKvvqKoIuhGkR2fkfPP23nZPoQ2PyQn8Sy2+rKiWy1Xs1Mkg4jhnEyIlFooUQmK5EM7CEmMIUOISEBkyBjjHwcEIkAD1oAaAkPWEBD2vjSoShKMB5AozK4IA4BBosKCiLjW+YhQJAFVEUJTFTUouY7bpitsSYWh3qq/J37DHL8vAZMFLvYhkSk9VlQFgQEEfIYNxflGCtxw8DAmDQsszueLv/r+97/+9TeuXL5MiMYYY9BYg0SoqE4Nmd2tHdfwbD5r2obFKbAoi/LmWgQD8W/0W2THAFgUxWg0quu6cxwSL2JjK2aX6TlncFBlEfFBs03b7u3v/vZv/9b+7u6f/C9/8s57H2xPRn/3m397f3/XO2mwsD8qP6tiH8R1Jo64Xx/wM+i3/lXGvVtYWJVZyJi0Z/taWFPEq2oig72SPAXJDthDPMf/hqbDsxlkiMsukSmKgvz8jupiOW9c+/Lzr9TjESsrDt11FM/hP6NDNmSuz7t7X0Rwb7Kua9f2KQSxP6FYgTEVx8vZ4cPHhmhcj3wHwVhLBowxF8+qrr11KbWuP7OJiCoYa8gYEW5WbVlXzrnhlfeTwoOm9QUNxWdw/f+7tB6fnb20RkZjmjzLyARxxt+I2lr7uVwREBFm1zbKjBBshjbcdZ9ZqPd6P1DSEIDt9caCSAXB8zdv7O/dOT45Oz6Z3X98dPnS7sRaQERBgxScRhEVSVRFwqlfAUTZa5J9TI0IqxAyxGkVTIUlBYIvbiogIqKBzEQ4n5OQpL265ilx0RIZLoKIL/jl/PKKF6XNhG1ZtK8KNsenBm6F/YlFfNXYNM3p2ez0dOqVZFVprl45KAsj4gJ/7cWbwsaYqwf7f+sbr7/1zt2ZCx6OtjCEpA0tm65p2TGYcL5Ub8onPt0MaXdn+/XXX/7w4YlzOl8snxwdPz48mtTXkAyRLx59BS8UjkVKBIUxHaOxBoHDSxAFVEN+TptEgFkV0RgDwuG42DcrMARIJY0Yqh/eOp7N7nz64IO7n6xWrSoZ0F9549U3Xr390q3rl8YFwUode3aXFQFFGC7tjN78xqtXr9947qP7f/a//ej+w0NV7JQ+fXhc//TDsjC//sbXDFhvjKxDQRxq38xF2bgNki66HzmNZpm4EVTYN3Kj/pBQxBtIxW8LiGScA0aDhlCEoCuMGpXr1/ZPj+290laENy5vFwRGEBWcn1gD03ZyNlt9+oBWqxUCFkYLE/wcEYwfAwTxMetg+rvSkOc3VIO2xJPaoKCdiAiwiJfk+2IaC4ohQ2JGFQmAgnK4IAZAtS58NJAIO+ccO3ZqLF25fHkyGRuDs+m8czyfzefzRdO0woJYAtO77370f/8X/+Y3f+NXf+M3f/3W888by8ANiKpiFGCuQUSKojBIwUaANh6cvncV1wKlPpAjRAR74zNUOD05mU1nr35jvpvX/y/jhuZH+0M9ec5xLep5w6MsKEpIREVRWGvCKpAMEOOmpsG13A9EEIYDOltQQ1gWOKnp8ETO5l3biY4KQKM+UiWKDv0PFxVVRAUhxf7ILiBiDI2qclzV86bhYJkqKkxIhCSo4h0QWZwIogmmfIIuyJNNPFwHyk3Urzm+5YkaIq1RVWJNSYi9xUTayoZ7vUhvNjd43GiowxqauV9kIpHM3HVdqqOp+ZqcLqLwP3B1LD6vVAPPHBwPFFTEKccyyRusF8aM69H21uRs1bKQKGqITg3ZBF7nhQBERkUWqxWn1QQBEZq2Wy4Xjc+xZGYWIiqL6mw+f/zkycHkao0KQ09aANShuWJPpvvBmkErPlolaDAZXNsk1n2pdN2/KxVRiSY+zzinUKaNg0ekiQFQiURVgRQBZrM5PHxcTrafu/V817hmMXOrhttGhQ0hALASmpIFH95/8Ff/6Qf/z3/zP//5f/jBfLlUpSsHuyCIQhg6oQrYKXRUWECjSGJIBRTFO2gCEZxr+MVmMKaJpHXGAWISks9TophEGo9hEBjnyBp7v8sQcqtRfRw9i2DTWTE40aiG+Iq1gKNz6wlqGlLGZGEROj/KPJ8vrLU3r9/c2tsNMkgAFcE0roPY89AX5Qqel34PtfNhOEeH1iK6dlJdC37I+GKDwBlwBAKKKAjozeWj0vb/z96fNtmVJGeaoKqaneXuvjv2QOyRmcy1mFyqOCUyH0ZkWmRmWrp/2YjM75iPM9I9Ml3DqmqSxWIymclcImPBEoADcPjudz/nmKrOBzM759zrDkQkWdXJivYrSBIBONzvco6Z6auvPm8QfYJYXA+nGI98RQDw9gvyf4Qh5dqSScgmSMZji5CstZbIEJIx1hhCA6rs81zj/WasUYPKyiLqQTMM4CuB1JjcJvPFvDLWAhqLLYAEqJd8tcmEBrRwxSYYg2L965AILPQjDX7bkjb8BpqBBLRZdufug15voGgQkdBQtE37H5sm2c7Wbr+3MZ1Phht9X3nVEwpv17X86SAOq5AqEtpAYw/jQUrGl5NS64x19q0qOOaqcv4+ZVdtjAY/+tEPxFX//t//x88efdnvd4bDwc7OjjG+LgiGIX9YXYGMN0nt6zlswRvlTyk1fdp/h/Y4bD2WGl1cvtvkn7Tx8c6NIkqyukaJX+4wHqRBWsORCmCC3B+1fiLy7YrQk1tXJEPedg3u8Z+Lz4vjsirK8sE7D7b3dtEYp4KG6r2y3aJry6DfXMpci7BrqcPrrN5v3oHD9ZG15j8NYA4Ii2p6ck4sDx++m2VZqWyVQjoGxSNFDTxssbnXHdg1bQKADKlqlqXG0HJZLIpF3u2EN7ZucigYE2ICYH3G6YplEK/AIdYwJ+09a01U17aW8gbQiTbzeGFLXdOR8c1P7+ZxIxDfPP4Q4rAGz6PfoJirsiqXJTkGBPIN0Ov6TrVkvFbM1M1OBYrDoN7EKApsjN3fGd7e3VzOF7Pp4vD12YM7+72dAbtCWAmVEATAAPmFs6ZAqAIqke8zq7CwCtQB09iUaW1IT9waETUefOIoUMxEb61PcQIVEPAq+LQpaVoLpa/HaHUep32+rxmLvuUXCJPBLxkO9lgHeXtxS+onFl4KGVpW1XS+nM0LhQxUk8Rubg79wcL7s40x4PMGpUpIuh2bpWYpYoiQDAsAChDOF8uLyczJhrFGJRCE1XNrQRGp18k/fP+9v//t4/nhBTNPZ4sXr47u3tqz0QsTG6YUsJpExhgLYC0khgJhU6MpWFvus4iMlEZsbf6Hga2GdeSqApYIL46OPn/y5PR8imq1XL7//sO/+On3b21tdCxaqUBZnEMkRWIAVkFUQOnm6fv3d7c2B85Vf/fzXz9/eUIWRfTF4XE/Tx7cvv3OzhDUIaLPnalPqrXxq749Wv7xkIykUFf6sbAXid/Jfz2GBnxwUHg3tFEQ4RDp4FRRzcVsfjGZuqJMrN3oZenQclWqVgCVJTZUAi8yaxNEVBYUQLSZrTjtJegW2SU5V4kxaMkkhgwag0jB2qYKKN7IG26BqCEZ8ExqVQbEvJu99957lY/FEyiqarFYVJVjFleVzOJVYSICEQGJLBkFHwzlYygsVqhqYePW1p27t/74j398587tXjefzebTyezlq8ODl68Oj04vLsaLWXF+en55PvkPf/n3B18dvn559n/9v/139965ZdAACYrPhK5Le1RQZi7L0hBZIkRk0DVLBDTJQYAgfpguFE4+HRvQTyBSYk2eFewePX2yP53eCMTfLl34igCl9TQoxhCsGB3V1uNEOfQgMZhYseEJxjEDrSdsxSubhKDguCK0G/3u3Tt7p5OTYskshMaSNShgCOL0DQT7MShCTG6Jmo9PHLKIWWKzxIIuAFDEMQNT7U/CELRorSGDURSA2hlcp9VTmBBBUc9vUVEWRlRA09qp9ToU5EowEqyg5RCuAPf9JiXaCiVqwXYR/f6AMWxnTfxak8mwjryDMAMtqz8u/BgRPx8dZG6KU8dEYC1lWRqUWY0yuYf+EiiosACoBRDQ+WLJzKpWhImMAszni8vL8Xy+EBEQRjSJTVDd+dnZydmovLOZZX4YV0KTGNayVVfeSJ8Uv1a+XoUFxDb2NWczWM0kWDtmtA9g2vpX7ab1yi4FLCyopABclZeX4/zo+OF77338yXfVVWcnx8+ePJ7PJimhzVJRfvL88FdPXx3/P/9fP/+H3xwcnAoQ+fkMShDJGKPiN0QWnz9FhB4f76moaP0EUZAlJGY9+iNlRPrGfqnfphrChL9JVAUAXcWSSvCVKwooB509HqiiFB4OVAIaDf+hIRohHnUJj4h+7298hHjNShL4mKuMbJ8n6b/7sigvLs663d7m1rbJMg5Z9NROxsAQ6PdGT9baR9buB7QMBwLXV943j2/Vw5AmRmJbLjoS4rlbAUHYO9K1OauiIEJcacXfORF2R2FEkyJGzF/S1hhDZAxZaxMyFoyo9wz4gDFjE5MgErMw+yhwbAZ0EA1CJ0/EGeVKHJFJI8Q0GIKjNAWAPkJN6nsIAaUdYgeq6nwMNqESgYYpHQjTQVrD3QhQVYTI9Lrd7333O0jk+3k+VQOClp54hTtN0izvDEd9ssDqiMAYP+G2sq2sbItRvTTGikhZlZVzLGrIAqJ4Wwl6AdqSQS2hJgOGfmcwOqjH6zNXjisQt7E5+PO/+NP5fPbv/9PPfvfFozt37ty9d29rc9OBr8IgogVxdVvxk0fBR7pSbrcWtNYIlUIID/JvN/k46DpBiJA8HsNfLmWaigjW5a3PRQjQ9jiMhUqmCRyFtusTNFCQ/ddTU4TUzt+rYmsoA/3aGo4IhhQqdI65PxxSkgiCiEgAcH8N1ALeYO9F0GvV4dZXUPtv/Ud2rZq85gC7Zk+/gpBEgF7WOT06Pnl9nNrk9u3b7MEg7c8rMA+bsrgeUeU4qxSR3upJefXOnlCSpOliuZwvlxsIhkzdMK4TcWLLoUkKXLX0rcC3Q26QgqJq5Js1DKjQONGr4rL/5qKy5hlc27LCXoZaJ/+1/7Z9gLl53AjEN49/KQ+/OTjnyuWSmSkeTIlMU8NcNx2wFh8V6BCoAuRnjADFcyK82tNJk/u3t8/Pzw9PyrOL6dHZ5f7O0NTrKgaZ1hOkQEki8ZUQItIubtArqSbtghNWWVg+Qp2jLalVyIUtr0Y41cs7XjVNh31C69EojGl4K7tOE28i0q79PHMRAesIm1C71dOj7XnCpp+mAFhWbllWy4rF+A4npgkZAiMoYBRC/5kAQFi5Qq2M14vrwVEAtOZyOn/5+vijh/tZlqgo12Y6v8crA8LW5vD9dx+8PBlXrMvKHZ5cTBbF5igNp4z4VvjDgDUWAVjVkFpjY1iCN2qRhOC9ZivyW2M9Dl5X2EF7lRBPZqyhxJ6fz756+frp88OilJRodzT64+9+fGdz2DFKXJKyKtdMBH8A9RI7uCUIj/LkRx8/TAH/35d/PV4UgDSb88vXF59+9uSd/T9lNw8FImhr7q3eV2uzcF0xamyPqrbmecOrY43h7X5Oa1XS8LnMwd7lvyVdTBaffvbo9euTbmo2NzZ2djZRK2WXGYvCiNLrJJnBBIUcBy4kolWHCKW6Xmo5SxZaImJqTUJoEQzFAx1RcMzFYbFm9436rm8O7O1u/5/+9Z9QakXVuWoymZ2enkyms7IoZ+PpcrEslwWzGkT2REf1FYooq3NcVc6PkBuT7u5t/+CH3/vgg/fu3b/b6XVMYljFVW4xeTiezCfz5eV4fn46fvT5V3//s18+efLk6ZNXVfk3SOZ/+B//u1u3Nmp/h7UkLG1gt6pSHJpEver0X4kYQfB+MwzjidpMNiig6XT6G0OgtXr75vHfvkYcOBO45nmQyJGJE624JuZFdjjVQdUUnUC60h8igsBFEIw+XREk6ebJrZ2tX39xenR6cXYx3h4kubF+RcNaKmrBsLFGHqrE5BQlxMzaPEm9aRIImNl5qS3EZQkoALM6J9zA3OsmKtaJMRoSjkTVCTOziiI1e1MT67i6i14ndMLVTf+a9/7KF9RH/brcqnWuKzjdeo1txaRE8ux6AGx0IhOS+EW7ro5VDGInT8kQSKvkEK6jtzGErGvlXFFULH4HBmFR50rnlkVVORd6t8CEAAqVc1XFEd4YTx/XoAN11YqjreielVLzGrX32qwb39aL6uc15Wj0yK++S3p1rlMgRFAZQN85lKoYX56fn53cu/+Oih1tbg0uxwsnpcjh8fjF65Mvnr08nS7HhZtOF6iUGAtoAA0Ikp+xQfFmPmFGAGZWH2fnowAJVdTDO9RfkkT1GdErF2+61LRJgQ3ObNArk6rRHqCKzrnL8djPAXiDmhJZY0PCajx9XXv1aq17vEF6iCrb6pcogIJz7vLyvKyq0caWTRM/KuRhYXH0ANrO+Ws/+re4NyIhBGGdaHXjs/r21mKqBIINWjsGOdfGeoT2mcZfxOIZbjHwMwy3+Y0mJgyDMgj6cRFFJw79iAURARJj6G5AYCoRkY2EVmyYA96qHDkLhJ5vpBVySKlARFRjgjgnHtMD3qtKNUKZWos8qiKBQQBmFUGy5Ofdgt4cX33YKpXDkCEkFoWlKgpmNoZMlnmV2Bg/+KJASgRIFPgFqlE/X1eHVxPhUEQR0RhjjRWW5bJQIOEKyCcLiALZNDEGAUUUCK6Za2u3C/2SNRqN/uLf/vnx6emnn3/5q999vr2z89M/+alog9vzDbQ1NbU9InClfRVY/E14azwNacN5R9+gxuA7ppglgkCEAI6ZhQ1Y7xxXJBYJE4ZYC7R1OAM26XAxtNZHmPuWcNBcNUKjryiqbXMqeqU6NHoVEckaMCboB1fM3lfhD6twXl3/W8C30pmvUZmvWuJWA1Tx6t59ddfwV79BcM599ezZdDp558MPHGil7FQk2LED5B+jdhscU/WPk1rsCOdbbMX3+Bfb63adc7PpbDGfd/KOT35qNNsr0IYWW9kfhqT+5usUL12hidb6ctCIFdb+fF0Rhmt+9BXdqYb8t5I+bja3G4H45vEv5jji03FRRaWqXFlqnd+OgISKbysQrwlwQ22NAtW9Jb+1OwLc2x5ubgzOx4vxdHl0ejFb7m9k1igaJAxE5LB7YXBjeq5rPXy+0npayfRpuQnrYQ2sI+FjJdW2D9fy5Eql+9YTeFhJEa52Jtc6YKpriHy8WiWs6+z1ihwrXFFhEY/OElQAYa7AY4PDVk1a2wlUDGEvz4b9zriYijCLoBBZMtYUs+piMi2ciGfphh60F5DJY5GzJLu1u51lxi24Yh0virPL2eZwGMu8laFISwZUDbIhSgxhK/GhMXcKMPsncsWUje03vzZNkSIJmeeHxy+PTy+mcwLKrH3n7q137+13DZBUKJX/sMPBRUPIjqJnIzMKW6N7oy6/d++3X9z+4tmrZeUqhsm8fHV0Nl1WA0utz1DrMx3Ead+1va119lob/4yjUqqN+S5suhBTkbA+4CGgCownkycHrw9eHCrj/ub2zvbmoN8pS0RICYmZVSRPEkIwUOvqgkLAiiggnFqbZwk7b6WHeLqq39X6pmuONq2JAX+8F1bp9LIPvvOhzRN/XS3mi8n49mKxrMpyPpktZ/P5dO7BE74O8PU2iypDVVXz+bIsi6qq8jx5+O6DDz9+f//Wbq/X8YWAAEGWDjub29sblWhRymS8uHfnTpIkZbl89erw4OD1z372j9/97of90R8NBz0FF09LrbsTMU1TQ7Y1fKWRWCp+zLutKxCRsZYMtSuAOtmXrO2Phjt7e2mW3Sz+3xptGHXtdNoUBap19xFbt7FqEwengETGoDEhThNColsUluPkRO3X8ZMo6ilImiV2Y9BNCc7Ozs8vxou9YadrFaorZedKqVLPWKAqiCJgYmyWJIQYbcwKoMYkZBjY+e3FVUVVliriS7vgLcPWuuXds1Eg8BDf9pg91qGbMW6vJQ2vNDuvbQlfI2Ku1ML1Iom1QroqjGIbonqdqaf2v1w1LK8M01NQ6cXr9gRqDXayNLUGnIvrcWOvraGxquJYKqeOI6e9Bd7QKMIYg4wIGKSFlopbI/PWdoSr4sDvXeuo6vpg1hXl99oP6Cq7tjldBK0SJdIlA3dERUGKsmCBSpEpnSzl7OLy8ePnr0/PXp2dz0q3FCCwxqchqiirISAgkEi4R0ZmQAInEKPZYonaGA5j+wLa1Ex98xEL6vuvTktWvMrlgpB3ILPpdNDv+7nwIF0RVZX4zZSCbNXs9M2FutJ/gKsFrdYe/bbrUNW5qlguFotF3umkWaotxrGuOBXaa9E1H/fVsrn96Ueedf2cb9xV3/rtLGimV47KKkHAba8wGAc4QEWQTL2prYRBY30C8i0bQBCNZ1dhpwgMGgRir5ACETIQYTRGeACxZ1cEagqRT2PjiguuCDFE5CGEcTYPIBMGAAQD2FIaQ2npDQ1AQEbBIhGAjR4Uja7jZgHHUKugAoGgOBAVrqqyZAJrIElSBAMhKUACyb/JpqkXSW3vmFeDbRHBGJNnWZZlzDKbzUEhDg6F9ckaQ0GyFsUVGK2qMIeWXtMwEkcm3b+990d/9PGTZwcvDw9/98UXH3788XAwcE6g/sbX+FBbduF2q0nbjcpVGDLGNTeeXKI6jG0NLgJt44Rt7KO2lr4W3yP2tlu8nJAi6oNpvLiNjVXsegUVWxOy9Q/DcLBCNCbAguqO9z9TMXwzCXlVr/56rMQ1X6DrU0T1h01AhujF8xdnZ2c2S0dbG065Uo/payEWYgBS04/0JLO2EBvnKesLJKrKmGV5N69mk+l8OsvSjDTegWEka0WuJSRYw020kZbayNCgK7rtioYeGlaKiG/Ba/wep/c4r1frxTebwI1AfPP4F6AO160pEWGuispVFQVHVb1NgLYKF0SEVqgUrFtaoikVo67bGpIEUdRqe6O/s7VxeDo9vZi+Pj4/u5ht3d62Bo0xxvcRm4RZQbR+AhdYYjADNuxDAL8eh60f41CxgKh6Wrs/VIWpp1AzB0ycarPmtVtt2iK9reHhrsayrtW61xW0CmtN1KuGoXhWa7A/sXr3KoQoss/vUq1cqeJQlNQ3d5UhphiLponZGPX3drZOxsupE2ERE5rhleqiKJ1Ek6z4aWdfLLI/lBLA9taw38kX5dyxLCs5Obt8eOcWxbcrdBYRiEgJSdAQWYPW2Nbgf1MlqrKrxDkRkZaVZgVr6ZupGCaijCgVpTx+fvD69GJZcmayYTf/6P0He1tDoxVKRSqsDH5UKlzBMVNcGVSMKkHZtfbu/tZ3P37/+Hz86uySBYpKTi9nZxeT4f5AhUADTWw95DbwiFFX60fU9Qh7hesdd5G1FOKtJABGEAnZydHRyRefPxqPF3s7t+7v7w0HXQKelWCSDFWr0nnqLgXkKalzqoiEKKHlnBibJmmZsHOOSAkFSetbp964MaIb/R8wxEyq0LBhk1BnY5BmBMgA6XCzs39rQxXEsVsui/lyPp6lNiFjNAjE7GsSZXAs09l8uVxUVdXt5u+++6DTy01iAFiFFUDEIRKZNLM2M6aHydbGxp1btzt5dnZ6XFbLly9ef/nlV3//D//48JN3BhtDJAmOiThSiIjWmk6nYwzFubRw+/vwKlX1Ad/1/WWMSZLEGBOZbqoSs7kByGB3OHzw7sNer3ez/n97FOKQbbmSQ133ZJqiLfoR/bBcpM8jIJJNjLFIJOrR+WsRKIj1SK8CIgGKqKiKQUgTM+jn3ZwuLifnF5PFstCuFV1pQdYZ7M1zDPMlYcdCJWsoTa0xCOxtj4BEaZpUzpUVIhCIK8uyLAoAMWgoeK8osIQbAm1wJhMFv1acfoiRleAVM317hMi1Au7a79sQnvqk0GxiLTZxC4mLdfZaO3lm7fvjFdhu/DKJYQMYGJFEpGIUUsJuluSpxUUJStHxK7HsDTu4KIpCxVKxOAmjLSbQtPw+qgYxsdYZJ8r1mtOGWLXyFsBHCa7FHgEEK5/PmYKoxsTJmfVwcG29e1dF3jfJiG8Zd23TjcPsdLi0w9M01qRZNpnNCqdFwafj5cHx+MnTg99+9qQoSrVWTWYMECA6scq+xZYl1hJJyeLHskgMAoBBF5X6MBRO/i4JSKowkobruuyVj9vbZglJlBHQDxnjutsrehsAiAAQl4uFvzGlcdOTihPHwuI17dAVapG6cfUce5UFjJGW3R4p8xM45bKYzWYs0h8OKLEeohocl7UYFV+XSsu29QaPxQoz5A0fekvPuqmiv50P8cbBaG1vOhIqofvhL16EkKQscYkQ8AP5oSpZvWMA1R8fMZZ2ceDPm1uBGmIOxu1JCetxD0F1ogyC4sf2/DQggaoKoyDFk5hf8OPhy8djAhIQAklNKaUYzGkNEaExJJqbhEmNMYjkBxalvmNVoOGKCwEaFQIBVIOiUpYsaUVpYhAB1IFWiBaRiCQe6Fu9tpUh0+s0YqQ0td1er9PtzBfFdDJlFvI2DALv/aQQ2CYIBttpYADMzOz89yHj9x0GZVVO0+y73/vO3//8V0+ffvXZl4//1eGrre1Nx1U9DIMh6Lo9EourQMRGhvXwEIj+kHXJDmuvdqSy+30zmFhWNg6imLh3hXCEzQK8jsVt57r7vIQoYLb0xHWZteEpN/JvvfgbIoOAqIhKAFcIDyuHAURc5TJ/vehR16atgbPVAFL9hnoxXFnRfWNSRITFh55/+eUXRVXcvnUv7/cKZUGP8wjphrWa0f4Wnh3uiS7tjwFXf0NIAGgTm+d5mqaz2WxzczNEv8Z3R+Br0udwFVaNrdC9dU/x1738f4I6vGIcbrmebx43AvHN4w/cow7lpU9dqyq3WFTLJbCEo0jA+3kIv9+Yg44W6tAY+gwrwzWo2Jp/inNIquzXRkOmnyV39rePL+bH55evXp99+eXze5tbYP10FBFZUAqd44htABVQjhaOEM+LgfEQI63rkrvJOAnOaF+ttaJymg58nFKM8nccCGYP8Fpd+1DbU364lrf+ljc7+EzbzTt82/bTqqvDdLFjZRZKDaioclWVohywqxDHHxUAIDE06KQfvPvg4PB8drFEUQKPhEBrE1VkZlAgIuVaQWOPcyRE4Gpn0L+9uz1duMvpclnpq+PzRVl1U4OkIAZAKieg5Is9VSUES+jjWOunLwEtCIjk2BWuElVjsJmUhbUUeKr3Bqf41cujzx+9uLhcKFBi4J17uz/87ge5ESxdmI2W2hShwUihKqygYD1rQQS4Siz8+PsfPX95eHw+LlmKUl8fnz9/dfTw9qaxDKyeU4EqGEBpdbtAosIYKBYqqldaqcpSczOxJh400k94fT7+GIgEcDKbP39+MJ9OHt59597tOxuDDkrFrsxQOp1cmaty4cqlJSIyiMSoghYUEIwAOQdOyQGQsVmWhn4uAqFaIkQQUKSoEaMiSECC+S9s5l8VASwBVAswCOgUJRglCQ2qP6AhY55niUkAPSDbIzMonHA0nGi8fUC5UleETzKMp6EwIygoi5bCYK394Y/fU/g/d/rp//Q//+Xp6eKv/ubvf/KT793a3uzkWZhCDiPeigjGmk4nC+pwU9V7B7GKKuHKXWatTdPURzw3qRygfgaQAHq93jsfvG/6/Zt94NukENfH4itLKLTAPdQGUNSsam/28bebh/5goAZjK3Us3jUIqOBDe4gQUYwxo43B/u7w6GI5npbzRcnawWCepbArYqQAhv5kA5CMkB9FhFgchS0iRlKHng4rlk7KyokAEVkEYKao8waxAEGRlMIord8cRZSIVMA7SCBWU7Ev2WiRNW61XbNdkWiv7YbqqjUYogBwve62+mGtfrOWsnZNYVlbnBRRlFA9/d6P8eaWenlqJkvngpm69mmLVxkAVJGVSoHCiWMfZmfImMWyvJxMZoslYEpkKKBt1RhrjI3uqZqQEERAbH2Q2FiWERFVwK9QYS1Wz8uFNcFTNZ5BYP19vlYg1ubja9i70IpDiFG60o6/w9gnrwUhxzyZLZZSzBb86vD0b//ul7/97PHZxZhMhkkPMMQAGpAEhLga9vPNzc39/b1ukrvCSegEcgWlaMHzabU4V9clIgWBaHGLPjYMk8QUZ5HCyUzXxpIioRjIN1bD9Rndb6vXjm++G2ONzzpGIiJxjGASsvNqJs5hp0eW2KcW1rebxklcL8a1Luz2FS4+NdEfQyM0DBGLxXI6vlws56PRoNvrKdX9B/TmRR+L7E9VULv2GutDCEdsY6xWgg1U3xT+cVXvUL2xFX+b9jKNjXxqmRzrcDZoCYEoAkiqDH7KHxhMPHyipy00Uy8B4CeqoEgoAFQHjSHCKnovkiViyhyikpEYFBLMnaHlGFgqCUUWLYIys7/BG6VYQosyBK4YnxkMXHifj7FkM2PqHGeGoH3GOYG46qIKKZEaFFImpE5mDeWskiQGUZRFyCfIpoRgAFxcaoxBpNDvqZXiJoC6rcmiWmuHw0Gv17+4nJydnJ2enm5tbRgyqoxECi3sjG99ST2QpCLiHPsFwSABiIgDZVBeLpf7+/v/9t/+eSHy5Kvnf/f3P3vw4EEvz4VZ/LgPKa4FMb9B5lRYnZzCdcJso3iqeAihICIZjH6cYKwKPhLPPQcJ9m3PUMbYOn1jxUoBc40hZP46HPC1v8dmriNe00QqyhTmHPUKxfjq+aH+/RuFXbzmzYswfGykgNW+9dfW9S3JY+XmFWZVJSQVOXj16vXpyceffPLww/eZPGoaiQgBTfy45KrDGhGJ1lCYVwP6vDIvIsaYzc3N4+NjZrbWroTs6fX6+Fs2lGu/+FqQ9JWv/qcd3Nf6GTd72Y1AfPP4Qz9qFSY0Z51zZclVFVK46sC2kEfVYulCTEcJvqj2TtBMugJKVO/8HhaHRlSN0a2N4f7u5qNnr+bz4uXr08vZIu/0VAnRGjISEzwVYhWhEtbDSDsCJSQDbFowfojDwRiydhW1zniOQzR1EEFYzmP9j4gegrta/WLzhauTD/Xw5tXK7VoIICB6olAs5rGdW4Krk6T1JxSNAwhkkBKfDRx6whohXREcYOKB0iIMu3maGJ8UERQ0ESByIkVZOcepggIFWKWCesEVSYQ7nXR/b/vlyfhyWlSK86Icj2e93Q0idOKpYn5kjJplXtRSPLE0/GT1p1QB9fTa9uRcy3sbZHv/JaQgimcXk+msrBgIbb+X3b2zm6Wo7Op+gyBGbdBfbBJDyQnAhBcsTpxuDga3dkadzJQLKUUu59XlZCoSYMg+Sihcbort8MIVslXj8GrtlzGurjmwAbTqfG2LLB7ZPJ8vLi8uCeC9Bw929251M2t4icKoogY6mTXIqM6iUGYsqDIroBABYTAjG3U+nTBWpCFXIagxQGD8wVpF1IkaQgo7r3+/KHYUvLwApCGkUSTgIwFRUYWZnYiouMbRUIMyMIwjqgIwIZIKxIC4sFQYY4W9FCA+O4jZETljkw8+vv/j19959OTJ5c9+8+LFq1/9+nf3H97/4OMPvHzhE43rcWj06nzkqwYXnp8JXyuqWzeRqKKEr/C1jAKpKhCZNEVDN7vAt0ohxmvclwD+Bo+aa+CNq6hGGQpExLmKRYDCmkw1+FS1IcfEddqLfkErFHXOqaFet3Pn3p3fPD47Ozs/Oz1/uD8ySE4YSaDlLI2st/pOktoST4iGTGpNc5n75Z49KRdFSQUq1oqFBSTsSf6u9dsw1RwFBYME6pyIOuecq6zNms2sofqsZMddret0FSv8prqiHoSnurLFyFOMU6o18/iaJmjtnq0noq97eLmQkAyBKHCNogBFEFIhUEPQ62bWYOkjZBUAgb3vE42CB+OTMZYFPDHHEnmNcLFYzGaLqmJIUUSqyp81dDafT2cz5xyktnnmV0jKsBIKBzVUMu4ILSFSdTWkvGV11/V956pMXHuHQ46feCGGVp7DeuEnIKyOrU1YQJTIpFlnVKn97RePHj95+dXzV8+eH8+WFSZdJaOiBGBQERy4ctBN7+ztjIbdfi/vddOtfj+BRIEYhFGZRMCNz84f/+a3luj2w3seQIHeT2WsMZaM8Wp93cvGkOWGa57ZOpwwvkxjyJK/thUwtgbbEopvtjjHzBy8kwqGjKuqsqyyPE+zpOluNvP36xf52v+NonZo/Ub0IzC7+WTiqiq1ab8/CLmtNcRc6zZxgzhpJS/U0b3X1+FvjvpoDrp647H6Nj8MgPUSLYJBrGMUlPyZC8MyqwoGxRNoOQy0iBK1bChtfBC24T3M3jVAgOp7Nu1ArzCQB4Gh701Ctbwcc0RDu81H1oGAgviyBgkBjIaoNAheRlAVIQ12hTr/nEIyFqKIn82ps7ClhhKFW0wJQAjED/O5yrkqVDagRGrUKYsquqJaCLMrE2PJGAUEa4QAmS0IizPaNPlUQUAN1IOEPtBFUbnfzbc2+idHZjqdvHx+OOj1sjRlceq8raQwGOogVKeigGiARBBYhQVVCBz4WE0IDU0/Sfv+Bx8+evLs5cHLR0+ePfnqq+99/DEQ+W/rAwPC/GVYFLxVu9WbBFX074Kf12iKMVwbkYArU4++jRxL5pr8FyY8gnqu1BixcHWwZ+U3iKEBZgy9PUQOrsS+NSImAgUPF6iCOm4HCLUuy+CHqllFsAoleKOQfR1rGFpYwzdpoHW3UttGWXxDNG300BhEVbkcT07OTt7/zie37t83eb5wpRqyxnhR3AC0LWvN2xr7oOS50le4Iq3zWJ0GTMZYa5PpdJpleZKkzrm62/p1LUZ9g2qra3r0VcW83aiGt+DCvoke9Qas2c3jRiC+efxvLw9jc1BWABEuSy5LcUxtoCCin2KIKIba8Vnb/NpLN4T09/DH4skQImFgPHoYBUEGvfzW3vbu9tZXs5fnZ+OTs/Hufg9N6i2WXssKUdEQ5oPadaxjCZOtzZk7yMEm1KUkLQJUgPhGW1IcNW4Hv65ruz5dBxUaPxToGk6xFhDq2gxWScTrGTs1TQrWJkz1zR9T1MoVRIXCvCqgb0AGkiAoaGD9exgvwtZwkCcGVZTFj9SqMgDMF/PJeFqNOnluVVxrYwufGgAmBne3NjaGvZOLiWO3KKqzi/He9sia4NyMnh5CJCIUBURIrDXeNAWrhRCoiD+91sfTkMrjf6bBYI7QGIdQFOXF5bRw7JxYoo1+5/137hr0nQHPuDAKPvwQBBvgoTcWAPhsQ/IDdSnx3f2t0aA7K8eVKKucj8eLougkYGKILaI0Xgsg39atB6i9IO9Hh5qDVYuSWTdIEEmV4x8Cxc3eX0LCUiwLV1Zbmxu97iCxSFChMKqiCigkFpFLC66XGZt2DIEos3+NPjcagR0rCRI44cqVgJomiQmmAGraGSLCTkQMYYQOKxE1h8zQZ5Dm/B26QATNHG00HxBEA0rUgFEhhigACKAJ/ZTWKUulIaZAQGuBqlPmXj//4IMHP/rh9373u8dnp/PHjw9fvzp5//33ECn4oaOQgIGTQfFoC40TAuqmDjYaoTT+kLrVFOhsjWnrxnP1bVKHQ2MCrps0XB0fjWzfgJsFP3fAjtMszTu5sVZLhz7nZwV466+Y9tC+T9X0pRukFjdHvTyj84vp4fHFtKgGGaKhBocffaMag+UQFP3GEdgzlFjs5LkhEq1ATURCks/wQSIVcqKVAEQKZC1a14HiNRLDVxDsXFmWznGMsqlnboIe2+ZyfG2K9BodtSm0YulUHwsQCIkE0W8ZfrKHgrglfnGJqJs4TekxmG3a4hUgL9QW0NAr1jb1iQjSxPQ7HR+uJP7NE0JsikAgUkVRWBTlYlmpkpfORaByjllEgJBMYvM8qy4dOu96pZpp0NJtw8SGtjmzzTvRvEsCMW+JPHBBI+m4CamJIrt6iEZc/LA2QddvuIio+hONqIbFua0dw+o94A95BsUkCD412Ca2258U+ut/+N1f/+wXp+fT6awoK6AkV0AgkoqrqlJlS7I1Gnx4d3dvM08MoLKbX2Ji0qyraALpE0UQi/n8qy++HG5u3nr3IZqEUPx7Q5lQ5YxzJs19mzO8ORIHPMQFWyMSEqGIf18CQAsx6+QmsXWDRYSFmYAgGuz9gk9US+8AqtYYVFjOZmNrNkajOO6i12gGb7BQYDRGNLnEiMK8mM4Xi6VNbN7p2DRBCr7Kxgld6zj1hwLrXZY3zUSvOe6vPRzeaMTf4geRIbTRkW6IGltuoIJ6rBaG+QUiif0JQPRWAqpnXWrqmAflroADgKLW28w1tsRCPx9ZN+n9v6+vY3/B15evP+lqbXpe2yX8oufPfw2jPE4Z1EiL+qsDAweaQRIJpzYlbzcCRIgnbVGDiqKoqIKoqKBVteTlvPDAAj9mgsDM6JwVDmt3OxOLPNQJVVHC6Kv0MrO31T/f7L84PD55fbI1HGT3dtKMBZbWAsGSK2YnxqAxZBBQbZrkBkpLmYEkMdZgxcKiblEUZLNON1FVFhhtbH7wwfsHL189e/7i17/91d07dwb9nofREAIpI5ICBhs1UYCJQMjxDsEF4TSM1vfyWgubtjxGtSMqNNgi9UhBmJ0IAxpBqkTqZrh/c2JenoaUk5b8vIY7wDemwOG1DiqKS3fAAUUPmlFIjSnKCphRDRFpSxpu/4J6GJhWfvy1Ou9VBbmlaeLbJc6171OjPRrUfJPqUEv6VFbl5fjcZsnurTvZYCBESNYgEpqVoFZUWr0nAZHa1qs3vLnaDNYgkbE27XS6T58+E8H9/T1rrXP8tXuEriRdrkOcrt1lVgSQeNio7edvUX7f/NPh9/Jr3zxuBOKbx3/tilqjjUIBVNhxVXLlYr5HHCBqzUHq6lBLWCBj3kxcCFAFtSafB604KLN1GCeIWoMbw97e9sbR6+PZrHh9fNEd7QgYBRINrp965VpbNCRIQBLcqu1BRX9koggb9GMy9cziSpFZs/jW/n8boahXO2u42uxqOZ/e2KlrLCStFm9EdACskgfbX68aKkWskxBiwnvMeffPmyLt1zPyAVEHve6o1yU4U/ZjtOCFy6IoF0XBLEQJN4T9CL3y5arq5nA4GvTyNBnPy2XpLqezyjEZAzVDMejUwS5AiNYawjqDBmvzXfR+NbpdPVgdrZ31du9xuTqbz07PLxwzqCaWdjaHu1sboC6eEUFQVcDUwC7/JgVmFclqkhCI29saDfudo4tpKYJI48lsvlymJjXUKra0dm9RPXYW7UPttCNYSxVvhS81ZxHElQA8BGTWqizLogSFXrfbyVJhhhAWrCoMioYIhC1Bnlmrit5U7XXzoBiIqiAoATBXVVVaY9LUorRZjp7x4c330TYLjWdN625NXApCyvxaeJDGYKcVNTWS5fwTq8P3rkT+QXNT1afMmG8gTFZ3d7c//vjDne3t05Pi9eHp4cuj5WSWEHmbXfu2D0yuRo9eoUZjO1lSW78QaiEYW4YHf7C+8Q9/q/azSE+oL5ym0oyNzDqnpZ2qpiIijoXzTqfT66IlLtqevTY3tF7SWslRYQtlAjfqZ6Nedn5enFzML2aLTtqzRMoCdSWtgQQZLFn1v/YLDaEh6mZJYjHMyAAJUD12HwZw/FQvKmGcmqjTpesszCYpNnicnXMaoBm6sgvVrpdWFsybxtuvvulX0sk1SgyoSCq4KKtlWZbMXvdIrUkMpgSJz6xHEMUAqfXyvUosOlFgLQbAt9/CqqTiZ6pXBkQBwBjM08RSzOBD8nNEjWqBqAqCsKyqRVGygCGryn6HYh8IioiG0JASKqJN0jRJ/eKLTVRAHbHQ9ngiRPinxhVPG9W8vqgIUVFdvAYwNOxA6madNhFvqOpgncEhrQSbtTV7TW2MSHdUIito2UHJVEzKw/Pzf/zdoy8evyodAJIxKSqyCio4kcqxcoVWe510d2s4yBSk4opdVbiyEGsVjPp4KRVAscIXx8cvnz3fffrcpqlJAl+xKotyPqtmC8CEENEYiu5BVLAGiYgsKiIaAiIPl4iGBFXlNLWmHvgImUgSx6cClrXTya0lpDqGShEpNQZEivlcmUPuZEzOAxXwoQ7x7FjL9gTrDnoJaReACq4o5rMZICZplnU6flC5IcbUDmJseifXCsSI191Euo4iq48WiPoW2eKG2/jt8u9QNNH6rjooSHP0Al9u1CHciKjBBuB/wQrpu/ZprnXG15JQrpYw0FjgFeuyri1nKa4kcEfD/er3aUEuPG2/0YOa8+qaQ7WJY8HalNRSsHBlMaBAvRBo0y8URCrFAHpQ8sglRYDEL84a9tWIqpMw0IDgwemAgAltjXr7exuX4/FiNjt88XLQTe/cHZHNBDlPk63NkYhlFmPRkkE1hFYFkMz5xcXBwat+P+10U0CjDOIk5MqIs0ly+/beuw/vP37y5MmTJ4dHrzuddxJEDIKnEoIogs/hDrN/rXz1mKNTL/mraAldO+a3SoO6H40qfvRSjbUA6PzMzSrQoC2KAqznsvxe2NkV9O3Vxlj888TYQgrn2ALAmvl55fVo62JZuYCvQUzo9Zr1mkAMb0gNbY31tmjMzVsR+/Tog+DQsZvNp0W5HPQHaZ4LAqgnayOs5daHbJRrRNW3UytXu4lkrR0MhsuiePXqZZIk+/v74Ces3vqBtBrub5T335Lx15aqvxGD4g2tUPwmbrmbx41AfPP437CmhsCoUpGqKpclVxWJRPwbRfuwH+6uzS8Yw2Sxtb7GYwH4ZpiERYcZAhcCPAWAAEGNOAV1g8y+c2fn9PjsyZMXXzx9kQ22lw4kiFl14Fw9zCnasIO1LTaqhi53XWg1EdpYF/E+9qTG6mMMe8BGIdXVbOtW1PuKgBusIiEbXmHFKXztlG7tVibANjkiNt9w7SfW0rOKAlKCxiBaBPJNY1FVEkWOA42+xQxxWEhVyeCgm92/c+vTp4fTsnJlaTAFEEStRIrKR56ZOMnrW8XNWyzMO5sb+1ubLwYnF9N5UZYnl+NZWZFBEFEFIus3SkOkAZ6AmTWWEETEqwMRQ6k+f1wa/7BGUR8UNVwYqoiqRgkR9Oz87ODFC3UuIdocdD58934nT7R0qgTg46Gi/6D2TGvN10fxtDMCz1YQx9uj4Ua/k1pcVEAmOZ9MZrPZsGPAkHgXdkhUJiRPKfM4Y44b5DWZ8r5TEZGdXu8PlSCRCVdFxBZXlVsslstFURQlIZKxXLmQtKMoqiJ+SMsCaGIotQSlgDAqGrKICKLoHEuFrAmCAwauSKo0NZ3EMDOoeGQYRFawISIM8DdRVCSJIW/iPwXAyolKvLCV4vlRm+GtRsBHbZWpWDeA6jiUEH8HrTFijncA+UFv1dgyZ90Yjj7+6KMf/uCHh68uD56/+vS3X/7w+x+/8+6+asBctE8MIeVPw6SkL8mjRzvmqwQQSCgRagQbCkGwHmsLRnOTB/+t2cqiaorRiRI2hDqarD7EI4KID9LyJaiyqyoB3dgaFsuRfZ6UKsJBbdaV211aB3sNU7QCooLsDCx3N7p39zcux8uXJ7NHB8ejYW+QWuAyFA4MXoSTuq+iSmoEVVQAjAEgC/2ezZLg1hIlUXKCaCxhReBUBDwfHxlRQFlEKKR+e1tuMAgHexkiEonIcrkEGEndYImMKIQmeY+a/1yZImwf4lepwdCCKWDDpTJG1E5n7vRycnB4dD4eL8uKEZM0HXQ7w06y2ct3R91hr5OmKXvwOXn5LkTnoPptRRUFVyiE6E8lqOJnJILoIYBepxQhhDyxHYszFFZUNb4H7mdElGIf0JqFc5fTWbEsMLcqPqrVEzKD/ZnDMcOnuwGrsgiyxqRQBaSoXav30frP2G9/oKLgfK6RhIwEiUEHCMBRBzKiphQRZQIwiCaEQ1Hrw2q4+HHPBhZuEhBREcHHVYXgJKkFdq8ogYKpwEyK8uR8+fps9up08uTFycn5pAIDYIh8vFvls6GYxTkHwgkKISdYITOIGNDUWABlFfWsYQFrFFXJJOPJ/Gf/6ec/+4fPKLFJNzUWjDWiyo6FZbM/SgCzNDFExposTawxw9Gg3+93Op0kT01qyNjNXodBySCLbxiwTcj4HdXf5qAoiiaMPIkDRBxuDm1qY2ZS2LUH/X4xm01m0/HF+XBn04XADW+/A/BHIkSJ6wY2DVMvxoiQn2JTQAXRclFMzi/KYjnYGGWd3CRJ6AdEBIQfmgkxVtAAQ94S+KMtA3rbK++1uTVjOLasAHFzlJui+lu1nYmICqHxny+3KNhvV1uIUBXeTGJF1DU34vow+De7kP4p56a2GPTNJt/XlSxqUVl1RexbA9jXjWDyw3DhryRwwr3Ix75NJ0iEWvuHmAFEkQiNr7aMxbzffff+bRH3+RdfHb58kSCM+t/Z2h2i1f3d/N/8mz/57PNnL1+eFsvCGCPsimIhqPNCfvbLXzw/PLh79+677z3sWNtJbJ6Q0QqNCjOpvb07+v4n7//qF794/uzV73776e3dvc6wzxIm7fxx1j87Cr9HxbB3143qeMYJjInwAhFXtNTVlhcGYzqJqBRlUXE/tz7/HVqJB3WEr8LXXH9XHaBviVT1A77roXPh0I7G2jRLablYLpdZNzcGpW2Kqo8fuO4UfhO1fzUM5vrnHjEa6+pnK+u4GRFdeV+u3A9+nGU8nVxcXHR63c3tbSB0zllrrbXwBoj8N74Rrp848XfHYDB45/47v/vsd8ui7Ha7vV6Pma/94iZnV/Wt/PqVq+iqdO6LXxHxPyikC/yeywK8wWB387gRiG8ef2iNWBRQ2TmunLLU7ENoBYyyMBKi53nGHciP269YjRCaWgpAxIWyUfxa6mU4g0giLFoS2a1B59bu5osXr16fXu4cn6fdno8wremQUZVqylFECpUeKCBBi/2KiGQMhHR5CZbnWBITUQiYBg3UC2yCViFOpEvNCBaBq27Qtkcy1MUrK7sfsmjvf6vLIWFMxNY6xOva81b0S2KQLcGQGvKELRAwFXuEBwEyoNYw/1pCN2h2dkbdTjItlsyigGSMCjPCsqqKSkTJw3z9OLDGIkcERKWXdbcG3Y1exwCwyGS+nC2LPCHr7Q1ofCUU2Z5qgCwZ45UNqJMKQEB8lJMxhogA24VNs2GBts82ulwux+MJICSEo3733p1b4qraxtuCKwkCRbdcS7xHLxCTH/IkgIQoJTSefWZMWTnHrCGMasVE3XTGcdU3WBvZQmAdyLrpu+GNhBI9lPPILLPZfDadL5fLGj7N4lvKIEC+4AW0xtiQ/cciohg4YOhvVWEpFktAg9YSSEIgic0Ta0zwZhgS8oQrRQBDpqZSeq8hxbuC/CsQoCqQWPybV/OworEb6ynwKCPV90vLtoAN4gFwHXmGkUGBRMQqGA69SMaONjc++c4nf/u3P3/x/NWLg9cnZ+f3370FQPUYoqo6x6rCzERGgVok9BUTi6qPZMG4ArQyKOteuaiHiSjEa/Tm8W3a0FpdutV6QYOvql76qdnqmMWm1On38l7PJkkcmaQWD6gpcVdOsQRIROJpE66bZ1ujTprai8vZ04OjT96/1886hKg+TdQ3t+JCTR7dp4iEqsqiSECEmaXEECGwqKAIM1ht1S8oCuwDsEBFhUWgVeCEjEkiFA00jXiCr2020gL9hMI4OnTh+gist1csvv0bB3nAKGaMycuzo88ePfviyZPJZFYxM4BNs143H3aT3Y3+u/f2b+/sbG0kqSEERWFDoOjEYzcURJiVY6hXnbemAQlkiIWQJB4sVKKllpCSxHZSawmWFSsoBmaOp82Tb8QBJJVbTKezRbFU6Xn/nTFkLBoDxlCaJMb6PQuLcrlYzFVEBC0IAocB6OCvMgAcw+F92VgLERhGLZqi26+OjCiKKEhAydLhxbyYLReIkFnTydIssZk1yAzCKBwCeUE5tikUyC+qdbg8KvpXGHfTug3t24WoaIpKHj8/enpw/Pzw/ORyPndkktzPMvvnJYAiJH7zQfKiLFeuLJedzBgAAfLSFauENh56qjMhpVVR/u7R05//9stK/ZkAMEEyZIxNTWoUUzJ5agHBGOz1e9ba7a2d7e2tjdGo1+ukFrMU/+L/8NM8M4qiwIRASNYAGQISVG2wwEIgBAJISjFkqbFJIgBir98r5oPLy4uzk9ON3W0C4WbmJXRwwRgiVCJRjTjWmMLhU4yisV0dTyfj6XTc6/V6/R5aq6As0spVhYACv04fuVLhtwLcY3hdC332Rt73FSGvDX+7efw3/5DV1FDVcHkDvIUronUp0Y7Yuibk8xttoW9Uo/45j6vxYld3ljeZTJvtLR44V28oittU4IhFoVwQaOXd0HrS1LPLWlgknzurAFSPm5AXLTcH3Yf3bx8fnZSL5dHh0ZNHA9X7O7e2NkeDTz7Ozs4nF2cTLpxUjnkhUjrRZbkcT8cHL198/sWTJ09fvH//7vc/eT9LksQoYKWGiTTv5Ld3t+7u3375+nfPnz2fTScbgy6hqgopInk/M0NwESOSP7crq/i6moJFIgjKTRcA6qDboDTX9m+/QBGSEonwsiwvJxOT5mnuOkmnLl6gxdP/BiyeBklwrQO3vWRRDLhul75Yz0EZtGlqE1sUhThOk0QAtXktWFuxkLw5BGtxeQ3QDwCEpAjwNQeYN8YwrNF+WvXqKth5tcpYLJfT2cyp7mxudTod9mHGftBE5b/ITVQ/WJiQjDHM7Jx78M6DV4evTk5OXr9+/eFHHzp2Xrq5Vkb3r09E3/7RhrGt6/gbXgVa+xf/tK3outDjm8eNQHzz+AM9SJVQAFBZpKzUVSpccw1rY6kxJszQ+eSooPioh6A30TG1taEWSoVFhMIOjMqqCmIUyYISqEOoBh17//b2s4PNp4fnz14fjTa3K2byiAQh9HQhn3Tik6ExTugiqI+3rrmH2mxVNbYX49zRyl9eOYhENDDq6ih6bVP2Pc/wyuppLQpmxjcsvtet6Vp7fBVwndV13aBH8MdaMpbQeFYfkahO54UIoCEfvochdjY4rFAVyfU6Ns0Mkv80CREpxUU5f3V2/nB+6+7erroSgLXGF4CAgCiwc0TLQTfb2einRkXd+XR6dH6RJ2azl4oAIqoLukLkZbia7Lwy/x9MbRDCcMlAyKXxh1oNUk1sCHgbVFlKVQIoGWO6eTIadBJCJ6jCEnyyFPI26lxBqGGBSgb8qcKX4NYgocZfICpOJNA7YlxsLO01lMne8xxPG3VsTv0C1c8at16lSNAvRIRZiQiBQKBYFuPx+OzsHIFiHLAAWQRUiccX9WgPqwLivJvYIqWqBry2D4BEXMnFxcSmaa/XI8VOmmSJTZLEIJAhVSECa4GMUTTKhGgUvDOAgAyaJEsy55NMxAEgGAW0QAmgD//AOIKodQcJgsm7TqQLFmGKJs3GU9mMI2kMOaEQxeV9bAQKgmCUQQnQQLfX+eTjd3e2Np89PT6/WJyenCpLqNsxREqKsMdpJYlPYVRvJsYW/UbUh4rEqkMVJcwP06pZWLURvm8e3xpdWES80lpfFe06GephCwAREYxAa5GqKJbFcqu3YbNMjHHMzrkErTGAiNJawKWBr4eaJjQqPLBYBbR6cHfj+avjxWJ2fDQ9O5vsDLo+AC3kzogBAST2kUCxdCFCA4LKAmC6nW4vzy2MRQXVgVNHrAi+g6REDFgyOEaWxh5dj6VA3b8CH15E6oBZ6m5ukFFBYxfTN71i67Q1ClMXSPU7uVaA1SJGyJgTVUAhM1vq85PT//Vnv376/GWxXHY7Wb+bE9K8LE9Ol68OJ1+aky+evb5za/877z18797+RscYcMoVkB8N8IDiULxpzXcNz82TMJHIJAk6EQitvsjiQcySpNvtJpMllU6Aw7mlXmYBpBIArUq3XCzFMRkEFlQAJWZk1q6lfq+DhOcAILIxHGxvbaSJJahUKvT+PlRRZVWCqN9idKiGhClkBUEJ499ApCSiwI4sgAoDLRyejiefPT04eH1ydD52KsbQsNt5597ujz58OOqkOQFWYhCY448CqkTYD5egCQQtrWn+vretoEJ+sFpRABlMqfT5Vy/+/V//8nJeCiVgc2PQqadESGArCYUbRRWBfXCQiFSl4yTEOMVR2XgtBVXVAuSiBk0vyQeoxIhqUACqSqCCJRoSUOfYLdAAkAqcI1jQlyoK7MRVwqwC/4//+/AHP/hgNMiVKwuGQYxRRlZ0oAj+BEZGlIz6d17Uh7kqIVgECwDCjpGMtSbPhOXi+BQ/Et8hZlUBQA9wIfKXl7/0iUwQ1tF7vQUUlJ23PIwvzi8vz/NuZ7S9ScbUY2D1MTRivlGb6rpZo9ZnaZtkQk8RaQVaXMnGaHSJVfxLDF7GG6j+t0kijr/qRFXy5pg374ABUUNAa8v1Nbag9d9jy71eG9WpVQy9ZQj9n6twvVGc/jpnpa6nQ+sVKRwRSGsLv4aBQ79zG4yipoKfO0HjI5sBQQlVhNEEi1NCsLvV/Td//uNf/fLLrx6//N2vPjs5Onn44Tub+7v/69/87IvHX5VzN0i7u9vb9+7vZl1kraazxbPnJy9eHJ+eX/7i+OdPfvvp0fOnP/zhx9/7o/e6PQvqRNGmbqObfvzgzm9++eunTx6/Pnq1v7vZzQiYKazcwY7lTTm+wiZVFHF+ptcEfy+2E1CjSzhGMqCEFQ/Ji31IYOx4Mv3is8++/OLLFy8ORqPRaLRx9+7d3d3d7e3t7e1trznWYIUGJbLGSMAWxRobg8mKcwTj6QDAEAVaRnTkxgWNFFG9gSexaZ5fXFxURdntdBJCFyJHSFUaZhyFjFNsffjXNB7wbRdvXFffaB9e4/807d8IzfRTTyF7hWg8mRwdHxljdnd3O51cUROb+KZFbU74Bt55XSmerzP9B6AWmZDMbomZbWp/8sc/+c1vfvPFoy/SPH3nnXfKshSQKE8rXE+MwLdp/xgrXoizT806JRJmUz3frNm8rllsrr/n40YG9Qnu5nEjEN88/uAldTygSuWccyJSF3zeBeqHTpMkSayNc/RxSfW1eDP63a6itRbufJM23PrC/ls6QWW0qASaEg272f7e9ouL+Xg6KwEVKdD3CdusKw21o9byc5z+jFWxRg2KCAGIwNMyCMlPYmqd8NBSslZUv1bGdXtvWbeirbS4Gz9seztp92BXVIzwP42pC7p6wls98bV+YprYNE2swcI5opQdXF5OKreXGQwRRUoxByeke1ugbp5maUKIlSiLkiIiijEOcOm4qCpgPw9pYvZXSBoGQC6rbpZsjvrdPBsvq0VZXIynexsDGnTQk3GRlJ2/UAiAQQnBoCEIlC1PwlICYamYK1c5YUQvvaxgHMHHL6ggoYJUlVsunXOoAGliO3lKoCJOlRXYhpFd8YnHdbAeIIgfIEYlRJEAJ0MgZmWIaTogimTI+Cge8NTH2GTF2l0A2rYOr5xKoSEf1rfAWnOViAhNWVbz6Xw+n0+ns7KokiQh9c17UnaAJszkYJ2kq+wqAEFDQIYF2A+tVmWSJP7IzizEIoGSmSSoxpiQKeExKkAEBIDOjwd4akaSplmWdwdpp+9Yqsq5snBcgsMkzYEVRNFg3VWBliDT6hc3bl0AXzq3EJh19YK1GTmcH2P/H4RZxIElQgB2SqW1djjs7u1vdzrZdDp9+eLlYnrpY0LCIYyQDGEclYoYGVijn2EdNywSiKqE7Sh6L3TUpTa8Ga118/hveE+7zpJQx1j5S8cH7XgukYqUZakiWZ4RGZ9NE6cTmo3geixdZB42DQhxd/d3Hty9OL2Yz+fF0enko4f3BJZQw2cQENTU8pD/A/bRPcHxlCY2TxODAOKdyVyU7NkCvqHFwIuiWCxL10kSIiINF7MG73AEvNSwCK0Fbs8g1oaTWkMKWxDb65Kp196HusXpi2kAJFUKT49my/Lzx0+fvTqsxL333oN3793dGAyropxOZ+PZ/PT89PTs7Ox8MVu+Gs/L8XL57u3tWxu9QZqAOgQUDrFFFqnWvAn90G/Q1JnXwr39dDUpqgIaxCxJrfcmx50eqYlZVwPKQEhoLBjSutko4dxCiMI8vhhXVQWgZVkWRSnC5N3cIfFJgAiQOLKOAlbJG5+bhPbQKENQEEIVP9ZE1l5MFo8OXv/my6+eHJzMltWyZCdaCSaGnr94vZjOv/Pu/Xs7mwObMBciKuBEKIAOfS84iIMSC3ONcQuxhgbwPI6zy+njlyfPDs8rSjC1qiRAiqAiRE2SvQIpovgwYQk1sAg7lsoxGDQ+R44Mrgx6+9QoNQaiPwwNWvX8HwrHNJMQWQtixceXEsUdCggExHG1VCn+w1/9Z8fy8P6dPKM8wyxNnavAABpPfXDG+NhB8lF9fnAJJEwrIZKgIJEoOOZOt7e9tfPsydOTF4cbe7smMaIaLXW+r4NxUKze4QOTiPyst6HlfD4dT84vzrvd7nBrhIkRXQ2k0Ca1AzRMs7Tvntph0Lpk6coWu3o+b9aiJu/3Wj7mf1kJ7+bxB97IxHc3mwZntOBAHe+sEUG7ouoCITXz+2uD/KGJqfpmWeqaOf26Lart9NP671uFD9LKRb/Snb2SuLh2YL4KB7hCNPoaHut1k/e1MTRaFZqV0XtPsZk8A/UENAIAFvV1pAbus18K+p3kj77zYYLpl18+uTg/+/KL0h48f/nyRbEoRv3B99778E9+8r3BKGNciFQiMvt+eXR0+fjxq99++uT0fPzr33x5fnZyfvbi+z/4eH9vi1mkEGXaHPU2h/3X09nzZ8/v7m8ne9taLZWrOgUBgQgtka0dRRrgfIjsc8KNsSmSVQUib46JSwJiK5UWDBlDZjadfvrpL774/IsvP//i9PR0sVhkeZZl2e7e3u7Ozv7e3rvvvffBBx/0ut2rYn37A2r3IdbC39qfft2cri/IWiStQ2nC80UUUEpMfzCYTCbHr4+EeXt3V1QNkqr6VT0m8oYQG7oCeViBS2hDj6yT8daODmsd8TVc5IorthHMQ9yOT5FBQ4bo9PT0/OKCDA6Gw16/56thEUWUlriiX9s1abaJFeTxNTHCa9l6zrksy95///2yLH/1q1+NJ+OPP/rYWltr/W1PdFusaAV7rz2ZdmjlG8nI7W/+ta2gq7jnfxrC+OZxIxDfPP5rFtSAoMrOMcfBu2iPjfEoSIZWiFFxNgTqENiVkC5FVCRSBUE/zxmtWq32Yzj7qlrUTma3tzbyzum8ZF0WxiZhLrZF11tvSCk0QSSt1Ly2TzCMu+BKkS+qonJNpR8hqlprXljPbOE3XLne3Aa8pul95R+GkSlE1NUjv39WNrFZmqRpMi0dAorAfL6sHGtmQwx9TfeNbUJC6GTZsN9P03m5qC1ZgDYpHY+n8/PL8SAzqSWtOcvx3VZAUU7TpN/t5lkyXlYsUpQlsyCiXteTxVjD12Oe9U/UINw1Df+VaJ1Q0gaNEQHYcVFUqqQASZLkeUrkbRQMwIShdsM4GK1NvpIqKmGMBgpEXFJlrZ+IAgCkaWqtqTNk4ktoarU6R/5NB9wmk6ahT8T3EFEVKucWi8VsNi+WBVdMXgdv+hTeCsUNFhsAUVnYq73evSiKwlKUS0ICg4BorCVjFRF8GG5wbSuRJQr1ATQT5IRENkmzrJN3u1m3l6QdC5gyc5VXrsCC0iyvyirJMjI+YbpOgQNo+aJg/UQC0Lq/YncDoc5tX4lkxDjdp63OioIyIfW62e7eVqebLReLk9PT5XJhDaKLBOvIU/MIcWyhL1qwOVyf8oqFTHyauHJ+uTmIfPs2szfr/Sun7dUOnIhUVUWG0izzQ4A2UAXiLYBvO9bXBKT4dZJndtTPu3l2OZ5ejufL0nVNXdJHEXc9ejV4idHzuRGtIY/k9W3DgMWIWXYKULGrKqcCZElR6r0lwAhjrkwLxhLz4usNHprkt/aLfNuKd+2rx8glR08IJBadzucnZ2fLohgO+w/u33rn3q1Rt++Kaj6fT2fzjV7STe3z16fTYnl4dpG/zIiACJLNXm5MS22L2rWqAjTxbXVmejuAJy4DBCgMiJBaa42hOsrJhwcRoSGPGgZD4mJGWZ0NFojq4eX7/c4HqXslESOEECCOgsd1jVahADGyBhWQvF88xhr6H1A6OT4bf/Xi6ODl8XgyS7Ns2M9Lp9NFVSyLE1c8efa6k2QZ2c7ehvcCq8YhmTC7Y9au+3aiYu2sQiJgXBTV6+Pz8/FCwKABFd8pCRE5Ky6euL1hfREpqAKzGPR0fbp6JvIUJCL171Y8PwFB7PV57RaNN4gTIJABEUQwfnJNDIIFkadfHfZ7n5+eXvS7WaeTdvPcWhpt9ja3BtYSUGz11D+6baBt3Y6+g2OsybvdxCaXp+eDjQ3Pb4nzQ15skEb4Uq41WPIMEZX5ZDK+uJxNZ9ZQt9dNsxRWWCyx5G6inN64v7wJ2PK1o7U3iMb/XT0CJgibBBQNI3II6wedJiH8qsh7LbH0n3AdtSjZ0GR6r5zx4GtlL3hD+tab9pqvLbu+/qaIE3HNu1YH2Mbvvo50WT9JNLHticHhoHPn9u5sOrmYXBTL2dn4bDqbqUJik2433Rj2ur0EiFQdgA57Osi73SQl1UdfvTx4eXz4+rT3hel2sjxL+p2uKKPCoJ9vbvZfjmfHJ8cXF+e7mwOpSqkK0HqmEglN7R+PkTsYUoKQyNgUyZAB9WB6Dw8EBTCG1HcIEZGAnYynk6ePH//jL371/Pmzk6NjZu7knbzbMdYsFsvXR8fzxZIVev3+/fsPrLVQr2txc0DCZsu9rjrG+tQRM3OaKuKN1XQEBCIAok1Mt9s5evWaAAeDoc0z8b1E31CEFj/uukvwupA6bd8dq2IoXr2oGipuTYZqhfsGKnN8EqLAlSuWxWQyYeF+f9DpdmyStNohb98U4BtgPLCtU695ZLCdKwjY7/d3d3bn8/npyenJ5snm5maSJCtRg6tyuobJKlX9PWsjhfZWjPWMS/yztUhDuMKNqb/4+nTBm8eNQHzz+AOcP8J6IKpQFZWrKmFGVVGkcIAIwwhIFAdVQuSXL01I4h7lY75E/EGZyKfDGe8xjBP1DoAAUZACqM87QAC6eXr/7v7eq4vnr04WyyLNkGwiUmMP6soWghURGzOwNwmGGi2mEkDMdgdoXgUgsigzO2ET+sXSdmkICqGRGNPWHB5aEaPrfcW2vnxl1btGGg6WsVjYYrDtYFOgQauxWitZKCJ5ng0G/UGve3x5ZgCE+WI8WZYVdw2FLqaqd1DFYk1Be73u/Xu3X5xMx4ux+GgWgTRLL+fLR89ealF88t6drUFXEUUCeB8BQPxYseZZOhr2h4Pu8XjuFMqqqpg1mEzBJ657RUMIkdGS5wyTcviIBNTTsbCB9GmNZKxxJRJcaEJIClJUbjJdCBAg9Drd4WDg7UqqguAx2aiCiATqkSMKASQiEQ2FCAYBQcgHDgmgd7mpsIqMhsNet0OI4nGeoNoeP1vNvPV2cPWu5WgG1ChziniKU9t2TkVZTafTyeWsWCxVgJASk/rtV1R9VYzKqEDR+wykAOTcUpTJABry80iLsri4OCNLWdpVpN6gj0hEFJL9RBXAks2yLEkSjzYuSycKYMikSZZ3uoN+t9fv9vtkUqeU2iSxqSGsqmU+62a9bDqZ28zmNvHItqCZqCAYBM83IwWDtcQFdUpy87LFQ1sRdYUwgnU2mKeHEvm4St8GcgQ43Ox99OG7f735i5OjV8+fHUyns+3RqCqh1mC8fuRT7H0AEfrQjlbkSXTXxMQFDf0vjC4Df2c13LCbc8i3sd3ZLjVru0rDyke/98SBR9XKuaJYjjZHWadDhqw1nU5nQn6IU5FWjHlX23srq1nojFWjYb4x6Dx/cXH4+vLw+PzBXm6RwnQLSt1ek1B21k0uJfTTD2qNsWQakiyCj80TbxtTqCpXVKUCkDHCYZ4GVSIyNZYCYSoQAp3Vr77RSu0XeSL1O34As7QcXi2bD6wRUWNCTgCa+3/p34WiKF4fnxweHSPIB+/d/dH33t0bDVM0wCA8KItivtg8vdj/8vmrT786eH56/unjg/Px5GI6Nx89vLvdT0H8tFIUAX0fMMxvkois9K+aKRQPjUZCFSHVTpZ2kiTBpSijEiEkxiRJAoR+ACMxSckVi1bOD2pIjJDzXW4AAGNMYqx4vI9oWbFkhmJ0JxE4VQXWenYKw7El7OiCoXPq4zp9cCqCEIJJTs8mv/ni2adfPLuYLHa2R/fv7m9vjorSHZ2Onx0cHZ5MP3/0ejYtFvNiOPijUceiD/gMg1KCaBBMYBthiPSj+BL8Z8GiqkDGKuCilNcn40lJiomSelhT7Lsp+QOR37KVBMTn9YGKzz4FQMdsCA2Ft1s0HtLC1i6obJAJGcD5fF1QCAQn8KhMiUmnnoMfen7kowgR1SRkkidfvT54cZxmppuneWqyPNnb2fzoo/f/9E9/tLu7mVpPdmYDQmSCmBtAVSIeFI3KcZEnom6/v7Wz8/rgYDTa2NjbNnkSzI+BH84hOglARD24HwEMEDm3mM6ePXo8GY+TNH33o/f7GxvimcvYBMq1JtJaCpPWtKWYsPTGeCJtyXwtZesNLv7rvsPNQMy3TR8OGp8KIoXlRIBoTTNCIg+g0DdNyq//gQY5ZvWCRLiO1FqnttSEsXU9rjYJwTXs0a/N41r74noatb19/5ftImsDRmj3klaQT+F2Vlz5axUksUYePtgbDdODw5dfvTo4enpUFpWhnihcXF48f3kw2uj3ukmaoCEwRNsbvf2t4bv39z999Pw//KdffvXs8LefvTw9PQehH/3ge508MQRbW70HD/d/d3Dy1VcH7z24ff/WFoqTakHaoMmdxqneQMugOnUHAMimSiY3NlhDyCBhqAjJit8iCJTh9PT0V//4j3/1H//q+bNnCLC/t3f7zu279+71R30gPDk5PTo6enX4+uTsrKyqNOvs7+8n1vqNQDgagdG0GQvXi44Qcoe0nsryKAxtK/GxcRiNKP48RIQgsrW5+fr5y6NXr3rd7v7du6pgLIkfLfYZ82u66pv8qg3NAvGtPvM3XKhNwDHVcoLvicdDSFW5yWR8fnlZVOVoc2NrezvNc/BP0gOc3ro4f811Xht4YRV24d9UWZF9EVBYrLHvv/f+cDD89NNPP/3tp++///69e/essY3m0JA4272R1nZ0zfv3De4uWAll9dwkXNfx8ZpXF8Iy9Ab8dyMQ3zz+RTy84UWYK1cyu7oulHqTjNupsBDGqaVa7wu4h+CzUqgTZjEoydaQ1kgiQjAKcQTJEHl0GmpiYHuj+2BvY3w5WV4smBUMKggBE1Dr22ptKBRA8RExUej2Xco4zRhpbnEJ99PpDOBE2LGXFFW5ZmMEdBxGxKQPJWEBAGPDNOP6wSh6iiLwqx7jVawj06CZDqEwMaw1tdeXMgDakMU8h4Na8UkAgOBEkywb9LvDXhfkGEGZ3Ww+c6ICBP41k9ahaQDIoCScpsnO7lanm6qwBwSrKLCenc9m57PZdNEd9sHSoJt7LIfP5QsbGxCRydN02B9Yc+6cVqWryso58SM5FuoK0m/xSoastUAUIIzxcBNkeGPIGB9o04xFhwpKvcoACqy6LKvxYqakoNLpdYbDIaEBdV4RZYmlkyEBJYlMCIp+AQkRdUAegyDWIAIKEiOwCrAb9Dv9bm4x4AjCNK6ChjOAB5pQLQKrikI9mh0ap16UF+E6zM5/4GVZXpxfji8nRVH65r96jHAwgSizIPlTnDYnUQDfreGqMoSpNXMVVS3KcrEsWFRAjcFOnqlCJYKqBhStscZ0e7087+SdXEQWy2LJUxYxqU07eXe40e0P004Hk9SpLku2ijbNbJ6DNRlAmiTLWVn1qzQ1ZLEWvrElvgQssVmrKEy4WGIjXWn1NsHo5I6zcjHA0gdMhuOg7WZ7t3a73bysysvxtCiYFE1AxvkSqbEj++RIVTVxYM2vKIgaLIYIkZvsbz6CVkCH1BTSGzPWt1Ml1mtHU2ucQn05iYgwl0VRFEWSJGgJVKyhNE1jy4qwtXy1hebVKb8g5HqDBoJsDXt724MsPTw+vfji8cHu5nv9PAH2kx4sigykNS47cor8NUkE1hprrZexRUBJEZSJhP36IsrMFbJzMZZT0WNkAy9Y/bSjZ9HWnbhWWkDDWYpTM6DaHjoIUSqtYdLmLO/z4vzK7j2oguhZASCE1pTl8uL8YjpeZklye3tze5BanSurAUsoJuU8SUb97a2N3sZGv/P50ycvjl4fXlQL1zVpL393s2cNetZRC4EZKPASKyVtbZDtL6ub35qlaZ5labIoC7GI1lCepWjIqSCgIWONgSxzDBWrgLEmpK8qAosWRTlfLH33kMgAmdmyevH6ZNi5Tdbz/sUH3ukbItLjuAoaRURGj54AZEK1phR6cTZ58vJktqh2d7b/j//6x7f3tob9XEUvJ4vPHh38L//pl69Pp6+Ox2ny6tbuxo+++9AYYHb+UjHgv5tfcCmcdDwKMRzKqJVaaAABjSWbYiUi7JwTz3hQAVGDBEF495unAIgTFq4898kYAwDMwibwUEXFNPKw77gIxWRQgtD0FGUWVu91QxAQg8giCv6dBotkLPmOr4i3w+F8MRu7SpUtISKYBB89OXj61SFB+sd//IMH9/eSBMMxzfclIeBiVAWAAQXI3xbBTJ9181t37zz67afPPv8SEHYe3DWEVVEycOjXCBKgQUQCD6wgIGS9PD59/LvPTk5O9u7cvn3v7nA4Er+CSM1OXPOg+UgfMG0lZLUqvlYO0KblEQ9F13gtV8r3G0/xt3gbm8/mk+mUiAaDQbfbfQtT2BtJVVdowm/w5Hpua5BGV92CdSbw1wpu7eu4NYASyp2v6WS8pdVxlX3/e7ueVvz7a7zvYGyqMRkaazP/B6QR0xQAebXiLfUoJ6qCOEDZ3Mzy/u2t/S6myfgXX1UuOT2fnJ2dPD88uH/3zuZouLu9sbO1sbnRTS0Ilp2+/e4PPkwGvZ///Ld//7NPD48Xf/03v9oYbr/38N5wkHe65s6dzV5Ok8nk7PyiLItuakJRGbY1VRAhpzXrF0ibXHEQQeZSNLdkw1/F7D7nGIA8WeLy8vI//81//st/9/87PTvPrOn3+z/+wY//5M/+9P6D+0KqqEVZPnr06Be/+MWXX375+PHT0WiUdzq7OzvAHEP/vpHHswHjiEQ8NrZx7Nc0RFq2aPWnLzLvv//+q4MXL5+/AKA79+4mNimZRURDIxyhhWd/Izi4AbM0ludW1LkP5XtrZ6UV/IqgqD41IvD+l8Xy5OT4/OK8Yt7d39ve3knTLM4r+47O1wSefP1b+uZXd/XfEhECkqG9vb1ut/sP//APjx8/TtP09p07hoiV1/VZjGNg19x0+A0F4rq1Q+EF4+91097Yh28E4pvHv6gOtc95U2ZXlgWzaw1t1EPjYTeSekJEryilWG+edY6srt75sfD1W61XfJU1xHkqKKfE797ZPj8fj2euEPAtMfJhVkHHdt6VGCU6DxpVLwt6V1Ss1QnCdH6MDgmpqd4TCSqqfnZfOEqLFJ0mHuEvouocu8qJaJ7nQRtHAPDBXAHs58dnPFdX1QaUj6rPnoXo0/IisfF1BUZ/8wrmNdTqorU3CmPOLipgxZLkab/bHfQ6BKLCTsplMXciCkYBRCsDggDis3CCEZjJp3AT+agwIqPCqKSULUWOZ/zbr44n89nHD24NOp2UjCiDCHgxVFVYrUl2t3eypy/KqlwuF7PFohLJjFEVEKE6i4wIQROD1hOCQ9ahtkIuPEOz1ivQuzrro5yCNzUBsxbOTWYTsKAsvV5nNBoRGS2B0KBSTCgLjYB4rPXJcv47g3frecooEqAxrmQnAGTJMoD087SbJVoVfvYqWr58cl3gH0AM/asj9YIQqcRBbQlXcsxQwqqsFovlfL6YTedlUYoohYD4FTuGkqe4YJBNfV67KqIWRTGbTETYIiXGAKgxttvtJzbxNhJDqKrMIqqI2Ol2et3eYDSySWbTBAiT5VKMqVj6Gxvd3qjb30CTKEIloGQFpXRiygoNOeaC1TIW86pclFnHpolZmdym2OkILE+sTVH1QuCJrhGC2rL0YT2lHz4uAFBUjl7jQLpEJKR+t5eniagslm5RsGidiwyIqBSaJvHKCe7FVmRLmIbWGIgXwwZDCFe0THpZQSOZ9Ka6/jZrxG3DbwhbAyGlml/kXFUWBQB0spxEQMUgpWmqsX6QsBI3MKPAxFkZZI/bof9ikWE/v3d7++7+ybPD8avj88mi6uS5NUa0ABRFdH6hIiQiVgEBMIgRHGysTaz1gpf4fcCgiOdPCIEQKiEqiwqrGK+comDYWYUjZSI8bw+XY+YVBnF8hWHqooanosZ6tIkWCGnqrffTm0dJgVCBSLieE0AGrZhBlRRTpBTVghMRCT9IAMAgbvbsd965Nez1hp3uo+evLs4mnz161u8kHz3Y3+znxqBvqK7wL0Qi+NX7XaXGFhF6g5S/u9EgdvO010mzxCxKTlKbpRn5USf230NBwZhkXrjDk4thntzdHRGR+HkSQOd0sViSQbJkkeaL6uXROQjfvX2LkiwxqFyCVBRCdFvR5o06DKpKvqfuxyhRFETJOLKPDo5++dnTV8fnm6PBn/3xD3748XsJCoJDgEHSG3XfnxXF//evf7ksqlcnl//wmy9v39q9t7ehshRwIEzAoAQkEinDtc6oGqxOgVNPVhGn0+nl5ZjLwoJBS9bYsnJlVQkLKhgkZQnLN4GA77k7ULGIeWLzNCUiEfbvj0C9J9bbu4IoiiaEg06+t7PhhFiNd1EHe7qIVI4QBG0QW9SbBUiVWJhVmKXgYnt7A4DLYjmdTatSikIXqvPJ4f8k/+Grrw7+/F//5Cc/+u7mqANcz/tg6xAIiBL5Z6iqTiQ11Bn13//ko0eff3H+9z9/OJ3s373d7fc9g1j9IBQAKqSMsiyV3Xy+PD85fXHwfFEU73/nk43d7c6gV4Ey+7BIBPTFcO2Wa9wAuCq8tQAva1WxtHQxWBGIsdHaWkfEawbXWgjam+3s2/OYzWaPHj2qyuqdh++88847PhZy7QIQbecJr8tz1+hH6wgUP/q2Ki3heh/iG+g7CN+Y2nVlun/9r+q/JaLfUx5ed31eLXgbIJR39EThD0NhauojedQE2wwpQlGDoFgyFmkme53hT7IfvDwsn7+YMKgYfnZ2eTIrc5v38rzfSbc3sv3d/r0727du70Dee+f9B/3R5sZo7+/+7pcHry/+8t//3XQy/d73HvYHZnd3Y3t78PLl2fHRyWw6Hu5sVajouYwIAALIBK7l2SUFI/VEvyKqoKoxRJSwaCV+vogQLSAl1r56+epnP/vZX/67vzw7O9/d2nr/vff29/b+5I9/+sG7HzAIpKQG8k7nk08+GQwGiPjVV8/+8R9/vbe33+/1+t0ul2UwZMDXExe19QgSbJs+DFe+RVSHvX2YFBEgzWzXphmax4+ffPm7zyYX44fvPuyOBmiMgDo/CUXY9hFfRVfX3blr7wg/IHw1+3GttQCNAUkRkAgTY1FgNp3MptOLyeWyXPT7/dHGRrffs1kWjeiAhjDGdL9dTP8Ges2Kuv2mfaHdZTHGDIfDH/3oRy9fvnz06NGrV6/u3bu3u7ubJIk/DbYDmdaewmoy6n9F3bbNRL7pd94IxDePf1HFtHBVuapSlvahABuiIdajDc3Q6toainH0/LrDa028aoNm4snYH3MYwG0Ne/s7m8+PZ27uVP2yX88DaWs2CBsaoyh6fL+SeD7fipUjioUI1sc9hARSjyaAlu/Hz6VL7XMMJkODAMJAKBrAquiNpBIdwigqzAFqHA40zZR7y7kIoegiQ4Ckom0Q/noGWguEq6qooiAGsZNmvU6HkEREWKuqYl/rahgQrhMM/OmGEBZFdXp2UVbsqR2ebaBKeadLZC3R5UwtLu7suE6GifFuMNY4B6oiRLg5GubWzqEsi+WyLFkFMPGjzhTeTX+aIiIKyWD1awm2BK9cSCR4YBvoFNGY4SgmqqXj+WKhIKKcWJulKSL5ur2uzbShSkXCrFdcA0SAIihCPAHy5PxyviyQTJrlwo68Hi91TFOs0SIkGFVR1zqt4bL3tvEYG0I+dhAAyqKYz+bT2axYlM6xf7EaegWwwtaswUyNLdkfXlWEJ5OJiJRFYQBAJU0Tor61Fr1T3g9XoaIqEeVZ3h8M8k4HyVBiTWLRWgEoStft9zrdbrfbY6CKnXOMQESGmSvnTEUiUpWVSyw7qUrmigFsIESv8tlaFLc3yarXd+AbR2doSIX0SkZQAsGgOXeyrNtJDZllpcuyYk8SCTpx/cO1bedsr0jYtKawlSpYo5CxCcKAmzr6fxfS8FWHwvr8GkJVlYvl0hiTpgmwAIJBTIxtoqq0XsWvLFv1BuaNWE3kJljC7c3BO/dvvTiavD6+PLmYD/uDfpaoluFaDbsMiIQNliiJKxeSoU632+/3MAdMEjSo5CkGZBEMMilnBP1BzxhDhGDQOWkcGAgSvMORoeQbma5idkli2zFBrFxHvPjIs7ib1O9n2B9Xy5C46IVll5pRECQfK+nJTIt5USydTTFq0gH6QqgGdaNrs9tb7BypfvHVy+Pji88eHSSG6P7+sJtaiHBfDB4qv+n7F4RtlS3QKMgPe4AKgmbW5EmSGKIQWK/snBNXMSuAAPvF/+xy8kQrcsXuZr+bmwiwJwUjShTGFMgJzAo5m1ZfPD/a3+ztD7NOgt6ODkFdrJXziNmBIFfHayMkkiPReF4+fvby4NVx3um8++DOBw/udC2CCIsiSEKy2Tc//M47nz09eP7qbL4sD48vD14e397dRrXobdRh5lkhzNrWBOH4QYSLl5DMfLE4OHj18vnLar4Ybm6ZNMm7Xac6mUzPT85TY/I0U2bfSVBCIJzMF/NKxVCa2H4vzxIb1lBRFrFtaTiCohGUVEmkk9D2Rp/BAFqtWd+qwOwtAookCqzAoMwASs65qqqYIUk7ne7Wn//ZT5F0Ph8fHx8Xy2oxLy7Ox8v58vjodHI5u7ycqpN//ec/7eW574THYfwo0bbUVkUUAla1Bm+9+2DJ1eHBwcFXTyt2dx8+wMQikVfaWLWsyvHR2eT1qVSVc1w6Z9L07t07G3du2TxzlkRVFIOsANQY+qLs0QyY1fJ57ddsgci0sQJAQwZvL2JXkOotYvg1ORagN9vat+dBhowlYTdfzBAhzzMWhpUegALoFUkFr41XecNBTUPxpO2cMWi5gGv8MbTjyRuTclhyYSVv4m27c3Qoa3OgW5d4IdJe8boOPmrrKF17k9ZMS23Ayzpho01LBVxV1xG0jldp9dtiYaHozUrIgBVihQRkzGg0uHvn9uvDOVvd2N3sdPPFopxPi2mhy3I5K5aX8/nJ5XT79ZntdGzWZzZobX8wnEyXLw7P8s8eU4Y/+NEHo539/Vv7Lw7HF5fT2WQG21sYIlHqNPlAbotnWUVgg8ihNLa+lamsF+PL84vLs8uxE02zfLixsbd/63x8+fNf/uJv/+5nl+Pxw3v3vv/d725sbNy5c/vO3dtJbl2xVFUQQKRet3vv3r0/+t73z88vz88vDg5e3bp1p9ft1X3imszbBlDX1VId6xKGmRANEZCpxYTGd4bkO7wxVaQdlYtIqEiK0BkN9u/eBWNnk8mzx4+3t3e2trc6vU5qbOlD0mvUPoa49gATC0VWGJNqpqDiEK9nP1GY+11vMzTgR89HErCAFo01Rko3OTtfzBcVu7IsEc3G9nav38u7XTKExr/YWIQrosJbBOjrKpLwtN+kl37DSCQRIaLRaOTVifl8/urVq8vLy9FotLm5aa31wb7tHOOayfZ7WfjXki3bmu+1T+yqOvzPmBu4edwIxDeP/zoPZimKwlUOVU0DOliRWMlYH3t1fSkep1O1Pk20RM/WEK7AaqRp+CZBInZ5kt3Z3947GpdyOXcOg8An6lWiEAKONfQurCzGr/AGA+rBW3X8Pw31LbXGJLydh5AU1XP3BCTOEXuzofFVlUEgAwpKhMLs6X+ICigQRhc1qKIAEvFM/t9ixBa35mAjwEsRxRdistqpWxffw1sUGqsM7PLMDge9NE2WogBUVlwUlWOxBpvCUEDqERiTTi4nzw8Ol8sqTTqlA+cU0QCYTmfQyXtEBgAXrpoWNGJMLSgwgHMqqlYVVYUQh/1ur5uP5/OiKBbLonKMORCRini6LiIFvBQ2CeoYr43QFvDaZp2F19Ifg5cWFQAN2hK5KN2yKCGQyNAaQwEqEnZ3bcUJesE+OpkDdDPs+yoe0VU5ffL81enFTMF08sxVlatcUZQWtZ25p2vGQGzHIWrwySqBcqM3ISKCc7xcLsaXl4vFsiwrFWhReBusyMpJwCMelUQUQxtc2TEkdjIZl2XJzIk1ZEya2CxL4ty3eA3diyFkKMuyrJMDoRKQNTZJkjQDIpzNfYZ76cQTu3z4PCIBcFmWxpC1RhWWxRIRhZmZIfA346cGTXj1yghiQMxoA5L+uv53EGvjeiEI4sEioEah08lHg36a5suljKezChQo2pWbH1oPl7fb2qGp4N2QwbwfDSDYBuW1Wgo3MvG3Thpe4eSuHTSbVlx0yHrQzWJZFMVyZ2s7TVNVFRZCTKz1FxMiktYqMLQCLVvyWGzs+JXfh1WT6rCXPby3+9svnr88mj55fjYajLKdgWemmyTJel1VYj+voWxMkuddIHBcOWGbmP07d74HHabMZpmPoWNFAkoMGRDlioC3UsxACBWsA6niOR8IjbfM+5uXkMiQMJdltVwWaZo2wUeh0dm+J+qJjlDPR8dKfRdiTUzWOAoj6tewcOuJArMCgGM9Or64uFjmu/1aa5Za5jJiQAbWfvRgr5Mn3W7297/+8suvDivHhPb9O3ubvYRQGNhvq/WERwBNEBGoZ0WLekowgngEn6iINaaTJXmaGFyAiKsqVmVhVlYFUWJWVS3nrppNM4LSSZdQwDdISZWYQcGppwyDGS+klOXl3/3q/t7oz77//r29DUtWxTVvTDAYoWrkDcdtXQJQBNCQMdnFxemTr16eXVx+58N3f/y9D25vdaFaxkpbEJhE3r27/dPvf8Tu86cHR6eT8ouvDr/z0Uc9Q4RIin4kWpRbYTkaNlz0fwU+w5BFnj978eTR0/HFZGfU2bs1Qkpu3buf5Z3jk9Pf/PLXo35/d3MDWISFlQERLL06Pj05HxelZHk66GaJIQAgJBYhZki82ZBWU6r8jiD7d3bvfPIeo2VWUHWOq3JZFctquTBI7JQ1Eo4NMGtRuKooEbHX77773sN33rn/r37yg6paTqfj8fhCWZfL8tWr1+Px5B/+4dPPP3v2V//xF+cnZxujnR//8Ls2M/4aVQFUQ2Q8idofKgK/G8EhiEq2OfjwB9/d3No8OjxcLhcnpycmSZLEJmgR1LlqNps++/xReTlPje0N+hu7O5v3bnW3thwpKyj6sw6ggJ+AqWFFtT/xmq0wDq1fT5aI5l9cyYqM2cSga+4wxPW17ubx7XuIMiJ0ujkS3Lq1Pxj05ot5WZTrvfhrkk7gWicgNKJwnRgM6uE50QKPiH6iZI0y0Th6m80BcSX4rdWu/5ptGttmg/Ww66CrtRTe9aQxaUV3e9GPmiOevuEprESAtYyk64p5MwNbt/Zic8+nh/t0bFFgNERIDDYx2QcPHx48PTm7HG/3+/t370zn5eHRqffuVK44PJ89e3muUioiGWtMipDMxks0ds7Vo+eHcykkS/fv3Nvdv5flB+Px/PJiGt0+QAjOY/cxptXFGOgYVaoM7Mdt59Pi1evDX/32ty8ODy9nMwGwSTrY3Pjo4++8Pnz9jz//x+PXr//oO5/8m3/1x1vDYafb2bu93+3nhRSQAABjeMOp1+1997t/9PLV6998+rsnT57nnb4xyZ39rfCWYzQ+xTRwrc1XYRuObVtL1ibe/B7ot634WSKDNlCxavsXiAKBEgqiU3ComNrNO/uj7c3Lk7Pxydnx84PJ0XF/YzjYHGbDnu1mjMo1fbIViRYiZT0B3wcfQZ1WF/RqQ/WL0XDdxWHpulowiAbQAiaKvCzG55Ozk7OLi0uT2a1bt/rDUdrP034eKEeEiCY4lukK7vqKnBqrTl2/iykeKK4Y8r427qitJ3ipdzgcdrvdxWJxdnY2Ho8vLy+Xy+VgMMjzPEmszw1as/YTUT2a8hY5un4y/uu/Vstuw9netCF+I0v1zeNGIL55/Fd8IHoAsXOVqFBoV640u7yAa7CB2eFa1d36co1lul6ZfdCVv1w7GUcvllTDfr6zNbiYLRbjhR/6UEDBFltLILLZofGnQoMWalayFZpbeCFENZ+PICbrENQIW6/3mRWUFSqiRxgLBdsOAdb7tWf7qSjH/TEcvlYXOG13ttcsw4jY7tf5/6xPdooKooTkqtIa6nU7WZrNFw6NqRzPZvOirDrdTKIcIIripTVRBSwrN18sRdHapHQsLFmeIBkig2TIptZkAEXh0AnU4/lR6g6OL2uwkyVEwMxlVTknWnca45OOvEXV2i21qtBprGtqs/D1mwARgFRO2FMKW4e35jJAjFeUwHoiMyqgBqpDeCaINF1UR6eX00UhYImMQee4YhEy0XuM7QNkPEQ3To3oxPNCtxePMOygzvFyUVyOJ5PLKTuHSEhUsymCEWPVkhDLPPVePx8SJSJlWeTWMHNVlcxMlBlrwm4dBq79bFxt4CC0FApQImutTRIkk4ouS1eKVk6gKJAMEJrEAoBjEd/QECZKyBjmCgElpBYJGGqOUTWUW69amlY77bVB4NqNH2uLW5xM91dPBHBkadbv97I0rUqeTubs2ATHQnvyNsyCqUITLBEwIyAtJbixogRbV81IRmxncd+U2N8uiRhhHbx4VSmuPf2uqsqiUNH+oG+TxEudhGCTBADVh6EArCAdFRvz35VL3JtoJJhAadRLdrcGL17PXh2e3721vTXsdAyhmjTrbG7tINqycpVIJWxs0u30kHRZLhZFKQy7t7J0tCeUorWxqYJeHQJhdpVylVcLWEyVS+9QISKIxh6fba5xDSYiVRGRqqpExBjTmGtWZKk626wWGvCqztDauEkRBHwiae3x58q5oqpYwAmcnM8upsXu9sggo3KwJ3vIDJETJuVuntzd31Si1+fjzx6/eH54uj3a2Oz2N7pbHvGrQWPjxuyFRCH/mrHRHuoYFwUVgzbL0jxLCEGFQ+Adokrcj/1azlJZI0iC6JidB3YosAA6h+I8UtYBllU1W5avp2cobvbhO0AWxNU1ZaydA9ombt8QJ3xquBKJg7OzyfRyTqD728Pb28PcCjvxq3uNM0oAP3x49+Dl6dHp5cWkOL6cnl3OOluZ8QkKQNIaPmltlNjaJ5GQZrP5ydEJV9XWsLu7t9UddIpKd4bd/nDTqh50st1R/+7uJvioQxUgIwZJlUAvp0tjTGpNgAQTAmiIKvKw3RVZlByIWnP33fsf/fhHQnaxKFG1qqrF9HI2Hc/HlynZqnKiPrNRTIKAOJ3NxXGWpTs7O9/97if37t/vdfPJ+HLQM/s7fUMkog8f7C2LcmtrMBx0/+N/+Mdf//rJ3/7tP7z/wbtZPiJjAv0bDYAJNoDIuvfPVQgFAUDTPLv14H5vOJxMJ0VVFFVpyWQmIUDmqigKyrPtzY1erzccbWxsbdpuxwUhisCX7ZEwJvgNE9+bALr1g7HWNoLrhvSx7QlvS4I3gzDf8odjJ8Kdbmc4Gu7f2iNDEYZwrS/v9xRT8Kp82o46vAohXZds/tkKDq7dGm9+fmtlVET9ryjS9WjbikBci264LlThm961WM6GCcI6NaNFrkFFq8bnXZBjWzJkeWdre1SUy2I+G5+fOyXnSk+RcsxFwcuFc1VZlhU79gBAFUiMRYLZojp4cYJ//+t3zuazBSfGOC6ni8KJmCAseo9QGNHF1U/MeWghkiKNp7Oj48Nf/ebXv/70t6ww3NxI8ryoqqdfPXt9cnZydDKbzPb39n76r37y8YcfXJye3trfH26MBIGVvcxeJ98QUr/f393dGzx/cX4xfvz46WhjeOf2joYtAKHVQA7vGmEInYEgjNbhhkVZVlVVOVcsl845ZvZjOWmaZlmWZZm1Nk1sYowqiIoqGAVpfR6GMOt27ty/tzkYHj4/uLw4ny5m4+l4sLc12tvCxAIaRNMkknhrGYAx5EeDa3EgjPRE/7hQExFUX48YN3SKuxspiHPLZXV2dHz88mg2meW97nC0sbm9bbopWHIoLAKABk3cEzH23q/iNPDqDrH6n8F7BG+1017LGY86SDzthPkdsdZubm4Oh8PLy8tXr14tl0tVLYoiz9Msy9I0sdY2s57G+JRIkWZC6C1P45/g/23r3YESRlRrx8x8swvcCMQ3jz9kQa2qzjlXuUYLq+mMrTBLMoRE4v02rW1VVlclIhLn/JdcxSYE9bLlL47dKSX14SVlN+3sbvVPL6ZnF3NvNZIAlJBWaa4YW3MSvmHwL8eeH9Z+rtjTRBE2iASkAswSEvWasjaUceJHTij6fzVYfyw2qzASAiWxDa6oSKQiBHEe3r9F1IgLvgdX15CkPlRO1/WL9pyXSKgMJNiX1FVFamg06Pd73ePJeZJns0Xx4vXR9mZ/o7fHlWN1GvRr6+P2yCEQ5Z1utsAK1FQFMxuTI+CyWDrBNINOtwNKs6JyDgCM5yUhkioGj48qImRZikROuCzLsqpYwuRTbKkrh7raRwUq+Kx1RFRBP+eqFLJdoik3SnwK4qdOAztYBETReeeYxLwx9f1nMURAip7/K+JL7nZYkb+EFdAQInotm47Oz47OL4tKwBKoClcGySYpiBPh9TyDesxIpbUF+xge9dYA/4tZnHOTyXQ2m85mM1cxKAJhKEZr0kVzdwGgd6wHX57EcVgWXlblYrFIsyyxNk0SJjIUk9IVfKZQRPMGKccYQ2SiZEKIZE2CxqQZDpBKUTSZqBFFQrLWLksuqwqbhg0QkbUpKDgnlRNWMAAq6K8kbUnkUL/s+ii1epIPRwkPWolYRay5J5EnbAUSCTzmsNoQdjv5xsaom3fPJvPJeMYVGwMBJx1kPZ9Z15KqW2Vyy8gQWNQCKqgCSuRFqRraEo79N6NM374NLU4nfu2BVVVhPp8tFwsCGA2HxhhVFlUik6apMVRVwZK+dhD39yJEoFA9/9k+6AuzNbQ56Lx7f+/R0+OXLw8P9gZ7271sswcgWZYPR5s2ySrHlahDQCRrUgWny6TCeVm4/jA1XVNUWrKIOBZmZufYlSUzMzupyoKXqasCVgdJmyzXYNX36AoPj2ppUioideVyNQS8zbBbV4ShffeHoQ1B4LALB4qSiFNhDz0/ny6PL2e3i2qzQ1BVoIJAouAUUAmBFITA9TrJw3u7P3V/dHY5e3109uT54dagt7e70TeGtYoTKKGvqA0QSgDU698+Tc4vBkRoCJGgkyXdTmYIWMQQgiHHCMz1nBMisgIgoU0UoHJV5RxrqysoCCFLHj2fvhICSpIst0kmyyW1YsBR6xNHxNirAqEAhdAzJHFwuZh9/tnj6WSxORze3h12cyRwAiAgqD48FxFBi+ru7t7d/b0nL05OL1+fT+fPDg9vbz1AAhURJYmzNP6t9x8mge9Nkm+wqcr56Smwe3Bnp9fN88w6kWpZoivQlUZcbjEnzUlZnAIrgX/Cg2627PfYsaimpAkBAhMaEVARTzBERCDTxAqAOmbN7NbtWz/4kz8h2wFgEFWQcj5ZjC/mlxe9bkedIiUAKsDGKBosixIBDVGaJp1eF43hclFVs7KYsit99GiWabeX/sVf/OjOndvLhftf/t0v/j//81/+63/z016vszHqq2PvFlof1HsAAQAASURBVBNBERABMoRchy4GgbhiURZD2B0N0m5eLItpsXBlhQzGmCxLu4P+rQf3005uksSjwArnQAHBkNbSCBggDcEBv8ejhnrXN1Q8wQJc55xqt2SuE53XVbUbz9W35pHYpNvr3rp1azQaDQaDi4sLr5i8ZXD7ylb4jYtA9WnM+qbvc8XDHjWob/BTVqQruGbYTL+ZBPbNOsT/zIfEdIKmqoSmLQwlKFGClAtBybpYVuNpcXR6Mps7tJh108lkcvH0CRh7OV0UFSNiklhrzHBjmCXb89ni8mKyWC4qV3QyO+hbdrxc6Phi/unk0aNHB3l/k1WsMRfT+Xi23B7kbskgQqQIfpPFVlKcCJDfyE2SLh18/ujLX/768y8ffbmxsflnf/pnP/zxT7qDwfHJ6V/9zV//zV//zcXF+M7t/Z/8+Iff+e53XVHu3bq1ub2lBKJqjGFlIp9rV29oYAxVVemcuxyPDw5eyE9/bK2p919tUooQfQQAUm0jVVVh9pbVo6Ojs7Oz6XR6cXGxWCyqqvLHp263OxwOd3Z2bt26def2re2trSzLA6exBhYD+iJ8qVKw5KP++8PvFIv52fnp4fHx68ePt+bT0cawk/eyNDN5Zkx9hkFjyIBRhkoUqA4kxJCygD6fBwTECBgNMarB1hNuChDmyrn5spyPp9Pz8auDF920c+/9h3cfPjR5ulR2oA1uCzG4FGKvN1zDX3vXrkyWrgokv4/YurIdtGzL/nNxlSOi7e3tnZ2dyWQyHo/n89lkMk5S28nzbq+bZ3liEyIkYyrnCMAaE4KV23kvaz3LN8b0Xv9UsXGgQw1T8nYrP1xeVdV8Nr/ZBW4E4pvHH7CeBmDmqhLHBltZqdoUiv5eJjKAcTQ8+gQVUUWwpaohAJER4YDIaw/2qjb77BVDhOfuIQFImRrMU0vk08woyEwBLRtS4QBUAASAPTWPfa5anU1bm1gBfOCYkh+9FSBRYPHZ8IGa1yITEQMqGCBrjRe5GAVUGMH/BI0bT1j948SMNOiuyGJWkVok9nI1tCQtr6evVQ5tgdiPCCuC8T5LAFRJEzvodQe9nvAxQmdZLo5PzyeTGdz2Grr/ABlAQAiAUiAA8AMkSGKsiTqsTqYTwEXerZK8A8plVTKrV2PBJ88BsgqLVKoA0O11yRjHWpRcFCULexIHkWHnan2WNJp+NRSrngvSsnapiJrVU12kSVLzXiFxgE7XwYIBTAW1uzVIGlrrfs37CYBIooyqZFABjk8vTsczBkqM8R6tQb9vbcKVf81RBw27e/wmoZerPl8wQC04KFEiulgU8/ni4uK8qioRhThbpEQqKMpt80WoqON39gZZX2lb8t5Dqe+XxBprSFWE2QcGIbSSkMDzJYy11loTtn/nZvOZU7VJQiZJsxxF0eTGdgGN+LOlOGsM1KFBKmma2gQ5Svy1ybZJyvElts9y8CuD1GWDvvGkErtMup6KjYokPnLOX+kCoNpJ02GvnyU5l7PlvBBXPw9/RoSa8qFrBhC8vg7HaG24dkjqm5+9bh7/DcrEb65vwdMQSFWn01lRlMN+r9vpIACrgAgiJknig1L8hYforyhsI5WC9Bzdoa0fEXqBqJoS3d4Z3r+9+bunJ4dHF8fnF3tbfYu2LFxRloAkimgoMRbJqIKr1ImygmMtxZ1fjM8uJouiYpHZYraYL5mlqirHTlVRtI+8O8h3Bp3MgM/kauyzNQHXk5YkJHj583e4QSiAkJr7paUBrJQtLUjc2tsrGjox9QKOiN0s3doY9Lv5+RwmZfH8+Pj2Xn+7t63AkcoH4hEznufOTALWpHd3tj56eH82np1fXDx6/vLu3d337u4ZSkScKHtHj/NdN/U/WMFnsdVPVERFDZJaqABSa7I0sYYUMUksGKNYgQuzrgCAaMiKTZMkSWOhg36vNwTGGFAQEY/m8QRKRINgiKwxJkCjAQEM1BCkKIMY7/kT4GgpVgEnsCyr18cnRVHd7vZ2RqNOYsvlXMEqAKoQIJJhp6xqUzMc9DZHfbKH88Xy+PSE5S4aDUUfEoBrvKhaV4bh0nVVtVgsuSo2hj1rjLVkVFQ1M5QaTI2mRhNSVAZXWhAGx07ACJnEomQWMktO2BJYEypEqo8uTX5gaJYrs28ymyaSwY+K2CTLtZsjdwa9LgAhpQAIyiAODGmXfDsPVTCMT7GKE6kcV949qcrMLk26d25v/emf/fizz5+8enXx+RdPbt3a2xgNFRiENfwKb4TUU0wKyqCkXuxnvynbJO3QME1FBFkIwMciJ90cyDoFUVZWH3aHq/xxIMUVetE3keRURTCe+mJCpFxV364tqq80bABaDVpcn6O6efy3/TDGDPqDjY3NNE3H4/Fisfjmaml9zvx9BFZ9g5l35VxXDzsG7tB/CYX3v+ws+dqT+b2+OfohiRrXozHpOCAOSdGwTVlofLE4PLo4Pbu8HM9my/miKsuymC+mi8VsviyLigtmABptbDx4552dnZ1eN3clP//q5Xz6dAmFIcw79sc/+d7+7s6Lg8MvPn968OKYuZwWF3mWUkLnl9PXx+dbwwdJmnMlwBVAjHPGOqEVGHzAdsKCR8fnv/jNp4+evugONv4v//3/8NHHn4xGGzZJjEm7WVecIoA1FpHImn53Y9DrKqGAqAoAGS+sto7TZMxwOGJm59x8Njs9OVksFhsbQ4+pb9WqXlQlBSKiJEkA4OLi4vDw8OXLlwcHB1999dXJyclsNqvT6owxAOCcn9VRa+1oNHr4zjuffPLJRx9+uL+/PxgOrLVtECWrAmJik4pVRamT73bubN2+dXZ5fjGfzGbz2Xhu0HQ6ebfT6XQ61lprrCUiViLKkjhi62UPUCFQQxFwCZbA6kqTTUTKqpzPZ/PZvCxKdmzQdPu9H/zkR/1uP806FcGsXECeqkdYiKxkozS/ghxwhRTeXvZlFesCNR+szlyhdoze1eHkN+iwXjfxeTmqasgoqqiw4zzPbWIHw0FRFLPZZDqbjScTa0yn08nyLEnSPM/BkDWJJZuA71uzrqXAaOMtbsvECutYjPZR3Bub6mXET7ZNZ9Ozs7PlcmnIeDPE9262gRuB+ObxByylhaVyjkXC2PYqXKLdfQrDcavRzPVhuf56XyyKSDOSv7JnIwAhytrCEXygIqhsxBkQQmBmsAZqlCt63iE266aIYw6dMkJUaj/nULjWyjT6vFdiJPHA1xj+BohAJEBC6JTm80q0FGUVTgxk1mSpzRLyvUEPz2MWMrTS8APFwBTWGsfRNKDrl4Fv69K33pN6jQdQMF6fAyVD3U426Hd9xcuK88VyWZSqkCQJ+OJYo/cYwaenFkU5m81mBTsHNkkEgIVn8wVSgjatqgKRK4fOOXaEDKCkosIqoIVzFTsF2hiNjE2RoajcbLGsKjYWibxP2BurCcXzgmP1iIBIgCIiwWTku9NRsfNpL0FUQFJA/3EoQMUCaJCIDFEYEhKMVRqHHxrYmDV9Ksq5qOqLeUAAUVgUxeHpxWwpSgkgWkN5r7u7s1WnzDVk0WAb8C0OAR/AHpPmmq9SKIpysVien4+Xy6VviYMfSPK2Q/8Ko6jaaCs1aSGCSOaLBajmiESUWEudjg+LD4wxz7IwpMIxDwQBwVNOiMhYa4wBBFEBQRZ2sxkgkUmADIMmKWR5qiSAQIasNc6ZIA6rikqedxUcUL3HowIhMULAd/sPDmvOTH2+wTdUEasd8RWPvJ9KDtO+aBBRCRm0KmBamMoloMDu/PS8KlxmE8DgFAxRkCTGGn8n1sKE7yPQakKCMcZaS4gBwYV04676tuvCsJo72lyQayYmf4mz8Hg8Zuc63U6SJr4T48WpmiG/GqrexEw231bbE9/xngbf7VEC3urnD+9tPT86Pz0/O3jZ//D+7dSaclmcHh9TkoAxxmZJ1snyDADKqlwWy/myWFY8Xy6/+PLLp89eTeZLVqwcz2czZRVlRUiSNE+zgRF0wzwl0000Qn78FhtqEvVim48bDXE3LSG4ycgKdw0FWE0bNuxfeVt0aLV+ASFyODRMmKJiN812NzcH/d7ZYlL8/9n78y9LjiO/FzQz91julvtWG6oKK0kAXFtq7a2nnnNm/lb9NnqjOUfqd+ZJTXZL3dxAkCBW1p5VuWfePSLczWx+cI+4cTOrCqBen8cWlKGFBSAr8+a9Ee5uX/va5ytwcD56enh6a3MwsAaANbIBCWKSngaVGsAPMvvdt24Pz8++fPh8//D88fPD7Y3BZi8DldC6FVVVhmgfbjiBtVYfGdOCiFbAqxpr8jxN81Qrtda05kFq1A8oIrJIWZWiHIvRUMoimgARCvOykbisgZkYOAsASGSkNaBQczGbOyb60rEGRwACI4xm0yTDjfXuoJcTICCxACEIh6670QDRV99JTb+TZAbYyXw2C8YnEWxl6sTSVmuIFgCWRVnMi1kxn81mrirz1NQx94ACygziUX1iYWWQdbsWwKsIqgTwWDhOZZZ6ncR7MhREcSQikIZHH2XTmEcESlQHtorUTXyCBYIKgzmPUFH8IgIohPxJmKWm8NqgZmwSxIRb75lIPVS9bv5nP/ng008/+3//x19+/PHv3n77jXfevi/klBSIAQVirCIA0cLZpUhMVA/JxY0/SQiNwXisFFVCVLTRHaeEshjnxhpiKfUi0PgQWitMk+51ObG55i8FsVtVl7PpVGE5Arq9vb5qDKL9RdcG4m/TFXw4IlKWpfc+VGGLmZVXdA6u9kS/znG8XHHA6xCir8GGtr/wj+q7X+WTwisG57+BKPzKl/YNbdfRFc1NwoWJGedkAaESmZfV+eji9Hx6djo9PZtOJuW8mE/n42k5yjJaWenfvr1TVfz84Gh+MlLUcj6+ODty1UwB5rNqMqwUTKfTVVEEBijfevP2/Tdu725u/dX/8beH5yMFZildCQ8ePgNmcdW92zvdNAHhGqxIdex2dFYJoDXJydn5F1892n9xuLa5+W/+9b/+4Ps/6PX6iU3PL85/9/Fvf/ub33HlN9bWCWA6mQLAYG2VNGwGSGhEW3HirXctz3NjjIrMZrPTs7PReLy2tqYgYQq26UshUYAre89nZ2dffPHFb3/726dPn56enpZlGWzC9+/fX1tbW11dzfM8iL/e+6IoRqPR2dnZ+fn5g4cPHz569Mtf/vLu3Xtvv/P29773vY31DWut905VgEhQHQBaYgFRIVAis7Kxnq/0vXe+9Fw679xkPJ5NpmGfqqrKOWeN6ff7vbxjjAFEQYTEkDViMM4asgALcGQrhg66805Egq6bJknS7eVZp5vnWZbbJBVAEVZAIQyUPJJ2wzCSN+KqLCotyxrUyTrt+kWv+N9jWkYzEtf0wDGw9dtpkYtHecFYw9rPtBj8jHlLYTEJ0AljTZLavJM5V4VK1rF3Uw86LatyOBxmWdbt9pMkIaI8zzudTpqmJownGaIwuCbKwmRIYZkv3CJMBoFbRT1777xzznnnKjebzWaz2WQ6mc1nRLQyWNna2uqlPWuv1cVrgfj6+lPKw8qevfMxzC0earEd5KRQh6aqol7WfhCppiDUFaNIu+uF0cSB7dp9eU49FpahZ4dGQBmV6+DWOOvR+spFYFjzU9p+YW2yVKEFRAYwgR6lGDYCMoogIkwhVgiwYh3NiuncnwzHpXPOVcJVltCg1xl080E3z9M0S5MkuHaCXgmLkAbVAFuIEmMUoOM4eyviV2ERBLgsntdcyxaquMk+giCdCoGm1q6vDfLUOhFAKp0Upa8cd6xVYVQUxcbiycyT2WxeVkVVVU4ALSCKqAgg2TTN0iwVVc++dKaqnGdrgwE6OFlFOBCjiPJOx1iLFTvPReWc950k0SYQNmqsgoTWENbdxJqYhq0CKd4uVOP3BMHU4cTh73mWygVWV1CIseF0NHn2yxvqJco/BS2EVIHQeb4Yzl8cnpZeySSgSADrqysba6uBuLjIPcdQOjZ+0ybToEkkRxZhFle50Wgync4mk6n3HLzAIT0ptGoRLFwltbWU4giUI2Qvnn2SpoZM6HsbMguHW6v4b/9juIwhY0zgHbNwaOSwiCiL8wrkARM2XiySAYNJYoVD+lYsmwN3wjmGGllV88VwkYLRPLlNVVr7tjUOUC+liVzy6y7khIiHjv+DgMgKReWn1ex8PjydTI/PoapQ/MX5sKq8diyYOoRQpCxLNERa416AoDF3tHS6sDAEgTgYRaOH7GV11PX1rdrRlvXhNmhiuQwEAPDOzWbTLEm63S6SEeeVudbwIp222X2w5bQN9249xdCuwwkXfERRBQTspObm7sbm+ovj89HBwfD8fNzfWvfOjy6Gagwm1hibplmnm5NNSueGk+n5eDItZFr5/f39p/vPxzMHxioYX3nxXkFMYrpdQ4an3l9MZiu9vJMaA8AiCGriZEwzZrA0ekst18ZyzCwssjRfweVoa8S1OluDGmOoJSIAeMmMXR8MVvpdOJl4hdPhdP/4/Hy829/okYIKa41iAOEmqx6VU6KbW4N37u0dn16cnI8Pjk9Pz7bXu7uApCBar3wSerHLI85x6DUQh+qzgTEmS9M8zz07QvLMzBwGJaIaKKIqXrxnF8ANlfOqShHjp/F3q2U/UABhUIZ2MG99TyBAjN6ss1lBFIHCgkgIiOjZF66aObe+trK3u9XrdMQriAlrkgT1EDiyktQlRjKLKSEygJdA1sX4O3LMGawBi8IqIlVRjMeT+byoXOmdA1BrbQQixqhdBfYqzhjp9tIss/XeFQRRZGFRNgazxIQEXIM16GlpTKT2SdXQRMBo4m4dIMOwCKlSjFcNKJK4xwqIAirX+IVmgW6eM1AQAVeyMUgoSQbr6/33P3jnv/z0k/3nL87OR4IECmQgdJkbsliovQURAy5JhJpRtPifwqdLQos+sAiQLshQqCDxfxfnOMZXUewVXjXrHvVg1drIH8FJ2FT2y5jXZjuDV+5ci0dY/4gh3+vrH/8lqizcdBqMMe2Jw0sa66XZjkaguTrzga2ZLqyTSK9qqS/dOl96gmr90H9AcRxfm3b1kj4lXAqiu6I4X3kTXn6ACISAWKCgUSRAEqCq8mfD0cnw4vjs4vRkcnY6Hw2LyrGCphnsbq1vbg32drbW1zbFy/ODgweP9ofDUVFWFydHpycnjsU7NthNbJ4kCUKKVF6cn03Gw5t7t7773tsPHzw7/ej3lagoe9Kzi5H4CoVd9fb9O3uDzCpwzbQVgJAlGFY1Myvcs/2jR4/30yT/4P0PfvyjH/W6XRAty/Lxo8e/+Pkvnj17piKJtfP5/Oz0dDaf2yxxZblI7KkTpxdGGFVQ7Xa73W7vnIZV6YuinM3n7bTCKBcYMtY454+PT/b39x89evTpp58+f/5cRPr9/p07d9544429vb2dnZ1+v9/r9YLUGBY/59x0Oh2NRicnJ4eHR8+e7Z+enJxffPxsf//8/OI73/nO3t6Nfq9vE8v1psIhlVCQVVEEjckSm2muOYtnV1bOOXZOWQREmF1VlSzldDYGY4wJqXqUJVmnQ4lVAA76bd0rB8QY2AaYJIk11liT2DRJ0yRJE2uByIXgU1uHBRIiL0wziASt7IrFENblo2nsMiJcXvkvN2aWAIWts24zmguvsP7r5e2pcVHVtR4QEhprrcmyNMsy55xzTlhYWFSsNZVzfjQUUVc5Y01gRic2ISJjTQhATpIkSRIbsp1VFzb32nkgIlXrKuaFqFhrjTEiwsJpmqZZ2uv2BoPBYDAI/+l6F7gWiK+vP61ALOJkwR3WOJTdzshtRW3hMuYfm7qx9unG5lt7xLtFKl14ChtOcfOtYlENGmybbeEYm85mncVCdWAZaqMNNZDC2iPVAClBCQK8FEWURVnEanQhIhEDziu+mM6fHZ4en46PL0ZF5byvhKvU0kq/2+9ka4Pexurq+upgtdfNsyQ1BCqAYSwRNSTRIKlyCBzDxii6iK5bqNsL86M2R3xsD8JjPbLZ6sqrgKCKNWZnc72bp8NCEW1Z6XTuZmXZ69kQzl5vLqgAZeVPTs9Kz2CsCd5ZkyKSMdTJ07zb6/UGxljmalq4WeUda54YEB8jZ5lR1QASYpYkiTGAkborIqEziohEBlEBGEPeq4n4KK3PXEiodfiw1qM+IjEVMJASG9ePiHovzknN4ViYcGtWGrZ2yiXBYiGyI0rtOK4cn52PD47PKo82tSqeANYH3dV+v8GM0SIDr8n7qfPt2nuyAHupimoynQ6Ho/ls7r3U6c8AiKKxRLdmEQwdyA2LY7eCiKoyWJuQNcZ67xuWQviFVbEB+DaGo+ioCu9tNCfHoww0SehoKHwdiyoLmKpyCgWZBA2JMgiqBCSmhokwa6xzhdYojNr0jEAIyo2zQttqb3uNCOYwXQQzXp55WqjDBECoYpQMgzjvJnN3MZ0fD89enFwMy9nJOTiPIuPxzDluHVeBReZlkWSptdo6OMW3XRv2cOtmaOw2SNfeqv819OFvUHtC3S6oqqosik6edTqd0NoMCmQD+eZAYQdt19sa1npcdC5b1Wnk2ik2j6tYY3a21na3185Hxenp9PmLkxsbq6jKvlAiYoOI5XxSztMkzUrW87Ph/tHp2WheAZ5dXMzmReUU1SABmhQUUMVYm+QZ2YQdj+bl6WjS76b93LIygbaWMgCg2rdaq4iNQrzk639dylGzN19VChCUUCGQgKMVBkDUGlrpdrbWVtLktHI6mpeHZ+Pj4fTG2kqCAsAhfXZRskh81w3ISie9d3v34dPn5+Px0dlo//j09s5Wautc9JABIICRQlXvdrV8F84HWvelDWKaJHmazec+RAax52aj1QX5IUA4sPIyKypRIWo+4LgChu3MIFbRgaoNhwt0ARJatKPC3VKv/CDxS0rnRpOJ87K6trqzvdlJc3YFafgSDj9IIk0dVD2hWgMGEUO0rhIqKhoVF6X5eqRDhKuqKstyMh6PhkPP3hBS6N2qIBqMfx0MBRWECTVW7ItykgL3A8KECiLH3MNaRNCg+GpzCqy7p7TIhV0cETEO1gABEijV5Pm64U8YoGHNwFl07gvWAVExc95VrIlJEhQWRffOO/d3t3uj0fjiYlwUZWbJGGOsQVp01QPqP6ZsKYTbX0S0/n1EIZgcNMy1hY+xtkXEM9wySimEyQUVCf94WaxxqNUqnTaLUiMTLEnAL/M/tnW9b+iOvL7+Z6vORETiAN3ScOHXb3PNCv8KVXc5j3kp561ljgioWXxdvtZVnsMf23d/FVDlFc3d5llskjyhFf0Nl7LBX6syv/xHh1lIQBRFQaNkWXA6K86H42fPnx+eHJ0Ph5Oxm0+8d2pt0ut3b97afPOtm9vbq2trq528o6L37+7d2dt8cXD04vD04ORiWjhQAsMIiqRESGitwfFo+uzp/mpvdWtz+8P33334+NmL8zEiGqSK5WQ4Lj/7A7MzhG+9cTNLksYh1ayvIlp5f3wxffL0xenZ8N5b3/3xD76/t7PjnFeBs7OzLz7//PMvPgfQldUV79xsPjs9OxuORyFpp3Gn1seZdoUORNTr9Qb9vjGGRTzzfD5HItRWGCuAAsznxfPnLz79/aef/O6Tx08ez+fzra2t27dvv/vuu2+9/faNvb3BYJBl2aXuRXPDiAizjMeTp0+e/ubjjx88ePD8+YvRaHJ4ePS9773/7rvvrq+voTUEJpKNg0CtFBJiQuqJSSlJs7zbFRauSmEBVvG+qqpyXswnk2oy96FaR9CqRAWTJogoiEoQpmOQyBiTpVmSJmmaGmNMiDIImfYhWSZu6gRxN43QLGxmisM47BW99xW3ItZDtOalX16XVHrpnBsUhssi8hWc2uK/6sJXtPgOrccWAdIkSZO0VnV4ZWVlc2NzNpvNZvPZdO4qN5vOJpOJIROmGcJftNYOBoNev5cmaTSmESKgqDCzqAS38nQynU1nRVl49lVZpWm6urrazbu9fi/N0izLOnknTdNwP8SK+Pq6Foivrz/ZEURVmIVZRUBirCe2LAmLKT8kIgNUQ1kRW7vDwl2lCxDw5bNOHejdWvK08SWHZqiGIXlQJQBSbJ2b247kMLIRTYUSoQoRbxFm0TGiMLTxXiKwqooaL2rZiljvxSJaa8EkF6PZs+OzB09fPNk/OjkfVhzJikhABs3xuUEYdDqrg9766mBnY+3OzZ3d9dXcgjFYUxSCZilxDlXqSebGfYmBt6gQi5JLwcELImqT5tmK9lq0/FXYGtrdXFvt5+NySkjj+fxsNL4YTXZXt5x3YfgVAckaBZrPZ8/2D1io11vNxCgSobEmASIGtEmOJkGTCrnhdH4+LbcGnX5mgNAgeGFxnhSNNcbYzJgEKVjCPYtInHIxiBL2VsTQTU1MIxFDjWnGWvytk+xiCwEiOTMw/VABSUSZlQU8iwARICkoh2QmxjAkFK18TREXzOoS7lY1sYRSBCEz9+5kPBtOCrZdiwTKBNDLbL+TI89Dbp5iPQertVgR339klVBNe8/O+XJeXFyMRqNRWVQigcBVW+/jXt/gpKn9sba4gVRVvqrKLMvSNMvzHACITBPuKCIRXh3r5XBfh1+rcWELGapBChAJxQubbhiTJy9AoSUeDjoMAgwooCDiCZI8y7IsmxcT772qjboqoiLVbjxsOkNaa9NtTDMBELWd0fhajh0SA1Wq8+n05Pzs8f7o+HR8OpzPXT7Y6HXyTp6L6LxwPnrZGpyMBPNfEF3iGRUazuqiS7S0vong8oJzifihcK0df6t2tHZtDG1Y8OJwHW2g4/G48mWWJb1eDupUPIgEKhEmJuvmxXSqqobwJdFtsqil60ZkVDAb1A2rMjIZGgy6b9zcPjgc7z8/f/j49N17t7u5RUQCIY7M8dKVXFYzB8dHZw++evrV4+f5Sp8Rkiyt1CsAgTIIGovKoMDeVQjA7CasrP0s7+yspNaillHrRAMRXB+z42ARNBmN92HbRgw5o0ELC6gAbY0GRv56IM4ucntqOZBDpRq/WlA5rMidzNy7tfv7x4flxbxkHU3ds4OLO1tb6/1GLlUBUAplnlJ4SWqVcWN17fatG/vn0+OL8RePn99/4872SscCADChAqmCeq0B5USooBh+7aiAAyoSGAEBTQjz1CKhVxYOUbtRhhSVAM4REXYqmsym/nQ0KzkcflgRGATARBk7jL0Y9ACVZ/ZCSCoszSbULEfNnRGYIxEySAI0r/Tw6Jwr6Jikay0qe+8NBpM0oIZfARBDNi0IAhOoQaOQWiLSeNZphk9DHoN38/n8/Py8nM+rqvLeIwW1gUDVezEIFNPlyVorweSuMbZXrAEiJEKkyGggQhBfOXY+TTODJjQ3A36FQFFFVDAc+ggQCclggHPU6rAK1++Mgkqc+EAK7UdQDQHzCtqEG2ETcQExbi5sO8weCD0LOGcMvvXmGzf2Nn/1688fPXzy4MGjH3z4Ha5cmnQQTJw8A0RUAyDKqiAKhKgIgvUTq/UXxV5KzI+IowAkMYpp4YVonTcgYqKukh2uuDYBWj8lRA4sWpi1exjhsgLYBCVeVejqju1LLKLX17dmL4PL3Lmv+azbis8fzyBe9B6wlUDzR+m8/9fvw3bz8sqvoP8D3+3Sd76kUV56wQFor0gKwT6cFF7PLkYPHj59/uLw7OKiKmeT0aQqedDvv/fWG2/cvnXr1t7OznqeE0vJzOpnhLTVT7c/fAs+fHsyLw9ORxeTYjIvf//5w2fPT8tSbGINQGLAUnpxPj05Pl3rD7777huHB9/7P/7m10XpCFAEmXHo/cef/aGsyjzL79zatRTjcGIQu+pwNH764uTF8fDp/mFq0++/99537t6FskjQVOw/+fg3v/r1r6az+btvv3X/zTf/y1//dVFUs6IYTkYMQGmi3jdVcsPGiW8OIRFZa/M8R0TvfVmUw9EYkJDAMyOCTRJQffHi+e8/+f3f/OxvHj96LMw3bt74i7/4ix/+8Ic7OzuDwSBN06APlmUZ/SdEl7ploeBd31jf2t55/8MPDg8Pv/jiy7/+67/+6c9+9uuPPvrBD37wwx/+6IMPPuj3+75yGIGDArFOVmjGT4FBgRAozxIkS2SD3yakFHA9H4NYuopFyBAZQ0RqGuodBHJCdANEdFTdMcQwOIINSQ8VDEQkH1KtxwaOIuilp2o5DBgvCeW4NPu2GB+BZdrn4hlZvIx6WumKUhx84AjIyoFfTUiLcajW5Iq24qLCDyekLEk7Wb6+toZh61f13jvv2DN7ZuaqqsqqDBoxEnrnvfcNXBgi5Ey992mabqxvbG1uGWOyLEvT1FobVA5jjCET6Ma+8tFztng3r69rgfj6+lP1qH1Qh7WJG5BaI66H+BEQjEmMsYQcnSiISkGR5cuz5C8ViBs4POqljOZmRJNFDRhQMsYakwARggkCIy3q22D5JZHwSjQKRqpSL3tNjlwtPiuCkkqNWVYAweAYMsSI41nx+aP9r548f/LiaDgpQlyeIbQGVUFZS2VEYq2mpRxfzPYPz45OL27vbt65sb0y6PQ6qUGKP7+myQOGOcowE4IKBAqIgYWqrwkLvnwsCz4RqTPc6g+ll5uttf7B+RjIFJUbTWaj8YxsqlACIiKDqigSEShVlagYg5laowpElsgKICGJYlUpGVLISnGjwg/LarOfISiIJ1KDEQKYGJsQpoQWAFVDNCBFPhc2vCUAMIRZYtPEEnpun3Sb0IcYa0BtHRwbnxWhVy1dNZrNOIwtEwAIKHvvHTOGIBnhWIQHb1f49BVQAufBKyKQoJJnHU6rw9NhqWCMMUiI2EnM2qBrgdk75xwgWGsiJ2QhIoGoimdVbxCFeTqbz6az6WQ6n82r0isDxtDeNnSlMa7Gh6n94TrvTUxoqJsaAGRtmmWIEKSZYNxaFjpBJCAgCIBAUVBZhZQSYxOboDGiyxlTzKIKBhDIIIaUwqDvkAYyTOCMgDHGWgo5BgCIxqJJFhpYk/NWT9fqy4PhFiYUfVW7vH5tPCmqZ0cXj56dHhxPh0NQyJN0/e6NnftvTXrdj58fuEfPKuc1et2aB5qi6yr2lVACPgyU6tH45k0L/e2gJEMrWGzhfcYF+eL6+rZU1C/3DV0tdIMxfXhxnibJ2tpKr9cRdiI+0lMMJWna6XVHp2dx4OMyJ3FJa4bWJF28/TBOr4uKEUHxd2/uHh9PxuP5wfHw4f7BO2/ezhNDygG8Ggo+5/3x6eTx44PHTw7LkjeyXCyMizKWPzGlkhAIRKqqMiog6lnP5/75yThN7I2tQU4q4ANyGDXQkEO7ixAkELkjKaId0oghSk0jkGXZtKUtZXlJZ5eGz0r1oyQCgqoibIn2ttZv72xMiiM31Xnhnzw/untjo9tZz4IFGGL7TwATY0gUBJRVwWc2ubm7ffP47Ojs4sXJcP/obNC5McgMKQozghIG4EEc1I+encjfD/ow1BIkKDN759l7BR9mOaKnVWseNbBo5WVe8NS5w5Nh4TwaDEhiJNJFWI4IIBA5z7NZUZRllxZJTTU5IfCTGpGSVDVgeFSRBaez8vDg1AAYFRCuMQxh/a/XXEANmGGkyktRshfo5KbXTQE4yPPAKgKGwLkIc5zP5/P5HFWCp6pGgIRaN2yyGhBTKiIsNWlfWVnJhh2YmUvnnYSepVMRQ9TNM2sJQAkCjR4ExDOjMZYQCePb2JxW4g7CgKixeSm17WwJznBpRL0BYbasURR7t9RKwwFNrL1/7+bf/f2XDx48+fT3n/7oxz9gAUNJzX8Onofmtg1waqrH0+pVoHXwqn8uBXLHwjW+tM2Ff6sklxxdL1+LFvyHAASRJmsXozP0NWz8V5fIGnNyv+nXX1//E154Veh8lUZ8VQ7+Y7RduGQiviqtvl7PhVdH/l75u7V1/xu8pPqXDbC1wG5SQv2jTm1XRHNti3KXK1YkBkQ0itYxHB6fPni8v39wfD6czGZVWRQW5dbu3q2bu7dv7+3tbvY6aZYYawqoPIlQsFMoIAt4VaDc4O3djb09ezae7z8/uOhnxkq/O1jpD9S5YjYupn50MR5dnG1vrX34/puPnh188eBZWbk0z3qrK6srK2fHhw+eHq/99lPPfO/OzQRJNWwZWDl3cHD4xVcPLyZ+PC3u3LxzY2tLy3J8MZ+VxfODg1/83X8/fr5/7/aN/+f/6/9Bxv7iF78AZmvo9PRsMp12Ox0kUuWQ6BJr81odDleWZWvr6zaxoS5xlVcAJGMAK+eOT148evjw57/4xdOnT4vZ/O133n7v3Xffeeede/fu9fv98BYz81W4x1XHBiKJqAIjmZ3d3dW1td293Y8++s3vfvvbn//il48ePT49Ov7++x/cvnXLJinH6i+c7+OyLWHbAyAFUx9IBIRYY4KNUbQUi2ibiIgSKaIEg1fdq5Nw0qplcyLCAK7Xeqy30WAVqCEoYWAotbwqTU2Ml3WPqwJxEGTbX9BQOC5xY67+9XZOxiXRedmZA1R/rg0rrGnHiBBGGmj8gY2OHzSW5lXlWQ5Z3IKDa0fqq2m6IJE1pnlhTSpMQ1GHOu4yXEzc/PVI8LzEm7q+rgXi6+v/foGYnRfPC2BcWCGacdqQ36xqKJJ3g/VIAOiKPyLaLBDbi0t7OYv610ubzAgggGQCExWNrTOnBBdx7AiIigJg6nD2OMIQMXxxvjGsSrJgtYMEtiADAFkVFc+EpIac0uPnx7/+7KuDo7Np4SrnNzfWNnp5N08Ta5xo6V3leV5VFxfjsnSINJnidFYcnV4cnp7f2Nt68+6t1X7XArKqAQvgFRgbW2x92tG6NdeeVnwNHqu94lPw6zQnI5FOau/e2vvq2dGoFOd5PCtG00I0BNmHPNlA/yUySd7p67BkCfZeAjACRoEUSQTBa66ImIDpjEu5mFXztbRLpCyEaDCw5RFULVEnTQ0FTAdHb2ZNXarnrpFQszTJE2sQZTnsNFbMBskiwSLDFBEgzg6TMcQKRVmeXVwooKgaQht2FiSiMKYKNfEgRNvV75WGuhmFgdETAivOiuLpi8PHL46QrDWWEHrd7u724NbONpeFeCeegVAwWL7DcYZACEK4almhMCIU89nF2dl0Oi2LSlkQjSGrMVqn5k2KYkudDCEAhCZwFgG1KiprE8zIGJulaIwVFgWgAB0WaQb+RCRMLdfnBkREMgY05CiFFGOhkExPpq6HF36k0EswBq0Bi4ogAiAQf4SKMoEhNBTTaUUkRN6htQpcH+NJY9xBqzndlBR6KVr38sTtpTGrcGSbnl88++h35w+ekrUrG+sru1sruzvZ1la6e6MzPKVuyghexIuwgqm7+iYc1MJsL9AiMrBJEAsqcow8DJLLYl3S8NnAwuSn1z3qb6FGvBSLeumgHL0qQIRYlu7i4iJJ0l6vn6apOCei8QFUMGTyNEOo00+X01lf1d4LizYROeZIaAkFkpSDbufune3Ti8mDx4cPnp3s3bqZJCkFFVCFFSBJLibF518++fKr56OLYu/m5rv33xjOJ6fjqWoZArQIKDxSqsiOVWJBxMzPzqcOwCPd2ujmxlhmBAmPgCKIIKAGdA0zs/cmSRY9WsDIzYWQyIUR44/a9IXqAYl6vBGWCO0AEdLTzMwDgDW0Okjf2Nt6cXR+MZqVhRyfjQ5PR7d31rPM0CLANrKHJP5qHtAQ4N7m2lt3bj58cjQcFs+eH93e3uymnajYhUGVOiOtwUBoS4LQOnYn2F2dq6qq9MDeq3DwUFPIRwjmV1F1jqdFWXiZzOaemcjWu3btStYYY0DGlGU5Go/n82Kwkkr9GwRqbhhwUqjDVynkfi76UUXhTk7O8gxWBt0sTSQ0uSXmvUXGlgIKEaAiiZJnZIFur3P79g1QL0pEpGJU3WRSjEbj6XQ6m80aVZpizGIQnlEFVVRNdCeH3TaUds2arqLh1/Qs48l0PJlu7ewYwjxPETBNDAvHNIB6VpVFTIgdiLoLARpQIWOIDEZGfDiwQf0sRsQE1HeYxH5fvcdgTZWoGxPt9ILaJwAIIMw/+bMf/Mf/7y+n0/Hp2RkaQ2SaxIKwQbZu0aZHGPlkuMzmrl/ASxuf2t7hAOqBsT9GnArdTeHYVW5V+AB/jPUyHovlJUvQ9Xb2bboomBJfC4WH1ojMJc2oXUrgErT30s2EVykTr0dMvOZejbz2VnwwLiIzKEwTNt7+ugbV1k+ssyAxJpLXwIvm5QUBTlqEwz/iMayPpNjS5RYBpyEvGTChJJtMqyf7h//95x89e3GsaETBJMmdO7fevnPznTf2Vtd6aUoEFQITegIU8RSHYAFAghtVAQ2laULj0k+G54Ta7+S+mq30Oz/+/oeJSf7ub362//Q5StXvJbt767du7/74+987Or54fnRCiDtb23/+53/26aeffPbZV7/67Vcg2Ov0bu9tsPccx0rBsRRFdXE+NZTd2L3BVfnZ7z72CmjMb3/7268ePOoN+n/+z37y43/yoydPn+7sbq2sDpIkKcqiKMtOt8PMoBKSS0EVTIz6xph1qtbaXrdjjFEV5/3Ryaln6OTpeDL+6NcfffTRR19++aVz1d6NGz/41x++8/bbezd2+71+lmXW2jDzCa2lH6/4uFuEBACEEHRmTWLT9J133711584Pf/yjn/71Tz/53e/+w3/437/85NN/+2//t++8/93V9TXHzocg0+bWqNHz4QDDqtENEyy0CGwpqMCRhxXOaARIYV45opqaRyZ4qANtqZlMWsCL6j8ZBYpYTG2V7dS+7Qhex2mp3/Slf9OUkFffq5fuL69pz8RzL9Klb9IqvxtLdJyjbdnVFiMFC3BorWgH2dc513iBmyHZRb7xFZUjOMobmagRl6Hl8LueibkWiK+vP/ElIuy9cvASRnfqUksqoOi05qPWraVGFkRt+bMWpuOlH7Hc08a2gULC6UAljtEpKIJnZuFY4wHEcGuILUGGVpiZQtOfDIowNi6KZji9PqaokiIBkPN+OmNCwCQpMXnw9MXByXBceiIadLP37t28u7edJ9YQCgIDMuD5cPLw8bPxZF6WVVFWs3nFnudFeTKaFI5v723f2FpNiAQ0jFgCi4oK1L7sJmItCFitkqDh+MStdPkQ1l5kNQS/g4JyltCt3e1eZselU6TZrDw6ORtNpymRCse0uGBoItPp9olYGWRBu1ckkJDBhKwiBMRqZ6UbFb5k6FgDQJ69hEwxQBYGhDRLAZADWog5tPTrLZDC/CYqZEmSpgkRoo9qgkRvbFRTm8y3+nDQnvqHkK03m81ERdCkaZqmSZJYY4iNAbSoHoVqrxUhoooHVUI0QftWBBQkEMXReP5k//D0YmJMhojsXbff29lc39veUO9R1RiMQJI4tis+uodRVMWrssymk8l4NBmP2PtAIg4dkqg4tbSpWi/VGkysEr4tAAJVlUc0oGDImtTGR6DugsdgQwo93qYarg8cUXypNTAiVSBjQlEcNWXEcNxRrSFYoSKPckEdRKnAoARojCFjEDDEZNsksUkableMZXY8OqpCOwgyDrjiolS+Cja9mhcSioZqPh+en/bX+hu3bqzc3Ms2VpNBX/PcGzflWakVGGBtMosWq0fdWwakJRdaezgrxtFL3Y9ZJG40gUOtjJbr69umDy/M/E19u3zWREBg1iCobW9tZGkadFpouYDJmDTLODg6g8tPX64It2mgrXlAjAAACl/DSH57vXfv9sazg8PH+2e7T4/yN2/2MwyQJEZbVfrkxemDJ4fD8WzQz965d/vO3jadSmoprEum3gxiO6QGKqAhRhpXLBdTBrTWbPWzPhkTxzIkumVDxYPqHTvvyURensStpUlWpTqtc8khvTyIqo33sw6XQwQRRAFApagjq6QGb+9tPXp6cHA6dCyF4yfPT+7d2O1tDxJAEE+IgqAqEsmuoMphcrOb2o1BZ7WbDc+mh0cnw/FsfdC1aMNSjy3pIWJ5VAAFmqTdpV41es/OOQ/AXGviIoGKEPjmqOpFCleVrBzicKiedNGYQwNEyiAihOicm82mZVmQyaFaVDQBOdxEh4OqaFBGJO4OSIpYsU/TpN/vpknScgUuIsuCVqGgnrGsuHJCaFYHg73dLUMg7Nn7Yj6djMfT6Xw+L5l9c7dHBVQX20d9loiDO4GgXJWucg4AszSN2eKFs8YioiFEFRUmhDxLAm2iyQOIrVoisja8gUFkBwQWYQULGFRpAEMEsGRXatEaAj0SqakqYQH/CLX51QZj3E+DveruG3cHgxyAq7JS9o2dMe5aLwvveY2Keimwq+k8LulLr1PH9KorolXxiog27+MCsQr46lel7dzI1r/8eufm9fU//YVNaPBS+lzbRLx8G0B4ZFqx16FvRi2N9ZKiSk22zEKBXaz5NfI2AN/1JXcptoKLo5OAoiAdEyeANFo9qbbKSFgfg+hEcZJLG74MgFHh0KU0EFwmKBgnYURqq+ci8AKuqm+XUGMtcdwgmtCBQpXQi5LABkZSIrLJ0+dHX3z17Muvnj57dsism5u9m3sbN29svXn3xvbaWi9LkACVFTCGFCABpqqqKGGWsfFZAaD3OhrPnzw7nM+9VtBRs9XN39gd9Hqdi4O9X44Oz86HXz182lsdvHH37nfevf/llw/ns1nlnZVqb2uw8c9/iFr99pMvv3pyuLn+ZGdjDQgZhNCgTbO0n1CXq/HNm5t7u1v9QQ8Asm73xcHxi+MTQXjrvXc+/PGPkjxLOnnW6zCgsgyH44uL4cpgALWjpX6xiGi03j4U1BhaW1vrdnNjERC8aFm6x4+f/P73n/z6V786PDh0rrp588bu1rarqgcPHjzdf5ql6WBl5c7t25ubW3mei3AYM1XRSzXCZaNr4PnG5FWwhtZWBoP+O2urg7feuvc3P/2b33/1xWg+Ozw/+Sd//k83NzetTb33daEVim2tA9+aRprWxrEW+IjiIJDG+tHUxU7s/YV3g+L0ZBOBVOOAmjRsUEAMKbFRPl6gMJViWRlLsBAte1W9xbbR+MoXND7ir2l7XLUkLwvEGGPjsE5dCKYvbOYpWzJx+Po6bqNd7S2vRc0fgi68mJ8L869trNtr48HxkiD9st/u+roWiK+v/9vraVGpBwSISOtAnjaDuF0b10Ht8fiAunTi0BaLES8VzDVSvV5xRBdXnHU0akJgnmdhUCRQYWjCS2K07NIRX1V9qIvimO5SqngtIqsE0B4YDcODLMKiwuj1ZDY5OLmYFl6A8jS5sTm4t7txY3PVIFCok6xBY9Z7nRT1YjgZjqan58PpbFaVrvJuXlUAOpvNSO9srPYTg4QSHTsSK6To6A2/NQBpclXCaK+S7T9Q1OJBwoRoIL2qWJOsDXq9rEPASDgrqoPDo9F4urO5Ki423kUFGIlM3ukgjYAXGxhRgG2BxqjkisiKgGOYVzortY/GqmHxgghSHy8JbWIRCUBUhIWhxhAjEpI0caqJsUkcMBFdcEdqkbhJHqsNd9rqnoZXKKocPLSgQR42FOa3SIBCoYtan+oQlIhUSJGAFMJ5BwJLcV650+FkWnjMOoQkrsxSuzboDzo5uBmCUhheDYGwkQciTYmpSMxyMRxNx2PvHAU/9eKwHKeQ2vo+Iob8vfChe2YVICJrTe3qak5KYSz6cgkad+bl84AuCWDNeYaIDBnSiL5eBANStJyHcB6N8EdQUZDAsAz47hruC0FutlFZ0lZrvvmBl0/eMSVh4TFsiREx0+lSPaEoatT28xu37qze2DWrPbGmMsxcklcBQQNo4nfEYCpsBCqqMylVAV4+pxjvtxA4Bs33qSMtX3LSuj6IfHvkYQkW4GV1+CogQlVn83lRFFmWp2mOgPWOJBqDSzHJkrAQASCpaaf6LAGsXxYBFKNZI9I8IF+qXk43dwabG/0H+6OHTw5u7aynJrcKqliKngzHj54dnl5M0tTc2Fu/c3NrpZueDqlecLWev6+X03pUJjyvXmVSOD0fd1Kr26vJaidHAnUY+7k1MVzBsVQVG8NEuLC81CUhImngydd7diMGQ41frZ8iBRWNdU+Y3GzaYhi6fIR+e7V/e2/r4fOTs/HcsT4/vnh2PNxYGfQSazRujFGmbohBKiJqLA3ydGO1e3B4dn4xPjkb7WyuDnJTB6RhxD40ubiBhaSLfFts0m81+KZF4vjRYv0Ob2IAT1fsJ7OCjZGm5RWzViBuBfVySMaIusp5z4wNcDC8A3VLuumJhVmmyMwHYFXHwip5lva73cSasAUIxIo1CDNx3sfgcDI/vZhMpoU1SSfLOnnq/dwVRTkvJuPRZDIpS6ca6MHUqCDN6WoR1FnL6YCBhAHOubIo0zTNkrQo5s672XSS2qTb62dZ0ut1AQQJrA1BvEBoFZSCsxEpUCoVENGECHMg40VJRMGq1LGGl2y52Mx4Y8v1vUCN1Rm+UUuOLQjVJY9j3WPu9/tJap2bTabzcj6D+hGOLc1LRWbcPdtRTJcwF6+Kt3oJqf6l418v/Zr6mBvi3an5RGDp91380+LFILz+OzfOjBrAf70JfLsk4mVR5up4/vLudvkubR4CbQ9PLdFR45DMK1qtoRMXlw1dimN91YNRS7a1+785fSmwNu2hABsMJKbaeVQPmBoFiapwfbhc8M2Wngp8ha7+SsO1Ll5hO0wzMNwNkClZT45PfvXRp59/8eTg8NyQvbGz/e6bd9++t3tzd3VrvWeIvGPxHMOcwUSLFGDAmQHWxue46KLzOp4U5+eTovC+kpW8t7M2WO1RJ9c37mx9+llyMZ4+fX6Y9LrrW7ub2xtvv/nG8fHZk2cvitmU/fz+3RsX5/cfPt4/PR8+ePTsw+/cX1nLBIPbxoiS92AQb+xub22uD9YGWdZBk/zio98dn51v72y/++67u3s3Ku+SLEnSNHXiKue8d5UjMhoz6ENPV3RBtkUANYaEFVQ6nc5gMBDV84vhbz7++Msvvvj8888OD16ASJZmvqyODg6Ojw4bUMPKYOWtt95655137ty50+/3hZmCM0pfqXLWg8sNjzLeZ2li7929u7qyQki//tVHDx48qP72bxj0ww8/3N3dzbKsZa+R8FkufU9sqqkwXBijVARAYjscr1prYXHXN8Q8qp1Ay3dfmPwJbZEmNQnCQFDA/TdOm1dzWhSu1nuXpNKrourr9eJL7Rxs94FaAbH6yjoI6yidls9uoQItfXGzo31DLsSl7/APhS+/vq4F4uvrH7iiVo5JbxIhpNqA5BcHhPZBvknjqbU8hbbHqI6xEoEWmXExedGsTkFjDIGV7DlE1njyQByysw0p+5BGtzhVhPgQWAzThcQZrPVHCFXj8goWnLOMqGBY1ZKxJlEQk+aj49FkVjkBY8yg13n33u0b6/0UWFhCCxEdomA/wXt765OV3mg866X28AQvRpNKeF6UBwfH5XSWovKtG71ulhg1qCYO3Eq0tYZBFV3MYjb24YbFcSmkbmn0JrhIKPQwBUAJtJsmaysDezrzQkVZnZ1fTKazvZ0N4LBRqqqAsKGk08kWHIDYxoWQRI6qACxcQgyVN87DdOadSQ1aQAfIDEqgxhiwhpIEDQHX+HkNuXthNiu2EhDVGLLGUGPiblxDAm39XhsINeJSszHwAep9I00TayzGaClcHBOjfZUUZMktVUfJExE7LSuel75S7BhDCKzSydJBr2swzlAvDz0RglKEGBAQAGnhZTadV5UzwZ4bb2S61AcOu3xT9YY7XxSc88KSJIm1NstSa217/qb+DtrUwPUgfGApNGfieAKq3z5dHKGJkAyK1ClZYRAotFhUmQU9e4ckgcgogKrgnPPel8V8Pp+lSare4wIJXX8G2pr4ax+hsG6it2rbbwCWi50TzG3vxubmu/exk819VbkZl4o26yZ5v9frdnNrwCBS3YIKb4IEtQVbx52XCb3t3sMCe9MMEC91ra8aaq6vb4NA/FpmIgCAiBbzwjnf7XY7nbx1KwWoKxKRTRM0hOqhfY/jK9sLyzV87UgJC4qKiktssrHWu3Vj+6v94fPDs+OzcT9P+pkRhXnhnx+ePjs4Y5DN7Y27b9zYXOsSeFKxiAZIYsUbnkuCJk1LJdB6vKoIzwp+enBiEQZZSjlZUSSlELAWKBWontkxJ6IUFt/FmV4jgo5sTOZGqMvdKFzh0nRlWP/D8GUwnkXHTezKqIAW3aR3e2dzY3VwPpk7gYtJ8ejF6fb62lY/zy1aA9aisSH9jKN6KYKCpNzvZruba486h8Np9eLo9M6N7X7WBSQi9KyqqqyxxaVxYpHD0UB1EfqidRivSAhCrZc4RQ1gjVhXVk4uJtMkz1llkexed79YhOoeNxlDII3AEteYejyjwVw2zPMgZYcMNMc8nc+9yFqv1+t2E2tB4syDodB3rw3QQGiSg+PnB0dnw/HMGmtRvSuL6Xg+ns5ms9lkGiaoIm54MW++yLVd0AZj9CjWJyLwzldFgaqIwOyFnXNV+NzzNEUix0ygAfZlCG1iJUIbQlMgII0pzTvdbi/PcyTDqqVzpXhU5MrbTjM/3o5hW4zL6JLGGgVcrHedZedjgybGRoYyhgzhtKrGo/FkPMmtbQZsYrfiksqrXwsw/YdJLW1jbVpDQoEXtuzDAn3FzqmXDxiLEatlv9V1af2t3tQaotclmfgbSiqtRgl+4zu80Tf/+FtLDUhtoYj5NhLSvdSApQTEqIRsE8Q43QmqwpGSTqix0xVwFcHrq4soanyJnPZq+emlv1rr+YrBHkhW0ZyfX/zil7//6DefnZ6Ogejm3up3v3P/hx98Z29zkBlBrpgZVJsRWoXWYhR5d/GAHJupYDzLbF5WjivHILq+1t/aXMtSo1INBl1rjXN+djF+9GT//v2jzffW7t678+jx8yfPDmbzcjwe2uT2G3dvbW2tPvzyycHR8enFWX91DwhFtHJuOpsV83mepbu7m6srvTzPkiw7Oj779W8+vhhO/vxffvjmm2+lSVr5yhBleU5oq8oZm0gwfgKoSMBJiGicNiQKxYUhmoxHLw5eAMJgZWU2nz969Ojs7Oz48LAo5oYooCeOj4+PT3RtfW1lZYUA5sX84uLi4uLi/PzcOffee+9Za2Fh7H3l3YsLI20zbxL5A6urK//qX/3LWzdv/X/+43988IcH//W//tfpdPrDH/7wzTffTJKkdtigXl3er7QvGkYQIS0S+a4UE5dpDO3zYxsKhE1OtgZjAQBe4kJEuuarHrpXPI6L+ZJ/EAdLK9TuG7+GKBRccnzDy8zLr/rD67/spdvl9Zp/LRBfX/9ozh/xBMs1c3ipgxwdWLGFq42dV9oTBEsTcsEhqQu3Y12ltLJ+FFQ9swRvpYgXZhAGEM+sZI3N0zRL0JaOo0JEqGHrFWqCr0EBIARCx1RqlfB/CFCgnf2BAirCYZKoOxhsbmx0+t3+ytrx7Jc2ecze9Trde2/c+It/9U+3Eixd4b0Xceor50rvvSp202S1l+5s9G5srx6fbu4fnjx9cXQxm83K0jPLV0/Pzid7O+uba508IaMMIMAMCgbQEMbYOjJJkpgAYIQAbrfWmjAG2xaFQ7gqxcEQ4chK1GipUczz7K0373714nQ+KwWkFBpOSudBWEkFUC0CIDBCL+9gmHhWw4AayuSgTCOYkGKuQmQUYDp358PJTmclzwjBilaCMdQHyFib1PNg4TOFelJMERSxjukhSow1AHUsMLWmsGOfnYikyXiP6oeKMJEJVEpDZEhFIUmSBUJBRLEx9oWdTbChFWIItzUABGiU7Mno4sXJxaxSwowMMZfdrtnZWd/e3hBgCjosUcwlWIzXYfiTKrBn57wqIJlFTwQwYn9VRbS+4xsytyKCdwqEZKwqe+8QIU2TPM8lmBVDB6XO5QON2Tn1jB8JUnTlxiexdgwCKAA779nbLFXg0MkIggmohDtNVNkDs8znc6I0SWaAJBAdG4hUVFXpqul4WM6mg5VVlioGLrS3bNUG4gGt8eB2B0YXBmOF1zuZwloDoImhbk79zBFMirmwpGna7fay1dXB6mq308E49A3Y5DU1oLjQ3wjqcTRvaH0cx8Yz2KJJLqk8rV/tejj323aJqggjXibgL51BFVSkqqqL4RCJ1tbW8rxT874BkUJBElpf4a5vD7Ri7K5h04GgK6VOcOw2ilDgoot6Qu7lyRu3tvaeHB28GD07ONtc63fzbuHldDx/dnByMSo2N9bfvHf7/p2bnYSKqgQWg8YYw4xa8yzifIBSwOwmBJ3clpWfTktRnMzc/uFZJzE3NwYbXWsJRRiDBhnauYQRcYs1zxelBv5r7WatDVLNHE49cUzNwy3NNIMGwHcAP8QnUIQCoIPKfjcd9Ls2sSWDJunTw1P2fmd1sNrNUgN7O2ubGz0T36l42CAAYMmTZG0wyNLO/LR6cXx6MZ7srOcoqgIcsBQiwsIiHNPJTRgX1mhuVsSwSkPb1rVg3aqqChGF3ppTPRtNTFk5FqW4poT52PDdajUZRMLANIZsTxYVjQTlehJbdLGtLaowQiqK6vD4dDYtNwcbg14/Saz3RcijY0DCOOCBiGiSSeWfHJ4cXQynZWEQq2J6enw0H55VRcmeSSFNEo5BMRFcELMB6vW5DfuLHRQAFQYkYZ6OJ7PJ1LNHwMTYtZUVYywiCGhirQizqjFojEmSNM86SZqWpSsrx8E6TbY3WN3Y2k7TjIgQqdftlc6V6i0lo7OzjU5qsk7oPsS1WxFVQQAp6tjSopCGV26MQWNChkLtZW/tIY1OBIiAWUYy5PF4NBwNO5tbEaXUGKmXi1GJ/+F1zIjXTpn8EfKxLl9N8vyryuDXfWt8uX/5lS/z+vp2icTNPdD2pMPXDWK3GL36jXvhdbR2263xje8rBETBMOQRA8FBFZRRlQQMeExAjYIVYQ0swcWzgjYxlpIELYYRN4jhaYocbL5YlyLf5Ll7iZIFCuCxbjJJHYpClArY4Wj605/9+u9/8VlRFtbS5ubq//YXP/knP/p+bkirCjwTGcGwmbzqnUdQE4EZcRugqvTzWSmM1qQ209XVfHWtk1itKpel6erK6vHpaD4rJ8PZr3/10dbaytbu1hv373z82VdT5y+Gw6Ioev3e+trgSWLHhbsYXuz59SQDZplOZyenR/Niur2zs729luaGrJkX5S9//evPn+zvbW3+5Mc/eeONuwCYJul0Out0uysr6Xw6Pz46/N0nn2xvbe1ub6OqeA+gRAaI0BgRYGHPPByNPv308//605/Ny5KMKYri7PQ8y7I8T62lYl6AyKDX/+4H333nnbffeeftwcoKIJRl+dlnn/393//9xx9/PJ1OjTHvv/++xg0TXyMFXrrTmj0rXP1+/4MPP7x589Zf/dVf/dVf/dV/+k//6dmzZ//iX/yLn/zkJ0kIVHjtfXop7Q1hidZ9talwhflbw5lfsXC3F/l2vlxtj3vpNEv9lKrWA0rtB6kWVvR/RDa99BepNbfa7lle7Ue2T8tXEW2vQiHr6zuv9Ue76AHoywXia5n4WiC+vv7RXBisiCwghI1vcFFXaDMrHtLHVCSM9sfZpfoYEAmGGPiqELTCoNhi2NjrirqmQLAIe1lcGqbeURATk3SzZJCakXgFEDTN3kshAkDVQK0IaxCIhSKZoFmnLw8JogqICBJZ011d2djaHqyEItWyrxDzjfX+O2/fXyU/r6beO+9LX0xcWaqoKDEmiqSKLFoUe6Np8ej50ecPnvzu8wfTeWWocP5kXs6T5GZ3Z72XG+cKX7gasSCIaghZeV54VA6leIgdo5iRCouAMYTwH6K5loDIIGYxro4wSTKyvY21QTc35zPPACXLk4PT+2/cToCRHQgjAJFEKkRMAAp+Wwws5sDdIAUQ9ShijVcpKjcrPGsXyKgSkkH1MWlGidCET995X1VVKyoicKO8AguQMSZL04QQVdAgIAkI1lE9EWygChG32xyCVcLXACbG9LIUQUDV2ghnAFAEDlRsiUPRoijh5CGIXCOBBVAoYbAHZ5NnhxfzQhPKRMT7+b1bezs76508Yako3KlBPQHGJohew7uizOK9Z+aQc6uLLMTQI2kln8fzKxBIgLYVlUdKstzaBAzVOGJsgnegYYAiAKESSv0IGqkZ32EQyCKKCCEF+zcLj6fjyldrdj20dijk+rAAiKIwc+WkmHvnvPOVoaLCAoAEAhQVDZqK2Xnn5uirkqvSdBOvzMDSjAhoVECgEcYo5gAu0qBimFU8ipAoEmoL59U+BygoCpBoCK8FFTAm63UIIE3SJM3JGjLGGEIDIixBBKLo1qaQUgwoQkSh9teFVABAGOKd2qIw1txzgAAuXgwYBjsdXlfV37JSunE9vEpqUUDPfjIagWiWZtZQ0BnDDHh9Co6QVUS5cpCNXq5ahsa6J9QoWRGrGndGBA12fhUi3Vzr37u1c3I4fvjw2Vo/G/TvVQ6e7p88fXbG3u1ur21trqWpcVVRlSUoWDIGSFkMkYSZf0QKG6kooVqCQSfJE3HzSelUKB3OyscvTtg72tsw3SxFMQtYfDAJEVHYdxSQI21P4xlAYyRqHcymFDpTSAqRwxMN+IG1HIcV2+1NBMXwX9SApolZGXR63U41KQVpWJTu6PT0YpInJkV+q9jLOvf6HaTQGaPAxSdhQaJOJ+l2EwWYVdWsqljF1ISq8Jkxq/dSsUNDZJIwDRWQFYGMoIFiqdHwFfsAUE+aqjJHRLxXGE1nlkXqmQ2tRyyRwnxsmE8iZq/AkW4RFWqN6W9xcKTVDq9TWQJ2aFaUp2cXlYM0QaIY0RJy7bCWnyEwMYmHhX9xej4uKkWwRrMUR2dnUs6UoweKmYNATETGmFYNRvgS9l/ERiPi+cWFtUne7VpjPLvEWmMMWhuCBEITngAF0Frb6/ZW19asTWyazebleDwpytLabGVtvb+6arMc0DgR751J2SRJBpZZRsNRvrI6yFdAfbtUXH48G3sxQUshBkQQbtIbRAFQmdmSjWMudYDi6lr/9PxsOptNp1PY2lqcawG+bnHHl5pvXyotNYNPbdTMS4vbtqjRrsNjfPzVOGLQS8vXNxF+r06eXV/f3k2thaSLeSRRo3wNohRquEurXfSNRrmbwb7/oaORIkrdRCQA0pArbsCmxqk/HxbT0XQ6qkbjUVHOvXPMHlAR0VrT6eTrKytb6xsbq2upTUGFxQEwQEACKKBcZbm+Rg288myG8kIhFpUkQkoGKR+PZ7/81Weffvq4mJeIcOfW7o9/8p3vv/9WSg5YAr8OBQAFzSJVbzl0PeYig8YcNEICTFSYWVmQ0NqUB/2s0zFenSL3+933v/fdydSNHz6piuro6PirBw9++IMf7+ztrG2u7x8e7R+8mM5neSdPs9RYywql9yya29T5cjQen5+dq/LNWzudXmISqFy1/+L0Nx//Dp179513b9++Y206m0+nxeSXv/jFZ5991u0MROXwxYvJZLLS7/+Tn/xkbXXNhgkgwoiYIBCvR0fH/+Wvf/rgwYMXh4fCioTR0lUUzA4RNzc23nnrrR98+P13331nZXWl3++jIUAlpO3t7clk8qtf/erp06cPHjx4++23O71uE1n+CtMu4HInLDbga5mYmQnN5ubGX/7lXwLo3/7t33788ceTyThNk5/85CfGkGgwQcOr+geNgPt6o+srVMvlYZTa29T6zk1CcnjN2GwBREiEV/ZiWexB0Sa/JKjqa/APV/6NLs1yNm4cjdPTIRMVKPobajdzCzyjlyqh+A1bSQZhdG2RULX88mIxTK94te21pH55V5SoZvyzju64vq4F4uvrTy0Qw2J4PIxcLkN+a4COIDU5KtL000KPdwEyrFtpdUQL1hTgWGaHrwYRkZCNp5EkGFK2AZDUInStWcmTI/XeM9pUIYTYUJiuRWFDIuqBWb0H5Zo+3MhWsAS+CC8gtLNBAMAkaZp3ydo8S20SnKEMBEme9rPcVlD50jvkhLWTIqCAUbJIBEDKAkCMdPP2jb29LQH9w8P92cwxi2ffX+mtrK/eu3c7M+iKuXgmVUuQWEysGU5mw9FInYsTr1q7cTl4qSVgoEEB0DgAYRYVICU0QBkAISiRGpOgmamHToIGwSuUXp7sH+6/eNFL1IhDYYNAZDEp57NChREtEIEgoqmz4KNVwHsJuGAGEEJF8izORQ0Ua0YXKYbyTFWd54qDemeIULwKkAIKICsmNunmeWIpcKWaIcoGNhlwjXFMehFTjKHwVzRElCYWhVXFEJFJyNhwUsQ660cjKlgDmjlu0ogMIJQMi+J8Nts/GZ+NS1GT2Iy59JXb3FhdX+mlFqGKDREN/sHwiwZvYO0w9Z6d97Haxzb9t6Xl10eBcP9FpQAtSwkiOYAxBsiCCgTGSByRwwVro/7ZdbqOEW1yCyLdEhHZeyBjjFFAdpVzlYYMekVhEK8o4rmqqrKoytJxVYqwCohaiwSAJvxoZRGyKkKgqurK+WiomeQKorGDsNzP1yjbx5zg5kmvcVuvsa8s958RQFGUAilDxJi0m3QRwACCMlQls/cIYtAJO+9Dfa0RRMMacGmAoK85yy1jHJv/+7LQkuvrW7WbabhBw0xCPIc2w+o11QcA1FVuMp0GUz8SSSDtidRTMooANkkQKZRMYRpR47gANX7aWE6BXgKSaptGG9kLob+lq93s7Ts7L/aP949GT/ZPd3a3mfnJ89PhqNzcWrm9t7k2yECqspiWVfB1phYtqsNa7gRAaQUYKfs0oX6vX5XF6flUkSrRs2lBlmxiAVbWOybF+PUQZWU0FLgQik2GikIAzNYoYCRs/GTR4IKLAc3Ixg/4ijAVYqBekSl+CAhAhozV4KpmkUCanDG4kk3JKXB2NLx9u+rkPYMafs1gJg5iWaeTra33bXpSuHI8n1XsuwYVpW5atah6ojG4NIqD0cKLhKYm52CzYrXI6hiS/gBUYVZ5krnUGUMtyrTUWbdx9THGmsQCovPOs1cBEAx4otiCql9aSBwNezuqFpUbTWaOgQhEvPMVsA8JbyEYFUUURVAZ4Hg43z89HxeFgCQG+3nKZUXcQCyC2sFSn6lqRlCdeLAouRCRQrRsyKb33ocsVJNYhAX1aBFBGCjIBpI0zbvdTm+AiEmSpXnP5p2ydMZka+vrad4RVQ6DOKhFxZbVcaXWzOdFUZYDoEVsn4CqIFqEWirFmqdBCESLxJ5mNCl2+dQ5V1VVPfgUC2BjaHV1zZj98Xg+GU8uFa11gfwS7QjDaIAiYNtkjVd2FH2pyvAq/a79L5cy31sjyZejJmjJVLUc3rtwcl5SK1rQ5vaPuN4EvnUF2rKg1jzM8BLYLr6slwmt45Be7W0E6W1Zs9PGzd/u4bRuZG3/6OX7UBAckSIaFqOYEGUsMCur8el4/+D58+dn05GfTavJZOq8Y8+BCkUGjaEssyvdfHtj9c6tW7s7O+vra1maqrowdwCLORD42gdwKRZzSZULQR0xu1UUDCXjWfWHh/u/+NUnZ+cjFXj7rbs/+cl3vv/9t1Z7CXKBqoTGkGklbrxOkK+PHApoAE1Vucl4VlW+dJJlNFjpdDoWpEIQRHnjzu0Xh+eHJ+enF+dA/vMvv3zj3lt5r7eyuvro6f7T/aPj07Pd3d2GupCkGVpLNi2r6fn5xXA0tom5detGp2MN6fHp8Seffv7k+eGt27fe/+CDza2tWTH//MsvPvrNr7/48vODozNrh4ZoPp3NZ/O//tnPDl4cfPD++99///1+r8fsFZFViQyrnp2d/+KXvzw5PfUsdbGv4W5x3vW63R/+8If/6l/+y7t37nS7HUNE1oRaLk2SNE0//PDDFy9evHjx4ujoaDabDVYGnh0AUAt43Q5arEP9cFl1bX+IMXJ2d3fnL//yL/M8/7u/+7s//OGrn/70p91u9/79+/1+D7FG7xEupEtsWhdXfMRXoN4v9TgvXoC+VDteSjetM0iBuc61ELzEnX9JfzEgCpc4yE3x9fWzAvCqILg4g4kL2Xch0S4GbJrImJcz1BQM1C69xRuLS2pyeK/lJYvM0toBl6GOl3qlgeWNcu3auRaIr69/FPrwAkK+4JrrUke4ISxFekMcv411cnReNVVXABqLNKhhiPP7tY4mCiEfK3xZFJKxDpVSQ5IRrvXytV6WeXFApRevHAooECUUi6oIFgBBQv1dz/5rKEGjU7NZolVIW501VQXw4vuDQZ6l1loWGI1nz54fDm5txyF2RDAJYKidApaRIKa1EyVpt9/r9fOiqjpp9rtPHhbOj1GfHV30V1bee/vN7e0tBKfekWpqMEtMltjjs9PEMjuvLHUMvQYLkBfW+j2RJj+OMYroYASjdxaV1bOwWkjX+/mz05Fzyoonw+HR8eFWL7HKKGxIEQ1YN515Zo9oqc3FUwk0WgDwLMaCCqICGAtkZ7PSOlFAz6UKAxEwOEdYnwidSMVaMiCiKKqSCHkwrMKiJsEkMcZSCH8SldgTVGWWgE0U1dBeoEB1DPtYkzcQSJP1OLUhQ2hEPSxEWlRoEssCexQRUQBZwAEdDcsH+0fPjkbjgpFskiTCzmKy2ul30zT0QEU1hLXH9qiAKopKeCdUhL1nz2HeHJZwChAnhhen8CAEsPPe2iRNDBmLAghcW7m0ta1SxPjGRKVwiqjN+02hGNgewYsHOJnMs04ebI2JSeKUsxJ7rQpXOeeqqqim89nUOccswqhASghEQEDYTClCQGPHAV6EopxjB7vdTpalxlBUtRbecNQmbFfDBh7FKvmjSlKNJjwUJaz72hQIoSJcWSpZWAnBkFMpXcUaRTtm8c4tiG8LGuPrjkqqf0To/PX1bbhi1wj0arh50z5UqapqPp91OlliEwRk5mBKxYb8BmiMQUKJ5QHp4qS+sHhcwTsCAKpyiNeMNtuwLwkoIoimBDc2+m+9sX18Pjs5Gz5+doiEJ+dDJNjdWt9c62dWvZtWxaxyCmoTm6Q2NcQAEh9nQa2tSgpSuUpE+/1BUfFo6pwaUGSEceEOzkZI5H3WSzG1JrEWMHCY4taNEsLhSRViGjtQSHah2ioNMUXzsvss6o+1X1VB6ipPAj63MZawSOWdZxdwxWQN2NSDFUVlfz6tjs7Gm6vdLLMEnmqQFRERQq+TbW+u5jlV3g2nE8eOkkSCCZaQgJAFAQ0abURwVECGmHBZF0jNtEdYdkXrJmPcbABAFAvnpXIssgSlieciDd6bMExpjM3S1Brj2dcZrFE8xpoVjQutkEUBgETRi5YVew5EJSfsm6h1FTAgqCKgDnlW8aMXB6fjaemcQU0MdrOEaik+3JBkqE4xjJtgaG9qGJ+OnUVWRWOAmb2rRMQam+e5NcYYMkSGsO11bY+XE1CSJDZJkYiMNUmSdXqY5klRAZg072Z5Z1aUNUFfKs+sMp/PMbXsmD3H+jEMnmlN+2gLW6pAxCzFbAZEWRox/RFnps3Hpw0QTVCISBWIzMpghdBOp9V4PAYAEWEGYw2AubRJLMIw9CVTrq/uN0KDX4sN71cZNpcvWB5hhhpQ9Wpx6bJuold2q5bAoVc2O73G6X+7qrPL6tVip7kCcm2rWlf1l4BAjTFgrzC814GusBwlhpeM+Jfu/eVngQAB0Cl6wARMB9DMKzgfzvYPjvf3nz9++uz4aOir2DpJsySxKYBBUmB1nmezYnh+fnx4dHx8duf27bt3796+fSNNLGGY7MOrRs6XidQveZSuqm6xd0dGwLw4OPjk068e7x8Smhs7O3/2o+9/8N1726s99WMDHuJBnzSegfWyJrz0kYWdT0IRqYBFUY7GY+eqsnCY551OmqUWwBOoiO/31+7cuvns+eHhyXHl4Onzgyf7zzc3bnR7XVA9PZseHp0OVtZcxcKSZ2mnv2JspmBGk/nx6UXl/MbG5tbWRpoY58sHj/Y/+fSzyvkPPvzg7t27eZ6fXpw/fvz0b/7mvxXVXNSWZcgSF1fyH/7w8OjgEADefvPNldVVL4xkRIWMQaTK++FoVBQVEiFSXb+AArB31pp79+69+847nTwvy8J7TxDB/Uykqnt7e7du3ZpMJpPJ5Pj4eHd39+vY0E2Tn+DlxFsEBWY2hu7cufNv/s2/yfP8Zz/72Zdfftnr9VX1nXfe6fV6Xr2IkF7Ow8NXd/suYXZDsusl1Vj1Kim+2UIa95C2ocbGGIlzQ6+pNRb5dXG2kbCd9xR+rsIfsbZfJUI0N33ITG7oxrVcC0txda3G6BIX4tI+tdSLxTgrB7J4EF77gq9G6kELD91ijl9f1wLx9fWnOoIgYmtUrU0xb/8h6HT1NJOIBkdV3TVqcLThQRfwnkPeXTivBxcSLvQaDUVM6wQcA75IQVlIfW50q9+BOzdMpzuazU8vxqNZwYLzoiqrClU2tza66WpmaW2lByoGIxOgWeEkQmRr8VoACQ0Cs4JIQOOqlzu3bu1sbfV6XRZ9un/yn/9/P83/7T+/e3ODFEUMQNJAaQFAhetqk5UdgdtcSf75j75ze3urY7OPvvjD+XR+cDr0/GhjpZ8QvfnGFmUGxWdEiaWEMLfQSVGtDQ6rqIhzFCewDsOJrxoaJoF6QQdGAUEZ1ZOyqPXUee/erYcvzivngGzheDwZvbG1l5NV9iisiGwQQBgECIxBo6DCQaNrkK5ch0B4BjHEHkfDiZgCUVmdqiigoCnZzIsxi1OAinU0Kw9OL4A0VKjqPfgS1DNXWea9LwiZENQrEGF0B4Nzbj4vyrJM1BMYACFVoxBC7hpPkTEmsQkZAwzhvKIxFk/rhABpxbWLilqbKNC00pnjOfJpYfaHfFHYEnPMhMgSJ2u9jdV8kAKpZ2BgVQCO+e5CIKQCooHKLCzC3gdIZSNFh+NfTZfQunssImIIhaUsmcWYxHTSVIVJvYiqsIISWkKKBuqoCCChqIpXMGRr2xpG5jAoADJgAKmcjcebxibGWmsGvX7O3prEOz8ZT+em8t4Vxbyq5t7NCRQBLRpRUAYggzaM5jXWZCUkJSKLiiC+SvNs79aNlbWVJElAtd3ahsbDjIuIBtTXFblX2V71B1dTKYjAGPFSVS4aukxCxiRpmmdZliTCMi8LFgEwQWD3weeCbfPU1UMgNrPd3nvnKmPoegj3f6mWZ5Qv62yuSy6VcGNMp5PpdLKxsZZmKWhsWWEjQpEGCrw1iYADQaWXp0iLxL/bvu1VUURMPV4AqsqhpwrCTFgOUnrvzRsvTkf7h2effvHQpslsXm6sd2/tbnRTw1XhqllZOecJkVKbpIm1RL5250pABYEAsCo7r0XpnRqT9mzWFRd0UCm9Ho2LqTs/PjcrnaTfzfvdbj9PM4s9Lz0JbSMhlRhKCSiKAT8kcV4AdLHOLUjrgWPeNIVj1SxAGCkwKqDhhIAwK8qj44uLi6EIp5lNEouWhEjRqhqvMCncw6cHOxv9bLOXk0HwqIEoLAjQ62Z7u5u9bno6nJ2PxlVV2V5eIQMFm3H8zMkQEgGRKgiGNyrYMynkqrMIKxhAqNMpWxBADLWTKMwr57xnWUSqBSRDoEA1sqmwtzbrdDpZnhGCIQoW60jXiEVOgyMBCPNPZBSQBRgACHqdTmKCOBuGdVABhYGUlKBgPhqPf//gUekYQTOLa4OslycWMHwDCDM/CIasGgwDSUEIgtj7BIOISJVjAE9kwrLNzEA46PfbNkBECsyrRhCvBzHQ2tQkiQJiSFnNO17JMZTOzasKbIrGggS1W0F8J8mNSRBIWYQFxGMT6EfNcJku2WNVp5PJ559/bgzdvn17a2vbpFZDZnKjhaumSUKGtMHHIxDR+tqatd2zi/F0Ombm6WyWZ6lNLBCCIKjAJe2spj02dXJrTv/lXApVeE2OT3Mj1fhyfalI1xi0X1rP1/tjS32qo+bxStnfmmhuK2XXJfW3rdepi0Mmfo3C8jUewzZx67K576WnI7yM6X65znWZ4wegBB5AFQXo4mL64OHhw0cHjx8/Pzu9AIVOnq2sdlYGvZWVlfWN1X6/R0QhBcf5ajqZTCbD4XB0fHY+ms6OL0al5zu3b6z0UgVGZUJ4Des0RmZc+R3bXtRgVQGg0A21SX5yNvrNb3//u0+/dEL3b+385b/8pz/88L2VXqLlzGBTFKsg1/krryQPRNtHyEkP8HqVoiim0wkAeO8IO4m1JiLSxACo8s2be+9/771HTx+fT0czdr/99Ms7t7wAdjodUXlxcLKxsT2ZFMzS6+ara1vGdqaz2eHRxfHxqJMP7t17e9DvW8uHJye//u0nj/df3H7jxp//s3+2sbklgCrgqmo+KxSVrDEmAUDvKwVk0dF4cnExLKoqzIgaRAQDSLP5/Hw4QjTWWpZ6gDAiJ+Oey95XVZVYGxkm9QIZeEci0u/3+/3+ZDr54ssv3n33XUMGFtnRS2VCfIvjtCToK+7q0HEX0aIod3f3/t2/+3d37tz5D//hf//Vr341m03n8/mHH37Y6XTrEFZtJj9reRmupuQt3xvwkq7b0gDH5dDT5g4gWmwcEprthMYYoq+lADWm9CiPwiKGVa92jK7++VW9pUWTusk1rcWcONC2qKJwMbGq33RtWvqMNDSI6GtfG8DXs9CxyUi/vq4F4uvrT9ijbs30LbWy2stzcPsRUfPkLw7LSpcyYeslVbRlTA4xcXHjhFi5kVLIThVRQJVwblchQAvQTenG1trKxuZ4Xvbyk8OT88J5EudnFVfuzo2dGztbvTwFV4IwGA103nqycqnrHuzAIcgreJVBJeCX11ZX19fXunlnMq8uhtO/+/lvvvPGrTdubFLoGSMhBctwjF2IrEkEUEYEFNnoZ703b4vAlKtfffJF6fjkfPjbz77KLO1srXQzMMAsjI68SFmWQa2tQUX1W9jiFoksfRyhSmfFCgwgEbJRNiAApLZ7r9pe7eajOVeAnrmYF2trqysZATtgFkRHvZP50BjAEOcFoOoBTIToIiqgCKN4YxIR8QzegyZqLRiUKqAvVNmXzqHzM1FGg87LxWjCzgmoghgAFDHqDKolN+j2isqpcE1DJIn4BK3KajabTCd5RmrAIAoaNQQGCQiQSNGiJURMsxQJwEMIAhJhAVYRE4ESok3JriF6l5zQeF4dTSrt9aWzsbKblPYchxez0ZBd5QvKsm5iUhQChqAg1dV8gJwYUBRhAS8a8B5BAjEADYsUW9nOCoCswuKdc4m1gAhkFQ2LGoOCysq18o9S4+Aa/6uGsWtUQKOUxEZ94BAjhWqTEIio9J6RlAwDkkKSpgYsAJVF4RwDGhHxrgzvV6PbUDxSaXAfhjNCnKwNZkEiQFWDeZaubKxleYYEoAJNjHRTXmDDHo1D9C/Jkn4t9DHczNKo+6rK4r1XBJskSZKZNO8kedemGRlS8M5DnPXG0JmqcTeKeLVcX1hdwrmzqqqiKKIZ7fr6X2hDw6tFb7ss8Z6n0+l8XvR63SSx4T6MyDVZdJ8MmTTNqvmcWWjZSfGaWfJ6O8VI625O0xLNFQreIG6u9W/f2Dofz4/OxkQoQKura2srfRJxriydc0H8AzREJozuImEY4agZsYgCqohUVHxyNp7OysqF2RxlZVAoEKclX0ygl9puVgx65cZKb6OfdXo86IGlGBgGqkhmAV1A0sAWRlkURYsOMIIAGCRCkVp90/pLYlaJgmpYk6fj6dP9/ZPTUxFIbWoIJf5QCUGypejR+fDg5GLQsdkgRRBUNghhBbaU9PI8sdY5nEyKynsIdleghrEBNfMi/HBClLBWxSNJyHqto1S1vVxIIJKwCKABJFb0uuwUr/F4jTk3tIqNoTzL0iwB9C2KrmLjII4rXrwvyBhAcqrOswJkubl1c6+T52EsCePbDoqqZASh9Ho8nA0nBSqiSi9Jdtb7qUHl4GePv5uwEBqDpp79rBvPgM55JrWk4Z4XEWsNQKoAImJMSJZvWw7ryhkakgaqhk6JVUAW9gqiYKzNskzJCEBZlmneRRVRLyosvm+6ebebpjmIivfKjKb9aDQsZKxpICjM8/n8wYMHibWrg5XtrS1gVubwacYGrAgimngOxUAqA5Ber2dNWrE470RkMh5Zs6oKBPR6ybQZk7lk0sQr9swgoLdvhktN0AY32SwFr4Jd4jeMm7u0s+mSkPHqv3JdUn+rFOIFyeib2X1eK7fgSwOmAC5lur7m1vralxFOnqlCxmqPT+efffH4o48+PzoaVoWaxO5tDO7e2bmxt7W9s7G2ttYbdENSSeCoq/K8KEbj6YvD48+/fDQaTU7Ph59/9TDL8373hgGr6hHhj+2DLCuA2PIqIoJVhv39F189eHw+mmXdzvvvv/PjH7zTzwh9aQBJbdhvg2WktgrR5fdW2+9dsEZJLRUyc8XeIRCgWmustQjAHPu7LFW/37t379at2zef/2aYriTPD09mc1Cv3X5PdD4cTY6Pz6ezAoCyrEs2K0o5Oxudn02d09W1zTu33zDGMlcHR4fPXhyatPPd772/e+OGzVIJuahE1hgWJSRjk9AjR5TmnBT2uzDfScaMp9MHDx/9/vefzudzRUKDYbMQCVnyGu0X3gOAtYkLxqlgo1EVEWNMVVXz+Xw+n0+n07OzM++9zYwuo97aBAn8JrJh6x733ne7vfff/2A6nf37f//vP/30szTNer3++++/H3JWQ2dwGf5Qb+rLgx2vWpa/7rl7Sahdu1kYgHivb8NcfX5fYtr9horqlRfT9HqhsQBgi1SDYVTpH+jkHaZLY3QO/l935OB1Nsy1QHx9/eNQiF+9ILYWUGMMkVFpYBQAdTO14QBGw9HLOtWxRl6avLMCXEONgzKqhISoBGAJUNlNRp0k3VnpJqDzyq91skk3n45Hu+u927sbq/3BxdmpK+dBtAsTDg1oMCpwcWWk2pDRaIFAiJPhxWw6JsI0y8CYs+HZH548+6c/+k6/Y4ksSWDueMIwckt1DjyqSqQ4gu/kyfvfu1ehjGeTPzx+XpTV0xfHRTHf2V754XfvDzqJqvfM3lXFvFLGSHnUVgI8RW0CFAw2Lb+oFQZhXkgUhVQtiFEGEIN+cyXfWusdj4vZvCpETs4vVLWTpxYIRJRStr3ueQWg6hmIVRRBCFWCuVsJlARYuSKbEip754U2N1fv7+apcQKs0WFLo1L8p48eHxxXAkXljk4v9suCUVUZBAxAipKT3NhdWV0ZdE2apcYEp5koECGhMhTz2XA4HA5sAp6UiBRJEeusHiIyFtLecOomk3HlPQDMi/loNLoYZr3Eo3pCg0jBLU5IoXcBoF5oWsHzs/nhhLc3NipPvZ116G91J+PJ2fF0dFa5F9PCXQyns/VuJ8mASAFYPBmDQME2HPieLOpF2UuDcZJ6sjgavUFrAIaEILt5Mce8k2Z5h1JVAGEFVuWgvgCFVEXUmKIAEu9VACQwRpTKSlk8IiXGGILM2Hk1d96nadLv91VMd20LEqtEDBiJFAjOleBcEI/CK5J6nlpCaECD5AhHfEIKA+AUMBfNI0toLZpITJWlU8nSDFLMf1yYjF8ayP7qMkNUVFlVVdAkCWWKQMaAALAYUctKXtGqBF8nBgO1AAQv+auqgHj+a05+ZVnOZrMsz1+qGH7DQ9v19T/rzvYywFz4R+/dZDJm9oPBijGGhVk8iMcIhYhuRzLGJDZQ0UHQBHtNHd96lcDYmtDH2AXVWhiW0B8KxlJhEQB649bmxWR2OpzMCtfvdwaDniVk57zz3itrvJXzLOnklkbCgKRoQnenjpO1aWqTdF7x6MVJWZWoiigqDAIBB89AU8RR4RMqs9Fs5Xy0sz7wip1uHwd5aoh9GbqnhgwhiVAocOtxGQgsmuCKEZEYJa8SXCiL8it6f+qCjIAAVMR7Px5Nx6NppYnppDZBBDAaguOCdZYmpfvq2UGaUifbW0uTpu0sqgiaWpNYg4jOSenYx1eijSmmjbiL2nSILY1/rvvD2MwWLyT8EJxKGgRAdKIBinCpcQ5LiL4gy1KaJqmx6KvFQAMu1rkmwFdFAUhB0FBRFJPJxLP0et3799/IUhOAJCGETUQFENBWAmfTcv9wOCsZRDpk1vJ8q9ejBvwArCohzLYWXCMSu2FNOOeE2RrT6XRMyMIFJGMsJJX31qtNDFBAP4heMQaEgp/QGpMAEotwpZUbzWZVkmbWplmSobG9Th+tKauK2RsyiGqMybI0yRJW9q5k9sYk2Jw3qcmQj3pSoFJmaXpjd9dY2+v1ECmAyFAXlH9QqZEY4XuQqhKZ1bW1LO94Ue+UiAK/ClRUGNEstsCrOtoCoqSXOpwtKXahKdS2g6Vdo5khuISVeGXU+1VdeClUs5Wu3DRDX7efLvpS9SZ5fX2bJGL9JkLJ60O3FlNf+DV/fUEKvHS2qufc262z5fZFnNtENEj9+YwfPHr233/x8fMXp+cXhTG0t7f67lt3P3z/7Vs31tJUEVlYFKchkNOgklFCzFIcrK7t3brRX9386g+PXhwcHRyd9h893Vhb2RikllIA34yx/9EacRx8CSB/VDTGmIPjky//8Pj50Tkmyb17t//sJx+u9g26CkRIiShRIEZRYEVRYAR7+RPBVhxpzPuKkzRxFyFUkOlsWjlOrE1sCoqBKgTKSKrK/UH3e99754tHT6YiRcFH1TkKISVG+fxs9BCeXFxMvIfzi/H/+X/+TZIoIg/Ph8J048advb1b1uDh8dmDPzyZz2b33/rOT/7sJ91eL6RBe8/MYowJ/IIQYVKXxSAqLBJSWA0Zk9jhePRf//qv//7nP//DHx6qYuBL2CRBAO+BhUPqmnNuPp8zs7XGe6qdtI3hGouiKIrCVZVn7ypXFEWeZvgKXfVqiXH1RsQregIzJ0ny53/+5865//yf//Pnn3+eJMnGxsbdu3fLsmyO/RRbp6JweX1WbWZ3gZCaqKT2oS7uApdfOFxKK8UroG7vGYCbvOOve4RrPsUVdO83KVKuTqu0GPpNQg9e0rIF8X947OQlr/N15n54xct7/dddV2fXAvH19aeuo+E1o0MhuDXk2BAREYsPg4LQgv5CPIUvhu7b6zk2U+FaW7RqlDsogLIQEiKBieWcKqiasOF4BwoZ4Won7VjqJ2az33MbA6t+OjzTcu7KilBjuB60Ek6AGgkOFjR2QETxXM6L2XhiEiqKeVnOXVWxJGSszbrPjk4+/8Oje7d31gddNBh9i6iL6HNVQgpDuOE9ElSb6Lv3b/7bf/ZD8f7h/sG0qOR88uvffrm9vnb/9rZNLEvlGDwDgKV6ODacLQhqDRYUKLx9Mf1vIcLXhRWpUINXFNfPu7ub689OJ0fjC2OT8XR+enax2TNZSkCgBsQgxcMdq3AseGrnDNS0X2YPwDZJSMExK+r6Wr+TOiQFNIaSNMlGhTw8OMVARWbxzk8mMwk4W1FgztQPcru9vfOd77yHpOczdzIq/bSg1MbweABAMNYM+v0EnLDU5GPxzmkTPgeCqIaQAIjIe18U0+kk19Spd5Gg2QTEAakCGcKkNyzodEbODEaVnTgpRJlS21vpW8xXunmau4tzb5KCde6ZxCFVXisiQ5ogIygF3cAre2ZRFQhChoYbCAnbKCvvnIgCIhFZa8MhwFLo1ooqI0WcSfycgcI/AKoAMCCQAUpK5mnpxvPKeUWgzFJqsd/JvWfP4hCMGDbWdvtggEEBOAjUMTMWpTGjAypp0Kcw4rihGY6qj0S1B1ejV0wQ1NRvd5hChmiA5Gb6SRZU4sXWTq8+rbfGCmLiU5xSAxFRQkIKKrWEcGRWySlLgFKyFklZhUMbPqC5Q47QJSGoVUY1gbu1KSaGyIs0f+trz1XX1//sBXV7JvdqyzP8o3PVaDQU4bwT/fJR2axL4cb5a4yJZ2sT11/EJVrrS358UI2J6iE+RpWwe1AtirGIqht00q21frebzSpnDCaJBRHnxHtlQdFgCZUspSyzSKCiIBIZNSqgDAg2zRCpLLwr5wTQ6yS9bqcoyvFkLopICQJ6VREUAK7YOx+Q98bQ3ubq2kq+0klTQ4goZJjBiyIFxAaACqoqKoVWnMbR3HhmEG0CN6PQWud8AqBRCHbnlX5vd2er++xsOqqQRUSRLEi0+pIxIuLAHA1nnYOzTp52bqx3kLywhAEXRUOmk6YGSRXCmtBI0/VQv4SXVQ8u1bWWqkAMPFjiRl6OB9fg4hVV5ZAOAAahXbZGo1XNyAcEIgg9g0DTCqTaAOjQBVoi0hBCJJsBdJWbFyWrGmsNYUOaj7PPpApQeB4XcjwsDk9mXAF6WR10Nnu9jjHAkZOhNbykGdoNU73s45WmKRGhaqhOa/yuhHdGRYCaTr+0M9ODWLAo4YjIGAyoYzIVS1EWlfOIcwU0NvXOG2s1JtQIADrhNHRUVYRZhA0krcPh1fx1BZFer/e9999HxF6vp9Dy34cXJSphWCl8wNT8Xex0OlmaIAB7QSRrEiIb0CKiiLjkcmg+88VwG7ZKdL2i3r5sxwg3HixDh+OBtrUIvBwC8IpWJVwSreGKBvcPVHRfX9/WQq71uITDMUEzahCXpFqlQll0IGIfpG5VwALPg0qtfskiJCQSh0AUvBJDCPEWQyZDSI4OZ19++eyzL758+OSoLKuN1c6b925/7zv3b9/YWumlnVQQWdSDegKCWLiFH8EABMqEfHNnfT6dTiazk7Px86PzZ4fnebq9khkQH+YRccm2W4/N0+UnSZtQE0VsuLRxvB4FzOP9k6cvzuaF39ja+MkH722u9diXpEyhL4OEtUOYEJUIFEEYFQAMqqnfbwnYxBrFhAoUuluKRNYgUVlUNs3zPAvQAUQKVEU0CKSJSbZ3tm7d2n58eB4meDyziFN2leeiOh7P5iXz+XDyu0+/SqwmCRjUna3d3d29vNubl6Onz4/3D877vfW333zr1t4tCMQhlaosZ7NZMN8AAVEgL4qGTrhqWVaVYzLWpjAcj/7mv/23n/3t3x4eHgkoWSOiqszeAYBnryqhdPfM0/l0XhZNWRRnQsKmgVAVlTATEQG5yoU3QmIeePhc6vIFiciEUNxwytKFP6ppTsR3ulljG1yYtfYHP/jBZDL527/9288+++z+/ftbW1tZlr1sFaXFs9AwFbRlsQe6ckLAViqTvqYfc4kz1t4LLiEmrkbVxXK2Za9ekl9jSLx+ncIMbd+t6uIfEJt8Pn316180QRfh44ucCf36k/fLLIa4iL25XBu+vJW1pL5f72fXAvH19Sc9VdAyKvSqRhzmIyEmucf4FY1ZN2FItH3mjlkrtbZZLzph9QcSFBWpz+NSr9SICIRGOY74hpAcUmBRFE4B0FIKhi0BIIsl5Go2kbJAoDxLgWihuWrNXcc6y74+JCAQKruyGg+HSAkZqsBnaZKlSTVXYbVp9+D47Be/+X1Vlfdu7/Yyq94ZQkI1FMsmCsUY1BwrGyRyv5Inf/b+e6OLCYt++mB/UvLnD/dv7Gz2O1lnb50BK2YvChgVvHhcQdQ4mqPtJmoU8rDJBgVCrXmPdZCEcJ6bve3VtRcndHgqkIxn1bODkzvbg17eAQFECaOY1hIx1Rm8qspExlISyzBUZFHPioaF5/PZeIZkdzoZAUpoO+dp6oATu8guEtHSMwOiRWRQr8ycJnZ9ffP+/XtJAp8/epHvn6rMQhBcOMYliV1dGezd2E3BB884kkYnK6hJLFBikt5o7gtI/u7j34vnTifb3Ny4cXO3Y6uqmLnKOe+CUKCKzMosYMyk8sdjHrmVZHVjONcKTCUsSooW816ep92kQxtb3VU7ZecvRlbm1lYqDsAAWIKU0ARAvkDUFkFEvZNwMFpKSFMAqKqKWZI0TZIkyzJDBuKXQYxHhOBlCnY6ij2FkPQGyEAeqPJ6OppO5m5SMgsiYGYwNTgtfcRnlDxVBNDUml6WZIiZsYkxMdFPmUCJEFS9hCjIkNMcojLq80pNiNCYGB/znCTciuFpbszGNTAc2+PYurBILJ1IWod0vKoR12eeJm0ovoGi4ISlYvUMCkiWEJWMYgJkARmCqxEJUJmDS8u0HcRLwQlNVkntXyQTmJuLF7944dcL/7d3R3vZybUdjC0iVVlNJlMAyNLMxEQUrMvJaKYERGNsnnUIjdTI3bZSc+nQj5E8o7HuEkDSWCIIg2IQdgWURVkRlFOTrPTyXic7HU5K56fT2XSSQYoszAqKaFCI4siLiJcgf0mscRTRGKuA3rN430vTtX5nfbU76GeT6eypnIxmFYCaNCER57yyMmAJOpqpc6507vB0sLu1dv/2jbWVHrCUxawoisoxEZJBS5SlJs/T1BIiKaoy65KlLVBuo70zzEqEIZtQU6soEXbz7Mbuztb6ycX8NPSCDGUIBEoGABEYkTEZVe7pydAa2BnkN1byeEBAUCBC2+t0jT1nlrL03gsRKQurcuPmrukRC5astrrYNex2scI1ywEi1C4hkIjTAsCQolrLCRGpU38TjfApAgAMgYQaKzhsvmkM8au5+QqAhqqqms3mnjnNMqrF5cjgUikqV4ocj2dHZ8XTw9H52BElmZG1bme9003RAPtAyAr6ujLUKgZ675k5fDBBN7fWorWEcekWjZSSRvDRRfu5XpaxPjTVSjgZY8lQhONHYzY7Fwy+xnpQtTYBQ4FirCpkTVCmmojXdhuRYClRPeRUqKoh6vd6gGiMUWaoc/cCcgvrw2pIi4oQTBGD1Ot1kzQTBWZRABMhxc3eo686+tZJuVo7ql4lDitiUIQXgbSXyv76bHh5quBl/atXfoG2/t/Vv3VFYrj6cq8hxNfqcBTCEAjCmbMx8jRLGcqiWwMIuKw9NZkrQeCMkhnVW2tocaCoUxIgjyhKpEIMiePk5Hj0m4++/Oqrp0cnJwB85+bm9777xlv3bt7a2+p0rPoKw/BYPBIjgKkFqEAHBgRWmfUzu73eP9tYOx9VF1P38Nnx5kqvt9nNECW0KesjaYPGR1zYmdrSXs0+p3rENIZkAlLp4cmL0+dnE5Omb9zY/vDtN/oJioaIloXdVFUJTZgBAgIiYMekYOo2FoMKiKCiEkHcBKN5k8gmKZGZzYoMyLlSxCsQqAUAMgmQmVXl+ejsybNnXtQmmXPg2IX5DxVGJ7PSV549Int2UyH0BjlPqdebTmaTWVGeXVw8eHIwnhZvvvnBB995f6U38GFnVKnK+Xgy9szGmoSMNcZ7L4EUgcQqk9lsVpazsnry5PFnn3/233/+82fPXzjnIMx1hmki8WHz4/A5GfIi48lkMp1IuMswWmlQgQhR1ftKmAkoMUlCiUGjEip7aICKiNA0L5lDVRDJQ8F3Gzr0YVjkUlIu1rMyALC1tfVnf/Znw+Hw5z//+SeffHL//v333nvvyoBgs+80hRASoqDUXW1o3TxLBU2zgb8KCP5SL4IxBq7EJDadxavfB5dg9wrL+OCv12iRFl72eJBdjHk2CvHV19kCgS6Js6Gh3JDzX9N9fNV0JrYDnS93hS9/iyXS6fWafi0QX1//GA4WxpjWwxxNgksB04htT1bMm4sV8ZWo0FhgXIXQLzqxujSN22B9lSCgA6G9VFAwdiICApGGOodJFVXZeWZjrGpy6Yi9WOhqx2c7CNVV1WQ8YgYgxMyur6ysrw0KN3bOJzYdTea//+pRkiaqsLfeB18mBgiiMBwiv0NADpABsmBTtEQIVmW92/3um/fPh9NH+6fT0h2fjX/7+z9sb6yuDjqWZF6WXtgGNRQXIPm4HDfq++Lfoi5e9SKQHRUVDSCIgiHYXOtvrPW6mZl5njp5cXQxqwTQ1lAECcBEQyQUst6iH9aSgdBMBiJEYfHgwFdTNxmNvBePIBoqUiTnK+fEOV7smkiKJBBUAkVUAXICitjv97oduzLoZqldUBlAACSxpt/vbW1vZCioYAwQoTGQJom1NskzMknaWR3NeSZEBnzhev3unTdufe/9d3Lryvm4LCrnK+cdM4igd94zU9r//Nl5cTEuNLVpf+4UCIXRgwogGUvGpL1sdW2r11GeH0/mwwzKDEpkEVBENFYMQmhKiwKzqqiy92UhrvRBHFncwnU2vcRHI0kSDMYi5NrdqgrQhMmDggqTQQVQJAYoRceFGxXlwem4cOrUBg9E4iVBnZQVIYAqq5rxDAnTxK51u/0s6+dpL7cJAamgAqHY+oQG8QglLbsvLkx/sVMNzZBv3P1FvfeXExEa6YsQroZb17pCk/nTPPB6qQffbsYHowULioLz4kFMiLxE8uLGs/JiwrPSCCiARTJA0UsfLAfUZjtiS6pqco9qRwBG3xwuqJEvjRi6Pot8u/ThZR9d+5AabllhKatqOpsrgLUGmnynkMUJtQ0VwZik0+0Za9U3g4fS9hheEomw7ZpXkdYuqA0PV0UEomNZOTGYWoMAVeVOT893+1m22kc0Qa1i79UETFxwtYbZ2LoFZQwadN5z5VPEnbW1O3sbaytZmppxN5vNCueGc8/WYtdms5l3FSsAkPGK48LNXpwcnw9PRhMx2W4FZVFcnJ1NJxPnKoNoE5OndtDvbmys9nvdbpZmYd8SMbiYCUIkIaD4gKICaTAoQZP3h0i6Oujvbq0fnU/PJ4X4xCSRzRfRUohMxoueTytzcPZ0a2WtcyM1Rhf9HOx2uom1lXPj6XxeVp004xqLgBhoyLUPtwZJSIhFXT4RtP93yUasi5oQL+v/V9peUt9NC90u3jWmdeSIi1IQiCmM6mLp3KyYs/eWqBaIWZW8SOnl6PR86nj/bLR/NH5xNK2EUkp6OQ263U6eIaBIHN/CWjEN2eQs6r13zpGhNE2ttUTYtLRrXn/tj0cFqj+BePbQWqOpY/YaE701ZKLIzCqEFEKeUGvqs4ooh5mT0FZNjDVkVTREvEItvbe8W00EzcIwJczj0QgAur1uJ8+B4jBRM6hGSDUKJCYGiggS5HlubSQ41dT92O5crjqvVKSLkXlspZ7iVclWWl/cTOxeSqJrBOKrAOLWcgEth9cVT8ZLxvsbTXkhK+vLVW+tGyDXIvG3bT/7H/h7GkKfg4Kp2rqva/0rEo/i0gUtq3AzC9JyIF6iCYZxSgQkIAQyCnY68ycno88+e/TRR5+OR9NOJ73/xs577919/3v31gY5Kqufg6oqRd0ZaflBqy9h8RVC0s+TrY21J4ej0czvH57c3V3fGWSd3Hqpwok2NrTq+bGgFiKahftQoc2RD0ChME1JBIg0nVUHx+fD6XxtffX+nRt7mwMLnjG8OxLLMSRAU1R+MivmZZmkZnV1JSGDSKpQG31UUHXx84JPIy5IWZZlWVYUZeXkYjgsqkrRIKVEJIqT6Xz/6PgPj579/osHp6OCJalcVVWV867dA1JQIURFICPKoOC8nJ9dfPXgD1m3d35x8uzFESK+89ab9964Z8I0DAKozOfz0XDIwqihOxjKFjZEwSs0nkxfHByQtf/9v/23Tz79/enZWVk5EV7qSGEra9oSEgn74Wg0HI+kvjOCSQVr1Bt7zz7gdzBNcyLDokSmmedj5spVrnJluIqi8qVzDgCSJEnTrJPn3V43z/M8z5MksTZwkEUXLT1tlu5bt2796Ec/Oj8/f/r06e9+97u7d+92Op2rT1PLJhJ3RiLTloZDkEBdwLT86NEc/jXgoEv/6aUPr16BAWGLz19vOm1Xw0vaQC9jSlA7gY9Zl87EKC99YS3ZveUEwqgOx/EnRKTXdKReoncvgb8R9Kq8rVf04aX3+7osuxaIr68/9UVExtpa+VVFRV1u9rRWqXjyvrpGYCspvtZmQvdsaUkiBIj8tghz1DD82QoLb9h9oaRo5aQbijw/CuZViAhEEyJL2iOJzaoWl++oY4sIoIbMXOcqms/IGhWzsbKyvb52MSyKohQxxiQXE7d/dNHv9jNEq5UBjoMuiIRoI3sYBYyQVZORIUuaKudJ1kvsnd3dvY31h88PndPHL44++eLh9uZgY6VTFXP2Do1B0GaoK8awNPk5MZMCFSgE3KjWPIBG0UKSIP6iAPPaSnd7fWVtpTc+GlWIF5OycMBoiATQBH4r1hpla0vTZkQVFA0SsHpfiZ8XWMwK9FLnF6gqq6AIa1V5aViT8SMgAAIUMAbEOOaT84uyqgL2MMT1SqtQCzKCMcYSGqQAZjAGO3mWpkna6SRpJ+uv2ZI311cC4s8Qra2t3Lp1o9cFLmfKqqgc3D+C7L1nwXzjxP3u0cWBasepQTAiwc5LgKiKLFyJejCmk6WZt31eTXqJTNELUmbTbtbtht7IZDyZTsrKsfPeFTqbF8V0lFIgR6PWnBFEsNaSgdBiQcCQAi8xEk7qUKPgngdQUWa0iSIoUcUwqdzBcHo+mQ9njskCGUJj0aiKFz+vWNiLsKgwxPP+qDtb7fVXe73VXsegkopBMSRZgom1FhMDhKAYwpeAVep2TnM2ouU6M6hZKp59PPEHX3+kthHAgg7SKugXbtxLbV9VFWrcJosznNZD2CAArEYQlOrEIdCK5xfD4uLg7MHT6ck5sBDFpje34i4DywubA3g9o1ZrCAESQqD1uABQRI63D3OL2cOrksD19S1pfDbMkRDzGHDbAigiZeWm87kAkCEVVmFhFhYEpTCJohL4EnknN9Z6rBppuOl4Qk3VD9y69m5I9aopCIikhmIGZv1NCEkAQvwnKRgFUb24GJe3bgzWNvPMiLiiLGazKSsAaSDYVA5UOFr7DZKxClpVXirXzbPtjZVbe1u5FV+VkGUbK/3JbF6OpwZ50O8nFsejSVU5IjKJJbDzybTyhcehyV4cnY+nk8n52cV8NhPvDII1lKW2P+jtbG9tbaxtbayu9fOUlNgbEFOrlISGUA0G5joKGggtyEZrRABRQ2ZrrbcxyIajMQoTNIl9KEiB4UNEwmY85wfPTvY21rYGHYshPpBVOEsTa01VlcPxdDwrrLXeO4zvJGugEmsgWQZxPg6nBGGStXaohUZXvQNCnQFbqyLBssoqgtT4VhcZL6Cokcuj4YMLSjQACtQ7XYQ4xX/UqMASKaiagmVeORTNrQmmZVX1ADMvF5P5w+fHM9aDi+nR+XQ4LdMkV4tZP886HUoSRh9uszpxL/6UqnIKEHYKECDEPMsQIcQVAmE9nITx5yEAKYSQIqRAxg+erVpJCTevqqiJNT3WEysgIoQAhhCQrCVriSzEsD8VFgIyxoh6iUt8zAOszVsQzpnY8gmEU9nZ+TkA2NT2egM0hMLh5UmoVVGRjBLKos0ZJGw0gaNFhCGsr8ldItBFo2Yx4tbKmK2PQNAUyYLQ1gi0MTxdmiG4JARfGuBdRBAvyQdL6e9tjbhGYbZta3qp3m6p2It/05T3YV7pWh++vuriqZ4SuCQN62IETBd3d/P/oUKTRq6L+3/xt0GQjDFAqWoS3P/Ow7Nnz37z8RePHr6YzIqVlc79u3t//ucf3tjbWBlkIJUvHYJaMrr0El7SsBdVEWXxibUr/X6eJZOCJ+PxxXA4K1bXel312mpu1Vz/mOKoxtQwtyWZSbEe7QhAIIMG0Uwnk9Fw7KpyZ+vOrdt71pIyq0rzy4siIJFJD05Ovnzw+OjkbDDofec779y+eTO3RtlhtIOEQEwiAAqoCYyjIQTQ//+z919dkiTJmSAqIqpGnIUHTZ6VVVmVVdUN1gyNXQxmB3svBmefcO/Z/YPzH+6ZM4NZDOjsoNGcFc2sSp7BI5wbURWR+6Bq5h4ks7sBzABohJ083ZWRER7mbmaqIp98pNsZDgYqMC/mo/G0cKImJQNkaDqZffHk2UefPfziyfPRrFSbVyxVVVVVfTZbr1kfCBw7g5Kl1hKVJT/+8qmr2aubjOcbGxvXr+/0+z3vfeg6RGS+mE+mE2YhEu8ZqQ4gbNMV4GIx/+lPf/LxRx997wffr+oqybK6rp2rV9ljtGLekWc5ItR1NZlMJ5OpMGN49yHwGoRFbWKcZ8e+qmrv2VhDxhhD1lpVCP7Fk8nk+Oj41e6r09PTyWQym07nxbwoClXpdDprg7W14drm5uatW7du3rx17dq1jY31dg0MDnLtfzCztfadd9752te+9vLly08//fTf/Jt/k2WZtbZV1ZxbVC/n8K5Ud2+oLX+J/LrzGRjtKm1M/DxbjPiXjqA8Q+I991NtDG+rhmk/onPmyHjZi5x7Ry3NuXH2oxWO3a9YhyNeCvlepb9cAcRXxz/7OkJEWFo8Fy/Ax8vYnUDNWKp3YnPR2rqvQERLecXKl9vkNQRAEcZW8RkHu2AACZFDuFao44MRYCQo6VLTHvHlWOcYYwhNsOlp5BICGqWIrbVclNkrWrQ2eDEpG7V5Yte6nU5iTnzFNZmOLRn3T4pOPtrq9Te6VkCUVRFUBEEIOfQgDJbJMjhUSFGNeguESWe9m7939/ZkMjsan04L/vnDp2uD3rtv3Rh0yLBndKhNsE60dm72HVAADXtxwBaJGpCOFUEtRe2YAnlUAhbRjfW1m9c2r22uPX11oml2OnN7J/OtzbWNfqoIoGSNYee4BrEiQNaQgAoz+yqoPwPgSxQGAMwoFYsHUlKU2MaKgmNdVLVnkWB+G1FnQgAyiIKK5MTvH4+Kyg8lbFoAgcwTdLsI3nvvXEtWaLROyGy9J3LeGA/AiBI6vcTYxWJRVaUAU5oQG0gNEACRAoESqHqhl0fF0dTV2Ml6QwEkAGEmRoifpoCCsM5LZrRb16/dGGxtdWosx0aVku5gfWt9ZxsJAORg73D3xUmxqIuinIxOi+mkKp3J08SQiYp0DJV3lmXhXlUVQKPQMhE1Cv00aNsg8IbVgIAympnTo1m5P13sT4tFxUyGwCJZDXCJ9+JqFSfsQQSNUUD2nhCdukm1OJz6Xr4AEUROEBIDeWryLO11skEn72ZJRsYAGxEyQSQWuB7UGmrpkuEWpi/hgcVokQyrJlB6xlLiTMWCAE01vUow1pVS69yAXRQ8Q8WWEYVAUMbz+enJ6f7R9Gi0mNf7k2I6nTmRoB2QENzUGkBjS8duOvawtujqYFojmywGQKqoXOa0rnA5z/nq+Jd7NMTV2BTGDlkaWYwhdMLTRTGazIbrgzxPCcL8LKJ6Ei1Ow6gyjGZk1VgfMcaZhcc8tIDBbSn24gQG2lWPNFq9YnBPDQMrL+pYylqZJbWYEha1HC1Y0uHXvv17d25s+Hqxt/vy+atX00XNJ7PkZGEpRQxkHVYiJfKi7Lx4VmbhGtWlRhISUd8xdG19rSirabEoqwVLd2dnp5NlJyejoqwQkjzriIBnX4nZPZ6+3Dut6ppFlBUYjDKpJ6qPZ+XeaNbvDzY3hte3BpuDdJDiIDUZAbJHQUWDKgYZQTygktXWiEFD/BtYYwBtKmXPaAJMyKC1QEgPswqkSAYlbIY187PD8dazPXd92LWCIAp2UYv6yoB65tF8cTKdGFQpC4zp8uxZvBKbRMlqzHoTUdGwb3uYl7UPmC+tpglBCMVtFdYYAN7YuUV5dciCCwMnaGwWEdGCkgoq+YAnRpPiiM2YcPUx8qBFKZzOrHbzmq21W8O+KHsRRKgBp7W8OB6PvZnV/nBWTssaDIpIVfqxlpO1bG0tza1BQRNS0kRD6DyAeufIUJIkJkmigZdEnyRAAKUmT73BQEkRUEWkSXuL8LFEDy1obmxRUQRrbZokzCwiQGoomEIIACUmS6wNBl9Bv0JIRskAhQ8xSazNs8YNKfayokpnFb/BKf7W7ZuAmOU5mlVhOwori4gIWbNCd1IFEWBhFhFRZAbx7FyVZ0m8IrgKRjXeFK3JapBjxQu+MjAMFk2RB98kBSPCSt7dpbvbuf8+50rZFnmgZ/FpWDKRo3uYthDwcjddEQgjnHWcgJYJcTXrvDriLdpgxLqk+69OO4KsvnVWWXVLImhvdYljs6axCzshK3hF4CSxOSpN5+XPP/r0e9//0e7BDJXff/fab3zlvfcevLO50QN1dT0zCNaaZmR6llVwEVQiYxMiBjRJv4+Dfm88qxhxXlSzRenWu2eox4gGqe0m2rbq0o+laQ1RBcWQCkyn0+m8AJG1ftbrdwQ8AMOSFxMeNZrOix999NlPfv75rHBrg/7u/uyrX5l8+MG97Y0OsFNhBDJCoIEGJYjBWA5YWZk7eXbt2vag31mUbjQrZxV7yr2rXzx9/tHHn3z62aOTybysPYPxrnaMLNqie2eXkWhHS2TefffOta3h5HTy5PHLx0+edHqdNE3u3rm9sbHufR3iggSJmcuimM0WwiIkZVnUrg7oYXjxJLHFovj+974vzIKQZdlkNqtqZ4211sQYj5XszTTNdravFcWiLMuqrouiYFm5jYhQwq4ERVFUZV1XNRINh8NutysKx8cnL168ePHixZMnT46Ojvb29k5PT8PLpmmCBMYQAEyn0/39fe+dCPR63bt37zx48P7v/d7v3bt3L2TS6NJUJJIB6rru9/vvv//gBz+48bOf/ezzzz8fDAYbGxsNDrt0l7s0TXT1K28GMVdS7974EJ79LSuhTqsN/y+wbjiPDr8eIG6MxrHd785NLsMdtTqYiZPUdvtodV/tBPKX7o5ehx0vP88rdPgKIL46/sUddV3P5jNmjtk7bwq6bQBWQlwaD/+idWElSgoRlFdifM4YOAIBAqFotF9Ych4xxsy03xrmhk3mALZWWtBmrp2N02wkjdqISihwYohCBysp2eubG0eb4+OTsXcVJwiUjqb17sHk9uas391JEAS9aojCowYyaHN9JYiTWYRBUMrU2Leub4/Hk+l86kVPxosnL4/yvPvOra0USMShImrwbVIiieTeJgCHjDYWhopRCorBfUMJBBRRPSoDGEQQIQP9Tr6zNkyNZcHT6fzZ7uH25qA/2FF2aChJUgnbtgGk0BGJZ69AGFLYgoCTLKKgAUCqBWpGFiIljQwprL2UlePwsWOMWAikLALFAJwDFmU9n5eyuWaMJaJIi2k2p9ZbCpEDeqetpheAmVm8Kq/oT2kymcwXC+cdYKogoFZZADi8GlCyWNQ//+zZ3mlRa0JpR4BAGQUMGASDiiIMosrKzCDSyTqDAXUsEnXVs0k7nX5vsLkGFsD72awYDDnLpVNUBnA/yQxRYqw1QChLRboyEhEiS7BUO+OaEs244ztjDXE5ZJjs3PHRrDqYFsfzal4JgyGyiEZFWRx7L+xVnDALc5LYjbWNNEtnk2ntaiYrirXjmRMCsAYNCKFYqpOkztNykJcbve6wk3Qz6iUmzICDk3S4ZKoBJ6GolI4wGkWAePlE6tn/gHa2fgYHXmGn/HJ7PoqALCqcLOrne7P5YnRyPJ2MykWRZ53N7W3p++FoYvO0AnXKSqgggc5siNq0hSYVii5qaqPw8KxZZBz7L6utN0nDro5/0c0xnv0LrpjsIyEzl2VRVuVOsmmtVW0g4cAql2iEF7aRhjjT6FiWtx9cdJdoMr+i50qYpwaQNEhlghiAVbyIF2BBa02WJkTEIAz65OWrUmTz2o5F77icV0XSqede8zy11mjFAYmL5osSMepA8gnLZlAPEEK/29kcrh1Pp34yLebz7Y3tnc31zODu3kFdVxUZtDYMcYvSsXM1e1DNDO1sDDd6eQre+Xq6KMbz+rg6nS2KyXy+0c/ubK/l14bDbp6iAntUimlFKl5RArYYHs/GypmQjEl2NofXRvOnB6cLFvIM1kbZT4ylhcjyRlo49/LgZJDjrY1ubhGQ8xSHgyyzMPbsaw8imQVvkD0AAhoS4dFsdjgpCsamS1cVrypJmvbXBqWrg+kAgkS9kUaryLZNDKcddgpERDQNEnHedkBjrpNWdT0virouAUTFgwpBk7agiGQERCCQcRFRyZiidrVjJMqypPaOhBVh7uRksjieLBZOJotqVjjHkVTLIJXneVktynKQpgkiiGcODiVSVVWWpzbNgicnqhIQtcqQFi3RVQdFAI9oAr1MQSUuq6gqHpFCHI6qVNFVCdAYIIqyrVawjWAIrUFr2tTYwEWWENekIqoSQ4dg6UIkoBoHzEuXjrAHdXs9IMSYrBV8MCjcXlGz08BLy4BgbKJWVb1jZr9iXyYQ7TBWtG6iKyQxBHx9PvMK56GxMYFLXYZfhyO85uurLwxn2MSNVePZXxFWpjM4UQMZX/rbrzDiq01QmznHamQ3rJDTL2yY5+zFYhMVmbCrOJYCMiigIcwXFRwejh4/fv7jn3x8cDjt5cnb9+5+8+sPbt/c7nUz0FKFQVkBJNoiN4/uG29SIkAgFUyMGQ76B8fTsq5ZxLNI4Do0rgtxv2225tXpEaw+LbAM/JYoNQMWKYuy9rHvJVIiYc8N9agZZ5Fx4heVK52rvc4Wktjyk4dPKNH8q2/3OlbVNzJPwjbfCwEhsJAkS7Ltza1bN6/vjxaTRfl09wjTx6cnx08eP3rx4tXJaCpoKOl4Ua5lxQ9tSf+Mj3/0ueHNjeFv/eZX7t66cbh/NB2Xh8eneTff3Ny8cfNmr9cV9QYsLBV9QSKlgN5i2KPjBW9KH9/J8zzPPHNRlt7z1772O2uDwcnJyaefftoyvVamXSFIPVgAN/daTMZWIpPl6XQ+H0+m1toky8qynM7mn3z6+dOnT1+8eP7yxcvpbOa9z/P8+vXrH3zwwXA4HA6H/UEvTVNrjaoEu6TpdLK/f3B0dLy/v396elqWxTe+8c2vfvUrSZIE4BqWqGnEi9fW1t5++97HH3/09OmTBw/eW18f4lLf3K6WS3VIozTDZkoHZ9K14aKFsV7W7qw2Idi+fjPho5bCu2IzdCk0rGdjUs6cQ9T9rKIueJ4X0W4hbdpcg1LHNm9ZpkYzwBWWTOPZskw/IgRp6A2Ib3C4x4tWfVFH1tzDdLZvvGC2f8698KoxuwKIr45/+sN7XxSFZ14Wo2dd0uJUEJHIWJNYY0Vbz9HoN99aszVxL2E51LbqldazdSVOvB1OLn1RNRIzYz4AKETp0BKjioZP4fdGYg8hmUj2gSXs2qTENt8fTxVVMTRtoNykGsj1rY3ace3842evXOVNp1M4PRrPn+8dbw2HW8OOlzKkxiOoigFgitwbNcDtR8XAKEJGb26t4fvvvDo4OJxMi1qf74472clGf317LVUWamPIA/J6RooCJNR8+BKMCwEQ1RCooHpQQGEEBjSEiGAMD7q9e3dubfz88fGkmHr/8nBye1TcuWuBPQnHlwAECMldHAPNo9kYGiJtahxUUDSlp9OZHxpM1AePWHJ0Oi1G0wUrSOMrRAggSKiRmEWgAkVRH59O796+YWxKZMJvD9cRBMjYJMmIjKHgyaABr2wa8oBiIoioSAhgn07ni3nhHAOQaHRdVAFEMpQWbD5+/OJnj3bHZeqpy0BR+Bt6TYSg7kZV9Q7Q51a7KWYEwEyADhBUBAQNogXnxDObJMsQDaa+rJIkDQZYplEjh4+KIfh8NOa+YYYRjcfCnRyMzMIZIBAJUq10OC+eH45PF/XcqTdpmmWI4L0TX4aqx1hyrGVVA0La6Qw2NrI0q71KWXIwORZQVkJK0RIwAKhn8mwrOZqUJ51qmJv1fnpjsz/opKiihNycGBpCaSDU4AUHQqAreziuzmJg2aVG/mQb6QXLymUlXuE1pnmN/wygiJ8uJk9f6bPDhXMFMfaz/s2drdt3hjdud6flo8Ui+/xhWRUs0qDxAqBIwUMNANr8qJXsYMWVMJbleejZZmj1h65C33/9W+VVdAgRAJ13ZVWJSJ5n1liAmEepCioMIrDi/mOTxFobzXmWUu6lRZ3qhf5BQRrDUgEBVQ5DJRFhFna1dyLgAQUoseb6ta1x4Y+/3BOrj57vfvTwyXvv3r1zfd1Ya63tdrDXyTqZTRISAEQTrIdARYRFNfBRFDTwKINIV1SyJNnZXK/YifjRopyMTm5sb97cXjfKz/aOyqLMugNDKOzrumLPrIKqWZ68fef6V965udkxrq6OTkdP98a7x5OD8fTlbjXq5FXpM5v2u921tU4vBWzjaAEZSGPwrKAKtosBGrTp+ratMXm0OxofTAxzkkY1gAQDkCj/QVDDwEeT6aToP7h34/pGNyFVNJj1fvzpCz2cJia9tr35/nt3qvlcmBQMGpqVFbw8+tuf//BgUig2Q1URVbhze+sb77y7mdovX+7500miHLYYFCSNyx/QSh8uIZiFKOpfLoIvqCDei7F2bX1jfWtzNgFAFXYqPi6BiiqAxrCyd65yTgUA1fi8clKz2izdur6TdXuGYFaUL18dvDg8GS3copaT8aysPEQSuicCL3oyOu1gtZVtZUbrqqqcJElGZOMOZyyE+4yVtPGAjmVRLFkaIFZDyRDjglWUEBQMgqgAghcO74BVx7MpkM16a22mlQCQNC2nqIh3uiBU5iAMF1dzUZSj1Pa4rwZSyZg9sAdD0SksDDbCvdw8oqG5ZOZFWSpCYpM0ScgEsnBQnPtImW4ijFq3aOWGKSxS144dG0NAIA3J+HIjyHbYucQOEC7sDnqG7xhZvPAaefI5vPj1TLTz7o3LmVNTSCydkVewGTzvz3gJjxiuOMS/thvZebX4pTd224utoEu4+tdY9cFZS1E9k3Gny9JPFARQkUhURUCVAEnIiprTo9GTL3e/fPT85cu9YjF/596tBw/eun//1s3ra6lREafiEWMzpyoxNy+Y1esZ9PMM0gTNbAiUgFNDiaHU2ul8fjye3Ly23klJ1cNZa4xzj3ADczeQF7TR2mFEG/zHsHZORVSgdt45R8GUbQXsU0UVzfPO3bfunkwWT58fslBR6cl4/vHnX/YG6YN37nTSjlQOm8QYVVAQY5BVBFBAyNqNzc133nn74y9eLsrqpx8//OLJi9lkNBmPiqJaW99498EH/bX1H/3so+cvXllrLw6fmvVBRTW19ODBO+++d//69lYn6z269uzg6MR76Xb6g8HAJiYEPGsEPYEMmWAi32SoxLsmej2iqOSdTqeTHx0d185961vf+j//r/9zNp3+zd/8jfMctsL2NETUexFpLSFjECISISgzL6piPJn87Gcf/fDHP66qejKbzWaL7//wR58/+uJgf98ac/PmzQ8//PDmzZvb29ubm5vr6+udTidAwzYxRBgSVpnZez+fLyaTyaNHDz/55JMf/vCHu7u7RPjhhx8kSXqZhEK73e5bb701HA5fvnw5Go1u375NRMFlIlgy42V9AbSDyjO3Ipx33n3NAn6RonDW0X410enc9vE6Xo1emOKsPKd44Sxw6YIEDVu5sRNfnvOqkz2tziBXImp1xf0YATAYNKP+gskjvv6LEZSm8zPX1bnN2c1LfzlW9dVxBRBfHf9jj2Bu6Gq3HDot6XfNQtZMk4iMMVbFo1Bbz7Y5dY3/BK4kaTZMK1ilXC1r37NRddhg06sBzYIhdnYZP9746IWxb8y1piaLvF1qGrdBWKJXEkRXrBLStlVAhVAFOE/t9e2NWVEeHB4fTUrMhAzVLEejye7RSda5nhkDDccouPqhIkLozTU0MjFbHESlTm22s7V2786t2aNnrnDTWXV4NDk8mWwPr8X8AGxFjNBKCMPJiyyXSdHAHY5NNDchvMHmNnhDKWued67tXBv2u0ejmSCM59XRaDEvOLcUCiBDltAoEoToXSJQJAUSNIgGiVFEwxAcRalweHhSDsFmWoduU6g+Pl2MpwvWGEIYeXfhD4WMIlCBRVnvH56ejKZhPB+gUo3IL4CAiNS1swlAcDMEAAQWJVY1KKziRVmEg3WyKRZVWdXeC4BRMMEbFwmJLAPtHUx++tmrkwV56gvmrI1YhrQN4TUqpMDq0kTXutRPNAVGFhFQIK/M6hUYlLz3tWcJBhFIxhhrjLWWjEEQkJgNtExolOh3qxxruLaf1Ia1DgBCpGQcmqNZuTeeHc6q0oFSktosNYlzJVcliMvTrNPtorWHxyfCztiUiIS5LEv2ooqt42nQFzNxIGOxArDWrMRS+3Kx0OmCVEE219YyGygZIc6JEkuNvXRAssN1wTPjcVhixMu/ESAprjy00AZYrvwAApzVN52J8VFk0HlRjCaTpNPPBv3+9fV0Z71zfbu3vZ2ub3UOJ+n6gIxBBYtGVFlUmviwM/JBvLwkeV00xJm43qv641/DcdmN4Jyv6xoUkiQN+SRhcBns8Zfe1MFGwFpj7WrjvdpENJK/QJBsaCPN9hT2KFFQgUhTFlEWZWFVARJVsubWjWveZJ8+20ci79yPfvKz+3e3h/3f8Rx2S0kMZalNLCGqIgqEKQkqN75/qgrhMZFgSiSgIJKndnt9OJ3PpsXReDzuZ8nO5vr17e3xvDqZ1TEEnAObud16QETJ4ObGWjdPbt3YvnmrePzy8KNHzz9/eiBSH9C8kxyjsr8+fPfuVs/aRu2BCkYJMSh4UZuVAJAMkM2T/tZWPVzr48E42AoFU/dgSq8KIjE1SRQXjk/npVrbX+v3UgU0kxqzzIpiYtP14fDmjZ1q1lGwiBaMKTxD2oO/+unprOLgJaWAIirYW69sp7exsZb1utLmfWls5rHZLBqLvbBoK+Jr0iuDLRIoi/Z6vXfuv/3g3Xvj030AZfagfkkRYgRDTvy8WEync2YlQswH2e4pGLO+ufHt//X3PnjvLnr+9LNHRx99sXc8EkpPxvNFUS99ZVEFSETrqq5LAubIjQ75gNakkCKih1iNhGwDbUoRRNOEdAYWbiTvYRxxWkWG6EMBqmLIFGUhLGmaozEiK0yf8MZEvKj3znv2zJ6ZiPKyEAFmFlVmrSp3qLAo52kvzTd73nvvvaF0GXMaOPq4hD2AUAGcc6enpwA6GKylSdLIcuNERsJ4OdiJQ5tL1RSYCKha1xUzG2PPGOPjGfb3Rdy2jQpY5gPjkjj8D1x+fhWVLoD+UswpXS10Ec9DD1eymF+f/etSj1S8+N/nwbIGej3DqEVYpradz5w6P1WFZkuLJv5xfbZkU8RkUdR7+3uPPn/27PHe6fHYEH7lg7d/87feu3Vre22QW2IQT3FdaWvFFVhoybJcddY+Y9uCCIbAEAB7FW+MOR1Pdg+Suze3u9sD4RXawkqipq5kjS6HKHGbjiJUUQ62cIYoz/I0sQBQlXVV1mFytpKDEwZPbMi+/dZdVUJMjo7n3jGZfDItnz7f7/cGd25cTwxB8DZWCN73sSZHA2CBrEkgSbPEWq98eDI5Oh6xq1Jrrl2/dfvunZs3b3kBZvXMF8vm1QuDoNbaza3NbrejCkVZzOcLZhEW78V7jhwpFA2sLkRjgl4zCi9ohf7VBsZ576uqTtP0/Q/e/6N//0df+cqHDz9/GCbPKx+mKlBDjMVg2Rei7Iwx1hpr7fHx0eeff/azn/3syy+fPH/+XAXKqlrMi6Kqet3+hx+8/+79+x+8//61a9fW19fzPA82wU3tIcED31pqb/D19Y0bN27cuHH9xo0bf/Znf/b06bPvfvd76+vrd+7cJTIrK2H8P2NMr9fv9/uLxaKqqsbtdxVsaPMpWpJvdCdpdqRznr0XF/VL/vXSpmP1Kbs08PYcHv2639pMCl/rL7ECN19CjliuGLp0wH9DsF77z6v2wSvc6l9qZ7yQv3pJYb6kUkctKuKqKP1qH7sCiK+Of9ojSZNut+uqug5W7kvsZ1WnG3gbStTQDl9TlwAsH/E2AjNQqaIr4DLLLrSOUbeoCtz8rqU3asBeVdpAGQVAMCG5SlqBYWuqqueKKoTo+NYEkUS72FawoyJMJMpAJN08ub69vrUxPB7Pva8TShjwdDZ7svcq7ya3dzYsGeVgSIiChiTwLzUYEzKqKlDwhlBHiHma33/7rRcH40U9Lkt3Mpq83Dt8963rHUpVHLQRYWdW9nhe7fK5LFTCTFhZm38LI1wRUq82seuDweb68MnugaA5nRa7R+PRpLi+2RX1RKaTdUwltQgYBKS2GyZQVBAVQRUAg4hIorasaPdwvm3XOsCqThAcupPRfDorRAHISEt1aa8YiCIA0WxRP3u5u70xOD4dV7ULzo0t69R7v1iU0+lUEgrZPWTQGnSOkzRJHVd1DZQUTsuiUgZEKopiNivmi6Kua1d7QlBSAkLheVl88vDl589OXbrF1GOwIdMsfKKi3IwwmZQVXL+XbgxsP9FEPKiKIBBq9CkNeW0YBbCRnY6JsdYYE8boAdRAFJRWEBqDBAODuPWJapTIgaTOSB6wYH1+PD4YzRceTJJnSW6NYXa+KtDXnYw2ht3Nzc1FzceHhwiQWENEs9lMWKrKe2YWiUE8IuzEK1qLAMoBlWI1ZFztK+B5qargWN7ZWU9smhCRMWiJjCFtSF/Q+nuvRqMvhU5N+RTD52NhqKvCWFhW6nBm8ntJH4sIRExYpwSb/bW37q3fvN65tW3WetDvYppBmsOskIQElQATa1VAWBsGcUPWjg8+rqxWYRSkq6DgxTT5N1hGXh2/ZkezsuKqiFtVvXNVWXnmxKaEFF1uQlSq4pJSEcX11hgTnIgoWhBoS/pTaNKdQ5ba6hEA4RBTJhgoN036mUHmAIyi6vpw4E067Kdgk7p2n3zy2Xevb9y5sZ00IKc1lKcmNUgQ9h9FxMCQjN5JCKLqmR17gIQISZTFEWI/T3c2hwfj2WhajMaTbp5vrG9ub2xVPPKq3jsNUW/GqJIyV15eHZ5kKWRW79+9ubG1ubFlB4N1UfNyb7xwPJ7Vj+VkvpiNJ6PhsJNvDQyIAqsooJBQTIoMUHYzKFNlg9rvpFvrvdxqwU5F2tA3CJirEiAokRdUr/un08Px9O61/rCbKmiakrVRtZskNktTk2eKFowBMgmaW5S+9db1z16NHHMQpRCygByP53sHx2AIyOoqR6WpbHSpyI7Be3qWULfa2AW0X1XJwGCtd/funXfeuz8d9cPiG+0TAu4soAgOZDafn47GrnY2SRbeJNkzUd3c2fr9P/y399596+Dpi59/8fR4spiVTkBPxjMAA2FuEbQ5oiKcZraTZQkSilibpDH0DpLEemVmJUALiEhhM1dSCDcfND4KMX4KIHgzRfa0Bt9lZmblPLVlWTvPaLJOmnQ7fS9KaMQ5j+i8d1XtvKuq0tXee++FjTGuyiUO8QCRWHA2GVX1ouv7O3KTDHpmapkEoUwIIp8WnRcQDBmuHDdQEyOWlvoUFQAlABQFOnNFmgQqqarKs19d9kWWkHArnIVLSIvnYLjzd8A/7k5xDv1pYLLLQQhdEUevINpnGuglFUOutrRfwynnCmx6SSLiJTcnrjIHdcVSpYnofTPVXCOtp5VrsiJggpB5b8qKnz7f//jjzx5/8Vg8rq+t3btz42u//ZV7924AOBUHzA0YjLCSCbBCq1Q4RyE6G8gWkFAKk9GEvHfMMB9Pj3IzmS1u7qzB2e5UoZ1HNvkgel7FH9anYMhMBKpe0W5ubmysrx2OZ9P5YjSaOKcAJiyQgbIUFhb21c5wrfMgM2QefvHiybNXqiJC+/uzLN0HSW9tr3eMAfWiQWdqWRnQEiWCpqjqg+PJ/tEJEJJNnRfxPjFmY2vn3lt3ut3ewcHh/uHxdDJOrDlnPXy2fI28FVUxluaL2fPnL1+82mUvqloUVVlUKh7CpLVJRmlJ2aAXMjcwzszqusrS9Ku/8dU/+vf//qu/9RtZlgXbycZ9KI4ZGnMfDFm+zMzM4W4pilKEHz9+/N//+3f+9m//NvSF7KWsyrKovGi3N/jmN7/59a997e6dO8YYEQlWwuF/4z1AQBR8+xARWuvL7e2d4XB9Pl+MRv/pRz/60f37969fvxFOcql3xAgCWGvTNJvNZswiUQwUwAfBpZ1Uu6LGu47O4vJvNNWFNzJmLwVJLyf7n1OWvBl1beMmI5B6sd79RSekutKoXTxdPYstn3sl1bN55PgrV+MXsKJmttvObmEVhb7qzq4A4qvjn/riGZvn+ZTMhYd5lecLErrZWLAKBD8pBAqWuFFn2hAxlrZW2oo2VwDiuAwEOqMihgA0hQhWQZOSoBKgPcXggKPIoSPXYHwojdWhiCrqCjDXzJRX7X5W8j3O7o8BofaeDPW72Vu3b+wenoxcZSywmllZ7x1yr5OtDXpredIkXwEAhe6mTWGDmC2OCiF/z6u4nc31Gzvb42kx8W5RVS/3D04m89vrPVAG5dDYRNgNzvUABFH+Gmu88Jk3ROrIng6duHoh0oTo2uZmlqYVw3ReHp1Opovq2vZQRbKss7mxfryYlJXHJIkIucREcxUVVUZUQAMm0GMd02hcux2bmDQYfTBoWUtZS8gXavynpL1OEs2GqKjql6/2ttY64/HEM5MxHN6RIpFxnmfT+WQ09TaEuoIxSIRExlprE2uMGU2K0uPxySh8sN7LeDzd3z8a9pNysTCYgFGbGsc0mrjPHr9acMeaNYbMKwiAokCw5A9KZwnMJzZG1gf5WpdSYmInrKKoCqhI0DqGEoJFYAyeaapkiYjCpV21T1Jo+MHa+jPFG6+95xBRABmxVpzXfLKo9kfTaSmdzrDXGyQmKWbTulxwXXTT5Ob25tbWet7t18cjY6DbyZM0JYVyUQQRPHuRULcZYxVqcVw6R2hsYhPjVdixkipHiPt0VjL7niWbJFmnG2YMEnKWiKSl08Y4YIxM/NVBcePpDdAYYDU627aQP5OLfbYq0qVjDcY4PERMk/5bN/qbgxvvvGMGPeqkYOPQAogEQUAFNTperKLX2FjQqERTk8ZfPL4LvaQPfx2NS1+nPr46fj366iBmRw2BLavp1Z69c95aGywmYgOpQqtiwLiKEFkLiCLxmVrx0G/t9VVEmRtDlMZqRhUEgt0EIIBEKwsJhqYmiue5Kubg/M3tNZt2F0V18Ork4afPfnjr59/+1m+oEihaMqmxuTU2pnIBKAUkKGQCBBy5cq5ytWASgXFVELaIm4P+zsb6fFHPFuXxaJblw063n6ZFvVgwu+ABZa0FsB69E9k9nhTlQthRkt/cxn632+v379+7d//5/qNn+7O6FlIGrn19d+9krd/tpWRAADigcbSiPlIEQhQRRCaVXmZvbK6t5bacOXYewZCxFEdUGOLiAZWVQM3xtHj68uDOVvfa8Fpk+iJICABS5EDXis0wI9leJ/2t33z/v/3kSTVfABKRQUBCN51VH33y6OD4eDpbGEuKFDqdaJgYiXLBclpXaobzXcqZjG/V1GKaJBj9fjH4NIWChAhBCUQRNCFK8yzr5kBkkmSyN9o/OBqNx2+/+3bW6wjZ7/3wR9/57g+PxlMhO54WgEaBKGw8kVwroDwcDLfW19MkVV8kSQoWaxYv3hoIWXi02uMREEWFloqGW0QCcELRFhBUQDhIcRS0LCvnfDLMiJLEWkMG0XY7tmaHIovZjKzx3pdF5Vzt2XOQ3hBaa0lVNFLCDSoSgkH2FUC31++vrQ+NxdVYVBWB1vI77j5oLKVJcuvmTTAxMLlBfhvbbxFjiCJ+QHGzBVBRBDQEBMAiIcsu/tAlTfOq/vcsInzWD1EvSOAvEcKfpUBe6ilx2e/CNyHHehaVxtd2y+cwYlix17w6fm2nnhfuq18AozTu3+dU9fiLEJ6zND5EtMZ2ihL390ePn7z46KPPj45OrYG379348MH9d9++s7nRs1CKOBUGJQw6xfjjAuctj3ElHiI2hiG6K0SKxeGQcGLNxvqQCMty4ZlFwPHKq2EIgREMTsQhgjwWigJKDWMgOMHHFTGxRIQKzL7e3Nh46627e6P56en4xbNXp++/vbneja8ZJp0huBlVpepl5v5bt4jo6OSwKIo07VQVvXh5Oh0X/sN33n/7RtMGGBZQBbJGyBSVe/T0+c8+efzZw6eVFwZgZgTtdntv37un6n/0ox8dnUydQJbZXqczXRRwWWBay4Ji9uPRqYIcHx8+fvJ0NCsSIlGsq7qsas9eQ+wughIyi3dOJOa1nL/qCiHzLU3T9z/44E/+P3/y7oP3gnOjMaZ1Hz57GuEDNoTUjB9xMp0/e/Lk8ZMvvnz85aMvHpV1laU5IgmwKACRik4m05/85KeJsWmSbG1tJUmyekcGtjISIJ0HTxGxqqo8zz/88MPd3d3/+B//45MnT77+9a9nWXZ2yT3zULRBcOeOi++ozXA790+XLdQr6DGed+5uB5EXfuDyPuOfMwB64XT1f/yvuDquAOKr45/ZQUTGWCUSiK5Mq0wTXGE6RN2lIVGgKHOPY0pQWXJhFRQEwcSYA5HYCEfsN2b+iAIYDE1KNDISITQiPryINMF10vqwYSQyB2A65KIpIqAys00MILVWsAH1bRXBCICEoqKoaExwJ0YgMgYASZVFCKBrzXt3bxZF+aOHTypmBnVE49I/3j24fvNGt7ONBsNgFI2RpkonxIBph7ca3eAVUKVr9YO3b45Gp7NiOq/rF8eTL57vb6+9Z5UIAk1YRZTINErQYKAR81m1GRgCNQB4zNNGDV8URABgEeeI8Pat63mW10XN3i2KalLUThMD2unQztbmq6P5pJijJiIQMseNtjlORIRKYeyOCoZF54vSAyuZGIYEyoJeQIAADTaKLQBWIA3OvwEtASmqal4UomrIGDQsoiCIBER1iNxZFGBRFYwJemBVVUIgQ0CU5PPCweHhCQFaQjEwmYyfPnuuUtZFZSBBEjT2eFq9OilenJpk/W7pU68GNDTD4MRh8AhWUAEvCqAdI5n1bj6ZVb6UChEYUAhtYopZUU8rm2ZuXnNZ+rIGAfHM4tGYJMtQOfbb0GZCI4RHQdsSYGk4FajvIihkK6XjWXU8K07mxazySdYZrq9ZY+vKOXXMrpuld3a2r20NszwVYGtwsDZY1KKKrOJrp+IIkVh6STbodnvdHqK+3NudFaUKJild39rudjuT8eT4+MSBqpITLB2o+Md7Y5P38z5kRkCUGBANAUgopAlAIXg4wBm5VqyocUmzC3hXtHNZWko23TxhiMuKIQOKAGDibRyD8UgRIZPBnTuDTp70e2pQlYNFZkCPvYgTdtqKCKNUn8LwAahN9IX2lM8396uhRG9a+vRXCeq9Ov6FNdKhe4yPpLRu4VVVlWVFMfMQmIVFYrTcSpBzoGlYY9I0IzROahbFRugSGk4OundRFhHm1dtpqVaBZmXQxmg3hn0RAbD4cjZGNV+5c3NSVEVGfmpPj/Z/+P2fXt8Zcl0FRUNKmBmygT4cMu/iuaISgUFhqJ2raodAQMEPELwwIOaJvbm1eTpejOfFaFba0ymRcd559iIsLEKUUJqkGdTO1fXc1fXEuccHpWY3t8fX1tcGvT6RvX3z9u7xdFROxKmgKvD3P34qyh++fWu7lxoEVaZ26IIYlhfVKKrxru4m5v6tncc3tydf7pd1icYQGSAECR9GAL0VyKims9o/fnV0a2vwzs3tTjdFYwSBFZxALcpxahyGwWJQOok+ePvWza1u5crKC5JBDcmb+vLl3uHhMVljTBeANHymIT4w8sVNKAhW6N+EZ8LrVlifCiCa551+f5CmqXK4nEtKkgbFg5KiYhwx2DmUhvDg+HR393gyXnRzm1p6+dnn//3/+c6LvQMwWbFYlBUrGgq2wcGISphQ19e6W+uDtX4XVVVAQIKtUfRZFiGwCAFckcbQNipmlzN5JCTUcFkQQaGuShVOksQaK8zeOQTs9/rBikiYVSUhFFdPTo/DDM45F7NBg+mYArBXJtMsuBR3FDaWhsPe9Tu3Nm7eMEE5HLYJCXGN0IA5cXooImRMZhNFZJWqrIylxJqwlIuIsCTWIiy1VYE5KCpIYcAMZAyG1N049FZcmQyFC9RYNF0Ec1e+gq+dNZ4b5F/8ntf1/6tBHZcjw6rLWewFUPuyBpuay7syw7jcNPPq+BcPCp+DsZa5u5fjLCu3NC4NAtr5l15GIcRV796Qwxlt1hKF5OBg9PGnz5482d3dPa4W5c7Oxm/+xnvvvXt7e2uQWkEohBlUCAjQgJJqY4a0fLZQG6rAKkYcLGIJAIxpCjMREUIBIWMoMUYVHGvluKq8rKLYrUIUoY1FWf42bd94y2wQQ8GWiQFNktLXvvabo3n5wx/+5GefPOmn5g9+/+s71zdAfIznUiWAjJBVBHV7vdvrv00Gfvqzh3v7p2SYiA7K2aefP+51aWezlySZqkUiQnHe7+3tffrw8fd+/Pne0WRRq2DCoOxrS1BW1ecPHy5ms8lk3h8M3rr31r3791/s7v/4Jz8tq+o1VgMQFsP9g8OnT58/+eLp48fPQcAmhhANGUvBilCbErkpadoe7wLw570noq9//Rt//Md//P6D9xVBRMiiNdZaC+dBVRLV+WIRJnHe84sXL/7iL/7y449/fnx0NB6PT05PptMxICDU3guzcvAJJFNV1V/81V/+5Ec/+tEPv/a73/72t771ra2treA1HF+fsOE+wyrOG0jEdV0Ph8MHDx4MBoOjo6P5fL65uWmMaX8cQIkMM5+cnBwfH29sbHQ6HWNMmEAEOtqlEPCKghIu9W+59CrghQYD8fKeAxFeG8ryzxgkPT+c+EeFic+990u7sCsE+Qogvjr+6deBprsJxSWq6mvFFZbQUKPokdVFcineW3GnDWimCd4IGEAeisEjgmBUMZo/UnQjDCHgEMLTwu7cZMqHyh6bVxUCACSNmyCf8cGF1SS8aMWzUtOzAopS08o3OkxVQ2bYz9++c+Ph85fVtKgZTSd3IifTcu94vD4Y5JYsorFB68kCYiCecatQbpQgCKgWeXvYubbZf3FgZ5XzoLtHJ4u67iWISMDB5SDmfi2jAGJTQCuezc3odlnC4dI5UUXFE5rN9UGv25lXnhHnRXlwNJrdqTe7iSikFhE8cE0oimCQfCCCR54SkYk7GTY8Tcfeo/cYqXAaOd4RWFSgRtSviihoFACD5W80ARGA4IIVBwchsj7EtTXvhsKsO/RuEtTSQlK5yoFzPoiakMCxXxTVZLJwZaVKFokBnx1MnhwtdP0dwaRWZQUECqMJp+GFBEJgTcBDlbUuZ6elQGm0JmMEUADJYLEoqsInSbaYFycno6ry4Wq6shLVLM85ZKYJBx9lAeAAnrY+pBoeIIzMQVBWZQVFrIVO5/XRZDGrGU2aZbkhdK5alIXztShvb2xtrq91slRAKse192QtOi9ehD2wNyCdLBmkne3h+qDb73Y6jt1kcrgovVdAlEE3v7Gzea3f6VvYPTgqnAchrxYETxb1/ni+vc1kkFBQQQ1pk9/ReI2sOIQvHavapUAB5KJGqOlO4yAj+G9Ekj2CIiEZQKNgMXADyIAoJkJdToYDNaTCMdKrKQlUlVWciiBaaxFQhaOc/nLXYTxDtQrsD6QYqPHaDupKwfRr2Uuv2PbErQlVYmKVMaTaxNEYikrD5SLbJkEvrapDUlyYwZlA/sVoUhRdhbUxpldY9f+MfBYMvt8Y1I3NTIJVgpqSrCgLJ6CbvcySLhIj24O6qrievXj2vJtn1pJ3NYKkqSVspjVn1PUQSMS159pz8IFCiPJQAUHlQZbsrA2c54Xzo9mUjC298wHaDDMj1gQwTRJQEXVedVbKk92Tk0nxsnfay1JDdHg8XtQ1WSNANeOs1ucH4zw1vW4/ubk5SK0lBOW4k8dJcHBGAgUEFkt2Z2Pw4Tt3Hu+NFnMn3qtNKWw3zeqDoAQoaATM4WnxfG80mrvecA2wEsVmuTEASbAtCmUIqhLwzsbgNz+8P57Xe6dTAGm1Bc6Lqk/RIoVkG1EQaULxAJCAVgII9dKMIGwyvgFEmbNO1u/1kyTR4NTbCjfDdqlLqVFz3YWQ2HNZekN2OOwXxeLP/+IvXrzcLWtfOl4UNTewNLT+WUDC9VpvOOx3O1nG9QIBA089yJVEERQNooqosoIEVVd4P9KEw7AKERoKI3nvXZmkqSA47xEoQdtNO5YMYLTxIRVV9apERtSr5zBiDwOAME0BAmFWwlhgNQ7OhBGhSIxJU2OToDKDxiSsCSSkpTglGOsb08i+mJ2rPaOlTlR6R9fl89kVMRBKRASE1deVcy5JEkMGG/IknqEHv84bDS/ByV7DH2+/cpFZ/EvsKXo2deqXXtZAf+H+pa1k+ur49cGGl2rI1ZsQ46R8mbCyciPjuVtDIagIoOkimrgY1RAbF5LK4jSTjBCwoIIlyhVxNq32D/e/fPzi0RfPZ7OFJXz73evvvXfv/v27a4NOYhWVG0cx09ywohcersaff+WEA+jYkD2bN42BjBSJFgZZ1Xn2XhcLd3o6894nKHHxDqa/kUMTI2LxDDrc+lqE1FLR+FEwkFNYXN/J3723/fBR7/Bk/MPPnvc3Nv6XXnd90ENi9rWKD9NWVDGKir5j6MG92xbNx58+frl/Ml24PEuOZ4uPv3x5u9i5cW2n3+1WlTsdnT5/9erZi90vn716eTBa1MJgBBgAjLVEWNV8Mp6psAd0qrOi2N0/ODk5FVhlZV1AHBG86P7h+Dvf/ej48Hg8r9IsTdJEmTNr8iQ1xiIaRKOASJTaNM1ysgbxPFTZZmAmSbK+vr6xvm6NqZ0LVbslSo21GNLesV1WDEFiyTtvDU2m45999POXr17O5/OqKueLebFYVI4xMGPikI4h4gp688YNA/DTn/1s72D/6Ojo29/+9ltvvWWtbbXFS2Pas0tu8FBGxE6nk+d5URTBX/iiQ7f3/vj4+OTk5K233goAceCkX4r/Xrp0r3KNf4mB33k1CVwWvfjmUNM3Q7RtEJSecYbBvwdae0k63y+aS10CjTdD1H9EGDrMAK7W+yuA+Or453VIDEMXiO71r4/JwCDVpbOreKgzEOmM2ELj6JKWxBHAmhVUQ/A2gxpEJQEjcS5JgHFz1+DsqLHJQ1ESZW2iE1DVNK19oDRGhmsLB79mxYs9iioKq5hYS6soUPRjBUlSu7U+2FjrTxZlVbGwoLGVc7uHp4NO3u8k3cT2OxkkJpgmhsqrsVuNvr4Y7ZoAVXqd5Pr2er+bzyoHiCejyWi2yNa7lrCNfxERIlLF6NYMENnQ0aUnKGuD0cay5msXcgy4Kkq/1722vXM6Lhy4sqwOjk/Gk/l2f5tIrUECUWUEJTIIhijwjZbbAcUZfGB0syizCLdWw9C4SgNA6Egl0n4VIYb2AYXspGAogoDhjqFmOxPVkHVoTGhXsXEmEYi6WtGYSwbSFJkCwAAs4D17L6KKhkIQ38nMbVzr1QJOBEGJgMiAKiGxNMmHUQ2uFlTrupw71QKlRkJpiGTT8XR0PCGyVV2XRSmRIg/CKiJZli8CQMwcjMlimhVCS6Nvmz9BCklH3otTUMZ5zeN5NVt4R5TlPZtmZV1XZVkWpbBLDG5vrHU6uaKWtZ+U1aysOWLMTKLdxPY73fVBZ6vf3ez38yxNkqx0ZmvQPRmdshfxnsT3E+p11/ok5KpXx+NF7TyiGCvKR6PZeF5kaS+3qO34prXDAF1Gz8ESfoodiLZOE6uWwhh0AystBzamG8FrGJEsmhTQIloEC0jBc9zkkABgnitLuCHCRW7TUxp8C9PEImiAYIgohnM1bcVKzRLBuRUKd7CekVWN2RUi/K9j3tnGcsWviLZ29agCde3qqtZmbBju7Uj4bZ/khoZJxlibAGHgPQYCe4MhLZOmW3ljM26JUdIAEIA5iWocMib4LSohaei8VADUJEiQZonmtOHqiowZn55wt5NYUlBhn1gC0qAVDTc/UkMRUgRFL+pZQmeoDWkfVVUkJ3NtbVDWzk3mi3IBxjr1gNDJMpuZRclV6SzZJKE0QQDDDI7hdFLOF+7oZEogKlI7XzqPxiIgi1YOJszP98bDwYEhe3d7bZAZqyrKzXpAZ7QIKGR8J7Vv3bq2vdY7mJ6KqyVJkdIGZIwbT8y+pXReFruHs93j+cb2lmMRAVBgAee18gJeVZlAySAYD+Bzm7/31q2PP392eDpW5Sa+L7DYTPRoUlnucsFkU1VBGlnC+bTui/blwbI3TZJOp2OIvHMqChh9plq5U3BFFxFUMBR87tF78V673f7W5vbx4dHffee709nCsZalq1044dj5NQMztAjDXqebJZaAw7yzmYw3OfREql5ElMN4rg2jU6Dg5OXFRZIuoLDURUHWoE2QQSkRTBNrErKC2A4hUIUaK1NsQt4JW7xVRaQxZG7EXWea60Z3EsRgjbsXBgp8e45t6mMo3yRi24bieCE6d6tiqDwRl0GobYyURl6yd857b41FopaheBFEOJ/oha0QZZlP2QasX+od+Uu2vq/7zuDrAhdijl4X377qon4WmL7EZ+Bqk/t1wofbIIfzVrBIeJmmfZnXtsRxVmq3pnkLnBTSWHcFWT9H32ESNEBWlWYFT8bT58/3nz57sbu3V9b1xnDtzq1rH757/eb17UG/gwiRBbGaYxXsmaCNHQFcDjnOhCiG6eA5owCM/xLUJGATiwZZVBRrJ/N5ycxZoqIKEnz6UWIDEhY9XQ544/LSxNMFPStFFwpAjyrdBO/eGt66sXF0Onl6MP7BR1/0e537b91aH/TyLAWisKOFQGpkh0gbvSx9505i7aL+2e7BUekSpkH98rjUtNZs2K1Pj0+fv9p9/Pzl8en4eDybV8xIYKw1CagEzwonyiyGjJCZl/XLvcOD41FRVd7zhajoMzGbgDSdlR9/9tTVLrX5+vpQXIW+6mZZr5NbkwSHJVYksouynM8XzBxd3VfupRbgJEPGmDC9JgVDaBQtkiUT898RWwcmREkTQrBkcVEu9vb3xuNRmqbGUAhyCXoshWXjiIisbK353d/91sba8JNPPnn69Omf/dmfjcfjP/qjP7p//74xpomhxlXQMKx1jSUxImI4T2aOeuQVFWAYxC4WixcvXiwWi+3t7X6/Hww0VpHf16G65xbYc5YUb94IziC5b6Ie4xv++mYcWZuZUMMO+5XX+XOCg1+dn3s+lu9X++HLfuINH+9Vs3YFEF8d/wwAYmHvfAgAaar2M8/yylgMENEQnXESb1e0ZeZAlDAFMq8CetWadVbU03kprBYNGhSUbi/LM2vJUMgQA0UkEQyueSF8BxFC2E2wRAANoXAIiCwxSAF0VRmqLQ3o3AywcaMnVa8tYRFhpTlRUBWPiaWb17fmVe2Px2VZd7spYHpwNAXP/Y7td9KtjbVhv5sb080TQyu5rtBgxO1nhGCJdrY2N4f90+mcCWbzxe7+8Vo3TXKDsatqE8IFVgjPgKvAtoR+rxWLadOOqWc0UWybp+m7b7319NluWZfO+9PT8eHJ6Ts3dxA1TchaCjg+Br1/SLEBBFBmUUEIJKOGVcccpNMBwUYFlcDVQcLoG7IsYGPoTNiHIrTMRGRNoOoF09sY8ETBTBCkCZjQgHk0eeIBFQwYMwoQK7JSsKhCVUICk55MJwuHlK2hzesqhLepiVfVEBoBgyitqSSCpoZIWdmLCHCAoFURxKtIMTqdBDON4NfYmCggqNokafByMZFqfyGUDYMCGFhi9F7FXAnVNZ/MylnhvFJi87TTF+H5fF5XlXqXGdwY9HrdDiDOajeZVyfT+bRy3oM4NiK5oRsba9c3B5v9zlpuE2REDyCEutXvPTNJVVe+qqvplBf9te1hf7Of6g1XVbujWcEegER0PJkfnowGeZqvdRBFRIwxbRusqjHxME44dOWtYai7V8pKjAlxDSaO1AQ/NtURESkRGIsmAUyBLEISDYNJLZpukpA1qk7Rxx6m8QElIkNkCMFgYgw1AHEUHwT+WkwRimCctgsBtIB38IQVWlGWXR3/inBixDOhLIjU4KWurquy8o7bfDlYkucVVoxAFRWRbLCabXJ7Vi36wyxTpB2cnXG7W+Xjr/QbFHxrw35BEZZUIqQ8TVj7mVHpCYAql4tZhUoGvfNhfMvCYAzGJwWlcVhhhTBUgyhkidsPqqJIArjRzYu1fuHd3mQRWrjU2usbW+vd/qvdw5eHxzWKSpJl2M1M7bAo1Tlhhjk752vvvSE0SUom4uMs4CkZFfrxl3ssoIp3tgYZKXpPABiEQ4AtjEXIxnjEZNDp3Nha/2L3ZOFKX1sgA2TAEGnj4BEMHDFl4MOJe/TscLgxXJS1ihiEuq7H0/nxaEzlXLxHYDKNNbntdxLqZWQN1Cpt/isCAdKSLY4hXRZ0FdFoopwQW2hRYKl5WjGiVRVRay0hFvPFGLl2ixCloMBBSBICPRVUUJxw7SrxXCzq+aKoHHe7g35v8Pmnn7/a3RfMnJOqqlXBBM0QtHxmBdVemgy7eYKivl65x9poRaKIenPYuzTYXIkCGUEjiAzgFeuyzIztZ2mwplAltB1juo7RKxoPopQpJagWFIFB2ZARFQAia8Pouh3CiLIoNpqjFuwNtmChBBBhr8LNxFGi6Ck6kmHzbKzG3EoQiFtjulkeroaI986rBJgg5AEvAeslPXCFsr2E1torDudgs1/ckL8Bs/uFHeybxbMNd/h8bE8j/r8MvA76tEssLJbsyIt05qvj1wIkXl735naF5cJ2ZiiAryXFnBG/IzTyvah5VFBCQAJSVlEBIRIwZemfPXv1xaOnjx4+m89nWWbfefv2u+/ee/edOze3OirOe4dIhMh69vHCC6j1hWfvIjbUJodrkJRGnyjJMpt1Umk07s5xiNSGFQVrC3cucx31PM4esyvC4E6j0yGqsJvvbHYf3L91cDx+uTf64slLVy7ef+fOBw/eefedu2vdXLkyoMGwLjgMiq8Hnfwr779zOpudjsfPdw8rL72eJJ2F8/tcLl6+eLF/dDIvKqVETWZTAoU073S7PefqxXzGzESkSI5FAMqyms4LQCBEa4006OeZpamZupFBBZjOF1mWb1+/dn1z42D3BQIO+t1et0tkVAGJVHA+X/z8408//uST2WxmjIkEiwsuE9r0chTycDS4uhtjzFmP3ea7QaOpkKq1JsuzPM83Nzfn83ld1957Y+2yJYxhoZzY7Hd+53e+/jtf+91vfeu//tf/+ld/9Vd/+qd/aoxZX1/f3t621gQzCkC9aAHRnkNVVXVdW2uTJGmB4wD9B7Lw0dHR48ePrbV3797t9Xq/cEm8aEYc/Cgu3Rp+QYjc2drvF24rr3EROWNkdGZrwHPfoH+fqnhlxPj3KKv/ZxbwV9vZFUB8dfzT1x8Q5YqgzI1H8PmKFtvFK1IzztYDAYdbmvlgEI4roCAtvE7mxZNnu6ezWVX64FfMINubw+vXhhvdbj/PcmNBUMSFMDYWRgUK4iciFAENjCgNETMIKE1I+kqroG23sbKMrpIHkRB5xX2rUa4HA0IQVFUxRO+8dYvS1KS7j57u115MmtQMu8eTlCS1+HzvaDjoXd9cv3tti3qZNaHQolX2dYzdE0XSQa9zY2frZDI7PJ1WpI8eP722uZbbQQYGgIMJQysPDHNe0RWFf+xWNWQtNG/5zExelUFcQtmdGzubw96iLirH49n8xe7ebz14JyHKs7STZ4lNODpFSFQBhSaPKLwqiyoIKTBr7blyXpIg5gVRcM5Lq2E8o8VtSeXaJP+JiNg0SZPEGlM6HyNpFNizq71nUQNLVXfjkCagLUudQzcfGl0wqkFFJkS2dLI/qbwdDDeue02YI2FBQEkAAa1JAETERdhR1IJ2U5OgU88KggqIBCDiw21PJpApQhwdN5xyVUIigyLIgQmPjZc2UcxubGbeCsQqpXNowOapoEzLalzVJ9PSAWadbpJ1WKGoqkVViatSgO2NjVvXdzzooixPp4vxopyVdeW8smJV9VN7bdh999b2IDOdBDOojXoWZgBfg68rFQSwIAi+AlcknIr4mxvd4u41kyZfHk0rYZMklZdXe8dr3TzvJP0sUeHYtmtAlYSgifEFfV0x0M7HG5PlQBWBFYtLg2QUAAwhGTAWjEW0YFLQpN36DSUkCRILcgykD+2KCggHlboBUAVrDGq8EEGsjxHpo9hJ6HIlUmzTBlEBmIWIkjSNkUcr/fO5CuyqBvn1Q4fPVrVtPLKqKnv27BUgWOy1TPlIfGl1qQgCYIhskhiyQeigLeKpQa+6HO+tPCIrtJvGvWLJc2ktB0La69JRG4mQgiuOAUDk6DerAqDqERUJQhCoQQSFMLsDMkiISholFw2mqY3oR0TZG6T1flbyYF66ceVUwSZ09/rWu3durWVYl5PTRenBGUiyPE0oKaUS4GZ9ACQCsgIonrU5h5oB0PiJoxcnitZ56KeUG02NMaSEHEa/SAgCiGKMNaSqdOfmtc0nu26y8HUJZE2WYyTEEWrozxDRkM3nZf3w2eFgrTtY6wJikuBiMdvd33u2lmVSclV774BCBAAyJKPjeUKQp7YsXcixDF75RMFmOkRgIgV2bUP6jYYM8dKKiIAyGSBFanjQSwNiRDKkIicnJw8fPsozYl8hGQhCn+iJAChAhrx6VhZVx1qIefH81aKYJ2n+/Pnul48eoknLkudF5R0TgDKTsSH7NYyy1ft+Lx10UqssToKIBwUIAZrEQ0VFlfBeNfhAIHogBVuDKep6VhTOu9l4tL22ZijJ0ywdGCZbMhYOZqUrS8/eWauDzAw6Zi1P+0mKwERowDgFx4SERFaFSYNcyZxhuIWbmKLMIwztRUU0enYHn+m4ZLOoCSkVcSsxqKKKYBqne0AFEV5MJ8V07us65NrBagZb428dCAvh7jEmsWQJqrBNEGKTF7nc1fACbhsY/arnG+lVhsT5TlUbM9VABn5j8P0bfCp+eTw6cNJb3kAbubwcZjXz3Kv1/9enOdN2frJ6ZwYKyurDcA6NPUcpboI4Gu1LTHJrvIAAyCsqECMIAQMtFry7e/Dy5e6Xj748PR4TJm/f3Xn33bfef/D2cK2fJuhcTQhERlU5BqDhr7Q7n8n8bCZPzSwfo5UdIiLYzKSZFfGeXV2Xi2LqvGhGgBKcD4JsInamS4h4+esi51QkMJwIiBRRmoZFpWuT3/7q21ma/O33Pnr56vjJq5ODk/Hz/cO949Nv/s5vXFvvgzJwHZSaAGIInS/Jdj9470FRwWzxg+OTqU3681m1mJWj8cnR0UlZ1yLYzTv9fn+IVFW1sQkRFaWWBQbjXAkkBqI0TQIr1lqLxrD3bWjP6taDiGhAVchYUrh2fevWreviyqparHWS4cag080BENS4mvcOj37445/++V/+t5e7u957IhPm3JciANHfATFG3FDUC7cm0qufp4gw+7AEZVl2+/btb33rW/fu3fvzP//zV69eiUiC2Jr/tlTfAOBaY37nd35ne3v79u3b/+k//ae//Mu/HAwGv//7v3/v3tvBP5kIzwV1trDm0dHRJ598MhqNPvjg/bW1gTEU+z4ARErT9OTk5LPPPtvb27t569aDBw96vd6bjQsuoMMXxnhvjBi9yMa9yDt+Q136utnhRTx3WcbGZhOX3fYbsdzLKbr6PwDp/YcZBus/8utdHVcA8dXxj3EYojRNEmvrGJm9tClaicwISiEkJEsmyH9WeCOgK8O3GFKtKogs6FhG8/rV0enjvaNZUZVl7R0HDPJgPN07Pb61tXljc+Pm5kaepuKFGSiwlEWb8FsDATQUQQBSpBVtfLsURoptVMPEzqOpoc8sRRisUYFW/H61oYoisyDC1nCgZCovz/dOa8+apKlJnOPKe6okKWVSsheTJ3mCpjvIiVBBLmy7qKrofZ6mN3Y2D47H+4cnnCSHx+PRdL417KfWAHDckoNgGJYENgE10iCQkUfQqD6xqR0l5PWpsIBCksigl17b2Tgcj4uqms6rF7sH0/liY9BPEptlSZIaFwLBVE1DQgiM3sBThsYeAAWd9/NFud5NQsKsshSuFojWxRqtiYPeFZfJFy2nW9QakybWWqPqRDjMQdlzVdfec4hGjHmEjfQMmzcrgRaFKAosKEKiBAKkgEiTaTmpULvdPB06bwAMGUDTpiSGwDSj6gNVhxAywk5CFoSEwzsNMIEXCalADe0QuYlTbKF4CFMJoEgv1lC+xqtAbZCOqBDWooCiApXg8Xw+WtSLmpOsl6Q5kZlP54Wral+juiRLN9bXOt18NB5PF9XpvCpYnFfnvNZVF3mtk2+vdda7SQqefA3AYAK3W8pKJtOZY1UMD4imFhLwTmpj4Nb2kIkOFvV8UqZJ6kSPTicHp/21tX4v7yCqiCC17EqytOIwo0vLq6YZXtIx2yBLiElbJNE/GxEJjTHWAAWiFwCSUvCXsCuuFtE5EhQjagANLwxUWSRU84REtMyyb9vgpjFeKaeapLtocoeq6r0HRGttKFV/cQd+dfxadthwjuUfolrIEFljI98SAQmUBYKLQTDTDvcbtSY5ZMgigkhkHzVpYNDepavlLiE1tytIQ8+JKabBSCWoYhqgJwR1kSqZdjML3bwqoEVME9NJ00KYQTRYz2oY8wSfChVm9gwIaEjrSCKOOgxgAOmlydagO1rUCzfh2lurmZGNQfqV9247X/700yejRaXMxiZkaPlIoVIAFVTYCZAhIlAUJFStPTDh4aTGV6fO60Y32V4f9Dp5nppOYnILCEQq0ZRSRYiVcGd78+bOxryqR2UFnIGkwbm9tdYlJAgGuJIcTqrHL4/v2ZRMQmSKshpNZpPpfJgqO1/VPgDAUbhD2O1kWZrowimFUSgDqYABik5DhE1qISAoBgFEJMOGcCTCtrPVaJoBgbUbVM2hc5vNZ692dxOrwjUAijBBMBEmYSEBsuTVszAoQJoez/2z5y/qesHgv3z8LEuMgp3MRtPZgkUNGWYRjfcVKhAoiGZEGQKw9+JVUBqheQwBxHaQiYA2CLO9oFP0ihPvTufzk/FU2PuiSo3v9xDTBI2p0ezPi9NxMZ3XReFdXZPRlNxmv3NnZ+vetc3MBN9fKD3PvFMFi5jbJCGgEDkKCBACT0OungmobJyyEACwiAdgCPotVAAGEERBpFXJVUCJgEVBBUFFvPd1VT5/9pyZuUGHm4EMNmLnti2PRYs1MSWVoFWoA5BZ1mb6us78TZvCeTR55bRb8dwbGtpfstdtnS7edCYXzvX8i1811r92EDGuDLZbx4nLcJWLf8VmZqmIq6alAehUVQJAJatoPCArKOF4Ov/ks6efffLF8dGJuHqt3/ng/fsfPHj72rWNTkYIHkDZS+tO9/dQaF0U76+GQIbyP9rbEJIgElKCaMCxW5SFY2FIEGIDEXs9klbZh5c9R+FXGDIGkDQoSGIZj8C3tobrg36/k/7//st/3zuazpw8erZ7PJoWVfUH3/769rBvkVS8JQjrEwCq8NbGxocffDiZ++//+OepzcuCF2VxOi0nlZYVq2h/s9MbDGvnKucRYT6bzOeLqqoCTTWcWEuGFWZrDSDxyoO/+vFq4+2j6AFB1E/m42o6EfV5dzAY9tMsNSZh1ufPn/+nP/0vP/r4s8l0libWWFOUlQkijMvhucDrIGmx4QAQX3b5iEiERCRN0w8//PBP/uRPvvGNb7x69SowiJMksdZaa0P8XQvRBmWsqAjzjevX//iP/zhJkv/wH/7Df/7P/7nb7W5ubg4GA2ODnb6sRnoy+zTNnHOff/7Zd77zt6PRaZZlaZqqKrMPo2VjyFrz8uXLn//85wD627/9W3fu3E7T1Ht+HYx6YaWMgaaIyz+tOcnllJl4J69a771pSPdLLM2XvNpqm9NKdqDFiN8IEJ/5lbh0Rbx8E/wFkO3ZX6cX3tqvuPOcxeNXxAd6tZVdAcRXxz+Pg4yxacg+DbSp1mjiDEbUbgxkCEmR4yAr7uUaUqODJUAkvDKwYFIxHI7Gz/cO57UvnK+c955DnltZVNOqGE0W+8ej8Y3i5vWdzbUeorKUFKsiQCSVIO0RbGwVFCnKUEPADC69upriQKGNjluevGmc8ClO4drSYQl1R+aYQciTpJvl1ppFxSjimEURMUNDbJNK8WBc9/JFakw3M73MRuJQgBgiaBVdmJIk2Rj0Nof9xJDzUhs6PJ1ubwy7G130wYlXwmwbAQQ4tFMgoBhFpOHFpV07BYVUpV1NGytF9r08uX1958nLvfF87lhOTqfHo0k3yzudztqgl2eTyYLJBpEQCQUSgbSgLgRDYyIgYObJbH5zs0/GAKgTmc4XjdOrEig1xaaedW6UZi+xhlJrEhOSdSjwgZmlrr2IAJjW/Q9a21BlAEGJfksa+VSEaAgIRFDFkDmcTLztge2Xmjq2S4SRIvaLKkFZHIAJA5oayA12CCwCAZ0ZacCSHyutWrzZoL2oF2lvq+CToNF0MnxwIACLolREk6YmzRzSzPmj0eRkMq8E1CQmtYC6KOdFOWcVQux2uxtrvSRLTifTo9Ppopa5AyfqmY2IBb6+Obi1tbY9zFErBgbgoiqSzDKBB3IAHknICiuQJIm11ggFP22fJXZrkF9f78/KuqpdYkwlPJmVs0UJ2wTN7AcBKfJxG+/roI0+O4debt2R5n6OfkWIBk2MPFYQUFWy4TEPsA2cMW+NpXzDVTCNFXf4UCW4jVoCEWbm4FmB1ERotpli2FIflreRCAQuIDODaihzz4tzl96XV+jwr2tjveSGn+u1VFVYvGNXu9gAaHQiF1gBnhrcp9ExBu8dhEgZJDSKYfMLRhO4koXSuBeFmdFSPBsUK0TNjA1QRAWkcVghAmqy7yDmsZMhyiwNsnyQ2NnCefBhBBvI/DbsNaghEQYBrDFCFOZxAAAUtSzWYi/P1rvdg5NZ6VUNLxbzophtbnS/+uB25d3HX7wsnCQ26/YHNs2L+aKuKhGPiKaxcmZmViAkjT6RqgILpweTyvuTfkrPD8ZZmqTW7qz33rq+uTPsADCAB0UBCtDEoNt55+7N08liMj8SVxmbGTIcIXOEqC1hAFSkaemfH4zXd67117c7/YkXX3txHIB6Y4yKRqsNFkht0u91O1mGukBdWkI3CWnaeog0llMYA5pUut1elmUnJydlWYbOk5kb9mgTxIvAIl68IpgkSdI0IRFCDfRfVAo2Vqgq6l3NGiFUZjo5me0enJS+7nU6lVNr7aJw4/G8qkWBWBUNNZm0CqoWNEvMza1NZM9cIzNEHjdRY9YepnWBQYeAzrNjEZsvvJ4u5ofzYlZVReVBRCoYO11XayH17PfH45cnJ0XhDJvM5IP+mlN3PBuND6azUtIkv725YSweTkcns/nJrBSWBCEluHN9Z72Xg3LAOGwYEzaSblyy3iCOuZc1QvCXDskNcboKSNAEvLJndp6Vw5NSleWLZ8+yLMs7HZskYcsIWZAx8xEJVk0kEckSEpAaaw0RqgigAVxdDKJTsp5jDVwGBOtZ5uaS+ahLbbteiLx4856iCm0W8Ur23Hk582uNLPBSXtvlZsRXx7/840ww75mJOK74ZV8GD53NOWuShNu8q6bmFUUFQpMp4mw2/+LJlw+/ePr0yb6r3KDffe/Dd995+879t2/lKVli1Dr+4JJc8Fo1/TkC7BvgnnZfXpmvxv0RUI0xaZYGa0MBcKK1VwGjKgbRhDBOUAQMmRMA1ARUQOM/oMzcnG1rfy4QAHIIJv9Fx9qvvHf7aPSbf/3dT08nEwc6Wiy+95OPFovi21//jbdvX+skuecCAZWIyIJJjifTw8Njz7K9tV3VfDo6PZ1MR4s5a0xfPjw+XRRVmlpEQEOdPJ/P5giY5zkiVlXFzN57Y4y1VojCDnvOzfaM7g3VWBAVIDw+OZrPJrmlNEu2r21dv3G90+08fPjo80dPfvCDHz3eO9jYGP5f/98/cd5/9/vff/HylaqcmUKpXgD1lkIrMmQTe8ZeaVnwY57nRNTtdu/evfvhhx92u93xeHxycuKcC/W29z68kRbgNoaSJKXgjsTc7Xb/8A//8KOPPvrrv/7r7373uzdv3vjf/t2/8z4QiVpPFQEAa22aJl988exv//Zvv/zyS2vtxsaGtXZFtqVpmo5Go5///OdffPHo/v37/9u//bcBQUZcvTlfS+BtV/eV/74cSFe9CPjiBfdhPYuhngsdfC0AGsLqL/pahD1HWhIN/gOWk+WGc+k7XHlm3/xbLkwz9R8ixUTAdluMlukIeN5w6eq4Aoivjv/JFUiEwghJYemZeFalFJ1J26JEz/gQg0Bsg5tlg+MihuTZT2bz6XzmmTudfNDrs/NFWRW+Lrx3npmLqvbMOK/9rWub19Y7FpIQViYqgDErPjBLWp3v0mMKL5uDyXnQchkxryu2pdoks60kqATnQWUR572rvXcBCxRVJItEaBLFhAHnVXU0KfIENwZZmlBCBEFQ2ZpAqKoIEoD4TmLXe521XudgUtXWHp6Mbu6s76x3LaIqMnts8l8CqNxyiQMLOaBuBpb8gYBMhGBejOojUOHcJNsba91OZog886Konj5/uTlc6/cHnU6eJlakRFFAIIz2Uy0MqKKRe62qql54UdasaAFFtXZ+PitEFEkpiNQwfmTaBpRHwVeEAgnRNA4aIdtcQVmEpQ0FamjioNjk1SAAGGi1T4oQYnkRA7ENKuePxjO2N8l2GBIfbwmJFoeBDM4AEu5aQWVLkhvMEGxAgBsj0cgHjAaLwS1LVZUapHml4CZY9obY4D4Q1L2E6FiQDJlEyRRlPZ7Pj6eL0okaa5NEASpfl1XpvRPQfq876OWdTlZ7nhflrGIn5AWYVb0kqOu9/Obm2uYg76QI6ENlsqiqjBDSRI21uUnyUqlg9UTGJomxRhQYFFQMaS+zW4P84MQUlVNjBE1Z+0VROS8pRoViQ8ZSZnZ18O0EXNoQt4biZ7roBl+JFwgJF4u595pmaZbnYRgfmN4QeSAYqTDYpNmHPCqNeFsbJAiIIuKZPUtmDAAwi7FgVuzY4vPQOIUinAsL1tZc/KIR+eVtzFUV8muHDl9U863eCSLinAtEnvBAiy6hnsa1J/ThQMYYaxED3tQsY8siOXbIZ7tcREABlGZQsdJb4HIYhhQ3tODs16hkmycMlJCAUMAopEgdQx0CQRRLgugYpHagbMlQknZzkyZWWQjJEIbo2dZZCUJGG2LQzhCgYz0Zz3ePT/q9bGM4uH/v9uHp9OB0ntik28nT1DC72nsfY9ME1EUYXZDRo5ISJIZAgRlLz6OFzhaCsLDGEujhaa4KnfzGMCdEE8Dx0J8bAzubw+tba0ej8WlRGpuDTQiNBH2GhBC/YG+BhZPjWXUwKk3WM2leVxPHnlVBg6tD8NNAFjXGdDu2m+d5kpgwhzIY267GD1pb3fbSegQQ0SZmY319c2trbW1tPp8HT8MQnh6WlICHEhGAes+3dta3trd7/YFFDjIgYUbl6LWj6Gs/n0/FRXtHAKorLkoGIpMmAsZ5mM7L2kUffFhRawEAghDAoJtvrw/BT0CCkRfENNfgBd8ggyzRtbNmrbyYxM59dTQvj2dl5YUZxYl6ZZPOBV3hFvP58Xi6mM+7Ntno5hu9QbfTqwlwnw+PxseTxe5onvWHiPr4aDyaF4uKUdQoW/U2sVl6LSWkwIC3cT3HOCptSVAxFaJVn2CwFgtzDKUovGmHfQgs7L1X5TCPEeerRWGNWbl2IdUKzsYzLAPfGo/8lTjdZrDzBvxWz3zD5eLilfw6APgfsmOsJGv9PXDev6cr5dXxzx4hxnOGJ810/5IJx3KUjyvl29kRQlv0IBKSFbGK6bx0xycnz16+/PSzR0dHY2W9c+vGvbu3H7x3b2tz0OsQgQ8PL4JAdHb4R6b4Ld8mBo0Hx78Yi2QC/VdUFouyrDxSJqKiNagQRGdh0FCMC57N9FuFqrUp6ykyXUIFqgSMiv2O/e2vPqg1/dFPPz46PnVeZ4vq4eNnACLyG/duX+umOag3ia0cnIxPHz49fP7q6OB4NJvNRqNpUVXz2lUccgIQEJ3ztXPWmsRSai1lWX9Qd/uadzrs/d7e3jkPhKj4ObsErZx/M7IO1ChAFlGlbq/39tvvINHDR1/88KefPXm2d3p6+s69e7/7u9/83d/91qMvv8x++rNet1u5erU00jO/oo3bjZ08IRljl661F1YqRAxM4SDRG41Gs9lMRAJ0671fetYjIqK1SZplwfCNRYwxW1tb3/zmN7/73e8+e/bs4cNHv/d7/wsZ1Gj9p6tz/fF4/Nlnnz18+LCqqmvXrt24cdPaJAqziIhwPl9873vf/+EPf1CW5YMHD+7duyeiF8wU8A1u3YjtzBjeSM1d3SnOQ73ShJufc4V53W+8+LVW8xasPC4u8auncA7jvnRLuLi/6NKU+3Xv7JfwoEB404//vYAoaIIM2hQ+hCsS8RVAfHX8c6lDcGX9XBHSaTuqphhzpssyRKHNstZ2BKeCZIwieZbFoqwrpyLD/nBnY4NAx9PpZF6czBfj+dw5P/WV8OmicvNigXhr2El6SYroBV2AhkGVojEdKqBcAgtDgwq11qS69G5aQkDYWhVL25e1o1nUkNPd9DYizKpiyAYCoyFCsoiJgBVAUBnN6zyBa/NeJ0+HnTRIt9qCBNv4G/ZZYtb63c21/u7JohY4Hk1PJzPnt60Je+Fya0GV5nNs873PoHVNXG+72ItAMONDFrZGNoe99bVefphMFkUN8PT5iwfvvL2+sZllqTGk0hCPRUAloNFEF+WNyAKVY69oFVXBe5nNFwGeC1hDcwPgknG+zGVCBSBCS2hNyBpEQFRBFmbPGLrcNrBFVQCDuhpxJYkdor9YI+UhBTqdzScLJ1tdSrtKSaRQaQjaixH1IqqsIqzCBGxJMospiQmJDA1FPVRCHNiz0CJDLcGpnaY24/tI5m4C2oWdE2MgSVJKUkUSYwuvo0V9NJpPCoeU2DQjk3jvK+ecd6pCSOuDtW4nQ5DpopoVVS0gQCKMrIloN8WbG2s7693cAGgtDMYaAGRRz2qEyKZJmpokBSIATQxl1hgiL8KKBEDCubWbvWw9T44mpSgAmcrLvKzLqu53E1KVhkWiqs65sioBpI2OP9tynpUDLRH9WNbv7e6WRbm+uXnt+jVCgxZVBEhw5VUU2r9G0BnPmFfEdsAx13XtvM+sBaKAJeCK/hDOemnp8uHHFQJKvLvwAhHjTN90pWP617G5tcxRDKk6QSZa181iGIIQdTmUilCXBv1HmqbWWvH+nEBPV5qOVYA4rOcqEoxY44p0pqyOtgAh0FElzATDcCvqYyTGRoZodk2Jhp2MvaqxkCRqk3nlTyfzxaICojxN14e9frejwsYSEwH4RolP2KSwR8NxVCJkhePZ4tnBydbm8Nr68Pq1rc31/mReiTD7GlGQEKwRRgBBRBUG4JBAxg03J7VWRFTFOV8IqTCzIrKyn80XqaW1Xie7uZFRCGBr3KDUbwx7N65t7h2PTmZH4ipIMrKkSMGZmVSbfFH0orNKdo8n3bwjSN772tUsDJg0SUUERImlTp4DYSdPU2usQVZdsUsP5Jyw27I0FlREsXtLbNLpdDY2NjY2NoI2trGojneOcw4RIzcV8cZaZ3tnaBNLEakVVBMKFEMG0YiXQPIFUVH2yrNZ6b2QTZIsV6Ci8tPZglvVp+JqD4uqqTU3tjbXer36dBJMqsNAFwmATBBtqYqgemZlATIejAMqWU/n5WhRz2tlAWVwtRiynpJx5WVWzqbTslh0rb2x1rs+6K93O1mWcpJ42KpLN5ou9icLO5mx8IvTSVmxMBIAqUdf26PTrfX1QZ6mhjQYUkOwUwFsSWmEAsDCHELqlgHIgVTPKgaW0mkNab0KoiogioSEqKLW2MQkluwybrJV/waUqnFnCV8zRERklKJ3duBY/6LOdfko4+WyklUG3wXG8K+8FF2Ci63i12c77bPbk/5C2uaVB/Gv2cZ1SfXS1qFLZEWWzRrqGaG7XsRv4nQMiAATUTueFc9f7j17/uLFi5dHJ6eD3uDu7Zvvvv32nds3trfXDLH4hYBHkAbqwqXp16/YZP5ijBgAgUQFlciQUFKXXNfe2qzXs1JWZemPjifXr+9YSlGDwrBtU5sd8zxwtcx8awHipUpIo5OCghLqnesbJsnVV5989nj/+NSJnk7nHz96kmQZA7x952aedUrv9w5Pnr06fPR09+BoPJ4sZouSFA0yARNokqV5mlZVGTI5A78oXMEsz22SdDqduqrSNBVREY7daCAovd7fpvmIQsq3TdLMItrEDgZrWd55/PjZZw+//PTRyyTJP3j/w3/7v/3B+x++zyrHx8dVVeadvGYnXi+9CO2QDBsXHTJkjbnodKuqdV2HCOimS2YAGI1GRVEs38WKh3I47byT97pda5PV9/XBBx9sbGycnp6+evVqNpsN19eaiQgQRSNjY8zjx49/+tOf7e3tW5vcv//u3bt3VxjEAEAPHz76m7/5m88++2xtbe3evXv9fr+uXasyObeANlyBVQcyhPNWZOdB0NcAx6uBRpc0Sy3s8BpiMr5m/cZz/9rMRVf1BIBvfC08z5huLvPrOTFnoh7hzYgz/kMB4nP5iy1Y0/osXw08rwDiq+OfHhkmIiRpuLVxrIp4mT87IZGKggSzQGzCpVpCriBg2F8QSZW857py7BhABnly+9rm5qBbllVRuRfHJ1++2D0dTYqymlV15UfT+UyY37p57fbOMCcLRtR7UDZNH6gAAiAqIfpmdcnGVpXALKoCapqOvRmNYpRHxd1LYIU73MxNG3QSIUTKZmmGmqJNjDGGDIBRRVH0QNZmC8/HM3cwWuRp2kltSriMFIGACagCiEiapGuD7tbGOj079CKTRXk8ni3KutPPVDw2rogYGc2wQoCOCdbRbyHk6zTDXrpkA3DDbn5rZ+vg6HQ8nTHi/tHpyWR6G4BsIPMKBZ6sSBvSFyozQTCt2yuQAFYsHEb5Sl5xvihElBQMIkdlvwm3SwOqhGsfkgzVIFiDiTFEIRqXAJg9e++14Zy36XygupRpi0J7i0mLuQRXYvPq8KgC2+msoe14NIAKws3OJ6hMojEmj1nVW+DUSm4wRSaV4NooQSUrEF0TtVVXgQrKsnvVEM0e390yJwiQUJwweySjZLJOv1KohE7nxcmsHi/Yq+nmgyRLKu/Ksqydc54RoJt11roDJJgV8+liUdVewIioeCbmjGA9z25sDgep8fWiLApDlPTXCE1iM1SDSgSGwLDzIGJBMjK5IQvAtQOKUT8WZZim1wb9Z0dzJyLG1o7nRTWvyp1+ioIIpBhnO977qqp0pahYcYVr9XqEjQhKAUN6FRH5un78xaOiLN+B+9vbm5gYRGVhUCIUCkZv4ZZaaq8E1EeOoDRGcoqAWJbVfFGUVd3rdBENg1KYnQR9roIBbIcwSBier/ArCJeJgauFXmD/XcLE+UX84qvjX97ROJAs6/5o0COhTbQmSW1KSMxBzBDWfg3ms40DojYuppCkaZZnSZo4OZMmL6vZ0tC2InF7Cak4qopEqMLSqiOiVwOt3HsxSq6xpwAgBUUEEZFgaguYWnNja2NzKGQTm+eYpaOifr5/8sWTlyy1sXZtrdvvdUHCRDNgleFhpfh2NExA1VqDhhlxXNZ4NN4+GPV6gyRNsywh0tlsWruSLDglNIQGxIfagAJSHN+lsjVpr9cty6KsPLOIIQRAk4gCK/mi+uLlQZKYLE+313pdawyKwYAQ+l63f/P61v7x+NnuifhaXU3GIlBQPwsE24Ywr0IW2D88HfRdXTtXu2pRce2xi4AkykCYZXmv18uzZF4sMms6qU2tKRwvo15j8JtBFWlEJNFQGkBUPctiUUwn042NjX6vn3c6vV7PWhverGcfKFGElCTWJsl6op1M6roEXzPX3teggKwmeFIrsGPPTiJ+QfOyfrl/WDMneTfPOoAwnU2n80KiZVYTQxSRCjGEw05+//atFNTFwR0Iohc1BBLAYlFhrwi1914RLbFJK9Wj0Wz3eDr3okrC7Jk9aJbnhZNyNPPOuaK04u9c37653hsmJkUn7NHkt7c3JrOFA51Uzu+fsLiy8iSYWrKEoDivqv3Txd1ZkVubWqMICgRIMeY4BAoghtA38czeB/QqJGtFgpyIiJC2QVvBiwuC4jtKdUQMYK/Xy7KMrBGIAXhn+lGNjaWoAqohTFJjrUHhdnJ9Riq7wpKDFaR1lUH8Wm+Hlh22Sj1YnTZeohc+DxycDTXScwS0SOtsYaulgPqcRHrpn3YBPLoyTfr13NBW2ZRNhXNp3FjY7qSh+OCFKQjFb0EjYGqv48n8488e//SnH43HM2vozs3rX3n/3a++//5wbYCkKpWIIxJlXqrzIs9RfyXw95e8M2NlzpoYi0h1zXv7x8cn47zbtx1TmVk9m3z+6PnO9s71nTWbZIgCLKACGBIradUNdZkN2/pEoSooI4SoUtKGj4sxqNZi/dZWt/t7v7017H//p5998Xy/IvRF/aNPHp3OFjXY27euHx6dfPLZw73D4/G0mEwWo8ms1+l8/be/upjPHj1+sXsy3V5fW18f7u3vF/NFXRYgzFka5o4tQYmZ+/2+MaYsS9+k0sUYFNWLn1uoukWV0FibGpsYMghgk8za7KOPP3/02RfH49nt229/+5vf/P3f/1/feff+81cv/+//+89+9NOfHB8fZ52O8DJifGVJiZ37Sv8LoiosoUDCs8uKiMzn8+CP0Z4zM5+cnFRVdfFahx8norW1tbXhWpIk0CTdVVW1tbW1ubk5Go2m0+l8Pl/fGK5Gygfhznw+/c53/u7HP/6xc+7atWt/+Id/ePfu3fAKRAYAZ7PZn/6XP/3hD384Go3v3n1rZ+dakIFevDPPxcrhWZrIRWuHX3rCgQDwGs+6GDKBqOfcuqMr5lnkeNWMe/W36VmmG1zwrL+UbIsr4HUoR5c6lQvfHm7O5Q/qGwc8//B9Ri9/cVytha52syuA+Or4JwWIAYiAsFHd/wJ1RSvlAQ5oWRPm3lbgqsKgqKokgAgGFJlFQcqycq7uZMNBngJCr9fZ2hg+ef7qxavdo9OJAwIHrw5ORbGTZVvDTmYSIwyWwAsIKZAqqjARiKxWSHhuEkWXmtesOAZoI4tEIjhb6zT9r5TFoigWhii1qZIlJEQKVssN1oVKaen5aFymdtpN7UY/N2CwsTvAdrkHIIBummxvrXe7nZmTysnpZDYrq531rnoAPTMmXBkiUntJlu0CrhrQLzEFABJRBZ9l2c7W+sZwYF7sAmLl+OBkVAX6G4iyB9GoZSZAVVEQYSCKOKuAMRTY2I5VQriPgqLhhrRjiBITX2SVz43xI2VcnSoYvFgCBmAyyKAb230EMIiqymeM+SFMIERBBaio+XhSqNmipKuUqMeWeqCiCoKxbYWgQFZVAk5JOkSWBJhbCjkLA6DKSsfZuArL0uc2/BEWzyqM0PiYaszPsAmQ9YJiDAMsHBdOvRqwaZ5kqe2wiKt8VVY1e1FN0PQ6XYOmruuyrCsvTkBBxdcIYkAS4EGn181SBBZh7x0DCrMlk+c5IgESsHhfLxZzYYfgDdrEgAFl9hQJVoyKvSy5tjHMnx85ZvZYVlKUdVV7BWrZSBpHEJilSXD0PrOD4+XT4hVqhgozIWZZliapNUZBOKRngW18wwFAcHWdAIl/hJU5hheBAdCyquaLRVlVECykz9xdKwOhs89/cJRbmd5Hv9fVqutqsf9XcIiC0Bn8JRThMYQRFKy1aZKCqHdOJOTGSdSdCMQnI84TUBWMtWma2cSyc+3TH4ZzQfoRtRGAoBqmk5Fbo03LhwQobdjjavRrBKcQKUYpBrIRIimBhLQ8UQgBZJv9LhqbpWmaWUjMOudo8NXB/nReltW8LBbe9VATYyyg0WiWHPjIKCoh1ccYAGQGp5iAwmxRPX111B8MdrY2nbBXXzouXJ0kxqYZAVlkJg6yFlEKlkagioidPM873bKqvdSiQHGCxKhABhTNpOZHr466/f67d27c3VrrGFSpUR0qgK8H/c6NG5vrjzuns9r7CiVXCh6zLKI+0IMJEiIgdN6dnJ4WZQlefMVcsygJECZ5L+90er08z8aT8Xg8tpb6/W6WJoXnSJdTASEKQQbBD52AAkqgEiyhneODg6PT03GWpZ1Ot9vtdLvdNA2SWGWRxiQ9YNh8Y5g9uL05vLaGBrhm8V48g1cfxmISlZwxqBOp8O5gNKs9DE2em5y9n0wmHLGc2CgCAzUn3Muznc3hxlo3qeYLUJbgl0kcHDY9o4qqeOeV0NgUbFopHC+q0dydTItSyJhEhL06kdokxmTJwnlgUefA1+udbGtjLUvAA7N4JKPiKy6JKM867LEsvbLPVNc6+Y2djU6ez4ryo9lsUurprBx0sk6SGUJAkjjUjjxtFg6GyBqtPzGYhAb7aQQEMkBgsBlqB6cgBQPIjVcqEnU6nW63QzaJBY7BtvYJJVvQMCGhiIqAAhprIAZWaLBaitT51RoPg7OSriAR1Gq6VwLj21iO5fT9Iua7rMlWPCj0NSlAYc5JqwsTtOSEaJSBF9pnXYkCwSXSp0vq40Xi8dXxa0rmacCjX3StdSnla2UzrTJUAClJK6fPX+1//NmTn3/0ZDqdb2+s3X/77m//xvu3rm33O5lKDeKMYQBmcY3FHYUdkPCMivPNxdUqcLY6FTlbV64EtyASJa4ux9PJ3uHo4avTvd0Dhz1icPO5n5ePH7+8c/umcr0xTDupppZUgZAQTMyGbSvA6GMbsyjCb5CQ8x3iMeLaFc3QCIHEGfXX1vJv/taD4cZ68V+/8/nTvTwzPC/rpy890t39O4vF4uB4XDFOivpkMiWyf/AHv/tvf/93Xz1/VrtqMp9nBsSV6msQx55rFVWpKHoWzecL55yIZFkGANba1k9ANew1EEDV8PUWNCQispgkibEW0ATAryiq5y92RycTV7ub17b/j//3//4Hf/DvNrc3P/7007/57//P93/ww/F0rKrz2UxByZiLpXODD8eMgTzPa1fv7u09ffZMRK2lJsI9/lhd1wAQXIbD6c3n8/F4HHgYunIEQDm85vr6erfTQUJgoSbrxVqbpml4tXClgnNFURTj0Xg0Hk2nk88++/x73/vewcFBr9e7f//+N77xjSzLRAQRrLWA8Nlnn/3gBz84HZ12Op2bN2/eunVLV/zlLkchL4DBlz5rbwaIL5K7zyUKrphsXPL97egi/NQ5/sqK48oqqxh/+YnLm74BL3+Db/g04DUu+f/oS1z74Z9z2Lg6rgDiq+N/ftFBYAwas+TanJ9/nUdfQ0UroADcsDu1+b6l1YSqEGGaJFmWqqoDOJnNjsfj65vDQScl0I2e7XaGG73k+nrno4ePD04n7Hle8auDUWLS6sbG7Wu91BgEr8YogIgBQkRVcQAcZEPQUAiXi2mjQGxWHGrsAoRbLLCZ3EXBui5pyBCT93g+n8ymExUhJEWrCk3sjwAyAgiQkqlFD8eV9z4lYNnYWOtaAhSP4lAjB0pFRHyamJvXtjbWuuP9cU0wnhXTeSG6SUSg1NpeSpzyK7TnhzF4r1VxAq7Ad3RmgKmqFnlr2L+5s/FFrzNZlPMKX+4dLSqXpEmnkyUmBP9hSATjYPSIaCnGKgXWDREJGRF0rJkBAHCeWaG1D6Qo1VZE0/DNg+yVQysdeiqDkBpCWDrXsiizMLOCPbfJoAZoJ7R8CkooCEDKzN6xcM2wP1qczDS7tcOYOMcsasFIxHy9AiCYwHAlUguACBlqz2qeCKknaJyDI3MZNfiAtrNVDNFTK84qISxeVJiFOdh5CKAoASWqwGgYSdAyUg21msTmmFMSmMZ1WZd1LQrGGELcWFvvZHlRlKWra1Yh40GFPYKSOABJrMlTw3XtDSCZJM1QQVhAxUT+iIpyWRXTxVSkNkbynLp5klrylUY3Dw0SXbM26KeGiBUQHHPpnGNBjGlIooAGgNBYk+edpTsZLge5oOeTE86QrlTTJHnw3gMWWVtfC7x+CTlz5MEyKKNyTK5r+u2GDMHhD4RgRgRQrMqqWJTOCRqKnpKKy4cT2ykVoAIptiVuQPhWZ/LY6AqjuvCKXfWv7Ggy35dbWxi0pEkKqs65NrKGEJGMgEQ4FuITpKDV7pARAAEAAElEQVREBASiKqLWRNHFOR3l6l9FzjRIS646Ea44nIabNL6ANiIOiBgaNqiVaJzgIFJi0VrNEs0TpURsYsy1tdG964+e7M1nxdHJaT9LBv3eus3Q1EhIAdEUjYJ8BQLKbNKCBYSkXg+PTr7MM1FkxSRJQRdl7QAzMkwGExPsKphD/FqDpxuiXreXd3I7t8YYEiUigwiBAQyARII4KtynT17O5wv/9q3bW2vDjkXwACred9Ls+vbWnZs70y9fFr4CcRg1rSIatl1t51Aq4D0rkDLVtXpBNZaM7Xc7aZYKy2Q8noxOnPNZlq0Ner1uNikqVoiWjRg2JwkeUhQCAVtfGyRVqKpqPp97z4iYJDbP8zRNKQgyojFmaPucr8rF7c3N/J3bG1lK1MnzxJqiKLyvJW4rEiQvgAhkBGhaVuN5YW2n2xkYNNPxdLFYKDQLeshrIwT2BGzUbw6Gb9++1stsXdTiHQMDEFhEQ8y+qipLlBpKs8yJatKpWE7mxcvj8bjwzmOWd7M0WywWntFaY9PUJokKcO0su4GlB7evD/OctA4qGlWqa355PDqd1LUjEWT2JO7urWs31teGvcwzsyv7g/7xbHI6nl7rZ9BLoNVEh0BSiDl0jVWLrKTAY5ucFUa5IBJGx9GsRCJMHAa0CJikyWA4LCvnhZtnrskd1PhQc6zJiBkdoLEWCVxdIxKRIUMQBWfnlPZL2X5bNq48sUCrMpolQnxm0PiGoSO+KQQI39Bd44X2e5WT1jbPeom4D16rb746fg0B4pV5gLaZMEtWhrRTlPDP2DjxEiKSFzo6GD95uvvTj758+WosUn/43t3337t//+27O+sDS4pSgXhFVmZACXnZ4clQoGhJv4IyXnZD4pvhqktIyNG5goissemTV7s///nDz5/szlknJXpEqVnrGtkfT2bf+d5PfmDo3Xvbv/WVt+7f21GtQ/YJKrWmd01IODRlYPiMCIHbOa3EPADSZnUiYCseoVrrZO+/c+f/+H/9m97f/eTh46eexXndP56U/hUZO57U88X89HRc1/XGenbr9s2NjY3Tk2Mypq79eDwyc+NcHWx22KkXFdUkSYgoBNOFIARozKnaK9uMiqENWG6cdokMESESMKtjT4CGoPZc+6rfyT747Q9++zd/6xtf/5p37r/99d/85X/76+PTk/fefZesefbi2bNnL4hIzy5BCEtLxvCVNEvn8+lf/OVffefv/u7zh58HBPaMuwkskbuQBc3M8/k8JNRdvO6hKMqy7OaNm91uDxEl6prIJrYoi6qqRCXN0l6vT0g2sbPZ7O/+7rt/8zd/vbe3V1X1ZDyeTKeq+uDBg3//7//41q1bAaG2NiWi8Wj053/+58fHx2VZfeXDr/7e7/3e+vp6MKZ47TJ7qdcD4j9cVngRMgZ4jUvM0rAYV1nDZ+2MdJX4oOfIcJdk2b0Jv47PAJ6J1Lt85HnZCfzPWd+uqDxXAPHV8c+s6DAGjVVClfPRBudLVwSkJs8dtIn2Ck1s9BQPke5NWQ1pmgz6vTRLy6qaV+5oMhstijS1KQmBzw0k/TS5scW+ztN073jsvS8E9g5PVF2SbF8fdhK00pgzBgxIlHGFe6KNfoLaxCpCYFjx/SFEZcDATG3PLcbOBK4srEScAyBIak2eJgaJFQBNE2wTGMECqkiJAgrQwgPO692TGZDFJO3nSQLGgoeAnmPkyhKatX53rd+F3VNBqhzPi7KuXdcaEQ4fY1AXCzZpOu1Hr9Efug3AixeIlvbE2tqzMg97+c76Wr+TTeaL2uvJZDaeLYy1w7V+lhx79mDoQqBppDyLiGcHCsJSs3ovaq2KlpWLbaACIRo0QZxLTc0B2IQt6RJfNURJkjSc7sjOZS/eC6xA+gEaaU0zo9sZEoCh0Eaqikrh5f/P3p89WZYd552ou6+1pzPGiTGnGlCFmjAQIECwQbakltR2za5ZXzM9XGta/wP6z/TSbX1lovpBsqb62pUEUSRFECAKVYUaMyvHmM+8p7XcvR/W3vuciMwqFEnokirGNiKZlZkRceLE3mv5+vzz33exrCpK+70dBzaAPgVVhIVZQBTRUMMHBlRCMKgZQRZpigLitMHmBpf3Ru7cbo4EBtY2biHMfmLLOwwbu2Ljg2I0isYJVAqFVyfAqiyCZJMsY5XIJxRZtIhEWa+nonmVO2YBFQUWEZGIFMCnsZmMe2liPTsvhtBEUUIhGyRwHVSJQABX+booC1FOI8rSKI0toBCFsWlqHGwokbWRAYPaRWZ5z9CkCkE7jI/GmshGzTkCr+SidwxJ6IKRtg+8ooi4v7fnmW0SA2A7tR9SEMOdzOwVlFU9IpExaAg0KE2NeRM1JGMre+e9V21cKtdrFL1yKOpUB33eP9M6iG+k4b9PkvCVqdJWMNmeR9BgxFEADv2eZulvPILaRGlubrdWmQK5Kic1v8E2aqul2rzQMNUV3M8NOWKbmKbd8DgBSuA5ELbTFKIg1PjAOPAvEkO7mXnr3kG9Wn9eudkyf5rM0v5wMBihNEcBBBUCYkQgUSWgJEoTm6CURNiL04hMUSxPjk8iawBtL+tFi6IEYe8dQpKaOIqZFNSx5w1ev/3uRDSO4ywV73yYRWn/Nrxp6pUvF7mvKvB1WR69dudgmEQWRERQZJCmd2/f+vz4Yrkoib0hViARNsGp1nJrQQCIAIiMrdE4IDZR1BtEBq3Buq7z9bpYr31dEVKElMZxmsRX1EAkbVHnHTIf2oxURBTh9vIiwuy7CqE7rgMAqAg7V5W1Gwizq2oRSZLUGJOlWY3knPPsVAQ11EUEgAx0MZ3XzmX9fhzFzvnFYlnXLrS4AUgUBVAQCQHFjXrR/qi/009RnCqHEiKQjxC5vVtEg/qMmNd8vsqnq3yVV45VwdgI0agiG4uGMjIWBKV2RngQ21vj3qSfkQSXOzoxy9IvyvpsUa4rqFhZOSLcGfV3h/3xIIkJXF37ukqiGACrqvLsodkNVERAKCQTtDdyG/Mg7X80wyBtV1u6gVnc1F1NKacdd2WTLkjN4BFu33vaxTRgcBBbY4lsU5NsVoBrikW4n3B7IFi3XgKGNuOXnvyvacTPPebQlMHXR8Vxey26PgTdNjWvzJhvpxduVpVr+QB6pXF7c33tjmhXZaBGX20fJtQNkLvx3wuggiAIAiOoMAOFEUBQpLOL5QfvP/jssydPn51HUfTa6y/91rfeuHv71s6oZ9Ere1Fun7Bwq1EzpIib3s+XZlrhl4pAbe4xarNGQoMHUyVAK4IGaZH7pxfrh8dLtdZRzOh87dR7AnEMD08umT1ZvXNn/9XGoSIAAo0nRLbHMFspjBrqP5A2LoPQNsVNOLuCNgQzRnYpwev3DkF+a5DGj56dOBb2OFvkLLhaLdfrVVnWpFiX/uOPHuwMJ48enV7O8sqL1p5EvSgrMAAoBFCvOtc94ArgvQdEaqMytifetr2o3SIjzAFwxwzMRhqYD1uAV165/Ts//O7d23cfPvr884dP33v/g9ns8pXXvvF7//1/P5vPT07PmMWgadbSDuvXUeE9qypZmp5f/vTPf/rv//3/7/6D+6v1Gsk0MegtrlfxGiQZRGQ+ny8WCxHpXvY13kIURXv7ezaygNihhWwUHZ+cnF9eplnv1u3bvcEAyTjnf/GLX/7xf/rPf/HTn+V5HkayVDWK41tHt19/7XVro7r2CEBk5rPZL37x7nu/fL8u3XAw+va3vvWd73zHGOO9f14z/TVR1X8DPfRKwfnrBNAv+eqbSMCt19MBzeSKrosvgFN/tde/rcP+3dkwvgTudHPdCMQ319/SRYTWmsgidYadq6rLRi1WRDSGkEiBOyNrMxqzlaUGmyrCJ9bs747293bmz44rkdP58tH5pbG0N0gjEBRvAXb69q1X7owHg+Gjk/tPLmov09W64tprja/cPtzpGdIG0ttAkTbuxa1YIdHNGRuB6GqRjW10fJfhqWFqcwvL1FLfVA3h7nh0u9bjmbvIRUkATeP1QSVQ09Q3KGS82rXg03lZ8LRWc7g72snsIAB/m7oKVYWIsjjaHw9jC16xcn6+WC3X6+HuUD22QN52mgf0ek5w+/rDIHIb9SsAwBtCBSIIezfI0sO98d7O8PRiVgFcLlYPnx6/dPfu3u5uFj+erktKTPP9IiIpqqoEYiMoc+3Fq4L4dalF5fpxhAJFUTfUYgBDFCaYtxB+uF0Bhi41ghpDaZpYY2qGtsQAL+KdD7auDVIZ2jEmRECjBABGw0QtAiA4lmlen618snMH4hFLUxR6DrAsDyiApCBAKOJQGdXHyJnVvtXE1FA7JUAkBGkGv0MVvP0W47Y01BAuwnwXklFiCEHOZL0qIKohr9YLzopqVfGqduuq8t4r6GR/PBiOwBpKYs8+7PYswr6ufMWqrMiekcEoInNqYXec3T2a9A2Qd6qAhATGIlKAl4IyAoMpnD+dL/Paq+ow601GgySJlNmQ8Swa7ghURVbCyAIpN8IXCzsWEdMcv5sJViRCan0o2k1HtzlwuD35ihuaY3hoyNTOlWWdoUl7qKKiYKwlY5AwaCp1WbKvXF3YOE6yXmJSUJF2Nnhr3RDvavGOAKwJ+k1DIGmqpdY9HMpMNdsFxnW+sDUmUES/YgF3c31NVOK2yG6bBM2tQYSAaAwZaxGxrmsXmiWA3Q3dSlLS2JGCF9FEhqwqhDjQ1iXaEHV0K/U0aMTbg5bwAvLd9RJfw7ErdDQV2qA6wuYEG75gQC2CqGcBYoiI0oheP9zB6jaKfvTk/PhiUfknqrQ3SPsBzYCCCCgY9gtDFMeUxbFRFNZekkxGw/WKTk9PHjge7+72ssHujojO8qoWETJRHKeBmeCcCwml3b6/XC0VhAisNcrimVU44KqQEJuGLtTMF8uiLB5PF8tVXn7zlbv7/dQoI0saRa++dOfBs/PL/LF3DikyNg62WiXYgkkTCCAZEyVgrQfyFCejHfJlsZyvl4siz9VzmF4gktSafpYioEg7Q0wIFFp7G1w+KGKDIpZO3DfGEJExJoqiELm+bfAJAzZkKImsJZS6dq72tTOxTdMs6w0i9mVdFXkOnkUByTiBRVl++vlTVYyiuKrdKs+X69wLGGNQqMnZa/iYYlDu7g/v7Q97MQqXSICWkIMpjlGRgDAyiEaInOKi4pPZ4mKZF86Dsf00tlEUx3FZV4Bq4ohMhIp1VUlVjQe925PR3d2RNVCzMFPheVnWZ/NiUbqc0Xll9llk9kf9O3uDhGoSQ2gsYZrERCUa5Eb5bfQFAME25kGbqQ9VBWURlm40qqMNb2TPrQheafHEW1oqSNdBbHXnjgHV1UdNhxEAEaMoMsaaUHmFYga0HRFrJWCRps5pN/3r7Ej9Qmn42iH8ecfTdv9EX5RVBF9wjG8+83ME0o1wfFU1+OLtTG9QE1/HUxq9WH5VbInY1DVAg42leeTapBUFEjCVh0fPnv3qg0cfvf+5r/ydw4O333rprTdf2t8dxQYICg2ZpN1t1Km3baxX+9zKteiya6/3CzXugOoPoQDBPAPaTMsgkk2MjT2LV3RKpVDhkYz1jF6cZy/qCcEDQM0qsijcqnAMjd8ApTuJdClkuH0134IStrBdQNSGOdOw7nwbUqvCCtCPsm+++pJn8QLH57OyknK1Luu6Kkv2joCQoKz8n/yXnz9+epqv1ycXl14BRMmL92H9a5Q4ankRsEFYIWyxMLbXkCC2Pqf6aTB0KxjVCIAUEUkoMnFsAOWjTz780//y/vnlfJD1fv/3fu+3vv/919984+e/+IV33jkmCq6e9szcrTna/FjOzs7+03/493/0R//uo08+ZmZrLQI1XbOtNW5bpgwogJOTk8ViAdujGFvFDxGlaXrr9i0bRY17DAlAT8/O/s8/+qNnx8/efPPNb77xxmA4mF1c/vznP/+3/+bffvjRh+t1bowRUSLLzCoaBh+fPH764YcflmVJRM+ePfvZz3727NkxkfndH/13/+Af/MN79+4FdbhjdHRL9K8FoXz1Ps2vVZxf2Nq5tlmE6uKrfEgYZAnDRteMwF/9xXyVf/xryRt/vS/313jDb2TiG4H45vq70J6GkP/RJMC2fwTXd/8m34DCotYBi9tPsileu7OAIIAQ0riX3tqbPD47q0Tyoji7mPZim9ndUWYC5gAVssjc3htbNEXlT6frdeXyyh+fL4ZZ1kuSURwpOBWPDduXrkjXCNtJJM15YHsB3cADGgA/gDaDh9ezMlt8g0AvTfd3zcF+uXhyWYpHa8LeBgCoaJoMHdQm8IHWXnlVA0wVAHZ6ycDYBnDcvp8qCLo7HqSRyT3WtV+s1qt1DrvDVmHH7Rn/Jo+4GQfW677ucFZvvNvYKstBz2QDMsyS/cm4l52Wpazz6unJ2dHBYZamkSF2BdhEAxezPcyIsATGg4IIqCiCFlW1yvNxlkRIzvlg+zVElkiVGyNAO3+GTcZKGNBuDm6EFEWRsYa8imIz3azKrQtdRakhBjT7pagGccGzgiJzM2wlqrNVsXIwvn3oIfYsAEoAXnw4XoY6WUUFGIURvFW2RmOC2KgF3xIytA1k2KITBkdqU7Fhe1u18mggmWBIagIgZMV1WSBZEyVeYV3V57P1onS5887V1pr+oD8cDpWMWmvTHjh2zrGvnbAqCJFn8Szg1YJF8Cgy6sf7w96knxl2CEyqYfLNIBoEFVaDYEzldVHW01XhFQzRaDAYD3qRMSLeIBKgsrSPhACwQSAQAQmdH934ANss+A3EcJvNsqn88bkMHu3aLohItF4X6zynyI5oxwAoAtkIKSDhQEW8r+pqvV7N07RnrYU02TrNKmr7hVm4rn3tUDGODCoDhMn1a/XQtjWs6+tcQTEGlSfIPb+mUrnZBb6mMvG22NT0MhCCfIaIZVl74e1aV+Gq3NPok2QjayPbJCLqtgG1Wzz12rno+Z7El0zdtqMXCuGJ33x53BqHx8aX2cTjKalaUGPNnYOdZVlertZns/LicvYJ4Hp/cjTp9xOKY0QEJRTF4Fa1pElE1kDpvbLvp/He6Fa+XCxXuaDdnexOJrtesTw7Y2ZX1y7xxkRhvBWa5mTj/i/ynMXHURTmBkIvZyO0N4P6JABkorWrnp7PWZGiJHn51k4aEyIZGvZ7t4/2HxxfrBxEkU3SzNW183U71NEwo0QAAYwxZCNBqjx4QS7rfLWqywra02PA0MfG9NMkMqZkBkANw0VhBqlbKXSLjy6hxyjd0b0BKL3ozIYABsCGdAVlEHbCtQcR6fVGNkoyG4mSOCaDTLRa5scXs+PzKRojKqv12jknikTWIDV5iC1aVMX3Enu4M5oMMksKYRCDDAi3Y92ooGisoGGgde3PVsXpYllUgsb0er2k17NRVLvaeR/IJKDgveO6Tq2ZjEfjnTElce7r2nlRXRRutiqmhS/FlKziPYnP+nZ/lOz0DdYlirFRlqXxAAjPFtgMUQUFNnjGQ7MOm82SiLC5SWSTL6pbivDVlvLVGfUuU1gVI2vL2qnKxh4ZeuIIqECh4bNhNQbkWJgKQwBSUSDdbme2gwLXzp+49STil/ScvmSduTKr+0WH579ikBc2ARRXRmFuBmL+nh7UvjoANOjDwUOMFCbEVG1Z8vls+d67n97/9Jmr3J3b+9/9zptvvvnK7k4mXDHXomICvB6u7G7XoRa/+W+t+QbTNO33RzXzsigBCckgobGRCAq7YFpQbKfTAFjUs7QcGHxOPv+KdcKW7wFAQRkEQq8LotLx6eVitsydkGOzytdFVTl2TTERxHCixWr97vsfNCmuZDwzMm+FrW2fTxG+Asdgm2C7qShQETV0YJvwz3Yo4fjk9C/+4i8vLxfPTue3bt/73e9//x//k38y2d+3ccQSOIJtV7v9VlvBslnzVqvV4yePfvKT/3T//n1ro8nurrV2Op0993N/AUTi4uKiLMvtgZtrt26WZXu7e6aZwgEyVBTFT//ip//pj/84z/PJZHJwcMDM73/wwb/5N//mvffeK8uyi7MLv3rvT09PP/roIwD4j//xP65WK1VdLBYXFxequre3/+Mf//j1118PiXlb6aNf6d6DL0DzfHXB9IsKvL+SxvpFqJYmjw4J2tka+IIkw5vr5roRiG+u3+AxepsNJ43+dXW1bNPaNbSSVUFE2i2Zmvq7qby1PXwZgdAh1VEcv3K0/+T0+NnlrHbV9PIyFp8C9O8dGRMpiwqDSi8ydw73nJr486efPT2rWJalPDydRpZev7UfgbPigl7aJMThdnYHIlCwYXVG2y31p31Z0InXG6vX1qiFbp/6DdF40Hv53p15pU8vlwIiaLCR0RWRRMM0EigRI7KQ97WfrRWUXZXhIO7HxlBLTgBUAa73J6NeEpfCtavni9ViufbNib85CwQdgDb6RAgAR+2+qVbcw2CDbhrjjV8GUEGFXdVL7ct3bj08vjx9cMLqz84vV3k+Hg5iS8qe2YuiUKuSBsZFd7hCREKDpq7L+WJxOB7ZiIqqcs4DojG2Cy3vmMgtJ7kZ4g5xeKIMBLGxEVkEbs/jAS0gnTTS2pHasRdQVnEstXMKyCL9rJemGStcLlZqMzvYrdkqKgEQSMsVAVACAWm6CJ7EE0pqKYvUokOpJRCxJMSpNxxbFWlzxbGpQQMMsa0XQyxRg3hARCAku87zk/PLrD+MU6o8Xy7WTy/mK6detJfE4+Fwf29flJaronSiSqhWBeu6AkRjE0RiX3onEUYGSGsXGzwaDQ8G/YwEWdCSsDdKEaFFIlVWL8Yw2WXtzhb5fFUhRmlk9nfGo14vgE9E1CB575EUDXp2It4YDfN7iEBEZIwCsIgQQsORVgUVuYpvgCvNimtxdd2JXVSJNEqSRDiKoxA2HxkKoLFgW6YQsC5clQUSZeyhfZJhA3fRQHquq7KuHAj2kgRVCIi2YR/tc6rwgvFh3Ej8m1HlTve56VT/vVKHt42f2zdAlqSDfh+RyqpytW9AJ8KqKNLFd7TZ3gDGmiiKAj0wQHWQKJTqEgYCWMIA6faJbls26nJmtl/JNoxCQZWugDA2OdLNnmRa3z4iEBlLaMLrQ5BBGr10tLssamsujs9Xz07Pl6t8thgdTPq7O70stcYaRTRGCcCI9HtRGpu8LtfF2rN75aWX2Vfvf/zZfDZTpdt37h4e3Vqs1+v12jlXlEWagrVRFEWtf4zDw+89S174yBljqXWZdbhyFtFwnAnJpYBrXz86n7HeH/bS8av3rCURtaq3Dif7u4O4hLS/E6e9i8upY9eE7DXvQIhxU0MQWQNoitJfXMywWkBdEygQMQdXG4FibMwwTVJr80okTPA0sFzcaktBm0Og3jdQyO3eErSIiSZ3IYQ9hZQCVVIhEAUJ4HtAWK0XVenS3iDt9YajsTHRaGeyruuzjz67//hksS5N0ivr0rGKqDEWJIQQggAhGQMKKiT+YGf3aG+vl/aEPahyaE8SheA7ImIBQVt5KZybF/XJYr10YuKoNxiMxztoTFlVq3VR5JVI8Gox+9qgHu5PdnaGaO00r8s6n87nROSYcye5kFOqvEfmGHhgdTejcYxoYkNKygYRRJ1zgBrHsbFR496VjtWvTSBckIgFpdU4sDElNnNb0gwtB6W99bFts67aJkMcx5gXIhyjDUjtVjINACps4CyqwiHENvwiRKbDvmiHIru6Dqhejf8NaCX8MhngS+zDV+y9+gIV4K9jubrSu33+c+qLP+ZmTuZruZ19ZekTUZEUKMwTRgAEGFUFP350/ov3Pv7gV48Q9e23Xv7ud996563XDDFLCVKreFVBCkclupohd92c8psWiA0gEZl+r3/37l2P+ODxUwFCBBsFCCAaok1+G6IiCIBzvq59Ex0KDBDgEah/xfd2myhFiECGFZWsV3N8Mf3pux/ff3wyXdbrwuelYw2pnoiqXlXCVJE1EkwvSE0l8MWF5bY6/Hz9Se3w6/bhtBt6DRwOoNYPhAgIrHo5m5+eXMZR/KMf/ugf/cN/9O3vfCfr9R0zsxBSUGaZGQ1haPRq085l7xFxOpv+8pfvfvrpJ/fv3wfAH/zgB69/8/Wqqv7wD//1l7yZzOycq+v67OysKIqwXW73zAKk2BgzmUx293ZDXFAUR977Tz/99F/+y3/5yWefpXF8dHQ0mUw+++yz/8///r//2Z/+KRlDRN77boInvCefffbZH/7hHxZF8fnnn3frrTEmiuLvfve73//+93Z3d+u6Ctp6xyD+koWXiDYB8QjtCeir9mm+/K+2nctdEsb2s/NC2sTVz7fVRcCNi+ZaZQs3GL2b60Ygvrn+q1UfX/THG2fGls8WBYABUCEEymA3KaQqXSxQyL8SNcCxNTuD3uv37hRVfTFbVWV9uVgagPEwu7U/Ya5DRIk4bwhv742949kqP5svHesir+8/Ph2l8d4giixiGAOlxpioWycLbb6ogqrBTVJ8wDaEuVAUUbnyfbeT9J0Wpk2WLYtBiMnsjgYv3Tmc5+WiqAHTpvqWTS1OxgTvEpEVlVJ4mleEMunbfhr345jFgYIJ8GPVYT9NE2Mr9gCV86uyrnxwRLfk1xY10bwyVkBgBHrOfxJmjRC20sQ6mZs5tvHueLg7HkTmwissFqvFYpnFUSD6MosXUENk2jmvIFEgB9wzIAmiCATslWderlaiQMYGFDVsQLVCQKY9yDcUwiDZIhjCyJIhQGIQ7OiDXqQRdduQJuhIy4iq4D1XnhVRhAeDQZqmjmG2rvuT24zGN0lzEvAIBkAEQFhVQbg781mSzGhmJFIW9iCqiiwArCASzDkqAm0cuLYpfcEQFdoKbVQgQRjYBvDOzZcrsKnJhiXD6Wx+Oc/XRVUJGBtNxpPRaAyYrNZ1LQiYBB8HRRipCpdoQGoHAgbJQgMM3smy/WF/kFhip8yqjBq+o6BYg4kiD6YWsyiKi2VR1GzQDNN0nKWJMeBZWVgECVEEm169qqghRAqH+WaGFxAZRRURTEi0QzCACCqN+oPBvaSdU3iL9NsintsfM7Pu7IxH45GJbEjTQ0RE21WhYCiOY5U0TlIbxSE76MpngpZMKeqcOC8AlCRpg6aja4+sNgMNV+IomxHC5tEQ8d5770XVWht+xNvnbmoex5ui6ut2dX1DDMRuVAzaZZgcAQknCiTrBbwokkEyitSaahQQVVrNCyBkoBtrQkwZKoSOhbQJOO26sXERbzLTrwZSv9BR0qAetzIAgBAEgBqKa9sBNCAMQqAEQILkFMJQAYv0k+j1u4dpnEb25NGz2XKdO+Z1mS+L3mTYGwxGSZLECIgax3Y0zHq9eLouy7qar5es9Ssv356ulqvPn02XczPLRqNxv98vy7p2ztW1McYaayPr2YsiChKSEqioZwZEIkvWNHqgNjhFBVEJYElSUECrBDX7k+nyk0fHd4+OJoMMxTG7YS9+5c7hrICKzbqsXV0Hk1HDEmg3NVJlFmtslvXSrKcCwIosIIKAZIgFnHgDGEdmkCZpZA3U7FkIBFGtBsY0hMEfpNASl+e41YgYJg9aGC62R8eWE4kYWYuAyk3tIexVwLlSWVxVmiQ5OLo7mEyqVS5RWqthpKosIwE0ltBsULrtWBKAKnM/NvuTnSxJQ9MWkQCIgQSIQ1SgEyWT59V8VS7KuvBQK2GUDkbDQb+PkS3L+nK6WK1z5rB+e0C1qHu748lkCASrqsodn0+Xs8UyiSNrrSjWKrV3oErKFrkX0SixMQiZQLFWL1KVpXM1IvT7vSSJEQhEYbtteO3GFlGWxoWgzXutTYO2qdc2HUcF0iuuOiKqnWtoktDILgEOgxTom2CQgKEsK+9904ZU9Z6tAY1UA6PiulkYtnhE2lkktGOPhL3/13nHts//ek2A3twsL9YRXhhn/8J3sSOWvkiYoE4QVL0JfP+aNzvhOULRl31EQ1swoGRMzEyff/70T//sl58+PLOg33zjpd/90ffu3j1AdMyOuSJgolBTKcrWaOIXeF2vSV3PC2V/xXaIIoCKVlVZ1XUyGGaDgSI6ZhY1IaA1jqUSCbU9AhiDLEVZzZd5VfskMgD+b9Ibadh2LdxdKfJg5+vyl7/65IOPH+QVL3Jf1SIqrBymEAP7WRCcsLIgUZs5A230qH4RB+DXelG3o5VDdYEBChcMRxKoS0oNdQoUjU3wrTff+Kf/5B+//fa3bBQ751iV7PbZHbEFFDQrmGKYz3v48OFqucjX6yiOv/vd7/y//+B/7vf7P//5XwZnxxe92PDCqqq6uLh0znXO1u3FMGi44/G43+sjIlmTxPHxw8//w0/+44cffeTq+o3XX3/nW99KsvT/+Nf/+hfvviuqyhyKqG1vh7U2SMPOuTRNVdV7H0IDiPxwOIzjKODswktj9sYYRPzSfsa1n871yZJr3/i1h+CvKB+DMfRXfOrbiPoNeAy3u9tfRcZ5YXfzC/fsr9Cw/K8sO91cNwLxzfV360gNAT8axne2mYy6Cd1oSUqEQshAJqCpwr+XNjFXWs1HhQFMM44osaF7R7eWuWP/9HKxXJXO+1n66FnaT1JrLKEygigo9yzd2R9NV/uKcjJbVQ6mvj6ZLSMzSoex6Rj5hA0oIsi0GDXoW1DAZuPU5uxtwghnK0JyN/BIiESkKo3VOczvEoaDirBHxVGcvnSwe3E5zZ+eqzIGVRwx2G+RAhqoyTASQCS78g6K+nhRJRnfjlNSsSDN+CtQEpvJOJ3npXOS13w8XZ0t1geDiJSJNHx/FMgNGuydDCpAKEjUQnIVRDZnHVBsBjmps78SEcKol7xytP/Ljx+vnS4Wq4vL2aCXxUmKhiREIImKSiPMNqlwatp3D8goRoyGVStfrYoVgwBgHMdJkrBq8NEF5ydq8/IUCEKeEnUlpoqvwTtAwpDwLlI7UUWUoHIrKDEqhbAyQFSoq3q2WASE4f7BYdofO4kqTUfDvdILS3jfqRGXGyIHIygKqAiojwz3rfQN96g24AI3jThEDZJgMy1NRLq5y7V5HKQdxVIQRUYCY5QIiASgrLztDftRtqzcbJ2fzNd5XrFoP00P9vcnOxM0ceW1ZstgMCARCZGMtdZXwK7k2qGIRVR2wjyI4GDUGyUmUofCiNSI1uIVRDBk/Bgx6Tzni3k5WxYAGlu8ezAZZbFFVWYEBlQQIArIOQQkNChNsmBoKQQkaYOTCy8MAIGxNewptpTh5mnGgCgjClASUOzi5rU9lIe2gHCYZEMKkwbNpyMikySppT1jjLFRnIQiHIKFPUhiqErKzOucy0qQqNfrUciqwhbs0sjWASQqgN34AgpDABoHKbjjuHVsR7xWxoWfa9MTuqlVvlaHabzmdsIu/RIBwBgy1ihoWZZlWTWToNj0RARQZTv8HUSUjLHWEoWh9Ua2DLd6CyImbAmD18bAO7vHtZHAjWrcLT1thGrI7gmIXKR2+wrLOhAoiaBaREJBEPbsOSI6GPeTOMmSNEt6Z9PlbJVfLlZFWVzOVjs7rtfLerHtp1GWWhtH4/H4fO2qqp4tl5fz2Tfu3n7zjVdL7x89u7i4OK+qkpCsNSzCzGVZgmIUxaYJVRdAVCJRDnMirUU6UBYbEgK2YXWAYbKHwFgALLz/5PHZrYOn37h7OO7HCJpG9Oqdw8+eXHx+fHk+XXtBRSI10Gyq4YEVEbbG3Ln10muvvHz79h3PuWE12rFmtW0SC6qmFvuJNagEaAiT2CaJERH20tY8RpFEJGSEBtdwN6D6wpMwoigoAaChKElDQByQUVZVJFAEZlcy18DVbN4vyJ4tq4rp3je+uWbz6PGj0ntSQTItWwcYQAkUBMQbcbd2dm5NJlEUi4oiQZDYgRioVihZK9Wa5dnZbLEua6dZfzAYTeI0jSLDzJfT2WpVrNdFQ9UQJYLY2r3d0d7u2Ea2drwq69mqmK6KWkC8xCCEZI2JbJwv10Z41Iv2B1lKCJ6b0CYVEXQseV4Rai9LImtCSdXFToUZlQYCwW0YoCoIh0oMmpxH6dSlILt3TInmJLyVn9Pv96valWUVbI3GmFDkEJkgwBgiQCyKitlTE5zRvHNXGjhbB9wXirO4NY8iKs8nRD2vAjzPk7ny77ERtb9IPnh+xOHFUnKYCntR1vzWB2ITq/sbP8TfXH/Luxn82pvk2o1MhNJ2HUHBmsQzPXl89tO/+ODzh6cRwfe/++1vfeu1e3f2rRGuKwCP6Ls5wHYjxM4f9DzCNQyibfUk9EWCtnw11QwJN//IOTefz3ezftobMFDNEuZQAba/HEgbm5GXbjpbrtfVeDAQrTtfU4DfKOjzYrpq58zFa1pVs/6QETBOzdOzy1998ugvP/h4tqpEDHuvzIH340MBiS3WTCH4abZdM1/UVYqiqN/vA8B6vfbeb7eXaDs4B8AYY61VVeeciFAwqYTol9B/xaZEACJBIcAoSfuDYZamtfMNPqJ5kxsXdpokZExjnmAmQ8Gxc3lxwd7fu3f393//x7/zgx+8+c7bF5fTJss6hEgjtfh3hS0Chvd+tVpdXJzXdb3t2+2afEQURdHOzs54PEZC7/305PJnP/vZT37yk8Vi0etl/9P/63+699K9995774/+6N8FskSYx9pe9LZLrLA4d7VW8IJcTi8Wy4Xzh80oKNK1uODtAgyvEnuu/SF8cbrd9p8/P9gBX8CIeCFU5IWxeM8dU7aw1J3rAb4SPvjXqz5/24ksL+o53Vw3AvHN9XdOH+5C6bSzcrZjN9iO27cAgS0YRScii7Z5MkAa0gfCmH9oeYkgUj+xdw5313mxLsrSOxZ5fHI+GvVvH0xGWWqNFfaoouKymO4c7HjhwvllXjqAs+kyi80oi1NrFZw2QrZuLLft0bqZxW+mSTsWF+iGtavdvgIbGMXW9EdzhEFAAeXYyDiJbk1GT88uSy8BCRvGGxtRVUSwyftCQEDjlXMnF3mVzvN+HA9itEgKoQhTQtifjI/PF0UJRe0uFuvLxfpwvA+siELa6BTt9wTQYHWhTTfYRq8qomkrnCaOvSt5VLSXxHcOdoe9tF5VZVVPZ/PJeGRtZKypAk0kQBuV0ZgmcB2x0ewQRYk1oHJZwZdVJSLBTBaMPI2i0cqzzW0URN5WEwlbWxLbIdllXrK4EJzLIl30DAbmR5v9TUCqWpTl5XSqqirc6/VZKfeKyUApdp4VAKkhfoQ53a6XEX6CqGLJ96xmRmJkBB/wjaibjJouxwCapLomy0ZEqH0yCIPAqmgMGKOiCiSGFLFgPJuv56vVunKKNBz198bjyWSCNq481CwCsYJpYZyKBq2NQGPva2YlQEIV8Qb87ngwHsQJKQmDNvH0gR+CKAoIhAJUC17O8/mqKCpvCAex3R/1s8gYkBA8TcHSBib8CLUxoDW3TACJGiJAlcBYaznXTUTy1gGzCyRpklC6NSDUi01OFyoAEV1cnHtfDwb94Xi0NQ3ZWNEVAY01ZDJjQx5eW0grgXYnBEUsy3K1ysuyJqIsy8jQVhHWeu5AQKk9u4AqBpy4bviiesWI8VwpdP1sf1OZfO1U4mv/2VbnAABkTBzHxljnXFHWwtLgB6QBFLV7gQooAYoAGWOsbW31rZgrzdBnq/a+IGBkWya+9p/dCklIElbv8FRhmwrTjr40bYzmeKAogo0YgArqnUdQS8aSGaVkDibWRpPR/LMnJ9PFqih9VUvpMUmKLI0HvXjYT4AIjbU2Kmq3Lquzy8t7R/sHe5NvvHTbOf/w+GIxnydJGiaNRcF7LrXU0HYkohDRKiogiASq3gsRW2s79NEmFBYUpDHpIiKQAYXpuvrVw6dA8Oqd/Z1eFFsa99MYWap1lS81ytBE29CNsMvESbw/2Xv99W/u7YxXq1U1P99NdWDaGPoGdiAggKqRwSyODAKKZFlvb29nZ6dfe8eeCSyzrosqLyrvCs8+jqLd3d0kSbz35+fnz4syNhhXERE0NhDb/mR3L4pTxxq2B0SDwAQiql6AnV4uFtOz+aPTRcUYpf1vvvXWYDQ8PjudL1auZgkRDcGdi6rKBnxq4aXD/XGvR4FdBU0vE8gyaA1cAC6dmxf56TJ3XqyNs15/0B8Ya9dFvlqvFotlXXtmDejhOLJpYgf9dHd3x1qb11WeV6u8XOUliyIaFRAWYzGLIjJROZvHCOMs3Rn0DKKyShNKK17Ji9a1kGpibWSoAW423ccNtlREMfSKCZuExS16RGjwbYhfW5CVq/hvENF+v1+UtWdhYYDG042A1HBLwBjDouv1uq5rClteg9YPSRJb40xAX7JQNHiu59RbuDrP220Z29vH8/be5lahjUC9rTs8D6aAF0UYbb0VWxrxBvLdLWu4TVC9ub6G9p1rDPQv9Q7DxsOOAKaq9fT0/L0PPrv/8CSO7Buv3/3t33r76NZORCK+AvWIjJtZzOZEdz295SpouzU2YudsvjYa/6KcxSuMMNTn2zaiQM659Trv185GiRdwXsIcqgbBNxz6UJVQQA2h87JaV3leI5jmH2hInoYwK7o9x9Op288RMzZvrAIgRQzm6cnFex/df+/D+9PFyokxhJEREhYRFg0+F22zXxri2Vd+/uI4Dsrver0OYmh4Ac/D0LZhR229rVfSdVrOFYAK++l0uVgsw+fcwuwjNawGERFqU1i1TcwTVWYZDAY/+OEPfue3f/vundtxFHfp0E3NTy9eYJxzs9ns8vIyZNh2mKZGyhcRkSiKsix7+PDh2elZmednZ2e/fPfd4+Nja+13v/PdH/7gB9Pp9I//0x+fnp72s15kTF3XIRLgqiC7KZ+CwM0t5VlEHjx48ODB57du3RqPh977VmpvsnmuLq34RSrI1r2KW+2E7X+DL/yQLxVXXpxC0QrWX7hub630G6PD32SNR4C/0xrszfZ1IxDfXH8nu9RXHlF90VPbyH+K1Iq+QZ2RRptECaJbs6CLqhpAg4AqIgKICLw/yvKjyXQxP50uvcLFPP/04TFRZA7iYRyhARUn4oFob9QXwGVR1fW58zxbrHuxPRgNbT9BJOywsxstVbZQQk33G8kAGGgyQDdNv+2rHYa9WiW05RKCEnBCdDgZjrKoXnpB05w/iCAcoBrKQ1DbCBBQiVUXhYtm63Eax+NeErVpboiEcLC3l31+Oseqdm6ZF+uiRDIoHluRulH3dDtCbavHf7Xp3cl2jYgAre1ENInsZGe8MxouKl/6er5YTudzY1MbRVBrB6aAJls4QAkCYaEb1deqrJ1zgsosLRmLiAxSwFK3W2gnC2pnXwBRAFUyNJns3O7vPHp6PJ/PpS5FWLRpgGMHKAFRAAopGSplXU0XS1FgZkQqqprU2GzsFbkZzA0qfvPjoxB32Fj7BFQsSkqakNqm3d4YI0LB04ZNISJKB7dFREBmQWNAFYCCYbARiK0VJlbDxqzL4my+Op/Pi6pCMv1+72j/aDIaGmPXNdeirIEDR43/HgUhKDOxsZExETKSekOSReZwdzhMjWlz/wQgDKy1HQ4EMAy4LOqL+XyZl14kMWYyyEZpHKFSEKxagRuvPLgo2rh5DZG1xhq7SUFsBV8AaGKmYPPxDUK4HcbFJjarc00AtF2Z6XRaljkgjMaj0GRojH/NehFYEYqWmoO7tv2MLm4bQYGKslwsFyGhOM1SY8KwfatXwxZTou2gNB62q66NzjnSzYlvasQNLf3KsPHN9XXYzF5QZ+OV4xSAIZMkSZokrFzXThQMYmCjAtLmnNzisRE1NFa2GyaNyVe1dUHC9hznNa3nmtlEr0s8QBoAF8Cq0uItGu4thWYdSIgzC56hxnofgK7eBh6CqgUdpTa9tTseZCI+Ipqvq9pJXtSrsrK5TdfxYBXFcew0gG2ocnJxOb+YzW8dHN45OCjLer5cX87znDupDUXUe49QR3FMhGpIUUUbPm8IOPVMZAwhwjbXr1PpNoccRLKO+fPjc2sxSe2gd5AYkxrtRZTFJk2MQ+TWRB34N4iQpdnuZPzqy68cHh2tl4uHn33Mq+mbLx1mOxliyKBXVKAQ3wdgDaVpbAiApZemR4cHd+4e1t4xi6WkKOpHj5+uitJ5FpH+zuDll19O03S5XM7n83DC7I7owfNlbUSEqJLGZtBL9g8OkhSEKxClQK5s+mWoAF5xtlh98OD4489PwSaHt29/85uvHxzs750c33/w8Oz0vMgLAJCm0S2o3iKPsuTuwW4vMijSjvSgV1CKPUApsHZymddns1XBksRxvz8YDHrWUFEU04vpcr2uKodERBZAbWQG/d5wkPV7WWSjoihWeb5aF0XpvAhhUPMFRFEgIiIFEt9L7M6g10szAA/tDq6iXrj2KqKEGBkyBFs9F2ghRLhdmlBY3DsMWJOQ1M6VCABdzRndlk1VFSCO4yiKjDG8LZ3gRuQRVe/9YrGoqtIgkAkM0jCJ1IS8fdmZuf2K8iLf3/Zz2k1PXyPJbI//dya10JYEuY6e2PSEiF6sBV/tTLxgQF23HBxba55uWrt4YyL++ojDuMV0vyoQ65chbgkDbZ7p+PTyVx/cf//DB1709ddu//AH337l5UMi732JKIbas12TOYndQ/pVbEVXtau/2ib9XMgNKCgzV1VZlGU0zDyD89LEvECzLXZxIyJqCIWhqFyeVyEhW0WxsS59ScP4RTlgG2YusJpFwR98/PC9X3325PRSMFIVQ5T1bGJi5/x0mecsZGhDhkGErfVrUzO/CDQcHMFxHA+HQxFZr9edEtoxfLcl0dCbFBHnHAbYzlb5rQCsogyC6Go5Obt4dnzyzltlnKTAIo0DBClAtliqqgq0CmrWokbOHwz6r7/++o//ux/fu3NLRJiZiKy1v+7+xLquLy8vF4tFcEM/v6AFU1Fd1//hP/yH9959L1+tlvP5bD5Xlp3R+H/4R/8oTdN3f/HuT3/659YYa0zLhXhB+GeQm8NvOnU4QDPOz87Pz8/rqjJmEg6MRPTcUMW13+BX+Fv9Il34uoD7ZfvLl6zM+lVF56Z98TcSev6q8vbNdXPdCMR/vy9REAlKiuKVLmgLwWlH5oAIwSBZBAKvityAmKibyO1o7EbBNigEUfZhRj610d2D8Xx1UHk+n+eO4eRyRXTCjK/ePUxthCwkigqJgb1B9tqdo/WyPLmclZ7Ppqu98TKK7CAmREHRrTW3sRBukq4DAVFaEkW7OoYA7A3X6aoZ5Oo0UjuGJM4Q7A6zSS+brhaKAESNoBo2rea9ARWgkLpCBAB5pcrrYUzD1GZRRASiGiTkvZ1JP0usoapm58VxoGSS+BAa18wwb+V9b+licqWnKVsnG1SVNiyuC/ZJouj20eHpfJ1X1WyxPD67ODi6HSexcV66uDtqZTyFABZUUAFhZFVZrYu8qJKIQuKNChBScBETmUbH7JLHQSGEC3vP3IiAZO3Lr77yrW9//+NPPvv0k08e3r/PzJ69UAgP6sDLIZ6OFZUBvZey9k5AVGvv87ImiEw/c4rCYgwiUJAwW7C0kIYGv4Awoo9IMqMRMigzh0E1VlBtGB7NzCte6ZIoClgygaaACEgozEgkgEqxRy1Yz5fr4/PL6WJZ+BoRd3d3DvYPd3f22PE6LwoPHojVSAMzDUGAEn5c1tqsPwD2br3Syg1iezAZjEdpCkzsUaDNnRBEAKKQEw9gvdL55eV0tiwrBwDDJH75cH8QG1JG4FZm32ROBsIyiwQyMygYg1Fko4jas33j5wKBYLtvBwG63kmrDas0JuvusN/+tJWElNM0RtIojgAhIIa1ZcG2vg5ql5I2jLGhlzeE4RAQlBflfDbP85wI4thYaxHd1uvZQEDbmr6bIoRODt6Whp/zIHQn6vbB/zKa3s3132LDc8NG2irl25AxQkSyURRn6Xq9Eg3DIGEEE1RDzunmlhBQkjbNTESYIaAkwkIjXaiVbvMlui3mmjx07Q/bSj2ovmF2V1WgQ6uDhpy3YFVq0A0GAUFAvAiyeAAJBytlBXEg9SDrpZOe8q1xf3A2zy9m+Wy1WOb52rt1Vc3XJo0iBay9opKoXMzyh49Pk6g3yLK7R7dm83VdPVsUPnA0FAPsBj17cBAnibEGPAg0ZUMw+3jvyZg4iqH182M7tNM9q9AMvSIgzYr1p4+PjcHbe5O4n0TW7O2O71S1mGhV03ReaKsJkjFRkt576aVvvPrSaDQ8Pjn55KOPHj74tGdkd9zb2xlQINkLG0BE5EBstzbJUrIEtQBiFNvBYAgIRFYE/dnlOs+Xi6UAGhNNJpPReKwiIapua8AIrbU7OzuvvfZaFEUiquISi73Y9tPYYoVh4EMUKfw/I2iEjKfo0dOT9z95+Ox8UXr+7PGz+XzxT//H/+F3fvSjw6M7773/wa/ee99VFVrUxvhap5G9c7A7zlILEkCKAsAI69qVQDnQvORnl7OzxTKvql6/NxyNxoMBkubF4ux8sVismAXRqKCipFk8Gg52d0axtaB6enZR5EVeVa6JSzSdniugLFpXlStLC35vZ7Qz6hGK9zUoswgSqWhR+cW6EIE0RkONOBuwWaFLGAiJQcAgRGZlYVCBAHxoe3oUYpw6nlPnOA90EpHArAx3irQ9QKIr49IAwOKrorIuSjJ7fj4tyzyylCZJeEaEBQQClEuZr9EeBK5IDx2Xv+s7Nmb3LfvhtjZx7bnu/tk2PXkjc1973tt/9ILO5ZYqtCU3azdVrFv6UbeYvJA+cXN9TfXir8KaQBBFjAjMcl396Z/8/P6Ds9ls9e23X/nxj7/35jfvqc/F19TJtI27BVUJEZuJhs30GHzB3bWZpPlqO/LVD23xDNC2wcLmJ6JVXS+Wy2E2rB07rwH4L22OclPWYsOJAMSqdst1HvZxBeGwJgUqWvcYflkTuRFQg68FgfLC/fzdT//8Lz64XK7IZt4zqk8N3T2cfPPVu6D0Zz//8JMnF4YACUVQw/gP4sYYrfBFJWUg5y6XS0ScTCYHBwd1XQd67/MT9y1gl/r9PiLO53MRMUTSeCa6IwwCoiVjLMzmi/sPHpx9+1svv/xKXTtGAGIRadp3hN45z9ycbUNzGoBFXn/99d//vd+/e/duWeYG0UYhbtoQ0ZdoiYjonOsE4iiKrqG0wgYqwh999NGzZ8/OTs7A+2BhzrLs3r17P/rRj/7kT/7kT/7kTy7OLwa9Xr5eG2O2ndTXmnPQupI3vTREIrpz585r33htZzIREWa5lk631Vn7DT+Pv9nP8CWfUP/G6aN/60yJm+tGIL65/ls7ToMqyJa0u/Xnm7mj1saoQIgGCUOprMqC0iaqgiqwECioGCBUbLgBhKrC7BAxsuZwf1I6dXJyMc9VzXSRG3seJ9HBZNiLTAwK7JA1RtrpZ4e7O5ezRa2m8jpfV8N+maU9hLCX4xWsfEggal4+KWqwErf69pV5wC5EqIM/bq2hCABIpilFgI1iQni0O356meceBZrxfwANE4+NnxlVREiE0ACRqJReZuv6clX2YjRJyAATIsziuJcmkSEAVsXFMl8XdULetqbsUK51kmtj8dXtuZdW292e3Gr40dQ0N1WINLJ0+3Dvw88f0Rqrui6KKuTrCns0bTZeSIhRQmBt3TscpGgyzrvKOQTDKszSRHsF2Y+FmYOfDnXr7EIYYp2MsYgkAMu8mM/n33j1G3uT3d3RsC6WLMLhO5PWMk2EgAISKkKv6llVNev3S+cNQ4wJmpSBtBkF38yeEaiGQSlhUUFlAy4ljVFQnUodkuvCGBoCEJI2b+qmnkEgVEQiFg7SY5BugOhiOj+/XDowyxrmq/LkYjZdFqXzw+FoOOjv7OymWW+xWDJDzeDBMhhBo53yrNI4ZUWZBYGStG+cUy4HCe4NsgTVCCMIQIOFRiIJ07hIqsgeVnU9Wxa1F1awRPuj0f6wT6ooLOCDETJ0F9rnmEShrHztONw7xlAcmTiyFM6dXZSjAgBaMm30XDP01xiNN37bIAg090iAgSsrE+/u74lqFFnPjITY+pygC5iizk4VhF5pH9nuKEIKWFXlarWqq9KaOI4jCsldSs2wWDjUNA85NYARveL+gquzwNsH+2uH8JvF/+suE2/m+LaKYyWDSRL3+oPLy+nlxaX3PkoICZW3bPGgio2hXkEMWRvHxhjvPWFLpLiKj7h2ht/+w2ujo8+nizRblACSMYYUWFRYRduscsUQZKdCxAgkKsLqQUGtjY2xRBiQk8oCXBu0MckgNar9LE6HvWi+TteOC1H2zM6pKCkaQECqnD47m6s8GvYzMmQoGvQH63rJgdPUukjDkdV7R2oQ0FrjVTvfUGDUsOFAC8ZrTky8gkYSACJbOD65mH7y8MlbL98ZZsl4ONjL67z0PHdLBMdMNkqydP/ocP/w1u5kIiIPPn/48OHnFxcXJo7jNDqeLibj/uG4n9rEoPfeAxAiIaGJIU5Tay1ZXxSrJ4+flEUOhICWRRfz1Ww2E1VjjbW0Wi4//eQT730Xxd5ZREej0b17927duuWcK8tyvaxWRbEWt2vHWaKIHIjMrKpoFBMPlDv5/OTk4/tPpquyVhAkFj4+Pv6zP/uzt9/51nA8eevNN4vV6smjR0Wdh+DWCGWURXcOdw2RMoe+YsU8K/KLVTHL3WyZXy7W08XKMffSbGcw6qeZNVhVxXQ6X+UuKPmBThTHdjjsDYY9NFRUVZkXi/nKs/gArEAEoIbwREZRvSpUJdfl7iDdHff7acziQXxIfiUAFiwqt1yvyGhso8gQqDB7YcFmThkJqd1QgVk4sJ3bqSdp8gFVVIUFtnJKgzp8bU0OJ38Qbp60raZeMNOVVVEUxc7ODrPm60KF+/1oOBw2XUs0Ciiiii/CRCK8aC9os2iJmrTKq37h7kOutSGvTVVfWQeCELaNm0SE9tN2n6fbGbfXh636G7Z3tGtozpu97Ou8i4k285dXf+i/5kgHaEx0djb/4MMHH35yXBTV3v7knW+9cefuIUBNWCGxKkkbQNw07YBUEZSaJjpe20yvzbfri+oo3IwP4BdrxApbbpJmnAtJKSwULGVZxbXzwl7YMzfHC92kAjT9JFBVrb0vi9I7jtAoKggIqKgifVFhcE0mlmCTCD0uz/7Dj+7/4t0Pp/PcMYKKY2+AkyR747V7v/X2ayJQOHl6tqi9N9YYIi+iots5519uOBAR71ye50mSBI342bNnzrnOEts916HtWtd1lmVJkkRRVFe1sMCG9RY4g4xqWBTIsHNPnz67f//Brdt3JLDyWnhWs/y0hp6AhiMAYSbE0Wi0s7PTOThClogxFHLVvsi6qqp5np+enoaZmw4QvL0Mhqrp/PxcRUbDITu3vfp98MEHP/3zn56enhoiz6ygX9QL2YZDdktu+Dd1XQcvMzNbm4Uu77W19L+SPPplku6vW5Zf+LFf8qTrb+7V3mwZN9eNQHxzfbVFA5o6NRDb8HpZ0OhN3GQ7E4USV1VRGZEFEA2F4R4Wr4yqSBisI0rEgAJENqTtmL3JxEa9OMne//jBOi9X7Cp2XnlZTO4dTCapMYBG2KLuZPG9w735Mn9yduGYz+YrY2DQj4YxbgTTjcG5+XYUCQioSQfHxqEFKMzdQb0t37dMhNAV8Y3+iQACYpAJxQi/crT/yaOzmrlSATRNMxspiGwBfIwqTfNSUMl4wIt1nVwurdVor5dGllRBOTZmMhj003RW+MrJ05Pz5fplStUaAAAONl5saFPQTQF1S7w20VpXRIerOwsAICopR8bcu3O4Nx6cL5aV96uyKmvHrKABndj4hlvjKG74YwoKwsx55VZ5CVkSJxmZUhr6kxBSZKMsSTCysYkiJIsUJUmcxJPx+OU7uy8dDCeDzJpIwHzy5OlPf/azu7fu3L1z93d/90fiCqOOjFFlbYIXwncd4tBMXtTLvKy8CJpe1l+sq2gQJdmOxj0vCIgGqSFvoQnmPmUvPsiB3qpPjR9ayoit1KAOVABIGnR1I7oHeVlAEYTaSAcVRkANM0qEXuT0cvbg4VMP1qM9XxaX89XlfOFZB4Phndt3elmmQFXNeekcg4ARQqWAHu5IG8G83mARCDGxcZKlka2PejDpRZEyilflJh0QmhkqJINkneI8r06n8/P5uqy9tWZ30Hv5cG8YkfgSkAEEAVCNIaNBOyUAwrqW2SIvagG0hJAldthPstQiCmoDbw5ME2p8lN3EYeicSKvshKq7Y64qSpesgaraGwyssd7XdV1xXccZRLFBEEQGYxAk3G+B2tGFL2DThhIMHknVqijX65VzVZKkaZIgEhnCLhy5fdIDjm1Dm+iIsC3OAza5Ui+2bd5USH+fZOLmjBO6mkiUZf29vb3PPv305Pi0quosSZsFPzx8W3xUgKBmmshEzeEKNv1IgCvOx/aL4pWZii+969pniNAYERAkRvRChavnq9wxozGRNYbIgFpCJlI1hIZagkscp2FTIAQwYVEEQDHKEfAwMcMs3uvZyo8KltxLXvn1uqiKwgmXzLnXmvV0lq9ybxGi2JC1gmQjiywiyBqmjEJnUOu6NsYYY8kEjKE0g7EIzIzOGWOaHiOpQdzG4oOCBHAOEKL1rCfT9U/f/xSB3nrlbppmuzvDvKrzaj7spxXDeG//8Pato1t3jImePTs+PT05Pz9Z58ter3fr9utZZI4fPag/evD6vdv39ieJsYCohAroAB0JJVnS62PliqI8PT2dzRdAhlU9i6trEYkiS8aQMav1erlcbvuSwvE1y7I7d+7cu3cvSZLZbHZ8fHx+dip1Eal/be87HBGH5EwTCaATXBdwsVg+Pb/88P7DaV4WDj0QWoqjqKrcB+9/eHJy/ubb79y9e++HP/ydo6PDv/zFz4p8Lc5Nxr1Xjw5u7e54ZQIQgWVVni6X5+v13Mnp+XyxKoqiFq/9QX88Hg+GPSJ1ZT2dTafzpRdr0RrEyNokjnb2RtkgI0Or9TpfF8W6ZKeApGYTPQVIwWkXCCHIVYT+paP9g3GWxaDiw6A2igCYmnVV+3lRooVhL80iS6DMXhiJQbRr9QE+f6+30YHQOWoFtmc5umfm+ceXJbjoWFuCFSooS1kUebGu60phzM6fn53WrhqPhoPBkJono7EDY7O1XDlfY/tsKjxvbmz+KPjinwdEbE+lbFMjOgmjk33bnvP1dhHgRn3e+gzdV7ny5jWBsdLQ1JoXH1jqQA1MbJsYKzfzMF+n/SuInU19v5GMwkAJIoAJpR4AKTARIDHZ/mxe/uznn/zlX340mxcv39757e+/+d1vvTrsW+C1okMKWmvLlNDOKBO2wCZ0UsFA+3C3vop29Kz5N6QbRXQzQY/bXp3tY0vXD0XoRge3j16AxKL5uqTFWkQAQVRYHCCJioSQdITYWEOGxSmA87wq6soj2QgRg2FWVKgdE2xHxLY6ME2SNgECqVATex6XDj59ePqT//KLjz8/9UpKKOxEYTTpv/Odt994+62kn5ydXqRJOh4NLqdzQ9ZEkdTOsQNSQFZsrcRtgE/79TaQQ1b1Iuv1OgTWDQaDwWCwWq1Cq/Vad5mZ8zwnojiOQ7RdmRfWGgk9ucBnBkBUZiY0SObxs2e/eP+919588+DgEESiOI2TNJwLhIXaYqjtcwMAkDGjnfHuwV6SplVVNrH1ZMKPoxmQbe639qwGgGjLqn785Onp6TmzGhO9yFCORMZ7Ob+4tMYoB85eIyLPZrN/9a/+1dOnT6uqImMkkPhAO+pj0+ztFkxmUe2ozYHwY4zZ29tbLpf/9t/+26JY/+h3f7S3t3etc/Y8/P2vp67+TT781371tlGKX1Qu4nY19ZvWtf+GB6K/nhr+a//9zTHtRiC+uf525eGwBocJl6vt4HZT73ZxIgyhso3LsQUZhWRVaIb1UQEcgIT5dQFWFDRkbNjUrIlHg+gltOtV/uDJk1VVl3V1NpuJOoNq98d9a4gIAQzIqJfePdqfLpd5WRZFNVvibNVPxlka3I5tdbFBDDejM4hwveH9go7c1bK91Z6gcSc3hklBBFQZJNlOL1nVeekcqFFAbFLetDsaBaAuNzwsJIKKeZaXF0uaDGJj4gRRFQh02O9lSYyAnnW2WFe118S0MYEdqU82OoTqFRccXKdYbhrYjfcTFEhBUHGQJXuTcXx8XnmunF+uCw3jZB1fqUk6CaViM80I7QRZVTuv2h8M33jjTZs8vry86GVpP8uyNFXEPeG4l/WyXmqiyNo4TZIs2R1NDnaycQo9i8ZEaOJn8+X9+5+fnZzPZ/Nvv/PW/mTUTykx4Mq1b6rghlgQvvd1Xi/XpWMBsqKgJsFkQOlAMGpDxrFDZBAAq2xmP5VJXUbSizBCDliJzqrUIoi146KIKjWxdU0CBDa8Uay9v5jNHz47W1VMcbwsiovZbLHKK1emSW93MullAwQsqtp5YTBM4KT12quGhOAt8G37ZquQ+tjCIErGPbCgFBgOol1msyojEqARNLnzF6v8YrHOKwcAgyzdG49G/USlDmHt2Pjl2yMkoRICYuXcal16ViQC5DS2vTRJ4ijcQdj46zHIYBxC6gA3VXXnAm7eWdnEZ4F2xoIQRdd8HAuzhzgI0OGOEkAC9W2NENAdiirY0KJb2oSq9947LyLGQBRZpAaNvfEgNijpZrqMto7r2+f9F+XL3xQbf393uS2FSBGb45aIrvPCewZ4Ea60vf07KUi7afTtHWSLTNqpO439UfT54rjzB23u0m6kl0gAC+dXZb3I84vZsvQeyESRjayxhImlYQ8GGYGhnrExGjKEaK60dVsIkgKAMogQaGohsXEPcaRQei37WVnktXNr55alO1+XRaVF7UEFKzCRCbiABjyl4TtSEQmrFAPDFtRlc85XYeaNZ+f6rC12ZJiG/ETWM5zPigdPzyej0e39SRzHwyztpwVD7CjaOzra3d9j5fPTi88++3Q+n3tfD4ejvb3dyWR3vVrmTheLGSi52o/6aWKtArFozVw4XpeVSeIoScQ7UXBeBMGxZxZVsYasMUhNju61HPnwXaRpOplM0jQ9Ozt7/Pjx8fHJYj6NQDJLaCwY8iqAJGJqlfmyODtbHp/Pjs+ms/nKJCmhWIPGRnESkyrX1fGzEwVT1/6b33z9tddfWyxnjx7cr5a81x8c7owTS+yZEYraXazys8V6XrtZ5S5XeVU6AM3SeDwcDHopIVZVnefr1apgpXDDWWMGvayXJcN+DwzlVbVa51XpnDRDPY182CB6NmNVqBwZmGTZ3ihLLZB6VQUwzSQImqqWonY1syqE4afWGIsd0L852gZmC+F2aOyVoB7o7LnaUhW/MAter7ZeGsBRcCgztwFtulqthSXrZf1+D1Sd90gEtvlbuGIguFYS6rXjqLSqyTYxZlvzvVJD6hWc6pecga/pyHiVtgxXbHf43MvcWpFwQ3nGq52q9vc3xKSv1c4VoqO7/8NmpxIADkA7AFIkbCjoTAar2j16ev7xJ0+ns/LerZ1vv/3Kt964O8wIuVDlluyCm0NTqFIbP6piSBpXBOwc7AHG1gVJ4lYcygZhjM2rVQB+LsvmCuC10YgVN8OfAgpKFDZTFQVrImssoCo4UCMtYAKBEhMbQ3XtPKioOg+slpUJBJDbKhD1SmCGNGgXBUAjiA3LD9SgAKBTnK7Kdz95+uDZrHKMVlWRRdGYNMuy3vBsunr48OmzJ8eLVRlbypJYgJTDe0INajHYQAJsZ/ux3aolBDAMUhRFMZ1OVTXLMlUtiqKqqm4ooVuRvPfr9RoAsixTUVc7aDiEoZu9rSkqEq6K4tHT4wePHh/duYeqXqSqnPccZkuvrFTtVicIShiSeEWUKID/Qz7eFvk23HzdmklU1246nTXh39AFvFxfzJmlqmpHBCKWyLbzu6vVqouEbT9nG3+zlSzfHEBEOphhZ1VW1TiOf/SjH6nCw4ef/+QnPyFDv/d7v7ezsxN8TH9zYfevp2/+NTTiRkLB5x+ZL9oafsNC0M0B6ea6EYhvrueWJSRsEEi66XpeESOD8kSAigYDhFF0S4vVpkcqYMK4Zc1QMteenfOeRcAoEpFJ4rifsrVmMuq/881Xa18+Oj1fFtVyXbi68lVNqrcm490sJhUV7iXx3cO9Z+fncuGLMl+u9fRiPsziuJcg+0YjDkeddvQd2sklvFLCN8e/rvQP7dkuF3tLR4Amgx2bgFdSJiILfLg7mlduURcsEWCESKI+xJE3B4Bg6ZD2wK5YCy5Kd7rIJ4PMkrWJNQQWYdTv9dIkuLbXRVk6BkoAVYU3b3/X2g8tVdXnTgRdk22rQ6+N50AgJM5BZvHWwW52//Gqqkvnp/NFEqVh5L9JkWk+m1zVmFWRCKGunImSu6+88uNXXvvlex988Kv3dgeD/Z1xkqUVi0mT3qDf7w2yOLXGgEFAAAbyueUVi1NlZZev88vp9PLy8vTsbDa7/Pbbb377rdf2dyelpQLAg2PPgMGwpKA4WxXTxaryXk1UOe6N95LRLiX9Wk1wwzZZFUBNmLCwhFlUEVRP6jMDKalRhyrdNBu1xXUXiyEEEHDVm6TCYAaA2vnz2fTD+5/Nl/Vk73Ze19P5cjqb1t6jofF4MNnZEYayqovaKxkhq5bYSztXGkRehE11jwhoVEk9Sdm3upPG/VgMOwIJzXMFJUIN/GwygrYWulhXJ9PFIi+d52GaHY3Ht/d2YqvCdSidCLB1KjGgUcSQ/1M4Xqyr0FwghF6aDHtZGhmQWoODWFHDYV+0qmq4Eli5icKAJkFQQUQ7gmTzV9hQykRQlYiI0RIhMygpOCAFYmhQph37ToA9eA/MKhyaU6rgHdcVq0IUkY0jtBYa2XrroN1g80I0FBEZCNPEV9Xh7ZG0F87hIl4NfLy5vl5XtzBu+QLDCROiKOplmQJUVemcAwUi8t1+h1dL8iD4GgyMhdZrrN1Z5WrHEUCETBi4bzTiLoLmmpm9wVQoMAAAK5EHuFytTy5mF4v1Iq9rVg9KCERoCVNrdkb9nVF/32W7g2zcj1IbqzawFVVgQCUDaBQMURitcMwewCiwsWSsia0ZppkOY+dczTKvKjidH1+uRYTIKGLlRdV3HGdCgw0EHARABEQBmAEguIgBgIVDV1Ia4Q4AEVkadn67BLYBrIogGFqYlFTiPz+5HA6yfpYO0mTU640Hpe1bjQdRL1ssl0+fPj1+drxYLK2NJjs7r7x0r9/v5UX55MlxUUm+9mVxfH4x3R33R4OBUlTVztVV7X3BwABZL2MfCUvwQYeJbSJDBhGBkNogetiW8MIrTpJk0O+LyMcff/z48eOyLEHFRhYpYrAlY8nIDIX3i9Xq2cnZ40dPl6vCeZjsDm2cVuczE8UmiskaqZ21kTh+9vRkucwR9VvvvPXb3/8eVtXCmFvj8e6gR6A1aOXlZLk+n68v87oUvZiuVqvKGuolyXg4HAz7NqJ1USxXq9UqLysJ1jlrTS/LJuNBkkQGoCyr5WKdF16EEAlIwYTuKAUzYJjbQFBEsQSjNHnpaDxKrVWHHHQfAwiIKmDWZblYl44V1fTTzFBoISugCSaAcHgnatQsQ0balAYQFer02HYwWlVEKMwMQRNvfK13Eqqv7T1o00VutaVACyuKChGHg+FgOKydy9crSIdRFANAqPUQngt7g9bUjNdzkIJfOTw+eLUBiVuD682Y9ouE4CvdSLy6mjyXXiWq9CLvQuMRuIoS+yKJ4eZs/7XeyLZumK2qBVXCdEeYu0MwDII2evLo7L0P7j95ctnrZb/3w2++89Zrd25NRApUlga+sHH7dqMuoULeOvZdcQk0nVBpLPFtmB3qJiARu/tbQa5b81G2pzy3vUgBUS+qoKxoFTCKk53x7qA/jKIofKx2WSyACmjIWkSPGErXEHgtQBCcFkEHVoJOa9wy3bQR5KIE0oR9iCFbO//05PLnH3x+sXIUIIqoomARVPXh508+/uCT2cVlmee9NB71h+PB0WyxPpsuWQSpzVJ5YQiZ6hbJDRDBGCOqIjKfz6uqunv3bpIkiFiW5bXFIVxVVVlrh8Nhf9B37PP1OmjM0Gi+LSgEFRGq2j09Pvn5L979zm99DwBOT8/u378/m84sojHUsADxakoza1EUy/VqXeRlWRkiQAJEG8VE1EUyIFzHZzCzc05EMfhs8LqI2VXg7JQAImu6pHhuJ3phO4+uia1upOAuJbs5s29LyYjBPjyZTP7nP/iDXq/3v/2v/+sv3v3L1Xq1t7f7wx/+zm9EF77+8v4GH/5CERaf3x30hW2Vm1C5m+tGIL65/rYUYuqoC9fK6A3zqakIiBBJgSSQQRENYWfmFERGsyqrWV6czVarvKqquqwdKzJDHCXDfra7Mxj1k0GaDIeDN994DSL7+PhsvlzXTs5mK8LjoqzNnaNRlhAKqfYzc/dwtyqKPF/Wtc5X5brSYc8CCoajRzN+JY0oChpC65pst1bxDtlZQQsI5/wurbW1T3dD7N3wOmqQxQkJ/OFkdLbMz9bF2juMLZJVloAgDhhmQRJSBWqcNwqCVHtcFnw+LxOKEmMHCZKhwSBtjJwIAgbIIhkAVhBA0k1l08z5AwNSk+6ibS8XaNuYBt030dq3QqC3GJKdYT8ygADMUhQloRFp4t43hiJFVW7kwiaeSAAgL6sojg9v3fre97+3t394dHSYoGZxFCWxEDnQ0rmqKFerFbMvqiIvivVsKfWyZzklRUUn+KtP7iOgoimq+v2PPprOplW5/n/+43/QS3sWqDBlXTsbG2NouVoK2fmqmK3WqghAXjDuDW02QJOKR1TEUFACYaOqemxOe6CgBnyCvmfQomroIoSBNlaBBgnSJt5oW3a3PjkgRPQCGkXPTp4+ePz42enFwdHLYOKT0+PLxdz52lga7+wcHh0p4HpdekbFWIFY0XlVNBsXtrYmdzRATUobSk2+TLEaRHYYI4EjlBBRhQa1uQlA0QDFNeOsrI4vFvNV6b1ECLf3dw53BqPEApeIKsqtdQABkdmDUUOxEnnF0vGqdmosAiTW7o4Gk/GAUL1n047cYUNIkdrV10LbUBFQsP3DUCgqhz8Jf4ttZDsioCGbxhgZY0N73zsuK1VEYxANEIVwpOADQ62RGZRJhcLPEdXVvihUhNI0TtOYjPGMomBauo0hwuCXAQIgY+xWIhAEpThEPG2LcdtBlNu/wa8SRXxz/Te6sXXjuOEI3RhoFECNMWmvZ63J83VRlBwMKY3Bp43LbNYXAAA0ZKw11ihAGAVtsYMIbXxid6qGK0mnsJ14tq0Ut4SUxpgfmMC16OVieXI5n64rp8YreQ4MByAAxGq6KnuXi+lkcHt/8gpEhlKLACSAoGgUQVAUDKGNkjROaue9AjoOu4In9gAISobQWk0iTNM+UuydXE6XCkA2ArIs3tfMwoRkrAn93yZkjiWk56gKRRgEYmjZSgrgvYMAciUFBEOm3U67tyukyoICgCHAaJFXn37+9Giy8+qtw36/N+it85XLi9Xj07OL6Xw2nXrnkzjZGQ9f+8are7s7Zyenn3z62Wy5UkWySVnlxxfz6XwRRZaihJnZOxYRY8FENo7D5KZ3viH1mk1AGCiH4RlsgUCB0cHMWZYlcczMi8Xi9OysDlFCgIJQKz89PT8jrvK8qvxyXV0uprPpwld+OIhv3x7fe/nlx89OU4smS9XY2nsBNUjWIICu1vn773+Qr5f/8Pd/71tvvjkfD3eIsyhW4ZL5ZL56Ol+uKpczXC5Wi0WhqkkUDQeD3cmOEpSunC3n67ysawaMGQhRBqPeuN/LEgsqZVnPlkVRe5bmqK8gcWSjKK7ryjkR9qRKiCRiUAepubM/PhwPyBUm4LvICBphRVSntFgWy1WuiMNBb9zPaKutrA0+KajJ2HkCsZ1NA8SwO7chuyLs1WDrPWhDS9sHpFnPA9CMKPxPurzeICYLoIIxNst6AraqmAj7/V4Sx+x97VxsHQsHJmnQGK65+OEqnktbzaKBF1GAel9pNYWw2cYsL7rVxu+qRtxmCofPv2kgITz/t9uIzG1lubP4XQmt25qb1o2PQ583Jt9cX79mp4g0oPnQ+Ay0APSKAmgVxSsZk65L+dnPP/ro4ydxYr7x0u4Pf+d7vSQCFZXAzubmYbsyeKmA0s3VQRch8UKcbjCuihBK8JMqXLsTQ214bSIHu18JCDQstyKoCuBYWALk0KOND4+O3n7nW3/857+wUawKZAwzAAjCVtwMIpBBJFRV8SrekJL3wJ6AACyCQSUIADlo5hsQFVUAhEBEiAUAWJWjyBZlfXE5vZxOkYg0IASVUMDL/Gy6eHbWj6MI8WDQf+nu0Rtvvn50+94vf/Xp//mT/7Kezq0xYNF7pchQkwKyNfWwNQXQqbkm0OtF6rouyzJJkizL0jQNIN3tzLrwXJdluVwue73ecDCoytJ73w25Xn3qkYzJ8/UHv/rVH//n/+yc++CD9z/++JOTk1Nj7ZZf6sriRkQBJdzLenVRgupQhUUMURRFCCgigRyFeMVS0U5XNKkDLx4HEQZEY21kbJg8Ye/hiwACbUrJxnu2xR3uUh+stVEUFUUxGAzeeuutN954Y7KzQ//L/0IG//RP/+Tf/bv/6/Dw6JVXXgm11pVq/69ZQ27E7q2fy/X234s+/MtkZRHtRke+gEd8tdHwnDv7C7Xmm+vmuhGIb67fSO2BrSTaiCy46Si3y067zokQEpJBIBRt8t+lSVoWpMLx5XL12bNn0/l6tiprJ+zVsyAZIktYnM2mz06xl9heGu3tT/aPbn/j1VcGw/En9x9OpwsHdDxdrwtf1e7u/uTO3oRUIgN3j/aqslgWy6p2y7U7n5Wj/qBnrEFVEAJEQhE2rb0kuHrbrLZmnL45vWA75Lu9JXWdvcBhDV3pRoYiCUncwDu9+PbuaFXVn53MSRPVsGsqiEdQ4TDwY8A0KTAIgGhBoajkbO4slUmSxFGUEqRxPOz3kjjKvYrKk+PTYXIQDy2CadRKUADGYNxuDJobwh0ASCjqAhMaMMjdoaXcsYoCmRfRj3rJzmgwy6tVxUVZEpk4TgPOKYSwGVAyoAIiHDZkaDu2JraOuSir2rl+Pxv00tXssljOl6vVfL26WCxm+XoxW6xmy7IsqrpkERTYGyffuL17uLNjjGXGuiitjZwie19UbjabPX3y5OTkdJjF/V42Go/R2l6/n2a9i4uLZ+eX01W5WJUioKK9fj/OhkiJVwRVE+qGRkZXBEFlER/KFVCJ1PUiHmWJAddp/tj6/hgbwhp04NsmZIdAybGokk3SR0+f/erTT6fL1c7BLTDJ4yfPzi8vKlclabKzs3P7zj0Bu1pXnk2b9mScKoM0Zu5AKsFA6FUACcZeBSH1EVa7GY4TjoCRHQGpcJjlamvfSChZOzxb5meL5XSxVgVgvnMwubs37ifGSI3oNdxvAfkWvopRAY9qEWxR+bPFelk5RBJX7x3u3jk63BuNpCrJBBRkOGQoNiYOaXDD3YAcaQuFCCaxbqS+pc4oqqh4NBRBEKkQEalercRzkVfr5booqrKqZrM5EmW9fpL2sqy3uzsZDjMQp8whyQIAJK/OT8/zoiSyvV6aJYmKYjvjRo3tJCRDEqLBFk/GLN5LQ0aXbhbtqgrw/PF7U8Td7AJfr/2s8+o0/qTtEQsUEDIw6KW9LFksV5fz2a1bu1kcIdaiAspNaw5B1CAqolhEshTu0qbH0E6oYFPj43ZqnWfphgi2Doe4WZsD+xyw820F0asSWRTlqnJeFJGzGAXUe3VOmEEEnee8dsuiOpvls0X5ytHuS4e7g8RCBKpeFBQtIAFRUDNVmYw1zTbfWTWhc+1HxtzbG1mDH2t9MS+893HSi7Neb3/i6jLP10VZehYEQ9YaYwmVEEW8CntXgcbGWIhiAQPsNfSrujwxbTMBdHOoarzDzd4sSKiKF/P1ux89YIZXX7ozGu88OftsOl+fXS6XuWOlNO3fu/fSKy/fi+P484ePnj59tsoLMkaFx4N0dDiMUep86Z0TIkRjbE/Jzp2broqiLDAw01kEyFhrwv8MWcTIWiJUBBWoa1dVdTgFOu+PBoODySRGXK7Xnp0QgGKMBCCVr/78l+8Re6m8eGXPoLK707/75q29g8loZ5A7f/GreZRGJrK1AAsjqYKSYkTGKMxni3eX70Wk333j9YPXXpZi4biu2T+9nJ/Ol8uKV0V9OV8ul2tVGfR7O+PxsN9Ha+u6uJwt1qvcO0FFRG8xGu8Md8ej1EYiWlduOl/lNQtSyKM1xqRRkqUJojB7530Ty8QcAe/246Od/q1RmqhXEQYiQlXwwACgRLPKn6/LVVFHiHuDdDxIUetAEkb0jWUeyWBnIAsj4529QBA0EMewKcwo3KJATQ5CSKhqB30achAgahi1JmLvUQTFa2iKqlcEE0UKpqhc7cVYOxwOd8e7+eqSRTxICLltVOtrEyR0bdQahFk4tG2ITJh02cIAY5Ne10GccDNoJRvtq8VnbGsKuC2sUVuNbm1A2Lb9VTdh0QodVulLsoxaY+V27NdNv/PrtZu1JVm4hzGQYFEBhBAFiIEcoChGCnHN5s9/9tEvPzpdL4sffO+bP/7Rb40GPeWKfUXIiEQN4qBzEGs7/hlG+GXT9nhOp2r4ExqEYZL2Wdf2EVAIvHoAtQDmOTvtBpWNYeglQPoQjTWo6AG9iIrkVeU9ZL1emqaht6fbMrMCtxgEVRAB9qzsrBKAgLI0jCVAEGxRNojB36CIStCxl1GBRIQF1kW1WBVVLYBWmhwCVlFxUrtqnNGrt/ZfvXvn9VfuHh6N+4METDL+4dsq7k/+4r0HxxfAZGIT8Bamo5xfFe6adYKadlRLcNKTk5PJZLKzs5MkyenpaVEUcBWSFo6ZVVXFcZxl2XA4XK1WzrnnVEtUAGOIVY9Pjv/Fv/gX4bTrnEMKn4dUReAKSzIQLT744IPVajUejw2QQRyORsaai4sL5x0iBgYgbiOmN1pwY6vRaz/lrZWKwogyhcnjcC6mF9/rTS0UyhekthXXnHmZFcAYQ0R1XSdJ8r3vfe8P/uAPhoNBUZRvvPHGP/tn/yyOo3ffffcP//Bf/fN//s/TNIXrUx36lb24m3Djv14Q6Bd81DWHNTaxTi/4qyvB2iEr6qvL2TfXzXUjEN9cv5kapF1cqJnqgyuIiRZN3zCGKfzLUBtjgyZFimrPp9Pp4/OLRyfnReWqSpiVWUXAGEH0Qdv0XvIKo8KsHBdsBr1+L81uHRwK43y19oyrip+dL7xnEN2fDHuW4siMRoNB1qvqRe1kvizn6yoaJoimOXirInXIuSt5H1snUwAMh2a4xlu+Qi9tsrMYlEAxZP+oqEGxRifD9FY1Ol/kK+9VEYwhbAC6BEYBBQgJ2/M4GCQAy8qrimeFG67rYUrWIEW21++lcbyuCjTm+PT83v7wYDgmZGEJ6IdQAknLJVLUYCPrZE1EIEOija1FpXG5EGGbGR50Zu5l8e2jg7NFsSjmKr6qK2MskEXEMBgsqACkItCmFhAiIMRpMr61f3T7bpRm0/ni/OTk/Q/ed+sVKk8vpycXF8eXlyV7V3muHXvv2YcR7XFvp3E/iyBa6vAdRKrEClXtyrIidsKc9rJekqT9Qb/XdwxPLpd5zbVXVfBee4Nx1h+jiUTEtIfQZsK1UShD4aGobJQz0kFMvUhRAn0YsSWsKZFAg4Hutl1pQKCohAiGyM5X60/vf55XPukNojibz+fT+YVzlbV2Z2cyHk8Ao6JwNYOiETQBLRLS5xoaQ+O7VwRBDCnMIUeO0Zf9GAYxJMDITlW4gZKgKkrj3oorwbNVcbFYr9YVeyaVnVHvaG80SDAmNSANlKs7L2jLkQMkQVfLal3N10XFokiGYDzsD3pJbIxnBVGkwOlQat8bYWnBlNeTewKaMfQcGiRHaLhgc3gBL4ABTCLi/fLicnY5XS6Wy/mqLKuqqi+nM1GJkzTN+qPxDr72ai++BajCrMYoInip83J6OSvLOk3T3ckkTZIwBUChoNzS2TQ0PyQYpwURQrhzUIe7WrbjS8BVl9bN9fXe0NqZ0tBIawbDW80lmG7UWrTWVHWVF2XtJIkigBD6wq25ihgIVQxKOCuQNUoQeBCd4XRziJfWFIygG7MLQucVDr2I5rxDW+1LBVVCZRBEZAHn2XmfxvHueNDLIud8XtR54YvCVd55L2vW2hXKF0VReua9UW/Yj7LUWhOFng4BWCITnM4hbawFl0qYKVVDgCoA6BMDt/fHVXXo/fFsXat3mNheL+3vjZX9crFYLJerdVl6DpwpMIhkVDBAfYKjzRijEJY+bo9HoIqi0mAFFaiN7JJGdQNs0ozIA51eLpL4GRl7uD8Z9LKzyxmJNwRJOtg/OLhz94619vz87OT0tChLMBR6frGF3VH/YDwweljXNQsoUOVlXpTL+VwRHXtlxcAVQvaK/f7OznAUEaHKcNDr9/tlXT598pQDjZoaKkYSRZGhuirWqwX7GtRjQDKAqHov3oCmkU2yqJ+mw36yvz/ZOdxLB5kgfPj+hxVrlPYVjLJXCdynNgEPgADZu8cPH9wa93q39uMsWS6r8/n6bLbIa17l5XyV5+tCVeIoGu+MsyxDa6raLRbrYl36MKtiMI7i4aA/GgwSY73zRV5VlctLz4isSpZsFCVJHEVWmau69t6jqiG0rBZlt5ccjbLdXmzFccgPhVD2SFjrGcy6dLnzitCL7bifWQpolNBW5NB4xY2OGrIgNcSSQpiIoYYd1ZL+SRTbG7PljuCVhkoX6hr2Iy+MimQMIitryI8zSqJYOee9IqJBk0RxAeS9D9VAM2j1oqP7dr8wVBCqSlskFN0a7A+yWDNvtRX60HRLSTe8ZbhaVV4RBrDV37BTQwCuNCyvfEhwvXW60ot3Ln2Rnnhzfe0ubO4thHAfIilhKK+BA8AekE5Opr9870G+LI72R++88fK9OwfKFYgLNVL4tQEAtx7i4K0RFWgiI6QV/RAQ2yczLFqh9iZEUiJtXSjaBHmoiBNlUEA0BEav4rBbU442n7Y51qAACKAQKZCCjeI0yfpABECKKNpI2rQlMDMLIouIggoos6gIKKmwCgNhMFZrN3bQuoihi8gEEARBAlBCkhDGCWoMOJawsiFqZHHUH7x0tHvvaPe1O4e3did7O/0kQcKaRQZx/P23vxFFZvDLTz74/Cl7RmPCgG2DwWka1NqucohbPtDt/OTVamWtHY1Gk8kkaMHb4mD4vXMuaMdZlgU+g/f+mjG2acoCsPBytQxg+maVa7Yfoq1pCQAwxiDibDZzziVxgqLWmiiKALGqqqqsOs5IsBx1rYXWwdws9w2scjt4oLnZmnE/EVbfMpsJwnAJNecNhYCga37AqiRKIdZ+w+YC3Gr3A3zzm9/88Y9//PbbbzOz994YfPXVV370ox89+PzBe++998EHH7zzzju9Xs97bukssNUXeeG20Ky7LRFwW7je+pa2b2l9rpFy5T9/LUdYt+wM+kJAR9fURKVfqxFf+QRfxeS8fcr7a5+NvuLH4l/lM+AX/pxurhuB+Ob6/2eLOvB5m8hx1avrFG7BnwAIwSAhbJlFABSQQRdF+fj0/NHp2dl8pUrgoZlvDK0v9YEm5b0qADguZV3z2c6o2hkMe1l/OKzzmmsvNct0VTELqRpLREOiaNDvD4eDeV6UlSzycroqRr3IWkNtd9sEO2FzGN1ghbGp99uIMgwBeFfYkdJhtHQ7hkFC7a9ACEKqBDzIosOd4dHOur5Y1wxksNsJCEk6SgcChEgYQACjgKXnReEv19Wkb5LYko17/UGSxLpYA0YXs0VeueDmFfUtt3HDeW2nVQJmov3DxoxCHT66E8I1hK01452Sxcnh/m7v0TGwF4C6ruM4tRSRMdAIp2iJ0BCiiaKo1++lSUxEab//0p2jl+4eRUn29Nnxr95/771f/rIX2SSi2XT67OT02dmFJzBoLVIQCIM+goAmdPlBEYQAmtkrJCBiUO+Zva9FlZ2q2CRRQCWjJvJqorSfDUarSpGS3f3DNOtxiKztsjRAAKidwfSqrCoozqjLLAwTiklAuKNJdPv7dmhZm2vYKuxIaFHRPD09Pb2cJv1+2h/Uzl9ML1frJQD0+/3xaDfLBrWDqlYPBGQUSSC4VyUiCwAS1FrctmIoAqMoik/BjWLTs2LAg3IgnTXCEhpF9GorpXnpTherVV5WtSPVXhzd2hvvjrLEqFGhVllq40Ea6psCgpIqFo7nq3JZ1AxEAElsd0b9LLYEEm5MupZtBSKBxNy5g2HDOemen6B1Qxdu2Gr04hlUEARUfV3Nzy8eff75YrYo1oVzjllW67ysaiDqDwZclcX+jlRjNKQK2hiVtSyq2XReV3Wv1zs82O9lKTb+foCrWRPC7Jx4L9bEmBKRFWFEaof3rxiH8Yt9WDdjuV/L3WwrzXOTaQhh6iIIVIhxZPv93sXFxWqVV7Ub9tKwtOIm4uaq1kMtTmFrf9kQVbU7VDT4hG3g4rV7bCsQ78rkKasYisiQqjrHidV+lt062FGVfF0sV+ViVS6LIi+rspa65vP5qihLRZxNBrvj7GB3MOylEZFFJJTIhpFOCmGyLbQ9mGW30K4CBqQ/6N89OliuCsezVe197bz3WTIa9XcOx4PZfHYxnV3O83Xpaq/B4CNIwQYc4MXGGABhQOGNdKaiTQJfVy40i+2V0xcAAthV7p6dTuM4Go9Ho9E4tudJFIM1o/39W3fu9PvZfHp5enK8Wi5YkcgoMCCgSmxpZzwc93vsXFW7ovLTRTHLK8eqYBoCPQGG9FljktFo5+AoRuS6Hg17k93Jar16/PTEi7b3AMSRjZIYAFar5WI+RfEW1BImxlpUAOj30tSYURIPsmwyGg6Hvf5oGI+GtcjZfP7w2RmjTUzsnAoLKhCQhg6vCZReQqDVcrFczOq9YdJLneLlYjVfFxXDcpWv17l33kbU7/cGvT4ZwyxlUSxX66pyIUrIGNsf9EfjUZpELFpU9Wpd1E4Cz0JUkijNsjSJY1Epy6oq6zALbEATkJ00uTXK9gdJL0KQWhTBxC1tCgAEiGqRVVXWzhuiYS8d97MARAoPgIAG+v/VgzFCC+RskP9NTxE0cCfbQRRolQtpBCBpg3mbiRFsBBYRYSQSVWUV77z3IhKmA4qicl7ShGxkQmRiw/ZGuMZMe14MaFzuXW7Xc8dpfJGVYpuV/KVy7Zd+pnZQL+DdtgH67ajblurwQv8a3hyg/x5sZ4GUuzG7qzbaaqC1ogaTpWrF/v7nTz57eNqLzcsv3/rGK7eG/aQqFghiUAjbRkzDEN7WtJqlOdTA7Xmj8dKENJJQbDvPoIxoBUkRyIR4c21VR1CwiBCBCcKzBtMKNLEowcQDaEFIgDSQJghE1QsKmCjtT3YPx7v7ReWW69w5v6Wt4lVBbXN2Y1FREiBhZe8pAiRSZW7EPqXQCQ2DdqJGAZpEudD6JQWMoqjfy7IkdrkLy1aa2t3J6K3X7r3+0tG9w93Dcb8fRRF61ZrVG/HWwEtHkzRNYmvnZfnw5EJFiADD4astROSKYnclPb1TAMuyXCwWWZb1er31el3X9Ta4NmTWBcswAIzH4yiKXlC4apvG07YU4ihK0lREqrJUUDImdIhlK70tVDUiUpaliJBoZGxRlCxcOyeB6dwh2gAIN+meLUZdNpDlrbUsnMWbliOGnUIAgJC0i2NrfsEuna85S4cgu030+CZDKLwhw+Hwt3/7t3/nd35nMpnkeQ4A3rvRaPz2O++8/PLL//mP//jdd9+9fft2vz9A5C+iAF89GujG672F9IErhLori/mWq3rzcde3wq8gmnYksxf89cbldj1FGZ/7THol5O6L41m/6IXo9S/9VX3TL2rEXv9Y/DUK881qfyMQ31x/V/vTiGTohc+wwkZgC4N/RLThH4WQKmNXRfn07OL+o6cXq3UBaBVSMv0si6MoLKzsvaIUzpWOBUjAFmLq2Xq5LKbpfDAcGWtH48lsuXLOVcLzwvHJpfeeX7q1szOJs2y8szvP3aqarar6Yro4GPWifmyNBRVQEzaPhi8bOBLaNri3uvBNNxybXtx2j24zeaWhmdkGrBAqkICo1AlFe4PkjZduL9cPLnNHYAOdAJUIDQApNV8zsK+o2fysV1yVcjbPx4npZVm/l/T7gzSJVVhBi6ouau8FqQldgxaQ0YaFYwP0aB2e2O2/kY2QkL3vDmoiKg2voDF7R4YCoJAomEG9qhhrbZIiERmy1mZJbMjEcTIcjW7fubO/N7HWBj8XAefLxWcff/Lv//3/9/L0+K1XX05tZggjS1FkRcQYIqAwwAWILBK+bmCRgGJkTa/Xq4syxNkwS1mXKh4Q66pi9h7ApP1a6PhiWji5+8o3MBmazx+j7X3jtdeNsSwCKkAUbGrSchECERNUVRxwZbTuGxklFrlU9RtHrKKCSJOVjCGBQlQFlYwBQgHwAKKwXC4//OTTKM2y4cgDPDs+ubi88Myj0c7u7kGvP3YM68IzRIIEhlhBmEEVVaI4ttaUlWPPW333oNp6Em9ctTcwOyklUIF6BWVAAVRRMkQmZsXcyaysjmfLi/lSWFGkH0V3dkcvHe6mJhB7gwMaRVvJZ5MngoBUK83z4mJZrKsaKAaRYT/b2xnFhL6uxLPaTi4P09cqwiwhFDo8MNJMgTUBwtwwva9s/M1RQ0W8q0KThgjKVX5xevrk4cMqL1AbjuQwy4C18s4qpmSMiM9zk0ZAVpsuBdRlvVwsvHOTyfj27Vv9forKotxAvbupedGqqleroqpclvWNsXFM2kTea6fNbcMbn69ariTU3RQnX8cdDV8IUGy2LOr1+4dHR0+fnZxfXOZ5gZPx1kd0YIgmwEcADFFkoyYWKOwt4WjUECe2MndCh+hFqVPPnxm0HRMP+2xksJfGkTHspEAuC+5nw2HP8qguynKdV4t1Pl3k03mxLKrK+VXpP35y8Wy23BmnL63GRzuDcWYng55J0ygy1kZIFiDqju9NdB6yNBPLSkQATKB7O8NvvHQXKXrw5CzPi+Nnp+pc9tKte4e7Lx1O8rx4dnJ+/8nx0/N5JcJqBSmykTAzexUOjHFVQtkgXkQVUISabpl2yjlq17prz0gWkVbr+snT89uHhwcH+4PxpITYpoNbL73cHwyePH306PMH6+UagSwRqwQSQVlX8+VquR6NRqPI2nXtp8v82XR+Ml+XnmzUx8iE5Z9R0QBaY3cmye6+VXWL+YrVeF57qCliG6MIsAfUtN+jJCrYuWW+nM8HcYSIvSQd9XpJbAzKvdsH/cQOY0gjE0eR2qhQwjieTmf3n5zNCz8aTLxgVVbeeQMIZDwEbhUAAonGEe5kWS+JvfNV7QVNXnFZw2y9mi+WzGItpUk6mewSkqvrICIURRH0AmujLMsmk0mUxKWri7yoiqr2XgEpMqxASIN+L0tSVV3OV1VRshcENaQx6NjAa4c7k55JkFWcqEqghYEqqGlU9Wi2zOfLpXd1L012d4aDXgrqOmCzsChuWu3NgRmphdSHQW0GEfEeRH1Vc12zq9UQaAS6ycYKT5oEZnDnF+yYmS34ClHLqiqKAolSIgScTefMLk56vV6mqgF52QxCESpfCS+Fq3ZdCd7Dq93HF5ExO5MTNr9e/Td/pUZjsyu1CXnP/62IQAenfNERXW7W978nArGGkfwGQd/Gxom0mpIAihAYyx7PTqe/+MsP5kX99juvvvPmN/Z2B+zyCAXbCY4mi2UzI6bYcI8IAhxcEYkk4PKQVMB7773UtWcvzvl8XThmAFNDrIBRFEeRIYPGoLFkDMZRFFnTM1FsTPDhGkIRL8oIYMAYgwpW0LJX5xxaYoKKOa8cEHzj9u033vk2mcFHH3/28aefzpfLsCdT+KUJoAODGNlIqFJAEfWitaCHqPLoKp8QxqASTNOthBmUTW14CIbQBvofAiqBAIzHg5fv3Tnan6yfnIm6oMN+5zuv/T/+8e/t9hPLNfkKfC2+QhVDgAYUnHJxtNPb+dF3FfX/+L/+dLZae++1CTdBRdQuwfM5KW17XXLOr1YrY8x4PL6Ww7Y9ABeEY2ut9/6FtcQmjlMEDQ13xkdHR3Vdn5+dVVUV+mfsPahaa4ko4BqIqNfrDYfD0XCURZExFhCruprP54+ePK7quns9JoS6NlENIVYOEBphl7qCRjcRosGN1eTDtrt207pTFVQT4h+QENEYGo3Go+HQO79erderdegpNmZnIiRiVUD83ve+90//6T996623iqIIDifPYrzb25389ve//5c///nPfvazt99+Z3//wFobzi/GmC4WYksF3ngJXiS565YPHbqJjs4dfM1B/NynuKYXwxfLx1+oDl8Rb69sB3jdL4zP2Rq+uJl4XdR9MTJ80w14vnv665XvF/VEYdvgdnPdCMQ319/tk3RY1ygQ1rSZ+9s4oFC7Mh4EFQ2RRQUGEAASREFioLPp4vh8ulhX3qMhM+71Xr1zdHSw388yNAHSoGXt5svVxXy9LNwsL8qKjY0rYV+6QheRjYFslmVxnJRF7pyshZ+czWuvd+5Arz+IssFw7M8XharOFsXlvIisiQcJeDaA3os1TfUTaKmylQuqShiapxS8nW16CoR0u+3qO8y2SFtBETQmF0VWxDqB+NZO75Vbk/zzZxVXQJFBC+04TOBgQTvpE1gRAKBKTmSe189medrLDm1momjQz9LEAoITmK/LwrFNTPgkpnnHgVVDRxUAWUIEcQiiJRuZOIqzLFPlqsjrClQUDaoKGhMKIhFU9WB8lpjbhwfrWlalWJuMJnu9wTgbDJI0zdKsl2VZlsTW2iixcZymiTHonSur6tGjJ4v5xfGTx++9997p0+NeREkcR5ElE6S/1qnTcBVAUdMoHvTTfi/r99M4SqK439s5SB48ffdXH/q8QAgAWROCmC2qiiuWs+OnJl3Xnz5+djpdUTJ4+bXX9m/dLZ3tT3ZzJ+gZREGNomkgGwKiDMLOO+9qUmehTsllRmIE0JogTLoGKT3osIxIW7otttoxsEhe1tP58uP7DyqAg8PD+XJ9Pp2dX8wEqD/s3777Spr1i5qrigUMKyqidyygIEKEWZaladzP+jhfr7lQ8QoU0jhI2UidIY/7dDCwfawbhRdRA5nEoFcUptLJ5bo4nS2XZc3sjeggjV863D2aDFMCs+HBYZiFFmUMdMNQs5hIgJYVH0+Xl6tC1KCqRTnYm0z+b/b+7MmyLTnvxNx9rbWnM58Yc7iZd6wJVSiIrMIgNCkRBI0E0TIRJvVL60nS3yWzfpRkRjPSjDR2t0CaUU0QTYKFqcZbdaecY44z7mktd9fD2ufEicy8NQAQAV7mLrOqzKjIiDPss5avzz//ff2eRWDfCgeTpNwhpqNlklUlTgfE8YAOidipOqzCIBJD9HA3KyQmMYqw96BKxiA6ZVmvVplLpofDIu/VdXM9m63KGgCSJI3RTxJC3dS91CF1wcoC0DTNbDZnaV2CSUKphdB4FEZUVYolMosI63K5Xq3WKlDkvY0xA1mkOwmQeW2p99oj/Zsy5Qt6tN6RaF8tRhGTJBlPxqo6n8+rupLOiL/d7mI9exMwZYxxzm50IhDZ0Pw6OTSaIHE71vGS3rQ7sQ47CYodIrHbK9AR7A17l4PefF7VTfvsxXk/T96+uzfMrUvMwGbjwh1P+nXDq7K9XK7nZX0+X8zW1bpplqvyae6mvfTtB3cPpi5PTIWGyRmyGmJLreNIKSIgR40KgZW9htoYd2d/kDmDKk/PrpZ1e3F+EaqyXa+OD/Ymw8H4g9FoPHE/+eTJ6dWi9kA2AKJ22B8WT4TWGkEAFolIfFUUUJFIao52UCLavCEdugOAIqmY2c9X7Q9//Bhsdnz3rf27CNZVbfjs04+fPH3c1I3c6PdxtMcC8mxVP7+4TobDvNd74dtZYvz+Xu/gKAWHxikQswgIo3pUUTC9/gwN+6YGCm377OIKwcDkgEzaLpfa1ITqg15cXnOQw+n44XiE7FF4NCjGo75BVPYJqdPWgbekntugUGMSai4bJNf7pa9/syqbq4sr6dIODQAARd0AEMQqF8689/aDflFcXF6hc8VgtH/33oeP/tNytQ5BksT1esVwOEyTpG3b1Wq1Wq3quolOqzwv+v1+v18YY5u6Xa5Xdd2IqFIMyaVenjnrULEsy9b7el2BigMwqoWx037v3rjY6yfEdbyNRZFZED1iPK1bQFuzPZmvlmWTGpoU2bTfM1F4xejSFdCuA7hrdO3ajlEmCKxNIxJCCBxCu67q9dqXZWqNBqvGRK8yGtweQruhIyUFRCACMkAd3IMRUOuyrcoqzbI0yZDM4ydPQ2gGg4PpdMwcokG5a0hE+tkrckwXC6AqwhGaajZ48dftB7sjxq/arG5tKC95uD7vfNxNd+2W2Tvz5nFVwdsChu4w0DZLWjfG/npR+831hRCINxSXDRFVIU7zSzfVaVkdqivL9oc/+PTsZHXUc9/46nv37+4ht6DBICAqRRIgbTwEDLBh5Ygoko3gIQEFoablddlWdV2V9dX19WIxr+rat8FHmAsooBFKVZEMERGosggiGENpmmRpNu71RkUvL4rEmTR1WZ5YS0Qg6pkZ0Vmb13X77Pnz04uz2vt1VXuWtx6++2u/+Tt7+w//xb/4n/7pP/8XP/rJT1bV2iWuiy3buCgRgYiSJGlrK4AMuq792WxlLbFHwUzAiBgEIkCDGAPzcKOnEYEBInIELs5JIDAhJtbeO5j+2je/tlp958XVHEDLsnz65NkPf/DDr773cNTLLKtRNMYF8YhKEa3OJYrPbfbf/G++4gz8r9/5wUdPzpZ1IEOIIJ6jBr8BTdwYrXabVR33AWC5XEaIRNRbtwFrux9w7/18PkdE3riAb6dWwlb6FJGyLGMC3mg8ns/nIQTftipCRM65qA5vf4X3vqpK9QkRKULbtnXTGGvHRdHvD1i4rqq2adi3CGCsjcqyIQKEmPceAjMHZmaWeDepCBApQghBRVTRGuwyYrvZI0LAGCCvLO9/6f3/6//t//61r/3SH3/nO//sn/7TP/qPf1Rk2UvPiwDefeed3/u93/vKV74CAMwcHz8hchDr3MOHb7///gc//vGPHz9+/MEHHxweHjZd4XBjddv64nB33Cxq33GS8iW3wWZyF38aF55eUYTxFxJRf7rj4TXf/zJhSF/zV9wGSb2yc+lP+2n4ioHmF5y1/JmP9uf4x2+2tTcC8Zvrr1sjRqBufKMbAsWXC1vdAHKIACwJiSADYJSUguLl9erielFXnhXzLHn3rbe+9t79fp4awuiGECRGOvS6vygvrhcvzq/OL2dgLasFRI5wYvFkE2tNnmdsjfim9M3T81kZaDSs8l4PrcvzYr1e1z5czBZ55vpFRmh8YKSYGIRdOcFxRIRughd2VS3CnRjfjVp0069TlUiaNEioSKKMCgaBFAhDTubB0eRivjyZlUFQrYk8+Zje15mWFVWBNxM0RKRgPMvlssmullmRJ84NR4Neni3WDQJdz5dl7fupJUQU2bKfIYbBx2mvaK1RBQCXuH6vl+e5D6Euq9aH+EyYmazpbMdoBAVAmFtn6P69u/29o4CptWneH5u0SPPcWkOIRMQhVOtV40tZrZumWa8W8/lsUVblahWaslovr66uCU2SpqrAPnDwLMwcALH14sAkLhmOR4PhYDIcvHN3+v79vf1BQWQV3FXp6dHz+IoTEIBG/QCAUeIoGNZlebl89gf/4Tvn8+Xk4N69ew/3j44n2ShARq2vsKmapvZByQkaVQFmVRVRFlFl5YDS5JkOM+tQlAOhdnk02oVVSVRjYGdSaHMma0N4cXr6yZOnZ5fXx/cfLsvq7HJ2eTWrap8Pevcevlv0R3UdqtozkES2aQy3EXGJy9Iky1ODFC24CBBTegANqABISjp0etCzI6cYQuR2AyKiCWKEjGeZr+vFurpelmXr29aLb/bHw+P9yZ3pwAKriIAapBhOqBGApYwdP9kQmiAUkC6Xy5PZcl4HIqeqeZ4eH+zlmbMIKsAAImIiRY5i3x/AwLarH0uKKJMh6ktlB+5U6jH0ETlgjGQEQFUCUNb9/YN33nqYJdnTZ8/Pzq+WyxUruSQlNM45S6giaAwYih0qVWzadrFchuANRWo1b54d7gRNADM3Td22rbOJcwkRYccvi4aIaF0RZvbeq2q2U2K+uf6rOl5vFJy4PHdhIFGSTVI3Ho+cM7PFfLFaM/PNKS7e+B25sFsojCFnHRGJRFax3A4w2SIW8dUgxO7u3fnSdoBxowmRgBpQEN7rF3f2xotF+fhsOV+sP3n0NLOQHE4HqVHxqm0/T7JRD9EuW39dt3/+0WcvLuZl1dRtmK2a83m91HRvHvbHA6PCxgJaBY6T7BJnbo1BoyCsGiD2etkTambs4cjhO4f9Iv3Jo9PZcn1aVWVZnp5fHu6Njw/2R8PB1778JaTPPnnyYtU0CMCqRESoSN0QKIJVZVAUZGFl5vgeGBftR523a9vXARAAo4qCCGRb8S8u5+6zJ7/xG78xGA8vr2cff/r9R4+etIERSQEkjjwoWCAiUnDrpj2Zr/FyMc375WDEQ2NcmtvcuCxLcxBom6b1vmXfcPCiQWAWRGwKIxeARQAZXDZIi4Fm1+XFuTYN1+yhGYzd5OhOL0+0qbhe54k1Fg0qWkMqEiAECYKC5NVq1jNJ7879/Yfvf7XoD3//f/7/nJ6cx4ZVlw2IyKwqjCqJwUGW3j0+XCzmz09OmezhPTuZHtSN94FdYnv9YjQcpWnatu3V1VVd123rRQSR+v3i4OAgTVMi07Z+tSrrpgkSJ7rBGJNmxXg4QoDFYlG3TeAgyhbUiOz1iv1Rbzoqeoapo0MgkAFUFKZOcERWGzQ5W9VXCx+C7vfzg/FgkGVGGJQZBTu6FSARGRMXYd1RYLt5dlEIHNrG+zaE4OsqNHXwXkNQYaWOyoLSlW2oBkAjZRUARQmAIrISRFEYkUgkUlMRKAT55KOPONST0XB/fy9GIITOHy8i3GUQ7GgoW4db153ZsQ9L1xOlz5uu7XpHO4MpovraSYHd79nwZ7bePumK7ZusO31pwiB+hWgbBaa7RjDZ7MT4lyJHvrn+C7DvvHRnRYzeJhCGAJyhtK79yYv59/7sk6aVX/76w3ffOZqMcoLGGCBlQ0iE3InKxEBiFDiGNqOochAFo4p13Z5fXJydX51cLOaLqmnaslzXdR3rK0R0zlpnrUETseOiEtgH9j7UVVPXNQBaY5xL0yTNsjxNTZK60ajX6xfOUlktq6pCk2bZqA3y5MmTTx+/YA6BdX9v+sFXpodHbz99cvX//V/+409+8uliuQ7CoKQqmyOpIggCqoS6qZnZEInKs/PL//in3z+cFllKg16SJy4xxhqTpkmWWGuttcYYsmQMkUUGEAJlihg8dUCkjOJHvfRvfeNLT08uT+Y/QPHrVfPhh8+vzuen3zz91W9+497+nrMZh1oNkRUMTCKoAUSkDRnY//23vnp3b/A//8Gf//s//7hlzcjEgI6tXzbiGkhfox7Gb2Lmuq47usLO+x7/ul0ioiQa50he1YUjXzgahJfLpfd+PB5nWWaMCSGAKhFZY6xzW3U4/qu2bYW5QopxnaISJ0EDs3UuNamqtG0TY12dc0maZmkaEcbxUYUQ1WEOIQRmiefD4L0PIbSISGRVN9khGLcOs4VLJEnyO7/zu7/zu/8tt+2/+7f/9vmLF4i7eIduPU2c++3f/u1f/dVfzbKsqqot+Ct2Dowxk8nkK1/5yp/+6Z+enJwsl8vj4+OfItS+tM5Ht3JniCaKj20XNwG3x01+PmH39b/rZ/7D22HaW5rg51pefvpT+88P0/sLP/c31xuB+M31N0UdjpVsHDVRgV0MvOpOWB12OPm4S3M8D4sqwKqqr+bLxbIKQQy5g9HknTt3hpkz2oIooBWwjQ9X8/Vy1cyX1XJdtlXlELzGdjQJKoAgKQePitaaJMs0SXyTVHV1varrAAMvxppev+eDl6aZr8rBKh8NC5s4ir27iH7qThwRyiqbIcZNfnqXRbY9ybwSNoo3pTvGn4AoAKIAsTENasRPiuRr771V/+jTq5UP3guaOAMTiawiXRirEoEiIZnotBRctXK+rPOr+dHeaDIeD4b9y+uFmuTiarYq671hRp3/OIK7OjpTPGKoaABJkiTN8ryXO+uqpqnKsq4aUKbtiiwKBKKiogRoyDAoESQWE2tEUVHX5VqqVmZz4eB927ZtU9er5aJpQ+uDbwOwF+FGhYMnVQkckwaMsVlRjMZFb1jYLL9erYvBeDye7I33hoPB8dHRZDqxiNDME+fLah28+KA//PTFhz/8QVu3CCCoChgHtbULsyFUXK3KD5+8+PCjn5StPDm9fvLs7J0PvvLul38pzdPhoFfkWd2081W1qn0bWuWAwtGgraiESOJT4l5ChUMDTISqSptNlkUEwcQgcuxEUEBEARZZleXp5dVHnz2er+uDozss+OT5yXyx8p77w8HxvYdZb7wqm6bxDF0iLwQJHBDAGsqSJM9yAvKB63rZNr7LQ6eIPmCrXDgYOOwTY6hRggAIkqBhsAFt2eqyai7mi6ppGs8h+AR1/2DvaG80GaQWWpIYX00xdy+mbnXH8C6lDpRQFa/W1dPz2ZpBjCWFlPDBnaPJeGAJIwTERI2caKsXIWCapmmeQ+REaxzqk9vAtw3HYpME2U2QgxpC6nKKBEFc4vb2psraH42kCb71TdMEzzZJkiQtiqLf72d5bomEBS2QISSjQZvar1dr0JAmlCYWVYSDim7x4BE0HGEq8ZRPFBEpHQI1HvJD40W49W3TNCGEPM/yPHsVPfaqkPfm+qJIw7dIf10g2s6sORE4ZweDfpqnV9ezy8urqqpzS0gELJvYlDhP2LEEDRpjLRnLvuliVjoPfucb3I2i2Z0MvRGAtuzSV0fdRWJsjqrvu/T+wUhESt/OFu3lrPzkyYlyeHC0P0ptCoGkJQabpHuDtD9ICe4djXrPT69OL5feozB+9vzq5Krcm6yHeVo4208pMYDI8RMsiiBRAzMEYJCsoCqiKrK3gIf9rJekRZo+Obk4uZytqqZqw+V8fTFbHx4eTKbTh28/sGn26ePnV4sVEKmqxo0PNrAbIKAYehSBhwHQICPaCMzHTV3RYWq7pJvo4EZT+fD09OLJyekdhNPT08ePny6WpUtzNEYQvXJQJQRKrBCJV0ZcBGovVmW/1l4BSQZpSmnqXIpoJahNiVyCoRUOoQksKIQCqISKggIGDKlQf1SMpzSd1osFN43tF7w3fVJWzfmpDfXA4SAx/ZoyZ7M0LVJnKFU0wtCCxXw4PLhv+hMBXZfrP/xf/8PjJ0+qphKFSFli32LiKPZ7BYo8v3t8fHU9f/ri+Wy9bhQrMcPR/le+9KVPPv0EDPV7fYPU1s1iuVivK+YQh2R7vd50updlmQhUVbNerb0PKpFApWmSZFmWJnnbtlVZN00TlAHFoDgNdyfF3elomKcEjNzqJgkKUBHYoJIKoAFKSrUX6/rZxawq22GaHI5H00HhSCAEEBYUIiAyAGTIbgHfnXeXkABRIlu3i8kFDiSCEfspkSSh0HVZInG4G3iPmq2iiXj7DqaFccVvFdCHxvuQpBpzEU9Pr5PE3rlz9OCte23TqCiRYRHuBvFfg4OIN6nswCVu+3NvVGDdBs9toWqAtz19m1G1m3//M87C25C7jvwK3Q+9FaYav1Nk17iwmTbYPpLOh4Bvjt5f0Is2+tRtNREUmLuUSIeYnp5d/vjHzy6u2v1p8c1vvJelWJXL2peEmKfWWbLWAHXdH0QgRCFVQGudATtfli9OL84vZ2cXV8+fn15dN6s6KEDRK/b2pnfv9UejQZq6LEuTxBlrUmszA4RIxqiCb7lp2rbxTdNWZVVWzWxZlVUTmJfLqr64fPqUycQilYFUwApmgamqyyYEMtg0Mjm4+877XxNwf/xn3/v+D3/U+tYYw8IY69Ut1TbSxkRQBFQBSUQvrhfr6sepoyyjIrMODClaa7LEpolLE5cmSZYmeZ5laZpZTC07ZyDroU2dw4zUgqTGZtlg1Bv+8lc/eH42++zpc+9bS3p5tf73/+uPn3x68be/8ZUP3n4wnfbBqPomQcoMZRZRxXvh0KDH99/ax//drw4nB//uj747X6+JtiAZ2vSSVHcY/Fur70sy6Kve4d1viNLwS2vabtWx/QnRI9y2bUQMe+8JMUrmFDfuDrzQxdYJC23ydrdsgcV8sVgsVGP0rjhCa4gIB4Nhv9dL0/S2gUM3U1WdXKuqTV3P5rOqqn3rveeYsAeIhmiLYB6Px3//t3/7d/8P/22WuP/H//A//PN//s+fP39urZWdYskHn+fFP/jtf/D3/t7fS9N0y9nYvFwgwsyYpsne3p6InJ+fz2az+AnaEudekoNf+kqUquNrspWGX0sWfvXg8Fd+lLglsL7UL/rFnBJvolbeXG8E4jfXX2Dt2KRzkTUvtad2uPM3PFXsYr67wXxUEJCmrqu2bZhZwSD286SXJ4QSl+W6blb16nxenl+tyqopq7b13AbxCkKoBlGVsQNFxfFXs8HUA8S4NfUsq6q2xhJBmmWBIHBbNc2qrAfOEeFmpvFWPLRK96e4xseQItWoUXYh21sXRxfxBSCwnZkEVIleTY3x9d2pg62RvUF+Z3/MMrtcewAQILM53MRgb91M0qgqsyozBwHDs3WVXmKWpTZNiiIHQlYtfbv2TcuSEIKiKIClzpsGKNGQDOSSNM3zLM+NtVVdV2XV+kYkRBkDt+S+TrhAQQIFAU2dVb++vrg+mVVIjsGhzRiQWTj4SGlomzoEYVYRNahIJAAim1wyBAEFY/aP7zy4f5Sn7s7lFSVFMRxOJ9PhYGjQKHO5Wi/n1+CXw1QTZFVlxsViUdZVUFSkmEOjQIBGQYQU0Ho0l8vFJ48f11XtmTi0ZdNUPizLpvSLUb+fOFdkKdrEVe2qqterhShHIqgIWA0WwiDBvkODQSVId7TrDnsblFt3OtSYr4aoCGVdn17Nnp6eras2K/pksov5crmshKXoFQeHh/3BwHttWg4CCl3pJKosYoxN0iTLUmuNKjL7pvHCHIOwQAGVUUMK3LdQWDDqmRtCELIMGJRqwXXrr9b1qq6WdRNCAJHM0qTIj/aGw9wlKBSNtIqARkAii43QbKa0VCIIRaAKcLmoFg17AVDIDIyy5GDc61ky2zlFQsA4fAcxNBBJnXF5nsdHDNuXCbokaJSIVe1K281oq2zWh0h2jXEpYp0Zj0fL+co3rW89ixgyzrk0TfIszbM0TRPjLBCpCEo3bCugjeeqCcaZPE/TJN2kC+p2KpgFELuKUfUWRGzrxRSOvjAyaCO5TzvLzSZ8E28VTG8621/IXW23zN5GgGwwcgJAhqhfFEWRX11fnZ6dz1frfDreRoDiNr0VJXbqFKM9tjueEWxAdNiBSbVrqMBrZ8y7W65L53pJO95mksZlUYrUHE77b9/bf4RXl7PqYra2ZADw7aPJIHUoIRJgSDkzdHfSH2bJKEsSoqtlXQapy7r1LApVnvbSpMzTXorWKiiwAgv61iNQnqRZYlNDJBoUDUQ8khiEXkJ3pv3EmjSxT89m67pZV7VezWqWVePTNE+zfLo3XdVNG5s1HK2Xm/Vix7wtws6ZLMvIUGCOHthtfspmjZYu4T32DoHWtf/4k89YNQSfpplC1QQhQEHgKJMZ8iCsqkhsCNAGoZwpwcxQakxiyCHYLokgJgeBM2QcpqhkgCJ5CFGBBQNYAExEi8IOem5a+qZJ09SnyWmzLqvWNNUks0KpczaJuGUkYwxQAowiRm2/sYUPcHF99ezJo+//8Efr5TKEQGgjqF0IQAQh5uQalyaseHJ+sayqyvtV5Znp8uLi7QcPVqvlfLEA1RBCXVXVulRmULDW5nk+HI7SNOGgbRuapmmjOgxkAI01eV6kaaqC63LdNl5EEESVMwPTPD8cFYMUEvTCgSAGJegmk06wa7CRF5w14WxZzteVQxz18kGRJYaQgzATaKRL3dAYFGJiHKjq1pQG0HEnRUCFYlt2s5iLikhsacYZH9lxScE2kEc3vNROV1ZFNKISJQYkBMWmFUCb50Wv1xNmBKSbIN9tjXuLLyG3uIrwSrNwOw6uL3mgOgbFrtsXUVVu/rnSa0/mL82J/5zSwM4naZPOCq/nRr4BTXwx9zGJ9YzcGNURINrpgRlF0a6q8unJ1ZNnFwx0fDTd3xuohKptQ9UiCPfSInPG2Mwm1jlLjshBQpomYFwT8Ox88dmLpz/5+Mnl5fVisQptmO6N3h4O+kXRH/RG40Gauix1REhx1BDJGUoQjEEiAwDMyiwqyqzet20b1lVb1W3r/bpaL5ersq7btllX5bryTd02vg3QChhWAGMFUYz2xuPp0WHVVB9/9tHl7NxzjSAUN1+4CZKMtECr5JCETAvMqoF1XTVVrbaiGFuOCgbRGLKGLJGzxrkoFieJwcRokrp00LdpGkfSKPhRlt6/e/Tee/m9O4Nf//Z7ZJunzy7LqhXW5bp59Pwc0FxcL48OJyZRoCaxVFhbWCoS1yvy/mCApAR6d3/wq197p12v/vxHH1+va0ESpKAISGSoC/OAnZmAnQbVrsi7WyFsIbzxz9sl5WVv0+3o9a37Nbp6m6bx3ptu2gNV1XsfQ+q23ezo2Om2ZgUANUCpsz4E7Zq6MdwPLFlrnXXOOUewCQjB2C7rSnNCMsYYIukXvV5e13VVNWXVlOuyaRtmFlEyyKxpmrz/wfv/6B/9w+l070//+E/+3f/y7z779FMQjVKDqBoiFUmz7N333vutv/9bx8fHWz33dgCdxFerrut1WcYJwt0X7aXGPLwuHGKH+0Gv1YJf/VGft4bfhhy/3sdw68fefmz4CrT4LyAR/yVPOn8ZZfmn/8afx1/8Rtd+IxC/uf6ai5AYXkPGRNIu3V7NtkaqTg/uUI0YlVxS0CgwxuFNREeQZsZYjSorB5kv1yeXi2cX8+tF1bRBWFhAgQIatEDMUd4VUCIbR08UCJDQqCWDNhVWFfCefWBrjHMOSUMjtedlWR0M+zGqi1URohEJNIYsbNZZ6uLdYhxKBG5xDH/AW5E5URLoYlVRgUQIwQAEhE4jViFgZF+kyf39SdP6eXnZKiAmpBoHbQUpoGpsm8dZnZYlcGBWy54DKQ+H/fEgKXpFkiSN11rCsq5q3w5yF5POFVVAaJNBpohJ4vKil2a5ddb7sF5XTV2rCuHtgNWbzFlSwKDAKllipW0uz84+fvScTCroknwI5OLBC1QUeIPjR0RkANKYHUAIoojGWmcp7w8O7997+N67e+PhYr5waSFIaZqCSrkqX5ydXV5dnZ8+yxO9M+2PisQQIbrAPhqxY04gCAKQolUQRsNk116fX82enpyJABGhS5Ist1mvajnUS2HuF0WRF728yNK8V2Qz5NV6XXvPzKCAEhIMg4x6Dgx4VBbFOAGNGhVyiPgR2GQqR8hfEJit1s/OLs+vF2CTrDesG766nPs2pHk2mUwODvYD2GXZMKOCASTRrkWOiNaZPMuyLFWFEDiwBOE4FqugpEwQrPrCQs9BZgTFs7AaI0itYsOyamVetufLVd02HDyBOgOjLD2eDvcGuQFGCZ27DjDSKuI7BdvQOIjvF7as12VzsazrQNFEXiS0N8wnRZIAG5Ro3wZUgzFRCiOxFwDEaJZmiAxgdPNB6U7W0eXdJedEF/5NgG/Uyjd6mgIoGdPv91aLVVmtfcuB2RiTpWmeZb0sK7Is6wTiSPbq1DthaBrftJKkaa/fy7MCgRBJQSTONehNbHBMY0TCLkxS5abL02VjEHXAl5iivPlkdH2tV5tkb64vjDa8aQTcMl3tvscKqgaxKIrhoP/48ZOzi8vFYn1nf7qRqPRmD1SB7oDaHXuiMhWxgbo94G00LtzcTvEM9mrOjL5yAOiwtAASFTphRzjpJ+/cnQbfNk1YV/7F1YJBiyxN94aOgIBYgJgdwiRPJr18mKUW6enZ7Gy+vljVofWrVdk2bZkm67Yd5CZJ4hwotkHrqkbBQa836hVFalUxZTCWCAFQENSgjnJbZOM0MQBwdr1YlFXVNPXF5XJdDUfjNCvyXpHlGZcNxxRzhs5MvVHf4okeiXq93mDQbwPzupStr3OranUvV/fyKaKC8RIePX1uE3d0eLB/eHC9rBZVY+KRqkNaQMMeFMglahzYBLLc28TZDE1iYjBAtMfS5ucSkUKaWINWYgtWFNirb9S3BAAG0VI2HCSTUeuDQeNFaoV1UkPLKpCKG1GmxqGxMbYBrREgkKR1aRtg3lSPT88//uzJs6vrBAQUEkQT227WchBCVNE8T7N+r+Zwfn3VitQtl1XDHk5PT9/79q8dHx5VZeVbLyplWbZti0jG2DTNhsNRr9dH1Lpu66ZtW69dHCIhUmKS3OWGTFlXVV2DCqmisoEwzt2dUW/aTxNg5NYKEEaJeEOywtj6xFZwzXKxbq/XpWc/yZPpoOglzqpCZP5QV03dlI9dftxOo65LdwBh1iC0HQ6HuHiLKosKqkRHNX4ur7AjawluU39R4CbxSDvisLHWpYnbOoAxfpB1J28S4FU95XWpO7egDRt0+OunT37+7eNnzv++9PPxpbVs+5Jsk4hwdzHTVzXlN9cX4GIWDgyoEtEKHVtfDakhVlAxcnZ5/eT5+cnFIs+Tt+7fGfYyUh9YgxCCelGvIEjOuSzNEuMSm0KWSr/XgllcrJ6ez3/48bOPPn7aVHXi3L3ju1/50tvvPLgzGfay1BkLooFD6zlwCCHEUHIk0KieiSg4QDTYNWLTeJOyiPdhVVarsl6X9aqqrmeLi+v59Wy1XIdWxCt4AVbyipQkw73xeG+6qtePnn66qpYAQKgAjKgqgJsVSroxe3Rk1BgfXfWEEmE2HsBztNLgxnIZQ2AIwRAYIotoCJPE5cPcJkkI7KuWG380Kljw4cO705H9lW+8VbdLBXjyYl6VNSLOK//hZ89OLq7390ZJbtCKI8wM5Ykd9Ys7B9P3383z1Cl7B+6tvcE33rlzdX5a122r4GMwDhrsoHCyCWx5GUb8eU7PV5PHXjsYATtkm12AQwghhNA0UZOVmBsfqcHW2q4siYEKetOai5chyrM8Yd7OVrCytTZN0qLopWnqnCNEipC3DVUdN95bQoqAj16Rh+CrypdVPZvP1+t1VVUcz/4qx3ePv/2r3/r13/j15Wr1b37/93/wve8tF8skSXY1VlHd3z/41re+9Wu/9mvOucjZ2C7pWygHInrvz87O1mVljE2S5FUh/tUX9iXcx2vk3V+QLPE6eRdeah++VlL+RZuIn/fXv8Jm4S/a3fyL/Yo33c03AvGb62/kRR2tfRttC3j7vL3TvYY4Sx7NG4oGkQwZ2lARCBkhiBcVBRdYl6vms6cnj55fzBtlQYmOEgBA9Nya4MF0nlsiI8YBAdoYaNONE5G1Vi0J+tZ771tuVA1ZQy7xCuvS1y2bxMSTSkwIR0PC3gtb2FDoRZBMZNnFk4KogrACOrIRqHozXgiqHVMxPi8BBCSDnbdXEQS4lRqPRj3Pexez1elsRc5JCIZs9K8QkSCKhmgFUh9UhFmCBDAyh3ByuUzdeDSajid7z84uKs+nV9d3Rv2j/oESgwIjAppO5VZ0NhmMxr1ePzCvynIxn6PG9yIe1xQQRJQ6GIVo9HqrsIIiOoPMYbVcnJ1f2iQllw+U0nygQNpF+GF32MSddjSioYiBNb1e/87x4fHd4/H+QX8yGU0maZrfuZp9/OjRRx9//Pzpk/lsdn09X5el9/W9g+G4Z0e9FImAENFENX6TzoIAJGoYSY1deX18Pvv+Tz5bt6yKRdEzxWg43hvtHYJLmnV1cT2bzRdpku7tHR4eHN29cwj37376+NH55eVyvZbAwN5hKGySWqVo4VaQjjki2JWzuLHxiSooamC5WCx+/Mmjp6fnJkn3JwdVE54+P53Pl2lW3Llzf+9gipbKeeW9AtlIbYstdCQq0ixNkyxLDVHbhuVy2bYhEs9EGDgYlUzbFPw4sQUqSQAFtalH9GrWjSyq5mpVz6tm3bQIYlFzZyZFfjTuT/LMKaOydifq+MgZkRWjlI8ABgDJJEDUMCwb/+jk8nLtmRxBcKTjIj2aDnJUCB401Y0f0nZ3iHY5xJ2m2uX67AQTqEYGhb6a23CrGImaT2e8D0FVgoR1ua7KZr1eM7Ozrl8Ug0G/3y+yPNukJ1uzuXuFZV01VaNZUUynk9FwqHpDitwWvp1HXyR6HzZBc1FE3pTFSEjovW/aJhaIKjciYfQURrnvTVHyhdSIt8X97tDlxrW6aQgC9Hr5wdGRfO/H17PlbD4DfIhE3LUZNIKGVTVi7WGD+4nRK4qgW4Rf1zXZUIhfd1NF8OjuGCncTEduzMWKoiLiAcEhHvacuX9IiJ+9mF+vmsfnMxZhuX8wKgY5pUI26nDCBuFwWAy/8vZbd9dPz66+/5On1+u6bOvGU9v6qg2rylpLUSD2XliEPV+tQz+vhkW6NyjEGEaTuy6D1gIYYEv61l5/mNuz6/6Lq8Wz8/miameL5XxVWpe6NDUuyTIMzBE4qEDGWAHxwYswKBuDg2H/7YdvJUl6cnq63uBiotwRuzab+KHoEouCILLCoqpOzi7v3Ln//gdfvlqVZz/5KAFnTEJEKhqYaw5qTFr0kv7A9QZZf4D5QIxDl5IxcYtRY7fA1q7SsQkoKSuEIFVVXlxU5+foGwmeVSF12fFRfnRke4MAhsHY3niwd8fPr5rV/ErCANKCkoKQkT0wEYi16IpazGW9uvJwbRweHg0FmvmVLNcCiAhEquy9b0kAVV2e7985rupVDbyuq3Ld+lrI4unzFwBw586d07PT07Ozqq699wpAREWR9/qDPOuBQt20y9U6sIACGlIBFrCWkKwGaNpmdj1jFEtg1Kcow8S8Mx1O+5nBgBoI1MbA3shwiDNkSALgxayYzpb16fWy5TDquQd7vUnfJsTxbTIE3Ta6kWF1s7bS5uMWhM0GVMbM3LbWWUWJC29XR9KmttyiFTXeATcOOBVB6GDEipZFFNCiUehCjoSZA6OqjSHB0NnEhFVFIw1fOv74TztOyyYRbqN3Cyjecv52jxE/T7jZaMRIN/XTzUTzdmzgpVnsm6WJXjPI/JKRMP6J4hTPS98nApt2FLyRh79AVwihbVvjHGIXdMYRzAKQGMeKROazTz97+vSsauVLD/a+/N7DfmIQpUgMjgsiRQwIyhDWvm6YUcmgFZMtXqyfPL/6zp989wcffnw9W7Lw0eHkG1/70m/93f/t++/dnw77RiGEpqqXPjTCvg1eWJhBYmIxhxCC921kzapICDGArtsQDQBZk016B3sjBgoCLfO6rM/Pry6uV6uqvV6snp9enlzMhbU/GB4dHU/39q7n8yfPngVmY43EWGnYBsZGHGLXjyITI5NBQGzk+3WVrMEIxN/p7HStQFHwgoAGDbQtr8oAwCEeQEGC3L1etN4nRhMnv/7trx0fH//p9z79j3/68bpqLVEZZH21OJstbUJZlrBvQyvKmloc97Nv/cr1V7/0Tp66UIflfHV5cbk/6ldVOJuv194jUlBRINVb7qu/Wo1su54QkbXWORe/GO8i7z0gUkSzMyOic85ae+v34msenCWTGGsiy9kactY6m1ibJkmapiZGgHTlkQIY3Lk2XYQ49oNFr1f0B+PJpK7rxWKxWq3Ksszz/B/9o3/4f/o//3dZ0f8f/+W/+n//P/9f19fXiXO4Y+Nt2zZN01/99rd/7//4T4bD4Wq1YuatKBy/R4SNMda6y8vL//SfvtO07f7+3mg0ktuBnz+/rfUv7bx7A3Z4c7253gjE/yVfsZ4VvJkLvAGP4q0kyQ3WUbdHYuiIc51FLx6rRbSuW8/KYK/nq5PTy2cn14vKB3UKwBwIQmpMmqaFIhCoBGVmzyIgZD3USV4Y1yM1Md6G1BiyomqsJUMKtmkqCzZ1uSVksMtKUpcTGKQEFIVBRQDI2mTDvFMFDaIQiVbUaWKIBIrCutnjNviBTkGMUnnkKWGXShZ9yCJEhpRFeVhk435xOVvVTZMkqVpQUo0uG1YU8D6EpubgI+nZkCVDoLBeh8XKO+d6gwlezHwI17P19WLVHE0dqYqwdF5ma0yaFoPRuOj1mrZdL5er9UqCNyb2bhU6ZzQgGO6c0JG8u6HmdShkNNYYa9BaiPo1gWonrplXdrXu9UAjLNbSdDp55933siJtmna5WjnU05OT/+lf//5Hn322WC7iRK0CgopzzliyjowBIkBE51IFE6kOREpEIsrMmiYe8MX5xQ8+/OTsfN42PMh748l+MtzPx3vWpIHR2kQVmaWs2ub5Sd20aN46mE7efvhgPBlfza5Onj0LrIM0y1JrKQhHE01HCaUO4IYcg8tVRRUtCeK6bZ6enD558SwfjHqDcdX6s4uL1WqOBHfv3RlNx0pmvlxVjQIlscaJ+UiiSEpZnkcdc71eRcAWoVHVoIyoxgK1FXE5GeYDB5YEgZicAHnVy3U1X9erul3XbRuCRTAo016xN+iNijwjMN3oahRNKE5DqyopG1TEyNhWAcNConi1rM6uF/N1FTimEOsgTw/2xuNBr4N+xTErlY4cwawkBKQiiDEmflMhbidbozJ2E5x+49XdqbS6OGxUEFRSBUIfQrle+5aXi/VsNq/rejgc9vtFUeRZliVpaowFQIrJv10HR+q2YZFxbzAZj3r9nmgLEs1ivD1Ni4gIE2GSuMQlnU8tdp1uF35t29Z1ba2ND31TJkJnlLjJlX6zCXyRxOHYTFDY0WpvnIO4UWJVECnPsvFwaMit1+VsvhDVrklyy22sWxMfEVlnRIXQdD6+zbQoRtMMdBEx8ApH4qXDyUt/jYvKZooFEZgUHNDeoPjyw7dsUnz24uLsenVyuWR+dP9g/8Gdg8NJL3cOCUGYEIA4T9zx3qDfz/q9/Oxy/fHTs/PZcl3VzMAsZIwisaAIWpuw4UY0rNt11S7X9Xxd9HJXJJQndjwsBrlLSUECajvKKU/He5PhZDR8frl4cTmvGh/ayrc1GudsYi2pOFAEY9CaxjcMIl6QqNfvvf3wweHBwcXF1Xw2r+vaJRlh5MPDNhUQYdO0gzjSE7tHxjjb6/eGg0GCRJ6VLDmjYJograqkeToaFoeHSW9ALlNrg3NpkqgxbIwaQmONTWK0XWdqUhUyyiLsfblePXt29oPvhcWMkDV4FVDjkuvrKVBxfFeTvDMLp5IVfaxKLVcr8dcGFbWBxgoSAxCAtUo5BCMqVAxypaw3knJVz+Z1WTbluq5WoEiJleANIBgqhqN33n+7CeWPf/hxXQsqkoEgfHZ28eDtB19q6jaExePHzOoSOxj2i94gyzJVXVd1XVXeB+24WSiEHNfh4ANzCEFUEBjY56T7/eLuZHg4KEi5DdGBRwIoIuCMgJGNJ0BE5q2cLcurVe2972Xu7t5g0rcJCnCIp//tHtjdqITGGGs7jwBE6qUhjZh8BBHx3htju80MtjQVkKjX7/TkqfMZR2mfEIFFDAAKCgMziFI3XkYEhKpa1TUHJhDC6GNmYCU0oBgxFt10+udou7ulzs3gMODrnMXQBV2+ZDpDACToKBN6Azfb+cjvLCGfMzt8U2G/XjC6rUR3MnBsEevLi9+bPeALZN0hMtY656LaJipGFQkMARA6SteVPH18spwte2n29v39g72+0Rq1VRQgjC1JAWkCtorWYJb2rq5mnzz6+Lvfe/rs2dXF9RwJBkWxN+1/8P79r37wIDfV2ZMPz5maJgTfAnGauUGvSNIkcc4mCZFBMNIt3hoC+7b1wbetb9qGQxCJyc0qACwqHLxoPIgUWfrwrbtv3SdAM1+U3/3hTy4u/iRUfnBYTMejPM+eP39xPVsAEqARvalENxNqceZAGSggBxAlBUTZTJTh9lAbSTeR7t2ZdQENxGmODhpOhCpkgcAQqwJ6pQDGohBAmiTvv/vw+O6DO/cf/sEf/unjZ6eiYgwwgooB7xCskAdtmyDn8/rf/uEPv/fDz8bjQZokbd2Gpjk+OvxHf//rH33y+Hs//vTpxcwRCllAiur1NkYTfnFr6mvbSC9d0YGxpQxba2NaLBJFN4hzTjrX8M6KpAC0Oy+xXak2DT2NZpLuh4sKbbah+Iq+em0RGds8XiKTZZm1djQaXV1dPXjw4G/9rb/98O2Hn33y8T//Z//s8vJyCy/eEjPqpnn33Xf/7t/9u2+/8/Z6vd4lNW+/kwjzomh9+93vfu/P/vzPR73eW2+9NR6Pt534XR7FT1GHPw8x/BcTiG//xv98evFPaWf+DVWi3ojpbwTiN9ffVJkYd3bX18kmeiMd04bNE7cUUXHGpIlzhhCCCi3LZlUFtOHZ+fWzFxezsmkYWYQ59DJ3/2D/YDIcDwdxXxdm37blel03vmz85dWqbctQqQSnhqy1RKCREREnexGyPEdFRBsASq9Pz+dVHQZ5Mh72e708Dq2IAqAhIAMMKBvYoEa9Mp6ngACVuhSszbkFotcspqPcZEfDxlm5kdBUVFlDkxt3d3/atvL4ckUGlEAgDt2ysCpzaGrfNkpsiNC4xKYioKBVoxdXZepI0ZJJWWm+9heLcl424wwBOAgK2rzX6xX9ftEnheViXq1XoW1RgkVF5TiYC4SosfLoTkPxnB0Pct2Ov43VRurImiiIGh2cpK9Zo7cVhqqogPd+Pp8/f76sl1fr2WVC8Pizx9/97veulktWQVUlgxqHaH20WUcXDyHShk6iAqIqkVqbprWETx49/ejxsycvTtumSY396pe/CjbnbJD0p8ZkQZCMFbBIQUKo6vbk5HQ2nx0f7h8dTJyzB3uTYWrKy9Oc1yk1uL1TMYIRZYOdBQEQovhus+qqKl9cXn365Ikt+oPxngBdnJ5dXy8U4Pj4aHIwbQVW67psIcQXk0jjWytgjTHGWJt4H9qmKddVCB5EjKF4LkUIRn1G4aCXjXKTkAJCAPIs66pe1f56VVWtb5k9e1QZFtmk19vr5bml1CChKrN2lZnGYL+OlbH5mAqQoFGTtEqrsnl6ubhelh4NGkLl6aA4Gvengz6BiniATFQIaPMu6ya1KwJWRZVfKShkcyYVjSdtczu2sjs3Q0TG3PgiCdMk7fUGUEC/N0jTNP7SJEvyPEvTxBpD1A1Gb1cc3zaXF7Om5jzNR4NBkeW+bKLZgQwxiyoag/ErIQQiY53dLbxuDeLJrdCP3QwifHlhe3Ok/oJpxJ/7nr508smSdDweZ5kr1+vzs4uyqnIbG27bb9SNwRWIKE3Tfn8wu7y+uYkQQAmhYxlt50Y/ryJ/rUkwHn1l+3tAUDuaKRrcHxbGJb0i6z8/f3E+O5uXq+ZkUdUPjvbeOT6Y9IuEEFSMKLG3hka5Te/s35lOR/3eJ0/PnpxerH0ILbIzAqCKZIyiJecUAquwqq+kbMvEkgGxBieDfNzP94bFuOcKRwlybtAZk96dHu6N3lrsnV/Pr+fLddVWLVftSoAIDZGNPdfUOSLwzlprppNxlmWXV5dn5+frdRVCACVM0MTAg9hr2+yqcTxA44SHaJql9996azAcXF1crOfzxBCgUeMkLcha55wbD9Px2Pb6gaySdc4FsgHIGSvWKhEZi+QkDhkjMoCgRFgSidSL2ezZk+b0RKVBI6iqjKBte3G5urzKDo6JLJMVTIBAbOKSHvXHQf0agkBdSm3UY2h9HcrlpbdrM9h32SDHVChd44JtYgbD3LOp1nax8LNZO59LVSWodcMff/zpej1/9933Uen6clauau+DiFS+uXPv3sN33857+cX11eXVctTr9Xp9sqb1wXtfNz4E3uR2gmh80ZABJDBoABUiMCq9BO8O+/u9bJxZEi+qrKRkGTGoAKAYI0ABUAS9l7r15/NyUTU+8KSXH44Gh/3UUkMbjXPHaBZXVKVNUtrOh28bK2WQkEVa3yYpiXRJjBsjQuSWESpBB/RWVOiM36BGWRVBmFQJ0MTNTkmFRKP07xTw8uLK+zpNnbUEIoAMAC5xxhgFZBHS25+1TV7kq5/QzTfcPJubEYQNxP71A+DxHt5JsfuZZ/JXf9Rrv/J5lo7XlOZvri/iZcjE1CwAIOrmvYgICBjAmvzpk0eX55VRuDPNvvLBcZYw+AZJuryV7n6x6FKgbF77Hz9++t3vfvj08eXsonTGPrx7MBgUzuKd48mD+wf7PcPry6atTk9mT5+dtm17cDi5e+dIpiNrLZGJDlLjnEuTJEnSNElSB1lKHewLO2eNqKgKi2cV1ZbZB24D+xBaH9gLAuYk1/uD/UG+XPvpsH8wGWfOXZ5fLBeLiBFnVQUS6ML4YqoLgABoG9rZYsnMPoSoIHdkKN12d+ilj8fme7qzESKCCcJeDakYBgbresPJg7ffzXMOUglaMLma/P7D937pG9/493/4x//hj/7k7PzcuSTN+84WAKocmmrlfYMqvvXlJT+flUQEon1n0qzYG/bv/9ov3z8c/es/+JOn5/No+GECQUS51f75i5HK4XMGI5i5bdt4fNtO2sW+dYQC3zDNd6YrbuA2O9VNDByNfqoIrTfaoZAZIHgPoiYS6whBNy0/xR1IAyESM0dUl6iKhPhlS3YynVR19Yd/+O9fvHhxcnLy4YcfRidH9DjHp1DV1QcffPA7v/M7v/IrvxJC2HwctodTdc6laaqgl5eXf/zH3/kX//JfrKrqv/u9f/LNb/7yYDBo23aTTKQ/c+XcavV/JXLlFsT3V6MO4y/4M3afg75G0fkZz/E/s2D7Ux/tm+uNQPzm+ms6UOuGeX9T5sJNKsLNStphnSKNfvNdwgyJs0Wapc6BtoC4rpvr5ToAXsxXV6uyCaBoWNgasz8ZPbh3vD8s+nkSqRQiwsE3o9x7boJaPDm7npflipwDl4hz1qoQOGsp5mwpGUIVCczBBw5hJqGqmnE/a5n3EBLniCLIGFSYVCyANRsS4Uur7Ma9stk8orcpRt7BRmLdSIzQzUDGRDBUQmZnzP6wFxgWlV+2gSV0Q8qiGtQ3PnAA1O4oZACjmAvaipRNjPgx1qUsUNbhelHP1vWgKFQYMHVpXvTHRZETUrNaVetVW5egTFHwVum2YjGAihgHK6MUvJPNtLP5EZlogtke+jYG222NtT2obGa0QZFQVFer5SeffFKVq7ZcSFMnBM+ePivXaw6sccPv/g2qAKHRLgkuIkwUQDYKiigYBpit1svF/OPHT5+fXqzXZWrN8eHhnaPj67JtbOGSXIFigFHUmZVIERsfPHsJbVPOh8PBYNAbZMlwOpRlS00Jytu9OaIz4nvMAKwABkEpCK+r+uJ69vTFScNhuH/ESKtltViuQ+D+oD/dmwbVqg215yCGgQyibGRSMpSkaWITDqHyvmka33pQNV2CmqAGA8Fh6CdmVCSJEQJpWGofqpbny7qs27phL8IizpjCuYNBb5wXw9QZUFR+GVIaRf/4KhACkiAyGCHrFReVv1pW11WohYQMKuTW7A16037uEIQDUVexb/Hh3XYsO8DQzecduzChDb8b4rPW7Q0D26HwjWXpdnMJQYQQ0zS1xqqiiFZVXdd1mqV5L0+zzFpLFJEtm0gi1bZprq6umyZYa7MsTRPblMoqol0IUPRm1nVT17X3IcucMeYm2v32dD9uOMSfFzQBbyJ9vtAK8W721G4fdHvjxjW6yLM8T+qqury8Wq3X6bAAQpDbkhdQXNiSJMmzHLuQ1s0P3AXy7LiBXjL/UeR334hT+JJmpaigEcRjNEJdEBDAqAwSujMeGFBEOLla1q0/uZoFz8HL8f7kaNLv5zZBQWBQtqBFYlObyNE0zrE8Obue1+xbVkQ0hGhVkQAVSTYPQxkajqMvUvv1Yt2sqmY9Kib9ZJwbZxEJi9Q657LEDjKzGOTrqr1eVlfLsvXMDIGDb4OKi0/VGmPJCMtisWrqqqpqYwjAASpLsIpERgAUSJWjYIhblV0FyYwnk8PDQ1F9+uzZcrUyzmGWY9G3wzHkBWQZFQXlubqUgQBJyKqzYiwbi8YiGTRWyIhSfNEZQMForGCcM1nqhr1sf8JtLepFFJWQ0mR/3w5GalO0BtBE/JYiChpxhjFtkUlSAz0BL6FtfLtYlUFtjtbaxFKSWctEra+rtmHDaJM0LZK879IiLObUlE1onp+eX88uf/mXv/rgwdsP3tJyVc1mixfPX1wtFo33d+/fefDw4VtvvdX6R0mWojEhcAjsfeDQ9YRhw//aLMkdAh5BjHLuaK9f7A37fWcMggB6gECOBVhYmCOV0gsxkCpxgLptlzV7FufspJ+PcpcaREVVlE2Ebxz50G7V7Xys3TDZzb4baVJISNr5CfUW/3dD4r6ZUMMtRL4bUuty5Do5N9KUhAGUNxuSgKrO54u28UmWGDIiQQlAwaKJMLSNVxC36N6XBOJIBcVbXv6XdQPdERc6AsbONxCC0i4RWPX1Wwz+NDFX9dVD8U6MHr728P5mAua/CufO7Z0lJgxLZJ2xnpxcVVXoZcnRQf/gYKjSoDIoQeymqDM2YUAf6GK2ePz09NPPnj969Fx8ODoaHO1PJ5NR8F7Z39nr7Q/TwiKyX69WlycvllfXaZb2UpdaIgnqJaiyEpI11raNa6ytE2uNJWOstYlzNjqdoRMFGbozQYq2S5MGCJ4lBBSt+4VFKis//ejZ4b2j6bBvVJfzWVOWEgJas3UuAaDixqwQMzFUW992Myd0s5/C9vh6Mwt7E0mgW/NMLH6jQQlRkQBEVMmYojcYDpE5YUXBRCnNe9lgOCayp+dn89VCkUxikcBaFzxIg4xARKDCIiCiQKjIrM/Pr3/wgx+/9+DoaNL/5a+8A/Tk2eXMCwPSRoXV12BkfgHlET/v/4oacdRSo1k4AiUQ0Vlrrd0l9m4Bbq/X7CJcGDozRxdFLRJAVWTzJQKjGF3bGsESAKjcsYsQAImAOXKKVLZwKYRIE/70009PTk/WqzUgpGkaJx7jg1TVPMu/9bf/9re+9a3BYMDMxhgRMcbslvpnZ2efPfr0Rz/8wR//yXdOXjz/pa985bf/wW/fvXs3Ai52EM8vvXq6Oftq557CXdn9r2BtfQl6/NNj5n76bfCXejSvAEwQXwrJ+1lP5K9WL9afKkcjvjHuvBGI31x/gyqRyAuSnS91dckmQqTDLwAaYyKOV0QQgwBlSTKZDAfz1eW8BMKqaR+/OMsXq9PZctl4ASKkIjf3jvbfu3f44GCYkRoIXUi8glqrmVVCMqlD6CXmbLaqWau29r6VlMmyaOJcEinCqupZ6rYpy6auG2CZL9cXS3u5XNypq36vyJJUAHzbhOAToiJNRr3CWZs4C7RBzhHG0ZdYfShL3B4wHldQOVLxBKRLuUM0EAfxo3pOqCBeAcZZkRyM6rb9ydPTua+VnKiGJmiQ0HpjjTFObSfviSgiCCir1oGBEMikWR6CVnV7MS+fXs6PjsZpZjI3LPrDYjBQDovZZb1cKAcVJhSMBt1oj91YQlVUhTq8LgEiGiK60ZGVNqRZwc7ng5EaBti5eDaN2U3PGClGMSkK87Iqnz9/6n2rbUWhHaTperGyZK1Rls0cZRx/RCK0AKhCKBbIRNeDqhCiTSxZU7P82Y8+urw8Pz29aOrGEr334P4vffVrAkaBKMnJZiFoEA0i2BEE0BgTgWHL5bxcXhZ5Oh72HuwPj3qJ1xa4UWkjp0xYEaWLj1IVQEUCMj7wfF2enJ0/Pz09uboYHRwlWXF6dnV5NWuYB+Px0fFR0uvN1nXlNYgBYwCRRQOLqlrr8qKYjveC97PZjD0rBwA1FE3njBIs+NzqIDWTwlkLgbnhdrYul2W7bkLdsAQFUYPYS5LxoJgUyTRPEmNMl+7OgkpEsJm3xY7ziAogaoCMoGmVqkYWdX0xrxdVs24RKFXQzOLx3vh4PBikaLQFFUSjIdwMoFJ8WzvyeJR7u1B42Cm2t2nLIspyc3SWnQj47r+7fIpYUaqoIpGhIBxaBsTReDTC0Wgy6g96eZ4liQMDZJEiLhpRVNdldXp2HkLIs6RXpGnqYBt/t/nNIYTVarFcrgGwKApDtEmQxx2lLb503ZDdrrHiVb/Ym+u/nu0NbvKc4irFwmE0HE6nk0efLZ+fnMxn81E/NbsxdR1vIgZkkbEuy7JoEbqRm1+JY45a8NaQuLk/afMDd7Qdva00IxDEWRAjgIyKKsKNFZikNDieDAo3GfZOLpezxfrp2eXVfDk5PX9wZ//OwXhvlE17rpcYUDHKhHg4LtIsIQtNU9WhXJctOUxtaslIxLJsUEtAhiU2jAQ0NE27rNurVf3iej3up3f2h5N+1kttPyNHmmZmnAx43A8C83UzW7ersinrZlU1l4v1fF03omoskGWA5XK9Xq1VWEWyPBPRwEE3lBgkQiCV7jWOIeqqYl26d3D4wQcfFL3es+fPf/Lpx6um1iQ1/X6yv+/2jrDoqUsCECMxmriwB6QkSYIz3lg1ltAAWNIYvQvaHXFRVYGMEuZHR4d52t65E8o1e+8DCxpMczfZs5OpFj22DjRicIAMAYga4w21hAZ6rYkMTFZh169BBJJcbeIUTJYlRdG0jV2XVd0wM6gko6ndO5TlrJ1f1VcXV08/q55dWeu++Y2vT0bD/enh/fs6Hk9//PEnf/rdP3eOBv3+t7/9rYPDw+cvXizmS+8Ds4hGXjUqbM97CIgGulYugVjSfur2B8XBoNdPLCiXzD5IK1p7v67bpm2ZQ8O+Zg2AgJbQgBhhBYU8SaaD7GCY90hJvAiKAoJsrXcKtKX1Rq1AmKN1OHoIOoeXQVQEicSVbewPdcx5QIJu4klBIgcrdDoxERhDBgAhdVo3ggAqCIKx+6t+Oyd0eXlZVu3bdw7zIvWhtdbCNj9SZFOxwm4j5nbCW9z7dmaBN2PtHQZl22vGl+1+8Q+yKzh3OsPLy85rxZ2XBpBfGkbGXeCb6kvn/Je/+VbK35tJ3S+Sd0dFZCMpdl9jYSAjYK4ulp9+eu7bcHD/8J137wyGaahXhkggUbWKiYipKp3NV89fnH/40aOTs8um8b1+/+33R9/46vGonyyuF6cvrrI8PZ7YSW6c0arki5OL+dXVuN+7e+/O/bvHSeqMgQiSZWEQVg1emjZubF0nPkJqTZdlQ4QAokCISMYYa6x1LkmcyxIiay2gFvl0NL579943n18Eyh8c7aOvwnpRWErRqnojiIheNkKzqFL07XTTb3E9ouif2OpdMcty2xmK+RiKGx8UaLSwxKHIzmitCOCDX65WF9fXBCloA4hAAahV4zOT3z8aHe4Nhr1k3XiRRqWxNgvSeK0DsYnsto7PbkCoEn5+vfg3f/jHP/54/M6DO0d3jv5Wb1B8+vzjpyerto0PXuXm47qLQf+ZkwQvcateKj+2h/emaQAgZsRZa5MkMcY4a7eeiQ4TscE4bDcU3A087wT/jgWMiMISIGySXkBVRIwwiiHiOEtEkUEBAIJszOZxRib8NuhkM0ZChhbLxdX1lYpOp9PUpcvlsmmamK2Xpulv/uZv/t7v/d7Xv/51VW3bdj6fX19f+5hPDuCcU9V/82/+zZ/+6Z989PFPynL97W9/67//7/8vf+fv/B0A8K2Hm+w+2Pkzbv+wsz3hjjvq1ddEf4qY/jlL/a6gQj9T47155V/nJX+N3eEXWevp5Uf4i20U+FfqKP6ZvU2EN/vYG4H4zfU3ow7ZTOZ0x2jcQU7gVn/ZKEDRlxcP2dKF6uKw3xv0C2spsLDa68VyUddV2yrGCGveH4/eu3/nznSQGyH2pKwiWz/jVgbaH/YSwuFgcLVcv7i8nldNAMIYcaLojEmsEdEg7FU8sAcBUGEfyhDEA8Kgros89z6s12sOPkuSQVEI4CBPyVpSUFXCmG6u2v3P5lgQQ9QElUBUUAQ58iVBgZBQu+z6DoiqjKqeTJtbd3dvcHZ5uWoaICOqwl5UjTPOWiVkUuyGl6PhURQkKLQszpFzCVETgNaNv1qsA5rJcFwkozTNlKVarxazGfjGUCyUVDHSuDZD+ttGuQp0OQ4QYcrdX2MwUATNiiiqdeQojjMDACncDFbjTlCddrOVCqBESEQs3Pi2quuMDAI6Y62oAnfAWiAVITSCJEoMhhVFSYmss8RCZBIiQ6YR/eTxs+VqIW1rrZkOeh+88+DBvTt//uFnLRtjnZIJgb2KiBKIcFBhBEidY1YQA8FX6xU3yyIsB/tD066NetTOrxRxgZ3sEBVwQ4JQ+XC9WJ5eXl0uFsYl/eHo8noxm8+rui7ywXTvYDCaruq6bUWEFAmBACEEz6LGWOdcmqS9fm9+PWvbln0gBEMUU9WVkEBSlJ6zwzx1Dsq6CuxXVXm1XpW1b4MiGEK0BnNnh71ifzwYZjaVgBpBwZHeBpv7pGN1Rh+2AAUhASNo1kGuVuVsWS5q9oyMRgEROHVmOixyhxaE4tE4ep9FupC3rjySWwvA5oypL9nBNmjurcV4l+jaFaNx8o8INOovZJOEjFmuFvPZAgSKophMJmmapEliLcVuQSw7O6FAoeWwWq+JJM9MmlhjTERQIEU7v8bXxnvftg2RVYln+5fHrl5bw+3m/OiNa+CNCeu/uo0ONhOp0Tg46Pcm48ljfLZYrBbLJfOeoVtVagcxVJUuUKvbKTuRTG451reQ1VfZEvCSS/HmnourLW2jsSLkVTYg/PhrCDglezgqEpek1qaE1/NV2TTlab1cLWbL/fvHUzia0iDPnTUIiGgtpY6y1PRyl2cOm4ZIDSmBIkGkB8aTteo2phZVhdCBSMVcLZpF5WuGVc17gwyQCgspqgG1hJml1Pamw9G6acu6XbehuJiFJy/WizUHBqskNgAjAm38pGDUoNWYqqYStUJVVIi2VABRBCyy/K233rp79+7V1eWjp0+WqxUQKZEYY9PMFQUnqaCJn+QoKQKSkhEyTOgBVGK2KhgDEYWgUd0ENEqiJIimGLqs6I33tG1VJLAGJDFOklScYzQKoCIEagxaQwBoiSJBnxEbJEK0lhAhzyRh6ZZPUSMR++jSpKiapqrrum4cStHrmUFPhv1llqznM1/VV/Py448f9VJ3cLB3eHh45+6dH/3kow8//FFi8fDgcH//YDrdCyyXF9cd3x8NIUqHa6btIc8giAqoONTMmf3xYNorEqLGc+DQhrBq21ZkXdersmpazwoMqtFqjUIAFF9E0DxJe2nqLJLyZuePpQFuh0dIY4tEUbtlWSSKQorQtcBVIXY7VdQQ8Wako1v2d+ZlNRrJ0QKaEJ+XcSZJEMkSUBt0XQusIxoKVAmUCK01ALBcroKX6XSS5zkLA1jYbFa6sQ7/nEpc12b/XM/uZtJ6py20jaXckXTx1aHvl5Tfn2Ib/ByVYaMRb9pImz3uZnF5c5j+ogrEqrFEIoyKWyRhIymas7Ozy6u1QZxMRvuHe4KiBgWscMLsuKXGh4uzq2cvTj755NHJyWXeK966c/jgwd23H44f3kvqcvbiyUloZ8PR3V5qDCn7sFysLy+uAfDwYO9wf5omDoBj2yP6QqMbFAhFVEVBBUQUgw+tbzsWt25iJ5GiswaJjLXWOmeNJYDEOGMSNumo6H3lvXfE9SbjvoQ6M3D/aJ+AZ9eXy6pVVlZkMEi0HXDbRCJ3rmCMyZBRbI2tHxWNJL2Omh7PrbgR1Lop0ohx2g4ocAjLxfz5s2ehyg2JMWiss86BTRvG549P19dXxGyUuanQQtsG33rRQKiA0UWE3SE2fglw1vLyyeXJbPVLIdx7650vf+m9RRPCxeW6bTfe1dcJfz+rxbOdLnytWLnVFrfKb0T6xj/gbe8wdLNNuyrmS6VzfEJIHYcSRSVu00gksfkpIoTKRIYIhchYu3Frx0Mvbd+8+DbQJpi3a9oTUuISAEgoccY559br9Xq9bprm4PDwt37rt959910kWi4Wq9Xqww8//OSTT2azWVmWHEKaZb1e71/9q//x+fOnXvje3bu/9mu//hu/8RvGmLZpVRWRNr0M3J0wVJXb9Ge8LZviNlkUNqHWO/Xbjs55+8j8+cq+4ucQ7X5O/O7LCaR4i5n287gk4JV39q/NsfGzMBJvdrQ3AvGb629CCbIRPDHKO503qhtt7+xPeiPiIhmK3jxkkA4rADodDg4n48fp2XxVk3W1ZwnMqkpkNeQW3rlzcG86GKTGhJaEUZmDKBEhKSjHKlh8YbQ/HeyPh1eLFXLbtleras1tMAlDBmANqE0MFXkGzpCzSdIuV2tRaJW55sZfFstVvyjyLGHmum7nZXO9qqq2nfbyg729PE+ds6QxQ2Xr0tgEcEXzplIniyqQRDOKqhEBRINk0DiLrMwS++XAjQU5HGQPj8fz9WreVszRhELWJbGWj4hGkQiCCNFqE0SUBW2SZVldtsHUq6Z5cn7tTf/owZe05ma1vr44q9Zz8S0pb0c7weAWJbuz1G4IyhRdM8oR3UpIxoKyMnceZAoOMXXWkokyBKsomm1at2qc7d94ZIQt4XA4zLLkxUlb1vX51ZWvG1B1eTbIM4YuEoaDsoiyV7IBTM3YsEhTV56L3hBZYjwaM4Saq2qJKsN+/8Hx4ZfeffDwznFVlefXs5CMemRYoWHfchAJGnxbV9y2/X7v3sO3m6a8vmxbr8rsg1/NG5+zA280EHTjrGTsNsgFCdCQIlZtuFzMP3ny7OL6WsncuXv3+nr++PHTpuU0yw+Ojoajybryi1WtZIEMolEFYa7b1hozHPazNPM+nJ+flWXNItppLBKVdwmSko562TBPitRWVTmbrdb1um7rxkcLshjUfpbtjwajXlEkNjVAEkACR0QjAYJRFZCY4SwAymTQGEDbiJZe1nW9avxsXa6a1isKJYo23qcWJHWYO0yNOlAQZZDonxAW6u5XEJHNVHL8UOuWWA23B3tfUrNeVwAhRW1hkwUCRL3h8EiprpvVapWm2XQ6HY1HAJomiXWOiBQEcdMUIhLWuvZXV9cqnDqTWKJN2STCgrTj24IQ2DkTjSObOD3YOaJDHE+LyRgvhxffjC4pvPERfxGv1wa+3BBbtlRhkeC56PWODg/zvH91Nf/+D3701t3DvVFvIxV1J/SN20FANWqdOzIw3qRVbcYSI89l19W+PYO95F6B6F5UoOgnUhXSDqQKBBhP4J0FVoUdmsNeMrm//85e/2Kx+Pj5+clFfTlvZ8tnz0+uz45ndw8m9w/3DvaHaWqtSyQoIeV5dnDgOKuaVlVC9xqAgBICARjsYh7VWmMsKIOIElmxpmR5dL46vVqNcvvwYHg8KfYHWWbJgAIHUHUgo8T00x6TGQx6gDr/4Wer2odWbJIbZ1mZcUMhoM7GC8osqAoMxAybnhUiUp7n77377pff/+Di8vIH3/v+i+fPRcW4BMn6tmmqMgnBOuVugJUUUY2iRXSGEXizxqnEbHVQo4qiCAbACCBYFEKkgMBoTOYgFQAkct2ksQKiodh+iiR/IkOOVK2SFYMAYtQjEhpVQlFSsMYRqUro+k+qaEGM5taGPGdW71vU1kKRHIym947H+wenjz7zV1cXs9V5s/7oxz/u9/IvfeWrbz249+jTz37/9//1dDJ5//33f/VXf/3b3/7Vzx49ni8WImLQdJot0uYuhHj/kKoBHebJZFAcTsfctouyXKyqdVUv62bdNjZxSgAAalxQBOOMs6iCwiBMAJbIqWYGExJQHzSQgtEu4m/7uWIRpY7QoiIhgPe+S0AFIGNBpJsNFhAWDkxESCh8IzSLAitYQFAraIVSm/QpzREtGmeTNMkKsgQEjemvPc4WS5SGfasscWQYkXzg05OLpm4PD/YHg34s4VRJAkfLIX6e6HYjo7wsuMBNTaW3ukQ7+wjezAfEbVK6fZCiGeLGq7UrQKh+rnawIYK9FnDc/ZKuj0s323E0OrxZ8L/IpzMRFu5cHbEaF1GDCFr79tNHz6/q9ngyOr57ONmfrtulIUJI68Zez6uPP3r07MmzZ0+fNbU6g++/u/9LX3v/vXfe6uXWGL+enZ+9eL66nO31h/cPjp0xdVUtVuvPHj1ZlOXB/t7R8VHRz1k8IgMoWoNkCAi6k6IgqKLu+C61C/iOy1LnN42TaoDIGkLbVh4AAStFBRvAUTayvXEv7+eknv3+MPvNb3397Xt3fvzD7//BH/3J+bxCMqAigJG4tIMIjKU3ECjGREpAUbCqBiGi5VBBomnDbNi4ce3p6lsBYFRENYSoIdRVtVrO+ykSajQgKQgSoU1OPn10+eKimjdATBaddW1VBS9WARBliziODxJCIFECYzAwnJbN5R9/OP7o+Ve+/OWvffWD7Enx488e13UTu2VbGRc+L8Hy5xCLX1WHYeNK3navN/OgsHUEv7b6jdipl6S6XflTRVi76RA0qkqEqIRKQGwIBUmYxVpjjEEkQUXBbTttl/8eVeytnRkRwYIhk2XZeDyuqgoAfvd3f/eXf/mXP/roo/Pz88VicXl5+cknnzx+/Pjk5GQ2m61WK5smf/c3/5uvf/2XVPno+PAf/+N//E/+yT/p9fpVWcWW5G2nsP4MMQR284RvscI2M7W4K75vHcc/h875V7BW/6V+3N/ws85Ld+Obre2NQPzm+hvyycROML3hJOrulqO7bR9BgxjJBSxkSIQVOU/d/ni0Nx6VVasqStaLKgsGSSzuDfL7+6PCsBEP3KoIgBqisJ1bVwBAAxjUa9sasqPCvv/wrkuLZ5fLRRMq39bMkiSUZ0KWgxik1DmD6H3bNDWRAQAP3LBY7z23iXVJkZNxRFgFvpgvg0Kvl0+n4yxNDJIlUpE4+AIxaEg6vbzzG90MAqsIgImxMMjSYRli+5pAVDyCHE/7JxfF+sVl1SqYTJFYZBOfjqBISgCCKBrtOUiKKKJJkmVZU9UUWl3W/mJRe0x9s1zMruvVHLk1wLt2GBGQjecTEQnNBh3bnf23k1fU/fYI7pOtDzT6Xrsni2jIRPPv9uTDHETUxsuk4+HgwYP7VbW6nl02bX29XNV1Y+JWagkNAQIatNZZQGbnEU9ni/lyKSw+SO2lDcBgvQ/cBGUxYBOw+/ujD959cPdo/2AyBKTZajmv2iS1TEZUmT2Hpm0bEgbxhEHasq2Xh/v70pbn66UwW9JBlmYGKPhYtgJu5om0O90pEAM0ga/ni+cnpxfX1zbN+oNh6/XkxflquS76w73pXr/fq5t2WTaKqQJFKUkkhOCdscNBf9DrEWJTV/P5DIG6ExrF+l2UayJIsyLLUwGZLVaz2XVZrULwzAwsDiFxdm80HA2KYZE6QqNsJHRGRNJ4/mdhA2oQiZBFBUjIMbkqyGxVX83XZSsNA4N6RaAENOqtZIkwMLQ1cmvEISiLCAia6BAEMhSRYJE8sjMaS1vE9k13GqMhXbvPRTRlRUvx7Vrjpm/RfSgUALIi7Q0Go/EkdUme58YYRLCJM8ZGLSgCT+K4YAhcVvV8vkTg1FlrzCbnWUVA8AaULKIhcJIg3TocKxIq3xoBk623Tbda8IY08KZF/UXezl4GEN86d93A5bpjSdYrsiw5982Tp88W8/X+aIgRHaC3OBJRATLWAlL8f7v0S9m1meiNJ/3WxOJPr4s3/ddoqel6GBv9T7uR2oiXxeAd4LhIinza62UH08VnL66X62a2qH+4Pjk5vXoyPXvnnXuHh5ODw30mA8YQ4bCXUZJdz9erdSMaor9JRIBuJniMIZcYQlRUVvCeQZWIVFzD4XrVcns1XyyvhsXBZDgeFJm1jlRZJLRKhgCGqfvSW3cXs9Unzy9mVUADNnHBS9PUoEoGQSme3bsEVWFmZlEyFFQQZDgc3Lt//+133rm8vPz+975/+uKkaZr+aDjdP1g3/nw2X16eJcNB5sjYjMkJGWOdWlJCQAEySJYVu0EairOsNz0v2FjIoHMvUQBSZEQTjczaDfwCgG4cr5s4PUAiMki4eW8EkFUNABjT0a0xliGR+KAobAwRkVg0hkANIQMHNG7y8O3BwcHVk0dXTz6bPauquql8Kz/58PD4OFru5ovlj3704+Wy/JVf+ZUvf/D+j3/y0cXVFSIZNBjpVrGnjkiIgTm1rpe7Ik1Y9OnJeVmWVVU3gb0oA9q8cGliCIWFVYwCqxERYEFEgwChZc/DPO05zY0a6ZjGepNls8OVYNgoMCgCYTOz06VTEAIAKVpFZNDA3c0NwKAepQUxSo4ylw1smtukwKRnswGlPUAbS6rO6YZg0iW6jEFIJcYAxHpVRQPDuq4Dy3A4KLIMlYQxhiCRmi3O+CURJRrKOiDWzVKgtwOFbi8a29xLVeFua9rqYqyMGNnM2vkTo1GaXh85tdt92qjDCDvJlrdMx7dGXF6e3dlpX73Z1L6Al2iXt92Jd0QRBSbMZdlcXS1CkOl4f9AfJVlq0jBfrF48e/bJp5enp7Pnzy7rsi0SPb47eu/Bna9/9cHxfj+xNWqtLS0u6+szBt87GD8Y9w/Q0uL66sXJydnVeW/Qv3P3uOhnsQWPFE2jHEcEAAXiTAjo7p27nbEh6gA4ZrcGj8U0aSwQQVEUkQyg+KbUUDsUIJVmnShPcvutb3zJt/V3fvDJJ8+v0Foy2NFicENr6tRhIAVCSvNkf2/KQebXs7ZtBLpIzCAaWMV3QH+KvGAwiBC9P92YgUpgUYY8TXpF35BF9YgBUawBQNv75V/q9aZ//Gc//s6f/2jVtGCUGEwAVgBCQqNAAoQAAqzASCaoaVWRgBBZ5WKx/s6ffW9vb8JkU5eEGFWzs8hsi4etZvrzOBherTFuFGfs5PBdDdpsSBExvO7lX9GZi17zazYlSUR0bID3sUQHiITpuL2jdGMl1iptHh4ZY4gUu3QfhBsi/E1zDoGQ4n1urU3TdDwep2n6L//lv/ze9753fn4eQqiqarFYtG27BVAYYz579Oi3//5vf/Ob3/zGN7/xta9+Jc/zsizjs/s5kz9vtQ9vEIu767TuSuU/j4j/mu95Y0f5uVsdv2in5M31RiB+c/3/8UQdg0jpc+ngurOFRJItdu4GBBBGwUGWHu9N5ovVog0iKkIGLKH0U3v/8OBg1HfqMXhhVhEkkkh33EbFq3Bs6iIAcGJoMsiMOzw+Pn5yevX07Ox6sQ7qaw0APTQGjSHE1LrJcNC0mTEWAYXbxJpBnvdSU9f1cr1mra1zw6IwaRKQrparVV33e8Ww3+sXuUWIZFtRBomWow57QRtj04Ye2W2PqsCbSpw6NTnWQDzI0vffOlpXTbhclsxAVm+6YbiLiiNAiPulgmclhDRLDRmTF4fHx/3J4brFuizLquS2thAQRFBVkShmeiMosEoc/4HIjtB4Qt0MRG/8oHGSl3XbSwZANIass6AYQohlBAsDYqxOnEuKojDGWud6ed7v9cbj0dHhXlmuDBlRDaKNsAFg4dCqsZujNCVIRkVWVdvUbFSAQQUCQ2uTRkkVkdEIOsIvv/f2W/ePDw/GSZoA0rJqr9YVk8MkEyBlZgkqDOI5tBqChrZsysszmzkzGY0x+Go1M1IN8tTEX6McQ6W27lQkUkQgGwSW6/LZyemL0zObZnlvwEoXZxeL+TLPe0eHR/3hqGm5rDkIKRlEAwoqwfsGUPv90dHBAQCUZcnet3VtrUUy26oMQayjPE2yxKzL0tdVXVVluWJuSCQhGvSKIk96eTos8iShhJSAKbr1QIEMAimKdnl8qAAMJMZ6wIWX2Xw1X1frum2ZvBArAqJNHCKFNoCCUSaV3OIgS3JDBoWg60rEs6ohY5CiJxmRVBl25ml1N58Hu2G9jef2hjuxxSLu7uM3NMxdzwEaY5xLEusSY611FhGtNdul4wZxBti2Ybks2zYURXJ4MB0NelsChooIym71HA3CxlhEszmi4G45sf3m2OrfQba9Wev/K9jLXgkC2Sax3BJpoHPSTvcmk/3J8+fPTl5cnp5ePrh7x5Ihiqia2M/bKLdIZB0aFIYt3HQnp7E75hECktlSYl897O10LDoOIKh0vwM4UlW2iWObTwlFOlEX8wmaW3N3bzydjA/3908vFmfni6vZ8npVLSp/tqwnk+Kt+8fDYV8Ck0kTwYG1mgkxrFtW7hZK6E5lQATWoLNESJHiSESBJcTNTi0rLTw3s2a2bi+X7f6oNxkW035WpA5QolKeIh703C+9d69p2/r5VRsYQMgQiLIEFiRj0CAZowBBRFm7wRNBSt3x8b179+8dHBxczxY/+eijF89P6saTSZKsl2Q9dMF7v2yr1fkLtSbZO0ZrFYwSARISmsiuUYrjw4rKXSRqvCVQgELc1TcsnK7DCnbnz1H2UADcHm5RoNOKCTXqIoSR/KOKahCo69cSbuElitHL1pVISBZRjQqDYRABl2KajJyhItcsTV7kqQqQnJyfN3ULDOC5qeez2QIRp9Px4eF+UFku1jFpFESjW1VRNkAiagK0benbxvtWNETPIRiDxhiXqEJoWUW1+8dKMQFCVEEygiJNjsbZuLAZKQVGUIog4G5lx222bXyusNkdRLbdDOw0BlUUIAbiSIlHBmIwgUhdYvu2t/+wGOxlxcCkGdocKUOTIdmNBW/z+QIhmxpjQKWTnplQyRIQ2SBQe1aCXq+XuQwVRUiFVTkWaipdXh7I1jaIO/Lqdtvr9IpXknJuKMCivNlQNvviLetkB36Im6jEqkspasSIt5qZuJMwd5M8dvuEvGst3BbkoqrKENNCboShm+zYV4jFb67/sq+OCbBxuzOLiCCYtuXL89XV5QpFjo7vJFnv8rp8cfbxp49OXjwvLy7qqvL93D146/jdB4d3D6f3jyd7A0tQkTQEfrn012dLX8F0fDyd3HFJUbXl9XxxcXWlIJPJeDAeGmu6DzTK5vgXeURbH/0tbOt20mxjwsdN2GSnGt/UZ4IAcQ4VGQQlRCFOWJB5kCcWwnCQf/XL758vqifn1w1L5+rfyNF401eBSLDZnw7/4d/7O4VLPvzhDz599Nl8uUBAAR0OR4PxOMszFinX67JaV1XbeG6DbxlCbBICW2f2eoMHdybT0WDQKxCMMCkDqI/d0l5qv/TwaJAlg9x++PHjRyfXCSIZ2wqwxnnUOJKqBAoY6RukRNoZnVE0cF2Hi0swtmHdcmmMMZGl+9PhMz9dOHupxtgtPAjRbBAToBrz32JVbIxxzhljbgzF2CEmcBtRvivgdoUObjEUIrGuVkUQBFIwIIgGWbpv7xqsQKKxWYoGuyMAxt6HdHArxK68QUCKYoQJHD779LPA3vt2Np+9eP4iMFtj4hFg43ySIs+/9rWvPXz44K0H93u9XgghPqmXX65Ni3iDpd9KHzdi8EuyCHb5ptswCfi8yOufItzf0O1Bf1oP7yUv8pt1/M31RiB+c/31X7izoOGm6r/xDW/JjQrbeOpN6HhXESuDQmbN/mR4NR8vX5xrpBSBITB5kk2Gg9QQhjgDqNtY6G3+FKqAigojxjk6BVVHMC7SIaUgAbgC8Q1jEG6almxiHVmDSJC6xBpnbMIswccREMyLXpqmgrpcl3Vdg6ghzIuCWRarsq7qcl2Oh/0iz4oscwQGCYmUKeKBN7tD5yPWLaH3xpbSLfwSG9oIBgBR98fFnYNx1Yb6uonN1R37TXcgj2fQDX6RVCiwkrHT/b3BoPf++28X/cmz04swv7S+SUhBpDM4dzzAW8nZuj0Idd6dbRASyiYPAJBQCdBQlDUj3RYUTPfbVUVYyZgkSbIsGw6HWZZba8mYIsv6vaJX5AjYNE0M9gOkJE0d0bosObQiTLQJLSYLqBBC0MgSQVLDAC1DoAQAScSqpgbfvnt053Ca5mmrEuHL16va9YYmzRlAJagyKhOoiHBofFNL8Ms5vQC8c3w0GvZ6TtCbPEGVGjuhBXTzngDEbB0TAFdVczFbPD85rRrfG/VZcLVeXV7NAc3e3kF/MEAydd16BkUX85siZsMQWuey6PGu66aufdNgV95tuyaiwAbBEoSmqdfrtq582zRtbUky54ZZOukXReay1KYJIQgpkwoJoyoDbZ0MMU5PgADQq2kYSi/nZXW1qsraswCQZSBBNCgqgKgEiioGICHY6/emgzQxHUliU0RvEaNbo/CNB+omgnLjGtsaq2KfZHvuhddWOJvY+t1Uhy2GFYnIGCQiMubWsbYz60Vpt27axXIZmPu94nB/fzgYwA7c5iZ7XoG5mxqkbcDeLb36Vlrd7rUtEXdqvjcl2BdwM9s9qO4eEl7SiLGz/8p0Otnf30vTbDZbn55dtp5ttvGebNyFOyd2JDKCYZOfuP0MdAoUbpM6dw4nr6YjvkQP3LXkbAZDoEPN3hCTQW9i81QFksRmucuSZJhn037vxVl+vVityno2X67KclU1o/EgS3NhQSRrMLG2yDOhIG1g0ZhBi530BCKgbMAQEhl01gIGBmYNcfYERIGDtkHaUJaNX1ZN1fT2RoMssYk1BoGQLcHxpHjrcDRbVc8XrW8apCgrbDbPjfxsYgMO2Ci61E0PDu4/fDCdTln08ZPHJy9OqroCIpOm5JIgQtb0e4UXXq+WOJ+b4R5mDoHiLPNmfaHIS+xWNYRNwGcXsiA3RzC9uV0QpVM1OqVwlxkSiQHURcN1qr1Al1YAnSQMetOb6GI7SRVoY1ZVUI3D0kYl6uKkiG5AQ0QkKvOCV/PV1flqMUdWBwZEvfdtU3/62aPxeDQajes2lGUdvBAQaqdIAHQtsDaAZ88hcPCigmg6hZsQDQmoiCqHrjOiqCoIZECdwcwkw5SGmZ30ksygAdks40aRYkGEm35bVGY2b2jsJW56dPEtjfUbiAC0EhoOjIbRqkuSpIc5ppgM9h4m+dgmGVqLZAESBaPdrq2bsoUQlKJjevuqAxBZAkKyTQitD0jojDEdAb/byzbDXzfHfr1Jk3v13L6dK9Bt/dvVD52yzNKloQIovfq5xhsZffOTVbkDIQMR3ILM3JgNbqVLvdpPwl3MMETAteItFSHCV3dtxm82tS/UyYyiCTR2x7ujAFU1X11UVemdUt3Wj5+d8LP1k2ePXpzN1isPmibGjoa9yajoZ65IKHdkCaRVQPIBFvOqLEtjzWgycmnila/n89l83no/HI6Gw6EhYmYgIoMqtMkzNptHERMyaNv50Ns34Ca2BHdk5E7hjbVXjK+z2KVPRtMxCxBCnhhUJkpG49FgNLSJ1VLiR/tGHY4vTEeNECIssvThnYO9QW9AVc82T55JXTfO2q997f379+/3BgMOYbVardersmrKpl3W1Xy5aEIDgIZM4uy0n791vI8S6vXCWKfcKregASAAIoLJyNzdy/UrD4qUfNvOFlUZxJAVNV2EJZFqwM3ZmKLZdvOKAJGAVN5DYIEudXDLefi86LPd9eFVM+xrxcobOGQ0UhBFtVRFWCQO7TBzFIhFxFobZWIiAo0HS3y9Bt3956bBptqt2XKzNGo3FigqwCRdm9UgKqICxj9sIw9kN+56gwTUDusIbVtfXp3neTGejPfXq/Pz86qqwLndJ84iRVHcv3dvMBggYghhF+r1ssetG7m56aPhTcin6itq+6sq8y4l7NX3aKdxePM9t79ZX/OgYCO+4M75ChVe9TS8ud5cbwTiN9d/xmvjDYw93lha4+6gbsypg236c3dc6vbBmHalBoCs2R8OyuPDpxfXQYGAQASBUpdmWSFBDCto3Ce6SpwQpBOZBZURVZEUKNZDyOoME/rDYWJxYixcrZqrVSgbT0yGrAKoADpyxhhjhYMIhhAklNNRfzwaZ3lqr67OLi6vZ9cqPOgPjUvqupkt19fz+WKxmE7H+5NJ4mwvTyySxJ+oCgJxi9Et1BK3f+/Oe7jZzQTVKBARKOcuuXswWVftxeI0KIOarRixPVAQosaQuc60bYTFOfvWW+/evX/3rQf3FeAHP/rQNbPjQbKfECCixF+PEYmLKth5diM3EUGBNluuaHyPKJqIJLImFZUoZgqzYmBufGuTTBA5yoMiZO1wONzf3z84OEiSNJpDnTWGUEFns9mzZ89CYFQgpCLvFXnmPQdmkaAcbw+WGFRrZAMtA4PEAGUjMfddhAE0tXg06fdTE0DaILOyeXG9mle+mBxTlmkXf8gGRQmQwHPwbS3eN9aerCoD8v7D++loYNimWooXIgAlUY7FikFUQEYCpIblcrZ6cXJ5en7VH42McYtVeXF5vVxX4/Hk8PCOIpRN2wZWTAQMAIqCiCBomrii6CcuEZbgfVvXbdsYoh1AB8SkDiDhpqqbulqWzIwqpJo7OxkUe8PeKE8tIUFAaTv8rwrGqCgkH/vwHQMz+p7sutF55a+r+mxZrn1ANMYkSIkICqpB5NB0Hz0QR9jPkuPpeNojt4ntQOzSizZ5UN1pdnPO33yWNeY6b0uWHaYM7kiw+HkH0Jfjj+OdI6oxH4OMQTJEm3CvjjeKndcTqa7r6/mCRXv93v7B/nAw0BBiFDXhhp2ymYvfJD7Tzlwt7mh1N3aV10nA+kYd/uJvabedONvY7hsVJp5UCZRlMh4f7O/3ev2Tp+cnJ6d122Z5ARhnNm4gEjG1GxGdtdJ67RgUuJsJs3UDRpPftjkRTwifR/3b+QjpS8PiN0HVmzhV6KKxI/EdjOggSQb7/aPJ4Hg6OrmcnV5cn1zMF+v22Yvrk4tFXhR53ityV+SJMc5lSe5cqFptGbyoQMdgEGXRFoO1ZKwha4gQDCMLgPdtYFVEEnSsYd2EpmmWZbksq9Lr3mg4GtgiIYQAwP2UHhyPr1fV2fykLiubWEBEMjEnFDt6A6ZZCgocgogORsO33354fPe4adrnJy8eP3pUlpUgGGts6sBSHdqU0iwviiCrZVkt10nVZBNLQEpABN2CTB35qYs26PSIuHMSbuDRCjcvs2xvjK262x2CaaMOQ5S4cdd4qhF/rLeYBJt1sEMkbHKVRLvV0EQtmlCjDxAAAbPhNMuyqldcPXtyenVdeciNsxQzDiQoXF/Pmsb3ev2JD2dnF21TKYBBu7WLigQRZiFRQURrrSGKh85NLx48B1BAVKJo/o3cJXYGBkky6mXTIiks5VZJQrfuEiIZAJTobt8McGytW9CFmCJZE4kQXShsFLJIAkgtTaWeXaKUGJun+YBcga6wvUPEZDO8EvuQtHElK6ggIqiBuNEBRad0jKcy1hEZQCzrummb6Erf+nd3lVYk5Ag+3nYJY6mEcKtdFBGmNx+3Li4yyikiohEC3kkD0PUmt/PImxZFrIpv8MR6a5YBbzJdN3GXNw3+G1z+tpW1q9FsBZHX5NrfmlKXN/vaF2wjU1FRiY5MlhgoSlUls6s2eLDGPnn+9OPH9bpczleeDCVperA3HeRZPyMI7dmLp9Qu+5Z7doJCiklZNvN5GUIzGo0Ho74YXrft6eX5fLlw1h3tH416Qw0chNUYCzaWjoSG0ES6vqpqzGHrmn9bcynutC3i7d8Nk+00ZgnAxDE5QrCogopEgEZByBjnDBEAgUmcTRPjrKKHra1VAbsjJEnnUlYidAYttD2bfPXtwxzLHJuzs7M8y3/zV7783jvv9Xr9EHwIPrTBC1chXC6XL05PymYNCNaZxJk8cZaoXM2q5XWe54SKwIiCqNT1BtEZ+/bd8XCQVeX6z3/4pF1UjCRgWFQAjAFm0c1KEs9m271BEcCQ6muE15fa2K+Ksy9D0l9ZBG79E8RtUwERo/gbvcNxNQshbD3L3nvvPQAkSdJFywUBuQWR2y4+uyMT28oG5Kb6jneCAUFERUFFpYhm39Au4ouDpN0QxM50YvejJdqxRBCAAaRpyTo7Gg2NeTCfzz9r2mgQ3hZdopokyXg8Zua6qvM828IlXkqAiBVa/KuoxGxcgk07WeG1IPjXvh2vpYe9unQj3iJpvDqcfZP5hHFYjXYPWIr6ygP5m6IR/6Lsjp/5E35KGf/meiMQv7n+GvXhTdQWvDJosZNOtxWJVOOwW3duRkTTMZh02M/ecsen8/Wjk+uyZRVRQCGjSDFDAICUTNTBiBgwzjmqSFANiAhoQQHRQMyCDQzcZijHk7Q3unc+b3746enydCGMpWqaOueseA8Kim3Tctt6ESbVx8/P6zZMp5Pjo/v9/uT582er+fy73/v+4cHewd6esWaxmD85OX12enqwv3cwnR7t7/WyJDVO2BsFS50VTTaOYegMKhuZWG4O8aroVUUBjCg0wzy5dzC9mJUvLleABGRJO0CdgIJGSY66fVHRMxdF/vY79//23/r6cDhcLZd/+O//4D/90X8YJfyVt4+++d69YZqiNJaADEGEkv3/2PvzH0uyLL8PPMu9trzdt/BYM7Myq6qruptqShyRanI4rSFGJDCAJGj+zvlxAA0GGFACAYrDJpu9sLqrKiv3jM235283s3vPOfPDNbP33COyqkg2JTLbDYXuSA8PX94zu/ee7/mez1cVLSX8YSfbmUoafiVDFw2jgiGh90GwaUK9WV7O19tagDmGaDGuVmufK7mM0BGhURwOhz/96U+fP39OxNvtDhFFYgzh6vLy+upifn11c3udOs9migjeudz7umaAJHinmFs11VGRPz2bTUeFZ2bm5Xb78y9fba2JZojiEB2nc4XWZssmXK6rm01UzifDUQQnZgSAaXAJAR1zlrngowghkqM3L7+dFvbR45Pzo5GuQ4iUUo8QCAiAKCa3tkIl4Wq+/Le/+uybl28Go/FgOLm5XVxe32531Wg4/Oijj5Hzm/ltHSO6hB62FMyrIkyQ+3w4GBwdnyxXy5ub+Xa7IWJi7qozEwkA4hEkVMvtBiVCVBbLmI5OZ49OJ8PceVBnEVNqjxlxd2YyNCQzVFU1MEJjVuQqwm4XX10t5tt6EzSgZx4CYoJstjFSEMlEQ+URR2VxdjSdjQYn49JhVG2UkImgpTZiN4a6twiLCFGLUenhnG3jpvvcdH7r5Oz0H4Z7YyPue9utKNwbKDH1Wdh5n2U+yxIHGXrdtjX3mZEh0npTXVzOmwB5XoxHo6LId+s6hRF570X2A7ndYasfebtvCLtXV1M3jvtrDh724Lr6G6AX33/Xk0gkwZGfTcbHR8ef/+rNZ1+9ens5HwwKRjSFPdg9HdcJvPdlWTa7SqEtLJA4CUntFCcAGaVslv4m7Dknh32Lu+mP2BUw1IZuH8bZHXxe93WoaxgqxIoQx1l5+uLk4+eP1rv61fXNN2+vPn/59maxm9+ubhabPKdykGd5lhVlXozyPAcQkCaoqIhZ8t5CXTdRKMfCEYAhsc8ICJ1jEYlNU5mJASm7xrCp46paXSyro8ni8dn08fHodOSGnojg0dn041q+uVh9e72KBEBMxB6QicwghhhAp0ez6XRSFqV3fjge+dx/9tlnb968mV/fxCBAhsh5WeTDkrN2XFSR/GDsIjXoAuDAs0PHew5mrza2YWiIoGrUtmihDTHfTy11pXv3kqZ1IIUQ9oVlFwrXW47T0G6vZabEnhTj1iEyU9eX9sk8amCi6f1SQUtQDgVAFAT1JR6fDdk9Qf/FNnz8wYvHk/LNq1e//PRT9nlRjqPYgPxoMJyMx5tNlX4pMxWJakE0ghoyMTsiSjyNtOa3RBIFAyQHhiTdDuCRmPR0PHg8m8wGOYeaNGKIQOlA54xA8dBxC4dc3O5OJsTEZcb9YyZATEAmZBVAjVl++jTzI+Ih0BAwA/JgWTtdRWmj0V627sTTZNFOVjgTMTJTQzNjdllWNAYvv/n2zZuLk5NZUeZAGCU64hhDtdtlGXW5C9L+bK3HnxAU78/x3sENw0GAkohagsz0cC6gd2xldjfOvuvCYtsZSroMEbd3lBoS4Z0X1g5SWO1dgRju2tMOe113tzT7Pzic/uH6a71CE+qqMmqTw8SYCF2Wc+YapIiIAJ9/+xoQipxfPB8/ejQ7O3s6HR3FEN5+88X1xdsc46PpgMkkBAQxxJub68XitijL45PjvMhE4tXV5evXbwD08ePzDz/6kAlCUyXgNwA459JwRi9YdxF0cEf8urO9JlcRwnsSjs26eRgzNRVgc46IEVEJzTE6QsfkHXhmAlark7WB2n5se8JsI2cRDTTGCAgSwzD3v/PJx0ez6aeffjq/maPJejWP9UZV0wGUiVjFg5QZZtmQPRsogoLG2BiImJpnzouMMO0cimCEZInaj3E6Kv/x//UPj2bTf/mnv/zi9cJQATmqSFRI0ycp/uXgcLw/YaIdJn2kxzw5ee9TsL7jGIN3AzDtLmK4jQ0ASGXaYDAoioKIErQXEfM8d87FGFPjPP1f732aFlXVZBO3/pDfKaqpeZb2tHbgqMv7O8TdtADJA8xxmqSB9kdqqRR7s1TXNb8TF99uNmigVtdNCFFkPB7/wR/8wXQy+/M///M+XySKcObLsmxCw8wGpqae/Dshcok8uA8uST82EbUBKn1j77fQNL9Lxz/0CnwXXuy9CumhjeDfwwbxW+qt/5FMGA/Xw/UgEH+ve9Sd04GQkNqRTNsnYvQLUKeItlOpKblKzQxZyQARHVrhaTod88UNmRqCmNyull+/ej0dfpAjE0FbGFhEVSRISbP9lIWBpgHGDqqrYJHBVISVPQSSmrQxpBA0qvjIZZn5zIc6NCFEVQQCpE2lb66Wt6vdbDIqy/zJk6e72Wy32Vbb7es3r0ej0Xgyy7J8uVy8fnu9Wm13VXM8nUyG5SDLyswZSE/R6BxdyfmhKITQ8g0hSVUERhRToaiYOffoePbxixjl5ZvbDeEAAZE7LgeAGTCRGgRTRhpNJv/gH/zhBx888WRv3rz91S8//dm//av1qrJCfv7Fy1hXz89OnpwcDTy7lKGKaqqIacqLOvMTIZMhmUEUC6JRcVNVy83u9cVN3TR1U83X1c16B0DOsao2dYOce06xEZB5//HHH4/HYwAgwjzPlsvl27cX19dXy8Xtdr2OsUk94xQvtN1sGNGxx2T/aYX0xODSwvPZbPzoaOwce+eWu8HF1XVYbtI+KIARcCfmxHaAgXI3zNyWbhbrchey3CMoJOOSGhMJkM8y1GEDVIdIABnZZjGvBmQlFIXXWFhEDRWAIBIgRjEkrEO8vl198+by4uaWsnJydLLZ7W5uFiI6m87Ozs6R/dX1bR0TMJoBydTUooEhGyDWMa53lc7n89t5Xe3SbUpEIoKIppbOp7XUGCqUxpmMcz8qitGwnI7KzAFpQJC2ciMjSIhRUCBrkzuckkawIBDNKomboNsm3garjY2d48yAOmFUVaPGyKQsgU1Op5OjyfhkMi4zh6EBEnRsYCIKKmiG3M4J7GtMwG4w4Nc1jvq5dzikTPRVdG+vP0B0dTNbdGCj6EJMzNrb9fDsDAZm2+12Pl/ECEyOvQdEEdEk0SGC9efnttDvzmEHSRl3qALttzj0DtzVOB4ON38jrr1r77CIaluV3Y2pMhoOHz06zXK7urn59PMvH52fHE2GqBZjUNW9NcqAELMsIyLpdk9VuVO/pbFJ3gtG+zn0+672O7srABK5rgWS/o7uPCYHE+1tkrygCTpPaABRLFTe5ZOS3fns5Gj0/Nmjq9v1q7fzi6v5zXK3XmzR7Zzf5WXt85Io88wEGEBEFAkAUcBUpa6rKEzknHOpxM9zh5ghagiNWcoyJUBnZhuFalkt6ubt/PbpbPDkeHg2G/k8Pz6ZPX40vVptKrWUiOmcG+Y5Ed6u1nUIi9vb5LRVkcVysdqsl6tVXTemxkjkyAh95ti5tFgigBopUX50ysMR5kUTxRUZsWu1BkAkJmIkMuxzjPaDox29o3UIa/dXiKig2LGrFbtYWpMkOSsgKRmqUS9ntl9dDIhMUh4e0p5WsA92I0r5ZY5UTRSM2tMNEqpJNAhgxjkNjyZP3Y8x+/1PPvrx09OvP/tVE/X68tp7fztfqBp7d3R8cn19WzeNqohGkQggTEiOidgQFch64ZY4rfLdDIa07lkgBFYVp3HAUGDkaKQNJfUUUv5ea05OExzW2avIOVMQVWpHQUBEQ5AUa9A20ZEYnRky8fT4yemzH+HwKUIOmAH6lGTUYYn27LJDqTY9RqkpAKklrmpmDjCYIYLzvto1L1+9vr3Z/v7f/+loNCIiSBgNVSSylM1kAkYtQ7gFfbTzTQfbgR3SHgz2B99DTZYIO3n3vmXv3kQ2dm4CgkPABfSqAbXG9n2H9b108neYpNaRPA4WArzfBXvY2r5/exg759kbMnOhQPNl9c2bm6/evAlkDPiDj1588OGj589Pjo/L3WZjkUBpJxGsIZLjo/FwVDCRajSJm+3men4NBEdHs/F4BGDr9ebi4gIQTk5OHj06YwI1xYObutuO0iNovcj2blejW/HssFHxHWpaG3ysBgjmiMjUJOTOTY6mJ8fjcjjMAh1Np0WWm2yQrQe/YOe+7/Iz2s6SJ8y8AwtMdn46Gxa/+9lnn2eoHsSTGhgTqUqQEOpqt76ttiuXeyCWGAGMERwSMUbtjptoYJYW9W6nIDADrUt2f/CTj4o8K/7886/f3CzWNTGIWQBVI8NEy8Fu8KId0j3Y9fcrTLe8kB7oqvekQ3jHxnu41ByG2kEa4TQDwDzPi6JIcnByDR/yjnsM8d51kUw5xGpiZmlOgpn6b9se4xOaKnlcEs74rq/1HjSji2noGwN7J+89FAP08MXOb2sqgMCA291WVMqi/PDDD0MIX3zxxXqzBsAffPTRP/yH//B/+n/8T2dnZzc3N2Dm2H1nRXNwJLv3rU1TrUGHhpf3OOUOxOXv0lIOCJr3iPbvUXHb7/g+Ftl/4hrx/7Hy9MP1IBA/XP/7POgJIITU99feWe+7iADoxt+RiNP4oZiZCmhEYgAFRRAyCWiRUJKN5Xaz+dVXVZHRh08ejQYFYTTANNVHkgZUCMAhkoFYSuIBaVEW3dAcIWaMg4xnQ/8aqiqK5SWm0KrGSsZGYzQBZECnwEE0bHVb7Xa7ZpC78XhQlOVoOIwhht02hrDbVXlePjofrVarzXr55Tevbua3Z8dHx9PpZDg4GjAxdij9ROGyFnyVDuvabXho2k5FEoJj9N75LOdnj2YhVqvNuokhHRqSkYWozX1Q0EFenj0+/93f+71/9N/9o221/hf/2z///JefXr1+G4MAwLaWGGNdX7y6XD4/u300mx4fz0bDghHJkBAcEQKJqGhbPdRB1pvtartZrjebXTVfbZeb3WK5U1WNTS0QFJU9AmVEUU2ieo/AGEKYHh8/f/7cex9CqKrq8vLqiy8+v7mZh6aJIZipI0QE730TxNS2u43EWOaDrCyhYYnBVMWMDAiVyYoMBx6IhBCPh+UnTx/F+HK+rXaikXwgv1HOaTA4Ph0MZpNA16uf0Vp2mxBCVWSFZ0I0ETUwiQbgXFaAWrXZmEldV84GGOu4WxZlUQ7GseFaokprlnV5FsWu5vPPv3n16vI6Go9nx9sq3MxvQ4iz6Wx2fJIX5WKz3okYsgKbAJASIUgEBCQCwBBUNrvlals3OwLIHBG1CekSxVRNJFa1hR2HejLMj0ejk1E2yDj37EnRzFTQWhwwESWatBqkiV9BVLRo1ETd1LFqtBLdKe4i7pQF03g2AYAYarKymaAFFp1k2Ww8OT+eDIusdEymKMp9dDSYqZgqsCOi1gFMiETJH7eXUg17avN+WTAzU7RUbHdicYcQv7tGvG8IizkF07V+Euj+0CMYzZKUDwbr9ebq6hoJpkejvMgBUFUAFIkQFQ7yvjRNGlM62x2QL+7YWaAL27dWAAABAABJREFUsuPkUGgPtdhZWvDeWfZhG/h+6sL378m9469zC4oy02w6efLk8XA4vF3Wv/jVVz/96U+m4zEQmzUtPbErkp13eVEAopqlQFdVOxi678lLLcj2sAL8rgoKWp9Oe6+2JRy0yYzt/bm/R6kvFYFIEwKWUE1jbBwCMQ085Jmfjo8/eHzyw2ePvv727V9+9vJqud01oa53u3XNLs/L0vmMvXfOsXNRRTQmsUvNLCiAhKYGMO+cK4rMe8m9cyRRoqqqiaQBTwiq9VZWu93tcvv6ZvHRk9PZbOqy4tHTJ4/W4eXbK1PRqOPx+OmTsywrPv3iy7DbVXV1dXW1vL0Fwzo0Vd0YIjMxMXpqAQ1qKpGJkAmRG4GY5dnxCQ8n4vMgwqbECNBmATE6ZDpEYLXxlekNgsSl6QaCOitxu81DO0WVJnOtz5QxIABt2clAhKhkHcvQHQjB3fBEq3ZqMhUbQBoaImp7yZKS3FlRjSTRKAQJwNHEz/KBjMcwOX7+45/+14386f/vX66Wt9fzeaMymx2dnjy6uZ5fXrxtYi2qBkDInlwa31GgnoeVDnZM5Mg5ZkBrYhO09wRbppajOQkkNRODNAao5FpppMW7K7RaeDuEi0iWKFZqZPeaiW22IQOToQAi+XJ0Mjv5AGhi4AE4vYaImCaQOhkF9wX8figl2cATdlVVFU1b7gcTMUe1xe16u9MffPTReDQiBJFoziMnuguoqkVJ9vsUh3SgYel+47rrf+yakL2OANjG7/aP7f0Sv4NB3yubDzJf7/FtEtbZCOHODM676vA9j/B77cOHGvHDyv+928iIyLHLiL0iZ8XgzdurP/43v/j0m6tX1xWaTob5f/uP/uHv/e4Pzk4Hi/nrLz/7vN6Gpq4ZYu5xmLvZZDQsM8dmKiE0l5eX2211dHR8dv5oOBhuNus3F2/mi9vZbHL26HQynaRKgtpxBLROExSUPryMu2TGdKy6u7X1B639EAAQtQ/Joc0dQc0UJO2iEhtH8Ozpo1lBo4HPy3Io/vT4aDQssQ1xpQPyD/aDBoDAREXGmePMUYaIJsw4OBnn/FGeZY4iKjIAmRAaM1QgrIEkOEXSlGZqHWQekzys6eQMkgRog1S4JeKQmDTHg+Lv/O4n5+fnn3315pdffPPLL79d7cSzRYLGQBQO7RQdHsoOrReHoR3QBda9y89FROlm6PoV4FBWTowIODjZOO/LshyPx+kLpgmGrp+tyS8cQnDOjUYj51x/gEFEdsxE5jpSEx5m7ZoZmMh+zUwB2G12HexnavtFKiGH0LiLC1EzIFQwMmJiZu56CumMZV0norVmiQorR4kiEQyKrPj444+J6dNPP/1bf+u/+B//h//hn/zjfzIYDi4vL83UZ945Z6ZE/Tp5J5PU9rG/KeS+I/OA9WH03/Ek3leZ4X28iIN9po01PnzL4B3XcM/1g+7e/rVSzZ345fc3A//30mn/mr91h/9/uB4E4ofrP0mdOI3G9GDQfTf44FIzVEJwzK4ds2yrV1UFQGsNjkKUvJgp5IrWjfzq29eG9Pzx2dEgRwBUAWRt09/S2SOtjwJ7ihN1Hl0AQ0Ye5vzs7Hi92X5zvWxQgAjAQmMAbKrd8FEqyByYicmuiqEJTQhFmQ/LoiyLwWgKqqpiKgowHI2c581qudrV9ZvLbdWcHR0xDoa5yxwnNW0/U2+t2wT3lUabEqdIjh37HBBVdODp6en04mL85mZTG4lw6yVCVAMEGA1HLz744IMPPvrwow8ury9/8Yu/+tlf/Gx+dSNNMxpNVHVXLdTCug5NiFUVrm/Xk5vlZDzMvcscZUzOMYCFIHWIjUgUreq4q+qqqjbbza6uN1XdBG2CqkQQZefLPEf2VV2jIZhCG/nNRJgVxXA0RMAQwtXF5RdffPHmzesmRGpfUQA0Qp7MZk2z223WVV2J1cbOkNF7ZNIYNaiaElhEiwARjQFEQ5b7o+Oj2WK5DXHbNEFtHWJwpZ89Gp8926jbrG6D4HhyFJu63m4douccTRkMQX3GgChCm7pGQlTwDselz9m03lUa89FRXgzQJDS1qpB34+lsvd1tmlc3y/WmDpwNg8hqtazqZjSejMZTx367a+qogGzAiAk93J4Pk2Mi3ZaGJqDEid/YDomZqcRGY9TQQFN7sOPp+HQynA78IBePyiioQogdlax11KopABmzIAmiIInaqqp3Vdw22kSoxSrFRiEKAjhCAgXRmICPYJEleLTTyeB0OBiWPMp9RkAa0MwRInWe/NQaB0j1aLeFm1kfHAwdBuyeSNp1/Turx93xq3ujr3Bwytl/mDmFY4CpJqIYACAfUrYQgYHYDHbbZr3ees+npydFUVhHt0yg8o6TuheA+Y68jb3L+a5L431CIR4miz2U1X8zVeOOtt+21WBQFGcnp+ePn3zx5bev3l5d3dw+OT8pPacx2rRc9/qX95xiuAGR2tjvVKq16JQkHB/Ofr7j+8N7CTP35kY7PajT3Q7G3u/CBhESKzGN5ZihCqVwWEPHVHouRoUejasnj8ajZr3drba79a6uYqw2K2Rmn7k8Z58ZYhu+lfQ0S18ybX0KpjEGRPTOO5d51SjShKhB0AyAzDiorENsllLHm+HVthwMXDF8/tFHXI5ev3pZS53lfjqbjKdHb29v1yGEKBJjHUQlebDRABWIkBWI0hRIFKwDozPEWiy4zMYTnMwgLwDZ0tasCsRAzIn8Cy2G2LoiOiVltnyJFh+x56W3Fi/sKZd3sB/YrSEdHkpFMb3FbeeA2jxOhS54CFs9tftG1hJ8NMFwASnRkRUT3higRREQoqeA8Lqq6e3l4+Hg+Q9/tJjf/OIv/nRbVbIwYjccjU9PTq8u3ppGBGRix5ljZxrNFAHIOkHGgIAydt577xmJdGuiAczYzIENGI4Hw2HhPQJoNBWkBKDAPebB2letAzdb6xcja6m9BqkU31OJgLgLD0UziSBKAN6A2wzd9tbtu4z43YVlLymIaAQV4tQ0QDWLoiGIqg2HA+d4T8ZUY+eZHfXMioPxll7GapHTXehjv+2lmD3VvRqL7zFMYa87vJvY+h0FMx5IzF2GX68EvbM+wJ2JcjOD91Iv732DPhHx4fqe7FndvBcgkcveXFz/1c+//NXnb9eNHp0MN6td3TR1s3UOh4NiswSHFkxyh+axyFgG2Ww6KouMmUIIi8VquVj5rBhPpkWRh9jMb+c3N9fO0fHxESHNF/Ms85PxmBhFJEZlx845FRVRZgcd8oh7Q/3dq7tLqdPmEBFFNDmQWq8PE+zDJNukMdNoII5Mpdmut6HebSAPze7wsNgx4dMuyO3ijuaYMseZd2XuB4wOvc/YOX8ym+y2W4kRLCIigjKSAnoGT8AgaGJi7TyfGiAmGHj/2ndZGmpdvjECICqaqjWe8PFsWOYfPH50fH42/fnnX9/cLle1anvcxTRl2EXVYbsBdGpjvyC8exJIJ4q0bWnLY6ReyU2+h14gbpomQa5ijKbqnSvKcjgcZlkGAE3TJDB9EpoPGtKUKA0tpDi90KrMDJx+zf1bfCCAKgCoiL1fGewmTLt/QojJq3E4wpX+LCLK2tXTLSoE2uOHaueDNlPpvoIZSJA8K148e/H82fM/+qM/+vt//+9PZ9Oqqjabtfc+yzLYd+fvr9yHrpZuGsP27fZfK3Heg0V8l4n48D2E73B8Hy7Xv/Eb/frV/n5p89ensd7Jc/7ufeevzTiMD9vWg0D8cP0nqQz3Mk+qNvWdp7UzThiYmgmC8R5+2/tlUj2VLCFAiICdxQSdqF6vKvfmGtn7x8cDj47QjMT2o0Pd1plKOe2ByN2AEyKARzqZjH7w9FwRbxutogXRECFYbCN1W2+QplQcE4pKGkV2YRekaaQJOiiLInOZ96YxipgpYGGmdVXVVXV5u4hqiHE2KkaDYpAXSASqYG2qaNpVBJW6EBgEABMiZsfsM4kSYyDTaZk/O5vt6mZexcoCmEMmA3DODQeDs9Oz58+ez46m22r72Z/+6hc///nrV6+1EYecZcV4MvEZqtb1Zt009fVytaurq/V2UBR5lhfeZY4ds5kGiXXT1DGGEEOQ0EQVCSGRmyIRFz4jzxnRaDgcjodR6dXFxaaRlBdn2iTBzXlHjjPnm7q6ePP68s3rartFx9bWwwBgxDQcjxSG4Li6lWgWOdnJkc2DKHAEFVNUV9TIFbJDBVMgzEejYjik27Va4CzPhuN8dupnj2oaXM0Xr15fB9HRcLiRJlR1XSGT5d5lDsAsyxwQVbXOmzrGQBanpR+XPiOw2NQhoCvLIi+KAbMTFZ/7YjjeiQlSY6BIiLDarre7HTs3HI99lge1qm4EHYLb67dt5dvyhRGFEAEUSAmQupwFBNMQtKlVGoyxdDjOi6cnk2mZ504ZNR0tu5R37UkLKd0IkCNSAAgCjUkTbL6udlWsI0bDoBiMBEAUWyYpJrlG0DRDyRwM8ux8NpqWuSN1qGhgFtEM2R/UmmaYoiJS5F/7eKglFAgchNC1zftOKu7/00A7DjegQhcT36vNrUprmCaCWy5M+xjTwZAitcnXvYu3z3+iJth2W9dVXRZ8dnZcFBmYghoBpZM9JCaaam/3PTx3WQcus0NgeoedvD/7hr1LC7tIMHuwEH9vNzez9x+7D3sdZt7xeDx69Pj8q29fv728fv3m8sPnTwbHY0RKiZr9LoUI3EXe3akssC2AU68EW9nw1525v+tn6wcz73DxDoo07Ib+O8BsS9w17HO6EcBQlUkzgtLz8Wjg/WAzHKx2u+V6u9zu1nXdRJVQRwmU5ew8sUPu1qgDSmKMpiIhhsznziMxk2NGYDOS5DDFVJMJ0C7EelG5VZ1n28fP8pPzx64c3dxchbrxufN5gVnmypKdi9IiztsgSkZDNGYlp0jpBCGiUEdkMVYA0KLE0ciKQtkBMpFLiiACp3Uy1eLYsRNbUmUHi27Lwf4G2DuH97WddkeO7hO6v9qvjqZwJ3wsSYVqoKnzBndabgSmHUhBDwIIFVNtmpJjiZANzRga8Lt6G+crU/hoOvzB7/zOy2++uP322zoEJDcajkejUZHnTaiIHTvPmLWN+STXoiEAAwGYd1xkGTMTk6kRICqggQcrGSa5PxkNSo9Mqhb34budYosdzLnNLbYug26Pcm6PRIfTtAjWMe0NTENo6rpuP3zgFO7eh/0wit0v4aEjP/fJc61wgEAxatPEqgrswGdMBJ1ArGZGzESMSNiCmA3eGRTZxxLefTyTW/EQea/aKkXdL973FTtEeB/ffPd73NV574BHTa1fOO4sR3eZEb2XcI/YfsfvfE84ftjJvndbGKoBGISq+atffPnpF69F4PnT86cfP/vlX37x8vX1N19/9cmHZ49Py8JxxrST6DjLmIrcowym41FR5AC0Xm9ubhZNE48mR4PBSNU26/V8flNV1cnJ0XQ6AbO6qdUlfzBUVRVjKIrCswfAqqoBmizzznlj1DZmjnoa7OHmpbpfU7vdpJ0Da+/k7mCICGZiJmoCGlSaqtmR1MRuA3m125jEOwt0e5BOSzoRGhoyU5758WgwHY/GXr0DlzlmJsBr0+1mI1FSKy/xxwmNEudFRdvKslvztScStT7o5I8gs5ZVk3qBaXY1NhlmJ+NiOh6MR9lo6L/4+vXLi9vrZVMF0bZewHbOtKUetQsd3ok3tXsPfg/wTf/pvffeF0WRpOH08TZsTTXLsqQOi4iKpM/MsqwHUCSkQyIdQ0d46L/j4aSdmaXAzy6+ukVNpx9aOhsyURcj320L6R3HPTSuDVFIq6feXRUTp7hf+loTMYCpJMNYshBrW2yZqBGRqYIhCKrYZDp5/vz5j370o5OTkxDCarUSkeFw5L1XvY936P7zHhQY7jXp7Td4CxDfN+fxawXT39jUu+cPuJc1+I4EfBiLfJhgfLj6/3sLtnY3i2U/bvOd0jne6aTbr9OY3/vTvitDPVwPAvHD9Z/gGSSNvQO1Q33Ua7/Y93q79U6VAJmTcUQtMe8AgRwAIxAhZc4DkAHsS11iQf96vlZ4Pcjw8dG4dEjkghh1nKIu4ioNNvU5BmmVJDBUESAdcvbR40flsPj6cn4539yuGlVKA/tAvQ3UUnQAEAA4MxaQGDRqs97WZe4mo8FkNJxOBkPC5XKpUQaDcjAY7LbV1fXV9uoqSr2txydxgkfZIPPJpBUlIgKyAmKQmHlvaqkicoDMyBljGsIVMY0e4fn58are1RfLpg6GBGAiNp2Onz15+vzZs9FkMl/cXn5x+emvfrFeraQRUopgRFAWw/G4AAvLOa0Wt7tttWl0G8J8uXXks8w5ImYyMwWNMUoa91WNIZIiopqCJyoyN52MxqPB0WBwMptMJtPFrm6qzfpiDogqjUamPCPnybuoOsx8DOHt69eb5ZI8IZgpWJtWDICUF4N8XELmNyoxhnw0Yia1FFWMGtVUIDZuPAr5YMueUdAkGnFZcDk08ka+nMxefPLjo+c/oNHRt29vv/jy5auXb8rM+cwVpa/q7Xa7NtBsOs4zJpE8R1WrNaxWi1DXGcn45GxcuozEJJjierlAmI5GpfPeAHyRA7kIjFnhi4LqUDfNar1GpMl45ItSAEKQqIjOIzAlIhpoF3FPfV6CQjRRAePU+u7S82K9k7pmkJzhbDw4nQwfjcusDZ9X6OaLrMtM7zZBQucDYCVWi1RRNnXc1XGxbhqxqAlMnMzmqO3gDTvHaGYhUFNPR/l0UEyGxfGodGBgSmBoZhYVADB5yMyQAEiwh6VqklCsK7x7RIOlpx6sK/cVUDt0K4IaSVsO930g3KOEWwRx55DQPa+st0xjO5mQXrruqM8ADo3BeLet1+uqaeJ4VDw+Py1Ln5CjoNBRiNFUTawd32/jUw5AAQAHdjMlQEaWqCqSXAz7KIy9BILpyGsPaQvfU134N2LduhQvRcCiyM8enfnMX13dfPX1yx99/OGj4xkQaYxt7ZTqRewnAVt2/0F0NaV5gx7ZdBhacphCc4jAe1dOSn9IkfGHx2dst1/thW1VUSVWOoxixP2hPsnIhIgEMsx9kQ8mw2I2Gqx21WpbLba7xXa3ruqmachnWVY6r8Tc9kDbYpzMLIol8EQUZefIMQI6JmGMKl2APZqxIgbVEGUX6uEuPC1HRTnyeen81ud5RLxZbRoBY48o6YVixxEAGNE5YDJEMVBERmoHfZogPifn3HgEg6EgqxExu6RldN0oIEYC6ugB7XJnRtTybXQfowDadoewHVDAvbrXOsVw3wZIpqgkNUMadEZKi6FC25ZuJ0/QJU1VU8KqaTtyYtoPWEOXcSut1pxePkIiAwPyasVis/12sc5Rf/eHnxz/7PEXX3wRo6ha5vzHH300nU2b0LDz3mcxYhMaNQRgpKQOQ3ohiiIvfKYGUWJd1RoCqTJA7nCS89loMBkUZBE1GJAhW9/BhPZ3wJbM2EneXaHcy7qGfUlqvSSfJGUkM5QoVd1sWkGn0+7T3pqGxbuWXa8S7/+fdbPkSETMBKJqIuLYRdHtrlqttsMBZRknlAeaoSmiUW/Dh73Fsd8q+rGve4V6Uoz7SZQDvqqmliq27/te3u3zC5Nclb6S9e1Tgzu8iUMlKB0uVKnvNt0nDt/RMvab3Ds/dsut6v6KiOABB/k9cu8k6dVEL64W//rffLmrwic/fPEHf+dv/f7f/i+w/v++vlx9+fkXrz969PHz48lwWGbZbRBEc8SjcjjwPB1P88yZyu3N8vrqNi/y8ei4yIZ1Vd/O58vbW898fDQbDYdEGKVINtXYxN1u19QNAhV5iYib9aaqqul0Opk4IpbQBBXvPRwATxLQNrlZiTi5Vvstr/cUm0Gbrq1gkGjq0TSAikmwUIHFaBLUNARobRZwz5lvieljgACOqSyLo9n4+Hg6K9AxIqOBNVVNRK2vidSsRbS3gwOmIlGMgdha6jl0KMFe0upYFr2mjaAtqRYJQE1YaiJ+8fjk5Hj87PHxz3759S8/e3Nxs2qiKFlUiIqSzgaYUBt9o/Bwkdn/fj0PrSd4ZFk2Go3KskxKbkpASZcmzy9AwlBYS5/fwwpEJITA3dVjrJg5ScltQl06IRsQ7GE/eHByBgBSxZjiN5W7d1REpJ016rI3u2P2vg+XZGRUYEYDse4rA4p2UrKZiBi0O452GaFEaKqKasxEGiGqqt/5uq7n8/nt7e14PL69vfU+Gw6Hzvm76vBdubZfl+Fe271vWMB3CL7YHQzw0Br8ztnyvQvvd7L4DgHEv60V1/Y/x33N9T98IPKOPrxvjr9fPj8gQr2Pt7H/CvDdn/OgET8IxA/Xf9IXgkE6ACP0EZ9wLzd977pqLYdpNzXTFIeCAGiCAATiAQtHDKAqCMiECBZjACZVu7xe/GVslufHHz49PxmWqAYJNoq6T2Xde1IsidCIgKiUPIhWOYCzYTabfHS1rL95s/jFV5fEPgIItfMtmnK72z05ZYawaipiZbnZrjab65vbs5PZ2enR8cnJcrlcLm/NLC+yFy9eXFxevL68uVksp6PbD56GR8ezce4dASMhKpqBKKiGRh17QzYBIsy4YJc3pnWzlbhjEyUblMXzR+fLVdzWWzELIZ4/f/I7P/7JyfEJGP7q8y+++vbrm8W1aiQwMxBVNBNUAixLPxsNf/DkOGzXb9+8vLi42NVBVGKoww4ccpJvDQ243XE9c5G5zPF0NJiMByez0bDMp+PxbDYZDfLUTZ41lg/+y92//PO3t+toJqZNiJ40z4tQ1xXjZrPc1WvRGs0BUDksyqwg4t2uCjGuN1sYDfzR8fPTE+9ckWVmIKDW7e2ECBIdWu35BoxM2ZSFcp8Xjz84dxN/u3364gf/5P/+3+fj0+vbza++ffPq8iaAFrk3n+WTaRFks1w1db1egwbOvL3+6tXtarna7moxVpNqRzIqKHpUMzFklWYxv4oyHk8m5XiMzK4c4LpabLa7ILs67KqaiGezo8FwFACiSDQTShk8aol13VkEqFPDAVAVxAzRJMU4IAJorHYQKi/Vk+Ppybg8HuYZotc6KfYO0MAkhZUjRTVDNHaGKIZRrIqy2Nabbb2rQx01CAiwkQ9ICqiAKqZmmS/LsizyDCTslo33fDKbPT+dDTxnZJy8/GwqYtCmBokaUR8vl9KQOgkCO4ajAbYPfeoFEVAniJiBtnUJxABBQUybRmMwjaC5KjLY/b43CJmSJYCzARjoXdUWQIEATQ2pk2cJyRjQ0duLt2/evN1ud8+enT99+ijPSbQWELVIjG0eo5qIdBRvSG5NVWlZZfvzaHt+ak+uIm060YG/uLd0qdqDOvy9q6jfk5zzbkJO5400UQVDJM5zf3oym82mF2/nX3395qtvXj978miUO3YiUVIbpS2ZmIgJkFLlm24kAKWu9uzhA9D5aO6JPn2qzPu9w603546lJP1ePRMwJUySJu8+EAAjcmf6aZUFREAQBHNMzlADKTBY6c37cjIaHAdZV2G12V4tVuttFTarGoDZ5UXuvCciBVQzIkZmAxSDGBRiQ938kImgSU+alKQZkpNo3mfj6RG77Ktvvg5RfTkMgG+ubm4W69vluq5D8sIwOmMWBPHMgxK9JyIwq7c7FEvYCweUFUV+NGuKIohaHdEhoipGIIJ++p4AqJtr6l+FPiIH7uBa+6l9QlJEtWh7qkBSSlGTMEHdhxAMUkiCYjsfAkkp7pxUgKhMaIjcy47Y9+QOsnfMVEGTjJwmyBkRCFBBEV1uJS2q7ac3i8FkOH36PCYyZmw2m2Xd1OPpcV3HEIJEaRqJJsigoqCWOZ8X2agciEhU2TSNxCgxSlOjKSsMvTse5OezwcAhagQww458LeqyxFtGba1+KYCBUjqfHsRStaFwoAIqKojJhoamEkS4mz6PMYa6AhAEA2Q4VOIP68fUQ+0d2wfdvzQP4l2WeW8q7My5bFPLYrm8Xcx/8NHT4+MZgKlqonTo3TT5Q5b3vTr9HtIXkdLkdDv0LpI0LzNSlfRSQIuqTO++phuoA6wpIrXtg/7uuxdndycKL/V4lA7v4bsqsKq+E2p0P73KDA8iWB8YE9+ri5AcuxDt7fzmn/6zP7tch08+PP/v/vEf/eQnP/KO/tF/819+9YvPXn578y/++b9mWf/f/tHfd8SDwdBxRkRH43Hm4GQ2kbq+ePPm7durEPTZs6enx4/VmpfffnN1+RYRnj1/dnZ2BmDOucGgNNPVagViTx4/KfIixljVlYikuDPnnIhqXW/Xq5ubm+l0Mp1OiahpmuVy6ZybTCZ5XqS1wznfCZdKxM55VY0xGihA29JUM9VY1ztfVwZGIKaRGZDAExW5K3PHhIfancEddndqlUpo1ovltVUNq6EGjU2MsQkxRmvTAjB5UxVJWgQbAzI7H9NZHYhSH6ttCSVmUNv2QmtB45o4SAmTYcaQ8nJEaxnn2e/98MUPP/zg7R+s/vjf/Oxnf/X59XLXoDFBMAyGBmSpw/RrWz49ODgtQVmWMXN68dOrlrTg9JmI2P6OnQWYENMnp688mUw6LVlilNSUKopiPB4XRVEUxT0XLes+JPdwTK8D+gMdBEb3DI0kVb+34d3PPO1xxgBEZIimBgRplTYwMRWJhon10X4XtJaMwUJNHTy5Is8R8fPPPxeR29vbTz75ZDKZHB2dJL9Ut+TuR7v2H8T9+KOqIVonaL9nR/ptXAjva9fhe5fr9z/dRO+u6r/+aNuCQFP+Ed35dvoe0N/D9XA9CMQP13+QQAxABMBkiW2EnTHiflvHemBcMtVo0m67oe+2xFUCzdlawJMZe3c8mXjnX756nSyat5va3l5H0fD45GRYpGogOXpSxmlbzRl25RR06aaa7BuG4NAxWA7m0ZhwpzEpV9Aj21rkX7J5ASETsZgQILFHkzrGq5v5brc9OzkZDsvJ9KiuqtDUiHp6cnLruK6rxWb31eu3VQhn09F4UIzLjA3MxFSYHBiqohkgkeMiK0bgXNxuY6hUApOBIYqMy/LJ6elqd1kpnR6dPH/xbDgsDHW73d3cXN/O56IGhI1EAiCCNL0To4VKK5Kz0fTR+cnjaXFzOtvVYbermjoGEVAAUTNFh1nesgaLLHececeTYTYeFJNB6QgQkBljqFLSAWfF7OTop7/3u4M3N6+vryWhRUwd2ur2ulrhenlTZCTDvBwWPs9Go2GZF8yuqsObi2tRDYbqCz8alEXu2CURRFsTeLK5SZJPYgQUjSbsEHzujqbHw5NHPyyePP1wcHp+ebN5dX3z9nZeaRyMR+V0FBCqTSNAw/GE0NRkGyWAbUVrNUV0DqCuM5JBTgSCJmmIipxT0+1uG82wKI+ms9Hs2A0nT7559dlXrzabCpBGo1GRl6oQwYKagCGzoLUMzF5lTJVxK2Uyttk6hmnEVoJKkGpXsp5NJ49nw2HGJQmBgUmImlKB0YCJFDECRmQlUnLRsI5yu1xXQda7GKJGA1UWREUy4qgUFQwoz8uiKCfjUZFljrHa3MYNjsry7GRceHQgKKoaEAzYGLuHIwmj2g0E493HV1vzMxFai51IbO+Ds5EaiICJxaAhQIwkKvUu1hWYQhGIAAkPtBbs/IZKth9G61cXM0q3hbWCWVo2TE2RJFmL3169fXtxUTdhMPDj8cA51iYYJGW+HSVQNUE5iO55vznU+jzm7g+96LAHULSwNdBeIX4oqL9nIjH8BoCagZoYExqRqIoIE54eHT09P//269evXr/6/IsvfvTJi8GzUwBKSTUtWwbBJQLgnlhCXWJPT2o9ECV7980Bhi8VBu9S7Q6V4jT/nrxCewWyt+1bnxjQ2cwAFS1NHXQAXBElNUIidAxRARTVHCW0rhkhZS7nUeHd9e2yDgGZg0jd7Jqwcz53eU7k0hftSAKcdCu1dklsX+92n25ztwQgL/LxeIxIq8XKgIj9ZlNtNtW2qiVEADAkdGTkgNkYMc8hLzDL0DkwY2CLInUABDcaw2QSilIRRZUASCEl4B4ma7YvRefwReiCNzW5YFDvMj5gn4tjeJCR0uXYtIY3M5C+ld6tFYiWRpZ7QBcQmYFaK0UkfbWL1+yqYsPuhew/2B5ujElBEYmNgDAyipNlXf/p519dffqFkMtzGubZcDi4Xd3ezhe7qtYoKmqqiGpqjtk5zvPCu8yImxirUIsISDSJbJFEht6djYvZKC+dgknHC0rmL6YEwNqnKAFQ++vvMZ1gh6U+QMJF7yvrBIIAIwIyoxCkrhroIWR9+hz26ciGkA4O+9cSUo4RAIB0PwsxEbnMGbDz8/ViPl8ubjc//uEPxsNByk1qvdqWnPXcPp57OuqdbSmNjusBalNE++inRPw0s7quE3KKGQ/TUDsUWnITH2g9eNCXon6T+k6hoN+m7DuINIcet3su4zYpt/2x2y1cTR+2s+/NJaIhxHUT5jdzx/R3fv+D3/npT548eQqmu/ViOPB/5/d/9MGjq6Kw2+ubf/HP/7fdpjbxZT7w3ilqva5vLy/q3W4xn4cmHh+dHh+fNcFub2/mN3NEODk5mc0mSZFsmjqEpm1vEqhqiDGBC5h5MpkURRFjrOvGVCeTyWQyNlME7MEFMcYYY5ZpCHG93lRVdXZ2lmUZADZNvdvtEiohdVOIyBGl5JgYmhgbTuh0aFEyyJDssokAfNjauXeDq0oMQUI0oTrWQUKdxilFIHW6iJASZlcRkZxz3rNzyoSOQRTQkl4MmAIt97MjiG06Tj/pqoCqRgZsQKbYDq9CrLfI7CE7Px7/4X/1t148ffyXv/rq61cX16vtOqAo6oGQ+Gtkx3uPedM06T+dcwkr3DIdzETT+r+3DPc0iaQdtyJy4rirmmo6TuRZNhqPvM/S3x66s10fqgN7gfXOUaqjDLfYnwO48CG05z7AwdKpW5OmLKraNAl9l7zMycisoCJRYky0oNRDI6IYI2bZhy+ef/D8g6PpbLlcvnr16ttvvzW1PM//7t/9u87Ru0mh90Rq3N8w+q57wAB+GxzEr3/j/p2YvId5pPDb8Xx7+BHcA0I8rJUP14NA/HD9x6moLY3XcDtWae/L14BDzlzaue823fpWo2XO+RZlZIwwKrNHZ6dk8eZ2WdWhEtVtEy/nIlHOjoaFLzwzOTMREwJDQlBQ62I7+7N4CtU2QwRGVQ3WVNrs0CIAtyN+lgZ5FPanbmtnh4hMVA2I2ADNZNfEJsQgejSbzCbjohwQUVNXqjoeTvK8rJt6uavC5dUuNMfj0nBaevaUhDhDYAU0ZJ+VfjDw+TBoiHWFsSGV/piVsT8aDx+fSqU0mB2X3plKjE1VbbbbdagbSyOSBgqaOIlRxUTyzIVg9XY79uXJeDjJWTTWTQhNjGIOGcVMBB2QB/bsnM98TuCIKPPkHXkCAhBDQwgAAVAQI2Lt2I/H2abJ6jqEBtQABC2uFpcMGqrtybiYDvxwUOaDsizLzHtyrolW1c3NtqIso3LohxOXZ566lBo0TYUXkgGgGgmgJDlQhbVxjr2j0vLBWIeDb29vr27W31xcruqKcl+Mh+BcjBKUXDHIPSOYaFSpgwQuRwUQ+p02Ve7sfDQ+mwzYJLEIiMjIyGBb7VZVTcPJ0XnOxWA6mLz48OPJz37h3l4xuzwrDUjEAmCELtTeVNpMiVSpQi8rGCUHelKi219E6wo1zAp3Ms5PR+UkQ4/qTBAsqnQTx8nRjQLamDWGddRNs6uiNkG3VagaqWo1ZEBuZ40V1dDY+yzP8mJQjgblYFDmjECoKIUN8pGDQcYeA6mgKiX3oBo77EBvHR2yz8OwO4am9JwSkt3Jbugnelvzr0mwptYmWIwqFutamgYR0LRNY4J9HH23AlBX//cJjkmgITXSBGLDThiAJKcpqhrBze3tze0yCo6GeZlnTO2AmphFUAROsRWod+0A39Hu712DBxit+7Ngdo9Z/HC++r62P98/CdjfIn0xowgwGg4enZ0WhVut1i/fvH355u3zJyecmBKmvSrEzjnmLlOln68n7JncCR2AdG9ksff4vOfE/77C5o7B8tC230/0JJRSCzVQA0mshYNAcUMw58h5DgYIwA5YkSXZbYEZGQAytlHeRDeajA1tvlisN1UdguwEnCOXEznA5D/WljV0oFz1DB3rOrjMNB6N87xYr1bbzZaQATFEATVUcIjJ/oTEwGzs0HkeDsBn4Jw5RgUeOhSFPCAxT2c2HNXsE2K3TcZNa0pyjJqRWiLOatvAgns1bU/U2R9WDhX8fWKddW3mPsOzZ0MkMQAAQMwIULEDQLfSOCZIl3ULEPY22H02596rhNDi3VupnwjACAkIlVF9FjSfV02dleXxaR5rDxolXF9fbzbbWAu1t68Sgpnluc98RsyiUu+aRmKIAVRQI2l0YKPSHQ+HR8N84Ikxgql1WVI9VSOxkXsgZ0JB9LFNh3dpB7LsuxFdP26P1iUzDE2s66ZbZvWgBG+/T9tmsGjSqCkiIzIgdSOpahZN03Gute8Tu7pulsvNZmfHx0dlmeMd0ORevOiOgHa/jt7zkTquS3JKMJnabrfbbrebzSYpxelxcp6c85nPDJCQ8jzPsizGqKp3PesHnOl3JIcewH/4kfTd39UI3jGjvSMrH1g5+tC8h5mY71VlpqYxkurxePh3/+B3Hp0/OTo9G3K03TJul1Y3n3x4+vx8JLGSWN1eXYU6mnLjNi7zmWcyi01VbbdNiOPp5PTRGTuczy/mN5eqOplMHj16NBwMqT1WJakxwX1QNFpI02nWuUe1RemqIWJeFGYaQtAQ2fGjR4+QSFVCjGbG7Lz3/WmtaUJ6oE5OTpAoxFDX0SQOypHPyKpGNhvKvGMXkEUCgDGbJ/LsrJ3XSA6IFgMB+xCJhKYV0IDKJkFEFDBNBe5H4CnVY4hIzMpMyVbMxGqoKeGzbQtGVQLz0MLkCPuI8v22a2lt6oRkaENHVBAbT+7R8WAy+WA0GRflr3755ctmvhaBqAk+dPdJf7czlJLyDtTVGGPTNDHGRO1Q1dA0u6oKIZgZEyFR5n2W5957RHTMzrmWRoFEiaHfit2IiOw4y3PHLunIfTubiBgwCfT38BdJCyYiVE2zFGqKpiCo0LGausB5QALoleMDBdZax3iIoa6qEEJqP2R5XhTFYDDgzKm2DOJUi8QgxGoAj87O/+7f+29++MkPCWm9Wk2Pjv7sz/70F5/+Agg++eQHH330kdwFYd+xjKQf3rn9JtD3t38tuPfel/o1Mu6/qzp8T1l+r9/l7he0HiB2sJHBISLY3pe68e90Wv6NTYt7n3Ovn/Hb6+n/4Z//cD0IxA/Xf/wedQxxt2P2qAiqsIe13XtcOxpxGuVkh5SE0n5lbKd4AMF7n3lHWAMgqBLa8WRY+udfv3xzebNYbesqaJRdDI1GOZmNZqPhqPRMlDrSiGid3YcBbW/WSOQIIwM0RQukgSEyRDZOBQkAdbzUhKewvmrHRFQElW6u08xU4nyxjjES0ng49FkpYs1m7X1WFt75PKqttrs63Gx3BREcjQbD3OeIAMYIwM5nRTEc+6Ik7+NqK1VFKmhKRiAAIIRceD6ZjStjyHy93eR5HmOzXN1W1cZM0FCkLRIkhcKrmVkQrRtbLdcZNGM/nZQe2ZnlIoYKGWUMpMlCSxEIiJnJq5ABKZqZNiIAKMii0BA3YMGwUt2GeNvErRkXpSJpU6nGulqjYUbgzM6OJ46pyIusLFxiVzkXlOez8byqOPNclC4ryLkOfwmWZobacxahAgqgtRWzYVQmQzWwivC62l2/ebXb2tVmrd5nRUZ51qihGudlmWfes5mQhNjsYlPnLiNf+Gqj68Usy3/45Oh4mLGpmaayEQg06mqzWWxrzYePXvxgCITAR8enR0fH4/FYBJhdjCYASslrB2So+9yZTk+9O6nJCGSAKhpqUmGLubPz6eh0kg89ZhZRo5n2mG5FBuBE19qJbEKsJe5EFrtmF2JUFOMmWNTEGuZWSkCHzmfFsCiH5WBU5oM8yxkBTMCCc9mgLAccGYRNyIRMmRI/07DN5ulUD4SDLJ32RAj7WJ4DjWmvpHSaRhewbjFKiCBCqhpFJPJBWoV10UxdsDMZkALxXiaGxP5N9ipRU7MkTCcxm5Ll0gzMluvVerNDoMlomHnHiNFANT0ERoytS8USWaKjYRyYPO7pa3e1bzhMVe5nvHv48ENB/X3vfr5HM0kFb5s2jgimCFbk/vh4OijL1XJ9eTn/8qtv/uB3PxlljtsE7XZPJCZ2jNQBsjusRNu0sD1H4L3K773S6323H965f9vnGeGO8pQoBekBYrXUvEERY+5P26mmN0/kmKkd72gfXEYEMlMQME82KlwQPDse5bmfDbP5Yn273K63dR1q1YicIXsmb21cWRc704piqNDV7WZqkvlsMhk7pjeXl7vdtv+lEMG1PwhFJGMG59R5V5RYDsxlwGyAQMAuTyU3OubxWLMyGqMxIVmfnoYAgArJiaqpvZ3YuWydBkmwBz4DWEtwxoNsXgACtG5169ThAxUXDqTw/WGojSpN5wpDaC3FLc+9H6ehTlTQg3dwn47ZiR6afiXEfb66c2ClAQwePaXt1hbXYbPcbjahCRLUJPnLqc1nQPTMzCxmddPUTWNopkImDsw7HDt/OipPBoOcgUExMZHTEqv9PapGqZ1u7VyXtRDq7kXcL6hds7HdVzpHFu5Jm4iqFkJTN1WSPdr3A5IjL0UhKYCCRQs7qdfBxHHGriCfGTgEA4iq0SR2AXmADs1gu6tW610UGg6HLt3x7xsG6UfQ8ICAuP/huw+l4DsVrXZ1VVXr9XqxWCwWi8T9dM4BGBH4LMvzQtXAwDk3GAzyPCdi7KyBiHhXgu4r6juoiW7euUMIf3dk/N2/vfMrdEPlh/rSnfjNh+v70OAEIIDSu0k5GE+no/FU1MLyopJQ7TZ100xHuZuOJZb1bju/iVWQqq6qpoIdZ1meZT5zlBW58248Hg/Hw/VmeXX1pq42o9Hg+Ph0Op0xt5ZdSJAFIgMlQFVRFWsbkxqlkV3oVEuIEim2JiFDIObpdErEy9WyripCNx6N2U37uzdBElKGR6Ln77bVbrsjyDNP0MRmtY6ONYqBUwtsoFFMUxw6drHJqV+HaY3CbitENVMBi2gKyUGP3NLUMUmZQG2OLFmqWDplmYAYQTGBg9JiEFUQNMfEfqH9pA9C19PqHjVFoNTN6ozGqlEtMueT8fAZnr69unl7fXO93kWAYGlaUbsK+/2KmB4EFfTPe/LetvbbGKu6Xq/XoWk0MR6JBmXpvM+yjImYiJkdEbUYghYgSUQ+y4gJMQV5MhMfhuJyYgN1AvE9jZWI1BRURcXMQBFJEnvLEDoIe5fQoKAqfZJnuwuComjd1KkJ1zSNiKRxjTzLB6PhaDTOvO9ZxiogYiHGyWTy/PkHP/np7z17+nS3202mU/buq2+++ubbb/7Vn/zxT3/6O0+ePk5Ik+/SMXuux6HOqq3gsD8WwndorN+lDvcfPwTB/7uKnr+lqot325x4QFvuOtn225uR/71P0e8CMR603YfrQSD+fl5NVe9uF7kvCCmGaKJwF0HcS8PQVTXIxM4ROwAGMEAyBE0ymhkQDgbD8WjMt+uoEKNsN9tqt3nx+HwyKF5fXH/x7Zvb1UZEV7v4xevry8VmOh4+OplOh8Uwd7lzhooglrh1ANQGerRgKKQWC8sEk1HxBHBZycUyVFZHdYoulf9GaaZTtSunUYCIoa3fEnrVM3sNzbaWV28uR4PNbDYdjYbO5av5DSCwc7PpyabaLteLN9dLVV1Ohsfj4XQwGBS5Izw+PipHU5+XqtLEsNmsrKmcSSrNFZAIVGsEK3KSRparObrCHR+9evvm5ZvXq8UNdxTcTn43MwVidn7XBI3RiaLGnNGfTHIAB+LBUnXvKEseIAU1tZSiHgQFWAiVUNGLYiVQqTWAATGAbVU3jbzZVRtAHgzJuVpj2Gwur958+PzRoMiHmS+9J2jPGDEGlzKBvCuGpWWkZI6JWwsYGaExA7ezvb0bq1WHARA05eeINAoWALTaiTZRHQ6LoWME26GZREf45PmzYTkAsNDUoalxu+HQaKjZ7zL2Du3JCJ8dzwrZkakaKDKSE7Pr5erLl68ubhZv1zUNppFzZg5BZrPjk5Oz+XwpSZ9GRuT2dGAGYNQKQN1EGaCpIjGk0FwzlAbqLUuTERyP89moOBpl3iKEANxSyYzIEm4YXBOsDqEOcVNXq7quYoyGwTAqCpAoiDkjB+iAXJZn3ruyGGTFwPuCnHPOO/aILKrJ1ICARV7kVDsMbMIgrcs2ZbmJdPF01B2lk8sDsBs9I6QOYtW6tlpq52GAvHXncBVVAZN0Gm69dskUlv49UnIpYyImt5PA1Jq/ACkdvBOA3DQFVRMYASeVABUIDZBjJbfz9baqhsPiwxfPR3nGaaxbVRWJHSEzAbVSBHjvxuNRlmVE3EZjJWjcwaRb8lAn7to7Op0dzsc9rP/fy6r63SPsO9N8gIRtLdnS6TQjfHR8/Pzp08Xt+u3F9Z//27/8P/3tn/z4w+fU59QAAKBnl3nPTBa1DaZr/UPtpxCi3HXy3fvu35FG1f9tq9wdslOTTaTvZlkLeIIWhEPJg4qgpqKI6eEjAEMzT+iJEWLbSYpqSQ1AIALHkCMxMTchh2aSZcfnx89OZ+tdmC9W1/PFfLWpQh2lMfLIGbIT4ASASvBhQ9clvmky0c5ms6Pjk6au37x+XW23icjgXEYIgJGQCKhRFCLznouSBkMtCvAe0CUB1YCAyXkH3onzRhmjR3SApGjKBo40KQdqBkpAiEAE2nrNkm6BKV+1hUN0CuJ+vBQAkNuowj5qL/2vs81aB0xP/9UNNlmaGO5b42CkaNrKxahqhMC4z2IDwHY9tYMBBsSkwKol8SSJ72ZghGg+IyI+Oeemvg3N+vY2rLZZyj5lMkjmLUyMqBCCiIpIFEFTFHFgpcMyy0a5Px4Uk9xlCCDRtE0dtT04Eg0tmra/SRs5CKrALW3aDkdo+xw2TKZ4OHBp7c3rZqJNta13K4DGAMBcmimxZOUzRFLTSutVXM9DtQhomR9mxQhxiJgDEVgTm10MNYExJac1Nk1zcXF1M7+ZjbPZdIxoIhHVsIUYGWIrjLTBcz2O+l0pJlFjAHdVtbhdXl1dVlUFAN77o6Oj2WxWFAUzicQQQ/oFY4jb7e7m5kZVzx+dH50cTacT5rY5kUbY+tfK9oiJdEMZ9s0khNRSgHvTwt+BpDwgk8O7EZe9JP2wpX2fLu+4zHPnPDOTxNXNhURpQqhCs9lsEHE2m0GWgVnu+cnZo7qu15v1elM1jcRQS2ywLIqiGAxKZpwvrq8uLuu6Go8GT548PjqaOefMxDoyCRJxizNq/bnY2gk0tSKSGSQdmLfbLQBQd603m1YXJATAvMjH49F2u40xImJZlqenp4i42+2iKBMWgzLzORGbGpPslsttXUewwXhIlIno7Wp3s1huqq3zIJQm+RANEbSdXAAjJCRW0CpKUAyWzqhgiiqClBYmMREwRQfe5dgaKkQkdi5jooTPQUU0NZHEQEpLWevw3xfD3MEQuwe57Qu2u3962FGrunr79ur2dm5mw+FQ6yhNlLrW2K/9+7izw6PCe8XNnj4MZjHGpq418X/NQgjp1DEejZJ3GBEdMSMhYeqbEiJj0oQduX1gHSIyce8iaVXODsKQ9PI2c7tb50k1LYYigjH2zMl+UYMWTXQw19Bq3KlIlfV2u1mv67pOv76ohqraVdV6u12vt+PRZDAoU/JeWvQk6vmjxy9efABEF1dXiFjttkj0/MXzL7/84k/+5E/+5//3//z48aMf//jHw+EoceTTL9Jn9/YQ5PY1JYLvSAz+ruCK3yDdftek2l/vwfZ9sLSDcbGH5uDD9SAQP1x/rRcTZcyM2GZu7PNa065A+94aJsOLAhAzMSEimgIAiiXyLCgCIOdFNhwMCdBMBXBXh8Vy8+Jcp4OseHbGCN+8vrxarJsmVGJh26xqWW7D2Wx0NhsfTV3ufe48aoQYOodOKxB37hQwFUPLMnc8y37IOXx79eb6FkwVMJkZATgVe11+mmI3J5TGPQ2wdRc5UJNdI01Yb+t6Vk+fnp/PANerRV3VrsDxeDIYDa8u3rx8e73ZbKtd3cxkNsXROBudHA0n06hQ7Xa7zS5UW9LILUq55RAaSJE59Rws2iYcT84c0du3r+fXV6CKRmqQZXk0g9Y1A6qkSEa+Ets06sjKdTyaQpF5iIFAyUBUAhogp/F9BTAwQQtKQhSQA2Cj0IhuggWkAGSMSlQ53IroYIjAbACEVtdSN3Vdl4NiOh0PMk9RUACxs84lJxExOEdZXoXAMST7D2ZeCY0dOY/kEFkNwTQFpKlpivQhpJQ+CJACzgmAgcgPioioKrVEJRuWg+MXz/O80BBi02gTNqtFvdloVSk6VCgxDLLIpqgpy5AMCclvq+rlm4tvX729Xm1udlIp7YJ98OJ5WQ6OjmbT2dF8uVFFRTagpKtSZ+BKCgImOm+KSUTzlPZ7AYuoVazWJ5PBdFScTcrSE1tAiIYm5AFJjAWwkbBrmrqptrVs6mZb1yGKIho6RY6KohZEo6EhO/b5cDSaTCaToyx3TGxGItqqqy17t3X9OXKIIE2NrAwKpqqKaAjUnU0Ridr2eFtKJhqmYjoHEiMxGoJqmtjtCtru8GH9yF4LckzB8Hg4QgfJPEEIfPDjUeviINIu6932MEdAUISIFgjdnkBBiETAbrusbq5XTV3PpuWPP/6kLItWozcCcGBgAinEPrknnPNFUeR5xkSdOpykfj0cLE/n1yjxEDdmvT4Dd46G/27hFA/Xf46i8V0cXkueRYYOWpLGUU+PZh88f/7Fly8vry/eXlx/8dU3Hz974jv0KLbOTpdlnokjxL3UpNplnSMCEJK+O0jepXvd047vFSc9YVDf+as7DG4kAiBABmRocadoioqkgIRJ0xQyckho1Bam2NKXsB0LRUBHTGio5MycWQ7qHZaTwclk8PRsdnG9eHs1v7hZbKraZQOEgskIWQHFsAO6JvZ8kCBZ7h8/fjqZTr/55uv5/BoRjMiUjDN0DiSq1KzoEdU0REVAl2XovJJjcoxOFZBQmDVndQzo2JyzLCJGMiBAgojKgAbGZpw+1tVPbecqHWTSBtcpxNB3xNrYA0ToZiRb1aG3Oxlgq9UmHxq281Kp+YkK6YskBg6omgIKJPJPZyZP/7AzFQtqv7yCphncVlkkozTSoMiWpm8A0BDJmS/yo7NssaTFQua3iMoIxiBmBkjGienZhAgQwRRMPajWdeH4dDyeDopxkeWMJo2YJIi8KTKyoSmoJdw+oqGJaXLXUdpB+uYE3rdW9XcmUWpFgKiCATvC1BFmQhOLO2lWABUAG3DrHU5bDRpYHatFWF+G5Q1SYM+oYMGMBHEAPgOtYrOJcZe0G0Rzjjbb6uLi7XJx++EHZ+fn545ZQ3OY4Z6woQj0zojI/SjINGYuZsvF8ttvv0HE6XQ6m81ms9lkMlHVEEKMohrVpAuy08GgJqKbm5s//ld/fPbo7O/9vf96NBq1j7mCmhKlNvm94Pb2d/71m43dmWe/+zfvqBXvEzUe9rLv1bZFROyYiKJEM2XHhWP2jhibJhATEqasVc88HA2LshgMqs2uWi7XdVXNb+dZ5tebHDSu16u6bo4mk+OT49lsmuc+xEBEMYqqJsJNWr1MVa1/0Anv3Mxodh+X1E/GAAAjq9p2u22aGpGyzCexL8EEUh/MZ342Gk1H08V8tdvukIAdYcDlcoXMflA2qJer1aur+eXNraSYFyI2JDQ0UjxonBJFsypAbS5S7piAhKVNabU0utbRbwlTPl2Kj8YeLA+AzMyEKjGhE8D2a953KYXvIQN0M3pmFIJeXN3MF6s6qvNZbk4xGECDMcXKvWfi7TtkvpbtgGiqiQqdeMRN0xwG3rJz3revNnX2YWZOlAkmdsxtGk+nIyMgJyWZCQGJiVprbftTJAqE7XsEYBLVtBeO74qk1GV46v4kA70qiwTcNDE0TWobdB+nDpdMTdOs1ytEKIqii22woihms1lZltVuVwEQUbXbVbstEw8GpWj8s7/4iz/+4391fHwyGAy99ykxL8uyQ4E4wZfTfZh+8vdGBB8029If9FBi/m0OmQ/Xw/VwPQjE35c3j5myHMmZmnPEhId5I/0OlkgPrV8HACllvrYpH3pA/UQVdjYe5IOMY4NiuKnkzeX8Ry+eFBDHDD95cfr0dPbmevGrr19dXM+jYhOxCdvluvr27Xw8yI+mg/OjybDMBlmeM5gaqgAKibQEwCgEREwEkBGezoblaDB9XX79+mqxrdQ8U6YGTWiQWyIhgSFBO05p7WCktq1yBGBDjKChitXNclfFZydH09mRqt4sl/Ob28F4cH7+dO7cerlYLl69vZw/f/7090/PsRhGpCrWTQjLxVJCyDCN/qEhABGgsapq4xBPpqPHT14Ezf74z/7s6uKqCQ0TAxiBaohExI5SsLUgKoABG/hGadPY22WDfPvDJ0cjArJoqICuMVEEbVPSyYgDuYa5JlcZ1Qq1WjSukBTJ5RlnTEwOMC/BkSNirYI1oq7Ihkgo6golr0iKAqhoxs7nRQHIAWhZi7phNjo2l6N3vvTovTEJM/mCXInIDI6QzTTEWkyUJN05UQAVLMtT/oEZgCMTI0JSjQEiqGZuA+Hnr78eDyeDYpgxl4PiaDwitWa5lPUyLK7ophoXgcGI0JSAPbp8WcWff/rFF9++vt02lA0bgZ///Je//PTLf/h//gd/9Ef/lx9+8sMmyDffvtrsKl+OLVlXzcgAkFPKYBcvg92tboRKYCBiMWRsH3/89Cef/CDW2+3iyiQoKCCD44iuauJys61j3Gyruq6rIDtDAQZyRJkCNI0AEpIncrn3o2KQDwazk9PZycnkaMaOV4vF7XyuiOYYFFSMwEAb06bMeJi5Ms93tXkyZwIm6YRuAKLKTHvjM7ZYNOqyh3EPTmv/KtmaGCnZCNspV0tairVnO9Wkl2HnkOxyqLpQ9dZHx608awIQwQjMQBmJUxYdoIKlnOrICAiaMOGqpkZAjl12M794+/aqqcKzx48++sGHmfdpdErVNAgSIjMcWC2YqSxLZtetRek3ozZQqlOKrfMDduYF7QViuBMeBg8pdd+ry97zhr5rBmmhvdxSSgmZQOtQ5Xn2wQdPTs/G8+XV/Hb7r//NX/ztn/7kbDbmttdnambE7DJiNmjDzrGftAdUVUnT33CHynrv/96L/H7/j9o1NHqTSCqZ+uI8CcJgaNLLY0gESNa1f7RtHpmR7vkKSMl+BZTWCkVH7KnwzNSi/o1IEWCS8+jJ6ZPj2Xy9/fbi6u31YrGdG2XkS/IZtuSAFPfefvvJ5Ojpk2cu8/Ob2xg1z7MmTXI6Rz4zJEZ6fHL8wYsP3tzefv7mzVJFkNB5Yo/oENkRKSEyonfgGIEpchp7ICZwbAjRFMlRYsQTEZFSO2lEbU4d3i2274ibaoZ9zg8ZYL9mthPARB2jWNIwLSKRoRGiJpSGKRlARGOkdrCWkpmXCFwCcQglEiMqGECkViMGM4bk0lUz0lbTJkQkhyaCCKQoSXVlx8PJycc/HBbZ62oXri85JfkQAnBLICQ2UDSjGNCk9DQaF6eTyfGwdKYggdQMhKhtp6XNQNsE0DZ7yfaGaFBDAnKMlpAKd7kHrbqhpgBqGmMkRJeyGxFBwYydc8aKoGoNQG3mADPoRBlAAQiyu6oXb8PmmkLFnjzmBBG1wqDAESCHWEuzkaZSCRHBOcfsGpGXr29vbuMf/Fc/ePLkkbXPIKSn74BfmSSMJGzcYXruV36DOjTrzXq32z158vjo6KgsS+c8IlRVBQgqCqDJZ4cIhAweh4PR48fndV1/8MEH//Zn//af/bN/9sknn3z88SdZlsEBvcngPblzd0Ql7QhQB2z9fcIidC2nPVX//V/t4fq+XiIiElm59cgkgzyh8zz0wzERGoQQEMARmrWzZOPpeDydTqfTzXp9c3Oz3WwuF/MQ6qLIT09Pnj55PBkPkawJNUAKMFPAxG8ABTM1vKugHdK6rTe+HMSOhRCSNCmScGIQRWLEoshjxE5JTB5URWIV2W02oapMjJkQzXs+HRxNjo62Va1cFJPx7z398fDpj8vzj/+f/6//z2K9Q4oGLXQAKJlNiNkhADJEdOYHOJjFsBPZIMbM51GqRJHq1FWo68oMpSWnt4QWNQNLwW6gIoCt/C2iCNbRDg5XjeT+aZu+RHQIKQAARYyq88X2zcX1elcHsRDVzDLv2bkmk6quQwgtwfwdjbgf++tfcOdcnudp9xfVGGOSQZPoaWYxxuQIbpsK2CImECBZuZjIsWPHgIhMxOS8a6VkJHYuwSWYmTroRPr+IcQYo6okRVjMjFDNksKb6BAHfW7qhvT2B+97bcU0hKEqRHQ44cfMeZ4zObOWuZxuJ0R8+vTZYDDYbDY3NzdZlk4den19/fkXn1/f3Ewn08169b/8r//r0dFxWZZPnz4VgRjDmzevF4vlZrMJIeR5PhiUw+GwLIdEmGV+MBh47xHTUUr7E8LB4FZP4+upT4fvFB62/bpf8N075f757rt6ft/xCfCbPv/Q4XNnTKbnQf379qbe0crf+VEeqqaH60Eg/ptQVLcrOr2z5O3xrIZtZhweBCVbKojbQV1CIjCxBgRn48FsPNzO103AyLytdbFal+PMgzkL04z82cw5551bLLdVHVSsVouiTYzr7WaxWo0HxWQ4KDzlzg2znAmZPCV6BHlTiWqGBqSOZJDR8SRfb8smbndBogRDS2aj1PkEQiCgdkAeOodluyEjpua5GWpUWGw2DDoeloOyHE0mxrBdbxqm0WBUeF9Xu91m47LB+bMPRrNjZKrltm6Wu90uAzXQoAqAhpzSwtpUE+8p8y5z28Xm5vpt09RmqO2vA6rKgKgEaQgTARDUAJEjYKUGjV5v6tntppjljjOzUJtFhgAgkFLRWIkacjvkyminWKsJMHpPeWYG5kgZjUDMANH5jJw0aBGwMTBF826+rbPcA/mCyDF58mIQgcRwG+Lbxe5qFxr0g+HYlWVkTiZQYK/g6l2I9S42QkZgMcQGnGFB7JnZsSu8z8FMRfrhWkjJupS0CgbCSLasNpVqXlU5u4F3g6wY5sVwOsGcG2yqFbmyENghIDsPlDViX79889Wri/mqAueRXROlrhuz5leffvo7P/7h06dPX7x4/vTFi9Wnn9ciiJhRR0ZuTT0JadnueC0jQ6PEwKbjIvvg8enHz86PjsaLm3qV0GXMdV1v1tttLVWQXdBGbFtFAADOImBQVEUAVDXkvMiKcjD2vvA+G4wn49nRZDbLihydF41ZMQBeSxAAQkBARdPMgTPMMXqpMW4LjjkRxNAGJwOkk6l27GEEQ2xxLOnhTMkU7WhXpw4nENsBN2bvDUlQ09ZbCW1gUfJDtNqLipkwUFf8asKOoglZJHCUABPaznARIBOqJiNe4nskYqlpijF07vp2cXN9k85wzjnsjrjUzXsf2qOI0HvP7LrIKbt3Ttl/cpKC8Y4LA/rC3ax3NjyQJr5nFx0knfeJUbjf3PpAxz0zLnGx0UwsHB8Pzx+fvr68ms/Xby+WX3zzpiyySekIQRUUGdgrUkIZEDK0k+pEhH3GtB7AQQ9v4DuDnPdCtG1fQRFRqv32MlM3sd6Fe6VGG2oahAAEUDRAw6iC5qjV/9KgDCKyGbXROpDMpwJABOAQgQkUzDlAUDAxU1MQBTBCZHSlR5qU3p2PR8PX89XV7XZbbTFGnw+cozZPUkRUyfEHH304GI6ur69XyzWzB6T0+kJLwTDv/fn5o9//W7//YVXPvvn2L77+emEmQGmM2JCNsM1iJ0aiqCCkxEQOEKmryl2LyCEwtAjRzJgQANW0yzLiffocABJ1yZ1tMBv0iBoABaFWMKcWipM06aTJpCQ4MFEwQiZMFEYyj5qYmOk2aL+3AmbGiKid2y35agHBMJoBCbKRgUWxmFp5hKhKBgna3h63GMxAHVtR0GSSHx3Xy0UIARLzHxFN0IAMwYRUSkdllk0H2Tj3o8w7iGhiFtUsLdX9dFhq1GrvV7Uu3dBaZgnuK/1WhcaWgnWw6LYY+R6kQB2lKIqCiGTIjj20xmEDi23iIjUmu+3qKqzn0OwYgQxJgFARIwhAbdbsmt2uWqzCrlGlKKAoFMJqvdvsggEWBROmGfIU3ZB+BFWLYpKgUWBkrauhlbm7uAAwxLpudrtdVdXDUTkcDPM8AwTR2ALKkXB/LoCU/2hmajEEQ4TTs+O//bf/4Je/+OWbV2+3m+r3fu/3sszvZ8bN8H1gSsM+e/mdDai7O5Gt7+3ufZv9XgYHyBrbe73NzEQfOBPfm6udgjBTlfR2xxhSq9AQVQXUmAm7QZjkeEndx6LMs8xluVsvlzc3WFXbyWR8eno8HA6cY0ADSkuOErNZmhwAUQUAbhsdhoCmJvtoNaKu8Xao/SUtu1f62iwYs/TB5H9tH4Q2AENDDKbqmBOrvGkMohrneTGcnj4anZxBMRmcfzA8e47l7LMvv25CJFMNTQw1gqFj54q8LIssm5TF05PZ+bMX5cBDzbVEraOhRen6aGbE3FqG9/mkqRxRYm9obcRZQi5AUja1e+zsMFvyHp3sPkAcEYHqILfL9WK9rYJGIdW2T0UITNibfJO2vifSfMeX7X3BZkaIeZ6nP2dZ1h8h0vm55fwwtrlxHRMEiNIPR46RiJgBkTrQBCVgICAScdoHsN0LiJkjt+pw8t5G7Bcf7316x/uPxJQRmBzNnXM82ZARkRgNjJgAUEQ7uJ/1juYsy8pykP5hOrFXVbXdbheLBSIul8vhcJhn2W63++abr3/16S9vbq4Gg0Hm/Wq5/OUvf/nkyWMza5rm+vp6uVy2ZYKZSAyhWa1WAJDk9aOj2Wx2lOd5Okx47w8dxwdvwYH4f+cNukOi6FTm35hTp79JAr7zCb/JWX7XF5Hubtu3uf9Duoc9Q7/9Kv1XxnfcDA89yofrQSD+HqvDaIbtgPbBQfNdw0LfWmorPehp79TH1YCQkWgYldnRZHSzrndRBWjdyPXt6riY5ghkkiO73OHJBNTmi9VyvZ0v19tdHYPFIBVp1VTLTXaz2nhHgzwfF2XmOHPOO8oyl7uMyRMZkhECITjQ3OGozCYjg21c76IIOPadGpDqQj0wsHT4VQQzIjyYQTVoVG7WmyrGkch0MsrLUlViXWk077wfuszlw9F0OJ7l5Yg8b3eVGNZN4HbAJvmU0SzldDEhZ1lGmUcE0nqQ06qCWkGtjcg98I2YWqtvIaIhiFFQUwSu9HrZHA0KKpxjalQacjVwBEZyhiREFfKWqFKsCQTTRH7GXCRYiCZ7WMJtcYbeMAMsFKMpVuDpZtdkee0cDwaewVSlERXAbQi32+btYr1ShuGYypH5XIgRHaEH8A6z1XqxvJlvbhYoChpFGnBABfsiL4bDcnI0GE2JGJCIqU1Dc2hi6IiMsX3FJKhIqJsoFVHteFdXuzq30ciDmiceFuKlUVajjH0V5OZ2/eXL19eLdQRmciIQQgSkzLv5/Obnv/h5XhSD0eTDH3x8s9y+nS8JGbrsdjUDYku1Xz9PlCQfCx5tMiiePTr9wfPHp0dTRIlgmyBV3USRqqnW27pqJAgEYwEKwCktSZEE0IjyfOB8XuRlkZdFMXS+8D6bzI6Ho3ExLA1RVBExzynPC9FGtC0dGbX0lKly3HGoKG68Njkq9lN+SIgEZKmN0CfDUXd2p/a4YKaaeKH9PdZKygcZc+3sazoTmxGkjsp+xDhh1tqk5jacC/eHEFTCVtVJuUWdhIApL0qBxMi0TZzUtmvCYHh7u1yutuz89GjK3gsgKqa07ORQSSTvzmMFzC6RxFvTN6Qh8jsacSsst3LI/rR3ECJvD/ar7++OdufP2Hrj3/GS7m+GVlZmIlEZjcrz89PZN5Obm9Xl9foXn3755Px4UExdF8pIziG7lIaaLJntVrLPiMKuBfm+JLoDa8eBqzHJv71Tvm2H3BlS7x6B9pns6MeHv5i2HJ9uS0+f2sqmnSqFhtgxahAYEFJjKc2WakosSupoSgOKjFQ69OMiL3xeDopieTVfbxvJvMvyAoiDaNWERmKW5+dPHovq/Oam2u6Y0nyrKqT9R5lpMhyenByfnp2N1VZqXyyX683WmI3S/yitPcgJo0HMqITEBEzAZCloKAnDXYyfoqEpGlHnvuxGQnqQzh7xrD1JuH2jEisCNGm9bbxRj3smREyAW9CUspaWR4AUtAnAhJqUybZDZwAW05RHV79ht1hpQn4qKCTztwliQk60CQTJnpYOAekGZkLM3XBcnJ6tLi/jaukgLaaJaKGk4BByR9MyH5X5OHelQ4eAKmZykC56Z2q6zy9tsbnUTZPcjeuxPvEPWnDGwZ0M0Bnxup6IdXZY7R4NBvAHU+oKIACV1MtmdWO7NZugI0q+ZVVAMTOTRqPsVqtmvY5NSEwOU6vr5vp6XlXboqDRIEdQU75L8jXo9Czb28Zb7ab/DACMUXa7KlnVBoNBVmTYxkF0/KV2yAYQehEcVBUQUkogM5+cHD9/8eLVy1fz+fzi4uL8/DzN0d/xFb7rJsM7EIk+Jyq5E5ON4fAzevDb/a9jd91r9l42xcP1n7FADAgpu5qZU9+irQ9w/xzjIYgU2s49M3vnmUdZxlnOoWlGw+F4Msq8o0Sg3yeLIyG3D4dRp0rrwa6Z2pHA1ELMrEMOHNJmuukW6AHc+O7t3y6QholTmyj2beeTEdFlJfucswLzYpz5Fy+G/+Af8Mc/vFJTBoixjnVlGhGJXOayIvPZuMimpR+ORsxi0ROzHPKaErAsrW9EBqgtAYdb8zS3T7cSUGIz9Pg13O/ffVbs3bauJTn+QCwjA6yqcHVzu941TTSxzlebyA2mhEjeDwYDANhut7vd7rCFDJ03ucXgEGVZwkC2NXbmfQihY7i1Q0WJybBP17CDhS99ZvcPsKMPI6JjTrzIRKKwA55w+knYjCnhjxK0TRIV6dB1kUzEABajpBjC9JokBTzleSJiCHG9WUIrW5Nq7JXxLMuSPuu9T7geEYkxJivx5eUlEV1dXXnv8zz33ldVdX158frVyyjh9OT48fn5erl89erlF198MZsdjcfjPC/OzvIkrGP3CgBACKFpGgBgdiJxt9MYBaD1aDvX4pnTH7qDGd57l9+VR5Isf3fJf7/qimh3toHv/oTfps13mHza9T+gZ2T9dVU43RnhO771w/VwPQjE39sjSFsGWVfQ4m/89IMAVsPODWEdkY8QAbTw/ng6fTPfrkIVjKoQ314vHk/KglzBQGBqoXT+g6dnj44my/Xm5ZvLi+vbzW5XB1HVbSO70NxutgiYFfnA5d5RzpxlblgWg7IclkWeucxj5pCx7Z9lzk3HHqmJsl1vIzkn93GPrWO0Zbxih+TfW2KSDcVtY11td1uJwWQ2Gk7G04ppu1o6dpnPj45OBoORCKgRgQvBVpvdtg7sDVroaruPICABOZfleUHOB2kchhfnx7vm6mZdi6ohqwET7qPCrC+12rNeBFKjKsp8IzcbBc5L53Yct0A1sHGWTG0RaAuwAWoonbvIUa7sgDKlhKtNAoKYAJJxRqwMLsO8CNsKUBfNwm2qPHfH4wJU6nq7rqWBMN82V5vmahe1HJejkWZF5AzBM2aKOYJj8hLidrG8/ObLsFmDBJUAaOjIF8VoMhmdPZo8elwMhsVgxGXeVveJeGbtFo5BktHJAEObMdbs6u1yy3XcDcAKCZPJqJH1LjoPVptd3S6/ffn65eVlJZaXhQA0IUQx57PJZBxD87O//KusGHzyw9958uTZfLXVb145ly+urkO1A1A1wxagyX3hjAAgghZns/Gz87NPXjybTgZicbFcztebq9V2td5UdRVUg6gaqLEknEhWSFABcuy8c+yy2exkNJnm2YB95jh3nPk8H4+nzvkkyhgIIjBilhd1MI1JHQCPVjK4uIOwoLBzWrMGQmMARLJW02mdkXsiYe/rMoWWL4ppFrh/ZlOGNLVTbL0SkspqA9Xk4aWuXdTfl50JMxmcWq9KLzLs69P2ISICUuBoLAZBOYAjAADXeR2RXWFiy/V6W8XRePL0+bOsHERgM4xGCiSmaErQn0hbr0EqQvZtfINezehPx4dxZHe64p0n+WHl/942PO1dWGc/RYgHDwuqqaG2VvqE4TPNPD96dHp2evzy5dvFcvtXv/zsxz98cTwdjgpvKADg2Dnnibqds1u0D797K+/C3mvz7i13OMAL7wANEQGTTxm7R7D/Ir11Bdt5gV4eM+hj7vov3bEvoDN5MnBKfm01wqQZU48NaBWIjiYIGtO/y5yflVlRlJPRaDZevblZCBa+GCK7IOqqupE4Go9Hw+HFm7eXFxcq0WcOADiNOGgk4yLLj6aT46MjdqwhmmPOMh9FkQw5gataQHkqaZGQWRGRHSC1fKBWGj/ImmxjBhDNUlBqC7wCxRRbBGZG2nJCEhqE9iWa9etCOjIkXI4poqAhgMPWqp0Ed1NAJDCQ9HpjMvF1GqSBogU0MGm1SzQAICBJgKX2jlFADWBioEkbVTUTsORcTQKKMTInqFcxyE/O3NHxZrsjC2TRQBHEg3rAUeaHeX40HpaOvQmpoimYJGRG90PsO4ytX7hfSw9D0PbSsL3DXmyz07suRmrrpv+BqjF14nw7lUKiBJC15A5TAAUIYHWzmcfNEkPlCI3YTE1UIbbmPY0Wpd5uJDQgmmIZGbCq67cXlyFsZ9N8Nhl17c97Rfbhf2vXHO2fklTwS1VVdV0TYVmWWZbd1cTbQyIdaARJJuj5lYlrSUTPnj0jpLdv315eXg6Hw+FwyCncgckOSDJ2N+jvTu3dOy+gDZhNvQ64ixs2s8P+V8dSf6jVv8/VGbZu1v2dgy0Ovb+BuoNrNw7fU2QN0Dkaj4ejYQlgjhgJTBW75EZr+XRGnEy//bSEtlbfNu4T27679QNYkrZUPLh6xZCQW/RCu+HuG5v9V8XuvAZp1BJTUoZn4u1uJ8uFN1bMNdKTR+dnZ4+zvGCHKiE2tTS1iApgmnlzqJnF0FQ7qHWzkbru/M59BnO39xFpyj8lx+QgRuhAUZCWbkqDAq3chi2NVzuMPVB/2D18DLupFlNDBjVYbbZvr252jQTlqKnllcbWUnaKOedGo1FRFImcUFVVb8G+d1RIuOF+6khEElOi/4QkmxZFkV5/RNQk6aazeMJYM6cWeBvfCS1bOomhlMLrCNu5urY/TWmAwoih640Fiei4f8cPgVci0rYMAHvIcqK6P3v2bDwer9ebX37688XiNomwMYb0M3rvy7LM81xVnXPp50mO491uF0K4uLjYbDa9Ag4th1E2m5VjAsBnz559E+PNzc233377gx/84Pnz50+ePBkMBohwoNqmH1iSozmEmMTiEEIIIfmUky7sfZZleVHkziVQh0MEVUspuIeHqzuVRXdf/6bj6T3h9dd9wv2u4m+WaLGn+wP0VqD/AF2o26HwASjxcD0IxH9z29TQmZbo3WyNwyq2nY/j1tMHZkBAknzIipi2IsqM/aNHj76db6+3MQQgcpfz5c3ZdDqcDbwzMwLUIHlOfpANcjceDR6fn7168/b1xWUdmyo0oomRR00V1hYZ0RMxIiEw46DIjqbj6Wg4m5TTUc7k2GXONbnyeOSRsrq+DvUOHAM5aCPI+6BnA9Ck0CWXThso145VgiGZyxRtFzXeLKtd9fjkaDia5D5bLRbLxTJEPW3i7WI1GE8M4bPPvvrsl59mJjR0lDGnMPc2oAaBHRcD73NVjdXWafX0dDpfbKuqWUchZFVN5VWKzVNVRVUTQsfMZmlqH3dRFiYXiwrzXMp8g7SIglkGnANnAtQo7sC2gBGNmByykgd0ER0iA2Ea3AGIzOydeQhCDNFjlvFgFKtNhLAIdb7eHg+LEWMQ29TNxWZ1uaoXDUo5LsYTzYtITOiMMkFP4Bx5MTw5O83Qdlev316/sqZCiRAjAEak3avX81cvJ0+fH58/mZ6dDY+PqMy58EGTtoIA1DrAEsChvQ9VVNVEQOebZcM09TAdlrGJ210omG8ur759c/Htq9fbKL4YUJZV210QZefzvGDnDWCxXP/5X/xsvQs//MnvPjo//+DjHw3K4f/yT//py2+/iWLOkUmKPkSAThABQ7Mizz/64INPPng2GRbr5eJ2efvlN1/PbxdXN6sqBENAInaZKJhhEIpqnpmKMs/K8XBUlmU5GAwmU58NQlBRcMVwOByPRuMko4qqGSCwgdV13dQNmBIYgjDEnCKHWrdzFzcZhJzUTEwiZ564FSYMDBSIEJObTc1U8cAwu49dansV0BUTqNrFJZESEIB1nrZ2QSBMYXTawSiSp68FSKSHxZA6UYoMnEGKmmdEb+CQM+W8MdcIOHFTHiCTMCOCgSIx5GUwXu2qOsQnL178+Hd+OpjMDBL0MUQDMXUIhqodNDxpENB1UuC+MmAHJhUws+STsO7cfODxtIfJqO+tQtwnO+MdfbZTu/CQqAgHU94Jwihq548effD82Vdfvnz16ubl69e//Ozz50/ORoMzaKM3zTMxswGJQhehipD6gvu+xHuwrYdmlnu626E4ZT1VInX6ALuZh84L2WtF+7mXO36urmHTGinZMSFK6hthYjWgtomhXey6ArURNW2CHVqrCCAYoSWCbmZyMizK4nQwGL6+3Sg55Iw9svfO+ydPH9fV9tWrb+fza07Eh3Q2aIm8VhbZcDg4PjkGppub1Zvrm13TcJYxoHbRlkaARMgOmSDZnYiSH7fNxmylxjaLXFWTvKDQzR1YC9dEBKJWK1Fsh6Jb37Eq9oO31rLMFVTRzJTBDFEQlREBTdUrpqRbFUA0JSBDS29R+tENWcnICEjRIoOl1N6WVKFJdk4qoCFEVQMRaAnSBqoqaorIZHs7WcbegoABMONwUpycra4uQx1Y1VlACBnZaTk8Ho/KPC+Y0dSaCJb8WS1rIwE+euS8qSCnLY/2FJ9EqT/UVlt983Dqtn++uvR6MABMygemeFqElJ2Fml5+7rhZCIlWjwFCVa1vY731oEAMxiqKyfAsEmI0sDzLssyzY+I2IRmZVWS93IDBbDqZTiciAtz1CNOtTC0THMC4vckPH7O2c7Db7bbbHTMnbeKw5O57PIcF/2HM0eF2o6IAcH5+fnx8/Pr165ubG+dcWZZopqKWMN+Hzr4DmaxVs9Ov1oUBtPtyEtruaMR79b5nU2Bncfwua9vD9Z99bdZZU1UFqRv/33cGEPdnvoOCDlu/avKLsuck4qkIWlqQ2zsGW7t8bx/uznuAd2Tq7iMtiKzTo60zTx5udr0Btfv4fvs71L5UVUG5DXQ0Ysp8FlR3q1VlMnEZegi13VwvqkazwQARRINqtNDEoHWUqqpD3cR642Lz0fkRNZv19etBhiezEWWOIkp32Ns78s1SlYrEAImAkczRRASqYtqh3dOycveomA7S9r5eb7u/A5rBerO9uV2EaKokRqKStpyEh5GO8lyWZVEUTdMkt2yb9dc9+K1lqXP7JhE2hABmSYFN3zS5X733vdfVVJEtScCJI8HEjsh5n24hImKkNN/j2LUKMhFw+nVoT3kDE9E2VxUVEiPjwKCdSMGJp5yONkaWFF4zy/P8448//sM//MPj45PtdjsaD/7kT/5kuVwyc8d5s6SAF0WRKo+mafI8T182hJBe3s1mU1VV+jiYEWKW+aIo0m8cQwDExWLx5s2b+fw2y7LRaFTXdZ/0YGbpd0ynrzwvsqwNJlHV5FPebrdN08QoIWw3mw0i5nl+fHycZZlzTtp4QE1f57BTmEIluvfovmTym2TY36jM/Pb/PLVi4DB74d+7yLFuGAW7PssDuejhehCI/0ZW1K1t89Cd0BFKDbAXY1pDq0oKRyEyAkUyZgEAZmQWhV0dQ9PsYr1VNKDc+zo0Brht5LNvL2OU86Oxd5TnBWelsWcm5zXL/HBQnh7NfvjJh/PV6s3l5WqzXW2r1aYKdUB2giSpCjO1INfb+u1ikzEUjMeT4fmjMwDeNWbEWeYmLg8qr99eGKGkrdjAMbWOyX4eErWrWwyQuvytNpw7WbKCyu2qqnYXx9PR6Ww6OzmvR9V8flsMhpPJ0dXlzeXV1R//8b/67FefPjqePXt0fDYbTgc+d6xAqshZ7ophVg5F43Z1u1rMi8yPyf3g0VRD8/nFPEZAylUF0URFwQRUxBDRO2QmAUtjOwZYMV3EuLpdZtVOc7IsGw48sQtIYhiRGsSIpMTErMhKnlxGlEv7PkcNVdMIMublOGKoKwIO6iSqauaoyLar+UXTDFb1+aiMxhe1frWot+akHPL0qCkH/3/2/rRJsiQ7zwTPonezzXePNaMyK2sFCwBBcoaUFkq3NEd6pKW/zd+bDyMyv2MW6UUo08NlABaWAmrLNTbfbb2L6jlnPqjea9c9IrMAkBQUk2EoKUSFh5ubm92rquc973ley7iYTDDLjXMgVnaB2dA4zw+enn0f/mByXL797W/r62sIElELahBu72632+WXX0yOTg6+99HiyePDJ49oOgEzJVVHQJjlOYXcd12EWpICAzK7JPVlDnLyDhGqDF3wYZs1Gy63nEuuk7LabLbee+eyqiqRqO0CAGJWXd5tNn/517eb5ujk5PjEZtPp+aOz5fL25vomDkRlWaYaMPm61Lf+7HjxT/74Hy3KYrNrvvziy6+//uLm7q5ufTAFzriY+KCK6AXAIChyVh0eHP/kpz/DvDBgabyKGiFQvm0sL8rF/GA6XbDL1AxETTVWsV3oVsuberuud0siRNUMtaKQdWvr1uyXOYScgNCIEThXM1Dop8WjqtCzhNEsWiqib4AQEnoszkGjqCENdiOM3qvI6jXrcZR7QqcOo/iABMSGJEZgjOAQ2IA0CccUxIIpoyPKiBy7ErgQl2eL2fHzStSqyXR6fJJljBw5lQBEVOT16q4OCGxPPnr6kz/+Z5MnP0D1YGD5dbZpvH4RoMuMufdlDpNr8ei792+ojcS19D+LvAjBM5GZMmcPyvv3mjU+PL4bJfVQpo6l4b2ADGZGe8EIE9BHDVRVDQ7n8yePHz9+cv728vbtVfvvf/7Z97738fHxcenYvEfUgiljB0gK1A+dxKy2yDKGyGt5UEPeF4keXHs2VNHDd6jq+60bvZ6bpgii2x/oIdRihK/InGNG1Z7BT8SMDvvXTbGwDLGOSu+gqgISUA9wMVMh1JwQkAUwJ8mJOqK4UhR5cX5+9uzp8zdv33RdcC4XNVVFQ7OYXGBZlp2cnD5//vzo+HQbwpvl3dvVXQfAWe4UNEFswRCAGZiNyBJNg2BIlCUkTEl8EcJuIhxlM7Oo2lMMeUVUMFWyZBFGVQMijNwbU1CNpbAOfA8wtIAR9JQGNVRFTRAlUXwJzHFkVyAhGaAIeggtwARdBuQg5c8FVgAjAwcDtSDy/uOHDQoqGkFTaGpExOAMTE0QorpoQSzjzMTA5dXhETx/jvXm6te/YJSK8dFkcjIpDvKiYCYTCB2oYm/lSzZzxORBjLoDGvW17BBJSpg65e+2LpCS1D5YlFQ1ziMDAEN/+QFB2p0MGJRQBDXOLEURXQKoIAajrl5fbVc3YG0aa1LKMDMVrz6IqplzLi84L2bXt1eiYipIaIBB5PZuGYIdHh6fnZ3F16+ie2uDmZmKiqoYaswVtOGGJFS1zWaz3e6Y3WQyifPRUZEZ9pf7GjGMVeMxLTRl+qnFtKXDw8P1en19fX10dFQWJTlCIh2Mn/tnezjXNmIkDbPqD/EU+w4ToA6DBL2k/2Bt+fD4rjQ7VVTSJZcywi3FC8cLng0jrGHfMBzKNhWDfjgBiaNjlFRClOb6jbLXkay/2/fBxvcF4n5QAFMQN8TsMkjm3KREItKDRK9xWzQFxEbLqSkBoFp03AcRbbpWqIMgpLvlzba9/e2Xb/4f/+v//uWrC2HmjJGQEMx3IUgXQtf50Lbgm6My+7/8j/9doS12myfnp7CYtk2bNlAzVQsgYIGAASP1iCC6NEQJGYmjBC8SggRTCz44ojjaaXaPQQzf7KaMOnTXdXd3q6YJBnkwDBYT0lM/jQxMtW3bu7u7OILgvY8RbVEm1hHQwDlXlmVkDcdxovgv8zxvmiYuXFmWRRbw/qQBoJYydSOJOD6YKP32iANOIQbNDeLp0F4elsT9oqLAYoaoTvM8j/8+vuYoTDNZP5KUvpTn+WKxODw8zDI3m87+5B//ycXFxeXlhap634lIzFIhoixzzBy8iggRO+dUbWh0R+Nz5GVnLmaQGBMVRTabzSbTyZPHj33XvX379k//9E8/+eSTn/3sZ4iYZVmUqqNaHdfP+GfoKcnMHC3M8/l8sEJ3XRcl6c8+++zu7i7Lsk8//fT09DQry2g6jq95eK9E7H1d///Y2Y5vgxT9Zz9G47jf82Fn+fD4IBD/13kE6eUhoG/6B/H/mSpQ8vAhMTArsDcE4zbIdrPrRJo21Nt2u+u2XWjVNrvOdx1FaxNnd7tWXl1e3N4VGZdlNZsdZLnLGTLCIsuyvHR5NnWc5fl0Mt01zXK1ur5db3Zt3XZt62PqLlIk6TuvIKIdhtavljtP5MC5vJy6rGCm6aQ4PTu6XW4kCAAguzhlZPuoAe0xPZQO+okzh4jIaT4DmRgJvMjNsgZy00lVFOXZ48fo+Obu5uVXX93e3vkuzGfz29UKTNq29keL+bSsipLZZXlZTSaI2NTbrq0ZDULHqIclPTooL5fupvaUOQQGEwETsGAmBoyUWIVIGnNW2DrCldquk4xpOp+Vi4Vw4Q1DVAABjRwxIznkHNAZOSFml4NKs9s267t6vRSVo9PT6fwgq8oMwYKP9Q2YWSg4y7Wr7zRAA12jF40u3USLGU8OYDrn2YyrDItC2QkRIjkmYgKEAMrM8/OzrCrm8/n1q9f19e3mZhm2tXpvYtZ16sOu7YKZB6oOTyaVY1AGMjRFUABlwqJUVQgBiQgU0VCNnSPn0EEgQ8ohcwaB5ifzx/7Y4Oblq3pXm4WiyJzLAGPIjwKxGPigUjdvLi/bIKIGAMw8m892u22z3eXM0ewVj62IOJkUp2en27q+uni7Wd4sb262260PEiOhYp5dlGLJOaR8Op1979OfPPvo43I6v7i+3e1qMTJAFUCmarZYHBxOZnMiVlHx3syYySTs6s1ms9pt1+JbAsvQMhaSBtutwzrT2mHI0JgQgcQMABkgRJHYABkJ0TSirBNQU/fuQ0aiyIPsjzK9mWK891MC8w52jxjsLGCARgikYISKRMRKGVAGyAYMxpBcCDk6ZkB2GbmMOOOsRC4As6qER/MnBkDsiizD6P/vZWVg3tY3N+uasmx6cDRZnCAvkD2YucKXkwPOi66uQdUIAVBEVCXL8sFBM1ir7oW82yAaR4cggUEf9wz7fK/9CNWHAd3vmER8zwk4rlFHGkoac01z9jwQh5IkeXAw++j541/+6jdr799cXPz6i6+fPXv88eMzQiETSkahPvEGh1nagbL6jQfusY94CDEfXucwXLl3bPS5k8n82uvIBhrL9eR4GqZjRlJR6iKhMhEzS9CEmmXCAaq6F7AoFvyjHg4DklkCUjIIgqCRaQABFI8mFH/b+B4QbTab1WpD7CazOTeZDyEED6JmEIKFIOzy0/NHk+l8ud1svd8FLylHhzBueQCxuWU9ja/ns0KESCKSEVrPkcAegzCiTZhENHlvpkl/iwkZYKPUIYkLP+yBCYSoENVZJIGo/UU8BSNmgKzCnbIJKoARMBnnwKyIHiTy1lE1oXQi0ViRzRACqzgwh0DAirgTUYipP+BMydTvGmJ2uTOCeNBCjZ5lQs6QcHJwaOdn9dsvJh6PM3hUFVOGDI00UH+g04h7j/GDfccwQS3SVd/fHZraaSNO0D1CCyKaJhzpflw8PVUPMU3++95iCGAGFP2KEkQCgIi0JkqoCGK+2d3dhGaTqaDj+LNCCEagZkyUMRHSdru9vHj75u3bzWYDSKZCqk3deR/y3E2rInOOInM7DV9r/KiyLIu2OBGxpLMjJF8xGpj3npmKIucex2n3seD2TsLkuMl0H2IDAERowFAUhYhsNpvVaqVTncwmMQQsbsHwHofyHo7cS8XpXbf7duD7EPNvq+o/1PHfpYeqqWj0rqARIxH1+aP7xiLshz4HjkqMYaX9PatiilE1FAQjBIAHMFk01RACs3O8b7IOV52pmUqUrWnP8toz9M1E1UbQGhzfXPueyhAcaqbR4y9i5g0YpBZwSEFaX2/45q7+7Le/+Q//4ed3mzogoGNiIkLzvucEAYiweiryl199eTJxT09m00mJCBKECJmdqURbbVDpJd8EWFMVUzEhjnyg9KYRRcDL/TGjd2ri94h3ZqSKddvdLjddF7ywFxBltd7JYRD3E1Gt6zoeALzv4vgFMwE4NYtnAGbOnHO9HjqgB0MIzFyWZVyUBkPrIFmmz1zViNTi3IxFmNygbI4lzqGDFe2xw59hP3s37K1IKs45TWvt3sUcX4xK3FSTxt00zcXFxddff/3RRx8h4mq1bJoaeqxEBGv0xmdjRmKiaEM2jcIuEhLsO3a4P8spMQFi7Eb/7I8+ffzkyS9/9auvvv76888/f/b8+enJSQzWi0eZwfM7/tTG5JZxXzCK5pEXVJblzc3Nr371qzdv3hwfH5+fn0fT95i/9PtQQ/T986FHNPr7NBj9cPv43bvFPQoa7GlmfcMYBwvDaEF6d4dKh9EPm9MHgfjD479ImTihph7MbOODmz0O1aERcUYuM85b09ub7cVydXV7u2maug3Bqyp5sYh3QjBiR5gZca3a7ML1riM0pnXmbpnJoRZM07KoqqosSiIqi3w+n00Pq5PFwdPTtmn93XK1a7v1drer29V2E0IAdJGtqoDe66bdGTE557KWmTLHVVEwu6ostfFtiKIQJkJXOkCpJTagmhFiYhciaLQn9XUVA6ISb30nd7t1002q/PhwfrtcNk3921//Zrfd5Vl2fHS83WXbprn98s3NcnNysHj+5PHJ8WJ2eERIXb1tdxvwbcFgEkxCSe7RUXm7m3UXy51vAVDRAoA3C4YIZCYERsSWO2A0hqDYotXkqqKazud0eGx53popmAJa7I1zRq5QyoBzQ/Kivvb19q5erba3V/XdVb1ZzQ4WZ+cnmcscgYPCJIvJF2KgMuFyAaHbtHUd2gZhMyvxdJ6VC65mnBdZ4TKHlrMSAhKhA6Yo1SkgoHOTg9lkMTk4O/vkx81ydXdxWa83Uu+sbUPwEsPJ5gfTxXGeTVEzAiNUMiXSmH1GzKBGLIzGoKTikApmxwgIAoguji+JTF2BfFJUonbx69/kZZm7XE27LqhBXs2DqlfLiirLCzNcbzYq0rVdWVXz+bxru9sgGDpUG464IoJMt7c3b16/bOqNb2v1geKMdX+gIubJdArEmBXPPvr+o2cvHj/72Ig/+/Kr9abuuiCCzHlRVYujo8PjU2aHSCrRZ58ZUltvlnfXu92mbXYaOkLJQJyEkjqSHXXLgrvCWoZAwGZkSAqGBppSdAKgmaL1zQ0YCUgwGMfSkdLYjWvdhMbugxGHtMZYAJuCGqpx3PVRCD1EgnDmqWLKkHMuJugy5hxcRq7MXGHAyHF+jYkyIGfmMqCMeL++JGNL5II6A/zy1c2vfvPV6eNnn3z648XhGWBpWKIpuo7zmcvLEHJCQ0PxccJLmLMkZMcgrUEOFkV6aNLEe8PRw2//bsTEh5PLd0YctjhPD/aA5rYXgAYEbLpgcM8RjmBiFX8wn3zy8Ufn58eb+s3Vcvtnf/Hrg4OD4/n8eJJRDEZHEAVEGBy3tm++EPTdi3FNMoqkG1RZSjOhNn5tD152ogsPVq974m/qeqZB42H2vL/H02/GjHnmIrKHKNGgbL9ERHkXI2iGUoYRGXKEFycTL5LGriqIKYAqoTKDmJpC8HZ7t1xvdqvN1oCq6czlZdf6tmtD8J3vfNct1/XrNxerzW4ntqzbZdvVasqsokgOyWni3sRw1xjF2Q87RwYWomJvg06hmxiV47jkqRpxfJejowcHDLP1Wdz20MsN0UWe3kKLEgKiAqgxABIaKRBkBtl2F26vm+VN2G6C94bsyqI4PCiOT+ngUIrKo0NkMmRVp0ntU9Ws63K/nqGcVvlBWeZ5ETi7aJvL2q9VRMVv1ru3r+5evc7yYvboUXFynB0cYpZHmzQqAwoQ5rPKnZ/mL75Xbe5mvp6DZiCmXmOPw+IljTBgDeJdkfKHtLdG9301QE13C+BeYdwHzFFCcu1rQE0adBo1htHOE2HeBPGwZSQK2oLuwNaqrYERsUrbbe5WV6+0rUtmEiYAcjEYSkFFQbzXu9u7txdv37x5JSqcuWo6Q8wQ8bMvvlouVwfz6dHRwtI4Nhr3wVpmasrOEbGZBZFIZAJIio9IaNrWzKqqyrI8ii/Rm/Zg5uCBOvxeV1d/18cQg73WvNvtNtsNMk6mUwAQkdHsyz6BCmOMYo/EsT49efiJw4g0voOfjIrGPn1w/5z4gZ703anLRghxiE5zTPAvi44eTbGGSe/ts4ct8VaQe4q2qmiQ3uzfi0kp6jRdlt53d8tVWRQHhwtC8N6HEIipKitAUFImjh0js2Cg3Ed1gg5PZWYmZhFj0O/E/cRm77nvO3RkxBIomESwH4EyMqmIx1CHerdbb67u7q63PgSM8iERAVowNbWUv5Gp7KD51a9+Ofnh85NPHy8muYkHDbHaU0NQBgCjCEYz0wAamIxAwcQUVYExDX4QYLJBE45IG5ZwST2EFpM4hvd5O9gFuF11N3fbNkgQb6pmIpboPKrmTUWDqQZL8YO9bwMQwTlWNUokhCLLc+dcBHkAIhFlztkoE23oOUUlFEcJoUEFFAkcgxmCxFDTMcy6V0Jp9BhsxcMzR3yEqqopqpE58GQKYKgCikaozmVxNkYhjEXnEMLnn3++3W6fPn1KRJ9//vmrl6+iR6csS2YOIVRVFRVnVXXskEhUVH3nawNBtEhySuggNMN4hkEACqrr7fbl6zePnz07PD2rXr169erVbz7/7OlHz4+OjwDBROKemBIJ4F7W3LDsj1t3vaM5A4DpdHp0dPT48ePb29vVavX69evXr1+fnZ2dn59P+7X9m3p18J/UUPzu9z54ckLrteB4pk078kCcEEzEqyF/EWhvmEMDUU2TaDAQZFKn3CBNgqUuugKYoULqVe2tNjiEOVpM3R2E6fvYmgfis3377/bh8UEg/vD4h9KGzXQILd1bl+wdpA4ioDEiATAxoPMGV6vNy6u7y9vV7Xpdd50PooZEOUTongYyc5kRMjAbcsyeMhUQgcYTIpoyYenqzG0cO2KsyuL48GA6qao8yzKez6oid0G0brrtrr69W+6atgsWyU0qYEBiENRENGgbuYpN27LLkDJL3lAF4z5jbwg/H7faEnhxNNy3r/yROEbxSN12oVMTU50UuQ8SRMyUyKbTipzrgtxuGkV39tgV8wNXlvV63ey2EjyamkrfkQ6T3J0ez1aN7243rbRGFACkzyM1Aa+KbEqARsSszMIEZQXTOU0XmlWdAUJcqgnIAWXgcsorABIlCbpd3W1Xy+XF23p5167vwnaNIMcnR2U1MSYFJWKHZAYCSArGCmqQl5JVwdc+qxgpmywwm2BWEDMSAIMxGsfKnI2on8bFhPcE40lWTefFwXF5fOqbRrvO2jb4LsQ8n7xy1bSopiGBEaOiEuXhOKyGZMygZOrAZRE/TYDxWAJkIGIizjSvaDLP5oc8mcZcBke5m5CYScx6ASjLcjKZIpOo1HVdFTvHjoGromyqcreqh00xiA9d8L6tdyvftqiSkpqICDBzLi+yrMjIuXJ2kFczV84/+uQHi+PzTuj2+u7q8kZFzJCzqpzMF4ujg4PDqph4H1TUAJA4lptBtK7brm1NhFBzh04Vu4agzrVx2OXakXkYgg8M7iVR7bf9gch5r2mcsoj6TCtMmUuw51PhoCohEJhAFJ/TKDZgpHQbEKATLjSfEpdUHnFWkCvcZIYuI86BHHKOrgRw0dMHyegcLfm0F3fiCxzaLsimcHu7fvv29sWLFy++92lZHQImBJpBlKAwczkTkIKZuDgjTTxkZPc8cRvnLO3zkUbSBo5yhwbpcFDTPmwC353drF+4e+fg+z/f/n7qDZEp1qPnMapmTMeHi6dPHn39+roL/vXF9W8+++qPf/TpYXnqEtfPRcQDDYD7pPpiqunfUXvv/80+q3rw8o6NLQ9dV+NfxPazwWYQ52iHXu69QdG+d0SIjtgRCUTcw55BDBBRDUM3xYbvBItqbLIOacKRx1+V8jybQ74OFkTAIIhs12viLKhGG5bLMgBGdiLB+a7Guuu6y+ubv/rlr0Ne3Yq/224bVUFWA9TIk0BDHKL/+t8TYZSrjiPqJuCDAQDslYh9ysqQUtRTOw1g/yPiOoV93iDsV1pCA1TlyK5QdYRU183XX+y+/qq7vgi7rQ8eiDjPi4N5cfZo8ux58fQjmkyEckWOykkCSItSV9NuvajoSZadTKgsWFxW5mBBoQ13q+Xm5ZeXf/OLzds3nBe7m8fTZ88X3/tkdnqeehBGceYJiIrprDo5dSbZOqBvIgE7/g5p7ik2J6CfRo99OQK0QRamoUaLBGoblWpDL8UQxHTIa0qFH1rP4RquOdj3LNQIYjibEQKTEXiQLVokqKp0Tbte+d02IwRVQMVEwdfONz74INI07atXb16/ebXdrouy4MzFkXo1+OrrV5vN5uz8rCoLCZ5dhu+annBcGVv0OEV/rvd+u9kAgHOO2Y09kmPOMsJQOSPAN6XB43BxDrdn9J2FENS0aZqiLKO3bmxD/jaZYEQ9/hZVGvbuzsi2fuDh+PD4Lm1puJdYDFRSSGe/7cTkzP1d3ydPxIYZjjec2ElDpFG6Ko4p28TIHBcsNUQffF3XERHLzCrqvWfHjgnUNJWNhAnUdB+NgqCmEcLT927MRriK4Yio/QgCmSC0fRYyqnZowbGxAzJ0RFHIZgIE1ij6AcV+mKiu19vMuUlVEIKqN1OLcCEd7hfqT9QKJmhiJjgKaGZAABIb4o5H6I13tSy8/189SMN72dZd3XmL+m/fvonHTolk6H2XB/pouOHGN0SIWW1Zljlm3Hd8gRCBOUISBvTzPbravb4nRNCzmEqkTZhGITYCJeydYZGxZDw0zOIoRhSISQ3VVE1IiHSgvREyoQKEBxcvEdV1/eWXX15cXIDB7d1N59vB+AzvRPDFFoBIaNu2bdt9Hd5/ejBUQL0s2YXw+u3bX/7qV5PJpOm6LMtW6/XLly9/+tOfVmWJSAmxN5zxHogfY0PJ/WU2vshINJ7P58vl8vr6+vXr1y9fvvTen5ycTKfT+OJ7BPM9O/a7TpT/3Ebj91nee1z4vgq79zXsEd1pMzPYl1bDCcGGbNoRa6Uvp8Zbbp9x834Giw13y+/MgcEPO9kHgfjD4/eiolYDieN3uPcgJftInD8cb+kOiAAYMagtt81vvnr5+maza6IGluJugwmCUWpZGZnj2AuPuVwxJRYsZlWJoAh0Qc1qUwMCInp1sypzNymzo8XkaD5bTCZlns0nFRwdPj8/b73frDfL1XK3q9umDWB16xsvHiwYCFjw1vlarHEuA2A1NDVywHHtU4VxIy3OCyPqADtE0P53TqoZIGMCuUobOr/qOn92dDA9WBRluV7eLFd3s+lkOjsoJtPdrikmk+nx2fzk0Wa7ur681mZToji04INjIkZAJdaTRdUE2DTtZrVTdUJs0dFpYAZeQEJogyfnysnUlSVNSreYQlV1rqgFMiKOrGRiZIeusKyEsgpe2rrerVaXX35+9+ZVe31hXWu+BQ3z46PHz58Xi4MaMU0xGRqgIoeYjWegiFiY6ZQAMgRyeRxui5uIEYJDIEoFJLIYcGI5x7lTDGCdmcvz4vSsiqkNamgaVCOoQQw6ES8SR2HNKL7jnNJtiMwIyKFliBlo/wNjlFDcs1BNxGXB5VpOaX7QLTfOy+mjsxcfPd/59he//rV5dURlznnGIcbsqnoful1nZhm72XS2Xl0rAAGrhKZturr1ocsJM47uNSSkIqNZVc1ms3JSujxDl2Wzw/nRo3x2VEyPbu7qi8tXdVNrMDJwGU+ODueHZ4uDIxKQVkwUQJnJALxCCJLlk/l8kTOEboMqZY7YijQ7DpscQwniTHpfliZm5WApSXPYYEgGIDbU7gCImgwn8cjbH9eThBQnnvu4jt7REeOoFOJMdHTcUUyfR8qIK6qKgo6zYjo5ecyuQldgVgARUOy4MEBuSRS2/kRhcL/XslewMenPZrq+W23XzUff++TZi0+zYm7QxZcr2vlQqwqRY0JCcJxbHhv+EOkZqJGnoYA6ik7q9fE+rMHeSQW2/esZDokf9oHvUMMTHuZM35NfYR/w02fTjYgMUXMRYabFbPbp9z/5xa+/8LK5W65+9dsvP/vy66cni6xgzgpXlMRORZGILDJt8N3y44HI2wMi0mWoauNRzXc5xcP1vMcCj/8OUkQbRWMUGAHvLYe47xURpYU1KgZpLb9f/A7qa+T9mcbFJ/EtDc3EkpHZgNgdLqazrPry7Y3VnQKoYgjB5YpIZqZIAOSyjF0eFYesKLfbbd3s/vTnf/7V1XV2enwHujPDLA4ZKKsiEyRCh/VoAOiDUpJADL0gEXX94W3XoaBRI0ydrr4lHIMEI6850YChz+1EAyIzVekFRe1VPwYCMFIlsEKDv3h99fM/3Xz1BdabZL8D68DqVwyffz578/oJYf7oMS0OPJoCmiKCoYqKx92a683x4vCs4pMSs0zUSVEVEgKJv3776uov/vzql39JwQPz7uZidX3Zdn5aVlRNEVw8hKkZIOWzOU5nsLpVIk0vObYJLWlAESptMVUxUZwTp6Sv8B6UwmqWBtmTkIOIGP11DNGGONR/CfiR1OZ7I2ZoFr3fgJQCjQgEfM2GwDlICPWuvltqUMxYRL16M0R2TdetN8u26zof6qa+urzcrNfx3IExLNUstP7Vq7e73a4q8yJ3IXR57kwtiBKSMQ13RpouAxoJLxBF2/V6PZvN+rS+dDM+AE2M7lPAwRq5b73ed0CNvMZEVJalBKmb2nsf6aIwIlQMuIn3LlBRu8L7fz+yBn+zx+Mh0PzD47vi3ondm7RsRZS29YLO/UzSJAUNHb64ZdhQ1QEScp+5ojJuRcRrsiiqx48nZiYSYMRliqjcrutW61WWZYcHB0zk2y5IyFyW5zlztLWOSDWwt8CPGpw2uiXtQcdUVVSBo0wLGGL0Sq9epmeIsL2UqkcD3MmAirw8OjxwxCLBEkJ/dDvEYADT/uyb8DeZMyKKX0NHzCQCIpFnpjGsGWl8U/WFYwJM4QMLlfd+VzddF/pE1FRDW3oBZqrvvUFHxAOO4vADyMM36YzDtMGgyQ6TB9GWG+Pv2MzAPOwp6pHAYPeybfcy8cCgCCEQUfx4UEWDRqcxBnnPFfiOVI2I3vvLy8vYNtvHLvYaMfRm3oFn3TTNbreLKXNj8Xr8j5OFGwkA7lbLv/rFL/I8r4qiKsvNZvP111/f3Nw8efQ4c5lqiI1jsIdLaHz+eP0PpukHi2oIwXuf5/n5+fnZo0eHR0e/+tWvfvPrX799+/bJkyfPnz8vyzKijce/0T+EkhNbIfFA2+PpU0xt6ooPkRa9W8bSeQ8AwKiHcg0HVNr3ho0QTFOCE4zw99jXlt8i9sIIfJHKUntIw/gw9vJBIP7w+D199L4gG295++NpzJwFMDEkY3ZiYbnefH1xebHa1EEVHEJMC/FM5DLnkArHDMBIeV6hy+82HSsocRyJVREmFPEiFmUfMAJQdrmaretu17abHa7W65f4cloW88n00enZfDqfTGfT2fR4MbcnJ13b1W272ux2bXd9t1zt6k0bvAKgNb4zYh+UCAxQRMjM1EVGf1pQo0zQu0D2Y0KJARdPJYpDZk0cdAEE0NW29l148uhoPq3K4ny1uru5ulzv6qcfffwv/uW/fPb8o8K5zfLuz//qF83ydl5lp/MJOCaXawzvZTDTkulsPqnPDt9e37YYIC/jCS+YOiQB23bSIBZTN51Oq6MjrArNXWBnhhmw4yygEaEAIDvnMswyryhim9vryy+/vPzNr63esnQmXkNnzuXzxeLxYzefhVYAOUb1RNMYIwGiEhhSiOFmcSeJuUUpioaAUIkA09uosRzt63NN76iRmQEG1UEj4egiN1AzMQtggdAQJXqjIEbXIydwLDICIzoCB+KidR0BAILE056aOSpLMvWYr7yB1yeLoz/+k3/6P/1P/+O22f1f/+//t89/8xmqhq5tCV1e5nkmQcwseO8cT8pqOi2vbt7WzQ4AxPu27cy0cORAzXdGlGf5bFI+e3z+6SefTObTq7u7i5s7zsunLz6eHz/+6u3dq69e1k1oO0Uwh8yAZ2ePF+dPMCtVTDrNmJlJzbzvRFQMVOFgOj8/nO1WV+u7C+2QtJa2dTk6g9wkj/ESGAMtOA4CoQGCIiXEbjwkatpyDcCIYyWN0a4wmjZNNGHsB7dT8T+QRwnVEJCCmiEDsiEpMDADF25ytJhnc55QVrmsAsgAXYS29k1hji+yPzX3hj20fQz0IFZB//cWNGw//+1vTWQ2mxdFFQM8AARA1IKEDkzQgIDiDJyJqSigEREhK8ieqZEyOSiJPvgeg+E3ycAfiunvamkNI79eqgT6hT/ShKynfqZTLpN57Od1zTGdn5+fn51ua9918vby9m9+9dlPPn4+OT8hl2d5meVZ8J4o3p5iox/d4yDuV49IQ5Hbl3k2FHXvM5v0df3IpRjrkD5hfLR/J+4gqNqId5qeh5iGIVYziLRf3N8fKetr77Lf93asR9gMHGBWA2aaH8yr+aHv2itU2LYW60YgQ5aIzAeMw6HMTJS5PCuqqq53m7p+dfEWfavzqZYVoCKyYzIkGcR7RKCYe4Yj0SGi0jkqkNKDC5ljGhiIGYGpKYV+GoVJNWFqMQamEfW20B73oYZBzGJIHgOQYZRLDTTOS1FppNcXq1/+Vf3lb6nZkiOHhqCAqoAKBuu73a/a28n0SGSa51pNBBDRWVD1rbVbrNcVwcG0qgoHIF23A/FlMT0rcaV1++qr7csvoeuyzDFT19XdxetbosPF/PEPfgLsDMEMyRjAFI3KyiYV7HLfrgtUJI4hfPEjj5G2w28KcZjGLP0FoI7BzZCSezW5pqOUFPuxmk5rmowDCgYUw+4o+ZUt9jlMRRPjWYGZOS7GJioh9SENQxfabbtb1xlm4gU0dGqqteCy7Zq2a4nYDEInXeeJXF4wsosKjffStLrddo7zg/m0KnPVABKAdXD/D+5yNdD+L6NxgQl9kLpu2rY9OjqKHrrhXntw9w3Yzv2NNmJBjL1Z9r4eYzQAao/RjCbi+KX7igw9GA7AYXcneACX2LuPMRkDE4s/Sk7va4Z9eHxHNGKw2LQbXbE2OuDs9VPcX5WpO9KHUSaJZyQl7ZtEUR1TVQAritLMmkbNdLFYnJ+fm9l6ve6LweQYZcauC9fX12VZHR0dTqa5hNB1XQg8+E+zzPWbr6ioiAKQczFmbn+VDsx9RIwIY+jlIyJ07Gi8/5lpBNT3+ytFWDzys6dPDw8OzVQEiPnB2U8hpaBG00eSc3U/TRdPqak5avi+Enl4zT2jw3C/RfefRxBpuy5on6piEfPen5dNRU2TlPewtdPDDYqBOxzF2XtniN5s+yBCMx4h4ps5hupGFTh5gREFNaiQ0oOZhrEiHB9j1kSE8ICIRskxOocpMYuHH/pemXhom3VdJxIS3VH3InLTNEOgXGyq1XXdNI33HvqsvPEzp67DkLCACABRTXZMpeVN09zc3Lx58+bo8LDI80RbgmiCeXhzxZPh8Ca/lz4X38mmaczg7Ozs9PT07Zs3f/3Xf/0Xf/EXd3d3P/rxjw8WizFr+92plL/f4wGg7Nufra/BrW+v9/1x7OMCxrnjfUYlJUoXqJoDikmFMDpxpX58bxY2MFUNKhZpVft/aHuqxfhY2h8ox63VB/+zb7V/WOw/CMQfHr+fp5Chn3QfMzGutmOdqQBC7rOvX/7my4tXV8vaW1DzXeMszAp3eDqvJuWTJ8+m06rKHCV8IXmFz7568/LtzbL2XgAR86w4mE8ODubqpW26ersNwXed3zU7TcR+6oxUlNDqrrlZ1y8vb/I8Pzo4PDo4PFlMZ2WWl1k5yRcH0y7Io/Ojq+Xy6m67bfy28ZumUWLvfZAQKz9TryYxXm+A3UdzE8IY4U6RwAi9+xIMCDARjNMcBalK68Prtzerqjg5PDg8Pq8ms+Vy9fTpsz/6Rz978eLFern8m836b371Wb2+Oz2c65Ozg0k1KVzhcoOAJiiQYTjI3ffPj1++efN20+xMoydXzRrRNvjgeHJ0PD89mZ2dY54LoCIAEhK3hqrAzBll5JhcRllBxtvb1c2rV5ef/Xp7eYHrZaYCGrwEy/LnP/3J9372s8n5o3UnHkkIzKUhrHh6THZSIkNKzpk429n3GBHIerlSILqdEQAEEXufdTyTKsK+YYkpPXzffUQEdmSmoKiIgESQNAwDInRETOQIM8QMzKFmZAyGGlVpUK+KDI5cibPT09nJqbjsv/0//Q///X/zLz/9g58sN8t/9T/8n//f9P98+dvPW98FgBI5LwqD0HVtleUIVJb52fkZF9mf/fnPV3cr33Rs6IhQgkpzdnxwMJ+fnZ6+eP7RYj4Dg5cXl8tdl81Opsenwc3/5os3y3WTkCAEADRZLB6fnU/nC0H2QU11WpVFltW7bdu0u10dxJidb5qJWVVBaa1YvVpfhGZdSlugsgmJpOM7ovVj4AQpNyqedMf+L4sXqKFpioAzA9G96TC+0/1wYSodzAyJUiY1EEJGVIhmQAeQ5chADjKuOK8wn4ARcAGUAWQAbBBv65FHMaJfH5ynR0jke6/XDJC71l++vfi3//bfHR4evXjxvflsluDICJDaA0SGIFHu6o+DCKIaadVDpI8pquAISQzDmeQbDFbwUIn70Lz+znQ6kSKpccxtiJLLPtUwjpH0Y4cI+/7WKO9QEeH4cP6TH/7w4uJmu9nuds0v/ubzRyeHi//2vymd4yxDpPRTkp/CAMgGKozpgwCTwa7yIAJr7BMcIrYHrmt0IA2UN+rZsvEJdDA/7yG9GEPqySgNDZo5op60DNF8H6tk6lvD0diTHFkGYEYGiAKAQ1k1CvtDVNWuDjs8LDE/rKa5W+7a9a5rw1aQATMhZ2gEjogRFA0YoSxcVizctJKmbfJciMVQRB1HZTEuAYkGHOd6IscDDAZPXJr9JWAkhT0aq5fTCEb/MsoSqaOY1iW0/RKKCKioAY2QzFBUDQ0YRTozS+BDxFxhe/G2e/WV+hU75PhjorhKQADM6KW9/cUv6t3uqGmOf/aHLWYxm8iCiG+Cb1xVOHTiqRVjVHIeuMkQ23q1XF91oS6YmMlQEQX9pr34+os/w+nx0ezR82iwYkMkpwA8W8huEbZL2lihGrvcBoZqOAgKe/AyGFIEC+8pgWAGJqCR26spuS5BikFlxOcAJgaLlTmZKRKn6fVYeGtiXSEAA6kFECDigNCJea+gCFkJ4Npd3Xpz1YzzbH17dbdcmQiAqQI7LqclAm63zWa91QB5VviuE+uQMSsnXuTzL7++u1tXOU8nVeZcgo0ntQXvcfjTIAEmdBWimjVN0zbNZDKZz2ejYvse1SHJrWMr5LsC0TeosQPLOMuypmvrullvNs+ePUtyz32vHzOPh8GjDIH9QBugvvcHqeo4aTltwzReYT7U2d+dR5zmBwNTMWBKXo39YMpg0b2nG2pcRZX7RiURIjJC+uqDCRs10xAAgBCbpolOHwDzwceZrthmm8wmp2enBtbUbWj9dDKfTBbxLvGtSNCb6zsAOjw8ODw6EOmWy2XXhfl8PqkmfVJGvMEAwFKAHoKq9Noo978RACEaMrsiLxwTdJL8tSlFRm3UQ0VAJjo8nJVlQcimEhLlKcqmaYkwkD6UnIjIMRP3b1qk+KgZGjOL6L7flKJ5bD9FC/YAZNOfeAmQuk6227ZrgwiaohpqfyYwMzGN4mjyIZn2jVscQ4DhPgB9oOWORcMHswixvxtXlUifGFAS+yeBVAdEQ3OMqw0qZGQx1MM0RiASAhASExKBAFCy4PbUunv9ibGsfO/H3X8AADGbiSoOyaKDRKuqMfltbG1+EKM3vux7w29EhqioOjPvfd3Uee42m/Vnn/326ZMnB7NZD/HAETgoPRml2BINwY/AGuOFN76xKmk/xOC9gT16dH58fHRxcfnll1/84q/+8g//8A+raoII0RA16qz/R9pRxlVMOq9807PFLu9wxMHByN9fuQQ4jGQhIYCJqIWgYOJD13ZkAEFCCEFTNK+qmCgxs3OYTpvm8qyoSmI2IiRk55g5UsqGlNtRmO1DH+L4dY/erHd/8w8b2QeB+MPj96WwjidUJBpQATAeDoh2GjMg5m3rX15cXtytdp0oMiI6prPF0aOTxZPz47LMyrJyjjPHcXRHRHOFp6cH3ndydXe36wwJKfOdz4kPzw4zJmlb3zZd015c37Q+dEG6IG3XBTPHpAgA0KHUoWnC7e16c12VB9NqNi0nVTWZVq7IyUJR5PM55JXNBXZtt227ruta33nvvRcRieWNmRpRlFn73vreyhEngIyi8eQdDb1/W5CdmnbBbNuaLieTcjqpDk9O54uDOMboQyCkyWy+226u7laOqDlcHM6m80lelY4g6XOZhanjTx6derluW+nMhKBTC2A4rapqOjk+yeYLzXNlHmY/AUmRJHl9iJxD58xgt15dffHV9Vdfbi/fhu0GgxcVAJ0cHp5+8uLJD35w8OiJUBYADcgQgSPpozdUKVDUipH64CZAoMGJZ2mYNxUmGn9+nPgFIwQdtOR7TnTszTf7bQssjqwQxdMb9mJKL/IRAsfJaIivKP5UiiRaVVAFNRVmnk5nZ2fnH3//kz/4w/L4+O3tarPdnD5++s/++b84PT7//Le/Wd6tNATIsrIsmWi9XolItauqSXV8fPLs6TPxels3oW3znBezydPzp0/OTxfz+Xwxr6rpblvfLVe1h3J+zPMjyKq7bbNtfNB02suzcjpbPHryPM8rQQ6iaMjEgFS3XRdMjYgcqde2Zumk7uqmCfVNs7q03V0mTW7BgbGGaDsAJEPUNFzYw596s3tUjEZCUv+mWnLSQlQJIszaoq041sw62EvAjPrQB0BCypBKyOZYlAwOzSFnRBlwDsaGbJbMxaD7Y8ZoibD3nX7wfUcZBDORsFuvv/j8i+9/8unTp89m8xmA7IFuKZULgYgGGa6XxNLwoD2IzxwCGtLw0vhwMj5V//7kDn94/GdpdabjMe6dfSMJcTDJ9hcA9UEaQ0ZrzFU3QCkz9+LZ42ePzjeb3XZTX90u/+qXn/2jH//42aMz5BwQTVWTBmvpW/vbcZiO/CY56cEkZp9W9+D6TIkzY1IkDAuC7ZO5DN9TkeCQyYp7ywYiQFpAYGjg9dJzLKqRDCgabjDFlKVYAqLYUEJQ39YaOhTJ0RYlOirKjDZNt24kWEguZEMVY2LkJCwbqJgZO2OHPUHAAERNQYkGFDJZ2od7nGYK1FPTOGsUhyMprnGq0c6FA+jOhuDdAVCOI+hM/J9ogKhICtKnXQIaEghD62KsG7ACd/Vut7rzTY2gSIRgqIRGKXqTAMicobRNe3W1/OKLxfOPcH4oNqTPY1BpQqhbX2fOCBgkMzCWXdDVbrtrdqqeWJVMUQ0EFbGrm6u316++npyeJdeuIgEqorkCyylOZuacdi3HlL34s1SG40q/QkfHYbTpxIwpHTppfWNltE7uZ08GbimbqZoxoRiqDHPrBmA+BOlnhw01jroGg069afCqBojkDBjYFZNpWeTc1rvVMvgApszsHHPOhNg23W673e12Tds2TXO3vpkfzo7cETMHtevr27rxRwezqiqjtJRaGyMGYl9uUq8dRe8khRA63wFYVU2YeVTJ7+14oyDTe+Dv32HdGrnw4lMQYpHnRVG8/ertkydPsOfBDJPdg5QMQA9GAfBbZejx2EHf0tpbOX6ny+zD4788iRjU9ijhOACRpLpBF36PYzEZj9PfplZX8kKqEfXz6PudKK3DImpxQiNpdoNeo6qd7wDAVNQAkSdViUje++A9MZ6dPTaDLOP4IkIITdOUZWmlAUDbtnd3q+l0enR4QIQApupD2NO0YUjGMon3LcFI+I7iZj8f0UNf1OK/RHBMTGSqqiHCBKNgChBlO9vHwxICArGjnkoc386I2Yk9ZrBUdgzu5X643nrMjiKk3K5UBQGaQdeF3a7pOtGgCqhGcZqh78PpIB2ODbZRmuxBNw9Kz73RdYy4HdaQcW8AesTE+FCxb+zGqDlSA47WZjGLAAqM8jwA697cqxYnQfvG2/vyL0dkDIT3opD7RxRq9Z0zz9Adf9/55z0o9vGP2P8z1f4N1iChruvr6+u7u7vHZ2dlUfb83Gi4uceCHyOD+zV5WMwBQAe9fihqESCK70dHhwC23W5vb29FpChKIho6Dr/7rPqObeVdCPK3fweO7LujSFpMkYZIiKgD0yMW2WYiGp1zccCl63xT113T5OwIECzGDmuS+M2IMPL643k585mYAqJCz+YYsg1jn4NTKyt+CQgBQExlmOWKjNF9VGYKiP6w3H8QiD88fp/tV/ug1ofLEvalFmIX5Ga5Xm13bVBAZqbDo8OPn549PT04P5plDjsfJ2yi4qMAgRBODirvF953ddO2IqDctb7e7o7m08P5dHo80671TXtQZa0Pu7rd7NrlZtv6AEitD2ImqGDWhXqz263X62VZTKtqOq0Oj+eLxYEP3oiLoswLBqSJl6quve/atmnaZle3nZcQ1CyoiikZknM5Eu/BEqmSwj3F591luq8/CRkMxUy8dmG3azwQHx4svMj1za1jFyRc39xmeTGZL9bLu8u7dQjaBQk2IzfLmTIwtgCmRPj87Phu111frzszQQxEkGXlwSKfzIr5HMvKM0ej6r4Vj2BERmTE6DJD6ry/uby8+urL9ZvXslujBmSkrJjMJycvPnrxBz+dnT+mybw1NuxHd2MMcUxQSyBmG0sJUT0cpyDFa8AQAckw1mcp9j36dXTISBvm3hBHQ9eD2Yso9ew1Bo1TIpQpQJSG0z5DBIREEaZEhBpD18AAJIgQYDmZnT9++vjZ5PS8Ad7erbu2Xhyd/NE//mfPn36vKqe/+eUv16uVinBRmOhqvWqaJs8zV2Qvvv/x0ydPurpB7z3j4TR/9uj0Jz94cXgwz/PMANfbZrmrN50V8+Nidhiyya6VTdP4EA9hCqbMWFXlwdGRD9S03sCYyDGrWt14VdBYvfs21OsSxULXdiu/u/H1TRa2OUpugQEYQ8rLGIAvw5uIPQ0ceo/fOPFmkKhsGBCPwVOEgwtRDalnBCeEZPpOAABkyieQTSGbIeVskSOBgJxcw4gJ0I17JPI+9+D9UWDfSJeSEDar9dXV1R//439yeva4rKpUsdiwDMWBP+7ncHFs8+qPqsPxYu/qQMA4wddrdr8D4Pjh8V+dhrw/5yflJnngwUYERQPAzNGj0+PvffTs4vKm2bXrbf3bL978zW+/mE6nhkSOY9nMPdRvVEUktei9uMBvqRbwHYtIVLYT3nHYj4ZAENvH/9gI/T1MAiW7tClRhMmA2V5mHs7rhKgpaShWSDYgjvd38DAygACm4jtplQhdnDkuOXdFnjFR1xoFdJ261lsXAkamBZKhiVorXsghOyTHseeEqHFNhzTdCkz7+zmKn/fsNGkrxl4Ltn76REGj2HmPP3nPqmnjoJR+laD+SYBFS/Wz3KqMVGHttRbzdd1utyKecD8cOXTJ4nrICJmqX6/bN2/byyuXV+rQBGP8u1dYt83NdlsxQcYONSAJybL1q8a3IgYKKErQh04ZqA+b1d3bV0+bH+XFhJEJo4wB5gqsZm66gLyQrnb76Ql7f4rS8JJHFfK9OrOPqbMRD2j/fqfSXdPoqoEhqIGJEmEQH0IQE0JTU0YgRiMDJFcUriiBCJAByJUlZ84hyN1VpA0RkmNml7EjCX61Wt3c3N3cLlerzd3d6mZ5+RQezRZzZjYf7u5WIch0OqmqAkxEOrMKMI3wAECU0np5914AnapKEETKi+J3YRjwd0bGf1MZP4BdsiybTCYi0rZtVVVDlOUDNxyO4sWGMZl7I/XveRnvgC7Gr/vDTvcdc+5Y39uyRBBC/NsBO0dicTwF7Ufy7V4bwkZc/IEKihE/FxJ4IenFbbdvKvbECYrEOaT5fG5m3neqARGLogAg51wspUS0aeropifCEKRp2rZtJpNJnheIMMiazGk1I6Q4SoijCoRGcWODxTaaWShtBtpLYaCKoywAJBpSTCNCgcYZqNSPo/TvyXA0sP0hE/YmoV5Y7I8PCCrWdb5pfRANagFAEgs+msH1QRotjND/vUo+7vjAA/DumBH8TfrsILNGHy4ADGBcEVFRpWTuFREKIcT3nJgQAaknJZuqqmgvjA80ARxUXbg/DvXA6vvgD2Nwx++M3/z7ndgHUVuCdl23XC5vb2+applU05gVYWp4z/0M49rlgV4/fDT9J6LD5xJx2wBQFMX5+fl2u727u1ut1tOpTCaTXiP+pl8Qf/ct/7eXa2CcFduH85jFeHEa+jAqokpB0MBEg4jvOh9C/Gi7znvvVcWII86PYRj2jRi2GNMOQ4ghERuoKUSIEvTDbYRISOwSnMT1TCtiIuc48ZFSBE1aabCHWe2Dlj/oxR8E4g+P35NqOTryVMcl1RD3aYMBxiztrarM3InUPrRBAPOi4B//4JMfPX80zQy6DfrA4slQ+lYpmZrpJKOPnhwR465uLpdbEQHk169ft7ulPD379Nn5NCNk9+jwqSnu6nZTt+tds9w2u8Zf3y03TVsHH0zNhJ0Tg5tNc7PeEcH0sjo6PppNp0VRErpYjBaOy8VMQlCtgvfbuql9WC43Tec7ER86M7TI34mU4qRDxd8VTROWalDSYihCOrgLGAMggSkgS5Cua7xed0EBabFYMPObt29//vOfX17dnJ6elOX09vLt29vVtm0b36nZfFJOMqrAMgQGPZ5Nnj05/7qRXePNsXNFNZ1Njw+NMnGZAoLGhRR7s69ZhCNmGWbO2IUgdV2//OrL5dtX2NZZ7sjl2WQyPZh//NMfnT57Pj057dB1AqKM5EwNozs3bZtEkeyVqpa+WId9UnHPkO1lXqaorigAIcfRJIDoC+719iQ3R+KnQjLMpHMExesPFcAIgKNB2BQBmMgROWZH4AgdKPfZRUAIyvHoZhAUCAqbnBa+mH+13DZKiyxzWXVwMFtMqp/9wR8+ffzs3/9//83/9r/8z8vlEmznu2673bZdu6t112yJ7aPnH/3o4xePF4uwXZ8eTD958eT87GjX7FbrzfXt8uJ6VR2cPvr+D7JyUXu7vl4u11uvmjkmU2IAJtNQ73ZN3WXFHAkI0REiYt2E1hsTqVi7WbWbW23uKudNau1W2K2zUJekOQqbj/PdCmAIYv29k2SQOKIVZfkU1hc38GQf2Le4UwhdNCQklpuaiYFoxEkbRdzkcKqKGXaYFRW6KfDcMAPj3n6INhjMhhrW3pGC8VtGgt6T5NvW2zcvX4mExeGimB4i5WY+XuR7uXsvMCNFCFoE3RDF094eKpsoAoNy1hcbvffm3ogu7LNcPqz//1X2QXvmICRTfjRUIqY9bqgIUW02KX/w/e+9fv1muVwtl/Xry/W//rd/dnRw8Ph44dgxDW1THHQ0QE7EyPvX3rvFzzeR78Z/g4NeZDAeLY9/0kEVxH6/grjK0v6wrSAgyITEIGEYCEoacSyKemS4pZs53s+69+OnviBg5MXHb4xmVQNEccDksjwry2qqrhAulq1e3a6b5TYomwoZK5G3sPM+FBm6jMCZERMrUSTb9nsLMrEi9TTW3l022MxgVEsPSXRGAKgWn4xgEA2HaBRICafak2MxgWXJMQULUTgpg5xn8IPF/GRe+GCfLZtX227tg3Y+1i085LQlHaLPBgVzANoFXW7WL98cHJ3q1AUxCWIBwOiyXVfXb1HDyWRaOIcBdp2+qcMysHEFSAoKKADck58NfLu7umpvb+an2aTMDKTuvCAYZa6Y4+RQs6mHTYa6l3yGKRzcY4B6tNN7ennpTDFs7nsr9WARVgUPYEgaRJCAM04ShInjDCiIdWoOyDmmKs+qIrecDrJs8eTpo+dP0XF8oqwqQVV8fXd72dRbx+SYiBkQTO32+vbrr1++eXN1c7u6uV0tlyuxdnG4CEHUrK7ry+slMR4dHsyqCjSI7+L5NV6ZaqYAoqBqzDbE0IEiMGgMWSJyzo3d/WOap42aJ/d1B/imvWKw8j0YqHXOzWaz8/Pz5XI5n8/HeVPju15ByYbhBniIOR62z/Eacl9DGKjdfw+J4cPj974862f7IvuuV+qiCDTeTQYLML4b+oQYZ+TjUA0amCabfxwtGKZt4qkwblyD65aicyNmrIEiIUWqjlld131nVKM0HAPuDIJzfHx8XJZVCKGp22BalcWTJ0+IGYnNLATZbne3tzeHh4fHxyfRiVzXNSAcHixcBASbMXORZWgdoKLROPU4YVYtknHMd2JqTAxAmmbkRhDXSC5K+OCEWiJmYFbAlOPKRGgxq/TBcA/0ctk9US4exAcN0UxMOh86H4JCUAimYiQICiDW2zTucWWiLk3jptQ9Y+zo8x204CGxYOy3jZJc/JsYKviuZIxEOTtB6muEGDVjBAi5pbi/SJQXNVSBYBpZ8ohgkTovIlFcjuCI8UFlIEK8i4YYuo/f0h3/nQ25b7IeD1TMiMIPokF0tVpfXFyu1pvj4xM1I+uni0Yxo/3K35vI7WG7rV+rred72P3BRDODyWSKSDc3N23bAtBsNh2pw/d2279FxfF3WLrHu5IlxFKKgM+ICTB4EZMm+G3Xtm2DQWDfJEJmdnmeZ9mhc845YnbEzByHT5OPgHDfRo/FvJqoiEkka6tqkKCqbee973zwYABNPDSihNA2jfc+c9nh8dF8Os2K3DFr2piht0ChRYjJ/l3ADzD9DwLxh8c//EPVRATZ7acJAe6l1KR13UwldoCKPJtUhWNT33HGOTlU8D4EACemKqiGZCFIGnOI5Zz6jPnJyaxpH/PL6zdXG/FC7O5W667dhnr9/NH50WwaQktmBUk5dWfzIwHcNn5dn9ZBbtabu9Xq+vbai4gBEKiSKGy2Ydfc5MWOHc+ms8l0Mq0qRkMzUs2Iq4LKLBfEw9mi6brNrt7u6l3bBQkW1JgB2BwCMSAZUiyDe48VWspMt8EEYhRnb1ENxBSIiPPGy8XVLbt8enA8OzjeffHVcrXdbHdIfDCfP3r6vKk3m+Xdl1+/2Wx3J8eL4/nksMor5ozAh1BNZ0fHh9tVA5znh8eU58ZOyBlnxDlzlvqDRMhIjjDLIMspK4CcGpLL8rKkjMrDWVWeH5+eLA4PJ8dH+bSanx4L0soIjI0YzAGic+TRDJSQHYMamtEwTbSvySPZYcgNitdIVFUQCQdmZ/I3S4JDGAAR7tvHMQ1iCNroe7WRcZAOR67XosEsptUxEZNREih7JnSs66NLgAlBUZ2SLoX+4stXh1X1o2fPHp8c7zromm27655/9MlsNq+b5v/zr//1m1cvYyXMxCGE1c3Vn/2b61yb86OTF+cH0+zsYDFzDNc3d1+9eXN9t669TubHjz/9w0CT2+Vmt6s327ZtfeQyOEfpZKjWNe3q+vrkrCyJJR2xVBWms6l23W67s/Y28zfob7FeorZOGzIhjCPFwTDEt04RA8ZBH8Re301/6NXPAcBgo8TZ+J4nwCT2Ae5mBiCGqrSnBqfThEbgZzTxBTMkBnCGbMCGjL15uTfN4XBugHuBXJYiU3CPyXpHLb5/7tFw8ebl//a//i+HR4ePnz0pCmcgAIqMAAIQVHzo2iDCBBLDrNPJnBAs/nfs4qtqPKkODo80yhcPr3vp/H4S0eCp+cCa+A7W1PbQN2pjq0ha2NQ0TsX0rj3glOFmSAhCpqIQkOD54/OPv/fR5fXtrn0jIr/54s2f/+LX9KOPKybHbCqjNLlY1Ua5GewdVJ/dt6+MMYIDp28ofgyMgCxRVPftDexX3XjzxTbIMBkwmILh3nEbmKhXoQyRoyU5lqdDq7ivs1ABDXh/RE+ZJohx4Bl7RCOxooFpmgJBRKZJXhTzw2JxcopZ+ea69V/t6s4UyDCItWLGTpkIkWON7rLAbEjMxP1HIyYRcAdE0AsfwzhJjEtNFPVRZUfMKVWgH4PR4R7vp1j6RSqugP0Vo0bsTANKmDP98HT+s/PpUUFimGVlHW52rNm0IOdSGjiooYU+WDOG8cUeO6lI0zSr5Uw7RRUDHyT44DjfQPnr5Xa5k6PJdDqdWua2jnbgdtkknx2xm3DXQYykEurlDQu7TX1zmx+dnpQ5Y7i4W6/AeWOgjLOplQeebgN4JEW1FBOb0mmSTJwWQbNxZsywJCb/XWoB3DMk9UADiywQQGTOiNEVeV7kZVlMy4qZq0nx7OmTxXxWlUVV5NPZJMszyvN8Nj168rQ6OoW6EesAseva3Wq5ubm4/OqLsNvl0SpOSEy3t9c///nP37y92m6bEACBHz16VM3yR4/PZvNZ27avXr15e3H15OnZ46ePJtMK0fcCV1RdVBOKDMY57AAxGAGapuna1jlX5HkUUB4yHPeepns4muGL32RtG27tscUvHncWi8XLly/Pz88j4PLeWPTAgTazHjA66Hv71eOh5TAezWk4p//OjuyHx3/Be9kIPn9/6N4ivQbue0thuPLSWbt3QVrcOzS20UyVAIh7IgrR2OE+9NyH/XQ/pgaGFvupQIQap8Zjw5Co65oIFGZGEWmapuvCIKsVZXW2OAgSmro2tTzPT09PT09PQwgRlatqt7e3ImFaFrkrkLldN8vbW5E4g4GENpYcsZeYEBDUuqZTUecchCCWXlgiJqVMteG/CEVMxIdgCsYZqlEKUDEREUkyqWJaHrGHLuK982wUtlJXM/HjxbpOVEwV1EzQojqs2qMmUgFzD+Abi6X39YMeaqPjT3x8gh0OD/Fpx9F/Q2tKRSxOUkR3tmqE+UZNOX0L8xgNbNjbkzVVbYMuPOwjD9RquM9wuF8GxCtZxxvQ3+V22Ev+D1Ab/QtQjZ8cWNM0V1dXd3d39tGLPoPxHqRiTOe4Lz0nUX34rvfK1sOPVtWqqs7OzpbL5Wq1QsSDg0XXdf0Uy3/W9WFPvqSo+5sSYhd0fXn56uXL1nfz0+NyNlWEqizzLMvz3LEjomgqGBILFKwzAVHU2CQe+JF9DMaQcbzf9ZAcOXOIOJn2cKa++vVd1zQtGqiXzXJ1e3GVMVfTyWyxmB8cFJPK5RlnThIyG+H+xfChLvsgEH94/F4cQnogoeLIvzAcZKPfKpEIzAjUISymk1mRZ6QqwSt8+dVXBenj48VhlcWa2zSgKSKno7YqgCKEkvOPHp26rFJ58+rq1pAJeV23v/7y5WpTf/rxi0dHizJGhKuABlCc5TipSjU+O5w13XHdPr5bLl9dXt2ud42IKgA6UWg0KIRdE/L1tiiyWVkezqppVTGCBQELAFCVWZ7zdFoGWdStX96tNrs6hNBpMFDkHDnHlOS9H2kdRRhhP8aiCBTpCtCPoqhaF/STT394dHKuyE0bsqL86OOPb66u3ly8PZjPFtPpdDK9uHj98vLmdrc9Ozp4fna8mJQVOw/QqM4PDs4nB4Wxz0uPFKVhyArijJAV4hQrARM4hixHlxk5iQREMMrzH/3JH+lPfjgpp9PJAReF5CwIa1UkAkMCB0AKhEgapd44VAuAyDF0DoZEpGGmyqLxdD8M1c9YpVhUTcNrMUst5p5BWvGT/3TcEsTxYSHFpSe6ESIBA6WpLRxkYRun1qbnEQJ0gAKEQqgGG1Xwsut2SJdNp98/O5u5LAh7hcXB8R//43+8Wt598dvfOmYEEA2+rbt6K+qnZCezYlZWjp1jqn3z+devf/vyIihNFseL849bnN6s285jMEeUZeRNhNKpi2Omhopevb3QzspqWs4XACRBp1VJAI1srL3B5orba+dvC9llGhwGTL4MNRRwUcntY48QQaS/7mycpPYAAGMPK0OEdN9pRHMioiEpoqV3ExNzG1BVIsjTEoOV9skbBmaa9CMzG450AACM93SGv00H/F5nXs2ury/+7E//3Scff++n/+in8/kEQAwEDBEEUMxENIiECCdlhMJlzjngaPyNx7J7aSujdKIRBK0/pw4RHx9E4f9KFGLEvT0kFrD7Md1+UhX6IMjYc0liIsVMNTUDEAULZVk9e/ro5ZtHb6+ud41fbZs//6tfTjP44dMjJDQFUEvtsBgh1CODx5fceD+Fd4bB7+XpDf8GKCaADaAJAkr6dW9rGRArpmCoaqCCSqagtJ8oRkJGYuyZiqkX3IMo4oLAFjueifGogEkXTDe7qsTs2GQfjsqCgsYYOtKk1OWOqqqo5pPCzbatFdV10xoiG6IYeAMhjq44QmR2gZiILALrolrfl/M20J8QhnHcPsoekNPwcoym6wselBinlmq/WEjDaAexYU/vmwOo6XijGWiV548OZocZzs0ruqPczcoin0yqg/k2zzq1NL6MqIQIKeZGkAkiGAONofFNI97MvGgnqobgiiaHbcDaw+Wmy5VxUkhZUJ7hZJZNDpgnGjaEwHF7BhA0RJNd3W130HW5aUlWkIFIUEV0XEx4dtxevvUibIAgBkBmZDaEmkJshMDoOKMqqsTUgxcNtH+XYk2I6Bwzc5ZlmXPEkOdcVeXiYP702ZPZfJpXRVEUZVkURV7Xu+lk+r2Pn08mE8wcEiATqgGgImJROgDbbJrlqq6b1fJ2s7rdru+QjDhSqkxNxcvbt2+vr6/Lqjg+PptMFmU1K6uKOHCO+aTcbJuXr96+fbP6V//qZ8+eP51MS98poUlQyFHVKDWScW9ySH1UQMAQQlPXQaScTN7LftmPoSSjuT64Tx8Eyo/v6L08N76vEQipKIr1eu29f6hNjI/fqpCcFITpKr63aODeJZn4EjhWYUbNoKHJ9OHxnXngO8CTUcTTvXotXZAI+znDcXpnHzI1+DTGR6N3UUiD6De4QeMFFmVERrDo70hrdDz5S7x0RZQAEa1tPTFlnAFYXe9CEGKOyGAmdFk2nc3qut5tt0G1qsof//jH3nsCU9W2abq29UE6r7WAqWYOmdPvZwYjrhiYQeeDqZH1DpSURaqiZGBMaP2ISnQQSDQ/CkQ7tAcjdEyY8rnShARFEH9PXkpzLPuz70B0AyRiVVBRCaKpwzTuWEVdVeMHMjbbDkADGBgy7yAmho943FF+cKiA+0iKsb946AWGIKrGpMQcQkjZcX3vakxIH1aY+BOD913wQSRSBUb6cPzEJYQwPCGMdOSH5YHde7V/J414rEGPtV247ylWkbZpd253dX11eXnZdV1RFHERNrz3sh+8jL0sPvJrP3iHH0BCMCXiaJZli8Xi9vb29vZGVRaLBbyTj/2ftu6490oARKTMC8e0vl3+7/+v/3l5dX18fvbk4++dP3pcFAXmjh0P5714qoym+b59rAL7chuQEVJgbTwm9/brNJ+EgNSzLGCIgkVEICU11CzLZpMpMyOy+q5eb1ar9Wa1un178frly3JSHZ+dnT4+LycTINe2jd1fhT7UaB8E4g+P37NmtQ0UwHt9NkgLAKGZhuAKe3J6fH508FXxZrXzQni33vzy869ubuefPH90fDjP0DTUpO2+FY0Iqmho6EvOnpwcVuUs/+zrL169DaoGbqPY3rW3v/zq0eH00dH86dG8yplIJAQDMwkIVBKWJRyW+enk4OnxdNvpclsvV9vLq+Wu9kGCAHhlkeCD3+3qq9u7o4PFfDrLnUNAItMQ4qAQm1UM2aJ6dnaYl+Xl1e3V7bqTRsQbOMoyTTIoAcbsgjghaGpqpnszZXIlgaiKwdnZ+ac/+nHt9a9//Zs//Yu/6pr68cnR2enpenm7urvdrpYHi8X5k2fTxcHt6ubl1e3dtj4+PDg9O8sn2U5U87IsXDDaAAsxYGaUAWdALMhGCBlZxsQM7IBzRRfQETpDJDBiyg+O+dCYsxYzABaLi3sCJ8dwOSU0QkE0NANC6110MYSIQA2o34Q1XQMPhp4Ik+AICEYM/aAtRI6nJUfVIGviPte0VywwNS8Ta3c40VI//twH0/Wkx5QokSbkiIAY0ECDeTUxDmrkMmC+btru1Rsn8Acff3T26Cx3eHP5+q9//au/+pu/JscEFjrftbX5ZuLwX/7zf/7TT1/kLkfEXdPeXt9e3K2+fH0Fxez45Mnx6eN8erLadl7iyZrzLAMtfAStqTERITGSqrbd7qL+Yjo9PFQuJtPSOSf19u719vZVc/uK66tc61zrXDsy4R7MqYYGaIqKaBCTCwFNMaE+NKGlYsWPpHGYHNNBsrd+mIkaKEWDOaKlGHoCYo1p9YRKYKARmEbEBJEDrQaIhgwcmRbxFJ0+lP3JblAZet3mvvIbR7wN4Z3E90hn6Yf10Jqmfv3m1dvrNz/82Q+fv/g4L51ZB7EmRwHwAAJmYhrV4SjXiYj3YbPeTCZT57JUzNt9/OvoQBY9EcMx+p70hqij2b0PjqvvTjlNSEyxfklw+b7ZF9k5Q0RZfymYJmWMGYHQ0Hzyx2CfYd21T85OfvTJR59//nnd3rHDL99cHx+8Pj+YHZQFqPXI2CQ2JmNWX5hTjyU1gLHT5gFJclws9XMWKKYwhI+NolRglDOnmpDHhHHwAhnSvD3GKFYkICpy1zryXR9XaZHpk/7PEIlJY/FsYiYAya07VJqEe7WqPzBoXKIJCFDB1ESIMMvIMe7a3WazVhWXOQBUNZHQdeIBFDkNlBByjErvg3oAgJiBaABZjJQ3HLUWyWJBSKnTiBTnOXq7WxQ9tZ+PVQOQVFgOBqL00QggCBiABoBt8G/Xu5Ny6oqJKd7uNsttY2WFx4/w6MSuX5tvk45qpqiKBBDncIXQgNmKTFjUVLxaFCCYBTRwDtM5GBpnUlWYF94hAFU5F49OiyeP1tvbQgKQxVnQOFUuqkCuMdioKiG6ir0Pkd3EuU1mWk3DtlYLaMaazKUikiYvzDjm+IEiOQQiYkTMsswx9cokOWbnOM9zZnbMLsuci38kJgWTvMgeP3n8T/8P/+Tg7AS0UxFRCSF0XceMRe5chuwAIm+fCAxI1eo6tF293t1dX2+327ppVEJBaRNCNFD1QXbbjW+aTz/5/mQ6L4oJcYZEqsEHRUJU3Gz926vdrrbzs8XBPMvI1EDE4jSxAce7zxRMLCog0LduAKzrurbrEKEoClUbDSTt5TAzpG9m+A66zLdIMPescwZIUBXlRx99FBWEPVliD0zBUUxP397FcRhUgqH0ywsMpNhemMI9VjPeKh/q6u9UUWZqSn0W1N65GU/NjACoopHJk9bGxFTvQV00jJdhGhyLllc0RBgNWY1tgjiEko215DQRPkypxNPm/nobRYcRIrDFkTBFUY2dRYu9EEBDCGqqEpZrkdAr2ciO8yLv6lpFyfz50ez/+Ec/VNV/8+e/entxVdchJn8QgYvRywhoQGBMUJQZ5SSsPogPgkl1jXQ7E02RozFbS0wMlM0yxwaoZiZxBIH6fSHRGhA1NUlxPJiUGqyQYrnRzIKI76TtfCciCBrJyWngBahP70Dknte6RwrfF4LfuQbeIdjcw18ADMvLu2FxUdOPeX0qIiw0kvuHw/OAjOi6jogGSEWfm2dR/xXVaD9XVYukgcj0ETWR6FC2+2Stkb9Y75+A/iNtACm9cY/PNhNRFYmebVTcbeury+vlcnl2fp6uB9PxdJWI4P68lUgd77VCD3r0Nx3YACDP89lsttls7u7uyrLM8xxGU2KjELy/jwZqAxorFc2W8GZmCMDIeV4sr26++s1vv/jtZ7Pp7F/89//dwelJPqmQQNGU4qSnWUTN9OO/EhO/Yci7HEaIE/g8hQjtq0G7t3nZiOAM/cqjGFMik1ACAR1NDhaTxUL0ie/aXV1vd9umab76/AtybjKdHh4fZnmWzq3xPY+Rhh/2gA8C8YfH70NlPR5Ret/yhYZxQhZF5Oz48MXzJ28vb//6N18HETFebhsvCuw2rRwvprOyZBd71qogSAxiEOUpCwXx0az45PkjH7rb5V3degH25pY7L2G1axofusNpNS04z5iJQQFUUo4QAGfgOKsKnJXZ8bQ8rIq7TbOuu03bbbog4kOcgEK62ew2bSgyNylcmXMMukVTUEW0PKf5JJvNJxPGSUbruts1oemCFwVmBbZ+4C+ho9IOlyJph1SDuHs75z79wQ+effS9l69effbl128vrjKCO8eTIquqCiQ0TbNcrwWxnFTT+dF2u1rWda3r1k2O82lA9khK0ULERM7QATljjrKHOTaHxqxERAxIAKxAADSEuhuBoFk0ecXl2vrAkz5KQREE+6DiB2ljcYiSIv02hb/oN1wQQ/t1lPmzn8Gy++rhKJpuFMUy9jtEq+vQo++/Awe0wDCwoz2VjSL/Q8UggBlRQCTEFgAlfHXx9uRg9v0Xj4L6l29f//wvfv7m4o2hiUjoWpAwn1Tf++j8J59+Oi2LtvPburtZtXe13wbk2fHi9MnB4VkxPVAqfPASxCSYhiHMN14OotFIQWoCGkzUt7t6s3QIk1nZ3L3ZXn4W1pdc3xRhm0Pn1BNqb7yARGcwNEUgQqO+SDQ0Ha43i2hIpDidlhxKOAQpDulYcduOQ3F9Ap2qMQoocG+bJNJIl0NWMgBURTGUlDEbFdMEA+7Bo4m3uY8q3HO23qVJDCl2vWET743rbrerr776wvvm4HBelgWimIWE9TQBCyCdaogJYEiggCriu26z3rx+/fbx4yeLxYI5g/tH4dEL2Luz4sH3vfNuY+H4w+O7s5GlXtS9EI97V+w+ZaZPJE1/SoSW6ISChEEEMC0L9/jRyYvnT+82u6aVtg7LzW7b+EVZIFKyGwOlhiFqauuM18n7dg8YJ570Sva42LBkD6O+ghtZgfZDHpiO6P09H2kJqspx4tAQFIgREJj2STgG2OdNDmZki705QutrPE37rRmoJoBNP8kKacg5thnHsX+mKm1by2Z1t9XV8s77DgAQOZYbqgKOiV0EVcTfkBCBKOGMkr6GaeXZP7EltTiCMQFANdEUoyczlaCJxbf3YPZs3RE/af+hIPaDHEn6wI34L1erjOWuKsXL5zfr27arifHgODt/0r7+Ule3HG3ECYOZCDhooHFzcpBNK8yyhC4hQnaCYMxGmYAFdpyVxJkAAJhHyA4PZs+ebN++DMtbVgOygVMNROLc1uC2k0bRGxsqICqaMECWW1lKTaZIponXFHURZiJkIBfldDLncuaMkYkxY46T3cTMRMzsHDvHUTKO+bCQBnxU1TOTmQBomXFdh7atQ4hRVJn33Wq1nMhkMq2ccxHwkc4CGiCISSvSiDRoIc6JJx+Zmqj3bee7bjqZMGdIWZYXnLnNdn17c4UAk/k8y/JdE9bblhgmFeUOYrjUCDLf3+Hxr9QSGavPUwjBhxBi2PrAGLmntiiODzPvUhrGkgrcn1MZsyMGQQERTQwRZ7NZVCLuq2l92vF9C3DcTw1G5OjRltYPb8EolHGIkHp4Hvvw+C4IxPcJEuNLLi2Slobv+lY+ptVczUDjFtb32OJp0ACQYWg7Jnrg6KcNUXhDY+7e7TDEMOI7jr8Ryzu+AGBi6/shaeK+x9xDzL8BsdGYV69OKoCBSYbd4ST7k58+O5xlF1fL22V9u9zeLdfbzUaRFDmIdT5IJ0VGs0VFGXUmt+vVZrOZVJPFwQJ6O7+lQylq8izFOEtNfCRDSO/zvaQPREXU+0y1VEclo38fZzAYWRRBY93bR0LHr/YmYYqJnT1WAvYhzKMTzIND6diK+67OOKw87xWR71lrY4+B9pbbgS8RDbYDJD1+aVCxBwaFWg9itr64768YUMPBaPatPY/3+mofCMrvftdwR4xX4MQWIsKIzFNTMRMFB6YWurBarVerzfHJaWp+jPlb+0zGtJ2P8nHuvfPvGrTHr2r81aIoQgjb7Xa9Xs/nc+fcWCIff8sDY/LvXgqSlQF65xBYDIpVZSLT8PbVxZsvv14vV4+ePHn80Udnj85ckRthAJV34VIPa/UeMGX747FB/66Mjq9DMHI/gDfEWg43WmIjxt5nXFkIARgJiIEpYyqybFK2Xde2bdd13ndt05pK5I7FPoqqITF+kIg/CMQfHr8HZXUqzYa25v1VOq4kpKCEFIIsZrPHZ6dPH5//+vOX3osZtV6CtnB11wYB5Cyb55ABhNj4cjGUXBU08gpD7vjRyXyzPdTQimirrOCChM2u9b5htLbzR4vqYFYWzEzRT6VmAmAJX4iYuWxe5dOqnK63t+ttttqF5baJ5hl0SLxtu23bOebDaamazSaVS+QCIQOHUDqcZlQuJow62TTLTbPa1Os26FBjDEO8gBonW+MpXRU5SqnpXxVF8dFHLw4ODv/qr395cXm93TVlRqv1GnWymJTzxQIQb2/vbpers7Isq4kYbBrfNIF3XWkE5AKSAAIREROxIgNxNM8CITIZU0RqDXgxS9odImLUFCFiIvv+P0Bv9E3nHdhn0AFGNkUfSzzMMvf7516rfe+YWx+MFKGY+wsFY6geptHusb+P4skL7k33pMEX2vs74WGftdc1+mZnPMISAkULmQKAI1X1AB6BEa5Wd2+uL7fNC/H1yzcvf/vFZ+vd2oGZBAmdAzuYT3/w/U9OT46Db5u2W663txvfWAbFbD4pj8+fFcUUqPBiahAkmHhU0cgRG6CfakNpGhUmMwndTr0j0Xr1pl2+4XaVh20BnbNApkjJZru3AUe6dRrLi+lY/VGmP93b8Hmkrdf2uvyQuBzngAw0IaHBDBQUgdTEhkuB0WKKByEiqYEiKbEhw54yAXvcRM/tfCB53fuzwbv6LBi8k1AHAFbXm4uL1wB6sJg5RwYBIMQjJ4CABgvego/W9SiGiWrXdZvN5urqarE4nEym7PJ+mPAd3e9+fWUf8uj+K9rHhtTxBxekvefivV8mjCKUk8ym/Y1AiIeL+dPH57/98mXrt0DQ+tB0IbWHQHtML46HxB+MJQ6lNbxTMPQNmdFX+zP7AJIcfxWGsdeBBpSo5HFWUGnc7MUhcjQutZyIvH2+5XDTEJEZGIkqRGiF6fiuxwep5fuCb1RuiPimqU1otQ7bzUZCiFAaSt29uAuwpgYgEOPACLa4X8VN4v12zof6Fw5U9j5tHIDuwYjMxt+x93Leq0RT4WgAterFrmayVet9519u6nUAn7GrZsXJeT07DLstiZhJLNVSUF2/GisissunU3Z5iCoDRYZ+Bk7V1BAUWWPgQRytAuXZpDo9zQ4OutUSVJLFNi717CzLGsNV0FaRDBUpvlcxc43y3JhRKWIbOJoNkdAxO5chZ0RIBhm4rMy4cM6ldLhEgY5SADHTkEfTM68tonojOaXz7W636dp6t9tsNluRUFVVURZNHZqmNtAsd5y5PucXY08TRJjUOWRGZTBDVYtnAzEVH0IIYDqbTtXQe4vydNPtbm8vi6wsq8oUutY3TZvnkDl0kZVCaNGkt7/LxlPDMOKmmoiYKSIPNt5vESO+/THMIMNoHmVM4bynEQNkWaY91XL/08cFOo5UkiEt8OFGZuPbX3sG1zcsaR8e3ymReNyNUNX+WD6az7NhdCIJr9EogLSPnBzWPFWjfdib9UMh6SKMl2q/CBDsUSrDCMueNfegg9J3SvqjHCZeTb9q7+krox0M961SsM53ABB5Qwhi2jq256fzw2l5t+1u7+rXb29fvnr76rUGQ6WsaWW7q5vgy4Kn0wodBZO6qderNSIdHB6ONr/+PYNhr44zoYLAg51Ch6N97wMZRvD78zaNf4O+V5O2j9RPS9g9G9I50odFvX7WwwmH8uZ3XALvKL/v1RbHtuIH6jDsORIaHeBj+7CqhhCG1+OcG2aVhp+iOoJGDFNI2s8dfzO67Z1GwsPM6r+PReMd8sb+zxLT0wAMJEhd19tdLaL7jNtRnfqgeBi+MvYLjxX28e8ybtvvtTCXlWXZtu1utyuKIgrEYx3/3abj37FhtE+btdgdNUOz4P3F69cXr99Uk8nHn/7g5NkTAg0agqkiKAEAcBwpfYDRfqeSG+dAjs7EMLIG2YNj0ztadl/pDZsmAKiJJb825/kkzyuztmk3203wPniPJkjkcsfOxaqPmexD3fZBIP7w+L1oVffTpvC+oswMFPq4GISiLJ48Pv/xrvvN519/9fq2CRoEOjEvu+W2vrpdP310OsvYkRUFHx7NJpyziaKBCaiSCci2dO6HL85OFpOXb25++/Jy2wYDMCIf7OXl6uJ2PS2zo4P50WJ6enhY5S5zjKqoXkRNFcBioVRk+vTJwZOnRzfL3eevri6X2+Wu3fnggxgSMHUW/F2zQjiczaeT8nAxzbPC5VlFWmWM0rLK2bw8nU8bH5br+svXlxebxpuJmaEROegHj4do9MT9VVML3kueZ9//9AfHJ6dfvXz9y1/96uLyihwrwHq9bbfbdjE5PjhcHB5NFovXby9fvnozm80ms9nJkxd1ECirGnLiXIiMCIgz54AypMKIxcgAlRDIYjYPx+BbJCKMRquhhBiYST0BSwl6FjBBzNbbN9Nj+B7G8Vgz0AGrn8ZDYgGvD1UWHTlckgUm0vMAdE8kgZRQOhxkaVw3xbMW9lIADONY2BO+cPAR0/6b4lAxABiZUezGIzCaABB6tU4EAMS0De3/76//stnebJdXv/6bv7xc3hiD916anfr28Ojgo4+e/fCHP2za+uZ2+ebqbtva5PT52eOPGszy2WGeT+/u1vWuBQUf2nq3UelcdP0SEKOZOUJR1dARMgK43LFBkdPBxNjf3Hy13F38tvTLTOocgrOQTs2QYgBiDZ5cjEJIsUfcp1IZEZr2NhEbXLwpmgrTJ48aPzKNPFXVODScIpgiyAI1WGi6RrBA4lgqGwABIzkkxy4v88n58xfoMhsbH5AGu8e4XklgkP1YbDqCRpfVnkvRh0zHTOk4kQcgy+X1y68+Oz6e/rN/+kcHC4fWggRQMRRUBQ3aNaFrwZQZsZ8xV4XOh67riFBEgu+InGWp5hmmkYZMFeutYr1xzB7YAeA/0bDbh8fvk0L8wJoxeEZ/RwH2HsEwlQoAAKZSFfmLF8+/f3l786d/mTOoNG2zE5kTDn7VJCsP3PZR/bOvMIdSbajcrBd9+gEJ0/tdjfGePAAq4oyggVGq1CyhxCN0BUzBiAgJtbeRSTSVEQEQ6j7xCnv4PCMSQpxnjuOa1BOHH1Q4g9qcqs3IPgcDsLpututm0+JtDTtPAIxERCzRjkUxPx6JkBCIYtocA5EiDii7FDD0oJrsq0vb967ALMay4WAat8jleLf6Sm/Z/aIu+pEtooRFzTriC9DbTZ1ttmjQEfs8A5ch4+zZJ/DDuztw3eXbzO8IAoAgCCIQOlUUyjWfZLOzs+efajFrg6XB1vSiSQiBUJECImpMDkQz1KzITs/O//CPvr5dynZp2oDG+RGsZgf5wakvZivISNQhkMscEoIYQj6bFsdH1N0dWFmCVkSOncscOaLMZVnhkBwAkpkzA4fo0rCOqeoeVBoJC32Y+1gFNTCNIKOu87d3y8l82oUuaCCm6XxKRLt6t1qvfQguy7IiV7M+TooIwNDKKl/owkvwIahIHA1RIDXzGtS0LErn3MXFFbmCmR270HlQOzw4qKYTD3B3u1reLScVzCaTPMvJZNQbxKHg12Ffvdc9MDMs8pId4z4o92+1lrz7h/Eq8WDu+N3ZZOuZrcOQ+HhE7z445R4T813S5d6h2e9u40y8D7vYd/uRsEJqZpZgEgAiAoA8grEOFkizuCHsr7YIwI0D44oAQOMk8p7+lub04wjhONerT1gd1mYciPDDLhJDRgHExKSH2zLz2Ds/kJGQiNmNbw0Y7O8puzpi0zr1gYxO5tXJ4uDZ+dmLJ6d/+h9suekEuG5DQdwwnBxMDmczUiW1s9PTw4Ojb5JfcS/SooGpBEa3z382U1GTLnPsjCg6GdHu5RunRJVox05DJCN79DCRBPes/X0dZA9OGO9rU33LUvBgQYAeZwwPTdwJHDFWeNNRWVRJRPam48y5PtdZnXNjl/rw5GYmKqam2vOFVe2+H3ggD/y9z9XvxVPAgziH+6bp9MuqGqKACAQRERVV9d4vl6vl8s57z5yMZt92l5mB2nBygxFZaIA1fzsjwjkmmgDgxcXb5XLpnCuK4r3vxt/5/Ulle1KEI/w3/vh6s72+ujawn/zJH50/elxUpfrWIyiO5fC/XS/ib9ukePgrfPuWOrTQxzgKVc3L/Gxypibbzaatax86Zq4mkyzPkcmC4Ifu5weB+MPjH1odtr1H4Z26aj+9bgBAZoJIYMoIs6r4/ouPEPOXb2+2bQhBQhBVXG/1y1ehyjNCK0t30razSQFtOJhOZ1WZOzDwBh4s5AiHsxIfnyHmV3fr6+Wq7YIiGpECdNuwbVc36/pu0xaO51U+LYtZWTIiu1i4i5mCowivKcr85OTIVdPZzi/r9ma9rdtOggxy5t1qXdeN9920yqdVXk1LZJfKTRNEKxwdLyqFE7xZX6/qbdciZgAAxNjTb6OjV8FEJB4UiiI7Ojp+8eKjrvP//t/92y+/+nK32xmQggKiV1mtazWcTiZlVR2fnt3c3O52beMtXyyyyZTLqlZzBkDOiNA555wRI6MSkbEaKlhAQ1AGdkiOiGOKOykQJmJs70hB6E3D1s+A9IiG+BEzEBgZokY+MUUMLgzwIcM+rA6p35fe2dWQ+h4sGsCQwzvYFWwU9QuQ8LYpRyPNhtJghBjTLgiGyZWhazHof8kbpgAGZEhGZMSqQSXEmquVYCIVk7TdX/76l5ubi5uLt5hlIj6EYKpMVM3mk/lB4/Xt68vXF1edcjY9Kg/PaXK4W9dlPlXOvWHrxYLUTS0hmCogODRiI1PxPu7ZhICoBIgqRVHMSnZ+Fepls7qi7rawzqnP0cjQjOIbK1GOj3Pp1lMJ06/XM94MbD+yDr2Z0ShlA8YIDkyjzpCm4QEp1sMUneZMyOwIgVztJZCRAwGdTCbnj5/MDw8n83k1X2R55Th/9NELYBCLLJfoJh6VGH2xjRDjsNXMR2kIwUHMuhubjm3ArloyXpgCmG+3d9dv726u5tPyhz/43qQiCDWIpCcMHiVYu5OuMRFyDvtWtor6zqegYlVVRbpHlhhmdbUXOYaT9IPS/cOS/119EMUyVQZpBd4xrbynGrE9YRuJMKmntkcUgAHh0cHi+59877PPv7q7uVMfuq4L4jO+x+W1e+GNew1oCJ95cKjeX5zxP/gezWj/DCOL4qja3Zsnk521H2kdyilyjABGJIN3GA0w4SRoVGgNY/JADCnlEUZK1uB1tv1/732RhMimUNftahN2noUrIGcGYubVQmReRmpe5N6yc8yxMRi3pJ6jig971HEiBWk8HzkQ0WPwz5iYlF4Q4bv6nZlRHOxNmUXRz6pxMY/vkiL7+E3kjDMk9mCumk5ffGoGq3Li334V6hWJRLUAwQxJ8iI/eTT7+FOYH3lkJI15czakw2BMCGUkR4AEkduA3gjysnr67OAnf7D7+vPu8muQzoggL6bPXmTzA8uKDhkQGSGL+6ciAYHLy+l8enZ+BmGCVhIyUiwfCQnZoQGZGgqQAXJMHSAwiY3JxFQBAwXZE9mJ0CzKTDb4ioOE65vrvMqraTWdzWfz6XQ665qmrCp2rixLANjtaiJkdojEkYptgIiTSRXC3He+3tWiEmOjMs4IIRAR4G5Xt00zX1S5c0Q0mUyePX16dnpORXW7bdfbzXqzOZwWeZYzswVRtRBUNfG+gPYfrvceEJxzhKwmKqqmWZ4550SE8WEOM9G+J/pgd/iW8edvssu9Vy/+lnbWN0lC3/T8g2AxwDEfCkMfiurvTmmm1vvF406UiF9JrQPEyPWF2JEhon7iK+0X7/H3QQyqHM7Y42kNiwbSe5tjNJOOXAMj1AmkgUUzQNQUHvxQ1BszvpI2BIa6H+bYD8ANJk9CUOx/bSETFCCywrQiLQgdKiqUjFAVswxOD2ezMidVApjPZuxy7/1ms9lvTUhjjRgRov45ZBWMdldJwXQ4mih6R9KNcRrD89voYBq7s8lLPU7mpjQjY38LofBdANogqz1Iu/2mg038l9IHMmj/+kQlCFkv+g8R4SC9aG4xwQwJkZgpcZzV1FQtwYpTvofuudh7/OIemvz3OGy/C2R4x8n2HsCxqsYQF0GNiXnee1X1vttut23bTiYTVWP6O7yGMXo4fRyj0919gtm9byyKfLFYbLfbpmlig+Q/3j6MYDScEg1AjQjRoG27y4tLZn764nk1n1PhvIkx2v35TRxm1P6eCxHY0Hi/vyf+/X6jGDEenxgQ8yxjs9ZjXTeb5bqcVpPJhIg/OIg/CMQfHv+w4nAMXtuXWgNsYHyiwJ5Y3hsBBUELR4+OF0xcFuXby9v1tt41rZoFH9biG18SQdbhtgtlxtaFxWx6cnhwMMsz1iIHBnBMee4OD3LmfDGfzqfl5e3tru06sQCgql1njfi6XTLArMxnVTmbVBlxlnFR5Gne0CIkGAyzvIQZ5a6AfCpFNV1vd+t617WdiapaI6Hz0olsdm5W5SZKRzMumICHxjI7Pj46wGKSF8ub1Xa5a4OF4BXZEaLuW2A68O+ms/njp0/Pzs6vr69++atfru7uVCWNzRKJYqtqu6b1WrR+Pl8sDg43m13dddp11XRCmQtMyIzsgBnZEVFGyAxGZOQMWQE6ME3Bo0zkMJ1NDFGT/psGlxCM0jmwx2gB9iqtIRph72lKuIKYU0Q9Vat361ofVKx4b3eOpfgQbJcGeVO8XJoc642wg9vLEMEIB+pur3nS0OQcBi6p/+f3pYFeOI3MgWh/jll1zBRHOAEFICTtFDKkbtf4IJwX1Xy+Uw2uNQ5m0Kndbba/+erVbrvrqIR86qbHWC7UVfkkc+W06zw554pc0GOLIkaJ7aZgoupVAxgwIhk6M0JwgBXnTnbd5lbqO2xWuTYZCIOC7N2FZmom8TVGL/SoyzpkqadSwIgGRRYBKEazjdilI884AhIyAxHnRZYX5DjLcs6cI57NZs+evZgdHHBeKGFVVY+ePpsdHJbTeV7NncsQqZpWEKOoR4r1ILukTxIEQNA8mBdpVIMZuqxCyMA4KTs98HP/a2FElQUA9/b1V7/+67/cLG+ePT05OTvKSLTzIAomZt66Fjsvu435lkxR+sg8sBifnAblVNSMYuZJH/NBFK/gQa0iUqVR5fxhtf/uP3pM0r6nAfA7bBP38XZ9KouqjmyzCGg2qcqPnj39wacf/037Nxq64FtVQXaxPk9xHiOxeuw1efc1DOVHvNc14vzuj2SOvUJDw2NvY7l/SRugIiGQpnRPTvMXRAGw8aEL6oMCaQIIAKhJXN2xd8eYJa4EEcV3oC9EY439oF7dJ71FV1hc7bsutF1QcDHsUgHRIIgG1bhGxWw6lzmXOSYyJE2OYUotMbyn6480YRwndw1zkGipK5pogoDvscvsXWBocA+kgKgEqqApdAjJkAZ8MQFKkIDYkSuOzipEOjzYHc66yzfdzaUFDwLoMiwm00fPq+cvqo8+7opJa2hGGQJRfB9BEkef4yYeKfKaHHUEXBSL7PAP/lE2n+8mpa834Kg4Ojn4wQ9wMhWiYAZoDuNeGGdEzIMr86qcH1TWVRZysJiwFPP6IPmTSU0ieKqHlY4CdvvI3R6NbSlkbaBhYkwZBWbO8jwvy8XhwfxgMZlNHZIBHJ0cR4A1mIn3wBy1CAAjIueYiQEsy7PJpDTTtgUEzPM8y/LgQ9u0vu3u7m53u21RVG3X5JQv5lOaTSaTiXIO2267adpaZ+fT3GWEKJD8cUN/emi4AFi9q5EoRraZoaiYqnPOORe3JhxRHb6JTT+Qhe2du/K98/UPbti9rDCyCQ9DLf2c/kNFeN+e+VuU3O/ua32r6cM28J0q0PpP1JBGy16MWemxr9DnTiDQ0O4cBUztL5O4PGgf2Rq/TP1IiIoE73syed9Cw748ooFLHBn3PcPYwEQBojIIjESOCBGZohwMEWq8N0KAmorIQK4Ybt+4Z2saJbH+SCemRqbOrEBfsGUYM+qAHGRFeX44n+QZmkpQ8WxAIvKgDzTyOcQ4MsfMppjIbNAvJb1Xqpe/dUzkGFIhLblYxvMKMfAT3w9jSxvSO9i1b721HzSQ3m1fvfuAe7lw+wav7h8mKtGMCoikgkooEtkipBwn/OOJmg2IgTAltGsvM0vvRY6C8sMr9j+Rg/i9X90fCPYd+WhAgaGJHqnKIYS2bTebTV3Xs9lMTb/9KBiPS+/7aUN3fDyi8mD7sIGXwkyz2bRpmqapsyyLrdN32zQPwRZg38DxGy69pNGYGiGCalM3q+XK1GaL2ezo0DLuTIeU1AdlNdwjc7z3Tcb3a8N90IL1Z4qHMeR/m0/2HunNDAwJDUxMAIAcM+bMbKJ1XTe72oLkZVkWxYct4INA/OHxD3r+UNO44oyWhL0DsJ9po1EZAWAM5lBLtqcni/l0sqjym7vVzXJTN+2ubjoUr4HQibem2RIAmN5smttdc7goq4xm03xRTcrSERsgzRdVNa1m82lWFZd3y8vlJnhV5BgV7hsBCdva367bjDcZsct4NiurKs9zh6bMjpiZs13rOzFFdll2sDgoykm2Wm02m6ZuYs/KG/i6qzu/adrWe6/66HBaZpzxELaGLstPjiZ5kU+mFb29W9d+03gkNGTE/fsTJ/qzrDg5PX385Ckifv311zfX1xI8Y2/jQlQ0MGhFm9Bi3YjBwcHhbJ5ZvWtAQkwty5wyI2fEjMzE4BiBCTPCLAfKFakNGkTMOSAGYsMREQQRkIQIgMlodBAhAFJIOIbBQYz9tP8eXhtz4VNV2Y9LmdkIUpxWedsjI7GPSotK5fjcYqA9qB4k/YR+Lhr2yAlDsBSdlhi5ZJBctP2zmWEafwUABDWNjCmJqN6IUWRgMBNTAwESEFUtkaqirGCRE2rXgior1Aphu73b1V9f37ZIpyfnhycLgQLzqYfcYTY7WGR5GcTKauI4k847sg2Kb+sY1aAagg+qQohsRAgONAMoGEutZb2V9SWGusSQQSDTmMZhMew4ZcgpQBz+op7BYBhzmfsRvB7lTAYgYGYaGSHUY4qNgBDZMTEnR4RzeTXJinJ+eDiZL8rJZDKbZXmOxAeHRz/68R8sDk+4KIyZGavJjLMMOAfM0tHAfIDOEkBOAa2PM8H94dgCQDDdmTTit6oBiI0NuQRwKeZ2SPpIMrGm/2gALr/4/Nd/8fP/0NXN6fHCObLQ+J0HCWhi4K3rsPFS79R3kYKGGG3XqqKiwux6k4Ya2TvH47jSpNBIHRXq760WPjy+a/rwXme5dwp/r5gCoyn6oZFFvUyj8Zbtz8Ng5oiPDhY//uGnNxcXt2/fBO/jVAH27dM9BhsxrWJ7MyDGLKCB749IvY5pAIr7oCEYx16NZSNVxXH4jKXAuD4wOi2xaqhGGA2qACqwbdvb1Xazq7sQECOjEkUjE8gIgIhcem0KphSj1XCYtbQHUthgvBppYYAGoirGnUAABHaKpJCSUYOZxLIgCsSU7MMUBdSedIkYBWx712aFlmAeo8Ktn/8ZZefY/YIH4Z5pq/8s4taCsdsESEZxBFsxmnBjay6281RU1Yg6ZMxyd3I+Oz0pD4/ry9ebr78Muw0EoazM5geLjz/NTs5scVhzFryiac+aVEtaekwnIiBCwzimiwAAbIjAlD9+Pq9m+eKgq9fKMDs9rx4/E8deVc1ih9qQ0AiBzKxT9MjmShVVCSoC1Gv2OICsoZ9+ShSpNFl0n2Ebefrj2wT3DVkDpCzLzh6dP3n6ZH58kBUFMZtIXpZFWRBgCN63nfexJydd0/jgiTAvioxdCEHNsown09JljikxH3zrGXFnVje7pt6ts6WhTXRaVFnGaRAqBKlrL/L/Z+/PvmxZjvROzAb3iNhDZp75TgWgBlZRxQK7QHa1Fpst9qo3raUHvYr9Z0oP+hekB7FXsxabLJJFFICLO54phz1EhLuZ6cHcI2LvzHNxwaKI4lVu3AVcnCFzZ+wId7fPPvt9tN1um8LHfAB+bWV0HPaHQ7taVYkHXdig+vKUh3sMhxkWsZRaJv/dsjFzZuO9L+SecCrBD9g6BUDV5eT7BhZ9yLE1+QSnOeiZMfr4+mFUZ1A3IiDX7GZjRs0iKcP+BXxQYMQLP+xS4arI7OnOtEIDVzO/uUV0fzgS0Wa9YWZRFclEFEJgpnKEJ29AFu49I4kW6F/pqiIAIREjU5EVwQ/xuKD0Y93j5mfOwRJaxjqUvPXnWRQghIgELUPL0KARWVJF0Itu9fzqogkEliXno6oNo6p6COfZw1JHR4iYmEgB5xAPBcKJsSNmrDUY9VzaW6SyQhlJmWh4BBNewgwWEZTlYPC9n877uNv70vBZo+v+qNwEDCIiQREkIgLF2vI1MUUVyCCIpBoWzGL3VxebkWqxDmd1ZnGuJAc1NTgP1nx4NTvbnk8BI9Ov3F/uJlJYCUuy6TmYJ6hwnqOawcouEO92u1evXsEDeSQn76Z2RGBKOT69tlWAXgrKp2Xv9DWbplmtuv1+P45D17VnSY9m0/YBD8LkH1BvC1miBPci4vFwvL2+PhwOz54+215cAFMCVQQmBLNJ6K4xig+mb3w/gcgmR3yJVEc8sUJMBet3r2UnEvQ82VmvJFNDZLZWs3EY9rvd8XgUz3h9fD0KxI+v331dDUiID4ZQVc3RtFTCxgiBDKUPGJ+t2u1PPjl+8uLm7rA7HN+8e//19e3ru4OMokAEqEAU4oj4Zn98u98zWBPo5dVl17WxietVd3GxDRxHGy0gtY0QJ1BXCw08TTWI2VHsmIURWPRmGKhmopEnrTBXjiEBMjqPD+Om26DggKMBKJBT+hPYu924O357fbu63KxXTWDiEEKMTQg5Nk1gfnZ1Rbx6c73j2/1+TGV8qlSYpAbE/PzF8x/95CcXl5c///nf/uIXvxj7HsxJj/5OGAp6tjhBb25uRaxpVxhiCEEIlBQQPEIFOVLgwBADhabhtg3d1qhJgjzkUbIgC5EgWd0tocq1igTABlzGSZwdgQTEzhooHlw0T6sr2NbaWzTA0gpGQkQTN7Q6r3jR8KxgYADSMs5c96/JbAYAUOjCfiRAqrEQ/nsIZXBp2jcM55Tu4jlddD2xOJSh9nBNVCALgACBn2RE/WyphqKmRE3TgInKaCGuL67appWLp2/5mxt7jetNc/Xs6pPf+/Hv/7FYuDuMx9H6MdtxYLGs2rbter22zkB1s4pPLjdf/PqX/fGQs6qIeOSbIaE1YB1KC9ZKtpue0oHHI4MEEkIzy4AIXK8QGBWORHVxIRqaICBZiQTGSoguNAl/OInBGqYYmDAgIfj8V2COERDb9fry+fMf/dE/aLdXT54/f/L8+eXV1cXVk9g0SkRN1zRrpKaq/27UI4UJDOHnSEETV2vIXD/iakg3MAEbIB9lvM35qHJEVAodWACbNoL6IaqZedaegolJQoCcdp//7b//2//4N21c//Ef/oEd9/2Q+uMApgyKIKxKSVSSlURpr3zYJ6FV1EOui326dh2WvfJS2KsGZmB2+rAj1b77FP74+uFsZ3hSG99XhM8NgDDHyk0j23MgnE3KCwbE3/v443/4D/7gPwxHydnt9n50nhp2xRmqU4Hu0TUnZpPqN5lVYKqJQktcKTMvGxseLz7ZeBDJTBVA6uBhQY8TqphqBjNRTSnfHcdd3+esCoCkKhNiz4MqPTjakBC1ToS4nD2VtfXS0SJC1NPDJ1+uw3OygYVgMWSMGVHclYOYETKAInib1TH66HQJU7Q522R+mN0PXHHr0+dXAY/qpAgzhTq/UoefyrZVICNVlas9pPJntcitir4voQGiswwJXZ4AUxOzSKSGpjoiGjZAIbzcXDz5ZPXZP5ChN81ITKs1rS4yh4wkyowAkAVKwW2oSERACIxILhuWICkDRQQMA8AAFC+ft+urRrOicBMHigUGCspgXGgKJUZXMWSKA1AmEiUoPX3S2roAQK3g+pp1Wm7pSSf1i+o3/oQUmwQmlxEAIMR49eTp1ctXsQ3e80OGQNGyaBpBlRkRGyJQUdOsaVRXXoMO45ByCiE2TVx1HTMzc6F3WxNjePXyxWG3S2N/PCCwAG3iehUjj2LD0B+PByJ+9vxZ163JtyYiRJkThCdVBDGrwOL0UNb/+tGfOXwXkHI8Uy6mVKYzb+/Z9PcMYbqn5PqYlw9k+7y2H2rLhJQtVebzNWqJwrz/IkK/sZbyShlwf3z9gPw7PimlWKf8aJ6ss0pBApv7XpMI5oMRZnTiBVKlErtWO5uIYKgCKgoAoBg4uvqrAkM/Ho5HJrq8vGxCKyI5J0Rsu8ZFoxJvieqgIiS/CQVUiTkyC0jNVMayR6LnkFLlgdvs6PcfStWoRilL4dSbAqEBYwgYGySUQAaoge1q2754to2siIqExOwlzNnD6KsoT9+3dBZNshiYMdXTJJpBzjlLCIGJySrfrg7XKvoICM3jBVaaSTTbsWEBWSv6s5uO+SyG+/4pZalLLknQZwvCskVUPtmFHOx/eJq682udiUmFhDyrxFPdsmXTsh0QgBJpbb2K/9SEqqYiWXLOWmiSoo6oKhkglTdxri0ucBPLfz97wZLk8BB6ePq/3sojW8QITHFtMJ+g/MrknHe73c3NjYggUckVWmjr03eniuyZ3s7Z1b5Pq4N5jqpmqWOhuyDier3u+96NzDHG+5K3f2RLDviSOXbeEgCjYh9WZt4fDm/evlHRq6dPrp4+McQMVpFaTsMo/JRJJjb7TXsDnVdG80cGtvSrE9IJSe3eZXlYZDq95f2h0oLAREMQA27jBjdN06Scbm9u3r0dPvrjx23gUSB+fP3OTiCTReSEMAMA+MAMK7hAo6oK6jkzIokVW47Nqtl2rcLTH33y8ue//mr8m7/d70dRFAgGhBQr6w1BbTjK/vAOQQjh6mr76ScfxSa+fvv+V199exg1WUCKSFFFptackJZqnVhRTQsKwxSQ1EzMkqNXDcHUgDBgFUuZG2qRSAAF0HczME2g314fb3YjoyJiDKHr2rZp1m1DIXBoKXZPnz3jdi1v3uiYQEuCkLuXtpcXrz75+OrpVT/2/+E//se3795EZhUwMwIEJFWrKWvFpKaqd7s9HRO1DW5bBjKO4lQsX3qZQwyx4bZtQ9vGrlMKMBqLBZ8CK632AhWYp0k8mYcm7GuxMFMdSsOyIiMgqSOAy1nT1EOSak3pLcECqpzsYjPkGKdhLKwurQIqxrmJXLvsNOE9PeF3ysmzGkg3+YCM/G3VLzn/VnWBIQCRqbf1i/qobqZDR6upGRCFVduuUfmIko6QuN2seb3SJFmR2vazTz75/R//5OmT508++qSJ3firL6537w53B94dOEZq4rNnz1btqomRCDFwAw0hmWEuJSMFzYGsJVgxtDLgcIR0ZE0BhEEQlNyijaB+YLeqt5OhYEE3IPqgjdNKplsLCMFcNAIgZObAFJkaxpZDDA1FLjmFRBRIQa9evPjJn/zJv/i//F/D5TOiQOwIMb+urECIsRantckB5P8AmKogEahfVDEA98tPoVAICpZMj5budLgx6REyM6Ex6GhECBGwjBmAmqmCGhCAiuYxp56J379999WvP79+//bpk+0//JN/mPrDMAzDMJABBI4MHIiJuG0osmGtgkwZuXhXABw4VpxSBpN50FUY97wXQe2D4u9sDFF9HMr9IUnD+KFOAHxodBHntW2JUyAyKfWMltrWFAy329Xv/+THu3dvKPUqDkOHs3w7rVThM5vPXE+eOpqX07eTFHVqDJw1I7AyRkgEqqRmoAqEiIGQMmBKqqJDGlNOOeecNWmZugBEj2FBpKYJAOpQ3BI8r7V+94EGJ+6fvtTsvgMHazyl9ymp6QhQtRGgJGV+V6CMrbpOVwaXTGuvihYqMJzpdctKDYsj9gFmx/y/c96aTY6d4n8xh0igl7aIQEyIaghqaEWOQHDXW3H9EgBLjSDwSR2hSF2kbh3M13kTw7HEpxNZCTZSLDugIZpRQSqZx6lpWefrvmyGwGSAio3neQoBqsfZISGCiWNJ1VANBIwQhDgjZyCFqa2qXg1Sne4xAGKqLMrZhr4oy/1vLZ1Q7rRVQlSHTyFQDNhEU0EPLSbfdEUkF3c4kknSNIJmIkMiAAXUGNnQCJARmTAG9qhCyaTCGMInn370/v2bnLRpadU1F9tuu1kD8NjncRwOhyMzP7m87FZNJZkQ1L6OmQHyZP1iKiFXJ2AWZq+e8ZRGXUEQJ5TSmgmm0xO6fBi/Y1U5gxRPse/uv7u/Ni2//hl88xRqAXbOvkRmqIKL/ueHDz2+/l5XZwiO/MEyZFZyGKv5ru4tNIeJ6USGQdWiw9QpEKtEYLKF36MsEmoAwBxePHuJiMMw5JzdqYxApsAUDofjzfsbVf3sR7/ndVXKGQFjjEhgzkVFTcvOChGU9swscXo0KRQQMKrminKaqRdFKcbCqkFDJQJAZGZChARqYJmJ16uwWUUmX6cR2FE6djaFA3Vi0oPyCo03q0vUTlnWEvrqupgiBiIuElm10jyw9ZQDZx0PqWl1cH8Uf44XOVfiHtSL76ul8OExuAn3fP+LT51m8EAAUEMy9LJPEcjKQdgUSUkVS3o2GCAIGJW2tKikrCIqYvWUYy4UT6vl6dJ6KjaUu3Dqvd0/v5238BGnr2weyXgCSlgAf+pXdwaxiPi/HA6Hu7u7vh82m5UBTS3kh4oCNK1d5nLqoA9poNO+6c/gnNVUv1SMTYyNiIxjapr2vmMXp8J2ESSxtC2fxSZbTUTMItc3N8dxuLy4vHj6VLn6wbyEPvH1TSL6b3YMn5m754cVtBoIXaCn2Rd27iT8rpP5A99x2nAnGxlyaJFiaG2FRNfvrx93gUeB+PH1uzyD1DRSAK3aXJWL/YRilb1QVpE6i2sEyMGjTLgcfw3NVgF/9OpZYNodh5td/9W372/3x7HPwJFCICIAE7W2aUVGMbne9f3nXyHR/tgfsxkGck1ZAYHIJ47AgIoLN5mQABpNTT6sxFsxQwUf6kdDJTSVYk5yB6tBcUz5mwVWpMEz2kBB8s2Q0XZkBIZITE0bmoabVlRzSlICfDyHPfz493/0yWcfH4fjV199/dU3XxlAVplTfieWfDlYoBohBlXIIjqOmEIDHLgBIzYMCBg5dk1oIjFTbDg2SGhmggah2JIdLakwd919B+Ayv6QF++jurEoHBMyGoOXA6HVkKTrL/GPll1nxSSMSaY1PqoNtk9ZrWL1yU2/wpLcw+7lcS/fuK07qwoJ6iJO/GmA5oV2PwkVQmGPrCveq4v3KH0fNkLPlwNA13WcvXwz768HG5smGWtDbW0sJiLvnzzbPnz958mz78pOf/P4f/x9/9uf9Yfft62/ScCsJzKQ/YjY43t1dbDaXl1dPLi7B5Isvfn08HkTFkACZVCPaRUud9jQcob9lTR0agRRiMGrNNEBcOuKsHvq9L0/VYoBASIHQh6+ZAxgQE4AjhZumidFjd3xyj5E4EHFgIEIxuXxycfHsaXd1Rd0lIgOaWULrTRWIAaIZTWDK+bTr98x0jGYqRygzA0GgMhcOACBovaU76a8h7dkyEqIAWFLdUavA68LGkwQpQzUTaEpp6EVGaruf//t/97f/8T/c3Lz//Z988tEnn6jkGJFCQxyb2ARmNIAsuN9r4FG1rUc/NRPNoqkMulmZtvKh69rjdqVOCyEPyUtnBXPXDEzox2JkwXFMh2P/MsnjPvADEoinWcPzCc2zMcyprrAFuOHsr9QIOytSlAqgffzRi/4f/MGbL37dp3EjDQGgd62sanPzKOUDcXP3fUBT3Xq/PlzqU4uS26Vc8glcj8WRrGaWVSVrSrkfRzUtdg+iEGiCdTuBkUqOnamI1aQ2rM+t3RO1J/DFUkdDBFwg6QFRgBJqItYQFQonRsQSAIbQxEixgSYys2+QJXpuIrYS1ujLErVXdgezCeBY3aGl1J9yT6fRaZBSORZFbjbpeGvRYDYUg5l5u9SAwOqbKZI5UEkhBQYAZD/2CKqYUOHnlB3Je7cG4PnhiqqQJ1wyGpJRqeMQFA3Qow/myhKJQMkAsjeYgUGBC0mjiBcKICZSfmhTVGPW0Eg6WtnstSoIdSR0Mtiiczsd0+QZurgoP4vgu6ztidg32yx6PPZ31zd5v7NIHIiRwafKJY9jUslgaiI59XkcsmQsKA1gwhiapmmKf8x1GSgNvxAI1F48f/Lpp6/2u2Nsmu3FRbfpQiAEgsGGNAzDkQOEyH4WcKeao5ynPvEEzteZnCaTpQ5Pne+TgLX0UJ+ZixcdozL4PHutiM76PQ/qOLCcn5++8kLEOaEVL7LmXD+p5sqpnWmLrzoJxxUwAID3M6YfX//N+3c+KP5PfcQJH79oOWA5yCssbozJGzkTmHygf7ohXVObPKfr9frJ1ZPYxP1+n1JqQnNxcSEqYoLA4zi+ffsmi7x8+XKz2SDj8XjMKXsHyOrRa9r/auTrCZp3kq29SKo+TpeNoHqCDIFACYCx6T79vc+A+e7urt8dCOli2zRtUBRnuXkURpkOOQ19LXuA2IwLUMVQ/cRgYAXZ4bN5iOhryHd9RAvlt6ArqGxnBYwLp6Tie3rah9Th31S165JAddZYWorFS6OuiojvjEYA7LjeJY7DHcceaTsJy/53c8455ZSSiPjlLQSm+iph2feC5lxgUC3L8tkN/KCSuDyHLY9qKh5PQKZGXMa9iCgwM9VBQ1WPKDwej+/fv08pPXny5M/+7Keb9epDMmnlVWixfi07hR82mnwo+LoQG4lWq9XhcOj7fr1eM/OZGfxss5is3w8z6GuPh4hev3l96I9Pnz+7urrCEMSUiNCjipY3GP62i409rBcX9Dj8XXYX+87fcty4n0I9RtdUN5cX3MTHTeBRIH58/e5OIH7ENzXjMip7/8GeRtjqis81QBlK5jsaAJYdwJBo1TafvXqRFfbHcbNav7m+2R9yUjv2Yz8M/tUyoRkgRQEaBC1bNnZ2QY3G8gGkYmuEmiGqYDVSbZHOUA1CgAoGBkqI3vWsTWkyzTTNEE/xD0RSggjYkOtSjKImWWTcAx8pcBLphxERiUNoWlR4+dHLj15+1MTmq6++/vxXvxrzEChA5f96SvwCPl8gv2Bu8jUBAKTAwbgx5MCRY8MhYgjIgUIEimacBbKHrlEJa4M6HVa+Qd1Rp8b7pJtOWw/WP1k25TqhP0U20FRCTjiJ0zQFO9k45vZhDe2rIv0yxXuaYFtcBC+pl57iJSOydCVmhxg6gXfam2xSNWvD2AexSTV74JIKI3UxNCF8c3s3Hg9bolXXseR8HCwrZkCkZ68++ZP/w5/9+T/6KSP++3/3b7/89S93N28pdOgkSODUHw4qkEX7Ied8tz8CcYzQRgqgDYaoGPOR0hHygXVgywhGhOCR8fd2RLVyWi86SjnWEyASQQwlfBCJiDiEQIQhBJ/giy4OezohMc00uWqXFwEEjoyBa961GIjpYJYQmmogpypWqwFSSb/jYmowAyQCNnAhAos7Cd3ol02OedjJuGMd3NFhQP77pR0RCAhUB02Dx1iAqYpkTUggOnz19ZfffvsOIPzoxz969eplu10hqDEDoCU57O76Q98f9u/fvb/dHwzQEBeNKRMVA5Ocz84yVsf8l7NQ89o1y+E44fm8bhmG8dtvv/106C8fd4IfhkBc/2eSUb478AQXCWvzodxOWX5T66EoMhIIXz5/wXmEPAoYOSag3niqYKbLuc6zmKCFlk0LNYomjXgqr4gWf0xNQZGIndtTcoJQs6RxlDGJDVlM1Ewti6WcDSCE0LUhxCoQO5jebDLi+EprVpt0Dzl472nZS+14UXO5BRhJiYU5E2ckNw8bKAFF4tBEaALEiO4Dm7UKnBQRRMdSTbY3mDNOpiTAGilex1VKsWpYJ02XHhybbDp+IRGKbxoAUKd7wfkPhgha2+Boy0D7mhHlk6olnBVKW2BKJSTvazoXusb6+jbnSQClhV1+2LmNOrUhAHS+IoUiiLVaRiynANMSOsvK0TSCMlZYYBm2AMUTCaOY2spwcQHjTyNBZrpISFvs96qGDGZ2OOxub64vnlxQaEt0keSU8zj0kkdV0Sygo6kgIiMyU/nHnQFIIpJTkiwpDcfDUcU8tq9t22dPn6y6FRHFrqXoyjIjQc5jzkMI2MRAjKqas/psVhXXH8j2MZ8OMVhqu3jPmXXm0buP8rzfy7k/AfCgVxFqBHTVvAhdefF4j4dYN+eGOzNVmFzHDy5lOPOqyrTYo0T8w+t61t4ennFpP4yptenJnRQrxIVA/IBbsHwjt166hVYEEiZfbbLktmlX6xUQjjmZGRJeXFz6HS4izPz++nro+1cvX243W1Hpjz0AhBCYeUniNTMFxeq7nDtSCETeVLQCzKjjiea8QUMgevLsKQca+n44DqB2cXkRmmL89XYKoS1LmGXrxQ2vttiDmahEeS+vNkwNme8pfZXYzynD4MG5NPu7CW33w+sePs88tGsXWzQWDEVOydVhImL2njGbmaqIEiKqAdfPyyE5KeecsmRRKXibibXsN1Udr70Xmwm2/KBdPIWacnTyVqtb++zHoXIMcnuO860xhEAOxiZip4EgTRShEIKIHA6HYRjatmuaBglNv+vgaCd8YZyRLKfM+u8QVc8+gqZpdrvd/nC4uLi4T5n40If7oTfoX3m33+8Px3bVrbdbjqH0lReJvVVyBVuc4+y3lIvv3U7/P9lV7DStrzTSvXOOiADdavW4/j8KxI+vvwc68dRJK/ujLms/W3TzYNKmiIlJs07ExoJ7MwtE3EYgWrVdE+LLp1e7/TCk/Pbd9bfv3o1JjGgceqVATIYMGlxaNhCXsSrTB3VZJBoCKFqtZ+oJoDqLis5VZjd8+0EEA6YQQkQDAmNvdPp8K1YDlYCV8DdytUtBRS3ZqJJRyUOysMAZ8cnVk5/83u9drLf73fHrL756+/YtgifSlQqVqNhwdSppS8CYAqKCGTPFxjhmA+LAsQlNyyEiMSAjBUAWBTXNnuRGRJN5twLE1PRE2phWWJyPIQvOrylMefAVsnliabNqF1/oJviAYlCm0mZj71x9Lpb7okfSnJteUu4mfXoh5JXANvLx2ykaagZJToNypTNRE6J8vo4YEZlFJRB1IYDqvh+SKCEChrZbMzfaJ02Gipur589ffdp16//t//3/+t/+1f/n/etvZNijKlIgbAEB1VLf78c8Ho5iaNSsu5Yhr0g70ij9eHsnaYfpiDIyCLtBvJpYq8d6PjEUWsT0bic9mImYOYbAxIELNIKZmEKIrhgzFWyZV93ukVKrapafzKDC1UAM0CCbDiZHtSGAQuFsVtqoeUoFAzBAAOAyk1sePXdVKphgmaEX0EHTPo87S4dASgBm7D8vSQYTtQxNgIA5DzkNpiCizjUPATkwKu92+92ub8L693/8oyeXl5Jyf9wlVRNNh2F/c3M8Hg/74+Fw6IeBJ6mvymQhhBDjNBR8ohCfHOXxwQPcIh8MAcCnz96+eTPWltXj6wdQTNeJje97JLZF2szkxqq0dJwsnjaTWQwALi62pC+Pd7eaRm9alh4gVSfu4uWj+lbjvnHhK7Tyl/1exYfk7iIIAgFpKRQYEZUcT5PFxKwf05Ak58Kb9XQdIiLkGJsQKYTynKiigZMp3YxrjKBlvmNWfJdGxQ/XQvP+gjPmhYxQiTOz4oQjAiKmECEGDQQhADMuCHwTwXnCGU39SjwBDc3f2U5zUrRMvlDtTuL52/6QDwhAHZJfrFVOigeXJE4MTbU16Zlvbp6er4GbjfwdqKIhKerUqHWJB4rjWktHzokUhubcBEMDNY9f9Z3So6fQZjcw19EdL6/IkJUbzUGBtHRcK7KkcE7qTW6LuAkPzzXHivm9t5BK6+UiQAGY9lkVNS3o54pOkJzGlAYXiEEVTQmg5A9G73aHEJkoeHs9hDCO47E/vn37dhhHIm7b7mK7btrAzEgITEZGiE2IiJAlq+XVql1t2kmtUFEAdKQUzshRmDoCldAKqrLsYcApHBPmUd+HC/Uld/jBZ+F+tN306/5WY4xLhc/uyc0TbPR0ZXB5Ah9CUyw5yHgCQX50Ef+QyjKbmkdO5qEzy62qEUEFTxf347x021mWVHlG1KEV3h80XeYvEjEAiInPZZVxFBkBgJAUBJCJ2MxElYgury4RMefs34CZ27bdrNer1fp4PB72N+M4bjabzWbDgVW0HwZGD9Kg2s4HD9vQGjNauAdTYjYxGACyqZOKsIl8ebG1zdpUqpPU5jJnAooXYAVN9IGZvexlBAcSBaK6bxfXjSmKSs6ZmYhrlDTOUA6YnAdlW0I1RTJGCwShbBIgoIrkGwnU7L77MuJ3KIwP/snv2QM641SICCIKEmHh52TVEELkgIBGZlTcviomYETu0HAGBeQsKYtmLeQ8K61RNVD1mwrENwAwNXWbuZo4I8lN1QiCE7xiwhz5bFBdrKetaIrx9d2HEQMyEUVmjyViDszkH6P5x8lMQJO3etV1r169+ov//r//6U//bLNewQxTKt2IiXFoUIFMCz1ksmYXczQ+YP49qy/OlmgXhQ/7fd/32+12iio9+2hO0lbrZjyficD8zQVAybK7uSOg7eaibbo6PeWlOC4MEouWO3xA47Xv0IHuHUNxHhL7nvftgzl7Z2fHBbdyMfpQUNPukHjcyx4F4sfX7/gQMpME57jbaro5cZLabMzxOW7CeTee/tV9PCpqgIz0/HL1/HKdkmWRN1fry47vDn02/Ort+wHM1ERMSzYpqbtqJicvmhX3TOmPoRHOcpDNsycGC2PliU8Y2JrYdE3bNZHAggloVkmmwkQp5aywOw5jTgI5FXcnOxkWAjlswkCZUUU1Z0b66MWLT15+lPrx9Vdfv/n2WxlGiozmk6NYiy0r0IZZiyBAE8JsAE2DqxXEOIisOQJHDA1yBGTPP/P53KymhDYnJ1XxuyYqLAYOZ5G/FDnLjO2i/dYpe5iV2Wn60mpBjnPmFyzGFx09AlMI2bysz9itOlZpjntcvr+SlOMnDqyZFWaz1RmmAKJFwrqCE3oLVXDaOoHQXQhE1DQNxehuOgbYdJ0ZAgVoukGzaUbuuoBmRzlkAMhGb9/fvv/2r/6f//f/R7r7dtVgG0CktxSQDSxys8o5j5rzmKhdXTx9to4WtN9g3+qQ7/bj7h0NO7KMJozGgEiolk+rcCBezH457YYAAQAASURBVEEhEBEzB+bgpmAidsAwMzO5cbgGRSMT26xfYZmaLeXu7JUDrJ4In4W2DKBoyeQoeQ8wAhlqAkoIXKV/BTCDgMCALUIE5EooZu9koI1majoiKUJWOcpwp+lAOrrFvrr5EcwsDTkdbQzYhKRZxE3rRoFjoKaJROF4kN3umPrchubJZjPud9c3r2/evzkeexGVMedxNLUkOWcxA2BG9YYTEFEMcdV1Oamjve97iE+70ecGilpyzyN4x+Nwc3PT973ZI4P4B6MPF+L7h7wYD2SM4Plxv3AEpWhw1QAMdccBAA2RLy4uyPTu+lpVwIxxCqMrMIaF2AR2kt+9pODZonqnyh8+GY91OCKgK8PlB1TlMkZKhMgG6JniYCCmAMTMMca265q2ZVIinf2OC7MJTtKr4SKwy1lMuPRIVjkXT0WxuhQUXyS6TdaYjUNlGSkCEkQKAQJ7RClSITWVxc1HfKAyW0uIAC4mWuZ0uumztQmSXqEidT+iadNbhhXWH3DxJ8tpx6rorBNtYLJ7GZZ9zwmT7umtOxKVW8NvHCM/x6gpAKIRI3ln1JdnqxKEDwNN8YY+Fu1xcjB9A0ObbNSw2ChL+ezkUFIIQk0GEqupAEuFHWf2wlR3liEkXBZuiDZVp0sfgKPwkQgRqe3a7faiaVoEMxHnPUrOpmKghEZcOBcxRg6BQgRmjoFDQGT3uIYYmfn29vb67uawPzCFzfaCUNZdy4GRyAiBMXBo2oYCi6iCXV2tLi+3Vu2N3nc/QQhTGROe9gP/0UTU7KxKPYmCrIU62j165ofwoGfEmLMKef4ri0nwBwvpswDVU1X6geCf747cnASXx43gh1Kb4fRPqYXmeYnS2FC1OSOrPvszTNzw9DSNjhCiMrHgEnOZrCcy5jI3ZmiKJppVjUwCs4JJfzj0R09KAYDpBFvaLQAvnj+PIWzWGwAyRRUbh9TEbCtAYDO7u7kLMWy364ajZAEBgxKPpiXnGtX3OyhH5pJP7ZnFnj5hBqbusyh0oTL7AgSMdRXDqXXoTuo6rOgLEZK3rKSuj0hlJsEyyDh6qAm0TSyB41MLdCqwdEqzRTB1gB8RBEIwMzIxH9Qrf9UcklG80XAfNvXdAvHZoMMDq81CczxrI/m/iEhGAiQ1JN+rVAmM0SAAaAFXaeU0A4KQ+VSKlABM38/KYcLTX0T9HxM1MRUT/0cto8dsoyEoQkaTQoVX0ywm4uCJ6VhEU26DbzqVj0gIDBSJmaiJLRBkEc1JFEMMZEFUiTBQJGRFZObNZvPjH//4Zz/72V/+5V9++umnZprSWPv+UIelvUFSwt0qWneaOpp6d3V4hxcRxt/h9q0fjXvnU0rH43EJ+niAIzFrvWWjJ1zSNoyQIGt/dzje7J48f3axvkBkNUXvOWhJST71PZyJvPdNNefq8Lmhe664z9tND1E18DuXspPNDBfRfjAdOJfK8bIx//h6FIgfX79TibjaKHAWeqtqDHZaL8zp7OwN5zzhYpeVcShzPgIiYLjiAJHbF1fPLzd90uv9MTTNu10/CGaDQTSpZ8sgTkN1PhBSWo6F/OBbvKFqgTDWGU2t1FeAaRUHgDJLayA5Q4Nt22xi2zAGgiZSYFaALPb16/dvr29u90cZkwJhbEpJ5M5dsCbGUXtQDSG+fPHi449eotnrr79+/fXX6XAMhKBKhB5zAwAq4uUkzrKnnz8wmSoHbjtqWw1BgSA0RuwBOYZsJQIOBFBL0BiBu6P09INbJvOcZNHVZZjwND+pUCgrkaM4rBFAPaXHT0u1cJfSJK498SkDvbyRIuejn82w/qxYqkx/3wruBsBFiY/OF2Mv8ktD2udy3WhdIBNaf33ZAS2CsY81qVJsLlebJnAwzeOgeWxjY8jctH2yGBmgGXPWnMVIOKjCl6/f7G523/7yF//+r//NRxdx/fyya+MwytAfQoMYgubsE7yEsO6ap5fbDkfre7l+d7d7N96+hvEYQUEymCK5BxcYCEwQ3BUcAjMhUgjVL4zMxMQhhKZpPCMZCYnJ0ZghhMmYBVACEasmNTfcEepocBE0rDxomkEFSNCy5GMe9yYHZEFDsASWAbkqIj4iTQYBMSO2wA1gRAgOr0M1MEHNYAlNwEbNh9zfYR4YFAqWTQEcvWoKkAVMGDVSCP7zOy0ZCExUcn7z5be/+k+/6nd3Dcd3X3391//6r8ZhNw5HNSiu6iJ+IAEJGpmhSm2DGDO1Xdf3iQgLonHRyLClR+wDZ5cFyRFUdb/fvXv37uLiom3bx03ghyIQkz9Tp2dju29tODPlneHkPE+1MuMcFlGO3CpSh2ELBMaz2cr6pla9LzbRZc2K67dI2NXtWP9MSaNUUG+iFY9O9dBoIa7XZpsWM5JqNkBmbpvWgAx5HJOIoCogxRibpmmb6KbMGh8JzmjG06uCVTGuSulcIS3HLidL9YRXrW/KCjjBBx7J0Jg5OAvBhVXEiMTGAExKRcaYn1UrJt4qcJWne1YrzetMvyAT+v4EpQ6LmqoWeTopJzUEBudNEgHMqOB3tfI1Ch4XFoALI6vYfUNA88C58vmA+32xEnALuB/LjC4gUOUO49QKADRAAZlOWl6tSu1E1Ia4y8s6B+KcpP8gACtYBlJkIIJc7IFI1ZE9X6rC8jTzjPOSbztbqLxrqzZjS2mhPCEQ4Wq1ihcXxGCaLGc1AclM0ER2zdYPcMxuTQsUIxJxjEAExKUPAUAhBGZ/0NpVt9lu2rYlRp+gMUKKHEMMMVJgMTXjJ0+fXl5cmplJGTGaWgHZYdG13TI/2kVUMvavW08Qy3ykKRfI9437wvFSZ/nuMvhDLFEu356+YwD8IZ2onPamSecPfbslQ8NUH4vqH05lVpcg720T2TQFNaVSnR5ysJ6AbDH3NxswKnsXFNWfRFV/dsTvz0KWcK3Op9QAPdSuTMAUj5B6fpeIQOW8qaq3hSTLmIZx7J88efLs2TPvt6mIqaSUADTnGAKLym63OxwOV1dXq9UqhCCiChiIHWwLgMzooZpIwN4CElWzwFhzzkrFN3kySrBobZQs1dTSei32USpuYS3IFwUDMzHJolk1pTz243a7btqGEJnKFkNUIlWm8JMymmOGpo5cLwigMuA3+22/z1jTd/sVPrSG+Drgq8RcpC8aVP5/RRVFoQwNld6mLvLjptvEU3xQZ1DhHGmP8592z0pWUVMP+TEVDycIzIagIllF8iA1OK4E3GnpnOJsf3cEr/8HEZBL79YIiJEa5hDCat2p6c3t3e3drag0XduuuhBj07QhMBiFEJ49e/azn/3sn/2zf/anf/qnV1dX4zg6+tId0gjFQJZFzNSx0Wpg4pAqKoutX7riMp78BLPf/h6094G6w4+I+/2+uOx/m2efFhPcxLzf77/+4kuRvFlvYgjixrVlICL+XZea+zfbfzVkES5L/AoP08dm56NA/Pj63Z5BFiLUZFLFZZ/6/l+qZCs/9ToUuHqvfDMRgYKYMlMDNULUbBEhtLFrYNU1l5eXd33us76/3f2nX3/z5mZvIYYavAOmCooEjGqwrKxh0ilrNFVBwgOA13VIuAAeIREIZE2j7cacBm2bTdds2sjMIVBoIhJvLzcf7198+/bdN9+8vr7bjaMaMzADshk2HLbbbXx6hYZN03700SdtDD//m7/+21/+arc/AGBDjU3GnAXGwSODAb1sRvEJHiBer3iztqa1EEO3MmJFEgMyn/4kceNAsdmSloMf1XS62cdd3brL08PkM6aTlKRiP2PAouPXtB9UqJm0i31GcTGzWWVul4R1MS9SG/BnYOJyelWD0movlquCanSBGM0ISWvrtCKJTUo1DlU0gOIJ8INQTXExAwp89eRJu9q8ffPtcXenOXdtY8hpHB0XTS7LEyfAZBmajerw+vr6bUqH9+8h0Nv3r7tWX8QnTduMoinnJkI/HEOMbduuu27VUGfHmA/SXx/ff53u3gY5RsRAgNy49Y3IYoRAygjMbeAYQmRmJgoxOjJicgdPXejqEDRRXRwyDEuqcj2HaY34KMmA1QVoUE61tSlv+YAkppqPN5IOiAcyAwYENkgGk1NJqwrNgB1SS2FFcQOoYGSmKslkRByRBCzpsJd+p/2BJTEZuJsAzWd8S8vbkA0DIcdGh3E8HCRnySmloR/G4378X//Vv/s3/+p/v3t783ufvWqZhsPB8hABkQl8NLuQI8rdiFSknFrwALOH75lH1U0HWq8RliCxiX12dmiaTjzjOO73ewD4+JNPVo+gqx+OQAxUna4TL2E5wvAhVN9ZfLY/bxOxejrBFriwijtPgAiZpkFEB8uoOtKQTkYncDknblVBpgnV7hxEA1M0Wvhea2JorfqK/oMFKwPAHGJDhpRUPa9cVQEhBIyRAnu4j8/dFGdyabqpVv3aHzSs6d3u5/U3WSyZyzH8k3q75LpMTChPWXGuLBsaqCASBkYMgKxUSn0rztyp5nSlkma4FJARLmJqCMnduEUHrqq5BxXU6SaYh1dxUVEv9fDZI1yajEZTfQ8AqExoZKBoRuD4BzdXFe8u1EaqM3vqnId6YIIpqqJnwBXgSGFKlJGaElRHAAAkVccx153LD0ELsJbVlR4y+Kh5dRr7vUNsys6ocCFCDUCViMutBQSA5v1fvxtVmRiRKpRraSlHXEyEeUrP5NUtsbaSNI0iSSVLTqqZ0JDJDYBUZmJCFYiZQlB3Slc0JxJSCBeXV6v1Zr3eXF09aQOBJEIGNEXDwMQcm4aYFYBDfP70yeXVlUFyrJarQESIRJZraBLYmQvYXy7RutcKC6AclzThuV2wCLU7S6I7++/l1/+g6Q+M6uu7JaEPzOfO51hdRNv9pkr/8fUD8u4UddiPzHPzY1qE77c6Tm8hm/pAVXWFAihb3MNLU6of6WqRhXPA5bylebiLqNYWaVWKRWQYBgYEhTSOTdusVisAFBGvAn7v9z4LIaQ0ZMkAkFLyCK+u64h4HNP7N2+I6OnTp13XTRFqIQQoszJwap5VgLnbOrcxlykpM1gA62yOVdy+iQhzKHMTNUqNKA5DP/QHkXw49pv1qomh7domhOiTEJOUClNOoMPrMTCHwCVYr8QZLEcTZhbT93zdH0E4e52tLS4T+9+6/+EWTqMZhoBOwEEkpcI+MDRCEy3cnhIwp7Pn1kocqAGImZi4U8PD7AwwGCExsg5pHA/HNA45pZSSSAZVnNLYzBCJvXNsE0YC2ZkR7iGGIhMDGCOHwDHG2LWXT644hCbEoT/e7ntM2HRtiBERUkrbzcVf/MVf/It/8T//w3/4JxcXF0Tc90e/q0MgrRPKIvL+/fvj8ZhzFpEQwvPnzy8urqb7YBqrrcESCnayO3zIAH62jDdN07btMAxwysL+kFHPFocVLcqKEWHu+29+9fmvf/HLn/7TP+/arvZCCyYM7b88WOh7/ozf0dj4jlbHb5zaJCRAUNHHTeBRIH58/b0ork8r4ZN4pzrSOY0JlNN5Gb6BxWmlDonMB1wwA8gqFQilqBbALtqwajoB2rZ8c3t7c3eXNCPxVMUy2jJwdypPDctAoarB6QEdZ/7kctCmtEV7TaKiqqKSRIac2xBWK+PAIYTNqv29j18+2a6//Prbb97c9llVxCU4CZrG4fLi+apbbdbr7WaleXz39pvb6zdpHEPTEShSQGKgommVVr8qMq66Lq5WijjKuOuPFJqwWeOq0xggBGMWBEDyuC8Pr5aSoY4euOATUjZHLlBpswGeN+EAoTh/EOGkqvcPzenIMCFZT9mOsABtWeU6A94PRfUAMYM5Lm++ec7gRz48MpHAtIp5k9ZBs6HLs+lh5irUCpaq78uKaxbUjIlj0zSxef/u3d1uNwyDmWazIWvqRwOLIQTACNjFDpt8M2QIiI32Qw+5p1WIq2Y46PVu17Tt82cXl09bsaYfwcCIYbWKTy/XbLnNdzEfVY8aZIzGxJGZmZECstfh0kToGmojMzfMgTkWRFbFnUwRMqdD7tNnhrXhUY7zVI1xSzokTQ3WKfDCD+6mkgcb90DZJFvaWT4CJnPSB5ApTeNcaGUoT4EUBqA2aCYmIPcDi+poNjIoooEkGQ5yPFjKtFCt3e0N6kdqjkSAYOPYH4b9+9vd3d3Y9+N4zJJVLWX+5ldfXb/dS5amCW3XMIGxuxmnY30RRGwyvlCRzlzuYaJqsNbZI2M1EcTmt7YYaLJTcbBoBMMwHI/HzWaz3axLVPPj64cgEJfBj4WLCpdUhO9zJr4n1sAE4fdxiKmZNTVUierQBBguItMe1IAW1WwN2pyf6VNk9qnw4zUKzkpuQKzMINRArIENwMQQgQMGAgQBxx2cBAvUISGra2wtq6fG3xkmb/EvJ97jadLdpW0E8BQ93xLIg9m8XkcCLpbbBRwJT2cdzRNXyqBEfbLPlZCyhi1UEKi8nWk9QPhQMTYl200XeDYxkc+r1BTXMvVMCgigZBOCCRRqooHPcdRPUdnpk6bmBxgH70/8qwJsLiSMahPWBeqfAGlayuaGOIJT4cHIFqxdF8eBDeaDB2jhZpSLjG5yp4KKPBVP5zbvErY8S5wLsbPsu6o5S0oiSXJWzaDqWUHFAsaBmIgjBSYOwAyBUCvEwsVt1XbVvXz1SlVjbNerNYFYKpq1ggIXWjEiiaIahyaGEMzS3OZxZcTmnMLy5h0RM42WnOGDFwfa+xawB3PnHixrbaEXLFIeZguzqaro9ymz77MkJtOGn11FtKLRH0Po/v/QwGOTUGi26Gx95528vN+n4qyaTM8fByScTKPF01PMtj5AAw6yqDdh+WpuinTExPI2FitT+WMaAYCZPCHDcWq1x68icnF5eXl5yczEPD0DbjT1P3Ps++vr6/V6fXl5GdFdw5pFYgjkouTZ9lwaKQTn50BcRNWggamIiFbrzCK1DtAQVWEcJY2Dig790MS42azXq269WgUfrTjJEpjLMSR2jrPZiTmnZj7/ZhPxhz7K3/jkT39gqQ4vVyQEECuOb1IlBDWULISUJaOvqFKi4REVjFBRTRdRf1jgV+S5fkRgpphyTuNw7I9j3499n9KYhmEYhpySqZQ41VrVBUDPxaNysbDihilUIw3VE4ubdUu/sYntqrtcr7v1umvibn/bj71PavrJ4cc//tF/94//u//pf/oXf/iHf7Beb4hIJPs9TwSqAgiEdDwe37x5k1Lqum6z2fR9fzgcvv7q66FPFxdXbdv4JMYZLHjaOpYdxFNM0/1PUkMIXdftdnfL+cUHWA5zhtJyU0AwQzUC3u12d9fXMYSrZ8+ISKyMPukkxywHCr7n0vKgRH3SJp7r8nu0I/jNmXt2euj6bd+dKxmPr0eB+PH1uyupC2SgelemXeDenlTYVIVFSIRMvjjzWZb05OKoSxeD+31g5p+SSTBriYGo3YaffPTkOAxfv71RzVjtNbhMY5nJtAiIbduFELKINwBV1ZvsU0ov2LLyROeruusqaz6OEvZjE7lh7trYxtBG7tq46pqnl9uWw3Z99f52f7vb3x12anrM2T2e2+1WVdoY2hifXW0tPbu9vbm93fXDMcY1NS3HZo6dRkAzBrjYbjZPn4ymu74/Isb1Gjdb7TprGojRiAzJiA1YCoWBqjCLzmXyQ0zVEiuhpySVz9gxrZAtNARDw3nwyg3fQDQl3tRp3BOXps16hRcnBBMZYhJAbA5NxeXvVe/09K+2kKf9FFbNwuUW06pSEC6oxzXVoZbUM4Aa/OSpPoltHEPTNkT45s23TlAz4N5wGJMnzjUEEbAj3jQNmg79eDjsAcUwIEQKFi+3/W61GyXsjtsruLrYiNAw9pFt3dKmszYcOxm2ii0laGR10abm0iQBECKbH3IQEHXd8MW2aZgLxaPyTxahWXMG8fIZQQNnW5nfx05PQVjG6hLWieO67xYMs4dWkYDlNOzS8X2EViXZeARJyEZIKMkANINpOaSiGlY3nhkZ9qIpBoTQgamZqCYAAWYAtdzL8aDDwFp0C/LbcvbQkSHkYUzjOA7j9dvr2/c3Yz+aioEgI8VwTPT2zbtjn4l5tWq6VYNE85hbnX4ul42LIU/Rp7QNnAsemEMo2UsnTuEZSmonvHRY5BeVP0ZEqnY89uM4fvTRx123eqy5f3AicV3Y7IGz+5nHqoTYVBVp6ufMZNkSnKNFLTNFM6QC4TcD1TxTgWpvco6kc39wVauxjr17BMcEi1802AwW9uO6Kk/twen2Lj+Hils7MQRGiAamrERuxnFR0ZdWruSL5Xl9kUCKs1I6kecXo8rT5ZpYDXDSgS1zBBhCw0FQyYm7xDSRfIFcL7YpPhZwkR80T7TQ9HCXraEMVteL6ymaCEt1uBqdwObjwqJQIQ+UQzgV52fEb2FL4jSc5EBl3+e4enRw+hwrO9nU25c1dA5RJ54hECEjYKmQK/3XPGm3BNOBlg7rfNByM5ohmY8+z9mLWkfFZ4O5GGRARTZipIBlNpVgMXg6cTLqAcNj9nSesTijPZ9ZBwCL3jmMMI4ioxZHmDEiciDyKFEAIuBAxBwiMvvglKEv6YgGwGCqALTabl6FaOInDrI8GjNNuG9G9khSwJzNAGMTCtPXOaTFOKViamUeqapUqtNNrPUMMs+UPAyCmAjVgHgaeVrdbed7zRQrt0Sd+OCPiP8xD4a633OadYdaDDtjanELyKRrF31QiiBeW81Q3f5Q4csVlP24BfxQXlrRvH4zuBR7BpuZnf4AD6Gu51Ks0lMMp3agD2J4dWbl5Fd+bS4A53+qT798O3eq6mL6zRv56gRVQgMZZQjAiKSIAlmGXMzMZgbQNE3TNC4HG0Dbtq8++sg3zjGlcvQlqtxaSzkfDoebmxunUhCR1FlCP0rq4mA4vbF7lwUrTEZnyqo3B5kAGZTaRnRlRCxp3O0OhHg89OtVd3Gx7VZtbGKMMQReDBmgc5gJKYTg8IqHdbhiofrNBNv5NigSJ50hy5er0Jk7dQrhXMRvqBISoCqJCBP5XCeRqav1gFhYPYrECKB+EFJDwsCOxHNwsY5p7Pv+cDyO4zAMY98f+34Y+17G0VIue5SIqZAT96beAmJYBLOwB67UQCMmJCiIh+Ko8aFXD27pmq7rtl1zcbm9vFi/e/f2cDy61/f5s+f/9J/803/2z/7Hn/70p69evTIDkeyWZSzjUgZgHFhyvr5+/9VXX3322WfPnj0LIaSU1uv1bre/vn5/OBxfvXq1WrX10tE8uOlMEpiA2+jP3ImmeqKXuG05rFbdzc31MPSr1QrnmahlA9smMx3MFQyoKqmRIYDevb8WST/68Y9WXScgUPvKteUPtEgp+B59h4d+n5aN+oWhAe0BkdfOUuvtgTY8/obW13fc9n7e/u7Jm8fXo0D8+PqvUE/PE20laHk68z6U1DkPrXjEFpPIUhCexzEmPdcqe86sRrkiEAiammCD9Hy7+vjpxfu3b5MBkE+tk81Ju+WkAOgeKAxNbJs2qOScJVeZ+OR4YLRo2CEgQjBUBVCxJIBoIQmTxGNuIrWBmkCrNqzbto3NsydPYtM1TaOmxzQq4Gq1HpO8e3e9u9vJODx/evXsanO5Dne36y+//Pr27tiPQwYftCRAqqR5BIAQYtetTLIMA69W8eJCYqshoof2BAZiH0v2lzd5HbhYYfo4W5pmyXaGC2L9dUSy6hTzxv28cRHVgJzCISylNRa8cWGOlW9kc2q7LbwGCDrF7szO38okKceU+Q4yM6jmFwVDm1KGFwhEF4XRa0wnW1nlLjsdEKTeB14xT+qL79k5p6ZbEVGJlhAlQzIlVCp6gqoZxQbjmG2kGNCiWI4Xl9auRFKfYXcYYtObAJqsA2yidpRCHtZka8QW1YKFdZOi5RxFzbV7AAxEgXHVxraJ0eeg7eSUX6SBU3fS1NvHZcLjzAg5HxBz1WmikwJSkU9BCBFUJB1l2EVOJglTQlXyAt0ragVQwhKypVWZAbKskA1McySQInOAIgEyWs55HCUnUOVyCjYsaoupiGgGAMly3O+H4/G4P75/+344DEyBiSgwBsImDIf+3d3NYLlpQuwaZiKEXKwxUKGdZsVv4PenqSGgshGQAWGIoWmakjY9X8aHO+J+qj6rz/1/RWQcR2ZerVbM/DiU+4Pb0k7NGN9Zfd07ViMs0kFqi2oqqLG6aWZLjIigORABJpLuVAQYGJX1ePnse52B03fyCqQoi0ulqiYOlaXelvtw0Y4QjAACIQVyuZKIOTCCP0JAVJEG5aex+ULVORGbzvRlSdYpsm6uFBBOJ4WqmlY5iwgUQmQmN90WI5A7lhBtmv61aXJZoWiC3tP0UBubdE2sx4VFT3MaekE75SgbQAF9FDYRLOTfBU92SubTclV09oQbzLtMmd5ZKK01X7wIqmaaYZE3491MBGRgBMJimQZbQH5xMgsBKKjWOPXp5lIFMC0xPeUNk+OiCHBic0DJwwNRy2BCpBwgB5g6xfWjRtMyn25sQFay6aEmoBrOtnI8w7BMwxleZOeULOdiUfYEipKO4EQgBCagiMzIEckTdEoLZNYukZCAQ6QVWTYf6bIQgBH9aqIRATMBhyyWRDlQ27Lf837mUzUgziYCoqCFnuRHhZRNy/s21CpSl0RKtPOKubiudWFBKB0enYV50/t/a6HoFxn5ZMhJNdc96HR9mbMa5iJc1Wjy1XsnvT501ZtYTmiIyKCGQLOk7IME5lSwx/3sh/IqN6ERnIePwZlyUkyj0/nx1Paup0fSRXew3nv1/FnY6wioNjXXz96SP1yTZKkLa06VdN38aVQ6GaVTo2IiCZEI2Q2YItL3PTP7IY2ZQwhIdDwe0zgCQIzx1cuXdupTVtVxHGOMIQRVPRwO4ziuVisPk3Dld0KynLdnzryRVipZm55HRCTsui6EsF6v+uPheNznlIZhkJwkp/bYrrarVbdq27ZpGiJULRKkq7chBCIoIt5iYGbWACeR+PvV50umzRnrZkLonDGy4BSotZisXSp8hfZTYv5UCchQ/MyAVDYdZCIqRZYlTSJDf9zvD4fjYb/bD0OfxpTGJCogxqZcDMKEjDAlr3jwjfkWwYye7YOMcyh3Ic2VCNvCl0AARiQiZopMTaCGqSHE2F5ebNer7tAPz549/+f//J//i//T//ynf/qnl5eXrgYsLl6tpAgQIeWUUm6a5unTp6vVysuEtm1X69X1+9v97nA4HGIMIYQFp65eQyL0pZpgsvXDzHs57wKaWQjcti0iDsOwWq0+AAtxA1VN/MWp+22EGDmMx/6427dt++qTj6ces+Hybja0D5yE7fusM4vT1dlZGKb0efstD+H4G9Rh+67f/n6q9uPrUSB+fP1XOYoUG5MHkxBO861nac4nIXUITIyny9DiAF3WHXWAXylIZveQqRSV2WAd8EkbNgwHk2wmXoKQz6qCaDVKuJhNxdKFiB7Fg4gppZxzSmkC4QNRmfc1z2Sh4icpkiMms5RkROlTZlRGaJi6plm37Wa9CSE+efoEQ7jZ7yk2n3z62X5/+Pbbb66v3/e7u931xWcfv3j+5OLJxy+fXmxev7n9xeff3PbDmIDICCNRKG3GLCkLckCkQZBX27DeZsSaSsdIXIy97rEtpoEKYZidXlh5iFZGuNComJBKzViCF0qlWj5YFzPKpKszjBERFq6bwjcAnVGTNrm6Cj2w1tZmpssu5zmhApecj6Kx2MSjmEJxwKh6lZdfASesRSmCyUCL39ZqM6MkzSvWazUbbAnAG9JKoowEIGoqooOZAfRp5CaOmRSRiTGE5vJJ2F6FcUTE43Eku46IHYcn29U26obTmvWSsUNDFUOzwAZRwVQUgVUNAUKgNoQQAqhfrkWNPbdY/DOdNHS7f76HwlbUhZp5D5Y6WchdQnerG5hpVhk0HWwU1AwpgwFSiwomAubXUXFi9Wp55E1FzUyzDISahMiIgclTOSTnNA6SE6uRD7tmMUZkEMnDOIzjICoy5vHYD8e+P/S5H5oQYmzB444JxWB32H97/X6QvNqsm7YtjBFRMMhqqh49JKOM2QQDc2wpcJl5JDUjQmhis16tclafiKy1j53dREuy3nKgcjospjSOY1qt1iEEd688bgA/HHW4DFRa6VTBSX0Fp/CEWQJbUPensHjf2sT5s/OCR7PKS8hMSU3N1zNGwrKoFn7P5AmxReoUTLbNiQlLNSdr3mfL+5mrXKxGqtnyWoymYADs97spQnDDDRgISNk6HZXs5taa7VPFUNAFXA8WHN+pvTK9LzixFZdJ1MrXLQFlPhJTAsuQCJAoEFF2wyOWhVC9K7gAFE1tIqSZzlwjcKc1sZB3raQf1F2HfORSlzz82bvtCnZhhNB0UjF1VXoKAcRiREakouury804qwvTNzBQA0UirKF4VZNFAp12Z/fo4aT0179qYOI4DJw4XZO0CeYBQf4TQfksDCtiyQwV0OdMDSETCbEgI2RHF0I5L/lwlQAiGpeL7wzJyScOdtZgW5pkuQRLABhkEVAlxqlERqqJTQ6ZYAIKyAGJS4YT6GKiaDofmMsCxkW8Qgo1Q5UIgEkRyYD7MY8pdS1v1q2/jzGlYRwBCLnw6EU1lHhVA1PJ2fFVZpZVrKbsqaO7rWQpn+2/rgCbmqiI6jQ+H2KMIXiEFcJJfn2JT4XlqEqdvlLNIuM4rladkzwBlBgBptGb0ppCJDE1MPLEISwwkGmMywf+QdVnBZioxjjU4L15QTExecQQ/5AEYt9aJpvwYkE+H4UpXtGJJ7DUiNXq0D6qlrxNb46ZqsG0qKKh+lwCGiJpIYGqUontLNulV4gn6Yi1Z+jsgDqUqghk6lwmnAM2yGZXviohEjOYiYjk7C18/10iury8NLPD8egw4idXV9vtNqXkF0RyPuz3t3d3T58+bWJEs3Ech34Yx/Hq6iqEcC6tFlzdwpUxHQ+k5sKqMnPbrQPhsO72+9j3x/54TONwczeGY1gNx/V6vV6vt9tt27bMs1GGA4cYaBkCiyd4IYPvl1V3T2hz0dP91PepaDVgsPDWzwhCkwFlviu8Xip9SPSxRSLf8TwPoeCgGFFFdrv9/rA/9v3usD/sD0Pf55RExFQRkIlD4CbG4H+LgACJjIACOfKn7jOGUCRgPxg4qHKiylt5Q94qdNQklZZCRAhoEYxM2xivtpvtaqUG/9P/+M//l3/5v7z66GNC7Pt+/kxLQlFpWpipiKaUQghPnz5dr9fLXWDVreLLNoab4/EYY7i6uqoHrsk/Wykhtdz0KBdYYKDtBDBtHlLXti0RjWOqRxV9aImm0pxeBMsTERk0sbn5+s1xd1hdbLdPnyiaQDk7zcGUhvQw5OIElv3Q7+rCGkgfEmofzrD7O2jECKigD3+vcjnoUSB+FIgfX39Paup5NTmrEk4eUTz7k4iEIjoti2X0ogx1yEI1VPC58VqN+14kNWUuMF+uuo+fXn317vogOpopkKoxBisTdahVDiTE/X4/hsBEHMJ6vY6xibEREQDLOfd93/cDEYm7U1TNhBmQcN6fXWIiNjQxEUUESGKD5MNo14djwyG0TWiaJ233/OVHrz7++Ntvvz0cD4f9bhgOb1+/zsfb3ZPLV8+fPX/5cru5jE33N7/+4vXtrUridtW1a0I2wJzlbnd8ZrTeXlwp7QmFG0BFImQGYmQuwXFQlkydrNZV5K12XheRsWbUgFj97TKLU+d5/esgLbajmbqvSDoFYCACoCgoENIcKV/8UKp2uk3o9FtlnaeF97UcBef7pQYcqZQWqRf1DsZFD/ytb7imJrujlsA5jzbDw0qj2wCRwUTUqJrNiIiJtU4sk8F6tQKL/XCnYy1qkUUlxBCbNqmKWNMyGT99/jGPfUipAW0IVsRrgo82zXpFq8ZWAVgyajHjuRpNzORWHgQEiISRKRDiAtG5nPnCRS+WviOm4Gx31hoSgify12QkNNASQWxqkk0yiqCKSQbJYAiipoaKCMCl3hQ0JGSQAoMEE1A1VE2HDAaxQ2YkJmQwyCnXoADJIpoGTdmz7o/9YRyGnDOFECDIqKlPaUwxtjHGLAZuGzTLGe6O46HvBXS1Xm23F4SchyRJJEs/jGPKKSWVlFKfLDer9fbqahW24OKInxiYI1LbtXbsi4+kTgw4Pg++c6ZpGpY0s3Ec+/54eXk1naQf94AfzFbmKZBELFk/VHV/9xG2Jq3hgriPMMd1FjoumBFSiNHHMFWNSEuSEJJWXgKcIFDLvxSJajmgg7iEFldIBZ4hI6e/qyVvZQqWNQPyBBl2vw2iqU3x7ouHZZYelg9GLaeAsJAvpouwCIun+wp7taCSgyXnOR4sayUAafnpECGAlu9AZZKFwadnakSdANapYXLYku9wNM3MWEXLGlWML5ASIBgyAKi3wqoiUPJOtTTg1As9IEPIU5ChC5YF71TykDwGCQGByKeuyaN5fWez2q9TJyXUCQuojXaf7Dbza6JgVMUJD//BAjNWnHuzilU6rI308v8VgMC1GzUExbrxe/qamAD63Acz6FLLr7ZSq052nDi5p6vfmQnAPX3nZRoBuNLpxkTHXxAjExIiUyFnzLc8nYbX1uTjMmBFPBOovGdM5YRBiMzDMKaUVqu4vVj7NUk5j8NIIbQlbWEqXx1Cah7S6O8gjWkcx67r7h93l13DnNWTi1LOwzAc+6MrUGbWtu3l1WXbtFgaFXjSrC324cIvm7o5UOdUNpu1SwnqtyuR1BuyLiZadAX1FD1QE0YEs5yTiqioqPpXa0JoY4NRQwjshReTEampqBhBzmKPAvEPVCyehqLmA/QpN/8DmeJzdwsRVaUa0ifcRH2CqPx3NbLPEyITdAKWsV33/K1UNd/KQTP07PAl8MJx5k6u8c6NxyUzwykYwalrh8MBAHJKLhC3XXfZdXe3t8dhMNUQwqtXr54/f15No5Cz3N7evHv3nplfvHixDHgsX9nKouWna5FsgN4gIkMgVLHAIUZs2q5puGloHLvDoekPh+PhmFUPh+M4pnFMbrxtmjbGxoFRCBQ4VjrtbzYJPwD0ufeXRMSzZ6cboAT3VWaa/0ql4uKDXxNPrDyFojMRQrgotRyYQiBTG4YhpTSO4zgMh8Ph9u6u7/uUUuFdIJIBIVMIgTiGEGMIyGyGBkRQRV4fDPWdsXTYJr4w1s4rWvWtEACa17GEszCJYIRGYAwWGBksBm6b5tOPP/nzTz75l//y//bJR5+knJO6hl5YYTWDdkkaMWdn+0/Xdd10v5kamF1cXLx/f93342qVYoz1maphxTYhg8qjMgms5aBxT/Ks42LgHcczK9XJZ2T1v2q/mxAhC6gd7/aocHF5CZFTGjOUgJpK/JuTLM7bSwsm0kPoElF1kjTXZvaHb0v47dlF37kR0Xczk+0/95s+vh4F4sfXf+Gzx7lejHVFvyckz/D7Gn8+jUFNiSrVl7SsdwGkImTV6zFANCMHyBHis8uLP/vjP3ry5t27w+FdPxxSOo5pGBP56J0hAhmQeiSuqYp4AePd5q5bMZfKmZmfPLlarzf7/WG326c0enhRSqOZTeEGTAwFp4VIwQCyQVIbTDgJQ8bjgDFuLq+ePH+xvbz6/IsvmqZ78fxl7nfpuM85vXt7fdzt7/aHi8snr149hzbqL3/1+vquP+xNsWm6JnTAcHPYff7NN1cffby+uspiOxUDcR3CyUswAR8AFCDDDFvAWmkD+oCpCw/TIPOsG5oPoQKe7hcoC9+Oj5IaVo7A7GeakSCFZQdWnL91iVaYu6QGS9lznqyEMxpJbVyXjIvyk7hIXXxO/r4Ii2+6kCsrjmki9/rMs79JItQibZpaSeIVUSAys4C0alefvHg65sNuz/u7m9wPo2lgWl9ujocjh9ai5ayqohCazWXbtDH1XT5uGZ608dV28+KijawBEspoaggBkBDKISywkyWB2AggEgYypns60FwELjKEH0qkmfiecDo+BtVUPLv2EcEIncMAWkUTn4cuE33kbl8D8w9tNq+VATefh5tmxolAVCUNasQUKDREwf3ROSNRjLExkb6/Gw/7oR9qTJwiYtd0xHHs0zCknA0xGOHN/pCzqYESILNSuL0dd7sMhG3XMsf3767fa5+GwziOwygp5zSmlI4pjxzDk+fPu4uLeu2WI3WTs3LKqYNFSt082r9ksS3hkgCmKuM4imjbtn7Ifnz9gLYyv2Wm+OsPenUmNt9ZIY2L16lP0NcjxFl2AyQMIVhx2DrO0ZfPxXEc8fSsjJ4SOgXcTRlE9wQ7hNN0u6UW4B7bM12vrk6h4m6xJr4A6hLpywgoxb5qOFuL6gUgxEXu0Fyu31+4oEwGublZSHIezYyQmIIST2+YEM0IDc0Yja0CmxVQJ98l2ALWTEWzLTUeKs6pnTZxESZcM5bCH0peoLNoi7vVzaOIhgX8bAVPRCWTB+a8UPLhnTKC4GchrcR2BBBDBNL6FUABlLy+NCUXGpgQrJIjnO9hqoqWa1pssYNN8TJYe51myV3D5EgoBQDzapcMwARVAxZ53ZGRYCmrZDPFcnBwAvHUDTfw4RZFH74wo3vZVveyGae1VFUFyMwrfuYJoFVrOEZmZAKmkmNl59XviQ+rQifqQQbZO9Yw47S8flSRN2/evL++WW9WF5dbVQFVz5wgAPacWHTZ3ETUVEPg1WrFVGauj8djfzxuNxsIjDifTydu6bTzZsk31zfH41HNmqbZrDfEdHd3d3t7e7e7+/TTTzfd2tsf09NCRL7FTZuPv3dmHsdxt9sdj4fnz58VcUpNy1RA7evMlbenxqqjA9yKvLu92+12wzC468LMhr4PxIxEZpvNBhRUZbVdb6+uQtu2bcwmSI8M4h/YbmYTeXYOp/SMBvcBGy6U4qL6IRKYTjQT9OCIigd0g++k8M5VRB00nDkG83qrVYss0JT6jXBhn1wyEJZLymLiZHEqW7oopi/l3InldrNU1lTVpb0sAuVv0Waz2mw2h8PxcNiPKTVN8+mnn33yyadQee0zKdjATMAAGZkDMYsoWCENIQMxKkCW0TRJAwCRA69D23Wx6+K46Y57Z+2OKafdbpfGdDhs1uv11dVl27aEQBxijEjoXUaT3/A8fp/ouaZpUkoxxsvLyydPnhDR7e3tzc2N+3FObo8PfIXFZwQ1AsGmJjEhcmBEFMnH47E/Hna7/TAMOeecJaVRRCZqc0BixMDMSNEnlTg0XPjE4G4cLOQKRKNS8YGRHzZmVC/anEXtJzYtsbBWp0z8ZjffQtEUJBMYImhKn3788T/5i//hn/zF//AHf/AHo4iIwGR7RnfP4FyRImA5pRgiqtm7d+9evXoVY7S5gEBmatvmcDjc3KBf6jN9xH4bQdQx9L7XpJTO4lIf7OOQD/tQsUwxBxC9u742ldV2k0AzmDE6o8v/IfNDANTC/HvdXctD4/Ig+h29i/+yYS33zxuPC/6jQPz4+nvYmbb7NmGnnd5nEE+izGJMbhkDe79xjVNMCJ5WgKWNVP9AJLzcdKH56HlKN8O4H8ab/eHbt+/64ziOyQyBGJHd4VNDFcrcHQCklJiJOYhIzrlpms1mA0BmNo4BEUQyM1lJr1Vws7OX2UUCwEJUMAAgNdOsRPakW20vL/uUbm7vjsOASLFdRWaSETQNIm/e3+yHvBkSxvjRy5eHPt/sDmkYwQiAgSmbvN/djm2zIkihUSIAKlxBhwoClplPq3OGNnmnvLNaEIjm77Nc2QXgD6ZUJYRFJPoSNjYn+KmblHEK+NVyesJp6rmK06XM9W8zR6Sd+lqnor0SJLQcQ91WXF1aJca1vhvH7OmE5qogTC95F13EWeUpDmsH6iKK2pAy8UiBxUoZxg1ebNfrVXf99Wsk6lbrAWgcRs3SNM04DCZGFChEHZVCCDGuGmpG2KT8rOVX2/XTplkTBAQCEBW1mpwDimZ+RmYAU/NAtUDETICzNWrqH5+CWs7ZS/UQbKeC5tkD6t0RPKug50Fv9CtLaATqI+5lirt6hGmCfk4Bb6VCRyBkU1A0txGDKFqxb6kJh9ZNgDmlNA798TCOAxMDEFMIITQhjinv9/vjcUxjGsdhdzzc3t2NWQADckQOivzlF6/7YyIkUbvb737161/ncZfGfhyTuKVc1SwB2nq71imVemFf95+fyNF16qfbieGBcEJHnXOcJoK2j9QR5pzHMRFRjPE35ss/vv6bq6gnB980WfHgyfihv1nzPh/4O2dDdhP3AIkZq6w6/a75mMSCtrNEIp5CeOy3PSLbEvfgXFIzx9URh2lct/bWCiBizgA9PaBPX6pqwjC982XIjxeZi67M4ujgICjk4pSRrG4NLXOY6p5QBZui3Cb6kQGqgVQ+hWcXaHlvPvoKhqC1lqz0i/oJ+FDqPJ4BCBNHfxG0iy75KhSwkk3wxYLTBV7mN7n+Ujbf6smqEzoUCCMyoXrIDi30GSqjsRBCIQEQovM+GNGFCC7ExWp0cnRWuR5AXsX6LDmRAUiBijjdSSQnSQlEigfZtAFoFYKRIQugArBpuSwzPaVgLQDU0EkLJyPqD6aoVTZCcQ+WEpQYeboxPA7Ow+imIw3W3u738yRMmRf1cfU5eUBIOX377Zub6+uLZy8265Wp4BSnODmdi7+99A0BYLPZcGQzE9VxHKVExpVvVeO4znoe2B/7d+/eq8pms1mv102Mbqoz1ffvr3e3d5tuXdIR6/vWijVeDAh50598jq32AObrrFoihJdrU7nXzQgA1Uzk7rC7vr7OORFR0zTITIhd25kqmJEqgh3u7t58+xrNVpvNxdXlZz/+8Wq7IQwBH4N9fmgK8WQRtUW70WAO9IBz959o4ZlNh0io0Aafy9DZtzvjKaxCYQwJQQ1MYa41lgHZZVZneuimU9dyjutD56tydi2WzunR0KVidRa/MZ2W3do/hQSYaUqp73uRXI61hG3XrbpuTKk/HhfY96nVaGwlOc2ryFpdoBQac5UMfT0DQoQGA3MXArdD1zRj3x+HfhjGUVTHYTS19WazWW/QIJb2lKvyM2vvnnUE4HvMMwGAiHRd99Of/vSP//iPX7x4oapffPnlz//TfwKAEML1zc27N2/GlD7016fLuAQmTDkKXi8fDgfNkvM4jv049n3fS/b8P5/BLaD8QNTFpmvbEAIjOdEvMAVmQipxKx4/V2+O6lrCZW7O9Ok5ixonjC+i0awXQ/m8AGZ7DUgWnx68uLr45KOPXr185SIuLVrm8FC+riioipl2XUtEx+PxcDg8e/bMZVwDIGIz6Lqu7/txHFNKbdvet98ui7X5TPUQVdfHkpwQ7dsQPsQN9K8zgZioxh66Xnw8Ho/9MbRNu1mLFe9wIYAtZnunAu+hO+ADjIiaEOgyyP0te85RhxrQMH01rAcu/B7K+fda6gDg7Cd4rMseBeLH1+9eIYbJP1pSMvCBJ37OeJmDyxCnKPHFwlcsk0QwDU2Ufy9hPMtId6rxswASEJ9edBe4fqY2ZLk79NtA765v39/cDUmSZjMlCogkMKeNqwoAuE04hKiqOee2bYdhMNOmaXxUJKUBEf08MQzDOI6qGrxKm6WBMvjgNlsRZW6ePH329PmLX/zil7c3d0N/DOhIgQaJCRoRGTQN+8Pt8dCtL9v1RRfbI45DkmQjhMChhUAJZTfshx3T+oK6DrxALDGtaIhqKFYz6Mo1mfKT5ri9GUpMJVrFcB7FKSQKW4SXwCLPvdSICuaESB9kXQSpzl6YqbQsvMjyrzXXvRQ1MIv99Y2VX1zs1TjXfXULpeIKroNOXllNc5dOzLUF0W9xGzpPwNQUSdVsTBzCaru52/fuQkLG2AREvbu75S6uYoddyONdGsfI3HZNOiYKzNaKSECIEiNAh+Gq615s4ov1qhOLIlz5Dr4dq5mBMgADIrPB5LaA4JlrBXUJk6Vo+d8LE+vDIz/1KPQgSQqnSKEKtcTScXFpxe9cRchoyi62IKihqSmrgbp9bIpHQpxPZYSIRAoud9dwCGdYxmaNltHEENOYUk4AjhkNgQIj5ZSvb67ffPv2sOv7oT8cD+9vr3eH/ZgUMBI1gEEUP//ll2lIaCQ57+52X9OgwyHLIGJAHDgE5hi5acJ6u1mtVsSsqmx14tg9BYohhBijyGiqM6V0ZqjAjNC+dwr3uXlnlXt89uPi/8N7lcEMxPtHTPwedBfEDzcM6hkcZx4D1MDteYSzTOUutGk7rSvK20C0ypRc6nT3lgV48EeolYl37Qw8D2DyCjmR8FTbPktIO69kgADqNCacS4f4gXSVOtfACOR6eVIVxzGDsSmBBQQEFDMBQCADKYsRooKJd0bR51pQoRT5hfhXM/pKExpPOwHkXUy/IIXM6i0zhrOJ2tI0U81acskJDVAFgBACWbEsERVYvI9WBCauqetMFAJH4gaZAZgwxmJjDUREGAgc9BtDIAIiZKJIFJkDIiAxOXURmJyz4expmsICGcvKXZrWhrnW9aagIjmPksUk5ZQlZ5HMKihju+euR7Yj2UhiizsUpo8eDR9sFXz4WahVIFLZQgCBPWKKJxJVSfojWmQxlXjG7/o2dvad3CE9G++BaMzju3fXd3f7jz77rGs6M6VlJCBAzhmJCgcLi/LbdR0zmzNNcz7LKb3fiXGB4Pb2bhyH1Wq12W7XJU0IL0KQnO9u7+5u754+fcoh2DyUYPef2Rr1YzmncRw86mr+ptOpx0poxILVYgFJUzoeDrv9rh+GbBLbdrXuutWamQg9AkDAjEwtZUu5jfF4t3v97vr6629wSK9evdpu1pDlcRf4QZl37h0Xl0DZOq2/fPacjGM4+wom3LwBnBD5F82hsjD4cBaV0YcCCqoBmoYEoE7iIQNTk0KagWJswUI+otNw4Gkq7r70M+PO3Qm77KksERaukms9+EHNs8l53O+T/zREaADZbR3OqS+lik7lRg3LtsA+mycAYEhggApMlWmIhMzo03pgxAjEHCg20DRN28ZjPO4P+5xynwXM0phMLGNklEhIgOomnzIXavUzwt/2HhCRjz/++C//8i//8T/+x9vtth+Gz3/1qydXVyHG9Xr95Zdf/tW//teff/45VqP0/ZGjha3bbdoMAFnUcj5myTkNfZ/GlHMSSTVU1R1YUsmQRsxtjNumW7erELkgBc2QgEuupgF7tY9UIiBogh7izBqaWLxOkyCoHfYaYlOi1Q186sK3dMfrkWTVDGAYKIJhfziutomYZ0fVLDaW0dYyNmJqKoS2XnXb9ebd+/f94ZC22xAjUxBVV8x9snBKupsM2lUWsVOz7aQfnG92Vj0EMcS2aacSEUug0LkIg1PuXHXUsZlpvtvfZtT1ZhW6RpzZaNNuUr65fugsW20SAA8Q+GpPG6tFbGpnLJqX9afGciSZIutxkvoXYOX/TJn43rWbUoofX48C8ePrd/3SiRmxMAPjPAsy16nzgXjKVSEkq5OY06zQFCPlX0jREKovBstkqypyWbQUTUEREXLPSB1gx3x5uXrSfvr++dXXb969u7799vpuGJOpMTFQHFWJ0NlMNcIFRbIZMPPhcPjyyy+JuOtWbdvGEELgnDMRrdcXu91dzjcTgGlK5vMV3XmSAKSobbt++eqTVx99/Ff/+t8c9oecxkwwmvly30QOsUNsVcbj8XBz+5bjPo8SMI6WPVQEmcK644s1dg0wiI2IDVAgQiMGZKf6aYmPg6L9eR4dEJX4agPvfVPdLq1QwkoEvBVDlrf2yzLvA7eTP7eGs0OFLtoEOyQwdYdRKbKLOwtAK6YAsKaeFy/wiQHOpiOrldHfSaauu14d8kIzNCr2bWfVTyPO1WNuzvslW1ikqx/ZvQaqACKaRVfr9eWTpzf7rz2RJmveHe+2LSHS7nZPG1413brb3I55GPpN15EAEBFzJsXjvlsF2+8J05OL7tlFGyVHQPaCGIG40ZyIrPBQPL2dSG3Wuz1DwdSFjmLbQ5202JNo+OpUm5kfNSvAzuLU5kBI00JXqN7f6pgVACmfqiIomRBoQAQiNRT18OFBIUuWAdE4UGgaAAIjt6JXuZg5NBQ6bDoM0aVn4ggEliGPedz345AKcowjEqPiOIzfvv72q2++fPP6ze3N7ng4HPtDNskIpjQmSAlFcUzwzdffpjG5vypwaDha0zbGiBzbrmu7rmtWXWy7uLnYdOtV4IhiRDO/0peOEDgExomD8jB6qygFyyprWrt81MvTRXwFuIfSeXz9N6sOQ8k9RVwE79QF7zepw8vl6lxRmni/UM1F7uea9rgKvJuYtgutudJhaiVsBV1XnblnGvGpzQfvi8vLYd4qzVUvc9ksbPrJH0AHaEmmnIqMGuoC35F6Pb235VJW93oGIyOk0IxqYmYmpJmQGqI1MyFmsFFhUEHQZOq7W0UKl+oDC3HdqGwT5e2QkzFAZz3YM2yokDNsYSiD0lWqn0jFZyIYoKoKmzFizQpTNoggkd36iSFQICDCpgkxhCaGJoSubQMTB+pi03AIQAEpBm6aEAKHEJoYmQhQEYyImMh5Dx7PwyV7rFaY1Z4sLhzMH7GW4Hg1rTMP3r/zME4DtzwjApiKZVHJoKJj0tsb3N3y64y3I+XecSiz3F8rMJyx1biszu7fVNOtBchgKGCiKmZAjGGKObBpYrjMpFSMQ+mn3KOXlacRliqrN1WW+Ull7HgY024/jENqmxACgU4Uq/Jlc85qxsxaSRFFb9dSNItICGHpZJwNg4sH6ub29ubm+vLy8umzZ+v12nSmxKzX6+fPn795++Z2t3v27BnaA+M+J35kg8mCcHV15b57OInEVDe8Ac5cADRA0du377/84ot37969+uyTj370abPuQmA/X5iBmjIEqtrD5vLqx3/0h/1u98u/+fm3X3z17//3f/fl3/7q+dXlxc/+z+3Lx63gh6IRz3Ma6FbE6i4sUXNOVKph1PVpx8n9irYAO3gIp4BAnQVZdDiqOuxCLSJyuWVRC+XMs4QdNFGixRRUijbkcFlT8AbF5E0GgDNgMc6N/Pk9TIEQS8vwtOMsRnCsjo0u+zJlHXLD0DAOKQshErnNA+uZENQM1QBEJRMZkYfQkhXykmdnMxEAByQyLJEwHpxDAQJjJFp1zWbddXfxcDiO4zgO/TgMOSWMraZDQ0BGKmiF7+ajD0wlVuYB7Pt3dAhijP/oH/2jn/3sZ598+mkaRzV78vTpH/zhH7Zt+/z589///d/POf/6iy9yzlSv2HSoCCH4EuS/gsh+OhrTOAzD2B/TOOSc1aq/1YyIichUxERFCIEQmyau2nbTrLahazgQEYIJmKmAAZVtxcPgvc0KqMbePFQ1UVqQLrDA1rWczcrsCYARqvd65yTYMndRQ3A1g2ZVgbFPu9v99fub7ZNnHItJZpLg/Wbwxba434lExhAocGiaFvHp9fX1N19/dXFxdXFxycRiir6n1M69iE4IYyIq8i7eI0WUzIWzJrqpqGAmxIvNNsSA5Yet58Wpdq76C3FpjIOWUlgk7/q71dPN5vmloXkezLJFOTVcCCaiTGEO6on3C9hoYVYvjWKbkGg1Cmi+dlhueQNA9foXKtmLpnGCUpsbAPznNyYNC3/JTxIzJuTx9SgQP77+PrSqJ0QTVmjRxD4728xKFYGASMzMhKJzJ80XlMVguHcECWuNDkBohkXzKuKMT4eYCahSXeYUcI3YXm4u193ti6eX37x5d3N3u+vHbMnEc6EJzdSIsU5h+ptHNev7HpFSSodDiDHGEMeUQoybNbsbyIt7pLoWmZbcFANDygYc4tXTpxcXl9fvru/ubrOIXxtDS2ZgkJOi5HJKEswK+7uDATl8QJli17abdbhY0aaD2EhgbJgDA7Ex+yUoMUQ+rmmziZcmqlcxZdPsCLYFNNEqqrem/CxtZ+qXGBGMvJDW2tp0Z2YpO43AREEq8qJAHmtWaznSqTcbJ4dxSZOrbm4onXgv8GtKd91KCv6pfEo+ralgUrEjfvD0cr7Az1BnX/NMDkBnMYtPnKod+j60sVt3+2MvqoOkm52smJvVuh/T8Xhko9WqkzQej0lVu6YBEpDcxtWQe1QEMhHJhmrBTIqI7kRk9VMVeqqUqiIUddumgHav/Kn2GGotjuBj2h8ASNQW96Qy3W8An5Abp6dwvgusCuZaLw+AAnAdBFTRrHbU1I93d+8NZLVuL588ie1KxaR+b4dwExNxQALQbKOBslrSMefDbvftN/3ttWaNHHw8Gg37vr9+9+5v/uY/fvvmm5xTpLjdrq4uN+uLNTVRjYdRVWJKcHPXf/7NG0RomvDxqxd//Ac/+ezF2mRkhBCa2HZt17Zt00ZumoCMo+R+GEWUAExlsqSb51ZLUlWuP+80ZbwEEKuaYyjOrmdKyRM/VqsO52TEx4PID6ecBgCf60Ok+xlc57neJ4DqgreGU/zCiYDsT5hZcdgrWa0+DCYDJS4MuGZmtGj81OXcsBRsuLCJebZV4SaVOhzpHgpgOZQK7PxEKkKzGhCo1TLRK3PfzcuvQTHkCyyi5Jes4eK0srMAoomSvHSEec2JhmpuJYriEyFogWQV6Mmq++Tp81XXjao3x+O73f7m2B9FE1A2BEMxAuTJNeJITS8JSw9tDn9Bm6JLEBBIVRnciex5qmYGBEAm6DiEQoEo9QaRIeEqNl0T2xgCcYyhDbwK3DigKnDXxhCICGLgJoQYORBHZkIkpsiBgTwLj8tCaIgYiAFBbFqyTQrLQUrfArAWUA7UKU3YKV2zyNUgAkbz6LhVNJcW2cc8q8evhSEhIGMDeHlJDefD9bB7JyKBqVAKy18kdDhXuY8Iptv2w8JE8Vn71dPZEwU4nVSqNXlxinygdjbDBdQatVC7YfG51pnaiU0NgPTl19/sDvsQeL1qA4JIFlUkYg7M1XuN5chHFaSoojEAAqhqSrJIIkXEOUh3kqJyzq9fvwbEi4uLrutKQlBVtUII2+329Zs3x8NBr67u5TTOGt4kfwzDMAyDiPjsGpwM3k2+CXWXtK864zB+9cVXb799PRz7ly9efvbpp3G9hlB4HaI2M9DAw39tBB3BeLv6yT/+0x/98R+9/+rbL//2l3/7q1/+2eHw7HEn+MFsaKePkit9lXftw3moiovVG70xhDpx8+EENYeG8242sx2W6/xy+/MbW71OEccOGHM9oH64mzgBk6fh+ingq2rPDywUk2vn/gZ09mXn5pKfvok9otxMqMKSlzzDmks+Y2n8dwMHIEZgO9GsfQOBcsS26TcJATkUO3Hg0K3W/dAf9ofjsT8ej9KP/fEIFaxsJZz9w03pWTQ/iR5Zvlar1YsXL/q+f/3tt2a2PxyOx+Pd3d3r168Ph8N2u724uGja9rDfZ1WemEiIS2ne/1skDXnIOaexl5xVxZXYMkprTj4iMzEx12oj86ptu67pYtOGGICIjD2Nt4yPGAKQGoCRGRqxr2qqDEiGYIoIgSmGMEG8XLKf7r1JLZiWxnJWcj87GqOBqOZcMDsApno8HN69e/f0xcur58+nEeU60wUl1L7eellSztkBxF4ImNkvf/mrGJuXL1999NFHw5hE9Pr6Oud8dXXVNA1RebjKOQpPktXu1Rf3x79MRESEmBx5tPxozv/w3Puc2RGqxkSvPnq1ubz6zSvF8qx7r6S0e9E4NTWozO+yZ65XoFb5d1GfMAUtUvJyvAymWS6z3xYIcQJXMSOcG/2VnPgIJn4UiB9fv2vT1UJqtBoCj1MfCeo8rK8oFZqK5P3UGCeGgANN3e9jE54Ny9yJzkggLzh8vKcGNyOgYUHD1cY5AjKgqa0Ym4vtum13/fDu+u7t29vbPh2TjElyygSIGLUQSVnBTIyYkMnAUh5THseRENiIKKV+PGoeVYWK35MKl8Fq/4rIg9QD8dXV5Waz+vzzz9+9e+cA1MIEJnQbWMkXN1IgIYCIBSeMSE1sL7Zhuw6rLrYriI2EkEPEEAwIkBCoTL5iIfMrAEgNyy6iubuvCR3YaIXG5NF2RFDRjkXRNIcqllwaQueJWV3uAcRFWN/bJ8BggQl6lE1JzSmjV1gYk0CkZELqIy5YNjIj/yPeEgatwXdeyxAYTXSpUqa7DIKoaoEYkUxBp0ggMzIgIEAFFDEwIAZPrTOBktmjyMZ+fpP90K9ltd1u+5TyKFkQxK73w6rtmqYf+74f9qsuPn16mVNv2dpVC5Q1a8A2rjemAl0nQzrk3GdZM1tODiNDUARBQiTC0kDN9V4vmn01hSFTqReppv25cAP16bFF6HDdyxEJANiZcLaAtKhqZVNPo02TCcyq9cjznYpETaaSjyau4BgYyDiqmg5iadShl5yzIW0NQkWE+DMpLhdzaFuQZDlpsjTkNOR8PKTjYdzdahrYjXCESJBz2t1d3969N8vPnj9bdd12tWliE2Ns2jZ7SQ7cNZdZ+O3N4X/967/++np/uen+6Cef/vlP/+TjpyuVFENAJANAQkZ0z11S0cEzN0ARTJWMagxVARBnEQ42x38ZLM4VYGgpp7vdHQXyz87J4wTgg2OIyExetyzsm4+v//Y3s8pJOvtMH0SsnivFp0Nti/ycOcOTppmGAt5BZg4cTDOUNWwa8zxRor1YVbXlF1+SAT0XuxbCBFCi9hBPbPI+TEDeYzVPtSJEJK8LEZjQPVJuFF6WiEtzFhH56g0PZwzAmUo+CRAPhOH4T2UAGCgETapihLoK/Gzb/vjVix+//GzVtGOW26F/s7v7+u3bEVA43g3j+/3xuh+Ro0Is3t/SNFbkmp2CtRitaA/zCkozIXkYjUfD+fAQgwbUgNpwaNtm3bZtDG0T123TNTEwdU3TNY3rwCGGGDg0wfvFhBhjYEIoBWE5HFAl8kBFIdf/Kc4nPyoxzmh+QyBm92tXR3cZvDYzVPFLVu+ourxr7agveCXmHiszMCgzR6UVoJANHdfBCMgDYFIgX1Rnax2VaSDPdoX5TDc9NqYnun/9m4YLehSCuwWhTsOWwKNCyqrPUBVi4KwZc0KFvqd8ga//tQBFJCD+21/9+vZu37Ttk6sLA/GIYyS3UtIU31rpzzAzsg29IBcRgGZhpTpf60WkH/rd3d2LFy/btqWFQDM1V2KMXdumlFyemx4B1xomqHbZWYjGfshjYqJJIJ4FL0DU2gA3AFNGkjF98etff/2rX19sNn/wD/7oxUevMFDiaQLCDwJoCOIZGejGRnMSVGxCbNqPN+vLj18+/eKT9dXl40bwQ/HtuCJ8Cl4oMR96xuqdzpY4Q8drMMncYitHQ3d5OoHXT4zzsk8UmKFSU7kOpsBp3Jn/SaqK6+kmUnpF/s3daDSFnxKdzKbe14zOcoa1qrknm/jJfM+iGWtlOOWMpDG9+WJ8RlI1/7/k/HTfNGfDqomoiDISUTAAH4xRU9+KCJEjUwihbdvctd2q2e0Oh34Ycsq5apP4d8So1hOC7na7169f73Y7/1WfUbi5uRGRu7u7r7/+Oo2jquKHkwxyzimlccwiAu6uKnYoR94DM4cYkVjFcjaXQ2OIXdt2bdOEEANHIjYgUDRkrIFw6kM/5vhINGUlAkBDb7IGDk2IXdu2TeOO5uI3MpWcHXYsqllkzGnMOYtYsYMYiDJY8O9rgKogBqpgqppTGve7u89//Xm73TRt65jckgTjM7JmquBa8DD2fT+EEMygz8N+tyfiH/3ox/v9/v37dzc3N8TsjfvLy6urq0vPr5tCFBfS6PcSPc2MmT10sXY+xN/SWZfxxN9QRVcvIUXSmMa2bZnot/neYPcRa1jnhRE8sqK4tlT9JMJMYCo5qyjUxMhARMQGJiegxzqWVc1hxfH1nysQAwBVgajSamDyQz++HgXix9fvuk9de7Q4RabUpKcT+2Kx89mMFAAEk4lMUS1UNmXSnZwa4KRS0Dpp61oaUCiDQEXyQTAwyW5Upi52kS9Xq4+fPhkUd8f07v31++vrIeWkmtWSiKggOITSrAxDuUPWx4tUTLMomhBqhSacLkOGhuRHphB5u920Tfv27dvd7sDEi3qGpnWsFIxmZomZzIDVgqE1EZtIkTk2sWkxROEAISpxcVVzYQEX+bWOx0yC/DQ9Ow1tlnMHOoQCTMmqa7VkzuHUg0QlRz9RMeNS+WKKRlAUhsqkRHX4YTl8uXzgEINSpJRPpG4OkxGhYCJpcVabPnpTbxD4wYWJsEihxiWW3UDEdyc/JRBiMK4iiQmCqIoUb7TUiCHv65ePQ/Lt3d3Tp89Wq7UqppwN8e7YN22zvby8lZzSmMa+3azX3SoNo4o1MVBAzUOzWqdxUFuD5V72+yRPYiRWgAwmAIplU4fC9aiIT/Rp3xMnnacJVqCkTV77WnPa/X3RJiLHhHPC2aQ/p2ZVh+zJdg9EaAFUCY3QzLLKoBlNzVXRPIxjGmQcGXHTdhoUkYddvwotxkiI6p8bkamYJBkPAKxZUz/2+0PqR8wZcuY8YCkjlBlzGvvjse8PAPrixQsKoevaVduBgWRJOYd143VF2wS1ZjSIbVDF7Xr90cunn3z87PllYyqBA5ipiJ/LRUXNIKUxJx9LI2RghLNaAF0ak2L2nC/pTHhLOe0P+/VmrSXKUmtIi1ZnXA3v+ruf4h9ff482srkNuQQB3zcOn51TsSY7TaV4rcaxqHZYfBLzsdsQSzJcyClXukTVB9UW4JzlLTYHxJ9mVJY0Fm89VkVp3p8XRXG5l72N597WRRiReltKp4F7X7KmXKNy6xf8/Dll4sNJ6GfMyjqw7H0cAWIgy5pMQwBcr1evnj17tt188vzJ8+2GjI6asO1i4IZQmbFd3/TDF2+vj1+/GbJmNeCykjIV4q/7Zv0hV9XJ8+bOXTJhJHZSMFETQozhYrNZd2HVhi5y63SI2LQxNBzaEBpmJnebuiDsXVpUQq2Tn4GkHlEMrZDx6y5PkweOPNNpkcdTdAwoKgUpmNe+JmaaxtGHPUzNTN3NlFLyhJ4Jz3AcjmUUV01F/ScmclGUmCkiMWJkCkRMGIk8t7cBzKBZczZpmBFADaT6a6FOpvpbXYYxelGtqMtPGRGXY+DlJ59PcQwgJyMulYoKRnbPTIS2OBk6ZsKjEyoYC+pjUE8PpeT8xS8+PxwOm83q2dOr6VupqaiA0mQKJiK3EntjRtXnghkROYQQ+HxcYLEO5Jx3d7sYm9VqxcxnTZTpanRdl3I+2+vtLCmoKnrjOALCar3uVis7Q1IYlPReMyZP4pNf/M3Pv/3mm+fPnn366SdPnj3FwFnUoI7XlfOxIREB6aTdm6E3DgAFUULgy4vn7U+azepxI/iBbGcKKqY+44ZWSep6OiUIyzy3xTkTTlEGcz9dzdmyhq7+FBm59C8RavidrwxF4jWaz7rk0xrg43Gg3tpbmBbdRFSrOCKbKHdlOPHcezk1cEpDbfEDVCvuAkuKJ0c23/68LkAiMs90cb/mMqQCfEQeiQgZUZzlqmqAy4hSAifzIboPCsjAmKas8OrpASQEDMwcA3HkGOJq5MNwly3ESDii4wpBv8NEfKZ934f8mNnhcPjrv/7rjz766OOPP2ZmA7i7u/v888/v7u6IaLfb/eIXv3BvLE6JZ4s1x5kJIpJSklwzr4syqF4rhsANcxOCW6xaQIoNEzYhNB45gshAAYDBGIERGYxUSTUgdiHGECIRB4ohNDFuN9vNetW13art2qZpYxNDiCEyk5+OfFJqHMfsrg0VETmmfOj73W537I9jykmctS/kHB5VMiMVVCVVGUeV3MYokn/9+a8++eyzbr2aWCB2uiz7N/DFeRyTqTVNu9lsmOPl5eUwDMd+AMAQwmaz6brOe3v1mEbuIz57oM6OS6q6/OhK39zUm/rDMIqIW+/vj4KdOIBtTqkbU8ollRHnhIjf3jcBxTo2p9c7OhzBgosk2W7fvb+7ven7ARGdy6QqXbd6+vTpatMRoqDZZItCOwUpmyH8VtDg5eAmmQvEsFg3AAjPelePr0eB+PH1O35NMbVL2Pu0hp2MY/uEIZOV8mqpJD/s4ZoW2drstbkh7CV6sQJhSRmvAetYEqKpXfG6iQJ8tdWrdXxxuT6M4+7Q74/9cUhD0jFLkmwZySNRsVJ7Qa0eherQpMvYZLVypmrKAABkbLt2s9mq2d1uN6bEhJOEPPuwyntDhABkotn8GMJMMQKzZ9swBwwRkYVCITEzA5FNAGc4IddbhQPPrmtcSNieNTx/QAU9acWvXZJjzUBqeUZzOG/xfPtfKGYsAwHHUBEAmVEFH5QR5CKI6MS5oHrdqKYH6cRXKs4Fo5I0byY1s9iDIAgoKgbEIIamRISm2aVjIp0Ox4CKZuqpEp4i5BK206sMqsB9PA7bbV61KxXLu51rjf0wXK5XTdeOkvuhj8yrVWdZcs5NiDFGASFRDpGsReu0H4YMGchcAFCo4BL3V+uyJwI1JPokRqMOE+Py3n7oIHjvd0ouIS4flolm6malaRprAQxFICQAD2gQVZE8ju7zNbM8jP1hfzzuN5vt5eYiDePx2O92h1dNs7oMsyOOEZHUVMYBFHLSdOyl7zFlUqfBmDolCsE0j2Ofxp4Iuq5tmoY4tF0XiPZ3u5v310POT14+22zXgZnI5+Ulpaxi23V3sV2tVpHZmRaAQEYFjc2Kjg8dxrF2PapxcJ4ItKVtpHJfbRbt6/HHj4NnXgyRKivj4hN51Id/UPtXEe1wItKc7WLn1L9z/m+xGgGaeghoAQwvPME4d3wQkdiXXzd9TJPkCGeyFJ6xF0+efwOf8jwTsx6UtmtXscqVdWOyxdrhOsBMPIcTLXhCvS93+jPE8FIavp/rNTeMTStnKCICo16sVldPLl89vVwFbiMzoolBFjJrKVyuVkqIXYch3g058LX0YyYlRySVMFNDVUMrqSyAbJ6ORjGEGLiNoWFqI6+a0DWhjbGNoYlhu161bWib0HiwOlJgDsRh8u9OF2iRoeZXytmHVGJxaoznPLahBQ+gZkkRQUVSKhOvkkVzVlVfhMdhzDnnMaWcck6SxmN/lJRMQXMWyeMw9EOfxhzC1AEzUOvHwd+ig6p9eseRn8hEhJE5MDeBm8hNjKuua9u4atun24toImMPiEasxbdXFd1JDZ8DdR44pU3tiipbT7+uRdxclq+nR8F7h8QyBPaAX6gu5T6HdDIwbou7Kus3X78ZxuHpdrtZr8icbQ1ZJKUMyA/5sNxbKRNeO4QCo3iwLQQAIjKO42azadt2giaXFASciJkYYrjb73LOy9A59zYy0LJ5O45j3/dgsFqtmtioZKj0mXKoq9BhUpOUbm5uXn/1Tds1H3368cWzp9CEQaS0/6dNbqJumE8o+I2pUHjdPkgEhhTbjqqP4fH1375AbKZlLfQbwIWviWB6DspfBEiZ4UKHwpmwXyfLzalzAD7/bmaETitzRXreEKXOElb7cAn8gjLFYpO+pTbPwJkWQXaCrVWm7GQ9grOd13/RHZezZbqMldQeV2mvzP5cresMAppXJY5OqPZnm5AciFNUVwHUAKgpiHOUCQtg2UdBcHmlAWgxUYFWDRy+W1LgjlbctNR0d4PGGK1WKVT6OxMGeWKP4wKJpmeAgiV6QlW//PLLv/qrv3r79u1qtRLVt2/f/vznP9/tdqp6PB73+z2cnWbq/eDHYClsEK3J1h7/ZiUAh7BlbpgjEhCC99UIA1FECggMwEjsQh4YGwSCLoTVKq5Cs12trrabVdutu6aJsYmhaZrtetOtVjFw4BB8yAkcXAwi2d+Oa9ZOexARNetFD/1wuV4P45BSGnNOOaecRCRLTmJChCqak4nkcez3h+Px8Or3Prve3d3cXBNz07bV0k6L6sxcjE5pJGJmDjF07SrGaIYxxhBC264MwB3hdWeZL+fZ4FSV4s+M8FZF4SVSkCo7RRbnKDUD1VMS2blZD0EhpWQGTIQw8zg+EBe8qO8RjWDCcVXUY5kZmywMAEYIoDaOw+317e56J1mIOTYxhmCqfc7Hw57MVC+bVYsxeNijWwQLnHI6Xf4dQuqmVWu6fcUMSwPj8fUoED++flfldOERFJoVPqwY27L8niYB3LvhiSwLjF5VybSeiad4kAXE8Kw+qW4rQkSrUqOfqpkZayR24eihoWVuaBW3L55shyQ3d/vr27vjkPZ92h+H/fGYVcVHS4oplkoQwZRsai78EQBXSp8p1kOGSQhhu9lutxd9P+z3e1Uh5PLz1wB6jzD3AjN0DRKMeRzGNIxJgDhGJAJiIkZmLANNbhxh9LdEDMQww/twIbQvUb9T6YS2IBWLaRmvxAr9LXRMgumTQkflltrWZp+y9wDJkARAiqusBAVZhW7Mn5ABArB66A4p+mysg4nnyBoEBGADXUh4NaTVDNRYIao1AI1lyInRKBAGJmRG51mbACqhlLhkKLE+dcdD01Lgu5EZOYvc7Q5XV09Wq9XxcBzTEIiOfb9uYtN2IDoe9/vD/unFVQg0pqzKgCGGRoaRYzCIoI2lZoQ0KghinAP3Tg5d8/h6zaKjyvyyieKNJ/Hx051/X3Y5K68nc99y11/qVqUFsAjOJZzdXSLSH3uRcRrNGdM49EM/pM0Fc9P0w7jvj3d3u82zq3a7KXBJIkAgpqxikk3UslgeGYS4hhXUmQJEzOM49r2JtE1sOBz7nojappGcDvvd27evKcaLfMmEMYbA5IlVfd+b2WbdbFZNEwhMTE1NsQYqkuvUxKrKTIuz+UIvmw2PRdn2aXqdjkKLD+ssvH76IKak7MfF/wepDlcmKd2PQX4Q8LfIcL8vg06D4RO8ojhJy2kYHXfMCcrc7uRbXrqGJ77wSRF4Gtdz/31+CH2yyPlZ3ORYZhzm9drmUNIZHVBrGiQsIyCLHu29iLxzMMUDGLvaEFRQBQlETeD2Yvvy6ZOrdZfTIGlIeYTMIqaqxsBAZoZmDiVEIDHLBmFq26gGp+4SEAIjNsgNchtD18T1qlt37WbVdZFXTdiumlUb2xgicyQIgYkAy9SwEzmKyKvuFUPCmb9QfpOtaoECYDKlurrea6ammCWLmIrknGUczTSP42F/SMMoOaVh1JRMVCRryv3hmMYxp5TSmMYxDcMw9GkYEVAlS8rjMPbDERSYA7mdy1REJIu6G67kE6CYVsM4AFiIHEOIIUTnZqxX7ardbrevnj55su5eRloTYWBw87E3CGSCYpTzw5QJeP9x8Ct2lo5Y2ww2dUbPPcJnUvEcxHpS9i5WcueE2AIqbXPmOoIBpJTfvr/LObVN6JoGXScDkCxZJAIQ8zSp42+JEAVmDcpxYTWy8pxqCjOA1TabdaxZdrYoVXGOkaTdbpdSijEysVbuPyJqucqz4jwMAyK2sWEkXdJfp96NAQDkYby9vvniiy/Q7NNPPnny7Bk2YTT1DkWJOJhgVYSVhFbnuXywyTleU2va54UfXz8MgdgW1F31QQqrK395lJYnmZNQqtPbYKJPqOrU6XFd0oESdXnHQkhfKKpzA76GPpSOmdqypbOIK0EzUPWJO3QQkK+6E4LpZK8xm8Q2XDCLpz3If8ap2YtAZroY3LQKpUczAwVz0DihqZKT0bzUIaosHfBcZkIS9QahGgAH8jELLHHci8xZoJIFXmn5U4KLmQEhh8iA3HQXx9w0rZPmpw6jzZDZ0+XyFO6/XKamSSZm3u12//bf/tsvv/xys93mnN+/f//69eu+7z1RI8YYY5zzsYl8IfLul1/PORm7gGeF0EtTDEQNc0PEhM7uiRwiYUAKZq4jR8TAxIQxUBPCqm0u1+unF5dPthdPLy+fXV6u22697toYQ2AOITITscvAWhgSCgaaJQkSgnq4fWBSyZ7/A0isgWi76vzgknIWFTEdx3Hoh7tj3+c8mrGB5qwA+93d+7fv/tGfr44p7e7uYtNehUBUZi+YCQBVNWffWkuCfdd1MTaB40T9QsSmabDWBYtMv0Wo6gPnMTzXOM+CmhYdkbNGiDqaCWA+di4tdBXvW4zhHnS4EIgf5B3713U7GLrbZnHUhKlVVAOAQQ0B+v548/763Zs3ZHx5ebW9uGjbJnAQ0WN/GIZh+P+y92dNkiRZdiZ4F2YR0dU2dw/32CsTuVShUBhggALNQ1PT0DzN752/0BiiBmga6NqXzIyMJcNX21VVFuZ77zwws4iouUclql+yEGRaSVER7ubmZmoiwsznnvOd7qDXstLNYrsegf7H3sEPPXH+uepwmTkbliGzlhKix9ejQPz4+kNtQUaGVN6CTv2hR08+hGxWnAl1KfdIxLnwbVSD06I6TtjmOtrEiRtP7IiJ7Vs+cSL+5TMJE6hGTa5OYBMhEURTSUIPO4fN+ep07RX40MV9e9gdurYbbu/2+0MXQhQ1VQFCNTJDSW27KVwKKOWkmDNUQGYYRZrl4uTkZLVavX796vb2FkpBxDg1S8NG5xjAiOD84vz0/NTX/t3l1dur6zc3d0IMRMgencu1v+SYWYmRXIIOIyEySf6PUnT+vuFtbGsbz3hTXGQKD+ek2EjFKyYYy1BoUzA1AsptJ5nkkPDGMGdDlPPMJKknYdLQCDJAGQFAIc2+0xiRTMGADDkjKLCQSAxIxYk0oH4YoOuh6/r9DmKPpL721XrVrE7U19E1EaBHigpSEJy5YcdMy8Epb3Ish7IR8Or6xtf1crFYLRZD1wKgiNzvdqeb9XK1vu+6vh9CEyrvdKAYQyRc1F4QfOUHDehrWCziAPuoKzY3kRCTbpHGrfmnkzbWuSUnkZOzKU8NBHJfzkPn3cwSMe+jmMkxKXOKWcfUB787KlkzY9bYAmiqQ9+/fvOaOZc2I2JVe1+5s6dPT8/PyTk97IHJNVWMQ+hbckzsCDnts7mcjRENGWLQ1GBddjhiJmDY920IPRMzUj/0Xd+uKl/Xvo0DEiwW9cXTZxdPntTLmhmIvQVkR/vdAUG362a7WSzqCqRVzEeKtE0BAkSm8YozzdMlU5vfFAlJMXL3wErvdhG5yh1DRCM+D0t0McaY0GDjsyh1bT++fmRTz3Kv4YNH6fu9IlCOfQ+cOz/kK8dCH0dLGH7nXT3QIfNlIeMq7L0Gn/EUkGcVR2zEI5Di7AwAP6xoj19t+pyUq74yoBfSswmItPR/pa9KZzTho965caH/ARk92yqLlWbCsAKaaTRRiY5g4eqTzfZkufaEIcr1zTVEX/FClKLqINIOAxGxs6jWB+k1DqCBVNkII6J5U1YjlMb7RV1vFs26rk+aZrVcrpfL9WrV1L723jsiArKYqliTgIgmoIldlOemqQguTYABEMlGeFMOzmgqxzVTlRC7w041SoxD1yeQTuj7oR/6rh+GIfRd7AcZehAJYWjbNvZDHIYYBkpuNIkqsdS82jQkTx01ljcPNXGTrpUhpEVO1aJJCEMXNTAjMRCqqkgcq+AQUQOJc4AkhD3inhEImfBX0n90dvLnv/z59vnT5WJpMQ5xEAuWFZEE9QcFTd4hPOId2YxqlZxQOp1CDQgonSnzW0qGR0fC2djOjrLto9r7/k2XkSw4tVMBGBTjk4Ld7dq7u4GQl01VMeGICcqwDELCggkWNc0ofkQqS6CaqRw1bs1l8fT8FxFm56sqfcJ8jKe0CluhgBsitIfD0PeV98YqhcU8+hmL5kXJ9+acI0aRUP6u8pFgqpI6FS7fvnv1/fdXl1d/9u/+7fmzJ+gpmsTUyyGa8SZpQ5ch0lkhK7uSMtNSyCNWAMXHWp8fzyt1eszkU5jwLcfW/Dn4JC0ApmMzJJZAQNZtQZVAEcwUxHJ99Hj/zrMDGZSUUzMAY/jS1Ea6OYy8e8uuiqIIGxiQERcbsRXEzVyZO9a6zGxOhoKZHQBmg1zQHK3ItpcMvwMd1/KkFIONZt+0tSRO7hkoLCOKojldmp57CfKGYAIqqa6jvC9FKZ8bpqzwXIkIkGrvt5vNerWkacB0BIajspjmTb4+7FIen73jv1RVhYi3t7c3NzeIKKrDMIzVAiMVPeuP5YEaQhiGIYQwPXMRwIwBiTClahyTA3BELpGLECoEh+ZJK+IKgQ1RzQEua79aLFbL5dnp9uzk5GS7Pdtuz7bb1WKxbOqaGXMdAmXJOyMd1TRP68rDEpmZEJMNKBgYOwS0VHInSAm/6BiJoggy1k1jYH0/3LfdYRjuD20XY28WY4xde3X59tXLV5/+0ZdvLi/fXV4GkbOz08TpQgRVadt2GHoAWDSLuq689wklJHFsFs3ekQRuyWW/amaaTgqzogicKyLvKcbFXj5t22yWGEurFc5KU4/pQwhjlri03JiqEuevR0AFETJqHIiONGKb7+OmLlmYgCxFdE7/kWj7Q9+9ff369vpm2Sw++eTT7ckpYmoaMERcrRtVvbm5eXd1NVgwh2dnZ8MQdZo5zzbO9n89iTmGpbMugYCAJObw8XT2KBA/vv7AGnFuddXZViN5blJEI1kkRpkLQHXKwpdjWH4eZh8I/oArCmZhjbFXPWUWrEyv06YjWV8S2Z3SRsQMTZKGamBAACYgkQHBsEYwMtfwqlo/OdlEhf2+PXR91/WHtru5vT90PYCk0FbWZUu/nhKAISUvhuWzRlM3y+XSTK+vr/b7/bHr0JxzTVNXlWNm57iu65PTk88+++yTzz+7vLn+9vuXf/er3767uxPy6BxQMi8TJMMZOUAyQqMU2SFiLiiMcuwvf1d6XyUdAzA5LcfmmMT+xQfunfKoNTFVMQSkXHIHpb+oLIpjAxIhaHJCQ8ZAZKpfLkqzo61OPiYC2PhlF6dv2lshJOEADNHYgExqlSUIH/a7b7/ev3qld3dhfwehBxSuXbVerT/69OTF58tnn3BVB3YAqEYMDKaa0ibjBljzFFwRjVBUUc3V9f1uz8yr9aptDxojAHbD0A2hduzqOrTS992i8lVVWYwiUSMSExqSc2YOtFawNg6BabRzI6cqRXs/7DI2vOcbI2slpsekiHTN/5718UN11bn96IcmrlOA2BRAAQQsxJBVACQibKrF9vxsfXHuyIUQq+XyxPGZQVW5MHQY2VWewY1WFAYEMCIjB4YaJGIxTxCgIRsYMlVVhQD7/WF3vwsxJD98XfmLJ2en2/Xm5KRaLkVFJLiq9sjsWE0Z4WSz2m6Xi2U1HIa0QYf0YyZEJCMkZkX0zjEzmU4zkHLMVrWYoNX5fhzP5mAjEcQsFl5k3oKrIlFy/wFA6o4Y99aPjIkfn0RcbIMTiuFBX81DdIPN+LxQgqbp+kzImCOrx5woXNgwhiXQZwUxkwg7GTqaphuj8gazRODDmM7DrjB84KiaL6apdyen4zOa3bKdmRnJUE1FypcDE3fiOOWK+UsFnWElfghzkSPJhW4sSYZ0JKpVXXnnUkNXVTd3d3ev372p/JK4HkQPYRhi2Cw3nsNd31/f3R2GXtnMqeAAAB5s4ei0rraL9fnJ9mS9Plktlp5XtXfeJ1kYEQAjpb6vdBK15BjCQrnNN7iijWAgVYsSQxf7to0hhK7vuu6wP/SHfujC0A9xCLHrD/e3MQwoMfbD0LVD12oIGkVCNFUyYxM2Y0zpFvOIFQATJJQBeabKeWbPjIR5mkXsKh9CcOwIZjRLFVXJSrVpVLm9u7vetQdEY1JVkSAxEidmCiWukwNw+RFGKccMEirUs0Xz7OzkdL32KO1uZ0OmRo06yhgCJSLUGS6sQKxnhRH5CmFmnLkEk982O/KKKJzNxQAwT3JMtXUwobsnuugYB0EsYJGxyBUQQhxevXx1v2s3m+2T8wvvWEUJcIhRRUaFbAzRq4qIEKCIIIGKAJCqxhgeTGFHDyYApIAzIiYsw1jLnm9zSn3DmmaKACBRJAhaNhUmwwQiJ/AxohGRqrFjXzkiHIYecnsCFpalIgATxD7c3Fz3w/DxJ5+cnZ0CQpQghOXdshQsg/lPRM3SHUepKgtJcWYbNSMUAHtczX5cDh5VGCeIs3n3pFhNnPmxU+tYNVYlAJ16UFVH1KeJWJEaHywu8zkkFFtlEY6zfd7GBaF4ZMdIy6haJSlTTaeZZy7msLE4brRP5gUS8rNmTlooqxKoaEI/ZdheCRCMfyM++GxJ4zMFASJKBpPct1kaCJjYkBDzc6BEMqfRzjQDS56YadaLjAm8TqZAhL6q6rrOb8L8dDx/M4s0jMd8/5m99Gi5T2Qbm2XgHtSfZCoCQOpuk4KVGN/AtOqTZYM0FlO0Y/ZMntkTecSasWZygAzqTT3ialFfbE+eXlxcnJ6fnZ5dXJyvmsZ75x17x47IEaYEkSoBkhqYZkZkOlOOlwUAIAMDGpmZiSGoIRsjqampOZICv0qWNUPMb2vl3RoXzWKxXK72Ybht27u+2/f99eXlX//1Xy5PNmYaRfb7/Xq1WiybGGPXdapiFtP7WNf1YlGP1zUzMfOUv9SpQ3i8eNI1nwRlgN8zrX+QUJmHp8uPNS++Y/rkqM5hRilMl46mzBUxFsfc3Grw4JXMRRN6D1FxZiIo98YYlyMwRXvz+tX+/n69Xn326Wd11cQwmB0ZDphos912cehCaNvDer1GBC5HXfgnnBT/3GEYoqEJFQexmWOGIT4uAY8C8ePrD7oFmR1VpyVnrKpGe1CuVQ6TYAC5O710EIwhOp2SelM8MhmlLPtXCtQcp+r5sTQqZ/kNFSgBfxGAKLMVmMA0F5irmicEU0I0EMK0SLHz9emyiiJDiH0/3N9v2n64PrS3h/bu0EWxxMUVIEYTBQW0XP2W6HO43W5PTk5CCLe3930fmI90WCNwPvWxonN+0TTLxeL87Hy9WvcxbE9OtudnLeJ9SFBdjIk0jJigw5h3RWxIKaecbZ+JRDmlyCZJ1krSxBIM2CjlirVkPktPYGZ0WLaT5L2OGRlwev9AKccVU2n6qAVorh22tHzkkP/Uf5S1kPyhMp0AYTyZJ4HRNNf4ARkwaKVxE3u9env3zddXf/s3/ds32h0sDqADkCABMd+f/Ob66ScXP/3j9edf1B99DL4Sg+QTz0lpAAPShMQ1UCCFXBdB5BBgGMJ+tz/dbC7Oz68u36lCNN23LTRNs1hZjPvDjqypySuiiYhIXXmzwM5FdeZqdC609xGDmiIoAiAwmGI5vxb9KP3zCEicuYGFVvnA6PdDHkY7pn/qBBWZ/IMPUrFTwnxcXEGBqV4unn/6iasgqgIRO1puVqvNylWNhkgAC14tYEWIEEPoW9CIAoAWRaJERqoStxOAAbx3ZiYhiqqhIZPzqTkKtKr3+93lzfXd9W1d1227Pxy8c7xc1LxaVHWdqMMKIVneRbTvo/dwerLcrhbLxqM4FeGi6KQNqwIBc0yb47x1TlDssb8IRArOOrvWEbKFBOda2gNrhuXKw7zzTurK9BN5DOX+mFazwj5CQnhIAX6wp0ezGXUUj3b5ozEna1wPiKs5Z2+auqJoPBlPfqGRMmFWrIhzQXaqC7H5AXgWL5jsxvNz+/zQO5tvlIWCyiIBY7gxz2vH7yRTkh48iMrDiMrU9j1YMzw8xFJaHpDAqZkIiNhiuWRyN7d3EkPd+PV6u7/vdt0+yP6+6673e3D+NAp03dv94eX1bdu15OtKpGJYVf6kXrw42X50tj1ZLVbLuq6qypEjYEohJC0rDiFy4YnkU31MLGARlUGjDEM/DEN/aIehj0NoD4eubYeu6w9tHIbQdUPfd2039EMYgkbRKBajSTAJDtEToSmoeCTPjgDYkWfnuXaIjpGYHBITERMTOnZcGgMdYeW96nRKJOYYJQ0ewCxolJJ9UIAoGlREBcl61fbQh6GPMQYJogLKwOyY09hYRQA5uehUBE0ah3/8R5//7MtPLtZL6bsYhjAMySeY/fSQdCZIPzHTkc1gI6S0XLz4MFGbRhwFugGlOFdH3PAx0djS43byEefO3Hkg1cBmrTZWkNljvtb6vvvqq9/e391/8fnPPv70Y3acelH7EPt+kJhR8mP2PF+RoJoR89Pcx46ciOMyqiKaKpIQ0TGNabY0RClNR/lPsnNVVY8H+6Njed7bEkCuXfLO1XXtvR+1kfJtKgIkObnvO1/XF8+ePXv6BD1LIqlmHSUjO1MFnmVwjKkZ6gSCK/iteSsxgNqjh/hH81Kbz+kejDbnRAIYmTAz5O6EWio3C4z0GDwmGL0fWn9f3hoTV0SExDgijGaxmHEvbKOJUkFA5mktTGUvZmqatMr5dzjfmI2S9PxrG9s9JvQE2DjcfVD4VhZfQkQViarMDjMyPwUFCElSJUyuSS0myxQOPC4Tm46s88hRKt3TVAlC6Lyvm4YoHV3hffNHMtemWREU1buU8tj7WmTf9yHE1BtmM2ItZix1Bkok4T5Xvo1Qu2nyNj5tNbmrCMkxeceeyBExkkOsURvAirD2frNYPD09e/H02SfPnp1tt8t62VRN5T0zJTisSw/61GGYso9lx6VmFlWtsAmpmMnIkFJaR1ANSdlhes6pCgsoiRoQIzFZXt4JEBjQG6OhGgpYUO1VdyHc7+6//uqr5598cvHRs8VyzUz7/Q5KIogI0vAvxJgmDuMej3KOEG2WqXpwRyTWtsWpBPLBdujDEPDjT/JAPJnmIg9qgSfy/WT3NhPK6ObpwHjkSZ/5k6aAQZm6FjfXOP2d5dTQurY97A/r5eri4qKuqryxpAmPlm6oqqqWy+Wwu+v6bhh6IpfakaGEV+d3x//FXTvme2UiGSMggHf+cRV4FIgfX/8ybFfpbs9K35SMOIaiFp5i8USMT4gRhTivIDhK04/11MVaBVPecCrULt3YWMxXDPnJjrlH3jIsSPP8FR2a5L14GjuDp0jsVWnhndS4aVwQPWu7u0N3e2j7PvR9aNvYBwkWB7NBQJGMOfEU2VUnJyebzWa/P9ze3qXuzmnzgaCmIpHLMFDNwhCJKQyhPXRdH4yYq4YhALFMTXaJ2JveKip4y7xhA5xAl1m/gBI0nKGs8nuRzliQNlDjsx+PuAST1wfVkghOYAySVc5xG2diRzZxUAPUZFcusRQ0pWReUU2twZKDWwzEQFzis5mEQUlIN3CmTezl3cubf/y7+69+c/jtV7DfkSmiAgiggImatfu2vb4N9/vzw/1Z5f3Z09o3nU1XXbK4jaRfRUp2ZwIGomTFattuWVfbzaauq7btDbAfoqNhsVrWTXO3u+u6vll5JieqIcamZmBGiuS8YyaLFruoUQy45F/nO63xik12oXwNj77CCcUMD5Sph7uB2WZxAjXOyE7vtdw+uFULerHAWMjxcr26eP6MKxQVIETHvvLsGQwhx7o46/smQGRmRGAWYwxhGKIZsnfeISRSm7KjVN6BgMTMziGiBMUKhjgoWB8DIu73e0RYLpu6cuidmcQoIQzkjBhNYej7OMTV0l+cb5eLihAdsyb/YzGvpQ1/yk1BZrtl9d+OO4VgTFfND0o4dfcd7YLGlgqAtG92zj1iJX7MfqvSDFPmWR+2OUxFcx/WUyidaUZpeL4RNpiKebK1M0Fvp2AsPgA12AwBPBpGcARJvocg/IGvCmYKcrl9xnRDtjpb5rnOWuARESiF9wpV8b1T6KQIWIEBH5tVxtxrKSayKcZiCEZmpIC+rtshvHr19vWr78/PT/7Vz3623m6rqLuul9De9QcZ6CASgW/a7rbtUHRVVbV3Z5vVxWb9ZLv+6GR7tl3V3rEDLD+HPCFGTHZVA0gSayIcRolhGNqub9s29P3Qtt2+7Q770PVD24Wuj30/tIfQdxqChAgiyResImZiBo7IAxCAY3SEteem9iWHy01VJ4U6lZ45wsoltBamYgFKj1jitKZSMpNGmRZUMXU5aitmGCyaCqFoMhMTqIFas2jqptX9vh+GEKLmS0XTHiCt/qIYNZIxmlmMDeGzi7OffPLi+ekJxtB1vcaIoAiJGpRLY9OZT2Ckmh5hgd+ndU/XW6FnWnI0qU0hJZzfXPhw7GllYG1HJgPT2cC3fCbDaICmqT8X+mH43fcv27Y/Odmen52aaOiHoe/7IMMQRNQm2cqm53lpDsj8J7RZPKTM161sJkuDEzGPMKLRLzGqw3kkjLRarZg570MBAd6fAVOMMcbAznnnnXMwDtjTQp+6b0X6rj+0bb1YLJaLxWYtaVNnhSFulk/3aSOVN70JHZvCX9OiNpU85IDYI4P4x6URF+c+FhQRFarYzNZjluvHdCK6YHHkgIGBmAJQJjz88P0+iVAPy1QtWe9VAQHZUXF5Th6RqYqNDFXS5hIQTXBE9eaWFEvOaE26Ya6impmFi4EYACDd3XOP7eRTnhVLjMvimCrIJypCpHnvisKUciAigmjFgDM/OMF7Ngyc9po2neJycgjGilVkprryjomj5edtOt4B5j50kwREyuowjJXbigqcF2/LWXsE0RwASi7R4mnIjB7UfHhLz2eJyTg8HkOORE3KY2pkIu9c5bhCcgYVQAVYA66INlV9ut2cbU+enJ0+e/Lk2fnF+elJ4ypHlDDPCKqmZmpImmqkEZQwg2OzkwjUZrXeaZlEMgRAUQEzRSYyRgUzo2ywZVXG5MQmgtLaA5jnkaoaNenfpmAi0vWD7A/XNzfNen2z29/c3QPA+fnZp59+ut1svHfpa4gWVUy10NqToD2L7VLeNU3z0XIdTthtoIfK74NT3vvBLJjFrcZE4/uHQdVinMX0w0sHbjU1plRon65lMrSjbpVyw84bWsqR3UYBACdZOO+fEKxrO+/9ZrNdrdbpxmAmOMZGiJqphTjEGCy36QhmtT/xNtH+x8RhPK6yfehOGO1QlvUNNNvf75qnzx9XgUeB+PH1hxKFYQ5iz/arSd/68J1fjJOIxExcBtCZQISZHTEbbZXdrFnJPRDNQhaYk0GpZjNhDjAPwQldqonOj3EDQKV0djQlFDNBRAIFBE4QVwS0CKKkhmCE5is0cKtm/eRkNYj2IXbdsLs/tF24PfT7Id70oVOLYAoUTJdNc3Z2tlgsvv/++6urqxyDKhg7ABSJXd+n9SvGOPTDfn8YutBV7e3t3e3t3aEfIiLXNTinxDHVxRY3ERIVol9eCAEw28xGrmTSc/O4Oy0DaFMZXd6yaBEYbcSC2Bj8QhsZETCWm2jaDFGmbiUaGaREafKiZJJd+tGokhoDsAprJIlOpWJ2ngVhAOuAAlWRUJAlnec1Aib7EjiDKka8evPq//jf737993r5zrd7VkumaUAG0wSGjKEP8fp+fxhuLwHh5Od/svrky6QC5wgzFqSyGhBZNl0DUNrzKCCqxP2h9ZVfbbZ9uAYRNeuHoXO0qmtX+WEYQoyNr5iroT9EBYdoTJVrPEBo976q+6GLBj697VMrCIKlMFzZf47iZm6tQ+C8ywB7v832SN+ZK5jJ4pH1o5lVRA1+qKvKjuY1oGDkXLNaNpstOjUTS0xtTG2+RN6DqamYBI2BVNJWAAEGCRL6MPRkGjCg1shZPWd2xJhaFp3zzjlVG/pgZpvt9qOPPlLR/d1d33cARmxEjXOkojFEValdVVfVoQs3t7cx6sl288mLj1bLJhU8EtHoHS6D8fI4mLZjaAYEeS8NAFF1/MgsfZQN3dF+6QFPACDJAWNuGj6kkT2+fhxjzjR2IEaM8MAnVcQqnAieR7pWaQ4Zn5qUIa42swPbSGtEQCByjpzTEKCIr5iVnCnRX0ihD8+d4+NDTY9HqpBneHZ0IJmttEh5cYCiYmOCpSMClb+O8mdJM9YxOVy6dsrnHGOPaXKbIjJoudJn3N+baUYRgSJQan1LzHsFEzAzHUy/ffXyb//mH7751W+229X19e3/+r/+P8+fXKzBeLPo0N5d313v7tqog6onen6yOjvZPjk7e3p+erpdb5aLxrNjMFQDUELg5JACiSIx9F0/dEPf9d3h0HVdd2jbw6Hd7/qu69tD13ahH0J3GA5t7AdUQzMURVMyZTPH7FMzTzp7sieqqtrXVZV+xTFWjr3jVLdDgITYVNXI4iRCYmh8hRljUgzrycydbbaSDoU5qCoaVVE1cdxFJQ7DEEOQOIRoCOwcErJZ45xnCmHo+t4AEZgwlfSSKUQAMOV0RWgk001FXzx/9qc//fzF6brS0O8OKgKATGkPQJOMRJR9pjByOWBeHD57EuIMrTuNRExEQpxdxHlJtskqny7++UG1UFRnBqskZJSSCcjCBgggSuoRBLo7dN+9fIeA68Vq6evh0HWHdhiGIUocAjETYHprYeZDTvsAKFVYqkrZYUfzdqwyg0nNDMDJml22waXQNzOFkzwnKuv12nmXDvlzn+P8qJ5yxFXtnfczR7XOB8WHw2F3f6+i682mWSw1b9+KEqyICApKRDbjCagazceh+fifCJ/Zjm2qGqM9Nr//aOadiIYgAHnLlO4gPupkwDFyOIu1Q+77zji2ZOXNfN10fR0f7R5MJbOyRwAKhjoZ6w1VFSGyUYLZTwsqISVQgKmZGJUFrZxoeHw+FnpDPmkQaDl+EiVjb/Yrp3lkutdSe8QDSybNgPiqSsRjrYCaIQIRj/T2BGJGNgCBMosywKKm2kyagvxdTO4QmnxQpZ62HEhoqu7Jq7PVFS09d4MYoaIpAiGSISqm3AiA5ThtKtXLNYTGgJz6w9J3gZlxZwZiIAKUz3ymmBEZUeOU5NCypclHvVIJZPkYTgAMyEgVuYXzDXEN4A0Wxgv2p4v62Xr14umTzz795PzsbLteNU3NzExoJlEFEdlye3e6tsiKpWxWRzoa1CmxIHMbNkKygKSBgSE7QmSVrG4LmgEbVtl5TEjMyKkqyEwhaOyjdcOw69rrtr3v+z4EYl5utuybPurf/uZXf/m3f2OqZ6enf/4f/uO/+7f/9qOnz0BkiMboGb1JLjpJmqyZII4WdTBN7quJ2Is5BzuqrqDHJ7jUBDimFdNWyjk3lt2NN1dVVYkTMjbgjfdrqvLLGRQkJeKM2zQ0YnLgHHpHCjkJWbSACXH4fjDVjjorDcuHFKi4qoUgi2bZNAtHTsuKPjdCGJqR7dv29vY6iq43G8+sADzGOqfiO/y96vBo4Jk/e2z+AaUEBxRM7P766vL1u4uf/uxxIXgUiB9ff7jz9EhEojGZNIbY7H1dapy0ZtQfJywaAZIBAShRbskuh+kPQKXoOM0ImgpwEBQ1/72J/EhYJmmFbIWAZOlwnE7iCaGVmq4yUz6djtQowbKSYUXT9sF5WFaVLaqwWoRo1/f7mz7y7f62C7sACjxI3Gy2y8XSDO7udsPQM3MC9c3H7yoiItm0hciUVlEJIQ45mI/knCIDkgIqGIFyRteNgKpUcoaTPjbugcoRzCYXW/6Z2dgbkZ1cR61KNtXZY8bVZzCFJHZ/UnHNSHO2E3OHPKKZjLYwpJzPJBWS6IbOhc5L3Hq3datVUylja3Yd5F50J9IhZbgxmYEAGBmxCYdh/9231//wt3B76ULnyQhTQpXMDIEJEFBRAUyCdv3r76/+7q/ZVRcnF/Vq00PeGGMx0UwopiLvaDoUIgFiN4T7+/352VnTNEMIZhZNu36oieqmaYfY9UNd1ZWrYuijCDsidUQUQ4whNuwCcRQUGHd/MCu8Sv4FytP7og1DsXkbHvWHfFDefeAQHKcpcyIVHNv3Zif1EeUyXQAFs4hTtjxD1izxK7PzTlIvTwQVSn2GqnHoYxhUAiEZiKpw7v8xACHHZMA0llFiVVV919dV/eTJkxjC0LXs2Hlumma1WjZNo1FV1TPXde19FWN3dX0bIixWq/Pzk7qqUoAXxv64mYybY12jTQtpdLekra+qjegIHIukbXrrEv3jwVs3/fDMJnTA4+vHuJ7lW4OQiSkFC8o1pMUQiTP4xHTgHH05ZR8NY7XPeFfPztSje5LZGZEYkBnN0MEzVgyNW/jpqh/r6fOBa84czArcAxAhlDxpGSCOVshprARoJXleUC2qaTqYx4vlYTOvaJ/KAKZ3JjlEDBQmE78poBbTiBWVkRQgaDwM6kTscPj25auXr9+2Xa8a/+ov/+aPvvjpz5fL5cX2wp0KIAIrXNsQasKmaZ6enX90cf7s4ny5aFzlmPNuIB3r1SzlD5IofLjf313d7G7vdnf3+/v7vj307aHb74fDXiWkFlq2nHt1ZozESIzIBJ7Js6sq7xwzcsVVlRrPAeqqqiqXczoIaIIATo0gB340DISETIQJmoTIwtmYnTBYSCPclnJ9gwGICqhoMi8lncZUVNTEzGIIYRhUtaoqX/uKHQE4gBijipLzCATAaSdklohRBiYxmlN1jM9PT//0p59++eLCg1iMYEp4dCgrGwK0ydE7zpBtzrmeC8Sz66AQDJIYMYR2v9fIlmLj2ZyOppMzedop5mvNTNQmmbmcZ3VWqYOmqkAkwMjOiC6vd5fXu5PtetUsyWjfdn3X98MgBqZK7IqJoZQFJBseziBlJqqRMGHQjpbRdDIXUTVDJGafmgwBJlRWbrdDBQBVMTN2SUc+WqnhuGw2qVqOPSFbStBPofiEe9XD4RBFqrquqiqVTxQERe4BhrIGjpExU8sl71Z+mKlwWHWKMyCIjeCvx9ePQiBOdDMwA2MjywRtzRsfM0AkswdO1zzjSHQ5G0XNEkAfZyRlDjmflKdZZgbZaeHemSFagT2QmalIxs/NpOl08NLcUQb5uEfIhY2Tb/ek3UIGf4/GxxzGM9WoJcJahG3EpMRlGq9R+sVRPp7ATQgzqTwZNiU5O3KJLGo5QpiaiOQGU7MJp1fyM/aQxHHUlYcIlIgJs8U4v/fOsWdCSx0eWEjDiWmleCzjwfSEBUPQUsqdjrmK5SEAY8GB5jNaqaVNDwqCKYY7ndZnD3TI749RLqZDD7ggqgDXzp8t1588vfj0ycUXn336/KOnVVUh5Ud2Rj5ny0ZqJMlW03TSL74ywtlfjEdO27KpSdYoyOcTBZU0J0C0lNsi4qm0LcOjVTXE0MWhDdIO4XZ3f7M/9Gbo3Hq7unjydLPdLpZLUdu1hxhC23V/8Vd/9eL58ycXF4wkUZnYk8++swlRbQBSCt8IRqOKzYam+NBfP7YLjjWAqdqEiLz3zjnvfeoVnN8dKblYMlhHmGwRyckABE21RDkHg4zE7IgZmWmsoZuipjinhz2ghtt8CTco4sIoH2iSibPlppDFSuVGIi0pgO0P933fNYvlZr1mIgQjIju6JfD3nqbmM4Q5E63MQIGSRx4BFWKQ7tC9efUmg8IfX48C8ePrD7cLmR6FYy7F5jaQ947gUBjESMSppLa8kqk2M/uztSEnNdIuoBSDwtTkOaVW0+dMA9uciM2TZUwHrzRcLVuiXMxDhg5MCHJRTFltNQev8iZEEZBAyjYJiaBuaLU6O1d2m72/OeCuD+bQxT/6yU9Xq03Xdvf3d6XvaHKdiWQRfAgBEb1zTV2fn50tF4sQo5gK2CAS0v7tmOSbJtcEkPV0JBtdqIiFuAp5Ns9WnvNlrjnxh2yG8iiYzLIK2/h51MzUE9YOUYNJBBNOrbHoBmJgNnQCpoBRzYgS2RnI0oyVRTH02B3s7pqHw/mi+cWzz5+dXZyfn1Jd94S/u919fbX7ZjdcS4xkmlRmVANjAhqC7e/f/cPf2+0NaUBSBMV0vgQGK7QkA0T1KoAWVO+//jUi+dMnm1/8694ziSVaM5gCQuqq1+yiA1FRSnWnCMRBwt3uvm6a1Waz3++jiKkNIbY8NL4i7yJAVK28q6pKw2Fzctru23Z/iG3nidS5ELgH9IacQ0X57Jd9vpAyp3lDi5l8YiNuwuAH1ccP6sX/xI15DF/Lx+rZFT7edCgh7nd395eXzbIysqhmYOy5qj1wIlabqugQYt9jjGSqIqrShi6EYGZUERAaAhJ554k4kSpDyIOQFKKrvZdhAJX1ovnoyZPD/T0jrtfrs/OzuvYIcBj2zmHT1E2zIPZtH969u+w7XC4WpyfbuvYm8biY+shZaSMR3RBT1jbf0yYSo0ga/qf/lbhBwmfn/01kibnYBqAiI/zrSLt/FIt/VGdqKP3qU3X78WyzVLq9N6rJUZbxVsV0GCicHZtqIWF2MAOEbDcqV2D2xs+urDH0Plv5ircjY/ZMj8qCxsfOQxbkVAH0HiNi7GucHPSqD9B4SKkNRD9gO8mq99QXNhk+SoA1+VmLRdYA2ZD7qFe74Vbi6er86t3tyzdXu33r2Jvo9eXNf/2v/3uzan62/Xnl8Nn5ZuH8yWa1G3qu/Gq1Oj892SyXFTMwpqUn23ZE9of2+vb2zes3t1fX11fX+/vd7c3t/fVN33YShEwJzTN6BEarEB2iA3RIDokdMiETe2Lv2DlXe+cdV94555jYY2LpqIgAIoiAqarGqQbNMj0E0RH6yjeLxjGhWXobQM2xw1z6YzQZuQEQTdVMTKKKqGlas0RNVNU09cJ6ZmCnKATmABrvAGFduSXSYIYSM8gIUPPpHp1jQtC+uzg7+fL5sz/76ZefPjklGExj2kSNZra0MpjZrMggSyOi9gAwnSzk4wgf5ggFG01Ldvn27V//l/8KrCGGPgx9np1DjBJF8i4uRZFKwY73ru971dwnCGZMXDc1AqmpS9AOZhHzzdIvVn6xUMS/+4evvv3m5c9//vPnHz3zlevatu26qJGqBrK5nphdsUJrEUoQAYiYCEVURMgxs8t59onfDWYgmof4YwcRZZMhjgSJJIKrGhFVVTUah/G4tmvMDscYRw5JlsJ0NCxbCMnmflgsl6vl0ldV0q0ezEpTiTDI2DKRWwBVFEGJkIwMjQhB8/eFJWrgPP+z9hiPr3/Ri9m45wNUUEitlJLKQ8qdBpy9CQ8VGwQgw5nclY0ICjoTJnGqbUQEkXSblIMgZodj8v1klguBRMkFv2VhijFmaySgqonlgi9H6e7LgJxsa0Yk4vTZkkCWlF8iNCMRMYPxk4vIWBRmZnlyU/7gdDOaoSkRq6paNmlqWf54xitPDmnJt6bNPBZTj87IVqcP4Z5wKh852q2XkRVV3jvnAfqxnSeP09LzZCwHsNxnM979ijZ4M1NAyBECLfZnVdAJOQNT7085Pto/yaRLX5wKkBBARVVNWJPVZCvnPn1y8eUnn/7ypz+92J6sFjWgRYmo4BxPe4/0tE2XEZpN+T8cf6Lj/qic+jVfpZyuFiZiyw4iEYuGDlEVUREICFUoE4g0ASMNIIqEGPth2B+6u7a/utvdHQ7KXK+WfrWuN9uzs7NF3SyaReUdIaav+Ory8vrqend/31SNqtRNIyYShYySBDGafFNrI5GpoSVXNE4D+wfvqZqFEA6Hw36/b9s2LW1jrwkzp3+pqqqu6/V6XVVV27avXr36+OOPRxRS3shRBs2nP+iZzBQyORPAwDFX3jvn0sNfJ6D+uMkbdfcP/PCPu5Rz+VsBeiarM3f3fdt1zWLhnScs1YyJd4FgYrvd/dXba3a82WwXy2VuP86znKM+j3++NXG6dRKeLHXidf1wfX3z+tUb7/yzj188rgKPAvHj61+QA+uf0ksQCh/URmpwchDjtGYipMVs3ImnM0pxfqrpSC7GTF8vLWtF/yygdhOx2QB0LG0bA7t5iE6QcHM2ukXQzIwUlcAUFTE1oiZDlcJ47lExAiJ0jFVdLcyzMDl49vT5YrG4ubnu+545nzc0NbQUCHCIMUpkx8zsvDs9OWnqum/3iYsoYIasBkAEicJRKF2gBnOfj5ka2vGOQ8Emr1c2SmIJUs4LKqaSF8yzZcyzagBQZSQ2bUS576W7j91BhoPFCMBuuaH1iW8WVC3E8QAURCd/txqighoMre53sr/zu9uTCn/65KM//fTF8ydPz87Oybue8POP9NnbW/j17/R+16XdXPpqERwgxyi3d/3r1xADkyKJWDRAI0IVsKMJNyAyqakNw6G9fH3z1T9uPvuCt9tKzRlUhI45RAmgg2HwqAaxeIbENDPzmdXs/tD6ulquVofdfeyjiPSdrU82y+Vm6Lp2GJhhs1qBeva16EHViJjJkEnY9UZNujZJR5t7iXdnJgjg3ADxgbV5njP6Ia7o+y0W70s/s13Fg81oMjsAAcUh3l/fvX35enO6cp4MCB0tVguqfOLGgYiFIEMf+t6GgUBNTVREIyEQO+JsFAYmYoYsWpkamICqDqEfui7Nl5HUMW9Wi49ffIQAdbOom8pMJQYiXNRV3dTee0Tu+vDu+hoImqaqvUs9Uyl0iMU0BSVPMPdWWEGwpQ9XleQdxlQeNZe1zGhG1ypOhZkQjGhmUY5ONekAY49e4h/X6jUhGLPvcrLRoI6snvHSOrrXiiyLsxjN+DvFjpXteqNbn4jGzsOR/ZNrvcYr7YGdJC2T+asokjAzF3cJwJGh+LipPGdOxh6VOR3YZqhEsGO68ezAU8qwCKbmboS5G9GK1JcLhxCTJ9kUkEiJNFXIomv78O52//LyJlTVyefL3T60h0GiOeK0Yn3zzbe//tU/vvj82cn5KRHwqnJ82ouiY1/XddN4x4lWZYgxyu7m7vrN25t3VzfX19fX129evdrf3g1dr2LJWosAFZIjIABn5hDYgEwYqXK+8VXtuGJ0SEzsmb1j75z3jokco0swYzVQSWDHMZsLo6MHss3HOYdECqSmopHQYSJ6BuZkpCp6PjIx8ejRSxJJFIlJxmA0AVEJMUZVQKy8d0yrpuFksmNEQlG92Cw/u9guHR6GCEjE2BsMqtEADR2zhHi+Wf7xT7/405988WTZIMTEhEwnSDy2uj8oOJ0y6HhUZvbBQsKZ+QdBc4dbmjmLSPLmA4DltreQGD6maMpBosSYZOGubWOUru+HoTdVAnK+UtW+7wCIyCFwjBYUjCpztQC9fPPu66+v/tN//H9sTjbsKGgwtGrRADE7R0w44tEUirSdeF2WmgLNYmo0LQbGBxbpYn6jRBrhaT2eKvtKdqDcfcwpSZNl4rF0a9ShRKQ4xWgSksoPQtX6vkfAyntmRkJg1MwxnRWNiTlmUyMwNCAFFQkxtodDjGJmVe0Xy2XVVIjATIbpAlYkNhN41Id/LC8FE9NSyAumqKCptsHyDnO0BU9P9xl3e1wm8sFFaUasxumZn0y9OBrYreCYcsFKDjHmSi9NWXwYyarp0hUR1dy6nVw9yZiZ7bp5+DSv20rGXjLJcQRNPkoiKHmAfOOYOWbnnGhygxARqalIwsqWRZBomlAxU/rP0leM+WxoAKYIqpwgxOlPT3l5NTEQFUm0dYT3SwwSgHXKes6WVgMgQu+9826K+Vt5mxXUMh3CslI8LfbpAauUW8YtzEe0SqkDJjuBS7Zx+sMA86Phh21giAhMUDlceFp6rBW2lX9xcfHHX3752YuPn52dVY7z15WuQMkZGhqzJqmJL1UAZ2N22gIxEyegUJaHwUTEwJiTA5ZHCqUaMiISixoagxWKdp6vZyKzqolCiKHr+33bXt3urvfdfddzXS1WK2GKqhyjWu59BzONUWI0EUZUiTc3N4uq2axWi8VCTaPmBr80xsu9fzb/AYJCurqnFsTSzgSmdmgPt7e39/f3XdepapKFy+xBY9TktjkcDt67YeiJ6O3bt2/fvv3yyy/LEqw4pqGJUi2Kc8xEBmppDqAGlr13oR+qEHOhN9LsRh97HEtI7Z80JGl5LFAaQBqst9u2Pdze34UYnj39qFks0vIuYsMQh6EfQh9jPN2euMo3TQ2Q7s3ZxVTs4WMvMv7A8mN4ZGnC+WULqSJJGWBou7dv397c3rN3Lz77dLFYPK4CjwLx4+sPeaae6rDeby+Y+4jGX7BJocqLRGY/4VzpOzpcJw8F2uyZApqeU5DT+Vawd5mVhIkcpbMHSmYZo+IYBs4dAUhU2O2YU7tp/KtGMrXgmQAiJWszGCCoCigbSUoREjGpW68Xi9XSAEKMzLzZbIgoVaKryJjHSjXuMcb73Y4I66ZuFs1duxezoBJUlSkV6E7nfKAcKRyr+cr5Pht9cOb1mQ9+LXE4zGBqqztC/8wsX6Pm5cwqMOoOw+314dX3/e3beLiL3cFEgLyvl7Q9qy+eNh+9aJ4842YFiKJg6dSLaCIMAEMPhzvc3dRD+8mTZ3/6ky9+/uWnJ+uTerEEwoiwRViv6kMX5Hd2d3vTCQOjIqFpZQq73f7l97bb8Uj3AjEARoco5U0o1rsUNkEgC7K73b38tr18W63WhHjeLC9W6/Vi0fb9u/v71+3hXkSJsnKhSpZKObIis++6pq2bxULCoCGoxBBliFo1TRQNEgcF3ywI3PX9Xdv2JuaJEUAgmKt7dANIA+pzPi8zsWnif9CDYM0sxPvhols8JsX9j1tIjj7PmFAv4GMscqmBpcKmlKx25Dx7IgY1gGgxWgwao8aoEs000RUJMaWiAJGdQ3bIlJgpiEAKSGRRJUrb7q+vLkPX13Xd1FVV1YawWi0dMzlnoCpqaFXlqrqu6tpVlSC13XB1fVs3cHF+Unmf8k2liXKSwvIOrIgtOLVxgybEKUwJwAdv89y08OBtt1ILZiIS49R8/SgL/2gl4nRNlUTpFLU8MlnM+uEelE2lK8mOPqeVePxk/7VZI2UpPE8IH5uUVpgZeyn5a3LvSU6yG5q9NyOyI5wfzp8A5UBuMHaVzH63gO0AZq7GObhmJhS+V6UyGz3hWPqYgiw53YqIrKmEiEiZ2j7e7+9vb/fvbvaXd/vm4tzIH3a3QzeAASIjgHN+d3/427/9+48+ff7Hf/KL7eYENTae2DM4Zu8cExKa4X53uL69fff27Xe/+frd9y8PN7f9/jD0/dB1GiIIMJErox9CS1lMVnMAjECmjnHh3WZRL6rKYVJcyTNVaYhLwITIyMVHToQIjETAKeJqqtqEMMQoIYhGAGDHnp1jRkpbFmVEh5zgViKRChHaZaw6FPBnrnVLDkAxiBoFBAgckWPnOdudkqRoaKoxSLxYr//sX/0kqA1qQxQl+u2rdy+vbnZd54iWvrq+2108PXt+tnm6Xbg4mMTR+jaW1TzwmL9f8fT+MHK8Qt57NuapBxGenJ588ctfVo0TiWJipkhkmv2D+c+KJdFWVCQMIhJjENEwDH0/qIgpgEGqRlXFKNB18dCG3SH86je/++q7V68v933sQx8uzk+aZUUszrvFcuHqeohaVRUBAZZJ/2yCYgYxyjAMTilKUNVsAYdpblLyJZCFJKKSaZtuxaP3oSxV2Z1NRzTw92/zBKDE2f2bt7uqMcYQQlMvUn+dmlFKto3G5Fx0ZenADKJ9191d3fzuu991fdd1XRoBsePVevX80xdnF+dVU/uqTtZnzUmax1XgR/PKdpJkesXCD00RmbFO3D7QwDoC0Ob4sjEZkrusbW5SsLHhLYltaf+lBa06GXUT72AscnzY1mXz2XwaQFrJXipRrhxN6U5KHdOO0zxSksGFMBEqEsEmHaCiyIjgs5yDIVONaqmDLjfRlQc7MRNRmh1lPK9qzvyl2c3kos4nj/x8SH+5WYoglMa16RQ8waDGM+/4HCiHT+e9Y04FKcXVgzBHwU5eBhv3GmQJQwxgxgLbyl9s1s8uLirnNerN3d3N7d3d4dCmAm1EgdwfM5Pa5rvfyVBUSMRGCJWjheeFw5Xjs2b5k+fPv3j+/IvnL043m4XnwsvLZzJVy43Q44ZKaawAQSREZvbJIJxVQJx6hog5h4apfICaSBAJGiW1yxiAAqpRNAsioiGtIWIWAaLZIOHm9u7m/u7m0HfAUNXGfHvY7/vBNc3T5XKz3azWK+cYzGQYhq47PTn5sz/9119++eV6ve7bNkpQUOccGg5h0PIaiXOFLA+aLGygltnJIzYERGLb9VdXl7e3tzFGRKwq3zRNXdfMLpUNjDxiEQkh3N3d9X3/6tWrruvMdBiGbOihfI/MERwZbUaIQKRAgEyoMe73++Vm5YlihpTAbNg502s+JM0+aOAoN3v2zdR1fXp2en11dbfbDUNcNAsqLcQxBjNdLBeLZuEcJxYTADjn0hxobAWfj1zhh3PncyMVzna56TJySIB22O2vrq72h/1quTg9v1itVkqPS8CjQPz4+sOepwvQah6Nx7kT6QO7llGtAQRiptI7Rar2fjfXaME4av8sgOK0mJSNeIYPphGplcwvluFVctymg2yJ5mSNGAtwHqwkKlLtZ+oIz9YtGz8vaPb1Fp+zqqKaNnUDgF0/dF3vXcUrRsKq8l3XSRSVlKcUREWAMAy34XoYupu727vdbt+23TAMMYqJgqOxNA9yVj51C8GofM/c0bOQEhRaYGZMTlgsKwaw98baeSSd8YJKBk6VwrD/7tvD99/dffNVuL+24aChRwVEBnSwWNVPnqw//Wz7xZfVx5/Xi00wEiAAJkJRYBUIvXUd9+3C5JOL8598/tmTJxfeV2pkAEy2ZKsX9c8/vrjp26/ub4YoiHU6Zvk4hP3+8OqVDb2zXMCdftKMACgIXDpcJgYmEZCBhGG4vt69ffPk489O6tVnJyefnp1vF3U7hFe+Cm/iIYZgkPzCKprG2oB5hm0Sdvv98uK8qus49CEGBdu3nd9uua5Db4No2w9M8XZ3ABGXIdMmhuqqSD4CCkSzjPWzuT/xg4CEyYExljUfNWn8gC5pH3YQz9AvMAXPs3/gQXmkgRFzs1isN5vFsvKVJ+fZO1d5QDQVUIEQIEZUZZtmQZQYV9575wAR2BE7YNZRiiJwzMYKNoQQ7u5u+0O7Wi4lNkECElXeETnAPLwgRkfsK3aOnHchYtcPd3e7ekEXF6fOUTKkjBwOmwHTDJUS9nRK+psZYDKJ2FgPBmNCemaQtMnTPWsiKqawbAyctdU/vn60KxrkJ20+lc6w5dNe+Yd1FMSjW7X8l46F8aVFPI/jctkZEYOqgWZJdVYBZ8XHNJ2xFZASBQNtzgo6XmULjsLMLFmiUuuOmo4Aigd/cnTNJ2PjZIRM/yRCVbSHzLjyHcHIySmpZSvfeupgT6szR8M+6uX94fXbq7u7w6ENvVjDlSh2hzZNFjP5jrxZfPny7V//1d82i8Uvf/4LZpcb3ZiRUE37Q3t/u/vd777/3cvvX33//Ztvv+tu73CIpEoIDskDAiBnb3ZSrhVBGZHBPKIjYiTHtKr9qqka7xkQzQjRM3kmZkgV7ATAaERE6IgcEzMnfRZT+DcFWuMQJCuMwMSOCdKqieiYPXF+qqsAERN4QsdEiJob6fPqXZru8/PHLMdymTl9KkfkHbPjhFLniLBsnpyf18slOtfGcNcNr69vvSNm8s45QIzxYrveLCoG0dAhgBEdWfPA3m9DhYdAkh+cRx49PLPEkD9Fs2iePn+xXNdmAqDZUmQFyA8lnZ6rsUxjEI3530VjFFU1gVTuk9LzfS+7u/by+v7Q6t0+/Orrt+8ub7jCZYPrzYIdAEjVeHaenFfrnfPp/R3vgkT5SH63GKXvezNnYEjoHKcFIDclAc5araxYCPHhrGj2jhXkUfJSqtlDUawk0iB9R1TEtZnylH83hAAGi8XCOZdu7ZxiKRYrLLDo7nC4vryK/RC6/rDb3d7cpP1runpUpG3bw25f13WI0bkemRExCTWPy9uPRx7O95Lm09BEHir4cyytatMtjUZpX4Sq6V9nQIRUDZd2RGWUNGphyfVChI5TyeMRM3TKjr637syOdTb6g0bSfWqGSPRkSHPD5OrNp0cag1xWTEPpKxk1aJg9kcZpJpbWj/cfX/muPA7tlTEtjrUhuSpTc4BkFH2hSNL9MDRRvGcE1GQAnjhVH0r4FRulc855j2PuNZ9Sy1qPuXegYKKt1DIDG5ACCZwvlv/mi89+8dmnn3/8Yl0vJOqbq6vvXr3+7evXv716d3O/bzUiYcxyrL3vR5k1mU++I0dQMTWO1k39ZLX9/Omzn3/+xUdnZ6frde09ogIwTTldQ8O0X0GmKVk1MksgxypKtS/mKpYCPuAx+UQkkAwsEoYQYowaJZe8aVAJIXR9H0MvEqJIUBUAReqjtKG/vrvf7Q+tQnAURIa+uzvs2yGcPX2y3myePXt6crIFpk9ePP+TX/wihOHF8xf/6c///LNPPwWzqxi6vr+/vzs5OWHHzlwaZ6bHdZrOElGpzTYFRc01f+P1E0M8tO39/f39/b2I1HWdpOG6bqrKO+cA8kQhacQxxq7rYwyHw/7m5paZDoeD9957z8xpVSCiGbfQSjtqNqanbY7G2O0PIMDkpDS1v7dbtR8iPBxd/+NlkfsmgQiX61WQqABdN8Qg6RHDTKm1Aol8VXnnhjCoWYyRnHuvGSeFC/CHT7hlBz3zvGHCqSskfT6GYWjbq8ur3f6+Xi7Pzi/W25NgJo8+nkeB+PH1h92CwBxqi0dIdvt9fxYn9xTMEYvvT7TfnzbPgW4jyAjUxlJsBHBIOvaJzgPA5f/KETohiosoMKluOiZ4QXRu8iyCM5pDtCJAiYAxI4ShT+3oiOQ9AQIzV1WtMcYYu74NYRDBGGNU6cPQh+E3X30lKm0Mt+2+j0PaShDTbM6WGMPIiFrqhB7M3+BYJi5njPQVHj+CjxRDKEPIvHVhUAfA3b6/unzzt3/Zf/+7ePUWpQMTNiNAU4hqdn9zuLvsb972t5dP1OrPf0J+EZBikgEAQRSHgHFwMS4r99H5xdPzi3pZq2IMYgAExgCO+OMnqxd3q8V3dNNGADYANGUZYnuIN5cgA5kxIJMjBDJjxHyINAC1qdamWA9QVfb79urKhnB+snixWX+8Xi4Y1Fdb31wfutdX7zpQIypTBNPJCIBE1PWdhOAd15WPHYJZ2/WrlVHVoOowdJe3t0wilr3DaAIKCghcKVVqqV5ZLZfBP1yIjw6WxXA331W87937QVXr2Aw4Xi42C42NREjD8TyO436d2S2Xy7OLM984cpSMwEBmoKARRCDGlOIBRHJsRgpKTC7Hv5iYjR2wAyIgSiEwyKdoBhEz6/teTVKWSyQiYIzmmBEYmMgRAjoCdkAOgDH22nX94dA2jT89O2FmOBpFqU3e4VlPWGmULr9oSDR9RM4DzA5F73koROVoQDXntz4KxD/2FS0XptDkKXrvXoNyejy6HOwDwJdpRZuAhWWnO354Em8VNXsMwWB+pU1FLdndbLMH/YgUfmBn/nDcv6QI7LgD870/iw/+M3+wTWWoxwd7mLgZD0Zg43JMZGpGpEDdIDf3h+/fXr+7vBt6QeJmuVgsl1HiEHoEdTTipYi5DkP41T/+1leLzerso2fPNOEtDDRIP3Sv37z9+tdf//3f/d2b1292u3vo+5qoQfIMqWLOFARSjVmyOCmaEQEBeMLau9qxQ/TMy7pqHNeck5Bk4BAcAiMwIqARgiNi5srXzlVMDpGYHZgJWDIuVSJapbOeQPIRZ5MaIKFDcszpyc6Inl3tfXIoAxgoyIgkyjNLBU1df9OUN4ZgiCrOOFe8MaNjAsdgVVP5Re1dXVdQX+3e3N7exijeVd75GIal46dn21Vdg2nJVpRaYJx4wQ/U4SPt4H/MZToCUvJILnEjRSAMoAqgkAYdiFNtYkpCZa+jsSPC6r0dJ0KUoiNgDHG/3hvZJvqLJ6frbVM34Cpcb1y99IiiGp1jYjaghAwGg6yIH22cUptF1p6I0YHDqbT1yKwwo1LQA5P+ESUcSqFeWsTVkug2F9znAnGWjE3Jxha9/GmSfdg5V9UVsQPKyfbJKpF9jmYxXl9e/uofftW1rWd3dnr605//bLlcusqn9L2oigqgiWnXtlHEzIBovV4tl4vHcMyP6nQGWUlUmBUyJ5dAknQN8ME808AAEzXCQLAc0so+CGDW11Cy7jlso2IIOofUZPUqzUbSIAqPRiMP+Pi5J8bANM/0ktZcrMWAlmoXjUojOs2KW8eldRpkWT4DTd9lwcAkPMTkpDATLd2NZlwmsrM57fy4lY+V+dRQSIjpqKpEEuPhcKjr2rnltJIeNYHBDDGB45nTMGVjfHq7ptr3WaxgxmScWmUQkQFIcencz188/3//p//0b3/2s6fb7apaAMC+H95cXf3qd9/857/8i7/49VffXN90icOR4etlJp1RsrNTyexH6RgrpIX3T07Ovnj2/KeffPLx06erqvKe2TEkP5VB6vIbS+cSpAM5FdHDrOSjDOLTeJMSOLk8TgmJeXSjJPJiiKEPfYgiqkOMWR2Ose279nAQGcyk60NUNWZ0bt8P94fDoRsi8EC464fb3b7t+yGGZrU6PT//5LNPP3r+0XK9JOb/25/9my+//BwAnj59+tGzZ2AwDEPT1Lvd7vL60td+uVyP5Ov0CiEkLpD3HqFwMwp6SzV5VuBwaG9vb+9396q6Wq3W6/VisUxqb2JzF5ygicQYo4hUVR3CcHt7F2NUpbv7e0RaLpd1XSeyc7K2i2iOsDzIakMBnoSQRt3lsh/vyuOjjP0eDnB2LVg+KYNkfNJys/Z1E7pBBlFRx+Qrj2gxRgMLoql+V0SiDUbkmJHczK5j8zvsh5Sj0VWBuecQIKWVAVXi3c3tzeXloT3Uy8WTJ08W600QEQB7HHc+CsSPrz/sJiSZKQqLEB9uUX74uZNXd6JUaoazNNO8pjMd1dNfM5c156PO1DwGAJaPV8WbAsYGD3B5SkiaJL0yo9aEJiDitLnXBJAav6X0xB91JB3FbSYjIkVQAY1ormE83N/95h9/NagO/QCA6atGImZ0zN57XzlVSR2mMYbQd1Hlb/7ub//ir/+Sq2pxcQ6rpTVrzPV9BEgpY8OIbAhixVacZuA0Sg42UZbzUHlcM/IZE8a0UppKj6f6cQoJDFCDuTjsv//69d/89e5Xf0cSnPac+2MR1EyldqAIMezim/3tzWV3e/dFs3AXz2GxUSBVoVQLFyPGyGaLujo5OW3WK2ZWEZWkNAOgMer5qTvb1uwgakTEgORSKa0K9AeIvfPYVIvaEVPuzuuHQUQsFZWqpkPllLg2ga7Vw166drts1pWrNFIYVvXq4uLi25u7v7u+3MVoCOBcGj+IKQAQQIIJg+r13e3ZZt00db9jEzCybgib7ZJF+qHr+s45RmAyYzQzVABRE8d1vZDeooolk9G4FZ7vhov9tdTC2oOJyxTihqOcL7ynBb93Tz78JHN+Io47zVEmRQBGrny9WVHtECRtGCVGkQAxoCqFkDViJCI2NEidCsRIBMTkvbEzIiMCIoBciE5miZZInutlo4E2Z9vFogECUUk3XSIXJ66wc+A8ExMy3e9219e3bTssFs2TJ2eOWTV7MZP2XApzsWyctfRmj/uOrBaraD/EPopjR5Q8C8WbaepS1k4tpRfTGH/cFVkpdKBjOeCfhft4fP1PsZrllnQEl4whlO32lkEsOFZvJ7zhAwk1BUyKdJMqahTHp25GD6esgKU0CxZfa7KLUnk6jysgE9l8XFRmm+OliJN4OD40fpgJm9n9+NDpeawMTp/8gZN01vD+3npuY30fMeW5HQJChvIB4iB6tz+8u75/c3V7fd8pULWsm6Zp1sv1yWqQ0B72EAdCJUAgFgFE5zzf3Oz/4r//9f6u/eUvfn7y5LzeLqPIbrd/8/rtV1/95rtvvt3f3qcaySr1zpE5JqbkYMpPOUUlykEcJnMETeUWTdU49oaN96vKV0w+TQiAGIGIHAMV4oRzXNeNc975Cim1kCYRN4vuYUitnKIioIqmBAiek9ZLmOgSkOzcnpz3zjsmIk5USJQETyckQU2Sn4qmWlUxi6kczRTNIEpVueWiXsHCp6kqETsXNR66FmPoDX/19bf33aAKdVWtlqv7qzcvLs4+e/5suaijSNrZ0OzCQMMHXPwH18n81x+Y3B8MFdKqSsxmACiIKCHxjnVc6CwFt8d0l1rGJE5qlpnqWPOYlK3E5wBFBQmhH8J9jPddT1E6QAECRNqebOoaCVUsV1FJNAP03iPkrmMroKLcDYBp0MmZK0GAvoIMAT+SvFUFLKenH3JmUur5g80BRUkaReExGaCqwzCk/0zVTASYHj5EFELo+97MlsslMWPqUk4PBDWVQERALCrd/nBzeXV9efnk6ZPNZr3ebNabTdU03vkxVCSqppqsdgbQdd1hf7jb3Q19v7tzn/fD4zrwYxGILYe5DS33ngJMLsBk7lSABxb4BFm3TPXLSC2dqEpawm6Fp49ltISApqZREBGKQz9lzsGUEqsH3IPHy7h6lv0V5tLxRDa21FRGCJRAKLkxkoAQLaISTUXQiuxoxGZkl/1sXpqRPvncl4nD6ctOkp6ZImWX9LxwIqucgmKpRJQmqxHkdj4uPAVQG/q+O+zjMEg4WywWvnJcLE3jxnQ09aPmjaZqJgiwc867IKKFM2yQGkotMdxy2ZwZzQRkUiWxX3z64n/5sz/7d1/+5ClX615q7RWsqeonn336rz775M9+/vP/7b//xf/nP/9//+Hlq5thUEKd5Xk5hZnMFMVU52NxQmS1VVV/8uSjP/vFH3/+5Nlps1jWC8cI7MyxIqIgIYDZVOajpiKIAEpGLm9yCIiS5dxiVMLUugpGoMktDkhMmjzCMYpIjFEk9GHo+i6ohiht13d934YQRIYQ+q6LQ0+EknJZ3iNyj7RDivWyD+Ht9dX13V06lVTN4ud//Mt//x/+wy/++I+rqk7B3Ivz808++ThptWFIj0Fbr5fe8+3t3cuX33/00cfL5cJ7n9todeJCJPUcgJjIjFILLwCqWtu1l+8u7+7vRWW92Zyenq5Wq6qqxjziSP8jAmb2vjKzuo4icnNzu1gsEFFFr66u2rZdr9ebzSaxmEcOWDJFjeE0K9kBMNOopgqqUyNhvulm5HFT+30M4mJnsLEiT0ABDJkXq2q93kAEU03RHNXoVLr20PZ9NCMCMzUBiZFwzO3QHC3xAULp7KWll7GUdSAaMJHEeHtz8+1336qE5y8+Pjk9cXUdQlAcqTGPr0eB+PH1B3vNp5ilcxWniZNlQ2fZKyerbnp0oSLl5oI5dfGBXyqpyJhVXJhZl2zkURACEKWDqBbOPSAQEswE4jy9NEDKJ/bJd5l4EplvhZibO7LgmHZNapwOMajTrl9EEYjBvKkHAdCo4e2bt8lWiQk9iGXDYQbpxEjovCdm0zr6agh9N7RxGIYhYIhOgYmJiTCfFceXYYHtUmrXS3LplOiFYhwGQ0V4aGnLXEicqRqJxGyAAGoI5AAp9O3lm8t/+JvD1/+IYe9NGaWUF2NJ00jKuqChDG3//bdv/s//dvHHf9Z8/LksN52aESIBEKtRMOuj9EGiQIwQBzBBA4ioIMBJIUnqHygq5m891RGSAqn3vqnrynlOJPxUF2CSy3VGDt8M7pm7fwmv9rvb1erEeweOiKsKnZ/c13bM30xTUgFg5GGIIUrNztd1d9hvVpv1agWpGFdNkczQERmZmgpI+hl0ITTMwhSNRBMsG4HQsACk81awmHoRbcY6hUKKK37D9D89ciAUBm/xQWUbvD1QbD60QB67EcqsoRQHACFoCnOpxEElQgyoYhoTWg3RkBCZMKX7HCMROA/skSklsbMQlvhuCgBGTM1qcf7kQsKwPtl459KVjGYOCdkpUoqBs0dkAERw7t31zfev3+0Ow4vzs/OTrXeEKIiTj38yceLo65ha6ceNOIBFiYe2HfqBF6mDODEnVVRVxZhyUN/QxDSO0GJMmzwRFdHSVgQPZ++Prx+N5WpW7ZwqVGZrRxnQlDXI7JiVn8YRCIilRT2Xch2dhzU5CrPaBXnLq6qqmSiUQ/42qmyTB1lnFR/HY9gHVNN8Hi7Jm+J8tIxUfe8j3wfLzlW/qTDTjka+419KhGqj1RKz+pbqXxDAQJFArD10b99evbq83bUDoPdV7Svvak+eg2rY7fquVRUETdpr7gEDZaS+7b769W/evX692qxX27WaDkMY+uHQHuTQkapDdMQOKVEjRtcMIDhHAJTok0ntZYSKaVH5pfc1c03ceL90jtMgFtJpjRKukRFr52vvfeW988gMyJqa6sz6MPTDMIhElW4IqQ0TzUCMVB2hTyYjRwjp+ZXQtukJiojAiGkMAEigYAigEqP0IfWKkQFGswgYCQUgiiZSb9/3QQUQl9hUTCaaDvmA2Ifw+vb+t9+/joDkHbELITbO/asvPj5dLhxiynAgkZUK4CQDWCGEJPVkfgUW5gVN87MPXWwPpvil+cCS5QnVmVkC5U4FifnYl0YXOhNRsnA8xUNGREvqlTVQURPlrPqiKSC7s7OzxleYS9UTTVXMJC2Wyd+NNK24D8a3Y0wFZ7a/8fsV0Rjj+PM7/mbT4qlzNhTMfHMwcw2PJmIR6bouSwaJPg3jl21938cYq6pqmiZhWHEkuxV3Rohy2O3v7+679rA5PT07PW3qxtc1VE4cGs3aJRJxGHId8HK5rOtqsVy0bTt07ePI80emEZeBXvIO5x0ZpfiVQik1nU4HqilmpjnxbynJDrP8gFHhDmf5RseRJKWlrJDu04qgcFwu934EYbYDt1KXOj8STkLt6GxQUUlNd2MZDSBSvnfSLZZuz3Fak4Gxs7US4f3QDM02xEcQcNVxzkuA6IgJKe+9c6hIVRVRReIQhqHvhmEw0+12u96s6zppgrNVOy/ySIjA2UAsANvN9j/83//9Fz//N3//1W+/+t1vb++uCBGE4EEh2rgP0WR0cQTKpp8+e/r8/CweDu8ur+7Nau+5rtxmVa9WvqqeVPV//OWfCFX8X/7rf//Nr0PskXHuLWVmRhKMqcQPABwzEzvCBcHF6cWnH3388dPn59uTBsg7x0zgUAgAkTTZvw1ggutM3J0E7kCChHdPFaGSH3RKFsGCyjAMqSC0QBdi0ufVgoCGKEOMXQiDxCEkmoQFgp5xMAMBX9fknRAbu3p7cnZyXi2W9WL5S7C73d2333373e++VxVXVQqwP+wNrV40IUboOgRwidekBkjE5H1FxHXd7Hb7m5vrvus2281yuVSV9F6ln34MQaISMbNLFXbpmmnb9vrq+n53T4TL9Wa73S4Wi/Snkst59FI/CCmm5aOqqrqu1+v1arXa7XZd16VLYLvdeu/LJU3J0WtpnUwXh4KposHQ90PbSR+EIOI8j3xUI2F4vAOcuBVH+8PxOTDrMwKxVB9DRBRjjDEAGDuqV8soUUViFNNIiCwC3k9EqaPH1FGR+vun1pHEnbYBTDR03fXl1d3d/Wa13p5ul5u18y5TcB4f/Y8C8ePrX4RAjFS2CDiJKrNbH+etuEBarH+Aaqj5RJzWRk1dapqHuokHnDlZudx2el7YmIZJcABFIKZEFygUhVL3MUYwxBSBcArmIkFu5UxHs+TRYqTMlkr+zmS5kuz2QjJK7THpw0y9Wg06ACgKIAlmR2/ajWmapkuewyOxSNTkIwLwjhlrYhPAQERVQ772hW0EjpARHAEhpU/ligxXws6Qo1fpOFFCXEfxSTQAVDQqQkbZWACCZo0YCdABVUR6vdt/983tN7/Sw2UF6gwckmIhxRpAYioqAKIDBIJ4uL/9q/+2YF9VdfX5qiOVdBL3jbqqNbpu+zc3t1fXu4sTZxGipPWLIiEa3ndwd5CoRsjOEhLDHGFkBCZEZSZkRnYEjKYq5hACqkGUHMflZLsBUMDkBjUjs8p/e3NVV5V31afLEzSOonsJQQugwHS6HGDUCVGATPV+39NycXJ67oifP32mou+uLtu+VTAlNgQyipDtgkAgAjr0K0+RWAjVUEv0KGOky7UPBcliJYWek2P5Ms9sZRgPrambbcRHT71s87KQaTnXSel6vwB2TnzLf6+ZgUSQAh2WCDGQCmhAEwMFzgUdREgZJcHgHHD+p2ERuLImDiOphZia9fKcnqCqZ8476QSMzv4Inw8CjEAGQOD868ur799cHnq72Cy2m0VqMMZiec/7Kc3ZuGnjks4kCbKXNvMAEsL+/j4GXdTLsT15lN9Tl3K2f6aRS7rBgJJXueuG3f6wXCznJJxHB/GPb9qZ7gwFMBqdTKV6imgcr5RDJqlOBvOpxgPSfJCHEBRnvouiO1k5HyZ6YXIJIWIhZudemlkDbIIqQjnj24MYzXG2Jp/10+o39qg8EIXHusX5yWQ8pT/wOWalOBsri/OsyF6JlW/lYI95tjpt+FNhkRqEIHd3h7vbQwRATyYSuxgkmHeOuBviEIJqpNyWlaagoAZJOQuHw9v7uzffIzuuvPPesWNGt3WVscPCicpTqpGogUBEpqamCRXPAB6xZl75auV947hm1zhXe4eQzMLIGXUMhOidW1RVXVVVVRGRAkYDVetC7IZw6EMXwhBDUBUDEUFET+yBPJKYSds7L1Y7b4wEUdL7Zp4cFfdUOmmmtJEARLNDNwxRDJh8ReikP1ze3t63+z4OIQwSo1fYLJqT1aKuK1d5pz5JuoYoBvdt/+tvf7cLsRVbrxvHHPb7z5+e/clPv1x6NhM1A3LJdzdKLOn6nDOJpwz42MF43Fg4HyHM/0jSiazkvNVMVC1KAXCXEyHhEY9hbICAaa5flqp8A8wCa4jAaA4E0YiQEUkNEN2zi6eLekFmIEjIqmk/ZsY47jMZZsxdfNDJQ4j6fltAIaJq3/dVVTt2KQM3f6Om/yxj27nmZR9yaYlI27bL5bLcqtOEOISw3+9VdbPd+roGYpjRGAkJCEOId7c37aFVte3J6eZk46uKmZVJwKIJ55N9Qe0nB6QBqCGTc/XSV9WiCWHp/OOJ7EcjD093cZl95uiggqKNhXVjHy8gWFI9y81MkAzthkRHjCOESSPOezmkMSk/An7TSYzZIcIHAV0PdLGyzBnMDDwJKYRIVsAMaUEp5s0s+jI7RFLLFoF0JyX5LLWIJ+M/pg6XtPc2TaVyx9ykdBdL+pViCzYzMUtG5sw/YM4lKDz+eVUjE1VVjWKq4fb2LoQYYthsNuv1yjmXtfqxA0Ml+6AADVENT063H332i+bko//tv/yX4T/3u91tGgRl+8rkEsGR4OGr6pPnH20XtdzdnG1X+9ubv/zm2/7dJfTDoqn9arF6enHx9Onzp88utudPF8t//4tfvry6fnl9tXv7SucAZcg/cETwVTUiCGtfbZfLp0397Pxiuz5x7MFwECGCCv1ysaoWtUWx3SAq2YSFpiKACEYiIjGAAbmUz0FCRuxTRIaAACCCDah9DH3f932f/EiqpqYpyxUtDjG0fd/23f7QHro+qBo5QBTVrh9C19W+atZrFyv0frXanr745PTJ07OnT5frdeVcDMN3337zf/y3/9+r16+B+Prmtl68efHxi2WIMYaha2Pfr7cbUXWOmXKeGACY+eLi4u72/uWrl69fv3rx8cdPnjwpO5wkXhuoRjGKykxJvR2G4f5+t9vtiWi1Wm9PNovlMteQznGaydqGOCfAl70c+ap68eL5yck2pUz6vh89y03TjFOQiWFtAGaiSFEIKQyDDAHAiJne66IruCR7YLfFhwCxIzEB0CiBvsuxFRGNwBDJO2ZUiQmX5rgyUwmDDCohdtoRsa95JCjN1nGY2/imN6Fk8ZKInqoXIOr97e3Lly8lxtVy9eSjZ9WyllILAAAqyo/u4UeB+PH1Bz9Rj4MmHdN6iJPgNunDsxbXcRYNuYnFplZYGGM3kx/22M007SpgtiqrAepYZwcFD1cEwBKsFQMuEumEtICkKiajSsn9jvuhxEfC7PTMjmQ0ze5nBlzXlSg5DwNwO6QjTzRI1phkp0KbxDwzRE3RY0h+ZyNkxw68c1XlvHeJfu8YHBmR0ShY5eOvTd7ttPGf2uNzm56Nv1yqS/FoIKg21XKPrjgypBjbd2/bl7/T+xsGcaaYu1GTuwfVgDBhdRWTo9iQTPTu+va73/LZ+eb5c980nRkyUVPBorGuum33v/nd95998x195jx7MVRCEQLDjuE3b65+8/JqN0RzPodcEYRQqprWG3CVAUVRBEFKhe0DKLAiKibzJ5omSokRZuoYETpPVb0T+fb+VoCGC7cFDZeHr29vWjBlNuJ5EfAIYk4apAC2Q6ic227WZ1U1iBx2u0PXiSoQGRojiCAhKKISiiICyhAGdjWAIMoIkKBZ4+yUHx8r1spVcrR0j8TQnOFLl9FsBHy0w4bccTdxpT+A884VjiXnA1YUVARTlYBZII4qMdEt84GAcGRFpVotQ0ySPTABMzCNXbq5Knp8QJARkKsc0yrxSVQEJQvE+WONAQiKQJw8HDc3d9c396b0yYuni7oy09Rf9B5jozwbpqhctnMmkAcSmWkIQeJklMvJ4uzzymP8pMul5ikiHn9cwzB0bZ8fBITwA7Hrx9f/7AfqkemXZw4EeX40FYbBXOhJ9aSj9TiH9VLKTuIQgmRekU7tikUrAjNUQNWoqXWulMTPdueW+zmw4H8Jpsf2dLAfIziz/I2V+/U9w+8xsuZBB+b7zNkkbxXx10b5bH6wtznJG6dFO71TCqigqX7HJy8tooKaDIlq1FTu7OzscteajnOrZLEGM0kmnSRQKICamiCwoYBpNLZV0zgq3qX30kiZBoIqCojIhA7Aky28X/pq4X3jqHauYq68w0LEIcoGUWbyzte1d8RJoFe1PsR2CPs+dCKHQdoYDn3X9n0foqoyUk1uWdeni8XCeyIGNBHFEoZGBGIsGeccVkZGU0yPLFENquS8kVdwt23//eX1q6t3++4waEgZXq/adoeom9VquTAQM86AEggSbw+HV++uQhRXeSBUCZ7kJ589P9uuyMRUwFL2HCHX18BUIXWs3czTnzirXoP3eF/vX0gj8KTMRtRMUh4s32p6nGRNY/rxdpwk4gkFXLzEaGmOqgTGJqhi2UzH1DSNJ4cWURGBil9vmh1O2NKji/XYTmjTFDXrvfkOyiSacaAyX4yTfXju1kpHetV0aqZxNjP/DKnaviQPLF8SgMMwDMOQbhwwMFVKTOuSJVONh939frdzzm02m+Vq5ZoKKGdt0kMGplsVx31HgkMjGAMBgvOeGBL38/H1Y3ilHgwCPLIPpHVBMY2jbKToFtNBcpsXO3BhmoHqKGCVe6bcRYxpd0iUBuqa18TijiyWnBFT9DC5PhKcYG5fgNECg7N2bbLS1QGjOlaWJMywc9BZmD5lHcqEJj3fyRDnxRVYnE1EaHmqVSAUqjQBLygddzLWGSg/U0pgDS15qA3V0AAVMIjtD70CiRCRXyyZHeWCWqCZtTqdJhHAIShYWDZ8ul1vlisGUgMFyXRDldyhbkwIqIZmm6b5kz/68tnJ6t03v6ZwuH4X5O3NcH2HUX3lwTNdX528efP26esvnn9cn56tT84+Pl8/O1n99l3G1pEhAplCNAUzZnKOPLt05KuIGnYn681mual9EwF60LpxA3NkWm9OVucXoWtbu0W1/WE3xEFN4zCQYc2u4sZX7JiBUGJUtZBI6EDk2LFDJFBRCX2U2/3+5u52EFHLerGCAWEXwqFt9/tD1/ddP/RhACRXVWmjLlEQYblYLFR81TTr9dlqefLkYvvkfHl2Ui0XtXNNiGftxWdffLFYrRaLxWazca5CJDNoqnro2uFwiFXVLBZmqjFCgZUk7/j29KTr+9dv3vz2t18j8dn5uYpIjEhZoM1MMdMQg0S5u7u7vr4BgM3mdLNdr1ZL7/1RlUMyx6R9ySzPAgBEHCVGEef86dnFar0eQuS27bou+Yi991SWkqxhJAO8GSkkAx3VHpmQMNGTFIqnfyqMhPSDf/+0+EPNNzhTdcjGLWaqcTViJGKljGlGM2bniZU4QN/1fd+2COjrKp28NHsr8qcyJMVSb1nMbgjoDFz6YUTpdrtX3786HFqs3PbkdHt64heLCKmtLx+RiRnmhsLH16NA/Pj6Qx6ty0aiHEoh3632T9q1oARqpybW0ck0RRzGA+p0HM3sNoLjQpW5QFw+eUkm5HMQlK6DKbGINJfmZvoAY2YamxKl9TuRfA0S7CE7enHT1M5VC8E+4qG3/RCjSVQNohEADaKxQhbDRKywKwxNwQRUVTR1hTlmz+zYOWbnHDhSZCUyovTt5WdylgrH7f6U/J1aF8DMuOywMp9YpyM8cTohlG42NCMwa9vdq1ftm9ccBk9GavksMrKust2NcttF6pozUdHD5Wv/8tv1/k/q5aoXA0aqHC0b6Zdd1/7m5euLf/w1Yr1Zrb1v1HEgEs/Dnf2fv/n+H169vReTyqVjDYENSLZYNs+eH75aqpmIokZiRBBLXnBzbAIqYJKlA2AzVFAl4rrm5RrYCdK7rm/j1d7culu00n5zf9MRCLMxQTIBjvP8EidPGrNobIfQ9mGxqN++edMfDlEUOXnLxqqddNam1LkTonYhLhAEKWb0MxYLXy4NISAbt8flUEpgNKL4oYgJZcescCSLflCbRPwQ4B8AJjWzqDlW7CVY2q0N1JQkqqppTAFeQlCgbLHHXDaFRMCMgJikYSJIbYoGD2r4IJ01VIGAkAHRVDUaAWB2QtmoyBUDXVJ32URvb3b7Xescf/75J03tJzXsw08Ve//xAkdBSIV5x9bsXoECq0jQc+d8YoSNElqMUWIc7zKdP44eVeIf00J2LKbCRGxUzbfg5GW00TBYnCBiCkBmJqJ9CEMMEuOkP8GsIBSKOwmIHec5Semy/BAsgvEHup5Tq/yxOly4x8fGrRnoCebq8AcFvgdmlnTZaz4Lv6cpz6zM+deKxyxNXMXQgJ3j9ao5G5bBMJqlSMJitfjoydnZ2dn1rregqeBmVNTVNNenpekQExEyOyIHgCpCiLV3DhGLnVtEp/aDoww1EqJD9AQV86Lyi8o33tVMtXee2TFhngExMzERE3nnvHPOOUQUVVEcouy7ft8N+yH0Cvd9f9O1u67dd13b9WjgiVdVHcwqXxHTyntCNdCoafW2KMpRRcWMzRKPyRDJKDdvipoZuKpS9n20VzfX37x9sx+6XoZo4ohWddMwH25u+PZut94sm7r2jonT0r7vurdXN/e7Q4zWbFamEUE+Ol9//uIJk0EMZIaApU1hjiO0D/zTpr3G8XwE4IiOPf3Ej66lMv7P94ColTUTCNDmJaEje7j82czqt1IDBQYjukHNUFUlKhiBgUQREUDwnlKaeyowLd+IaS6TmhXyFS2IbCrhGlU1s9nDIH/nKlLupmNexMw+bCOIE2Csp6cHXJrZu6SqY1tR4pMDZqsyTGF5meCNpVCvaw+H3T0RrJbLzWbN3iuiFXh69pNjHpnne0LHQK+BmaQe3dn0+fH14ziVYemhzNu+JCBNywZOSDoARC7jH0xVI5RElmISSOmW0UAB4ziFMkQ/7RMzPMkMEIiQ5ub19PigD84gx1/BcvfJmKBPfl8m1ARpLyWxszMj5ZsRNa9yCKopVW8ZgoFo6Q1IgzgbMwk4rruGaW4CI981JydhNugCTAtT6fODNMJFQyo5WgPU3KyDJqbtILYn5wVxvapzf1upDBy9Q2pOAUSitrt2f6ehB1WQLHvZ+DNNGTjImMaa+dlm9YvPXpwtff/qq/b2qqoWHkERmTmkqdwQ4s111+1vry9PL548+fwLp/26ZgaLyRZhhICqkKDtBkYSmahCdowewQFU5BfNol4swJEw0qoB4ggYqsYWK3I1B6gd76+g3d0OgygSmxlwXS2Xq/Vy2RjpMHQhqogYIrEj4jAMwxB2u+72/vbq+urd1dXN7c0hDINJ23f7roumCtAOoe367tCFENJjNrXDOeeYGBGryhliBKtUqanZETIFjV0cJFLUAfvQdQdfVWfn5+v1erPdrFaryldE2DQNox12oTvsm7omxihRAYg5uUliCFW9fPLsmQF8++23r16/9lW9XDTEDOXJz0Rp2xJCOBwOV1dX+32mBq+Wy8r7iV9xdPGbYeKklBsIkcj6fghDYHbL1bpuFqvV4JgRse/7ruv2+71zrqoq7/1YK0jFRYQAyOQaX60WRARlwlFG6LOagVmGez5c/yccMEcunLFEh/JtnxFamOaSBgaM7FzNNUiMMYSBOgAl7xDJaHwsEBolF0DWbxRQgREIkUVhCDHE3fXt919/++rV69OLJ5/87I9WZ6fcVAFRIB8wyxtB9sGF9vH1KBA/vv6wr+Q2xQ/8+gfYMOkXE1qRRv8xTYGH3xvingnKRyPlMvVFmp2BShtJ2j7MynwM0qoLRlYCv6QgKJDrOsESMhny1oMQFYhAQa1iZHYNcDAalrTvh3bo+xj6AINqLxqiBGUlktQ2ENVAM9A0R/0MEuyJmZk8k2N2zMasRJJMusSlLQUKLAIeiMIFyTzffWToRGolTlIvp1yLZjiuEgIoERFYbHeHy7f93V1l4BURCCmXMSEapjY/RSI2whw2VgWAyKDtTm+vcb93T5ETvMIxLxYYNkPXv963f/nr3wpVT8+fbE/O0PkBqSN6u9v97fevvm/b3lWGPtEJlDCY4/X25OPPbhYr7TsEAIupBxwIFQnMk0pqY089HACY31nvabOtTs8DcnROYxxE72+vaXelJL2YsFeixNZ4oGyWHbU5YiIMqm9vrqp91e73YIAJPZbKlwS0XDJmBMgJJTJEFU9KLiKpkYFldX/ckhPhGMdOE2MDmkjSRz4mK5tvna15eDzNwCkUbD80AR4T6zY1PWcRBtHGCGFWvDOYhRFH7Gr5i5iQfb7SEiSiFB7nOcLDrUQKJJUdCFEeLxhkpWAycFJ6/8lx3w5394e+75uGP/3k47qqoLCZf+g5ALNksqWU2zSkykpcjtEBiGqIMh71Ibs8AQCc84vlkpnTNjSEEEJIU3hAVLWxvuPRRPyjE4insGnunFRJWZCiBCUCIhgWY9LoTsq+QoL08VmTSeyACaeYTBbpb2EkB9gRdve73KZFOK9cJ6JM42XGcrs+uOpw9DNOfuEp+D+tfR9YeW0E3sF7pYvzvyXl6HHszHzItn/wR+bk2VGMgFSttl2vHLuQWu2ZDGyz3T79+Hmoq65tYxRSAzQtjYEp+wMImqXjmV6YQPelOBzVKE2cMqJCTTUdp1PfPCVoBQAhNo4XdVXXrmKuHNdVDn4SpErY3FWW6YvMaZAlZjGEdoiHIXQxdiEeor67vXt1c91KFDBRI0Sn2iyWVFVB9f5wcOvVqq4SmzIt3Qk7K1GF1UiRU09vhtqkiTgRIzMwi+rl/d1+6OvNGiX0ofdE2+3pZ08uXn711XB/f3dzs26qVVNBxQmJc7s7/O7V6z4KkXNoQcN6Wf/8jz472y41DmZCqVtPDemHsqT/1I7rfXU4y7r24aqb4saFGWSlRGuPjD6z5eCouaa4CCCbyKc/oGqqSd4UDWpCjOyImJJP2WBWjKFlTJAv+GP3skLuopqNT4ptYfaIUAshWAat5qdCvoOKOjwf1aQUb4wRAAiPak5HB3H6iY+1RVn8Bo1DCCEkqGXGqjpSRS5/XQjh7vZOJa632+V6Scy5h6OQxwiQpm/jvfRN5j3btAt+fP1YXppBa2VMjkW5LBAuHE0CY+Lb8lBFNGF5NIe2UyqvANHSiWJMeOq4vigWSlvWUlMHHqXo1fgAUJ0/dMYJFMwMxXNa91GeBszEcperQXLrp4+k1FaXF+UPzDgxA5IUTKnk8dAQOalb6Y+nhXsMPeTuOpGYVWdHOH7NqON4x/JYE4BzSBBmClya9Nze3Sko87ZZNEzpAaXzJTtNoNNi3g/D/X5/aHsdMU1l154ISKZGpqtFc7Zqvnzx5OMnW5Shb9vuen/2fH1+vr0eghx6YlpuN5uLM2Ds2v2333//zctXz27vbxEtRi4Fz2kmpSLJUR0iqKpFQVd5Xzl2jggQqrpeLBpyzhh8XSGRArZDf3t/v6gbXlSr1UpQI8hht69XDqNhVOfYOVc1Ndfkgo9R2LnFcoXkuq7/5ptv3r1798033758+f3by3d3+12UuB/6wSSoRNNkQAkKUTTEkMbhjpPjxFSNUss1gEoIgdh5kdgd2tub68EEKydkvSq03f6w2+/v1Mxg6Rw1TVUlNjTjYrEAlfv7u3t3d3p2RkCioqgOXdrx9UNXVfXzFx9Vtf/666+//uarL7/8crlYMoKqQswiLAAMQ7/f7fb7PRFXVZ3cvoU2TDpbv3JyRdI6lc4WRo6Q6HA49EPvvPOVJ8fLxcIxA0BXXoi4Wq0WiwUUh1dObBY3kvN+vV4jURQxI8Nx62bHQIkjlNL/MDfvmFo822JiIptlfoWKCIE5dk3TdH0fY4wi5NlXVdMsEDPE3BIcNIPCM0yNAMiw7Q+H65t2t//ut9/8+u//8cnTj1589smTp0/FYQ9miExHSAmzH9ihPr4eBeLH1x9oXG04khMnNuJUg2DH/TaWifhERJo5uA8yjlNEdJ6HnXdnj/8+cw3PXMZFUJvXFCBlEFfxadns+cYAeWI82q8su3aVCNXy8TQZZylbPYQsEQGEgCpPC2ZZNMGqQWKI0g/SdnE/WCfaaeo6l5TXQiAFU5OEXHTsHDETJeKuc2xECeariApIAAVwPE0KM1eMcHzDrSgNNsl2aVVIGFtDMzIlQZfq3c2MkAHAJA6dDi3G3pk5ACAnAMCUbJOI4BCdcwSgKFEk2Xg4JaTjYN0B9nsaBDOLGdHXtDlhdPvr67+/vbn+1a/OTt+dnV2wbwR9K/b20F6JHNhr1SC6lB8jQGXn1yfrT75wzz7W19+RCcVgEhVIjRScopSiQ9DchqZoBMhUL+unz5cffxqcj2rqGQAPxkECIzJXJqSJomSWWhBzcRTmODQACmoKN2vUbmiJXI7rISYyCBI6AzWLYIzkiJG9qxeiQYmUUKJXUBNTS9aNcvYEsUlJGR3ChSfxwAyLH77dih47Izllzdnmwxgc6xk/1ERvYGJiYEkNmcqex68D3TgjAQIjBGZgl+klmRhTQoQ4GlNyhdykEVFSchxAUI1iqbTPwcSzS1p7qq7zN3e3V9eXQ98tl/7jj19UlTcTUDPTY1zWnMNayKfJ1aGMlN+fMi4iQFQENR3iECWmO4+YDUxEANBUEaGuayztTDHGEEIa3SBQ/jyjNvC4DfkROa5AQXNhSKpQSZIfIXIiB2WyzyxcZ8UQhaMAjIwIjYioZpouABSTfYK8EhIZoJpH2hPtrm9i3+XY6QzwqmLjgprrqo9VubwOJi4TFHN7MuaPkfIfnirNHwsfNBQfzZnSF6JWTgPT+jsjv+DkkM5fN4CkVTiqhKZi75Zq4BwjoZisNs22qa7VwhATqzidkQ0wNdVDCmtkeKqaCKCS84SOGBkphuDZJR2fGJJ5Bc3yv6R6g4xjBkLwjMtFs6irmqn2VDnkQi9mQMfM5IgIicgxEQPlb42Z+xiCaB/lrm3fXF4fou5ElBgRHXNT12AQ247r5vT84mK52l29a7tutWjYOTXVGDK0QXJVmghJJHZmaprbkFTUkB0g+araLvxitfKHHbMjUwaqXbVZrp5sz/DZ/lBVTmPfHsKwXC5rY27F7g799e7Qh7jarnbXV2eb5RfPzn/22YuaDEQgYTqyapMDVke233xknP/o5wdH+/D2b45nKXOFub3dzEwFKen3mtEsebgLI/ioOFmzmxfHmscyTR8D6clli6RqIQohI3sCsiHGYWhNgnG6zcxSohkzWkw1bQ5tol9YwlPhLAt/9BrvOFEJISAiOzfG8GdAlZn5GrNpS0SSQDy1wM+q7dLvMnNyqc8O7RBCiDE2TTNKDKCp5EkRYAjh+uqyPbQn2+1quWJmNZEYyXlGshxXsnEUDIYwcihzBQfB+IMbcw6Prx/LeqZToVxxtiRROAcRc1YtM0DVAIGAaHLypjlKqXXJyqdRah9PxysiMDVEMkydawql9tIMQFSAgLjgkUy1VLmWROIM74Il9HIMacnFkgYjPA9y05foHINOifKEMkfqi0RE4tIIZgbpdkuZEwRwefHMondacrRsNbHwVtMbCqXEMzunx5AMAAJqErcsb5TTiSnxAVWsbbsYg2o4OTlZLhfeu3HzW5oNiMjd7A6/+qt//P7N/Xdvrl5fXhuRiMrYAJsSnwom+uRs+//6X/788xdPLzbL83UtPf7slz+7/O7N6fb0yXJTG969vdxuN88//vjZZ59wXbXt4dtvv/3629/99ptvW+/7viOC1Msjkjt2KQE0VEU0GgxiFAWrSus61a4b2nK1+Pj5s/Pz09ev34QhdIe9GcSmif2h6+4xKEWtDJfgfOWMYujbN/v71+/ILypXOTAkYsCb3WH/6vWbv//7f7y5vn7z9u39fjfEyM65xgfTIELereqanAsiHGMQYSKVxC5gJkYDInSEDildX7Vzq0WzahoZ+lfffUvv6n132J6fe+9j2756/frd1eV2u2VHnDiOziGhaHTOr9brEMPV1RU7Xm23Nbi+76MGcsnAA13XsuOLi4uqrv/xV7/69a9//eknn1xcXKgqEaooM4cQdrvdze2tiGw2m81mVVWeCM00RhuvbTMLIYYw9H0/DIPEmE30RFVdrdar3f5+GHrv2TlSEXauIULEGKNzru/729tbEcmtd2SjDyDdWKndb7FeUdp4jAaHDw2EcyFq8eb/3onxex/wQeQfMjMS6TAkCLivKmCKIkFiDFGiAGBdVwhExIZgIirRoTMzMnTE0oeX37/8q7/5y81ms6hrt1r8/N/861/+8b8+efJkMImgCbmJj1adR4H48fUvWR0uO3obx8m/ZxCVywdoVIhSwzjYBGh74GD6J55W84Hz++XRcHxChkIYTsXuZpolsTx4x+kQndHFY5pq5MZmEGn6PcpOMgAkA2JgI6wAKjQlMMeh4l3ATqkzugumshuCZs0gSeuqiJCwEp7ZMzKDA1CiolNnEAZlwhbOPDalVWLqk8nQ23nMIkc0k4qmkRUXWG1Xa0Q+hP4wdCJCnkMMFnuQmA5sqgbsUr8xFOyAdwygMZqApiMIAjKjqmrfSdfVikBspjEdq11tK8fotGsvDe72+9dq7BuAalAMrm5dHdgZeSZOn5LTHoxrXp2ef/GTt5dvlhAcOQqqkhp2UhXdrDSXTAhEzZx3J+f1Z1/g9qRDipx+PCToNJ1IjTLrcVJGEq5sohwigCY1EICSPKSSJMYUBkMEIBLJxjoFjICOHNeNDRYBomkkFqNUdg9mBRGpYuXMPbZVjO7EfE194KRGuZ/2BxbmGdH46P+PKEmzByqRTcZGICYkQlSkiTNlk5MLbKRgMyf62ZRPHHNJc9fg/K8aNQgzcITqUsqvbDQ0bXxNCQwICNjf3N5fXd8PMZyeLNerFSFmXvcPPk5MsxdL1BIlWmGK+YKagoqaEjkAEFExAQMil00oicepKqlbYwTRqSVFoBxmdMaweXz9iF4pKVe4hOx81SxYlJAhFdZZvkgmcHlhjNiIsi6WSHYu2RFxpLdCLtBJw0fKSVQjJmYCBJGEwk8rYbrg1ZCIUTWVcBypw/YhFHeehdB7gNTZzn5CBpffHXu03k8ezJvlAWYUug8trOP7ONV+ohmIiElUNKOkZTOyw0zm1dD37V6sH4bEtE8AnswyyvRYBQAGMhNvuq3r9XJROd+FEAGYebFcSt/3bctAAjmQxMgIJloqC0BTdR8jeuKKXeVcxeiRUjoRASvHnhwhAxEzEWVXZ8r6qAEiqdr9/e7m9l6BLp4+WQG8vLoKh31QSwV3yOScXzTL05MTJ/H23Wsz9c5pTMVnlLc8mV2iqqKRjEwUoloUMQBRQzNCcr4+Ozt7+eb17vY2SEDEZrFcVzXG2JBvttuGcdH4yruqduqq715dvry82bUDcYWGHuDTp0/+6PnzpWeLg0lEYoSU7jRTYZqUS/gQb8SOHrt2PJu03+85KjsrS9kLVRxx3AigYKg4Tu3HjQpMi8sPYbILmTSNdkg19+YQG6KJRk49VCBqKiJWFnSARAqegS/MkrxFOFGJ072iZiYy+RLUhmF4EJObUyzm88v0Lc9fgJOhwTIRRdKZf170B8VmzswpRk1lYCkxElHXtbc3N5eXlxcXF4vVMn/CrH+n+ucZARpG2JoSEBR8FRHpaOCco6YfX//zv9LmWAzmT/wRJZ8FYoRE75xoWVntBSAYs3U4o1QQZgRF+oyiCQmUnTSEqLNuPFUDUErTtTSXUk2DRUQd7wJVO44OoB3VaRAiiljelzEyJua8pc82Lm3MlL0xZbecYXHZBY2mYKillS43lxZChakKkSRoN+Icgp591woGIulRpUl1M80HRlMwQaKEO8CSFRgp54BgUVT17m5viqq23a69dzD6+BO8GHG/b3/z1dd/99s3+y5EQzWUNGjOAVhCAJGIhk/O1z/7o49fPDl1EFEG5+DzP/rJulkvjE6q5cbX3vT05OTp0/Pzky15v1quXFWvtme//f7lt3d3cNjnVCFiai1knGAk6fgnBkGBzdq23e/3t7fXy5q361qfnjum2juJMcah22vf7pm071Hbobs79Pf7W4WF8967DPVwrIzRVKO2fX91ffPu6urNu3fvLq/2+/0hDFRV6/Wqamog9KuVQKJ0YDDFGEi8E41DSAJxwjBi6SJiBGKsHC+b6nSzPj3ZVs5FEen67377tXv5ytfV0LZvX79GwvVqVYa/SAxM4Nklh8BitRxiuLm9RaJmsWBmNVXRsR1CowWARdP89Msvvn/5cre7XzT1crkMQwA0Ven7vusOiHZyerLZbJxzRx4WRFENYUiYiL7rQgghRhNNgTNict6HGF69etV13UfPPyIiEUknXSJaLBpVUZW+7w6Hw2G/r+vK19XxiTF9MqcAgibHlOH31NTS2F0cSmY/OAk+3ub9oEY8fREA5hjFUmA5veq6zgtcjG2MzvuqJnY+GcIBTGNUsbbtr968+c2vf90sF5/99I8Wdc1GjLxardIzhZCVJlccHp+WH/F/jwLx4+tf0IYE/pnUlzK2LRJVFqgU5yTgCddI8734+6OwUQU7cmHg0QdjqaQdm3QS2B2z0UINHj5mAQgpz5KzsTgDd9AMmDCB8FTTIyvh8LKSSJC8mWie6qrCZq31+l44xO/eXt4W1tyUZPSeF7X3TeXrCl32jBiRpkh+8jgREaDOWsbKdzMrAJ13u8C87yhj6bzZmv0XT55//PQjdv7d7c33l29e310Co2k0k9RnbACmhESiggUwVLYNKhYVRLP3dQKHWYxgCOAAooHT9BdWiH6By36IQw+yQyIVRlVgJBfZm/NEjhAJYrEvoaK3Zn3+k1/ev/wu3L6xVliiZRYaJKNcSpAqkAAJorDjs/PFZ19sfvrzsFh3hvb/Z+9Pnyy5jixPUJdr21t8jRUACYDMtbIzu2ukZWRk/vwRmSnpaemp3rI6K5lMgsQWiPDt+dtsuao6H/ReM3seger61KyC+BNkkgxEhD9/bmZX9ejR3yF0t5IaIAUDUUM2pyS59TiHTox9lOWMDjBASPx7Ih+x573VRPpTQPWFdENGZC6Qo6D2IANSRFQizyTMGU8w7mjneIu0Fo1pFRueMLF9/xOJVJFm4vH8NhltVic7ax+PcvL1kep+GnPnKCfpodkYywUK4/I6Jrc6EdCIkRuX33CuCtvMtTjqTik3DhGZwXjcdMzFPAIRCAAyUnh43N8/HMH4xYvLRV3ySIOBebDHxE00tSnLN4+q0CbmBREBgqh6+JzmBUj2KdAYmw1mlvjmo7tsGKIHE89qo+zlfC5Cfjn6MGraJ1VT4FBWgCLuW1T3MmrKkdNpZpjDoDPG2m9ioHQeJTd9kmG8Ana3kK/4IhAzses7uZ/0o8v3bww+sfttoKbzo80mWKpzwhO90R8MY0B2xsx8IoHEzFyEeqJBTwfudObiiX8Zcfz+RhvpyFxOhk0VFSWgbOSC5MNiVI3b/eN93/UimrJlOQ/C1It/9AbNjAFfLpsvX704OztXwx9ubx/aNoRQL5qDSreTkgmAABUBGRAJVCPklV9CCExlCFUIJVNJVCAGRH9T/q8KCmgpTIzIUbbph22qENUGiV0PaqvF8uWLVxJCJ9ZHiYdjf+gIIQA2Vb2o66oouhAQQIdITdVUNQOKKE4jgywEDgiIohANVMSb86GPii0qrKtqEUJsj2TAREsKNaDsDzXzol6vV3VdhrIOZVnsxN4/bG82uyHCcrXsjse3V5dfv33z2fVVSJM4R2xStgdaYmvPeLunw/5pSD86ZfPkHD5adsGP4yJwDKsyUHH2R5ocpKi5mQJ8Mr+08UKaAcfM59TTaHICV8CIsId8N5mqiIqoSZoXYqbCpNQMG+Pvpj7TJtDiqQTsH0KMMXDheUQnZPCTMAhHPYB+HBX7kQSvqu4RnhfGKtJ1HYdQlAWHkOVpQACJ8e727v7hHsFWZ+uyrvxERkgpcyaJRuYVbYpgzXckjveDez3tZKH++fULce2MP9Nc/7sJQh0WBzkHHNOkJjVC4MGg3jnodDnmk8X37vzmd4fLuKlJCDrdsJOvHh0lr8mCOyVq+R2Tui6cFcZeu403iDjZP60QIIIiGampnu6TmRhz4hOONyJxIE9Ddv4ETTl4CVhvQMQAZD7ARSUyQqaMH/ZKWRKAX9Ewcy3GmK2EWrcpn88ntIm/NgZ/qkLXDQh7AAgcmkXjqATI9n4z62Pc7XabzUaMIRRTJiACh1AVJaiIaV0Uv/3qi8uLdVEgDBFQuaoLKu53x4dj9+Lz5Zu3r6HvVk1zvl4t61qIFWW5Pvu8WmC5OH737Z8eH5kIRLMonD45NOfGIYFv0TABqujQd/f3tyh9SVoxHHebvhvUjIsqlDWFAIzOOBK1QUzaXoKEyBSc4yHxqHGn+/3hfrP56cPN3cPD4+O2lxhFoAhVXTWLRVGValoBDKqDDH2M0ndRVbILlgkDhRBCIA4z9F1RUNNUZ8vlqmlKona3LZbL1XL54XFz8/5923fDMGgcXrx8URahZL8sgBGLENz4rWBcFOuzs7u7u81mo6rL1YoMRTVZ481UAMxCCOvV6tWLF/v9/vbDB7m4qJuGCbu22+93XdeFwGdnq+ViWRTl2CaoqoG0bbvdbrfb3eGwd6w8AhISE4uKmvRxaLv2D3/418VicXH+V+kYNfU9zLIsfah8PB6Hod8f9s2iKasiL2A7INsQgJjEtI+xVGEoTrSRJxrxlAw8BeP8n4x9TywC+CS/YzwB021ImFhHuQcMgRFwiNHBxAYYTD0ZGFT7vusP7XBoh76/vrp+8cXby1cvC8ezYTC1qKqUNqTVlGbv4Al09Pn1LBA/v/58Jcisk0zkmCkuGed8iJ/TiGePLExG3lPDyJwpMS9hPwa6fSKHHdMsemQAoa/PT8nzSASqlqKjT/Qef66ToRmN47W8SZ9aXDRDU8tkrpT4pmou+gEAKphyU1WL82V1+WoP9Y83u9vbR0kbpVFNFAyJqqJY1GVZV1zVQKSIEUdIYFLpCD2fGp882y3P6wEJ3PA2hoDOrSGGZNBg8cXZ1b/9+refv3odquKnh7tVU9z/0/0gg2eoGaMoshESI5JpBBshIDrEwUDUJBl4CQlJnMNFaOT6NZkhAht4wh5DQKhq06igYooGBRYIhVKwwGkdxSx7U1EUI9JAYfH2qxd/899ufv8fDh8Uu57AAiKCj9Xde0ACGJGUS2iWza+/Wv/FX1Vvf7UL1eDio2XzLeKU/Jat4jq2inYygYBcLmseU1smOyMgmNvP0VOTBZAN1JN3OIjFwTACDoDKlE/s0SExer3TQjildm625fkkD2s+Ecnv0/fI1ZPfZyy3UaaZn9Y54m1u86MEmaas/xIhUAqQJR8tZx4UugcvrSROI9scTzJ287MvpjBDHvsNniRbL6fFLb4jJBtNXZqnx+1htx+KcvHF2zdlwePD5iRJx1JdO08XmuctpJVGQE9p94CjKW/oBM6asMtT0G9OLxKRGKUsi8kRl5WJ//Mp+/PrvyrLlYhF380DRSTmAlAdWALuq1KxhFU0mDzkI2Y1X3d2ciTNNS9Ma/2YrEMe1RIKJAaLOJ2ZNG67T6x8v/zM7HRWOh15hGnWQzm9Pl/v0/k4WSRPHKNP0cbJWfwRx5ycEGynpy1O81wEdS68mVrS5ySK69TMnJoxU88ziarHw/Hx2A9RUoZqZiKZc5n9TBUh03UVvn599Xdf/mq9Pt91/e64exw6RYgAg9kgWhoQojrtCohGPE6uIpi5SAIxB8QAWCASITMxc5HkhPQ5ul0LsplbwUCVwBZlCYhF09SEVNdX67Pj4Rjbrm07QGyaxVldV0RDe4xdV5clIQYKZUGM2PW9SswLMGoCRqBiZqiuf6iyz5ll6I9qbVebvV6vFghRhBDPQyiHgUwWVXm2bM7PFmVVcIHG+NN2++F+sz20SKFg7vru6y/+8u31xboqNHa+AJJOraSymkz/y91DIws/uw1zMZQ+y/yppEtguopGyoJfsTRdYkCEpqLHtl8mhCiiKZnnw1MagqRoK5yPtzOqPhsfDebXnSZqaCKWgV/2lmKvzExUo/gmeloycaYWmMK4fw8jmiitrGOaB5yUBHljXWKMhOzmYBdk85n79H50idrnNTBVxwnpgDShinLWkI0OhqEf9vv9+fk5hYBECuZ6HBEddof7u/uu796+fb1YLIjI8iFKzCDgU6iUtAVGngfkZQylXOLEJLME+/DD8vk8++V0Z/N2Kbv9J8dsvqFSgrflXgHRQQqm4+mWBgxMCUFsppDW7bJXdhRo0tjT0vPSLccOWsn3Kefye4pKzFf9rAr26M45lTgFVJgmS87knDgppy2FrqUniIMgMnzMPOKNVHXEf4tYCIbIObV8pF0QJAEYwMgbLERPC0ksGj05jDPeLNXqvu2ZuBaQmT5m0HWD2Z6IY9S6LkPBROhvwFiZsCyLQISG6ks22dAUmMqqRBFDvVovvvr1F2VRDEMPokUIuz7+8bub//Eff1d23efnF79+/eri6rJirps6MA993B8Oj8fWjMAzbQyDS/ww307KUQwGjFRwKENRIBUhEFh3PO5A70q29vh9WZahKOt6fXa5Wp83q5UqKVIUhaIsz9gaJbAovVnUYZBjHPrheOzuN5u7zWaz2x27vhsGQKSyZCKuSyvDgKAGUaUfhmPfHbu267q261WiswcLJgoFGKIiEhXMRQjMVFW8XC6aumTQdr+73+5eFkVThIb5w2F/c/MBCC/PLs4Wq2Xd+OlPBu3usGoW48/dAKq6XiyXj5sNADRNU4QCABApmolKMs4PAzCdr9eH/e6ndz89bja/+vUXzWJxbA+73aNqXC5XTVNXdRlCGGf6fd93Xfe4edw8btq2NbUQQlUXIRQFByJS0yFG6fu7h/sPH95/8cWvFsulqsCYg0QaQqiqykz3+8N+vz8cDvv9frFoMOSJ8zgaQjSEPg79MJRW5oG9fUJC/Sic9uOHyUe6DebJ0bRL9PHgM6NHc4Q6ogEMw4AAZVGUoRDAfhj6Y9t3fVlXIYSo2nft4bBHsYvLi6+//CqcLw86RDUxQTUiVkJ1XOacJWpOMCbHOg1xeD4FngXi59efuQyZ2lDvIRA+CtH52edOCExEkNb93R5iU3TXiYdjanHVlJE+fniNJpesDqczeZSYIWtds7X+CWk3sWiVcnoPOAQ/L+LaiNjyiN4Uo8OcA3Bd7FME8Qd1qndcniSEQKAUykDMEkVNzMRARZUDVXXR1GVRlVwHxNCrmoJiyvo2MEKQHN6LOAbegxtVpq3I0V/jA37ISEZCNCC1VVX93Ze//e3Lt2dVGSpcvb5uFuGfvvvXHzf3UAaoKy1IOwBkBgbDEtnFTVPV3EYZpYbHxsRSAiwLbKqBMZrnt/nONQsGAxRCJdbx54bIwIYMzEBII2IsR7xEIACi6uL67/57alZ3fzjb/emfbfcQup5FDFAcp4wkIUgo+epl8/kXV//wfys+/3Jf1EckBBbt3YCNBAKqHrVnWRoGr4Rn69U4FZszC3tShdLHDMaY3RHg9TIYkiF5jrIgRaPBOBoJcuKbmmIOp3MwmblHDjJwYoqqsHlTeuLjm+3AjreeJ1zlDxXHdz4fq8z9+HnkkC+lcU2PcrJjWvBOK/PmEbEetpsTh6a/KBf2J3OdvFeXJxQIDkqRmZCdAnYnAQ2ZkIqh7W/ut4d2OFsvf/ubr6oyIPSqChml9+TxczKzyj/KnIaLqoaGTMESrcqjrfx6nnnV0Mwkyw064ru9iRjXIUftBOHZcvVL66hFRESjRMNZQlbSwTRPOdIagaq6XwPGVVac5C2bC2d5nkAwu95TXjyGMpRlFQJrB9Pd5BQbdD+XTFespSA9M8pR6jY/+Nw+jIhqmo+2ad1cNQd+Ifqfgp/B0s3HpJ6pmR59mm3UmI42l50o+aRsPPGcERmjyGBgyB4BQJ7blc56I0RmUBiOXRwGVVWJZsqEQKhZSfOjuGH44mr1V7968/ZyXZYVgDGzEu76Lm53cuwZeIHMKIOaIRAaETGwep9vDrAiQuIQCg6BMTAEpw2HgCGMFB1HHFLWvglNUQ2grgCJQuBuGLoYh92DDP0ZU1w0Zb/oAhPScrE4Z7LD/iADyXB9fr5Y1FVVgkYmDARRlAEZlEzA1DT4ggkBMrJzF5RR/TQxrdD++vWr49mq73ozK4tQlHS+XjZ1vazruiyIgIipKo/7m5ubh2M7VEXo9o9vLldff/5mWRUy9G7VI0xCYeYe2Ti1TINZHCd6NhEm0K8yyEZDmLbCM4vIDbM2JSm6pkMGPmSMx6774f19DFWzKKsSS7YAiuLfNwL4SY6ZE2ZZgZlmFFkUzlB9QDD1O8GBompshiYmfVQxQY/lRTQkIPMfIgISOQWZbL6JbnngS2OJB6DzjR7V1OSHUHpX7Djg6XS2MXhjGuUSpTDFtHyT+2k0U1ERAYCyKPyeZT9TVfePj7vtdn1x7imZDOizUBHZbDZmcH314vWrt4hsKeIZDEAUwJTGYEgAAoVoqjZ0fex7iVFVEa2q67KqyrpmRkMQeI59/6XZd9S9hDbLkMppjZoHbzlEMplfMFtOkht/PCBSYQoZp6CWeUFGlERYJJr1b7k2TJAWmKWnoKGaE/xxGtQbWoYjjUdq8nAo5IdPcgKbKhEniDoiAIiK+eTHFI1GmJKi4rjGg2BqfeyZiSmkOFk1RGBOieb+APExEgI5/R+NQhrDzHg7E3Nw6ljtdLA2t22AueqMptB38eH+sT22VV2tVquyDEiEHKiERVW+vL4q6IfYD4iwbEqAYn+IUUxFTbUIxFQUBR2PXR+1KhqD8sfb+//tP/zL//wf/vDuxw/XZfjT+9sv375drFYNh7Ks27b/cHv/3U/vv/9wu93sHre7+75vu0OJHGwYFJI66tirlBdvTJmpjFCGogy8bqpXlxevLi906I8PD7shEvJd9aGqFvVqSVUhQNXy/OLlm6vPPyvKsm8Px8eHw8Pd9uFxt9m0u2Pf9fuu7YYhVPW6WS4AokRFjBI7Gba7bd/3UWLraN5hGOIwxKhmaMoIZSgsFD7M56KCEIi5CmGxaKqKijKg6mG367p+fzheXFzEw7EAaIgb4qKqLlbLs6ZpQiiRCkASvfnwY0F4fnlJBSkYEBrAar1W1fZ4fNxsLs4vi8CGsyFgCp+wzeb+7vbm/fufRGWI/YuXL7q+b7u2KIrlclnXVVGwi8uqNgyyfdzd3t7udltEqqumaZqqquq6ZiZGNLBBpO/73W53OBwuLi4uLi/6vmvboqoq1z1VEZGKokSkpjl0Xd91/X6/X62XzaKmkZXl9BWmUFd917d9X+hizlT8SCCG07CnTwrEJ6ajrPOkKnW21/l0+cyjyCcbApEOsZfOxApmBGyKspX2sD+0+x2FwIElSlUVdVkv6sYQj+1BiICAkQghwihyQwBkX5rJibsxxuPhuN1tu657+/nXzwfBs0D8/Przt9aZMoAzP9GcgWszmsS0DZC2OCHO+lF7Wubg0+1XNISfJ8zMERMuBj+ZlfkDLRNQLcXXpq+GOaUApqVZrxLAAGXU7yD1QG6UdH9GarkAfXSXJ5II4lZEUzUdJKpGcEqcJ+EigAExFUUoilAWxIxIpBEH0yQjJomS9MknmvfqR0K9zSCwkxfGRQ0Ft3ZVEF5fXFWAsjtoh2FVXaybui51Y1SUWNZQlDD0iMRKZsahACQxjBZtRHfoZDAFQHYEWVFSUxujiswVTw+bNwqWf8KERmhMBEDKGTkJNv1sDQ0wGh6QrT4/++1/E87OqC53P/xpuP3Qy6MBGTKoACEuV2F13vzmry9++5vmt78dmvMBKjUiA0IyEgUzFXV2mikBAaoL0gZG2WiNE1s3czCzxRWNbMqccnM4jGwK9WMQXCMmIRNjsaAaNEeFj8uv3nQTjFUszHICftYMYpZif54MbH2IOt5WY0jhfNibteZkXz7BL/ucN9WzOLYGSABAoyg2LqfOhza5nbDRlHYKu5tpv5AZrpOwnMQkf3OW/B4AzNvN7sPtXdt3b15cff76dUE0utwQ7ZRvjKeDpCd2y1SSZPwcELJ365Pra8y4nzaos6JAKOIfj44xQeMWcrrdny1Xv5hTTM3XGHW8Dk5C3scpDs411Tz/SALuSOudp7Q/9eVNz+sUdsNMyVfodmXHoNio0Bnz2HB6rCYRoRlpngyN93gKk5x8x6PchjNL8qcX8Z6s6bgIp2nuCZB9We78VZ0tC4+OYzN1/2bax0waNTrCZmaZzHcypgwzANAkIjiV0q1pmj9NIl42/MWr6xerFfZ9H6U7DlHViHsxjgJiAXBZFCXxoR8UjYmQClSSvk2WZjNfm3WDl2vAjMTMgQNxSE5iIiZmZhx/Uk7gIaIQikKbqogiXYzHXvZRzPS6KhbnZ/3Qo0FV1Q0o9m3BVNZVU5dVWZhp33dx6M00EOR9yfG7Bf90ENTjYUv0rCMAIAxA9UoXTXJRFcRlKKsiBC4Dh3S4YOCAAMMQXUTojsc3L99enS1LNJUBfP97tgvjeyL5RLb8aCccA4PHJ3yShsawB8nWci8GyMALFRuR9WMshVduqtAPenP7eIhwfrG+vFhcrJkCM1qCA/sQQnWsYEyzb3samvrATyc12+XXzHL2dXVIoXSqnIJ8EZCZVS2qiiiSFtOGbN4IIg/sVVX1sagfFeMp47fGMAwAyCnv+GNv1YmVIQttIKpP+mf3MMrgci0iU1T1oQubQZT9dkfERVG6+uaHDhHv9rvdblfV1cXlRVGWliMH8ymr480DZohqorHvhna4u7m5v73bbTYSYyiorhcXV1dvvvhsebamgtGHN8/IpF/UC8cShfJjelayIIzBkoAEHkaXliDnRh8ESzw2yFkQMA7dUrazESX4WwJY5LQ3k0Tow7QdppZsCHOY+HhgUQoCGH8lGRVVgdyU494fNQVBwBm5Gz1DwgzZAJA8Ss/v1KkvQhARM8WCxzBnVQVU5mS+UDAUdVS+uxHNzDMkU1Cywy1sXoNO+nI2LMP0eJnOaMqtsQ5DFJGuH2LUqiqYmYpQ1DFg+fbl1WpRHaNwEa7Pz8z0eNgzF2CgcQBiBNs+7v6X//V/Pz+7+OztZ30v/+7/98//r//hf9ocYw2wM3i/2W4Ox/X5OTGr4Wbz+P137/71j3/67sOHdnc0IK2rioo6FKHr1E8Dj6sbE9xT7LOpuvYGDFBxOF+uPn/9OphJ120ft/vd4XG7299vAIMQaVl/+d9cLl68Wv/q15Gg3zyoxeP24agazaJoVOWiWNY1lxWEIGCHrm27/rgf9n23Px7ato3DcGjbru8GSY/HoihKJsxkA2afNFsgCsyBqQpcV0VRkBl2bd8dDsOxjcd2VVVmVgCwQQlYAgWzmrgJAaO03bYiev/9D+vlqqgW0Qceaky0Wq1UZPe4Q8MX19fEDKCeqm1gcYhDHDb3D3e3t4+bByR8/+Gnh81DVdfL5XKxaEJIQ2ZVc+PZMPSPj4+Pj49mtl4v1+v1YrGoq7qqKuc9O3ZJRPu+K4vw6vWruqnv7m4NjJmr4GQJRcQQAjPXdV2WZdu2eV4/3gu+lkNIUFVV23ZRBAnZZyyzeJXZqWWzhW/8eI8ET7eWn2RIqhp+BLCfxSCzA8BNjYiKEAaR2A+mWi5XGoWIag7G4WG/PfbbUJdVVa2Wy7puOIQ4DBnzDQpmqO7lIfA1V2Ty3WNT1a7rdrvdzc3N4+NjWZbPB8CzQPz8+i9BHR53VscHDeDMSWGnU9a5kTHxCKfHCn08wZpbgHOve8KSyM20zpOjcFbxEiCc5nRn+4sbA9UbkkQ7xNEw5hiJNMYe7TJp2JoSPnJfhGQGBr44mRNXXGAGERu0Pw777RBL6brRouhdGxEEpiJwYAyMzJ59azTtTqWpJaQFQX/iukNgDlqmOQooN1pivoCJhKAmqBG8hReJXARRPQ4So4lR0Syry+v+7oPu92JWkKEaEwESKAmSGpola5APXAkUGJUC1g0tV7holM1MUU1RPVuYPHCHyRTTohoac9qyRH/uU1YnE1PZwNQIBtQI0DSL6ouvf3Vx3n14d/vNN4ebn6TrVAQQMRSLqxfnbz9rPvtVXC+PdTNgIcYFspkoogAISKIW40iQTdgJG5flst6J6EnrNjrkDEzAJg8EZHCFJ1eAafqrEDAAKwAqqhhHJDGXolN5qAkC6iV79u/aCPN9mhTkJdEnzapImNAilpFw4zL1SBz8KKgKbJ5oZ6LqFfCULHXSHKBfcjiBqk7BDJ4iNcNXjZTTsUnJhpD8+9HGNwnuu88uTDRQpJvb+2+/ezcMx9W6vH5xXgQcOue2fByjZHNxOE2qaPqCWbbTIQ6axT0Y26ARUQw5lRsAzAgZbZxyWYzxxEHsq41GqvLsIf4FWa6SCGaYNmhxvjc+O4mmYKfT3A+zKeLjlOT7VITN9y8lH3GK5jJins9YTrXapIN5RU7EI2E7NQa+Yed+rrHV/Zjar+A5QY5OfvL+s5ynp4c7wse1PyYW7YwqkPsHREnbu+rpK17E55jH2W6EmqCJ33SgJYFxVrgVPEnU5UkyKyGc1atCcff4uB/ih2P3+LgzYlUBtbLgkqqmLF+drbY7HjQKYARkBRWOJtGETNHTyMwIgAEZPSPQCROBkYmYCJk8iDY9SgnBR42gSkxMVJXFAvFMoRNru6Ef6igSk7WNePoHkSAO3TAMMfZgxgSBizKFY6Z9SBXlUKSVaTEyCIiSeOhIgZkKLitGYMJQBCrYKF2qKOrv0POZCjbCCDAsl9XXX30BoKICJpDp1iOwT4HcsZsf8QgGan5VYib2OPUiXzEGOc71ZOKAxqaYbwxfciVME001VQMbom53h6PSZrv/cFN89mr9+aurpgqGBKagCqSm6nNTypFW812ZzAieZsjjDrjNLIuaecSWRtEE5JhRdTYUGgYqgMab21Q1ZRKIekJuqq1MCZhyyKqqxhiJkZmzzdqAZqEXT5hO+eaXGJ8AYVQVDIZhEFG/eVUE0S3CGtv+cbNdX18WRcEelKjuvLTNZtP3/YsXLxbLVRSBsTwwc8uF5n0CVe264267OW63ABiHoWyqV4s3y9Wyqesf3/30w7t3D/vtm7dvL66uQlmQEymeX78YdThDTcYOa0KdZbew5WQVb4F8cEeu7IzXs99j6lgUj7dMf9uUmWGGRIoElKowSe2NKqi79hFSeIs9jVtOs1CYBWB6FedKlH8NS9ZWAzARN+egqvq8z9RO28n0/hPub1S4TJ2/5LL1uEbjNzyO+0J+foFATnBFRA6c1udGQ0U6m2Gqu21k1qCNSMJ8MLrSnRZN0QBQRPe7/eEAIQRiDGWoV+dvXl3/P/77v39/v3vcH28fNneb7aqp//bf/FXbx+++/7E77ssylFz98P37//f/5386O//D7tD9z//HPz0eTLAS0OMw/Hh7/+PN/V989jmJdmr3m93729sPN3ftri0xVPUiVqWgrmJbHPaD6Bh0ni1Rp9OzFEyoBQKrkMj1xeWyqkCtPXbvf/pwc/tw/7A/dEO9XHz+5W9efPllePGil+EYu+Ou2pkdRQE5lKUCBGYuCyU+tO3Dbrv/KJTEAAEAAElEQVTZ7/s4HNq2k6GTOJgZkZgNqoMIIJZFUVY1oZEJMYeCixBKDoFCEULBHJjLUNRlYSAi0WQIhBfnZ01VLJtaTKsQCgBWYIUmlOfLFUX7cPvj/f39P/z933dd9+G77y8+f7N8eekebRMtiuLs/OwhyuNmU3C4uLqg4D8+bY/H+/v7zWbz4cOH25uboe9fvXl9eXl5d3d/e3d3eXl5cXHRNBWzk/EgxmG3O9zfP+z3+8VisVg0q9W6aRo3naT0FyMOBAht17Zde3Z55q1x27dd37bdkTxdMVdoRNQ0zWKxGIZBJHqHwsy+jwIIRGSqRVUhczQVVSaezzGndhc8t5QSTdueIPg/EV07nr75aPY9mzGPfHIeENGUNwCJ4+9TTxMBs7qu2u1+e3vXtm25bJrz8wg2aDy0RyOooGRmDsETIBxqzISEAdTQlIiZGBA3280333xzd3u3WC6ur6/Pzs4Wi8XzGfAsED+//ovQiGc+1k+kZAKceJfmYyucVKesvmae4/SMmvXVH7OGYTqzDZ989ZGSagA/o7I9bfVhHguEeTEry16j9IpufRqrgXGNHnK/4k0ZZE+OSLtXCL1W1rdoSpjzzXzTEykQkOvCAIBGUy11EkNnBorZqzxpG5On8mkeNSZgbpIREHqTx+PhuF5WZajO6m3fff/h5vZxNwgs62b14k28vXl892OvQ1OWJiImKWAi94MpRCmFg4EaRKOwvqxevKbFcvDla0wO1JRDRilaFIEIAMmIMhUXn3zakKtY/xQNGQZE47JYXxahfrG6tsO+7w9RBIkpFKFahtVKF8uhoB5JjMBS5oYAJp+U569ZRgC68QES2PY0Fs7dCGmcmvOiUvx8Vq8nEq37sQRAAYEYlBVMjSNyRBRAc2ipEUDKQ6e0UoejTQJ+JhZgnh4zv/KfTknGXTucBw6cJg3B6PGyWdb0SDim3FaozQ30MAsFAsAn5v0xEe70hrf/jKkSjN3A7Bo3pM3D9sOHHTOcnzWLpjQR0Kd4xER1m3mIT7Prpjfpye993wNxcgGfejrxBKkFk90mxZiIyAli4pSb/vz6hbXV41RjtFw93Z5TtY+Tpj6eaM6eJj93P5iakodnjedgykxMAu4T2m++DtNZRqNNg5INfoIz/twtePrcSAbGjy7kn8Gn5OFTXlNAxSdPJ5x9iKd31+TIHqMkNYHzKYAWEAcTd3uK2jAzXaIqiIAxIaro0PVxEBnEBAiRDDlQU1bFIF3bX/368mxRHNvDceiPg3QiYOXRWhAXOXw/WtJXBsdrEjreYYzkTDPiKX0VTD29x/06RIhIjFYQNEyipQIooYgkiGfC46padAwzmBICAQbCQAnOibN0I0Q1QFBjsDDmcboZCIEJAjMTBmYiElKwaeMZ0S1CSmSmg0R6eXV+dr4SHcCE/DQDdRCS/wELhoJs6ZgjmD8Y7aMSKf+HzszF6bFtadqRAhh5PJAytN/MLKoaUBToVfvYItiiXoTrc84LHJimtZ4IBCIJ+KOJIZyevUQ82ghEHBmeMLq5EsNscRo3gtEFKzMPBdR5aTolLNI4NjT3EjPwyBQfb8PAgXyG/7GJwU5K4vyjIT11ELv8RJjyjU1HWP90V6rKsqmZyX/Vv5++63a7HQCUVUWMUYUyK8aD6MgTd1UPbdsej8fDLsa+KMqmaUIITOwIS0QMi8X1m9eqEkI4HI5wPMa+6/v++QT4BZ1k6EVrdvc7ciT1FTD3DUzBpcnCj7Ozy/+84+5MDcjIMo1t5Bchqnn+CM3mOT5r8WlNwlB4B3NCD5zwwSCaoEZO+h1nQ2P9muE2OSlzFhabb8ScUzcmw4oBjSEswMCjb4GJTEH96TiLy1GdLWamtYnkiUl7MjYPGE+LCjZDF56sA06nMTm0zG9Z378XUBOLokRAfTcI1uvwl7/9zdnNwz/9yzffPG7XVfH3f/fb/+bv//bYDb87X3z7p2/vbu+QCzX69qdb+rBpu6E9DgUVVVlC7IYId7v9j7f3g2IABrUhDl3Xtu0BVcu6bpoqrFY1423s3uHDUXpkMqSZ65lGtRvBCkJCZbCyKMqiADUCDBjKKiyrZVM2F+dXd/fb+4edLtdFVQ0IvQzbGB+HQQy6Ph72LewPNZKJmgFzQDCJ8XjYH3Zbf4R5ugyVIU+8Um1RcRGQwWJBYVFVVSgCEANWRVGGUDBXoVwsFmWBh/2jRKkpXF6trl++rlerYIoyMGjJsKh4XZfrRS1t++Hm9ubutut6ifHy6vL7d++kZG6qoiwQiZgBDKlana33AA8P9xRouVwq2P6wv727+en9h8ft4+N223ZtWZbn67OmrNfLle8RP9w/ENLlJRFRjLrfHzab7W63Y+az87Plctk0TVEEQr+gfJfHVK3v+9u7OzV9+eIlEm63267r4zDgLCJ1jFMqy7KqKgA4HI6P28dmWXNgSoz5BI0pilCGQAAkxoHUNCMccRpZWB4OZPNUPq1sUpLzVpFlv1QGhY8lXzIHpdmMAZoxkZcUqiqoJopmZIBgDKiA3eH4090P9zc3geji+ur88kIRuhhl0GjStseh75m5XqxDUboJWU1VjQMUITDxMMTvv/vu3fv3t/d3fde9ePHi1atXFxcX7t9+PgOeBeLn1385GvFcDv65znT2RzBtbSZNNk9i7dQVCB85KPOU+D8LmnZqxpweZfCpWB6vSHRyQifqFOWHXh68k6F5TLq5wJsAhyNA0sMcAFMUD6CJdgcRE1tA7BjUkHJGPRgAERAjoUP7kgxrOTLA343bVBVm+Vp48lHB/NMbSVg5+iFFRhAcNP7x5n1TF9fn63bo/nR3+0/ffrtpewhlpLK8elW/fLv97pu4fYiIBkYinnc+uTLtRL0eALVuzt5+sf78S6rXIkrGHjMqMMbsmeKoEQPTmFqmY6x2CkRLNEJCRMO0by0AgCRUc1OViyvUiNJxonMGAxoQB8IOVEYYPmhu/7xqVAJARdJZgzulxkwCh820ELXpO3ZtIyc+p5+NpZoRXHwGRMOgZoLs/0TLYBDTKdvKxhx5zEhbmPt0T7XQp6oNIs6l3xkJGD/WaOfXuT29ORMWDT0Cxx1Y+X6kmU94Spp+Ol35P5GCZ/+pc7VtRkWBiZgNamoPD4/39916tX754nLRVBolXbr2CaLDuFIwfTSUZk/pjauKaBxiqJJAPNqrCU9eYPMrwpKXQFVVTreGU0fi6djPD/9flDg8s9s+2bYzm2FIfkYgnv+rJyNMtKfCqyXACTIHZvaHFqXcnaQSa2ayziESWSDOD9YZNnJ+082nqqMlaA6omXPMPzXZPZnOjgp1JikhQrKWjmFkae84c9m91UdkcvTq7IzyDtAfdwGsYVwxAkFRFEUoj1G2h2P0VRwTUDWTkVyRNFojVCSjkgkNkAkRd7stIF6dXfRlOLTHbde1IkVgFPG4QQZFFVBxgoG7pShFLWUyu415RUnD9a9LgEx+hiV+lRGQIREDoCIooohFlyxF4hAHVRBTM0bgjLdJfAkH9OafponHtyGpEVgg8AMM3FKL6nZtd9SNc8pcYDjn1piAQAmsLPjNm5dFINHBIZrjEE0F0wGmlAqD5CJMU0rx7ZYZszT7dmnUYvAknzh9cEaJZjXTlF1vSilNBmTACtCJPmyHHz9smkWzqAuHGLqG5AxRNRv6PsYhqaUiBuA2bwiOygcwMEk6jprFKCqat+NpPp8YV3NEYtf1mWGCNkOq5M36NJiJUQCoqItZbmz6hEIognMPDYjw5BFwKhAnFn629M5fCdydpgQTCA2RfChJRHVVI4CKArh9HQ67/fFwqBeLoir9SeGSN0z4YxWNnlzUdx1IrKq6WSyWiyWXIXAIRUAiETmv67Ory77rYz/0fR/jMAxR5Xkj5hdzmBEAJ+jBOLwwULQEwFNDmli9mIeOmAF6E2M8HSyGoGSG6n+E0qTPgXOWFsXQEKcLPpd46I86Z9soTPnZuVdRt+wn5wik8JJcyOZYOxstKgSzHa+8PmBTZl72NafjUDXvv6FDaRJFbL5Qhjoqu2hGM/w6mIGKKSWai4KIjsx9PJ2nmXeMaYaF2caDAISGpDZi+tOHMC5qqAqARmiVDlSF+/uHu9v7ZVn8m7/58v/+b//m5cvzY9sHe7us6F8CPTweY4RuENNeohQlBeKqqY5djAC3x/13Nzebx32zWJVIi7psFmVVMomt14vLF5fN2XlH+NC3725uNjIosyCpWDaJeGkraMZgVcVViYExBCJC05QCikgFF+dnZdMsz84uXlx3W6AY+812oww7ifvjEbvusDvsHh7xcCwWDSqYilIkhIpp3dRoVlaVgO6647Fr/TG7CMUW4cjBDIpQEpEZVoGXZVUgo1iBvCjKOpRN05yfn12cnYm0uyGWyNfnF69fvHr1+s1g2qlodyDtl1VYL6qzVYXSf/jx+4eHh93hGMrq0B6++PrLm83DfrvbfLh58fqVgPhIlpgWqyUC3N/efvjxXfXm7aDx/v7mux++/XB3e+i6vo+M3DTLxWLNyKtmsVosABHUHu4eDvujZ5nu9ofdbt/33Xq9RjyvqqKuqxB45F/7A/zYtpuHzcPDw/nZ2cX5xSCxO7btoXUaw1j9jXiHoiiqqiqKYhiG/f6w2+05cAjB3S2mRgZVKGrm2A/W9WVZDYZiINNeNaD6yCLNkvJdPzY76UxLNZ3qmAGDc65lgtX4NnMap7KvETmDHNTHv6ZGiIQkJt2x3dzebx4egHFxeXH28rpZL/thkB5ZBjDxsNkYI2BZRAyBEYgBiZiJjsd2t9s9bjY3d3eH9shEr169+uKLL87Pz0MIH1mjnl/PAvHz688qEE9q7swuNMNNPOmck9ZILk/5mSnmyAdvm+0jS+V/+p4flb5pGpZDfWbB8bMF+4nM6FQs/8OEpm7jshyIkt/UhHVEJGAbbZ/+X8gRv3Cyyp4i3MAs9h6CitojSNq7yPZMRGBEjy9Hn7FrYrvmOgjT/xgt2U90uBPs6wS3tRmJ0sCMbC/9f/zxW0F5K6/b9/0f37///Q8/dEhcNh1Avbyq335Z//jtMQ5HGUCkMEVTzNZhBE3hbAaCYIgdU3jzev2bv1h89qVQraKcwutS4i+NYjUakAKQuV/HA2rGlWsDgqyzIgEiMhIDiGcnkwL2iB0FxWih8uAgUwMBA1A0GRNTMdH4MtACeOKl5Z6VIH+tCQw6V0W8cFRLiYCazRTZrpcX92AUi9EADVlBBCgiRuSIlGV9HEnd6tA3Q8mAaQYjN2NPziM8tazaRH480YhtCrCaZipPbxbLlo980WHOJiH0Tz1JODgmzs6Sd8YWGsfdvSm+C/LUGMb/Nsa+TVu8MDOezXbSs9yTviDqsb15f7fddp+9efX5528XTZlwL2T/iYcPJu3eUYqkOZbEzWVu1BrzKrMePwPXKIxTqjwb17Qc7XuXM77NPOThWR7+5Rxh4BqkTemUieOJT8SdEZXwcYbkrLaGlNU25r/Yx47+9DzxSLSJJ3Q6Fvro2qMZ3zjP1fLzcoyUfyL7+r1us8XAERIHp6sGmo0h8IQflY2izqocobUn35SfmmoiNknYM/1r9iGaoaEhI5QI60CvFvXC+rqsymr52PZx6PdtnxyhqAlRawqEzEVQIVRTQ7X1erU77o4BqK561Pf3d2dvX62rpkIoArUqjSipsGk/RDYFHUAFQOfEKxoVEZuRrCBbUhE5DXHJP+isPAI7xABJEUVViRhAQMQMmQESKhODj4+N0QIRG3J+sqZdHNHEvB/Pl6mYSpenqbdhoOoITKPxWQ5oZsweiAqLpn716qWIkIqJEBhNfh6jfOy6l9UvMjVMR7yNlKFZ1Nr0jjIbyHIaIU5LYqMlVzPKA7LlGoAGMZ+AI1ov8u7mcbFs3r65LAMwGKWNdUUEEWnbtu/aBHYYBiLKnikyci06B8UCAkDXdV3XJzC8mqqxOwXN6RBmADFK13UAIKYhDWjHLB1PnENEiFHatmNmhIWd3oaIVJZldifl4jKRpk7ul9mVj+N1ryMPyl9MTo7ME0ojwsE0Dn0RQlkUYKASzYCIVWH7uBWRRdOUVWWASKiq6FTXlKc67NvD4243xBiYlsuz1XIZioKYjSxiGhBpUpOBiqIJRd0sJA5FCEXx3JH9kjTi0YGbV09SHWv+lKbEXjidcY788aQE2QikcItsMgVn+z2BaS4czQBVaapWMcWEJ6uiV6UqADSz2ySaXLLsui8G1cZFruSdUJPMhkv/WEoQTYuKaatM88Zfjoj0Gn3ej0IKMcY8qkwrDLMbNjmfTcfjSs08rdnEtI/mdsxxX1TN2Gc9mQuXvxUYE2wNZ6Eejmb2lhNJ/XEEKGLtZvfHH/74u29+2B/af/sPf/n//O///osvXraHLfb767O6CJ8bF//L//H77a6jIhAGlsGClURVhVEgRtz03bc3t9+/+/Dy14tQFpcX55+/fd0ej4eHw/nV1avP3laLZW/2eDz+6ad333X7DlAxO7LTu3RQgYaATRWaKhSl1ws+rTWX3QeIRBRKPq/Wl5fXt13/w367/QnluNur9dtt/HCz+fBh/7ipYpRAoSjUkBHqMqyX9fXl+aASijCo3D08PG4fRUUVZCFnRdW2nUT1chzRAkMZmBUIrAnluqyburm4uLh++eLs/Oz+9idSuDo/++rt51+8+axu6u3x8NgdaOhKi6u6WDVFXdDDzfu724e275FDQ7jd7UJVvf7s7bt37/b3m+urK8FEiWIMVRl4vTKTb//lm+3dfRu7Dx9+fPfDD4/HnSCK0aqp6qYpqDCVsijOLy6Konjc7m7v7r/77ru+iwog6ggjE4lNU/s/RIGIVZWIhmGIMT5sNpvNhohev3oNAHEfEdBEhq4f+kFrY6Z5v+MHYl3XMUYRaY+HuqkMkTyrTo2ACuISQ3vctbhd1wsmFG+LKE3BKWEWzdgHlWRTKIvOfcKalohTmCXPCZ6WHFlmJtl54/hCUwMQ16HHpB+NsTu2u8fHzcPDYrF48+svllfnWARRBWYKykSgWBYFM/f90Hd930lZln7yDv3w+LB5//797e3t8Xi8uLz4zW9+c3l5uVouidk3Pp/V4WeB+Pn1X0QJgiMxNp+/Mx8TzrCMT3ZRx5ZyWo41TFNcn03PvBZPd2DtUxj1TOmd2MbzOOn5H0lgxfzyNdsRozPV90DeRuIUo5BlayJHppKNw2Yv0COQATAgmYOEPX4U1HzRytTFcANRM0QFVDdIMhJhll4tY+thZggGgI9czyMaNouCaPNI0fzbiVBAAAEZOtAftvfH74dvt/ePh8PjsT+KQlULBgCMFZcv3px/9duh3bXf/dGtMsGM0iKqGanbAJQgIkYKtqhXv/m6/OxzWV20GsCUzNAYyH2yCIRgiJqkyCTIGYK6hSuNJAmURhIsARAqomoIGExjAjMbRESgoKqiLpurgaDLy2mt1QBVDAQIgMkILWLyeU+xZqZj5mFW+TXBSJLInun9lnG0YPM8w+SpJkxIaTcCGKICq5EgR6KeaFArkFQdepHLdDM1iP6zJwRDU8X0Q7dPLX3DaGqYrmMc3Y5+5Woq7T5Sh584BJ8G7KBmCHC2XpGTD7OpxEbdALMwZXPZ+XRaMTXKmeM6vfvJCewgbR2n1goE7Xb707v3Xde+evX12zevFnWDw1E1Go5W+p/RiMmAgJhCCCoQ1URE1UzRixxHWeX5QXosaX6NfTwi+ibT2BswB0q42KfDmOcy5BfzUrVBxWabuN4MfRy+MYssn5CFM+D+PAIyw/HtE2NOMyAwzX2mzyIorct/Qh1+8vfnSzjl4pze0x8bKNAz3A1Pxyqz0JJ0A3jQD+Inl+hnf6kCJKrkFIMp4kuAKXGIeAR5w0yJmNAZfqwgrgouLtfDqkAiCnXYF9vttutaJGTHCqiGAEYKiKEKFXExqIEOEl9fXd78662ynl+e2Wr53fsP18vF62VVFmHFUAPU/lVUHnc7sGiCoEKIHMibrkQDMCUgShmzwJnTQUmST/6d3NETEflZLZafhkgASCElBDC7ZyYESiY4NEUQBmB2qSFda5b67YT7IAB1xx0CMmbXNpiKGoIpjU0aZvJuFnuHaDGqqrrmqwpZrzFFA1U0MDRCNHCedQZ3Zs6PnyYJ5YtJSfTdmCwEa96gtvytjwOIHPGqmn3F+YAxfwsmqmZYEO/b7oefbs4vFrwsaRSs3VtuMgx927Yxxr7v+74vy3K5XIYQkCVnlnPKHkREwLZtu74zNVWQ9ADHnFnnp1sODrA8rp0qO1+8hyFKGUBEYxTmMK87/bclXnXgWSU6O5VH9PEpiFzVYozj3qtB2hR2brhluSrNbNREtShLZsa8KS+qOsh+v2+qerlahRAUUihfIhSbapRj1z08PHBZLFeruqrqsiyKwMyS5roofnqRc2kcNmtoUITqsiqL4jnY5xdl25k/usdf1HzneptBSE//3OxJP3oA8raK23qyQIvoEx3fs0DzIG0cQfYp3BSnAnJGcYN59wIT/NRmqy3j6azZmoCINPdziMhEMVJT0vny3Jzu4jdobvfsya6PP9spe5TS9MtMVPyPACJTeh467BU9aNSXO1VQ8T+x2D7OfXPXhjaVy2gAyAEJ2j5+uP3wH/75T7u2/9UXr//2b/7i4uKi63oVFYF+0C7KEKXth8P+UFcNE6JqwRxCcey73tQIh2h3u8Offvzhr99+VoKVRfXrX315sb56uN1A4MXZCkMRDa6urs7Pzun+xiTDB2ZdMiEWIVRlEZiLEKqqCoF9TcGZb87/MVNUAhRiCAy2P+6Ph/0Hbs2O28fN99/v378LsecQVCNxUYawWC3Pry6a1bKsqkGlH4a2a+uCl2UYhl6iGUC/Wvdd33d93w9DFAQzHSxGRqjqsKoX67q5uLy8vL56+erlxeVFPD4+ML99+eqzN28uz8+iyKKuFPV8sdwvlnbYg+j2YbPZbPouGhAWNvT9br/b73fnZ2cxxt12G4d+cbaOaFHERASwCOHF9Qvo5Idv/njsjpvtpu1aVQUmAiuYmajvu8BYN4sQgprLwdh3/bfffv/w+FjV9Wq1WiwaInp4eGBmVb24uFj5Y1yViB4fHx83j3Vdv3r1ao6SMIAhxq7rRspwFukzF9uz8Cgl1zERMRMixMTwL8qi6/v2cDw7O+NlzUCjvg8AyZ9kZoKgJ8ECXqOJ/8ccOANAjJRI3klHnjnvbORPDhIlagjsh7vvXB0Ph+3DpjseiejXf/nbq+sXyNhJ7I8tEQVmIkVik4GIq6ouinKIeDx2Xdf5nf7tt9/+0z/9k5l99tlnf/M3f/P5F19wEZwcNWTW/7NA/CwQP7/+3OJw0odd4/R8tExwnGWR50yOsWweHRt+yk4g1mmX8SP1B2Z7sk9wE2N0FZ7U5jBNg0+V5dS14McZ1PgJh1cuWWhMqcvVTH5oYrIf+1o6SFpgtxG7S0Aw0iHUge4W8/cbERQtIujoelbzmHCaRbGApkcsCWYr8RRSN1vqhJzjAJZImo429MR0dBUWEfmmbe/6LiIKspYFUgGGhnwErpr16tdfh2A/iQy3N9Yd1ZBB2VTTBhoIgSLGUNpiufzNX13/d/+drV/vuYwC5CeNERghkZs6559otqomzASlHlYAiHJUlCI60tcUQJGQk9eUDAk9bwYgG0sLjKIufyAQoCdTgCqS+ropgxo4AzjD+NUmpQempg5wDjMYsxZTCzxxPVzLHzmDkDPrFFENBVmAI4ZINJhGQHGVEVHMRHXoJYphURZ1UTc1qlrXqu5RgDNS2MYyddKD7ZPAU5wpxkSUw98MM+jQjUozHIV3l6Y5/G0cR1hWmhA+LYMqwjy1Nt2Aoypt2c4BI6J59sgYCZ2QVhPB/GYxNBDEx832xx/fxf54tm7O1suyZO1cMhMAQqBPasQ2q/JDCGIaJQ7DMAxCGETUwAidZ5JvEPMSSlVUVZlo2n4YsXjqyjKPvzijxdqzPvyLEohNVdSzQfy00lP+75Mj6UmI3EyZPT1vphCc2eGXfs1j34FDCByc4jrG2o1+4XEs+CSzbhyeJiodnSYLfXRW2+T7nZrkpwpCVgXzExtxehAlD+QU0gcnTJ7xDyeVM2le/nlmSfijDw0BCaRA4wCGqABK0hR4vlwcj61YXC2b8+WqQFuyh8UZIQGIZdNkWVXEICKihmX57t37s4Lx1dXVqq5KDkQBoDw7I1M0EYklh+WibuqiDIGJMlI5YYABgTMTGgkZyP3FgECOC0gSimcZoiJZ3pVAIkt+XPSUGCaiskhXl6ofIwxQELL5kotIzrqdAYDSulAiYDChakJdgYKBCZohu/90XBJHjBL73o6d3D88/vPvfn/+d3+LpuyTbgMQRVA2JFQx9BEsQEiB9WjjqgTmXTBIcANncTAgAJkpJN8xZciQs4NnUQjkRAydEiWQSNNyNhtgr8aGt5vHm4cN03rdVJQm4+rQQjWLIsfDYbff932/aJoQQl3XlBZKAJEM/VRHVdgf2q7r81t3I/zoh0IAEIkOFcnfI6YgSqS8WA9911ehsuw9TN1ySrtKrxB4rGcm9Mq0im+gMK9IDSDGOAxD8A3t/IH435a+EM1BR2gKzKw+2PBWXDQOQ9d1F5eXZVGkXXcwIkYDJtQhdl23e3wkwPV6XZZlKAovrwwJc7xXFPEKgJHSYFrVqaqDij6H1P2CxOFPBBSPNe2Y/oBTTPBYRqr9HCUQnLrlhw5nxpbPmjgVwYmRn+FrOu5SetEvmC0XCdaT3i3OSk3Mu5+TwT/7Xp7soeb9B2TmtHBpc+q9za1BU+07/g2nCR/+l/jJPLf8pwcFTVUtESM5dw9G/PjTs/8TCrGBARKSokOdgZKnRAAJg5j9+OHmn3733e7Yffbm6i+/+rwui/v7u7riMiBxefvw/p/+5Y//4Xd/ejh0Xa+EHJgY1Ie/EciYCQJE3R6P//iHP/ybr34Trq9RIhO+fvHqizdfdBp7jQpoFDoOX93d/Q/ff4Nx8POF8qovgjEiEwUkNCiZF3VdhoDgc0obgdD+SSOjWkSDKvbF/ghd3x0Oj/d3h8f7UoeCzbRXgaZcX798cX55sTo7K4oCCKNK1/dDGRqCBcJ+f+i6LkbtRXqinlkKhNLATGIA1ioU6+Xq8uz86urq8sXVYr16+cUXb7768rjdDI+PX33++YvLy4CMYoZM9eKLl6/R4LD7w+PNrRh0bcccuKyAaBj6zebxYbOholisFgayP+zr1cLPaANQiYOIhXB+dfH//Xf/7sPt+0EjBMyDNQSAYYjH9rhY1Gq22+2ObXt3/7B93B6Px9VqGVXuHx7u7u4QYb1e393dXV9fv3z50mm5VVUNw/Dw8NC27Xq9vri4qKrKD4WiKJqmcV48jyiYky3hKWp4Sp7IbwwpjT9XF+dn293dT+/3293lYmFiBqLk0HAYHfumM0QfUXaVETPPM46nNtFsTF5Ns2IEfyak41XNkDx5npFAZb97vLu/PxyOdV2dXV6cnZ1xCBFVxBSMiZBIzZi5rhu/o0MIZkAETbOIUW5ubv75n//53U8/vXr58u/+7u+ur6+rqhKRvu1sJunYp/xVz69ngfj59X9tR526NAQgSZaTvEHnUhRlK2He4Nf5gawjeBRm4WenTTZ+Qil++j/xk5XM2N6cBHOOlcKnEsEybOdjIdzm/21mOIVTr6Zz/dIKVzYczxJ7LKG0FFVSX6KKGn2grGnnw4XmjEOAtNN8+m2nmilHJJxqcP4W08ZVBjvDnE9JwCAGg1mStrPZx1t2AiyaVfXy7dmXj1sK/e1N7FuNg1huy5GU2aqKVqvi6uX6V7/hs+suVAOgghpoQMobZDPgkRtscFzNnGUK5gDCER1o04IrAqFz0xB0RBn4IWgAgJygab5INvp/J8xZMglPmu9M4cinG0zQg//UTMSe/D4bC1oYt11TSLMCCdAAJIACqICAJGC96qETsGDMoahD2ZTLMxSJdIhxAOs+8v/CKQZxnLDYkysU50t5MBK90/c8U5LV5jmQaRFwTLCzjK0YNV98UvbaDCnx8T00u81gSqbO9Ivxu8KxWRkjHo0ObX+/eQQcmrooCyZMWY8T4uVTd6a3ClOvDnknO6qRpLWjMQvPpphBmP3Nn7gAEJ/8F5zyXGzuKH9+/dffUsPsBzpl1HysET/5lVPR8xOn1XizPPkLx7uDkso77bzO1Fu/3qYr8eMmId1VeNL/P3lwZVr6LMs0nYp4Ei83TvDmbTXMyTDwZDAy69inf5VT2mFU2+EjdTiPM/3TcXlRffWWkOqqqMvQ9oOpIFpVlU2gefZXypBENYRFs2j742F/WBe1Ij0ej9vjcVlxVXLhhOIS14smDn2MsQjcVKX7WnJGavJRjnifHH407UiPwIDpreu0VKRgakCqqpD8qmA4iYygApI7uoDozZDOJmonWv5ktXNlNomeJ6G009UBI1srxbqZDcNwe3//uN1dLhv3CifqusejWjoDQI0oZ7XOnsk4bpWfPM4BEQhJJ9iVAc499WO040m9MS/ywMRgrAN1GIbd4XC+rJdVmVWraSHNTKOIARAhUhaQbX6wpFeMMgxRRJ9C4WezC9WPBCY8ecbnSYbO/Pvp2LSJDzOt7Xxcc/5c/TDEIcY4U+smQM28Xh03W8Trwxn/dRStqrIkZjdjj+9BVLuuOxyOIlJWFTMjc75kT7YXJnpA9iMgkq9hPWvDv7TTLN9JM1E0GWTSQGiKIH7SQMBHHDucP+E9gdqfB1MjhKA+P3LpFmw0UGSMV5p85rGn53PlCJDxnYxHw7w2mzoZAzuBlfm0SA19lGVmlBI38Ul/lp57DlzObcbsK3ojlL6GJO3ZPjY6JM3O6fIKKd35NLsZPlFV2umtmD7fpNEDRYVd29/cb3fH/mzZvLy6XC2avuvABrAyMm323bff//Tjuw/b/V4El8tlXTUxDibKRYgimn4mhExqdvP4+N3Nh1fnF+uiABGNyhVVRRmwAGQIxZXBqxfXFTPFIYUG5KbTf/yMQAgMWBVlWRTTIl1W0KckUCM1MbPCZIngSeTHoe+HgUzAxEwlIiE0VbWoq4IJTWUQVbE4kEoBUBMJUbLbZNsHOm5RjYHKslhU9flq/eLy8urqarVaV4tFFYL2Pam+efHybLWuODgSOwAi8aKozppFiXTc7iRRrsFC4cFwXXvc7bZVU4ciRJGu7/e7XbNYzBBypipd1w5xeNg8DBrPr84QQdWQVFVijFFkGIb9fm+q+7bdPm73h0Pf94i4Wq2Lquq7XiQCwH6/99PZM0SLogCAvu+JqKqq4/E4DMOMgx8hjVY5w+5tVptMpCtf2xIRcieQCrinzIAYQ2BQ2z/url6+MFVARQAlAANJDKZPbxtMq9hT55mrOJ2cD/PfPKNTITIZqorEru+7brfdS5S6rpfrVbNahapS08EHSN7gZ/GCiJBSJofPR+MQ7x8ebm4+DMPw5u2bX33++dXlZV1VPvIUzyKYSdvPr2eB+Pn1Z36JQj+AAhlCjBoF8nDRQgiAqGA5hxrc8zPKOD7mZQ4cQkIQU+YR28R/mKTXnHuQnlQn6tjYTNmY45NSW0a1zvKoM29jZiHPEFFtrvWdlhRTQG0Gu1ranBr7yaSZEpoFYFCQnD+OSSo0RygiABBoYVLoAAgRQH1rRiOYCgBgMGBxSweiIqiC+kTfI9vUzMDTQM05gDOW1zyGbzxhVSXt7/vpr5iiUbz8GZlDoIC+jI8dgDVnZbO4Wr+sXv16+6dv+vtbOe4kdu43oVCH5TJcXFavXy3evF189uu+Ou+VoppBNBDCAlF9j9Z5HJTZXjMU77jbmii+7tryf5XSu2efvxemBDSu4qol/5ciIBGaoAoAgJG30Iyo4Al7kDCWM3OwV5+a/sCoJWey2Ag28y+tNpfYNVfDXrk6BlkQhCyoKZiY9UZHDGBhaRZAKkZD66Juuu7uCNevXlWLFXKAUKxeviZA7fY7xH57J/2RAVUN0ZDQU5pmM1xwjnIyDJ5kzM+gullnyNvEOO9sZ043HDHgqN44WJrcZNwoIM791OMPa66Xj3znsc/31MYU95SuUUkO/DFM1wwM1d+bUlR6f7P94YfHpqJXV+tVU5qIZHa035o6Klmnlb+oDDGXa30fBxn6OAyCqH3fx2FQFU/EVJP0vSNZjnX0+seNfswhJz8RTrrJ2AFo/qr6LA//kjpqNSXzISeO8IiTudyJ1GlPheDZINJG8/+43J7aU5333/5oJ2ZmTmgBmyGO8pcemf6jTf40edKmSzg/MHX2QHhS8oMhug1zmnpkPgYoIk9ibmILnCY0zmEaeZU+uSunWp2z535CcPhveRLVZaPtxVQtqoICBCqXdXm+bBAkDnGz2cJysVgv226IjRZEREKozBD74XGzOVuth9vu4cPdi6//ItTLu/3h8nBcL6rz1WJZ1dEkihTLRV0GNSHmgjAQp+/AuXgilEoLzVFwRoZEyVA82k4hixrzn3v6xjCFubiHjtECoQeLGyeWPaIxIplZVEspfEk8oFy+MBMHGEwNgdECeb7nKNsjEBARjzRqBEA8dt3Q93UdVqumqOhw7L57/778/K1DohTUneYBwYkVimYIRDpXOEfSLrGfrRD8IQlAJEzoUA4/d7zEym+CcFw/ybWS5gmcs6AGFZBegBQIzNAGFflw87Aoy1VVFwEdXeyyOxGHoghFWIYlmDmCEFJnTmYAmJKSEKHtu0EGtUnuz1WhMycsSt4Tt+RnF5Gk08+iGj9CitNskWCKZpoftbNKdfyz2bFrnvWKqtr3vS8OjwSb8Xb2EYT/W2Yysxij240tl3aqKnEIzHVTM7GIGAIykaoZbDebzf3D0Pfn5xfr8zMg8gUZZE6kZZg2exAANQ/jEzJF/Qf8nLn6y3k5ew0JESzxYpIjJ69HpFzip0Evowl/bo1BnIo7DGAQxUgtEDARMhKCbzOqGamOq2IEGDL7PPtAOCMpJgYNzSwjfngloTlz/xKKLnlO8skEqM7JSTsQo2SsqPikhUxB2SOVZdS/skrsZS5aagnVJLkpDUxEFUGAkbxuxMBEImoigATjFk9eNJ1lfJnmt6Gp6kxGIb8XSYEUgyI9PO7/9MP7b398qJvFX//lF69fvayrcr/bdYG6NjxsHv/w/c1//MN32/1BEBHos9dvzi8uDvvD4bCLfdfud5amzBTKACzf7zb/7v/4x+ur6//uy9/wEKVrh74rl82iqUMoKFTcLP+y6y6Xq5u+60WBcWxaGblgLohqDouqvFivlk0dksNHTVViX4QyTZYJHYNDqmuypgwSwqUIF+G2CPuuG2IvZjFGaY8BhDRad4xmwzCIyBAHGWLsWjseue+5H4a2xzhQ12Pb2zCogBksm+Z6fXa2Wp+fnb+4fnF+cV7UNTAf7u9vf/qxBPirv/zr89XKRFUjEnFRRFMqCji7uL28vv3pw939bVHWWhpRwBBAtW337979eOjaqq5E4vFwuLu7+fyLX5VVSYE5BCSMUX74/vsB4747HrtjtaxCYDNDAh0GkX6Ifdx1w9ANfeyH4dj2wzAMEquyfvPy5YtXr4pQ9H13d3d3c3NzPB7v7+/btn18fHSO8GKxcJTw3d0dM9d17RiK4/HYtm3TLNzJS/QkkwbzoMJPh5gKMFNNGzPKBqpaNnVRlvc3Ny/fvsKqIMZgIKlvNQUIeBLDYzZnvOBMIcmL4QqEwMQZywfZ3pCyJcdaOcZ4PBz69hj7Xs0uL6+W52dFVSKheBsGwMyYLVbocgQThWBI0YzRun748NOHm9vbGOPXX3/16y+/bOpaYuz6zvdffdqO2ZBm+uwgfhaIn19/7peqRVFAMkMRM5Cx7yPiAikps7kxZICUM23jjqYEZlcJ2VspQBA7hRR/IjJ+XKSd+0GmLm4W+A6f2sydip5ZM4Cj15VoBq7Cmfn3aQF2YjVJwz4G9TY7xd2N/REiMAKBBrKaNVmP0OeQ7p/yoBi3d3p5NwGU8+RcAXl6Z5gJrlkkfmpGyiYzzSP4bFUGyEvE0+eI2W2K3CH2wLSqV18vytXF8f6m221ie4A4mGBRLcPFZXFxWb645vOzjus+huwbEGQw3xX25AbEGSc5GVZPZ5VJMgSkDOTMn7ZH52QxOQ/68SMIdR5aziLU/SIjmJmSRkfxyUSAksQ/2XAxBQTCPGYYKYcvo6Uc9eweSCKlIAhaRGRCMo5qRwiqfACtOGiFSDC0/TZ2UizPP/uqXq7brtdhgOa8qupCe+u2NnSHtkXCgKlB9a9hamj/ubFo85ycuZvv1PfniXsAYCLRVDBwvuAUgUAzpCSV5M631nEh0DKpwX369MRJmCNHaFTeFS0Fz480SwPg0RUmUW5uHrePujo7u7q8aOpKRHDMl05Z1R/3QpnIoRKHoe+6OMQ4SBwGEQXAGGNmaZ2ymEfQaja7mKqa+izaCVzuB/RIoTEBLCX9jMl7z69fjExsJ9fvrGL+RMTcp9AT+sRE7NEe03RhLiY5Md0ACZEJENSUkAHGFHhzrNz8qBoBDjOh1XeC7UnfOzs/8VO3/wiA/AS1xjXfvChsH91uaLO4rfFsdc6si92Whqk2duYTenh0IFGyaNq0+uI5eIZmZRFWy2Xb94+7Q9t2IDHYebfSmhkQGKEuWA/H9z/9dHl5wcj90BMSMbdRelEDChzKEBxNEcWqgpECEukwYHL4IiHOsl89ZRuJyFM7M214RB8lkQ2nADYwUXKefVq2Hg81Bwg4nhMBg0Oj0LE2JulSw9GMDEBIzFwyFkQqaj4NACIyyTNuAgBw7g2ldEJCwsPxGGM8P1+GRcFFKJi6GB+2e9cc/bGGhMGhWABqogDEaNmWm4+L/E0jAgCPZQECIRQBAweXiRmnMXwg9kqNPDmKwMCQAQHVx9xEUQRVoqn4DaFCQI+7dndouyE2xC6uOwe5KIsGll6M+Y0QQhFC4U97T/51XJECDMOQZF/VkTY82o2nx36eNJsqsIurMF/HIU40IUSkjAA+qTz92iCcZzxONzt4LTeJyP53lmUloiKeYkizKsXcMGVqSICMxOy59lyWiCiijntRlaHvg6dZjqNzNUNTlZvbm91m2zT12flZUVXR1C9cILKx4rGxls03IBqTjiN54GeB+JclEY87fObq7Zis+TSRYvZzx9EXPNoKs3QLvtooBiqpYixCKAOzEhGaGhGEPDRCRAABA1GkVEOqJkBpchDntJU0VEFCJEbwbGDFybuQfTs4HWf+3ZF3QymRWJ0bowmCQX5KpnsWXTWTHPSKCMDh6TaA/zkzGf+Is1xT4Hh+CFuef6qYsrup/XMGwvlYdgqUHv+XebCNeyQRDQgo9MPw/ubh2x8+ANKvP7t++/pVUbCoIKGJPXzY/PO//Ouf3j08tj0wIxITV2X1+tUrANhs7v/w+99H0VCxU3QogAG0GP/w/qff/fDDX3/x9avlGZQVBeHAgRL4b1E3L66uLtbrcrs5xj5ToRFMmYvAVDAXzE1RNKFoiiIgFEmpFBl6I6LEkEQHPzEhl8WgQz/0onJVVrBYgHT72IuKqR73u/3jY1UEaBoARFEQwSjD8bDf7dv9IQ7x2HaHw3EYhmGIfTf0fVS1oghhuVgtFmer5bKuCgSLQ8C669r7x812u/nLr768vrpigKHvISKFYGYoAqrrqvn1Z5+3bfvvHx6k74nYYpRhwLIUiZvHh0N/LKuSidrjses61bg+O6vquqwqCnzs2pu7D4PGxWqhIIfdbrFsiAOo+QwwDs5K7rzRcO954NA0i4uLi5cvXtV1paqXl1cvX77cbDbH45GZF4uFO4idW911ncsOh8OBiGKMTt0N/o3kkm9+7iCimvolbZZqFS9gXTz2YMR6tVpfnB+228fHx6s3r0PBHSiSzyuyBcjgYxzNScU7Sh3mBwsxcgrPUPUujzLpRVT6fuj6frfftcdjQFw29dnFRd00RhCd6oeAxEiUE3cnNqYCIpMB9ENEgM3D483t3dnZ+du3b6+urtr2eDwe51KPgnEII/eJAjmt+PkIeBaIn19/TsuVpADb1BjP1l2TgkaABoQsiKoA6NHjTg2ARJJ1ZsF8hzzvU3yiFR8P2idysNlUFmQDMarKXCybV/lzjXjyYflmzSy3B/4zFLknWQfJY5RDazyEKAkHGAOG67O6LLhTGFT7KIPqvuvD2boKDKZqooaKaOrqr82xXgp2Yn/NRhCbFlNnD/Qn+86Y0bnq1qFRVp70WAJCZAEUIyC8H7qmbJrPv1p/8dUZDEN/RNECA1ElVPbEfcBIIEqsyYrq+XsRBDUCc2Yro0ca5VideVlmeUMaccLYnuxzkY+oPTEZzEO70SwTiAE1/XK+pnyNZpzhG85QHBNd170L5uS0zBojTHonAIJH8xmaogEZcDojM63fgAC9CVP/4SXIGkcARYvGPRUNcLOq6WwZmIrjUVq6vnzz5jd/Uy/Wd/cP283DEYpFs142RZADxO6435mKgZgJIQQmRhg0YgqSJi9PgRhOAzc+Xnuf8qPSMrt7kmiEBJuhiqcVoPkl5h2CGoARF+lCUnHFBALljMFUipgAEYFIhmFoXv+jWe+tLp1YlFFUUhNQUZToUUzMx/v97/7jHx43/a9+9frNq9fLZjH0A5oRpcx6S9HP80Xw0aKMiCSi7bE9tsP+2B2OHSJzCCqKCK60zfzCaSqRRJq0kgWBOS/qURyG/eFQN00IYfYJT4bIZ8TEL6edRkQkVfcl6txLOArEE+vtdNx4aia1J6fk6YTyFBfkXBXmUARijpHGoYWZEeETs/AnXFF+HeMnzsHpLZkmiGIyMJ7Ixjablc7F5VHJBZrFADAnoTedNxnfq+q5PcSESGaap7OgKipiOmfc5F7AR8JG6DvzypCoxIigJjEUgREWHIY+fn+33Wx2QeHvv/isKIs6FEsuGsAC6KxZdvvjw/F+s3lcXVzcHneHPnaDmCXZgpEKtwxDom+iTdY0IDNICxuqamQuvOKTYSsgpw9w/IgwGLCiOP/IMzEBjTSl3vuuLRESuicXDS2KiTrN033XgMDEzFyEUJcVl0yBB9U45noSuVafftAIxARmTp9wwEU79BjoxavrtRkQMGFhuDke/Oeq5BAB5Ey1VfLFJ3K4cHLs2TyD0480QcRAOQ8PNTCF0sVuREAiCkwBySPXAhOHUBZFyVwUoWB2MyMA94qsKsnQCEysam0vu32/PRzPq6WKWNpZtxAKIi6KIsYh33fkNHpUt0ameoiJ265t2yGq+qCl76OpgpFTqsGMGOOQntqUXdKWIiE8iZQiCKdhgK8VmdsvBXKGpCoRu7ryiQJy3H0nl6DTTj0RXZ5fHI7tMES/R8azS/MgSlHJP41j23W9qTKz5hoFDYe+e9xt6sUilCUiQaps0cge7u/v7+5Xq9XnX3yxOltHFU+NMgTxCDI0mtEERtQxgJoyskdToNlzR/3LeVEigjKMax8wThbsP9nL4Kii5qQsj3kEn1YqgoHGIfZ93B9aAGNCJgwh1FVdFMGHGIGQKKhJVGW3VKRsFo/mponb48U9UlrUGydWNqVxYKIiGQCm2h7RECYauM8zCQgpHyKEhiP6LXlC1B/06kZgUDwdiqCP7UA9QwVmU860fGAGyGqAKcTDQEQN1FO5AcAIVdMaietlqr70w5Z2/yA9bwENWAwHke9+eP/HHz90Uf7mqzd//Re/KQKYCTJ3UX/86eZ3//LH2/t9BDRkAyq4WC5X9w/3Z/frwHR7c/PjT+8phE73dVk2RREwRMQB7H3s/rc/ffMPX//1+a+WZ01D3CORqchgMaqGalFWV+eX4aefaBgoPXAUFMA0AASkAikgFsx1XQewgChRZIhYo6km65MxATL7so1VSMKBzW7uJB4PFVNoFhLV+ogC/aEfFkOA4AYyTwe2Tm1QGaRr+/12t33c9X0fRcGoKMKiaZbr9Xq9qpq6WSzWq3VRlE1ZX67P7jebRVF+/hd/+asv3rKqDAMRYlVIjBKFAZA5EH1+/XJRVdr13/zpW2MeELq+s8Cmut1tj3c3gFYWARTaw+Hh7nZ9drZcLZvVgoqij/H9zc2+PVTLRnTYbR+ZcdE0gGQah77dxBiHSAjMIZQli8YoxHR9ff3y5avz87OiKMy0LIth6B8eHo7HoxdpdV2v1+umafzO8uOpbdvD4XA4HPb7fRwGJr5b3Vd1U9eN349uKFbVhM5HxBTvxuS4EpzRhQyI+PLldd+2/9s//u//dtFcvnxRAIIIgFKg1FpLKtgQf8ZPYFPAVPodPl9Nkx8VAETsDseu7fo4dEPXDgMV4eLF9aKqy1AgUy8mUYFdvUZNdyWpGoyJlEhgNvSy3W3btqur6mx59g//8A+OG95sNiGE9FjLFQnT0/K1H/rN4+bF6y+eD4Jngfj59WdTiEFTdoDv5E5rrUTZOKyj1c4gi3DwtBEZm0m/4fP9bj9n1MKPZdm8eDulcOaC/clkLO390cku8JNn4kx0O+HsPBGsn1hIYJ5rD2OQl6GlyDRfLVw1RVUVAiRqvZoYHBVi0XBgAFXzughnf4c5Q9Io+9hg+gdO8Lo2wnA9wQcBAfhkBkizBmXyvSkkI5hHhKO5JEc0EOe/r9CKGGAARuXBKDoxKpBEDcZeSAoYMDKzwQluzzdQR8vmXG6b4TWf/pw9SMXjtt1oRWnnRS29qySBJKc00uxysRyA6Jo9QdpYs5zVhElnBodMuCdn1urljzan2OAnOcUZ3GsKJgCKqElTQYOgUB8g9sWSVldlCFr0ix00Zy/Kch14QXhUDYdWXoSaKISiplAZhVH4Vo2gAmZEgJKLUsvWaP8eTtrUU9bEEwHrtBPwalWjHI/Hze0dss0BjwRI5LtURDTipNE7aHT1CgAAxGI2WSSUZWpCDc2F5qyKSQREyGZjNCVFEARiFMPtdv+v33zbD8Oyrpd1XYQgXQ+qTCA2p0V/YgaSHiEqQ3TmVaciRRn8rXjaLxLNGXtPf4ZO/GQiYjc9etJdWZYeOTVGqnim9vMJ8As7zWyU/j/KUjN7OqS0kwi7SSR6ejPaNH/7KMgmj+UImZmYXXDLc0l64ll+MhCdHF8zD++oEec4LPQwGfjUifnJuMv5t+Y+2p8RFNAXRlwaTnFbro3NTsaJJkFANrHPiSgfYAQAmui5vuGibFgzVgXtRSgEs0EZQ9O0ffev7z68PFu/PV8v14vz3bK638Z+QCDiEFUe99vP33x2Q3zout3heDx2ZeCqLhGIiUVVTMHMHwRekCAaz1CvmoF+TB4zm6J4sgHV+Q5ZYkNAAw4simoa05TSzPwp6UKFt3SE7OwPGCyqqO84iIiAMVLgUBRcFWVZVcRojMwMLiF7tOYo+afMJ8NxvyXP3yQPosEgRrGUDIGaRGnIqzZKRInvY8KkOYTTrcz+5Ccf9hlQIMay9Ig1fzRyEchPJzUkNqZBzZyBLAJ976cCmjJBWXCzqBer9cKQgP1PQeZ1qdjuOOx2nZw3kF2AmDxNMPq5M6EXx7psTBhFoN1233e9RB0rPzEpfL8+FxhT3ZRXR7ITGBBTXeFgB4miKrmwUI9NUBERQXxKAz9Z+03eSQJD0fQoUTUOhcheE29NnSIiIhK9PAYuQvLY971vFq9WKyZSA1MTiKIWQlk3jYEZqH8cBChRDvvD6mx9dX3drJZRZDAlogQzF2/A8/pvviOnm1gVUrAQzl3Pz69fxtBzXldPYL3TEmreG2ly8jKYIlJqCnTCjZqBGpkBh4INxNqh60CFiMoSgGK09LQLjG7qQ0AFZFAEAjNRH0a45ors4clmoh6ePaMgn05fMK+zGMyYMDQfzxgoGNmUWJ7xxWMoK2ashl/wT07A0eN/Oht+EpDiOZTmqxvOlLB0WwJl5uBoWM5vj4gRgPzPjume/nz77tsfv/nufXtoX52dvX35ogoc47Eoiz4O3/zxx9//8d397ghUKPBgioYFFkxBYnz37t1yuTCDoigP/VAxV6FkwCH2EUyZDeGHzd3vv/3Tm8V69fIKTBSiIRiSKsaghPj6+rqpyvt2Z+MzQhMLy4V+UNN+YICi4IIwMLIHi6dAQCAC35MhRA6MHKAGror6w0/7/e7QdkjEHArisqiqsgaBw/YQhyjiM1AQFQOEUFBhzWKFXMRBRA2BQhHKoqqWVVWXoSrKpqoXJQO17eEP//qARMvV8ny1in3v4HWnOmKggAEDWJQYhUyaovyLr78OHN7f3e+GXlWiRI3D0Hd934nGoWdG6o7tdvPYte3hsOKHYIwKcOz7XgYCKMqiqkoZBikKxxYfj60amunZen1+cUnM+/1hGOL6/Oz169er1TKNVRTatt3tdoeMJ2bm5XJ5dXVVlqXbhP10aJrGiRPOKd4f9vf391XdXFxY0zQjntjMuq4bhkHEw2/TSekD49GqAwBRpCiLq1cvF+/fff/D91SE9fkZuWFHDNnPP5p3jid6iD3tzC1vyaSkIY896LrN3f3tze3Q9+cX5+vz83qx5LoIRUFI4k5Agtl2ghkYSHZE5LZTJPZD//7mQ9u2i8Vidbaui3pkNI0spvn+sU9h/ZPZbDZ/+MMfAGC1Wj0fAM8C8fPrz9pU5xhzZwSMqm8Kukp9FyHMT1nLjL+Rlzty22a96mkI1CfnWnNZdpacPhUW+FE7bT/j+JtF35xW/LPm2H4+1P4jcgWkHDAbiZOeqKZkViAFZiNQw6ikSDWENlQdWgSP3s5iFT61+NqUQTdlT4xJN3mFfhZjl8aIeKIPPk0cQjfazFBZboNBZI55Ic2QjRjNAjIiRiMhNOdvMaMwqBqQEQObkEvClNvZjLfAEyVibs6CeRzStEmdOhfvhFMMBWRcGABZikV2P6inZ+TEC7I5DAGztdtwtjULE3t6KqnnazV5CTV7zhJNGnPyuSWGSEp392h7QAQUQ0NGKlvFDquBF1UokbuqvkAo+05Vh+OhOxw6aiB2qih9NwyDGpCv8pFNxS/hCefEpgiQT/lHZhvoH1/qObDIl7wpDsP93d2//O53CaBGkGBtqjYxKYmYAUDU6qqCHJ3g1ffYvY/thDsmxjuLfe8uQ8ETIpwYmYSQyrCo67rA7b798acPjHK+rprKE+qSdXOMzrIxCmkU6xFw3Fl0+VbVzEIRqqrWhHkkOl1MSD/K+dWYumniwIAoyRRpzDx5LeHJMOPZdfXLUYjz9MU+GvidvPRpntN8aIRPhoinh6XhbMoxPr3Tk45Sxs78tlY1IpivvDw58txJCR/tCtg468ms9/Gd/xxxAmZW4vyN4wjlP5k82dM9lSmpLPNiRujwJGrPzx9PsD1ZHRox8IYWC4JVXe63e0s7jRjBFovVrj1+d3+3XlRXy/X5uiuIuiiKgEXAwF3XlWXBZWil2/btvu+qPoQiaA7BTSav8RmSBoCYIpdyMpKakjp8aJbdl8+M8dsYefnu46WUcpQ/esQxYA2TXg+IIFGGvu+7TiSqKTIRhVCEsijLoixDACJ1GgVEF+BDCNP0OwPlfWjn6zGGOEjsh2GIMTrA33IZgmiAPrnMYmGujzK308efrmdTnsqCAbIRYuBQFAUXzEwcmBw8mgf9syg0dUU0taekphpBROyw2d3vjue9Xlxfu/0HwJ3pLCL7w/C4O4id+V+KpwmqPksYTzacKiEXcE3BdtvHru/zIAQ4QYrzCDUXpG7Jn+Yb0w1sCoqEVVWOQO3c+c5EJlXXlOFT2ZUjVml8IIyg7aosAUBFVDWE4HeGiIpmZ72Nq2bpRUgqkuzhIqpCTFwWrihTTrDr2u54bJtFU1WVAgwJkTR9X2aGelJEOp/Z+Ruohiiu9jxvw/zSWjObUhJOEqVmiLZTZFdm2Kcls1lQZvIBmJpGAVEDJA4hWAkAGiOAGdIgFk0A1ffeAmOBwAhMEPJpxOONbSl4E8EdRKqIDt62adPjtBL3+s4mT4kmE8zT4+zJiWMfTXzHI08/lc443t1p8Ek0tVjJfqQwpWuND1H//Z+e7FraGaAp9QuDId7dP3z7w4fd/ni+Xv36szeXZ2egyozHw/7HD/ff/Ond/eMhAoeqMTUbYlp1Muv77nA8HA5NXVVn52d8aF++flUCHbbb4xCVCcqgSg/t8Xd/+tPbZr0uqKlEHJNBwQxjGIaqenl9vSprsuki8UK7DMWiqZu6LIlUIoAxUVkUTd0URZHGeFmaDPnU8G4NEAPC+fXl5eVlvLntugElFuvF61evX12/LKsKzURkGIa+60VkkAhIhhy4rKqmiaIJYJ+qGi4pVAEY2779cNv3x1b72DTN9YvrZbMIQDIMaIp5xAtmgYmJDcnU0CwgXa7P2levumFoNxtUJc8CiIMbw0VETQys77vDFlUVixDRMFA0EzAGJISyLLr9oW9b5lJjVAPksqnq9Xq9XCwGkRCKqm7evHlzfX29WC2ruhHR/X7/+Ljd7XYi4hbguq4Xi8XZ2Vnh6X8wlUwhhN1u56px3/eHw/7xccPMANg09TjMiDH2fd/3PSHGKCISzABPTfGpWKN6tfj1b76+vb398P59CNwsFgGpk4hgGMgTJscj9impUtNzYuR9UkICxmEY2q4bhmFoO4lSV9XF2dlqtapXCwssTrV238PsRkslgqZqdyxlRWS73R0OexFdr8/Oz8+rqiHk5HJADO6iOLnZyXFb2+32m2++ub297fv+q6++uri4eD4FngXi59ef13I1b5HTkZzV4VNnRX5Q5XYKR57iGHsFubE8waV/Sh22T5WzTzrkTyrKH3fIJ0CJT+rH9olsesvp7/ZR+ucIXPfHYPr2LUVyISiR7/OzuzDFAAiUsU9Z6GM2+jwJ7IkDFE/FCc9gz2p0jg5yIdSeoIntRCDOUvy8RNRsS0ZGAs0+3Az+A0ACMkpEPzQk5PRvEY3YWbmEHCB3U9PX1snD/JHTYZaHPiao4izKG1PMPSQSiLuI0Q/FE10Hxo2Y9AFmaMRTifDUlIpPLrDJeJvn0giT+XUyAuQ9tnRB4PhLZggYBtNDxGOkkkmEmMru0G83u6Lo9pvtcbsrQHebh3Cg/d394Xiw8Vr1GL5xCjPqFKeC/8el7XzB/OkHY+OVkvLkEcHEurZTjQaGZAamkqyB6RhHAkA1HYZYV/X4uYhIHHowx8KQqol4iAFm/914dyMRMgeY6HgBuFDGal2/enH1+vpquzs8PGzrGl5cL6uKEvkCTdWzMHF8QJywpk+Jby5nhxA4lGVV9f3gnMf5bTtTytOjywBUk5MRfGCiSfumFOcy1+aSu+1ZH/6FHWn20URwFIKeWIo+pRE//Z2TSpOTdSxHmc3GU+MZB6qGkEPSUodsEwjyU8PIGaI/ZdnNfkMGjAJ+Yvb5Ecln/P+jsDv7GDTZNwCfuKvGzyNPRsc5WmZRnNQLNvGGEcdOIf06JY4jqjJgU4aSse0GLqqqrHRQIMKqvN3vHg77y/XZer0Kgftu6GOkIpRNMwwRkdZn6/ah27btruuqghExBLbk7/RyQ/3kyusieHoqJRIBKFJyrOZCxeZNF+S0IfARJjnTIGPK/XlEHuIDiEamKqJD1/ddLzFq3l4OzBwCB2YmV8MxUXxBRDSl03smnWVS1ARk9+YqqsYoIqaURnFjGlOaoSG5XDom1LrIPM7CEQmZmN0Q5rN2YyIm5uDiMAfPU8yD1mz8Mcqk+imqMQFGJcZ+OB779tjDQ4RQV1VZlSHx7lkF2y7uD62oJl+3zUa6kIBIp2ObHJaaUqB0fzgMQ9R8eacndo4UnqaSZNmMDKcXsHpuRFEUKjYKQ+7qhXQimqlikRN1Tmnj09A2jURPDFlFURCTTVwaTCKTqHqAHySWCOUXIvq/03QWKxFSYAUXiFPZcjgcJEpRFEjUx4E88CcP+xP6Ch1hQZNkMLKSwFByRqXK8wnwS+rOdGrF8tjOnqRY48fdhPPnIHOysz+EfEQiipLCNQ2RQiiYKHI0E0JSA5PUvohKFBJCJgiEEcHX9AoCIuBxmVBTz5Gepb5ckGWkPAazqW/w9blxD1Iz2XBaqX9SDJ8K4IYjTohIVenJ3N+TAE7KgTzBxDFzVVWdc+PPacpdlxmopOJRzUyzrZPGN4OghmRGhIUBt1384d2Hh8ddXZdvXl68enVRlKwmIvb+5v6b7366edgbhWWzFCqHrkNCx511fde23dD3Xdcvl81qvV4tVy+urvebRxGJUZA8wQw7Gb758NNlsyxKenVRExohFlwgslW9mlyer8/qqgRszdxd4x9bEcKiblaLuvKhnRgYMoeyrIuycrsuIhJn8sFpr4dE55cXn3/2GSLvtjtTuLq6fvv2s+vLq7IoAhMgxj623XHoh67vjkPfDl0UEdEoidRlgHGIUQRAEC123WPXx7brDy0BfvH5501d12VppiagngKqZn6NloEpGCNTovMxFWfr87Oz/e3hCDE6c04lIhgR+QKik6D6vqfAjBBB0VggZZ0HNGY2gLbtijoaMRo2ZTi/OL+4uCSifhiYabVaXVxcLBaLZrHgUMTD8Xg8Ho8HM6iqCvO2SgiBOYQQ0oLmFOcrbiv2BAoDbdvj4/YREYsilGVp+UL1WG4m9DpBRbNLHk9bV8AQXr15I6r73e7h7h7UmqYpXJowVBgDcKfoyGkq67u8OXrF1KIMwzAMfd8PQz8MIgKiZVmslhfr1ToUQcA6iSYGTKl5hMlqcGIlzOtEUaRr2+12F4dh0SzOLy6Wi4XfSJTrFETKZWUiiavKcd/u9/ub29t3796JyOvXr1+/ft00zfMp8CwQP7/+rFVIAkiNcQaTAkyGBqLikSMAsydWbsMRczpn6mY+Dsn4CJ0+GXtN57PiuXMqh7d8YiH3iSj8sYZsT7re2S+fvA34Wa/ZuC+hkMEENtPH3WsESqAMjGpgEg3YCoIUVWc0y5LzAg/n1ITRQZO16LnIi2B2OlP/2Nn2qZH76IKT1N8TIQcIpkKICiaav7ucI5fAC6oIFH0CTKxEBkrIYAEojERNdIXZeM7gxNmVkVxLk0A8WsrHpHR3DCtMAwBEtdRAuv5uqUtNhA7T0TisM3XvRCN3ahPM8pu90lMbjcYuf2durZF/O9nVgCND2X3Xph4R780tAkTAQz/s264C0q430f1mu6k/FEVx2Nx3u81Ru3uVIwzd/ffx8EAmjAAm5kUZphKaAKfgabPxm/mkTPwkjPFUIrY0UwBQ06pavH716q//9ssovZqKiloSSo/tcRgGAIgiXdf3XR9FJIrEGCV2Xd/3Xdd2EiMAimiMIlFMQFXjIH6Ui8Tu2KoBM4ZQIqApxKj7wzBIEZFWL5p/87d/+d/+m7/ZbPa7XX9xVr99c7VogsEAEHNULiJy9n7rDEwCOamIwIAAQwhVhUCBuSrKKkZJ4wTv9gkBMelfOjc1+kQ89n3vjzDmYCkxgT65vjABU55fv4SX+5mSXHuK4IEnbqOnSmtG3HykDp/0qHTavjrI0GdOef0lJbfBLIxuumdPZdyZzuU6cg5Jd2lJlZlGasaTI+9J6t0ndOcUUufUnQRq9XGnio7Re+YJPurt3ORKi3HQFFCbiR3JMJb0chypG55amd0p/r2wk+SJzhb19vBQFNVqtWSx+7vN9YvLbjjc7XbXF+3i/DxU5fFxd+ja0NSr9Xp7c28qb968/eN283A4btq2IBi6/my1rqqSidTUTNJysUfEAiAoIVlILGeYlGybjtUxA9YMJGkSfqT5ynJKoxMB84Dv8UczYZ2j2tD3bdfFYUCikggAqAhFWYTA6Lm+mqJP1UCixBhVZYQKToQmSjhrHCU/BUAqioopJOCoSsFBxNCAUkI98CisogEYM86G+ZRpUEjJ4g0IlGUNQDEERc0Zhw5197WwcZKbL18nm6hxwcxclBIft8fdtz+sVouz8/Xl5QVhUEOJ0PXS9YNIrBhV/SZyl6umtZncv7p7mtIowpVvUoBD1/eeSDr2tITqco0aAhJTsEINP/L4W762AQEoMCS4xAQT9+w5X60nR7LmGuuU/m/5fsG8yQWucCFRVVZjDH16kiA6wBQx5nMsCS6eRWfgXjif1iCHEJhxpIGAmdp+tyfCsiwBcRgiqhRF6bvefjmNM2FLbnbMSz5qpmnX3jOHctHy/PqFCMRz203OJ7Gx0EU8ZfVl40NKWst6q43xpyimogqab3IEJkYOzMFZ6uonRBrBAYioIvlgijzGCkrCQMDoAxsHT8zSgg1IndTv+wycp/lAfjaAIZkq+np7WtPMhiP2EtE9yGjZN5Ju2xxlTX68ixiRx3/h6CMBmqBKlrYcTEEg8Y4xC+UURSCN4tDHNqgaSEzVkzhxGlb5cWOI0UwBKsFA1ETRm4fH7364Q4PPXl5+/uZqvSrMInC4f2z/9fvb7262QrxeLi4vL+8ftwftqrpsmjIOw+6wjzGC2dB2vehytf7ss7f97rC5v9vutmJaKHFEAlQqvjvu5Yc/Pkj7t198dlaXi8BNCFVRlLYAslUdLhZVHYqD9L7mR4SqRsRNtVg1i6Cx4lIjxMGkRAxFqJoQApkhgk8MPzL7EBGul8svPvt82Sz3h4OqXV1ff/b2dVPVIYSyLB3ob1FEpO/armv7oRtUuiF2w9APgxPfun7ohj4e2+F4bLf7YRhMhImX6/XF1cVyvSzKQACFMQqAACr40MtVRbIQsCQYXNism9XZ9Ytmv32Q3thxlpK4lgCmyEzMPAyDiFTkpH1yFp6ZuN2VimLXbou+r4CLIizq+tWLl+uzs91uZ6pFUSwXi6qqmDlwIVH2+/12uzXD8/PzGGW/3/f9YIYi2vcDADATc2p4fd2IGUOgsizqummaRlR2uy2ALRZ1UTAH8gVOAEUyDoVbwiUaZHiLe/8JQREEkMAQ4bPPP7u7uX33/Q/7h81nbz+7uLoyABGIMPccwNyUYGqlQQgFEYnErm+7vn/cbXeHvagSc900y2VThrIqy6IouCgMoG/b3W7HZSiqyggMNKdPAc5SHAlJVFRi27X39/f7/b4IxdnZ2dX1VVmWmjZsOGFrPN834TMtFMwhPD4+fvvtt7/73e9ijL/5zW++/vrrV69etW3rfevz61kgfn792UoQO8U4mM2Grv6MIRhBC/jU5mkIxoGQyVCcXkt8ukuLOPdxzRpjs49wq5NFAvL2vZl9yif1SUENDX5OUP45+Xh8P/N89gl45yW4W2DGQT4YmpqJQ9kLAlJUiINFNFWJMZIAAAXJuWun7jazaVswNbk5peuJ3DFJ2aPzKTXi4zQeP9ZIiIDMUJUQUFQ80ptCGvcrgKiN9iU0I1QAAA4CqimlkEVc003/lzXsmX9s9hUzgwhPHcRPzHmpAyXPUfPsuxHB7BeXeozfaBpSmHFMvOG0U2otOrAJjDTRQikJxDa3AILnYWCKtMO0Ga0oKXWKwMiM1diUTcmMTFEFVFHEYr879I+7YgFC3ZGHPh4evv/9fVUGJsDYPe6H7p3WODTUlhgZBVUQgZghRbWbAelklDVEI7UTO/FMFPYLcm69nwFbcoSzbwWrMdNivbj67DMfk2ewhRomEhlQXn8y867d17AliqoCmkSVGFU0NcZiMcau7aMImMU4bDdbMxjiMHSDRO26YfOw+1//99/9T//jP7+772kBm8f+fH15826z7+Dr6xefff62qYJJNFBDyuY0xI8x0JPyBerDCqayCqF0oB0ZGBJxCEQ0utPSrTrfZAYwgxjjdrsDAGZ2gzAHcpDxXGS350b6F3ieZWJo0m5GkyCON1TOtfS7i1T9oDFEA1WY5CfM/ARMZEQAAFSbnnnjQkDyYhFT4OTeh/F5CESQzxYbyfjTmnwK+SFEnJkl0RIbZoTWj+s6+OQRMUKZPoJLwOnyR0q8VgU5WRV024rabGNfVUSG8W2Lf4yWcokojbtUxFQkYV7HgwJ8LYScErCqm7OmvdkfEOhsvd5u97f3dy/Pl3fd8P3D45frq2bRgMb+uC/LUJflrcW77ebrr7+Eot5u94eoEcLmcXs8HC8uL8/PzwLSoJpJHmpmJr6ZOhAFQ0rx2pS3ZW3GrvVvExExnaB5JOD8ZcdIpVLExdNM/U3f9qBD1/UiEQirogghIBMRcVEIkIgMokRCTIYsqkPsRZSYKS0rGCAwEiIZ+hDPFFEBh2htN4hr00z+E1WAKIoeXkMkqiZiiY2RfcSWw2r9W05Iv1GvsajCZGzkI4gIJqLJMKaWDnykqDYbWKTRo42eciAKzYvr9eF4PBwP+/1xvz9ev3jdVA2qaIxdh+0w1GU9EcDNXdRqmqzK6cdgKXfORXFCReLHYx9VZym96lWnZo2eibHQYQCLOY7nhGpGDKRgaEZMSK4Ci86s4IYGyJMzF6fZkY0OQ0iY0TRW9nsbkRCZ0dGTVVWNe8SIGmOvQioenWcSo4goAoWAATEaA+hIAHO5DkxMwWAY+t1xt1yvKYRU4URRFC6L/KPFyUhhaqLdMPRDH4fBVAGsYC7KYrFomH5mCvr8+q/zRYzIPM94mYwiNl/p+7htSGKZfhyvAp+MEDdmDiH4xpmZ2BhinMhsKLkXIDONQohMxqiUFbHgKVvp9lVCn+SBr9A5pMebiXEQSXm30uccnvQCiSdmKQ+WktEmO6fH0/Lklecno7vEnJdgCmomJghIOtoY2QFq2quaiqkpGZgoEkpAY0IliM6u9x+BjQF9QIFFEYjbQd/f3P3rH/60F/vtZ9e/+erz87OlqUS1Yz/843/8w/e3W+Pyy88+uzg//+HHHx8eN81y8dXXXxro73//r90wACATIkJRBCT64fsf3n//Y9/3FIgCS5RAA4cCAx9Fv9k+/Li5/8dvfv/67Ozzy4vPX714eXW5rJkiDWSLVVPVhe775AFCVLOu67quh/VqtVyvl4uiDGYQh6jRO6KErsmuc8Uk7Kc5gxqg4fn5+fn5uY/OQlGWzKJDbPuuPfrPgYmdUMFlaApPFiS/htSgl9j2vRjosdOu74+dSOyHYbvb1Yv68uLibL1ulgsChKiecYT+YEeKIh46bQRRQQQQQpRhuVxdXr94lGHT7Q1tiENUMWIiLjkUzM2y6e66rmsXy0URWAE4FABs4EeKiMbQFm3XEoW6Xi4Xy9VyZabDMBRleXZ+cXV1XVU1Im4fNz99+HB//9D33cXFxeXlZd/3Hz582O12dV0VRaAUuCQiad1KVV1QHoahaZqXr16t1+t+GA6H4/G4f9jcccDFYqkqw9CpxqIIq+VqsVgWRcXOkVcTlVSfIEazXgVMCaAqi/XZWd92H969+/f//t+fnZ2/fvX64uUVVYWXIpbJ9RntCGCo/fDh9u5P3363ebgX1dX5ul4umtVytTpfLJdlWZqpqA6mXXekoQNEiXEwIQsqqlF1hgCFvGpUlgUAbLePm81D17XM/OL6+uLioigKRLTcwzKjmsV+GHlPIYRA/PDw8O233/7+979X1b/6q7/68ssvLy8vY4zb7fb5+f8sED+//gtoqSF1vxklqDA5idQrWzPDE9KgTTMk0pGxS1OQyEy0zdFz8AS/OKOsflL59UUlHhPTT+NEniCJP0mhOkVPjOlF83R7g9Nemog8lA+SLpz4jb5krwnt60ewv3lXIogAQBSCvxkQTanZ+eu4uqq5KJqsyBNIcQLp4rRFaqboWROAgEniQDUC32L2kJjR+G2WmPGYGsS0sqWoDrKTtC8LpgRKae8W/CjXcbWWXGfOoTesQDTac088bznKDLJJ4RMvNYC0zJWTJQC8Q5yvynk16BlEM7K1jRKJpDHF7EPDlEEDGfyJgGoKmpxk2UuWUr5JgVTRlEwJDDWSakAMCCVCMCsAKrTCIJgFMCY0dLtBD6bD4bFHWaiCHJccj+02di7ASwEazOoCSxgCRDZlM8K8ImiUIzoQZtxjNwV9fMXCR1vkcwIdwvSt2ZxgYgKgYAqiKaoWcBokZNwpaLqtDKCYFvCSDWvs2xVQRUENkMxUYvTbLB4dlmW77bGN/D//4/e2iaLSDfa46797dyOKzaJcNBUiiHjRBwzpcp1DyU/snSMjIvEwiIEAOEYDgxC4rqqiKCY9wDMZyObqObpON2pDAMzcLJqyKnGOxz4xoD2/fjHzTtP09Dg53uZjTTdkjJedjnecCRGl2d94p43mdPN2KSm8pgbiUTDqLS+pisQEdiPEUbwbs3fyOThuoM9v+ZQdCTR+baaABPAzQYpTcNzp2o2dvkZN3B/AY8AsIrpi5RBVMcfmo2GqBVx3NhM/hYkoPxum491JtW4rTmQGNfQoISDxTFFmRlyv1vf7rj3sq2bx6vXLH9/9uGu7Aqk+ds3jtqyrAgmGvgpcnJ/9+P7d7eb+L4rfXl5ffzgeHg/tq+USRQ9DW5THRbMoCiZEdRXDPJgL/edmpml5xzKVliy1SM6cNFMTf0qAW990BtPyMoYJXRokjzGaLgWb/x4mDgVlgVgB+37w45mZbUDmoCoxDipSFzUm+ob4RiiZiU/t0MeHKArbQxcVgVw1cAwxEehIE2UAZcJxBylRTxyVk48EJJylRKWhGqIiDGaqyv49GdBIH56NonE2dnOpJX0lIQQQtrIskBdDHA7HI9zcXJ5dNCUoxb6HQzdcrJp8V6VLKUGdUxnl1kDMYChDVYuxF9n3Qy+mltIegEBNzIIBJSQoWsq9G72+Zvr/Z+/PniRJkjRPjJlFRFXt8DOOvCqzzj6qG4MZ7ACLxQJEiyXQvIMIeMQ/CyIsiLBYANNzYKeru2qqsyorMyL8tEMvEWbGA4uoqrlH9nRjh6h2ct2oqCgywt3N3ExVRPjjj39fzqid4oSLJR4UHIADKb0e+0vFGXtRohoUpqgrPZGdtXS/kZDI1XV9PB6HYUgplX+h7PxXts60I+TS8+FJ1BLLNZjOdDmCUkSGcWTRqqrzgqBgYappjDZgblAVcj6O4/39/W6/S8zNauXNIA46gCLiYedAII7Dp/+0fUn2+aE8ED+2/qt+xEXyVCI+naF8Pm5yegSyKzxbIJntLpXnP9UMHZLtMpgHJVRJhEmjgCMIhN6BU+OjoxQvDCIKUqa0gACQCgOgAk92AbQhCiHNa1T21yAC25E+W2MQT+Sq0v0tQ+wIKKqaJA+wlkNwzj0XJWceGhERSWL+4nwUJ0LnSME5LbB4mGLDBYCA0HkFvH+4+/bdu8e2vd40X3z+WV03IihC+/3ht9/efHg4btabTz79ZHu2ef/+w93j46YJP/7xl5vt5tvvvhuGgRC9J2uWxRjff/gALMwRCASBLdgSVFRqFxyhKgwqN7Hb3bbfPdz83d3716+uXn/ytjk/Pwjf9O04syBtg9ZxjG3X9sMG1ytAUBFXeedd5DiOQxXcab5hFgHznGU+ppuknutwVR1jNKiO8frt3REAkKTCCkpAxhkRVWaRxBBFWcZ+lDHGmIahPxyPh/b46aefXp5fBBeA1XmnAUQEch58PmswChAmFAEWThxT4rGPPYDWTd2QIDkiIEcCKAoxJRBxztso4WqzbtwqiYICOfP2kqpWodpstm3bi4j3rq7rGOOYRgBYrddnZ+fNahWCV5D7h/ubDzfDONZ1tVo1dV1ZrglzSikZ6d57c2DbqUljjF3XHQ6HYRhCCKvVar1e+zGmxH3f9/0wjrFppJgZFABCFaoqhOCne9Y5N92whKh5K0CLib18/Wpztm2Ph7ub+4fDroeIwQORc+TIkXNZ92dOzMLM3XA8Hru+XW03Zxfn67NtaOrQVOQ8EIxpnNqLtjEZQGO9XjsiMUywgVYwf0bGzjgejh8+fIgphkAXFxfb7bZpGiNYLRxOpAoinBFMiCIyDuPhcHj//n3btr/85S/fvHmzXq9DCOM4ypSl9FKcvQjEL48/bkVtg/inp5Iysae60F4m/OcJDVezbdNWFzsH6LRZL1I1TtTDJ9bIZSv4VP/NkuoTETnjFJ5xJLI9d3EYml4/fqy6fqIPzT9cppMXIkyp7vNhLP86GepqgsHkQc5HnYJ6FFBXgmVFRNGVkstmqKx6t2FlWMJ6ZxqXlL/OQ5eQn49mmwAikLnNEATBQclgs09ICRVJEAUzLRMISm6tSm4MCICSKqltB17RARb1WQAIBB2ceF6LYGtgjeI9eu57FQGifLzSzDWhYtiztjWCNT4REB2oMORwMks2NiWiENUKI2O+LqGUarkIzekZqqgCLATqEEk0gHrM4m/wVJFvQqiDW3sXCCrEmrBW9aAe1IFIihyHwyPq2GE89ru2AqChO6O4XXOKMcUBUSuHK08VCOlIKs5sXaUMNRdGHoUGLPAKgyWcTIX+/f73onhBGVYujiRVYVFmQIu9z2BQLMa3uQ1RdP4cwFS8VAioDudw2hxOSIX77AC89aXHKnFiUOd92JxtwDsKwIRR8NDyb7/+AyJeXJyt1mtQJxxVTHCh4gXXnCa9TDBZSGkTtVzBAZBoBNDgAzny3k8LgcI0z5698HZd2XyZwb8AwDmq66quqpl+83Ls+OHuZ1Bmy8ty9LwNMK3+pOBz8qiyMAsnYGDR7CpilpSB6SwcU7QfKyIqPEFpLMnRAaQx5hZFBjHkUhg/9ngu+C5fapn1p3k7Oc24mxCrT/qgHxWIkcq8fd4MQECZmYVZLOkKFqq4MYfARgMVS0yo2jTCYs9VNZaSLRTCkufyFcWwqBaOolCvVufnZw/74+Pj/eXV9dX15f3N3QNDVQ/brse68rWP44gA2+22rurDoe27YbPd3lX1cYjVanN1ftYd28qHaQEszyXWqSQ1soHtADkqUFSAFYhQFqD6rE8i5UYoEKGeIrAQEMpfWt9RdO4U2HkEkdA5JFLVY9t1XdsOPZGrq7pZNQBlyjUlQF1tVkSEpIoT7dKQ1RldxSoxaTsmcN47BKK8bhMV8AgA2MY+GaKnbIVTkPWsEk+u7hw/l1dYmbvWU3d3QUOGiXsBoEiS8VGSO5rOo3feORqdxHH88OH95baCjUvrdUyQWClruKZww9zkxSn8uIz0lCdkhf2h70cWRSK0tgaLuKmjqICIpUOcA0tneQsQAcVQDixc6lvvHZI1TI3vWCLvVOcq9NTTMDW/y1sxeTclVEEOksbEzIXijI4cAAgLoVnmBVS89826IUcL4/8MNbOnnm7Ps7Oz9Wo1HT7tn1JKiKhExjA7Pjz+6m9+xcJ13bx+/XqzWjnvc94Xp5hSd2zv7+9/85u//Yv/w//lzVcvO8EP4ZGDDb07ObVoqYsA5kAHfOLHmMHizxvhT85cOaOsmM+dIwN3q9ISQL8Euwg6BeAcM12iuAVQGEEdqHcQvPfOBetjqKIqqToEBCVQMkOvHYtpsgiUHOrpN8a88KIq4hymiSB5nSr2IBaxvl3m4lsnkGUhtFt5VdipKFAoysZkI2dUoey9ZSlbS7HFlNwMlwTR0+HY/v4P3737cO8c/eSrH11fXxMqgksjf/37D//+2w9vX7/54ssf1avmN7/73Tfv3gfSP/mTn9Xr9e+//fbm5iYE7xwws+3jItweO+/QIQiCmX6QMCnrwFjp+WpNlR85HXk4xrQb+5vbrtrdNd99V61XyfuHw6HjVEgdmQbYx6Ed+m4chjh2PaQo2+26CmEcx8H5ddME7+ax4EXJXxJHvI3gTEuTFD7VdMABxMTJ+qyEgERi3iixqURWZkoCMfXHduiHrut2u91+v784P7+6vCZwKSYVmzNUVi4zX2qEWlYexjGOcYjDOPbHbuwlPnb7tmttjidyZCIkR/ZSk6SYgvMImBInZnIeU2KeLiVQFef9dhtSEiNsgerxeASE9WZzdn5xfn5WVZWq7neHD+/f932/2W6ur6/Oz89VZRz7rmv7vquqMI6jKhtzviSX8n6/v7u7e3x8NIE4eL9qGnJ+jHEcx/1+75yzmLthGFKKCBC8r6rg3Hyz23kNCiUqp706L6LkyIcQ1s3q/OzqzZuu6/bHwxBjSomZp2MMlYpYVVdNc/bq6u2PPq/qCr1HQiW0SkzyOcg4LaCqpNnKYCl0S8omIDjvqqoa+uGb33/z17/61Zs3b96+fbPdrkMIIXgiR5R3+jJcbD8AnSNVHYbh4fGh6zpQuLi4+PyLz7ebreXq5jNb2aNf4H8vAvHL44+uEM9uzZLiok9CbGCy257mQmWIK56WJkuXEcB8tz9Th/E0zQyeARZLWPf3xvJ85Nf5iHCscBqAu6gK9GNdeyxHeXgiLNssb8m1Lqhi+0qc305dBgyfnK4mdDPgIoNNl4jhrGbnNARE1EKYmJEd8xYigJgzw21EOld3GWpvtm81j0wWYnNsuk45pwiSTdGAIgRKYKNH1pGd499USZEUgMwsRnMk3YkP6VkmoU5QkZyAAcvcwzIrq6BACKo2zmYCJZeBb+N8ZraY6QMThtH4+fkDE0E0a5KaUOtAA6FHrL3zgJvgVp5qT8H7VXB18E0IlXe1p0AQECuESsWBEChJkjhyjO3Gpa7F3X3oWh1GSkNF7LwwMKM6AgIOxE4TaLL30JJkdSnGalH+i0VNQD4iFS0t8x8xjZiKg4ucqHLJlU7O8rLFJykfukx/R9ATSsMs0i7bQZN4JQoAzMwiaP4LFYGcGpkE24Hvd3sf8PLysq6aSYUApJyJAifIZc1H8MXIwdIkXdicCOi8AykpGgvX+nylLeLCnt3QS/AJnMJpXx4/sN3sIyXx0oNviwQLjJGPQ992PUsCTcojAQTnvK9MMVRhFSHNxFIpfE+yxDQi58iTc4QOsXJeUiKFdrfXxKehnR9t9DylxzznCD83fH00V/1JtvtSGrbeL85+SwPMgJQQO50g+IUdNEXjCRgHtdinEM2COyFRl7eYAHCJIciKsxWJLAwoSHXT+D4+HI5Aj9vNdu98P8SH3X672Trn1bt2GPpxXAM2VX1///j+3Yez7bperWJ7hOBfvXk9bto0jqDKzEpzETlP39gzijAIEIhpt2VqQSapfRpynvD5S5F0IlwS6Qn1PhMSEDGzblSZE6uoSkopmdwuSkSVVIhoDiNV8d4779GRggA6YxZM2ZoIDlBEZEwpAaDzzkRrRADwiCI6b6EnsBTA04vn5ILRMjyMJ40RgwzljYC0xLXlqaXyfhT+YZHTcXIJiNpEExJVwQlKGsbD4eggDGcVGA96gsxP2KzchpZFlBTOi7NzMQ59H3O6FU4fVCFJZ6hqbv/j/ILKej6dubJhEBw5Hzw5VwZ1Zsf981vyFDmxuLkWb50Bwb335horsyx5aH16BrQzE1EIARCZ83tbCn6cpvtNSkgpVVXlvP9o04iFlXXo+5sPH4ZhOL+4uL6+vrq6spCrMhYnFXPwPgm/+eRtXVUvG8EPZDtTERUH7qSpvTy8zRUEPi+DnrgNnu0m89dQyZCxzoj5iItw+eyACjhbDPIxHXGRsSKGzQGOAkmkJNQoASCqR/AWcGc2BLGRRrucpzgTnPtH1tsqy0HhxucsOvP+mxFzauUsGUsTrH1aJ8sNaEBvk6WmKtjCLWyUzaRKm9EvtP1c0LoY+fb+8fZxrwivLs9fv35FSI5gHOKHm4eb+/16tf7JV19tLs5v7u8/fLhBws8/f7veNB/u7m9vb2OMIXhmjlHnKUwEBeVSGFoTDEElCXMS5RCqugpptHkEGBTHKEc+Yj+o91EYAD2S5BoUBTSBJlAGScLMMQ49EVTer5tm2V2bDs5lkczKnuY+bOlJq0Xgfc/pBAAsG1VVBJglpZTGxIk58jgM7aFth/5w2N/d3bdt++r1a/I+chJVFo5xdKRq+KvJCe6IhYdhHMdxHIchxXZs9333eHw8xn6QMQKDVmIjztbttVlXRHJk0ELDm4hooWfkLrIj573npHEc+3FE51brVdM0q9XK+6AA7eF4e3t7bNu6qc/Pz8/Pz9brpu8HGwyyiLeUxpQSc0J01tjr+/7x8fH+/v5wOEwnMefcygdmHsfx4eFhv99bhN3xeOz7IYQwX5bFNmPe28zOxJLvRDmqIqsP5KrKQ3DisDa0ERslRvNnSPkDrOqmqkK9atA5UdHMbRFYBLHo0ohAVABqRNnhBADgyAHC/f39+w/vb29uLy4vPv3s0/OzbQi+WPdm35ux+3PIOUJKqeu7/X7ftq33frPdnG3PVqsVIKSYQIFmn+FT1ejl8SIQvzz+OMcQPaF6PlGHYfaA5AJhEWazSBqDOfy6OEZM8iPL5cLvs0Y+GZL9iFz70Zf8fQayZ/+2nEh8Lijgc88mTtVQbpCXIkwJFwcyBcmH9DnjbNpKVRSdPrUsLl6GfrxIyZ3ZWSbDKcFYhbIcfaIOwPyk9g1q0elFKdbZn7o0AWAOgLClvwSlEyIZDSFPWttvYmNi9vJpnpnWqZic9pePf2SlBS/lTLKw6qhiLv3KaaV4zwlQiuROMDOyzYKFk7vB0stttFyFUB2gd+BAnWpF1DjaVFUTwrauK6KLVbWuwyq4uqpWwQXnvCNH4FAdgCf1ok4iKqMKcJLoIca0Ju5Xo+d4F7nfOxicJgIhlDqAQxBOlqdjoUcwae5PBN7pc82FM+r3XNJP3fFzDFQp/KcUjsl2rtNTzel8Uwr2TAcpEbeW8TRTY6ayHk6m7HHZ97HDleRLg4UVmEUJXWLdd8O+7ZsVvbq+rkOlZaZXJ5/4PAmMT36vZ2Dr2Whv2fWyKIzmK01PWHyTU3J+I+Yelw1EIiym/l+YjT9AhTj7F4v896w7qIBJ4H53+N0f3n377t0wdASyqt315fn15dXZFqu6ds6cEJnhBojO56hvq6hD8MG74Lwjcoh1CGkYPdDdhw9j5Kcho8+gMU9zhU7naZZ61vdtfE+wS0/+MNuHDSE0ldGq0wxKZk8sZDGdmjSaxzdwwgMs79ny37bBMIAFidmiw8UnyqoxsQnECOS9V9HH+92m2Wy3Z48PDw+7va+qy8srdb5tu0PbXSRpqlUab969f7/Z/rTebI6Hx4eurTabVVV1+33bHlgEHIKzp9MS1JR5Q6wCyqhGb55WvGIsnpX7+b18MsBRUokyGkF0IWkqkHN1VcWqiikmZkmWTgZN0zjvWGRCiKgqEZILTdP4UBntP2NtAfPYESIpMBCrjInZFEdy04dC5ADzmWuSiAloeSUsRBw8CbRdxAVM7mHQcnLJ3Cedos9LNx+nnL8y0mSBrgqKAnm/RkUkDCE4pP742HZybMeYFIiAs49NOcPnoTCsjGW8PP1Y9O2x64ZhtI1cyxI9WQ+K791uakJE0WeWeVFwc5eFHAXwiMjCyy8i8t+z5uPHD5RzgoYSUV2b9M8GgtAseasIc4yuqnI1XXgykpunNmMrE/jIHqYXoHNPVoDJqyEsMcX9/nDsujdv3rx+8/b84sJ7Z4NSAgoqBK6qqrquV5v169evzs7PX/aBH8xuBvDE3L48ySN8v8Xu+cjm4g+LtG3Epb19qui895ON/UmsqwJKPkdN0eUzuKWM9QmzIqcxgi/hXfY9waF49EgFJAMk4KY8a1VF0kWgaCY7LX5tmmjhpVVmm1teFVV09lBiOcwiIJidxjkERBYQFXvWJYQQAISVME/hyeyxoJxfiYTg9of2/c1DO4znZ9tPPn2zXq9BEijePzz+/tt3ivjjLz5//ebN/W73h2/fHY/tq9eXn3z6dn/Yf/fuXXtsqzrgSW2YpbmcnIm5j0XZhqQiMY595bAJNdZ1z8JJjWclCppUJQFiRR6CjslyRZQBhAAcAiGLRE5pGLx342pljP55lqT01TSvV2jRf7Bwg4m1FtHhhDAxmsScT1isHgIp8TjGFFMcYhriGFPbto/7/XHoH3YPdw8PKcYoMqY0jNE7wYTMySkTzCkPZoJOJhDHOAyxH8b7w/5u/3jftz3yQJpIfWYoS76ikNARAjrnAI1sUCqChYNMRAjVOZdi7Ieha1vv/RrXFtcnwob0ub29HVM8v7hYr1cm6XqfjDecUlz+z94tMwjf3t4+PDwcj8epoagKdVMDgH1B13WPj48mEA9D74gAUETsjoNp6GTa9XP0Yp4MtX8hJAXoOQHCarOZupl2zJtpK5Ab9oDAoCps4Cmc9IWFs2aqOmXagM2TQ4RIzKyg+93+7/7u7x7uH5rV6pd/8cuL8/OUInMq7eVyIMHpEKKiOoxje2y7tuuH3nt/cX5xdn7mnGPhPM1TAF5lEtS9CMQvAvHL449/DMFF3+qZbRbmUISTAtTsnpaXSiXaHIhmwqhtNou4nr+vIyTzzkTTs9qcper3JkqdcAyeOCU/orbp8mWU+JGT8xPmlz0dywjmYiWPh9oRaZFZZ/UTAeUwBsyzV1iCuVSn0E8FFJUSwF5GTYt+9jG9w05imo1Qc0r7aQF4UtQoLZLdzGyaq1JD0hIoAi2dmyUVoIQ02X4wffQCSwMmIqLiyVVSzJ5ahl2fTOzmFHOdhEudYtgngMmU3ocu84wVFVmYsl9YRRhBHEzjqqoWxsf5NybQEFzlaVWH2lPj3bqutk19vd1u6uZ8taodrQJWBIHIOURgFAEQQxmDMKo4EAAmZtQEwIQiTurah7BWuO4hPR7vaEgqI6ASAbIIZ0CZ2EY8J7EZGGPWKYo2O7XcsVCJ4T/YGpm1VMwZ0ZNwQHRqjNKJ2VjAkk+RINNzzvxNKHEhi6TGxRnCUu3BAGMAQIZVYRFW8C4khsO+Px67s+3q9fVV8D4TLNEmvJ/85tZ+oOUUwfz7ZTIGCasl1JE6YAbzby6uuUUtlS/zaeia5m500cMWqZz/wRLr5fGf7IY298fwI+0WRCAWff/h9v/zV//6V3/9t13X1pX7xc8/f/vmP/vss88uLy/ruiZH3lFwlG0bRG4R9Y2mF2Ox2IsE58Z+POz23gd28dT/vxD3nlEmnm5JpzRh+Bgy8rnQvNCCT0Lqpm6lrU0Tl8FuBxHhbCHJQVwnYlwhvZQ+E6pg+ccMHlIAQRIFVkwiiiAALCAseWUQFSRRiYJEftU0j/vDYXd48+aNCLz/8OHbm5tBAUIY+NB2fYxxvVoTEScGoFA3h378zde//8uvfnxVeUJU5qiMSOQ8IAHltADN4zL59518TgiLCsjqELQUe6U844yZYFSkYZv9LLk9QEuJBICIqhBW6xUN1A8DCAMAEYW63vqz6YPw3jOz984536zWeTK0NA0VUdC6Z3mfFqEoGkG4qMOLRjJCpjZI7lAQwhygUPzIRe/X3Lhdyt/L8Qq7AvAJm1tzDh2efJf5sjIIinBJvs/oUiJHq/UWdDi2/W7XuR+90TRMHiAQ1bm/XNqNkv2B5YLR3X7fDVFEp5tjbmliPhjkoWtCokKoVCkDMiogU+/cjN5mvxJmWHSXP7q9Fk7ic4PB0jaAzrkQqoIxETHgNaLRMCJzlSfU53e/BEjmj8AvnMJSHhYONgV1LF+bWItF9ZNPPj2/uPBVReQsImNS+QSBCB15HzzWjfcvFdkP5EFEVA7hiyMiPvufftRs8n1OGrt8srljuRll6q8av8UueGaOMZoncXLlKrqF1U+nMsFuaiGysUdUZdCUmBLbUAQBJsUE5BUcknfkDaie00RtUNKVgLy5zV/6lFDypWHCeU9xOToh/WAxz6hT04smGHE5E4rIhMXTvEGQ3VIOqaDPVQBdabChIKrih7vHD7vWBf/m9cUnn74B0BCq3e7xm+/eP+z3f/Knv/jqpz879OM3f/jDu5ub1Xbz9s3rmOQ3//73h7a3yRa79xGnlNTJugEWt0JE5IhUFMGp8NgnwnVwV03TJjmMygJsnxehCpDDuqqbuu7j2A3DEBMaDj8EF7yA9uPokYicbfT2vCySvTtqfidQVe/toJ1XJEOuF+YjO/OWquZsG1MbTZJUBFZmbvt+HAYQiJGHYez6Ybff3R8Ou/Z4d3+33+8I6Ob+/mG/r+rGqQ2tskoSjixiUzwxpW7oI6ckElPad/1j1949Pj4ej8mhVJQAlFwhDBkaSxjAl23CMO15nQXQJEiZhgkqzMn6uH0/HA+HZr1i5mEYyPsxpq4fbm5uDoe9CxUZR0hSSlFVmDlxYmFZAMHsgjL99/7+fr/f931f13VKKaaUhCvVEMJ2u91sNg8PD7vdzns/jiOzWAWnqsxiZLyys9ssEy6GT3UCceaCB53adZyvIkGHdAKksRGw+SBgBTmR7c+LJvnplPbU57ZakggFcPe4+1f/6l+NcfzxVz/+8z//83Ecx2GEqb7LBaQAADpnwCfvfYrx3Xfvj4eD9/76+vr8/Nz5mVNcguycnT/tdg0++PCyl70IxC+PP3YxrXPNoCeicJHgyqkXEOevz+YazbY8KYtPdrjkYRlbMOh5nbzUi57bqZ6LZU+O73mJXKT0fOQpTo1RT75gyjTQj7CMcYoOKwVyOs0EdrM5CVRBGJSBEB3CNCsiosCirCToFTPPmBREco4YIBkYooSv4RwQM5XzM/7puVKOT2XYuY1b0MGlVDG8cI70ATDkU9kb0DYjRWQ0A7EDIFQqkApRRAQhlTIOdVJElWIW8aPKJkzTusuBVzuaKFokfR54BqeKwqrGj5SgRmgUUCFVACEVR1B7X/lQeV+HUAcfHHpywdGmqlar5ny72a5CHcgTBcLakwfwig4UJaEqIqMoS1RlBDFEWg5OFzGeZTFViXKSNABg7YlWdRscDOxJURJZZgWiQxqUpWBBRCkPOIEsvWqY+9wlcRnw+7oa+D0UOYXTqzkDK7JJizBr52XoT4EwA1EKmwxObiWFJ/gXozpM5gu0v8xIZVRIZXLPwK2qSAjBV+MgN7cPw5CuL87fvr2qK4cqhDbxrQAAXDoahAsB5MkFvzQuoqjYjFgZ+UUouUBL5e+jGhxMo/OLL1zUTvDiHv6h7Waqk19wGmmZSAsLAywmpWPbf/31d7//w6Gu8bPPXv1X//v/6n/9z/+zT9++9S7YcDcoIwAwQzZ6GmUPVVREDDmRkUDmohcBUFZmZY9u0VmBrDmeuj6nY/ETuMSTuYEnQ77mZJz+yereUgHB8sy97LxmFgNaEWKpJZypC0TmvRUzAcs8q2niHGTzp2NABmFVlpmrDgAMkFQSK4OqAosm5jGORjhOrAqUGCILkq+ren84bM8vzq+uILjv3r273+/Xq42vqpS4H8bzs7Omrh4e7t9/eH+2XfvV+ruHYxvH8zoY/E4ljigsbAYqKqwmiz5CQHKIS4iHAujp1JNCdrPibJpdDjmZfgynLq9JDhGAEAIRkXcGl1CApmk2m43V2CJCSKqpHwZRBMKUEhAhOhuoKlSqHHvEomPi4xCHxAkX/KDcQZ2NT8L5LGVpbrbpi8pS5M2DtAuFuGCZBBgn5RTm0Q34WHIDgDnEMtMUrFWCCGJSkAowK4AD9N5r4uNh+G//u7+6uqy/eHWOwtaRMDE8aZo6c6pLUzoqEjm/2x2Ox97eSrsNmCX7vrNx2OLcjUjhiIrRWCR3te1DM/2ZmTmJMIsgqSPHHA33YQk8kwthAh3KPHeik5677NlPgo7VsSLinANVH0IIIcVkfRhOLItbL6Vk936W0rNejADgnDMSZeU9ISZmsi+yOlkVAFKMx+PROdes14ooIgkRyc5SWr5SGJRVCEklyYvr6ofzyA6c0/sST+ESH5OAQT9aE81/LjpRrgZwSQXUZW/SOWc7yDyJBahk7TNd5KQsChdFgcVUuub5AxJA1DEKRLZAvEDiHVXeVQ69qEN05DDjzjmL2ISIblq81VZ5nV0oc+C3TcrgnLQO8y4wJaSoiC1AS+jYRE3KGSZk9LTMgfNEpEACiuhU6Obu4Xff3g398NVXn3762VvnnQ9uv9v/za9+vT+2X33x6U9/8mW1qv/7X//mt99+G0U+f/MWXPVv/u3ftu0gqMpsL5mLwOi9J8JxjBa7YUW5AwhETpFjqogaIp8StN0q+O3Z2Tasbx52j207igCAI/Rm+g2hbur1dtvHOPSdpSmwaj8OaRiuzjfB4NDeOedMJeUcZDKThi1SDAAASVj3u72INE29Wq11OqVYvWaZY3a6YBUAUUkpdV3PoiwaU+pSfGwPtw+P7x5ub3f3D4+PmnjdrN493P1//+ZX3TiebbZ1VVXBE+gwjonTMI6Htr29vzv23Rgji7DwcRx3ffvYHX1dXb56xaBJwTsnCsLW/bVrTwRABFJKOV9X5gpBREDYjOSCEkJwLo5j6vpuGIbdfgeIXd8nkeOxPRyPzLryfhiGtm0BJKZxGIbH3d1+/9j37Xa7ShxZEoCYczbG2Pd927Z939tZaxiGvus4JQAwgfjs7Gy32z0+PppfeLVe1XXtfSBySxbeNPgskqmQy4YMOauKzCckRFNTBOEpZ9zyFwkW1hpVEJZpNSnsxgXhBZGcs5MlIMYhtu3j3d3dOI4//9nPr6+vq6pqj60jp9MsGcyoK2Z2okTEzHePD+/f3xD5t2/eXpxf1E09RVRl6HC+Y5WIvPPOOR/84XD81a9+9V/+V//1yzbwIhC/PP6IRTXMOVWLcaasGRden8lNhXheVGItHdqlE0/nGXUsfeons7HT3v7kbz46aP/kz/ikoT6vgXqqmT45IBE8470WX/SztF+rDeYR/lwYlqKEaIEzZNWFwkvZzyIMDILKSzZeMeOeSPDTEAbSMn4cpn9GsDmeWTT8Xj0RzSpmo5ZKKAiYxTmjNyiqQBaG2dZzAkQhBYc24YkoSA4cgQNxpuCWMHJxwgT0EV3GVDwqRMsFMUDVcvPKh1SGPVElD7tlaSLzEFEYhc1xTETOk3NECJ6oDj4QBaIq0Kqq6hDqUDV11TTOIwYijxSIgsO6ct4RqRAoopImEkEFh5Ad4pJdcjRN12qBSmf7tL1sRBTnEo/kESvyFELtw5gEch49ogIJgIIjzyCikGd4YNYbyhE6F+pS9M5yQes//G4t7oms3toFxFHGbuiPXagd5QBbRZptu6eysk73et6pYY7zQrDgqcntnT16+bVaOqKqMAAzsCISoQP1h0PH6SbGtG7q7bYmUgOgIVrVz0XKnu705XB7cfhOfwAwEF5iZjWbnittdn7WBHrS9VoUOrq8r5+M/r88fmjtTs4plaWFKeWEfdISFVFh0JQSoJxfXHz54y9++tOfXV+/CiEIm+tQs+12tlhI9luIIRpkLo9VAYlFgMh5JwAic/z6807PHE5NNtb5kVGbZdvyyV9OIVe5DVkeTxzHS6XYGMpZ2p4mD9TMqQCIZKRW0Xm/Q9vIVBSSKgNGRAHHpAzEkt8RFik0VYnCSYRFWTglticTy/kDcs5ZsX04HO/u7y+vrjabs81Zezx2PfUi2nXd48PD9vPPQgiHYzuOI9DWheqYDne73VVdN+TIOx3jGBNMAToIThVKLmsJCLTfVaYRSVw2hcoqgMu5mMIPmd/quYFe5nDNZoukBEBUASI6dAwA3nvvPTnrMwoRmSTClpSEqiqJwaESkWbQhJrQmxT6mHbHNooyKRpPs9AV9LldDkrae6F7LaxBsFxgpzj6QtI0d/V0SS/nwud3Y9l+K8Oqqir5MgGxI4Jl5SqQApDzQHo4DH/9q9+u/+IXl5vaoa35bONAJVgwu9Qg90fVspCGPo4xqh0h8u9AKpO5TxSduZlsOFos2VengTM1ExbwdIvNMa2GgEgpzuEX5VF6Lcu7sqhmOvurpzdkMlVZFhAiOqIQAlfJbgP7KQLAIiklawvZDZI/OBWH2TxVROcysb+IzkNEg1wSYrNakXNEJKDCbHCPU05lNrPJC13/h9XvVFFBeab2wpJx/3zCUk/BFB89Ji2HDJ4cD5dHrLI05jbkFBChINk6UlbcmUGMKCUcE/NIQzYf5eQpAgRiRmZxScbIgZwnCo6C83VQR4VIVrIoS8TmFKFclN95ug3ti1RndXhyPNj9QrlEmgR0Oi1bIQPWFJgmbjlaaK1tLazc9uMfvrs99MP2bPP2zauzsy056vv+7377u67rX11ffvGjt4L8/sP7b779NvbDarXuh3j38Nj3oyOHgIatH8eUWOoqvHn7JsZ42O8BosMMcUeHtQ8eSTlaBK5HbJzbBFcjOEJpAgVKIEpY1RUCAgipikqMoyA450IIEsc+jm3f18G70uYCUEICUE6MDohIFz0Heyc5MaMQOWFblCDnsU+8SYuVQ1QyDJca38nOA+icaBpSHOLYpnE3tPft7u6wOwx9VHHBV2ebyzdvBpF/97d/u25WZ5tNXVcC2g59O/TdMLRd97B/PA49i9ilNnLqeYzM583likSRwDlXeUYVFiQD6lttLgKQSjCdqI112tJtfm1rXkvwNFUbdVWtm5X3PiU+tm3bdara1E3dNIgUY+r6LvHQD0M/DJYuOI6x7dqu66qqQsRxjH3fD8NgnutlSoQwa4HO26o9jmPf9yGEs7Ozuq5D8CdDJPBUElmYZwBAlaXEdJtfoWA+cAZ542mDc5ogwifaMSKosk1tFo43iEqMiACEcRj3u8N+fxCRV69ebbfbEII5FQqCZo40st83hKCi+/1+t9sNw7Ddbi8urpqmsaEE40Tn4erT9vwwDMfj8eb25te//vWxbV8E4heB+OXxx1SHNVsL55EceOpPVF1qTLrwEJ9acHIlI2X8cF6lcOpp42KGcJnP/gSYNRkAAZZ/fqIFPz0zTZE1H1NPv7frvizFcy6rEV5z0xmz/Dv3y3Wud0566JOQDCKiiOrsX6m8j6iLianp7UYgXfwkLAE6pNOJX5fU4jxuuTjTlTcZZ9qsAgpYLYgAyySiEgGsxQhcgAhISpRjIDQ7fYoDCTNSBAWWGTiz4wYWqYOKuvycFFVoilNXMcswZQUTEAAc5GgExNpR44IjJMTgfR18CM47DN6tqqoKvnK+8q7JjXDywVUBEcAjEoBXsBxgMh5ZPsVKqZ5wtg3YeYIIjF9cEuURxCmaHKSJISWbkgLE2oEn11R1RJTEjiajfXFDze4tLITkJ658LXRdUFgiJ56EhyybvQVx8tQBW+p6UGbu++Gw7xqu6to7h+TwScUwz/liTqZd8pGn6/3pzVaG62YHnb2TipZTLKKIBEBtN3bdyKLrlW8q70hBjchcCoS5D3V6LM/POSeBLDLyCj/02d2LmdgNi7RLeFYsKajS3IAqLYmXOvoHWlEbf20J1V+qP8XhhKpAjtAhOby42Hz22aevXl03dU1AonGKZBWRsvZnZq9lv01sRMgTuwroRDJCFoqbgnA5vY7TPOli48PlTAWcJtR9z4DwCROgYATLhGG5uQpw2Mw+OWRPtfxxcnBmBI51T6efjJz9uCAASZUVoiorMCADJlVWTaxJjCDHIsKqKQmLMCgoCpIS2t2neV6VFMB5FxMfj8fDMWzPzs/PLvs+DcOoKuM4HI4HQNhutw+Pj6mYbljSdx9uPr+4rOtAPmgchjGKQlOF4GychdziHGKrLs3wcbCuV1aOi6yAJ2/8fIz4yOEhfy6LBE0iAnAelNCpN4G4FHhKZB5XCiG3uaisOzA3zsUSSkUxiQwpHfo+lXHOKbJpQZvPa6WU7X1e/fXJ77JYKSe+UBGE8kHpdN4UntSggE8bbgoIKpr92jrzSPOWCUCIfozj11+/+/T16+ZHb1cVIQigiCg4l8FWilMQqU6MY8J+jCnx5CoqLX1CWNoWzE0tlreOU5TStAnkT3g+oC5nCJiVLPfpGclhgbLPV0zJwbJ7fr55TSBm5lzlAoCqs/mAKRQhX4Q6A1JFLF/eObfIYy1jvNNHU3Axdr3FGA1AUVWVIzKBeJFPhgtpjHLkwctQzA+r4fnRXeDJ8NMTSPGTTO+PmmbKUP60KuipYDStK2D9mOV0i8wZVFqMuNnK+ORHWMRG+YLpDKmKuaukACLAIozqkCJR8CrqPOUF23kXrPGDJZdkatbNZ+Vl8N5TzmDZyu0Go3lJmNXhKUHcbvTp1yxymq16qkg4xvSwO97c70Dh8vLs4uLchyAx3d/e3d3ebTdrk4zbvv/Dd989Pu5stzkcjrv9XhQcOSurbI1qqvDJp2/Ozs4f7h+YeTrKEoJ3PjhnnTznXONoXYXzZnW5XV1sN9SsD6w3hwM69L5anW1TjHHs82hPQiAGBRYl1TGltu83UK+8t54XM8cUU0zogTAbhXQqiaZcWsnaIxI6ckg0afyS0wys9WkzfaAqyY4CqqoQE/fD2Pb9oesejof79rgf+p5TQvDBr7fbq9evAtK77767ub8DBSQcQXpO3dD3cRxj7OM4ctI8vQKsLKC+8ltPPSdCX7ngQpgYCHN9ouYVFqODqZ4W0VOfQJRFEMB5V9XVerPZbLdI1HZ93/ci0jTNerWtV40j5BQHGbuW+77r2lZFEIBTHLq+bdumqR1RHIeua7v2mFLUMiIWQgghTLCLqR5JKfVdBwDOUVVV5PxM4cYCn54dLYsDi1oxODncTP/VxWAA6LIogvk4LOUQMkszYPhKENCMns5VmIowkYv9sHvcdd0AABcX5xcX5yFUdhIuNKflTWisDByG4d277/q+d85VVX15eb3ZrJ9wnPQ0Znwcx74fDof9fr+7ublNKb158/plE3gRiF8ef2SN+GRk6aSfrHM2lVXIE31uThKZyo8FbGA6s38MH4GIJ23rkzgFBFzu/09UYVwMij+r4+CJtA2wGEBHzOiqRZb9lMQHqsshVCCDuZs7BmeBLQupokiihBa8wrN+PL1FaE5SwQnObPG4KFOg7kIcw6kkmxr/Jxan4mkuM/aLbcMQiqXyW4SLCZRT3HzYy0oHTKnBWZUzROyi+jUVT0WX6MDyRiCIOZJIaeIVGEEMUA01bBSB8t1KIK4EJYMyoRJhMKwnoSOz7BICBsJtU51vqsqTJ9eEEIIPnhyRd1R5751zhN5RiaqzuTIGVVSxGCBUEUmQncvFsjDFIk/JGgZGsbZ6Yk2JRJUZU4IUJY48Djz0Mhy7w0N3ONTevT3fbjz6KgARs5A5mErwhzUOjIZsURmYxZi835ucw3bOBVykPS4kzmXLY2nqmO6XyYVbqmZGiCLdmHa7PrKy6HpVYxa+JZeOGdQpQJJBc/mILFM0FYLSdJKa5oYWfZEsh2XXt7JojEkS25lsGBOnURW2axe8nQXKbydUrrXTGWaYkiJpCjsxOR9VNSNP7QTIORRoKv6X68+JZDZNA4CIng4T5hPulD7yIhX/kB4iGjknesk0WIhofojZU0kAoN47HxwRbLfr6+vLOoQ8fToFYIlIyqD4Itdp9gliQS+BeQkVSSUlEXHkF2xGhJNC9EmtjtmAhdbyezou8wQ3vOhiii4mbrPmW3LkrAww4dY6jZKN1BZTx4bHmOj3OXB1cpiCTpuaACSBKMqiSTQJCGBSSKyJJSYZYypoKlFEIafGsp+2FxFYiIgiCorNqun6brffJdHrV682q9XDwwMCiHDfd2OMl1eXNzcf4jhwTHVToYevv/3uT7786nzVoPes2A3jECPAmqoABIBCzk2umymHSUTMY6yAtgXRYtGY+rs4LwtPVt+yqEwKok5zFAoAQOjI2xuXI3FM9ZsOP0TOkRVRZqubl9q8RRADjCl1Y2yHkVWsNWzS8SQ2ypzcU+Y6CGHu8OmJ0gHP+2+opy34RaBvsbjDFP+6kF6WMyvZ4JpFGhZAUOewzHQjATG624fjb/7u3dXFubtqKvvMQUHIKMY51nCRcwiA4Fw/xHEsG4SKaTkuC8RAcBJ3A5Djzmfa7zTkWgJc56k2E5Wzy2kyJM4nT8s2GMexfMICqBZwr3TSLcWCgDAj2CSc2T1snjJDiNibupzNN5YrIq5WswRsrGrMzuhll0vs60W1qirnvXMOCWke40c7bgJCSbjzAKriXqj6PyB9GGQZMr10NkwnlwlEvgAmTAdKPT1qTb34aVjlSZk1pY0t402sVWMKqYjggsYyfdEixuJkkyvFTbkxdR6bs2eSHMsCSTQqj6KRhVBBhQiDdw1rFTwZx42IAAQYQRd0fMh5G6WqmfgTetLhKgSKMvWaQ8jzaRpLTtuUfDwBz0SVgEABuz7e3j0eh/Fyu7q+vAxVxSn2XfvNN38Alc8+eXN9fS1Kd/e733/z3ZgSOt+PfUoaY/LkzOdgz9fU1Zu3r37y1ZfvPtx2xyOPkRDB6k0HzpFH8AhV5QNI7dz5enN9dvb26vz11SWt1vdDvD0cHtpWQlWtmsgcWXlkj+CCU9YxDizJg44xtV3Xe7cJXgDM99p3feMDASRQcKRECMBADtUBIhpqWUGEWdA5cgGpsKHLuJLlf5IgIdkBi1W4KMR9N7Rdvz8eH47H293+/ti1iaOqOnJNvb04355vV1Xd9t3d737/7bv3++O+1ZQI2GwnAOgJEG14gpCAgDzVdY0htOPYEK28984lFgIgPdn0koiAGknDKAYKAvZ7Yu6II4AwALng3Gaz3p6drTfbruuGYUiJ67q+urzarDfkXEoppTimoe3aY3vsu16ZUTXFOPb90LZps2EfxqFvj4fDYT8OPTODqidqqmrVNCGEkiyH3pFDFE7jOPjgiZz3nhyeOFey2IDLDvAsGsxVj30RPbv5ToEU09+LmpM4p7wUWHF28SzQ/wgoCuM4Ptw/7Ha7uqqvrq4uLi7sVIeLJigu0mpMCnp4eHz37rt//+9/c35+8fOf//zi4nK7PYsxqqbJdLwcfTA0x2632+93x+MRQDeb9Z/84heffPrJyy7wIhC/PP6IR5CSoYWTG1ZwqQ6LTr5WOwQsUjRh4hNDiTIjBQt+L6KpjeI+zed5HsszEwMBnp5t5slANPDpchZmDurRhaS1QDqCpb2W7rHqTFsWkbL8TmSlnPGmxnSDjLYCAAKXcWDAlsGnAAxk41QOlYAJdHEwUURFQhAQSzDPeSuWMiLG9Ecy5ANNBxkxyRZ1kc2Qk8fLAQvhxPJdXqYu3s/y3ixMmiYBYkEF2c8mgdwAJtOEFdFSZaw9aIP9gMCKooD2FUCWjKBo80qmimICBPUEAdETEVhWMa4qv1pV5rAKAMHRqq4q74NzdfDBuxCcdw4UvMMq+Co4h1ACeMFohsX1xCyMjAsRZdrYprlaIULS00Q/ACRkZlAWzjPR49C1XReHYez7fn9IQ89DP+x2sT/Gthvabjju++PusL/rurap6z/7yZc//vTNm1XFIiCQhBG5XLjoWFGVkDQHuRVNJ3OpNaOkIX/c+SMjsvkcOjVg6LIvUhgdemKpyoFyjMqIrH5MDgYgj74iIUIRQnTWElCPpldrAmef8GT3no75sjjvl1BBsZdPWUIp+pmosmoURkJVjWkEJJFUBdpuN3XwWW3K9x8hqrpZEsdTe9psvMoKiAoIKIoYxyPf2DhzuQtjY4llMSWg+LbsvGVNeyhs5clWuVQ/Xh4/jIcFXheTPuqisSFlNSynZK4q70PIMR/kCFGEbfgjj4ozc8rtEzN7on3rwqWMJbI5GScdMVSBnMtF50kRnlXInDKGuERmL5qXc9/yqTqc7cKy1L6mafpiCylq8QIuYVMbRSBWtr+zwC8kFmARUcDsDsYEkNCxKrOMMUWWJMoiY+JkW4Q9PREF73JspAKC2EBumVAUSXlRASNRqIEdAaFZN23bde3hGML5dhP7oR96BhjjcP9w9+nbT9br1f7xcbvZvL6+Or+8ut/tjkPsWYV1YB5i6oahCsETBYeIpJk+qZIleZwVFntPTVEtUUiE7onbbp7otPaZffE0lJMhI/NslKjkryB0Rr+ZPtPTI1Y26tCUlZZ/HksSpchwGIaHrutTyg0ymgYdsriePx6gsnTplE41tbdPZ8aXvfnsmZ6Mh4sJrWV479L7px/xHiJYmoS1wW0khIERUJEEQRQ4gfPNb3/3/vrqDPHN2+tGNSGiyOR5NoVYYPoZQADY90OMirWzlOMMdxFRnYmKJpRnpBlmZ7jlDNouI4UBY3Z1BLH7bAr8mfJ/lo7IlNLjw26/PxgJ1Orkuq7X67ULHm02Hchk3OmGneVgsOgJijGmlLxV/4gKOI5jXdfOOed8VdUxppR4qqifHnrtGFpMxOM4Gl8iM8oRl8kdk+eA5k99PiS8PH44BRqSwBOHjXHAxdLkJpDObLO39W+G8MPyhJXXoxJDV/TQEyvfRAhdNMuUCFHz5YaiIIYwnY6x82aHioSnBLFpAiALxmoDg8WZT5pTSjQBDHZ6ZkAVN0o1SHBjKO4QT+icUrHzO+MeFAMpIuVgGUfOHBKlOFIVNPAqoha5TdiOg2gzoYJTDwlRwCEKiiW4kgtR9WF/vL9/qJ377JNPr6+uEGC/27//7t39w+FPv/rk9fVlVdUP3fju/ePtw4EIkzIPkRWAMAHbQV8Ezrfrn//8Rz/98Vfv3r375u9+33d9RQRAjJRAEIFTRMTzTfP6bMND7xQvtutXF+evLy7eXJxjXV++qhTBB//b7z4cH3fH45ASKDtBcRptWUSBlGLH0nrfb7gFvSAUQlVhTlKSC1KZ8iOl4LxlzZZoHWVmIi+AbH/FKcVobCxRtovPCCSJOSM+mFPkvu3bfbs/to/H9n7f3h7aTqIAb1bVxfXl9atrTqkHWJ2fX3/+eUfu4Vs57u8jJyUQBwKqIuTIC5BKcL6pmnrVXFxfx8REWterpl4rg0M3j9OUucIxRkVwwXzYSlbnSLJ621QBQlRE58j70Kyas+3WuTAOuzSmTbN69erVq9evgg+i2vdd28nYc7c/HPb7FOM4jszskXgcJUYUUeY49mN37NsjxxFVHYAnV/kQnK98CEQAkACAWTmhKhERoffkvUOkJR4NBZe9zBkIOKdBzWrJMmzWJksmWWbq/3p0psYwcM6rKEfUkpMooChJbWEwevLNze04jtfX19vtNgTPHBfn0pJHjzNpZhj69x8+/Df/t/+7Kv/Zn/3Zz3/+i6urK2YZx2imnKlpCgApJdt/b29v7+/vmON6vf7yyy8uLi6aprG0gJct4EUgfnn8sUXiMuZuiqEVQaIiCAJ0krF1CvSczgV5z5dyhLBNXz8S437yn6dYiaV3ZyLp4BzVnVFSGcy1ONY8b5PDs4yvZb2kKlAKfsjrnS3H2WmiiAgOgBCIijtL1HJDSShXSQTqCxwwljMKAbgZo2HkK4emwhkaOCVEdAiKSkoqjhHIvrZ0s60AlCxy5vFmG7FaQKLLZFCOcZcFSYPmdVwUaBKbcZoJAyBLVNNcTeFUbQLNIr4DyO3ZHF5UmocWIgHqHXlQiIKgwUEgrCu/qv2qqprKe6Lg3OVZs900dVVV3tXkgqOqpoCOwOzDFlqGbHsHa843FAGW0nqw3IrinbKkJtQS6pptD9YHIESn4FzIEDQVOwky83g8jF03tMfueGy7/u725sO7913bdsfj4fFxOOxj1w/HfeyOEqOmUcYx9m0cun4cQu31+Jj2P3pswiebqgFRAAFRKroDq7eSLd8jdhYtg8GZX1lO/kW3KsNC+mTmXBfa1gJcrcu2gF0uosbKCFW9rWpPzkWlFBVBq0BIiqo5CbcEGpRriHJbYVKK53xoKOnKOMOOF/IBQj5pZf4pMxIQQF2566sr71zBwZXvxTJl8JE1yIgtFrNXUhOtGyFiSlTmnSmkMqgr9tGbY0tBRJEKH+002U8/lvV3Osbw8vghPEQgZWsszKS8IgzPewFpUiHngveoKAycOKXEiRGVk3CJzRQWyoFckqOZDWA8nVyt2weoysqMAN77OWD+lK2/BK5NQXPlaqSiW1nnRW2Jm5Mk81IuUrouy588tUglIzAWr7Bk70wKrYglkpIAggIDiChDDm1PgBFpEIychjENQ0ycXdkCxdDjgvfeZLIsUOaQPGBkEfsLVQaRiTtvbOKcSOK9a+q674e729tPPvnk+urq5uam58Qp7naPX371ZbNZ7Q/79nhMZ2fO+yPzh93ufLWC2O+7weKDxhTHSITBW9N1hsjOApxROyiTeqxSnKjCp+eg07FlWsKjcF6ncmC6qSiL9ExFnPZ9oyZSVilzJF6elMaMNRLRJJxEolAb+TDEUQA96XztlPVfdO7in5IiTfyYu2b5tdo2ON8Wy38q55/leQ4mSvOTN2Ru2E9fQLl1bYIxCytQcOZGQkES8EPir795t2r85eUXDh3mIOMMfMpsUpocfxqHse/HEKDZrJNI27ZUwOGWUmWfSkppiIMkzR+mPM/rRS1k8JxGZQWzCDOrqoXRL0+M4zgej8cPHz40TbNer8mRWOCRyP6wD1VVVVUVasAZOlyWGkkpGXrShyCqYxxZEyoSejvBcenEZ81aMY7RZOWJHRljDJYbRdanz2+7mZSD95mMgh91BquJbhYLgfLS8Pyf1sOuxsU28bHy7kn6ywSmeb7ula3kCddiYhCXL5iOlLQApCKeJtHg31tyPv3nhcnRjrt2k5uklJhHgJ7Ixg29x+Cd977yQT2RpX0gzjAytTosLxwGqFBBzZuPKIAIK5KUcQgWIAe6QJEpTpMXAIDkaGz7+93+OKbLzfb66rKum5TGh8fd737/YR38mzevfRVYpO36D3f3kcU7jyBqv4fOxZsnvLq6+PLLr2Li3/zmd13XGfdcBYEFJCmroq5Xm1dnZ68vtsPRA0vjvVk8lBlibOrmF1986am6u3m8v3kP6J0L4B1ITMw8sNpopi2b4xCTKGASNTCvJakyp+BrAGRr3YIgEGss8e1olC0iUaUY0ziyStKsbFJuTYuQGmGfVUFEY0x9N+66437odn13d9h92D3ctXuzQ11dnG22W+f9w/4BgZKA8+7q1XUrib087B+jsLHoU0rCYgQf7/1qtdqebYloHMaLVxcXF+dVVVnO2zSQYUR7e23e+xACWg+PCNB6uoQFgy+qRBSCIyIFPTs/V0Eiqqpqu91eXl6en53bT66Cd4RxaDmloe+HYYgxWmuwa7uxH+IYfYjjOIxxzLh5VQQy+pDFy5KljMbYd13bdeM42gSJRZUSofcOYGbTL3ccsXx5InI55+cJTP/5jWwbyYRUyvh+R+TmWGPrLTkiRIyszuX1RET2+8P79+9V9dNPP91uN/YtuYrMwoksphC0qqq+H//Nv/m3f/VXf/XJJ5/803/6T3/84x8DQByjxfct7Q6GTnLO7Xa729vbx4eHqgqffvGjV6+umqZhlhjjEgb18ngRiF8ef4wTxpwbUtLobFNWVYUEIGp5IEogEzsVpjEmUlxagwmJptDwaXDxmYy7SIR7ftz5vlOOfo+acyIT68dPObp0y6jOL8mMJNPo7tzodtm1KDYGrJMgVVRrm7Mw5VSsRQyqpGK+14COgZKiMxqwKKjQnEnM5sI1YZ2yySsnCiOQ5i43gdEICrwClGZLU3bSTBoAYHaq4klcOy6Lw/zDwZzABQ5CkA9R09sIzArqEFEYFQlyO9QhKSg4tLyh4N35er1uKk9YOdqsfBP8dl1t1vV6Va+bEBx6h5tAwaFhhakgloUhR9+KcDbvWf/ZBs8QM1mfp/4pgQBhAVLM4gtN9bIwpmQjK8MwDG3bHQ7d8Xg87NI4Pj4+PtzdPN68a/e79njs+3738Hg4HiQljjENA6TkQAOhjgNIcgh1qC6aOpJK7GGMPPQyjqzS6liva7syLIVIxTRKZ/NqRHM08BS7UyjMcAKJykGQsKA+A8ws4DyXWxTc8s8q5jnP3jIgBYyiPEqfmHoRjQCyXoXXVyuHKsKZoggBhMu7qlDCtApuoeBJzZlRkpE03wV2rJpBlcI5LCG7d1U269XPfvrTmcl4Mjqrz0ekyhMWJooFW6mQUqanlkEEi1mY46hnZXuCzFmLXKb8BF0qZR+vVF404h9Wu9NqRMm2JinNxUks1cJXUwHnyIc8ZqcKMSZF5CR5ZkRl4hBJwbdNhl2ToiTnN6oVoIAUqtr6gEiGzjnhLC1PyScOkVPy/pOQunlI9rT5MUMnNCu0T75x+rPNfbJMIbMoZJGqmEAFCMizAgu3SXrmjoVZYmIAouA95eF6PckomIkOAsAqLCAGg1FRnp7N3NhTjp5ppFjVgRCHfry/u79+9frV9fXD7nHf7rtx6Ibh4uLi8eExckJym7PLm3c3f/3br4d+WDmMsSNSCj6KdDESkqPMSEyaWUhSeJNiO/NSAC2iZ46dtXazlVLTB2SrBsESFg80G5AnnyosbOCQF2ST4TVDG7O0n4VNp4QqSTjyMKYk4CK4VviYEiMSOf2YBvS8252vFgUFa1Bi8QPm/38SvXvyIhec33k0a94GThi+J+csLERkLFyi/ImCR0IFAYqACO53f7hV0VfXF59/cq3cWw5tjqcot0zZXVBYh2HkBHVoHLApJmUrQFBBG/pi6Y4dodlqrTfJgDiRfgmRAWPkJJwkTTmoLDwMg6qu1+spKNd0/HEc9/v9dnt2dXXVNI29PCQQ0cPhGMeookQ+eJq6O1Qe0y1seVBExCKBjFCNIXjmZN9lX25PhyYZLNAT0w6lM17fWi/5QxIWe8NzHFR2EiiwCis5EjLmBtEiqv7l8Z98vzN3OfDjbRv4R/Cxpu+ygatTau9HEln+njorOwYXKYvzZvAf49rLR0EEyKQJG7oEVkVWEMCEDoUoORoduSqEKoTgPJFD8oTqQEAyfC4LdZZ3h2SNG8zBqaogpKyarAeH5AwgOAnWigQKQNgP4+39493DXsl99unrVVMT4e3d/t2Hh2PSr758U2/OMFT7Y/ft+/cP+733pKDG5J2ai/Yenm3Pzjbnu13369/87Yf7PRAqahRRUVJ9tV4Rp20Tfvb527eXF9J3TV15ct6HgACcHKhHCiNvmnXzyRf7n++Pu8P7YwfB+bqqqkZEun7ohtF2rSi664bV42PtaO1gFfwo3I3jqh/D2kVmTZGF0ZEPbkzRwgic8955RUgiKgISmTnFSKjOIcosO4oqck6/E4VhjLvdfnc47rru4Xj88Lh7f3//4bg7xN471/iKnGv7/pt3f9AxBu+jwsg6JEGQTbOOY9+nmFSjsKp658gRFAA8OhKRq+ur6+trw/ie+gOysG18HhOIT/ocSEhkjnU7FIgCIVV1td1uq1DtdgcRWa/Xr1+/th3B7gbvPXMKlQfUlKJIsg1QJA1D1w9d17XooO26vutTSlaqIILzvqqqEIK92nEc94f9/cPDfrfr+t7UWOec9y744HyYV/7lEJgILXLc8FmMyvPgilkGAZAnYXdlC5tuXvsoqyqIStM0x+Px17/+9eFw+PLLLy8uLlarFTOLpFxqL/hUqhpT8t57F37zm9/8u3/318z8L/7Fv/jxj39s64OK2snEuEz2Giy49fHx8f3798MweO9//NOfnG03VRUAIMZkuvkpevTl8SIQvzz+WDW15b5OsPcyvV0sKgSQCQQwZ39kF5OKTgNLC476zEAw6v5HzzSnsZvLKBh4LghPAXSnkSyn6UOlvaWn9mWdi2tZwupmjXhK+8lZtjQdVhTEgKvm9cSSo4I5zG0KOp+4epinVzJJEIoSZw5ksCW7BDWgIkqexZ89owYVKnNXGcOHQCDZToJz1gtM5ZrVJnkOH7MXSU/zLApxtmiUiqRKasVvaZyjIoBDcAgewCF6pNpRU/kmVC44X/l6VVfe1SGcb9bbpq49VY5Wjas8NjXVla8CeU+E6AgqRD9/cvkSYpmsnWgYslK6weTzArI4uzJUi4QIooyGe7QDdBJhTjEOXTd07eHxoTseh8Ohb4/tfn/c7Y77/f7xfhyGrm379ji0+zT0PI4ppRhjitF0RGQmEIcAqgGEUCvnL7frt2/ffri52e8eRZj7KGNqzrYAcUzJIQKCgEjJah5FQBMiOevG4kk4kKHcMsLpBKRiPl3UZWokzoAJLOhGwWwgzJ7bMsnOrP0Q7x/26khJAEQ1IfK6Cevar1feURZa0QINMqcaMicbdYGFnJsO800FhamqhjY2KVZTSobN5EyalCqE66tLhyhT6ly5UXIcMSKCUzgZfsx3rYBY9sV8vy7mu+dv0WyomxpCUCg32QpxopRNbJzntRAAvAS//2AeLBKTzNlkJxcYlUaasRSBXKibBpBSkjHGGNOYkiIZr660RhSLATdvEKb/FYz1pMqCSMa2E6meiLmTA+uJ0vdc6lVVRCVCEVzOoc/9ooXsO+nCs2qdyyR58pOzZJlfN4gSFgKjIDIQE7FAZB7GNLBERTHXlA+Wt1bW7QnYj5N+WPRQYUMSFnOOiChLFq6zozivMNOYIRKFqo6R9/v9ZrPebDdJ0zAMd3d31xdXTbPimFJiHypw/v7YwrffbSu3qtzZdtV4hyqqmkQiCzAjQnJMAOYGE2uoiWSfqlNFFFWHeSgHMjBBsklVBXNeH0x8+mnxEyhxhBmFrqjIucVe4DtmybZYQrBgNGGjQQuzKgEpIqKyckzCIurcKNKOqYspAbis3sLyFPRcr5lje7UQCOfhkwlluBwb/+hfzs+CMI+Ww8KkfEoptQseEU4Rp2a1R0AEVnHgBEjV3zwcf/u796tmfbn1msZCeSlTKWJ7D4HqGGPXDaGqqrrROKhhSNBs6ViKbcy8KqQQgrmutOQF2nAJi5p/TUCmrwcATjyO4+Sqnu6acRzHcXTOnZ9dmBcYynEXAZtmhaOLKR4Oh816Y1rDst34pMD23quKte8dOe88FdiinQJMDlYV+5ynj9Ui7/KzLwLBnHPGlxAVmN52mz6zEb+CTyGysySKvLQ7f1i1GXw0pE6f5Bn+B9XhU1cQLkdblsrRcsbl2WqjE+qEnoWp/seVctTALaLFpkiIIGXXISRRRAYUReQhqR/ZO+ecD84Zujc4dY6wYCwAoWSFCKogKCEJYsltNU8tu3Lm1pKEYZP34Kjtht2+5cQXq+byYhsqinG8v3/c7Y+Vd2fnFxB8VL3f72/vH1SFvBu1bMVleA8VCKipVirw7rv3N7ePbOcHUe/9Z5+8/fKTTxrlw93NdlV99cmbbV0NIJJM0POVs99JK8Qg6mMi8l9cXX319u3ud1+3Oo6JAStEQodKyqJIwAIjy6EfBk4MOnDqxiF0oXJehIP3jogcosPEzmFCIE8OiIyeNXJ0IM55LjMdiFSOEsbjmqI4IYp2w/DQtrf73WPbPhwP73cPN8fHI8dIqiorQnJu5Ph4iCSMCGPiMcnIEllSHBy5OiAKS1RH5EPwznly3vvgffBhtV41TTNd/MsDVeEPYYxxGAbD+0wNWpRpglGX0e4A4IgI8XG3e3zYxRjPzs7W67Ut+GXYS1WBWVKKKcVp2Z8PdSopcRzHMcWM2hBFD+RdqCpfBXIOAGKMbdvu9/u26+I4IlGMse/7tu3W66ECco6mUWkiLF4BmeMn5h38ibXlpJU7DVMtrbtTr3m6x02rzTPZ5IIPD48PX3/99f6wf/369cXlhQ9+TKPmfcWqRBtXyUcHctS17cPj48PD45u3bz55+8nrt68L9B/Q5Y1PQcnl/TeldP94f3tz65y7enW1Xm1W69p5NwkphCAqiCQvpdmLQPzy+KOeP8qtjpO/qsidqCdAPYHTnJMJQKyO0BE5JM5J6LMytiw1nlQ4y4J5acDRhWh2UlTDbBn8R9jJdKkV6wzjAn3ySqY1FNGS34r8NrXZsdgWzW8zcaxApUCs9CRkbGFVmv2++Z01tdhOITJLcRMHwj4TycOfWvBduXbNiC+VHAmUY+vMg5ztlPNcqE4vAoBU5s1E8idFmkJ2uykBeETvqPKuclQRVd7X3teV3zTNumlCHaqmWq+aKrjau3Vdr6pQO+cd1gEcgXfgHDiXg8cIwSmQLoJkJmuPWryd1XNAgOZsk8yqFQQ2ay6UFCZOHGMfx5jiGMeYYkz9yH3fH9vDfnfc7+8+fNg/PrT7fRr6vjt0h+PQtu3hwCkyJ+UEnICTioAqEjlVyrZtRRBCRZEmuODdqmmuz8/eXF0d9gcSUIa+G47HFt+8SmnsB7bZNpNjESFYYq4ooXo1ThdMnCazjFvsGmkB7i4SRQhxvgxgMXZnXQ3Ej50GcvNAFYaRH/ZHIRRUBVYRT9L34/X5KvgNVVguNOtVoD6Jvy6ckqe+2kycnCWJZZ61RYEVUQgAtQpuvVrRMiNkxmXqHFjy992yp7/mCdXzxIr5NLL6++7+j00nLCIqXx4/lO1MNFmnQmf4TAG0TudmU/TQudDUKwAXk8TIY0rM4hxN6nARQ2GaWC8NiFmSnZFqKoSoioQO4Xs9X8sd53kk3fSf5u846W98PH9VdYGVAIDniJV5A5xmSTL2HgVRABNQVBgiD9GWSJs5JAD1BVVpgW9iyMYSf2oA9IL4PnE8G13m+dTOhDhQ83UhOU+iOIxjVVfe+/Vqsz8eHu7vX1+/Wq1Wu3Hf9v3Z2Zaq6tD14zh2tb8+36y2K3CEAgrIqkkEkxCBF5uhLC3hrNyCFHyvmoZncXyabcHTdOpy3VPNPtspIlYnvrM50yAnEqgCiRCpdZGJ0DknoDFxSpGFrbknKmSZ4RahIyIIgjgIt2kchNnGTyakrNqFOkdKnUb2TpdEBnuWhW5xssuHq+UEOn5swBuWKZ4nicHzdTcxjbQMccw0IgVgUDQXuYXbUnXoht99c3dxdnHx889AI2SAkKrlU1ggAoGqxhjHIdZVU1dVkjiNd88HwqzcOkdENmjr3FTqEhXGmag515EAyb4cATIv2BkaeLp7RWKMqmpwiac6mkLlg7UVu67rqZ/MaJMpeBgG55yRixHBexcTT/hW7z2Ry+Pc5SAZU5Ik6k5u/OW0LxYoiqraDy+z82VoJju484Wipovb7W+LxotC/IN7PB8g+PuLnu+rkp6Iv0/pE6djLh+d71ycxfIAzJOBlWXAzD/w1S6fSxf4pNypmeZ+ClxVFmR/EGDVmBKREHFwLiAEhOBd8M5meBw5R6jGclbKth3EiUekOC24asYbKV1mW2AAqOuG/bFHpMuz1dm2CYF2x/7h8TCM6eLifH12rs63w3B/OOyOB1u/REp23jLuDwkU22O/b3dtPxCpI79eb16/uv6zn/30i1fX4/1dG+Bs1Xx6eeGAu1hxtNAC570LRKjqQYMCxUikV83qqzdvfnf7Pg5tH2MUcc4rIIH9MqoISbSPsY8xig4phUi1G9u+55SaEKqq8koSFRCDd4TEPigSTGThMsSaVMhmpaxhLmwdUGugJ5YhyaHvH9r29ri/Oxzu9/ub/eND3zKiEhIAOicIY0xjio4UEVPiPsYxGp5dAzlHHiQJKHiqqsoReXJVXdVN3aya1WpVVdVTZ1ipaBAwpdR1nYhYg205agMAah3ODMKci6pxjPd3d23bhxBWq1Vd19OAF5Z+XGKOcUwpSQ4oyrAlIhSVZBVpjIaGsNLWe+eDd84jkTCP49h13fF47LuOmSmbnccYxxgTuaSasxgt3cB4VHaOyaWWKjzDQU0ZunOQ+QxVW3JB8605oWly0JyKghLBGMc/fPuHu/u7y8vLt5+8rZvaSBd5KIlwSlufnpiZ7x/uHx93vgqfvn7z6aefAsAwDKY+Z82kHDoIKaZ4OB52u13idHF5cXFxUdc1gIqwFPKV7ZmEOv3Ny+NFIH55/LE04mI8QZzmwHPAj+bRNhBV4WKDhTkXBzgfFpxD5zFFESOZ4pKUB4gfOXZ8j050wno4PUoAzuaaJ2eLUyF4TqFfnDpOiIL68eUVFkXs9HpEUdWRCika8wGZaZ7KV1FERsdEKeeBwpRQr4CiZBSERQI1CuAk1wkUTFUJAl3Iu/ZtJFYJqk7G0vxW2F6SfyWSRYqgoZZAjFhUvMRTqnCRyBxATX4bqjp4R+SI6uBXVbWp61UdNk3TNHVTV3UVmrpu6iYEV1XUVD6Q4SkKrdm0YAAUCzXLqiZZGlA+sEAhlqAjQAWbSkYBYC2asQBHZZGUIMU0jrHr0jhyjDyOXXvsjof727v2cDzuD+3+MLZtf9i1x0N3PA5dd9jv+raNfR+8R2XlpCIESKC1twQcG3ZVAAj5+lcH6NAyo6UKft3UTVNt1uuL7caZ8KOIgrvd4f2Hu8/evK40dZoIFChr/YjoEUgBwROR56wQl+koQEIiQUVAJVVSNH0ZRGmagwbUnPRYhGO7uvNh3BTcXKiXY4Al39HAcugGRjOJK4I60HEcv3v/UFXO+9qRmDxCmqPoLZUug4dlEkyzRLaQGkiLC17AIpOMoCrMBnQD8BanC8E570hBsssu/06AT8zSz9Dh38eQwTmj3qpvWgb7aInh+gfXTk+qo5dy+ofzEKMJZs8C4FxdFgqKzlsJOR+qGoBSkmFMMYkIMOqUd642Fw8FQ1S8slCk4UWcu2ZXhc4BWXDqrloataYqeqnkLoxaT/zvetowfQ6geNY1Wlgdiz41Fe4KRCUaFVmhj6mL3A9pVACiqqoMo6wmq9rmX6RRkTxpIqpcBPOiTgOqlpyaOdYN5GO3mJb5IkDnvSocjm1VVU3diMhxf7y/f6zqBl37sD9szs990xzbNjI70lWM0djGhACkhKJg28Xooic0yKt9AHmLJjOgCQAY4dBCVlUQifQJgDhnnhGKTAKxGOGnXBN2aEgCImxVsk1UIKBzzldeFPphiHEkwqquXB1YBTV33ZOwWkIsYhfHwziOCuqclgAnmHvFmWZxelDBCdGwVHJVZfKeP+tMTDoz5pxDW7eXeQ8FMfFMN5anByecsqbERM3prhFlBiCgJO797f5vfv3Nz778tDYCJCQAFXEWVOgy7EVTinGMTd0El8NpCwdUM7A5d+uJLJJeVFTd9BbBdK1leKnBzogcAoGqTSI75xFpumdtENg5l+eIoegIhdntvA/BAzYiYpOwq9XKvtcU6mEYhmG4uroyCd57N4zKzEZXNFEnJRYWxTwjHMcxxei9myLvlj2eSTC2aVz7IXPrQnMuIiDa2PWEQ1bOVCbl9NLx/J+IXvz9pt287XxUHS52SP37scXfJyKX3XPpcySzwD8xI0+X9PehJz46Iw/ZKFHg3XnUw9RhLAC9+Y6YoDcsAMIxsVP1oA7BOXKOqhCqYJxX9M4T2XE7w860rBdAAET2m0lpe6Jauy+wwOHYH7shNNXl5VmoKHjsunZ/7MhXV9evwmrbRb572N3vdgNHJUicOEv1hR+ueZL2cNzvj/s+DsF5X7nry8tf/PQnf/6LP/nszauHb3/Psf/y9fXldr0KlIbeNyGSAmaXr3eowqjiUSWNLGOF+vnr66/evub37+6OLbMIsZJzOafX2pA6iOz7oR1j7V0V/KjSjqOIBOdVdRzjEEdVXa9XiM6xsCqrIiGriKAxAE0rdkTknKpyksTMnERUmYeUDkN8OLb3x8OHw+Hm8f52t9v13ahi0OhAwTmXEvegoCkoNE1VhSBkLm4hRO+cOgdC6FxtAEai4H29qjdn281mY+eTCVBrSHcRMYKI9fOOx+NqtbKWng1n2NfLhOTLjQEk500dfnh4YIa6aS4vL7fbrSEOFj08TimO4zCMA4sl9eawH5HEksY4RuG+H2KMYockwhB8Xdd1naNXh2Ho2q49tsfjseu66aRXtm8RyQLxzE4ksh7hEjazCNn+yNFP9YkP7+k9N71vS4sMOkzMv//m919//fXbt29/+ctf1nXddZ3RHkpojc4Ec1N/RB4fHm9ub87PLz/55NPt2dkwDqAwBWxYw5KQbEFg4OPxeHNzk1L67LPPLi4uMslaFsk6hbzEwvBC1H8RiF8ef8yKGpDBIZDFuJSUblPRNAnHmGwpwZzbwyLCKU9OqggRMevQdZxiXpJES27K3Pn9CIQR9Uma9nPVeCLqTQvftLoBwpNDkkxDrIgnZ26TDoSXtCyAiSWoy9JL5LlsRIKQgAQRwCt4VhAUQCGLL0JUgKSYABMAAzCgQJ76Y0XLgpsSvcCTTVjKiV+02LFoloYzgNhIEAAKbNOk8/ZQSsRMg9ZMJ0KQeQRUAFTIEA2qgOAdVc45R947QvKOtnV4dXF1sdk0VVWbXzj4dVXXVairECrnnYeMbyIHgsA+qYEfJ7iuufXmpB5cqHtmly4OBBS0DikzCLNETmMc+kGYhzFyGlN/TOOYxjG2Xbvb3Xz3bnf/0B32Q3/sjsfucNg/7sZu6I9d37Y8dMyDSlIWBKhD2LgAwXkHpI5RhEWUCdCBhamjADEAiAIzAjgih6AiJFpX1dXV5Wa9apoqVJ6cG4aRWYiceBgTPx4OH+4ezpuKJGFJwcj2axYk8GQ7YiqRgVqar5DpiQTeO5vd9t45SwJ06GwbFjusWu5utlIsYiLtbCuUkwfz24tIqsSAjEXAMPQo6/ub3eXF5mzrAQVE7YNUlmLSknzZiGIxhAlwwTjQJFPjJNMWW6YRIdwiTAABKu+a2uNCz7KhIUAovONFd6coE5lsMlvfcErrRYRpjh3n/KUyeWAIN/2YG25eQj4inCHiizr8Q9vORBOLuTRLYntO0wDFyUJc5DayS3AY4/HYpZGZlUDK+EjR6SZ1WEEFmAWLoZi5cFpUFZAhc3eLdvm0FflR+P6CbYpFLXoOFphSInUpEsNSvjxF7Z8UCTNWCa3bpOQUXRLtYzp0Q1QE71ehzh5WnednRPJh3Qb9C0sJWDVNCXV6OuAomuVoJEWZx3VwCiegHIhZpgDIkyYdx1GEz8/Od7r78OHDxcVlVdWIuFqtvQtIDgAiQJ94SCzoHIrJFEA4QZCTilchpDlfLfu2wLpZSFlowNLmgnmwCJdiqhYeuwCInS/EDNOARADIiWOMbXvsjm0cU0qMCo5cqEMS7ro+pVg3zcXV+ebijFVBOYJHQEBGp0DIAt2Y+pQU0blKUrSuvBmI4DQvfMGIX2gxReL4aPthOaK+ZBDnQx3iaTmKM2ui2MBVRY1DVNC3E84CEURQVAy4Pz2HAIowAPVRvv1w99vfffvzH7+qyCmP+QVhcb+qgmgcUz8MVVMrGJPXfk8RVSAgi9IVMLWYp3C6Ip5mF5tTICVC54xCrYxsT2JBRlboMosVq1bJGx1SlKdhZDRQQw5qBeec6cJt11VVZaXv5CBu2/b8/Nw5B4BEosDjOJb+igIgOSz4YNv6KaVkTU5dODBnYj4zItow91Jim9eKGb9fnFxE+SYU0RcD8Q/SxPM9Yu73/P3H5eN/LAXieXjdR6Xq6bGkaf8Pkr+tOpx7UoWxBzmGe/IxY3HTaxnqtH2eVQWURVF5ZHYjEWEVQh2CD96WMrMaABIrspYQkPJjkHIkKxCK6jiOx0MXh3R9db7Zrgk5xnhs2xRjsz47v7weWb/5/de3t7cPj7shsiLKyfTmZFZGQuzGLolWVfXqzeu3b179b/+L//zHn38uQ/9v/rv/5/233/zo+uKTqzfnmxXKOELEiODQ3CVASKiWxCyoSXiI7F14dXH+8x99HuOgMe27gUWSLZXZhUqKEEUf22M7np2tKgHMpBsfXAii2nZ93/dEEKrgPAirjsAs5JyVkinlkE/n/ZgSx2gr4RjjOA6JWUSGMT32w+3+eL873O52390/HIchCqvD2rv1ql6Hpva1C95XjsApjwlks1r5OrjgZHfUCMDqPLlmVaG2Y98Pgw2MNPVq1axdSRmdJEi78HJ+AOAwDo+Pj8658/PzyQJs8bwoCC6TKu3ApYQKnBLHGFer9WYj3oe6rg0oPz0FM/dd17Vt3x9j7EWide/sbJhSHIbueHQK7ng8jsOooDZRvW5WZ5vt2WZbVZV1VMY4HtvjMAymqpR3lUJV1U0TQgUwl0jMSRXMWW06eBFq8Znya2gifMLM+57WTJ4r8t7FGI2w7IP/w7ff/cv/11/92Z//6U9/+tM61Cmm4ENxKWk+/lq7Q5WIWHTou5sPH968evP69Zu6XkksWrx9g+SbSUCICBQeHx5vb267vvviiy9ev3qtqiklKyinG1sRVYVVQcAwjS+PF4H45fHHeSSGh0O8u3943B+79mjTI6ACwI6wDr5ualABBG/Ol8i2k47DMA4jqDrvVXRoRxEIrnaeMqwYZzDoIlQTl5BTIlqQdOaKuhQhizG6j41ZnRRCp4eYJ13rqRSadAQrlsmRME9n8Sm6xGJrwOxiFJQCrbf19rJqNuTrMabD8XB8vE/tvtJUO0RH4AK7ekQcABMioxfKlCsBsrHKpCo5lU48COc0VQJVIMqQCvv1gSSDMEhs7p9QM8rCqkEhLYnkMaMayJEFWxCbgZQcYgguOFdXIbuDK7+q67Oz9apuNuuV9z54qiu38mG7aiyGzgMRgsv5eKrCCKwCQJZm56yAVZZkn5RDdCQIgAKo3jtEG1GaqGWgAB4zY5FFYj/cv7857i1Brj087tr9YRiG/tgN3bHdP45Dz0MPMaW+7w6HcehjP/Tdse/a9timYayqSlk0Rk194+eknRqprjyiY06JIwmDCqQEKuAJgZCcQ3LkhBNgnll1hISeCFerZrVqyHvynnxQxCSsKsE7TRrHuNsdv333IXzxGeUMPSjjXKZggpl7Sm6gAqihNqweDsFTMQARoXcuIHnMwEHzBTlHhBbZnF8eAHgzJqITEZUkKkSGE0YTiAUgiWkZNi0HqqiMu3H4cLO7uq62lPN0QTywzeplCQ1VUhJUB4qqzJoAlRwCCoIrYksRmNjG7Q08yjZRnE3NoFXlgzM8KGjBaxSwiDWKadkW0glKY8yVmU2DUm5q59A5R+wMeKnZlE1okZgIz9YEmPRnezrM9JUTrSTXMy8V9Q+nkAYxoqxkqvtiy1gO6DEgqarpWinJGDlFZmbKCmgesQAV4GIZLoMzPNF8iwQnyiDiEFUZCbx3IoqzCmZGy0y6VWEgNzPkphtEM+euyLlamLBmYcmZagA5sZEtjR2ylrtgJ+nErpyU7qTCCookzgk5db4dUjeMMQlVzaZekfOqwCKsrGLqHCYFZou2A0CyjEjNeOG8+JlkaiOoGb9hHH07N4DLMwOomCHACrgoOaz9qeA9iagI7/f7qqpijH3XEoAkvnn3/urism+PQ9cxSi+86/qzVU3BB48KypqyoM8BkwCwElTOO/ImIqoYZT8vMVggToKaODlCJEQFViJbrC1yzda53C8XGzK1tyJximM87o/Hw+Hh/rFve2U2EdCTD8HHGPtxEFVfh93heHEc6nVNPnjnnXNV5R2iArQjH7sYk4pm5mbmTOWesNm/MXfEMwYUlmuqggWQThUjAzpb+xdzFlqy0HNxCJmNNAlAimDzJPAxxxHNjQxFFTX8Z75BCBHN2MsIRBgQQCAhaQLYDfHf/PrvVmf1JxchgANr8tksigoSSZKhG4eYzq9fr1ZNP7aqkBiQwHkHCsy5VZozI7NB3biJeZuZRlElU4BLihsLiI7jYNuK+avNEZxSCiGY5lsGtVSsOUJopifTYauqEpH7h4eb29uz8/PVaiWqAnB2cXHsum4cKYTgPbMG38RhTGMCpwoqzJK4IueqihwhCCjvdg/rdUMUQNU5F+p6UjFK0jPqnPqMNF2si4gwYSaivE1O/QH9x6uAL4//dATif2AKHH6sLw4nKS//AWfe86gGfBaU9+RbaOGI/x8qEKtmf0txEhWvDC58MRNvr0zATX+DVoEqqzH88qTMwEM7juQICdDZoR0RXcciztkEoMs+HjtpWxuGAF3bt4/dkIDOzs8uzrbey7Eb2uMRAKt6FQX+9jd/99vffT2Mg0imkOeNY0HoQQVHOe3j7dtX/+R//k9++pOffvnFF2d1dffN737/678db2/+7IvPPn91uW5C5TRUvqZaY48gik7JAaAjcg4VNTkZKB2474Yj+OrLV6+CyNZVX7/7cBxTL9oBjKIjKFtbCeEY0/1uVyOQgkM0B1McBgJAO8Sjj5wEgdAlZpVeAZu6CSFwDpGGlJIpqgbVHTn1MY7DkFI6dsN9N9zs9x/u7/5we9PGgVXJ+6r22/XmbLttfF2hc96RJyKKY+xiP+5HRw4V66piERf8q0/eQuV2XdvfjMJCNZ2dnV1eXW62G8pHKDWMwyTjIqKw7Pe7tm2rqtput0uI5dT8UzyZunHOscA4jsyy3Q6IsGpWq9XK7MOTIKCqY4pt3x2Px2EYbVOwfioROUdGSUo89l07jiOnREDq0HtvZmdnr1MgpZRiYuZ8JvFPBqBp2REmquzXnIIETm/kpQEORE6cdpOG/n03mXMkoogUglfVb7/99l/963/9s5/99Oc//8VmvVZVR25JpkIUxdyJJHSi8vjw8O7du+12+/nnn6kCc0IktAyrBTx9WnAeHh5ub28B4Isvvjg/OxeWuUBEQHQlgSh/rsH7FwPxi0D88vhjPo7t8Ls/fPjrX/3tN3/4brffgyZPuF3Vb19dXV+dv76+qn2wIFHvkIhUgBw5RymmFCMCOkec5OF+1x47Hs2WQrrkrs3QnOW0Y2kBn55gdEK4TYqw6PdNPJ2eSKay78SlVeYwC5EhT8tOcXz237L8mVp0PUUzUoZwdn311c+uvvhJaLboKxbd7R6++/3fvf/t38pwCHWoVqvgQs8qoySgBKREQN6SVowLYO6OScZ2FqJqSQgEiMW9nfNZpmATqxUL6LFQB4v/CqhMfRCQB++D984HIo9YOR+CWzX1ytjBIXjnau/qKqyaugqhrirniAg8IYJWzhECgbqchcf26lHyQSuHuluhj2S6KFIGTNjQGTkgAAJ1qk7RZMQ4xnEYx66P4xDbIfbDcX/45rdf7+4fhra1vXfse4nMMXIceeiAE4F6QCey5rQm4uAfW01D78dB0+gdKAtKdCBhgTBDQFRX+SopiLIIo4ojtGoSQAmUHBCieEJQIk+EROCIrGIEJFGNnDSqdw6Bvae6qaSXIaYxpruH3fX1dVP7kmelimI9UzJ02inzhMr5xKAagJKlcwBH7Ik8IpEQxYzsyKBFsPrQKtjgnXPeOTKcl3MEkgMDOI9yi2eRfLoWVHUiqiBMj/v+eBzqUKMzVKbAJNNkm1UahxGSNwmYJQGy846cIxKXeZsmTsniHoYMPTQcqKpzuFrVLivX9l4gnPaATm7i5QSATsF5UDSmyUWn1m1ms2jqXJCYl3kqF07Xh3zT27s4ndYn1eQfBct7efyP/yGqLEKnW8M0xHfKSQQVIeecQxEZR4PHiSt6a2HYCrD1Q/KR1wLZCslUVFiLfmiuPyB03suYihI60WKkNFjm5JAJfgQqmrPOZFHoz8d91SkYRgsBQyWHrhY2RY5alUzKLwRbBrX4d0EURCU3MB/7nhV9VYV6jc6pTvIzgIKwMqtAgWrkN7DE82W8xuQqLa+4xPFlTi1mFmLWH2Fhqsq4i2nK0hDtOJlK7A+W/f24e/zJT35yc1v1fScikbkb+pHPVkFLLxcAQRTLFC+QU8KcWZ4HEoo4amGZNpxBCAxc/N5AOLFC7AdqxoioMEjiNAxjjMys4zD0/XA8tEM/jP2grNYPJSEC1KTBeb/ySZhB+m6g/V4Iq8bak6BESiiA+7Z9OLZDZEDHzI4AlObFEmfBp4AFT/ISIKe3zleUMb5sUNV+j/x5zIoKLHJ8J0VRcbakwgLGtfhwn5y4SgFIimZJZhYEFJOmc/dSReGb9zc/+vBqW7+6qAscOtv6bWhKx8iR43lTVVVwdikKcL7M0BoWZU57CSayu05NqrALXmzTwClMGVQkplSFimyEHEFEUmIrkovEoDkNK7+tOEHA7S3y3q/W69vbW+e99958x03ThKra7/fOOb/ZWDEPgCLKqARKgI/7vSfyjgS9I6qr+nA4DsNI5EzO9c4Nw2Bz0KYIT4DILJeJlkGbk3AiA5ziggiC+h9Dn3t5/I9VI/5HiP9LKbmYzZ/f3f+Q5/roBbWs5p4IUqeDm/9//qqk8xVdnhBLZQSAvAyIwcUiZb8b47SEIlp6jmauRO5LstVeNu/qvK/LYEneq/LeICYQY9eNMSbv/apZO++EI6cUY0JygLg/tO8+3Bz7HiZ0D5ZcmYUar6Ij8HZd/+xHX/3k5z/7kz/786ur67P1Zvfu24ebG4zx81dXn15fbdeVd1B5rL1LEOo6AIIgCjoA8oSeSFEZJZEm0j72qe9Wq81l3fzo6ppH/bA/PPS9RSYwp2SRqghJ9dB3xzqs69D3HqPIGHPGTPDkHIv04+BVvVNhZWYk9CGAUD53JE0iwsIi5sJIKdl40TjGY98/HI63u93dft8NI6Oic6H2q6apQwiANfm6qq3rp6DkKYkmjuSoClXlKyEJrr64uGCCISVbDKuqMiiwM6a8gpXwC4wJHg6HcRxiSt779XodqjCtqFByief9bZ5b1HGM4zgSIZEPodpu16vVysjFkzgroimx/aZqhpMFlynDK4yKwJbTIAzGqXcT12gcx2N77LpuGMeyUwAhBR9CCI4I5mNhpm3jYi8gogkxAace6ie34T98PVERR8Qpfbi9+Zu/+ZvLy8uvvvqqCsFma+YAj/yT53hhRDwej4fDAREuLy9FBICm9xkWSVL29UT0/v377777brVaXV5erprVnIc55/TAMoQZAexTeFn5XwTil8cf7XH/sP+3f/2b/8d/+//+3Td/aI9j5fGnX3325s//5C/+8p989aNPLzbrpvbeESKAaVbojHmrwiqaDcCsX3/9zbd/+O7u5lGksAQWa1lOPlWd6+XpIELTwR/hWXhdTuialNOpX42Yw1/nL1bzByEUYyBm1GkuU3Qq4Us4LQuoCgs8YT6CKKjY2L1zbnv2xZ/9xZ/95/+7yy9/IRQYCJBi6m/f/eFf/jf/1/bDd2eettttD9Tt9h9uH6IAE5Hz5CsEBZ2CW6YHyaLcMXa/lIkMQCIk0UTkLJrVpuhV2QJOHWRfSRWqEFwVXGXAAnKrul6vVuu6bkIVnKtCqEKoqqoKVVUFTxZXa0QEsvrZjmGEoJxQeHGkRC32lEwSJkIoyqXplmZFUtEkypIk8dhJHCX2GkdNI8cxjTGO43HXHvb7+9v7w34/tp2MY+yH/f392LYkQgqoQoAOMRDVKqjsbSjMmXFWESCldAMJuh2O0At7iOhACEQJIav8piuIo9A0IJSySkGAAN7ZwCyooop3zlW1qjoiu5AcYfBUBUcIqhzHJAnZOedou6q7TRPjOEZlSfePj7vDoaqvgQqbIde9eBIyBBnkK3nMGZAIvKd8qgAERSIgz4ishgvLbfqim+hU7ZIjQvJEzqF3VDuqfKicc85ZDwUEkiiLMSMEVViUAEDcw264uduvagrr2o6N+aPPw+LMKbbHo44OEFlTSiOi1KumbhrnfImrzKP2Np6XZ4ALKsJeqPd0eXbmMoEC9Zm/V5+ownOxP8dBlRFa05cQETVpTLHru1DXzVptvnsebMelPpxn2O2AlRLHmEIgFSipD8uy5z/spnl5/KdURYuklKaTpc7SGD5vKApAXdUhkMjYdW03DCklBx50ztLMArFOWXVSBmlNOhRVVs5ob0MwAUAIYdTWnpSyYVNVMWeaLGKmcxRp4VnMrxDzf562Mcy9yxl6ISAqiriwakxEhOyQythyhWQseiJFGhPv2y4JVHXTNGtygUVHjqb5goCw/fBS5Rp9SvJvnOnDs0k/Qywwq8NQnM1EBIqgdEJZxYJlpIJNmMiWpjg7RyYND0PvnGMR7nlMIxICGUWEu77vhrEJzmQ2RXQIwpIEVRRZMUhOBUVypA7BKSKg01z0CIrtYKbYW/6Kouase2BjrVtVyMAxxq7v2rYb+zGNKY1RRRFpUzfnzdqTc+AKbQmdI+ed814JovKoiT2FEJCQMDviGN1uTL/57v039w8xNGG1EVZQWuYoLDtYeTL6FPQJZTgi15YlWd6glZOYiLAEE8NMdF8oPoU6r7AML6WT4Kkn5Wj5fyh5pWKhRponO6yxDPt2+M2//+ZiHVZvLj2imLM8A0uARft+HIehrkJVB+ft2KOl2HYZcY0K2a4lk2d26vVn2z8BMOg82WM2K/QuhFB5X9nxbxxZRJ3zjgJO4I7pTSjtjeX7470/Ozvb7/dd1wHA69evnXPB+/Ozs5ubm+B9XVWTyzNf50QhVDGOx+MxeE9EVagvzq8efv/10A9VVZFz1m09Ho9N01RVbWPCRDTFCYkKs6BDBAIyaaJ4rgjh2eTcy+MHtZ3lg1E2si7PTSXGseSgLL8Lzek3HY0yKmzKN1mmvJzc/4uoFlGZBkDty3Fh6VmUaRMvHMmReYiEZc5uPXXzlEUJS7VzAmHKWLHcppyjcTD7Bwhm9nAOlnsSVjNbi0/VQABli8IGlAnQIqCqhETOTex1tdUpx8cgIKUEu0OXYlxtNptNpSgskkQiaxJth364u3nc71WUCHIwteZFfjFKq0L06tX1n//Jz/75P/9nbz75tF6tg/PHu7sP33wj3eHNefOjy7PzdeM8Iqhz6AgRq9Vqhc6xglgBgegBDS8HDjAgkMauJ5aKwtvzM1Fy3uP9PY6jU1TQgZWVLW/g4ThWvg/1uqpE0sAxrr3HunHOk4oIR3GVonhlFmb2LoyRRRGRRKy1FmOKeaEDYOYkbCF4j4fDh/u7d/eP+65lBDH4EznnPQjEMUGNVVPb8kyVD64Ch6q8Xq/XzZoU05ED1aEKytER1lWIXJ2fn223mxC89d2MgYmAxjWKcdzvD7vHx7quN2fnpg7jhEKykSURAiI3XyV2+4wxdl2nKnW9Xq1W6+12s71oVmvvnF2fokIAIjyOwzD0KY2I4J07jTgCCzsdI6cY51lkT01jkXqBWWIc7x/u7+/v97vHOA7WH3XO1XW9Xm+aZmV9ykJFy1M/wpw7/TDhMxE/Fun0ZMD6+b4w3RrWWBFm5z0AfPPtH37/+2+c93/6p396cXEhhYA/3eZTrWSDbCKSUrq5uYlxvLi43Gy2qkATGHNh1TJ6hqoOw/Av/+W/3Gw2b9++vbq6epKRMDmdJ2+E3UR9P+z3+9ef/fhlI3gRiF8ef5xHNwwfbu9v7u+PbZ+iXl1c/uVf/uV/+V/8L/83/6v/xZtXlyRJ0gjKoMCQZ++KTMR2ihVmVFqvVyGEmXu7VIdPG9rL7vQ/4FyrcMolnpbFPFy4wLd9X6NsEqAmU6eeBMBLnnfVibOjgGbOQvW+Pj///Gc/++IXf1pdfzoazgGJPJxdX97d3XzYbFzfNqs1ilYJ9OGoKkbCI+fE0JTz+oxIubAW1dlAZgWO4Q2RCd1keHPoDAVJDoN3VQhmSKm8b+qmqcO6qVZ15Z0Lzjd1tVk1TVUHF4hc8N47T85p9k8uon9LIHYRhPPuhJNvJffskSwyDdEpAqhTRFY1FVFFhcdh4DiqcBq6dvcwtsfYHlLf8dAPx8PYDzzGvu2Htn98fOzbVhMjAIl6B41IRS548q6y7nDlPYKisiOsvA/Ou+KYScmNfbNb1W2394SO1DkH6GKKzEw5SA0M7UToHCmhcy6PB6Oic8QsAEyoRFhXHrJVLYeoqricNERggBEEcIRN7StPvlxnzDyMo512VQFlvraJFnlySz8HABJ6R975zI7AnFFLziOg2CnOPh5ONrw9yVKiAiwiCRTMse2J1nXdVGHVNEjo0CmSKFqiFBV5WQAQaIhxfxiGQXRFCoyTwyrvyyyJUxzTSCoSOfZD6x0Cog+BkEQ0A4+Xgu7SI435OO0Jt+uGTFlS98Ss8qTNs7hJYSoLQJ/4YLL4zsLjGFNKWpgRZfD2Ob98UtMwxjgMI6Ed6fLyBc+f6eXxg3iYj2OW/xWWsR4nwW6I6FxVVd45kTgM4ziOzCzO6XQYV8jk/QknIcLZMjznthmYP4+TsljNCYtbbKqls4K7IMQVBftEHZ7uKvubpSdLp65MyQuYSuyFX2nJb8lZO2bkACIFHMcxxVSvt3XTeO/Nk1+qesw/H/Mr1im2cuqdlpEVXIw+G3gY0CECKkumRdJyoGfCv2RwcB5jwGLzx6lgUCVmSZxEBYGQ8OHhHgnJOSMARpZ+HMcYqspTMZGpooqkBBHAIXgvpOblyp1OvzDAoQKIze7g1NuDHAxgmHWTwsUMrIl5jCkJAwIR1XXtnV/VqyoE4y6h5OmKHIHnkJxzdVBHiWRUYYDEiTA3vVnhw8Phd999eHc4rK4uz+q67NJPTzulBzeZsD8OA/3on+Gp7xam6Duc4z/z5I2enLn+QdbCZT4E5DByUVQQBlBvUGBf3T7s7x/bT6/PMdA00GUQElYdhnEYuKqq4D2d2KTxdGOYpa0y6fW0wWdG+yRJAcjlyrOuG+8DWVquKjMjkiNvjcapnasne8fTd8C4lrvdru/7lJKxKTabze3NTRzHYRiapnFEbJKEKqDzIdRV3fd92m5VkZxrmsaRG8ZxlbhyzhaHcRzHMW425qCHySpuIBdWcUClBa04hQliAXq/rPs/YIl4klFpCeMrvSGYzkdPz1MLfXjCM8xa6lN9eOHB1cXJ8GM/c3nEWgxvzTZAh/CRrtKyrVW6tjo7KRarly6TJ2E5Grgk4EzSMD65UU8YFIVTWCzFYGlYhh+eRmxyzyyflqcoDAVERRqiHPtBRJqK6gYAVSkoqRKOnLhvKTrEotgXzZwKHNleq/Ph7PziL37553/5P/vlj378M+d9HCKrPN7dp6Fbe7pY+e3KNwHIUQEvIznnqtqpamKccH0lnsMBVuQa5xIhx0genPNn6/pyXHV9O3BU1QQkQIaZUMSW5XHU9SjnAoGQbScSSUls1MQ7URFma7EhgFVMSqiiypw4jXEcAZCcA6IkJhDLkNKx63aHY9t3ohpqLyKKyipjTArCjlfrlOcOAdD5uqlYxTtYbzerVSNRlEdQaocuSVSQuqoSx6aqvCMwsk6O2LFDAsdxbNt2v3tE0M16dbZe+6q24wxSqQ6s7SfCoOQmDRYTc993Ihyqqm5Woa6qurZhTiPHi4pFMwnKmMZxHK3kXR4jp7xTFhkjx5TKxBE476qqqqoqBI8IMaa+b7uu7fuejZpkebYhVKH2LuS2Tmmf21QZLFhp2T5WTmXPVZQnZwB9dpOfdJ4QydHj4+N3797HFH/5y1+aOjypurC4ixe3LzHz8dh23VBVYb3eqprV9ykAx/7svR/H8cOHD7e3tz/5yU/Oz8+992agfqJlLy0Clpr429/+NqX05//kZRd4EYhfHn+kxzAMh+MRFLyHVR3+2T/75f/5//R//Gf/5JeXZ+tx7FKfjNYv2e+hLGznV2FD06qIgIBY00nLKQHJHEtPahj9fsvDRye+9amp6nSRO/3hJg3As2zoPLdb3C4TSnLRG5uKcJ3mc0GVVany529e/egXvzi/ftVXHljRgQKAQ7fefPXLv0Tnb37776MPIIS+Z/CKgugttcwwTwSm2aHkeScu+SqWBagghAgOVDQpp+DqqqqIhJzzwRM5Qlivm1W9ujg/a0IIwTd1VQdfhVBVvvbeE3kiT+gIDRBoGzFByvPR1tIvycOnxzIEyOMrJr2JzrMzIOoyYDKlmKJIir1wGvuu74f2cHi4uzs8Pox92x0Ph5vb2LfECYU1xtR1yuwQz1frOtQblTPn62blnHOA3pnV0xLsQERSHBEFlMH2ZmWPVOXIFwwOLs+2x8uzx8c7JiDEOngXQtvqIIqEIhaZIzZeNIWAW8wZiDpypg1YlI1z5BHaruc4iogSjIMgiPPeUgWMXxYcVVVAFU/okJIIOBjHUSxnPPsNTQNmmxItV+xsYweYtn4TS2xsCCnbApB0Ig6iFgQ2lnR6Q46OMSqzikTRtu33x94TnZ1tmlWzOXOVQhBQUBHNM+b2Q1RVYLcbu074DFxOgjZUgwCJjfJySjHKOMau69ru0DRVqMOaV0JORACJCEoLJZsVxWyFMAsYRLher6aDnGpmui5QbB837MrkRSuRV5MRxE54JtYImAC3GGzPXkp5UpPYH7q+79rWuyCiE5JrUVApLmd0Xx7/qdfTKmK7QBb5TiS2JwKxd66uq6pyXdsPfT+MQ0osXmaWj4ipmHM/Mdski1qsGU/MzDZHoJYTtZDzbKch/Egw3XMc5PKZbKpkIRnDwkes+nwj1IWvysRck8MU2fANLgC6MaZ2GELdbDZbcoEVWDjFpBbEZmtBhhoXmkSpn+1nTmqvMEz+X1hWKcvQtMmKYsx1AGDOBS4BKoqISV0FMQGq4hzZYKawKDKi3j/cXV5eDWN37Nvk0Ikeh2FVV7X35LDU9oAKSWRM4BCDCNn/rP9JLgujc+zrfMZQzfw/tF+XjFQtSURUgNCFsNquN2cbj54UHTqHREQqykk5xjhGTRbj47JtL3iqAzlyDh3pmBhHRRQFiaJtiv/9b3/3N7//9r7rLiInxfPN1lGwtuNH9d8nAQyLXt2JSwhLG6wslQBl2NOidRgkJ5LjEy1K8Imao/jcBviRc1pe7a1pIZEBhAlUlTwgot8djzd3+/aL16GqCfNxURFJYIi8Px6PRznbbhMnPdWmdCYFAZX0CBWRjNS2eaasBEy8b2aeptgUNFQVAYEiMKiisGTiP7onN99TioUuNHOR9Xo9jmPXdfv9/vr6mplXq1XdNMM47na7/x97f/YkW3KkeWK6mJ3Fl9jukokEUAC6u1DdU11NsqUo5Iyw+cj5k2ce+DTzyKcWobCbVY09AWTmvTd2dz/HzFSVD2rn+PGIyASqZoToTglHCvJm3Fg83M8xM/3009/XdR0zc+CSsxvNmHm1Wn/z9dc5i4ERIjP0fffw8NB1XdM2TOSnlP1+d3a2IYrepPGzgmoGNbVAQOrtUFUiIL864Zk4fhK4+Pr4PvQ71ewExTfftAs3b+Vt20lDaA6DREDvYC1V5CeXCeJTXfn5ZYRLxdrq/+a4CO9nuAuSiEJAVRMpPnDzctFnzwRnnMVffEn0tVm4no1Hz2tBA0OdhgxOapzjTeKQ+bmj+hJ7XX38Rwx2w7DbDYjW9dh2SJEC9aFQbEOWPOxL00R20p57nNEISVUZK3wAkN6+fff3//7/+B/+w/+9W3XDMOYhE+DhcX9/d8emfaRVy+ue24AyOXm8dRpCDKpmaSaq4cQVbJEAKRG3HIaSipQmhM26y6ZJ0mgJxqwIAMEMspgZFYD7sYSH/bbvus0qAhSxEQpYYQ6AxIaqvlASYSAMWryjqSJSSlIZPbbHRxBFNZU8ljLkdLd7fNjvU5G2i826jwBSikjZPe5IITJ3sV21HZiWMpLZuu1BgWNc9et+1e0fHsV0f9jlu8SBQ2w2/arkpKKlFI4RkM0TgkQK4jiMd7e3D/f3b67e/OiLLxBZDVQK4HQEUoUFaklFkGhKZZD9cNg97tfrbdt1sYkcQoytGqQsQEh8jFvDgqKSJeecRcosKsybskOxUi4ppVKyiCFSYI4x+HAvABYpYxpzTmriZ0NkCjGGEBF97kqd0TJj9bSOXPsoFmhtOrzQtX2RP2PPYuxm5qeRxRgN4D/95/88DMOPfvSjn/7sZw8PD09SlBehTVqnVohTyvf3D8xhuz1r224OwXm+fPnWdv9w/x//43/8/PPP/83f/i0BjOO4fHqeFuufLCIAGALv94ff/OY3/+v/+r/8/d///esu8CoQvz7+Yo9SckpDjMgM/+KnP/q//J//T3/91z/dblYlj5qTr4bVW2TLvXNSlzxeE2lKyTFP2/S0D2LGaVTvSYmOR81sPtPgfP5ZJHQDzNWILcad0Ay+S2vW6TFN8hpOwMZ5FnJ2YegRfKr1f0hTXAk1/apZ9+rtVquvgwiOKTf9GrrVAARKAVh14fby07wjZWfLsAihEZo4KQvZV1YiN5sEz3jZbNfbzarr+rZtu64NHBi47/uuadu2iSEEZl/t2WtuUzAlUVK3AiASG5IZCKiHv8PRuOXWKABwwZQQiZCqoj3RJ0QljwcTzUPSnCWVcbe7u7l9fLi/u/mUh30+HFIa0zAM+wPkbCIgElQ7olWMbehC0/P6LBB2Tdh0rYoWERdTSiml5JxydWjVl76oCrm1ByAQsZkACEAMzISGYbVaXZ6dferXeUg+ShwjrZoWkEVUJYF5YD2WUhrmyAxqhkpIAiKS2X9AoMCEKgKgkmEqpEXKMAgHJrDAXDN81QiIiLu2G4vZmAxhGFMuJYRIc8DazC/0EzMZniYw1o/qfKKus+CGUkOKT4/ONtsrwM28TFy1cjMrqc/jUHK+vn+Mh8MgZVMyUeCmMQM1b/sj+fFXYXeQx30eRm37YCBaZGJt14E9AyhpzCmVPKo4WOz4QPSYp/muq0lHaorm014AikS83W4CQ02dr8ex6ccoAR4P+icNZ6h6lq8kz7EUsFwioNIiRAQnIKOBk0TQDEspamLGWkzECP0Af3xprVLM5iiv18f3QyA2UZkkLoIFLfFE5wIAs1yEiJomDAPkkocx5SLiOtOM49UqAXtXpC7wNbLOZw4qp8i0tid9Hh7IyRGwbIss3Zd1o1w8dVGddy6Aih3yPpLZMRQOidiZd3W/OYUF2CToIgGiASkAEBNHIx5LftjtgHi13iIFL3W8D+hfp9MPqhFk9bY1AFCpNpFZWq36s8tqdDSeeGHg0sARArgAAqrJcYGbKBMOgXX26/TiYMVoFBnzQEy5FCNIIgB2yGUQzYDsoB/TQIQAomqqBMY5oMfDMDIgOFnf5wg8oc17V0SGNYbQSyDw8SSspAZQA8DQxJZbJgZD5+OamZunhjSiw3JRtRQQIKKua5vInu7qJmQA9R6bGoyit/vxF1/+/np/OEgpN9elZPzs84uLK3jmfH/++DbbaNWDmBdtjcUn+1QsYg0LXWgsdtpsOE3OgScnt+MRrqKxK7lLK1vERKVmvZmlnNEoYPuHr65/8sM3XXfVkuMgyDuZapaKGEBkKkXADMmp/SamzoReimagKojg3AX319dZbp3kfzjxJ4JhHZECPRbLNNW91ULuqbAVU400X4fzi6CqzNz3vYjs9/vtdusom9VqdX9/fzgcRCQSeb6iiB+MkZnFbBjHPud13wPC2fn5/f29y+PM1DFfXFyO4zCO4/SmIzDFJpSSfbAJZoyLaXXqTyrgyWTeqzr8/dvR4HjfuaPgBefgggXx9MvVAJ/Nm/soFf7v8MwWpdtiFSJkpBgp5xNL0HK5+Es9lueBbw/9QwBywreqHg5jKqVt47rvkUhEEK1I8Ty62RI1jcdA7SQb9F1TRKzIT/7qR//9f/9//bu/+7dNDGkYy5gCc6DwuDtokY5jE7GJDVMkN1cd31ljpsCszFLExxBhgrQSM0djZmJumpbIWX3Qtu2bq6vBbLy+2ZchEnUheK8TA6qW/bDbjyu8OOu6rgEMhmikokTONhZDcw6elCKgIqqinsNGbN4D8KN6MR1SGsd0GIYhjWISAnZt0zWtImiImotiQVHIcri+vRkSqKqWtOr0cf/wcHd+sb1se8Yw3uxuv7rePeyB6ez8fNWuICIgpZR2+4MAFBNAk5xLziUXRFyt1u/evDvbbNXRRuDC/yKbVW0GMXnX2cyGYbi/fygqm/V2tV4Tkaj6BsGh1lhStAYLE/hKjnW4CpY2FK9nHTFRii/UhGgxxrZrm6ZlZlUdhv3Np0+PD49jGlW0WoQQo1uRmABNxE8u6t6mZf4eVbGal0SWCVNmy03qu7pNPt40rRim9unm04cPH3784x//8Ic/PBwOT+jhz+3AU/GeReT8/Pz8/DzGUEp53sCuzxdxt9v98fd//PTx0//wP/wPknMSMTPXgmedxHtXfuQjonEcf/3rX/1P/9P//D/+j/+Pf/2v//XrFvAqEL8+/nI9aoVSVEW72Pz7/8Pf/e2//puLsy0HNoySR1EtYqqIRmiqKkSkKiriKAaHEtKC0EBUO7d1hv7UNvU8Hnd5xHnxQYgwBYZMJyGdjRJ+4JgtLXYssStJZxrX9aAhrbEmE7Zumvmd7MNzZSFKSGygozxcP958c3f2AxXCXKxkNUIKASiqBUmQBqWgAjRmSVmLAaJR0cpfF0FV8rFBAwZghsDIRDE0FCOH0Pf9ZrNeb9aROTB0Xdu1bdu1zBxC8KQdRkJmU0MQAqsjTaaTfcbERQEzqwbhYxmPc0oFOtlq2jM94F2yZNFUtMg4DpJzSWnY7x7u7oaHx/FxN+73ZRhNpIxjOgxSRgQJRDHwmmO76vrm0gc4GYzJCEBLMVPvQUfmgDaO4ygllVzGJKIAAHnMuVRhHlx0EUQslhEgI2aizNyE0DUxxEBMCLZdnb29fLt73KWUTKTkjMQxsIpMGCRCojyOEAMSciBTUFBCMFEgmvhkrjMqUqDgbncT0ZxFikUsRqZswgY2GqILoQAMGADhMOYs1ldhfR7InoPnwZP7ls4eBARi8HaxISrahO5F8thBxIVhxI6TvzbDfA1RFcAoxC7GJucx5SRabu8e7u8fHx4O24uLzWbtc2rZzwRmUHS3s7vbw27bn/drUzGTxX2ICByYKUADgbnvupYiNjHOhkCr3RE08NmAetmJqFvyTNRAQ+DL8zMmUi1oRHYcsptBVs/8cVbj123pbKk2Sh9QmPK+TMFP7VZZb5OMdRL5ZZZzMQEIzoKbgNvI9b3QY/saXmvq75VADDMe1yabJKIPDE7mx3o1IRnG2LZtz2FvhpXBO2eJ+pUiNrOMPBpF1DcgdTG1SAH/sBb/SjxJSpyY24sE+Xn9ne1SM+FXZ7dkhRJXtVANVE1Mj13SKiQvrWPTNyd0scgMxTzJkjHEIaXH/TBm6VYrINbpfC6iZihmImLTXIBrphXf778DMepi0hiJUD2bRLFm0i5wruQ9MyJ0tJwuPP5oNI81T+YX89bOfEjwOURmZmQgKCUPwwEQQ2zILCA+7A4ERIDbVdfHGJBlAkcUMzGBsRCGAKxBihoZeMqNISiYj2ogAJo69+IYwok1113BAJ1hRcyBiMRUSjZRX64KqKJiQ6CEYkVKsqJFmr4lxqzZLBNxYCIDVVFQRRPQj/cP//C7r/94fZsEAFnEdvvDze1t2/Zt04VQQ2pO9FkwwqfF2zTKoXYqwcyTKrawq8954bQg7EyHqnnqZTIFLtTGJ+Phi7kcmIvYhR/br11yMYOJ1KAA3O/Tx9vHi/NVu22qukkO08RUlAk2qwbRQgj1byqMceZ5Vn7ozBcmD2ytWYdwFKnVHECJnhoopbZLyFSlZCHEEJg9WsOmOxA1F8m55FIAcLfbNU2z3W6bplkeMruuM7NPnz59/Pjx8vKSmc/Pz0spDw8PDw8PlxcXPjVsajnnGONqvd5sNuM4HvaH7WoNiOv1upTiAGJiNoO+bxF9hqcwMwCYCjMTo4hJKRrcVw4LxrH6WMJJDX+E07w+vg8PRJwV4RPazCmy70lhdeLCOf3MP1lt/fmN2G8XpGrGo0c7nhy0/utrJ78kEJ/AlkXtMAxFddX2bdchBQUcU/7qw6ebu52aES/eEK2DbYgQmVJKzPwvfvbT//Af/m8/+9lPQwyqAiLBgAw058N+hwqBQmQOFAkI1ZhJp5l+x6kFYmUGrU2CqW+lSEzkRhqIMSBSSnIYhlEUAber1SFlo5DMhlQedD+Moygq6JDS7cPD7WbVxRBCCwBahNQCUfFwGTMAJZIYGwAEKGbmxh5QZUIFByvIkNKQ8jimMScxJYbIHANHosAeX1KKpUDQ9nHbrSIHQmSmpmHVYhrCrjz+/tMeP378+Ckn7WLbtN0qNAF5KBmRiIMh5lJ09CLaKMRV0zUxtm3bxCaVwoFxitEGOIYWLW8SURDR+8eHx93ODC+vrlarlY8MIfgRsR45QmDRehoS0TGlx93jfr9LKakKTZnjs2aacxaRIlXkBYAQYoxN2zXMnHK+u7+7ub25vbvdPe5STrPFpmu7ru/apiGP+IFqCJjv3FnKIGJEg1NjL5yCnl5ET80lFk5QyVpUmv36l7++vLp89/5d0zTDMHxHH1ptTia327tbIlqtVk3bAAIHpgmquHxWpZS2bT98+PDHr//4t//2by8uL1R1sqgBM8+U8xozowYATdP84r/84h/+4R/+1b/6l//+7/8eTF93gVeB+PXxlxOIzYooGGxWq5/95K+uLs6pMlndQ2hHo+Ek4umU1OlgH1NjYl2kPuGzBtTyVLFgERp8++RR3bxnOhScIEYNjoGezhM4QiGnJbXCIutXKzhk9oQ7MbsJ1ZYr0ZTtg4Ba7P76/re//N35j38eLtqcNRVBJlYxg09ff/j04cP+4RHbHoHHYSw5KyIRGrGpIgJoYdCGmQIDkcTQtF3fxLZpuraPTYMhtm27WvWrvmcmIqhzKTHOmdYIgCbukzQAFI/fQTMEwvlUonW5JQKCOu6EBECuqRsAiOYiJaeU1I28Jecx5cM4PuwklWG/y+Mo41iGYdzvZRgsZ8sFVSNix7Q25Bg4xLZpmhib2HQxdrFlJDPVnJxJla24tTxADVtVLSrFpKApun/TgAFc4a7juuZUPpFSKhmTsBCVkUMTvK0KhOvVarNe3+ZSsqil0DSmYo53pNptLVpAakw6IHBEK2AigADEqoqCzDBT8n2vUpXqTypWSNxqkVIxSqogYqLqd0POpcrc1Q6MM2J3NnwYnDiI3d1kU9GriGTg6AMRnW1jc/qInNjuFBQVKvobargjInFsGhLONuZc7u4fk6iIrjZrDuwoZeesjaPuD3kYkkgPVswEgGuFbAiAoWm6vlOp2fBAEGMzJ/86dbWSNk0BSQ1FVEqpfSJFImOmpglzDhcspgInx9rTOWU78u+m4f55ztlAVSRrxXWYHyOOCUt4XBVwFpY9WgoMwdDvbZxOXctzTF0KvsV68/r4b1IghrpHnZ6exe24uLjqiKj+NxEAimoRKUX8pq7AExET8cXKvzPYlE2nihPFSEXcR+z7yKzKnWwoC5LJnDa2qOZ1NmAu3blHXsQRoX98yHHPOl7YNmnOOjkqAQmYk+gwZlFoPZXO+zrgg8CqRSsyQ6ekOhfabDn64/zzur1PTHuESsXTRQD1LNpRHZlcYGZwoZUvhA98pmyd1O9NE4mDiCS1wNx3LSMeDodvru/2w7h2YbVtCBENGUAUuAinEogJkAAF1QAImcEQfKoYCRAUCMkqfUINCevaPCnj9RljhU5rHUeqLw4CEpmpgKqr5AyKkK1YAUMMpACBFdSKggriIPrV9e2vfv+HYcy1VWGmamPyPUVt4ng+ebm+RdEAOy0XdR6tfVZDHpEgJxjR2YJoJwv+HC2FR02pYq0JF829KvbPNG08ZoF61x4BIZl9vH54c7G+3PYIBRSBQMxykWHMiNDGMI4ZJ6aE+iuxiKXyILwsBRHJGKegqdo/9bjCmQ9TD3FORXNKNBQtKY0+P+xBepVjD5ZzHscx5VKKEtHDw4Oq7na7zWaz2WxmqYuImqZp2/aoIMema7txGP2Tm6YhYtEsBqJKIbRdN+wPIqIGBuZ0CxEREXdzz9Y2MzUgBHQrBiICyDykvySHWAXXoBEy8uvK/30ViJHwuUC8vK9fFGqfT50/WQS+XQv6E/3Xp7Xat6xI83wMEXnPYxpEw38GNPtb171v+fif+T2/7de2ha6mYuOY1CzEGGIEIlW4ubn/5sPd7jBWdoEqESE56d+PtAhokcMPvvji3/ybf/3DL76IMUopTIwGjGiqw2HcPe5UlKK/SIEoAApRxdL5nitgHkjJjA4lLoKzvYMJQwghhqmzK5KLqFEIbYh902Q1AWwpQyqssteSzdTsYX/45vo2EMHqrEOOYkERA6KSKQGYSDFDZ8v5pIKffKQUDcFniLOa54IkkayKTCHEGlerFhAiYoxtE/tVbLd9f7k9b5CZOcYYAo3psDt79ITYXLL1Z9ZR2/WFkDiaqKMbiCm2TdM0FJgm5AIjhRCQWHwMRWrCuy1Z2UQu2k+WMU0lj2OKMa76ddf1iAzm87N14/BDoN90HBhMRaxIGcc0puRC8HxwgyPRHouIiIlWliUShsAhBEM4DMPt3d39w/1+v08plSJepTJz07RtbJgZfZskOEbLmj2ZX0ECL42WYb/TJjvz65/c1afXNR414jGND7uHz3/w+XqzVlBReRpdMLE55gkbQBh2w9fffP32zduma4hITYkJrJKSj6cEBED4eP3x6w9fA8DP/uXPfAOdxzWxJhQfaTn+gu/3+68/fG1gf/fv/o6ZcpLXXeBVIH59/IUFYgQ6265+8Nln666zIgWzqeRciri9CMDUjYvuXKpgxonPWGQ2sBwXo2VwNjzD5+ET1PoSF3XUlCaLL8wg03nVm6GuUJkQMCX4+D8mky8Y5oi6KYRdJ1SdwixUT59KiIQkdWKPVODh7v5X//jLq5/8zZuftgVCMUNm4pIOw6/+4R++/OUvhutr3GyMwnDYWR6RiRjJqHbXIoBR27VN23LTUNOu1qt11/RNu+r7EBsMjMSVRkQz1cs1wQnz5TsfqgffuVCHzHNEudtQJ2MaOQzL1H2fpagVPxio5jGNw/7+9nYcDsNhn4cxD2M+jPuHR8wlHQbJCYuQKqlFhJaoIW6ZG8JVG/umi03kyE3bMAeH6DGiiUqRg2StjIKiYAisQE5bECmmhcCYEAwtCyEysTfgiSiG4BdFUU04SskqRUVzKZKBExMTMcWmaWI8257t9/thHHLOrhyCKvtJCsl5xCL1GvCSzEyUZq6IiWjQyZtEXNOTyIjZQ9mnAVRQk5yzKsz9YUB0/gJM9fR0GducsHF6FJ4/h2ChFOuk3bu2NH8bqm7aE/I/minWUVrw4Ej18fHAnsIMaRzHfPegAIrYr1YhshsbEDEXG0YZRhHRietbA7J8zrpt2+ChXGriduAYyPsQFZft7meYBx/V1Cf6TX3w1ZgheAz9LBDbNPB+RFmcVjInedPz4LN76EBEcslulCBiU7dywwIxN1VReEyinjx0WP1kR51FF4TLb62vXh//zQrESxNdBdpOtsin4FQPrvHRQlHNRXIpooYTONhUnd6zmDWp9yocWcFWuzsT2X42esx1N86tiYk6fCq8HruVOC0BVZN2Ju88HrgYbKygYKhcXzgG04FNXnzzCHhmRR7GPOSCxOuzs1KkiPqvr1NT1V8znYVeda2X6gcVFADRiNDsaNWBamzUqTaj+TlO2zRNztT5LqQltG76pY6Mmekb07KJG7hZrdcpFS1ARLFdnW83H7/+6m7/uBvGrombVXe+3TQcmIkJIiIWQSyRgwvBRBTIPEvBjd6MFS7hHbJFjxsqnXyRcmSVmWOEYEgiCqbua3VStUqd4QnAgO4XBiAUABYEBAUVskK0O6QvP3z8/TcfpAhwwCl1pzYPCOZkX5imNWsuogrisywaOOb0Lpx9uHiFT3Ns7DhcZB7hMwfN4XFZhBpNUEPT6PhDbT6EzZ9Z69ZqKfbOHNYAqGotRzG4vnu4vln96PM3jUcIGZpZKnIYChO0TaA6gQNqIFqjEhe4DedgFiKKDSBNCYN1H/FuOEwfwHp/qqITMxFKKWMa2rYHnH9xRDQRSSkNwyjiqa6EiIfDYbfbHQ4HADg/P587BTFGx0rsdrv1eo0B+65LOd3e3uacm6ZhJlVSUVGNIbRdJ6WAh2RQDR9QkVIKMk5hD65iGJsZLnUBUC1z+OHsE6utTQM2MHb2K9g8HPX6+H4IxFNaxXNReDlb8B2plU9MxAAnN/hSSJqjW/+kVAtHZrEtx2Lm/pNNMzH+5Ksp3l7oDn67dLvk4iyB9vYtQvp3idrLdtj8sswzAU9fHMQpsg8BUERTSmYWYuQYDCCX8vWH6483j0MSl3FFlWqvFHhCwCHgxfnZz//6X/38r/96s1mX4pBfX+q5FBkOw263bwxqTg0xcSTvsU3HXwUlREIjRODK/yMF4KMxIoTQNLFkx0GaqRIgM7cIXYxqYER9jAGsDwTD/pBTETuM6ePtfeAQIGybbgVsiAzIiAZkYGJFiujMIaRqtihqc55NEklSimoWP1EwB1ZVMEW1gNAynXX95frscnO2Xa2vNmcNcQwxRCbCnNOYxpTHnMZxHMfVhQJC4PvxMKImtVzEEDnGVb9qu86J8cfxT0RTKCqM5PXHdOpbwEMQfaXNOWvRsSRkXq83Z2dnMmMmkR3ya4aqWkohQo6MzGjkR70ipZTixYTPNs1HFJ9UVjPR4+VIRByCt7QPw3h3f/fw+DAOg6rDtQwJY9O0bdPExoeTjhPSC6TMiw2h6TS4HOdy7Da+qA7b7AKa1hRV3e13Rcrl1WXbtSJyTGldWA7mA0a9cRB2+93Nzc0Pf/jDtm2BAGRy/DyhIyMAwh/++Iebm5vzi/Mf/OAHvmuLyNyEJqRZL/Z3IsRw89XN/rC/enP185//fL/fnUDYXh+vAvHr4//PD5+pj017dfn27OwckMZhLKXkIuOYxVSKeWgY1HiqiRvni0b10oio+vF0mQ1y4gWeh8FPTyfHCVM8nvZxsoT4yluHGaeSpDISqfqWQJwWZWCis8kH7VipzvWLgvov4X1FAwChumCDTtOxZiiEiqhIAjik4df/+J8Hav7lv7tfX76J/QYQTcZf/MP/53/5f/7PN199eblp87v3FJv94wPlx2DMXBqEru3Otn0TOYa4Wm3avg8xcuxiE2NgZiRiICSmIgqWLWdAMp+LBAAOSFVS9IFeQCLkadq0egusljMeE6GiaoKqIFnGw2Echofbm3F/2D8+SE6S8373OB721x8+yDiWdDCVANBQbLhpOW5j08bYrZqWQxtCy9wyTztYYcQmxImREdyz7CNPZRxSGsf9PpdURJBdtvRZXRArKgXNmNAMtKhpQQMmapqmiU3TNCEERGRGIMpFck6Sx5zGMo45DeZbd9aURgQ8325zTnf3d7v9PqeRmRsOhsftEAFUxIeyCZBD5NCCWH2dzAhUMjAzmDJHA1ATZCAgFSlYqphMxiEIWNGspkie56uEhAgEQIRSba9zVN2TA+fcIsW6mSJqTSAARQSpoYjL4r6+uS6a+EfgGNmGoNMIsIAgIoQYuYmxbfeHw+3dfSplu91uz87aJjKpZzuMWcZsRRFNQg1DAAU1VCDkEIIFT05HEQBlZiQEMDFx8q8KACgBWx1l1qIq6sZpIbBA0MbgEAc1AxNXthUDGZBr24vwydNSiGtclaNIAUFNVYrkxjV+bpiDiBKh2/8c5j0Lw3gyaGvmAFBToMlViYYw04cBkUDl1UD8/RGIp84FAJgRTDFrdTbT6i2KiKoGokQcYwNIKZX9fj+m5MN06n4/MIJqiJ3HTiarr+OOxWUgMANRU/FwG0Jg5knWOUKRptO/mGEdfHGuaKUW0yw6T14LLGrz0vBksPdJyBjO2edY/acK3ivkYrBPSQC7tm3aHimXYRxzJmSq2WxmBnrUwWetee7g1hZVLaqelPGGC+HgqGJRbdTRNKBDU+UD9S2AudpBAP+0E8rtBFewPObSyHazjaF9eHi4e3i8uHrzxV/97P7u+sPXH/746aF7fPx099A0sWtj17Z9jOsmpsZMaWyttAjEiuBjFV526KR16qItfSKDTnoIVHjv/PtWjX96mQxUTAqYsltTwdDhzkRUI2isgArRY5bffrr5//76y5vdgBTAFJQoEHPgEEJkmjP7TrNi/JV/IgzN8o//22tXfBYS+Gxo49i88IJbAfzJz9fotHtNtZ/320xhmjrxb+TuueqvB2Ou80JoDIZqAmhcccG02w/ffLr96sP1Tz57AyhgqiI5l90udx2v182nm6JasHYv641W90FFJJSSx2FomtaTE9xHOwnbU/QrEkLFi9U0PP/dVVMaU879ajWlnBoYlKK73YOItG0TQiQOzPHdu3eHw+F3v/vd/f295+qcXVzMr2TXdWdnZzc3N5v1OhB3XWcAt3d34ziu12sOoeRcSsmlEOJmu21jBIMsJWAgohjjMIy55NAEZgIgIhIpIoXZMaSkqp7TN/oVpgABAABJREFUmFPqu5UWoRrzSAqGRB4VJdMbXQeTCeBVIf4e9TuXGZTfpqs+bXyePmbn+5/SZGHZsTux8pwcTu3U8QDP6RYu4s3aq0/+uSy13MLmL3+igE89KVwOr9QWyDN6hj07c+Oz0nIRTItPtLYXnBy+C08n8lzKYUwA0DRtCM0wpuvr219/+fV+FJ2GYAk1G4AamSETIqhB1/b/7t/+u7/9N//d28srE20ooHfFwAyhqByG4XA4NH2niNksKygyaMGixNObSGTMJqZkznfSSl4iH0MUNTNlIghoJi52MnEIrMXOV6u2Ke7ZxTdvb+/uu5tPH+/vHw4HUX0cxm9u75rY8kXbtBHVkqkJWRFAKGJFBFWaGGMTfXZYfD60GBIZYCplzHkskkrJoo70Eig5C4bQh+5ys/3B5dvPr96erTeRiAUCcmBGAxSLsTtbrVW0SCk5jznvhmE3HkYTBclQskpo281me3F5GUI8DEOWpKKBQwwR3WYjeIz6tcpHBgAVVYUi5XA4jOPoHvCz7VlsOyLOqQCh59qBgmc9zOWDiBgaa227llL8tBZDsKaZqbszAqL6DwAB2E3OsYld1zPTMIx3t7d3N3cP9w85Z0QKAdQsxrher1frddd3XvzOCRTzFR5CWNwXikhe4cQYAdBHuZdX8vP14cSiVydFgYhyzt988w0RdW1HSPNZ9MmN7MZhX4XcZbzf7dfr9cXFRQyxSPHXGWa78UJWHofxj7//Y9u0f/PXfwNQ051gKtaW0S8zaGIYh/u7+88/+/yHP/qho/xVXhETrwLx6+MvKRBLSpk5XL19G5tGRQ/DQEQ++udJLTBJwma+S9WFDMzAxKTYwvEEJ2XLouP9kol4iaayZwHMT08e8zK3KKP9B+M0+wseyAUTPbHW2op1IvRoJARTt16pTTQ3REEUQEVUQjFQwAw25PEwpE//8f/16y9/f3b1fnV2QcQPt59+9V/+8ze/+6WNh3DoLB0gxlGEiZrQtpHeXm63Z2fbzbqJMcTAHAAIiIyFkQBMFc3HLNEAyeMkPIHXqNoGjl4g37/A8T3ABm56URFXL6RISumw391e3zzcP0ouJeXxcZ/Gw373kIchDYMVMVUCiIhNoAgAZIG5C6Fv2lW77mJsm7bhGADJgAAYkREZgU1RAVEhZwKgwDVlVRWJSs4p5XEYUxrVNAaa/Xy+H+SUzGpQqQOsQ+AQGmTqunXf923bMROohYBW9TwzlZKGkpOk2mTe73fDeCg5GcC7N5ebTf/wuLu5vTFDNXXUdJFp/NdZhAAmqiIBOXJQKVmyV1QCKCJEZKIKVkqR2mMArhInqmogRANRMVBEtzFJMKZjv3o6OJ+atqaT61OGgVXz+kzePeU3gXsY3SE7jQShKswgDDdo4Rw3NHGKAUNYrdcpjyWXu7s7FdlsVqt1g2qqmnIZU05ZIvt3FvMkLJhZGD7B5fIHudThZBkEZ41OepdnwZmOuZTi7XtFAEZoIqsqqiJodavMYXUvFq8+vg84GSudezpDxGZvtkskRMxwLFp8xJ3MSMWAlnnZaKbLCUdiXJQYulhYXhXi78/DrySdnfbTzqHu/J0cjYhgIEgcQoPIKeW7+4dxzCpqgD57gKgKVWaet71Zv/XklprgOpl3fIEFMUKUadsiN+qCwlGne2oHQ1fWKkzl6Js6pUrAbHQ9ob6enOl9zh6dMo5ISDymkrNwiEQhlwxEoWnGYRBVqh7h6lr0SFq/V3VJfoHZngNT0DY8WbhOCxOaqndCnPPrrNLqqt20xvE5X2JZqNOUOnCkCqruH3emsNmeIfLd3e1XX321XvXb7fanm80wHB4e7u9ub/f7A+0PhBAYN113vlo/rNYX63UygBDWHErSVjEGIkLvHiEQKiEh+b7ssWhO8/dBD1xGHtQLiBCA0NtpVpQAurYlrvOh9SCCngqAZqAIQjwA/vbrr//hN7+73u0whECsauonAwohxsh8Iu8e94saOvr0aGQn/3n8w7TpvIglnNzZp3q4Q6NfakJgnRwxO4KxbX6nFmkTnotgOJGDzZuoWK/LIdvN/f7LP3z40bv3oIUJi+j+MNw+PKxXq1WMJpqTlATWAxL5/WUABKygnkSUS2nbjoknFjHaEfhh0xZSzQqu4gdGB9OP46Baor/9iDnnlNI4jqrSNE3XdcRshiqaLIUQfvKTnxwOh5ubm6+//lrNzi8uZt1qu93u9vv7x4dVv25abrr26urq8WG36jdNE1Mu9/cPOefm8srvZVXJJU/zDeYsdEJkDojade1ul0vJzBQw+CvMTDFwyZjHIQZSJQKcI6wY6z0iVpN/AED1FUL8vWx82gnDHb91OvPPkYDhBDD+VE6aJd4//5t/96fNyaXMrCJFZNEUhCc2SYA/3eF4Gp/13B/tm8qpu/lJmYmLKK2TzABDQ9Q6WY9jljEVBOTAHOJ+//iHrz4cRqnwdqrdKVNhMAQQUUS8vLz8m5///O/+7d9tN1spQkTGM0nNDKBIGdKYSjboi9koOqgWpCZE0gpy8t2HgJlMUW2axmNCwCoQs6dyEwOAiIUQugY8tIDMVk3s+x4BGYmRdL8f1j2iEuL1w66A3Y/jN48PFBtC7IAKQjBNLtmbGeHE9hEmMkIVTKmoQQhRzcaSx1wOKSURQ1ewjRAIMTJfbLefXb55c36xXnXRqyUCVR1T8Y2EkELytU6LyDCmYUxDzoIkaEPSfRrjqjciM2zbtuu73XDY7/dFiuXqkSIiBlLTqbWh4zgOw5CleDQsEcXqQuq7rvPBMW+amKKTOUQ1FxURk9pmRI8/ASs5jYdhOBzyOHrTLsYIpzmu82CZgQFQCHHV9W0TJZdxTPe3d4f9PqesOtnSkBAhxtj1Xdd3MQacTOPzAOUTo/307tN8egSAmYb8bYzv5Y11hHgZaNa7m7vNahMoVBjZgi51vIsMJq6oElFK6e72bt2vAwefxl4cHsDQ0NDJwiGG3W5natvNdrPeDPvhSZFVYcSLRo6JXV9fI+Dnn31+eX552A1or9MwrwLx6+MvLRDnlLomvHnzNoRoBilnQlQAcSJfrbIrwhcMzMRMKslBxTQjkPs0Cebp76P+W1fSBX9qPhl4HfjCIcMx+XJS9uhkHwar43Wm6mKZOcJneopmaiK1ILcZLTFJhk7MmH4WUxBFMVNAITZkRcxgRSWJHMZhP6RD0d3hq+F3v+7W56vV1pDy4SDDfkvYrHsCTQ93FkMBCH3/7vzN5dt3l2/exLZt2uB5pL4PEbKamKJRMCfHmaEYVfaQ85WYg0e+2QQi0JKLQ5S0iJRcct4/POzu7h/v79Iw5DFJymVMw/5wf3u73+9A1VRAhADaGAmNzUCBDGOMTYwrpgaJLTBCZGzIVpAboJ60IUXzwRwxRCWfimQirokZZiCKbIwoZlqKpASSUQVMCYzMAciG1TunpsZIxASATQPWAhEjR+bYdl1smxibwIxmgclqPxcJUUsPKlpySeOYxsfHh8PhsNs/ppSaVbfdbM/Pztu2vb25TzmJKSgIGqr5+ItP66qpiXIbAUIxJXEvgyLXzIeckrgh0BTQCNHUE4FNSiklAFLgiFhcgAzMADQBhZ8eW/HpgbsCcm3CQtcSFidZZOnKmA15YESV3znfM4ZGVaAAn5y1Gt9jQIqGSMSI625VSs45Pdzdj+PB8LyLkQCKyJhSzgUimxSo0XOgAKjgGXzVCEiM7hXDxUDylCqlasA03Uk2DwBEpq4JddScaOKuGiyjc+ylEsDmI9BU5KsBwUSNmGhfpYCB21HcBm6TUobP6os6tIUYAhP6sz6GM7n+5u6A40Hn9fF9KKQNUR0l7NdydUDI5E3y3oAJK6A7OhCLlDSmIlKK+jJV+xGqHrB4wnYwFdFKEZ38xJ6ngZP901tW6gosIRGAztXsccp1riuoTsFUUJAiwBT0vPQv16bId0zUevCsQ96JMQQMYXjYlSwcGkAsRYiNEUMI4yGlkkOMTqVQVTFzUxI6u91mQDvOo/tLC9nCjIqntiyYQwQWoWhaIQBmcOwkVwuviwizFHIs5lVNQdWKSRpH6QqYllJUiqo87h+7tj072/74Jz/7/AdjyeX69ubx4X5/ONx/uvtw83DW92/Otp9dXWJsILRRzRAUIULF0BIyIbtdmiqDAT0/wC07s6i3xBs6AZZDaKIjJCPiFDQDNpZSpKhZMStiRU0RIdLXHz78p1/95hdffg0ct6vexEFe6kemEEIIgcjbG8f6cErorVXcqdnnZHDbVUI49UMvS9kX/YBLeblyt6b/dl8VLDMXEV4Sr52/pEyEBmwwY4ywpoKCAWS13aHc3B32Y+maENjG/Xh9e/fVN1+/f/9+u1mjmRRRBRVAq3M0Zib1aephOAzDsOpXfhip7VGDE+O9LwI0Uc7MEIMZlFJKEaLgzixVG8c0DEMp6ezszD/oEGAflHarrz++/vrr3/7udz8Loe97f5FDCG/fvPn48eOYBo4cQtiutzcfbx8fd6v1ipBXq95NxIyoqrkUBIAIRMCMCDamgQZU6z034fgeEam/8oRN02jRnEZar9Bs4v9XFWE+Pz/Jan59fM8ey3nz58iIFz8Cz7LsnipH9h2byHdZEf95cvHcRnoSv/nSF+CfnCx/UShfPH1brn4v4JgnW4cfF57+7jiD4CDl7HVQjK0BfLq9//DpUVyarVAkQLCAFcrExKtV/1c//qu//du/PT8/X5J/Jl+TEBMwGsIoZZdGBibRPkDSTd9EEkE/109Lmu+MAHDkPJoHnoKv1iGwp3fGGDwrF0MAolELIzZtG4g1lQ5gQ0zrTeCYzW4Ph10u6fp2fxjL27fvtttNiKwWvA9BlXcUTLCUGAMCSClDSnPIQXbvcCkiBkjMIQQG0QDUhrjuVm1sCNEDfH27REPNUDy2AaDYXEGm/bAf0niwtAfZW3kcD/uUzs42Rrg/HEBte749227X29XDw+Pj3UNOySOS/HiVcx7HYRxHpxlsz8/69SrGSCFMRuA8DMixIWbPSiNirTusSM4551KKSCEfrSIixlFkHNMwjGPOuRQwfYpVmTiYRLUq9I1DVO/vHx4fdzc3N8Nw8GZ5dRwTAhATxRCodjq1JqkeYVNP2x5m6CkRs4WZvZ38nUDtFw6IBn40PTs7W94jM+NiLtOenRbgcDhsNhuEmsfwbNWoTWlTe3h4QMT1eh1jHMfxyQQDTifGJcr58fHRjdV+5kGEV4X4VSB+ffwlH646MnerfkXIDl1SRC9ZRBVB0cwUPIYHPDhEvY50o677GSe8+nzPny5Y3zbiNK9NL5xInvTQpg12IgjUsqAGaHlQloqauCJ8hNFVl6DJHItndXiyrmfEBqxIApQNiujD/pAkZyk556JmCH2LjRraHsbCyJGAOiKLYAKqBaxoAoOz1cVnby4urs6alg2EihGGKgQCqQFwMLJpHpIJCetsi8MPQEvOwyhFfbBld9jv9vvHx10ax3EYxsMhjymPw+Hh8fD4kIfRSmaDgMTO0ssluGBvRmBM1IiRV3FqaMgikLMktia2TYzMAZgBTYoAFCSOxkBSpOTsgFcm1hjbhiYp01QKFKtgP1WsGyTFEJyyVNuwjsswaJoOCf1NEtNcdCyjO9Sbrm1iDCEGoq7v2xga4ibGGNjzTTkwM1sTu9K2Mab1+PDYDOPo6Tlr6AOSpHL/UFAMkAKacoUIA2HFZ05PiYhDCJ4l5S0Kf53FQNw+Vu3adV5bDUoRQy0ii1lbapuGmauKZAsmI864g9mCh0vTxpw+dDQJnlTf837vCvCRneZReFYT5m1yR/u/kbTSPv1znWIyppRSur+7h/WmCyyqRUVUgMgqC6umNS1FgMqqomMLeh7Qw3qjOWeVCKcIewRECMxNjLWPr7Nb0BD0KB/Bn+V2MVsMR08uuSIidWQYj0YQqxQPJJznskOoVC/1qX9y47XiaY2kqiml/zojtl8f/yyBuHrollPyCyHsqItN4VsYOKhCSvkwDCKiYFTRpDBl0z3x8cJ0veCx0vZorllAI7QjIc7cYI+Ai6dx3PvmAEh4zkOst3M19MhRMn5qtpr3Rp0N/khADEhFNZfCIcweQwN1V1FgVnHPMNgxyNTv0irvuWtmuUwtNeAF4/8kEsUmhX0ZVekfdAEAZ7vzBMU7rXNswVVA8P4zQM75sN/HJm5W/fX1dYi83ZylPP7x668/fvzUtf3Vm6urN+/evH2nqtcfPx0eH24fdw+HT5/uHh/241999tnbi/M1cofQIgREJmQkRPIOkqKxp8LDCYZvIUn4mKd5EncMkXluZBmIk6GxiYEYRZXMgFXF9rn84cPN//sff/mHD7dJsO36tu0Ou10IzDEYERMyeal7HLI+FWj+bEcNniT+ncgxNoeC0pwTXKdYJqMvPTmeaZ23ePZ8njFP/IPihytQ81EXMDSu7JE4Zvh0O3zz8e6L9xdtoJTL48Pu5vbur378Y987oD45qKeiKQfKS+eca4yke9Td6IeLd8vb2XNTxe3fXouKKBG3bcvMaiZFvNJerdYxNjCnR079G7/jACDGeHV1hUTjMHhInR8e+r7fbjbDfggc4iY2MXZ99+njxxA+b9umhR5wFBNEImYspaSEAF3fBuLQhGEc9/sdgDGHuWPkP9FPJmZKTYMKt7d3Nzc3b968M1NDI+T5PZvP1Yv21es+8H1Th/9JWu0TxMRzBfbb1OFT2m9d4P85KXD2glo8259n3MQT4sQ/6QV5ztB4/tNnRPLzF9AW9S/O8cWLTdXqaRdyKUWVOTLzfj98+nQ3jOqLPUwoHKxZ4NK17dXlxQ9+8IOf//znV1dXdFzMlwntdb4EmARglJIVBysPh8P9Yb9qNt1ivgPRg9YY5lAd770tgjlp6uEyKxM3EQwQGAXMgAExILYhAOLZegWBO5GmX0uM6ZsPt7t9KuV2t4sIJY0XfR8gBCJiijE0MYSGVUFLyaoEoLmkIohY1MQ0ieYiIlqKFFUOIVpjAKzWxIaZRCXl5GMxgRnAJ3RN0CFeRZK6MDuO6TAeDjmNVnZWBtLBCoaYitw/7FARBBSM27DarM/PzqXow8PDw/29qjGgt2aZqV+t+raLMYY2hiYSMyJq7Z8RIE5MKyPmiYiJRETBm5uVIUYUALEULSWLZJ3CjWYo1kTOPIqYiDUkPQZmIilln8pu97jf73NKIlJBCwAxhL7v1qt1369CCG5fmwFh87OasYLPGz/+02cH3nffpPaSK2eO16t5p4v+05MzDzN7PeU94L7vY4zPx8Sf9IyZ+d27d94jmSNev63cK6Xs9/txHDebdYzBzLMuXneyV4H49fEXFohdyqGmabHC8sAdtoAoYuiG0Am1Vw09c15dTRLRKehl2gifCcT/7NazndAb59SaYwpWDSJRUZNiYiI2TWPZZC3RGsYzacJuiiQ2AEMqhgIkhqPZYcxJYT8Up5sSh8iAhERkiqqIIFiLDh/FFQUDVJGCzJt1t+7bNjJjVfBcsUBmJFW3tVTrpXrUNQCUUkRNspQiHod92B9yyrmUnT8eH9I4pmFM4yAlS85lP5RxCIgNU9803hcF02AWKPgeQwBkyjmBAYi6xSkisEEwjAbBMCAHCgBogKKWc0EFBlTVkrNvK0wB0GJgIDRENgQFKwhUe/2BqBCStzQJwRSJkcnD3wjAwwSGcdzvH+8fHw7juB9HbzxzjMGThZDX6/W27zb96my97pqma2ITQwghMAF4lABGZgRrQkyl1Ip5Y2frdRqHlJJz+tQ0i/i+qLYQZKuRgQEYAInYyaQ1dhZJgAghcJUMfJJLzUQ156wqM+ug67rArFZntLHiIXGp9R5zf5bzesubwuxEQZ5zaRd6LS7+Ap8qXpOOMJ1WnbHqRwliDjEYaE55oJHakAt6dNL0M+CYInd6sEf0OPoZsQnVFbmQbp/c2wgQI/d9S1VTOGbWVpjpXHU886HZtywFOttnlvNccx8cZpP9UoW3uYaXKigDgId/VDF5WY2XUl5L6u+XRjxlr72U275gHaGaIoW2bZh5KLI/DDkX75Yc1wysG828d0y3RE1b09pcQVBcNIGmORpb/vS5UoSnJS1W/NEyh6Sy7TwGTW3ptkAEeJozdNpf8VguRDFIuaScKXYzxtHDwerdiFCkzFGouoh2PWIkZlV6ass8gRNM9H58Xu7bsxIHYNKJF8G2/hrPE8NP6AfTeQJUdRwHJlr3KzkvooJgq75HgN3j/rAfi0iIcbvZrNerd+9Dubj65ptv9o+P9+P4m68/JLFdzu/Oz87X/QZjJIhIjc6zlZNLGnHmmtuUU0eu8zlEAgEJmTjEQPOYiHdhzcCAkZERQNBMETPIbjf+42+//PKb630Wig2HYKYiEpuIzOqSKMFiYX5qC8LTj8NLo9Mnb8pzV9Hsm3u6C82aycQlftoTsZPp02Xk3akMXQ3XDjCaG5kgCODbblF73OevP91enK/Wq17VxlT2+9y1sbaJmSaffWVW4GIPXfYXTY9Gp0VB68MrjpSplEYDUDc4M7dtOxWlomrMHGOLyBX74LOyT/tJ0Pcd4OVhGIZhEJHVauU/rl+thv1BVaUUAOj7/vrmJqUxNjHEKCpShAIyIjMXgFxyZxEJmQlMS9Gcc6UHE/l+JKWEtvVfBRCMg+Ryd3OzXm2atkVmKVIx3k/fWzR7RUx8nzazJywI/HPqphf00Ger8pMPLGYGFifWGVeE8CfGVl6SaF+kms6Ze5ONQL97NfuOLL75gn+BIzEtmMe9eP6FThYTn+qrCyJOGTS+lwOgGhZVUQsNidnjbnh8GD0Pbeoh1joLDEIIZ2dn79+//+EXP3j39iowIegkNPvMkRITEbjZijkQcRIdRRE0gN4fhqtN39KCBeB7EYJVXhvOafAz+ojUyzJSphKcBUQCyojAbJ6XWgoChqZZc4CcNeeztrtcrdKYxpyLyM1+X0z3ufTcNMRNDK02PVhLIKoqOZTiaSRZ1NxyaypqopKLFM+yRwwcwZRE2CdOUdVKlhGzilL2zjmAqBURURtzPozJ2XdDGnbpkMESaiYoBBwCYRDRMRekLAcgKWK4Wa826zN5q7Hp0jiaeJQfhkBNDG3TcOApDhTAB0mZkEArjVKAavKw21wqXc/LvmnfUYVSJI8lp6xSPGEClhuDLTLcfM9EIeIYmBDckpyGvZRRtZiKTco+ETkxw308ME2uTOmq8xFoCrDBo+FgCWZ5Lul+271Zz5fThUWITWyqmnOkMlUBZ6kOz4fGSnZWddvyciDpucnPpee+70MIL5LHn+g5ImUcB0TwCaoFJ+Z1L3sViF8ff8lyGtQMiTk2bkOUym9AIFUFqhYq39RmgdhAq61YtXbdJnug4WnD6sU9fl7aZvvechhn4vG8cNS1SRGbZhvdxew+KFWd2Bdmc+aPG4on3sT0xJCMGJEEYcxSTAXwkOXhMKixGBLFEJkDihavClVUREHBzLKUaUzGI8NErUTkdddGRgIhZCRyteGIAzTTUoxMwUQgpVJyFin73X5MaTiM42HcPe5urj893j+MYypFhmHMKeXxIClbfZqGBlgEVbht21W/YWoDRq5ub/IMQcPaqZeChmQYAkeObWyYY9e0kZ3fxIysCEZsiqKaNDMAWK2pDMyCciBTMWRVI1dFjBCMCE2BmCMzqICxeQovESCDj4giSSmPh/3d3d3N7c2nm0+P+/0hJcdF+7ZMiA3HtmnO15uL7fb95eXZer1dr9frPvQ9hkAIjETR0J3RSJySml+I3fl2O+x2B7CsEMCKCqQE6OPbtZJSFe9MIgY/KtauMQAyBQ4UuE6FM5Fade5VVIIWKa42ipqCdV0bYgQDdTSkzQe2ejn7YXTWM+upzqnBC9OT4zdrrgcsgMSIptONMEW3zTGKU7+6cikRjjCIZV+XiLquG8d9SolNSiFVrRxjQJoNDfW0ObPn3BmOc0ZKpUiYzrqOdxT8jKU1FdLapjnbrjnQNMTnijmeDCm/7AlZ/AOLPwAgUQjBc06mIcXZObJIxZq0PwALgfu+Y8aURCeyzaTeH0fkvXFdSnk9hXyv5OGJI+GI0qXDDhbrv1sFCalt27aJO7BhGHKR2UHrZn2se1+1+J46kBCJUHEeGpgtywhT4YGOV1MznecSJy7xUdsiID0Sk20pEC8L6XqHEiEsDtyLXW0aQ6n2aEMU1SElEYmuOKlNZleQ2tw1FVEDDnEm4XhJSiflN1RZ2asWWBYneOxkPStUZmfKzCLwM8TCc+yQ4urLnhWumTthcwiNAQKUlAunzWb9+Wfv/vj1N+M4vt28OdtuP9H1x4/Xf/jyDxzCxcXF+/fvzs/Ot2/fN013c3Nzc319fXd3yF/dDcM+5x/YFeC6Ddz7Io3KjBPiHVyudRkAyUHO3v4kT1Il9Fx34mX7wapvFgw4OLfXxIwUDPRuv/+HX/3u5pA0xhgbQioli2nLTCGAKRJwvVbxW8Wiidhj04Vtp6FMi46Iurls0rdheuPgiHd/dhh7IkwhUDWtTep0fQ4EL9SlCEcrct2qUIGcECxgSMjAqngo8s3H2y/eX7693IhBypIyxBhiiG0TY2CiKYq1tiYrKkLBeNoFfP7DdSsfIq7PB5CZwQ8+Wh9u+3IERwiNGZqCxw8wMXM4tSL6TVbr4dqhpLDdNkXkcDiUUrqucxxK27bOZBnH0dVnZh7y2Oa2WfXMXHJmpBBDCKGE6CBLAldPPGhIsPYeLLumkHNoWz+CO9ATTW9vb98+PhJxw+xL2zGa4pUs8f0ViMGOciYuXAW2nLE4dRGeTjwc//wkme07fujTcU971o88Dmv96WtvqSItnyozL/ugf6LjtdCY5tTZqRmss5I13bCLkZcZl7BoniDSfKdXi0EV0IDRwzPIjMBQDQtCyzTklMZ8GIpv/zR9wymAGjar1Zurq8/ev3/37s2q79zyi1MRVkRAIcTATAZGCjE0IbQ5p0MuQIpo98OwT3nVBI8j8ME7RHDbqSIZHfOqeTZroCkCMSpT8EBqAytAiEBYieqSkciIYmgaQM65VXvT92l/uFMdRHa5HOywV9uGfhVib9oTGpEhMJqVHPz4oJAFZGrAG4CqZS8TEQ2IiShEd9KGgMRg6EagEbPPgoAhKWAxK6KHnB5TGoskKUnzgxwEDZgMWQGQKMbAFIrZoUghYrOcH0uxd+/f/Wh7kdK42+3Gw+C4SwAxyGCg6DkuCoo1tRSQZhiEN91NPE9YAdRETYAMAzITOkJQTYqmlPM4Sk4qBapAfEwdN0Cb5lNNVE05QmRCU8ljGoecB5OEJgCCU7gOEcSmads2xOBjxFOH3o4nnumiXID27Ml9/W3MmeXdNBt1/Jb1xCZG2qzXZmqiyG6hk3roOb1Pl4cE71+6/uvjaN8BipnXHPcdv5h7Of+/iJaSQ+AQuIY4vMIlXgXi18d/DQW1CrgYpmoixo5erHPsqEagAgYyGXbdoev/7YN7Vp0a4JYHP+8uHU8v9reXcvCL8rEt687TLrSnzM0ZdKLFfPxWFY4pVHosrX1c3xd0ChgiEBaAUjSLPgxpzAbIBmQQVqt15ODwCgNNJYmKSnEPpYfVF1UxK6YKYuCCKRDaFFdkNp/sVIEolzIc8v4w3tzc5SK52OGQHu8fhv0+jePd/f1hPxwOBykipaTDUHIGQzVzqZXMUATBCCFGbkJARkXsCTbMHRlJ1py8MFQFRwbXtqkFDoE5NLGJsWnbrm3avu1UVXLOBiaAiAEiouFkbyOPdSpFtTAYlkimweMTVJCMKHBgYkYUBWzbhhlzoSl0TM1J1mYpp4/X17/8za+vb28e97v9eMgiYtr1fWw7d6k3Tduv+usPH68/flw1zaezs8vt9s2bN+/fvpHzc9tuO+dQcICggdEPhSJFTdBsu+r3200M0RCK6d67kRJSSsTOizSR4tUjEzuBpAmx6dr9OIBo23Zd36eSU0pqKio1SZiQmTkEpn3KUpMPCGPbEjN4+e+buE68XqTJ0YsvmD+qSwGP+s6kpdjRZWcINRgOJ7m0uhys2oXhGIA3ARbmA/T8JiKZaRNaAhuGYbeDYUjFFDDW9Hozh6NOme5SBwEqdeLkSVvt/qCL5vOgvBmIqZltVv3792+byGbix9TnN/GLUXV4dBpPwwFgHvocQkDDKhBzmDvqy7SumYyMaKrGgdu2AUCR6Yy+/E2mpUXVStFS5LW6/j71O60yU44epRMTcc109ExFMy0AEGKMIYj7/YpEZkIAoBrYdiQv4EISPXKB1WzOm/dOzhSRZ9UbsmQdTjopVjvJ8fy+7JIuj9STyDVXCide+iXc29zd5PI0szKrWMqCFBxeQNPkDxqoFO+febanSQXbTfMBuPCJzM8NbKFH1Y5SDerBWQXGSQefNvSqT3ozzsyg5sMqTHlifmZwPIhHcYkUbyD6oK4aoKKhodnhsBv+ePj8ix9cXV5cX1///svfX11d/fQnP/3xj378u999+en6+tOnj58+fFyvNm/fvXv//t1Pfvqzz7/44Ze///L29vq3Hz58c/3p/cX5X//4xz94+/a871vCBiEShcCBUQ2YwJOCQt0BCN1ehACgiEyITITz2l3nTw3UyFexYkgUiVW0iOyG4Te//+qbu3toOgTMIrkkEEFyyAWhKBHHGEUMQF0Dna/Z+u4vFCOaxqLrGnga9LQ4Vc2XHiLRFBZc30rFZU/lOGdaVQ/zrqoubUSeEgrPXMw2ZYsa1k6Kunu+6ry11yhmBhS4+ePXn7747PL924vr293H23tkPN+eOSkeyZCgjFBymV5WA0QFErFQPXgwgepBDbAUi+LNHDWTmUdc+zroZ0NEZA6ELMVKEVOI3MQYEXCWcuoFjjxf88d3wazvexEZhuHh4eH8/NzfCGbOJZdBmqZpYjw/O3t8eGQMXb8CAFVRJTUKzDGGNA6laGwphhibaAlE1ZESMUZvWB4OB1eUYwi+ua/X6zdXVx8/fSTm6IuVG/0R59203lavZfX3sUb78z952bb5NlvxMfr3hcLKXtR8nytQz6YQ7Luf1XMAumtMizzSGcLwZzE0/vxX6dv/6kRlO1I1QP2grYY1hYfg5vZmOIwihWa92w8TZgS4Wa0+/+yz9+8/e//+/dXlJQcyE2fuL9IzkZBMTVUQsGvavu8P+31CDAwB7W5/+Hh3vz4/w4YRwEQmxERtUnkOj9Vw9el19E3EiblEBlnU1NRq1on64F9OWcFyyilnE0HTiPj28gID3+73eUxFbZczKhYpSqAIqeSHPfSRI4HnqouYQpxShpz9YwoIISCASTFA5hBDMLM0jgGMLCBjGouqVoKloREXg904PgzDkEWJgKiYjWjZSoDgjjQ13B+GEBsCGMfBxqHvur7rdvuDff3x3Zs369U6hnYfdo93D+VIn5ymN6uQrfXIhwBT1Dsi2tTOVLMiWkopUgCBQwwh0mQvGnPeD4eURqfVzREpiAgw9V+RrEZK1LdlHA6iejjsD4chpQQAgVCBnKvftF3fdW3XhRCnZky9SGd/PVYw/QtNncrZe0nGfX6b0IKgMpvliOjq4uLh8XGGGjn4/kQXUl3epGY2DENKKaVUSnkRcDH/QVXHcRzHMefsz/a7JWw4+hVeXcOvAvHr47+q8wfWUO5iohbKNBVrtQtXBxBsqn9VJzex249ng9WCWrXc9WFyCs+B18tl6MmUog+GL5YPQ6InGT3Hp+KhKua+T61F+zw0sdSgJ/elIkGMxlEAH4dxN4yGZBSbPhAxADdqTHH6TTVrET+MKymYCqqYgolaARNTMfXkVlZQhUAhcCBkUxLV+4f7h8f9mPLuMB724+Nh//HjdRpzziWNaRxGFTG1cRxLLloKTOafABDYt0k1MxCluh1pVGoAiEk0R1M0lTEXD3aBCjMEIANDxhBC7Buf3nRtNDRt03Zek9T1mCgEIjZSYACuGQ1KZCGAKgVGDogEnqayJE8yAoUgAKiIBBzI2wVFRMFMNeX8uD98uru92z0MORkCEoEKIv30pz9t15tvvv5Gcrm6uPzhF19cb89/+5tfS0r3tzeaEpl1IQSkQESwYsTIxMxapIkRzAqiKKpqw6FvWrdVFBVVTVICI6jlejY1PI2PQyAzyzkDYuAQQ2iaBghVZEyiRZFrDB0ScQzogQBcrQPMjC4EzwfNo/fKcPLgLpjCS2jE07TYZ0dvg2Npaie4FoTn3nrXxRCfqAn1Pg5MTDTk4XDYP+x3Yy5m3eRxrvpsDcY7zpAvrLlLxtYiKn7+6S5KOalm1cYYSDUjAvHyWdbD2Is3vi0ZscdSoeJXMTxPLcHjK7pgWRy7SoRHLqvVN3Gehp+bTP63r1vA98hxZWpWGyyzcFIn35dD6/M4iREYg4FpSmlM+cgXngj7fmydZF+PolGwk4YH+PDisegEUxNRUPEwjoXQBJVsfNRYdb6IceoLLSQ5m+b76jY8Xdl4og/XnpIvBuTNOQVUwCyGRBSokuk9ldwbqACeku6kRae3cn1yOq8FlZMMZVpqngy3TzekO2T80O8BN2aTJFxvUAIwRLFqNjJVdggMooAhewsWVUpFywAIiE1MDE8OVZOi8Ic//L5brwxxf9gPv/9jGvPl2zc/+Rc//cGPf3x7c/PNNx8f7x9+85vffPrwzdnlxfbs7PLN5fnV+ePD/ePd/afHx/0//vKPH29/9NnnV2eb8y72kSNYNGoIokJAYAQKxIgKJQDj9AaQ6dQlYA8dMtOs4pG5oEB+LOJggFntMaUP97uPD4/mykspgoCqvi2NOZEqMYUY265fKBq19p+uDM8MslnE9yuBKux+zlNAm17viQw/QzwWi7aP//iusUCAPKWxVxT38eNIs7h0rDnpCIIwBNCJcerIEkAAY0VEBQRBUEDKRW4e97f7dH1/eNynvm/PLrY6tfw9JsoIXafwX3WqbedWjBIyOhQFxEAX+aYqqqCuPdVXzMtUIkICkZzSqKoUCNiQqeoo6CwukZIBMYSABoTEzE5iIaSu7RBgHMfd4+NqvTJADpwli5WiFAjW69X9/cPu8aGJfH6+1cwpJSLEiMgYmlhKCSEYQwytKZZSVNWMCdE14uFwyOHA65UKqEEpWQnef/b+/uFRRcbhQH1P7B5JVatT20ioBMb46r36Hm1nHothLwmb/wRl+Xng1RM+0ZOEwz8p0T7Phnnxc56IR08E62NsnZnTwObW6Z8jgs9P4wmG+8//wlP9ujY+j9B8q8B2Qss5Pz5IzgUmRDoiqICpBaa+696/f3dxcXF2tum61scXnLsqIv5uMfvAJoOW+Vk2MQAYIlMgIE1F7h7397FhXkcKSJVJAMhESgw65dYtesQ1v8b/GEIICgZFpmB2IuIYzKCopmFMpaQiZhY4AObAvOr7g5SDFJ9gGtIomJkJUIsSmwK2Gjm4h9QMKnESaotqkmNLKQoWAsWAwZBqhokfDagUS2lUNSAqaklkyGWf08PjQUODIShCKiVpFnePoomZEWvO17e3q/XKhz1yzqrqWIb7x8YAuqZdrVbDMMooYDJPV037Hc65CrjQ2qem9JRWhwgApUhKWVUQgJjN43eYAGhCZk/iqRl617K2xnU+trn0kXIWkZRq8J3/UP+aJsbNZn12drZZr5umCTFQralpUrSrrWFKnD2WrPDtEwDPr3z/JgtSGS4H1IjZA/1CCFgbwye3v9+ehDSfo5n58vKy7/snnOLlE3iRd/EiHOb0mwCh94/tCb/i9fEqEL8+/qJHEDAOFGNrBmpT9huAusVksvVVNVjrULk64lVNi/o03+RXMViIOUuEzfPAzaeW4Sd6sR1Reku52dQ1aZnKfJ3Dq32ux+UBcw7dREM2QAyROBQKQ7H9mIciGLuuX1UYhagURfAAPlQAASjmxYcvuPM/JrpI8bQ6Tg+KgSNhTEk+3Hy6vrn9dH37uNsf9uNhP6QxpZwP+4OJqYqKs5zrWk6qVBudZmZMxGAK/nlVc6RqzVEEIzMA9FnKkhKoEUAMIVCIoQkxcoh9v+77br3ZUAjuvvQR5RiimpVSoBD6TkAEqB4M7h4zECF262YMFJg9KcjdRIhU905iAiY0AAFnPImqiQQAAU1SUs7DMAJSbLuQMxAKaDE11Xfv3q82m7ub233OCBCJzjabz9+9s5RISsMhBjbTNA4l91IaDcGvj0AMrBbYJ+0C0qbrymbLhFlkLOByOCCVEsBHjZxOi8T1WOpJVJBSqkcHIkIMzExsIvUDRI6pyrmOySAih9jE0HarmiEwRaVNFi9CoOkemDC/C0Li8gy7FGCPQXc4ZzzSMo5uNgzPkubE9T1BFB+Lc5jduMTEMTYp72/uHj98uPn8YhMpmgjY0n84eRyPSjc+EaMXnw1zgu+MymgCr1cdE1qdzp+UJbBvE8Onj0+v4mz70sUg8zQ3b6IzeHxx1lhUFJMCV4+CYJ6x4KGDx+P/tJ6oatNE+pOZ2a+P/1YeCECLAb1ZTXvOzXa2C1gbIxOLWC4l51LHJWdY4Yx0OUasnZ7ECU1sGgCu9wQRMrMQqcqU1AWIhlBjtU5na2yhCaItsKrLKZwTjW/GSyAu2Kyzb9lcH1fDIpZFcRrMn2X06d5UM0BGIsolMwABqqe6wBzztRxht+k+XYS2TYKhvahEOM58pgj7J5C7kacxWC8KZwDC1BmaDxyTU4oIK2QjBo5NZMJUsuacs3785sNuv7t4+2a93mzOzrbbs/3j/uOHbx4fHq6vP90/3Pfrddd1IYQ3bz8bN+eHx4ev7x8/PfzyfNP94M3lZ5fn21W/7pqOOYK0jF2gYgpFGcmIDAC46gYuZLKZzw4nKVkyALARI/kwqyIWg/ucP+0O3zzsRiTgaEZolThrJqqWxoxsZxdn27PzGFskqpSKyavupA+fzZo5GzOAC4/vB8A8CGJzzYXLVPLFJJbiJN8DHKHPxyvzqRqF+C1Vn2k9BZkfjHy4pLZHa+sE5tHaytPUgvTh9vH6cfxws7t/PGy367OzMzPNJZdSqjlxgh/BApTvmsT8+rhf3zu1s2BS59YBiUiyuDVpRkwwY06lSMaKKlY0JCYpsts/7nb7x93+cXdQ1SbG9Wq1Xq1Xq1Xf98Su4QaARlVyTilx07Qw9WVzycS0Wvd91+acD4f9+dmWmUvJRQoSEkFoQhmSiCCGJjZgkFOWLIEDRW5iMG1zSinnTlUMRGRMAxC2XXcRQkl5HIbA1LStb42GpiZO0FQDEdVXBvH3pjqbhyGfAaf/fI14WXx9h5z0ZILzz1FnnpOCv1uWfa4su3I6l4Q+wP5n7fN/KjDzxZ/4onq1mJI5HrBnZ4b/O40JEU2VkYC9W2WgsOr687Pt2XZ7ttmsV6vNZtN1ra+iRJ5yURA5hOhCZG3IEaMaI55ttzc3176pGVBRudsPX/EDBN72XccRVNA8nxPIEE09av20P10jbXy8I4Y6+69gKovUBLCcRwXgQDlryslUETGG0LfNIaWxFBUpBob2OB6S5jZwG9gSjgWbwOQr+uzfms4phKiiRdWxOQBETCE23oL29zbGqFr2wwBmh5yHlFORQ8678cAAKiWrihmwn99wcd0ShaCAgQMzlyK+AadQbu/u05jPtmervmu7DglKRtVxztute9rcIgVQmbHOOE00VckYiZBqlqnL+h5hnVIqJU+dCLf3GvNU28yVkNVvW11HAKrq/LrpYKNVFyWKsfEHVQolINLUXrdZTfGXZNFRQajsDq5IQFM7YQs/ba6YLdN/l+kOFgIDwOFwiDEEjKI6D6Ac8yQndVhNkbBpm6s3V007Pe16FH06c4CEoMDMxMSBiemk8YzHr5obG46ZVBNROUb5vOrDrwLx6+Mv+3DHrat9BqgT2U2hIgDRFCdjks/bTkBfxxCrqtpx9gLVFqzfP9Xmermj+0QAWhIYJ75k9Q1XBK0uwY2OApzztCroFpCYKbaGNGTZjTKKYtO1fd+2vZmVcdRJu1MXiOvvZxVN7zwN/2GuIddivDrAxEAUEHk4jA/D+I+/+tUfvvpmvx+GIZUx57FoERVVEZ4KYZpqfJp5sHXt9Ohv8VfZpTsim4LhFUBdryBENGPiEKgJsW3bEELTNE3bNk3TrzZd3682a0A0pKKScy7FJyxlTHlMIyE2TdNgCAbEAIiMBlplSiZsQqRK+zdAYELmAEgcAgVvfTMAEHjCtpJbP4nQrBTxLbZpm77rhmEwACZ2OO9+twNEEGVAEC3j2DJ/8e59AAMpBNbGpu/ayFQ325zZEAio7udICIyoiG2MZ+uVShlyUrDAxIhGyETGRNWAppUmyITkoXzq1aObpEQEJi5CCMFxk15yp5xVtcalEXfdqmk7RII69OWm20krnfVie274qAxiT0s7qcXdHXb82OQ+noSieXefIuPqoHbNq5gswfY0Cs97I8gcSsbHx8OXf/zwkx++v1o1E1bYZqdYfXYT+Wy5qS8QEDafQypqGMHACKAJ1MRAEyXTlmqzI1afETOPwhvalAZWx4Mrd3l2c0wd/NrAmmRAgtOByek1sqqDVIH4iet5Trn3fN7XjeD7IxAvrsznnYjpmnQiixFCCIGZTDWnXMo0nYnHssoW+WBPvfsTS9xwKcHVqQPGyuleRCk+JSwtSv1F9AkcwZGne9+8A85PC22uEicTyMQJQtWaxBUYZzzF/APrlIx5BgFZribKqvZqta/hpA2anVYYz9Phv7UFNBcTVrnpNeC1FpiGBlahVk+YUv7boFNw/LYnIuaub7u+DYQRFFPa54McDnfjOJa8Wm/Ozs/Pt+fbsw0ztl1z2B9STvvH3XhIsYmbzTbGpt+eHfb73e7xcDvsx+HxsL86216dbc5Xfc+oTc00N0QkEFUDYjRDPw8IGChoEcmljCVnyYgUOSgh+24LlMxuDocPj48fH3e7sSiQTfQeJArIKWUxjUSr1Xq93oQYZhK8zanm3gZedtjs2AVUAIInLHac+aTLJXd5R9iJu/Dld3O5+tPJWc6movSpyFJ7qESL6ZejLcl3F/X/Q94d8vXd/tPt/W5/WPX9erXy1GP3EWJ16S19DFXQPh2fPyJaJylt+nWIkFBEl6Hz3jgUFVPjUP/Tn3nK6fFxt9vtD8PgGTs+J1tyeXx8uLy8qkwJpMChaWJKaRwGRNeNcc5EbWO7Xq0f7u8Pu0MaxxACZRQRIuTQxBgk5SLisQ1+zBARKRICIVIIoW3bMSU/vZaSx5S6tiOmllswKLnknEOMxIzL4aTpLXgNqft+OXheaNnAd6JElpiIk7HLP0PwfZEygSe8IIATLMO3asTPMRdPSsIZsg+TXXHJqf/fKKw//4nPf4uXxW6vslBtakYhOAcGEDBGwhBkTKDWNvHi/Ozy8uJss92sV2+uLs+2mxijny39uCqiiBgjMpF/kKYRJiLcrNervs+HvYkpYTY8iN3sx6YdkGPoIoORKrGnHai3zUwNnhwIAKbJCyAmUiWiwGw1Yk6yiEiqkc0hKIhIQfB5TmxibGMoHukMiGhDzllKDixtFFMCaEKIgdFNQDP/3EeCasYuIaAqCCgQhxDmIHkiDL52mRVVTcmZxWoqZgiWVXIpQETINVxXVFRihBhCbBrm4AkAplpKwRhzLjblugNcMnPTtISaszgp4jjqWs8vaAgm3qDXasZBRXMXELg9KIQwTcyIJ6ft94dxHCuHYbpaYWoUzySw+fIRkZSSX8n+VVOg3NxmRXdWEZEBqCjwRBpGmO4FmLazGe7nvEk0Iydgz6yz02BSfHbxPz1TufYbY4wxDMNhtepjbGCOXTxm7oGC1nmdSqnCpmtUtWgJFOwkeWPySxj5l1CgWf6G03TZ+fvPJRkiEpOIFinqle+rOvwqEL8+/vLnD1dDfeqzboQ+X4rmmAJTqp9YQfDuIAbXkp24KxVCjFUYtGXC7JO0zaVZ+IXoba8xKuRRZ/uw/9kJx6KmKg4/NvSSwmEPOhmOUA3BUAEVQZGMA4RGOezHfLsbjUKz3q43Z0CkIjmlNBbV4iuymIqCKjgqQUy8jtY6BSUmquJW5cqCUjBRgKwPu+HD3Zd//ObDf/ovv7i7352fXw2HUYtgVodVReNAACY2Zcw4Z8roOCGsBqriZxkmIENDIGYTteJcKUFEQ0OEwGHdr9b9arNa930fKMS2abomhMgxGpEi5lzGknf7/W6/PxwOCjamsWRLOcem3Z5tL84uIoYI2gRuCCIQoakUMDMGdFIiIpsF395C4Ng4g3iqCAGKPy+caYVpyLuH3X6/j+t1E5vIBIKC1DKT2m9/+av1ehND3J5dnG22m9j2Tbw8O+tiYKyHrJpOSwHESspk5rEyWAds0RADUYgxMKtqTCMOJCKPOzKgQGRGauY1aymFidq2QSRRBRHABAAq9VGKlFKapvXPmUrHkkth4hhRiyDzerNp2tYv+AW3YrKtwtPI5xOi5AuS1tyKPdlvzRaVwOxmQFQw1w/UrFIufAZ3CsvSaTyZ/GDkyF1Ag/C4H//xV7//wfu3m7/+Waw2X4VajSMaLoIcpvoE6pD9kZU6Zdepiqj4F3KwJnIbA2MFUeqJOqFmwEjf4geppv/juAICLjWz6Ty8GLTyRYY8QGrxLvh8v07JmcjMzKSqTpZF5AouFzGzEAK9jjJ9j/RhwuqMnxLVnA8OtX1pc0ANmAEyhRBCjMhwOBzGcfQ9x6FFrjdNJSX5bXSSZzWFwy3Oun5GVx9gJFJA8Tn54+0+XW9ES1wPLFIuax37pDPqZPiFj9/3iqm7MvFoq72SSMRSTp6EBrMrerqTAHyjQQALITIXEZlZHB7zclpsox3XmPmvbFl+P1ENnqAn59qA0bzfaG5gZpfjvCafaVYKpgCGBGwg3pM1xNB169XZ5bYN2BF2l2f79er2+na3S7eHYXh4eHx4uP74adWvNmebzWa93q43Z1sRHQ/jOOT9/nA9XocYuq6NfXe+7rSU25ub69/8btU055v152/O355tLtb9xapbN826aRQgmAaCBsjUFAoAECsAlFKKSC7iBpwCxghkoEQH0dv9/nfXN19+uv7y4+1Xn+5qCJ8KGoXQxqZBLkC43W6vLq76tiNEDwQA5KMUq0A08eltigp1rRwBPI4davJ5BQWBp+XVluUxEnViGp40LA1etOvM1XV1Lc/aivNajsBQIpw5CUazPAwLC9fxgIei5oeZUew3X371299/9bjbffb+3bpvnU6Bkx2fJtSl76b1gDmN8S5uw7kvW7el6mojp3YKLM6fRORnOA7MXFuDXtKP4wgA68364vKybfumiaqaxvT48LjbPR4OuxhDEyMxM3PbNoi22x+QoGlaIowxikjJWWLZbDYp5f3N9d3tw/v3b2JoxjRmkLZFDjE2Mo4jlapHrFarlJKq5IxO2u+6LhdPxLWSixW1xqSSWAAIh5SNhlXfh8A4GfN1gr+8Oq++P9vZKV20llQV6f3CpPYT7RVeSprSo8UcX5R0nwyvPHkyL1p/vmOEHJ6TLhaG3yNxFdEN/vPnLpXib3MaPakin+Ms5t9ojrCb96PnIvjim6sZGh37Y26eDcwxNn5O36z6q6uLq6ur9Wq1XW0+//zzy4uLEBgQPHYy50zEIkokqsrETucXhGni1vquvTw7++PjwyAKGCEwEN4UzbeP2agJ5ytmM0UjrOiiuiSLe5YWp4pJAgUk8PjUAASIpDRqKjmbats0u3HIecxFiDE6XrZYIOxiNDWEMooomppKsSIll9yEwEiRKcYQOPoCzERsFGpAjgYOgYKXy2hgbE1sQwjEgYiZQgyhjU276oc0igGFWABGlbZtgNk3diDiJgCSAYpIFg2ATde5v1QVRI2JpJSAOOYsRTOWYRxDjGfbMyaObYPByn6f0khEXq4wEGG1vonvZIYApiAmSsQhxqYF/0OMkQNPV4v5IMgwDKUU0QJW3NQ8WWZwcg3DrNXWdbsUOJmW9s901nxomiaEyCE42NnMqL5dOF2rLoAscsJnJ7iZmUzTqLPN72mzdr7s2dGIp3/lgMSzs7P7+/tSCjFFimLevp2Os7b44QYI6OfD3W7Xr/oKmlgeMKpv3TV3ijEaWMpHYLFHOfiXqOlpC5rarr27v0spl1JijPAKI34ViF8f/1U0qEENrZTiHU4vYXVaGtDAMf1SS+aqvJgYGJgcPcVgjh62U7evPY/a/LZN2icicJ5afxIxNDGO6wYr/mxEHOo05cNVWB0xGJVaXwZqGiXej+l+d8iCm816fXaJSMM45lxKSqJSHVWgWRV8k3RFXMVQTU20SJWqRUxBFCYSk4IVMBT9eH13+/Dw1cePD48HA7q8evvp4/VQDqIaDELgSBYcHgE6z+SqCDHD8Vjj/EatFQGh03+VsLpPVYEoEAUOIYa+77ebzdn2bLVeBQohRg4MiKlIGtP9/vCw2z3s3B+z2+33aro/DMQhxLZt+6TYbd4KhbHkVlQDIyGaeNpLoMzO9GcjUABBDERYSywmRTRAZlZTlOLCOTEhYB7TsB/SOFKMDNiGwGZs2hBJB4zcIr+5uDzfnl2cbd+cnXcxrrsuBg5UkSHV6lnUTNHjlbASCf1vEYwAkJA5tk1riAKWRZhQEYgAimLdEesZlGuCn2apAWU+2DLv7p5RXseFStkPByTkGE0UxBBw1feBw5Q46za+E5HyRavC6Vn/yXkanjdjbdlGRVjO2L7k1sNJENDZijzRtUwNipgiGfBhzL/58uuf/+SvqCECcr+kX3paPciuQqBNL/FJKYGT4ut3YRH38LdMTQxNDEQIMj3H49daRRjjS/JwFbJPT0Oq4PXDUadWd5Y9f62OPrP5Dpq68UR0tHLPKQoGpQgAeIT960bwPaqoCXHGNdiTSMQ6eE9V8BJRIoohMHIpJefkwYbT5VT7nTjTEuBZgI/By84pv/IJTI4uFr91TRe689HvPoeiH4v8Z+avuU1C6CSCOuFPE57GVNWQCUmJoIhImen/M1DgtGsLqshMMUbf3Oooo8+1VCOMZ8dRbRTjy6LAs4UOl56WObkO0AgMCFVN1XE0s0e25rGjA+mmTDVDcp6iCAaOzXq7On9DlrGMm46vuvbtavXp5p4+XN+MKamWlB5Suru7McSz8/Pz84v1ent2cWmqh/2h5PLw+PD1N9+ENrz//LOLN2/apvvqD3/8cH//6e7u/uHu7uri3cX5cHF+ud2oYcehZWoQTI3c5Qbg0D73ogqAcjQgBUIFAxOV+zH99uOnr+8fPjzsPt0/7HZ7pppGTkghBAph3fdt352fbVfrFYFBPfyQ1XadeertpO1P/UObtgfDyeKmc+VVx0AcFXkkdtSEw/oF+BTqVUkWz0LJCQlOWNQns+5aWSZHanbdb4490RkHQVMpGABNTIviV998+vjpZhxT2zAzmSVTmbqRoHVjcd+c/0w/9umJRqywTECdWZHzk6QJcjq7ulSVQ5iMXVZKcY/YZrNp2jbG6M9WVbu2PT/bqurj4+Nu92irVYzRzwYxNiHknDNzYEdXIKaUUsoNN/1qNY7jfjh4aCokUFEpSjGEEPb7fTJrmiZyDCG4FuYrj/9qzOzwSiliZnlMtWPlMdFFUkqBmdsA4N1YCET+SuBrWf096nee9CPnqxxf0GGfaLt+1l3yeReHH4VFwNUTafWFc9W3GG+Xyuy3HXeXiCRY8NOX33kpZzNTdSDNcRrPvvlzAvKLP/35arb8QS++gHPnuA6gTqMSHrARYiCiMaWuCW/enL9986Zr27aJ27P11dU5IZpIPXNX6HlFFpRSCFGkSt6i1VAVGPu+VdNcMhASe4SpjmmIHN6dbVaxBVURMTQiJPZdcxpMmg7HvpQxoqd2EhtKpfQ4kSA2gYzbDi3S/W4nUhAhhKAiKqKlMELfRA6shyGr4DQGmYqKlsAkysUgBESkGIIhFNFswEiBQwgIRKCEaIRIxCHErm0jIRGpgSnGvmm4i20jAE3Ko8iQ8lBEiBGQ/c0IAUPMRQyzS7ZIPIxjBOKAJSkRxtiUomBWrAQOq74XN6ipMQNxROIhpSnmjZTrNaZS8ZeeQCNgokbEVqPzvJY3by4SkFQt2E89KiKmxdN0JzNx/SEuxqpaTUg97W3YMR7AkCiE0DSt5wIFZq+kDMTHPmeBeLo5j0XgXCWaPa0iEWEalDm5R9TVHVyUWVOqXoxxs9nudntVQ0AObCJ4MvKDvlDgtOczcROax/KYx9y3PbKfjZGI/JPnGAAEZGIpkoaUxhRCmNvbL/afCLFvu8BccikpxxBMDAlfJeJXgfj18Zc/hxhg0SKiOg0FWNVrZn14TuqeoA6+oOqEXdBpdmHacZ8sAc+hUU+hWnNW9IRLn1hys1OqpvlMfmVVE/GFGwDMa81peVMQ1AJEkblpLbaHlL/85hNRfPvu8369MZVhPORcuQ+OrCguOxuCq83FQJyoZ2q+BxUFVTTxeFupJidFFDIt+Xe/+zKr5SQMJGpvr97tH8cyFOGabBdiJDIxQAMmYmZCPKjOy7eaAiIoihghMjMT1SRutYjEAGSGAG2IfRs3XbNZ933ftV0bYwwxuD02lfLp9v7Tze0fP3xze39/GEd/ZYuUlHNRu7i4evf5D5EChW7z7ocXF2/Gx/vx8eEwHFIeWDUikmoZh2y6QqDIiqqgqoKmCIYERORN2WoSFZMsIMDIBsCIbYjezw6b7TpElYJozBRj27V913WXF5fb9XqzWvVdS6YMxGSmk0yjBmoI4NFz4D/XDAEEKrmSqMqLTRuR0GVsQlBVAkQFM+WATBwa4hCcNQWqUsQQ1U/SzN7gbWKMzBQCEYlqdtN4UUBypFTTdWfnF8zsBCgAw4m6bRMFcmGvsyejbU/NF3bc+Y+qCtosBdiUDjfLO1P80EnfpaJN/WRtAGCEYFwTFPwApBaQiZr+119++M+/+O3Pf/bDs1UEyCrFRLGOysM8Fz8JO0emKy6UWFVQnwkyU7W2aVZd0zVhTqKbQo49W6oKWC/MDs3T8jjNwFf/WZ1wd6ZVbcY4VmL+/Y9nkuMqQlMMBRM3IQZiM2MmVcPpyCEiuRSiQFRDGV8f34d+p3cHnyEm6tB9JeRN95OZqjRN03VdjFFKyjmLynTyXpjVp9t5uYcZHsOxbXn/V0jD1OOc7fcTG2WuH+ap/NkEtDzfzwP7Mw9Faxt2UgkmBs3s9PAiwIigCplqap5QWr+Pt0+1FFFRc74OIIkIM6M33uyJG4tqeo8pGE3heEcI7OLPi5z6Iw/c6qhN/UZgIIQTjRHR6kgQmIGKmJY6CYRgiCKaPXqGohkIYr/edGdX2J2DFRkfDzJ0gd9dnb0733z+9urL69uPdw93D7v9MBZEJby9ubu+vuUQ+r5v22a1Wq36/s3by7Pz7W6//+aP33z6+vrzz7/4yU//1d3tzfXHD9/c3D88Dt9c3318c/lmu317vr1Y9+erVcPcBWYiRUAEDgEM3Z9aDAGdO4HGoKV8vH/8hy9/+49ffnlQG1I+7BMREBkRNk3LHJu+3Zxfbc8vQ+RAPvvq/llBAlL32phHxXqHzy9gH5IC87qUp6Jrgv/MjTZ8Yt1dRgtObe3l9mE2xebNbyAstixcGApseYUQM+PRZUSV2iDH3UKri1/VkNwWDAqQBDg07WrNZOfbDZFJkhg4MKEBI/qK7WoIIiARWx0PWV5vSDSTlaYZLOXp4DTkIURWNadGnDgKEVw4HsdRVZumaduWmU1VoDaVbUpiWm9XHGi/34uWtm1jCACwXq/v7+/HcWzbNgRm5hA4pcRdWPUdwsVvf/vbx8dd3/chxJzTYT/gipzJuNvtDGC73fi2lXPmgO6cQsSu6+YIeO9oq+o01Q3OvPrq4zfn5WK9XjVNh+T9aSvzevL6+D7Yd+DPpEN8m0w8a6xPhNp/3uPb+A9/Jr/Cz11PNOsnM6bM7HvdP2nTf/5S1Kc6LXj+n7Nh+TmUefmi4zTMqoZIwIylADO7ohdC+/6zd2dnZ23Tbtbrs+3ZxcU5E6ZxrHw0cg0Ruo7Y072nYraUAkAUyF1BxWy9Xl9dXd3e3mbRbFAMRZFE8e7+rGmad28uu0bzoKbIiEwoVEuAKhraHMuMQFBLZmN2wLpZUUCIkdlADfq+KwBAFEQEsQyjl3SM2HTNpmmN7u93e5+3IyQXkFVUAwhgsUJMSiBAoEYGjJRySeMYOESmhomIm9gScdO0XkJqUWUNHNu+ba1lDrvDcLfb9U07Nhljq0hFddQizBCCpCTih3XbH4bN9uwwjiVp1/cIlouUXLqmMbNUCgyHXEQNApNBjgHatm2a9quvvvIBwSkFsYiqHzqOsH5Ez77r+z6lLCKiFkPbbJoQoiv7OeeUMphLySpSRLTOLbpxqi7LJ7neLz7cV9u1XYyRiLyPiT4Ga7P3B5bQoFPvw9GM/N1LgbclVMWkLCkuM8jFf68QYghhGIbdbndxealmcnqD46SD+9gyGHRdFzn6tE0Tm5mhAYtADJ9R6Lt+OAzXH6/zmH/2s5/ZfKiYzq1PnjM37ZurN3d3d4f9oe9673m8OndeBeLXx1+4orbJ3KeiwupFng+x2zT4Xc0Xk30YtNJLp8BonUnAsBiL/5Y0gJeTZJ/k8Mz1LSxAWv5nEbEKoa8tu0pPNZuKBxIzMaQmhLaFEHYp3d7vQuzWm21omiKiaqqCaKbiW5hOhklRMJs1aBfFTdVMTAEEUN0WVie9JgK9qiHIeACOASlSEM35MFoWMmyaBkHLcOAAMVBBmqobdutWkUpnx6mEMtU5YMsUwIzMPHWVAQJiE0MTYhubtgmxYWYgMtc+U8qP+/3Hjx+++vjpm0/Xs5UAPZLbUIZ0dfn2b/7mv7u9f/x4c9/1mx/91c/yfnf74au7D1/vrh+DSdMERCt5TDYyQGRXswlJUERUycDrs6JHYC0hGXq7gLabM6JGVY3RVPI4qhR3q7VN23ZdE5vzs/O+7WLgSARgBIamigrIYACoQMbM0YLVNMRiYCLGhGAkUrGGjvciBAJkRAAUKd7enJN/YwghRiYqknM9MZiocmADy1LMjDlwcE8hQym+i7t9xxMSEEjkRdLfqVkRZnCw/Rmp0C98yhNZeYZU4EtVwZyeVX+ogpGJoktFAKBAAoDAinxI+1/8+suLs1WM5y2TH8UYPEZjEdDh4YsGipODeYpEmgVckWp0bGPTNo2PgCEoKOLM0KrUNVsaMGuFP7XWYUIgz0zVagdGPBEqZjgszr42qKuBzTZr8HuXiJqm8aobFu0nP6mrWggEr/bh79N2pmbqvspT2+2ctXY0L9TjOTO7mSOnMeeyMDcdN745BsSeHMRxOkQD+cVucxZb9duqiS6EX1hago/72kKPfsF+sgC8eq7K4h6BedDQAKSmlrACqkFRUwMm9pm+mi5rIDrFzEL9BupVLQWcucNH7+eJ68tOurqnCZZ/SiZYHg+mYFlQBSli4mB9P1KIPzsFUGKKfWxbYM6HsQvt+dvPmu1l5s40c4BdspBzCLAK8fKMQ9u8u7y4e3i8uX24ftw9pnwokgFUyuGwH9Nht3/s267v+q7p+qbrrvphzNcfb7qubdvusx98cXsdDo8P94dBPn4aUlKwMZf9kNoQ+7ZpY0QCQ2NiR2Sogig4yECBDindPT7+8svf/+H6030aM5CoqWhARJW+a5uuC023uXz77osfYWhLSlaylBHUIs+uMJ00XYK5eJzS2ezYYffPVkN7UeaYdwZPM6uRNrP57JnF79nk+BQ2twD4oJ2s4aoKhA68mC4S1WPeaf2Tn+TM1Fn0HiuAiOfn583V2fv37wKR+NDUMaKmirhiVoqaW8hNa47Ngm4IVEdM/AOliIgSuZ3Akyl0+nXcqGvTsD14icvMVUqYdXCHb+hRZGraxmEUpZSua2PTEGKM0T/C7M5i8jnrGOJqtVqv1x8+fvziiy9CCKJScklpjG1ourZIKaWMY2rbFgkVTFJ+ol6pGRL1Xdf1/XG0GaCoFCn7/WG/34vIZgNd24cmkOdNv+5o36fq7Fscsi8pQ0CLVvfzjFN44kL4p3den9ty/xzB+sn6v5wKnT28y4EGZn5hUuefohEfP6gV/DZP1h+r3u/O4pssChU0Z4BEIcZV3zVN3G63MTZ9v7q6erNerwlxHJMnAkyJ34iI3poFJ/PqnDBg5JwaIimFmN68eWMA9/cPQxYCNKCG41jy9c3dhmjz7rIhApAymZeAcAkJmcePakKQSh33mRwjNIGkcsmiyoGavrWcUxFCiE3skFgVA4e26fuVqOWc/UcxcrEioqomoj4paaUIcSRCJDUAlSzCWPomchu9CCsiKoqe94Imojlnn6GKRG2IDYe+bbOIUhQAyDllEys55yKKRG2IXb9SwGEcHSUnRQCglNw0Tc7ZX+VxzAS83x1WqzaGmut6dfXGDA6HvapyJf5OurBNyzuAmJUioobEOZfb21v47W9vru/W/eZsc9Y0zTDscxbz392ECBFDNeGoLTxAM017KuGfGf8da4fVYG6iklMiDhwYkeuJ6xQCbk/JES8oq8tQF8QTix7RCyRxP0Y6UNF7orvd7u7urus7CuHbFhZEJCMX3Nuu3e126/V6bmc+p5w7Peb9+/e/+MUvfvXrX33xwy+6rpt7NosM3rl3ZWa2Wq0Ph8OYxmEYtmdb92O97gKvAvHr4y/2qFMMAAAodcLUz/STH3cKElc7eSyTcSblTu3IZHy689Za4jtOQnXZPbqrqnPq9Kg08Yh1xpCKGsFSXPb1EYkDxxZDGEq5f9iPWc7OL5q2M4DKpwArWoqWWoO7g0dB5tS9I+QHTd0zTAomdW7Yd0uvnoy9tDYgAzWIhlmhHIaWOBlEpiYEBQ1kTQxUa8t6HmrbVodDKYLVAwZkyEAMRIZoaAauxjIhgRFiYGpC8FiwJoToHwc1KWnMd7f3N3d3H7/58PjwEAnbrkuluO+n5EyIhEFF94/7w+6gWSOFdduNJQ0h7BC1FNHMXdOFZsjJMc05xMDMyEompCqOwHAtG9wD5n1VQDI1JFj3qxhbLUVNTVViYyqBKMYQY2zaNoTYMUcAVgMThAoL5jl1hxCRnF1rzKokBdWEABDUQxLE5Xucg9z9ncGSC3kCVdVqkYgCMRJI8ma+IQJziLEJITZNE4gDhxijzxHXFJspJM2sjl3vdrt+3TcxTrnHi1r8+G+DFwyzxyJ0MS+0hDjY8hA/tQxmaeYFfP90zF2Agw0AQRQADdVTFVCMRAEZCrAZf/Xx5jdf/r6N+oP3Z0hkxW+02Yp2kjFX3YnzaDMsXMUTjLVt26ZpmFFFmKaZ8vorE3zLTm/z012aZvy0YwgTgLJmYlClXb8QP2Ynmdpz7RFDYOZqIalezCkICYAWfK7Xx/diO3MCCQnqEgo8O4lmi6wfoRGrsYKYACDnnLOoKSHNg3VP2jBHrvZcCR+T1mABOalX77wZ2jJtaPoWk/0fllkiz8vmJcxuMg/PlFfDSib2XJF6k4orYIjudhTVaR+f875ssgPXwLiqL5gBEZzi84gqHnaZOfZif/cpX2J6/RepYrW2MgBRK64Gm4G5fbiolWKgQNx0senazVnoejEY26Fp+u7sDbarbKhEIRCZHXSIltGwC7RhXvftxbp/d769fTzcHca7w7Ab0z6Nh5SklFLyUEf0x7bp1uvNuutSKEU1l8SMTd8DQknDPhd7eAgxKKIABkjNMAQOFRPBLKollyJWihYtWcqQy24YH3a7Dzd3B8kZSR0AYKBgkTnEBpAMuVltu82FUgNh1FKsjFaSghKCaQHJWGnXdBzfAFyOkOKEl3guIWGFoUwi/8l7VQN54JlydIqK9oufEJfw6Kfqz/SmT21FQ7Ojw326JBEqWNovOA86UgIwhH61uth0V2/fOPslBG9CTzseTrmIU0pqqUu30xWpahbT1NvyGpvPV1gjoSgE9tHv+VfwOpmIQggxxuNhGMGlBDxKMEQIbdv6KjEMya1nIURHQSCmvu+ZmDmoqJFx4O12++HDh8PhsNmsQ4gll2EcQ8OxiZ10UqSUEkLwyN0xCWJ2WgUtQwfNmGjaqggQCZklMAeHY97f3R/iEENsmhhfN7TvqVJ89AocO0A494sQjsCiGRP/YoicPWnr/e+x6z47u/45Ym7lNdUkiTm4ZCKDhcAiOIUu2ndI2y8EbB59FOhWgtk2Mb1GJ5IWLhBvBkBI8yl3zkDu2na73Z6dnXVtXPVd1/fbzab9/7H3Z02SJEe2JsiLiOhi5kssmQkkakPRDNGdt/n/z/cX3Nc7VbhdVSggl4jwxRZVFWHmeWARNTUPTxR6uqlBneNWSVmZifDNXFWF+fDh76SELb2cauRHTbRbWTEGqFZWxI0BLPPMNdoSRLXvuv1+v8z54flAqhgpEArxcyk/Pj2PfXy375nRxLPX6z7FJUoAa3vuzmt3HVnNlDdiCl6hqIrQIuKPdbfR9DECUic6ZzEACvF2HJnoeDzM06xqTASB2gqTgCqbmgVgJzP7k5EBUMwWFS44cz4vMx+0Q5DYdUxoikUBjM+IhByDKjDxkPosdsqlJsCoFoNTXpBDTJ3H/cUUcxGH56sKklPuUauzBKTIwuX5dAyRkVizctD9ze7d+/fhKYhICFw/FtHHfq3oIsBK7Aghvn/37sP7D7f3913qQfXzl0+llNPx+fnwdDge6lTDAWWIqgYXCVfbsLwevkRkaNvs61pfEceY+r5PqQ8c2lW4yfA1UBM0+gXyyRW392IJ2pzLW2v81/yZNRZy3S0YhmGapnmen5+fb+/utvMb+GrV22Xfvu+fnp4Oh0OMse/7NUt5u6zg/3x7e3t3d/f09PQ//+f//G//7b85TOmF7ck2dkBm6rru4eHh4fEhdamNc95ebwLx2+tv1VH7yi04OE833iq9FBSew+ZqbT0qPGO5pvl4WFUN9aktiV2TH/8SRurSA79QeXS1JK/cdPU8OnDiMLRvBlZdy+qOPzGGnkJaRI7neZozcTeON35+V0gGmAMmHFpgNSLHAcEgDYDo3hQ1VKONKq6GlfkKNR6karhowK7nqpZ5HlI8IaBaZOah0zJHZlAQUYMa+RdjzHmRLCtHlQkRGIGwphFUKCT5iBkxEMXgGGIK1V6iaKpZTs/PD58/f3l4mE9HNhj3+5C68zyLQ0KgEGAXw3Kef/jjf2YxDj3mPD08zMencjpDKWxAgJG5S5yJzPPbyqISVaOqYM0nXD1fqiK+pOrvkZqZSWAmIiHUUgxR0cAoIAVmJg5OnspZVIHY/PRlRpAW1OqQp8t56QE5WuvIui8Edf/5shztHycqBKGeiKsbjtBMRUqpjSLFwDHGFFOXuhhC4EBEOS++pbNhONTsXlV9en7uhu7+7o4JDTcV++Xw25aor1AV0ABeBQ/XK33T0CNckMNVHzZvXl9MmOFK0QVAUAUkx1ZX2IMqipkZP51O/9t//rjfpffvdkMkhWag31CotkJwlbM2jgWom0f1fw/MMfA6tba6heBQSvxa073c6duAL4PtXGYdjbf3nqoxE7aeueuc7usRll89FZ1quJ0zITlt4K2f/tVNPGEb4bFdtr84dqlifKuxKISIhCJSclFxLHejntgWCvFfdchWzZ/UbgFbG9VXOugmwl6eaS/11hcbuJdp0KvHqAPa66KfG0aBmA3ARC/3tjkig1aWCxCoKw1EtknnQx8Xo/cGqHqVRr1tT345Ix63xFv/uJZG5xxzMVVQUy2gBVQMTAEppW53k8a77uaWU1fEIOYYO+h2hUIWA2IAZMCpBNBJpQhKz9oxjV282/Xvbm+O8/J4mg/n+fl8fjgdp3leShYDU8nz2UohgJhSTMmKqhbXETiwWjKiWcvnwxE5cexIDacFtKKOgKmUcj4vpUiWkqUsOZ+WeV5KzmVRxRgAiSjUkgmMYwfIWUCNIA7Kg1KymCioyaJlUSmACDIDntGk+s5FzZTWaYWagblnFqDRnWwdqG7lebtoxOv8ZHuxXqcHv/iVfS3BGLwym2yfRzemgXXQ+AKxXYMYEcja+cWBUkopdWt/y+TzRFtzbOr9bKjrF6rfJSF+DQR3+1V10wGop5Ku27WO5EZEbWDiEEIIoUGNYZ3BbEIz6vHHHFICA5ymaV5KijUFqJSyLHOMkYhDDJpVVMhov98/Pz8fDseuTzFEJCwleyccUwJY/HtwURgQvMzyRnp95ohIzjm4EEN+FhIRdH0PANM0nc/z8Xg6n859l97d3zpb/+3169OI4TWVtA0hr4fl+BIgc/UZ8DJr2ua8/dJy51cS8y89K14ulLyK960Tn6YRqQLzdj5VsWxt5fGynrqe7y8gSF9/ifYiuJTZsKKNL1mtpk3F2wrQZs7N81gRVUbYDd27d/cfPny8vbntE4dAfdcNfY+mOS++VmnEHnehUOvty3qQeRaZo3LBDJk0BAYAESOi3TAu+/x0eC55YWQJrMxntZ/mOTw9CeP92CUgVGnfLmp7oja4GrRsAzIEaE8Pn4HXdyDQIigKZMCARtSHGDkuKgGzqBIzjRwDoxQUKUWIKBCiWSkVt49gAp7+qYrGRJHJiB2hjqV4vb0siGBL348xBkIyWyS7qhw4IrFYDW3LJU/LMpeSVWfQbDqmGFNCJDUlQmb3XFUZIITgyShac7qhmJRF+qVDToFgXnJXtB9GU815ATCRorM2q0k7ScGIEJgRKaX+djfe397e392lrpdcnp6ejsfT4+Pnp6fH0/FgUAIDMwRqPP/KKVwPNmhSb6276kFT12AAAEJMfT8M/a7r+hAiUUCg1so0/4DW6T8SbhcC7Pr+hU15uArQL8Jvtgo1XHPG6+jCzEXeUsrj01M3DCmlX7rx10dE13UxxmmaDodDcP/NNQlnnVinlD5+/Pj8/PzHP/7x48eP33777XZp4MX4yk/mlBIRuan53bt3b4/9N4H47fU37qcZySF4RbxNpabR6FZzaohg8IBsP+h8fCZVINbW8dqr9qIXgbNtZ5YuTbBaW05s25R2Uejqyp8JWCFfH/LGy0hNyV2lPlQEsNBh1xeOz8+Pz6cJkcdxV7k2RPUHUBM1QG6dvKlUziM46raxEcF7svpOKLi9sU3iXTgPK7R+/ZMIJZdxHJmp5Akgpq5brCCSbwN7C1RyHoahi0l93cUM0UKItnmTAYwI/aj2dzgGjhxiDIHJ0QquCuRlOZ+O5/Mx56Xv4jimftwXAwRc3CBH1MXYp4AiDz//3A/j3Ye9Hp9//rf/NU+nPE+W864f2UrfDV3CKZL4eWeiklUCcAAV0wwSQAuomSxWilur0RRVsNoBiAEIoICpCbpj19f61WTJRgIiRmwOHyQSEwJFYiBCayFjAG4e9eNPFFERCYkKVpIBqw/PkZmEmTgQ1FKtKiLqI3WELFJETNUAAzMghcApcgwxMDFTUSkiOedcipkRU7PRkTGb2elw+BJwHPq+H9glS2cAwzX2FFZMKV6sdJtevarK+vUtsykFLp4mWBfzLibGS1xJlY99E6ndRJ4BRSpgWlwXFQUFFAt/+vlwd/f0D39fursRoCgIIpltU+HXb8CuZAWo6rOqavvzkdntuhcaOTQnhsE2gPFaWrOGmNCtDt4S7OvdZK61hNVcZbaSjlfGS62QPKwPmxymhuqjegRelxxzzjVgAt9C339VbXT1G2odGPljYr1s67MUkRArVAgwxtj33ekY3GejLfyliZ7rGl1taEGrExfrxuLVaGK1cVVTjxqihbVYJ/TRZlP1bKWV43VT/UIa/tp+hW2VUTcznZVx4XcB1j7h8v372j8gAZSGCkY1MBViCikWUxXxXBFEWr/maoPedOavQKKIaDM2NTPjRtBodLzKRBBXh0VAzbSYZHN0EzBQGHZ3w92HON5i7IGIAibuFeOMCQwVDL1F5KAQi4SlnHOZ7xGILDLEwF0K+zF9uN0vxeYsj+fp8Xh8fH6eikw5T9Ocsxyev0gp4+3duN+HGA3seToeTqcQwm6/l5yfTifVh3G3T0Sa5Xw4zksWUEXMUs7naSkll1JUxFTUCyjGGI0YDakmuRjHGPphMSpAPSVLY6YuQ1QyIqTQS8hSMiOjzlgSWDYpKoqWsSyGyuAwdgPTKnE0Vryfq64W0epWb0OOxvLD7UWyDUF/VSSCWn3ReqW1+s9WRPc6FVidQYYmKh5zuG6C1Giai6SlRE4A1wKWl7zMiyEZEoAhGWEdHlR7whrPoBoCS4uWvW5Ha0BlW0Fz4oQVKRwYgGGzJl8TaJsIu0bMwWXSW5tzJFwNej70IY4pUSm6LJmAYgwxpFJknhei835/06U0lcmNyX3f39zc/PDjD7v9yDv23fOchTmEGNVMRRSMAUKIKcVlWeZ5ZmZRzTn7fS4i5/N5zwzE1wenxS45s/V0Ov2v/+1/EcBvv/t2nqe3c+BXLBC7TxVbcHf1uLZIyssIiF5pvrzhqiYefDko+lpIelUkgro0YJeByrU463iDV4Xm9c/XgrnpxW3eU+Xg5pj3u/4qsK5mv26+w68wzXh53iCa1igxeIFo23yUxxb422rIiGyAiIEANJcU4rv3H373/d/dvns/dF0XKaA6dl6ymllpjBpVRGLkSEQisizZGVY+AhYppQgYArCYC4joa4rjOCLi8+PDw/OjZTHqSuAjhlNZ5qeDxhBS+hgDGhQQIiIDye2h6xWNKrVA1+YqxxXj5mp3iqE3BChohQ2yakEzwFDQqAhQCNwF7mNAyQFhWbJXJzFwLiUXKaImplCKQ+uJhMgIFayAcHVr6SI5IRrhomXfdUMMkZDEUgiSQXUm4sChiMzLcp6nU14WkQXgWAqP43CzR8ScCwUWlZjidD4Tcwgpi6SYSimAsJQFAWJKyJRzfj4fOSB13bQs8Hx4/+5+GHpiO59PUmaRJXAAqynF1ROtyBQAyQqUZcrLPJ+nQNx18f3725QwL8eHh0/Ph6dS5i7x2Cfqo9u2nS7tfWR7k3HFfnvfziGwh/0CIFGX+nHcjeOYUh9C4hCoRmTjRvZfJ+8oJi+9D9t7s9446FYtN7uLXO4L35W56DxNyd3e9THGcRxzzg9Pj8fDIb5758btV7e9/dOmlG5ubr58+fL8/DwMQ9/3/lRZlRz/Wv7l3r9/LyL/43/8j3/91399//69q9Ktnd/KQRWI0nXdbrf78uXLzz//fHt7+0Ljfnu9CcRvr/+rCw+oydekgNXDCuue92W847YfT5au0qpptWEUlza1BnIiUQ3NuDxWttsN2xXaWu6r+TMVDS+h2Vj3gupkzQRNCdSgEIiZo24JkFURxee+poBGAftdDv2nh6dpysz97bhTQFFFogZS9t2moGvmHYCCOHTY7cBm3kVUlKohmRk50MKlAJXGY4Vi5g6PFUypaj8/fPqH210aUinTIiVZSN2IBEBiCESIBlKKqRJiDIHIScQYYzKznIsWDxVwcw2bFhAlpBhijLFLMXAIzJE5cnDwQox8f3d3e3MXQodMhnyalilnq6bpsiyZMfT92A+7GFKXOn38cjyfUky7ENLduxQ+EhSEXOaDg4GdUS1lESKMiUxQBEoxKSZqkk2KqbIH/FV9ven7xCGyEPhqf33zUYgZgLSosCIIQUAgFANEZEAz976txwl4AhOSNY8eAYCaAKkJATGygIIBMXJA70ANAQjU1HtFMSnqm1cRRBFpzvOynE9Hiqnr+2EYBgBYyjLN0zQveckiusyZQxiGEZCmZZ7mWT6VENJ33/2m7zsOTIRakWfrMHmVhmklMroLFy9wKJ+IfOXNanvnW4NDzZS/1pBN2zqx2zHqvu36KVAN1KgKQCge6KeAGMZjWf7wn8/fvP8x/j9+e7dDqJCzWkPXG9iqH6E6Ix0MDVXWdpiptyiRIRK4pVpNyVZ12GqOH5rii+2CJqghuPO8SeqEZEAOciUTc7hHTJEZzcOSbUUYG1ATCFyKIPZvVkEqmJKAkNZkJlWY59x1HbuP9E0h/tXMO2GFraDfklopwOuQxdZpozfaTvjpus7MTqdjKbnl1FScUYuHvsxsFFe3SHXBIIAo1dvQZxpixBQCCxiYiVacf9VqXWldOcUble3K5N6EuNbHalOEcXWGmioQEKIYqq/Cswdzi4oiXDLufGqiVTcHQjaqz2NrNk2P4llUl2UJISLqynmqrH/ceLSvlYtLA9MkZSL/AheluwJe0ETNv0MzMymgBcxBs2jMw/7dcP+NhmGSEDgGZg4MzItgEUJGYhQtZqhGwlwoFB6KHOdy3pncIOyREwGTdKg9Icb4ceyWd3ezaAGcRZ6n03mepmWelzLN+TzN83TIImYWkU7Hk6ne3t5yTI9fHv713/9jN4wmOk+zlCJmWXJ23CNUvjMAqdt+mNzBSkgoFpn7lIbbEZBO5zzefhjvPhRMh0Xi7maeCxkyJcNOIC+iYBhDDKgMQiasWabnUpYsGUCILPouc/OPOfnSWkidgokIX2g89kuKj09wod4UF5F3te9tGKYv9KmrJKiq3dQfPahC8aRHLxzWgEeiZtwDq2GzKllP5/OXx6fztDCiKKgBMcTol6NbfdWVCfcUhhCdflhKcR12pZog+RxYRIp/Y04WfmFZaiuxl9g6YvbTRNVKyfO0/Md//HGepxjj/f39t9991/WdJxB4nEPf9+fz+XQ6DcOQui4lLaX89NNPIcbdsDOAZZnnZb69ub27u/MbteSSUgKw0/kUU+hSMoBlWYrI2A8IYN3gaXXTPDsl3x9QpZTD4fDzzz//t//2/0JmD4lnZPCfAun+7v725u77335/OBweP/38xm389Z9yzYmzaq726sjuK33nl1y3/6V3WC+7J7Ue/1o13nwS+CtxE9uF9M23ZwAqglstyY8SEVG1dfHr9UvdLvHG6+rAmtMFF8zSC8cSNekbS/EtDQXDm7ub//d3v3n/8bthd4MUnCVoMnl4JjHzRuoiJkAsJatB3/fu/TczzzlAxBCSFHUtV0RKMd9dUNXA/PGbj2p6PJ+kKKKoSpnms2YoEgzCu/s+1J6ZACKbIKhYUTEARTMHL7Q83BcCup/jkRk6CiHMC8O8gIl7djQGUSPmwoyEt8OuCymXUkoRVWm4xzmXz58fz8uiJBYYiSiwL/KqqiIaUikYmHYpPk7zInqc544oIgSk3X6vZnnJYEDESymL6pfTdFrmWUoGC+MYQqAQQgix6xBxnuelFDd+FSlIrGal1Me7D/aen5993uYOslKynq3v4s1+xELH00mlpBjMMwcvHeVlDmom83w+Pj0hQMkzM+e8nM/HMk9DF29vxudDmabpdDqMfRqHnaOlmQMR+9QUAU3NBNaireomUiMXGYmZYgyp68ZxGPoeidcc8O2N+Es344t0ivXgc3HWk6HgOqNyG3qMeB2G3uQXZt7tdkvOP3/6vL+5ac4AhK9CKf0/hhDevXs3z/PhcPj06dPf//3f+wW8fkvt+1HHcP/mN7/puu6///f//i//8i//8A//sN/tSylbQdmfGCFUY+K7+/supZ9+/vkPf/jD/f393/3+7YH/JhC/vf52c+kisize7Hjom7Y+twqhzfBUN33EW0pTU0UnK7XjZ+1/Xw2WXVvEFQh7Pf5tbuJGjVhTLOuIbP06nrCjpr7IqwCmRubioHLA1CmHp+fj8/Ox7+P+ZhdiOp7O8zzHlKwlv645d1bT6Bp62Fzqhv+60vZPQVilCMd/8brLazkvANB3/fl4KLnkWGKXVAtSXeatjhoVBGNEj2ExA5GCyNWS7JwFIsYqAYR2NBEQN4KXiriDoI8p3SbiyLEnIgOal6KIQH7KSsmFKKTYxdgxBSKOHENIIYQUY4oxMJjmvOgixVQJICAxAKqSCZqAilu5XReG+l/qjMCtSnTBJElgSoH9V68i1tgmYD7PVRP/VThPgqkdNni9d31F/EVARCZiwlKPTPDSsV4sAKIFOSARiKweIl+g9hxzUZUiuRRAVEMi5hCKlGma53n2ZFtVULUuxKHvDamo6OlUCB++PMWQbu/vbm5uiKAlYL1m/bAXjg14aXn4emqzlqxf/WfAF4AFQLc31RLexa11x5DM0yRNEcyETNGMAICwO56W//jTT+9v+/Ef3ge/equpsSGJKzXmQnHBVSLY/FqweQarlgRkL92FK5j5ymZ9AQFoRVlu3hG8fExblq9ZuY17dQFvNFm8KYHY4usqURzRb6+1zaj7X0hvoKtfVe/czOMX7+31M2SVOhsT1YyIYogAkHNlBVaen+oLr+IWIWzVoF7tVNvTwnd8CZwV2BZaQXwrZftHfSqycvZXxc2fUe2nwM3ywGo9bgl2AKag2PhIAGCoADXJFXFFvFzszTV90peR/UGMnlzirawjAevTwxRXEyWsmmPzan/VzFQ9fQXBXg7zNT/ARDRrUdGal+f5fsgGKkap39+8+4DdbimswCEk4gCISEwGpd71SBh8hCwAilyAF7PZ+Cz5MJcx603EHeOIGrAEsAjGhJFIkAcIfcdZegEpAjnr4TQfjqfn4/Hh8CygkTEvyzzPXaoht8UVWDUkBCRi5IrWMnNI1UXYd+uaERARBuYY2cyWIv3+9u7jt2l3L5wEaIxdrktLCMgUCMgUKUsuKmjIxGPqQ+xMZslTKVPJs5pE8MgBANXmqENYp+9EqzHvqwN0VZFwg/ZB5IuraEsevD6nDAB0zUrbtpo1mU60Zu0ibFdvL1D8OsPxWTUDApKIHU7T0/H07nbMakuxXHzBqlWUYD76M2/Cr7GqVh0Ltg4iWv+MiDWWasVK+CuEUEpZsUUhBBUholLK4XB8enzOuczzLKKI8vT0fJ7m3X738eOHEGosjyvUeV7O5zMHjjGO426el6fHp8jRfVLn85mQbm5u9vv9PM2qgIAxpiJ5ybmhl6BUrIRLSMDMqqoiTMQhMDMCLMvy8PDwhz/84cPHj+N+7yo+rX8P7Fr//X282e36YXg7B379g9D/nWPtLW7iuga7EowAXmGaf0X9erlL/lcKzdcV78t00+1JXbNwrGJPV6tETQ5vmNRtJNdf6HBfSNhadxqgknwV1kdaQ/pXDwMH/vjxY9fvOQaRggZMBKj+HPBG1KT2rRWXBFTELT5xnuetcLbuW/gwzh9dIpkZmTmEDvH2PE3TNJ9PM3JhJgQGxsOS//TlMXJ4v+/HiKEuz/n57RHxda/EDLdrR6s3uz4QTRsq0SITxMhEooYAFsH3eQ1Q1CIRhhiRZkNBtTaE6KPKUuQxi5hICRhAwRPe1VSBChAhRWUkFhMxnIuwWQBLKZ6q7K2ExCHkInMpX87TKc9zLgVsn9Jt36/UHVVNXefIZgPIOQOKP6u35UQIAQFUdcmFEEQKmD08PcbEKXW73e5weC6ilQByuVaJqJlYFJZ5eXp6yiKn04mZVWVZ5vP5LCIhhHEYuxilLPN0flyexnHs+8Fqm1v7LCSoizwrYdDz5h1/aM7BjzHGtnVqNQuirqu9vHT9x/xF3aaUK6W40fy+Ts54cXtuDQd+QXZdd39/d/7hh3/5l3/5u7//u3EcEfDVxYK6E8Z8c3NTpEzT9PT0tL/Z14Wb9mdU1CEb7jm4ubn5/e9//2//9m8xxr/7+79LKa3bPM3pTwBKiF5Ppb77+PHjw8PDDz/88PawfxOI315/23E0qqd/mCoY1ZRqW6WZqmeprcxfP6ZNFdVDm2tj0OA+VzbhF6Pm7aPhstVo26cYbMjCGwXXtFGcWqKd2wTRyG2O1RoZOfbHaf70+RNy7MddN+zUlEM4T2cD4BDdjppLEVERFXH/cxOiHcq4Dulfy3RAWDW69Yf289ibRXXDcc5LzjnESByXeaJ5GcdeihkgMaGxqREagMXojYH70BxgYUxIGIiQKyjam0ZKIcTAjnby5GzLpWQBBCYa+44phpBC7JCYOSkYcGgBeJ5CxIiOf6gpcMyhZCVCMvUNT8sZlhwMiIjB2BRVK0FCC0oBJRM2UZSC6kqxp+xaVWpaacqMjAiBEdAsXCYP1mobNQUkYMRAQEzI7OyTpkeu832P6AVznRk9CoIIEFmJmUjqWigTiiqzF3B0sULUPWgDw6LqQCZvmOd5yaVkKVK0+PxcxL/QOI593xuRAkw557wcjgc1m5eFiXa7Xb2kVRFfPdT9hqom17/GJLLdi2/n6GrOW+PcLo27oeJV3J01erIZSBN80RTBSBUQMQv/6aenXf+fH97v3+2IXGiqNzoQoIvP1obT5oGQtP5OfM4MW9XM9RLXvf76Jmar/a+GN9v81C198iqbGzdZWC1FeBWjcM3QNFMA58qBrwObWUqJiM3+T05seXv9TQeeFSBKiOLr/h7zdVVbtwc2kFRePaUuedk6TXNecmKGDft766fwM81gk9G6AQXjhhZXc+BM1czXeiuMdh1kVJGVoKJtr1rfdZK0zl1hmyHW4jOJ0OHyYq6xuo2ohvStht8rXAWS1r4SfEWx8TRqwxBjXL8TQtTKc7k4rszg1WfYCqu11n7Ux5Qn+dSkAisqzqz3eFNAU0QzLEYW4nD3cXz37THDNGdTTBaEUk3zJAhAZmAChuSeUaf+FQDkcYb+LCVqiSU/yjKS3FAZmQeGgZDM3N8bDZCw44AcFSAvFhUw5zLREYzNApIgLjmLGTGpwmKaYmQkH04TUABTYs1FitRoGq5IZQP0baKYYgwBEaZpxm63f/dxd/8BwpAF1XwWSioqIhUIAYghGIIam3JWyRnGdBPCHjsJmm05az6VPKFkBGFag0DbFQWO5jVxAOVrD1jTil+/PEvVsStOZoDXKIFgV6402Ao0rpUQklQCIyGs8G2gthK+zjr8yDBCAFiKfnk8Pjwdb/Y75IBcd7REi6gYsMthBChmpSUIv3rx+R0aAndd5xLDql/5/8s5++Ktbdpj/7tbos7nCcD2+/3Hjx+98c45H47Hx8eHL18+f//973a7MYTobfkwDI+PT8/Px91+Nww7U/j508/n8zyOY9d1pZTD8TCMQ2BaCERElEPgwOF8Ppnpbhz9mfN8PPZd6lJ0NGTOeZ7nGGMMwZmMTor8/PkLEZciw24kZiNqOfIARiGiqTLD21ru/x90bBcTMf1CufnKWtovu27XQ2dt3OyXScMvnvarzXAbkPVXlHv4NXjwWod6+R363bEpOK/E5e37Q7hFsJmquEbaAIZmUBF1FSgFGz0PUBGIOIQUUxe7kUMyX+S3YoZCBlRhAlDjMgnryqyJQWBiClVBbqsA/saWUhCZOQCId58AnHOOEWKMwzB8+/EjGP3nn/58mqYQQ5ciBDyX5Y8Ph3OR797d/PZu+NAR1khOUY+uA1RA+brcRiRmf7/UjAyCGahUITEyESxF/R1TswJWilARrn0cAqEAt0uOlAHf3aYAh9N5XhYzcVCUJ5EIoFAAxGwyyzkS9il2MQZEBmMxnBZACMRMDEs2xKXIU5FjlrmUYorTzBxj6vw75hByLgrAREyMxD669lrCH3SllJSSN2u5lBCYic0w5zIvueu63W6/LEteshloDVeogdfrxaim0zQV0ePpxE41RI+zziIZAbqYIAawLjA/Px+enw85yzCMMUZVtyUZNxzi5Vxkp1iTMXBIwzCO4zgOY0yJiHRjrwFwg5lub8YXN9SLTaAr7G8FXeKLgdBryU+4IqZaYIwh4TD0t3e3//qv/7rk5fvvv3//4f2auXxpXn2n2hQAxv1oYA8PD5+/fE5dGsaBkOqoQuv95HNZX/n9/T//XkEfnx/Dn8P3v/se3NRHREybeAAB8IxIHndj6rrYpbfn/ZtA/Pb6G1cb6KMb0cvjZhtI0HSbF5lYZlcxOlWQ+uvUlu1iUdXNcP3K1nyQPnzT5vvyvUBZIawexEV1GuyxpMEoCtBxmorqbtdxjIaIQCFGO08lF0AG38gQrZl3zYRyWbCvfVK1YOFqH2vpD005Rqx6H65tv3fFbvAoItM0xZgAQFRzEdW6/EzIRjWzhdiflIWU/PnqT01gYmzMMRUVDMSMEJm4mmerVqpqhEiEHDhxjBy5RcGFLgESUM3jbTmwbB6Up44+MvJkPgFDMFWVrHkCKU7lZwACYwBSAFUUARUQARGH0dJGaauGuIrDBSIf0Cv6vyKuZmBfXfIDkgAJwWst71avQt6snqeISJWxqS5D13UVFWcSrLwxQHRFxs1n/in1olvUQ5RD8J4YiESlVJ62SsvWFbUQUkyRmTHEAelG5PHpuSzLNJ0fH6HvOwAcd+OVPvtVuWYb3fcrLRh+IeIJXnVk2OoVho0f7KKk1svR31/ENe7HxS0E9ew6BNTDefnTT49/+vHL/h8+JnTVVTe+kUY2cy24+frXX7ZdwHOE18YxgK98J/gX+oWayn3lrrZVJFNrMtb6Xl09bbZcDVNnhMM18riGPKmIFO823Kbypg//mhTiCwi8PZYvUxbYzvQ8FXpdzyDfFZUiZoZVPpNL5vUmHW57xTRg/io61xkO4sVF25JH8DJrxBePiVdioxFBxF60wRcs8sXM7FktYkY+U3FfsG4Du68IzOskZSVI6qo+u3EYtu6wurKwTvu2GfFXsvGV23oTPFtDRLe8jjpKbKZc87MHBIlil/a33I0mWU2K2lyUoi8MAyEAgThZXAEBgFwsVyU2BDEQixkKS1iMJ81nhUFxp7YP0KFFIG4XhecsoAH4caYFRExURcCAiUFMoKCHNKiJqqJpKSbib7VWjdvx57U+MFijFGp8rIGUItxzN95QtxNM4Hhf08hkSkWLqSFRG4E6cwdVsYiAEBsGjswddYlCh3ECWVAWK9m0gEqL8lz3LQw3GtGl1VvTqeDVOMG6nvFCebHt4b4aAa6LyDaxW8lKL8vMzXlh1e+MTlrUpejheF6yABISA0LzQGuru6pbzrTd11f3YLth2ouZ1pCrFoqFZrYsiwsK0HTh1Zk4z3POOcXY7fu+H1OKzMHARErXp5jCp0+fPn/+5PKxSwz9MByPp8fHJ8TKl+yeD8fjMcbIIfTDMC/zNJ37vmNmh5AyEwfGQu5+Y6IQwjTN52k2FUeXeviBS8MuisUYU0pmUIqeT6cQQuo6NRO+AD/Q1fmibwfar/Zssw3qhy7MtV+0I1ybfP/LC+MXIitfty+s984vlKn2F5TlV8vajTBdsYdfq2OOFJAauGp/xTd8Haznux7YNDkfOVZl2M2kFRnVpS51PYfkJ94WxUPrGd0Ck9WMWi6ZAW7fGe8jVgG9trErsxDr/mguAGgxpt1u/KiQS/705WFashopoBotYj+fJmAktHTXdzEwoBG2nSTwY8Nq/gaaJ623x7X5wUCAhkwIhlJ/WvQAG58GmyqooBn58MzDUWltyIEId32X4rvbm/205HmZc16WnN22NasJohEJgJqKmuSSDSJzCkxeXRB21QBsSHRelud5mUrJZkCEITbrko8QsBQhCr6cyxzWd/IywG4vF4vnhboYgcDUpjn3g4QYU9c5yHE9i5r+gL4Q6fBr52nAJVNbXbfcGgW6rhdRXzBVhXHcxRDNfT/q1+06aHDqUv0mu64bhr7ruuBZ3rWNRYPNILa2P1eJxFuz/It5CWxsRE2PeeVxcV1bvkKA8S80jsM3337z+fPnn37+qR/63W5Xl6mhZUJtImeZuR/6vewfHx9P51NMMcaIhM0Ioev2kJgYWD/0f//3f//58+dc8uPj4263CyGIipo6tcmr0O3Pmzp+9/7922P/TSB+e/0Naw40Q1VzIcxjDmwDIrarcJOKUkW49pXYxdhU+6TrsJ0XpcDWkLWhrK6sQrukzDqyoJqEvMm0df7s0CGqeSykyBCSEhfR4zxzSqnvALEU8Zx6Js5FjAQIRNTRAXqtDm+Wr+wS0mWbGO7NPjsAuVMWrW3yto9zGVaLTOczcwBEUc2lFJFIDGYK6iNCV0VBK52Wgc2M2VsDDsTg27+GBBiYAmH0vxNHJjS1Uhw9GSh0zDGGSJHJuyQOTERsHncMSETI5CWCSYOFmBiRqVEVuUXLIvMEWmJrstCAHGpbPGy9mJCWDOpRaEZbb2tt5VwRrnFpF13Tg3VMwZydBUTIhIEwMhKTw2Fxk8zWdFBr1VxlDRg6rgPVrIVT+Efo6jCtVgsmIMwlVx9bFXEQMXAgLwOtIq9R1IqK/1HCEGO6EEtD2APOuRQRKXI8Hj99+qxqMaYUGa4zml9Y7WyT9rbp0u0vaMRfNepficUO9PCBBuBGivXyETaZRQhAUAtGQiDAuAh+fp7/5d/+/Nvv7u87wooMtrrkDtuaCi+6sd+Dq1JcW/5XDGvWQpRe/EzbUKCrhcnt+gKaqmlRbT3B5Uc2wFeJHjWzo2HMESpmuClsvjFAgZHJC7q3fvpXdJ5VfMI6RFk7SfJmaKPwqmjdECRkosAhxCBaDAyJCGEN+dhcZheT+lq3rz73NfoHq0mZoNm7rKLGL5f6VkLdaNqvZDk2qkTTmPHr58PaX9QbSA18WY8JNob7ikC3NYLvchzb2jWtYSaqynzZpLHLHYcvZz9r27Ea0K4E4raes57v6g+mthVkIIAFSDnEfozjjXECQqCiRZelcIgxBldCiNC0BqD5XgDVZgwVEdRPFBZCAS4QJ6WDlGfVG5OBbTAYmAIqgIKib1aomLfbiED1iEKPg1c1JAWzknPJGWsuIRCzIkgRLUJgBOi58uuvWxznY+DcqqIQwhB3d9SNxRhNkQMihOCmLjFt5YNP5Hx1g1ANZwFQY8UUOGAXY0hpRMhQis5nyBOUk0mG1cJu9Rzchh9eptvwC4O6Tf7h2qn6xfByenG5h9Yxg68lXUqFi3Js20lGO1ewIZJBAUgBnw7H87SUUvmgSEC8piW3KYNq1W8qF6iWm2vt1sCPa59pL+4j97BDA397CLuZ5Zxzzsw8DMNu3BFyLQxBiXC3G1MXmenz5y/n88n9vIgYAo3j+NNPPx+Px3Ec9/v9zc3NTz//fDqfd+PY9/3xGE/nU0oxBBeIpUjmEEKKqpLzAiF6iSY5L4uuBKQm91/mRjHGD+8/PD0dlmU+n86IyDFAqf7Fmk74lrj6KzzPrlbCEfCSU4p1DPmyaPwqwvGvlJ7/d9iKfkGTXYmiPnl/FVbzVa7d1/Wt+mbM1uC/waMzuB2/GYn/al3b9WGtk0FoO3YeE9KWKYkDx9CPY0wdIZWihIRMqOZAvGrZvkTX2hqb6ZojMa1Re7DJY3cMsaqVsoD5CqnDJkyL/8jExLvd8JvvvuEQfvj5cymyZDfxkBb9dJjALKHd3+yGiKFi9XzBr5qW0BtkJQO1KkXXjt181ktUE2K0nTN42btzUgWAYUPRmZMr2hM8MI99F0IoptM0nc7n4/m0LLlIhjkDsFJARGdfFFVZcmZVxMCs1cKiZGiiaHyY58M8F1NDDCEOwy6EqGoOoHe1ljmUImCKsQ4J3IxSSvFn+PrbX3L2jw1MBHY+T33f7XdD1w/zPJdlwY3FxIV7RHZ/QHWBqRroRVug6+4MAJHGccccn58Px+MJDO/u7j2Yt22ItUoMAQXdXR6ZU0pd16WUQuDmfsJ1uAltyrcaZLYWuvVCemEuXhkUPow2uxRmW0LaRZ3B1+70dpDHmH73u9/lnA/Ph59+/Il/w13XXdrJKg5hS1+HEMJu3OUln89nBxn7UPNqDc58l5cB4O7ujpmfn56fn56Z+WZ/Q0jrL4I2pW0NXDfr0puD+E0gfnv9refSRUqRsvXPwiabfaMVv5o/8NIv8pXb8fVlpfqArid3NRm1xhvWh5yptoWelR25Ds20uoB8KIxoFArQOcu85DiMzMGpyd6RhBjzNOcivjAECArocPeN/NSckq8IeVewiS3OpwZtN2cWAXBdYqnbo8SkZiK65JLGfsW/c4XlYdFsZkRVRXDbSAyRAFVEVUANEBiJsXYFgTESEihoQQqBQwwhMgckRgiIgWr9QHBxaDd+h1hRy0Vrwo56xh4jEZha0bJYKaRK2JbzAXx11aQok2lRIS1kAOgu1Yv66RaH9vtGANNVNVAVrNnLax4aESEzMlNgIvZwmnpdEeEF2rsG37U4s2qJdht6g9FWU5wqEiOQbfKdlmUpRdZ3Q7wdZyJiJCRjNZvnRWsJqgZQ/TtqIhIImTnEMI5jkXI4HC3L4XAws91uf3uzD4E3NesvOhrgF2Tiq2L3Ba935Srga3fZa5oNVMIpqmmTYbH+Q1XNA0C3yPmPf/70+HS+//YWfNEcdONGvqwm4aZUspffxlXAwtdOll/sXfGrf7DL3aYiJZc19Aq2u4P/hWfECV9Il3IM0SFoZomCu0LeGupfVz8N6nARXencUKG4r8wo6pIKIaaUxt049H1j7gPS10kdW8c+rsRvl8X06tZDB7FU+CCQmWJLgtNt777ClOB6tlJbuovy5cV99WhgHcM2CjE4Ta9KZQiqtWvFGue4fvcViucqnKlKbePJ7PIT+Fa7tI0ibAu6X3f1LwAtttYH63h4/Tmv+nm3PLvXREVNKRiH0I3d7ib2o2LEABwjScVRcGgIBp9xoiv8vmRkdLnJTVGBAYjUaLEglIrlxfIiy2hlwLIz6xCiAxfV0EwRKYTYpX4chiVPaljEPJ9dRLIQkWRBMCIg5hhjN/RF9XQ8qSkahEq/QXVms5t/1bKYghWzAqHb33a7O+pGKAaSkZg5iigYMgX/0HaJsdWO3phATLGqzGYIwIwUIncUIcYdLAdcUJazlOLzWkBk31a1NfkTWom08cHbVT225Q+vAK2vE6iawbg5gesP61NeQkKQzYWMm12vi2KshOseUW3BD8fpNE1zXoqK+pkcuML7281nAMwUOMbAhFz5xDVCad0r26Kx/T1c3XzmlRUzL8uiKogREUVknmdVS6kLHExFsd5Eujnbbm9vmLkUmabJlWUR3Y3jMAyllOfnw93dXd/3zHw6HgOzW8aenx6XZfHOOedSsnBgZspaSimEFGPsUpcRCZQQAYiZLYTtbaWmCEhM424gpsPxKCJ393cYQIsaF2IGNURAJsC3M+3Xc5xt+6YLLeX6V/wyS+oXhkBm9pWA/H9C8/i/6w+/6mVe9d+/WCRfnkLMtP7I28fXdUoewssJZl1/UbS21N/eVVt7FQohpr4PITIRIAVvSJD8EQwbQ1RF+9Yysv5qDH0joQL9/btaz2Jm9ggfpsr634JupIiAINFuNxbVw/H08Pg05cUlTAM4F/l8PCdEwfBun0bG4IssUNFA5Am52lJBCN2KDQao5DuXwABr1WJ1bc/RgbZuVCn6jLGGb6/yJQCaEhghJOIwjl1KXYrnaZqmKSuABUxdjFFL8Z2MUqSUYgBdlziwgUzLAgZWzDM5newITIG57/uQopRiHnZCGGNUM0cC5pwBzHNHtw3RsixeYQQKhCwqCAZMS85Lzhxu+2E8nU4lZ7xg8apF3UzaKJQuZuG2RmmqWy/8OiDv+0EV5unz8/Ph9vaOPG5Otdq2/bRSUwQx9WoqxpBSijF6LCFUnNPliEM3s2xO3vUi317ta1HqjObNHVTPbveF1SwN+6XJ0aZTu/x/JKLvf/P9n+xPP/zww7Is//SP/8SBLzzP1QbUhGbXhR8fHh8fHk3t/u4+pghUpWFfPVs9EKY29AMoPD4+Pj89p5D2N3tvq8GsWfNh7dQ8//ftFHgTiN9ef7OXH3KiKqZ28X6qXSeM1PwpX2ZZV3Qu9zJuFmVXPOLVo23NrLxC59REWdvGI3xd2viQtS6Y42r7NTQH+PqDmZRZiZeC5yWLwhhClUNBzSAwxdhNSylFfL3DahBYRaaqbaK0WuO+0YHNGVZtz75NkanZloicXAFgyMBcT7F5mQGBAwPikvMiQjGKFCREI6iIzBr+CW4iZiaiQIxgZcnuVTVTAnAUQ0AKRIGRERggIEaixJyYA1PkSp9gcme1IupKU66MBVURU1EwIAAmRDT3i5mKykKyEKiBkQkhsPswidRUVLBkIUIEAQNguF7VNwBHOhhyfZOgAg7Vs//MCIGQzNRVFEJ3EBPXlW/fbMLN4LPR/NeU3mYPpWoNXBPNdDWjM5Mrnp5gI6LznItUJlfxKoGw4yGmFFMS1fN0yiVLG0cgUtd3HFhNiSmGAMQx6s3NDTIWkel89jCKP//5T2bf3d3exshfWyRqCYkvhSq8hFDbiyq/zu03Nij7KgBytWOsC8TXn7PePqImqgBYGcOmYChuJaaUrXw+PP/L//rP797fJF9dVCC/8OufVQBAoyrsty/qtww2O0ZdWVt9xnqJFbwgiw1eoXrj5VcL13wJUZmXhYmZOcWESGtuiSsCLyLIWrqYumNr+xxz4siylJxlHCMRu2741lD/emqRwCml87K4xtuOjTXG8AJq9egrvx2ZqevT/f3Nx4/vuy6CiWr2xRH3HesmSdW359AuMrG2TXjY5PkgEWp1EBMCWD08YON59IeSbkByFRHgE1O/OInsAsVpP8r65cBvUFz37j0yTVb7CKJTD+qR5+hhtcqMwbbyWr0q1Fh4yByKZFhDxbZEiya+2RYNtYJlTc0q7N5XU5oOrrAyJXw0a2aGShFTjKnvh30cb/qb99Vjy8YciU1VS85EyKEdkaCIxMxI/nOKiBEhEBAC1Thsn/uiAKqGrDFbOMsS5NxlTQAjcaIYiAJKwIU6HkKkfuSh7w+n43leihS187ycp6ksxUPhGDAS9jHEEKEoIoMhmUbGGIItJlKPJiWSkDSNlHoi3o/7+9/8I/Y3xh1IBijbMsfJxYDAzA4IppaCbopWDMEpl6iARcEQFYmJQoiBmfsUy6xS8jRLXiTPYplMPGSArtRg2twDm7lB+zX7b6pxrbCNDXBLKb0QVS4YblWVlX8C9clcR8oNDF7bWwUyMzFYN35M9OkwPx5zVjAgUShiqoZQF4XACOvMVzG2HaRVFkGqBCQVqxyKChl30GQjLUKI7NkGRQpclr6rWT7GQEwK4HtZdu0+Zg77/W6el5zL+XwehoEQY4zffvftw5fH0/HocIn9bnc6nZxOFWMKMU7z3La5yCUhJlYK85zzUlKXGkuLAOv8KMbooXnVNQmERCEGREImMT2fTg8PDzc3e2bGwCQMiES4LLNdy4Vvr/9bK8SOL9hKqE6GtWolsfXO2nyUrtvmv5wa93+o6HkRKoMva9pXeMfXlSv+cow5rr3g6ytigERMZNW1ee0+JqI2ELUX6nAdWPlNxlthjNQAAWNIw7hLfaLISGRIiMTszmJgJEDTDSOKK+HvYl5xdh9SZZepqvPEXRNU1WEYArM0XqKPAFtdIbmYgTFzjGkcu2+/eZ9i+PT54Xw+GUFIlBUeJzHLix2Xkj/u+30XCBURpLo6CK/T1YlbuJ8HwzSZG+tKk79d6BeND8bqgNvxF7W2aeuHhMyIYFqyA44DQRcZLKHpeV4YYzeO426nIud5mqbpdJ7O5+l8Puec0xBFikqhFs4rqm5G6VL67ttv3394j4ghpvVtJg6Sl7ZNAkykdkm5XynPzCwiAESieSnCmCCUsoRn3u93XYpd15dlkTzjJa8E273i+6RyNaGvG6rbbsVaZUeINA5Dvrl9eHj8/Pnh++9/J1J8UmAb5J+vJnuIDXNIqQvB0+UvIH9r83dcw2bbpbkmrL46qV1pYKsxx1raxEo1+cuznBe3LRGB2c1+H/7+7xHx4cvD/1z+5z/90z8Nw7Aa9q/QxgiE1KXu5ubmfD5//vT58cvjd7/57ubmZg2PAkcK15RjZeJxHBHx8fHxxx9/zDnv9/uUkkjxXEokZGL/iaSUt97sTSB+e/3tFWIXggC918VVnYGLM/ElAtUX+rfPzZaccLX9/TLcvNGK/eO2y7Yvaoh1bdCuAtF1FbzaH6tWMQUECllxynKec4iROdR1Vh9jqbn5c8kToCGxKqyJvi1eaP3W2l9QG93WwNcjtDUgrlqiITUKnq4YCqdD5ryoaogxhDCdz/O8eOQ0EUPlZZi4OziEOkRENLO8LKpallIf92286VwjRiAwAguEkTmFkAJHH6ESMBmT1zSIYARrfhLU/Vc1AmNau8bq4RWRosXJhoRmhKhOLQYAUHBicYHi2Uo++bMLdgNbBYdIIQBWIwxT8I5XRcWT3Ez9HfSFIa4ZsJVNuLqDV+QJoW0vhXUlemVZtqu01Wq1vkAg1CIe+QpANZZQ/S9xu/LAnLquH/ol59P5NM+LT/YRKcYYUxTTgMgxhhgNMFggYsP9vCxgcD6dSikPD48hBEK8u7utUvsvxdP+wq0IW3hvg5uu2MhfCIbaaMHVOoXXhi10XqdolfF9vII+wVZEAoIIFv/jh89Ph+VuFxOxQTHDtty+VsBKUDWvlRqylbfskmqJWzY5wn9hDVkJLi/StX00IEUoUmBP7LnKUalz5ktkH/q+sDf8a5CFl7gGkEuZl6WIMAdC0BfI47fX/81fXZf2+2H6vNQVwbrLQNQatmp8p7rNp2AAimQx0m43vH9/13VBrZSSQyBoutQWBgHr2vtlp8EZ3/45tXo/AQwrgpCq1uZX7HoE1kjTS3QYXL4CNM6B0xi3nBZrejQ2E2ajLaOH1XiHvLLynfBbPR3oJyWuTfPlpL6cxYC118UqT6zsxSaItxUeA7zg5EWrXl29rz5TrrtBYqYIauqGYBJARQbGkPo07MO4434X+l3ob4yiCiCFECKTeE5oKcWQydHAjgppTdWKpiIH1IMRgf+rj36NGJBEUZQWxLOUAHpUSEzBsEPpTHtCphD6dBNi6oZxmk7Tkov085JiPB6OgkYATBAIQUVLUUFTNgxM0nUxpbSoZQeWxISp73Y3w+4upMFC19+8G+6+wdD5QNxZtGoGWHv4LKWO5DYhOqqiithWlBo7qU7kFEARFZIF6rp9MKW+SF7KfCjLSZYT6AKmpEreCfvZ4KJtnT3WZraes5uKr44zX1vWUDC8InqvLS6u8RB42TlaDzA/URs+DAwBK8HEcCnw8DzNWX3vuWQQkRbGVAUNNStlSSkAgDvQXQmrX6AumQmYNC6429/qoAgQmIkYixQRYXdyAXj364dLLY/0Yo7YRCEAUUgJEWmapmmauq5jsN1uN52neZ6/fPny7t27cRz9apymKcbY98M0TcuSU+pCiKpackkxBY4L5HlZ1Kzrov8OHMWCAKnvmSgvSymlZBnG0d8CIAgp7PYjmM7zfDw8cwjDMFDqwLMhSnk7z35lIvFWh22rc7gpuuyrxS2EzTrIimG57vrs/4BGbC+au7+Qn/FVQ7ct+S4PkM0W/Lq5+ksKMgAYMyGGFWoPm9W6ddj6orxcOUiwGVwZAIEBUgh9P4zjuKdIlWC0Ap3M1TryUV4RUfcFm6yYxLomT+S9CxL5iCjnrKYxxhQTh+BLA/UhI9k/3A3RfkQqqFhRVIJwu98FDoT8+QtO09lUDUCQnwvqYVKZQcV23RD9KeoPeKVtT97ekXXx39BWIKAZmBOaGGtWeCvC1UfJLZ7amnyJBORrfWbM7K4fAnDyYSDkwLu+u92NALCTcZrn83k6nU5PT0/neRbI5mZlbz0AETHFEFK6vbv/9uOHlJL6W13BHVqBQpVwRevF0AARVSFV9YByb0+cQ4JqsOQ8zXMMdTu1zGZtJ7XxFtob5ttU0PYr/XB6sTS2DjkNiHgcx/N5PhwOp9M5Rt96bQAud3PXWSkyh8DV+Fxz9tDH9FV4x43Z50UY3aa3++omtO3WKQDSxmKDL/BKf1kdrsmyiIA4juN3331HRF++fPn06dPHjx+7rrtOrL10XkQ0jmNKSUWfn59//PHHZVnu7++/ng95HUuE4ziIyNPT0/PzcyllHMeu887OpRb9Ol7v7fUmEL+9/jYzancZad34bNihy/+Gm+113CRRb54slxJ94zt+DTSx/ndaBcU188rs+k+6Udi2eMRmRdLNg3vNZCEkzmLTUuZc+nHHzLDpZA2UwGm81Z9V2wDvJkHgen292q9sqztuVLdLbrgfKYSEm7Q+apO9Gpbd933X909Pz+dpWpYlhYBgWRbwrVJVQqRqOq68/DIt7nwFACbyuLTUJ7fT1I1WACaKzJEoEkdiX18hAEKriW0tJA7W4abPCgG4IfUZfWpnCgpaVIuZEoI5f4uqSujsXnRKFWbXd90t5EgJa70iEQVmIDZDQwjMnvNjbFSylNKiTq02w/49+gHbmj5sAunqUa1WoPqbr/UM2kafbNeQfxJCMiQDWbILxO4TtyLiHiIkBoMQQupSTEnNikjOxYUVzxZAJs0lxJBSCjGKKhsjWt91N7tbU/A1qmVZPn/6HJj7vhuGfhuefqX/vnL221dqr11+/Gq4gG1UwmsVu60Qq41DBLEKKKA1SsPWN0hNDZAMDQip//x4/unLoU/3qQ+Ai4oRYINXgvmDwbfW6kwFVM1UV0X/8uMYfl2ObF3Sr6CWX9JbwGMcPKbbf7oQA72IZGmNwAYcXgVigOApungB9dGyTL7UxkSrvPd2CPxqXkPf3d2Mj4/PuRTD5q1iQHCadVWMHRrvtldvLEOg3dDf394gKJioCng8Y1NA7XKpVPrwijeuV2zNhK6Slq1+XlUlZKQ1tu4iyOkljWRVaW2zMlCratjE1sPlk2yuejTXhdtmqbVP3W6PS6Zs+2SgzT2/kuw2kkKl1UspaspUnWtatwZXOdtlOVPzblKh7WeaeXapozWgZZaAgimiIgkyInFM/e5muLnnrsfYY+wp9oZkAMwYYuSQi5Q6WBSs9rGK91BzOhGgmNSdIgDasJXZH0VI9TeCbBSl5GKS0dgAiyTAweJAlMgiQYw8cIxd3/VLznlZ8jD0hDBNZ1BlNDS1kjNwURJDpMCBu90YYmRBFgBOaXeTdne7u3eh3yF3xl2/v+c0GJCoGFiMIcZoTSAmJigmYiCCTjtCcwObIvDmF7SCBdU1eEBBFIsUukDESdkkll2ZDvPxUaYny7OAMYCaAPC1tw5XgPx64lyCFGpkwTovt+1S6lqXkYff1imM4zpQm61xFZCbUd5W1ovBilHx+oEfD+fTlEWl+uhVcSvuApppKdnQkHysLqtLoC3NOEazwhjrXYuXW7ViIjWLamh+q1IKomdUUr0vDKhq11aTDJC8unHk5Twv8zwTEVEIHLq+T9P08PDQ9/04jl3XL8s8z3OMsev6nEsphYi7lJhCXmZfiGHiAqXk0vddjc8VdS5WlzpCzMuyzEteijuRQcS3d7uuY8Tjkc6nY84LE7mZEYnora3+dTVnm6TTS1oUVhjoC8H2gvmGpohu2revYyP/f7QUbWf9dqnQL2AwwJcgsC1++Ovvp7JNPZ9zM6aELTXiYoAwZwJ5YB0iapvPXk5G/NqL0LZcrULTLt8WYghx3O2GYZdSElMAWY2S6/u8tqutx9PKpyIKIWwey6ZWADHnLKoidTuXkDgEhyEwsQHkXETUdwV8kupxcFKygaVAMcU9+SSRPn/5dJqPYgjIs5Eus+YMWkru3u36IUavci7mJi8imjX4cr5bqxfWIPYWbWDNUKumWjm8eikHqEIDrS4GepIoKBgBclVPIcYw9H3fdUQ0IA59f7PfL8vSdenLl4fzMpW2bWgGKYQYQr8bdzf7+/fv729vVYq3Kf6rLKrc1G3/KDF1atcqzaspBxZRf6L69U/EgOZv7DLPuUuIHDhkpOYvgXUHrB58lXxcz0KEDTER7NWbJqW4243n8/nh4eH+/raLsUWDQ8thRUZEohhiYPaBQSkllGIUVpcyohkSb+nc2HbJ6iXvqa24GbhWu8Ml6cVP3dVlUG3FaH/pHr5Snc2MmN1Vc3d/7wDip6fnlLoPH2IjaKt+taESQui6xMzE9OnTz9N0Til2XdfcOZdWzSEezOy7L09Pj09PT6fT6f37d8PQ+fflezNfB2C+vd4E4rfX32ZELb6XUURUWQlfTJzMtqfuxXGLrQVt5019fNT0tUuxUp/vcNl7qhzCTdf6Qkd2i6fUeG41qGvjfmhRa1HUPFmGiFmA5qzzUopo13XVZIMMgKpABEVERIkoi6oUAHLEAKGtw9KWwk2A+qLAsE2KC2INHPdBJCEgoRQ1A3FnGBqzo6MUwHa7Xcn54cuXaZ6fT+fvv/1W8nw4HErOgSkgxsBInhZYchEwLXlxb68z+edSyrJ0gSBGxvr+MlH0HsWj6LDCJaiy94EYiAmBFCuumdCQSNHtPFWBI0AVzTlrySoLmNQDiZiR6nxVS3FakBkguyYuRYg8YK/O/ZD9nfEE7uBLom6SQgJsuWGaq62IKkMYGy6AquDe6rOmGluFidTVcIMaLqhm4ixirAgnMzARJaYQo684l1LqCBpZ1nB0M1BxHYk4IOKS8/F4UgDPqecQOEVRTV28ub1JXfIrgULQImAwjAMglJwPh2PJeZ6Xz5++dCm9e38/jsO6BlXre/xFPOB24L86li7qMLwIHnn5edoOfaVgr7xfWxUcF2uqJObkTjMwJDYMoojA0wz/+m9/vhn7Ie0RCMFUDZFgZVAZKKgZAhMYiBQPH/YvTpVuaZdwKqi/LNxuGng+xqVfeCH14rpxBQBA0K4iMDUKFEL4OqRrKxGvSUQxhhpq0rCagDidp5wzIlK4fK9vMXW/mleXws2+TxHPi9/X5FeOAnruTb0BHLOARETeDUWO+9vu7vZ2mc94YenihhLcUg6d+bA5Efw/gjpSv01L6yI+GqCYERhtZkVtbngVJHLxTZh9jWNapWT13fvLLQ51S9PT1AnWo2w7hlHPoK1fDV0p07WRaCLa5nFkgVlKrlTjOiWq36+uuTZqYuIc/5psWftkMAUxNCBAUowayD9NiDFSYA4hpNT1cdhx6rKiYUAKSKGqc0AhRo5B50lKRkJ1i44zpv254/owARutybaiHk1/wUrWd4DIzVHAABBcwFfBs9oM8aASRDoqI5UEGAP3FGPKzCdAkZthSCGXUvKipQComKoKIFAMcRzD7Y0ShbDfccf9rtvfp2HfDTdGUYEMiEJUsyUXM0GAmFLw7B2AwNSlpCLZcr0+SwEiq88vqqOHi3lKEay6pQgBsCBMYkEtEgXmENMw7vqb2+np5+X5MZ+eTQpQQDQERVt5X1qJE25vB6viuqFubO7U6sEtQhQvyq8B+E6rrTzide8E1xG7bePsLlmyftWCAYR4Pi/H43mesxp4Cp2IWDRiIkBVkCJ+PYFnMLonzgmVDTZfDAQQAX1j1Wq1QKagakUsMJiqFIWEqqYiqhZCJApYg6q20jaYbRfqjQiJuR/64+E4zxMAWuz7vr+9vX16enp6ekopMRMi5pyXZfHonuPpqGoxxBjC8/NTzmUYOteal2VBpBCCSClFVBpJgGjod0xxms7Ph8P+Zh8xkjmFDFLqPBrheDwejsdpnne7se97dP7m2+vXIxDjZeKPa+lruGWTNVrpam9sBDCsJkakFSH6Wu31V03Jt+FyqyBt6w4CXJCpBFRX+PE1dfg1dbppWnapA+vaxAo1MjEn41LVM121RERF/6LqoBvw2BS7XnIgbKwdE4P2IUjUd8Mw7HY3NyHEUsTnnrSeILUEwKwe0oNMFDD4OLKm5jHHhCrihh5dyul8Xpbcd12MUZFKKWXJKcbzks84j7sdM0upZ3cREzVVQAMOwcCw+XWAoRvSN/HjuN/99PNPj8/PZV4Es5gupsen40+n8/tx+DDu3o/7jimSISmCtWcjmJhedi79Ta3Lv+TYKzNSIwVWLAbmsKMWVVdZwH7aq2hF7yATmYJkMQVUAtUiABRi18e+UyRxwDNRCtwN/e393T+p/enPf/7p86fj8YBmXdd9/PAhpe72/q7r+xhjjDEv4DsWRBQ4AEBecoxhDf8FQGIWFXc+qaq/zxyCg4CXeZomQLOYKqHxiSiFbtztaLDpeJKcido038yjbXGdrLcsg9q9yIY7UaHMvlhGvuiz24+l5M+fP8fIuN8xkVdWTotqDTFHYjDIy7TM55xiCgEDAhIYiqmaEZIRERpSTctdO+DaBVu9Oxqcw/Nd/ZtWNFBTAb0gkMEDW9rBW2N5mh0cL4d6/WHRGVdavRQAqet+//t//vLl4eeffiq5fPzm483N3r1rL4xNvuCVUvzd737bdfGPf/yPP/7xP96/f39//46IVKUxMKqXyGMadrsxBHIf8Z//fL67ux3HXQhh3RBNKb1tw7wJxG+vv7k+bFKKlKKi1RwIG7aUfc1HBWjp7I1ASpdJtv1SRLZdVLC1RvmqB94YjSt6uD3aaqfvEWdYJ4H1qxsFCKkYnJd5kYLMRGiigJfiw4DUqQIcULOIIFEjKLbNXABDRtww+fwpjNxgfApgNTAdVxCfe21RYJUCMTCnLsYlZ5Hj6bS/uY0pdV03TdOSC4WICLnI4fmQYhiHzmONTKWULCqeSwDgFmBsvUod3yFTZI7MMYTgwXREjMYAwRFbROSFEoL/PDW3u8rrLf8UG2yw7v5mlWJqTLVTAm0cKkSnKXnpgAjBQmVGVK+nz2XJagwsIHJg9pWf2vABAJinDbmTl8CYaJPwgIDsya/YmHzVIwC+YemqstRRQfuLAZiJtS5di0jOS4wxxqSlmKEqFBFAIzSx1b2MPqB1G9Q0LU9Ph2leDEzMiNiQzZA53Nzsh91IxFqzIIgYDICNu67b39wQ8eH5OS/L6XT68aefcikfP37Y7fbQUgteWDi2zfZr6z9+Q+n6Uba6Hy4+iKtCG7ecia2bw5wyTe6K8itZfZUHEVTBhAwUuVj445+/fPvubtfxu5skZUY0rlkKWteftdYnBr4rLtW+UVeyKjoarkAyVSxwszd+bSzBV1wtlUVn4PQTFVVTBm4J0Vs9/QqJU52Dznx0SBzS+i6ep6mU0nUdc5NI3g6AX9GLCGPgEIjJTKpVt2k7thkA1vQ6NAQTMutTvNvv97vxBG7k8+iSBnPc0pauEBGr3uu7cXZhbTuwLzAHJtWNs6OdhlozYWBD6t/qwmt8zQueo0McqpWkBvFd59wh6HYwU5tzj6tcM+NqRsrlJr0Q9+uPyRyYSCueBR0XoY4zbN+hmohKtbmpE3PrbgJQ4Jg49qHvKXTUdRiCkcf6YNsgYYpJMQgocaLQcUgK7OQaCpy6jqdpniYpEkKo6601S4e25mtqpKw1/M8HVs2O1N49tAssA4mAFKGYZSlkNAuei0WTnjEgmeBSIIsXGH66+cDa9UlBDtz147v36fZeKPRKihFDj7HXMAh2xImRgHyyZaUUJIgxpBgNbMkzACCkGAKO4zzPWcSkTvOkAYP9sL4oQgj+ZKvh6QjEJJX6QEUMRVOIKfHwLqRhPx+eTl9+hJorYLzqOisteN3BNlCjumdE+JX576otrPp8q4K8vPBvdeUVwtX+eKMR41VBSIiI5HaABnmsz2ttjnw1KZKXZfaguVrJ2MXS57syDbmMAITMxEFFRH1/ljx8CZGLZa2me5+keBQE6Qr2Bsh5XpZlvccdERaYvWCIMQ2DHk8nmBfmyMT90L//8OHx8XE/TV3XuT3c4+k8bdhrknHoh6F/eHgA0NvbW6dMliJmICWXnEspYBDiPHQ9IsXYGeI0TafT6Wa3D4kIUcUAQdG6vgshzNM8L/PhcDgejufDYZ7mt4Pg1/O67GZh3QHf1k7XEm/r13CNFN/ctpePwobLu9Zn/6rvZd3M35ZsBrCF6cNlVZ8A//pQvBWUbptvy9ZGq7ky2zpB88BW9wkiKEgRMOP64Fn/HG5tFE00oxDD0A/DuItdH0JwiAsSQjEVd/m44YbXuEoDIyQmzpKXeVGfdyYAxFKKgoloLqWI+HpliKE2XmZ+cqnI6TzFGJmImVvCJ3FAkZJzpsAqsFgJoTZWyLzf74mp7/vPj4+Ph8MsxVAXsVlK1nleYD7L3TDe9LHvkNjqJKFVEZd8efFEOkNXgcXQ6cQO7FfVUtzmJS0hAdAQGFANQMDUPGKUSEFU1UDBlixFIXZj7AcMUbF5ypgdTz8O424cY5fef3z/+csXER3HIcXY970BeJrf8/Pz0PWRWdaRtggh+giRiRBZtADCvCzM7LP7lBISiUrDLAMzIUFgRkRTKUXmOe/3BICiOi8LEQ7DQIRgAo2JZYCIrmXRmshn2wXQi6mNfEqOqIS4G8cvX76cp1NKseuSS/MAqA2CQQillDzP0+kcWiPc92NMHTEjkrRpC9XCBQzQvzVCZCDfd/TEIybKIp6RQ1CXlBGR3MtNl6R2IsKaOY6EZKSXNTi0SqTQaoBQNKteIERAVUUENLrZ3zDSz58+/fu///vd3e0333yDG2PEKuYigqoA6P393Tj2T0/P5/PJTHe7neMpNiVE+xCAvu9CeDeOw9PT49PT8/k8+QpOaPSnt9ebQPz2+hsPqdeeqko8m3rgOg/6UodUVKytQa6gV/LW1oVxvZzYCL5wHUGwYiXW0oUIDciQPQ50bc1VlXzgVQHBpADKkUNXik3LImqp6xu00Zdt0ZdMKyGBCJDNxFSJg2jLyWuekbW9MbjQNhpir40br2FB64SRkAzUF3dTTIGXaZkOz8/ffvPt0PfjOB6Px9PpfDyfhz7FrjOwXASA1CwXgdr8ExEBX3aszEOskVTNA20QMXCIgUNgJmT0Lea6C7z+xQBkoFh3nuv6rbleSCu8A9qSMIEFRmOuxZWgilgxh2maiGcx+E6R2/PQWcZV93ejqVkRLcVRi0gkvupbwdVExBShuYU34JLa+AaiQEQe9HdJ5yBCtCLiqUqqAuu6EyKjw5mryU5EQ4xErLKIiKgVUSJsaC3wzDIk4hgcGXY4Hp+fn11yBiQi5sAhhpubG9+IadhLNAWuBxgawG63TyER4uPDY8n56enJOVPffx/7PuHWOPwaSPirFe9NBtXFKfg16O2rncHVurtJg/UIQcCyLgU6ukXMxwKABkQBEYHS4+H0nz98vr/p7m+/Vc84XmlsdbkMHdICYECGBDUSBy/LWnZNjFm9V/aabeSahXeVT6d1mwp9DOFw9G22r1UP/Kq4Va2s1RargbgSY0RkmiYwSyky8/p7edOIfz0CMaIzdljqdOUSZXVhVQMYkN9RWQiNwWII93f7/W5UyafzyVlpaqQqej3I2KrDWEENsJrUYQOAQ6IQQgjBSvYx16rkVmZuAxOtMvE6/HhxmK6CWvOIqbQIL7h86RpLXmmyaBtmn23w/45JpstoBXB9BNX3zM9bFSYSUVFf8xQHDa8rqGpmKkWkRc26j5gBA8Y47G93N3dxGDn1yFGQpapyZiogda22IIpCAe5jF0KPHEHBoKgpIsYU+76T4oZdafOe+n36Gaw+STMgRCSXqV2LJEfSNvtr3WZx9L8iEQIgEwOJFlEFyEgZyIQxL2wZlVE6QLIYBEuxWQiFESAXmbOqssWU+rv3fPMu9XsqOBUtAkYRMCn3HFIj+KvvsDJTCMEASs5znkxMRWjc+a6xnScFuSLX27bB92k1I6FbjOs2LBIyG+KilVohQkqhiymkIe5uKcbTlx/lVAjUBdaG7tEL8LqWchuS1goj3uhH29PKzIAIkazmKeILaXgt/7Ya8eo/8JrTu1O3Rfb9OPRDYGKGFAMzA9SgQ7/yg+u0GBDYHIasAEa+6IxQE6LqeURopeKmqvGQQc1KUTMoRU+nuZRcSjEA5oV4TV6183ma53MrozDG0HXdbrdPKYXAiBBi4pBzLvOSU0LmsL+9ORwPD89P38QPMQREPJ/P8zwP/bAbx+k8zdMcQ9jv98fjwWPuxnEw05xLyRmhjnKXZS6Pj/03PQcmBmAywNPpuJw/3+x3+/0YYhJV368JXeAYe+m1lNPx/JzzW0jdr0gdxk1KNuBF/Hnxp5AQXzCGtx/4utT7qjq7nl6v/IGVJv4K0vQaeusBFU45aP3RL8vEG9hre+CBNQYYmlWhFttGhTscayneYiqBAAREBdS7UcM1uaPuIGpdujcDg9TH/c3tMAwhJiRu7aE5vKLy08xETU1EihtUSykIJQYVEXGyDSISebhFC7WBEMK8LKdpQiZmFrNlnhUhxaimeTqXnIdhjDERVaETEUOM7mHyb0PVmAMhqYopdql//z7s9vvh4csPP//4dHxCNGOaijzZLEs+TfOhT+/uxmFIzEzitXKNjsUVL9xywqGt5PpEXEE8mqWUUlpIt29dajWdrKA7a9B6UAAxWEpB5t04xmEABFGllh/jy8TMDIhFSojx/v4eEWNMfswty5JzdksHNr5iHX+qAUDO2Zct/F3KefF/ZmKKREQeEs5MPsaWshxPGgIHIlPLpUzTpGpE3PX9dD6fz5OI7saeiVbIkl3/fLBNdL0MUdbJvfotRshdl8ZxmM7nruu6Lrl2oapy4VPjMs/n8zHEBABFxT1UA2HPfQgxNGYZmV5yAt0r7HebqC+nebg4EyOygqLP6osootWpKDO7p6ym3XJIZlCkKPmMXys8ignbqWhgVE3jdQVBRMyAEVRtt98T808///i//tcf/vSnP/3z7//55vbGKiS6JkO2bHALIfT9wByenp6+fPny/Px8d3d3f3fnLMrL84rIVB3hmFLqum6e52maTsfj4+Nj6rqb/X632/nv/e31JhC/vf6WZci6TLJ2BRdZaAVKGTU75Mq/xYYxvCKtQh0A6lfVTmVitYHwtnPYwn6b1xgAkEyLyledc+ta1FCJgKICLWURMw7UdckQkFf2qNf9m0YLARFFDekiDNeVHNMXA3K7qA+0xvJ5IHyTxerh66qialvqqRwoLSUjwH63/+abb758+TJN06fPnz6+fz8Mu37Y53nyQrAhN9zPim7bdCKhW5K1Rp+Zw/uZOTh8joB8GZ8u3ZwT6YgI2+YkIBteco/Bo29VTbQubBECMgEj+5YumIZlOlsBU7UioEbknVdd2cJV+rO1ilSVUnL9nXKMFGIBUlMwJQAnLZML3u78agMDZ2O4Pu5HHYCWIhsNBdaUJqtpCmZ66ahb/YxMBES+/OIOHb+m3CKvm6w25liKnM/n0+k052xqUjSmNIzDbrfb3+z3N/uY4rrT7JYjUlAiMmAOMQAB7fdmCofn53mZTqeTD7e/++6bGGOVz/Fy2f/lihn+Yvluq8qMgLrp5y/wrvUOqbFBzUbgVRCZcbURArGr6mqAnJW+PB8/PTz/7rv7RMG0aNVoV/sktLy3iivbaHMNEHdNPFvztbYZIZuq6+IbuShncLFENl5qDQx6+aZdyK2OT8dtQMMK7fIPLUVKyczUpehYTLho6m+vX8OLkaKXoiL1WYlqjSnfSEgVvOvxjWAamW52wzcf3u13Q8nzssxYE6/gWhneRLdvWtmadVJL7PpBDvOHpmBeaMKrCfmrhvzrqeqLHJLtfXWVCL85Pv3xp214e0Ebb4gVWJc2an7dVZamXTaRVzROXeCoAnfrKk1NfTdWrBquGSiGfp+Gfb+7GW/v4zAYMXAADGqIZf0eiljxFsoUxAw5UuiAo1VGBrryDkQxpZTyMs0iysFJQ+ZxLNYi2Bvd5iKq+46wP63Xw0KqLu9Rey5N+OYjUowuLBdh9W0cDYgBiRkzkShlsVAKiIIRZCvFChOnNMTuBuMN9ffRUOdsS1FDCgmI1kRbT1rv+o6ZCCHnXHJ2q3qB4v7oGGNnVprGZ5fsTmtVjCOX8bJw64ZsQ1+/drsXmFM0GRGViZnHd98C2CkvlqfKWkRC1G28BK5JNZurfcUxvljaaJGNPrR4ZdiPr5x01pz1ZFt4N4CYmGARqTzf1KlaEeeJebSe+v6YVwjtUHJ1iQBIDUTNCyeiYGYiJlrmeSkCRZSYENApai4oHM+Taz+qpiZYsw/q2oqUIqLkk3IAQmQOx9M0dF1MkYgRkSlYgKVkQIgQOfDd/f3j09O8zNT1zMzMOeeUUuAQQpjn+Xg83d3f7Pf75+fn0+lERCmlIqalmBohppRSSp8/ffrxxx8/fPg4DD0jdn0HAA8/fzodDk9D9+1vfhNiMqgA6BoTwYEpBITUdW8Hwa9LJcbVOdvWzr/6A6tBY1vOXEaX10yJr+wIr55H2yINfkERvlZ1L2ttNan46pPgLxe3X325ajyoZyCukXGu27oCja33rAvsSABBg4CZWDVJtiNt9TH70R9T3O9v9zc3SMFMVcSFaBFR5w26B6XNpbCadhAQVcwAOEaG4PndPtldcs45A2AIkUKgUnLJnlTpDYmqlIIGaKrFyrLMPmpqgiPGmGIXlpxLKariPyzU5FU0Myba7XaxizGFHz/z4XjMeTnnRYWE6LTMX474NE+3N/u+S53vlQJhzYXzUGl1vFyL6dYiRVSKliJStI5t3aHa8tqMLsPjeiGpWRapwaGqipi6NOx2EEJRIwRiFw2NmZ26syxLXvJSsj+K52Ueht53LPwcSSmVUhBwxd2uxiBmJkIne4moQ58vsagATnuOIcYYAdjASimUIjODybLMp9Nx6NN+d1NyFtFpngih77q2rbKBe8Hl/HptVL8mxfoHKBAOw3A6nZd5NlNm9xfbmmlnpkueTycE4qUsc1nUQFVyKWW367ohps4R+LDSH+pIH1GBrOkLbTd0LvOUl2meTQQNTNrhVVeFbVkWUSCo661d36eUeAhO0l/Xsf2p4phJQxBYwyXA3WNg5hjhfui/+eYjB/rjH//4L3/4l3/8h3+8vbsNIfgwwy8ZP6xlqWmN424Ulefn5x9+/OF4PNzdv9vv90TkrXcFufg0m6jruphi13XjOJ7Op2maH58eT+czM//T//PtBHgTiN9ef8OXt31ykd1W5WbFSLWR1gv+/1WW9baY2KrDK98QVw3ousjYiEK6SbBtANX2Mt3k+dZVJ1AEo4gcF4BzLoDIMYYYPFPEn4EAqFXOsvVrEJEfh2ujZdu+aK2T/FzarFU2z84m66B14O6NRVO0OoxFhMCsIsfjaRx3d3d3fd8/Pz8/Px/Gfhj7ftztDiKqngDWIlwaua82l0RErCxEDI0T3zjuLRmOfFKLtbZCQgIGQkcRVaMl1nzAJmGoSnPgAhIFCo5QQEYfSapgbgxidYGYyRkQ7MlyVHtzaGB8AFMp9TemRqVQzELBd6wQLBIxUXB9uP4Yte1kZl/wIUKHBLTJpF4VstaSkKweTwoXapM30Mxs6H3jOjJvUW8I3hl6Wh2LTtM0zfPxfC5SiqoBDON4e3e73+/HcUwpQstz2O75+jdNSD609fdXxdEL5XQ6/fzzz32f7u5uvUZcpflX/BebwfXmrtkUzL9gArl0A5t6/Eqf9WpGpaUuEHjKHAKCVIC3ARgKMmI4nJcvj8+PT8eP97c+E/Kd3upVM1RTMka/IkrRi2DWhCpTMLrSgW0TpnC9kIDXgvG6Xb+ZOlS2sf+L6jYUGy7BkJsPX+GY1sQ4h/flXKRI14UYIrQrp64qv71+FS8ijEyRkDy6xndciZC4PtUIGUNgir7EZmAmKca729uPH94NfXdOMTKvF1KjQNrGwInrwVS11Va+w4ZWXHG8taOoodlbIXedoW77HNxAEl5c2LDF0eAlHmj95zYXqss9lyeAKlwe0b616yJp/QmvvMktZNIMRUUb68mduGpqfmSYtsSBdUxEIfXd7m68/ZB2t3HYcT8as+/sGJAKKLaTHFDMex8QVUCOIRFFT1pRrQMlf0c4hBjjdJ5EVc34KuBok2GA69OkAcyxRsACQsNioDaAz2ol99VUoGDkHCYEJiM2ZSuMgGrEJgosjIWLiBpAgUWBUkgpDSH0CkksIsUQo1kuIhwC0Sp3GBGFFDkERBApS15KzqDrlSCqyswpBKgop6sroGoEWKe+cIV+wPoMc5Gk2sZRjBZBBYyEIe6Gm/fleMjPJrpQPQttHSFCmx+qY1I2oaFfjeTsxfB8DQbwa3mt/bYX87W38eqa95LBEcMUeBjG3W43PT/nXLTSMN1W4OVK5Wiv1ZEBitiyFIC5RMlLnuelXrpq07LkcvHU1u1paUvf2tzl4C1rXTauIb4ItFnORsjTPB9DCDEycwihS52BiZacUqed97fzPE/LQsTDMMQYp2kqpSAHt8idz+dx1w/DkHM+nU5OWmRmIc6SiSjGFFM6n04PXx5S6jhw6joAHHrMu93D589fvjwa0rv3H2IXrxZ3AWNKfHsXQnw7CH4tnVmL2W41EOLrFSFunb3Vu2nXkiv8okD8IiL4FXyFXfEGfdP+F/Xsy2fY/N0AfvEL6IufpGbWAV5kZR9nYsMdNZNCOzZX9ZdjANDShpnrYeCgc2frdUM/jGM/jlj7KRA1AwFDUQUBBXXrRWvrwA2wUFdRRVS9ljAEURGp7V6W4r+kxBxiyFKWktWMQ0DEUkREQ4gAKCLTdCaCUqJ3LcykKqjNX2nOETYw4sbQcMx6l9KHd+844uPT0/Ph+XQ8nJYlg5ECqS1mJ4EuxSGGsU9jZK7vnaIpi/pDsIiWItk0q2YXiFWq3ueEqBUGbdfzaAAxFcmuWxYzUTWkLqaYugIIatX/a/VccBrvsizEaLk25QbKgbEgMfkEmphKVlBjTpdQehXmsIkqtBdzdEfirmbf1kJblhIhIqEITPP88PgY+J6Z+35Yllw0LzkjYoqh2qjculZjTV/Y17YSMdZRSJufqmpKiYhyzkVyiB2I4iVLxXxb6AyghvO8LEt2WuO8LEte+mEed/sUuxS4rSh7kkUVOdAMfdETwESPp+Pz+ZS16AocVCW3GnsKhMh0npYsoDDFeHo+hhCGod9/vOUUQ2Cq8I0W1odVeyC8kAoJ0Oo/u0kfh3H4JnxTSnl8fPzzD39eynJzc9N3PRKKyEoKV61TZ2be7/dm9vj0dDyfgUhVnYkEACq1niQjnz/4uljqUurS8XQ+nY4ikqf8dgq8CcRvr7/xiNrUfJ5oVXdrnTFWRbQd/Aj2lf/vcrLX52friV5sxLc+2wxeW2Ja+4gthbGBDnUTFlQDyqpDChBCsBCy2FwEiUMIPqK82KJd4DRw+KxpyzowKaVwiJfZ3GrCWsN0cc0D9c4avdO8UIpWw5V3EYRkBGpgAmoxcIxpyeXLl88xxo8fP+73+9PplHM+n6eh6/thWOZZTUpR4u3Wb93GZTAkZGYJgUP0bl1aJsW6Gno5NVuygguiazgSVhJr9XyrGahSJRrWGTUiNUeWH7KqUhzzC+KfEBg5EDMTM7XDhpp94fLr9yZMVbFkzEFDBCSRYiIZMTJ3MSJEX4m5hPEwQ11WvYQcboNTDZwAYW13HFYREJFroA8iIoUQs12EXIeImQExAVkrkwyWBZH8AptzLqIikrr07t27m5ubYRhiimZaRALxauNyMXi1ZzAzEAEA7VBVcl6m+SxSnp+fP336FELY7XYphle3/Wwb3/O6vWKVSvB6lL0qrM2aWCubrz/HGhZ3kQ+qLaKuhSMCKiBRmJbTw/Pxy8PTu5sdVXo1WE35alMRA48J8ji4q0HTdYQ8bvRdMAACsBdQia/ytTeiyJpSiJcoLd1s3IMZGrWRP2GDXyMRX5Yh2zuS8yJSEDtmAgNQbYiSN4X4V/JixC7yOKT92BWxaj4JMcQQiGMMIcQUU4whMhEjE4FZCGEch9u7PWItoUVs49pygsJ6DjRa+lVrvjbzTRnDdXSH2/Gjmr0YQ37diqvqC+/w2tS3hhjbp3QK/6abRtyYtbaZQh4P0lZFfflnjcDegC4B0dYDtx4cVkqhqp8qgDp02VQawIlD7He3H24/fjfefjTuFMOCJIDmzbxB/Uh3aQGUNmBVo8Axxh4xeMSrgu9uYiXmcwgh1pamEj1gw5dsqIIrg09zpjkHqULvCYF0JY+087uOzjzVwLszJocfrKxoFVQzARaKQsUMBMiAA6cUEwEXI8nGkQhjDEhUWk5srRRS7GKXxESLSCm5FCmCauwUQVMRCSEyM4sr4VAP6yb/VXcRMTEBcbMB1WczeotIvtvjSgJJ/e1gAUv9zXj38ZBlkWfQTBddyFZZxtpYrZYD6/Djeoa33gW4qdx8mP4XDIZbquDGMu9VU6UKMcXdON7d3s7PB9WNbwrMs+lMQKVaBRyCZGpSypLLNM9ouJSy5CxS/Q5ZnPxJ9bNVrgtdKlFzk1pAQr/xmh6MbqJvIbEAYEXyPGfEMxGFEDy33UC7lIZhQMRANAzD8XhcSu5x4BCJs5RCgMwcYzydTtM03dzcDMPueDyfz9Nul2OMFmMp0sbN/P7DN09Ph+enZ2L+8CERIjC///ABED/9/OnPf/5B1N69u+/6VHfEkBDRGN9Osl+XQuzXOVB9Mq+ch5eJFrD2XZehWa0FX5/zrMPEXxCmX/3Xv3R1XTijKyd41bP/q125lzUgXqZJWPuT1Zxka1vaTq3W5RkCMjMCQYXE14y19anFgfth2O3347gjCqUIcu2zRCtQodl/iMlT0Gtqi6oZVKstkgooA6tYzrmIVMQ5s4gWFVYfEFIpRVUjGBI1KC2FEFVtnmczjTGGEFNKzJiLf6raDomIAQZm//FijEigIiUvgfnDu/e7/f758PzDjz88PnyZppkMAvChWD5OeJr6yLdDfzP2HSGjoimZcZuULkWLWAHNZkXN44cUNjnsVDs7AVz9Od5MFFFRVVPxvhCgG0bgYOvujoezMbZw+mryDSGEGBSMmEIMiNh1XSkFEYlRTZmoSM55WeufnHOMUT3yDsDMQggissrozqNgDjGGIjrnjGjVXKRqzGq65FweZTf2XRcpxH4Yi8p0Os1LRqLgZ7CfeXClPr+4TDfHVrsOEUyrSzrnJeel77t6DuMqeJiYajZVWHLOJTures6LqCw5i+owjND3Tn3wFV1owT5ujWdEW+R0Pn7+/GmWHPtut9/HENcxKV1sfFayzEvJSxbR8+n09PhIhHcyDbt+3I1d1/tWK5gvE5nbzoB8t4xqxweISGoesWRqFlP8/T///ocffvjTn/605GWe548fP/Z9T36pAJgptuRYAAgx3t7f9+NwPB6nafry8GUYhnEca9i7AQDwOoapzwqlwDc3u3Ec5nmezue3Q+BNIH57/Q3F4SbDtR2BK2l0WxbgJuigztqab6od30hEBrYF2W13Dy9+GnvRJ5jhNpZn0y2Lrsgka/7ElhPq57hSUOQsWUSIggOkxMwclOjrDHVbx5yiCEjOSJIiSNyCiKrpFWspthGqCJvACLaCZJtIiQYbRgcSMxIFIEBBpHkWApim89PT4zD0Tm0303lZ/PAbd+Pp8DwtS4wcY6hQCERTtTrnM2KMMWgXQHxGq4CuSa5ftv4zrdbLmvRnLls3mBltnGhIROS/PDfyspMAHb8gIlqWLMsiuaiIibjz18GaIYXIiUNsC1B160tVQMVAaoKZoJVgoVBMIpKXRXJmpqHvb2GAmJi8O/M4vpaQUw1u5tYqFcGas9TCZVbHsrOXQL0hZ/J6EjmEaZqLqYgU1SJiAIQxdj0zGkCWAmBFFEXE1NSWIp69++HDx2+//TalBIii4lnztna0NcOHwLlXWIcqAZiYbwBF5PEJDoeDqn769KCq33zzzfv39xTC12LoKyX4dnncZ7z21dLf9fSljU22ElJrv7HmxPt+nN+uzvf05Hpb73YAA16Eno7LD5+evv348XbXmRRTa94RQzP/wVGNHda2VccayMu2qVeuj+lLFczL7gqhbKDtrVjrGFckhYqZQwCQop4R3+Y42MS7BqRb7Zmwalz1V7csWbwYrckXb930r+1FZLtd+qd//N233743A+JAgTg4SzymEJmJfcLVKlrf5fQeQ1QDAzN5eqHPGkBlvbE2rvQrikozNLZ9fG04YkQOoSw1NU4voSD2IqZyqwuv//zVJLWaLfVyTKO7Pj2sx8VoaYsh1gJ6nKZQDaZ1f7be1NZmKvWL+kd5QIza5ieSGn6k0uCFVUTGEHf37+8+fre/+zaknVE/FytK5gh5X1URERGTatovjVnst35g5hANQT1aAEEBFc1bd+TAXUeBpUgRCaocglUAtM961xfDpuowlRbk7SHx4NgiW1NoXVRVzKLFFEEaJURMCyEaBwUFQwUoZSl1AZUMWRShYqCrvlzUEJAIGEMwVLDIFGKooA/mXIrIhbLhpCNTNW8GgTjElCIRA4he8gNRvaRCYg7InkTDnkMuRWr6KFXLD5r5deCDQTUww4hJiYa777SAGS2HR7S8AqtrV4xU+3m8JDuS+Zt0iVL093ZVe/0/iuOhAV9c2PCCSoFXFWDT9pUZkZkQEKxP3d3t/vTEzIgUAB1DDEVqNIABlurBqie7liJqzTRcIxIrjgNAZB1QYg0d1itfIyKZPw18/wpcEvLEIF2Pex8p+vlf1PK8NKOZnXk+nabj4czMIbCKIubj8Tx0XQhpmSevXDjEkLqn52M/7PphGHe74+Hw8PD44eM3RIGI1aCoBrWu7//xn37/5z//+dPPnyXLx28+MDMgvHv/oR/G//j3f/vDH/7w6dPt3/3u+2HsOQQk5sC+12xvTP1fl0jcwn1xA9W1K4Nw28/aNGyIm7X5r2XnekptQKv4ywwK2C6yvGZowKtE1PpZ/4Lk/HrkRnsMXYExoH57qs1t4AuNolvDBLT/AwJmRmTIYqWY1pOXmLuu2+124zjG1HMIBug2WiY2QH/eErND6b0T9OSVlJKte5dtowUIDKDMy3ma5mWOKaW+iynakpd5KbnEGL30XJZFVHbjLvbdMi9q6mCZZcmn07nv62qj1KUTMrCq3wGqyJSFkJmDATMyMs+L5pwxYN913fuuS93jzd2Xz5+n87ks5bTIaSpE2Ec+TcvD87FjTgEjU2AKZkxIiKLgD1QRKGtYnaCKqXoXG0IISCHXmaaUUkQEAYqqgGWVBYxC7PshDIMiLjlTCD5qFZFGja7XRillKYU5VDqU2uH5cHNzs+jijLtzPo+pH4bd6XT0fRpEcDlYVYmYGLeBNP6r7/u+peqJqAFRjMxEZpKlMBMgZpHT+fx8d5u6dzF1BpBLKaXM0xkXtBDNgpoRMSLDZWgOHiK6XqfNDYNbE5kzMXa73dNTWZZFVVrG9rbSI1AVKEXKkpel5Hmed7s9AJQiIlJKJoQ+pRCim8NWexQCBgqy5D/++7//8OOP77/9+P1vv+92IwZuMY3eFK+NITBHouDfYCkyTdPpfD6X8/l0enx8ZOZxHHa73TAMMQREdnyTZzwwB5/0WisN13sMEQjp+99+f393//nL5+en5+en5++///7d+3dEaKoiSoDYUgrcPJ5i3I07EXl+ej4cno+HwzCMt3e3fdevSYPb0PJWzmLf9eMwvB0AbwLx2+tvpw97oyWiqpfNy03SAGxmh7ZRgjYoCi+5q5hqsAFKbEjEXmFDk6C3YSZrd+9HZfVrmQEoiEDDINhl4RzByTyeYsdBxOZlUbXARG2YXlOrdEUqu2QMpj4sJER2Bh0SOU8fTH1ohh7ovam7bIPWqJndTSvUyh+uEGFHv4dIHAKixDCZBSI0k7zMtzc3j7sx5wxoomUIaXezf3j4skgBBjYOxFcGp+bSZkafvhqhEkod8SGYAYGCqhUGIPDmsJIwwXttaMntVTpX/1Aihw03BwqqKyMIICJ5npfTucxzXqa8LCISAoUY6sw7djEk4gAQfIPbvXZSMlhdOwX0uG0tUoqXX0SLqc55KUIIqopmWkqMMUDyUo4ArY0ATKQ5Pf1KLFV90Qqv1Oo3I1NFMCIIBF4WzLmc83Qqy1KyoCEiMKa+67qUtdj55NOGvu+RMJdiJatJSGm/3yOxaDV2GZjb0oka4RE87g8BwQgUqs2DDDjxfr83UFU9HA6llMfHZySOKd7c3HSp87XZlo5QBdRriIlHagCRz24v1fy2IH855rlOi65kLvB3TtSUmK1JVEiKq6BVsyY8zR6F0qHonx+nf57K7ZAAxC+ZZmMG9lm6eVIht30xqBmXjOTcB616MijoxnAJF5xLBV1syHk1X9DANpuzoOueoAjUR0tLQdlq7Fhzvk3VCP2ZBuyGliqGpRS7LoZQY6lV4c0//OsSiLHv4scPd6XsEYm8GfKsRndVAjTsuePSVWB1kdeQDiYQ2iTaAcIGULdSUhBf+HTboVNHkusKv48ndV2U2J5967BkHY6+mJ6+bsBaiS0tL0/N1FDrBFQ9XAapBYeu49rLhEbhgs7HlQpllSNheuErVwSViBIimqzUAANDDuPN/e3H3+w//IbjbhE0BTEyp0RCI/Rr3Qdan1aipiJm2MeUuj6EoG4fNlADqeNf80OKALquP+u5UjHcNkvr85NqUNslwhuqtoeXcABX/QAJKKxRRQhkrimogiKIIaoWUavEIrVghsiqSFXVhhroap53JotKIS98yMNf3OVUQoxIqGCiBiIKiugrLB7AhKJLEdVcfEcoSyFlvdBAsPmHDJCcd0kUmsvbCVqEBABkG/qomhKBARmAKS5ZCBAjcxrT7QdVUNFy/hKQTAtVXdQMzMOialHjE1uXTrayu21w/5fL1SP/XrLyt+rweqmvTvzLhxvUeKJcDKzv0zj2qooYiZKZqBVAGvc332A0DDmXJfvGtgM/QD1ldxssXA1JFbTcMlSp3sKXaMeKYam2gNUisVmwxS1ZbdW+NztbapZzllzUR02IRPT8fLi52Q99n0tNnQ8xjuP4+LQcj0ei/W63V7XHx8fxPPV9R0TLvJhqCAEBQ0zv3r97eHj49Pnz0Pf3799nLYjYDf1vv/++77qffvjxX/8///Lh4/vf/va3sWNPzbK3weevrTtrS4WqVRoGu+pGro6Klx/+C6agywY9vqoIwyufZxWf8ZV85OtVUviKWPHXfGPrynyrCuFa327LBFirwo2u7a0HEqmo17FIxCGAeMosxBTHcez7PsRITGZQRESMAiEzgmLbChXxKZCD/QIHA7OcyzpDBURUKXP2VbV+6A3hPJ2nvHQpIRIxm5mopK4TFVEBAUNgDgqz5Vw4Moeu63ImAGCuAAoz6PrOK4Q6pVUFY38f8pILFgqERIGQAyOwme76sU/dbhifn55Px/Ph6TSdTuc8LzlHgiWlxBwYA3EgjAQphhCCKZaiJlJ3R4DB88ORAhPyKhBHNhORnMuCmCEToklZSuYUx5QwxJS6mJKZFVUsQuy6qvNA/HFYgUbLvMSu814mpqioKlqW4oKvT0HyUkk7zLwsS98PyzLXhMAszChSml+1JuA5cbEUBaLAVO0siP7cZUIzzSUfj8f9bpdiROLUdTkvJZdpngkpxCgVqyEbelO9TTb7rJsqamPoEZEYIzM5v8iv+O0+TW1PyEeqMs+z12lIXESKqagSIYw3/UiBI1PtpgkocpCl/Pk///Tzzz+/e//+7/7+HyCggkfvQNsqaq7mVvZYzS9GjKELu7QbxjxlmedlXuZlycvDw5fD4blz5n3X913HwKoqJQORERmgsyy9SvRtqCzZfd+/+fY3N7ubL1++/PE//ng8Ht69ezeOI3MQK2iV4rVWmwhAHN6/fz+Ow/FwPJ5On376uev7+7u7ruucKL1a+Vb54uvw9rfXm0D89vq/tgRp+xK6ifuGLdj0QlF0vXhLl2o9XPvrwkHdMOauCKFaAaNr/OXr3FVvs6tRSVfEo3citadFMiRDQiQVyIsgUvQZrCfZrO5e709rUM1lCu4Q3Tr1aoQpz/iBF3vwl3dgi32tPUZ1UG99YVYf3CnSfr9flmyAMbAz7IdhRDybFjXlEHa78T//8z/Ne+b67qM//StuEABBkZBjUFUDE7VSiv800IxUYoAg5vmxQGs0D6IhgWebGoCJCHqcHa5gXSAyQNGsomZaJM/naToc5/NJctZSzTpEXWwFQUp9CJE5ECUOEYHATKRkj2w3rcmriMpkikUVU4zcR7Pz+XyaZzCVsUApiUOJMfVKGiikgFTR0QYq0viRFQ/i2mtjjzTYWG33zReEEaHkMi/5uMyzlGwCiIpAgVPXdX1HRxZ1eBaEFM0MpDjua7/f9+NYqpkNDDDEtL57YCt+GtbkaKxoXwQDBuqGzvDGC5RpmqZpfnx8TF1Sw3f3HNjXvFon/nK3DhvO90XgCFylz32VDr8tW7YNPCDWICpysQwBlVbjCYKt4TyV9xCmIg8n+fJ4+Oa2Z7xAPr2ZENAAHhNEZlCaBa49A7aZlQiXhd2rtgHxF9qElaRlYKaIl9iESla5hEmabXefrfkpAdSEDEVKEYkxugzgjobdbuy6rgkW0K6ft3Pg19NRM2KXUorWoOy+pAvrNQ+maNgQ5lqHfRXM62sM1YF5sVGsHnvfktjIuxfuRGsgEFHbWVERsXa9jkKkm0U8gCsK8JZHvFWQr4W27e2DddfWIUII0qJtro2cdNkeRfT53SXCbnMjXYCOCD6r9S9digARrAB4IOBw/+7DzYfv+nff0XBflHN2oydccA/tNK9wQ90erBg4xG4IqUPkal1Wv+2R6MLhowjdMMzLAn6ErfOA1aDkKnw9z6DFc7sE7nJnBdlixT6QNcAMggVs1HREUFYwDYGQ1QyRTYSIkiqZZcmqxUgKgqLlPE2nw17nwAZdMOcZMnEgKGSIuWQRVQDmUANn/bKkgEiooLo4EZJEcM6+kYPEYGieiesEJCJABmJAxtoVG4IZAQLZhUhfd6bMFSW3GqpNaCEmokD9Tbi10fQxn8TU17FbWdei8GqUHyDSJbnYU+02O15ezXm5hRtA/xVfeDPhWJdv6trTpT4EVfV7zkyJsOvi7e1tSFGNFwVTy87zphBTn0VzUTX3DdtlmujRi+upYGbuQm+jzbVoXVv3F4zveiYafAV8uijEVzcjrJl+oL5HrAoG7NMIWkTldDqpaGBOKfbDQEQxdcfzmUIYx7EfxvO8PD0/s9O6iIrosuQwBAAYhlFE87z8+NNPIcVuHID+v+z9eXMkSZLlCfIhIqp2AHD3iIzIyq6srurpWeqh/f4fZ3d7uiqvuNxxmJmqijDz/sEiomoGeFR3zxDlTAyMMiMz3HEYDKYqzI8f/x4S8N3dXQpxP+5++NtfL6fz5y9fHj4+8DAQsZTy3lT/1tqzK1bEG7yHXwGUwa9qxG9eAl/7+F/7cmZ2LSLDhlpk9lp//trX2zKC8GqBtf9vGw3efP8K7a1PgqHZX4gthjiO+zQOSKQAJtK2Zfzm44ltRkSMLCYiamBkjePktxSsp4rbY8Ws5OwhX842LqpFJQYOMS7zPC8LEjl8oJRyuVwAgEPQrNM0OVYCEUsppRSnDKsqB04pOQsYAIjYQejuZUaEYMHIfOptRVQ1EEVmGA+R0v1RLvfTy/Pz49Pj+eVUVJ+nBQwCU4qJAQPbMNoISICiCILB927UtIAqEnKIxDG1hGcHdwT/dTASmIYhfbw73n/7STk8n06ny8XQT1DYBvCa1a5TREspNXhN1e+ZNdlvWRoVEB0mCAYpDd1DZmalSIwu0SIzL0sJkVVrTnv/mFpceayom2dFcimcYoxpWZZpnpZ5URE/ppgCEc/THDkMw0B1IVfXTJXtHGXT4GwJSQCmACpGRByCmYqUZoylaynZWrcKKmVZoIiawZKXrKVIQQAtKqb7wyE4vZGYCRn5hx//8vmXzw8fPvzjf/ynmGJNOsSKolQTsRrAg4EQURynWS2/jAAElDgFxSHFMkouOefsG73zPPPpPAzDmNIwJA7B0FHY1b3vGcYuniio79YQkVOViOj56Xme5o8fP9zf33nA4Kt8P/KXdzfumDiEcD6fz6fT5XwehmG/2+0Phxijn5tbwNr/xJ3t/fEuEL8//s9sqf0idI/DJi+uX5+b0CdbuXVdsbVrgr0vj/pNf82Ua27iCsB/Fb+zKeDr5munzzbVeptsh24Cqf8BKCpZhImZAyG5hKrtyapZDUw3t9TWDpeImdmPeSL2QE8DIPAOv7f6uEaENlpxK2CsTbywxcN2FAEhgLMUiFhUCdFxS4fDvpS8zGVZShHd7Q539/elFNXijEcFM1UycGSC2538OBQiLaUUyaWUIkKixqLqrRERiCFyBLvyIBAhE3l3TWrG9fbf799KHuzuUnBelvlyOl1OJyvZl/HRjAADc4wxDUOIKaYUOHKIIQwhJAJS1ZxnA1Mt0SJKtesRkSGJKBMjhxFA1C5FTpcJVVBkDCmKKECQwNGAGLj5oDvVo1OpKwvEtu8NUwOyxi9GRJjneVlyLnkRpyQAAIYY4pDY16AA3GwACG3wi8Mwfvj4cRgGl02RiJEDM1BdLqd1H8+3k8Gk1g1eRioAM7gKOc9zKSXnMk3z51++gCETfXi4x75EhLf5D6/agJvq2bbQCbvOIcHrBPmeYe2VCda1LLyaAEEtcarb0UANi+K06E+/PP3H7z6Mg+8Yu/AK6C581/1Vi2guYlUKq2bNHm+5/SFeCdn49s+IPZtBV/l3s3ffyribrgE3vsqawuyI5H4L8iXo3X4fY7z+Cu/t9G/nUb2la16JuvcK+95tm/oYtvmIaeX0kPocjfvWbXXoKrwCB6/x2WsuXR3ItCsU247sGpWI2z2YfiZeS2m/3re3CBPs9sbmaqF2/YGoqirTdUhR4xXUpMwNL0pVbYMeWgWyvmKPgIRtCAdqoIaGPB7vP33/H/YPv7PxfrY0F80CqsrEPUfN2i/FGimqz4aYQ4opDQMF9sV+3zrRHkkEfWOIQxooRPWcsioNt82JZrbtdCv/S66o2cqPstrl+A4CVPHUEyzBCLWh5QkxggFSIAMCMsxkQKBoYnkuZUH1cgFLWebpLPkyUKEIhdEIjciIgLgUmeZSB7IcA3NThzHUXxWwQl6WLApFjEoUDSFgCAgKKpXqiI6DZPMEVqCKngYAIMc9tCDP6v5uwkbLFUTO4uVECGk/3n86Pf88nyauSX5A64jA1vDDTeYPbMnwG+dvH5PA1dTkDSBS5TM5luRqzgdmwGRtLx4Ch7v7u+MuztnEsmMkwFBFRayIFVGrw4sVN+W+P7X+Fqt+hRWCvxmv+h60P02tZG3fmLNXyznrvk63/2+OIdwMO7XWhFapjtM0zdNkAIE5LnHOmUNg5vM0G7pXj/eHw9PjlyXncRhCinnJ8zL7jhaHcDgcrMiPP/7trz/87Xfff7cbdxwYCXf73WG/D4Gfn59yzi+nc5CyPxysLzi8P34jzdnKikDczNb/D5ctrzXi/4FzFm7BwZV21OowbIwleKVn3/Lxr/682kJgxdFgz67xqrsaE8Be/SxgZr44gVj7Mm8Jh2EcxxGJ1AxV3WPkJ5uprzvWLFYfgRUVH5e5sQCJAnO/a9WgVbBcSi6ZAjNzCFEl51J86olEkvPlcokpEbOVMs8zIO52OyJa5iyihJXDm/Oiyn5LmabJGRT93gNgIlo7UYBSipExE4ipW4p8ri04hoFGPuz3h+P+eDw8Pj7N83w6nZZpuRTNJmCGWAbTUS0RgSiKDkSJiSAAAjFRAGYCDh3wJ1rbqphSCjHGuH+4+/Dd7+5/981i9sMvv/z444+X88UUemJIr9X93llKmaaJiGIIaupLrjlnIlqWxSVFT1ARlUDO4RdPn8s5byRaNDN/0WjNm0FmFm1ris0VT0QtZwZTSjmnaZ7neRYJ9TO5Av9zzqrCgVe84eYt6b3DJgYFiLzcwpsE1hBItYhUuX9bxDVpRHsBIiClmrGKI4lRQYpvJuM4jhiTp/Plefn5x59U9fs//P7uw/3L5WxEVolS9dxyCg0hEdaRrdXWxzdoEEFR1eMWiTkNSUVzydM0LctScj695JlpGMb98RhTolBfW/I2Gch1m4quEvXf736/DyH8/DMuy3Q6vZjpOI4ppcDhdbKMt2MhhLu7uxDC6XR6fn5Zlufz+bI7X4YhpZTGcYwxOoD7f+7W9P54F4jfH/9nWq5cJ/QFtTfn0j3yBTaiSk0G28i3VvmIbvZAvf46r4RguG6Pm/0WGkfNrnpmgzW72nuDmqWHaGbTvJQivqbXvS2q1T3morR47Y5rKcJIMcbLsqC20J6+nbJtdayvVfmfE5BVz1L9kmhoAi0FfLViIRFgBeHJUmSal+Pd/cPDwzLNeV6eX06A+PHTN//0x3/OS3n68kspWkiZQIshkVMGDKwUDSEGJg2SS8k5T9OyLDkRFuFQMpAyMysYE3H1wXlIDhMyErIfachhJfG33WTzKboHvJRlns7n8+mclzlg5R0CB0YaQkrBI58icUBm4hBSinHA6tksboAKCUmCe5zdC83AREzEQyDcUaAwvTxdpsWKLikPJalaTDEtoiFASkTUsmuqOLiOYlt6ce/6qmMOkICc5Xe+TEvJRbypVGAmwjQMaUjYvecEZrYsWVSLCMd4//DwzbffpTS0RT43DhvZmufUxseMYAjaxNgVtuW+qhjjhw8fAOD5+Wme5+fn51LKsiwIcDweIgdn8MIVO2JjnFjV3uu6usV0vI5QqCiU68utpTxq/4qbnPrKqcQN7cK723kpP/7y/Plp+u6bgTzFEmtAthoQIiPmUs7TvGSpEhg2dyWs9fwWRWcb7/3bk+GtM5+qyb2hqNUrBiTqMvHmUzofti49rJ5yqFefL2jGGDtWDNv7/70K+Q0JxHVjHq2LqNVi2c4vuuJ8ez6WNbgjQXQrX1aEiqqX67fmNvnQAHzlwjoDEXA1U9nqqa/B16+cEb1L78Hlb+7W3HxKO1Ox/0xtcZ8QydNmUXX9wxYvYDc9TVcRV8yF9qGvmqmKdX0cTR3BBKjINOw+/eGfjt/+AeLhUvg861yyqRIhB0JmaBKmgqdwt6xUNDRiZuaYhjGmZEBFtKgJgFKNSbVN/ioAcIhpGKdpKkWJAmJoL66TNLCn9/U1pnaXaFlzag6cUiYyRCRFU9C28UNeE3gK5hr7Seh2YMAAFIADcgAtFJNpEZnnZXr68nO8/xjiiJTMopmVouDNooAZBQohxhACNLMzgBGHkKyIWZEiBUTQrKgSIHBEECgIBm4k8nxRP3l0E9FZ32Q9CFFQK68IgZzDrFLEACYqiIEhAA9hxMOn787zixVpQbfErpv4G8yRu2ZmPR6+h8GuZSFdK8Ldb/XaAn9jK96cll5ZkRiy45/VgGB/dz8O8afPLwTqoj0A4uotcFoLS5sXb8atdQ/MECqBug5UYTVj2nrprZsofVS6uSqRqDOemhNqDUrdyOVdQCZYIcB9NQeLWpnnyzx7Eq+qLrmUIiklIuIQz5cpxBhiAsB5nn7+/Ms3n77BIaZh+PDNJ0X74ce/Lf/2p2+/+eb+7j7GwIAK9umbbx4+3D+fT6fL+eXLYy4lpWiq7wfBb6Q7Q+d40oYqtq17e4cC9lZZ9WZhs72Eb2rF7Zv/a0WR9066adCaSwbBquiKsEl2bHPJr9VYN7QMMGfn1Au35Z5XrIbrbCJtbbXaONadgD4cRjAAjjGO424YRg7Jl1GJIlIwtUVK3QzykTKBmRRRA/CI82pDEcG6iuGcJM2luHmhOMWsgKoyByae51myxJhCCCHGy/nsS2wcgorM80xEKaQQYynlPJ1HGJk5L7mIhMAhhGmep2kadyNzqK4L8nU9rOE6InleYkw1REFVc92rI2YCQ+a7w+H+cPzmm2+my3Q6nS+X6Xy55GXJJU/zOSvolE8iIMKIiXmMcQgBOSFbZKhqNCJy8HaaQ0gxhRBTjB8+fHj49IHHEZgi2D+EeNjtf/7p55fnl2XJbqbaTtFUtZQyz3OMcRiGy+Xiz1ZFdrvdeVmAg5qKKhMpGHLwat/fqMuy7Pd7z/ojwlzy4XDIOYcQtjT8wOwOJxNxPAhTNc+qWYohhPT09Hi6XCp4lynFqDEys6iUvAwpqrU6Dum67eomgB5iqv6Wc19R4ACgTCRiHiy0jZLsRh1dHXb1zZyLyCmr5rxcdJlynlRm0CzHI+yOnEYB/PEvf8tL/vTtN8ePH84lQ4rVBIGt42sLZIZuUxMvEbUlDbtCHEAJa+S4Txs4xkOMO9OSyzzN0/n0y5cvl3kZd+M47jiEGCIxI6Kiive6fs71SZVqiuEP//D7Oc/ny/l0OT09P6WYhnEIIcQYmEPb5KP2cgERjuNutzt8+PDpfD6fz6eXl9OXL59Vdb/ff/PNN/v93rPr31uzd4H4/fF3fpCfulpD6lpne8M53RilqqKLuCG1t/9VA0VAX/Z5LQMhXuXm9n64uUArDm+zsoQIWN3A1qBx2PtzBEDPBnWyfleHm0JEVctegw9wJSyD85Z6Wjd2K+h1AlgLTncTMUKnWNa/90VQBgPFLp9Duw2rqtmS3Sek5/P5++9/vz8ezpfp8elF1Z5fXv75j//0l7/85enLF1EroojslmTjqjj468TIzKzMpjoty5JzSUFESkFgQANjAq6pbVS1XQ8ugi58cwcqAVZghZmoLTnnXKSUUsqSl1yymXmik1TwnjKH+jpgN22iAboU4RAAERU15EBkKmql5FIKIMUhEAMQMAzIIURGOD09XeaLm9d9gxWjgSojMrOvzaxG8sqGho1E479I81i/auABVIM5l6W4gxRdZFdTiswpqFRDm/9+LvMMgGI2DOP+eHc4HNQaBLu926qOsBUlsbWAq78De9I8MJjZOI4fP34EALXHZZ6naVLVlAIgPNzdU0+RRbxGDL9Zlm/XzN8o97EbTDbN93bEsgWlXtU90OhYK/0Ys8Dzefnl8fzp4xidDubflaCmSiMscz6dLjm3msn6b8OgM4uvuxa74rW+1S2o6caD71eP+hqgKLa37quOBa52GtvLQsTNNK0uqa80MaeiS8klq7131L+tttrf1YadCAPrego2yVBb7mUtXv3hUyzsdibyUedVIPzrkQY2cOLG/28rwxgB3joKu3DW37RfyaZ7NUKqDuWGGLZqvHfyryqoQqWcI6yBqlcTlXXbAAFVxWz7BNAUTH0VVz1i0imxiKhGENN49+Hu4+8sHmahyyzzogrgOzwUGAOb9mZI1dcP/PZSJ2ocY4opAbAZCKD0EsO6IdbXHBkJKYQ0jvOyeDq9/1DEzCEgglaMek3P9fPIAKgyQfwO57BmUBE2IG5VTOPj+IqIoWdngomYipm4bqiACqQYlAIQh2EAEJ1LKfnx55/Guw/34wOEQsiIrGqoYGI+rQ0phjB4jpy/+qJKAESBQkFmlVzUEiD4TiixQ5ABAJidi0FUiVMq1n1SoLRO39Rx/a7FE4IhqVveYJHFNIbEMQBhMRvvP6Wnn5bnRVQJG7OrHXpUsWNQ42fBviY89cBb2MQtbhXh11F1GxgFdE6lFQWsv0MmoBCWLH/78TMjEGOITMRMSAiBONQFox7fSu39f5Wgpdeimq1XC71yIK4XU2OwKHaf/bbUaL395nLf8Ik9b3AT0OFeN2ubT6BWJCOhmObHR0IMIYTAZobE+92OCInp6ZenlNI93fPARPTx0zdI+L//1/8KaiD66Ztv1MnbiExxt98DoSLmJc/TueTyfgb8ds6yWghty7ntCaJ9JGlmTil/UxreasFbOPjNRf21c2f92/p1sAY9WjXv+zmpNXzYtkCxG0v7mjnR0uVsPZwqYkzRS1akurNnrbtsO5GeO9LYZ6adceNsPSUiZEwppWFwbg8FpjpJQ0WPoFMgY+TqlEADIo9kUZHinRUih1ATklXzsiwinhpCxDFxzvl8nna7XUoJDd2P6Z1XYPb7dAyhAMzzXHKOnEIMBpZznud53O0UTUVBIIRgZh5qF2NyN0MIIYQIAEWKiqiYiQEbcJ3k+YSMic3qCeyvcAzMh91+N6r7k+a5iDx9+bLM8zzPl/N5ES2ii+qkGkSJEMEGwTElZnaPSxqGIaX9fj8Mo2eTj/sdEi2qJkLMuziMn9IY4o/0w0+/fJY2WPVPd6nXHbjzPIcQCCn40aumRTzYXkqBthWaYtzuUYUQmNld264GuFOkD9T9bcmBTc2k7kGiKii5TVzEhAE5mNH5fDHA3TgEGjgQB2JCLaXkDN4W+sC5nVA3VxOukKU2RPcEYyaPLPI+pe1gtWB4z0ioHPE6aATQupmjMk8ClgmEUAIUMiGRaDggqcCf//Tn++PDh0+fIHLR0vp45KaDGPZVA2qCBAIAU9usahJFcwmRorVdTwXgOMQ47tNuF15Oyzw/PT2fn05DTPvd/rDbBQ5CoITAa+xDr2x95J9ipHCIKTw+PT69PNmzpRh3u91uN47jyBzQgDg0MKRvbFsI8eHhw8PDh2maXl6e/vznP/31r3+d5/m77767u7vzN+H7GfAuEL8//n7qcHXgeKbT2wMbxE0s3aattE3wLLT0KCJEo5sR9OrUuE742azZNkyheffkfuFN9WCbRtiLAP/mRKKapYQYiFl7j2mknUbR2mRrLX/N0DJDxJTSTUmNVWG4WVWuEEOoEpm3C/7nZOAzvRqJ1ZZprcUWmYiUXMTsL3/5y7e/++7u7u75+SSqSy6//PL599/9PsSBYzIt1eqFiC4xuyEGcSllF4IDDkU0Fzkvy24YihgXBQPHVbmtzfewOh8aTFUEGajKZp6i4MbheqpN0zzPF7fEVRaIKAYIMcTAGtmrpSK65BwIAQMaBxCFGYuAQcl5ulzykkUlBDAwkbLksogAh4EYazggUcDoSyxAj1/kskw5Zx/QkhqoIgJzYO7hANodxJ1lqVrXaNA3rMHN8LVwLapFioCjsQDAmMIw7kKMGYrPQEUFEKd59lyZ3e5wf/fgeiLYitAkImv194pfFAG8dfbhZhPJR6A1HInp8cuXZVnmef7rX/6qIoF5t9u5BP5mIe5v3ZshzRby9t/ZW/i4twujsOkNdAOHU0AUVAIkNABRPM32px+//OH3D3d7JiRTaUCOqv2eL6efP3+eSxEnGbd1XVEj6qY9BVNrnv2t++ytTsTaeLutDIjkxUt1AbCaxUDU7yeEtPHWrLFaRNTtJ9tksG5qAEJTzTmfXk5S5P0g+K08zEAQeZvf3geaVmPTsB5D1g0e2ucL2DoEBcBNuGJfJLcVxdTVqHUbw/QaZtqD6hD6BmaDJ+lWGu5bpdXTf70CvCpuqx2rfjGPaV83LXz24bJCNRn1ESfU5sQTJLEn17nPRrcdvNMZm5BcATWliIoZcxoPx4dvLO6FhzmXuYioxhRiZL+1mo85a7CbmtUwMSTfWYE0DHEYOSQVK2JqCBSgrkYagAcDdB8ZEYc4JIqhzLNHE3DFDKM5AN79or51UinJ5qR4CMyK4N7aSgIUxjXgCHuCgoGhd57S0gBA1ZCI0oCApD4HLRASmrIULVmW5Ze//TXsPg54CLsYmQuYmkBRdjYhBwqMhL6baT0l0AsS4hBGZqIQFUEMGAgDefIqECoSGpoC1+EcWZVQDABMnClBYKgCqqCAyFDXZAADYslZzWRZlFmYAJjT/v7T755kkpMUKeT2XK3v1UrWQmqtZQN5bHLqiJBaUCDVhY83bIm4GpCbIQC3WG0yAwU/uMnfhAK2FJE55/NkKsSUdjEETiGkwDGEFJmJ/Vkxs9ddG7oXbmcgNSe9t/0KqtLyDF0Y31rGAM1QlLa6r7Xrv77VqmRFzTmwuiE7C6CZqavE4Nmw7a3c6lItokVmm4GJSvnlKTAz+UXw5enJRRDPrPvw4SP/M/7w17/+6b/9q+Ty6ZtPxESRAYFT3AdO4y7nZb5c3pvq35RCXMO+3vAK3Oi529Pkpv+6mda8qR1vP+Brxr2NiIxXXmbfJm3zemtK8asp/rXFYuVIXBW12/9TycLtYoU1aQI7iL8+ZzUiUl8rZUSi3W4cxhGARIz8MPRpb9+oq7M6ISJAEDXJc6DoH0JEPI7+0ghAyXlZliVndxOLSDc5hhCdh+BzvJxzznkcx+PxeDmf52kqpQzDcHd3JyLTNHEINRhDVUQCh2JFRC7T5CLsPM85F/dREpGnn3k1Q0xjCA5GuALKATjS13J2WdkZDn6PJuQUD7vd+P033yzzUkoxgJyX0+nksnUWAYDIlJhCIGYeUtrt94fDwVU+UZnnOZdyXhZADIGJSExNgQgPh8P88LBkeT6fl5JDDA6OUNXz+eyvhtOW3RTs/VEphYh6coO/ngBwuVx66zQMw7Is7aXWEMI0T0MaLpfLOI7MPE3TbrcDhGEcuJRlWfyV2VUQvKN+Fm+nl1KSlGXB+XIeYtjvEhGWolKKarUfdc5+w+tvQ+qsr3Ztd2I6W3J7BV0PVluiQ7PGuSmhHqCiZV5O+iy5mAgqkgEBRuTzy+Wnn37+7nffxyE9nV5KBWPWtIym4VRAc6ON4Y3t4GYwgwxcQWtAwM0wYWkYhjSUZZkul/kyTfP0+MvnIcZvPn6zuztAYH9BvR/HupxZrREe2z6OYwxhPhyfn5+fn59Pp5dxHO/ujsfj/TgcPHuw+feq2u5PeByH3e53Hz9+uFwuLy8vz8/PT09PABBj/Of/9f/9fgq8C8Tvj79X/QF+97OahX6DPqw2FbtGuK15s5vu2f8fAcH1H3bYvH09D2qbNCZqlVNxjX1062oPGlFEIwKgJRdV4xDQkzebrFzjy5oZSW2tMACpWUQxhCjeoWJvu8m64FRXOKl2yz5r9mzx/q+Iam4vqql4FQ5ZpQADJEQGIitlulxKkWHY7feHEGPJ5fPnL3/74W9pGHb7/fn0UkRcOlUFUUWEQExEuUgo4vQIBFKzeZ7zOJYhRUVAQJ/LqvUIbrTG1wBo2nVTjDe0EBEtOS/zvCwLMyFgCIGYJIM6nBOJgC1AMdN5LgARQCkQoACgGkAR1bzk8+kkpSBxKKJmIuJiXIzJvZxNgSEkpGBpdxjLcn626XLm85lqHLsaWAjSRoguZjYp08w3klxyqMtV1UxhiB7iQ2omZgLk0jLFMO72u92OiImBKCCygSCiOZqZaNyNu93e8yGq79o2zty2DNuKdN0sEK2tICIarpNnjx2/s1rPORn585fHcdx9/PDhcDgQssFXckKuNFTcqMNfIRTbrVq9KcbBELTxT1opv+WimoHT2xwDSrOUnx9PX54vQ9hxxHVG0yrzyzQ9Pj3l0ozusHbm2O1vv6bk2VfsKjWS0KTO5EuRZVliiMPg5AlcVwToNrHEsZv+Blj3/QG678CFMwMQ0XleOqf4/fEbEYitJzhDAxs0F9OKf+hGwJ5f1S+Weod1rnlTe65a7u3yQhMW17WVNjvckFvqV2wwxY1A3Nty/1ciFMGmQkMzvWq/EZln6vWf0HVgrDk5LntR1aE2mDwwA77SFxrgvcEk7GaOq+JWGFjpxYgAUNQoMseRwmgYjQIFCgMBZV8iIefZGnUh23eGFQjQ0NXLEEIYiII70QxRmpmXyKXZBhT3NDYEROIQQoxlyduoNK1MjI5A71OBqg/XlLKarqeELZpS1dszRfDRQQ3hrdlEqmBIhoagzaqGDMwQGGNUSaaixAYFTOaX59PPP/LwgTlZGJijWvG9FiRPciciAquE6HaWaZXNiZDQtyWKqkKpm0pMnjK6afnQrKOY0Y8bVRc0cSVeO14LDRUYyQPtKkaM2IhnwXT4MJyfpmVWOanVz6zv2nU8SbWcaElZNWLR20RwvUUb9XgddWy9wwb14zowexPn6ytitc2Gig0DBV2KvJwmM+HAg7M+ECNTCrwbU4whhECIHOpeCBHCJr2xcjwqNnSLiOnXel++6Vj89tN3kMtWEiOEDUG7XRFo13YH2DCXt55NVyuICMAzKgGAjLTXFyKiWnxgQETzMn95ejpPUwhhHIZdGvf7w6dP3zx++fLL51/SOO4Pe3JcOrlRGVNMBNAImO+P39Sp9t9jCPh1bfdXxN/XGvGbH9DuWr/2DN/cYINXkZUAb2Mx2mFdwRnWBqBbJI3VHZEtjK1GkbpZJHAYd+Nud9hEmqOaecqL71bGGIvH0dW8C8L+PRXc9EpQ0+FKKV4oMrMhTtOUS/EAuhCCqj4/Pw/DUH3EiDlnp+t6cowDc0MIjkgaAFNKDsDt6icAeI+QUhqGwXl0VPNIq7mBiERU1VyP3t5j/bbsbW9BtJTwJlHTrBSRUoBwGAdmVh13u10vXRCBmVJgEymlELPDMbKoXC61FkF2iqATHjyAbsm5lBJCvH94AObLNPks3L3DpZSc8zAMzOyadbfdzPOcUuq+jf7Dqqp//ZzzbrdzNAciiqqJbfHE/vKWUpi5SOlFvj/MjIj9/s9EaRhKKbmUQIwGRYQpmAIxhxiJOsHI1tez8b62U7ftseCm7/4rgBa+d4tHuEqggApFbL4mU/VwUQQ4B46ciDhwDMh/+tOfhzHtD3tmBivI2MtRab/99vTozQPo9c2hMcqsH9a9ICHGNI4xpuP+YKJlXl6enz8/ffny8rQ7Hu4+fBh3e1FRuNIQwIwIzdBMYwj+n3EcL5dLyfn5+eXl5Tyk3eFwt98fhmFgvppF+UqYH477/d5DHR1LknN+v/m/C8Tvj7+jQow9/Ln2XZvhbc/FWtVh3DomeoiYNfEIDBHe8g5jTUT9uv2xBsppC4433MZG4/Vg2XU9JEOac1bDyOwLtt0x1rPeKwbB6hYhrluDjlxgJFbxG3Tf1ui32pW4YYibr4rQ8IVaG3RoDuMefaNmvkuCMcWiKiI5519+/vn73//D8f5ufzh8/vnnl5eXn3/++Q9/+MPx7u4yXfIyBUZG9LuoqIEAMRnAvOQxRW8IiuqU85TzUStnCPtvq6sQpmhKptgNM3U1so00m0C8LHmZF1FBhBA4DcOSFylFAUUUCAxMwHLOpRReliRyII4GJGjgJImyLHmZJjBLqVNBjJhDTHEYiRiJAQn8lENCNoqWxl0ppZR8mWcyC1h7fq8S1t6vdW2riLGCAZGJxIwA1fsr5mpBRXMkZeAwDrth3CGxgVgNRGooA8QQY0pjiBERG2K65SBBQxxv3oVuK379Hu4mQR+J+xrYuNvd3d8jEb28XM7ny2X66aefvdR7uLujQNfOiVZnvz3QufnnGxaNrZK19cLbdb96VcB46Q/gnjsELiJPl+Xnx+fjPg4xAN0uGs/L8nK+iLqY3jTs+nr2qXnbcG8jbPj67nzFWzScprOcEbGUPF0m3PleEm5fHrwRz6GtAV+/nA1qpu2GRwLmAFGiQMTv58Bv5zxrfnK/QmvTC9t4UbsdTUIXGZEI3X1eNbK6SuA0dKn++Y3tpTJarG++1t2UjuyvdKIe/lpnn73jtW1ktv8Eqpt+HgCAfFgKAgB9Vrb+KNiWKNaZUHcrV1IxXuUIEIK2lXxt8T8dI+XwYZ80AioYmKAZIwihLIrGHMcwHEIajQMFiQpE5BsDZuh7uibeqKzrRJWVS8QcQoiApICGqNiMyk3M7r1Uf018Khw4IlB9zhyshn1iA9pgzaqrfmkf2BKioUfao5ipgNo640Y/qivd19pIAZEY0NDdw6poaoCFGDiwhYghkgrHpKZQiuXl9PnH4e5TiAPHHWAAJE7Rg2YpsJHrEkaIiuihudr2UTs7oogh+zOqFI0txsRx8AgCVnwm4KGzZmRU42zXRQ3bkNgRzcDPWSZAomyBwuFw9y3M85SziiAYEa4L4D4ERa6viW0He/X08GPO93l8fckPz1tVCzfwB7+o1GCLG1Lz6YIHMLawuHBZllIWIlpEQgyE/lrinEsMgZlijMOQAjMHN1ZVOEYnKa1lAmhLPlRYi9ur5vnWg9z1qIbQ6MecbYKKb6BPsMKv1y9ezWi+v95iPxCR2n7TJknPnQ0Ehpd5mXMhovM0DeE8xqQAYRznaTpNFwgcLYQYYgpu3zZSAnpPfv9NScNfDyyGzU7ZjWHQboTXTmb7le2zlhrhpxVcW3N66sW6ztm/5JVLsjeIt4cs3BabX6te+3lI29FpXQAA3FAC14IWWkgyEYaYxt047nbE0ZMnoMV5+cGGxM0IWSO8tSEvVA1A27jOTMXUVB3kXswgoNPaybkHOWeXdz36uKu92ALJiTkSuUjqoqcrj6oSYzKzy2XxWReiR2Wom4aJSKQsy9x/jylF37dwkOvNzcq3VKXylHHOSwgRVKtUCnWhU02ZHGqPvj7bb1YtWN1UMgT28VpxcnPZ9CPmtlwjQvcAlSIiCkTDbvfAPIzjsizn83meZ5+KmVnOiyuGiKFyEZArsUoF0V9PCSGUIg36qIiQ8+Jfwe+0ImVIg/eGrlfEGF1BbiN26j2O/+zMjFhtU/O8MDEBRKYYh5BiHBKohpgUcNs33YSR2gYzD3ClI69vv+u/urHwv07Dbqdot8CL5Hw5nRnZS8RlXj5//vzH//BPw25wn5YR4O3VUi3PRFYJgG8NbG4+hQhXT956A6m8JyTCGBgQ9vuQ4jxNT4/PL08vZZHDcUpDSrsRib3Q1dYiowE1nReHMca43+18azbnYgafv3x+en4ex2G32+33+xhjXWUWf+cqIhBSTDHEoGoppSLvy53vAvH74+/aTxNS3Y6VtrLvBlYF2ARzVdXGNkNhs21j1wbCoNe5JVfeq40udf0BalcIu/XrXpU1fXewCcQCmEUMEIhbxmavR8xgHay1mmf1FNdJWl3hqf7hhixYCRo+4ntrmo4bYEbbXUZbbVpGjvVDwhijrwXJUn744W/Hu+O42x/vjp9/+XnJ+eV0CjEejscvj5+ny6kIGdG6yKVSClYTMTEYILGUMi1lyVJEVMnIb9ZO9/CShhQZQY1vXlUFJQVUM6kZNmVe5lJKz43nGIZxVFV0XU1MTYuUspQ5z7AsSVUoDEWRiwgWUSlFRNEsBCbPAUMIzBxiTIliRGSqi14EiE6RMBWOw7gX1XJalpfLOUUeVKGlh5GP33U9vaqosUk39BecwX2rNfO9CsRUGZQhxBAjIWO1+3U7E3lhHEJKw4C+u2MgvnC9sgnr2+V2c3Z9PzcsyYZz7cqpVzP7w8HrvpyziDw9PbmcEkM4HA/wRv3wa1ftW2X1VzwdTSFomTnwGv/SFRhre+YIKIaXJf/0+fnTw+HhEMk5Ku1iVLBpWc7TLAbc36k12Adt00zcKMBwnV8EjRZq/QJtX63vS+UlT9OUUiIk+DVYnmMh3QYIzQbu1AstpWwcbGiqbpk/HI70brn67Rxnff/bs7t8v9tnTit1YnMBND3UjBSskUmgB5oa9IbXP7VzGK/f4y7fedpp/4smHEPDuWjlkPoURVcla3v4+ewKO3J9Oxazthu48h9X3aoTMBSNQNW23QS2lZa2FwM1w7XDxQWagapCnyoNQ8DEs9tqjhdxSLtxf+Q4CFLtqJFUDVWbf7WrvVJ5yR33ghg4ApIjHRRAtL02ZlextdDmRD7PM3ArrrbcTXJP9QY0u11+XoH1lUJMhDUYwKCPc1FXbM56y0Ss6U9ORbIKxgQmMCYKAWIyNLSdIoietZTL6cvl8Yc4jHHYKaBFpsAAiMzIvptBQIZIgA3jpFLnErXVg5YVDis99/VUvZHjPbZNa0xhVQG6TNPSB82hE2AKOZecYyDioBhmgbvdRz2cZDrnywuaEYHpmi+loIRaRekNxHqNCDUDAFERFScsW6Mr9rOGNrp9Y4B3D27TnUy73x59xoIYOKiB74dl0RgjIYYYmSDnwkyEmFLaFUkxxsghhsgUA/ccuvo0ut5dd0p0LRPfklMd0bL6EqqRHe0K412LzfYjXdXJ3Za1oS1foaLwrXA/J+xbjRYCJhYzEQXROeeTnZ2ZyYyc0mWZ9WRxiSmlUYcQuI5pCeFdIP5NCcT2VfBfCyzGN2Xft9hlXzMI1/fqRsmyt8TojU7WFGS025rUl93t+ke4uYHV07GOV/G6mm35AdcGI8M+8UUEn0dtokI8a4WY4zCM47gPIflig6fS6krXJ3fuiEiRQoGBSUsx9VRwrHBkIjAREZ9mKlgRkZJVlSO4c2We53memTnGuNvtlmWZpsltxczs/zqOo8HbJdIAAQAASURBVN8Nut0VEUqWZfFmBawtF7rRWFU8z81/9mVZujRupohkNQya/ITqkMZq11WhEBhpKRkQTY0Dc38XuXfDwFRLeydsYw8QsWhWU7dRoGh/I2GtEjBSQCRtqzA5l3poKxDTbr+LKb68vMzzXDzGhiil6ESOui/T7GjMhAilCDMCmMvrIsXhxU7XyXlJaRAR31pRVZfmt0quO4hv+vPVFVud11KKLLkwLUhQmJCwlHI83knJRN7pruCIGwKYO8pvLqibvKLt67muyPS/2pwg69jmmgmuUuZJPTBHRBhf1Ox4fwcIogUid1MMwpXlvz3ht51FvfZ6/azWC7o3gKZg5h4JDnS4Px7v7ziEl8eX5TLJktM47JacxpFjwMA9w5YdVGhgoggQmAOHcRxVVUSXRT5/+XI+X07nl5TS3d3dbrcbhsFRJMTYKkDBNquIQxrwvTV7F4jfH3+/BxOFwFIU+pJs5V517gRsoj62xz62uNebGkI3qB27qU7wSrkyj1+r4em1NdY2rl7DteyKS1Uj0ZHYkH1HFYmJGKjuElpDIre7MHoZJSbuBK4ttTNlGTmEIsXNheL4Of+oZnOpJhH3vUJd63ArmJkgUEP2AQKD9+BanxqS+XppCBpCQlyenp5+/vnn738fj8fduEvTNE/znHPeH/b7w+Hp8UtRMxNn2AKhAeYiMSAh5VwYkZiBORcRBzZrI0aqArEzOhR91UXVI4JADZSa2Uo9OL6UJZe85JwzgAVytB8h2jAMhFDyAqqipRTNqgW0AEgRmWbg05wFiEVRxMCAiHbjmIbEMXo/HlPkECgE9fa8wpIclo8GiMwcI9IOQJfzeXrJp/PFBiMHgRIGQg+n8DeNz+fre+Z6ZuAJPq3nIwUwIDNyYjSzg3TViLS5073xk2LAFkMcx51vol0NAZpfAjbbqbCi0DbHsF3bGRyVi0CMgOgHYQhhmi7n0zkv8/l8QsQ0RI5hGFJvmF/To+DaogFbQLZDoJqy7+6jq6Hxq7LGrpek2swGr1yEiAqUC/zydH46TfnTYQjuwTcDBMYicpmWaV60MkbqTqCqbb9lc7OsFuatAeRaYO9G460qD2Y6zZPvlG3qv3X7ffOat69u9T3DTRZ3jbgFVlV/x/l8FpEYwzu08bfWU8N63+6tQsN6V3C8I+c2UXI9mBKR67ZpxclUKdZ61mfHANvWptk3PWufQbA6WRsQF82ZAKvO267ota8AWKUnWJO1XDU0tX7Lq8qi242dPmGgqlB1N1dzncNgfUS6PXxt/fMrqEX3t7iOSWZYSQKIzHHY7fbH/f6oyKqAgMRkhoCG3RLi7ZnVp8mBTdZuDXmd4QmAiurKfEdfYu5pAiIEyH6YEzMFtqxSpOTMGJjQNqgfJARQ70DBOXkNtwSNTryy4w19Ck4MXHdSUBUMzMEdHnAKBI5J9hklc4A0CqgSGAiBSV5Uspb58vLL7nCAw4ERhAahQBSh32PRtrMwN4r7hgyolwoUAKidlS2yoY5FBcAAGSpFqbJNEKwefNZQHu2l9DeZ69CihGZkqipmgQmV81Q0DWk8Drtjni+gZutKhvvuUNXQbAOsriEQ3VD4ynh724Jqn7hvrs72oa2ddkM7euBSPU2YOQ0pl0Vzybksy6IGu90uMKn7hwmLTKqWk4TAMYb9LplaitG/AVNLlbte9l2nOtsraeNXUNVtPFELCtsspXX0ONyu8b55mrzmMrvzuoXM35yFPlrCZmbwUATIKiKCGZiQCXMuRMiRx2mMQxxSGseBQngXiH+bp1o3Gza90DbaLm3evVcEUrhyKcJXOBKvP/G1HLZaTLqUvFalt5LTTZDym6r0Ght5ExppuPF+UCtW+9aNr3Ki2NWNH5E5xDSOaRw5RDM0QySfzKGYFRFUiEMgJBEtUgyBmL01MlMmTCnVRVIgT8IJ7A5cm+dZVBEUQ4hNjvTSwtXJtqZmMUZXkF9eXjyqmpnNrLkc2ExzlhBCSinG6NhcAEgp5QzLsqiqa8QiZZ4nInTF2YmIQxq3flW/hW50ydr7uR9ZTYUEDBQMzHFDvicaiKijM1YNkQyIRBUMmbnfoBCRmZg4UPAvCwJFihRPJVcCZAquZocQHx7uzufT8/NzjPF4PE7T5CEuABBC8KfsCA6XxbV6OKoL2CEDMUY3U/vzJEYimqbJCcv+qp7PZ/+A2NLtunG484gdBOFzZVHNRZd5OZ/PgenTw31epnmaRczXzrYd3GuxtY/9bvZOtmzi/jRunDq3aY0tzbuNh31HjJZ5AoCSC2L49tN3xXTOE0Si6Hy8uhzWAb5wZZR6I0J2+4PUpZ8mf3ePjtZwig6/Qmp1CxN9+Pjp4XC/TMvz49PT6eXz45f94XD3cH+8O4Zh8ImCASGoiPaKVzy6iSjFGCPsD8dpmp6eHj9//vyXv/wFEY/H4/39/fF4HMfBjztPrSGo393gnf73LhC/P/6enisgAkGo9mFPmmpa8RbEDmBXZUIv9etSbkUxekPi6uvWomVW3X24EeBUHRXrKz5a3U/1DuiOpxrqUrvetvGnaAZYVBfVIgpUwQuVUeEZIdU31fZ6EYkY24Dbs1KIWdWIGMAXmoCZ0bm3gAbqqQZgBOj/1S7PIRCqIpEvR6CBKhGiggIIora1lwqyJOZhGKZpyjk/Pj5++vjx04ePL7/77k9/+tPL6fmvf/vLv/zLv3z69OmHH38wU2QWUDD1YDlVzaWkELX+UgCIAUgIF9VilkWJJGqIPiGvfENF0yKFkBiYqLZfhgZmfgYveZ6WqUgh5jjEmhmMEAIz73SIplqk5Jy5RCk6molnjSPn4vuwRDFEDjHFw26XYoy+S4VELjczozmJAJBqDhoCoCIhWYzIOIAdP3w01dP5BEQcWM1UFHYYEHsRo21sq9oBxO71JjGpK66G0go3NfAKQ8WWZfFCk5HZiYWqABACI1KMKaUEGzfQ9rDHX5lk2rqe47+ptUX0thLMzDxxL4Twu999/yV8/vzLLznLy8sJ4AeR8oc//MErwpuy+lWZDmtYRxdWm5Ckm953dScBuPzSDST+DG82EF3FqIb1iiZnUX56nn746fH339zzXQIoZlYUgMI86+Pz6eV8qd+TgImJCAEdhQZMsBkHuYfPVrIovvUyrmMhq3mUWIrM0ywiRBRiaHFziNS2h7dwc4MO9tK2Xte/V+PBoaqeL5en5+f9fj+kkfAdMfEb66XBJdetzaQan8y2UR41KadCDlyCpMDMRJl01b3QeqBOC9rC11lA2+uJCNcDssWV1oRTIjAUh52DYctV68++jjnNkBAURGXbR2w7efQ9CWhM3j5VrUghtE4dAuranP8ElSHRFPP1p+n/W2nH1d5rYBBCDOn+48eHT5/iMFzMfcZIyAaIZCICRqjg3VglyBOFEAKYqKgoMTXaoIlYVo/v8i1Qd3CDqqzGuEY3R+IU4zAMU72PCQoh6SoTOAivshGqyNvyDJCoht23XZB2WwBkVapWZCQkdSMsgrZyAYoYChgQJg5EGBCpcHCaxQ7xDDa9PEWGqBe6/ECUi+413kHiuvbpL7fLzG0wzmprVpp/b/Q3ABJVXkKzvHn6uPvOAjrJBEHRtHnSoc20N7/GbstWandgz3clDgWWrDCMx+H+4+npZ9CaarsaANzM28hKW6df/WnMmi0OY4whsAhsL7GbFPitPApV1tAqzLe8u20rHkIwQ7/5MwdGmJclg+XMgZmIA5P/xpdccFqmy5RiGFJiphBCStGTddaYLwPCmqN4c9DDdd7szU5xjXut8caV09UPYEK8BpS/dg3f6gtdWPs1w1d7xZkYA5gaSBvCKhQRVbEZns8XIgyBx3FEhnle3o+A31B/tkIkriDCG7IJbvWha0W2fzD96tjgypTwVjiEbQAUNax7pRtt5h8Oc7FXx7H96mFN11e+0TaDztPJan/XiPJbM79/JiHFNI67QwjRjFuL1lYJ/bKNbGjq904iIFQwBEopevMpKlLEr2lVMQRRmeZ5WRZRDTEamMe1pCHtdjsPlHPEQYzRebgewubCqI9LAcDJuYg4DJzSkPPy8vIyDENKaRxHEY9kVgAQ0VImVRuGgTm4Xuxo41LU9DLFeb/fO9W3s+yWZSmlEKCpZclqqkUJUQl9rqxqhbMTl2Jj97ksC1sQQQACZsTqks6T1hcfcjYELMxu33FeojdiIQQgFBEwJOa7u6Oq5Sw5l1aHc87leLxblsW7bAAehrQs2QyWJQPA8Xj0e6yIEnGMOM9LCDzPCyKKqIimIUzTnFJyd3b3GncZ1KXkmtdnFmN0jMY8z6WIGoo5JSOUMn3+/BSjo4sYRACwN0d+ufnv7lcGJzcXkfMZthOX67t/VU6oQbG3X65GLCFIKQvMeSlFbX84fHn6jAR7KTu6Dyk5/6SPJa4vd7w9ZN9EJ70qI9eBDW1M02CiRgBFjcGYIIzp4/DtnX788vjl8fHp8V//jYh+993vHh4+cCQKXK05AF7SMZPHQpYipgCmQ0q//+733//u+8t0OZ1Oz8/PP/34048//DgM6f7u7nh38GlK3UEwex92vgvE74+/a/2BtcDVunz5K8f4q9S4zch3Wx+0SJKb26n1+1VfMPRgsatzvj4tuw23tbai3vEOgGpQVEQ1JO4M+BoyUG1TtbhSAKvNFdqtlOCpICwizT29Rpvbtf3E/V/QGY9EvvDjdiVEADKqHTUACOI662OiGKNPjKfL5fHx8dthuLu7c1fpy+mUUnr48OGw3788PYXgUVpWVBHU1HxjOoWgACpKZoFxKSWLlCLZ93BTAjcfuWHYDNVMlFGIfXMRVcRADUikZJFcioggUghM7OeDQhXokIjBA+WIQ0z+YxqCGnrWOnIkZgQm5hB4TCkEjiH0/Pm2rE2dHoDtRcGqnhgQU0yHwxFNH0spqkspNXFoxgTr28W8k2wxqP2tIQ0vYmaiWlTnnH1M0UOH52mal3xIYwyRkSpstz2Y2Vm0/3ORZdd5Nq3tbEUubZZyx3F8+PBBRF6en3PO59P5J7OU0sPDw263WxPYieArAKYb0bg2Ebd7getbXNHg6yftbZxCu4ANEIGnsvzyfH46T8dDCszOxDag85KfT9M0FcdxsLUULYQNPfU6qOQNK/OmzXFzXYWHrBe9qrsRnQTDDm1RWzniK3F8dV+59iTbGb6qBgerGYjKMk95WcYPn5jfz6/flDRsdivHdGPu9UwEN1cTNpc7sgtexAYFwVr0GW5Aiq8sUquw22jwhlsM8dXF1/yd2EZHN+2Hbaazm6ksXLlRttwJ6F5gbH2UIHINpavG2G4lw83Vd8uF3Hj5/dLruAdHGaAC0jDu7+7H41Gxbw50VsMm6BZRzEwtBPY1YgP1ES0ytbA+0HpSehuvjQ/TMBjtHt9uJ9UZxERS742bgM8uifoSkp9baxQnOsJP3epsrZ7wCPAuxQG5H1qpAqiRCEgoqKmH9hFhRA4N7GuIASjsQ6A0HO7umUDn0zfffPtT1qINSwJtbwdt81QBicxMKxsJANF/KtJV+FErPT/NDJSQK+Td0PenyZxs4vFuoN3Y7gq8VH4XrPABNSBEJlYA4QHjyCGYLqZ1F8UqDZ4QCK9Xx7TP5GpFVzdw/VfT/tU8Ku1G1Vp1KLUr1lBPjbQ2aEVCBOZgBqUIkqoZMSMCAKtiNkXQQqhmpZTAHAJLYSm2LIIEMYQhpSG5kly1LYLK0n9Tlu0XXY/gqekH9Yf16/pqtQiuz92+bHfT297kg90cuF9bYcG+9eBLC3XngPqAvPK2FUR0KWXJpVh5D/b5TfdruO6AvJUI98pjsOqs/65AvB4kb30dbFC+bfbvpo3arKfcwsX+vZr6+hp6g9a6qVFVAcleV8ApuWIbEdljYcENwqogxQA5EhF7hekJYWpWlsUAfGYJhByYmE2sFPG76PPLi5tVa06aeC0KYRM91z28rgu7ckpErmN6FNs4jiKy5DxPSwjR72xOHWQOVv06EkLc7/fzPJdSiDjGEGMSkXleQgjV8CHiqnHYPDrDIUspUupWiVuAa3Y3EqKKKEABmOcZN84b7IRnJQNjfxFyLkshpkqNExVRw+JGCz9dEGlIkUNQUTFJIQxDMoOXl5eHh4dlWT5//jzPs8futTg1dJdGKTJNU3fVhBCWJfsL2HENIQyXy9TiysHzA53C4S9IL/P8DOrveYdCdABFjwEkwsAeGsvEXIpQCAAoqrz59H/nMvna+3NzALyNwtu0QdsjAcH3f+r2Us4qAkuR8/l0vpyHYcAQaBgUMMRAzf/b7S9vPusrY/irgMqrW8f1j22b24XU41qkl62Mx4f7cb9fpvlyOX/5/Pn0/LI/7HaHfRqSx/2VnnxYvXEERE6JcezbfrcfhuHueOeQ4tPp5Zdffvn5559CDPd37ikeY4jv9L93gfj98XcuOAIzgmHj8xm8WddaU+jg1XbSm+3y2hdXO9UmP2HDW9SVQ9qSYhoJsf4tXk/TW09agRJFFJBCiIikomCARgbN8uQrplCX0nHLJ62FjvnxzBzca8kBVdUpuli73+0kkNqtt+7Ck39tAvcRG3rueb0nM3eDoxFBQBrHcZ7neZo+f/58/3B/dzzeHY/OcSfm4/F4vLv/8uWxFOUYVE1KrjgPQhNl3LtVs4iA6HnOeW/FjETBSi6SRRiZgJDMW3QEMSBiRxGat/oCVrwCKGJmITAzuw26SuO1cUMAYIqEFrQnQTAig0c9ECNxHWMTBmZmYmYCVN0eEuTDAKzLq4BohNWmBEBADCEc7u6W6TK9vMx5cTFgztkQQ2D/OgqOOsTtQMEAVQ0JzKCY5SJzzgUgDENIgxQxKTlLEX16et7tjx4WYaK9sg7MIQQm8vgiwP++zZbr5IE3lvLarjh1g5JIGhISghkzPz89VVYX6OUy/f733+/3ew9/wLcvqXVl8FdIFDdPpnjl1A54ZNomP8GGYueQRm1RPoiUjb68TD8/nu7vDh+OEawYgEF8OZ9/+fJyOs3on2AgVU5yz6IvphvcCFtrM2OvfjCDSkRdfyAVLVUdpjUCAre5mNf1UJPjRdUr5l5oqipA8Bc2F5nnzBx2u93/9Ejg/fF/UYm4bTK+jgq5KY7taj+e+o2pkvrUgNY5h13ju7tRc7tp263KjZLgsh0hNTe9j96snkZbD/IW09+6enxzlNI3AzzgpUW2omNmi0ij71ilmTakstXpDbQtfrx+AvV7+aUiZtq+AgIYUFErBneH43i85zQs5qQNNAMxa4Rv9P/jUFU36wBC5z863VU88kBVFAC46vf10IbebxMaAG/taap1D6D2kK+bIu0kW6xeHSd6QEU3EsV6NKE62MBFN2Kun4I10F6d5y9CiBgQTE2l/jxgxAgcECOFBWUZ6OH46XuZl6fTaTpP3/5eSxEIUIMK/N7k0BHfuCKH96GK1HGg71QBsREaklWGhAfZkQfUIZqpa5yIaghtO2mtn4DAxPMCRbX4ywxdyV9p74aEBZlooHiIu8M8T3UXCtYAWALC6ghsvuR+uLVNd20Pn0y4vX4LbbzpS92cji0jtk5nrCdFYbUUIg3D6CRiyYXVWI2ICCsczMwYYJrzsmQmCkxMNKQhpchMM8llzkOMMWKMwS3HgYmACDr6xZ3a16MXwK0NAdqUpma4qq4HmV8z9NZCzOq5fFsiv/nQG6v1emF2t2afchGCqhr2+XYd5wBk1ZyLvh9nvz1RGN5Wf24dCVu4xP/g28Cu/cj2tedQz7yNz8ba3OgrSvC//0Te0Hu/+gw71rz/uWN/D4dDSsmfCSEBkuehkiEwEpqnfiu0nQUAKZJz5sCmAESBAwdWtayL1qPP5mXxSSkRhcAhxhDgcrnM0+RZqy59llIQIKbke5qX88QhDMPoT8k321KMueQiBZFc1XUhOCXr3DMzQIyVWSGiTC6DlpwLQIwxpajFXl5emPl4PBLRMi8eHt6KEPWOxr9m98DWcroUp0X5x3e3bCcqBEBUK6WIFo8OizFRDDWQ13QpgljpECEmDoGJlmVBwhCTmeVcxnH00vrbb78FgMfHx35PczpEKUZEpVRJt6m9CADLsgBAs2NLzsV/CiYyoGXJwzC4pXqaJmdx+Btjmib/OltMUHVYE6vIkhc1U4AimkUQdIiRiGIMqpjzQnALY3nzEvia+FtKKTn7K/N22blZVXl1UTdomYF5gPayzLmcTi/Pz88hRgjMuxGYY/Q5gfVEnHXn8hXSc7tD+eaPsw2S3Q5qbGuYRgQA8fbdjAA5cErDYb9/KPfT+Xw5XfK0zNNEgYf9OO73cRyZqUAtJpHACSTQqCz+rOI+Hg4HVZ3n+3meTqeXaZoeHx+/fPmCACHGIQ1//E//5f0IeBeI3x9/t+KDmbwN0y1n6tdP9d5o3J7vm6ZtxZvC9ZjLXj+2O7bWS/JrW6Btlh/d1ytqIorE5GHfVn0W3S7WosrXO2PvjWt2kJqDF5AQxY9k7sLf6/l8XzSGzUYXIavLCRUy2M3F3rjVfV0zIDPfKpqnaZomU7s73n3//fdPz885519++fzx44fvv/+Hn378Kc+X5mitmTk++s6lYERCMoNFymVZsmpN+3G40lLYCA2MAZDME1yRRQQBDMljbYqZKogImHr6LxD6RjF5ulpPQDJ/sch8iZeIORAH5ADEyKxAIoLAHmDq//Au2kShRkVh9Zj6LwmbpmE1wb5q/WZhGHiZdcmOAAPVJed1y1gMCPzI78UNuGtKDRAUbC55ynnc73G3p2GYLtNyuSxlMrWn5+f7jx8PYb+uaJuhWY1exTUX8HVGx/+IxaMpnrgK2c5GqJnCZvvDvk5oP3/JeXl+PplVAtrhcKj4wdcHOX5V87oRv7YqWFub6v2vZ3b1Yct6hTRLY/XdKYACT0t5fLo8v1zuDwmNEBEpTlN5ej5PU0ai6vntosJGULu6+GpGnV3Hvtv1R1y94g6e6Yay6mp04c29crgmgfUNAySCmkJ4VTC5GKFgpZScy5DGEOJXndfvj//7N9Wvan37dxvVZiCs+ZTaza5w9XZqlxjYGoaGb52S1YEMhmZ1L920n1HkYun2SFzxjlhp9jc9f72ozdbbn6vbrWmvhkTbAMCbbbWf3VuG7PafNf7NH25CVef+QzFQDru7h7DbK5Ia1vUfQ1UtlUdBK4+Z2RTUjDn4jkdlJldivjtyHdSkLUDMpGKm0K5fcPcaiyoSU4iQS806sK1Brt81qVYMVrersd9MCcjxlIZGsNq5qWlx9aAyQkKjmlhAhKCoBlIjzoKxGIMRU6AwQMCY4nI6Fx5Flr9+Ps3pA2FAQDAQQxNXnokQmVEYVIupeY1A6xuqGfEcTWwmJqAmFdELSh7yoGqNp4NISHUDrFYb6mytSqIUdeO2R8jUqS0BIBQFBAyUOO3Ffg612lhfwHY71rVIwyvi8HXbuW1E7VYX3gRR1CzRzvF1ycl32DZXbgghphRCyFOGuldjTD1BHtWqIqIqogIGOcsgQ0qBiUk4F4kFUwnOEg0hxBA8WQcRmaheL5tTAG0d/lpDlXVg6mYO1RNZwTbZQF9T6LYv1DW6bVUN7LZa3pxf/qw8g84l7sbb969BgG7x/x8sWN4f/9c+yABvTrSbCvB1QXgTgfiGxIy42SbxnUvbfPKth7ffX9c3JG7KNoRfL6Lw39sTvxn0vbJn3O7Fb6HFiJhS2u/3jmjzNNrKVCOoOJjWz/iFQgzW2o367UUVBUIw0WVe5nnxhoOJxmF0/df7LwrVQ+1zWKptCCFSydkgxxjrCFhtWRYiCiGKSC6FmQmDgRSp4qxPQ5e8xBCpchpVREKM5LSKnGuOPJOIdBZckWJgRQpmLLmUUsyMA2PNFmNm4hBMtf9ecimqSuBBr7hZD4IuJbd7uolKyUXVXclaSkaozHS3mGD9oR12XIoUBqZNvFtKqZRyPB5dEMw5D8Pw/PzsXh/Pmst5iTGYAXMgQndqL8viqrqIuDPalXQA8K2UGOM0TR1wEUIopbiPm5krUmmTdesRCEVwWbITnlRBi4jkR9Hjfj+mIXBEIDWlt966uDmnrt6HdlVn5pxz5SaTqm76oE1cjNmrg3JTe1b5wFRFiqhKzvPp/JTGEIawy3eDjJ5b0IEvt0j8qwPKnLbhInG16bWsPO2xw32K4x0xrmXwxtpUwX2oNelYwQLiMAxjSvtxd54ul2Way3I+nZec0zyHFDkGh/pVKwFoMyQBIoqpGSJTCBzCYbffHY6HZVnO57P77rO//98f7wLx++Pv9SBEZrLrHhUMbiqMN6w61qUd7AECrZnT1zO4LUz9KwKxWlvQXXMVrKdmQZ+bQf1oKKpZDClYVbfXp1pvn70td1xEDwHaVFF+zDRgsakqh3Bzdr6u+Lsbutuk63nhpUvLsq6pWwSo9cNDCLvdzkNnl2UZhuGPf/zjv/7bv12m6U9/+vNut/vjH//4b//63/7y5xdGwhiYAqqoiUsROWcwsBDUwNTm7KiimkKacyHONaY3GACRARKrFaSMakgkAOKYZLEixVwgRjSqkoECoG2Lx4aDdXkYmTkQBeQIRBSCqBdk2PJ2kQAJGUA6irBTMc28HHNQJJqKa3kly7JkkQWQQhpE3P5kBKBSUCj4ILRF1W2BaIggpqpKjAI2Lct5mg73d7g7QAiAqCLzPKnq88vzy+l5GBICMpLgmstIX9vU+4oa21vHm8bP38H4Koyt9bTEzCEEaue7FHl+fi4ln06nH3/80Qf+h8MO28zjRnqyt9nE9no0vUGHAzIhs9vz1i9CzcMNm460XRx+GStQUXx8Pn9+fPnu0yEyETFQOE/58fkyL4oUEaU3x7CJh7ydHW3222G7Gf6GPNwKpRZB37t0VTXwdyxYBVnaps+oWc01u1G1+9us5kEhgOVSpMjd3R0149774zf2+JqV6caj95aaXK9TIrIaLtcRSq/jpK4c8VtcsTOI2gnhb2mynonXGl0DVFMwl0srR7gGdHgd/urJdzVXrXKH1Nooxv3zxH4aWQsN66CJ+kxtw2UxbV/MPMLFr5yiYuJIfzQzARAKu+P93adv47gTQAVUz1prx4WqGxmhp6sBgohxqOPSio7C9v2sb9qYqCGgDwXXfPZNIF8TriuO1g81zxdARQRAfpUq5k+B6njRmrgJNQneqI6bEdAEzO8F5ImzHv1GZECKHkU7IKCWggYEqCq+kIQakABDoDQedp9QisznX56fd4c9heB5eSZGpqAYAhIGYEJ2NLBU7VrVU16xqhWqRgQo5ns4AJ7NgOzCuVqNwN0i6WtYbftNO3/ZrdZMzH7KNzHH4QViHukXkEc1AsjgGgD0JaKuV7eDpqbibaqgWlNRi1t4Iy/rdmDTfkkdmlw9ib3lbXPNNKQY4/lyVnUuIvSZLgMqGIGnSIGomVqRXEyXEgMHJkayFDHH6OTMGDiGUPeciGIMQZnZ98Kg9sA+cLQryXcl1FR9e3v1395rXq8FbF+uV/F3eGMC3S5Kt5pMEDxCo02eiXzJx1bcFnoe1/vN/7ckD9urQQtcj19edyW/fgjW2g5o82EOwavW4Gukdq/IcMWE2Xobxe5luA4rf/XZHZf0RsF1uwuCeq12UW/61kS61gvEEHa7neOAu9XeXzaqZKS6a6ZFVc2zAXx0hgjBdzwBUFVyziKXy1TEQoh+ZA0pUWP9mIIUQeKYBjfhzktmZiTkEC/TMud5NIgxcRhE5HKZYkrMbEC5SC7a4bNZhGtTREUFBANFCqH2X4jIBFJyLgaWUkJmybnMIqrudEbCpSyiUkqZ59nMYooxRJeJ1SRgoFB3oVSllOwm30gBEYvINvnZlURmzk7Q6NscRKZWNIMXKgCcAgdP7NRSxA+dYRxVRFVSir7f49S+EMLDwwMRuVb+9PQkUhCRGAFMtAwUDSAENLBlmd13jIjelTuXw988IuKkdRFxyoTfSx363HICpRTzpdg6U1b0HFwzFSlawIoaiBmowMvl9GV82o37w2GPFEwzUBUgsHchuEZtr4jJdazpooERugQvrptvNYzVJbQqEHIVgtdMZcZo4gEaoloITMp8Oj2GCCHS/nBMMY1DRAtEoYVKuIrzCnes29LR6k4qQgtJrpPz3gKqmdRSqCL20QAZ0bBr0TV+QNT5JWpWTNAsjPE4cpJxmufT+ZSXvCwzMw/DMAxDjJE4IFoDPblK7d2bmqgq+hoch3gcx/uHB1HNy3I6nc7ny/sh8C4Qvz/+fgIx05ASY47M0IAPLUT9yvTxK0VMnyL7TUqrE8StVbXoeKtYuYkKWWtiuJaNV7XSC2JAQDKo++NODgLTtUxp+SJbvnGn8m8FJfOjmokpqBkLd8PMW4kluFW8bJtMgmCEoOSCNHId7Hl7Rddtw263K6Vczueff/754cOH//CP/3g4HE7ny+PzS87l/v7+cDhWVJYDERFQPKqYShFv42MIAKSiJYsrnIRQRDDnxl5EZGUkcjVYlTwntea7Y1FpCKrVwuSIRs/6qbWf1tx0J0swMmNACuBAP0MEYCQAYAQGD6cH8P5F1Qxp3UozBZNSKkFPAcRUNJcyz/M0T0ueES0Quk1ITZG4yhiNhshEyEwNStUUD/NICpFymefTNMVhtBQFiThwjMRBTae8PL+c7o5HAyPmYCYGqupLv7Uit9sK+2sLb9u1HLM16x27vxyBkNaUWy/DfZ/UIEY8Hirp4unpUVVfXk6+qvsP//AP4zjW9I72fn4zauDf9WhUpyJRtfoC1pwEopsiftuFQDPoKpICv1yWz48vl+ljPCQFFoXLZTmfcy6AI4IhE0RndEDLuaOtktYdllfrvJvxEfT0qG3QApjWysx79j4fstob14/rlu3r1BaPY3LJC9rcxmmnSLjb7cAAv77S+P74v3dzvT2/8I34jq2DqZ45qojMTiRnUm1K70at0VfrhVt/Hzo5QitT1Z1L/vFEVFELCEYblAShGYEorHvphABuC2oyHfRjdJskVxXp2rkgrMTSnq6NVWFcjV7bYKxNFwFqoE4GVHMYhla7jYEij7vjN9//w92HTxyHbFjUVHEFVhh2HV3bHzoDX9UAqZ7vhMRkBUxMwRdvGi+3yoXm81oz83mk7zZ1TxAxB4MQOGcxcTBybXT8/oaEQGBkbcfA03ERqcfrVsewo6iAzJDV6kICE4EBVgutIQIzmhIBEpBiARdTiqCRhVApHiEZJxqHiICHh3T/rcUkzAVATUAREFVVxdCThaqKbkQI9fUGRReCVVVM0YyppvOhaXWOEgIaMHRd3u1s0l6fNn4ALyC0Dyi6zxXbpI0Ds2fHAAMlTjudzq3X9DwFIH8N27FWs0Gt68eVB7K9poiw81Fv+tVufkf3v1+RfOtbufJXAFywSMMQY+q3aE+3IABH8aIakXFTVZwXYUDzkiddAJAZU6JxKCklDixquQgCxBCiB+GyMSsiMBGZG6ZqwVYTh7BBR1qOK2zWcl9XCPb1ifJ2ge61OrzdD7i6X4EZVVY2NKR1L9RXG9n1ifr++C2MOdWDy3BrCt6SQ7e/819hmLz6WzTYzhJM64Ym1lFDpZxvJvdb6BEA1NG8Yff74k03eJXc0jJde4lmiL+mEF//09sJWLVhNUIophyCo4fTMDCRoa+Y1R1DZHbXol9cpUgphRC9IkSAYRggoJk6Xm9ZlvlyAYNAoSxZRN18GkNi4nme3Z2TxjjuxsvlspSZEJGYAQ2gZs4CMoc04Ol0EikUYkjMSMslz8uSUhpSCm0CREiAdSwKADFFEZmmGQhjCByCW4JsWWIIyGy+P0fgMyRxG4SpL6/6sJSATKUUBYQYYwWnmyHBfj8SMCM7vs/fDw7cm+fZnb+uqgZmTxrfzP+AgBAxxeCuYe+/CDENw/F4eHl5CTHs93sAOJ/Pd3d3rlwz8zfffHO5XGKMX758OZ2fc15UTTTHGABsWZZSFiLigA61WObFqdClBuSg24SXZWEmJx7lBnNwtLGfgH4qiWRVK6WYBX+SbsZCAyYyVSlgqoycxv00L+fLPAw74qQgBmKgCOgdTFsH9ZUX31i5Rsn30TpiLtkAOATti9hq7lJr+x6NjtfqtKuLxv8ZyCtIKzkwm5ZlPp3PyJHTcECgwDyOQxqQMTYZG9uA9WqS1MnL7XzRdbjj3wORgLsCU7S2tFSnP8AKvvSKgEZe1Vpf9VGfJqnV8oUg7Ye4S1IkX6bz6fT85csLQIpxN+53+30Yd8Tslapq2cybfMWOFECkVJ8Z8939/d3Dw/sp8C4Qvz/+bo+IuA9oIX36eBfbDgI2lRS7jRcbG7gZkLAN09qxuC7S6iaMrNYfzbd43cBbC6nrRUrPwLxGFK/FECiQABmxNVcrM0MnLWKNxLa6AIst3gVaEi5sQRFSm1l05p+fNDHGrVKFiERQxFN5sPMMW/h7+xhAQ7VW0HSbiDWifIfvpJT2u72pPT09/+t/+9f7h4c//vGP07wsy/zly5fPnz8fD8c0jCJFzQAJ2V8YUTEEUoVcBBEZwcymvCgocvCZnoe3uqLAqoCqBgFN3GCDbkUmQ8ylZE+wNUIwBja02iR3dd/MaV6MHWakqIokBOReBKzWG1cIFA01FwNQsbwsqgbEAlBUC5RipVgxVTAri0opyzKLSin5cjmLaEo8BI5gXiJwCERUV5o85Z4JAyGz/wG0jWgiEsNJ9HmRc1GIA3FUJI4SkoRxWk4lz9PTly/H3W5ZlnqEGjgJi0Oo3a/7K4gae1SvpgJbZlObLbshEK57NGxWo3UTr4r10PfXMMbD8UDMBnZ+OeWcX04nL4m+/fbb4/EAVwgGXFNr8JWuWzejyawZ5aDCTr2GrLlAZmDGqxdpYylzubR5PdqeMRrSeZIvT8uXl3zc7xBwOs3Pj+fpktWAARCBGTi2SgK8eGB8NQjamJrXxKSKoqmGuH4VY+9jCAnY6nYtIgLqGkZWZ/Wm1SoILhZ5QwIASAakZuIzFMRcipQSAg0pEUGf4r8/fgsdta1o4G1L/Hp9+3oxfiUugAE6JRZI6yitxrPW/dv21f0rtQztK7S+36iwgoUghJBCkFL8UNRtx05IQJ2XZ2aqm4mQXTUPG+MKKICoVpYxhUpk0LpuiOjno/MRXCPGrT64pf/7n6u77mu/o9ZubqIAFNL++Ps//vOnf/jHNB6KYVYRZQU3HZtUrHB7xuYog6pVLkXqHi75Ca6V/dAyY1WtqLSc+ramWjPpyEPYATzLHpGIAoQY5ukiiIEDVYYEeTa9H0aqQggdTGOAjEyICu38IwBDNVVARbaWU2iGbUUBOjefmA0NgdBAoagVDGwKfh8FQ6UgBmomHJkDp71xUdXgUwIyAiUTEFVlh3a684zMAElL/XUoGoA41IMNU4oIkEUEVE1AgLlSJRjZCEq7pRJxzRY1swr8kNZ8YVWEmatBVs3AlADZfx8EvAu7g0w/VRnUKyR13nFtHLEfQN2u2mYWsDEkioj/puCac33lErgOrrAqjpMvCCMgE9dThDml5JEG1RBXMS2KVsFN0LZzwIyJ1FzNMDAQsWlalmUJcQ7Mw5CGYYghWLEiZV4kEKYUUozEFENo0QvKIbgFuzbbgf0Ko6qTuJ/OKt+j8YxuUMI32Mqblf9tWQgbesBGcK+8q4ZF31DPzQyhLjLX2DDrK8Hvj9/IcVad9HjzvoJXBHl4yz78WjLe7FDilf7b6jD874EXd76MVp7A1/To9f9v4jqu/+1GFP7a67DO/31cK6Zm5i7FlBIR1UUHIgJWIAXQUnprwMxuMvVzlluIDBGZWi6yLMsyzwZwOBwB+DLNBkvdPiNFopgSIOZcLudzGI2IduPoEVuIOAzD/d1dzmVe5mVZDvvD3d3dNE0555xzCKHeXtqL5+JpNT43KLA/z5QitDAD/3NH7ibmeZ7naRaRcRyJSLKICjPHGP2Z5iVDAsIqrS68+M/bbzL+tul+4WEYOqi3e3WpPUIIbv6tH6AiUjVfb5Pd4etoiPv7e0cqu+K8LItHsvv3dSrxf/yP//S3H/56Pp/meX56emLmJS+73egMZVeB94f9ZZocUpFzTimVIkTou4ApxWm+QFsx6U+4lOKvainZfxB/Tfzpicj5fJ6XOYVBihQrJS8IcHRutZmohhDncnEBtG8ZN0D9ejHi9Ru17Sa6kTn7doqvgapqdRBt3GU3icO3XwqAibF5g5kYTHMu5/OFKI3Dc6AYQxTZq0EaAMl5mKAGvDIX3wLLIJihmHp9WRFL5jNg12OhDm+9afXzRLL4fDgFDc16bN2zh4QGVEs9tAr9YqZ4d9wd9vNlupzP0+UyP3758vQUY4opDSntdrs4pGqnqHZiXzD2AYj4mF/xPR7mXSB+f/x9f3ls94fw4cOn3//DH4bEBOoxse0kX7eCVnmpKTd1k8fWWe9q2K2R0VeVSZeJVll5i3tdrZj1u1RPEqJ7Ohwwr4iCBIhZVFTBWQFVFKPNV2xsVYStfaoTYq1SVtUpctL2L3yBpeVX9xVdT1Uj0C4bVldUOzugqeQuNqspejyZGwFqwEwr/R20//Ty/PT89MOPP3733XdPT0//+q//+sMPP9wdD3f394fD4enxSxGNsXpbvK/G2kRZkeJQoVIKUF0LAg8pKpmIiTiI+FNAEhRxR7IhGqon1ImzIcxYEAGUG3uwSXrUGZreB9e/Uav3cABkzzSr68OLKEDJYmqlSF6yv5qLWQHDgMiUJU/T5XI6LdN8OZ1KWfxYnecJwH737beopigECIwhhRQD+68WwAAoMIWATN5PN/K0+S9xznLKeTawEAAZDZlTGizOI06TqUhenh8f53n2cpKZiqhd8w3MKoIS6yRVbmrfLbypQZVga2DFjXRrgL1Rd79cC+dDJ5TtdvTwoID48vysKpfp8tMvv3gXOgwphECV4OyG9GakbdOOrcN9a2fCthjX9oWr5GpqVKkyW7rc+pkuLdT1QRAFWJROs/3yNH3/7cOB4ul0eXx8nualpsIrVEN4daXY9Z3gSiPe1PzYQF7Wrii/+4BfLfWqVQUw7LzVPoMH2Di2ATZQvG32GCAqQBZ1q7yBF5HFQxk7nPX9IPgNNdX1rr1d3H6bDvTm5nsbS3TjVLM33U6Art5st9253yVbjhu6jaVgM7GvLYLrW7rVj7Szgv1qb+SKq5+lT1AVEdC4bdsoNMZNn10BNFNIs96r1B2OFT1sKiZuSLKWGabV+5zG/cM333789vu4OwhQEYcUqSqoYdHGc+ltvNWOxOqEVD2Ihqjbq/uLZCIqRVoIWPcgm0el+8zpxlnmyHjVGqBHTbFAJMX+QxshkQHVoZcryM7i66znqmOj7xf5jMkQXfcv2UCQwXn3FAIhFANtDC2KTl0EM09hqcNzI5dSiQMa1iOUAbGoqVS8CG7iERCJWFWria+qqz7QIwoRKgLLDAQwAJF4H6emHttHVO3tqqamIiJFpZgptEzX9XjD7vETBHIHMMcx7u7kZVAV8A2ouhaja3/c3u/dv1hrQdsAKBC+FgTv/XwDQzXDE66aUUsFgLYdYipARDHGkNI0T9T22W1TlVHf98IWhohaf5t1BsEiYllK0VJkyTlwCMwxRiYkgKXkFIvLx+wBu2iopgQtaBZUrQMcN4bs1fB7I4XDr671vJl3tAYqaBW/2j2g4rSt1mCdk769jNaR0rtC/Jt5+OKjK5v93UXXgBftWyPX8u7NZXh1Gt5AhK+3bf57ntXm6//7n7GKSl91N1+vZtqbUjm01qseMRzCMAxpGNpVY4oGSB5D10A5yG3X0F/JdlKhmboLFQymafLEsxCCARLROA7EmJc8L7P/uQumRbSo6DI3cHl9HZa87Ha7EEORUnIuUnyN0+0rdcqFNM/z+Xwex9F1YS9LnUVoamoasGqyrro6Y2eZl8vl4p9CgUTkcrnEEJGw679EpKZFik7af+QlL4REXF20p5fzbtghkpQiIh550jFE26g6vwt1KLDUmGsTKSHQ8Xi8XM7LMrvs6x/jL5Fro3VuBwAApRRX58/n0243fnj4EEJ4eXm+XC4ppfP57Ap7lVZLRiKujKxuLKsMSCJUrWTkLnNDD12oYdTiArE/B0dbpBRb/oF6kyFFRIqB7vcDMoUYI+EyY+sG3PX76s3d7vn9D/pb63w+q2qMoQvu8NbldLMGatdhLKqmWmroOhAxm6GpSpGcS17ynPM0zxRCiImIkRWJDNDUVJGJcKMRb0N6EFGr06EmZtT6QgG5Tu+xRjhVncTXcQQEfO+4/a3np2uFpLllrEKfsKI8QcCIMO1HjiHtxpLzPC2qNs/T5XL+/OVzDDGltNvvd8MwpIFjMKIiRdwkj7Yykt8f7wLx++Pv9dgN8Q+/e/jnf/nnh0/fniZBVFj7EwU/Z90uZa1zbcDDmsPeAee1Jvd2BbZ4tjeDFLpG3HEStekxv4tvYa6wQha9wwMqLhD3lruN/mwr2mGTjqyfIn3bvT+1vhpJIYRpmlSFKFaicEUcNCpW3Z9EQEXroTK+zFpbCCTw+JuqwPmQ2vXlVgCFGEYbp2Vecvnzn/704eHh4eHhr3/969PT49/+9rf/7b/8l0+fPj0/PbXwHq8D/B5OoM6HdQqFFTcaEzKyFgFVVctSuHAsxeGMpQhaQQIgBSQjykvOJYtWNxwRCRQDIiRA8AKLVrXE1BTFiJQNXXRk0VDEkEzNvWEiWpYspvNSzFBESikKakSzqoDtD/sUU5Zyejn//NNPp+fn56cvoHo8Ho+HvUoJIRzGEVREqiwYYkgpMvoQAAAQI1Ng1yXXYQOimRax8zyf50UQgdhffeZgCeIwhpSQuIicXl6KiFk9QVt+vauvAH1r03oODBlqXzRvEVJbbuA1iRjwRqxaN++uHBgAAMyMyMe7e88muFwuyzK/PL+48PHw8HA4HEIazMf7ClcG5q1c1URga5Vxv8RqUw7rPuy6NL/SfSv/tBPI1bnWBgYoipdFf/58mhfjh/j8/PmXL4/zMhMTIRqhLiDatQPr0XdoN/0J9ECvvum0sli2EUstLMX1pJ4231/7dt+h7YYtNIiWL6gjESCKaK60tcoy8+CL6rYyfdeH/5+pI7/yOjWWJzYjHq5Kcb+gGmX4zdS7zU59O458JcFVRd+s79drcx/rK2vYOuH8Wsu9RgWoB45VBosPVnVr268yWncNV18aNFeaqIq2E6V7sK1uxFBMh4eHb777/Xi8VwpFoag3F5VZvA2F0crowY6C2eaJOxbA/KgkQlfHXwmI6Jbhlj8OfuO7SjkArMPgRshrhpZm+wVfO6H1t4mAbNSCdOqd0BAEmtcYgdC4IkU055yLzMgYY+IxooOWxJOFqn4dCLX6ZgjJIgNozrkA4TBiSkGqqOfxQ1pUiAK6CFkpFwpYx5E1pwaM0Ai9+jInO3mUEoIhgRKoVgVfDbmWa+oecOdNSllMBdoZub6pcE3sa1EOYAAYx3D8sDwfdL5AEW5D324WesXftiqbIlZ4RztQmhf+dbG3Cvn4eg0dtpGuzkup8IoYYxzStMzrAs1GBOsb+CZirfKsGnyLL/ZFFDBYihRRpBxcd2YiwhSjGgZSMYjBd5ZaCYREBIToPymvocPQzYzb09z1kfVt/BXEzddK4tc63Wa8enVTwDYSXQNx24jg/TT7TUnE17OHfp9seQ83B9iK+LW3jrxrYuAmjsUHHyvYj3716DRTtG2ztRonbtD80E+BTe1Mr8TiG8yX/XsDYATEYdjtdvuYkgE6T2eTAlvBP9uT5fpV9aEgA2DOJedSRAhJFXLOxOC2XANYSvZ4t5gSEoUYtEAuBQmZmAMD1aC5EAMzxxQAzOnAAEDs/ZSKSggh51ykqGmgEFO8TBcF3Q97RCxSSi7u3vAZn4FFijHGnPOSFzUNIXDgkouoMHAKCQGXklVL4kRMJZdZ5hDCOI4ceD7PzBxTRMIi5TydCYiJpQGI3SnsormrtF4e9z/sf+JA4TAMABpjVB3maTazEBhxmOfJm2ORIiLDMPRvgejcAJznebcf94e9lwY5ZzNz03GMkZlVjZlNbRiSUyxcX3b7sL+pishNaGH/5Zpt03UtBC1FTLVtJgFxMANRMd+9Qpzn+TxNahZjSIHpzKK5Nxk378q+JFbjBDehMqp6uVzM1M3svZJ5Q19+1QDe1nVqRS3n4osDAKAKPte8TFO8XIZh5BCGYYypJwK3DF/VLhD7d+8asZkBtf1KNVAjMy2yyNLaNVLRWlBZvZxqEiERp8DKzHVvSMFUndu1RmzAFtnvgHzEOA5hGMx0uCzFKSHzsszLPM/zZbq8nIaYxjSO+10YB98UpuYDamXt++NdIH5//J0eHx4O/6///I//y3/+jwrhX//2mVAQBKtCJN7sNe7ZZgLmt0ttc9q+0+7Y89uzf2Wr9aKiugFtG3htqoqN3XPVb9sqgfmwS5FFZq1FgG1KKGeMNhPRpsDeNt52VZRXlJL7fHxDhDm1FWBAxEo3sjXf+uqLQOsCq5CNHRpWF+7reUCbog448G7cqZ5/+uGH/99u97vf/e7h4eGnn3768vgIAN99991f/vxnFem4VgSyBu8AIMM6OFxKnpeso9IQwSBAzXH1uzHUnHgmEDQz9Z0SWvIiRQypbuuTApoVZAmeciAtBV5ry1GXOgORqm/0MyFKsYDMxCBWRJeci4gSAbGCKhpHHnaDFblM024c7+6OOS95Xs7n05fHz0+Pj5FoiBHGYQjh/u7+w93dskyXi9bfDRMixhB8YxSQgN2n7eK1Cy9mpsY4ZXm5nKb5UiPOAcjVb+M0DMO4O4cXUZvnycXgwFFUmJyMtDqAqYYeWxd78VXs7G3R+Xpl7lWW9OsBMiKYkZnGFO/v7s1BGSKl5KenZ/8lmln4EKlFNtUN904q3JB3N3GC9Sn0vkK3wb6vVpBwjQDpLjjvFxy8iAIwZ/n8+Px8XoDi4/Ppl89P07wwVSXXADstporSQHVTuZnrK33VevaDLxi19K3Kp9kAHqHz4xQx1CKvkzffXFFs6wf+UjEHRBTJbhXxn9dX9hzxrDfelffHb0P8fZXi+JU+E2Drxu2LK4Q9s9J6aBa84czaNrrY4qQryK9i3NFzOLruo5t2HvrFduXwwk3uaUurU9seYdaZvP2cbOMYtwCvvFNwLdXakVS1102YtUeZaX8B3GJVFwjUxt348OnTwzffKsUsWBAaqwZVTdr9t0KEq162Nla9Y6uIQ/cu1wA/dGmUmLWY0y3qHBe3d9H6i6o+2coBaTZnV70VDZQQ2/IksvOLodpwEcmQkAmRzXTV0czAhLCyOPzAARVgM9QsGQoQBWjrKggCkm2aOIXQgIGK5l86ISw558tkAIH3gUalKECmuCylDgmSv7mo4iwcUABGvi8hhQjQ1MSU0DQSE6Efz35eiNvKpY6msZm0VVQai6KoFFOtKFFPGWwyrvvFyccGTkNGAI68u8PdQykFi7ABgSGh+3i2EHxYN7LsRgntp0k9mpoFbOtj6vMV60s4DdxyhZ2wdceEAscUXWrZjAfXHbXVF9lJxwqIqGRMZL1yJPJ3jBQVK8tSkDAE3u0AiTPIUiQEjpEDIxHFqI4qDl7a1jUgaE+/Hq+OCq0hHET4yiO2wouhgtX658I1buJWO8D+S7erwtX/vM6h3h+/2Yd6mlpLuLY2+O5vhgp6x3Vo8lpn7Z+yOeOgotvXDqt3S31G/5XJZ/1w3CKzYRPa/Lqe2qjbNecLvpr9/LZ9GIGurZYUQtjt98NuzxzEFD1htG82qJpB49KiO1ib/7ozeijENM/z+XJRtZRG3x9dlgwkHAITMfO4212mqZSieQkhUOCAWCq1DTwUzpfS5mWOITIzB14uS7YcY0wpqeo0TUXLYX9IYwoazCyX3E869nW2gtM0XaaLa7uGJiqkFDDEIeqk7koOFEIMBoaEbg22YlJKDbdEK1Kqc9lUVJARqfpz1XSapxSS64Yu0Q7DYGbLskBLx5mmKaXkr0YpZRgGN7LsduO4G+e5KqHMjAjuMm5U4igiAMa8A7Ccl5QSAOecPb9OisQYdrvR3ySPj4+Hw+F8Pvs2X87zOOxLKbvdvpSccyainEsIg6oyo59svjzkdi4AWJbFbcNIpCKmPofWnCXnAgBIApC9HShFXcImwJSiSj6dzpdpAsCYUoxRy9zHqOBNTZMPrNH2NwPv6jESkWmaiCnGeDPhu1pl+3fZLYCAKFrmec7Lsj8eqq24yDRNLy8viBxjDDHudvuxes/RTyc3R5teCcR+7Xul4UeJkxlB1Yos03Q6naqOT+TvIkZCxJJzWQqoxhBiiuO4S8OQhhSGWG03Pr4GAKqbxdZMO+TsRrNSioJffWkfEqpVJ4LoMs8vT8/Pj4/PX55MdBiH/d3xcDwMu5HcuxMYjYHeBeJ3gfj98fd7/O6bD//b//pP++P4dJkDFSYBLNWVgNLqEuoFyIrmA9/MbHaP3qS+QbzqO4mtnbO3WgvcEttNHQDZ12ArYM/7OEby6HYDII9+qZCD/iVe5eqtNUr3e/b0MFuVqRijH5brzh/WxvAmbPomh2ENFO99DHqCarUAezB518gRcRwHL/x/+umncRy//fZbIvrl8+c//fnPf/j97z9++vT0+FhUSIAdq4oqntDHlT4EoNO8PL68HIbhMI4hBghsRVVERUspHr8WGEQFWsaBteQ0EVEzEVm0eDcXAscUY0xolnNxcHMdzZoiQCCWYqCglfpAiSMIgJ/ZMeE4Hh/uDGFeFjHZ7XcPHx6eH5/Op2cspZwu88tJloU5CIAhhBCGmPZxHMfh+29/t9vtmbGULKYbxYRqOk7LKe6OqbqijGBGz+eXp9PzUjIzBSYBAkNV5xgOu3F/SuMynQXd2I0phqXAUqYGE+wrnYjr6V5rToRb48/27L8RpF7rU72e6FtRnSjIzGjAKd3f3/tG9cvLS16Wl5eTqM7zoqoPdw8pJUYo7lFaDSP2Sn1erzVtHsWbjtSFmBu+N/Tldujxe1WNNYBidprmHz8//ss//f7xdHk6nZYiwNEvtBQhReY66rcuUZltcaq1tbYWgdeX+Nctw5U8g+4c7hZIfx+aO8JsA5TYbCHYVr4A8FU7M1MRHoZWyAoipJSIEMQA4V0i/q3KxPAq9GnDl6Dag6+HTgcqEW0yoW7aXLgyba3NOb4avfhmCRIGDhxCyUvnh/cUL/LavY40t9dv9y1v462q5Hp1aDYvrH/LUhSQmhHEiQAN07pBGoC7mtRp8JtJkphJ3YsxU0AcdvthtweOs2gx1CoqVvC3R3O6ditqtIoMng+pXSbuW6jV4VWXatvMB68NQQa+P+ufK9q5+nUMXTteceeX+u1KEYkZiSsiF2vWNoowGUUENNUMoIRApmiGUAiVKfgzRfOY8wmxjKOmmAhCoMDlQiagBZcJpynOc8yGUCJJCMwpKoeSFWc7gn2IYKUMZVIJwINhWowef/m8v78b0gAgkP38IUT0c7eoAgAjailoZoSKgJlBJgxjgKB1X0jRlGzxzkmAzaIoNVKOOWcKCYhI6m6EGZiooaGF2JaIfTZGBuKFUkEiGuj4rZ0vaotCrstFHQmxpYHBds4BN+dLi63bnoZrPdWneOt1U8mirXyyThzFOqlECMyBeCnZ46Q2+LKOBIdt6J2XDtjRwMxWhFAZyReGsHbWVkRfXk6X8yVyjClyoBA4MqYYQxZmjoFD4MCBEKIw1+BAICKPR/aN5ttq1tbD68o2hmibQI4b1/BWMu4T6DrQ6bcygIo2a2sB8A5q/H/AQQav0Pl9sx42Lpibt1v/Ej2oFInUqXfQ9y86LsY21+YmhfWVbnuzhtndlK3w02s99+rJrGtsb/2kN5b8mu+x6kRObMLD8bjbHQJHH3+5YgiAoqUUdZqeatuU32zc+9lJWF0yXx4fp2kahmEcBg+UXqSIWlkWr8xjjMfj0RkUeZpijERhSINDhLVoGlKM0VPslmVxMXo37gBgXmYR6TbrvOQ0JASc5snUYoouzk6XyXvSGKNP+QIHQipaRAQBd+POpJptHc5bSlnmxdScXJFVz6dzjJGYUkoqejld0piYGRQulwszBw4ppjznwCGF5MBff7Y9C645cJWZx3E0s9PpZGaOFfa/GsdRpLj5OOfiCrJjMVy0deDv8XjnUGAAYA4AkFJSlZiCmYno/X3lUQBAzrki8hGIKOfFO3FVjTECYAjBzFTFwNl7K5Xbn1vP5PU3kYiWLKpKhEIaGDgwAIg6RksNICCncVQp0zSdLuf9YRzHseTJVN9QbmH9jttNMqcnOwBkHIcO2cDNY533NOnjBoDWrxM1CMRqknOZ50XFWvAvlFxO5xMADcOYhmHc7Xb7fYiRmQCAiQzszdmML5OZWM6ZkZjIii2n88vT87TMosoppt04DAP5pJjYyX4ll+l8yTm/nF4eP38OyEMa9sfDMI7jfschECMS+faTEgpZi90BFe2Xr5ipFM95QKeBJ9rvdh8ePsg//H6apsvpcj6fC+jT6RnPL+jhDIFDSqExrN8f7wLx++Pv8Njv4oeHnYIwZKbiDuKrvNptSBYAAYptlzRxW7XYlT6znQm3Fleth4rcLOYb3BQVrX2o4i0aojOIDaCoiooZMOOKMqYuMROsKXPNdbUJndtw+Go34mZUMBuG8XS6hCghBmzwAbjGzEGLFmlwgyalIWw90lDDW3z+T4BqxgDSZQUiGlJKKZ3Op8+fP//jP/7jx08fz5fzn/705//0L//pD3/4w7IsT0+P7somRjUy7QY3ULQQQp7K6XK+LEcBCIHJAAnyklVEVJvs4CB+9LIQCJjZgMRKKbIsuZRFyyJZAnMMiThmyafzeZH87TffphQBYVlKjAEN5lzEgELiIcVhNAz5sqDqMO6O33yzvzsc7g6G9tOPP+Z53t/d3T08nJ+esJTp5TQ9v5yfHrVkMAsxhBhSjLs0HHeH3W487A4hRkDjy8XKQsSEzBRW645qi0wk8FR4FQVVomzydDm/XC4tswaxAUgQLYQYU4ox5Xk2UyJk5hAYCE5nlSJg6h6hlmrYQ5zo9iq4Drx6rQuj3f7J64CabZWPSB4OlVI6Ho9EREhPT0/zPNnpIkUAUBU+fvyYYkSityqYm2/XO3IwQ4/6236Al4Y3lhCvYVoSEYCimiE7ZoPE4LzkHz8/XQo8T/k0ZVHCEBQQFJiAmdCVqevtYd8HX43YLi9V5//mmVuLDa4GadhkqVSaZCVe2dViY1+yta7wAajWGgNbglAIgRBLKaoeYcGEaKjvR8Bvtal+zSC+XpNfUb0+RSBQX7UlQiKuJmL7d3PhNxPJdrtRl2MRCQjVgJEDd2HMtN9brAde4waVpG1Zss8cO4/iJsK+9SCEiKJapIgIEiIDedDHxtjvl5Q2Vdj30f2IuJqhunPZzIDETMAEoAAI+gFEtmrZROhrjmptwNYntBVk4S+IqjdOMUZAFCl1rRHJoIuQuB2k9elOKUU99QW0wgKImBmJrGgpJVBgXtGsVpHlTnsHBpe9gcjAiokyAYGRFNBCoBQicchgZgVBcvkC+gK2oCgXokKsxpKDTRGXYCUapBRNFoA5gSQK+93dhPS0LPNluR/Tt3f7faTT9LkoFQkCYTGW/BleHmFIaqgKBCnGfRjHcxEBYCIgChhMM6ONgbDk/HIqjzrcf8Ppbross5Q08IcPD/ug83x6OZXTjMp3GHfqYapNlXc/eI1erImEjtH02AIQdfN3RT0aggEuwHz4wONnmV5UZgFEEWTq9t/uC349B+3wyjezpxq0fy0RtYYZ1jJtk7vWAiO1NtJiqmYuZMgyQUMLb0ebm5loJ7T2oxh71SCgSkaqnpnOvDKxVTSXBZdMZIgYA+3GXYoxBI71P4FqYl4IzHVzN0Qk7MjL7Stim/zK7Z7va3/Z6zCxr1BdV2a19dL4/Ub/m35s8xtg5UFspNm33jCvEdhbo3F7d1aCmlkP8YYe+VINgdvn8VWWEkALQBHpBvet4fetT7av8JM6l3wD/feLvaMLzTDGtD/sPTVOwBdEABBEZZoXVWOOIcSe2eVRb+tyD1CIRADzkpdcYhqIQy7CDCGESIii0zRp33rxpDquh6xI9kUcQmJiAvLhnXjYNXIKybG8ec5SZDfu7o/3Oefn52cpEmNMIdXLXgwALpeLO3nHcSxU8pJBgYgCBzC4nC/DMKSY/JmAQVlKTac0qJbM9mQCByNbbCm5qCgTl1LykmOMPDITG7l+KiGENAxg5t/dLZ+n02kYhuPx6Hl3fnMrpRwOB89he3k5HQ67Zckist/vQgjzPF0u093dHRGXIiEEIs45n89nP7tdZBeRUihGdsl4v98B7MzsfD5/+PDhcrlcLhcALKUcD8fLZXKvNwAOw+ge4YocZA4x+GIlNMa0Qyq8iVMfwBn4d69rqMzDMHBgnRc1E5+Ez4AERDgt88vp5ZtPH2KIQxymeW5OYVtxgh6q+8rQ6vxmzxvc7Uaff28IfjfsQbDre/6r9z+KeH9DCFRTZitsD3Mul2l6fnkJMQZO47ijEAbiEIJvid0UqlfHihkbBjCZlp/+8sPf/vSnu8Pdh28+7R/u4n7kFImJRKVkf5qMFJgDBQdqn59e5tNlmZfHx8fy889ENO534243juPheBjSCEyCIFBlkaW5kn0a3ew7tTEU8NLWgGk8Hvb3d98AzGV5fPySl0XURMrldLEXcPn7/fEuEL8//m4liLMACTEQu5bZd/hukeybcbQ3st3r1JpGA3xdE1zFu8PVzbF1vNgAiNYze5oSWNcPfUnC1EwMci6qVhvUZtjdwCw8aWbdoDdDbgNAtZ4T3xoe600OhxB8XGm2GpqoWUW25df1crH3O+6ZwrZT340eLm4TMZjD7ZqTixmKSIxxnue//e1vh8Ph08dPP/3445/+/OePnz798MMPXx4fvaMPzMymoFglckET51Wd5vk0T1NexrAnRDe25L5Myh7s3rZviTkERXa6vprNi83LLDlDVkNV0qLn0zx9eX4+zRfk8N333+/G3bJkM/v2u++XOc+50DCMD/e7+wcCXs5TPk8hxYdvPu3uDrtxiBw+//zTl+dHLMtgev785WHYB4BpmXVZQBVMD7uDLvk4jofdbjeMD3f3wzhSCEwQh8FVbGYmrpIEglHlTgKYgqqH8ghhIXw+T59Pp5dlKYBa8wBXNmIIvN/vD8djWZYyX1RVii3LkoYhRip5eXp6HMYhxsTMIdT4XQd0Ir0x8n1NFXxTrn1TSr7JtFE1Jmb3QkTb74EIQ+DPnz/nnKdp/uWXX3zG/vHjx2FIHtd+XaobXEeou4bSv4WIdbPkm31F0564ehvr9e1r7sBu6TN6mcovT5fPj+eXS0EKKY2XPItpzqbiyjyZ4ZVGftNS9LDs3vLAmghW7yxV34A1QquxRLeJVT7XAVhxIFVck5pD0s3vAOCZP8syiRREF0pMTUoR1XeZ+Dd3ruEbYvHmPY/b0nkdUbZBA3Y+y+ZNuznDNhOVljZum4f32A2d0mjafSK67if0VFbbEos6VUgrZLWCI+oV0Fh1vepmdi14w75QM2qHGAIRVSyj45gc8lvtNiu3r3El6sQVAdBwnpfzNO1KsTgokvmeYCPjC9RYV1NZMzpbEVDvSK1L36yCqsfQEXH3NW8zvnrovKqoipkCElaKnsdf0xCD5rroiETEBISeM86mBIYqpEXni0kppSjZfj8OCGzCVhJIQADT6ZwnCxBGQCsySf75wwf69HGXjOSUX/72ePn8+HGkb+7jw4EOCRhYS9mlOCQeg4VAlMIPS/nxaZ6H8vHAv/8AD/t4mjkv8PRyKsU4jP/LYfjx5em8ZAgDxGCWKCyG4wtpCRF2R+BgArnMjHqMOA4SQl6mWYResj4vWUWNA2VMmvX8/Cns7sLuL6dTQSBOvflU0VKyLxkDWIMhgCmIWCkiYkVLjFEVCOu70hDFOA73w/FDmZ81n1yjJTAFo3Vw16omWM3CNwcKEXfPYlP+cZNnhUwB1LWoGtVgoOCRAFaPhqvVdcBhGB4+PMQh5lxawuLaANe4+PWz+tcAcJBRjSIEZ20SkpioKRNWLzfFvi2kqvOcp3khohh4iGmIvtfLY4pLYSYKHGIIIsZcqyr1JHZrW2cbI8KNQZgbwvJNaW/9MD++r3eTbbs7U23XCHAbjfD++I1pxDf/av8zo4GbyQ62KMhuH/56NWvX3/F2ebIehpsi+f/Yz6ytsNs0iQDg+4+AsN/vx93B4RKqfj8wx8EO4646AwhzzvM892fuZ0pgRgqINC/LPM8hBM9qE5e3u3GJyUrJJS8lVytxSlLK5TLlRVxwPB6PDmQQkd1uN6TB6t1jTimFEO7u7lzK9ClRCKHXosuyXC4XIjocDuM4uhHVhc76ZNqL6fLobrcDg5JL1XZTcnXV/2o37kRkWZZlWWKMgQMCLvMSY/RvmnNeluVwOOx2Oyni3yiGcDqdHCiRUuqZb8yclyxFYop3d3f+lZm5lLwsS4phv9+fTqdlycMwpDQ0Ej3O80xEbj1+eno+Hg99wcIMTqfzuEuqEmNwqMXhcHAEx+fPn90V/PJ0Wpay7lcRuYkYEdW0ZCzXDXhnKBO7ddf3K8TFZcRiBiqqoiHElEZ5elmWxXdhAUrOsB934ANLJCTiEHGe9XpJtP0usCsGvVDRprAPw+A9I8JX5nyb+NAtOnlz1SET+jQ0hlCQikhQM0I1AzICUBWHoozj+XK5pGHkEIkYTGqh+ZX7PyMlDhHpv/5//z//9l//dwb6D//5H3Z3x8JYEIoVVGIwYkJAkZIlM+hAqGgYw/7D/e7+zgBEJC95nuZS8pSXly/nH37+iZnjEMfDbtyPISZ/Ep6UpOL5d+QxCVSz8upiassTEACQgPH+wLIzEVNFNTSQGh7z/ngXiN8ffz+3lauHzMHMiTL+T22dNLn7F9eEcngF1LmiNEKv2du+aa9ur++em6Vdbe4pqzsgdrXEVNGD3sWKaIvFc+S6uQ7bE+xhTe/Y3rTXAO1t9YUrXp3MIMZYVEnlmoQINx6QV3EiXXQwaMlmKyKywt0BEM3drevuVa1dLpcLIh6Px8Px+Oc//3m3G493d+PnL3mZ1ahloXkTYyLCZJ4vepnm02W6zMvDbu92aGLmUB1lgEZETGz/f/b+5EmSJUnzxHgREVU18y22t2VmZWVVL7P0TGOwEoHw1+KOM04gAuEyOABEAKZngO6pmsqsXN57sflmZqoqIsyMA4uqqXvEq6zBJXsewigpM8LTw9zMXEVF+OOPfx/6xFUMMSqCAiGzGZRa5xIZybSiGFQDVROTKtM439099P1gqp7NawZdSmZAXbe7vLx89ZIAZV/GhyMSxqELKXGMJCLzdHj/YSYq9w/zcXx5eW1g5pm5IgjGCH2Ml8N+3+/6ruu6DomQnVSRXM9wtxutiWzeKm3T0OITQ0KUzW7H8WGaxyqKaEgAtCEYgKfVpa7r+26sWaWKaq01pYSGpZTb29s55xBi13WXl5c3Ny/Y/eMLQ/qzp+zPr6cnmIon37wyGc+Xk5r7WB2uzcxmoe97ABDR4/Ewz/M0TbZU269evYxelW6m5ZdT+2d8yt57fwaM++fcEABIURHctA4IqMCnuf7p7ceP98dpLjHFfuinmk1VBZZx3vOLsmfeEGz3D/xs6dM0/1WsagKbLiUAgKNECZqea4vzZZ3Fby0hNVvg3bYKYH7NlFJExD8/NRGp0zSuk25fHj+Dzaypspt7N6zxc09dTOfGxFmj9Q4loVsPTbdxPbrBHMCix6172MKbf6o2L/siLpXMelPaBLOubJVNMtVKul82MNvcf9SjGw0QfDBEyDx0bpm1gFbBuPaGuNi27OmUT0PrG2x0KMPVy6UAJjnXXKzVMyYb2XkJR9MqYrrkCSyuYYBtoORZig4hmJ6R6Js23nIIUANlDxyyFlfr8dvE1IyfiNZFyKtk1sYlPGZO2RRL1TxCnV8OodvH07F8fP+eSroc4lUoA2tHyggGOoOeBEvaZ8KpjKXcv4T4y13qTFXztK8F8OVFf3Xd7XdIWEqVLLYj20fYBaia3z/eH8wo0osQroeYAt0/njLEGLuhZ62FIL+5uXyz08PhUEGFZaR5KqPW8M3VTTF7yB8EQopdv8uoU8f1IuHlnszSPz7Ih7tbgcTdLu33Re1+nnAe+w4DmUyGfSAfsmklmULbU2S5ZhmMjJwtWEVqrvVif0GJFpYDKBkiAcbY7aEbMpJpJVxbIyuyefEkb3YZA0+pbReNoSEtcyRPthuvtM9BEHbeCdA2+PjFc2BruyKGyDvquy6XXKvkOddSay1VpE2X43kOfeH2Locxaxq3Na4RgpO+BMANx4pPvJqICmiKKqoGInOulWcOgbsUfeap67AocJXARIxESEQhEAIR+OBAu01o6yQtpCozWnMVl3BdeJpw4GLFQjU/T/NrM3liW95L9OQ/cRT58vj5Fm3P4SX/jDOdnTsouDXvwJMew5/7cfDc/rMx+nzSkf3/aQt/7jlW9UxTA8CU0m6/J2aFlkDiPGBspCRQqGpKSC6z+iTK5lUhEqnhnKuodf3AzKJiVUQ05zE4gxyJiHTZhR3C0HwGCU3BNdZVxHSzqrtWXQ7uum5NeHP8Qt/3tdZSisfBOSlijWjzPzcOxoJOdn6C4yxWZIF/23r88K0UnlpT/S2vT+hH31KLJ+n53cT/X8+sc+AvM8/z7DccXeqj9XncPVOlOoR3feXMPE3TMAxetvgb5EWxdeADIYpUqQxoa4YbeVJoCIjYdV0pBY2maWbmWopUcW9QStHMrJ6neF3pb+QpgBijgYUYiNDhBm0Aa+llqmnDLtdaRRxHj4gi6qIwEasZAXZdl3Ou0+TvcdO3g5WdvU4Pu/JeSkkphcAbEMoSF/ms/wf4Z7o7z1goPmy98P78J+ac53nOJeec5zyHFENgRP6krfKU6wIWifNxvHv/MRL/5q9/8+LmRgiL1aoqAmCSAP26N0BFBLRiggRmipGQGBEjYDCLOUv1yINappxzqVIOh8M4jSklDoFDQzV58oESkCEAyjKhi0BAsFi9QT06igkQyIODANgQNX251X8RiL88/uJdao9oZnQtzhCNFnjEmW8IGzwVtnlxOBOsNpBiv72u/eRnFMXtbXTd1FZgXhN0EABoDdRxadiQgNgIZen4GWHTsZc8PfuJ401zypghrPf9xd7SahQEAHE/7+nkKegrk/7P62ubDJHF3rGM1IO5W4vMFGl5JeglPhEzQEopLz3truvevn17e3t3dXX94uXh3Y9va60BAxO1UdLFUOZDlFOpp2k+TZOYESB4vzrG7EQuM5+3R2JAQgocggJqC0EiATMCFBXKZZy1VkOOHGNIpnA4Hu/vH8AsIBrS4eGxSynPmWNsdGlVRxap2XwgENGR5TROd/f58TGL2OnUhY4uoarPcpZSCyNalT6my93Fftj1XRdS8qTwABRCrLWKFBERVQq82JBaQJFzG6uqmGWwY9HbcXwsZVKrTApEyE1nbD54IMQUY9d1Nc9a/TAnpVZTrSqlltN4QuS+72stfT/0Q88hwIL/e+b6oY0PCLcZIE+Vz2f/12dO8wQMbG1+HNxosGQn+tzu4/F0mnKut7ccQpfifrfrUlyK51WWssWLd5ag2nDcMmv37FV9isGCs2v3nKxooOJQD6Rplt//6e27j3dTLn3f73e7h8OjOxM3PfIFIrnQJa2pAxvBDvCpzbjJV9Yu7bWD7wLUOhtAq8PDlg70c00clymBtb91xiGbp1ggu1gvpdZpmlS/CMQ/L4243Rg3/brPN3XOZdUKYkBH3yMQ+f0Zt5mI9iQ/ypbbe+tWeHaVNf99W4qtI+TABMLmeF16l4iIRlsTscc7LjlBtkIsCM8mzFVw81pIRMD0E6fKuqedl94Z343rcD8+y8VyQKU26U9NqomgAQGWJjgqGgKqL7XmHl5Nju5TJmrEic2t79yqAVP/N0ZEsBRCQABqJlILQEzREFSX8DoGaqnrSARsmAIzgpiszWAEDaBYJ6gz1jyY7BL+i29e9F1893Y8fX/bjfDt5eV3e91zDVbUpABaFyumMZ6OZsd5rlavUF7bIakRVb5BuroIXazBNMgsJZNKSCilA6jGj0V+++G2XO85ph1HSkPG4ff3Uw7pYs8DR6vV8vSSL6526X6E03TMQHHXEVc5lu/2vVT68XjIFfew++V1qtM9wXSV4vVuV6F/fzdphjC84GHoL65qPeUC17Hf9UkBWUfTgiqC5MglUEMzQwMQMFnkIEZkplBrnqe51Fq7PqVIQEveAxCTGsY4WNplDiAZG+/xSUiaenzpSjtZ6MRkREAtH2mRAHwIBxa9tC0aaiQQwDZs0mjIdkaYPtlGzbdFZkTVTs08CT3nPM/TXEqTrLXtoOdTqCktr6K17a1Z+f2HtA3DT1UAqMuZkAKSb4NWDKQKgVGVuQgHjrH0VWMIzJhCYDLva3ddIiReHFO+WUHbRJ9gms8HxUbVWCz7y1Jv6UN2DmPFp9wmxCdDeF9u+v9/JQ1/qgg/+6vvO7hqUn7QPOtU+HRL3DLt8TPPZvZJOx+fvp6zjvbE4/7PV4Thp2K88FxbGoQYdrsh9b3CedLMRyPNXOMVAHCnBQL6PKjHl7VzpJoW8TxtA4wxISEqqUItMs85GkQwMGAKTC6kSi0FCZk4hEhkec6uqDYuRK2n06mliSC6SLp+smtbtOs6lxRVtes6Zj6dTi6nulq6KtrNi4rIzK4jLypkAIB5nkut7VABIGqlVlrmFVYh2zVchzz4K5nnOXIMFBCxSkVDYqJAtVZRcUTFOI7ImGJS1ZprjNFP1KISYkhdnKbR9e6VINF13TRNrhTPeZ7z3KWUUqi1xJga5A3JhfgQ2EsSn9P1LIGLi4uu68ZxTKl/fHgUqeNpHKfJIz+ZSaQN8nrUXmAm5mrVz/MxxFoLcUAmqedQXO9cmoGoE6aw1qqmAYNfHmZAxDEm5lBySUxdN3RFcpVSSqO8P3cf2JKfam5Rd3UbWxoq/hMdO/tzDR80JQdZIJhplQptyBsbXU+r1DnP0+z/mcYQQ4whBjp34ld/wnn/QTQLGG7vHupcXrx89ctf/xUQZllE91aioa4/DxkAFIyIVNxahm3IGinGkKBxPGsp8zTP42keT6WUaZ6wMDGFEDhG4uXPHBfFRz2f3Ld/MzBa+8GwgN2MzAgohi+IiS8C8ZfHX1gdJk+t8SVv7VS6zGyvLpGzGwKW9JyWV3cGHbZx2m3awNrjfG6qXLXg9fYIgIqgq6SDi6xjYISGBMhAQdRExPyetQ4SrkwM2x5ryOXgp6A3XJhcmyPRUhnXWkPwTJjzuWU1fm6f55MzGW7dymhydrAAArLzEAzJQFafmI9IugDtDefD4TAMQ4zx/ccPX3/99TfffHN8fHz4+DEgYmjZbAZGzIjgBK5a5DhOtw+PX7963WYeCRk5hFByzjl3MRETh4DISAHaAA4BYkJCpn7Xg0gN0wHu5xMAag84xEQANdd5yqUr/TBE5uPDwwQ05ZJqpS4VFct1vjud7u7NrNsPsUsEOj08nD58jKIEGM36EGuts8osJUtVsxTiLONuGC53g/uHQwzmQrYBEzsEamu5dSsBgBGQqFU1MVDCWfX2lN8/jo9FZgS3DyOwajVYthwEMCcRdylG6qKZ3T8+nqaxamOnmZpYnabp8fFwcflIgYcQnnmHV6X4p6ZE2xWA8FO94mdXjoE1P7n5i2VceJoXFxchcIxBzKZpmnN+/+EDM71++eL6+jrFbiNyNQ8HEaoheL4PkQGIKjcUFH6KO3ymGm8ydtrbMEAAalgsw7non95+/P7t+6nk/eXNxcWe3zlMFJjYfQ2wyMGrJ/P8zIQb+XhFhLdSeFHFmrXTk5T8GliA508m9Vc1HpuU1f7Hs69cb0KHlvr3qIIaEzl80p2PeYF+fXn8HDazBVFqT00Zz7yM53v79uC+4h/QiFymQVnXFyIugYf2XO5ZFOaVEYqwIB430SFNUNNzXCssLmKEFXa/mVDRhbWyTRuyVRzWtmM3mXeFRTCtZGSkZT897zhooNTSepogRbTpr2jT6pr+28Z21DypVlqqHTL4yCOonF/4UoyYeULQJ10oL6tagwfB0GyDKfDTQ8lZRfq+9w+gqoFqwCAgAETI/jkGikRQRQzEQEENbLI6lfEWynFgfPXi5m9+8fV/8S9/meepk4fDFSR5/FevLn5zRUnrPJ3GosdKEDkOaSI45mmGOUZOWIbxY7LSU9hdXxWIPzw+fiz5dCrZDEIXurRXi0QV43vgH2D46tU3eRzvawLY9/ziI/HBQhjl2oiORQ+HTuOl1fsf3t893JdE8W++Gl7spzKJPkQKL4aaJ4l1/DZdVzmQ5h13nemH48N0N74avopdKTyTCmFAjr/86tXNrp9L/dP76WhZpCqEKmqiqObuI0BTFTNEUkINxESoaq6UOKWBCMFQQVXB0AQthRT6PYVe59F53LCc7uxs6LNtqKCIEBAGXPJ+zROHNrhU3UzhNMtsYzU+pSZ4aW92jrTzBS0qoIghpBiZ+GK3MzUnXc55nuZpztmxY05LA2vUe1UNgRd0mV+gbep5ibdaWifuayKvhfGMqFhyjYGoiM5lghEOxzGl2HWpS4lAGSEwlSopRmb2cp4XjnbbIJcfJiq4WCwWanlzZq9L/Rwhu6js6xfXmn+9cz0Zj/iyl/0MCzT4lFT2GQ13qw47YhiRGlLYjNag5SeH1Gc2x9VOfO79tM7Fc9bFM015nZPcYl62G9q5bGxy1FM0zSYvmdo06PolL/SAU9zt9xdXV8ZY/P6F5puXqpYqJmoA7GZHAloCOWutpVRESowilus8lzrPGRGraMCAyADVRzmlilQJIcQUA3E1qXlWtUgMhlLVsQmOkogxutT78PDgK9QBC4fDYRzH2O4GjcLkPtwlb01d7hQRfx7/MwCklNzHOs+ziKzybgOdIwGxqDETMTczlfPkOZiISKuYvKh0Pdq/UnIpqRhbO0grBg5VKzJSIEVFRApO6Dc1zZLHMg7DoKLH8Vi1Xuz3ROQMDRegQwi73Y6ZVQXAVEW1ijrzSjgQEeZcDazvU6l5xfi69cprXtdYY4wXF0qEpZSUYhrjnHPJuUohohAJkWmp2UspaOA+cSaq5ugeAgZGMmxJLS3/x9A8nvRcqPv5jghDCh1BGMdMF30XY39xkdXK4UEXdn7D+YOZmqwfZi3jNDriI6bkZYp7jmk7mPVcIrYFlofwNAUZ2/g2IQAxAdNc8iWol8OAoFgNRETmGcZTnMZdSsyMfYqMyCGuEye29ELWJUcAWsvDh7t+GF58/aamMJZZGABDRIy0WBbaDHd7RWIg6IE+Lfe4HWwRDcDLZkypj2m42EuZ8jxP05RLqaWcpklPRyRKKe2GIQ6M4K0CbJQl9XFqhNbNIu+q+hyUj6x9Yf99EYi/PP5jeJD7Op7MyKJ6JvY63opPzqELqvBsHl46vk911eVkaxv+o9fA5znTlsROn5xvV6fEamJBFAExBeCNTexTby9up4MXhKl9vhu/kZUXUlXAZSJ+jRnxPzxjzOPCGkakDWfDYDNp1bhFiw0SiMHM5xhtc3JaqIvqubo554fHh91u9+rVq4/v3qpIdSMZnrEbqsrEhnIYp7cfb3/19Xf760GkAEggTl1HiNM8dSl1wxCIvJ2HFJz5T4CERkSKKqVQL13XWRGsFQkjUwDQWrUUVOhTF4hDDFYlktZx+vjj9x8/vLNZymGiIoQ0PgSOzAz5eKRSu8CBKIbEgedaZqlZa78b0tDnnGEnl0O/C12KyXOENWBkFlUkIgrMspnKsVVs8SOPmFVEAThWeXv/8PF4eixVObAz+6t4DWoGtHjEU4gzRwX0uldE5rmuAF9y0ziRN+11QU5/RgLefHEdRPrn0Bs+k2vXsJqA7XIwa4deNrOUut3erkWI6PHxMed8e3traqr25s0bdxyvywoJ9TwKDGImZiJC2K6rZyL1s27HtlJvrXMkOOfRmylUIwI4zRmZr64ud/v9ahp2bx8uS3L9bdkntYVtOtzPW+t4Nqes78RDGnFrvHrGU3YeemMQO+C0tcZFRKogIBP7LyuG4MnI7Zj+zxjP/PL4n2RVvemC4CfBUJ+3eCxrGpGZGKDAtku4qXfX9JvzZvAEVrG2bZ4gHs02RIkWDvbU9uWk/cVL716OJ0/ahDTvmhqog+yZiNq0nq0Zmx5EBLbFndv5E1i7s7AZ5Vkivtd3g8SRQ0Qm8VxYj8QBNEMTNcVGJfbejj4hoW/cKU/2XKLW2sUGGG+m6YUK0zo8jd6IbBRE0VAQKzAhMimZoKohCGA1yKo637/r8SjTfR9kl3qGx8QvUaf9EP/6199S+Xj3u393HXKU2mFNQ+QYxhP9eFfsOL15c3nDRfG46/DlxRApBwRGHGW+PxzfjY/dd99cDMPbj4+3d+Pp/v5Xl/s+xI8z/nHk0+UvLF7NR5v0Ypr7oHzqbmaOj6f7+SjhIPxY//j4vptHOWXVdJq0/On4zdXr9KJ7BEmBQr+Ph/n4/u1xhH2gYKlUmzQLpas9Wyh6+P72eCfT1O8vXw3x24sLMpB53iMc8wl4DxjIwFRRC5hga7GxgIEpIrCZVClSq7UAAhFxTrTTQgysGhgH7nax38/z0YEiLX536ZJ8VoQUqaoBgB2igk8Mhmi2dd63hfO07yufug7N2UaLGiWmrIoUmrcuMgdOXQLEeVoe8zyOp1KraIO6OI4MN8yZje4KYkCNiIgAQA34hMDrWPGi5Tb/Gql6VJSVXOZ5JoS+izGEFIIa1CTBgxOa/CApRmJSUFx0hirVjxmtf6QOxD+/Rmwi+lnF+8Q0iudxGVUwtS+68M/28ed/s5/WPiuvSM/7IW5Ls7Mt9/M/8omE++nV9enl9ix36xPd+dyrhU0MwPOfuHnHa1Ldetjuum6333dDX82q1NYWXY68Kca12vL0STeBtrkKwGHoIkdEK6JuKA4hTNPkRV8IYRh2RNPhcPSDoopWg1orIQ39UEqZptH/VYyRiHLOx+NRRFJKV1dXOedtUI0Lu9sAG48yY+ZSiltuU0pOdWjfT+jwQMdWOJi473tEzDnXWkOMRBxCzLWoamKOMalpLRWkxpRiSlaL1JpV3d08TZMThHe7nZOILZrDMaZpcogEB57zDAB938cUvYObupS6VGo5nU5NzzUVVUA4jWMV2Q2DC9D+xsdx7PsOAGot0zS+evWqSsnF3cRxHEd3/q7JKIgYY1w//1Ux2O93/n4fHx8/fvy4u7me58l/j8AUmN3FdW6YATpn2cyIEIBCZHCcrqlbZHzPcESG/+qlCgVk94THRMxzLjyhmfZ91/XdNMVasjoe7EwINH+/rvivuraoLJPT1pTPf2qdtgboExkBfFzSCAFD6LpuGHr3oXudb4CKCgRqVmvOecp5LiXXknOeESmaLROWuJ7BFh+CKmCep3E8cWSKcaq5gC6iiIE04RuW6czVwOOlt2pBYiQyVEMifgLfUFXTioix62LfG4CKOJ57nudSyv3Dw3yYGBgIkCiEkIa+6ztixjNHlH2iiAgNTVG/ZMN8EYi/PP4jOH+gA/6sWYJRAdscIZghyjpvftZGDbb/QSQgMsVzRA/AhjSEZiQiS896DfB5WlwjrD7Craprtg7aeWuZVFXON8OFYoFneXbxQBssaLzF2LSqTM0iTUSI1ALi7Vw6xxTbZBCHJ3l0G3rsetbRT7S/BZdMCwFAnxIGmhyPTRT0IsXWU4Xjn8zs+++//+7bb29ubl6+enN6fKAQ/NP0kqCIOt+BiIvBKdf3t3dX+0s2ADMmiDEwoY4mpkvUD4YQKERHIYuh+EQo6FSrAPRDYrNpnIvIReqGEKeS6ziVcbIrjbFjZGTknrPJPM2n6YEVKAs76JgAQbUoiCAhh+iD1WJWJE8qnOLL6ytTvf/4sRv0qh92XTekbug7CkRMEQNAJaYQGCAyM9o5z8kZoVWkqs0iQiSIt4fTn97ffjicChERGzAJqBgziHM4DZSgiSkhqWEpOgzdX//mN7/73e9OpxMYMEOI5B+sqpYioqAKbVD6c4OcT3/jz/GjPyUQP4PH2TKgC8sRnppGBGoWEg5EgODciePxeDqNUqXkmTm8eHHjPq1FpwJVdb3a/yKrPdYA8MkFvG2QPK9GXOP1qxexVbbI2Hjf2A075Hh1fZW6vo3nIixxR4ugT0/1YMBPC4tGr1un8e2ppfPcsyE/PT9pxD8rcPC89NGzraT6XUhUWkd/ieCIISCCqKpICJ5U9OXxs9jMWvqHwoKDWLINz9wUeJoeiUudue5axE67ZucbtO4RkoBse4Tnm8ASu3EmOTRaqBk2CkpbTYszdyvygD2hB27D7lrfYyM86zlWqO213iVanGIuKROiTys2DMRi5XqOzick535LY3Yv2oG5iZIMlGNMXRdCPBbJWaoCraXD8nJwqeXVVGrdNn5ayivA2X/dunG07GOARP7xqdTGcGwyoog0BL0pYPCJWCOroIJUEHLJE6KSZtBaju++fhU42mUfLi44Ut3vKQQ2VQboA1uZx8ePYxbuw8M4//BQH/TFRJeH+wxw9+YC9syYT3XUi4uYSAHksU73Y/7jw+Pr774ddhfTQ3lUKTx8KMEmOhX8IH189UZJjIr0L+9tqJnVoo4VP4768ID5EGSuorsY0n6YJ7OSx4N8+PHh5tvr4WqgSIf7x3F87LtIFxcQ6eF4eDwec5H9Zfz1X389YYw/3nWP0wkev3vx6l/96uteQbMMNsyv98f//h8Ox9uUrgGTX2PZ1Ih1ATIZsnoEgorWqiJEUFVrNVx6a7pc+wLEaR/3L/J40DKCKp09tJ9RrEIILvcbOKliISRsfARruKJ/zU9W232HiNz4tm5A1roUhpvU41asQ7MZE1KMITAPXdKrSxWd5ul4PI7zdDgcSiler5suFnkAM0fHwNmWr9jmWs6xXWaqQLR9o+trbslI7gYQE63jKBMBI0UOXd+llGLgGEKMIQRWtcaccMwMGpgyERn7PDIiOvS8oc9c8/Kvt7uVt14RnmCu7NnBY6WTwxet+Ge0nT0TXj9/4Hz2DYh/1rLwZzoKW9S+wSdWSNyCbj8dpHsmfj07cC4S9j/x+p/8TZchzJiiZ5EpYUpdlerkX3ezQiMF67qZqxozxZgouZmYi1RRJ1G0uVUXZ1erL3MYhqERe0sBgLgGVmtLFvG16WyEdf6167raeGXq+XUissrHu91ORXPJJRdiYmJPEy1QYKHVEVEf+znPh8MhxhhjHIbBZWUmjiE689UMkAMtoa/GbdTINe7AXFUrVNAnvyBmjiG6i7nt+6aqWktlZr/NEpGoBA4OuyAkYnLO7zAMRFRKub396DxAW7DL/jL6fgDAnHPXpWEYTqfT6XRyIIaL4yKChF238xfgiXb+/w7D4HZsd1UPw+A8jcvLSzOLMR4O7Pbq0/GY52yOTGQ2MyaOfQQE/6zWNjeCMdFspqaITIi1VP/AtLGqzQnIfdf0d2ZC6Kd5MtPInFI8nQ4+LmZatVnAmxruznGX4P2V/HP8QMvg8vOeny+vRapAAwgx9sPQnC7MTZlAMzUEzCWP03g6HVPXp9jlUkJIRLxkpOLWDUftrwQkFBgjA+g8T8ak4mIvERITK+g6Tn2276x6j7bYuTUbcH39oh4p5FB8RABiTswxpb1qrbXkQlk113me53kuuZgZh9D33TAMwzB0ux4jU8tvRTVgz6z90vj8IhB/efzFjyHOE3S0mT3RaRZWmzlIzc765zkJ7gxK3MZh/VS32Z5UxNuQn/Oxd3mWlhG0GpgNSRHEXyPRwo3/RC1a8k+aJ9I1Wn1+NPFJPR+6XIiLrQwgpFILIKQQcZnxgaeoClwGSfDTjjpuTB6r4feJLEiNlYngTu0zItkzQNXA7HA4HI7Hy/3+9evXf5xOi1rvUyRrckyDFBWFjw+Pr4+ni75jQlFVU2JysbuUzCEQhwbxZUZHMfhAh2kmFBVmpr5DNZznq/3w8vLy/e1HNjWp8zQFor7rh743M66FhAyrqTASWZtMauMiXs0gOiHStMZuuBqSgomolJqAYr/bpa5rs1wMhERrJDcRcwBtplRb3HEtE0mzaDaoqrPK+/uHx3Eai8yoZLkDIsWgoAGNzNV4UETvZIRIIZQ8VdHd7mK/vzyeRjfb1areRU+pE5FaRdWWqab/EWd0/Gcg2M6nhCcXZFtVPhqIpkQcAnRdt37/6XjKOT88HtK7d2Z2fX2VUlx0Knx+vG/sCYINnvinXvz6IW98Hk2JbdMFBqpmQP2w3+3g+vrSdDEebyoaaDNDvAlCWcPp8Pm9YNXINiNZ5gOMuGnjED2xga7rHTfy8MrgQlMTNXXNw8wLe/DBwKUnpO40Jg6IX0BXP5+tzBbeyjJ3YEiboDm15+2ARabRpsvYktq6OpuWIzaSon4qzSzd03OjE86XJ64sYDchgxosNmHcbIWrGXnVwvQJCmPJpnu23Ww6rKsx6wkF0s6uZPgU+ABPBAhbo2LP3HXkEDkkoFBzFREzBKT2MZmCISEY0WJmXCCUS3XRRv59a1uU341Gvxm3BFBtBA9iBkTVBQHgW4IBq0KeVTJIIZsS51kmnUWhRKwoD33cX+/C1S7u+m6/u3754iZ1fckVoCAQU8yzaAfEDBQUrCIpUoqhTGONyBdcM/7w7iPozc1lDBELymR0P2m5n68H0XDBu6Hq7rHq8fGQlaS/CLgjKsz9+/vjWAtQvw8JPtwN9/evoF70PHQ7Zr3oOpttPImcuLKGgi+vXk0wzmU+jPM4VaD4djY9ncZ5VLUUOwIcrGgedzh/czl0b15/86uvfvXNy/H2caxZLb+K8uudnMrjqYxzpWPFbGgULUYkYmSioEi1kf/MtBEZVaxWATBqjQQEIiOoioEj9TtIQy1TgiVcFIBcuD3DvM4tRk91VNVtDs9TkegzX1//ezPBcr4u/ahmZ+63qYqpHwqdjeHyNgbmQEwd9X3a74cqcnh8nOYp5zJOU6lqCiK+ugnxrPye+b9LVby+PIYnucQuKLhDTRWhMWyQKXibxOerdc65CBOEEFKMHl4UIjMzIlEFRmQyJSPyuTQgH9MxH09+orh5XpAP4biRa91DV8rNGTfhUc3wpdn5s3Lv2E9oJJ+byrKN6afta6tVf7sJbsbCnrTqn1ocngzcfE5Axs+qYM+PlD9xZrY/876f/DcTd33voSDiAeXIiMBMROw9qlqL+agEt+QY9+cSMUBz5kqtc6nTnEUsxODdrBACIMzz7DtRiEFENKuoEFKR4mUREoYYnOrb6MBdAoA85+PxGGMkphADGIgKERmc1TpEJCasuAamqWqpBQVTSjFFM6tSfZY1xGBgIkLs1Q8YWIgRBD2RJQTkEDwfbU3hM7NpmpytS0xSZc5zDNHfpoiM08jMMUUDK7W4PLqENrODLzxrjphqqaUWBubAIuKEYn+eWmvXpSKa85xSR0QidZ4nIlIVUYkxppSmabq6unKB24cy13OOK9deaMcYvT/tf/UQttZ0RLy8vPR/6yF+gcPpePScHicgu1Lvt0rHXKgqQDIzDowZTJRCQ8oRgQ92ACEgOD25S0lVx3FkppubS6s6jSMNAxHXKo8PD+4M9nobEfq+CyE6J9qN5FvTz/Y3/lMNH/hc5GOr+uA8XuMdi1Irh9CaorYkrKjMcx7HqR+mYSilFEnKbOsSN3uywtvuSoiB3FIQmD02wnSJefWg1Z9u+ayRTbDJWm/nSXVnocnq0fHEYGJiJubAAYJalJBi6rpaSi1VSi3TXOd8ejyEFCFxiCHG1HUdexeF6Utp9kUg/vL4Sz4a16EJlIv51rbKTfPibm4ca10NgKbnSaAlyg6fnBpU1fzWAbitSJ/+ocmzWwuEqiG2vzuByZAUsKoaLXSt58O3CNuSelPEmz0ZcFrkbVO1pxQ3NMPAPBuAqY88yCejuOeEU/JYI58XRlvprXAO6QGERlFdCUwLGcDfhrWUlDPkvuUCqN5+vFXRq5ub2/vbh/t7JCRqodY+IyLoCEZDtXcPDxfv3v3yqzehT6RWK8YYY4ol5znPHAJzEKnIy923MWsRAN1WaaDMuBsSgw1d1DevTQvFFJhqKafTiZAuh52Z7WK/72mgeLh/MK2eqK2qCECMiFRFqgIRBSSQ+ubFi5vXLw+Hwx9//4f58dADXXR9DLHveopRPOklsqgYKDBgIMbgv+WGXlBTEamSi0xFCuPDNL67v//7P/zxvlgBfJxmGefIc0LukIktRKLESASIgQgBlTkOu1zy4Tjiu/cGEGJQVVr6H13X7Xb7cZrNMRzIZm2AaCuv/BRf+M8efj8FyS2rj1bzowfb+LGAkFNMzBz8OAIwj1Oe84f3H6ZxPp3Gr7563XWdt1uJfExWzWhVzJBwsUetUbz2pIO9PLbIB0dFrsldrvwIY1UYdvvry/2bVy8fHw8ipeUgIaxT4asPcV2Uaurpl9sErefS3jrG7N5LMLU2+rScwzbou5+olsxMpIrUhSFhABZjIOJVIAYAFZ9NxMDxSe305fE/6e0MN4zv5V4qIrSFIy3mvM+UvrYkHC6XnLNItw3I1UhoZ+zuqnduZsBh7chQQ+G5/Cr2BAaxwCueuuFdFWt1uv9RnwHE0TuoS+jbWUpwFa/x7WxDmtyO/dpTQ/GmpLENiBKQQ+oHil1Vq9r064042FirSKimRewZnL09P50NpESkZira+OZ4ps2ufFgVCSGsvwszI1QsiqVSrR2fEs8xVIEC3ZQPB63IxKmT/Rt9+RJfXPQRMBF98/rNRT/UUnPO8zQDhP3FG05z39WU6EW84J6vyzAJRw5Q5l2yi46Eh8Ptx7v7Y7d/gxY+5nGiEPbf3I27x7dGmGroK+4l0alEJB76mzxrmZUULnq+6S9Suh7f3h/eff8Cp9+8CS8uY0yaUQBYsnZ7ggeeHqbB+n/zr/6rP93/6YePP94d7m9vrY/pI2Mp80VnN0MfYq8c7+/uP354z2n/8ubq+mr/6mIYUpzBJE91PPQ6//rCrgZ6OE6Po7w/1FPVHPv7uVZjUa4Yaujr8DKkBJDaRa7mmU7ts0VwU5wSFwPiwGlP3UU9PEQyWKTbZajsvFVgO921X7GBZ+g+ucwWh/1201y6Jss58xnU21cSnRGNuNzYSxFj4mXhyLI7Nat0YOrSQMw315fe4n14eDyN8+k0nk5jKVVEtNalcdPOqYZLlBfiEpyzna05t45UEUARUbTJx8xM7p7w4SkzFSnVIFfmHHiKKURPdSeKIQSm6H4tZ/YTEnl4u5EZkfnM3HkIry1f75wvqR4bUAzhauhvQPEvEvHPSB8+d/4QPyOhPpdTt4UM2rnTgvApXu9cAZp9brZLt+CkZ5F4ANsZ8+eWoCWJFPBz9OSli/9PXaa6Gi0BkDD13fXNzW6/B6RSK5jVWha2EqqKs0xd41q2YiRCN8kuLCVChHEcx1yIQ5d6QkxdUtU857nMiMjEvspc/jOz0+lkZqlLRESByKhKRULRBqkwtNN04sz7i73zGaZ5qlJDCMNuEBVRGecxhOBia6ml0ScI/YOMKXoMnZrGGPuhH8dxLnOEGGNEwnmeUZCYAFhUzdQtnP6v3NFZaym1EmDfRWYCgjnPBubKdSmlztVhwSJSS3UHdOyiqgIBELjHmbgFwakpGnpIXdXKxhwIIMzz7J9zrVWkOq3i8fFht9ubqWhVFQck5pzb2JBq13VrpJubjv3jRUT3FLvO6xeP693MfHl5WWt72QCw3+2Oh+PpdHLshr99TwtcrjpVFamSh75IzbWYAQcOkcE0xhhjUBMfkEpdurjYpxQBbJ5nM53nK0SrJTNRjPHq8mqeRgAIjH6Hj5G7LhHxtnryA+HaFv9MOtGfs8E+SzX3oMU19C913RL4u3gR1Gop0zTPcy4553nOMccYAXirU5+9d6pmWhGVbM5zqeVFDHOtbZ7FzEyqKBmb2TMPwZoFYMv57bNl7DKid57TMzMUbZ8IMxBTigx9b20wXErNcy7zPM85l7mWWc18UXuPx1kuf/VlG/giEH95/AXPIGtKHW4Y5ABoi7VxayqGMycNbD3BI9hPpGO0kLkV9/5MzT2j3D2NytD0ydfNEKj1q/00bSC2em9X9ABtOML4DGO6jlo8xVCC20A2sIiV3gNMHAOLmIowheepRM1ZbbAJe1hMVUvdgYDcyPZqSAtwHc/mFZ/HMEJbjZe4TInA8prH0wnMui5dXF7e3t+BKrc5SwAzHyRpHyrqcZrffvxws9/tExsHj07yAUURrVWq1KBKKqiiSGDkp0gCSDHGFHIpYDbEwAallOvL/VReFDUMgQO7YFeqmFqKqYudljoS5Ub4MFMj38C8kxtTiJGZS8nDMAyxn+2Ic6EifRc74hBC6hOlYIRO4zdQBQNy6ZzJI87A1CMNxWrVXGoWnQ1vHx7/8MOPf/zxR017GAYFmHKdpCTkQoxksQtcGZgQKXAI1BFRSD3FdBrH449vnTrcjH5tfIZV1+wad5sKfhLs9hRCbc/Tn//HjMY4NWSzGa/WA0BQACQKHr11cXFRSz0ATeOYcxF5UNXUxeurq2HoFyFI1xrbNZZtypVrxM9iSbZ8cNwMECzlhoGePfAqFlO6vLq8uNydTkeTio0usQQdbG4UuD0B+aHhp85IT/7xGoFp4lbgzTSWnd2X649pIBvbdOlpM8nlJ466pcf6XcPtJ18QEz8niXg7uHf2xW9PtAbw5AC9/kv1ZpRzIc4jdE+aKGuDEJdYOThTsbejAEsbcgFKANJSdhueVdgV4NRWx6peg8EapXVWclcFeS09liStpjqbrg3L1Sy24SFtjSxPDGJPVXXHWxgFTt3AIVa3bSFuPuF2PsCzEVqf9c82nafN7bGN6QAi2xLU4slgS18KAnNr3aqpKQJomUknwGPfj5e7GklOlkedO5gh0L4PFxf2+tX+1VWPCvlUiWJHHQmOp9M4jTXnFLrLy1cst4FHMunIbnoeoqlZSkDYEwgTWurKi+u51EnDaQ5vp3DCtH/51YwX08ylqgTCPoRu4CtiQw5JpscPP3zYcfkv//N/8+rNL4n3/+H/9t/+XTntruDyOu53gFhkrqc8AXBIQwhsWTDjzcWbGoLy7re/Pz3OcoL9g14zw8VFoQiigMQqUKc8pIsoenj3ntNV4CjVAoeu620+yXT45s3ly47vDzpAzVJ51/1wP42TZoVJaSrhCEWZbHixzrii89pNYIGTMKKpCpogEHXc7ZSiQsVlqsUWc5D3NGixJZ65Y7g6yJ+xjPDZlbY4lZ4cAxfT+RMOTDP2IjT7fZsPMAQDRWQ40yudtgyGYClGihEQh66b5nw4nI6H0zhOx+NxmucVs+0NU2RCQ1tVKQJaFr+vouVesRmTX7EbHt6I2I6kqI2KZiZqqkVUM1VAYOK+71KKFSGGwIGJDAGYKEYgbDEghLpGAGxOrwqI1lDQ68r2Jado+NNO0y+Pn4dQjNvOo/3ECdOeG2TO63BNflmbi7Aw3wE+4ZLgTz0x/lkm8nmiRfXT1vuT6ZafegYE0/M8DjN1w9DveuIGbPGwDQ/39mQwMx+SA1UxA0cxCEqtskR1MTMCoHP0fb0QMwfOc7alSqq11lJDbJRhByMQUoviJCKmru+61OWSp3nqoCOklJKI5JzdGKuqVSoRxS5q0RWqkFJyLIbbUGKIagoGqgoIxNT+7Bm3ZiISQ3SCQaklcSImW/yba9jdYnpAJnZGE2FztjoQ2XU9UXE12b9Sa8WIIQSXsEEADGKIJZdKNXVp+67RqQyIRFhUxDu4AI6JCCGUUuZ5CoFVFBGcvTCO426/5xCc29tcwCEsY3wNpYh4lvXXN+VHLI+wW9VS57rvdjsXiAEg53w4HFaJ1kzcEitic56nOQNiiKnrO0CLKXJgqmTSzMv9MHAIfieVWsfTadj1ZlZy6VK6eXEDoKUUgrX9gNvIen8L/0R05E8dT9e1QJsFYracIVuCKYcUa60KihiWiO7zfllqKSW7pV2kPrv/+zOvcrwLPRR5OkzjeHTFhYHMzdVgqiZL/DJsrNDrj/PBzFUB37b8W5pG04d1OeKZ5xz5OUHRjNBUwYCJuhBT33VXFyYqpc7zVErJufilkktVVcSZiL/c/b8IxF8ef7l6GoCs3ZPQkNzXs54GkKyt/qY2Lbm4uNadtI4/PA3SxafTSdsw2+09aL07+hQHqad44kJibRGcRow+2Wqgahi8xsHzT7BtNi5+crixZ7koTzTeJR3ICwNVRTQiqhWmaRpo8Pd4jvTZRPCtrIlVC8Pm7VrGnA3chuzeGjdPLSRiAFBQH9FENFw7k65q+Q46jqePHz7cvHwxXOzmcURCRhKVIpWBza2bBFVhVnl/e3e9Gy771IV9sw0gxRhBQKSWWpOqqIIqoiCQOsIeLITQdV0ZJynFkGIKYAoQXr14cZzmAhBjrKqpT9TFecrzOM4iIOITx1UEzEKMoYsiKlWGi8uvv/12GPqay49//P18ON7O5fTwMADt+32ikEIMKXZ9B12sAY1A0Rb+kbsD1H/HskwhibtDRarawzi9vf34/ft3tw/3wjmphYuLjsL4OI4lKwAyUCWcWREMMYU4DNjFFGMXQgKgKdfA2HLawXw7q7Xe3z+qQp5LLRLYA81kUSJbz+NpDYxPYwk/n4W4PSJvDxJnjnZjfzq6WsDnTwF0KQm7Lr16+aoL8eH+/vbuzlTv7+8AbZ6mb775pu+7po0yPRvafcoaxo3Q+k/UGM0o4vYRREAiUFWQGLgfOmZSqYg+uuUZtIj2ZMxqOUrYRnWGsxXYVmeMw1ptAafYOqpcpXpHfRWBn4SMmT2rSxCQiTgwLa/EPQ5OWl35Wb6cA3OM6YuD+GesFsNPp9I9QTosF5KakjESMvFqDnYz8VlH3gBJfWZioVlsu6hNNcO2uS6RWaYt/LER6ZZxPG/5LefxRfHdnPgRdTVs+sa32KIW0pJXXBJYCQnJDDe+4yex8svOuhSi5wC7zWenqiHEbthxTLU6Oegc2tVUCFNTUG1uRx8DepaBCc+Ie23v9Kx5XrAZjVRsBoE5htAGIVrtoWSF6wGmd1xPJDXL6e7h8ZRp311eXF+9eDlcX/HVVaAKt+8PkMPLVzcvr19fX1y/ff/OzELg3c111vLwh+/rRRWR6XicZiOMIcYUdn3fIQQ1m3LtLndS4X3hHyf403RR+qsar+pJUn9tHdVaUYPm2nEYGKIWlfEf/8Pf/erbl//Zb37zzXe/KhnT3eEf/6//FwwgWIsaaBlP493pmGLfdYxoiYJk+d3/8PvS83e/+Nv/6t++mPN/9/Zhhqs3tcSaHjWJlfxwPFx23VcvXw79btLyw9sfCl8ghW9evX5xcaEl//4fxsfHO8sIRabH48OHj8jwzXXHN6nMFjkJ2Cnn/+5P/8MpH/PNX5P1pIyMqKZWm17s2b8ASARMFSBQDP0ldzuZR1BzTHsbJN0MmMBS6ntij2sZzzDfzy6D5chETyNo/LJ5ckBTVdgcuOCcRGBLPAagmaq4PmIKioTaDFO+BcYQ037Y9728uMlzvr2/e3h8PI2nUqqrz8whpQ5A5zzPc1FtCQLqJzTQNU9xczNpIjIAlqrsOe8ERIigLXDWR5kJAcCNy2bzNM8ppRQ5hegOPgIgwtTFwByDRzg0cbpFvmLrlSIYIdknHZ4n5o0vgImfnzS8/T0vyYmwlC6fylJrW3ALDm/DW7AcdDfP3kZZnl44S97DVhfGTUAlfjpL98kszrkb9FMY5X9CYtYVOQbUp7Tb75m51FpFkYCRsQ2Ymvf4mcM4jtM0Ny0MVu45pi7FkMywlDJNswtZtdRpnAqRd24ixxSTiJSpAICKZs0uSl5dXjlNuNbKxP3Qp5iIaRxHF3PdajqO4/39vTNtu12XSz4dTyUXImJiNzLHEAMFYfGVzcwmVkpR1RCDi7On44mQ+qFn5pzzOI4xxsDBZ4+AzHHtrrS6i9Y3XCZm5uJeUOYYo5DknC2Y25DdOJxiQkAVVVHCM2UCE6aYFNXZwSkkT8kDAwcoT+NERH3q+n4wMw9qWyEPvVMHmQMxIEzT5EyJFbnraXgOGk4pAcA4jiklvzxcaO66zi8Yf3chuFuZnFmhIioSY9ztdn6G9x/hSnQIQVVWz30pdZxO0zwTU9f13TD4YYaIzAcHg99yIzN5WB9zEBF3nc91Tin2fbfb7R4fH1UqAYj4gcvcAP6sqlp7/J988XwEpa1rbcMIOjOFkHQtiQhil6rKNM9dB0i0aRCSquU5j+M4TlNfyqfzoFuRN4SAAJHp+sX1x7vb4/FYS0EzLVUJFGGLj/i0Zlxdb7a0bzfR6LCBHnuClS7tWvdCgICBSGUwRDExVQQSRgYEBUYMfdjtrxnaZJ2Kioip5FL8wvjy+CIQf3n85R5qwLCxLeCTwwY+Yy1uAcXPlKUnWs3TyhxbDM4SXrVtQ9kSJdQa3cshB1uHCsXvUISAaApqwIb/jFOVrehVMzAQXIbtDden3wz7thl8WIAWAKC1CtMOEXOV8ziVl1JPih/E50h1fEoeXpqEq8WYwBQXK7ECMqCulm0iVHGxj9X08Xjodj0jxxhfvXr14ubm+HD4w+//4HkLRGwNEWgE8P2H24thQMaXV5eoyiCESIF8NKaYuNiPqgQtPVwB0IwCcwyS81TmXUwxkBntuoREY61zyUX05c3L65cvbz/evnv3Pmu9HHYQOFB3NQwxxn6321/sY0qlCDFfXV9H5nmc7n/88eHDR0aEqh2GmDgQA2HsIkY2IiSkFNjnjKoiYmAiIFCtUpfZIckl51zFrKo+ng6ncVK1lOLDNI/3d5cpdbsLUH68u5/m3HXRWFFRCU2hoAZRJImBDYMt+VUixdQQGojJ0yNylnGa5pK73c6EVNQHW9df6qpqgJ0vMlyTED+xVPzZM3ETTFs/xPOjpJ2REQyQmCMiI+PVVYihqjw8PJqIt9CZ+eXLFxcXF65YxcAtMuh5zYiL3/F5uPxnXmdrZWMTpExcC4hMoKBVzYyYfEgZGIHWVYWfDE5R030NnnxCK7/csRLq9GC3qoGCiYhohRYBj7YJo28RRku25Er3CMx96vwcI22MGlVVaoWVgqoKZowciL4U1T+nitrWZgRRk782v+JnTn9vFXwSp3PuhD4jGD0DMjzRnRdfu088oC9jU+cUebWJSB6ZQo6790jMTQm+6qftekZYvZnO8cV2kzCn0Ld+lJ0Ld2gQZWsF9OLpxNZAXZePtvhpM/c9Va16fi3Ol+CQuph65iguCYonX7N3gtRMRJZIrbOGvkb3fHpjWbuqqkpITGhEosoNZqcGEFMixFK1BbdSCIQdCZbS2XhJeslhlrCngJH2N7v9Vep764PaNB8Oyppurl9/8+bbmPo0DN1+XwlAJUjOQR+P97mkylCL5VwNJCHaWO4Pc4oppfQwT+/HUfvru9p9P/GP0iO9OBxrmSSwhZuboZT5/iFieX3d/fKrq30XqVz9+/F2iHy4ne7iHSINAxujGOaso6lVqcqGUFVhnhDT5eX+bpp+/PGHv/kv/4sXV6+Gf/EV2O7/+H/+r8Xw3f2hHm/5q93l1e7x9q7Mp1/suxhI5gKqQ4eJgRljSsVUTC4vLu9uD6e5fP/+4X7W/fX1+1P9/v3tzdWLC9MO5evern+9/x8+3v/d7e8hfYvhwhSEiwd3ejQMAIAIIioxREqJYt9fXN+MH+5BGzgCgUScJUXuqGJC1wV8pFtEvNJ9NpOxOq38YnBX2rrDLJeK+flkNRIgIDGKuN23Wel9IQGCiKAZBhPDBLwcHRuYEiyo+5StQewjU3cxXF7sROtpHEtxkGiIKe13O1V9eHx4//7j/cPj4+EwTTMH1xB4mab3XjuumF9VC4HNmk2yBR0jICgSIZohNrASnGPfaxWtMsIEgF3XdSnGEKpoDKHGsAT/oMdSMQGAIiozOcpsnVdwqZCIFjbZCt0Q+GIl/hnpw7AOZ7YoVAT7RNCF55VbO4Cdu+fbkOAnBzO3rXzSPf3UYYOf8RX/hED8zH4In4eSw2cFblhC1drsVwjDsIspAoD6PMkSw0JERAxA81wQS62CSCHQUqMaIseYYkwI6HyDw+NDSN3QDUBYRcfTaGC7YedDhIS0G3YKOo1TA/gOYeiHxkYA9NNvthw4pJgAoZY61SnGGEPc7/YrDLfDTqqAAgd2g22e8wRTSqmLnajUWn1CiIlrraamrFJFRZ2/Ski11FqroDDzXGcrGlPXDwOSjdOYc3ZXMgCUUkIIMaaUOq1ZqjhYAwEJyH9QFztAaCFviIg4jqPblciozhUUuq7b7/aeKua5dm6n9a/EECEhIMzTvN/vd7v9OI7TNKnaMAwAuNvtAHSap5yzp7cdDoe+77uuExGXnld50RVel4zXePYVKLHAjjsXl10mHnaDVFm/383Fu90uxlhrVRVnF7tb+dWrl1POBoDIMQT1+g69inODLbkn/fHhcRynly9f1irjOM3TBGYhMBE6/lhqWaE+Kz35mYq6HfbaeqKfpBlvL/5tatO6OvBJJ5VDIOZpnjmESLTOTtpiZailztM0T/M0T7uS/dpbX9uaPOw4o4o2XF5c31wTQMlz1/VVRf0cuACTPuH+be195rSl7W4OmyDEJVGVEYAYOCyDOn7WNEGDQOwc/SoiiGaKAIzEhQIyQYuTBWaOcUhdt9t92QS+CMRfHn9Zn1VTYxGA0G8WXlKCmm7iC2yxDWkrO70Y9hJ1Gct3K2zjQOAmc87F0QU+ZWsgjhewqqjKCEaoC00NVcGkRWwjILEhVRFQc7+zAaAjlB0dt+K6oOWkyTqTQU2VNdDFRQUItCAaVnTwOkvSYkache8tOCZUhQ1aa3lK3xsUGjoPcBEd3J/tlmFA1GYModZma7P71ryRSKG1zz3hwJVHFTOotX78+NHrh5znUstX337d73encf7w8eP93UOplRECEZh9mMb44V1lSMNwSSGi+dCknwZnqSo1hcDAoEqAPhiZVY05dKnmeT6cAsKQEglFNQiBEdGQTAPAEEPZ70q5Yuab6+v99T7E8Pr1Gw5caiWkm6vrkufT4QQ5V1E5TbFonSYKHCmw+9QjxX3Pu94CKQEgBvQqirxh4bKOApiimlWVXMssJZtkKYcpT3lCtKFLF8Mw1dNcSi2lR+ovLkvRY701rQMEZubAhgEpiJiwFWPBAJxCrAE0BkZCFalaiAFQRWaROuXjVK4umMTYY6aWACtthvvFxuSmCzfBbiOqzrlRuFxfALSMpy4Hd1u0LFjciACmiEBrF8PQwA++pEERKYQoYqIwjsdS6/F4fP/+vccu73aDGbZMnqU1/Ml+D2se4CcqNhpw8zauILnz23Ddik6nSUo9nWYDMgQKDZO4Ysrb2najAiz9Z3QR/QkBRjyACtHABEBMDRSQDKyqeEJIFyKfV42PEcPmpmTLR9tuFbzBSmxzUTzQAwCk1jzPftr7sgP8bLXi1Uz11BzxpI51EM/WN9HkYbcQSoMfPUUxPKuKFyLEspvqEpTnm5ipK2rEHEIgM1OxtbOxYJKepdWtNT2u/uRNP3KVeUWUREj1PE+zICAWrXdJb7RnoUfPTV5mG3ndzAw4JgqdAqm1eQZVUEB2+XudhfH2j/2ks2wrGfAS+rokT/ptVb0HaKIrotETVZgxgJLNbONlAjYZH6exjFpsP8SLZEmO+FjyUY5F5jq8fvWrXX+Z53qaTlc3l7thYGLRIsePEfOrq35IIZJBQg4ATLHrHg7jH/7wIwBdX9/sXuwLhh8ex9tw+YEvj90r3t1UzsfpYxC7MEARPTz8Z//pX3/31WXH5eH+7sc/fH94eHwo9ff/8I8pxJevX43zCQjHqTzei/WQAnbdcMFWSu1TJOjGseZp+vD+/b8wkFnuP3w83X3YR/zh4aMBvz8Svc+E4ebimvID1hpJd0RXQfPd97fzdPjhxy52KWCv8y9eXcVT2b/sIUa8LxYHHq4KHSQOFuM0Pebx/q+/e3lz3eGP/O8fjh9H1TCMUoiZiBQ9MAGJWUQwBNAoMUZOcXc13fdQxnZoWvGhbYLKO+reK22oXADw9E94ohBtoS/PF+DzUIdGbgGkrcLVrtXA9OLldQohz/M8TXnOamoVPWeJ/UUQxdgsuiEEIoyBA4fAMcbIgRWAidyk5hhgERHRcZw+3N79+Pbd+9u7d2/fTvMkFak9MSHxEqaIKzSDFl0Az4sMUP0YeYa3tv6Onxm8FWo6TTnnQkwEEEMc+j5EZqLAgRlU23AAoXFzG+uqIJMbOjbt33Us4MvjZ9nv3Np0fkoXtj/vQvgENQwGf4b68JNYCftc6NaCoNHPhs3Aakj8CQf0avFRsMChH4ZhN2Cbb0BiMrU1msztt84icJ+pw11ESq2iqmYgtSKSiHrdlLo+DR0ij9NkcQE4lOJPwoEZWKI46XWaJn/+GGKKqdY6TRMi7na7rutUdZ5mly9DCFeXV6fpJEXc1npxcZHn3FDFHCyZy9AcGBV9IDKEkFLKOddamTlw6LpumqbD4eC3L0Sc5zml1Pe9f6Q5Z0C/z6HrrfM811qRKCzDOYToCAgVMTB/hV3qSilVqveqzQwqiEjXdUqacy6lwZHdi+P3xnEca63DMAQOIjLN08Vu74jhVR8UEeaQc767u9tf7Ha73TRNd3d3McYQGMBEHN1Rry4vfSjWCR7TNC3hnwQA8zx3XTfnWaX9TpFoGkcO7DKxioKZ59rN8+w3eReLASCEDkGrlphChynXcnGxK1JFLKVIgVVsK2vGEBDx8eHx8fGQS7koWSSWUkQVzWoppeS+u9jv96ZSS164KerF+jP69vJX26yM51c4boy68MmIFWw8RmeNmLkFCQZeYiXa1Ij5QG2toiJVa5WUFIC389k+6ybibHxVqTFxncvjw33/pvMxy58i1nzStmnfs1WHz29hGc1cvMTgesgq/kQgUgAEQ17FEzVUMwER06LV7fY+aYdtFOBLs/OLQPzl8RdtUdv6v+Q5lArNrLddn4afO4Q8GyvCJx0w24ASt0eZhqJfAUlmhqrgs6q4Rl41R6Waq0VuWYJaBRcbMmyQWpsXY2eLc7MZLkP1HiO3vt9V4DtzF2E56xshMBOAlZpDZCLQdQjXa5clPshaPLgt9/3NMefc/PejvR/xwcP3nKwMpGR+7gEgIwUgUjXg1jT0UcoyTxyCqo7T9PD4OOwvjOjm1cvh4kLt94eH+1qLv5hq+uPDIzBfX10Th4ARUBt5VQVrUSJgjm2IenFhAhpiSDGkOJPNtaQUkJEUggEQW8SIVk7j+HiwWvpAIYQ+pcAYY7q42CPR4+GQp3keT2Wax/uHOs5QpcxzECUkbu1FwMBh6NJ+h4kbjZJ9QNO8eOIF2uGpbUW1SC21ZKmz1DFPp3kC0BTC0KU+hcQUREDUVGOKw36f51HKqUoliEyJY0KOUMEAxQNWY0RNQaWLTAy5ZJkrgIFJraqA1bSYFQMxRAxuo3Xp1u3s4Bky1sz3COdLfvn9N24gfuY83+z5sJoC4WxAbvzStehs17CL1OjRzJdXV1Xk9hZOp2Ot1X3ERPT69av9fq/q0hKwJwY6KArPLe4tyPepyw+3x3QE1CXQx5rHHkxhmso8zo+Hkxo2JDhta2C05RyzrgFbRmXh7N9v4pW2z2JlbegCfWnhzstxGTbc8ZbR0z52NcBzWhessd2LPrjJeEAwq7XO85y6zq3EXzaCn0s9vZmL/Syl8ZMjODy5W5uqIjG0aQHbNAKfn4mfcYGf6dLqnSTPuGtwIVn/4dNkOXuyWZyf2ZZ4yPY6VtYKLOwL9FLcB+NhmyG20I/X4eBNVd6EOYBP5wpXd4uaKSCHCETVoCpoS9B2+GODTjUl3VqFsJKXdAneW/kDtIpb22nMNZEVzHtahBh5C55DAiPIkh+SjH0EFa2iHHfXFyEkIis8jkFzDCjZjqfy+gZS7GIMTDYfD6ePx4fD4Tge9fS+P96+vtgnwjqPKtilxB1zoBxo6FKpaiYpxn0aVMsJOaceh0vt9xAGrIghqJRe8+t9+ttfvL68SP/427/79/+f//Dbv/uHSDQejn/8x99//dWbb7/79vLy8s1Xbw5/+O39oUbqdsMeURlQAAghIJJZnec8zSZyfLh/96c/ldPxX/zVt/PdRyjXjyE+2PT7u6my/ibEjnVgTkxZ6e7w8fb9/cPdzEi7IX77Vfd6FxmGOBAHqlRP0l2++eZkNBfoX3wlx+Hu++OU65vXV78q/MNpvptkVivARBiWCQrfU4AIY0TQORpHiLHnuFOppoLLlnT2OZmpARJ53y6AT4mgN8Q36+9J/fnJ0rNPa1E8JzQuoYhITN4H0aHvX93c1FrGcTw8HqfxBAAutaSU1pHkGCM3dCVEbzmgZ6ozcwgxuOqKsBbJdHN9dX1z/erVq/vHw+//8fcf7j5O0zTP8zRNqkAcGgbT2yEAHk5gmxyxlVgDAKqwXOZAy6iYotO2fc34qLeAWSlSRFzVTsG72sFfPJEFs6Ckqu1rhL7wiM5jfefRpS8i8c/IvGPneO1nUu2z2Dcw+KeU3k8xL+e12Yhe5+WK8Jlt7dleuT6ZPZ+SbNaCc1PJnhkRGnEcP1ONNt6FGiBSSmm336euczJAu8LJ6wV2uoKpUSBi9gLKDEQ051qlghGACCpzcG9CjMkAVAQJ1/6Qy5QrD9e15hBCznmeZxFxEoJvYcwMiD4D0bTpGBsVoQ+Bg4r6kIQbUySLmcUUickT6gzMBU0/gnb+7hbLUowx5+wvxu2r/qHFGEVknueSSzfsYgg+Q6TQtFRVzdOMTlpcjgdNhVzFejyfLpjZg+O2tN95nl0jFpFSisu465iRiUkRqRUR/UWupOacMwA4xcLxUPM0d11nZrWKqsUY1awuY7irFXfrP21gYtHt2cCVbve+OD5uTaVbjxkrhdkACIkCE1KXumHYzbmUIiHGEGOeymoKI2xv2eEhAJbzjHQZQwQzFamitYiodl03TXGeJzNjouUmD5tKyrbq8JmpB89xE+fUiXX5PVka68TYOhOJfomWUhAhdRHPA92mIrnkaZrc4q3eD3l6T2g8PfWLRdQspFRLfTwchv1+2O3aROd6qWyCllsz+IkjAZ8XiI4bNkNENSO1daVshoEQAAIYN6InmjvxiBRBwdQ/FDSvzbcze/ZFIP4iEH95/GUfCssQK2Ez+T7vH+NP9qe3uQfPBsc/VYcR4Kkd6jyFseqz2DSjbT5ISykBEDXRSmfsIj47OC2C8PnnLzhT+IwisEUxrpA7nw42M1DPQqm1mHUuCYIpnNNLdIPpeYKc93mlrXXRH965VfXIkTXxFMGo1Rna+MsCoApAYNLMaGompZpCzfV0PN1+vJ3m8upNevX6TZ7rhxiPj4/j8SgqDPgwzgZ3N1cfY0jp6sLIVh2YhLUgImGiGNid2E5ENgPgELqOYihznqUmImQi02CAzBEhn44P79WjEjDEEqOZSdHjxztkOh4P4/E03d1rrvPhZLmSmJkkIkipSYQhhKFPu13oO0FTMEIMHJY4tJUgtlShDT2sRaVImUvOpagJE6XIXQyRKTImQgYDVQJIXdfvhvEw55qh1BSUmCiwu3VUBVGZkZgCGzOqW6Rci2FTMwqdUaiGYxZRWICAwIgEzAQGRmi08oRxTaTaXHC0+qbs6Ua7vSg+76RYj1CfdT4CQN93L15cq4qZzNNUSjkej97dTSn1vZspVpPfk7D4NXX3p30ii/UQzt7nZaWTqkrVWvJpnDfdmPVstMai2KZswW0Jg/A043qJSVnXQ7tVqEoVMHCzm3uot37Hswd7k6z1BM9HRMzwCRSsipRaAbaDmF8eP5OW53a7wk8K0WdA8OWKXE7etmE3Lqd2/In4kWfm/E1CV4M44NlHbNISZRSfGIHPT3EeH0Zc9LFGHG51xZOwIj+Ft7Gdc27d02jWVnRs8JXtzuQT609tZc91OqIQkyF5TmRLCbAlHMvpOot3dBn5cHZGq/Fa7O3CSz7PXTpqHFVRV2pVmzdkDhyWI4G34pSklOme6sTB1MA47K6uU5+kHvV0SDLt2faUjsxvjyNU7WLc9x3k/P7jHz784d2797e3j/dRDr/e0+uX/XyS02NRyReXcBV3qHrZd7/+xdezmCF2qcvc7VSTphRQeqwMSH3/qgsAcPi4C/Cbv/rmu1c3Uz7+4fd/+O//w9/dvrv7l7/5axbQKrUUU33x4uZv/sXf/N9/+x9Gm/U6pSGO42HOGQjEqslcpaoIGViph+luPh1fXF/+7S9+kf/xt3//7gHLq1JPt4fvbfzxN1dh16UACmK9apzn+d304ffvVHToOY7XN79+w8A2lw70sosIw5s3X2WK//7vf9ffvIo3L8Y8/3D/p5uby5s+XYQSpOYCGRKhVQ5EtEgfhEykCiAnFOxC6AP3ey2jyYyr2VzbPdc29Hx1dLctqNQnZ0H7NEJta5haEhye2/PPBSkiESoQCEoVAry6vGSmUsp4PT0+PLhAkFIahsE1YVcuFkOTEYCK7wzqqEoDrdXHuZg5MpOZMPPlfn95cfmdwZuXL9/ffri7u/vw4cPbt29P01xrFRE2BmI/LsOSS7zs9gibVMz1DZiZmCE1vpmfEZkYcGXqq6jKlDOVwDwzE3FMMcbAhIExKlRmlRpEQ1DvpgcmRsY13K91qPFLWt3PSSCGNTb8nOK75M49XU6rV8b+OSRqXCuyljG+3TS38LENAfzZBmE/VRWeY4Q/baDiJ2aJZsvfptggAHKI3bAb+h1xQB/RcY2Yaf0RRIyMgaMpzHP2DdnvwQDEFIgjExOzinGIPYc55zJOxKHrOtdVt3Evq1K5/Yo7mfxm0nUdIE7zlEtpajKzqc6lEDMyp66rpbjSunClmrnSYbuq6repsnxbSkmXkBUzcyDDKuPGGF17Xe60igAxdVLrPM/+/YR4GsdcMzOnFACxnqMRvJWlVWWba+fqsxuHXRBX1Zxz13XuYvbSw+kNzVwMSIh5nkOMLtquG/o0jcMwpNTVKsfj0fFUToOUqkSw23WYqIqkFNe6xvXWlrnHIaVkjsWglsUXAPquH8exluJ1jWvT/uLXmLuFg18Rgch7gdh1w67fzVMmmImZkDzniJcZDOZY5noaJ0AMIapp1/f7/WXO8zRPoKoGpUrfdxSiGKgoABHSej5bj4jnHKR2edO6iW3s8vash/NkNS3gMF2Cwn1FErP3DAAsBuYQfILSDFWkzHniaR6nknOtoqIWVnXYF4hfe+AnOETs+qHkOp5OH+/uX8eIMaidtWnPabY25Onhp0Ct7GuWwbVVjEgr/gmW4h3B2uiPu3mWky1uUflrqE07M6ICKOr5RrfBDn7ZA74IxF8ef/mqmmBhANtyzFiPJ0+NWRun1kY18hQd/FzH2eCJkLMRiGGNrHF0PCICOl1usf55kA4so3xaRRGDZ+o01ONSAa8GKj+Ef1rRN97jOgjcJicRkc7giWZMNCIkZgrcJoAo4DJhuIA3fDIWFmUXtw7NsytzTYdf5z4Wk/T6fYgKRCDi+riqG7JAzZBAAUTBDEUqqFbvUV/I5eXVu3fvx7G8ePHy1avX0zj9v//b/+bw8IgEBuFxrP/whx9rUfrVL15e7AQ0GjMwiZrVaoUMSTEwMzEbB23nwr5Ldb8/iRzziN0uRkYkBLFSEQjnPI2TtJgmKvePFEII8ZiiERWptdZRgQzYMAIGIuYUAj6OR1HBEIeLfdrvuYvG6L9E72AbmqiI6RKG1EgFHsdXqpQi8zxP8wyIKUbFGhgjU8fUM59AGIEBQU1LTSHW0J3yDLlgKEEESFKXyKScTlJPaHOpJzNQpZYEK2aGUlEBYtcDplnw/pj9XMCMLknHQEgAUp1OQn6YNlT/5a0u+s15oVVx293OGS525gk+SYzdZBU+y9daJnZRVVOKL1++JMLHh4f7+7vTaRRR1e8R4bvvvksxiIpIhaeZik8tJNvBqOVwvyZfr4ecs90ZEdFnltzHwRwQslbT6k7GtrCAvJuyJM6DnI9Iti5Yx3lD+wTBCD3P3X+mai21lMDBGY4qiujqMbovwhN4WwsFYYOtgbNVy2GUAGoWmJHZuTEAwIG/+K1+jhLxn/uOrY/Y7+rLmPxKg3EaUGvQbZbkNqFuEXPtyWBhqxhsMWD4PkbMETmDV6Gw1gHLoiYEUTMgJPPbipmgOtG48QoRzluLrX3dJ7jJ5YjdmlUrTMll7oWU2mYCcLHhrKCVbaIkc0hdjxwUQLXBTUMI5IXB0v1xVtISJ4tMbGRAZrX6Hrme9W3xuPjYI6CyQQjBu5PNW+NUO7diIgICmwYtWAuWWSMDcTV9PIwPf/gD5sO3F/HlzfBmn3aRHwg/dHYVQtD68O7d7/7x94fv3+nj9HiaH3O5vujw29fvTtPj8ThNR62HVy/6/+Rf9fs9RzIe4CIE4Hh7lLfvP1gaXu5S4MO7+b0wQPcCOThE5+Zi/2/+5b/86ublH74/MNIvf/Hd//Lf/i/+k9/8zYvLy92uQ6a3P7wNjH/zN3/1X5cRE6UucuI662zQp1igTqf59qGIASFPp3Gq5eb66he//s3Fq1fHgO8e/sOjcLq4xq6Hd/lxfIfX129/fP/ux9vDya5vfjlI901/A6aK8vb7+9NhClq/ebPr9qGmHfXRkO7vH7///vvvfvmrf/kv/vbbX775P/0f/vfX7w98dcUIKlOeVSODiVbx6Q8AZMYYA5aSZ5qnOA8JbOi6C5mOMh9A1c9g2sJ2PClL10b42ocUUG3EFVwNYs/MjdsAHDOPUncM8cak77a15oHzPcdMLc+5lhxjPwzd5eXlyxcv1ydxmaPd7RffnCkUU236i7b1akBIMQbmoKwWArWgVUMwJv7lL7799tuvxmk8Ho539/ffv/3x7//+Hx4eHkREqpghc+AQqlRbOpctKHmN00PY5HoZmJInVXAbMCfymGIkCsz+srSqzmU2VXcyxsAphL4zJAJQKsJMREwEXQrJGkjKxXBAqKpfSuqfz06GpMCIDEtWISypDdszoZ7zK7wE+ywg9Ylt38CQkIBaDbPIXJtE062rYJ2uXE1FZ1Pz57MrPtOZbbWXLmPnazyAwoZjaI4CC/uL64uLq5j6XAoRsQtUBiaqhCiCSCEGM5uLlJLnOROGlBJRl7rej6apT4RUpebTCSjEGA/jXEpmrltv7Aq9XUVh13YvLi5qrW4ydYGy6zpRPY4jAPRd36WIiPNci0o0jRyYg6mO44iIwzC4+DtNk4uYLtG6v3gduOm6rtbqP9flWteLffJmGIbT6XQ6nYZh2O93g6pUY/PkIATEgISIAT2VGYgZCGsubnMmJjWrUjXPu75fLcku7646eMM6bZg/K/BqPfCEEADheDxdX1/v93ufrnAjtifaueIMABcXlzHS4XDa7XZdN5SSHx+PV1dXZpm8QDMFMuclNmRELrp8LALAzJEDI9VSSs7+G/GX4YF4q+N7hQI7wr5WZSYiSqEbut2YJimiolJzmSermcyInHKFh8fj4+HQdeli19+8uH756s3VxeU4jXR4qKVwigo0lUopQYy5ShWNwOTwn5Yxb4QKQKAC5xEpW2Iet/d/b4EvkRhmQNgUiTZ4Q4C+Kh07CKZKQH3f11rznBlx6DskbiBKQAOtOctcy5SncYohEgWzsK56XYp6hBYKHAfsDGa1D4dDvNhfpxs1v9KWqW0kXcxBBG6ZXvIhttYccMtOW+64gSb6jYRa1duUEiHUQE8aQy4IQzPoeTDMYmlyu4F9CV39IhB/efzlm9R+Xkai7ZxRq9m8alsnxlfQmj17DlqPLecoO2tjumhA9gQohwBMZNuZIzBEMjA1dbHNjx9iakRIpABVVKtwZDuXk+f5iHNnfGOkWuPWm4XWVhSjG6n8sNLUKwOjdutqhsgGfTcT0/YeDQxMFXRtG4JDL+xZluhzjdh9am61Uo+ldl+AOp8SWJt2RtxUNiBzr7GZiSf5oBrWIre3d98O+9/8+m/evvvwu9/+/sWLmzev3/zrf/2ffv+nP+V5Pj4+ztPpw+FYVZmhfvv1q4v9LmI0olqIAKxWQ1AUDilGZkTvOSsgcb/blVKOjw+TlNANgdEIpRbTSoAg4pRlALNpjj0ysFkxQDJL7TBrDMjNCKxiJAoYYtwNcb/jLkorjjBwYA6IZKjVIFdB0MREiKJaSpnnMs15zvM8z3POCM15k0KAoQOwx+Pplo6oygDkeyeCi85ELCJlnru+Q2YyqfM0Hw9aTlpnkQJIiSMRARSpisCqpIgGrBSKQi0ZkAGRhZixInQejw6BwADqosMgGC2qS7v66Gle3WrDaDKUwhaR8tn022d/XReL/4E5xGjX19cpRgA7HA6llNNJf/zxRyK6urogJFyIn+vz+HTeYsh97ohsAQjY6BfNabwJ01bVFhQZ07Df7y8u81wZCzVKtVO4YW2mLHeB5Viw8oPX/7I25+tFdquxzUCtlCK1xpiIg49JEQVvhXu+mMNnFBCQzFCsiqj6jydyagogAVFrjhMbYK21VOEQkdh/uV92gZ+dRox/ViNes5jXEtfnJVXFj/ohBpqrbFqa8BScer7VPx+kbTW2qgtDQEwI6Mhg9+KSwxkAvUA/Ey0QnYyvZoTksyW2KEGGKw8W2inapy3cxWnL4nkSHQBmRoa26csiYmOprwt/M9tnBmoaAseUiIMAiq5ydIvfE68YFsqEqXtuYC07G4Gc2kRtGzlGYG53HlMTFBQkYp8UQURuU6tqhk7OJ5Uo5XqXatF5rlOZx2kMaJ3mmwH/6s2L15d9b4XyfIHxF5fx+MNv777/03Qqhx8+vKT0moeBug6gHurtu9Muhbuj1kooHIPcH3LX70GmMT9yDBSHx4f84cdbfvn6ok99H6WeptOPtQr1LwBIpynsw4urCwaNBN99/dXlsA9Ar1/dXAzD/uICGdUMTW7vbtUgUBepY4iBwtDt8pwRUYRE2slrGIbL4UUxVNDj8fEypa9vbn483OVTTlYTENYCEOeZjo/2+FCwTpppp4xIWeHupMfTkeq06+KL1HGfAHAu1RBjl/5f/+6/CR3/7/63/+v/2f/qf/PhH/5+h5FCcGUTCHGZ5VXvgig2YzgR1apamezrq55TL4CqbYT77H5f5suRWg2psBnEerJkyHfmRf9ZDYC0tvVxuXDPO52hz2uDGpi3DVjVxmk8no7EGGJAoJSiSwPnRqCqN3t1XTkefSreJW0JEewgbFYmWlLsjVlDcAFBmGnXxT5d39xcvnnz8q9+8d2Hj3fvP3z4+PH27v5hmsZ5ngnZIJibtGzNiluJE9swAlNVNKgNZANkvt0pO72CCIEQlZi1VjXLpZRaZyzTNLs+FVOIgR0cbaoi7LU8EYXASFhq/eIg/vlsY+vOs4YkLjLMU7OB4VkXfhZ+tYVU2/aMZx49eWYTbcw/258PT76+7Cz0tPr7s+/iUw35nEq6Pom7Cs0gdl3qe+IgagZQRdqsCbWEMVVTLb5p+0m475mZU+zUjT+eaVGlaHUquqjKPHtmmrtlASCl5MvRnbyOWcg5+0SCI2tc1fVvK7UC4uXFhYMm/DuRMKXoIm8gIsBhGGoV9wvDErPmduB5nk/Hk/OO3Sx8OBxWoTPPGZbxoFKK83+f0JmARLLfPAOHKnWaJiaOMZqD/M0CcYxxnEYA2O12qUtUaZrnGWk3DAxQSnElOsbolGEnXSDiNE0AMAyDa76qioQiMo5jiinF6GAKx1Cs/OXT6TTP89XVVYyxlHI6HS8uLpmrIyxgza1Vy3Pu+uQ1iIvO6+2apIVg+we+iuZ93/srAQBvm81LfMhqc/YPeb3S3HAdU+z7fhxHM2BCU2OmSq1Mq1XGaZIq0Nl+P3z99Vddl5iD/+pjjBwIwZhpGAaRagbTaQarTEiI1NB7K3ACQLRNBTtG92mPxM7rdCkLVRaXQXN5GwKrY4ha59BUiWgYhqPIw/3dPHc3L15tzHUqojXnkudacq2lenXf+CK0QR/D2srt+x4R7d4+3N5yjH3XhcBmhgQAVtH1jcXHYygNoYirQ8J/9uJqX2KUKDBz2PLB7Nk435MD+pr1t97U7DyOiqb6pS77IhB/efzHoRCftVTbotbPGMbNwWH9jlX1WXI7WhTVGlOw5qYjon7COmycmtYvQlWtUnXhNi5P31AMTTjyb0c6m6WWlyS2+HIXCjCeuT+weUfnzLxt8Oj6Cay5RrD4EFUtl8IRfcrGI4iWwPfl51DTCbe9+rMDdH12xGUmGM/yBPqr90Q791mBGaiYKFSFZY6jzXcwQlU9HY9/+tP3w/76xcuXtx9vf/jhx4eHx6vLi1/88lcxxtuPt+/evv3w/odyOpV//P0s9V/9+ldAvEMDFWYEY89AMzAkYhIyXS8F5tD1/TiNUy0pJSTmyN2un06jlGqmaE39JBFyn1yV9vm36HBwgGz7zJmpS2nXxWGgLlaCosJoHGKMgZh8S1IDXWgMplZrGed5nKZxmuc855LVOR6IaJAipxRiDMdx/nB/4JBNTUUZgAjbrHIIuRapolUgVJlOdRqtTFALiIAaJ6bg5mBWRRNADESEHIGCIImCIYJRCMxIKii+dwdmUlMwEzQB+wwvyc557mcX3SZJeq2M0T7ncITNFNLGTWxLW7hdyswcY0CErutubz+Wkh8fH83s4eHi1etXu91+aXKcw+bW1ffpkb05FpuudN7eF1A3iBghihkBptTfXN8cHw6JLMbARC5+eSLiMowEsE4et0rEgzAXnoQ33NsIU/NuApKZiRgyNyUXyNQUrDnBnJpuIKKliJs0a5UstYqAWRWlKqWI1CpmzFzVqggSiQF6DjVx6+d/efxctrLP5mGdMTCbKdonjqcnYdNuY23hJ61VSARPAY6rmWLDW32yjzSYtqvDyz1N1FB90SvQQhZvTmBce5ct+83UMx3NqOEmEMkM0Z2V6x5nLWis9WcJsA3kOu3I/0sbqWjlIJ+9w21o0rMxkdSUgGPsKESf7fX9eKkRGAG0ydzBsIV3OoqOkIBASABAFhfnOThlXfgoogpVwYDZuX9CTClG15ddCGBCrhJk7CybSZ7nUgubXLL+q1+8/PbVxRApz9NY603XDQi/jmGCdJjoT4/l43GcyLqL3SWFLuJdng6PU9nvJkFS3uEARd9+OO6uB8R8e3vbxXR5xZd9/NXr6wcpMh4J8DLqq5APx8qxY4vl9KgXmILVMoLK9e5iwCSlxIgYWoR3YE2p++M073evxsP88cc5WQyxHz/eUiBOKSH2gWeugBhTMuLTOOpMEcrL3fWLoaunj9N43IXanw43Q4dCaIlwx1Z1Mp1zQOLAAMwSEAy15rHUWcIlxhBSTMwpdbv/57/777pd92//7b/59pe/PL17pxQsRE4arCNOKGCGalQNRETUqAowm4n4XRrxekiBEoWoUhx6iauhvl2rXiiigSloa25rG1hx3d+eqUVmgEbcEBC4xE9tyJlISIigon4J+ZJjZjOZpulwPHjdrqJIkIhSjCHGEPwsAfM8T9M4zvOajqwGYiDSSONmJghiRlUAMQQOQUPVwFUTh0imRH6EIGTC/sXVzc3VN19/NU7zNOUPHz7+3d///d3t7eF0Op5mAKAQArMX2UsmnR8lz4NB7dOTRVg3XcABaAAosioDgOebj6rNUg0sF6GJmDBGTilIClUYEZgRiUqtTFhK/uIh/nlpxGdnL55rn89scT/xz/U53asVU+1ZPbLLR9vhKSVpiUf1Wok28PxPjQX/HKX7+XevMhczb0ZeFGjhP5hqbRw/A3BLbEjRJWMRCeyLPgJAztVl3ypuRERiWtEN6q1a06EfHBmcc/Yq1XPn+r6PMcYQPULNlcrT6eQOWRclSylq1vX95dWVmT08PJRSUkocmIiy826J+5ScbztNkz+bowWnaRqGoXEeTMkaBtcNxS5P+5Os8F8XWB2tMM0T15BiSjFN8wQLYVZEcskJUwihSq21glc/ITSLNHMXgoGPVhYCV9jVHcqu9K3vGgCc4UAtulMChRBCrVVNkZCMHh4e+r53bT3nvCJ9NsZV7bpYazmdTl3X7Xb7Wuu7d+8uLy+YcHX++r+6u7tj5tR168nKAcdEtNvtXHH29pi/DE/t85ft37bOddnSZu773j8BT2cRmUSt5FmqqAozIYLr775BxRAvL69MNedRpXpJFQK7XSB13Vdffc0c3pa3h8OREEIIidnT7BGR0cNa3ETmvdA1BeLp+vyE6IVERKgGpuoygKm29r8vuVpDCLvdbh6P97f3AHx1dU0crDnVZC5TyXOtc61FVQDCYgnyddA0EFHxs5fjp6+vr9+9fffjDz+8ePHi+vqKQzBQBUXXXHwbNjAFaZJw8/61chJg4zE3VfEwlxWoAk9BUn+2b7QFcray+Eun84tA/OXxH0FRjctMkS022NWoeE5ve4qDWZCIsJG3VusfLMWx4TMnBXzubLGSeFVcjmtaqLn2pgaBFbE4NlQNkZDIbAUHf/5YhdvW1KJWnRVtW9+WPnuGhQKx9syg5sohwZNeNz57O/p0anIr6sHTif5NBpF5FimoqvpopkpVaecaU4WqaOrUCW2qGPhIJo7j6R/+4e+//ua73/zt3x4Phw8f3v/2d799/eLl69ev91dXnNL+cpjHw+Huw/cf7/p+kFfwYnexj6kzMxOGc5gYkkUKCmr+uSPEFPcXF6fDIdeKDCkEHmIArbkaljpXEGl4LzRVUf9FEIGBmqJnfpM1GFhKsU+cIsRQwMS0qhhhYAJmQxRAQGOiwAzS9rNxno+n43Ga51KqVNeyDYAAYyRi8nmd64v9xcU+HacMpmY+JqqqjMwUCRUMLBcFmFUYgNU8DI+RU0iOaWIO7psyREwJuw44KgUBt1YTWABkAioKs2BsdiXy2a62GcNZym/8BLBzqbg52ds5Q3E1GH3m+vnsDuq/fe8k+NET0ae6oqo+PNzP83w6nUQEicBg13Up8rIQFD9/oH92PS9rGjdJAavK037LhsiXF5fOSfSB2Sfhvdu5I1yYKgAAdM7zNVAgQzLAIloEzFiVFKBUQwxDv4+xr1XHObuhzK31fnTzkfzDcSJmBNQqpVSpFRF8xlBERNWPLFXqgcfIARFLrSHG05RLtSr6ZRf4mZTT23kR30c8J3IdkoWFhb/uYktZswzXOlvCuxaE7nhVswUrsb23t4vctTCv3r3CFj0HxbQRYGBnoCMAmmedmBcCsE7qnfOmFoSEwkJXWvo07uNUWAi/S+dUQVtK4xLXgy3aEsnTJZ/fVZ760HwysnWPgJQwxI4oOBCebK1l/PRPgVRrXaSEFc6k/mOIKaZkYLWKtZA674C2rVVE1NmO66fvgebBRwQIEZmArFh5QHm86PUahsOxxgpDiK+T/c3XLy926d39wx8/PJZ5/sXl7pcvr3qGPE75YHXMbGQCVjUGu4rRkD7M0+3H2xrsMoaL0KvMH+9OL0556I1CRCKthQne7OOrODxS/NPpOB+n4earV1fd0bLVanm2UlTV0FSk5lzKhADEOE1T5F3O+Tg+qFaM/W/+9X/+u//Hv/vd97cPj4f9LohoCBZpBsFQLAjWIkjBmI3QANGwzPn+47vp4UMZj8LlFzf917tQ51lKBSDkUFQBtbRwF+hTpwRd6hjUStUyk8rrlzfv7g7ffffd7eMxxO53v/vHbwfmGAoCBw4xRk3CkWNQADVEMazVVAAVadWJQEVPc9ljxLiDUrXOKkZgsEkXVJVcatOvqF2Mqq7stPFkaTmKa7vRwMxZjh56zhyQmZlCIHarXUitRbNoGd4FQaBS5HScYog+hRYQGJEZAT16LhExx8QxYhgPj4cFK4ZLhx7cXuzNTiQMxABoVhVVmMQ4anNDmQYXrw2BmXd9g/u/uL588+rFaTz98U/ff//ju4fHw+l0PBxPITBTYGLDM178HGFkDdl2TsxAI0R1aX0jHPhkW/t0AFXNh/tERMSKlFJ5mokIOVCXksNOiUCKfqmrf04bGoDauUVPBorbOOTPnt1WqDvomk/aEC5tpBvsnB+8bZ4+8xE/Z9PbSsLHTxMsPn3lP/mWWvjeOihgG7ATYkxd6pKBVSnQAiqZuJUUvr2xG3cRVy+wauumeOCVv2aiNpNqYMQECkVa3FlM0W2qji8rtZTqPw5T11i3tVQpEjiEECgQGxtClXo4HFr+JaGq5FP29EsiNNE5z754Yxe9PnYqq5rmmmOMkaJWVVMC6vqu1lqlzmUOHFKfRKVqDRyWD6FCgRhjiMFZiERkCFIlEAYOhlBFxDTFZAhzmUQlxtB1qVZ3T6sLpo+Hx1JyDMFD/+Y8A0Lq0pznOc9qmlIippxzLrnrutSlcRyhQowREOaSVeRit9vthhZMGljVVHW3G3LOp9MxpRRjKKXe39+7RAtgtZaWG2Raq9VaXPF0KkX7JBdXmfuRna3s+vhWZPcmQcNS+oGBaI279+3mrIwTDcPgnJClH2Ctg26Qcy4lM4fdbthf7GOMUus0FVia2N4YEKmEPOz6wDFQ/OMf//j4+GhQRCpB8z5ZiovXxQF5bY2tLK8lD+ncFlmFEVM1R1YwIQEg+jzPxn4LKsIcLi4vzezh/h4Ad/uLGDswVS05T7nO0zx3Ze5qZxoxLEAaPAfIuKfN99wQQmfdzc3Nw8PDw8ODgV1fXztDi5cu5WLGaykS8FRqWfsBnoTRMuYQtqr9tm59NhS7/crWVPcsIOTLBvBFIP7y+Iuqw40LsU4o2dZEbHDmKSLYT3WqbZvJvt5JtkQJW+6E2+p3C22Ec7aCLdJvi+8waDuiqKx03tWC+U+1r7fRC2eHV2Oc4sorfT6PvAlqcMoqS/FyQhDpfMP/5KNYSa9PM1hwe29dq2hQMxWVKiKgoqqe71Ol+hdba67BHr0g1O3dVdVubz8a4tXNzdXNtSHcP9y9//ihinTDLsZ4/eKFXV2EQGzy4fGIGEq11xdXmihqDQuUXtGAETsUqw5KIMQQwn63K9NcRRAqEMYUqe9CDEKslHWuSqwhFGpT0j7VhWBGwEQQQsu/CSGmBF6OQgssAiJgRk/pXlIyGNGIFUxNc63H0+lwPI2liHqsMTUkgefEkdvVQj90w9CFFAudx6gdukTIBAQqWoqa1GnuU9RatVZTiyHuhkHaodKzVUEJKDDEpCEQsgGLElBAYzRiIzWsCtmIAA1RAdkAQBCNmnFIFxM6rsLqcqBfTBlgTxvLn98RP7tZ+pJ1wWoZreXUJWa6urryMFuR4hw0NOhiurq8dILYlpK66dni0yi5J2uhvfoGlrJlot1MEZG6vmfCZSa+eTfUwInM1jLiqR08XCwzp622U54oikFVG6d8d386nso0S1Ur1cyo6/fMYZpKLqKmpuZClgtMqgqARFMrcQxUxdyaSUhIomptAMoXPK7hRRzKNBciyqV82Qh+TiV1uxSWw7Ft09ZXs7CXubgQwFvfxZACICEwITjYU9qVqo69W7Wqdb90si+c64LFWrngfH0sxkXSxg9uwwS4knad64h+2tZ1sl4bqdtvaEv/SU0AjJABQVowlZkaqmJzYZ1R+6h+122oyrYMVT9J0EZEdqi+T+kiB+Bg1KLjz5GwS2pYYBYlIiQDHwcSVV1AeylFH4H0XL5GBvKomEa0EDCzasagaqCCMVIIVUGAAiGRYZ2g3pM8JMhfvxw+wvg4w1Wfvu7gpk9q+OFh+tP9WEuNBt++vCGVh7vHd+/mu3sDBUStUpWYiNBA1U61HE0M7RLZAOuxPDxOKcLQ9wQmWsGgS7zbpWj8/uE4HUbrrnfXcc5ZKhIZIqkCBSbkXOfjfOpSTF3Sqkg0TtO7tx9yGV+9enP9zVevfv2r08cPuczz4RgJeSodYDJOwtEsz6KAXdeHaZYikHDK093thzqesGaEOsQuYIFaEQwJBFRBkHBWMQAgJMaaBWOUPNZSoBTNk5X85tWLSjjVYqY/fP/j1dc385xjjyFwDBoqASfPpUUAZsDAKqKS/ZogBK/C57l2fUDqC5wkn0irW4a1zTmpqJZaqqiZoIvKaiqLncuaQrxQRz1Swr20q6+ciNgQQ2BmJKTAPOx2IaQuxQWa6fHARAhFbJxyjBOadZFmRt+AiEhTR4DIHDz+COh4mlTy5lAHVa1Kk9cRAdUN8WJqiiSKCqJGwiGoCRsxsRIbsC9hREC42PdXlzsRvbm+/Obbbz58+Pj+/Ye379/OczmNk2rxpCXzGYFVGPcmaRvPX8twR2G0JeEbvidZNjfWOQZyjQTUUmsRQAQuVKoE5hDIo+1Fv/Q7f2Yb2grmtGfS8EZzWSoOOluMn87SLJeXtYiHreazTrWtE2v2eYMy2gYU81MH1GcC8SdWwXUx4oKkb8daQgwxDsMQYwC0ZSSloSd8DmfpRRGoiahqBcAYYwgREVlxCV1HVeXAJkZGALA1FJs1SiwxdX0HAE6W8PQ2YkLEpgib5ZJzycwcYgDEUsppHLuuG4YBkadpmucppTQMkSiUnMd5MrPdbtcPvZuI3S2butSiL5iRERTUaXhMWlREsENi0jYqBCEGA5vnWVQixhijVMk5x5hSShmy30iZ2FnMouLcOlUpxYZhAIBaq0htmp27sBEpEjGJSJXqZu1SSi45xOCzfLVWh2CIiVThwEDgETGIuNsNh8PRwRT+4xzvkHP2ktlMx3Hc7XYhsKrmPHVd13WplEKLZ7mUIiKej+cHEvdTN1EpBMdQuCPYv+79gJX4seWDrbhkeEpYDiHs9/txHKdpyqWICiIxMzHmknPO+/3u5cuXV1fXRGQEpcpai7mQupI9dsOevopzrrnUWrMusqiqiQoYtCYBcwhIvl0hOATMd8t1Tg0XGcJW07x/KyIiWcsebrd7bJBl6LseLuz+4XA4HKro5eVVTAkVa51zaQ5i0aomuBlAXXs5S/obrqTBy8tLVZ3neTyNTDTs+hCC57E3MvlynF5Me08+8/NYGPJqQTjP1W0SCLZ/fXbveiYT/9RN48vji0D85fGXM13h+R6ytJvOGXT2aUN4+ze08xn46ZECNyg6VT3fWz7BXLX6mgjbENNGcgUgJFuGYykEBNRPY93XMX44Z2ifv+FpxN56YIKnXuAV3bgOOLiZxbSAgZi4auBltj1N/F3BlPAUEWCq264+tLkQ9aFalaoioG4bVjUVV4dFvKTfTKTYkvAAZ/gf0e3d3W9/97s3b97c3Nz8+te//tMf//Dh44eq7/qu++qr15cXu5ev3ySihw8fbg8jQIjci1EfLJkBEyMwGlTiyGbCCGh+PAqBuUvdaTwWUaWqlWIIlAKFgCnWqQIgECmyVzgGAMhExD6XlVKMkZiQGYlcBYfN/HaMkQLb5oSJgAyAgEVlmufjcTyOYzGXgxd12Ks0cjwAAUAMzMwhMGEAJFMFUyJSRI9mV1WQaoBlPLEmkSJ1RoBhGPquzyXnUkREQZXA5Y0UElACDIABkAmjATpfAgEEqQARkAIxICMQEpsAKqEfe1ej0IZygkuSItj5csWzrvRpZ/UZtGRzVLd1Ynvd8glxv9975/z+/j7n6XgcVc3H8C4uLtDti2oAJKpnkWs5t6yJWHBGeDt0W/3SVYCwfo9BI7V1ycrYUJEAALTgH8gn5FckjYJVN0iUWquUUqpIqVLFctVxnA6n+TjOpYgYVjFRDHEAgHHOi7ANxLR473W5gek5OBsMDVrOA8gSu2sbzJXhas0CULU8fxGIf1Y9T7dm4ML7VlNYo9vczq8GjkHBp9Hszg3W5gF2RbhULbWWUn3ItJQCS+izN6Kc/etnbu890CLm+vEfz23Wzb7UJmdxM9qyZloZmC7bkq1uLlqAReT3FgJAFGguDwTDZUzB0Fngy1TwYjSGTUzleq9Z1AR3m7UoIDVAYuIIRN6ldKZFU6IJiCgggiB6Piu5iOdNTSUDIo4pVZGai23TTdDVeE92Ea0iHkGGyMQcoqjnqiBaJcsR5o5GmO9fv/4lTUFK3gW4GlIiOFX7eH86TCVGzkBAEcymU368PZ0O2McOwIppBoVajuNcTbvd/m5+eJzLUQMyKuDpcYbrvu+SalE1IAYikJww9QAw5ePHh9jNnWIFssShS6IQQ4wpVq2nPKUhxS51ux4hIIJoLaVMJdeI//J//l/AlA/vP/z4j7+V02M5HqhqQk5IEURrNbNhGPDu/uH2noAtkUglU1cBDlM+1dOrlLrEMZInBSJ5+YmMZFqncaQiZFO/R661nI5v//j7r/72X88It4/+OJyud8fx9PoFRw8zQ6QQjMw8bTRAADLlUkFqBTPH/ZhqqbVqAohThXyaElQ0yaUUEbX/L3v/+SRJkmz3gkrMzElEJCnSdPjluFhAANn9sv8/RPbJW1lgF4vLhk+T6i6SLIi7m5mq7gd194ys7pl78d6DXLzeChnpqa6OjIzwcHczPXr0d0xMfURDREzFVHDex6w7MYXzXdbiX9RlJwAAatV8PcI5tIcIu8MxhNR3nYMyQ2RCD6gnMZhyPQ0DgYBFN58pKCBybIAihYhIyDFEjSlNOa/7OjUTteoyhNns9zKHQRESkZGBiaiw1Woc1P1t0cDUaAmxN1QDIsKPPnr+0ccf7Q/H29u7N2/fvH578+WXXw/HY/H+JQggLYvNktGxGKoet9kr03zZCJsZqLph0Bn5NuM4Vr3CnaFWVcswImHgIFLNZBVZPjx+IBaes8ktPGt2rmRa/5vvDEKeFUKPVZh5x3FZKByytzDy5vPzOzOVjwurIpK/yPrj/xtIoWezK4tXEdAACEPX9m3XuQfIR3hwlqyWa2NpcC7BlRBjaJo2JRcrYY5FVss5rxl6HHglH9ZaSy41V2KKMXqOnFSpWA1NVadxCikQUZMaNR2GYZqmvu/7vieiUmst1aXDebknWmI216hOCBy6riu5TDIRcdNQ27SHepjGycVijuwa5ZxGgOiyJgA4e2EuP2N0VwSAiUopmZD7TU9E4ziqKkdOKY3jOE4jE4UQRNWn69ZIumkavSaTWleiBSDknKPGEEIMsdTi9AZ34OaSWdlRyKWUEEKTGpeYZwbUwrgYx+l4PLrJV0RdJnaKhcNtRaRpGmY6HYe2bRymMY6jS71E5EJwjLHW6tQOV41XbdHVZP9LF9zPzViuLNd5ngkdneGf3XETm83m4eFhHAcXu0MIgcOQcyn1448/evH8xcVuB2COpJDqaF09s75SKRIj95vty48/Hsbh7vZGRZyCZKbTmEUqM4UYOIQ0B5BijNGHytSAEMwt/LQEvSzT0vPUlQgasQcNeU6vnU0xmyFi2/XE8e27dw/7ByTc0QUxVSm1TH7z96YsmXqSxYIh9guH/Cs7d79dXFxM0zQMw/39vUjpuy7GhokZkQDEQEzBmcuIf4wUgY+eOfiucfhcAjqvas+zmt7zF39Qhz8IxB8e/3PIw7bGXM4bWTfoLYNA82TcTAOeDUzvi8U4W0PWCJslwNpmGt25cjobd1XPyUFzCI8t6tiSErdMYBAgiqoocAimK9bCeZFL2bHU2vjoKl5MY2oitiaiAJxvUOzxn+ucC6FnCrlztdZKHEOKOAOT0VZYux+QZUWc01dwTsRD0wUGCQutX7wqVhNTAVVUEakmIlLdcwOioO5CfezY2ZIDo7hEbxnFGNTg7dt3Dw8Pu9323/7tv3n5/Pnf/8Pfv33z9mE4Dqd906SU0ucff7K9fhERgfg2l5PoRZOaGCpqkpAgQCDL0nF0uQ2BCCkQb7abqebsqV4ASkgIHAi5iU3nG0QiCkiq5ksJM4cYOUQKjMQGKCBGaEqGSIQhMgcfxGRANJoDEdEAVMlADU7DePewvz8cqiiHQMyuTiAyEzKCSzFEaACB2L3KTGwApRZVTUSIFFNbpQqIaa1SEK3UDLONQKoYcbi8vPARraIiQEWh5Y7bHXAnEFUpcEJOCGomtahDm4syUhBMCCVgCSjRCkA1kNWHgR74jt/rxZj38LimczxNpftjfzhbQZ8MjBOiEbdNYr7qut414tNpOB5Pr998a6af0qdt15HnBc04YPX5xTnSbRZg12RKvxcsitYcY+kRBoAeQmuQuvbFRy/fvhp8rhyYvFvAwGJUFItqHUvOWkXHMo255lzzlKecxzG7QCyqIiCGtaqYi8vsUGsiNgCpsu4karUzph4tGw44s7iYLKlfq49yCeqeGXyqZwitD9uRH0417X5WXFsvax0LxLh0E4CWeEOdFd5FC5ZxmoYxl6qqtj+ebm5ui0+fljJOU5UKOk+4zGDDs14FEbvPqEvNZrMhxLU2gJl5wg7J8RzUc/uXF+aoZmpkswHe6W6+d3ZuD8xGDAJACAwhBAoFoC5wfFElVDfN49p2w5XvCPhoZybzMQBcY2XXRRFj4KbrOEVAdKOoGSChqQGKVUAiewylZURAMVRy1UtERBQRm6YFg1oKqgK5uUmJAjOhkZnVkg1rrRqaNhAxWgVlDkyoIgR2seleQrc7vOn1EDfh5t3pdH8Ml59sdv1wd7ThYVuPzy8vfvziIrElDldd96wFyO7MKsVsAhSzfc6F8GJzWVh1mFQAmFtsYTQsGloESoX4iGksUGw0zA3kTZ32N+/i5uNNtAKhaahp8DgdPnr5MadYREqVrt+VrBiK6bTZpp/85NPf/vY3/abNefj0x59dths55vs//7P7t1//6r/+17svv5E6XjSsKiiVQZvI03D86osv3r1582d/9eefvLj+6u5QIIQ2vXt4NYVkxJxCiIGURQECVaNgTBCCSTQUmUrRWkymXMr07Re//rN/+2/xnbQh1dTlaTRFUTiNeRpzzeLRQ4iETI95hkwYqEyT1moqalorlipjqcEoV725uwsymZRSisxlrc6zN3PkuCV3XUV3gIUQ2EERa7k+r1Y0Q7JrrbU6U96maZocEylyOBxV93dMMUQOoUmp67rNZtN3DSPnUnmCGMlGH1vRqiBCyC0Ac0wUguff9l2Xp5xLceLK6mVYB1AQIMWowdilKMFaMQS2aFU0zPPKbKaVMAQmYgfXk83AFQPcbPvtbvP555+dTtPt3d2b12++/vrV16++eTjsi2QXQZiIMKjTLVziXbW/uck0UysfgTMApCagiKhiTLBAJD3TzqnPtdqcaKdac57kAzHpB2bgsSVzxf+wznc6FdSDmWfNFZfG4nf2nasB8Gk79Pv+/L4daJaxdB5BIURVQCJmcj/7UwOOnS8l3/eJ4EnmhqdpASBik9Km72NqqpmTwZg5pOhRruuJXUWYQkqJ2wCAzJxSQ8Q5Z6k+Fmm+vz8ej05ycHCqw82b2ESOokJIAFBKUdOmaVwOLrkMp0FFY4wUKVBoYkNICDiNE4eQQnrx4qWojONEhDGmpmlV9Xg8MlMMcbvZqVT3DgPAtt8CYs21SvV3AgYElEIquYynsWmaru3M7O7uzsx2213btnnKwzAwc9/1NddxHE0sppS2TZ5KzYWJIocqVUUIyYvK0IamaXLJ0ySqmlJEpFpLKdUMYkwEqCKMHDlKkTrVStX5yyIiVTAhE49lnOoUQ2y7VrJMwxS3MYRQS7m/f+i6LqWm1jIMbg1upmkyA0e61Sp939cqp9PQ9z0R1yrH42mz2TDzqvM66diV5RgjID48PPiehJmnafJ4Oo8BbNsWANYAPc/Wc4dvCME7903TrF7jruv8dyFi3/eIWHL53e9/CwAxhJSiB5aY6WbTX1zsuq6tUhAUwUQqAKhGB3QgMhEDoIoJ69X1lepPjofjcdozU4oRAVQMEFR1nCYYx4EYCWOMm81mUWbNxWwKxEQOC3rSp58ddbaQlAABGOkJhEHMDGJKz1+8uL27fXh4UNWr66sQsNYsUjzWzykcsIzErdeZ91dXycX1Cmbebrdt2z7c3R1u7w83t5t+u9te9JsekNCAiBRBTHWdIDN/tScQiTONB1b0xBpDd24l1mXAZf3DmsH43fr3g1L8QSD+8PifpLZWIDvbV3zPzJCduZns6WYCH9d68pAc1cfZ2/MLfslwPm8Cz0INwHvKLqyNcgUoIrXWAIEZVtrj43td/GKPqu/7e5ylP25PDFvLjmvGMM/bH3eWGABACAGR5rj2p2Mas7DtYcA6xymsjjDP1HKNfEG4Qy3FZi6f2qwIu19YQKonbc/xEDNtdT72dSZSEhAjM3EIGDgkQzydhrGUev/w69/85uOPPvrRT398fX11e3Pz+vW3ZT+l1Hwl33Rt2zXNpu1wwwqItRYTNemaCAxYiSkKGpoRoKAvZjGk2PW9Daec85QLEkcDQEZEDOhOYEACQAYCA6bAzEQBmeaQGjQDUAJmZuQYODIRIzEpuI1vEfLUc5W1lPJwODwcj0UltS0wqwnobPwkBlq51YALiJADBfScVhUwq1URiAOHEEELiKgqB1IRkeKjWFXK3cO9ElSpudZqIEjVMPZbThuzaMaEHEI7t6oVBASFqigx+dgWQYyACvP3ExzFDDafpOhdlnnuzdCQCB9H3xe4HNg/6yM5v4LgzGhs52nxHCMqIV5dXa1ZHB6qY2bPnz/3oGEfWVo9jTjXqGYAi69yga7OsZOPm3nzEmSBSkSm7bZ/y+gNAqAopgogRethPA1FRfM4HY8l1zrmKRepdZ45zqWqV8aGZqCAVXFJaAA19zv7Z2UAml3/PgLlnHGkVQpeGR5PCDBPXTQwoz4XdIYCkSJ8iKn7wfQ7TdQeb9C4ZpbiHNBmC19VrdSacy6l5pynPI3j6H2L/eE05VJFxykPp9F3v6sxcr0Ul2iO5d6wNjsBIvN2s2nbrm2alCIxmUiKiUMgRF2ndh5HXMzV4XWvPctDRMg8ezA58pz+gUQznEeJC6CVKqsneoHX0TzCT0/KcXvMrMfvISQtHVww4hRTIiYD8JUcAf2+oW46UzVEAzILNlOR51B6xzJ7mAEixRBMpEpF8WwDIIJgpComXkKomztNq6kQEjOFEAxizXp3vO/x/m8+ffn8og8U7w7HL77+9h9++ZsUoOvS3/7ZS+aPuqapUx2O9/3lZd81fZITiSBks0FqMEMkIFQTyVMLWJEQDJEYUx0KCEaOono8jv/46pWYvdy1z64uOko/e7a7kPb2eFNi4dgOond3N//t17+8fnmtKcamZT4iUqlysd2FSKfT4XSqIUZi6jcdgpRpKMP45Zd/+PJ3vzo87C0wEBcQgdoTtkQRLQXedG3f97//7W/7rr16+exulELRQn9zevei7atqVQEAAibAaigCDBaRY6CsUoHHQq1SCDqOD3/3n//XBw3b/rppusPD/e9/99sINpxO01hrdZu3xJhmJLZvVQBIFaIKopT5Vluq5IpNiMjpOEyQj2SVZmvfHDRkCBxCirFJseHghajb6ryPe2aFXFcx9XVk5WjN0M9afQx8mqZxHHPObg1zqv7hcNj03W7bI/REEKcKxkRIXIEqURlOI2AIKYdlgIc5MAes1eaiGxHQHXAicjweSqkpxt12G1zTZjb2Xqkxh5V6GQIRgbvk5jmBVfim2d3JxNtNv+m758+effb55/f396/fvvmHv/+H/fHoszIgQswUEs+smXntJnoyY7tCWlcaNIKu87mIaFLN2KFJAEbEy6odVAU/hL//gKqyP5I+h6vaq4+5o4ui/KdOAPze1/xnhZjF4T5XSaDOsnBsl37vavIn3wOcNW9nJiwhxZAI2WumeSw9BCIGX9B8AVdLqWlSYnY/qXjoGSLXKqZQVX1EwN9wExtXgV06JPLZSE4xrUIV6hz5SkgxxCY1TpaYxsnAmqbZbXfDMByHI5a63W3bvh/H0fXKGQMD4Pp1k7hpmlrodBxKLpvNZrPZ1Frv7+9zztvtNlFaM0JiiIFDLbWWGUPhYXpSH/cVpjPC2FG8IYY8FQ+ymxHMU04pbfqNK91Sq7MOXGP1jD1EcQhvm5LgPBoVQui6zs28RJRikip5zKlJgcNsohFxlTbnbKre58o5N02DODuiQgjDMOSc27Yzg1rL4XBIKTkjwkXbnGvXdUQ0TaPNsYQwjqPLuDA7P+rMRJgmz6r1I7xar1zwBQCXztd4OleH/av07/c8gg8AYozPnz9vm9Z/NTOXIqrKxCkmNRuGUTQ3Kc4AJAN/hVqhadg5iaJahrHd9C9evnx4uP/1r351OBw2mw4Rp1q0VucriYjqhEjM05RL13V938cUTWWaxmTJkxzEVYM5qAV9mmzpWSIuyHE6E0RcaC61phivrq4Ox0OVcjg8AFhfxuLAbBE19SJIn7CGfL92lpl0tnElxIvtrmM+HQ53b2+Gu8Oz58/67ZZSYwBA4ISuR63Hnii8cDYT8HSVf3wP37U6nU9Hn0emfy9x4sPjg0D84fGvVFTDah1cHITwqEsue1JYKVewglQftxy4AB+W8tTmJEp4OtN6bo54zGo717hmL+ny8j5YSOSDq+uzl2H4p9sRex8kcRYAZo9xYMu9zFa5d+FRwtmww5LIyQDQpKaowCOOGc8O0fsqni30C5zZlaJqJqIqYCa1momomDhoQkwFRAAWB/Hca7Q50l5NEQVIMFKiwAGQgAg5EgbkYIihAZ1yruXVt69LketnF8+fP99selW5ffeulro/7MdxOoR4aIdcSsN8te37SKrJCCgQMAWk4BBdJoKZfcyBu74zBGLOuZhoVbEASIBEhGBk5nxZJAcJz/97BFijEVBgCjEip8DBU5e8q7qyTQwMBBByLfvjYX88TaUAE4VgiKgKhADE7P2CORlpOaeIkJkCI7uWAeu+yn0OzGAzocLUxIQROXJVyyoPxxMgilkFUoyh2XDTGzWqDMDMCYk96EJU0EzQSEzmKXBE4NmahM4cBDPhGfzkl4DMIVM4UybgMed8TYG09xbRJ5Pg36cUf++/+kIbQuy63gOaD4dDrXUYhpub+TlXV1frjNh3W7V4XpbYGu1z3mY5v3MgIKa2afsGkIvAVMxqVRG1CqgEYFVLLuNQi2gVqWqiph7nPvO+CJB0AS86ngLmYLEz9KmXzfN3TnNK8Br6s3AklshreA9O7loZmC7inFsr5y/iwyrwQ1nL0IBdwDIAMFQzFfM2RCm11ppLqaK51JzL6XQax3HKOeepTLmUWqqMOZfqd2irIiuCe531Ay9V4f0UZq+7qshoNk05peNms7282HVdw+BgHF4Gg88asb74mAEakc8Y+s0VAYCZ1iBXOFsUDbCqqZqC/3ON4bMFsK+0pEHaUsHj48WOf6wRNRtZEFx3ekQGPObJwlxDGZibawBEbOYm6Xy0/N6moIQYYwRVhyE+TiWZginOsDvFOXkPXHmbBfIQq8AxT6nZBcJE+nLX3fftqze3v/7im5//+OXnH131bSCA+4fh7vYBA3EMxARWABEDFqm11kQxMk5VJI8AiirI7gyyWg0pAke1qkYmFkIgTgjcBP7kormUtBlljNM7qVl5KOHLd2/+8asvrrvu+uXHyJGIjsfjy+dXHAmJgJg4lTHvur4ch7u3r26/+Obr3/7u9TdfoWnLHPs2Bcb91ASUPNVpbNv47PoqpWa4LZvdrtuf3k77qZbLtpmOUBBGLVkrMKIByDz+gKZMBgDClJEOo7RD6ZuUsB7ffX3Q5uOfvWhiPN3p/vbdp9d9VS3VqkAVoTnTnJgZEEXFXUVLgLiqqCGIQhXTSBRTSJ1aaSm1KRIRMhJz06SqCoBNSm2bEvF6TsPc3H9cX7zcNVWd2S6Ljd0QEZl8+gTULOepbdtpmtwVNU2TiJxOp5ynnEewqtqHQEwNs3IR4spccZg4NKXUZXdiABA4Epa5W0IMAdBz6iBPuUzjmBclpWlSSk0Igb0vYiBKbv5dxrVd0Z7zqcDQDGjxKzBjoEAhpqbZbPrnz66ur6/7tt0fju9u3t0/PDzs97XWnCfhQMz0qADTeys+gr+4uVXBfOJgHvcxNVOa8emIhuThlwjISOFDu/P/L5Tj7zPZPU2q+O84D/60QLxO+i8loc0xFGejjY8ZzN9xEH9nfvyJSP3INEYMMRKxD1cSU4hhBtQuahogUqAUEzObWhVZ6bRuMMm5llrVjIlKqRzYZcqZ5EC40gxcYHUXqnehfJkLIYQYTE1ECpR1Z05MMUR3JDit2IkK/oMhhLZtVaWWMqoSUWqSv+w4jn6j8133ebZe0zQppVJKnjIHjiGqai3V6W2uF5ecOYQYQhUppcx7G7VpmugsqY+IAodSi6g6aGKaJrdwrtMbBua5lqUU/+1N0xwOh5m8TGRs7mxducBSZZV6HR7IzKUU/1cRyVP27YqIiFT/sv3gAMA0Tf4GEGkcpxjY53GXaVr1j18XZLCIMJHft/01/Z/TNLmw63Kwf951unY1C89DWmc3Ut+VMXPf95//6EdfvXqFhE6389++ChOqWmt2yw/o3PFnDkTBDMTHHE2j6KbvP/nk01evvrl5966UTITDOICo9zp8DxZDENMx5+Px2LRt27aEpjK1bQtgKaVHFiUgz/igR0XVx5R1hlD4rsx5EUhKCNCkJNrlPNVax2k4ng7TOLrl2VTwLGvjrFRb+/dPGIa+4scQmq5vkblCKeVw9zAOU9ps221PbXKL04IqR/g+sPh512cu6O39u8fKl3jvrvWeOvy/4Q724fFBIP7w+B9eXq//h/gkaA7wUVc9+wt4IsTYef7AI8PU1q0EfIdO8RQ37K20Fd84K16MgCg6ewfnW4y9PwVl8D1V7zK1N+vBS5rP+tT3FKSZpuzlurNK3bHVNO24fzBd39f70jQhOb4KAEANHoVvp0GZmZhUXxrNqoqoB72omgloNY8AWABjs+Jl7odERcaQYtPEEMxADAEZObiZixMFYFV7OJ4Oxy+LfLz76U+eP3shpYLCYb/PuRxPJzM8nI7DNDTMqs/GxNr1vkAZQAAIRsCMaEzmhjsK3LQtzF33qUxZSjUAZGOex16YgJD8C3EoGAMRgBGaa3WEIcQYYwocvShfEIS2gM+8b4tgQ57uDw+ncRAAjnFmBxChAYJ4Lp0n0KxZU3PEFEc0NsDVgu02cPLYBCVPgXI4CTHHGBEgj/k0FWI2YqGIsUnbKwitGBsGwkic5rQjUxFBUFT0dLRlZBWACBAQEpAAoFqZTYCmPrWE74/VwWPi1NPT6Vwjfm+7/72LKJyHwM5DskpMKSXVbrvdish+vxfR4/Hgr5BS2u12iLgGxj5d7NF1bD1/V4ureHWKLHZoU0COabfdUky52uGYax5LzmbVxav5vK4gts71oxgCmMwvTg7Y1kf6MbrAtP4eOItSMQUj+z4gFq4//r3SIaJLz/ZhcOkHu4IZmqEBOQ1XVaqI68JV1G2Jx9NpzGXKeZry8XAcp6HU6p6dFRG0GBsYkObFwzWbs/kQmK28qGoA+rgMqpVap6kAHIdhAkBm6lIy8HsB2ho8d4bI94UnBp6NjMR+WTKRh3CpWSlVRA1QzWqVIZcKJogZUCnocqWCKSC5gvgeYNn+pCawxCAt/RREABCVOfsbVoTUY9ilKhihmImAdzznih0IjdTUVIkphIgG0wQik6mKKSPPXUERRF8RlNAI0UcrvdUTUoexHQ46VZumQqhXLX90fXmzn7789u5i233+crvpooikLk23OhkKkYKJCJBXs1VK5Rg6oglM6iiKIArBAFEUq6JxUmRF5RCeX1ykrtu0TYgQAm1SuFRqgh2CTfthD02G+jDs/9uvf/VnP/rxJ89fpLbbv3t7PO1Fxe9xIbYpdbXUbre9/eqbL//+V1/83T/a4ZjzoWkb3rXtJnVt2ucjg53u75uLTde2z56TKO5EcLsN8V2u+XCcLjaskStZ1lKkIMX5kAKyGYEFVAAVomqUj7k9wva67RKIjHl/ZM0ELKc9lbGP2z1ANShqVYVFZuoWB7di2VmAsKr4Kq2AolAVKTQX18/0RJuIfdsQkQ8yxSblXKZSUkhNio41ET1Hij32Puc0WJ3nRp6G1vj09cxDCYGbpq21OJXyeDx4H+d0GvI0gomaNk1MMTIpLRoxwJTaWnJFcFECTYGIiYJKQUTigEgoyKwAJGKl1Irg6aV917WdpNTEENWM1YiYg3kG7RwPOefb+c5iXgzd9ghoBqKCHLhJsUmxbbtPP/54KtPv//DFq1evvvz6q/v7h7c3dwJFtfpbhDkkkwDP449XaNpjyqau9zi02Wjm6XwIsACcTdHsQ139g1nO7J+dLTurpNYIO/xOHfSkXsH/zvfwOLL2pD5cK0T8vhfFP1ln4nfKNCSiGCIgVakKGlIMMbo06WOmiMSBYwgxBhGtpTgKijkAVM8fnqaxlEohIOIwDNvd1sPTcs7uYHUA3bKUzbEBMIe56SO3zQAQQgh+V5zyTDwgZjGnSfCs7eZsZpvNZrPpx3EcT8NYZdP3bs49Ho/TNHVd51lwLtq6y7WKlFpTSoiYSxaVtm39bauqYx+8e90QhRjVzPMPQkgCmvPk7GAAFKlVqjObRQUFne8zD3o4BtCz3RYbaa3Vn+MOXyc/0JKiO7/DWv1pj2ejWQjsn7ptWzAbhqHU0m82/pc+Y+HCtLODEdGRytM0xdCHEHKezCzGtHq0ahVma9tWVQOzrZgCJgTMJYOBHxDfwrmavJqI3cJ8/nFWAMJaHIUQfv6zn/3mt799eNjnnHOuapqazpvlIXApmHNp27R8WPUBFCRScRAWIKOomtmLFy+uLi9/r3Z/f4eI0zQSACKGZQPnUMRhGKYpI0DTNDFwjLbpezPrN8AePurTpov5dilo57JSZwsSLgwWQEQOrCpI2DQJEXLJpeTT8TCOp5qLqjzBPby/v5vx4o9CLcyYKEJqQ9zsmjY0+4f9zc3t4XBI43SF0DJDOJdL7LxktTPxB8CYeBGLzhjEixTjwgs+egGXQXG1hTNuH6ThDwLxh8f/XLqwoSeevV9OLo6kR6uj3yXUVjH4PNMWz7EPAABI87SQ/9ML6bVzda4/e3yn773VFq+wg4BBZm6xrcPmVeQ9g6C9v6dRe7z1ei1PKnMKyrx2GIGPtyKAT3msAIl5hh7VQE0xsojVKiEEjwlePoItlTSCGSGsxY/LgiZqtZp5CEKVWswz6kTEaRKqYKImZrNHWg2XTCAfbUkhpdj0EBsiRoBSVaoAohGrIhAiQcTE3ITUHw8P3357u7/fX+52n3/68b/9d/+u5Pyb3/32/vaulqJVDsf90WwYjpHwert9fn31/PKii/zi4gKuYk8EqqYWI4JqAvJOPqAxcwkxH8ei1cBMCQTUBA0U2R3AoADGTEzIGJhCwBA4cGwbh+aRT6UhgNrM51cxMgOrKqWU2/39w2lQ5JgihVBrWeolVw5gWS0ZcD5xVasCmqEYOKif5rINgRg4EESwIIZMVLWGGFNKISVQtAypbRXZkCg2sbtot88MmyzIMVJIwCyqhOCi/rzDYhYRwqCrFx2CcRAUMo4Uos9Yq0Sr7NwGJ1f7CQ5Ac48C319nv7Oun7P8v2v6OFeH/V99n+QaTYrNs+vnKaXDYZ9zGcfx3bubaZp+9KMfXV9fO5FjuSIWWoX3qj3nbb6cZ0a5z13xmbRlSCIaYvr0Rz/tNpthkm9e31oVD2UH9NQsQ0A0dgu9G7nMwa9+BAxN3TpGsPamHMVl52KUX6A0M/fE1lCVubJeTc/f2RqtcMenMZLLmD9+0It/II9xHN+9uxWzWqtvnacpn4ZhnLJUKVJzLsMw5DKTjYrIGYWRzKk5M497nqldvMPwGASEsLL4FzcGEZoxkwEbqJmAlVIOx6OBEWP70UsxWdLc0Cf61zkbv75iDLvttmka8wDTOnNSfb1wRbvUqgYiMOVyHKdiijE12w133QI8J0Be39banXW1l2Z5ep7GsTOH12Nanb8KMzgpj+aJFiDkeZpnQZQDoqGIlVqLqIGjKg0UDITmKFcTqWAcY2TiEWEYTjUXFGZGVcnDaFYNgEPwlDsDQQ5ujQyUIGxFN+9u6m4n3NQN08+f9RftT/7pi9t/+OWbh6H87Bcfxy68env7+v7wJr8LY1MwpaiAeJoGUc1cKIRLIkA6TZpSW1lV6nE8Ieg22WkqfVFG3DTtJ9dcqkg+ZVG0mJBNoYxyCsqRL1vIcSo8Pbz+7S+Ph+PLn7UpjYfp+pPL4TiGEoj56up6220Q5ctf//b/8//8f99+8Srkuu345Yvr3fUFRmJmEIuJX3/zzS//6Z/+ctO//MmPOZabu3sKoRYhMT2N96/f9Fu8T+ME0QDZGA2lKor2MTQEDUBE2nX9YRxP44Aw5QoG1rYX3z5MAfHw6ldlmuTm3Z99fLFpwuujPFQ9iGUROB5VpPGp2xBjG2OIXlp74V1qkVoBoCiORfum+/zHP68Pb6gOTEbzzVMJITCXKj4lhbSuGqu4pOeBvR5KQbT0IrxrhyAquPyr2vycGIM76dq28bns4/FQSrm920/jpCJAhLSDIgDFgA1CytM4jmYYQgjsQybkU0aee+XiRVBl9uA7dtO6qg7DOE3ZsVSbvm/bNgRmZQsqIhKIZ5SwBKG5j0O+xwmEqFLNiMFkngdGdohqaP/qL/7sFz//6f39/Zu37377hy/u7u9vbm4e7h9EKxHrEgyMC7nDQyB9C2mmT6S0NcmO5ltTLVJNPCmrVvnQ/vxBlWYG5+Y7eIzY1rP44jNPn80hoLZiKFYXBb7XR5+bfusysS4ZtqxuZsuAKQATenaWn5Jritd3eo92PnQGj6OcZ+4as2VwxCszDiG0XR9iUoNpqkYQE6qAgHsiDQCJkSnEkGot4zg68sh/Q85ZdfGcMnOIaoqBgOg4DOM4+HDKcRgQsWkTEZ3GQVW7fsNEImKIqWsCcyllHAc326YuIWEtdRxHM0sphshSLeccYmybxk2+q301xmiNVsxVapDgMquzGpi5aRqn6HRd17ZtKcUn/Nb4uHEYUtO0XSciuRYAFDMFmKYpxuiRLSIagqLDn02QY+IwjKXW0jYNItexlFqblC42W1UdhiGEsNlsutTc3NwcyyGl5AJxrdUtzE5vqLW6WXgcR0dYpJSGYTgej83ySYdx7NsupDjlyW9OAqq1pFqL1GEat/3GlfH7+/u+7+e8u5xTSkhOOWAPo23abhyGu4d9jNEMrFqtCkRFNcUoKjULM59Ox8AcQvAu/3qeHw6Hruv8zeec/Q2XUqZpcqW7lOLfiH9YM7u+fvYf/uN/+NUvf/X116+mXAEqB2i6qFbGcfBg4lJMBFSN2FjV3eheTxFS4AhST8fj7mL37Pnzy8vLb7/9NjAjMsxZqRCI265v+j5PE1JAqqJ6HAZTJdCHeHp4OF1c7FKM0dPVmWLgwM5mnFcsd/zqoqogGhEayNycnHdwGmIIMdRapNTDw/603V/strbpQSo4Ih/RpRNmBkIDcuynqSKR4538oiwio2oBQub+8iK0zTCOx+Ppzddft7fd5fPrpu85BnAPPszZT0A4ByW58cFcEJhFYUQCNPDVDOBx6HeWjjzs1QQMUZDnvSgRmhGiwb8Avfjh8UEg/vD4H9ylhhmtSHNIs1eJtIJl7DstZfyOXdjHSec60zU883uT6iwEIZh+T3cbwLPG7DHNbv2dJiZiRDPgF9zIScCLxRbgvf/7/r65b74ZCXgBYNncx1rBpY97LJ9eWbNlkQAIOYRaJcToS/6jo9PxQWoi9ngkbLaaqFRVqbXobDo1qdULfvPgb8+rNjUkBXLhKysac2zaJnWp2WBMwE0FH8A0ZRdiQZEgspmaKqfUdJuUMwBPp/3hOAynYRrGF8+f/+Snn/37f/fvp2n48suvXn315d3tLROdhkqIp3F4+3C/bdvLvv3xRx+HpjUDC8GItFT0opQAmdgCGUUOfYq5FI/IJWJV4xA5BAQEJY+naVIiDsBMgSmEkAJxADBV8bHJOVnQlllWNQXItTwcDw/jSQlDbJDYwJgjIKiUlW+AcyDbYltQELWq5ryIgmSzt9VUFdGQkBTNgAl9H9QEjikZhakKt5vdi49i6gyoGEFogNtKkThAIAzoCRcmJqCCoCJWLcQgpjR7W1EBK7AqFmQyEiQFNdQFWk0AyKiAimDiHYlZ+1zUpqd+4ZXu/8dC6uA7CKc1VtihbHO+Rwht27ZdQ0S3t7e11mE4iVTfrXZdO1ObYdVMF3rH03bx4yU2UzTOaFRmRDElPg45T7khShSImZkAFUEQgJCZTB1hR7M/Qw1UwWGOYDRb6R+rjaUpcHZxmxoSMJLO25z/vm7zahCFp6CrDwziH8zj7dt3//Xv/l4NFtpDqXUeA61i6wkwx7gjMoWzMttMQc3Qn4buQJxNlesyM3tw5pPTHsnERE4bNwMPIFEDMT1N+fb+vk3xertBIiQCBFHjBefgxbQDeU2tVqm1uF/SK7dxzMM0TdOUc3Y3r1SbiuRajZG7npqGW78+VFWJzNR8w71aOZa3778S5Sx1egFePPoX0bUAXP3EQEhEtJpA/GgQoiEzEgMImJoRaKDotwhVBTU3platWisCxhiYNg/5YRyGEJkIVCRPIzMTKpr6rV61GKLWIlKSpaZ9MZZJoKaAPZeOYRu7y4u/+l9/+dUf7g/jW73+pHvoLh/a8uUXbz7ffdo3TUxCFRX0vhwnyBlwG+PHTT8A7SkOmnM9jaUgQRS4ubu5uLhsY9BaZRo5MCdCRkYYhtPxePz93fHLXOJHL5/9+NNuG5s+vH0ntzd3v7n5p36z/eTZ9TSWm3d3L14+H47HYRx+8qPPEcq337569c3rfDg97+P2IvzNX36mIG/v7h72exXiFN99/frz/SHF1HWb+/2bt2/fvvzss4NAgniRNnJR2zSdDCfAtt3UFu/fHAJ3TROjaSLsiEixY2xZCk/IGCIZ2M3D9Os/vHv5bMeH1w3KbovXl13lNO7hIHCqMBYhmtSkisRaQ4w99TGEpmljVKllIuIaRKSUAqACYAQcUyWe4beLW9XUHaxiAGbsF8aCz3z0Hc4NzrnBR49e2XWC+xzAC3Y256HeoUwphrBrmjSchpvb+7v9kOVbAAwUDFENFYhiM061aStR9VN6zldca09GIqsAMUHTdiEmnCYiCCHB4ijIWUqpUmXKOYSQUmzblGJSxRCCETCZmrhdgAhrwRBqDf6vzMwcBJGMOVDyyCMmpBQ/evHi448++qu/+avbm7s3b968+uabV69e/eqXv861xphCCExMzAQIKnoWN+Y859l7/Uh7W5avJbGiitYqH2rqH5A+/McfT0VYsPc9ffg9UXH41Fswj+/Z2vU8m2ebr0OPYwXHhJ/RAG2FFS17sPcj8fC7n8TWhuhsJzQAcm06hNQ0LRCLqqmFGAMGEBBTIqYYAgf/kHnKOY+llJQSojFxappSKlEAA0Q2YkMYp7LZ7ZgZaolNQ0Sl1mEc+02PRFV1mFVXmhZ5sUmJiBSMlT1RwKm4IYRu25VScslTyUTh4uLCuQeI2Lat22Nvbm6YuYkpMA+n0/6wb9vW2bjue22apm1bV2ZXHoJ7bN0WlacJiLpNn6WOw9Q0qd/0tdTj6ShZu74nxKmM5ZjbtmmaptbiKJ6+70op4zQCABJihTxlIgrMgdnM8jg5fMEHMmKMbdu6cu1yqs7wXCUipwwDQFyqXZewx3Gcpqlt29S2wzjqNF5cXDZtezgc7vcPXd8FxFILT8QhlFJW1jARuTh+//Cwu7ho+804jre3dzHGOZEICZHGKQNaLTleXxFRyZ4LYz4uWstESLvt1nPYttutmblwT0R935eFU+HKe9/3AJBzDiHEGFXEAP78z/98Gqf7h/v7hztAA5QYiQjVVBVUEZANRFVrVSQhVlBDAWJeuMRYSlaRi4uL62fPDGDMuW1bAwRiNRnHSdSKByoicWzQo5Zqkaq51JhryWIKKhqYCLESEVEI7ASPwIGIgNC7rSsdAuck9yeNfSaOIcUYA1Eeh9P+YdM2bYypbck5HqZetBkhGrq1eb0tEPLc0CUss7hrBoZtc9F3F5eXh/3+9ub269/8run7y+uri+vLvmmMsHqou4jPty3TLGZmqHOUjZqALOqLO4+WG437JACMZoeOmwNdDVlRG4/bgg+PDwLxh8e/5hZkEd/mmfnlVjSnOsFKBLBH2/DcmEZCYIQ6kxmXCPkV3ThX0DYjQs81mveIM75lWfvh3sqOKQKTOtlgRl+p4RNdGHFtvD3ePuct0BmraxmWcevq+vfo73wxSxIjY1h4efNtlDabTZ4mXBBLIQRk9EgBmvUCOIcqe36RStVapFbnC/umQ6Sqq8NOlTNUJAWqQIqoRNQ03G667WUILXESgCpWq8yoSY7A6Am8ZgimM8EVgANtdsQc6hAkj7f3+/3x+ObmzV/8+S+uLy8+fvG8i2H//Pk0ju/evSulVLU85dM03e7v7x/2p1w+vr7++Orq5eVFJDRQYKPQIiMTCxgZYaTQRFMnIhEQcUjzbocCU2QgYkZCAzRCDuRB5qaKcxQZEiIQ+hgrmqKpqBxPh7vjQzahFIyiW63nEDJgNEAw1yh8MVIAX4lPpe6HcRJRYgXUeYZbDTwGUMCX55zVhAFTbJGiIlNMfX+5vf4YORkAV6hGFRggGKGaCii6k5acmgxzfMFjFCwYAhAbkACJBQIGQEAFNGZhAzVAM1rpIavDYgZVwwrNfU/5/V7p88z98QQFtYbYELNfZ4G5bVsibtqtD7Ld399P0zgM093d3R/+8IeXL19eXl7EGHTJxXIWyhxB8HgJ2WPAOvho0nIw/LcTi9rtwwnqFAk3TUccQuQYKQZgQgJg9ok+Ql2I5QgevuERj4izZxlngLUuM1VkiCKLfk3u1fSIH1g+tH2v+Wb9a/sjIjv8M3nbHx7/J3sch+H1m3fko+pAc3qoeQQOACLq44nhoR/LtB2oeloUzpfDQjdfOwhzZcyE5+2ZBW6+qsp+Y1QzQ1LVnOvDw54B+ibRDF31TEjFORl1tglWseNpyPl+mqPzplIqEEmVnMtUs6+kaiAKtVpVAETzyEdARF6IhAakHnn/iE4+kwYebxq+b1+ugyXI1Vd0nicdET0wiwh1nfVx95D4rAsyU5yJBEphtoapkooaoiP4qyoYEGHgsNtdHvcPtYxixVRKyWCMCq7rE5EJjlOehiEiXHGCzcXb8s0nOedejRHAGHIsD9c7lP5KmfY5716+ePGjT3+Nv8YxRortVX/49rBp+5HNTAoqGEVMwqFkqYYpRiYSzajClgiCGA6A+9QUUSr1klNCAihNkk9fbmCSd/n46ne/2l1d/vhHn7XH43OBCY7l+O4P93/I009fXD9vNk0TebfpiK3tus8/+/zXm7+/vXuXtYTNFrjc3bwehkFBBRtOG5Pw5a+/vn75j/3FRRswsV1ut69+//Xbm4dCoXv5kclD38mgp22fQl8y5EQcUxzLMKoOEp7FXUMN6alreXe5+9FnFxe75ou74TAM+G76fPf8ogtOrT1oPHGjSbERRkUjVcu5OLGEEECt21DTNiFFDCGUombTNNUqSMXIzMiIsS7RDTZrkwtqZV4/9Kw3vxIUZ1jpwjBEAjB672xcW44IxjNGStFwwR+amjJzt91cqA6n4zRNX339Tds2MTVEyr7VKnVbfZAdAAEAAElEQVQ8jYEDEpiRmonIzHkCL7l9Jn3BgobgQX3I6JGMqCqqAjCMIxgwUUqh69qUYtd1GjwqEplYxAKTBTLTWmXJv5rj7ohZpaLjYvxAECNiy+GjF89fPL/+s5//9Pbu7t/81V/d3d1/+fVX3377Tc6laMWKZhA4eJ+GkAFMpCItCLZlH43zTY1W4W6Jyfzw+EFZeN7f5Hx3I/PUw2uq9sfb3niWfKVr5Mn37Y7WlIa1lDOzP2bI+ec+xRk/z9Z5NQMDIIwphZhEpNQKiDFEDuyDoG5lVbXqdAgADpEC55zBgEIoImPOfRdPp1OpQiEqwpRL07QP+32ZptQ0IYRSysXlRd/3wzC4r7bvezPb7/cuMnoLNgRedUbHJdVaY3LYBRUpZJBS4/wEPyAu9TprWFQY0PkMLq26j9VfvG3bFNMwDqfTyRHAHs7mEqozKAAhtS0ROTo5xrjZbKZpcm9s03YmAgDMhBjd+esMh9PpRESbfmPRcs4lZ+46F3b3wxhjbNpWTqecMyJut7O/WKr4j3s70LVjz2aotXZtl6d8PB632+0sdo/Tdhf7vi+1iAgzN6kppXRNl/M0DiMYXPe9D2RsNr3H5e33+81mk1IzDoPn3Tn2oZQyjlPXdRx4HMeU4ma7ccSzn5MuIrujRWrdH/Z916++YOcI55wPh4NDpd0s7JW+f0FrcZTzRMIXFxfPrp99/dVX/u10XcfMUr2NaC6Cu7S7lLWsKmhk5qxnLUVPpxMzbzYbRDqejn4cmOf9ZBUZx5GZ5n2VLpW6aYhps9s8f3HNPLMQwV0JoKVqroWZeF5inKBBRGRzOrEzOeZFVedkDQ2BU9NeXT3bbC9U4fbuXg0uLy6apg0hADGoVhEycpDRo7sH8VwpsdWOg6YqWZSJtteX7XYz7A/TcTi+vT29u+s3/ebqsum6FNmIaxVPmzdEJVgjJtzRM1eNOvuo8OwOBYYrw9ONxue3sPlW82Et+yAQf3j8q2vEs5123sTbirRaW74rTw6WCLp1k7Dk2y0UVFyyV8+I5rMj8mwy184eXoHCUou66Pk4Qs/B0aVmaIDArPJE/YGFWqrzdmO5hy5BKOCxV3Ol7H01pNlNNX92MlM1BEDyYLo1RHrOp48xDsNJRHhBNaHi6slaOLq2pPp6s/HxodUzYSuoeE6dT1I6j14NxEAxQkwc29htKfWUGqMgPk2EKmg6K2iIyMhsBiq6DIqRgSmhsWFsUSoASLZaa92ffv+Hr991NylQivHly49UpG37UsuYp+E0DMMxq9wOp199+Ye7h/uH43Oxz64vdh0wZgwLm4oIfV4E0Qznap84eAZ3WEZTCchnOn12dDan6eJyWc8Ve4w+NUMRnXL2rZLPo+AcwuJHiNCzvNFm5zGgAFTDLHp/mm6HPKnJUmEaKoIxgmpFLWBVtUouitb1226zrQai1DR9unyGsRdnejCaoCekLf2J2VioS3tzPknVFEBnwAjNkhCiGRoSWABTYGOao8pBdA5TMwPCdY+MaKCIhgpnmQK2JMM9GdM7t8w/6lXnMrG3T3ysNefsV4ifqjHGi4sL3y2N4zgM4/39PRGZ6fX1VQgsYk/oMo8NGngvEHAVqFewlKoiQK0mRTOAyIRUQuCmCU1iJgxkTEbMATxv3Xi9yuamE8JZguVjC2pR6BD1EfG6wIoXFzCsqZiPXICzPD3zKxzX/L1zp4wPS33YhfxwaulH5RZX3AjBmgxJtk6jnE3mPrZkzjol8xgvnoW6rTl1Z/O8eHZ9LLgGIANDJA+1KqXePzycTtddDDg7ez3/3RyaAguFqdQ6jNM0jaVIybmqIpGIZvF9+IpcRyBV9ZkcVf9MuKbUKSg5p/v7Ioxwwb7D02CB5Wqyx/njFdg/l/d+51tyapc1UxExEMnCzMQ1PvKx7YwzY8pQDMEsxgggOZcpT7VkpkQzP1lM1bQCSGAORBC4WPNwghJajVaDgFYFoZifXVAe4M24P+qh3eLl9vrZ1W56fcy1tIjIWFUAQBGqQUEkwFx1yKVQTa32DYYQ+77Z9i0CjrneTtOroRbVBiRyShTAMoBcbvsSbNwfx1JtnI5vblOuuxhhw0eAfJTb/RvBurugZxe7TdsfTg+Yrvrdpt9095FqzYhglkFL21Bo41RCrdB37elhf//mrZyGzfPLF8+uCOB4Oj0MwwghNJ2WiTa74WHPWivn1BuVEahKmHLRYtLjloCIse3S9rLttpvUhKvL+OI6n+5vTofDhjepTZr6V/f1ZggVmSOxChp7X1FNa62jgRkic4gcU0qpIQ6qgkQ5T6hKpATMgS2jgjpma05lWFjabon38NbFZ27L5NhZ7MOyPftuA+M8Ndh3ckysbmJEXX80NY2HzI9Tub3fX15dAZApMU8hpK7tRAQripMsFNwct6rVzpAhYmJGJFWBgLO731GmCMSkIqamKr4FHCfOuTRtSjGmECwYMS8f0AXnBb1mJqrs4pEZhcXvOY8NUyBECilwimG32Z5Op5cfPX/77vObtzdv373b7/e5SMkjMRMHYB9TAzNeN+J+/eIZf+lDo/OH91hcwvYkl+V9jfh96/DZZOQ/M191htvCP/GEs+DufxkQ+fueeTbxthaUvvcyYg4xEFEuRWrlGCjQeTAsIooUz08jIlExsClnpsAKpZRSagl1KoWIkRDMiEjN0ROzF1hVu64jQpGqKk3TANgwDGYWApvZNE2lFDN2wIvrjDMlqc7RbUQsouM4uuzoxFun4sYYDSDnjGZMnFLydM0QAuA85DdOYwzRnblzuBwT6ewecYyDr7nri4cQ/KX8l8Y2IkLOGdHbUbPZOcTQNI2qKigRhRicvDx/BLQqtYHGmQ+11lLL+sqiAq7xqU3T1HZtjFFNq9RcMjG5EgkIHHgap3Ec59eRSkxN24hKqYWYUvKwAbdSgar4kXQGNDMNw0QiMUY/+CsDWkT8xHFB2Q++/yfnGhOReE1JBAD+xa1m5xUkvT5/Tdb1ojLGWHLRUtq2vb6+7vvN4XBwu/SSVUgu+j8ixeZ35cvHfDIAgGfihRCur69//vOf7fd7R3OI1Lu72+PxNI4TIoTgKbiwOHgA0IghRAopIIAsFRYyIMwbJDUxMVQgpOodTGACIphfzSvOmYo5m/iQmChwTDG1XYqxiuwPx2HKMca2aUKMhESzWmsrNvxxEmAeZSMgdHHEhP2+YISUwuZi16dGxzyVXKZ8+/pNatt+u+k2XeKgAAYkPpGwoGPmnD0zNEXfgeN5x8sFJoKnM+WLZLwMxX4QiD8IxB8e/7qbEHcDzqEYdlZWr2u5zSy0s03KCu7EJb4HHomM+Jh2cl42P8pf34nbWsYP0DU3M5oRFkTAaEC2ltxIikta3EoRneUqsMeuN56liLioCSvlDYCWzRf5jVLUCA0MiAkJVWV5W6YerR5YVKtIWBJaAYCQwOYp4eUYmJqYus10jnZXNfGMMxE0NVB1uPFM/gIzMgyUOmo23G5Du8PQzEEuc81ESAENVMQMiMgowNxCdF6kGZopVlELCVLnB91qFamvvr1Blcvd5sWzq67btm1s240hHIfT3d3t3d2dmZRpfHc8FNNiyjEq4nXfk2HDBQLHwMEjzhFBbSFUK81f/vwHRwvP3yMigjuAdM4883bqLNA8wtEUrFSZclVD5qhLAgYS6eJrA50VGm80qpoYF7Whws1x3JdawQs1Q1UEIzZGRatgFa34LkoA+u223+6OY4YCTb/rtlcZQq1qQIBkZH6ynQFKUHXO9p3DNNzVDLP1lWZsAi20NgRjJCK0aaFwoyoBzSslgAF4jX12IiKctVDpycT3k3rgsbQG+560OgQwJGYg1McpXiOizWbjx11Vp2k8nU4OgGmbtNttcdWN1kpjlsVwdVkanrkM12d5ygGRAGVBU6laCImrFNVSODBy4MSR2aIBERBCCky8qkdnJBtcL2GbExyA0NHVSxfpvUi9R8iMeXzlOnq5zD3iii/HNQtz+fsPdIkfWEXtm2V2m/q6hK25n2sqpidYvt9feeqxWlRgp1e/Z9VamxOEqMt5uJx4RKhKSAro9+jhNBxPQ9ptiHldrXDWeOaOq5qZaK2SS62lVpkNw+JM/qULOCfAqZtPgGG5HRks9s0np/V3Px3h46p1DrHB5SLTOYEPAR+vL51lqXmpJ1xtIuo3xaUFbOc7h0fpfEkvMBVQ4xAMYhV2xLJz6cFvTyKIxoShiREZQArFh4oTdwMB24RmhJUDXF/Eg+TX94d8qvUyQB+u+/gOSy2TWApNmI7Zb5hCWBEJccw6yIQs3YavL3nTUtvwpgtgNha5PUxf7acKcBXh2RZjNZ0KoVw1aVNrC9BTSBXK7cPVpt0ksM6Y7BjCu+Nhf9K7AzNNpXT6wKFtN5cXF9eXN6/ash8IiNGYlGOwmHCi09G22/bhME37vQxj4mfPrq8HkWHKo1hhQgoQYuVYiApUauzZi0aHmkgNm3LMw2hHrU2IFEhIK8MExMDbXf/jj/Wr4baWWsQihgHSq8PxrkBF5oBRCZEJyO3DqlqtEtI0TalJIcaYImsQqRwYCbBaRAyaK5F6a50Wkz0Ryjx65Rqrx8eeEYoekUGLc38Fx8+nxopIWmfVXXV1wwChVQN2aBmp27VSSiWnWseHh8PN3T5PtW1SyVlFY0whRQMIMfgGb5WWfNE0RCR1ZyIz51ofOzsACOCsbZgz6UxNc8lQIJfclqZtGmmaJllIMMMYZ6za2g03ElHmc4UCkXhOq/VxfUSkrmm2m00tl89fXI/j9M2rb3//+z+8fvP67v7h7vbeB29FigExBzDBZcYYiecOuj32reH7hv0/PP7PLRDPDC6z97EN+Ed+xBbDjP0flfWE8+DLY9X2p3WbMw8hvldrLoE288SKL2cxxhAjEJZSDKAJgYgc5bTqpO7n9RhLqYoEqhACeS4kAJYqZhBTImarNcXovUY3crqxNASutZppCCEELqUOw4mZmqYxg1KKbxBrEbduui65siZSSgBYcjkcTgDQNAkRpynXWj1CTURyySLStW1MUURKLaISYiAmA3OgRN/1gOA8YmYOKfinizE2XesDp84cWAdwmcl5U2bK/pakpiYRUZ5yldo1XdM1ecrOkY8pllxyyREiMSVMpZYqNYQgKlVqKSWEEJuoplLFD7WYTHkKMcQUxWQcx1zyHIpgSkZe+Q7jsN1umdlNxCkmYpry1KSUYpQqwzD0fe9He7WMOQLCbegAARHHcby4uFhT8ohIF2SXH/x1WnfWahFcmPaf9b93E7H//Xm7cQ3KW53vIiomTdNcXV1dXV2N4zhbmogW9Z/8160uAT9tdBkYdd3Z/cshhOfPn//N3/zNNE3+Bobh9PXXX79+/Wa/3x+PB5HHcZp5YSFYz301q+IZw8AO9zQ0lLmg8pao0yvJkQsOJZvH18iDlP1uj4TMSMQcm6Zt28bMcqljqYEmEe06iBzm9i3R6nDQZYJ1XjjI02Y8vnzeO1Y1QGja1KQm9DZM493Dw93DwzRNtRQV6TcbDsGTaxZ2zLKCw2qieKxyV40Y0TewBPAdFI7zTpddwYfHB4H4w+NfbRNiRq7VEfgwAK7OvqXTq2tfeG39rFe6rjDiJ52gtWdsjxkLSxDqmeth3VLYY/blnIBCM1MAsHrgNhBgcOXQzoyAOruvfM9BS6FONg/feQXC/nQiRgqIDIi6JPiA2ZxnN8dGg5oYqEtO1RQVYwiwoJo8WtcLalWHLy8RWe45keqmFVNZBGI3RnkG9iyve/geKWNs2v6SuysIvXJbMZgxGqEKkIetIRit3tulrjMzQwKgeYLDEIVUKWpQJI6xARGdsuQRpdwf8sP+m1ffvtttNz/72U8ur6/6i6vN7ur5R2MMdDzs9w93KQat5ZdffXX38PDnP/rRpxdXAbFvEjsfgBTAxVnXt1FRGMCQTBw3D0YO1Pczisnj2AwNwVSWlFUfJxZVVcRc63GcpiIGjJ5uDw5DUgBUME/cWAdaEUAVKuAo9jDK24dxMjJCU0V1jUOR0OpIJggFpJBKJFawbrdNm+2hHqpI23TAaSpgGLwfq3OiOIH7dhbo2ixh2NoPcZEXFIxUAyoSgTpOCxVBDLOhgM+IJiIlqQTGgABic7yewXqKzkxle+xy/PFaAO19ssT5hWZgVZxq5eE8c0+WzfrNxnvpb998W0qpIrVkQpOXLy8udkBMiGIKC1JGTf1inK/uedR3ppQviEgzsBATQBiKjsPYNmnTd1K0lOlExkQhcNe2MYZYJUYKjGpaVYk5MAOSp38tOxecud6LdRFnAMW8uzJFW62RZt5Pn9XhhVy8+Ii/x69y1pT+MMH0Q3vMg2xzYbAYlxarxdqyPGdbPyq/S4bh2cL0/da8ZTiG0FCXxFaYncCevo2LaubGQnUunvR9QFIwrWIiPvJHcwHg3CSrqkW0irp53lOzkZApiAGIGpDoipUgDzbxDf8ywrJ2RQxm/+Zi7p2HCZ8s17hm8C1DDgZmprSO3yyUAF9mieYfYTFRK7WoVeQwVxpLT1RlxhqiPd7qnOmMALWKqqWYdhcXUsb5xUXMwGBC4BADU0QFUTPgofLv702q7YI1pH2Q5zva9vHyVJ8FbkWv8xTfvd7yDpINjQY0g5hr7SGoihmWQBSoQJ3yuOnxp7948bPPL1BPh8N9zSfRjVQdJz2cQNiebzaT0Vc396eHd8+fXVxyMx325X5oU3fZ8I7w88uLUfJXD7d7xObq+cdNYyil3Pzhq1eH/QmxvXx2/fOf/OKnf/aLh2/fvr7dt9B0oX2TC6BxjCmRiF1ecS1aT3e3r980V1faNYdpGgxx0yOEWmswu707fNS2fYTLXdt/fG25IFiJ17/98vYPX9y8uj1c7bAk/PrmLedwh3Z9sb3u8k+fby7kZYxN7DYTx3/49uG1bKy9NhGi2jWtrzuGJKo+hwQIpZRhGDiG2KTAzIFEJTWRa0P5YMd9VSUn1XunMARCMnLmP5wNjS3ucVBTI6LlwlvxgoZzIqmn1ywGgXnDNt+yCdhfmGluGqqqKhQtKq4f4fF4/M1vfsdIkXG33VxdXL98efOjH3/+8uXLy6srZxArPNl2iggCpJR2223JueTsNoDHq2KBPhERguO4QU1qrYdSh9PQtm3Ttn3XNCnKKjMwz1M1ggDITGogoojAHGMIEMCpzSAGiCEEBNBioLppu23fP7u++su/+Aup8qtf/+qXv/zl4XC8v79/e3s3DacY04JRJmY2qUhkCgboHjjfANDiLvvw+GG4dwAXnJbpE9vwWTbdUmHZUxgF/rPW4HMH8XuzJu/hX96r1/4EYsKeYLueWBzWyvEM+YWAGJsUUlCwqhpjcMOjd3SYH729LuSpKDE3TUMUmKMZAnLbhjLVrtu0XZtLNrQU4/F4TCm2baOqp9MQQjCD4/EIgJvNhoju7++nabq6ukopDcPJTDabnZrkYUIM/tsBwNkFsFiGIcSU4trQCoFFas5TCIEZQ5z1EFHhyMjoFIgQQmoSMQEAMjqMokih4PK0eTRcv+mh4DRNANx1HSIOw3A87plD1za11GE4tW3Lkc1syhMzG5qqTnkiIiQspQBBn/qQwjiOVWsTmhBCkTJOY9u2HNhrhFJLSgkIihZTCyEQU5GSS44pzp5crR13/ruq1KZp+m2/3++nPDVNI1kOx4OYpJSOp6OOkjiaqYoAtGY2DAMANE3DjIfDvu+7lOI0ZScyu96K6J8XLi4uhvFUa3H8xTRNfmSmaXJ9tk1NSunu7q7ve2cou6zsPmJP/3PihNM8/Amu556OJ2Rypkfbts+ePXv37p0Lu36O+TthZudEi8icrTcb2MVp1H5a+le83W7/+q//OsbY9z0z11JPp9Pt3f1XX335n/7Tf7q/v/fZyjk6SAFJRbVIrSoANkyDFh+1TORuNm8ILeYDIiL2ZUVFRQXc+gArx9dldCLmGML8lSFS2yYALKVMOd/dPzzsD4F4122blFLTAHtIuADN9jj3VZiZgKzRSy6cAIOZTlJFIBhw17zYfrJ7+ez+/v5hv799dWg33cXuou271DXITLgwA4EAgfzG4j3Z+SZj84SQ7zNVZrFHZx/DY6v4w+ODQPzh8a9fU4MCLv2l2RC4Dte/Nxl0LugCukgoAECAbDDPuS7K8SOyau0Dw+x0fVKHq+mj9ckh6bMjw4k5ILWquolkMSPh92s7K9xVbQEhL7fSWe/DWTibtz/q8sFiK3OjpOEcLe1yNTMhcYzdpjdRv4X54jHrZitVwm2qUtX/p6IiJqJSTWRBDgmYAJkhGrAgCcbLqxex30nYCLAaiRqAAzFZwY/OGdrH+Y8qYEbEc4PWTcxoBKqgCAGROEQMCpxqiFonKVlqfpjyqT4c//E3TZOQKMbYNJHA2OzHn/9UpQ6nw6A2SP3y7bdSC9KLCqYERpY4ECFSYM98nb99UBPRYgzMBKai7kEDJiUiJCVGZoJHY7l5H9vMcpXDMByOx1orx+jyBtnZwLNHoSqSEWhVU+RkgNXsNI53+4fjNBogEZChqaGpWy5qrYGETEWl1IwIu93FNIzHoWRBjj2GJEbMXAUM0AjAkGE+W9z14+qSqtMIVnPqjG8A/yIUlcwAxUfGENUAFQmpGhUCooRsrGhQXOn3RvDiAnwMg1qrU0Rcg6rPI6hXbNz3eh7niPYlWYK5MtNjUkRKTBRCqKXc3LwTqdM4vXl7U6sS8cXl1eOF6SI9zbboRz3NFi/hogc4R66qALEpjlMeT2OecgqhaWIkBgWdqpRjTLFtmioUAtZKHLiJQRc5CgFiDAuvhcC7HjBDV8H5izNWY5bnHjtUi1y9yuXwJ7B6jzzW2UYKHyrqH1hRvdza7fEsBX2Sa4gLIGFNZFwoCh6i5YuCmg9szvbeM5venPbmwYnzSKu/uhARGzJb9aw6MzALIeScp3E0xlWkRkBTE6uP7CaXzxatx/kRSIhK4mlb5PMvhOKtyTkLxd+sLcue7/JnFY/W7f6C91ZVmHMez6+ReQEDBQNv3jkifE5wVTUEZIR5YMLULJdaiqgBUuUQiAMhKngfFIhQvB22RBjMb1LR7dFmICJ+uRIxUxAAqYKgYmqoTDEgicX7k/3y1d3NFi+2TQLtbfyP/UVIzYvLEJGqlsvL5qJvWu4+Qn3o0+Gu3nx76Ds71bo/TqcCAPwshNimtsbNNsW+Fw6m1nTtpoEQA8T4EcVXw/3b23fpuqMyYDlt+3R9dXE4HovUXRtTm6775nqT2mB39/u7m7vS9ptOxtNtu+3b2LSpSQkPh/LNN7//6OLq6qp/+dH1wzfdN2/f/fznF8ZBFa1UYAuBYtIqx/v727uH+4sy1RS+eHf3+v5YgUwlDw8ApwlPR5saG6lOavXF9sKAbveDpSZeXr65f2WoYddfXf409jFc9HstX/zDP/7f/y+/ePniqmh6N9kX9/nv30m5/ChjJLBIjBTUiJnczy5qIjqP/BhMYw5xjCnN2TOzn4sAMSKpc0ZMPV1dmc0bpetZZOuA0eNm8fxMW1yuti4pC7wb4Tvhq+c3bSJSBUbXSHme0EUah0kF0eD+bvwSb9tf//7j3/3mF7/4xV/+1V9/9vlnWisCFKmkhBjg0e0LqUld156OsdbiqyQC8NKNBOZ1lIgIQSE20S8RJ4oeD9i27bZru65JqUFiETMrtAwj11ocvMZqVTWqMnEgQwIkqgZSlRBjSiriynsMlAL/9V/+5c9/+uPj6fTt6ze/+93vv371zatvvt0f9inGmJr1YjYTROQQnJzMzPM25cPjB/FQURM1pAU5/djyfqrYPvY7PZn5PBzyXBF+TyO2s13T0yc/uQzf+9mzdwLf+4Rzutf5/AquV75XeoTg3vgQzKyKGGhI0Rmsa9nophwAWIEPTdOJ6pQrgNQqItL328PpZGYP+4ciFQl3u93xeGzbNsam1oo4MvM0jff3933fO31YRC4uLmKMpZSci9sepimP47Tp2Y3DZubuYH9+ztnTKZ2EMI5jjHG73Q3D6XA4phSb1DSxqbmMw9g0zWazqbXe399Lleai6S/60+l0f38fQmiaJqV0OBxMjIj6rq8ix+ORQ4wxuazctq2DepkhxGB+SqjFGHPO4zgycdM2RDScBidXqGoes4mlJnVd53eqpmm2m+3pdDqdTiGEwEFNh2HIOaeYAochD6p6sbvouu54OD7cPzRNs9vuhnHwz8jEKjoOY9d3hDScBgBgYlOTKtxyDDGPE3BsUzvl6eHh0HWdv/lpmrquCwFFlMjvrcgcRPRwOF5e7rqucxxHSklVxnH0QsbJyIfDoWkaQjwNAxN53e23azOLMY7j2HWdK8L7/d4z6xzK4QdZVdW0Ccn5y03TvHz58ve//z0A+HiHj5h4Xb9uhPzF3TjsT1g12bXUck703K0xIAqffvLpJx9/kqf6v/wv/4/b2xvm4G1z0WyiTeM5eH6NEhAZoKo3IN3b4FRAQldvkYmjG+prVRF93N+qMlNKTQMUY+QQkQiQAH0EFmLTtl3vq9U4jG/evokx7nYX/XbTtm3goGaiOrvyROYBtdlhsTgHCAERmZWgqBUwMMEUdi+fN9cX4zjuD4dXt2/pFrquu7jYXVxcxMAlV9HqgcwuKREjrJhFO7uPwcKDU3vShvkXA20+PD4IxB8e/wPl4Xk//6eLboRzs9Xq9fUfdlY6mDqS9Y/IMXb+G1cpar4X+77W38ljha8GkDhO4qN+QJ6X4xNX+DjIuI4z4GNuymo/fExpd2m4ij6OwSKe1SlngFUi8gjsqqYmIFiAmccpZ5HNZuMrxxkvdeYOq9ZZmlA1VZUqUkSqmYAZQAVVn8otBhZSarft7jrtnlXgbKxG6nFos5GUdF4MxEyezOsiPnnHizLg3AziBg0cHA8kjBE4YqpRFUBrKfs8PUwDGswAXZNA+HA4iRSr2eqEMn1Z89ebzf5nP/3s5cuPnl0JbPsI7EkrhojBT4laVUWNgRmNEQkNna/s0/5O+hdiNjAx8S+/SBGpVeRwOp1yLlI5RiBCb7Z66NJsBDQzMa2iCrWqCLBpbPbH4c3t3TfvnD8cBE1VQBXNkBAEDU3BJOc6DWoSQgxI4zBNFiz0IbUKCTAYMJBznLyJCohkMNOpZgFSvStuxOSm19lyCLTamkRNQSMlWiknFKva5HgJtkCOvsgIioAGYgCyjqavXITHWvp9D4g7LmYT83ds+KvKAwCllJyzmQIEL78dcOav9uLlSwR82N9N4zQMI9qdmX1uuN1sHTXtGvR8OqmusXj2PYEpnpqlIabYdByGMR9Pp3EkDBO3KaYYYoyBsOaSSw0BA1PbpiYlUeOiRB7Gg1Dnyb6lgT6rwDhPCPhnh7NLfbkjLXWIf8D365knKBv8sO344a9oy3c9+xHe/8Zn1dTvD0te3QocORukRYOVrU+Pgcr46ET33okz0md+KQCZCRMF5wOKBY5G9PCw71OKm54pVCuwKM4z8wQXGXYO1QMnuXJgBAIzsgBEpZRSxRCRGUp1q4YhqI9Szt0Uvw8YnbH9cWFu2Dzz96gzvF/k21nMqql5QBaiIXJgQgaDIlVEplKm7GxkRJtx3syBKEJCVa++WGuVKnOwp6qpSdFSs1klFA6hbdp5gLYUIwIyU1ARIEMFIVYFCc0DqmC8x11DutPd//d1fcGnZzxdNvhy12w6bkmjDv2GrkNzF6BnyNpkjL/7+uab18e9SQuKqBDoUOqXt8eTFajHT5/t+sYUamJ6Htqfj7rV8bOuebZh7C8UUQm/eP3tMJTnF9cfX+4Yyun+vpaGVFul+jBgOrQi0+lgfaxWh+PxcnP16rd/f/jqy+dpd30RXrzs33zx2zd3z3dXLw/DcX/cA8lueyl9bJooUu9Px3fDkCn80xev7oZpPI3DeNDpdrcBgNMg00nHCDmh3N/XTXdRBLnfXH6+S8+fP3/58YuXn252fa3T8bQ/He9kuHv19rb58Y/uK/3q5vT37/J4/ZOweVlGMZs9qAAUQlqB2cTGRGpqCLXW4TQUqSklRmIEBEUwWIRTWwBSNPdGMNBsnlVVxCdxWfh04zhfbPQYdLEgjJ64Glc7/3s7SfdVBeZKHGMqpZjps2fXKQZG0iq1yuFw/+XXb27vTl99/fr/+n/7jz/72U+IWaesVpnJTXzeLAoh9Ztearm9vfWZMGaeIWTecVmSe2yhgjqCzPd6ter+YT+ehibFtm2atm3btkkhRGeYusZnHILC7B0OrMrASMRgBIgKRDlnJN9XIAIQc5NCk3abvr++uvrJT35yc3P75ZdfvXn75tvXb97d3ByOxxAiIXKIQFhrNsQYg5lvpD88fjC9TjTDdf+1gvDf62ovs1Zw1vl+ouF+rzr8RxdQ+z9iDX5vMf7+Jj0CYogBCXMpUy6Oy/ML3335HvlVaq2leL1YRBrTaSpu6vSxzJKLmRJzKYpIIXAtFZFSalz1U9UQYq0lpSaEWEodhkFEU2pSSsMwOGTWe5hNSo4vcPLAqg+u4jcRx5g8cdy36F3X+59VNCARUcTIxKCAgE1qVDRPmcl5smRqCBhCICStGpoQYsBST8PJAGNKqjqOk7/tpmld2WQOTFZyBo0pJgISFROLMQqJFCEgJlaHBoshYOBgalo1hcTERQsBMTMIuEcncmxig4ZVai21DW0IIU/ZzAgJDac8+Y+YWpXatm3f9cfTUat6rsnhcDjsD01qIIEZVBEidsE9hOhnVNM04zgeDseu6/z47/f7xSDs3nAQ0bZrT6fJ9V8imrVpZu+1E2Bg7vt+v9+7Ndg9yGvCnhM8XCk2s2YJJ5x9yuNUpXq/fLPZXF9fw0IZJiJ/mpuR3WSzwpFXSIUTpX0uysuNYRicPcIcTC3nUkppmuZv//bfvHv39r/8l//i0YWISMyGRhyRYq02DsP9/UOTYts0SNEzCWc8IJAZSPXljygF97ERoxqYKhEbzIFEarNHrc6M7jN6p5l/or7vu76vueRxut/v7/YPIYQmpc1223UdL+4BMcMntwerqgbGHJhZ3Qfo+e+giACRE/dXbdqWKqXUcby/ubm/u2vbbrvbhhjNZMmwQFVRr63d6/Mky9bD9x6LODhL+/iwCnwQiD88/pUV4nNo3J+UifGPjdzaeU7W+89/vPJnW9cy6vfoJl64VY9QUnM+DSKzl6rLVMJaw76/IVl9KctI65mqBmhIXuyoyvKf8THGyicuz0CTCxd5bsuLzMEFtRZfUWZDNDwm2YmKiLhM7AWE1Gq1mlZQWezD6o1BRI7tttldx82lxU4EqzwmH4EpGCqwGaqairu9nkRGAIDO8xywcA/8ENGiFJuhIjEEQiQwIc8Hi7XkyVRKzurdRqCp1PIwoAqBMBgbWoW74+mr129sWWmww0AUiAMwOwvAAFRMvP4RUkAkowWp6Q4FJKLikp+BKZiaFimimks5TWNRQ2af0ERYCZru4BOxalKtVhCxUquokUrRt3f3b+9uH457MQWw2aY9Z5ghMAOYVKk1q1YOFGI0gCpWgRCjhQYoCbBhAFpatwBkoMgIK00b/Kt12ZrWJB57tESYgUvI6kZFpkWtJ7NQQJ2xIQBACFUJxL9fAPNuAM4OEbTvbrTPDBtkXlV+p+nyBA+3etkfA3w96HxN3mi77vLqEtD2uJ/GaZiy3T80zTsE6vomxECAcy7femHi0193xmrwTQCHGGIkYkCaJ5eLmFqpEqs2TfTLTwy9ay1VU5MCCTEG5hDYDJiJDYzmA4vnFzWch6+scjqu2dhPY7yfTk3iv6Sa+fD4IaxmS7cAzzMP/ULwtt36ZJ98X6Yd/GJmAwFbE7V8CfjeXeoCIjaExzzJOWPDvbeEyERgRswENJ4O05Slbf3urOsZi8tQ/py+uPzP1BVnAuRAMaVusxnH6XAaxnGqNS9TPvYYEYZopoAEZ/LbGfhtGSc8L+HXyNDvWdEN1G86bgKhNaFTvLk3a8NLE68WVQlBmSNzRPY5DFaiShVKQTGFOWKIiIhSCBApodY8jLVWKgU56BK/GmhhuqqEpjnlQYQ3tLUmse2+mG73crird5/1krDdpg2RlTyaGgNu+6gQLW5L6N+Mtd7lYZAEQgh42Yc+lm57IBKdOgkQwMYTmCGnT7Zxp9uXfegTA8cBeV8hUytNY90GUwQRJDCVTdO82IU45Cil6dq3h+H07bfAGFSnYdJJtTvyZb1M9fMX23rX3t6+ff7yBce27wG5tm1jEreb7f6INzcP8s3rO755dXOblXQ48vRwyePHfUrEG8WN8gWlS0bMEjmqStrElxcf7S5f9LuLfncRiIfTkQJ2XSw/+7P9N18csP/ylL8e+Rgu4ua5cTtO+2lSQwzkQ1q0OsvxcW81D9/4nVeZDAChQC1QC5ghISl5MuGMpkeys7i090ipC6v4iSdoYQs+GU07ByU9qVOXwnWdZSHCGEOSNE2jAe12265tIzMTgsHhsH178zCO4xdfftltu91uc3115SFCogJnlgEmbGKy7bbW6lqzqqA5S5mc6n2utNUqTnF0ucQv1FJFVHOpccpdzm3b9l0XIjOzmgU2AUAjnMd1zYyMjA2MfTAGoVYHxaz3Kzd3Bwoxxa7vN31/dXlx//Cjb7799vXrN6/fvr1/2O/3ezOVop4HT/hhOfvhKcRzz/C99qZ9j6RrT2Vf+5c3wr/bUP8/aCV+jKF+38QwU8wUkYkZEL19iIyGICpmLhHiks6B6z6WGZxbFGIUUUALkRWAY+IQRC0GNx9I0zQxxlprrdWh6TkXt9n622jbFgCmKU/THHRWq5RSOJALds61cInZzIiJkJjMHRgAmFJy3dDlSBGRKmOtKxX3dDohYpMa/5FpmogopSQi4zCmlGKIvmOXKkyUQqyiUqu/w1Kq41i9p8UAzKxIqooLur3W6jh1h1SklNwTXUphZiZWUP8IhMTE/rvcR7xykNu2dTIDIsYQpUrJRX19B3Ss4oz7GKe2bf0TeQkMALXUlBpGcrO3q+oulbobupSqurJQZuHVt2TH4zHG6H9OJSKSN6R9dXHb+DiOxNy3rYE5j8K/Gm8huJ/an8wcHDg859qJ+Jv3+Sc1kayOsL+4uDgcDqs1GGAeo1k/7DqP6Ml1q3fYOxO+SrpkbGbMpGiaSym1Vtlud7/4xS9+97vfffPNNwCw2WyfPbvsd912u7m42DHi6/J6HMvxMPRdawpt2waOM0JM1V1bYNa2m+cvP1K1YRiOp4OBABES0pxzQ0RMIVBgI/SJy6oKpeCMI5rxxIQYG0JmDFxyzjmPp+HwsN90XYoppZSaJrTJM+YdT+zLiruj/GsmXB1bCgiEnuYaGAlCqEQjwDiNp9NBtKa2adqGOXhCkogsyesz/Q8fe1pLGfc/pFv14fFBIP7w+N+xktuSabnmXy3SzCOx4Sy26rsd4kWgOWeoAiCRzUyJeb8i4hxe3zQ4q/6MW+darcIab+dWWETM1cdQfRxjGe6f0xjIzvDIuJQ7RDwzWOckMIIloW6Z1l8hlStIHmff2KyOebUfiFBEwCxyjCGo1GUzUQHRVKtUMLdHmYpIqSJFa1URk2xSwOpSyysgKBBiaNptd/GCN5eVm2xBkJEUVE0FVBDBLICpGuuiYeCj3oc+SzjbeeYRaVTwlEFSZERUAzBlNKOAlMxEVZGAA4aWRCuMI5ghgZlJGdSMtSJIE7FPHFAaFA3w7jAUeVNEPn3+fNv1XUyuIM+kZwEGBAMkQ1FAAkIgXOd0EHHuwKIZgQKIaVWtWnOtRQVmp0Ctpg5cQAVVFauTjDofTOdYSFUoRvtS/vDm7d3pdCpVIKqB1GwqMzZYQYUVpOqkdWDQNvUxtZNSVYam5+6C251yIxCNgjNJZnQBLhParrCruODvuU6zdAFIblInRERdRqfVTETc9KdKYogWDU1UCloEEMAeDaEE0Tkoy3+Nnumt8xZ6TYF7xDPNGBH7o5t490Ctfw4heCd8DTpnRjNjgN3FRQgxNe3Nzc04DMfT8PWrV3nKz55fX1zumqYhJDdGO8z7sQfkKSNrRpeZGYgYM4cQY2rsdFK3ZAMUhZJlLHXIJYQQmVMMKVCVOkKNWQNjCBRjSDHGyKTIRIHIi3Akl+g8xB1XKezMfbkemXM//Z8iS7wvQHzYgfygLFfgieHnzQT/10V+mhGoZu6VB9A53HK+mIF14aUC6tojXKbt58CQRQfDM3lrDfOZl073xZv6IC2pWMm1VEFEc6a8quqMzac5/w1nErcaEhAiMzVt22+3u4uLzcVuytN+f7y9fXh3cz+WMpUsMvcV0XCNtsQ58s0AkNTTV79/y70aM9e8+DWTbo6JBQyE87FBExFREJlbhjFyFRPRmTeslqkwBw4pxDRnjaREIQQObsSptaoaEzNTZEDIUvJwOA7DSQU4RoioJIagLEwaiRFKTEGkwdCFtMHYTSql0KQ4nm6D5MumXPSKBvvTCIZ906W+i2yZUuHIV5ebTwNg9+zlNQa1JsU2bbcdgU73b//h7avrJHS42UV8ebX7ZLOBdhMQRwwPyt8Wus+4jy+tCcXwMMgl87a9bL02CtMm0q6lZ9ddT+Wrm31IsWub08Ptrt98sm2hnETtxVV/9W//6nC6K4JZ0KyLpsNRSXnb7Mb98IfffVmn6bjpRiECuqoPHR+fddOOBox6JeUZ4MvUXbbteBwRGaga12ZDn/30Y2Ce8jQWMZDdrg9hs+3//S+5+f1JfjvAvrvonz/D7tn+kO/vhyoSQvDVS1WXZHZjb2ranCLquVjqgoepWYl1wlrVlBBwnpGZLwJf6JmI5v9gPiwLy8oGazwkLDuuR6s+4nfG4eFs/h2XjRouZmQEC2Hm/rrg0ng0T5P6pmmbFhE/PR7fvH377bdv/v7v/oEJ/uN/+A+Xu4sQgkgFNALiZYY9psjMMcZhGKZp8Pr+fOtyfplUqa7fhpTIDM0Cs4+KTaVMJY/TmFIa2i41MaTQpKZpm6DCFJgCBBBRCyRERBaUiWluDDtzmWhe1JANjbwfTbTp2t2m//jjj3/ykx+NY769vf/q1ddv3727u7+/ubm5ub2tpZyOBwDyXIcPC8EPq0Kz71vnvmdv49Tv7/2pP830tO+sCv/7TUfwRwAXdob2R6YQg4HlXEspbd+BU5V4VpF86ISZl3QyCoijVFOgFHKZVDXEWGuNsSFyFmCKKdXhNEdQLlQB12f7vl/lxbZtVXUcx1Vj9bC4tu1nhOuUm6Z1TTDnzMxN0zJzrepoApd6c87TNG23WyIqqjVXV2BdQ/Sn+bbc4bb+n4ZhUJGmaYloylMppe26tuuOw5BLWfXNYRhijA5SyKpd2/Z971BmPyzOmmi71mtSv6u7JdbMYghus81T9hudT/G4KExEp9PJtfIQgkMztttt0zTTNNVaU0rO5PWX9bfhAmut9XQ6+Z/HcczT1LUdL7gGf4WV8Hs6nVJKTdOoiiqGwCtKYprGWksIPpJr290m50lEnBc8DIN/rrBs+E/DKcW0+oXd0uuiLTOHwG7hOptRthBcO8Vci98eY4wvXrwYx9HfpH8jpWQXHNZ9kH/Y9yRj/06d3eEYisVTjLVKzllEUko/+clP/+Iv/rLr+r7vP/30048//rjbtjGGGIKpfvTxZxe7y3/4u7/bH4bLy2cvXn5ydXUtIsfj4Xg8llJENKb44qNPf/yTnyHR7e3Nm9ffeCpgyVlEmDjG2LTN7uKy3+y6rm+6LjUNEtUztmeYsYeETNzEbdeoSD6Nw/44DePD7b2JMmLbd9vry9Q2TdNyDJHZyHNo5mtwaUORY0B9b+suXwYEoti2bQrDkIZpHMdhyuM4puQIyxiReXkFMUCamYHL6u+04u/anj4IxB8E4g+Pf92Sesm9fWJN/aMrP8K5Wc8R7D5PD7jkxfl/sbV4Nh/1fSTQziRiXH/v+vK6GKLmghzJ1IN60BHEZjpvo9foKbMZVmpzkDTS3F1bhvI9Cow8zoNgfQPqoxuOiDizgJHaqnK7hkdSyzKnb3OcLgDYXBu7QAxeK6g4g3iWekFw9mLNx8KMFEOT+pA2ArEKFQUgIAoAIlVgRgE8WnIIcUmVX800hDgb4tzYaogmpkaGYEgKDntgQwBSAgMlBRFRI+YYDBkbWr5K5ZgiGNYSQFLDXddsEnUJegadTrnkd3f3KaSARECExgZowGZs6AGHPusMSICMiqpaRc2MCU21aq2qiqZo1UwMipQiYoQ+XDzVKqACMIOLVEVzkVFrceVdq0i1ajgJvDsc7vb7UykFsBpUqSITghIiKppqLkVBxCawSoEgEDCpUTUOzSZ2O0xdBXJ8ti5BTjN1EWfXnC9SfuJ6SxcMVA3QSB2YPQOunYxrpqb6eGbOYYkmBtVY0Ay05aSKSrKoOYrniOHziw2fxHl4L2R2NeNj4/VM5cF1d7hezt739r3U4h0MqkYEbdcBQJ4mFRnHcRynN+/eKqqRXdJlk5Ir1UZzm+hMwcbzxdsH/RD17AKpIQQfyHU+x5RrqVI5qKjFAE1ARBkLM8QUqlpRbS0xIxPVQIEoAjLQfBM5h+Lh8g68gPdjR+eUjsf02xUCc14inR+0D/zhH1QtDeta9v5XuxIn5rlU0zns0dZyVT3L9CxSi5Bms9NZ5CG4uePc+bh2duZLDIGYxNSXJTVVY6aZtMjrYoAI6Gwl9P4UEQIREqGJX6+pSVfXVxfXV5vNllOMTeKQkGM1vD8eT3mqqj60IgImikBmqGboYFjH2aA5YR1sTYt9cljwic94lfK8TwaIwIHAUDxtdW6l+UgO2ZNer4lIFaFaWWqgGEIgDgDAIZBH9jlCg5kQEKUWK2I5F1JEo2CCQMYGANUAGQ0UUcy07Tdd20cDytmkNoRd5G3fbTtOidXoONZDsRhTihtqNqc8vjvlkRk228/+7KPrZ59+/PEzwXLMRfzmKjIpfPnLf7qD4zMc+qu+YWqCGWJRuyvw9WRfDnCoOGHkvpNc0mTPAr5I2CNIqcf7PVt++WzXsF1tt/sRVa0xurp61vd903Rv7qfTaSKxn3z6+UV5/uZm/+7N7el0CmYo9bJjmCQaDg/3d1ji5x+nmGicrkO9jNZzltO9soEKNS0lD7ChoRRKNOXDePOqu7oIsRnH3KVu0/Rd2zFTSM31pz/51X/91WhN2l7j9upYYRhP0zQCOhSRzKDWyhw8POZx80dzZ4M9qsGUTOYOJQVEVBUC8Ta7n7sLO3FuHs40bViTLDyQfTUewGIis7WLc4Y8/J7hGPyOq9LhTtGwaRp0npXOzgJEbLt2d3mx3W5Tav7+H//pn/7ply+ePfvzP//zTd+Loi3obs9tJ8+A546ZYuSc8zTlUnIp5XylWI4NGXiWEQEEFUFEcvoU+JCcud4UxhBT6LpWEVozCISgKGAmxYg5EBkAeNGcInsOLpxxV+fbiBuZyfx3dE3Tt/3Fxe7Fi2el1G9ev/7DF3/43e9+t3/Yv37z2sBqnuyDQPzDWc4eS66lc/C9u5YZu+fdi++qyN/rzrM//q9o/0IFGP7Ey75HjPmO/uz+CgoczECk1lq9cCNiDgEQ/ZqWhQbrWd+IJFVyrgDsGmgIsZQSQlT16AGttSxAW1XVEEJK6Xg8uoboxk8nA7gG7U0mtxuHEJqmXQN0QgiIbIoiagYhCCGdH1hE9DQ51w1DTEwstTgeoes6VZ1yDsz+66acq/uIm8YcTc6ExKZaa01NE2LQbGbqjD2HEXddZ2AllxjiZtdXEdcuY4yl1nEc5+xKsFqrmiGhS+qiwiEQkaCICROnMH/qxXLLqxO2bVuXnpumcVl2bd35jvo94IY/Yf2p3WbLMU7jmHPu+56ZppzPQA1ABLVWDhxDlFoPx4Pr4z6ARMR1FnDnfRkRDcPgcXZgVnKOMTnTzw+435mnaUopimgpxYVgEfNTIgQ2s3EYOQRVKVJWsb7r+hDCOHqLsV0yKWy9A/sre0Shl1EudsMyZOPma9fxa60AmHMupbjUHmP88Y9//OLFi6urqxcvXrRddxqPJWdEuLy6/OzTzz775NOSy+vXrz/99PO/+Iu/vr6+zqXsH+7fvHlze3d7Og1N213srtqmCyn6EREpUy53t3fuTI8xbTe7i91l32+7vt9sNm3b+pER1VocSLao28a6oFu6vu+7HkWPD/v9/f1wGqZ9KaapTf1m2/Vd23UEjDy7ksyTlE1N1TGiiPOcJwH5/KyZIXHX95xSytM0TXmapmmKOW/6TZMS8pr4shZkhAiEiz1jnZ7zKNcPhIkPAvGHx/8EpitcpkmXmDqzJ6nP9kQOXjEPS94zLnt4nx+gMzVndied+RpWdKgrPIts6iqcmzYMDR8dyaJmighkS/iC6qNpGGdaBBKQES6CEtnsKpyd0ECESMi0fhoDMEKPgfbtypKUQojEEHTJJXKviZSq4sBY2O/3V1dXRGSmTCZgoqIitRSt1URA1ayqiml1MiTMlGUwxIpEnIySYgRgxKDVkE2sggqaETh0VQCRUBUACZfe5lyH61zjuOPW/azLnPHiBvfoGEUkIDQgJCAWrTKzJwIEngPnrSIjGHEMoHKskg95bMKFhbDt202foFgdbx6OJnZ1IX3XtjGCGlZlAzJLJoEDEZsJiNte1QV4U/DvsKJVlWJaVcdaplIMoYgM03Q6nYpKVRFV8yRBRCJDqwTqNl5Tq8Zj0cNY3j48HMZpqKWoKLABmlX2sRcgUZNcq1UjJUZANgqCNGSA1Ha7Z9jvKiUBnpsHhKCi6mseIZI+5gL6bBGZAhC5e9aWXkBg8pEzVZBaxdSzxYEQENWMCBRQkAyCAYJCiW5SzwyGCKgu4DzZdK+T8ovhfe61rtcFzOfqk6SRdSzLZ+hKKUQI0K3oYb8AQ4i1VsdIt1374uXLpmnevXt3PB5LrW/fvhunacr545cvY4xIjPBI1SZ8lLJ1cXjxIxRvRuaJVDNTZjUjQuZAkVWlqNZxGvLU1dSmtmsbAdGiVYCL5jEzcwgUAnPkZoYXe+zfyml+lImXe8B5VssS6vfdLtijmdRWQ/Q8NPBBJP7BLGa+ErC3KR+zd85DfnzdQYSqleZoS1jaEOrXlj0GgtIjq3dhvROS4rxyhTD3PlWNyMBAPJHDbRZGIKAiyJzaJKrDmLsUxNB3Tj5dYQoc3LmMjhWGJVT18uryk88/2263YjaUcSi5msa26XYbSrG6eqqmMgNTidlhiMRMZDNoyBYbJqKazvKcx8QtR83gMRLAZ3lngj8QmGnVxeeIa2/IDJAoMhNxIUIf5jU1NdFaJx11JKKUOiaexyHnLq+JVGZEsFx0GMZSajAgE6mEhZSRY8NqwEoxBDZEqiJ3N3endzfXLb/ow0cpX4fTi45etG3X4qno/Slr2hB0g/Qwda8zvdofn3/2yc/++hcvXnycOGieSpUfbXZTre9ub0+noRNtNpc25E8+2n161fRtUCRI4c3t/X99e/wGr/LmpRIPQkw7utjuJX/97lX5/audCWvt9fjxBv6CWTBajHenw/F03ET693/982L6376+/+Wb6e44kpT/YO22QB51PNH+1ur+lJBOfJOQA8dPn120F/Ht8e2uabY2/bTHjy7by/5yHHksw+H2bds2HChbrYGOUiE1p4fD7cP9fZ5i00GRF9cfXe6u+vYipPjRZ5/9+d/+7bd7+fbvfl+GMfX2cH93f/vOao6pRdMqgkxSa2xsMY97Exo5hiU8nZAATINRFGZFJOVyytMdY0UHICqo2qL2A5kFJJ1jIB6vmXMHwNzcBu/Zz/vANc14vTOv7l0PAPZ7N6gqggJ63AUxbPq2ztuZea9XTarWhpqXL55d7LYP97e///2r/9d//s/b7fbHP/4xEZpZ1ULmJyMiMSMYGFLDMfSmvpF72B9c6j0HI8YYmcknCZiRgAysmgGZW5Jh6ZSM43ga5OHh/nIcr66uNp1BCGAOcyQzCQEX4o3rHA64Am/xArDnwAMYkVSVeWMC/z/2/uxZkiRJ78V0MTNfIuIsudTS02gM5mJw7wP5wOVShHwgKUIS/zLf+EARCggRCOVyA4EZAIPu6eruqlzPORHh7mamqnxQc484mdndwAtnpJgxI9VVmefE4uHuZvrpp7/PTJURD4cdALy4v/lv//qvzqfTTz/99G/+zb95eHj8/e9+CExfF4Kfj0IMiBxwDWVBZ+U9p3NeWudbo+bzZ/qSh7cFMH5KNoM1OfiPBtzJNhb6Jf0XPkPKfPrq/rEQ2XU3IiYMgSNHQs9RTuubROSQl6XUpUqVtpXlruuRqO8HF0l9i46I49ibmbs4EfF0OnmCmW/8xnHs+/58Prso7O/TxeJxHD1oYBh34/6QlxxCFkEzPp+X43lOKXVdrypLXkKIzjdwTsIwDLvd7t27d8uydF2X+m6a7HQ+HWLoh15E5qenIhUCG8JSyrLkvh92+13JeV4WMUspcYzzPIstfd8B2Pk8mZWu67quc4by0A+ZsojMJTu+qqiYIsdQpJ6XZRyGEFJeclXp+zF0MJ3P52VJahw4S61VdsMwdp2Dg0VkGIZxHOd5ds/Ttc/abSV+9LquO51Oboy9u7t7fHyc57nve/dcT9M0DEPOeVrmGGMFm0uGhURlnmZmHseRYng8Pe13AzLUuphVZCA20cURBBxotxufnh4/fvw4jqPjfZ0H4p5rEZnmBYBU9XQ67XY7N2674FuKqFYiQyJTm+fzMOwQyRSlaClu3NGuT0QoUpj5cDjsdoe3b9+aAmEAaP90dXie5xWpj5suvGLKWlK9Y4t9qYoxitg8z96HcE35r/7qr9z9XUpZlllr/fD+/fHpaX/Y//KXv/z2u+/+d/+Hf/nu/fuhH+7v72KMvcrdixff/uIv3r59++bNm1Lq7nADHErV1PXffPudZ9+8e/v2p59+muZ53O9v716M+0M/jl0/xtSF2MUYfPV1/Ihr97lk0UyMMaYUY6BATCHF/fevDt+/zKXMpymf53meP/74Bw9m3O/3d3d3KSUABHbnr/pe2ZwZrXW11CEGz7kHMIuJU9fv91ZLnqZ5nufHDw+EuBuHLiYOgZC9KUAIDcNGoA53QyQmQBBTEbWvldlXgfjr4x/JZgTbYKq3b+hZENZKgIDmDrnAPYmxzR+sDg6Px65WP5kzgush8Obn2gToBsVzpRiNCEENQaHKZdawPQVdBOrVTenBIuSFdXNtkTVlDcmaKdUb126HQTQgcklLzLW3K9Pu2uXyKkeRkBAdjFVrVa2OHPYD4hCpWquJqMg6lKGbXuUIAQUWQwgRug66DkIwYlMLRO48htVW3UTsNdqzObTtcugNyAt0P5rWOMtO37DLd4VwIYb4nzSxD4AYyNAITdhAvYGKhBzEREEkyyxzFbjdpUMXdt0IJlNVOx4XlcM4RmYC9cxUMyliWKshYq0OFDanTYFVq0pghIva+8fH9w8P7z9+nGvhGJCwquaST+dzLjX2qR92PnM9dMlqlrzs+k5Uq1iWOhd9mOanvORSRKt7exFJARiM0RiNGLCLUEFQUt+lFBXCvMhiYTfeYBwUgwIZc2uGmimim+4cmujo0YZeMcPLrGtT6HULcgPaqL/23MxYqhArEBkiEIuZKc8t3y8CKDue+IKQXr80+9Srv065f7Lt3nozz64yb8Ljerpev6/L5FFwPoqklPaHQxUtVaTWUuvxdASCvu9fvXyJVzeAlnaN6H77zfa1sStD4GHozdRhXo5vJkY1C9bAHS6GL1lKmeZlSSn0fQcITXM3qSJcNYqb8aESEUIMzMgAlzFo2wCwhmB67fNqwvoXknC/tN34Glr3sxKIkVrme8ubvKpXr0LbV3stutpr+vwsuB6HX88lu1x9n+S/P4OWeCEPujUE11uEAeBSKy9LZBJVVKugaEZgSJupGUHhws0HzKWUnJdaquq8lHmeRayIVRXv24CBL00E4GkltUGTEKyNy6DhhRe+fq6mazdk8wVd7pMRtgrBDd+yDv80Z2NTzVVr1Qv3iUIIqlKtijmdxxuZSwgxhm5LTQEzEanVmBEAOSQgmvNSKzITCQMzi3FQC0qmGoCYgAkEpORaTastVmaFN+flfNIPY0r9YOnmsdhpgnw066zg+GBwPtZd0W6Z89Oj5iWlwYhFre/7LqVg+k//4p/083gbjgxVRQTJgEoWrvkmldiJiv74cflwnpJB6DikEO9394w98+vddy92jOPwUcK/++27/+dvPoYQX78Y/28/HN++e/9uhndnmqZs0+nxP/7uleJN6sdxfzuM/bevQwinetZcspl0YdgP3w67OE+7pdwT3cjC5zlKjmCH+7tu6IvUn95/nIUn4ZxAJKDy+Vi/O+zv7nay2O9/ePtw+nsLdPf3PyjyXCQiPj09Ps3l6bic3j0KMTJaQFMgIK26ZEopBWYwhIBVimp1JR8JA7OqVBNkJAwceu53hkGtrr0CdB/4kjMZKINdep32OVMY1i7dc2YRfFFj+vzG7O1SQlS4gMWZzRePNqOmoiIlZyYc+u4v/+mv3r598/h4/O0Pv90fdt9/953UChRVior6kmZESLARjUxDDCGEOC/LPM9LXkouVWq7vhECckuhJXKxwFPmzZqaICLeziXC8/nMRAGJhoGZfdRmExraTsynw+D6ZoIAqCrkLn1yKzFUEwT3ChiufoBx6H/1y19++/r14+PDr3/9n1+8uP+6EPw8Hmqgvsl7fnV8kt94fZWZwZ/HCG/9vT9yoV3jyP/4c/wpzLE3VP7U3qptKhEApIoZMofA7HWSaqutmIk5DANXEdaoIlWqGB72hy30JefsiGEnRXjB5Che50I4zyHnvNvtHMvQ932M0fVQx+y4IfTp6SmmlLr+fDqfz5OqeuwYGAaOTDznPM9LjC0hzWViPxRu3hSRxSzEsD8cAPF0PrtrU82maQIADqFDQsJaa0zJ6YlqxkQhRhFZ8kJEMYZ5XkSk73vHM27IhcfHx91uR8yPj48Adv/ixeH29vj0NC/LMAzDOM7TdJ5OMcbU94BYRdBof3MjtZZ5mZclMDPzsiyu+fota2NxLMvy9PTk4qyDmP3Pr8E7zvbxBwA0qvI8r/0tOB6Pu93ODdT+Lbh9hZCm6Wxmfd8xU85lv3eccTmfj2tanfjrAkDXdefzOYTgb+x0ehrHHQCcTidd2SMxxsfHp3EcmLmWXKsOg9OlFzAIIRLT+Xw+3OwaDBfanOh+3P8w/xA47naHGEOtBQFCiB55tyGYHNPna9ZGInbshh8W17IJeYNdeL9hmqbT6RRCGIY+xhjjjapM0/l3v/udqsYYh3F3r/bw8PDmzZvD4RCY3Qn+8uXLw+GQcw4cvM4UtfPplPN8OBxub+8Q+ePDR8f6pZAih8CNu2Srw9qNwzFGAzDRpc4+GXMqFd28H2Pf9yEGJOqGoU/9Ddg8T9M0z9P08PBxWeau77uu64cuRkaCrcG/qSVgYMgXecgDlFRNFZEO+8N+3Oe8TOfTMs95XlSt5Kqmu3F/f3/fdYmIDVFMRWVd48nR44Zfi7OvAvHXxz9gRQ1wNfl3raBsEtXVnNMfCexx3UevE6QQP8++8YGELWa5wRzWnYRtvmR3X62ciVpE/B6psDqVDZ45UlY5dZvFInJ7C66aWnNFQfOkrLLWlZt43Zl/9p7J89xhJTITESLUUn3gQlVqLR5MZ1qlzfu6cXgtgAwNUJDEAEO3f/GahgP3N8i9GRoYqa3ZSgCAauRHwsAAPfqT4Uqit2dfCq5/iIZgaGt2fWMWoz37qt1fpw1Y6TPUqGu+qBu8BRhM1GquJudlUck12pgodSlwJq25znJMgYcQA6BViVSZiIAb4UMZkJAYAMQ0axHQ43R+/+Hhx3dvH0/Hp/MplwKEtuZQhBC7sbfIk0mtgqbnPGvOAXEptYjkqnOVKcs5lyxS3G1s2pgQUslDalzqVmSmmELqIzMXpVwxDrdxvBWK1cBxxQwMRIhGitrAnWo+ho3eUmhiK6yc2xVRReuZDg1tvfZZwBrbpMUxAWBroqAZzQIGNGAwrUGlI3YXVrMr+ry2E55Mr6whq0gN+FzqgS2xdnNz+E6uZek8t3hspzeRe3/RDGK029tbEfnw4cOSZ10U8fTmzRtCuru5ceQkIKBd7FytodMuc902TzGGrktrcDAgkgqYikrbWiEhAIqZmMoipUqpwoEjU5dSAgI0MVWzUqVEiJECk6gxrZseBL+0DVZ756pVW/uOLt2UT2511y2rLYPia5f657akNfsitit3vUiuwCNEZo3ejuuZfLUINYaKbqTtP1rkfhHK5KcftsEPbyAZGJRaJ4MUGdQYDNTIuTYGpmJgLZ3KeyFgZjBN03maOMVqNs9zLlVERdHvGU3WXaH9V1SnNRdgXVNwVbpxE5b8PT6TCTZzvtN0UNVWVJR7zRiQ1MCtoyKmpuq+ycvUIAGRiZiBR215CrZ7iL215mgmAxEFMuuHYRh38/Exl0IVAgQMbsVENENTVuJARsyhYwyzLD89zh/reQw1WR0ijmdMPULCksYShxxGwQ4AdBiq4I9Pc+rnMQQG7YfufD6Wqn0/MCDUejvs89NPiEqIanaaCxCG0P3FfWfDsLsNSOn3fff/+cP5fHwYsT+M4eZwN6JCkbLMv3+//Pb9+WOGX789v8tDtPTwyH/38HB6OM9T1Ywk1ikMMrwYxkPXd6k34NOcJzk/wMwpGgFH4hgATNGG3XBzM3RseTlJscAcuy6ETkQLl1mphv7xqO+flvenvMC0nKC+eDGdlrcfHn//4WFWKWTMXd8djmd9nMpj1mOWWgmHg3+riJWIMYJaNgOzAMhIhGqiQo4NA8AQahWwakQaMCGKQiWm4hIpgQEBEWFZiRIKPhf+DBlxnRf6pb7dn5GirklKzKyGnkrbouEbm3jdrSqYOrOqAsA337z+/vvvf/vD73/66ccXL1/84rvvYghmYpTAxCfY1NQnzoJDycg8QjHG0Pd9LXVZlqnhiUutRaSmGJhpO+fXID7aOkZt7gXBRE5Px8jBt44hXDKafNBrjVracgL8r1ajg6EaEAEzuzcDkTYMjm/ZYowQLXWxH9LhsDscDl8XgZ+Na8cMPr92PocB/jEn75/RiP/r/uaq6vqT6vCf1o4RANCTY4wQ3W4vajEll7kcreATBqpW8oRrQ8UlyiJ1XuaSCyC4lrelnDk0YJ4bl8DZFBstwZ2zy7K4PFdrzTm7SxcRz+ezAcSYSq7zPAPAOI7DMLhN2C/MWsW31n7l+pO7BgoAWyaevy4zb8ZbJpqmSVXHcTcMaVmW0+nUdZ2bcDfCwzxPbsjtuh6xBeXFGF0j9pcotSzLwhycoew9Xn9pZ27YKtAH5soMAMzsN2JRLaUE5q7v6lOd59m35RsnYRgGhwur6jAMzjg2s3EYc87n6UxIu93O/bNuzd7ev389G7vDj7/zKHbjrnCZp3kYHHY8n89nR0Awk/9iraXvx/N58t+NMXqfYFtEPEXQv+ic836/96NnZl2XAGBZMoCGEAEg50zExME3NjGF1S7VzL8p0c3NTQjh6emJiF68fIEIIqLamBteI/gn2voBDiw+nU5+iHa7nXcm5nlGZJEKbUBKmNkZxw5fZkYAG8fh1auX/vyn0yms50+tdRgKEZqYG8bXvoK6Fm+qyzyfzqcY0363v7m58YDEGCOH4OgP3NKJHYrYcC0MiMDGEaXrRKqIVqkll2ma5nkOwVXmkJgDc+oiBer6tJV103yelzMzhRhSSimmEMLVBGebm2kB7ral6ICn0yBA3/cx0DzP1jxvdD6fHx4fz9McY+z7/ub2NqbUx7TSosTnaewrLemrQPz18Q+5AfnkPzel+JOsXDNYt+nPl3+Dy9DQ1fNdQoHweovzuQsSLhElej2RZOAWL6xV1KXhTQh+FkOFdk2BvBK8fShvzb5r5s9LrXLd4b52abYPu2rGiM3961meLQ7IanG4kpqJqpiKua3YRL3w8HuhNT+2AAmQEA3jYbx7qWkH3IuRVFFcgc3YwLW6NfAdFAG0cjBwndvErfCHBijAK7jP9t8br8wnlx1GYU3rWwkGCATEBERAl4gLEEUCwKlmm2qtqmKy74zjwAFBi+hiUoEDmObKWIMDxBrQAz1bz8yK1FnLOc/vPn54Op0fj8fjdD7PU60iqkDY9d2426V+sMgVAQlC6lGtLtN5zon4SWqpZam6VF2qeOSf+/7QGdIqYOI2clUVUQCOMcQ+hRQMUASVeNjdcberSGIuaqBho9ciEqBo88k1d/oln7H505+Lsp+wCT6JbgRTkzYxbrR+nVxUEZkhqpWqQAoIRKBgviW+GIjgAnNplx9eFY52uS6fFQn22WMlveBGV9jsV5vvDxH3+/2yLGbqG9DHx8fAITD7NnF1C+NFI76qBhB84YcYQtd1x+PRDBDcE9mKXt+peClOAICggKamuVCpmamKlhi89lY1ZjStohSYAiu3iGIwbqhMbPyqbaqyXR3tKNqKXF0bK/jlquUrYeLnVlK3Ftkzz++VeHytI181Ea4V5O0C+zzb8BPN6xMK0+UHVnsyITuiHsHENJe8ZI7MeGlLukBsPhbitSeY+LqWc1mWpctFAKSqqolarbWWctVbbeLu2jbEVTt2fv3WqdwGIdZ5Se8TXi3HCLARiZ351KRnQARkZkKuzoZyQ7GBXfHBm7WkMfschJiYIwC1zFgDh/XDSrQws5jSuNtZLYuZSRVVtgaqUtEK1YAUAiBCZCTOEmqtkOlUKFGXjJJGylhJ6EDasRQrWNA0EdWAf3h3jhh++XK/78fY9WqOu9cQ0263k93h97loh8BUtByXChw09EMfwzAOfVDg/ZAOg+ZFyzQvCueEp1yWuUznpZS6CJ4sPuShBhaDeiywLHoWWmQw6pAHDjeRQ4wFecp1tuVpmU81n5MeujsMHIFigek4yXyEiHdEuwBShIz6QFGIqwmy4WHKy9Oc3z7k90/54VyzIk7QPxWpdno6PX54fKplUglxGEYVS0/n+cPjcQGibgy2M1UTBRIMrl+qqigRIkkjaDX4X/t2VNVMQKoiopqZgvdjvQuCBMhtHMtbKtdrzrPG5KfpoM/8il8wE3wuMzWGkjb52S4aNPqpssbfgUsAAJZS+uabb9++e/f48Pjmp5/Op9PNzUFEif0dP0vPu8TlEREhAIZokiTGEFLIOS/L7NPrtVZTR2oTXlFit0V2TUg2NHBvXYwhpY6IzOrqp/MJthXfRBf75zrHjCKGar7k+SwCoW18G2yBzK0fGmOMh4MDpr4+fmaL2ic9/jbO9dnG75Nl6M92X774A6vD2P4YvNj++DNv4wP4RwXrq+KNyMBExADZG4khgIfPuIsQrFZwALeq75WJ1Eopoo5Q93H+1sr1qRa/eErJOWc39vrkCiJ6CiViox47KsEhALUW7wnXUuZ53gKf/ecvBwTbVkFEVsMyrL7UzZPRlmX/z2uJ/xMX6qZfu4QdQiBCVQmBmUOtUmv1f3fdkIhiiMuyELGL1y2MLkZoqF9FRGfvqkpgNiL3/DJzStFUXXROXbJstVaPTDCzKjXXTExEVKUueYkxMrGqGpr/ea45dtF1agNjZqiw5GXoByQsuahq3/cAUGohIqSGrWTmsmzJqFRK8QDAWhupQMQDbNUPhSunfpC3z07MG/kX1ga526v9hs/MIlpr9prO1qEo/0SB6AI6Uktd6rru6enp/XvZ7cZ+6EXqsljOeXM9wxr3vf3ntVfaPeMhuNXG8VzezDMAKOuJJI1SX82g7/ubmxsRWZal5LzuPCXn4meLH4T1eRoj+zJ8beCNENemV7Igb27uL/SNWrnHRC3s0TPuALDWKmKqRatUAi++iKgfOgRUE5/0UhERM1HJUkMJKTKTA8OZ2eu5y+avRTQ7w9M3ihRCiCn5hHLXa4ix5LoRMGqtqUtd37tijkSM7LN9X2/+XwXir49/BDrxBVKK24jr5/eaz+vhK9ORW1/1ci9bf7GVhNi8v1faMV4lcPnQPoETdrGV2NXEVryprS5m3CpZ15iszdluCzkS++QCIIEhIoo9K1eeiWXNxroFYoE161SbYieDaiBSsflKtSxL33cGcrGsiIi2xCDnS7iEKQpiWAGVGUI33r1M+9tCfQUuWZ26y8guP7pIro7nI3TeQdv+t1qI4Oo+3A4xYcMSNJa0LxTNV+xamhOcgRAVEQzFU/WsyRjIgEDAuqnTxmA+wIlTnnMuudZZNAPd8a4PnIIJgCiwmFZFUwJgREIUUBEruSxLybkUqbOV908f373/QDEC0Tnnp/OsAJ5mFoYxjfu0351ORwMLMd0NYyB6FJ3KQwadpinXWkWLmoCh0ytVW6YFgIi6+g8GIiJqzJy6lPoeiUo1BeLU9/tbS70aqaEaghFDM/oZGRiZqh8nM7cBG6x+DUNSFTRDAk87xKvTv5nLwQi8jdsEkOa0NecVAgAKgBAWE0UmIZTCKTKigRIgoHk4bGNHN+deK+bdlai2ftjW6MCt190C5ZlgjaGgFtVo8Mll2fbn3mEGRBx3o4gQ4vH4NC/TNM3v4UPk+OoVxv3eQ3pWPfpKO1qreyIjYuA2jOYZR2q6+RgNAcRZ4D59ixxc2xcFq1XmJacQDvsxxkCEgNGxHdUvncApJSEVIwRgIiYwA6+1AUENXK9yRqQL0/5FrXFIuAJCmiW8vfuv9/+fkzqsZn4FXd3tRdTFHJ+/e16lXh5b1eGLA6x6DOIz3QpWGt0XC/J1EJ58cWOCClXNAhMgVSlLzrHvxbt8dAFKNo4QoDp5H1TNsErJNecK2OYS1GzJZZ4nqdWrL6dSGILpGrfpi6ATG5HMuf54TWG2ta62LR7AdS1fTzfHFurK5ifiwAZe8SIZkoghKgCYXDRiBJ98ZGamSBSYgpuRV6CUR534WgpqyiGO+xtQAbS8TIgtPIeJCNHURNRIgVBzUeaAbNxB0AmqBCxMJ7FSZFEJIHaeDGdRBYBdP+Bu/FGOJrrv+/2459gdUkdPRxVj5tv7+3J+mBUsJAk4TeVjAQCCmIj7gP1UcKn6vpB1vdb6dM7vTxVBjqfjeSlqGCkChJD2NMYoGaYzTDnNNS0wGu9jSiEECgb6vpznRY9VJpGl5GoqO5fcAwvwuT4el4ef3r8h/fC+u+vTLoZ9F3cMrBWphpio3z0+zr99+/DhWKYCi6BWPJ0fn2YZ+jEsyhkgW9/vQtghDmI01/lpWpQ5xg5VqIixGJOKuQfWzzMiyKJMbMgbx9TTDwjNTz01Q+8jc3DaiIugZMBI2pgouvUjt39e9V0u5952KSkYrlflten4E8vkFpSELTN13aT6qulVrwg1dpkAqBtvX79+tfv1+P79hzc/vnn/7v3tzcF3UW3bs9FT1if0i8QjHwiMlUKg0EWpsizdPE/LsszT5DrFdidBanCbdnNYB9VcdC6lTNM8jjtmXqM2POnuckw8Imk9Yp6ZSWt7q2VjEpiibno6YQs99rtIO9RfF7Sfy6PxPa+uAng+BfVlPeiPmPT/9At9uozan2IQW3MKrpDx53+rLQEAr9wVn0nE1qRSv0LcMcrMTIzMKoYExJ5GDqUUEfH/BCLkUFWd7mpmIbD7Z2HNMO+6FGNwrERKySVX91OaZT+qPmSQc04pqoqryX4XMdCccwjBnaqOoVivMfOWkFuJYwxr+Iejz9D9uCLqnpoYYwiccxZRpyS7bZmI+r73bpM/uYefu6HSW1B+izBTh/B6+J6TH87ns5l23VCrPD4+itS+v0GM53Op1bquizGUUmutHje3LMs8T7vdbtyN0zTNy2xgwzAg4zzPVm3oB+cwTPM0DmM3dNM0TfMUU0x9yjnPyxw4dH03z/O8zCEFAxMVYooxTvOUazazUgsgDLuBjR+fHod+CCGo6VzmlDoOoVZhbhwe9wh7mh8zq9Zpml1898Q/PwlDCMfjsZSyG3dMVEoZxxEAtkS4dtapH8lQSq61jONOVUSdUEmAoEUdkeBVjwceOu/44eHh9vY2pehHfp5nf5WUErVpkrhp+jlnZ0p4OGEpZRyHGEOtLhBb1yVm9iaESFUVkQpoZk6usP1+v2E0fKdTCuScV1n/YpVzuoUXcSHGEGIICYBUgXn7K9sAS5+kql7uFZcdLLkTOsbU98M8L7VWqd4ayFJDjA7tiMRMQMwUYzCPASpScl7mGQBiDF3quq7jnn3uVbeZTr9M2MeZwcRUqyEGDsTsqcW7/R4M5nk5Hk9Pj09v375lxr4fdrvduNvFGAhiTJ3iV/POV4H46+MfXh5e7yobqvZSX68bjufhyFfm20YQNgQj9xS1J7seC3Ky62r0uIy7ruO3LiR5lxhXdZYQeRV+XMR1h4tdjFfglS8BMAIhkMu7zAGZm4fQdwbSXlTFnrs9L96pVfoC5DXrfYUuIaCZceCeUkrx+PSUEvuwkpmYVpXJtFoL0m1Fh9/pFVGRw3DY37/evfi2YF8xVsOqUp0hiWQAis49MACyFUW5bsjsmasN0YzseUfeDNXEmmIMzVZjhqulC9rIddNRAdbvAgjZtQGkldeM6ChNJEJLrFaOUk9P+c20HB6Od7vdty/u9kPXMakqRS1lUclSSyn5w/v30zRN5+n9+w+n07lIwRSAyRBCLKkfLCboqtbaDcPQ9xzjcTo/TadhHJ/Op2l6+3d/92v3Mmttp6AZITJGZDBD01oIkIgCsdOOwGwpDnHGENPh5sApILMoiIgp9/sbiuNirETWUNbOC1Ugj5SCpreookeCeGBgM8qZmVFL/nsWw+ht0pWe5EWdYqNBiSoSoKMVDLEqghkiddQr1rcPH2ofX93u1MBUWlhQg6M0jcm3xaJgRm46gqsZXt+4buNdvg11ONc6vgpXLv7rFbd1XAgJCGKMt/d3McWQwocPUEqZzvPvf/xDrvmXv/yL3Tj66cTehN8wL8jObVmFAYgxurcKaMsqMiICg6oVARkwhqgASy7MHDm2G4zJUmp9eArMIYRxN3apM3dTzpkQYy9djDEwETJbIAqMSOHiEkZe07ZsLT8uSgSh55FdxjZbOf21ov65ycTt7oeXBzhxpS1FAETXfuGLknUd+QgI2mjaV38IFzHr2jp0XVqvJxsYyHY2hhjMdJFyzjnFyG22xNDHPwENQADETFSLVAUDQC31/cPjotb1PTBP83w8nZ+Ox+PTqeTKyGhekLdcUPE1pxXea6nwTF+7/Ltdm7kui435vagB5uCSY7ZikjEERmRAIgVxcXhVdSnGhoIhVgWphoAKoKZ1zROwtZoBcLAPcoi7ww0ingBrzeRmshi8RwqAKuqOkqoGhAwE1AEEDAwxGMC8LIsqF+xDGPsuhQhEalCU5opvHqf/+Lu3+/3N3d1hjLFkePPTH96+e19reXx4u8ThIw+nWZ4m/FhgzqQYjtP5OH9cBJH7bOksrNxRGgxY1Wz/UgbTWkCElswa8VSW9z+Fct6b3CAkoCEQguYyP6l+OD891lwCFQqNt0kggH//4/ssghxfvnz11//NX//42zeP8/nHj6ceYQ84Iu+JEhoRhRTiMMxqj4s9zlqFFBAVSi3nuaREpqTVTJC52+1f8OGui0PZP564+/D2J6hCJcdOCIiMtQIoUiAzAgwckq8fsI1OAZgpoAWCSMYEwQAQmdGqiKgashGZtgTglSv2Ocxn++ezJsrmETb4ZGT+8/+8lL92BV6C1nZsm0EENRG3RwUCQBUx1WHoX7y4f3o8PT09/fjTj9+8fpViaLNl1GKJ4Xks82WoGcBRjsG0Vu26uNsNtdb5PM3TNC+LiDh/bOstMbO1+STjbXkGqLVO02QGPjy+jv8yM15lH7XbzJWq3gadTI251d8g0MbeyUMuW//GR6S/rmY/J4H4i6Lw56ZU+BJG7IsXlD2nFP8xofkTA/Kz/GQP3f6Ssrz5DmBtFsJ6kV2eBDeR2U9a8kmTEAL6ZlW1qjiAteu6y+KErQlKzKDq4p2bcEMIpRRn2joO2MPo9vud67Pn89l12GWZiSiELrmfkcAF2WmaXG0kQlHXWF213GYqrZQyz0sIOAyds4ndvQvgPdHguqeIhACqsixLjI1xcT6fHU17Ok3Lkm9vbw+Hw8PDwzRNnvbmKNtx7Luum6ZpWZYYo7/Q+Xz0w6Wq5/N5v98PQweg0zQx8zgOtdbT6cQciNC1aaI4DMNKCWgeWPBUEkQDq1rFhAO7dxgJU0wA4NooBx6GQU2dPlykTPPUd/04jrnkZVn6oVfT0/Gkqnd3d2p6Pp+7vhvGwVHODu4AAkNT0VILBQ6R5/M5xuDgY//sG8bBPVbjuHNXaUppGIbT6eTfi5kty9ylbjvh57kl4B2Px3med7tdyeX4dO77vu9GIi4lI6D/rpkQwTxNfs/NOatClwb3j3/8+PDmzRtm7IdunmenfBwOB7dC+03ZPdrH4/HDhw+llBcvXozj6G9V1XIup+Pp4eGj/5jzpk+nkzNMcik9U63N7u2ids5580oTsX9Nfsq5ozzn7Oe2n4Tucti81W4JjzGKyOPj09PTcRgGf9vOV7nepsIaKu7L57r2hBiTN1ZVqkkuJS/Lcp4XUyOilJKL3YQUYtd3DACOqH46nh/sFJn7vu+6LqbIXeTAhs1i0JYxa1Y+bSK1FRFc8466YezH3f3Ll8s85WV6enz88P7t73//AxLt9/vvvv22H4avq8BXgfjr4x/Wc/VnMJx/uhfdtux6GS5yZfcqhcM30KjPcxX0UiW26SA3TpqCrWBXN1OsmXleBjR/IIApYEMjYrNHbRxWNUMVAwZzKbXN0kILHEPADYZ8PX3eovNcZWoDmOLICAUzydnMutSVtDh9EUykZq2LSFFprMkVT2DmwZ/I3XAYbl7sb18J9QWCQTAD5EjqJfCKfQddmQHUED/W/G4tj6t5nFHhel/YLJO2DtfLemgAyVqgybq9QyRAhwgaVFBTVTQEAmspZE1kccadqgEEQwQMBrWo5rOd83QuuO+7sYuHLg0pchwodlqWbOfJ8CHLcZpPqiVwRTBTBhDVvCxZLcau73ciNaXYxehWmmWej8c3S11UDAQ89IXTEFLnQrZjG8AqIxKzipqagIJIqcUABZRDOBxuDrs9+DysSC1as6oFADI/Gi3l0GPpzEz8TEIzBFQ3quuqCm+0XSJt1SOs4zTuMcJ1fhsNHVitPnTrT42mYIruDyZCpFoqkoUYOe01Pf308C513MfA/nRA/k8zacNB7SVRzJp93od6NxTyav/zHcY1R0JEOKCCbqO0Wzl6obUQBAqAgKp934scVPTh4WFZFiT48OFjiun+/v7mZr919a0hvf3Ea20FVTGzwJxibIRovORaiikKEqIiiUrTidRgtVEicyQGM1VYspR67LolcIiBUwpIWItqzZmQmSJzCByCVtHAgVcbBzoJ62qAfRv5V7xc+5fi6usS8HOrqt34S0Z2re1u09yffO/b6WFgn8ayr0x42O7m2/DtH/FeXfVeLiMezc6MjByRstScS+lTVCU1qLqitM1MQQzVUAx9cEYQPjw+PpzOHCKHoGbn8/l0npYlqygaqudy1arIbU7kar7GZ/RIG0lne/ur7gDXithFf1MABUJgbiy5Ftaqvua1DlYMARURlZhsNeZAu0+CiKn68mIiWhyQoYBIoLq5NYmCEywCQSyZl7DUmb1trEZIyAzU0vu8A7z6nxmIBcEEVEUMiBHJYowhJAVURXUzpiIav3ta/l9/+59Pp/nFbpQ8xzS8un8BoGk3/PanN//q794t1RZFiT12PcdgIdg+mCWAIBha/iuoVSNFqxXzuT6+y+cjTWcFGoAPZe5MBjJCmBTf5fMsuZgJ0KJSyRQUUckVFGNT06wxpLub+9d3L8fUyZxRLWBk9ftrqEZGRkC5EJhmgEmQQp8igRGqocW3Wt99eFdKfSq5AoKBRtYUcgpDfPGrwyEO3dPTk7SMBBVBMiIOjIEwgJGpMQc1VRNTQ+bADApEwCAMwgbB7+FuHkYgACRvoGut2RCIicmhDWjPuu+fylXPr7VPr6NPrIvPLtt2ObNHoZoKba14VRCTNhDOyIYAUiuF8OLFizdv3k7n6fHh8cPHj/e3NzEyExIFbPKVgKG2m4B7I9dOkv89IAVSBUYMHAJx3/c+QTxNU63VUZv+FmELJmj7yTYvvNvtDoebcdyllEKIMfKqBZt7zaCBzGjNcFZc8RFkLv5ushqCWSmVqM3Xe1ivOsr86+Nn8dDGHvlTZuEvIon/dAVnz4s/+1II3h+J+V2H0exPuo02nH2D+SmugefQrigyzwlr8CVkWj26iKUKKBCQVDnXk4jkXEQkdYmI1BQwlCoIi0itVWIMMcZpmj14zQ1JrgMOw0hEzMFfzJ2YZm3cPudSa+1739eD4/IR2az6e3GRzjGyMUYzcNyrauMRI9ZVs8N1LIBFZFkyEXVdX0oRWULgcRzneXa5kIhd0vUrupSycd6WpYTg4P42lJpSZ2alVMT2M7VWZo+Pq/6WmG1ZMoC4zigiywIpdWZ4Op2Yue8HIp7OZ8klxXjYHeZ5fvzwOO7Gw+6wLMsyL2Aw9AMCnk6nHvtxGA3sdDz5n2vVPGcC6lJ3Op2Oj8eu77qukyqPD4/jMEoVJg4cTG2ZlxRTDHGeZ2Xt+k5FT4/Hm/3OhUvnMyzL4sBiV6X7vidq9F4/sV0/da+xg31VVat+mD40ARrAvx1XXVWBqxEFVXt6fGJmCgRojmCutfjd3iGEgaM/c0odIh6PTx8+xDu7nZcLPsL/xd/zsiyufU/T5AF0/o2nlFzvXnJG4mHYuVJfSp2m87KUYRil1pIxl8V5FCEEZyt7n09VS6mlLCFgSt12YW4tRP+APiUsoiLKzES+szLmQMSI9Pj4+Ic//KHWen9//8033wzD4H2O1mGFbRIMfNFBNFUDIA4UApty6oZhVFEVqSpapU5LMVsQiIliiH3fx667DaG4hl3KUst8LEhITByCq8UhMAKQZ07aWryvt43VOEdVim8DQwwh7nf7ndT6dDyez+ey5B9++CGG+D/+33xdB74KxF8f/9A68ScI1U25/SRs+pMiuA2Yb7/euIqERCsw98qRsfmNnwFSL9uOZsnEy0wrmNtAcN1VNG65rUEoF2nbrgy2LmOJNtumR9Qpitp2r4Q2nbftjXxfv87MK2y8H/cI+1amlgymMQZAy8uiIKJVpEgtWiuswJ31WdDlYk7d/v5Fd3ihsVdOotRMxRoA0QiqiBGACZgncMHGegfFBpJsh7BF0Hl8fWNNrLQB95U6v9G1Mo+DcBGaVrL0Wl8HQ1AREwMBUTUCZERaAwYRwMjnRQBYTQEiIhWTmuv5/Rx43sUwptAHTAFS4BRBTaTrtVvymQuzuHIA4kAvYiZsVuWUdghmxaSKmpY5V61oENRVGSpIRjGON0suWrJIQZUAbsi1LKqmpq6lYjWoZhao39/cv3r18PFdrVlKWZa6ZLPQq4ISmSMXdDu31dTtvc1UrGpiQGamgs6IMCBEIyIzNANys5J6sU1esAXkEFWrGaiID6+aqZqiKIASqTcliIMxV6lTgUSpv31dTH58+/bVy7tdnzZg1uXUdkSLbR2Uq3J6RSS70LN5A7dQZmZCapl11zv8RrFuLn3yoXJiRmZ/8sAMAB8+fKi1Tnr+8acf53lC/P5wOBDidmdQMyeM+QEUtxjHOBwO+eFBVVscra0xBs3LrLJJ1WBVhI3YY0A2uwiiqE1TAcgI1nchpZRCSClBINeqqhgXIcIYA1PLwWIGI2DcVIpWLxMiSPuiP1Muvs4x/YwsV3BlG77yTxGRrMMrLdYRaZ2Q9eFR77qseq6BmbWxcQLULcftshpu4/RtRPxCiiBA3d4GMYtqFXFnhRrOpVJwPGG784iIAUQ26ro+BB6rAQQOIcVS6tPx+PHhsdSqoqreL4MGxlGTWnMuxo1o03DGF5VNBZCQANBvDpf1e33X22Cie20MAEBWP7U32sy7jYJshqqGgMgRkYmJgC+x1iJiqgoqJqJrnJ34BwRwvRdbhhchEZpSLYuUCsRIQRVqFYRKSMYQEAmImc21MGfbA2JgRRBCI0SOMRgyIpMZlQpEZEwcUz/0kRBAzlp++ji9//DvaTn1Af5H/90/v70di4hFlvH21+ePEve7F98ARwwEjEBRlawGADYRBgXLsjzp+QxztemkyxNPH1JdeoAUumBodammJ7OsejbIKBVFDERBkIwY0ILPJol4OKFovr25/atf/eXtzc10OkZTMPMGshkoQy7mZClByZaVaKklhNinru9iFztRfcpLKaUqhuQT6TnIAloNIXUxDMOh++t3Hz++ef/RKHizG5mZmDk4Vl7VYiQ0QFMwI1MGCsyACv5dO5ofzaQiKHkgqImhVcRqWwgwga2DoXZBfl//T4PDb8zfz1CnnxLALkNs9jw1orX28TLsfiUuA5qb60W7ru/7fjqdPnz48P79+/1uFCkpRkesOHC4KcVb5LJ6BO6F1+8sSDd/WUq+wvZ9P46jq0guc5ScmdmnXADMhYDDfv/i5ctf/OIXu90+pc6t9j6G7O+51dq1SntUn3jYsmmttXub1ubMNA+o8Lfu0zAi1b5aiH9W7h39on/n+Z38v4gyfN0F/BP4iM2+88dQFQh/qgWBW5f22bM1edj970YKyL4kmZnnX4UY2/SeE97WGU4mThFcEiNiA65qgdjVUiJ2CcxNuM2Tj3g8nmqtux2Zmds87+/vPdIm+DYSwM2evmQ1CjDRkpdlyW7g9eXbLcDUSL6W8wKmazZatz1JrWIGzC0lhDn2fViWZVkWEe26DpHmeUkpEPE0TdM0jePYdd08z2Y2jmPf99M0nc/nruuYw7Isp9P5cDh0Xf/4+EhE4zgiuuYb+n5YlpxzQcSu683ALaVd1wHYsuTT6exitPtbmTmmJCWrKiEFDkJSS+26LsW06JJzRsTAoUsdIa2DwTidp8Ph0He9s2KHOHRdt8xLCCFy1Krn0zmGGDjM0wwdpJgkyTIv4ziGENwb0qVOqwIAh7DMEwDsdrsQwjzPKSUXTFUNwPymurGVx3E8n89OBHYDtaulDmcAAP9ml2WpVQJHSzhN5xijqokWUqA+kWHOCwAg8Np0BEE1aydD16Va5XQ6mSkSHg6H/X7vlnD3tjvOYp7np6enUsrt7S0AOMB6GAYXuz9++FhLde4EEYssIpZS2u12TkYuuRLjitpuzwmXwTVDbIGBLgr7X202O0TyzmLbqxFpi0wkLwCHYSil/PDDD//6X//r+/v7+7u7169f/+qf/tOXL18Ow8AciNkbG/4Sa5yMIRJRcDgiA/BaN/kEeK0156XWcpqnp9ORQwgcYoqp7/pxNLCccy21lpKXvEwzE8XY9X3Xd10IIRATkZo019XGzzB0i7pzQF2rIQ638fbm9lBLnc5nN2J/fXwViL8+/iG14ZVQuhWWPkL+GYP42ZiS/dENwlr0Xm/x4VrKejbtvqqp136u1bPZkvGIXBVc4+vgUufjZoxq40vY4okAiZBQr9rdF0MKfNHf4jRHNFODi8MYqaEmvPJ1V5ZKrVoRnSHgzmHXXhUunwcFkGLX72+78YbSUClUIENGo3Uskmytkvyw+0eyS8GD5tovNVrERQkBjxvHq13ZGpfSpvvb7wJBw3K6Acs/GiISu/GaEFQ8Mo7QtFlsA4IauI3VVhT9NgqtIgaqOpUlkgW0yBACIKrUko1rGCSZYNZaGIhDMDUOoYvJyZcoAmDiVjGvSwERgzXXOCoQUoSQVEBrNSAmYmh9zzX/sH1fjWipAIAUowIaUBHLVYsARkZOiMGZ1Osm11ar99YjaYyJi/p6bV8iBKVWfPqeUioTBAoUOMQq1c9vBTe9N3OQOYS43S4RBVGBqxoixjiOdy8/Th+fzksMsQvs/GszZbxqnHg4xhYEafY8m+5Sx26mEmYiJkQHGl6PDa6sw7XqbjKxz8oRQQjQ97e3twb2+PjRMxkQMKXIzPtx5zuSzTO1tiuaIZBD6Pv+eDz6616GEZuCANbOWzeEA5mJKpih0Traj5eWkqlonZZSq+YQulJTjF2XgIOauswiYszCTCFwUAwEQkjsXBi4tH9gCx78ZIr5a0X9s1nMsFHsr77lT8bV4TJ1saIZ1osKG5ZHXS/aTo6NTPqJ2WoLqoNnMGLwEw/Xfbzfm3MtbverANUUyQ1LlEJsu2jEmFJKCaldm8whhlBK+emnN7n8dpoftu31+kGsBUc/X1W9P+oDvJvS8Al/3No4wrWKjiu7SVVqrcVUm8vLvA8HCqaGnl5GrEAELhlvA0POGFZ3EK8TCt4lbHMCHNATt81nNcxMVKuoIXKMxGyqKqashGwMthYxSETIQJ5hy8CExEhtHgZ9WMNQDQkDhxRSotgxM6NJnk7LaSC6O9ze7dL+/jbuelnAprhgKGnA4YZ2t9DAPuAmbhXDWiEXksWWp3J8B9Mp5BLq0uvMOpOpmUm2rLqU2dGzFXkx8qMMgIqoQArKSE24VKtWEa3WbKWAaV7m9+/e7sdhenqwXNwIakGCkhkYoSLW1jFX1KrmTAksImaCZjHw0Dm9nTvJls+Fg6kQB0Z8fXvoYv94znMxU0E0NWVQLwtVa0M4kr9tNRWMZGtMjLP1EamtFOYflABUzLNT8WqiZRtYwc/jjvECNfujbZ5PaKprPNQak66wDbGIApKt6eeXn3VhTcUILcaYUkKiaZ6fnp5qLY0oRc6yZwy48YjW5DdGtGsy8nUEkP+w68Uxxq7rhmGY10frgqq/Kd3v9y9fvbq/v+9Sxytx4poA094J+2Ultdaci/+6CLrhYmttbnwkXCVjM90u3a8M4p9ZbWb2bOWCL2XHqf75KKdtCdMNFv9p7fN8O3SJQbb/2pbD53bmrXVKzQ7tHhR1LyFTcNXMV+QryeyypHqkqoESBwQlxq1nQ0RuwoV1imW12bIzhbfoMyfeOlt2u7R9Kq6pciEG5hqYCm3H1rXydeoOXTPc0FIOmvB5/G0o1l/aJdeUkqufRBSCjz40w38Ioes6N8Y6K8N9EsuyuDrpuFsnBsCWVwZQa3WCnCuk7cZN5C8dYwRAZ/s6nTnnhYiHvi9qpRQV9ejp8/k8ndvz55zPp/N+v++6zsEO7tJ9fHw8nU7DMMQYXe8ehgEMSi4WwRtmy7J0XdeaZ2b+bIiYYpfz4sc8png6nVLk7Qva0tvWc7ik1Odc/Hd5zaPzA6tmiNhA80T+V45fOJ1OZmZaQujAQNXWkVM1xLws2WYDiCmpR8s0EB8wUwwhBHa91EkjXd8xc4xh42J75Kl/dsd6bIlwKaWu6/KyfHx4mKZ5t9vvxp2fmU6QcISFGZiJqBKHbQVxCXi7zkTUZXGPvAPADUVNRCoqIu7sUoFq0pr0SERcSjGrRNj33f39i3//N3/zm9/85ne///3461//51//+vXr13d3dy9fvb69u9vvPcUUrzataGYi6yRs27U2uwChEqUQuyqlSK6lqmquJc8yl7yBklLfdX2nUmsuJgpm8zSXnAMHp/6FFFIfmbgl67jzYI2ddD6ViyhEiMSRiZk2xMfXx1eB+OvjH65R7TsRVARtOqkxPtvB++C9wZqoc6WpXUm97S/bYP5VLQqXsOo2wtfWBVtzKq8m4+iSakWoW82rariV6AafpW65WmWrNr21phqv1fmyV9Dhpr813N4mgrtErKsQ51IkrawJQzSpBcykViJn1a5aYtO/xd+9AWGIabztDy+p3yslRW4xK80iTLbNNzd12EVdwzXgyzZrFphRi5pbDaQ+dGK4bv8Q1gljF0B0lTm3o9WOXeNUmNMLqA19gtS1umprhJMXcDPGtQ/ppmZWgAxSBYoCglFVzErovJEocWcajBalBaw4P5qRgRjBVERqdnjumhLT6NUKWMzEUClw6ASjYXV7HxkwoYmnDdM6zOZnEbuemEvJuYTYLbVOxWYBoZS6kbrRiBuQBK6/Md82XIQUamqsXVAhrZZr2oETBtuUWSAlYwQOZEYiaqqbndDdE6pGTaa3VflEBRBDQYppjOPteT7tiiYOhGAm0KDdeKVuAq48ki+aPpoKA+hJHR5isP6ybe7ZT85/XJ/at2ltx8E8DCMAlJKn81mkLsv88eND1/Vd6lLklnrv94jNz78KQF1KMUTnIW5mMpfc/Lh72t0KyDYCEABS/XRYshEiSVWLqVqtVZZcikiXYnA4FoFZrYLEFERj4MrAhCxOj/TLHs08rGu7zeB2gX+tp392Dc9PgafP9aarQLnWhGgrGl61TGwjUdileP7EVPWJ9tWiatZn/0SdVlXmQBTUzABj1+/HsYuxiymmFFMkpsAhtOl3BgBCZKSScy71/fsPDw+P7WKFZthv69rVR9hO6fWkv1T/z7GVV2vxNRHpcidQqdVMm9+62SlNVWu7pymqeR+uZdCtPjF19H3rZxIS+tDsJrG5QclvvY0U4P4hDiH1IXZ1mS8zTADqkjuuIUVAiKhImAISEyK1kFbfwKAhGwXkiBTMyDAAo1JVZAzh7tXdq7u9peGnx/PD48NPH47vThX7Q+hHI24AIgVHQetcYS50OkI50fIUTx8wz9GUrCJWQjG1orqoZJVFi5gqMsVYIKAJ+57Evbn+YaSRfUQFQaWWWvM8n2stj4+Pu91ufnqSIr4JM8OqpD62QqSBDRAUVLVqydUk12qqBArGTClwdDtsXeT8pKIWInAgpCH1aT8w4OOU56JgFQxto0qpiRTm1HLPtm9zbaIQADtXHn2Ao00rtSQIavl09lwLbleJreNP29l2lfD6iZlxa+F8Pvnerim7uhg9SlJVcW3Ur4+WVYcIam6sCyGUks/nU84LExEhO32LFTFAU7nRg+FpDYy7aNmIsIbpbTqUqS+1HJ1s4opMzrXmWq1WCxzGcdzvD0Pfg1ktxW10AOw2SUTgQN4NCgwGIaUUePEZ3u2SUiVmXAneSldzYyJrZME2Hvf18fNZzOyP1Gx/igJ8udCer1PPWolbeK/ZNXXJtkv0T/mA/nxJuSnTdpVysxUg2/CKO3k8OaPNorbkGLQ1MKDZLvzcJhNVXEkF7v8tpXji2TVabfNgOoHXf8xH9ES01uL+TWslnCu2DW6wKYDu53fEgT9VjCGEsF2bpdZ5Xjyz6znoXxwF4E5nf62UUq1Sa3G90syqw8QBapWcCyHG1M3TGQw4sLOVHYDrMqV/lg1MkVJ0Z6vDan0EwU2vROS4hpWMXA2MmaVWf5MppWVZZJVcXa7dgL/+/H3fu9c1pUTEAJBzdnE556wiToJeltksuVzr0i0zl1JTii7mump8XBai1KXktm4/Ms1oAijSvqlSsjcMPJwwxjjPM5rFEJGh1urf7LZMnE6nGGMtwqw+EyMi2yBsKWoqIUVTBWYzH8dtW0Fi9jFHA1C1JS8xJWhhbuyaeyllWfI0z+fzOedyOHQbC9jpJU+np/fv39VaxnHsh87nOUopDhFu25wqW/9ARM2A13lNfzYR8fTC9dTbmhPkpHtRaxxJsDalBUBqviqZqTfQb28O9zeHn95My3SaT8fHh4+/+90P+93+1TffvXr16ttvvz0cbna7fdelGFOIAYnaVLE5dwKJXJjwXSIxIVOgyKxBO5Va52UWEVEtpSLUEFh920qcErWWv1QRkVpBrUrlGMIcfH+bQuIQtvm9VgaqJ0/5Bg4QwEP5vq4BXwXir49/DBsRdTMQOYK1bb09KHn15FpLJ7h2VNEaaAuX7BHRzadHhKBXCQfu0jV0/5bKalhuflo0XgtaBARBVWfJaTVDZII2z95KdfT5Qk+zXot/LxhxTfhqJTW5w8Ka2QgRyStcXEv7S6iRmqEprGR3sBbCriIAgiqEa9S0eWuTBcxQAD3SHcwCEKfxMN69jjf32u0qBAFSQ8SmeishGIN55r2AqQKhGYEhgVVQaVqFk4pVFAmQfDgL1NTQj4ZeyeR4tSnUDVCs4BKqIaHpNUMM25FnJCQ34YCu8cmIxuT9ftiAIujnBCgAIjslA8HXQW2qMgEkRa5YM9as+SR1IVIEw1JIBaSCVlwzDa0FGaEBFsMFyIg5dtiNlRJw8WlQBGEKCrFqNQWFRgw2MwBhZDWd5+l0Ou1vbz+eplPRYpGHfXf7IuxvFBkp+CDt2pnwWET3EZCBYcM7G177ihGBHfOB2jaxiGoi1c1FfgDZQpUMqqbrgdT2RZkqAgG1DStRcHd4MSAMw903H//w+3nWMUEXyWpBNHHXlLWkGzNFhRYTj9hs1+gQEBSpflGqin/7TERAKr7ZDtelxabbIhLSqgWoerMAiHy8LoTDsiwqdjw9llpOp/O7d+8Ph0OMe1yvLLuKd4QVTxFj7LvOx/YAoBn5r0UBn+V3dsfFUNz2ROw7HfeyIRKHRpcByLXkrPOypBj7vhuH3pN/ARVUqmo1CUKEQIQxWoJA1BKJoAVuwXZb+CoO/ywfn/MlWkwiqKqsJHY0j5KzZqva/ERXDRR8bg3GT7LsYCV6w1VKlYggAjGqGhKgtkQqBYshGqoZEsdht3/56tXY911KHELoEq2g883Ya6omAsyx68bdjojVHTct/AcUAYFcGENrkYs+5ILItjGIia+jw56Z0S53BV3zCJCIFFFMFDS0LCwUXVu86mAfFKmlqpjP8rcI1OZ6ax5MBkAi4hBiSs5lFxEptdF9WpUvqkDMXqmlrtdSkAiQjNCQkINRNGK9yAnMxJAiMHrGKzUKjxogICsFV3tNUR0jRIQxFlSNvabhd++Pf/jxp7//3e8/npazcBjuQuylahNARaAaLdWOZzie7OOPlB86XaIVREOiSWpWWbRWNQUsYAKmkQ0IkEPXI6YqWcQAFQIiGFeCKqAASEioaGZiBAo65QlKnqq8uDkgvxNbB5UVvaz0bqhW8RO3GJpaFQusSKiiCqYZqQo4npC1LCVPZydrUojY9d3+nroYgN9prpIpAIoRd4QsqlYBAhsioCmhmrEZEaspggmgGYKhKqoArcEVTbFf56bE6dJObEHYsuUQHXLyzKxoV6sGPGcNf/Gi9iWbmADb5JAAUPPpulVQYlRXB1rksgkgE3HXdSmlsizzvCxLSTH4AqPuXEJTpcBsRL4I+v8b84rbsg2NsW6MEYnMwy5FlCgQxRhT1y3znJd5WWYASDHd7A+RWUUr1jZq5kqStDGeYIGJqXnhCYkCcxUppdRSSwMcu0Bgl9Gxywq8pmjgeg/4+vgZrWRf/HPAL9zPn/cqL7nijR10/etwqRKupjCvPD3wXx3PcB1kp6vbY52Au4w5ElIL0liHzpgjMxOhasuy4RCYyPVcDgEQpQogKCCI1lIYoJht/lNXRTfHpZk57dc1U0fE+hq93+9DiPM8H49Hx9cuSxaRKtVdDDmX6dyizNa2LnuWWikFEZgZ27ahWavWrTSZ3wqaP6NZZbeNgZmllKZpnucFEFOMpZR5ZVmoyjRPfd8P/bhMy5LLwKHr+nmeVHUYhlKyT9zv9we3LY/jOAzD09PT8Xj0RLVlWc7ns4i4+dchBn4c5nkuOacYHUTgrt7dbpdz9pLEpd55nrffdbDDbrebpqmUGgKEEOZ5mqYTcwwh+LbBxf1ac4ypVjHT3W6HODw+PgGM/uqqSsTMwQXBWqqIdF2vavO8pJT6vndGc9/33tfzFcShvbUWAEgxcgjTNG2Kec7Z+TxEVGoptaaYmLnU2g+dKIgqInBMMYa85H4cHcGPiCIqq5XMEKW1LJxzDEghxGSAJRdRWUo5nc4PDw+BgwOdXR8GwGXJHx4eP3x4TKnr+p44ACIxVdUl55iiiBJxo4OpiXgwg64hQR4hH1ShlDqO7A5fAAhhy1HF5gPDhmUgIjdKt4klaQxMQgxk37y4wTrlXEqu05If3r9/8+NPP/z2h2EYX796/fqbb7/97vsXr169ev3qcHMXIiGxBzKLCQKQ+rSQX62uFLcmUgghxZi6ZKrVeyw5z/M868TIMbjZIcbAHULJueRcJavoND8tywQAfT/c3d3vDzcxRi9LzdSkxdZdhkcR1b4WaF8F4q+PfywPxWfTqpcRBLzeAXxCmbA1sIYAtOmusM5266Xq1BbBY4C0UlH12gVsq/FJDTzoBBSgilQVpBCIDWltmNmFNXGlULVbGhBTBEQ1UJVtlk88vKSpw+R65hXqztYfBARzJq3fx13oEy9AymJS3MQhtaQUvDbBph2jGaqjh0PsxsP997/K1FXsRIMiV3PdlVxg0Ha8fSp33dahifO/CK/0+PaByYN66HqfeKm2fLbl6qhe3HPOpP/C8Nf6P4aAzGGb6BSXMhsocJXCGzOIVhHDABWRWxMSFBTB2v8jGEWMXYgadreSZ10mydN5eUIpARVUzMTAEAmQDKMiqqJgoi5RSBg6SqNSMGNQd1crIvZ9f6xHI0NiIhJUAAZDBahmp1m6qXZ3vYRd2IWQxm53GO5eIvdFlJrNHN3QC6t+tO41/bxT2rITARHYTFp9SOhxiWpGxD7TrKYuA1UrfojcsNcUpTZN54BQ+uTgi8ICtOtuhvty+vgjn2S4P1z896350cQPj39cB+Tdjmzr2YsA4LEPvs8Tkd1ul1LSZ5Ej4K7Az/1Z26niO2O3Fdzf3xNT1TJPUyny8PDwn/7Tf/jLv/xnu6F3twUimug6PdDa2oGD73rXfjhVFTDDq73y6tICaW5wYiJRdSKmZ8G7+kDOS1FFwtZSVi1VyvE0zXPXxaHrPJFXwUrNYBaIYgxVoBQNjDFwiEzqBHM33tOVKvH15v8zqqlpDXF6flZfSVKX2/6KZHn2DJuzwwsnZr7qgDwzbfn5v5WpcO2TQkBCUpdH2cDQ2DNk2n8y72/uhmHw+VkKAcyQyURqqWbGhABQzQwx9f3+5qaVrCIigoDERAamVnIGdl4sbEhhvNzB4PNIeru0+q7/sIE2zExUSsm5lGBKnIgYai1F24iNK+GqYqZGAMiEHCJ5dpwaIsWuDxxUzdHkJqLucGwFQds8ELHPSviLE4euH8q8YGvgIRITBQqRIgfmwIGImAiINJAhECIDMiAzAJoCGgbiQMRkCAolSyVlCjHszcq/+/378usfHh8f81IpdtQdmCNxbH7UmlGyHCc5nuE0xfM51Xm0cxcWlFxynmtdTB9VM2ImMqTYhSpSq3zzzevDzc3u5ub2/ptzhbfvP7x79yOR3t8f/sm338h5Oj08/vCbHx4/PjG4/7RN43748HF/uP3FL36xHJ9UraoFn7gRCczAqwhhgAjSvilWsLxkAiVWikkUZTZhC4RLPWYzijEwCWIMkboE+TTu7jiO6bZ783CMomDMUDmEyKxCsFhMwQ9bFVWZ+9QxGohGhM6Xfnfae6++7QFVSxUg5hAC4YWN38677Sp7LlI9G5lf+df2xR7PM/lJzdNQVwuirTscR16vTe/LCisGFkPwEWmRmvPCjKok0oIoXCB2my6psgjGSESeNOl4M09f1jWtUa40NqeUgmouJTCPfV8dybjMjOT2w+v8elNRZ8pQaywpKVFDQ3oOrPuRteGJi2s9F3LORRy8uLBlc1l+ffw81rJ1CuWTkEa8vnw+z5FbYSPXky7PxGW7Foq/0Cn/VB3+vGp4DrV4dvGii8tutqArM0I7WU2bI5iYEBmRu65PsSeKtVYxI2ZRy7WICCITRw5pGDmXAgAhBF4Wt9b2fc/MZuaj6LXWLbjMzbAeKQYA4ziuXILgyJbUDxRil5I/lQPyOUS/u6WUxnH0K9cvW9/cLksGQOx7cThy1yMiIiNiiGlZ8lJqLTmluKnSm/XYbbOAmLpOm7vIRDX5OIKIQwwY4zDsaFl8X+xhmBvFwlnJroZ7Ip9TdP1NumvYhXKXUP388Z/Py1IAUox+iDbhe55nVe37HhEd7zCOIzOfz2fnLDv8l5kOhz2iPT093tzc9H08Ho+lLPv9vu/T6XQyk5SiGh5Pj/v9PgRUrSrBMbWHw+Hm5uZ8OlaQruvN7Hg8xRgRvRmKMaacFz9gOZcYowOI51m6LqnqNJ3d++U7LvdT+0eYpqnrekBQFGZiYmAzVSSOMarK8TSP4yDVHWlY1RSJolsGrEVEqDLReVoenk4viyAFUTMkUfnw4eH9+/ci8qtffTvsDqKKhil2ivj2w4ff//7HWuvh9o5jWEr2C+Hh8YFjONze7g57A6smUAU5UAi0aiD+feUqVQ0pIDEA1trw32uQDKuiiBgaEYpWROSQYhdqqVXqcVoCB2aqdbGqwcov7sdX3SupdclyXmQuNi3leDouy/K7v/sPv/mPf8up3x1uXr7+9ru/+Ccvv/nm1avXL1+9GndD6NLqgFAXSmCVzi8Dy4SoFIiHrsMeAW2Z56pYii5LeTqfa31CsD7FPsUUwzD2iVlNj8enx8eH4/H48f1HJBqG4fb2dujHcRx3u32IIedsakhoANUvma/0v68C8dfHP/AupIlQbUzNwCNwfEp0LTevZo1WGegCiQBbjavW3BzPI+/asAJcZ1i2/X0zo245d3iFh1W1KlVFkVy99QShtnHynZLhljG0atPk/IbNO7zusYhWjzCtn3Q1L1/GmJAAVQSbqO2JZdYgxG51UnWEsEgtGbQBZ83tUQqgGJQpDof+7hXt9iShWou2JmhvzoPAV9V1g+8QGKCpiMI6TIKrkVVNPTsN1AwENqUZnhFmN434qjCzTyBlm0vO1i8CAAgbmx7Bo99a0bUCOr0bQGv6fMtzsoYMs2dTzmaeu+2qNRiJAYXAmIxillpUiyxkAI17gAABMCISciSKFAcKEYiRIqxGPlMgxJQiIgKqqhAxxaRM1Yp3HMygCD8cc5ol7O/3e8bQYegEIjhg2SoYXoFFP2HRWjvg2BidptaMeghIBI0n4rTitiemRncDFW09lDatA/6dXowVou1+6b56t7ZxyKaURuW4lDIteReC1YWwJe04dsMJFRvFZfXrNaLHtk33XWkrWa+YhVf19rMp+2sj5PVjM/Ae9odS5kfC83Gq1R6fnn78w+9evXr14v7eoWCNR7m+hO/etgG9VtL4VSS6Xq3braNFyDm1EbaMbGlhfat6gEBkrc8BrXuPpqan8zLPOYaQuq5LIQQmRgGwKqoqhJVRNap5nGB7ATYITJe0+a+Pn4vjii6Uzy9k+GyOnm3c75rlvf3tJ/R81ykvUezPH36WfoJN1AZ7bPU8oc/AO7abcpUqCszIjABIZIDIBEQmZoBqZuKLAwIQEseUYpfq6awrVwLB1xxwlCOpgeMFGmLIp2vaD/2JRKNrIqU3A31RdeaPKSiIl3DMwYihimrxwQsOzOjzh2FtCAXHv3oQF6JpFVgRxWrbPXZlCgFdvNoGABhDSqlXKUiETBxjTIlTosjeEWwIACZikkY/AAZgHxzwZcUQpYIBICuyGRlFJDY2tKI09LwLIuKBeKZkgApWq53e2/Fj/vg2TvNOcYfIVtTKpGWuZaqlglWCBVGQlUkJilUlSOPwV//ir7/79ruQur/5zd9PEGXoh1evD136/sXdi13/4pf70/HYD8MPv/3h4e1HrRJCNIRaLVL85sXLb1+9fPsH+9h3cj5zc/UoBVY0UWuEXW37HAWn9gN4LxekEFexpWofGJlVqruVkEmhgAkGZgpJrMPC8ylYRg6kgSUQRwDUTFiYQgBq5GmmPiEGEzILAGYlgBRU8IWxYYi327mYkc/nXHWocYN1XxCHuIlGlzyIz1nhX+zdaYv/XT3MlwkWBADzFdbA1ASEmMlMFXTdNKpCKcJU0AxSYCLDAEoGJiCsykTG3DpDK42xAbeaNAtGdCVHw7aJ2iLvm6pmSsTeQ9r+2U59ahPBuk7XeGwdqKhvz7id6jEEZna/oasYfhvxwDone69r/SVx8uvj5/HY8oevWyafhzp+9lt/9gf+5M8D/ukn/JOitu/qEdAuW9Cr+YAN/G+I28nsv8jsdEFc60jduArO0nWB2Dsl7nV1s7DveLcV3F2rroq2pgtRKeV8PocYiZk51FJqra6WqqqtOOPNOwzrPND2ElvDmJnBzNs2iLgsiz//ssylZERwdu3GKXYd0G8jteHFzcELhLjMsxOHEXGaZqm2G8cYYy5LzjaOvaoty5JSDMET5/JmCq61juN4OBzmeT6fz85D9zfmtYBzdRsSh2ieZ1zT+eZ5NjUO7Lqwp5zt93uP3GTmcRxrre6z9iGG8/lMhClGFaGUPJ8z5xwbfdhHcbXWYqbjOJ6Ok+k87kZmenj42MWIV1kOquqwCE8RHMfRTDf0hDfVXCfdhO8YOKU0z7M3BrbYOuYQIrti4AJ6yY1E4bOVACBVyA3gAKJCkbFF6rbzk9YXPZ2OT0+Pu90YOOSSc85PT08AcH93P44jAKQQQwyIeDqePrz/MM/z7e2tZ8H5yVxrfXp68rPFdfzmbVdT0WucvW+AmJmJ3I3rSOjryt3XDn8eAPB2iIq6glylhhAd0q2mbBoZu3EIhKawCFTFUm1a5mXJ53mZl3ye81LKxze/e/jwJqV+3O/uX9x/9923337zze3t3W63G4aBiNvQsKpn93mjFBEU4P3Hh1rr0PV3d3ccBwTjXtMu9jnWvOQySymnZZkyRqbUxS4O3X73ou8Pd7XmOs/zsuSPHx4/6GMIYb/fD0M3joO3fLbl/2u386tA/PXxD/8gcGsvrd28da2/olDhJwSrZzuHT6zGa6yWKbg76DmVYtOImwF2ReZublgCVAQzEPW0E1vVOFvNIbgqZZtbBNfR+9URvMaONCOiOgBhrVXW7hSueEaEDZLs7uIWLdqM0Orh3+YgOjQPdqsukAIYAVQDMzYMlLru7kW6va+cqpFZm3X1XZCqw4Fx1c7RM+MaDRDoEtVHVwlItlmAm6qLLfDhUx7ZtpG0L+RxfWregWspvUF5Vy0SnHlkF+THlfRiF88zXMX+XTOVL0WiuasrMoBh2SOglqBW3QuLxIABMSARYmJOmHrkYKtZGq15rRGRCd0ubAhGBCGldMgw11zNAAi5H6jfZ4uQOsRgFBSDE4rR1m6EPatfAeFZluL1ub6eZETUPvTqfVNVVBUVNkVD0+aoA2vQFbxO6Pn0CREUzED8TKgQQ+Jxb+U05zpwoGbXQm1NBbwuqJ8LW5vse5GJN6XMCRqblv3Fjf4ndsurkXxAxK7rDvsbBDKxeZ5qhQ8fHwCp67rdONoVenWL0fMN/banv7QOcLtOrw2Z7f8u73/TjtWQwDEwuKJTCTZhtz2HqGkuolZKYKauizFwYHYojqgj59jjKFriD4IL+F85Ez83gRjpk8p2K7Cvm2dXnvp2ZV5jTz9DMVyq9Osr5ZN77MaaQGwT+eBJ7YSol7oopZRzFjVbgaft3g8oorXWIgqm2NDe6L7a1PVdP0zn6XIHbmAIoDbqom0R999tdx2zz6DM251vwxBvwXfeSzLwXgpekY1XKh8GokDMnltnSAZExAS0ZlKTp4yKqGlVtVqalHZ191tbjtZy9lyX9qAADCGllBclJo4pdSmmGGLAwEg+QoMOIgZEghY749U9sF/UhOoTQq3EIENScZw5g5hBAFYiQaxQJU8wn2HOOM18eh/mD7v5KdSagAJA1XLWehJZVCsiBEYmVlEFjIFTpL6D0B2G7i/+2T//b/7pr7o+/d1Pbx4W076Paei61I273ZB2w24YhpBi1/f/9vRvz0/HmKI6X1ZtCGnf9T/VEgKnEAiQ20EPCkAgYmaERaSKtFtYWxEsEGdiiTH1uzF1Y2BmfPf27TItYBiMwRAUSIUkc0GGPNpEZWFjskDCPjOrAJg93ZeCZyLlEIjY3UMIKgvIgqArgKlFGBA4AUlNxWCTV66th7j1Jp/vFbetyqc9jC/07exqu9n2lZ9sSH3f5suHkrU0C2IKMXKIAFCl0YqrKBZRbr17M6OWAtG69WaGRGREbUyKL8kMAEbk4oJdcZW3Jj2Ax/3Khk91dUmk+me1RlGiFceBpqQistKNm+xNhISBGC4s0fZAB1ZsZJj2Owhf250/I30Y4JOE4T+fmvCJT//PqsOfv+TzzLo/Lzd/tgpf9oFf/PE1hdVUfYIQDS7ycZVihLT2Wlwgris517m0bWcL4Eqrq7ciEmPjDjsW3Mx8I9r3vQumzAwGm3Rrq0Pfo96c4XvdZvZ/8Utv44+7jOiv6OKd25P9aX1YodbqbNyU0qbvE5KwsD57Nv9oTisWjyoTaQgmqAAQYyglu+4ZAues/u8bdjnGwEzbjMLGwPUxvpyzv8MQYs1FRJmaR7XUwoFjiv5ZAMD1ZVHxd34+n7fXci2471M/DKWUKpWYAGBeZuZdjLFKnRd14HutlTA4XV1EALBWSTGmlDze27ES18ZnMyPCnEtKLTTP+Rj+L/4tbF+N45W3g49ItVSfz92+yrjq0b75UxUOwW+Tzi3x2UpPVvCvQEWIKJf88PCQUtrv96Ly8PFhmqa+7/eHvX9NIQRAWJbl4eHh8fHRPdduu/av9fHx8enp6ebmxj+jf5tERIGcbOkub9+R+smwWeiu8SafR1NuyYSynictkUIUTdFMarVa+4CJCAP2BqJkQHroSq2lSC4yLct5WZZclyKlZj0uH+aP+eMf3v9wuLm5vb27f/X6291+3/VD6jqfDFu5ig3O/+ObN7/97Q+1yi9/8Rc3N3fjvht2XepiGmLsKBSSUqUUqaVqlbKccwmcmDkE7kKMXT+WWpZcclWRaZqn6Xw8PsUY+2FIXdf3fZcSfV3MvgrEXx//8HW1Y2Mv4FnctuErsfSCer3a2TdU6ycW4/WO5nv1C6vpWUnQfIXWJnwb3mFTkx3Ue7G+mrd5fW+hgIQX6W4TzS6hQ84GAFqHtOxKDvAPRO56tovedxnWakAAXXmLKiIqFVQQFDwhRgoDiCMswLw2NgUDxtTH8SYd7nHYF+CKBMCey9XkYG0zXJvm3ebzces3t2wxvRJaV++zq5nNGPpJNXDRNT4bOoMvocqezUr7t4T+5mgbH3XQ7UXjvJrf/GzfiZet4aZl+rdN2PQ4ihhHAjLsAKp/P8RMHNxzTBSBInACZiQ0kAYLbnY2U7PASOwB62QUuv1toZ3NWQGIuR923bgXGoBSBVYHVBuxG24bUHk1rT9zEV55fe1TxRg85RDRfJLbEdCqUEVYCFqSOqgCcbNhGF56DmaO318NsatDAVDEBAADx35HqEWnItYT46bjOJtzPa2vujab4uywCViHbXXzM6oqrkbyazfHJ52DT3Sua3QaM/f9CEAiUmqRWud5+fDh4zgMhNR1yTsZz23KEGPc7Xa+ldneDH52om7tB7BLMH1z2SsoGSoCXFAnRKCeXtkcZEgrEKNUrZIRoIqkGLouGQQ2BLBatVZNESQwMzGDGplnR30ViH9mK9mVVntNNb0ula+F4E8Vpuf/vrV4rgfkP3fjfmJ+XMvBxrxmQufO+NWUUipVqmipVWzNfTUDhVplKUVVG6dp/VDE3PXd0A8fcb1YGkddm4NYVEWACOjT96ZwaYNc5+et8ppugJrLTRCROcTYhRCZGTC02z4FoEgBgyUAt7V6pw585sTM34pqC06BLZLl01Jn3VXAtvgjteBRYmbyTx1ijCmmwMwEROAC8bqmO7KnUQCIgXjtEGBrQquYFtsmnNBQa0BF9zMjGUcFy9NRHp7oNMV5Geup15nICmtWOYtOUibVSVWBOcQQiAMGIBapfRdu7uPLb6DbdYT97csX33z74nb//fe/+PDD2xpGAKgIk1js+3meb25vX76Mx+OZOQASMYMpqMmyLI9PTzFO0xxTSiloEd+9JIqKUIDQ1AKnMShaafyPQmCBSCksQJC6+2+/eX1/P0ZGk8r4/g/voCggIxGRR8lVMyPFkQqaBWUCRiVGJx40gMV6KhvORggI5M0MtWrlDKDQ3EStvdea822Xo97wuDaLfa5hXbdnPv8xH7+F5xF269JpiC059+rqXa+GFW2NwFsuL7FTSdbkhhYPYG1UC4GompEB+TqKAERiZtQSrNqnJXLD7mo7AASy9Qk30oU2ddiImaVIi3RsW9nmH17n82wTiD22ztfKbfYLiYgCB3R9hIiaiqRaq+fYlSYTIDJv81hfHz8LefgSJQobpuC/hIm1iY//BRryZ6sePE8nf55398U11z6dGL0YIj6zFRlimxmRNql2MUv61ZZrQea4mnnNFJFqLcxkBi14UjUEXk0MYAbLspgZM65ap22eCSJiJmYKgbuUcFUGNxlu7bjgJjdvY0bXOvv2GVzSva6e6EL9Qy/f5nme58lD7ZxB4VkiIQTRBp24Ylg1ZTDGJEXckgwI7hdOKTJzKRkAUkrMJFI9oc7T9hCd1FRLydvuvdaq2gLrXAPv+i52yaosORNhiEFVxSTGCICl5FKL92JVVVSIKMTQwBfMRFSlimo/9NrmXBEQRLWqxBBzyTnXvu+HcTydTpExdUmqzsvCxCEEAwgxmqnfsoZhOJ/Pfk9bY+toPSyN8eXeZ5eDY4i1iFRxFzlcBT8Q0TwvMUYK7NZs/yo3yoePbrRNoCv1dlEl/BwgIlEhJlV9fHrk0D7y+w/v1bQf+n7o29RU4CUvp/Pp4fFhXub9Yb/b75hZVLzAfPfuXallGIeu67xwrFKD52oziYiolFJCDKYmKs5BInxmXNhOP397W3airsz9ywriaYdgBCpVTCoRMiohoAEbIAWKUQNpRwCd6JCrVJVcZF7KvCzzPJXl8Wn6ML1Lx/3h/PHt/uZ2t7/dHQ67/SH2PQRC5hATUSSmh4eHv/3bv3375t1vv/vd69ff3r043L3c39we7m5v+75jDl3qwCznvCxzyXnJec6ViCLHxCmF2PXD0A9aTUqdl2nJU87lPE1PT0+p6/a73eFwSF9D6r4KxF8f/yicV15xwWZdAEN7Fnj2xS1CC6eDtWBDbBM92LJs3LO5LbR2GTL8XLDEdWeybcHF98hXpjBV3dTH5vptXeqW5wUbJ+8q/MoBeE3k9mJxpQSoyAWh4NoToYqJmaqoVKmeYbCoFK1ZajapoIoItRZkJmZ/C4oM3A+HF93dCx7vC0RBhkBawRQBGJBFwYAvgnobXWycCUJkRgOTWlpHES/findKVyVtFdmbb9q24gN8avdzCfi5irEqem2YmNZoGVsj7lWNGInZZ0xUPBUNqB2oZ6KzXWAYm4sFwbP1EJDAM8YRyUJnwMiDqbTpmhB8i1BLUQBAViB3DasZqoD/rqoxllzS0KfUT8vJBABC7A/7oesc9YEUYgfM1UgtKIWVfdLyjUw3x63TlnwriYQEiFutt4XnOJUAtxOXGlxDpZ19TZrhuCXz4NU15EotXnkSPrVKeWmLmAWY+9AbClcsggYm4OZCMkBAuWZ1w2Yl3yZcXX7ayomLn/EToojZF0fOr1yW1ojkzaaBMSoAIN2LysOHj1XqNE1vfnpTq3z37Td9FwHh0vAwA4CY4l2889yMeZ6nabIrF7NdYMpb9bCJ5qsVC1GvADfkgXprf4LImpmLkYkYuR0H0znXpeRpXmKMfZcCMxEGRkOt7hwhDCH4/HoIrKZfV4Cfl0Z8UUlwdZ57m+/aUHxdS/uv/JHS2ynYXxCdr6+jNeiy4VkI2G95DTHMQMFUFQhj1+G8HI+nx8cjcwwx+Ni8ed1g6q/IIXDDWhCH0A3jsN8jcmtp2oqa2FKvzFDVENWc602XfuyVOP6sLXT1J0ToxEJHpQ+7/avX3+zvX2AaxZEXAGo+SdHK5VqzCDggT0V8sHhNyUI1FFE1BaPrtR7BwKRJu4gKgIbO5IU2bdJa1CHGvuu6FAMThXVt9sROZ2gQKhpuCBp0tLxiFcsznM+wLHk5Sc5QipWSTKLJSMAAwBFiJ05JXiZ7eupKHZGGSIZ4Fn3My0epJ6JKpKkTBfISPmIg/cUvv+WUzpzycBO++VWN++Pjxz88Ld89nu5f3P3P/6f/k98+/quHGgrQVMubefnOQN59uL+///Dh8acffzqezxyCgjFAClROx9//+teP79+9+P7bGFOe5/l4QmBE7PvBDLDUbIZD+v6f/fL+9cvT+fj2zZuP79/l6WxFIO2FIo6H9PL14bvX37+8Oz99uHlx/x/5bx7evIdFQkqIKuAOemPVgRQNIwCbMlIKkJjYJ4dMPQuRiWrOYArEwCRAs5WlLhXROHiOmw97IAI1VjS1hne7Bpto+4ld3WXYbRzKF8pNFV0dV7qG4l6SVddOIRCirucKEPgYlni4u5vpaYWOEYOB1FpLdRxnYF7pXqBKqiZVgaF5CgzElFCUDFGQkIzIyNRiiD644p9tNetVl7bc/GctGQDQLBAraVvIVNrdg43dRNwkANzEcCK/4kFRfEQMiYiEJRDTuomAEAIYuBdPRErJIqoqHo77FTHxs9KIr4w6z+zAfwSg9Hx7D1+cG/uzJ8g2RgLrcOWf/Y3tZxDBaxkPjt4iXi54mTa27kFgoe97T+Vy4GCLljTNednksBjZcQSIWIq5+tl1XYzBk9/cm++SsrdnVlnNHcEAYMsyr/mxJKW6z3Q7Yn5nDyG439aZvw6y8F20eza3sTwn/3Zdd+04dvyvKJVaRKr7JT1d08ycVhNjLLVB2Px3U0oOhej6LqW4iJVcYowxxSr1fD4xH2IMOS/+njeFmmgw0/N5Yl5ubm7M4rIspeSUUozB6RDeN1KlaZqYKQWepeZlcQOHu545cD90FGg6nw1st9vN03w8HRFxv98DwtPpaRzHlBIyTtN53I2Hm5vz+VylhhhHxGVZsMd+6EWqA+AMLNcyjjuDOp2WvuNxt5tOR4c8OLXDLd4u4zLz6XTa7YaU0vl8chuy8xn8q3GFGkCmaRp341bpMLMH7iGiqJg0gIabebeAmeDcpPUaqbUYcUzJ4SHrz5CbvURlXuan41NM8enp6XQ6vX79+ub2JsTAkZFQVJZleTo+nadziOH777+/vbs1tFKLv5+//+Hvd7vd/rD3n9eq0zx10KUukZG2nF9ra+hVwK/nB25v22u6UsqyLG673qDYbr7xoyctN1jNBFXINJgFQFbjKmIGSlpXWjZRRO4jGaB10XbRYBA9qNZSaqlazcrx7fun9+8oxNTtbm4Pt7dxN6Z+GMdd6nriZHmCkvP5/Ju/+7u///VvYheGsbu5Pfzi++9fvXr54v7F7e3N4eYmhiGMo/U66pzzvCzZ3foLMAESYOIUQzjc7A+0B4B5no9PT3le3pzOH969H/rh6xLwVSD++vjHUVh/wQfsSpfCH9khtI3EZ4m3uCW+rZbcprBdrBa4eZC3ut6jqQEUyE1AaIoOv7Crd9ay9LAlq10rA42S4YrAOl/q9kt4VswTQIPDutEJYU3uXUcpsIVuVZEitapWz+3UWtCMCYlRTVABGdVUjSjEMOzG2xdhd5cpZSUgRiDzQgbIAFUNGZvSB03LRaD2ZgkJiU2NTFUNHVcAaEo+yrlqsa1xT6tg5lbfZluFz2B/z76blmyyQnibrovbl+jOakPUTZ52PobqFXwBDL4Qf9GCwNYIMD8N3I8tRATADuQwVGNjDkhIKcWUTFVhbgBmM9FqouSZgaBgwoxdF3MpYSnMgZB8yNmIIfTUJE1WIFGr5pIBb6edujxzmaEzAhRTVQsUvPLU5ziEVbFon2MlQmPLTQNEZCRiZB+88R71tVHWq9A/4fmg1R8rCgWBMUJEw1wkI4JzKHD1ZoM6uBsu+eWXZ8YmRREBAIfgQBXXc75YRXxugdzQJs7/3SQbs2BgBun29tbnqgzgeD6LWd91L+7vYuQ1XV0VQRHUIDIfDgfnlB2PxyXnZZqrSLNSP+PAOo0RES63Ej/FFNQHAAxAG+/FmAgMSAkQpBpwu/CJ0JrBX+dalqXMc3Y3cd935JBtVRCTKoAYQzBLXwvqn9Ma1hqdbWj9QjNbTzZwy5K7VACQaGOGPmNQwJUF8vN8LWuS1BWX58oh27bsfnV7Z4/b6eokBCQ8nU6n03kcRp83tOqD7wKGRBxjDLyti4jEMaZhGJmD1ALWrhU0IGr3cFUF0XU25TKkAOs8zfPpgWfTmmt7t43MIIdhN477PadUW1NNzayIqlRVUFFQqFlUSVolIx461AiTxAYgpmZKHJjYkVOqaipkyr7Et5kYNG98eu+WkAJ3KfQxdDEGJmJc2Uu+4hkBKJrS5kljDkhiVAvUbNPJHh/tw2M9Plk+o5SgcoN2T3wgvuGQQqAkUktWBVUs1ZaFEJHhWOtP0+OjzI9WZybpojELB1EyDBk59hwH/t/+y3/5+vXLv/n9T//2N3/4aZkwjt24/8PHx//8h5/u7/a/+MU397t0fpgxjdbvTNO//90fXsmcZXl8fP/u3U9TXobUq2giTERoYlqHXf8v/vpf/O73v/3w9icVAUUQwEC1KsQECDVG6cfhm9e/uP9vf3k8Prx/9+Nv/vOHN+8Pty976ubULSE9qf13334TSHcv04ff/7QcT9kmDBgookefq6gpeQ8CMRFGpi4wM5KVQMYIGIPvDYwQ0ZiBAhnRY7HTgllQ1dAsoJqJEBSTliHsY9+kaxMfr7aOF1b+c5z3pT25rWsXswC0BNQV7H9p3xKByUoqI0CAqt6SUENQMDEjv9LbBzdTIyRkVhVpEe2mCopA1IzwioCmQmqiRG7LRVXVqmiIobV/DYG57TlXHAUigshKUAM1NL/ObHVZIoCIC98XJEuLvKXW9TExQNXAzfXMCipaVwsxuZCPbk6MMabUuZEw52zOY/r6+Ln4drZN2CebN/3SjOC2Z9t2Vte7uytnwDVe6cu7009cw5/M4vyxd7v2XN3Or/Bp2mTztpgPUbK7idjbHrC2gGIIeEVTcUOoz+M7a6LvewcI+N96wJpnuLk46FJvCGFZFlgRrqrGzKoGIi4BNyysmRN41x9r9kzHGrgYt72Q8xDgKnjAD/VGGA8hxBAcLABrJIy7m/u+C6FXu9zrto6yW5BCDLGL/dBnzn6zCIFVqZTsW4Jaq1tuHaEwTROtIWwibgQGF7hjjDc3B/+MLmSras5ZiWDFUDh/AwBKLg7Gdam9KbbEpRbXZz0cz/VuM52myQVZAEgpDcMwz3PO+fb2VqTkvCzLMg7j09Mp5xJCGMfRZ4ndA5TGQVWPx6Pz6xwoHEIYhkHVUuLrgzPP883Njf9LimkYhrOdRcTRE/7t+JBiSqmuPOtSis8vbigPH21Kux36H5r5rTsERkBTq1VCYLqSled5fvPmzTRNwzAcDgdvBji7w7/T9Wvtb25uuq7ztz1N05s3b96/f7/f7zfiROsuINVS18nkxpRgZqbWxMCrICe4yhDaehiefOgnwHaWOvywrUJqUjOpxhAiiGlFFQYAdOeXGweYSJ0euaELIyEQCBH0ATkCJzGccl2K1OPH9/MTxRi6fhh3HBJQmJ8+7Hv+5uVNFchzrlJPH+eHt+9/+E+/6Yf+m9fffvfd93/5V//sm9ff3N7ddf04hFT7mHOWKqBg1eZpKXkpeUGnzAQOkYeu//4XvwCzeZofHx6m6fx1FfgqEH99/ENuQgzIyy7X/BTWcGi4WIhtxbRejT/YFiZnJpdsWmuJd9dkW2wbcYP1b8nBgerBbtqcRegqJ64BmuS5J7y9UNu5rKZI2/YltNYdm1lSYTUlqWq7Oa6qrKEatFvkZjzcBG1VdUXBtEqtIlW1mFTT6ogJUVEFNUFmABJVNVSiMIz7V9/weKvUqUVC8mEXL3c8QIRcpmry3jowvIqz6h5VYyIjJEUtuTaMLDVHp/+nV9YmLqY/m+Pa+GFrJfZMB7wKt6fmv0ZEV0B1G/iENX9mzS8k4o3X6aZZ8UEehcsTth9wWxFdgLPY+JWOxQiMwVaNwwAAycEWAESNEOjgZ0UKTGiEAGyM2A/9vODucPP48ODu71qrFq1oYohEYM47JiY0AKnZEJC2zgH55BKAXqzWnvi0bkrg2ubkedCmCOYqhdd9Pm/qR5aJmNsG15sNtG4BFV2qIbry7G3DdJfy2NpEuQhkQOIQIiFHkIk0k9VgysbNJbz1cmyjD1+2+75J9SgbeI5V/cRgAl/giW9AGaO1Kt669H6sTO3lq1dgOk1TLfVs0+9//DEEur+75cCmqo0CYiKVDB00ttvt9rtdzuV8Op2n8zzPU8lS62WIuHUsVgr6lc2ZPbhxNU2v7xyqCoLSajZ096PbC5kDErO2s3MpsuTz6XRmghjDOPRd6gRaF2kpZx8q/Pr4WfitTF1k2SZlN+O/+VqwNmYu06mfT7hf5luu4LnPMSyqVSoirPOhCPbMzOXuJEVVVFMjNWIyBAFTlZjS8el0PB7HYRh0EBXVCu54qhJDQoAYgiKGEPyOyiEcbm9i1+VlAVRfUcEzf9BMxEpFIA4RTTdiOa4K9oVXsSrH26F4lk25riRatSxZeCpQqqqoCEhVMCRD9AVfMwAEv9tRiE16oBboGRCZae2CgYqZGjZ/dGxjBESMJG5rJfV3W1WIZdh1XQqMCiIeAmsEzOQrEKAiIygAISOxCi4TPD3VD+/sdOJl6ko+VAsiAQWgEMlIdEO4IzpETIQmddYyo0HAiFApHEt5qPmnsvy0TEerlpi6FGIUZqXAqd/d3O8PN+PQpUj3v/rLf/7P/nK4+/3jefkP//f/9+47CuMhU/zb3719Op//9/+r//5//d//z/6P/6f/87vTo8a+pGRAi2rfDy/u7+/v7jn9oZglt7kyIGix5ePDh//rv/q/dEP3/S9/cTqefvrxnSw1NwXWMmIhe1+KPRx/N2UryoLf/9U//1/8L1+Z2f/wn//woLygvXt8+Nu/+Q//4ptv8sePlnOXOFAKSAQhI1tgg6plZjPyUpMwEDJqIAwhRDRuRAlEhdQlRAUoSICEKQ0fp2maKhgjMYFUb2Oz47DNTbDburLuqRQ+mTd61q1sC802te3jUo2kYlfNH9tOV4WrobZ1OwpoVk2qVCq0EUIJ0ap77mSd61mhUisbTVVrBVVbZ03QSvHVyC8T77xKqVa1ybTMHrnOrZMDROgw0FqrxzGKattvuiNMRVvSz0pw9mRKZFUrpbok7HMBYGBsnobnr4ciysys5Oset/StGJnZYgxd10l1P+bXx/8fPa5Dp68bnH/Cl3BNboEvhNTZp0ahK6rZfxnCxIuyzWMEm+DcllIfkyzZ3zMjIWEptYgKABlwCF3Xm9n5fGIO4xiZ0QXAWr39irVKKcXZ/SJaSkUkR9YyBxGZ55mIYkwpJVVjDvvDwX99t9u53ObeTPf2+nXddV3XdSklF1WvncU5Zx92dHdnC5ojckOuGSzLVEVzLjkXazUUrrJzqy795zcp032+CHh6Oqno0A2Bw7Isatr3aRzHh4fHlMLhsF+W5enp2PdD1/Wqkxn4+zyfz6fTue/9PVspRUS7ri+lLsuian3fD8N4PB5VtOs6Qso511z7vo8hTucpL3kcxt2wOx6Pp+V0c3Oz3+3P5/P5dD7sD0M3TNOU58xDvx9359NZah2GAdTm85RSur+9Ox6P0+mUuhRCmKdpGAYCzPOCHQTmp9NRa7053CzLXEoJIdze3vo3tXE2+r4/nZ5E5OXLl9M0nc9nV2Y3BbnUCjaHEGqtu93OlX3/9/P5vNvtUpeqyLXTdkvtXpbl/v6+5Nyg0kTIrrmLo+ABTEUDB0NDQBMrWqbzxMRDP+yG3dANTZmtmnMuS0HD/bC/PdyCgoMvVPTD+w//6T/+p9vD7TevvjnsDq5fz+dZquzHPVIbtzIzcqQEICjUIlJrl4Lzsr3S34jYfkv3M2cjVl8KSbCSi6lGUMjT8vHjoLMNg5igqY/GKhBzc5S5iQifZVE6iFlgDcZphyhY8kkCMrEiUz4fH8QMiHuFX73cvd6nLHWellKgFK1FSy3LXN78/a/f/Pbv/93/43/YH25ev3793fff/+IvXr56fTuMw5iiGViEXRdq6URVxZZaj6XO0/R0PndPTynEFOPdixf8RyE5Xx9fBeKvj//fmK6QDRkpoCFxRVhURUAMGBHUtpBZ3JyYm67adun2DDB8mSR31tIlr/xSoG7D/D5t4S6pTajzeHchdpFa9CqhCx07sKltvtE2BSM0VUFiL1I3V9cFW6HWEAqbNueGlTUjAa3pfCaiJk2RM9eLRbWqiqmqVANDCkRBwQTQEDgN/eEuDnvhKBDMGDGQNRCjIjjV2JmQ2wFpB0HVLpsp8uFKj6NvQsYVBmtj7q3ojxVt26yYniFuANf2N91Gr30Wmdp8Pl12jNDsrO0/VuDtxktoycM+7a8I2ER03XB6V/wxeyZFmBkxsefcOFaWiNXEP5eCLEVA1VTURK0SIRJDCIE5oMgZwIwJQwxYy83NTZ5nBACrVnLOE8Q9mKpcegSEqGDsLr+mFLEhXbFwzRAYuZVszTaO5FPP2557Q3kaEhIhGJkBojSVdw2KUU+cKaUqNXORVUVY43xsQ3fY8328kdMkDNSgAIFqMFeXYkANsMa1AQAYMzvh0Xkdzsm4JOGZtWTbUj4BT+PzMfMvuj/MDFczh5utVsXNHROBQ+j7/nC4AYPj8VSrLMvy9t37GMK4220wVbu6XXgxn2IkosA0jsOS89PpOE2T+zJEpHWRyFQEyPPx2hCCrbX3tQ6+0lfAM4VMhZCccmNIJus0QSNfeFS2qphaFZ3npXYpxhQMFAjtK7TxZ7aiwRaXCN7IvPLsrE2Qz6jBV0WyXcMfr5/2MvLiduM25vFsBHfrPF0Mk2tXs5pIrcQhpsRhPk/T8XTyW43UDCqiKrWqWogBaWh+ynVsI8U07sbpfKq5XoLedK3EtxtLG8TBy73YPpcMDJ4FZ17QOv6itXiU+ZJtNb0gGpDgFlJPxmDGgIRMRI4TstUAamhADTIu28AMub4M1GiyBGry/2Xvz54sW7L0PmwN7ns4Q0QOd6pqNLqBJgHIBNIoCjIZzSg+6UF/s55pRiMhGiVAMKKbQE9V1VW37s3MiDjD3tvd11p6WO777IjMKrSkhzJcxLHqtryZMZyzJ1/+rW/9PoPC5ByhlMsyXZ9KTmM/OlpcRQxB1IyQY6QQvJXNjFCDawCW2c6n8PDpcDkdEHaMfR8ZEvlIAyNSALRZci4lg46xF4PHNP8gMw9DT0FUL5ovmi+oNsQdd8YIjAKGphR4/+7t4etvw+GoZue8/I//+t+S0j/+o2/+xf/+n/3lL/724/WRh0GHcUrzLz9d/of/+V//n/7ZP/vv/o//4l/+63/z68dLNg3IHcdAEYERyYeislkk1EClSF4W0cfD8e4f/aM/efP+7fff/3Cd8sOPn8RkKSUDatd146Hb7RbgYsFAGIzG8c/+6Z8dY8ix+/e//fTb04WQH3/7w1/99ge7XuV0CpLVJJsZovT7eNijZjmJpGVgIqiAegQjZ3kReWQbmRFYYGf7BCAzxIHiruu7WbFe3nTTgc2d3UiIAp/nYtl2PfqyafE5+8g2YImaj4DPWtHPmEU14YFUTczEm+jeHwU0syJFRAEcNSOIhkDG1hBPa1lLDpUAJURQaVNA3HpEZIYQapvZKtWsdpsq2csthyI3cPlz+jlVJlRzcrqtz1opTQzk9xHqjc6hik0UqBqHsqoSC1NYEWSwmZp/ff0n1x/dsn6f24dfNlLhyxaBv/8v+v2S9XZtffHFtYvodL3mhVTN6F0QH6hp96+v4G6J9WeDm15X2gNi7xBbJxKEEFxwRMTkgWwto2JZkqp0fW8GKSUf5F8pB6v5OqW0uj5TSo4D9n9aMRQViRsdDew+3XK5XJZldvq5W03dFevm4m0imafJrZmTa7JcweJYd0cuSIVi3ZIDuq4fR3GV2YPg3EXr7atlSWYQQvQ37x/Qf8uyLK56S845ZRfBzex0Og3D0PWdzeZietd1OeVlXpyhUaS4ZXscR39ydl3ouqAiaUkV9StlHMYQomjNTMs5q9phf5znxSX1cRxEVFQAYT16Ls3vdjsX4oloHMfz+ezv2c+aS70ukiIUM3Ovrht7mdn3EX3fG5isYSeIKSVv0vvxcdidaYkhhhAAMQSP5iueeuAGXC9RELBx3su7t2/fvX3n18mq2/rhVdW7u7s3b94QkRZNknLO5/N5nuaf/exn+/1+NZjP8+yGm0CBnTtUZPV7+fXgjdJSip8I//j+NtbrxK/MZ+rwur6oqhZZ5nm+jh24oYyQEEnrLvHmwxN9NiveUi2QkBswVEw1IjJDkSSLBaSO2QjFDAiMUZjLSIJdSkELSYacNaWSSllyFrViCpCuj7/9u+Xx4Yf+7n5/d3e8u7+/u3+z2x9i13MgRjYggp4Mc8oqRYtkkTRP13kKxK9P9VeB+PX1B3upgRgRMCF7nAcSAakHwaG5ntj0YUC78TqtgQ5wbSp7CtgqaK41iLOA0YcmqrgJPi+KhqS4hlI3yFz9OabmJg6HK9xqHd+v2ipc3sTQ6kVEUtjszqFFVD8be9zsoleQccPyomkTuGrejZqaSmUV1CYkaVEBRI48HPrDPcRBkMWq/xqBCMxN2QrgWpvDNJoMARsmZiOxVos14Db+oIkT1d7WYuU2NZ81Rt8aIryR1eEF8tVuUSsNG1xJsNaOP25Lvc3+TsHIfPoUtG5fzPET7sXWVibi7VxbG8b2k2QGroPXaVM1UGdVIjMzIVI0iIwYEIsamhE7TktEChMy+nUlpoXM0LCGI7egcTcRrz5mwJoNiFsAR8skr6DqOvZMboPdNFEq9XKteRvX2k0BZgZMhAiqYkqmCmSVrLK6L+om9hYwV3+eqeMTzEjRsuGkji0O5E5nNfMURAMPE2pqdvU0Nw8uru0EWiXVNjr+e9Rh+EwGgzXVyW3+1egNgRn7Pu92OeV5XkopOZfT02noe6+dW0cBNul89RQEpsiDIQxS+r6bl2VZpmma52muPk23hdSUoPXdwsaB8nLDs34oBa0nThWIVgg2oR8MH15XNUu5FBFR6TQSMQfSV8bET0gdXkNLN1cIwrOO1bPEue198Tmb+3MDfkuQc2o5wLO0rOeBeC0qvY5LghGSgCMLAxPP03Q6nWKMIXDJ2aSoc9hVuy76EEwTuw0AQ4whBtuqZRXP4Jmu2ISn2tNrMHSsGai4DYm0L6Jm1gbfkpaUlyhZMGqzfjlOB7CGxQFCUfL/tMYXeiFXPNfyCIgQqH4eZ0FpMSigWfKc0rTM13m6GGjHXAqKZDA0I1FTNIhMTGhIhoGICGMIJJnOT/HxYT9f7y3vAg8YAWGRJDmZFUBARkFbpCxz2oX+0EkI8WT6o4ikpQuqYIuVhIaBI3MXA5gKaAYoQNksmgWCbuyFWFL3Nz98OPz7v3x3v/vZV1/9N//lf/E///lf/Xh5Cm++KaFbJvnb7z/90fsPf/bzb9Myv/n+h18/Xa7nEyFMy/zx4fHh8cmVC0UriMX8OS4lpSnNArY7HN4rPH46XU6XNJ/NCgAECPeH3Z/98T98yGVKomJQdL7O19P5T/7hH/2Tn39XksyPp7xkvVxP09TlJeY8ACjARU37CLtd2B1JM+ZJc8JbxB+4tOigW38GMyojMCkjEpODxhDxEEPPZAbFAQ9AYD5No550XLt96yDOlx7dL669z1XjTfxOazjYRl9CtE1IAN66rfjC6d+qXJNSVGRdDSscWdWQVLWRTrD2Hg2sglUUa3jQWk0aiBYD9/GSoZDSl3KAf5f6ZrBOatVpGVWtMrF6xF8NZa4luB8ZqrxnNKMGLfYpdwtee/Da2n99/aepDm+3Cfacqvf71eQX1+dmZ/T3kYN/VyFp/4F1GpE5+D3uuBVyGz4FNVz9uYjoCtoLjIbbeL0f46Kwa8eEhIwu3YYQYuzc8+tHwkVX193sMw7G+vfrr6CWleci7AaPo5vVTdd0O0dbUJ1ZxG3mRwVK1L0gbCM2V1uxW0TrvILnmAXu+w4AHPLQ98M0TTnnruv8i51i3HXdNE2OZibqpmlyhbRJ2DnG2HVdVstlEYCu6xDQj3AXO43qGIRhGExtnmc17fs+hujSpIOSl2UOgYZhvF6nlFLXdS6X+/u0rCLCTF3XlSJ+4ESSiHRdX4osKcXAnndd8/qk4pi9dednysXiNY3TeR0uuDtzxd/MqoyLyDiOogJO6jErRZ6nu2MIIS1LnW5ptmI/ZZuAmBvVQRqHBIlijC7m+nl0gdhP0+FwOBwOROTX8OVyOT2dzOzu7s4vS5eSc8673U5aQbjeGeuAmi+6zf0t7oxapeHa22h8ia2xTLTlHItIyXlJOeewHzlEMkWfLwMPBiiOjHoG9lwnaQDbsDC0mWJ3NalpQbOAIVJAhGKmpIYIAYzJ0GToVFALSLFcQi4iNohBLiWLliJqS7nO53xZTo/nh4+Px7vD3f3usB92u9gP3TCGYQccY9+ZqpQiqZSUtIjKazzMq0D8+vrDvaY5ffh0Cv1IHABwXnIt+qmV7FvL0bNy31XdChhYx49uwTeb3aaviBWL0BxNVcqzuk1c49S1uTZFTcQAKp2QNulfuvGKId4kUajO17qON3XP22MvbGKwru+wEWuhpSi04B9P/2hR1I5XMGMiJDQgMVXk0I/d4U0YjxljNlJDW7PcrG4JpE1W0WqJUbtRArYwZQRgAjMCMgYFVJVa8BFBU9s3sDnDVQQBhC9tV+AG0XUbs9GqvOHmTK0Kf0M813nMprVajQcmz34hMncSK4pbNdHQq73WzvVPKAZhlVIATQ3kFg8FUK1MFIgQjYkA2CwSGoioFkZgQlNRkcv1nPNCqJ4YgXV9JSRGYiDSlrGxXgYOxrVGzW69DFwNqYhoBFSjbXBzkQM0X1X7PgMgQEJQVfPGs6ohEjKqiQiqslWfuIJR9fQ15fRWhqu71t1fTgpoRgaW1BA1xo4Q2BOpNBPCNvxnzZOsY0YbDh0zcwi4sW79TprE8z1AGwxuE4aVfwog9bRzIMauW7pxt/P0uVLyVeXDx09dPxwOuxhDNfNWEF4tqhzh4iPNMfLQ96o6zdM0TefT2bM1UspQQR31+qYqB8AXt/0vOHpu0Fiv/PZccIGOAQBMQFXBC4+UcvEJaynyuhD8VHfLz27k5//+omXyRWLjdte8pTc2Ojdaw8l/LhA/o+MjMhM135NniKeULpfLMPRD34vkUgqYuac+xuiDhK1DgkDo9qV2e7bnCVVMzuo0BEf2r89xvBElVy8SrBSdLw3+q+mSU8qJQZGRoOJ0kNmQoZYHBGiiTfK6zQ41EJTabYltdQS1piT65ASIWcoyl3mar6d5uqY0qwiHUNIMJobgTw4FEERN4JI8AwUkQugYwnztTo/jfD1G2gVTlaciyfBpuaa0mEd9IhhjBrvM1w7SoZO7/UEjLzxcpJAUQFRCoDBw6EMcmMlERDJAQZyKlsfTHLswjuF414/DPF//4vvfvP934z//x//4//Jf/wsz+u//1b+VPBN33PVZ8v/6V3/95tD9s//sT37+3Vd/8Td/9+d/8RfpMv/mx+//+u9+8esPP4hKIAaiojiDkdt3DH778LD/5a/evHu3G4Zvvvr617/81XJ9DARmyiDHgP/5d9/8+DT9za9+m3ORnJ+uj//r/+vffB3Cwfgr5l9O89PTJYpyUS4lgBFQhlAQZdzx/k7HHUnmctTrBdym1yBgzORMKQRkhADAaIxGiAzswiqC7WMY0LJaMWx1Tv0nbAEOt1XuucP399yqL9imBs+/ZTWmV3+irWwu3GRd3JoSeAN9GoCUklIuUlx3cMe/F3ZIamCoTb4BRxbX9cu7jqyEYGaCLb1ZVDyUj5kMClX5qG7dtb1+VxdKmxXAVoHYfcVQ++yKSIrUuvg1+hLAmjvSBY7bNxITmetf9trv/E9pdbv9543rgtaevZtt0Vp4GjRbgd2aqc+dJrf07y94B77Ug7i18dcr/lZ/viAaN5sOt5vRvfcGdUfQxU4Bc8mlZAcHl1K8OPSYjUqlYM45r0Eyfi/knEvJzul2ybjv+xBCLtnvUPMoSzNXY/0mDSGsRuNthq1bkrfCHDRHcynqMWlYsWbs2RjE7tKobtNlWVZ77PrO279akeLHyLXscRjUbJrmGGIITIQ5JyIYx8GtGC5AA0Ajz94abDFGdxO7+ukHzb/eDbklZ28wayM7+6fzb3ENtA4oMIkK5Cp2u0y5Ug5yznd3d8uS5nkehiHG6DiI3W40C0UygB0Oh8vlmlMiphC4FFEVRFjmpTvsAoclLVWMNnN3s79/VXG0tMvlTpA4Ho+ufXdDF2OXliXGruti+4C8LAvRvqIqAgHYsqS+69dT6QBiAGAO/ngOniho4CsCe2e0GozQn+DeK3DWcBFxJ7iL8s62dmO1XzlIWFJ5fHx8enrq+/5wOPgl5JEtLnOv3YjV/0vPEAqIjR5OxMRVI/Heg6oOI4/jiMil3IL1csrSFQxBVCwvJS9gOo5DFyNoUTGROgGK4PYdL/y0mfFut65tCsZ1ANwzZTrGGKgLaGCkIKhWMyHMswgEBBAhoiiUgkgBiFR7MRBVh5SpWC66nJ7my+np4eO43w/7/Xg47O/uj2/eWxyRYxfDGDvr1cRUJC3L69P+VSB+ff3BXr/54cO//H/+v7t+YOZ+GDn2cdhx1yFzyaLq7Vk3eOqXu80Om5IXMws38hT5ZtIqpa4ZKo1WUbRalb3etYq99SxbM6jQts1TdB3yBbT1X32h9riD24Z4w3FYtWB4VqxvP47DU00VtDhiQkWsasOi3l4GQ9/aKhiiGGLsh/2b3ZuvlLqsqMCGofpcfODRvGBz0jGvVto14Bsb3KBGirmVu2611KyYZt8SebTQOr1PG7Zt/WB2awQ+E4iRnpl32sG3l94BhFtODLp7muizbAoksFCbjmAhmBmbqZSMKLXgM2/UV5lcVdEIWryeKZoFZmSuPCQCQGRQIVQmMgiAgUwlFRTtAjGWy+Wp65gILteTmSKy1Xil6iVCqvAMRCDcDLZChR1CfQ/NpOPm0oZk/hzLAEhA5ipJHeT0LxZVasZyrXkUXYxXAl8MEaJ/agI32FVXuKoC3myBpuLMjWqAAjRAMctqyZgxBqxBbQq3ZHbHVm8wxDdZqhmvqotEVOl3uLS2f9Psk7CiHTf4SHP4SzWeE47jQIhSCgCcTllUn87n7uMnA3t7d8ddUCwusKgIECOzqBCRR9PXwSem+7u74+FwdzxeLpfz+Xy5XFJKoqImNe6P2AevtpaxRo995vdct9nr31eLPdIqyRmQ5/sRmpkaQiq5FKll+uvrP/7XZrjiuWlxg5v/XBfechvXXdx2oG/VhdcrsKpArfFJnuSGtspD0CKG9Da+RyEEBXMg+zCMU7n4RKF3VnNOLvEo4rIsUkrsOmL2d0kI/Tgc7u6GcZScYdMLsTY4UplP64JQB+xRQbftxEaif5k7dHNU+VMUgQgpBG3yM/jsu89/gKAJmAEGAEZkNAcUYfNU1UCCdWSFGQiREciETEgVQXK5Xk6fTg8f0zyJCgHG0AVmyUVUa743MBCJt9EAyVANZzO0sqTLOF/Gko6BOoJzWT4ty5NCIi4gErAUBVMEoGxIpMNwzTJZmaV0XYRuR5pFCzEjEhkwcseBAdg3/mCCZCrz5XJVTabh3VvcH9589Tal+c9/8QsW/b/+n/+b/9t/+99e5/w//bu/LtT144E4fJrO//2//B/+u//Df/En/+AffPPuny+PD//T//jnYvP3nz7MWiiyiRGxiIlYIIwUQe18nb7/za+vf/xHu/v3nUivMLDLDyKaT9//+sO///d/+o/+6WP+1WVa5pQu0/mvzxc7pz7Gy3VePj7JNWPfJ7E0zTsm4IBI3O/K7g2OB4w9hhhB5PFBpitwQI88c1trkUBESEzGoOiWcCOQ2ndn0oExWMbiNoKIGAyAwMyU0IhqkCqYfVHV2uovW/l4HXmp9sUa4IZVDbYbMhHNQPVGRF1Ll9qJ9H19u8HNTDXlPM9zyWW/H4e+Z2aVsgLTnBV+uzXQgfYoZsQcgBDJPHOidmR8cllFTE3ZyPVlvA3F6xqOtO02VQX5FnkLaoDbL6trLhKRIYpCTblvWGfb3K2ukSERmykKERP553p9/bTWtC/a0r/UBli/jhENGG7Sj2+wYDPGhwCENx33eS+mTXC+/PGrRqx+2a7LB7keuvpVboyjlnJy+/mIHg/BhKGLgMiBXWpScStu1puv0/q+a8wxv/VlXmYzS9l5xWBpSUsiJmKapnlJSxcjR045TfPU9V3AICIK2vd9CFxKzZpzA2zO2YkHa1N2LSNdL966gJtAbK6uEmEIzDz2fUw55TlBMSnF1HLJK5dgm2eQSwY0DkHN1ATRvDYNIYQYl2VRLQaIRAFYlf1pR8T+e4mqmddj+pwU4Vrt4XCoYWhEw1CNxsw8jqOqzvM8Xa+7YRx34zzP8zzvdrthGOZ5XpbF06TP57OjG4ZhcOvrfr8fhuFyuYhojGEYBrfPOvnBT6jDmkU1dkHmGuUXY5im693dfYx8Op3n+Xp3dyclL/My9EPkLpdihkRhmeehp8DxvFxE0/v37+d5dvF3HEeHgbjS7Vz6ZZkBrO+Heb6IyH6/J6LT6bTf74hRpYBqHwOhaU0dolLkmqfjfl+yEBEwSVEM2HVRREPkGAMH8nwgMyuqpW724el8fnh6un/7lpldgnf2iFNNzGyaJu8fTNP0448/nk6nn/3sZy4QhxCmaZqmyS3e4zj6ReXwZWclt8YkAADF2MXI7IswAhkSG1FvYGox9GCckluM2YXjZZljDAi9mQAaBYgdD0MXe9aiZqCiasBIjB4U4HRO8tFOarAXQDAtNTqvpUblUjw9zh3NRiQiwITu0DMDUTBDAk8YR7d+odbM98CAoMoaECkyd4Coilk1i+WUztfp9MOHELvd3dv++GYcD8e74/FwjCESM8R+6IfXBeBVIH59/cFe5+v8y998rKPZzEgUuq7vx3G/3+8O+/1djH1lLKitfeFWDdSReV/2t0WGp5JVj0Mj2a5iLVhVDKFyBtxUYWbmnTwkVAQtJmrGVfFzDRnUzNqkRNWcAZCxdgDJhb46x1ejxsDUCH1U3wxtW7V7iGxFxHrIt2/atIgKaAERkGLqQQjicqCaiZoic8fd4W53fAt8WASUOqJejYqYqSKSAamZqtT8NjJo0jD5R9Aq6SFWGb35n1Gp+rxcViZ3YFXJQ0G08fiA3FWtcnNowTNF+Obo2ZipdeVbOb514w6oOjGaISjUyJr2A8l3Y2Dqc8VMxBDMFJHMJAIgkgOVzBTdJMv+PYQYEBlbuFMj91nbjiohmNS8MwQtZV6m8+FIXcTLZX779ddv7w8//FqKFCEEhWLYuzfgpnKbO8IMCKtzzrn8YM1JbOBp54AbrbwlKFJr7baJ1Bp56NeYD+SSGbcRITXVlBITg4GUohxM1MQT4wFAiIQQiINtqaBu+EP2dkC9mcwUUAyvWZVQiA3jQIiaicCRz377mBmCNvuF9y/Eo5yv16vjWeoswHaj7tvfz7YWTV/2/2xg6+f6kW+pI0cayO6NmYvIdZ5M7eHhAQBiDO+Gt07YrDcMCTF2IaiZSPG37EocE3aBu+PheNyLvJ+m6XK5nM+X63Vaci45m4ihQLvwX7gdnyX/UfVseiXeZgjQ4ZJEJAJm5uyS+gQzQwrjrmd+XcJ+MtaqDT/45bDIf9jJuPHaI7UZmgY5wRf+YjXPTiPcIFCeQRX8i9u2ee1PigqSj6CgqXo4FaGX8uoabc5ZfKbS58oBkBhQ3r3/6sOHD/N0LcsSKsHUV2dRQEUDAQO2zYClGSI/S7FXNXaWVLVE6Ub4NlAFMWSIRNF3BQZgRgCqDmCvZkVSjY3aCs007XbimuyF6GhiUAUzMgmgQYzLQjKL5JSn6+Xh0w+/PZ1Osev7foyxRyJQVI/2QjAwQmFCYgJgBCLnUZmgKuvCeZI0nQrMCa+opyILMFPcDbueicBQJQIMRN59nqUooxA+yDLPFyUiIq6EIShIghCRvGhwPM1SzCKJpesP38vDR+sHO38XGP/6evnhL//dx1//3X/1z//L/92f/PGvv//hr379mw+//dXd/RtNl9P06f/+8Td/+kd//Kd//GcD0zxNf/nXD0vOQ9fHuGMFX/kRsDeLakE1SNk9XT/+L/+m9HvI9g8WLMfvHq1cSBeEgvT/+F/+1d/85S/VYgEuzHT8eum6f3u1PhLDHr69G5AELU9PDz/g9PSESBh3s3W7sO/jXQiRUDn2/f3Zpr8FKUBmFIoSKbKTtcDB80puH/YWhNVeRI+4DzznnFVLtSQBAYqYgJRQAGkt9T6b2XrZnlz/XM2wW/Q/3Mzn5oowNrcgOEPRKyvbxvOCIQIZoDSsFJvN0zTPs5mN4zjudm1YGF6I1GYmCmpaDWWOr/eONwACOQeSyNZp89rbVQBQJ3V4R3PtMLWDUOMfmuN54wqwGp3p6zIgMnl8AtVPg2CKFhrTbTMJ50ubEgEgkYQQVGVDgXt9/Ue+nD136/79kcH28keYtfk5s1s6lW38xS++3Z5Lztt8EQBEYnQkWLVMoD5fb7cTO2bPou081sIAAetMTIxBVKUoIgSOqaQkmUJQNSnihsoQgogi0jBEYopdXMG+Lu/62ha7GLoYmIk5xBhFkEhElpQul6s3UXJO1+vk1uCc89PTk5NwXblzjdglvGVZqj8U0V2uzAGRliUjYggREVJKRQpxfYKFGPuuMzWYwTVoAJimaVmWEEIpeZquxGjWm3lMSanVRbLr9UpM425oVQC4XzXnPAyDiJWSzcyJEz5mxMwupzopeMVxOJ9hlaf9EJWcc05diDHEkktKqe/7YRjcoOocCVdj+753szAAuNU658xMfd/lvFwu5zdv3iDiw8ND3/dfffUVEZ3P5+54OBwOyzI/Pj4eDgczKyUx8zj203Wa5gsFLDmLxhijml7O5+PdEaC/TteU05s39/MyTdPU971jMVysL6XsDwdTnS7XhLjb7a7XqwvczH0peRj6nMuyXJGQmbvYEfHlco0xkqOoi+7HnaoREQeuXmCEgoiEMYZ+iB5ZUlTUrO70zZBwyenpfFpK5hBKStg6cy74elPBfeIfP350+/DXX3/th9Tpz9bAF+5Y98vJWxT+6aZpKiKEyCGIGqBKWw1Tyq7gAwAhe03EzMwhl2Tmiw6hkxbzLGkJaECopmBKhMzumJFGRtEtFl98xylWI9hB4VmpjCHEGKKBJSla6k3urIxnhglwRAwSUfSqUwVAELEj5o5DjBWCBATYFcMilotKUTWTy3m6zGeFDyGM+/242w+H/bDbwSuD+FUgfn39QUsQMmBFEgBJKlZgzogTfnxgjm/evPv6/TdDP4YQEJ6VJze7Yv1vWyViq4Lx54jD6q9yYREMmLCRW9FUCYCZjFhDUCBRUamN8NuMkm8+V5osgKFV3y05CK/ablcAhdWMeUMiUHlGdoeWvl3ltloUiRQRUS2lFJGijRbv3DoF8AcqEncxjvsD97sCLIZmQRUErHh7DklVbeUFm5mCgkcb3colgPpMd3d1COusoqmIQW0yI2yxuADU5iJr9l1z6ADWSKH2hU3U8DYlNAiAbrYSz7SPjXUBPx9ANsAqbnvctjcLqLFvoTp4URUqLRcMFdeRUGBEJg7t11CzNPhVYQgmVtQjBySlNBHpfhz3PV4ujyoFzIkdoMYAASgCsluQW0GEgGiENa7JwWQG3MbNq0Ls5OvnAc2+4LltcM1hrCqk4Xr8PVtjXUrVTERo9bNXQJSYGoYaEYuKSEab4Lv6bryLAObdDwNDAUHLhgxMhAGMCUk1gBHI2oox1fYL0ekjvgaLSNdFU/+tdav5MuTwd8CImy6GXkggPXOv+GXs2/iu63a73V1KopqWWdXmef708DgMY0C/qkFN1dMTVNx15aw5pDo4KzWinULfxRh3u93d8Xi5Xs/n8+l0SimJaLPer7bgFdi9XpctkcyNMbaqeea9jVXa02odttqzQhDV15ncn5hEjJsVCp4Th1+sSLd2m724HW7hMM0NaZsfaNbI1g2ogC8qZhFZQTBMCGAiuk2mIiSk2kUrgXzR8X4qIdaRPM9Bb9c9Me33+3HcEQe12d+Xgo9KOLQUlRz3joa0tvNWYel2429iX18+Cvz5bkYK2MYj/NEA6NFlaAamRFULZDBQKSLm2gF5ChugJ3oyKKKAZShKYiyF08I6a5ktTTadYblAmhTMiIE7AlasMp8fPWbiEIwQgNrUioIpZWNTNlWVp5yUYCFKSEoYTUQKYvAIPUYMxKiaVQwtaVlEkupSChABERYCJCRW8nxeqmZYEX+W1TEqZBCBJT1JCYRQlieV6dPjL/72l9z1v/30dD2f5nnJjx/RMsg8f4KHHz7+5f/21yXrPE3Ziu9RSaCKNqYBcFTcKQxGb8bDXde94RgFFBnH8SkEY1JGJVRELfLDXO7v77EbYzfAOGoXfSjYQ41ELMsyZX1SuhRDKBFn1WXIOyoHCkgUiLtuPJbQqyQfpiUL3t5FU7oth6RqSBC8d2ligmy668I5yzXbOnDiLG4fsyJCsy/grX8P8/qZULtWI/DsErVqxMfPb+NnLAoDBRAzVCNVVTQrPqGMhCHGBiSlG7qByFZRTA3QFHUdCXedhZDoNjeP9XHgg1LNb2UGiLpVb5+FCt+wV7aZGbstRt6SrR0dM+DARGAmWiXitaP+TElvJuiKoJByu2FfX//xr2ZfzJ37e0nLN6TDc633/7d38UwgfpYMAXU+8lZHPcffwQ1rXK1ElXbKIYBj2hABSUxEJPiUHJEHa3NLD8t5yVmZ2SzMaY6dJ4xVqKubMUMIGYCZh2FwNgIR9X3vKuc4jn3fr4KyMxM8Bm1FDDdfMG0zPFx1dREwxgiAOSdELCU7CCIghxD9CARmJs6SneHg77ANt1X+G9V+rXo0gaoAoKEVKWM3EuBSFlV1e+n6GPEHSyklRmc/eFKm+gdZlsWFYBdzHTrsSrd/Rvf5Xq8T7XAYBgA4n86ENO5GRPS8OD+G8zy7Gg4A1+s1xrgbd8uy5JQArItdymlNtDOzZV4ccJxSDpH9XTkl2dXqGGMKaUnLYXcwjqVkJNjtRjPLOfmhVhVRQYB5WRyL4SQH9zJfLpfAIcRgaqWUEIJbjKFudbHvu2m6BAz+tpdlJnImu9Vzy4wA5FWXn1xHhBgiEhiqiRkZtD3+TaCXy+VyvVwiB2gnYhiGYRhavqJ6ROEPP/wAAO/fv7+7u3NJd57nlJLva7xPsObOEZLL3zW3MCVmNrU1w9D3mC79p5QQAMYxhIAI3r+skgUSM7kZLqciuQx9JEBVZURmMkBQQ2LcTOCA8yGI1owpv2F9A9vuXzM15lA3wnYrFFfZoW1+W5hQRW/bOufta1UIhKDuaAZkJCOkgIAMhmSAYiQKQgaYdTnPZS7LOV3HZiN7fb0KxK+vP5BArBB9il6gZPFhkZxzybl8/PBwOc9fvX//5v5+GLqa6lFn3G9qMCrY5wXFbf4dEUBFK5GgjswpgHVd7PshxuDOEHJXMHKmcE4G81wttrWGaJXHmm/dAtkcz1BloYq3qMCBqpSSW3TRDNVWkyy0tUCx1fQqolpERaSIFBEtoiYeWnZ7Rrp7hTn0+32/vzPuZ2Extz6BYAUqF9OGqPTfjYqmoJ7wXnUIFQUjZASCW0qdP4VFPOwOqZIgrT3jsVILV7GTDK1ZTpyWAdCUQf+4NagN6oTxdrfl6wG2DVn18po16vHKN3NbWMu2cdeztMZjM976qUdmDn561DdGYlg3Vi43rKY/p1ESeZQYqiEqgkDJ6TJfnt70oQ/MoE7heHp6zFkMCKkD3lEY1UgM0UViJiQGJgMQdyq4A87n4kxX0ZzqZ6nrJTznkBKhmNviiDxJ4wb1t2fqsKqKQKisYWwjes409Mu+FtKm9Qq8wS/IE/gAtGIJ3b6FKICZCI1dpI0kaMqe5AaGSMQ+JajuG3JGSUs2UDAAduMdr62Az0ncz1/43ORlnmPUfFyudlWvdotuMAB6ePiUcrpOU5GCgN+8f9eaOmomZqSmzGygakAADAyGXj1zIEBmxr4PQx/3u/H+/i7ldLlcTqfTdZqv12Wekoqb91sf2t+tm1WcyrGa0XEzTKkO0rY1hGSFbnp1BGCvAvFPcU9tNQzNn42Ez+Uka9rQM5z7i924N7rq8AfQ9ucjISKtiAkTW2MtvQ8BRG6b9e9ZNWtvrKHBuj0oJZdCxIhEY9/3XUeet0PB/EFJVcziEPbH4/H+fhjGNE0GqN4BqdPq4F02CtHqM89vBFqBQhtSUJOxPnNbrxlZaAoqAAJIiGxIilSAAAKgJ2RV7Z0A2CoOnQ29l0lgLAKaWAtbQUmkhUyhZMwLaIaSJM+cpwApkoFpKQVy6YIRM7WRFfbYn0qBJDA0MAVFABQEU2bELuQ5T6UsaMaAlkwypNQFxkCEwIAXBDQoKouWYiIAApBVBAmIAncckMwWSUspITAzmZmUZK76oQP4Chuxoc2zBgYoqeTThw9/+6tfAnIXu0ihZ9brZcmLWFGVR/v4a/iFGRQz5BC6YERFlMCsSIc0KL6F+DXHt6E7Dl3kIEqTlSezC4fpzf18/0ZDjyEyYlBFlTLuMUTjrnCnaIFxujxO58v56VRUme3p6dNyOoEskSXCfH/sD8MDq7C8YT4yj7i/L/v7dHlgK8EfmUUhIqgZmSEIACO5hr1G+5opgx2H/lLkqimBKnAdViUyQOfz3ghWtbNA2+in36UO36bUPR+genjtefQFVCQUItw8WT4vdevgq4OfjBGplHK9XFyvGfrezYYAoGCmwK3T0xQBxFUCbmPyqur8KXKTlXhrlgjNu66bznp9aNgNswK4iVNeHzguBXvLsrHFwIcR0AzNvV3iFRsRkoKZtGzhOuTkElgNVqogtPLqIP4J7c5eLkkAYL83em59huPvcAf/fbTiL3RTn3cdnAWxgZ7cCOD13kT7olgNDQ8eurg77GPXSZtkJyIRFRN1ppmPpVQ5zxffAgBIaGCumrnWVkpxxK3DFhp4Qafpusphrc1TY7xdI946On05dnnOpdXt2JzrdKq6bjNr7Gw7O64kiggCaqhYthgDM4nUm9Q/IDM7PVHE42prcgYStf2B74Y98I0BIKW0vkNVyTkNw4BI87yY2Tj2XRcfH5/c5EuEKRUzcEOxUxH8dzGTtlZi7GLXd0WLx9yZWcqJmZFwukyi0sUOCafrVKTs3u3U9DrlMk+H/S6EcLle+64bhiHldDqfDodD3/eXy1mMh77b7XZ+GGOMfqZCbQZI5JikiBRE6Pv49PS03x/Gsc+5nE5Pw1DHH/173STufxCRoe+JcLpWYoMn7A3D6Ceu63oAk1KYAzM3hZ88jUWkxNAVKQzmF4CqeO5N13Vd36koIBTZ+kVqiXi9Tp8+fexi3I9jSjmEMAxD13cGNi8zAMzL/Mtf/fLDjx++++67P/7jP94f9j7B+fT0lHM+Ho+Hw8HALtdLzrk6zUMIFvydIyEHZmK34zg4xVMKkbDrupQTArjX3i8MM1tS8ozv3X439D0ipZytlPH+PsRA6JOyhOgSOaOJod5cZuibR18IAQkNayQyYY2LasaoaupxKZnqn7WNW7s1TX16xrOXfI/f2DKilsmorW+6mvrYB1xbeEapqTUZCqJOUi5G+LoKvArEr68/pOGq0YPdbommVbBTtes0f3p4IGIi6vp30EwX2KSszZay2pL0d2TXNrYcEDSWAUIX4zgOXdchIogimIkpkBkBeb+pWY9hrUVWBdhrjUZLRdwMTqHLp/4HXXMSPgN3VXTdOoGsLZJuRQe7vbg2yWuggm+MRTVwoG6EMBRgqdZm0zbFZQBqauq+Uw96s8+OyoaP3MoraAOd1IQNaw2+2svD2/iZNet2HSJzi8pquoE1lmht71vzd/svWg/ohjG2JlTgC7cAbhqM/p+GDam32n1sPV+Ng4/INaodAFDNI/JaDdycBWDWmgBEpKhQLE+Wp+OhBy1LTjH0u93+8fHRd3OAjBiRYvFsJtg6GLhqhWYNRX2rV73NgPgFQ9LzKvtG5Ghs5ps5autP1Dp6U1Tk5qSv/uNNtwTcQg+4Me61OvsG92h0DxDDYpiBCYSIzUJT7gF86rzhWap1sgZPYSmCCMh9LZQ2yu+t8P3SJ1/d6LhJw7sFAgECw6aqpmHoDXBJSz4Vz9t9eHjYDcN+N9TfolsUqd3MvzUtoYrtIri290MXh77bjcNhv79cp/P5+vR4mqbrsmQAUy3YoCvef1ntkC05cxXBsO5Omv6H651gpgIuIr6+flqvdWYCtwk8z0WcNb+q3hGbffgztyPiF0yL9YZaCYzPfbjtZxs8i8/a0OEN6MaxQQVAonEcfQcyjiMREVLo+jqMXlcB89D3/eHQD8OaRIfNIG1tjLcNPdwk4fUJ87vE9C2MuIU7gndda0OFQEGNVncptv4sIFgEY5fOTKkUUCFTBmUVtBSsBBCy7Ohhg2KWxQSwFHRrLMQYlYIhikqWEjmC98VuQwNEyICozv8gYjBMpL7VYeYQ6/JSe3GSTVRJS31ok88WABQVQyDi1i9VRGbmwIyApYihgKgp1ucXmJKZu6VFyZQAI8WAqOA2a1vSAkBWhLs+Yq+iSxYzxbq0i5iqIEdSEEMxEQQICgPgAfk+hCPFHcdcypRlIjoDnhin0NHdAd6+Re6IIiE7FT+77wbIjEyL5nK9Xk9Pj48fP5raMPD09AFlvt/B2PM4wPuv4rAX5EXhSdHQkLoYjm9yXkqexBHdKqbBCNRArOozBujxurXQMgPTLvAQqGc8ZyEK0EJs18Lid9SA8FxLfXZLbuWkdl5+1/2NXyrlmnTV6qn1qz1MFcC62LuFsNmvdDOAta7TbqC3ja2qdlPc17vWpGiKXHMAVlF4XTQ3sWHr4I4L5QZgzIx4m4rTVkZ429Ib+ORQNzBntGxM2QZQSZKrpN7AYqAi8Nru/Ek1O///WAjXfgza7xeC7XcryJ/dqrBOXa4NoHVc53cK123rY+41RmDmru9CDAAoKsyBgqO+UFUAmQh9lSlFuo6Z2We9CImIV1mWakuH3a7rSmhKqRSc5xmR3HRZShYpRQoqbcVulyDXT6rP58le0NJbp7b9vZnbQQFcpHarkd4UwBBqEAbeHiY+uylqzsfYJtA43zaGgO3PDQmlPmnnzw29pX97yIg6LsN9u566pmoihcjhG+pBeV0X+6GXXKZ56vu+G7rpOqWcXCHNOaecQggUqJTiKqqbdpe8AAIzpVRyKSEGKlRUOIbYdWlJS04xRA7Bn2grJZlDUNUlpd049sOwXGdG9Rbdssy+wVUVxBBjSGl2zEX9XuYQgqM5QggqWkp2u/fm1NeXH4SWdQ8OJFkrMlhFgvW8q6opMQNi33fu8LUVd9m+0UyJUKScz5f7u3k3jkTo3VBiMrCcsqp+evj06dMnQHjz9s1uvzMwz0Vc8qLayE01xUh88tZbkqJScvE+H0dGQo8/R6gxpDc7goFZvVxVxdsGDkLxYFNf5oIqh0jEiGbqaXsuEFT38LNbu7p817mYuvfeTqj497dydzuUTFSn1Ny3Jq2hX1fTTTNYS8kBAyNQFcFxE5G5EuGkaTEuRSiamb5uz14F4tfXH7oKkVXqUhAxuaXswDTPHz5+UtX9Yb/fj45bdVdeq6Or87QlIZiBGhigz7gr1lAp/ztcHw6+iMYYObCpGIIWUzUBSKK5FKlhJ3aDRJiRp6ffHvb4vFFdVTxfO1qHu9KKvRsGKypRdVWHzdETKt7bdZnY+2Oi6psnt+2SS4E+ehs66PaZx9mCAHj1ryuMEd3JUsXQFVawghoBTBEUQT0DEFt8tjMnaqYqteNF6DyGSp1EAwNVI7gRmk0VjKtk7ORAAwO6qdNW45SACFAtqA+EuH27KsNoAIoADGjk+6KNCbmKAnZrDfj/IaATpXUdScMGAqnvh9x5Tk5T4PZZW91E0DJWqdrOS07XCOnN4T5Pp+t16ne7u+Pdb379PQEpkDktg0BUzVklUHGZLe98lcXVbbfgcW9atW5qIRrrOfGreZ2pwxsRoZ5BXYm9N7apQ6ktLUlKYQQwb/NqC34i8gPT2CJG3itxZCr6NrD1BbjRtaGIIUIgKsCFopvzTLJp8YXdp18RCVQ9BJpiVENAInb+lN/KsP1EN217KxTVMl+bd5La2CysoTpbNotXacMwhBiXZV6WZV6WIjJN86eHxxg5ELqryeeURUu9i5sB0K831drhJwDgBmNmGvtuP45v7u/mZXl4eHx4eHh8fFrmPC2zGTrixWe1bnhiv+hoVYexpbPUG5Aav9vvfWqsydfXT0ohrh0RsM01XgG79TavgydbN5a22Ldt+PVNoqwMnYpxb6F3sOa9bwEO+PlGu2mXbceILmt6Gyt23VdffbUbx91uN3Q9E5vZnHN9+LikZQpIUOTu/n7YjYbV2VFBkGprr0NrMCiym+3tGe9pvdFvs8fPX/V9MyMjB4Lg71jWW8s0e2fHrY4EGs2CCpRsKpITSmHQCBrAmCSARlAGARQwMVJhma0IKlE1QHNkDn3BKIBZipWFIFBgH0ipEzTICj5FgozQgQFRptoxI6aooQD4IJI/erNILqomNXoAgIkAiB0BDUguynHsQkdEpg4vMlHxhZuACFEMFMTMI1iMADAGLy9UsSiKWtsGpiWJpw4Qca2RDBGYiM3QsppJEOmAjxQGpbsYRgxF9UOePqRpRlziULpeux52fR8pIKgUEwXujKMaGaKqKQioWk5pmc6n83m6LmlG1QBm+en+SD/7en/ch/1I929HjtR14XJZzteSilB4P77/SvMsT5JlEVU0MyZFN6MDERm6tdYHWgixTlwFhJF5ZKI5ExByJwqu7LMxU6hpAptkpy86HzctmY225BLSRp15fifWJWoDcLCNjNX8w+1fVfV8Pl+nCQD6cXBX3efC28ak6c5iI1XezLeuPXxVQXhOwwe5qTwOomjsszXI62a2v0FcuQ5PEYWbddpHgxAQpcphFRimNSv4tpq9CGU1RGvmstcl4CemEn9+of7+b9gwWr7sCmqB1vblH9tsfX+fX2q1IrZnP/6lDO2XcSuwkZApxljnQWsuN3KMCKDiUwIkRTzNyzEFOWdVIyYv2IkwhJos59gBEfGc8lKym4sRbZ6nFXEuRQDEWzXVNpuSe1TXAsDxFM0Awcy8baCuR0NVU84eQ+6/8aYg6zquV53COWdfqRGNENXQVERkGxkOWNGubukAgJUm3EoXYOYQ2FFUzOiBe8syq8Zh6J103Pf9OI4icr1eQwjjOACwiJSS+75jorQsecmAMPQDMooKIMQuKuh0nZBwt9vNy6ymAcPhcPAE6d1uxyFQKamk2Mdxv5uu11LKOI4hhPP5LKrD0LvVmplj1zlNGForPhBnIjXdDaOqXi6XGON+vy8li+QYu5XM4AzilNIwDE74HcfRwK7XqxTp+96/zB/m1+u17/sQgpkQIVKEGncPdR9nSkRd7MwsxAjYwknBskg0izHud3tmnpcFWp/Pz5dfeKWUy+V8uZzf3N91fecbVLd+z8t8Op/+7ld/Ny/zt998+/bdWwOb5smpHS64A8C8zIS01nJ91/sdMy3TMi9+BXZDZ+DLj/kfiKmUsqRlWRYmyjlNt9E3yjmL6EqI/vDhw+nxdDfGyhI2AFUpIupD1IqwHZfctHHbTtbUlXExIh92WT1FThrzSlPgFlmBGAK46zmbpaZqeGqAATisn8AMsADBGu6DQCoKa4KAFjMlt/X5Onczsb2+XgXi19cf0G7VIlYbN1XEcXtWnwKX60W0vH13P/R9dVKarqbVdZS1TtdXCpzWDRlCu/PbRho88KwiIESLLCWlpEVLViklKyTqZkMPOFuXT3+eeT8McY0xWUXFW2UDtyk/I2JkUgGpu+Zqs2x+YfWfvd1UmBTVolbUD4OpkyKa4bb5gkMXhp1144IhK+vqNFlHMg1RmtXXdxdgCMDu11m36d4CBTMVAwNkAG1B84hMaGbib91TURA8wEQd7Npsui56g/q+veZ/u/qMBqQ396spkqIRAd/IeJu+n66Zg+u2zY8yIqpi/ZbVXoeqCmsKIcD65/ZTDcGzU8jfefN7KwAQ+lmuLl/0oFUVlAx50eV8HPhw3D+mazHriM6naZoWQEKKFGLoAlEdbWlnv1W3BgxgIG6yrpYorRZ2aN5m9Cg7QLVaWRBxU0QRwMiQqtRemxVWC1oyBAB10L+qqhQABSRTtVJUCzRMcJ26U2cutW6KVinWx9EbaZcQUEVUzRgQITMgECtJFys7UU2k+Ka+Y0IMAKIeiEwkzlgkUlMtghS24T/6uS9ldVC6bxB083QwFdmKR2tAQc1kNyPC/WE3TQczmKYJgK/Tcj5f7o8Hl+Odv2qm3ps2AjW3AvrdQgDAiEB+f4CKgZGYIklkiodhGOObN4fz+frDb3/88eNHyZZzSSJEgQP5rPHG8O5aWtXfb0L/zf9ioDVU4dVv9dPbUcNKDN/4hddx78ahbkgisBd2oRe2qSbKuLyFlbn2LEbLVgDRi8R5/3+iWptSgEhkoiVnJKbAJAEIQ4z39/dd13UxBgpMrGasUp3GtY1BiGgUjnf3w24EABFl4kYNukWlo09LIlnL12x26nXn7uO2Xo+jG1isYXN8XAad2huQubZzzEDNsmERtSJoxoYqgqZUiuWEJbMpW4loAa1H7ZgCIaow1IF6n+tPhKkZUZyFgyFQ1wFFUBSzrIXFmBQ5ElogYo61XYpEpsE0FNNcIoKhFc2oyowRKK+jCQjq3B5DMiPDCt8nRGLiwEgREQNTDIBspgpioKrCSO5iiQiEnEzFg4NUTUXB7Fo4hIKYRLIKGRIYgijogn5QIFBAYPL12oV8BUBjwx2GI/dHCANhBHiYnqY8Xyx/CKrjPnQ994BBIZ8f/vxfHe7fceg59twfwriPuzuKPZIFBDBc0vV8enw6nZaUEZFMGeT9ff8n//DuuMsxyDjysKNxiCJpPygqP5yfUgr9+HZ8/z5JXh5TLwUDChjWMVRQj+ytObQtKsEUzBip5zCGwDonQ0/z8SOuxYQFjbb31Aul6QtjO/gysuL2xc+9kJ7me0uP0BvX5abAeiSAKjc6ZCmli7GLMXY9IpeyNP/Zs87Qzazvt7nqusb5XxJTi9dCMxNR/7WI1szIjUcMhgAi7lPmtcB2dlgqhX3gHQBVKYSWw+wXCDiuA4D8+aQ1I3j1Sz5r7Dq4RgEUUUp+FYh/2r3PF0rl2s6s3UGrTQmETUOi1ty4Otufty4+Y1YgvhCmNyvjyzboNtXi1uP5wttuilsX+3HcH4+x63xAz5n7pZQiSuiQ4IDrtgaAmZdlyblUwiEZMy1LUlUzyLmkNDsTNufsZAYzCyHGGFrKHJlZ1/eElFJWtXEcAcCNt+5R3aa6uYnVNWJH+oqIs3EBauvIl89AFAP3/XC9XnLOECKTLkuapinGd35kPN2OOYQQAOdcsvsj/TeqhyoTet9S3LfUmBKO+nXhlSgyBw/ICSEQMYCzL6z5uNc2FTpsfZ4XxzWo2tPTUxciIQbmZVkI6LA75JId1hFDhAFKKdzz2I9urCYkhw6rKCLG2KmVZVqGYQhc804QQEqRIl0IAOYC8TiO5/N5nufDfn88HC6XS0rp7bs302ValiXGsN/vrtep60LX9QDATF3XT9N0Op381Dix9+3bt9M0Xa9XT4V5fHra73YhBMduNOLwst/vclYD7EIQkceHxzdv3rq2C4Bd7JcliZRxHH2n7wjskpOIIJFjSU7nM4e4XufrKXBP+vV6XVIahsHEfCHIKT8+Pv7www8//vDjd999+/Of/3w37kouOeei5Xq+mtiwG/qud6OxmUkRZoYOCKlIkSwqampSJKesooGDiBQpBhY55pynaVqWeRwGVxZcmPaBpxgDEarqdJ0/fPgIJfX3h67rmYJJrvPPYoqqJrhx5jV5FxoZzbwyY2IHRxDplkWmKobm1ua2XOLWa4yoosFNeK6CSCk5Z2Lquz5wUIOUi6gFUebQR+YQpNI7ZZ3CIQJi31szvTA8v75eBeLX1x9AHwb0R0ndH9Z0MK+PUUqZp+l6ufzdOBz2u91uR7VFZBtGk+uohlqH8uugfBv/gBaQiWvhYqZq58v58aQll5KLP8uklKVYvHsn3aAemI4k7kimio1wC7NV62wlvqIhUB3VYSAzK3XarnLXCamSgNf3vJ0YrJZiUX9i1/+JajETMCMFAzU08XYYUhzv+t2dhb6IuXcTqrFXDcg2A7z1j2r+iBaQ7Yan9ofr/kYFwUsir+cIkYnds1YlXONqzG2TSQBaTUqCFb7a9i0OvhXURuOvCorUeVCjRmmtev9tQ1Z1EVp/UKsZtZ79Fd+JLaTF8Iag2DANAMnx/6BW6z4/Z1wdy1Wkr1ZYN0trKTqfSdL79/fn0+N5usS+//rrr//uV38nOQMFAyCOoRvVCNElCFgTwtc3VjsfYHy75rFefwCeRkRNDq66bTMxNztxIye1g95cbcQAJi6qgKnU+VTnlKBYcaXdqJKbcBWZW7AcYB3bVrecr/5sjzM0RTQozsAEWJR6TzhiUYHAaIItfdabwEIQCK2UBMbYdVQDpm+bAVg9R8+36002hc3ZfKmXrZMF685ZpDDRYb9Py+LdpZxTWuYff8xo+v7tPQZGZvQpvEo9JTDHjPoBE1MVEKJgID7ZjYAxMLobWhAQh67r38TDOL578+Z6nR6fzpfLNS15WebosdGARFRRbmBq4pt6ny7H9Yr16QNGbP3u1x31T8ptpaZtMXihUm05Ep9f3p9vlVdZeb1vbutdvbJARBpUyFq/hFr9jSKAKG6H8CwR0xp2GrlOkkrxnqyZKiEzB38cEhK41YoCMRFVZNxou7u7+93+cHp89Od88zdW42bNCPEeqKn3IVGssSNWRNANqn8DmzKREZhFpAAWSraSsSQwRdN5STIXK2oiJhKQevRJYCUTNuiZAmNPFAkCWmRGBI+ZdV+oEAsYITATg2H2tHDyrS9yYGQx8mmawJE5Mse6mUEijkhGRbolDekKyyIiyTQjUCRAYvPP6o4XRSMmZDMyC0hMhMwaEAmZmCobi9Qwp6Qmhj7FpC4hI4KIFclLKWJoTqBERDXJRUSUa54eIwegAMDkc5dKBlSknkkk0ByAEAxBAmgfCCnNXB7yPC2XrHPoeLg7HI+Ha5LdW3j7bhgP/bRc46fr/TEyTdOUv//NU4JuvPuaOKJLKdRlCudF+t047HaY72Q5Xz/+1Xc/H7962+9G4gD9EDGAkjIDsiFb7PDjebmkp9Ax3x1FU5qfGEFMfWzUp1lRAXHthdQrDVURoWM4xPC2D1ZsUlE/stz5UmqmK9wfPuOofvl529Ze2ICrVp7W9nubvfil0OxBbSJuoK/d9/Plcr1eEeBwOByPRyZUybUEAVBvVD6bJKi3whpcvPZWAUhQnBpDtwwG3zVDE6zL8xGdClf0pbOmySGaVaCk19tqwOzJQ23rrmBYC0WfWsM2JFYbyNjeGCK1ZxPcuLCvr5+IHIxf4qD9Pu3Y1gBS3Cx2q0llFYtX6F69hjeO+Jfs4206a9OMXmwi4dm0DMLzlMo2r4k4jrv9/XEYhn4YmdkXrhDqkJ6agFkuWdIMgDHEECIAdF0EAOZQZbvARbKZur/YWQ3X6+Rf4z+2FJmmWaSGp12vl2EYdrvd5Xy5XieESv69XC5Oy3W51k27xXHCIj7kysyedNcowNk1377vSs4pLaDadV1KyX8mh9ABOOqhZXyB3/I5p/bD1bVLN6UAAFsIgVWl5OwZeo6tcBNrk5KdJkweNweAzNT3w7Is1+v1eLxj3k/TdDqdY4yHw9E1VkQKoStFrtdCgPtxR9RP12mZl6EfIsf5OueUwz6Mw/j49DhdpsPhgIDzPF/yZb/fBw7TNAUOu/2ulOXh4SEwHw7HZZ7n68TM93f318slzfO4G7sYL9erlHJ/d+cPvWWea8+bKAYqqQDwMAzzPJ3P52+++QYA5nlZlvlw2KfUzfOMiIfDAQA8Ou96vbrNdsTxerm8efv27u7ufD6XUo7HY875xx8/3N/fEeL1ejGD/X7voYLeYC9SUcvTNIkKEcUYPWlQVaWUvu+++urrHz98VK106bWEM4MQohlM03x+Ot/tjwCwXJdLuVyv1+9//f0PP/yw2++++frbN3dvCCnllJY0z/PDwwMz+zSYiam08Q6D6Tq5tI2AgQPVJzp2oWNmKQIKTOz/2sVORQN3Xdf1sTOo893tEmVVnedJVHf9sBsPIXR1OHbVYQxNmzXZOfuI7v/zZBm4ecT8ajRV2Gzw28ydbUaI20NAPaESEIwBaH1+IAKz73kJkJHIQIuBFGUtABQo2K2nihgcn0XtaUTbEuL19SoQv77+IDvqtYqtw+DaAPm+ChaRlEvO+fHh8Xw+D8PgY3S3cl19ckFhO9HbPK3+7Fkx+a2KFRNh5lxkWZaScs5lxf8WQ5CiqqJ1300rl9XT05EbqhfbvkUNkKBqQ0Cw5s5JEcW6mX+5N6mQX1Vpn17EPw44HaOlnqCpD156f16AIPRhOFoYBFibc7Z24ohqvvxzW5l33Zxa5QaWzabHVvijH9JKqWt4SSK0DVAJblnf1gjHhu7QbBEot/AlrGFJa4Ydwor683lJ0g0XFm7YpnrCsDpeQczcwIyrGtIuhaYE39gfZs+xz1WGrik0cOMyrwxf/6yKoKBFy2JlfnPYvX93/+P3vwagcdwx8/V6AQfkE4YQOPSed7c5NmaqUAVegI0T4VbQVpu3giIyopv0zKQ8Yx/WvKktnXTl2YLVWJ7GMHAiyuos9DFYqKCGGu/o/wCrAR4RqIVFrRG5WKnC7iwQYwUUADHMigthBEIiILQ68gtm0qArRmREygRkaIpEEaysmSWfj/2+2IeY2howspLX1qk6aMbh5oeq/4lgwzjscxGRx8csIgns6XQeho4jh9i/fXN3Pj+lefasOa1jxWsggh8h9FgebyKIACKgDzeT5xlg38W3b+934zgO4/lyvZzPl8uUciol1527rK0NQHIsCzaexqoSrwI3vEb6/PR21V7I3jBJ7dK1LVt0g1d5oRFvmh+yaXfdfkj1arWJkw1xZ+PwumVdkvfHEAicQyc1DsuKi1DgsZIWguPtPGTUTU9Y3a7BoYyACKqH43F/PJ6enqw+VGqPqmZt1qUEDbdg8Zd+LqyjCLZNpiYjQjS1kpbLp09lSmCKkkmF0UQUxBiAzEgtIkRiJgqIRBAIOwZmjGQBIRIyg3tRzXNKG2OeSImIvF2oQEhOfWAmJQ4UgAKFEELHIXLoidiQkBjQsCRe5rjMfD1BuoIUskokJI4MWJNIVdEwtBEcX+SQsNKI/aLwBd3QjIqKt3DVocNFC4EaeBKBiLR0Vn+QICEb+agpqpoVU5AMoHVyR1HNIOutbNAxdoQGJqDJEGDox3d3UnRZ5n13ePf27u7+TiAUxf39/e44ctSHp2U/Du/fH0xgnsP9HZ5no86YrZS8LHmahcKeqec4MnYcO+0wzfunaTmdp90YYiSOWHK+LvPhMBgIksRIx8MwfZpEA/VdON6lPKEuZIJ+4SGqmKIZqbVgCSWPLjRWZcAh8N3Yn07Tpagi34IXsF66X7IffjFla60gtC6m29QDsFtLv5Z3m2mQCWM+bAABAABJREFUl7c+Na5YvX8fHx+dYnk4HHa7HQKqGjHewhtstVPhLRKg7pBb9ANRs/sBk9OwqE6+QDUd26aQW6Pt6kBarSrBgWNGzhIn9PBDc3ewexjqd94yLZEArFq26pxeRT6tRaO2X7nRsl9fP5nVjNYCbNtx+Z0CcaPfr/pvBeHYZn182VYxeB5cvNLwXmjEm0L4/7srzcOuuxgPx8MwDMAk5p4aQETxQU4gJDIzBgSElJI/DVwnTSkxO38WW3oYr0GvzoJIKbks6+82BPY/M9MwDG4WFh8do3pUicgBBc10HFayhLuG/WtcjPP0EIfG1i2zKRFyuFFxu66LsTM1QVkLhpwTIpl1pYj7GNz5iw2PZmaiEuFZj3nlVrmZtzbt0Pq+y7ksSwqBncnrrAxVqWTFNgzkwnfOuRQx02EYQK2IBIDYRRFxzoOL0RXv0PX+SV0Wn+ellELE5LNKZkTcdZ2IqIi/T5+0iF2XcxKVyDGGsCzLMAwAkHMGgMPhWEo5nc+ReRgGUfUv8Ag7IgL0dVabTRucrbEsi0fSpZSkSN91TLQsCyL2fW9my7K44JtSil3w3+gKac6FOYhYKUvgQES5JN/j1xTjEFZj+Ju397vdfprnNit2W60cE5Fzdk+0007O5/PjY5VE/uEf/8O7uztVnefZxZOSM5h1bnCeF2iiyrrQaNUb5EYK0tti0boLFUOclkWkLMtiqkT1TnQ6ChHmnOd59ui8EIOqiDIWg4rFhuKSC6yJqZuR4Zpnies4ePVT+S3vcwYIAECMCOT0/rWRaY6nVK+jbmYFNXMQNwAUATXlQOTWBwQELKKmgi2dCZiB0Od8Pf2AkLTiPF9frwLx6+sPZ7nyOZ265plbZ83UkIg5LsskIlLK+XI+nS/v3r0DohZMe2s2b2TC593kmzVXuTL+Pf5SiYOI5pxzTtmZUSKgrERFzURroGgTOxU2+VbwQu57ZjLxQvzWETNDQiD8YgpBheXV2GtthN/6kAMQMEWsMQ8KoC4Qdzsejwp9UaronpXyW92+z/xr7Y3+ziDv6spEVFDbIPZuDf/1eQ6V+YtGVXJFAFUXf8kF32rkxps2C62xZ+RmaqjcDF2F2tsJw1uvsMKMnW1RtyJuwGnG41U0fekkwJqSV9OZqoz97IO4wIrmcd1Ufc1qskiaSNK79/s+hpxLP4zjbn+9XlKaK7iMA8Weut4obEXOCue7SfO1ibrRqlf/0erKRuYAagK5HYEvFetbjb6BRNGTZ5rUUvNf1w+JdrssTQl5HfzDVWlu4IeWr1QPk5qhIZmJGhIWpKS4iClgQGZC78rUwBD0K7wOmwXilgnoUVP22S7Cfk/TqOUA2TamY93Yb/fS9ZAb9DHKbhTVy/VSkqDBZZ7Pl+swdIi7t2/f9F24nE/LPJeURYqIAjlKrv7BtPhV7Dm5ZiCiZEhOPgUDJCaMQ9fHOHT9fhxOfbcbrw8PD9OkogoqFdxYz0O9WczAkLhCJ54JZPYKuvrp9j63EXGfLxmfAUxfOutVt6wVXyvFN+3goKFqMK6to7atawtK6x0xUeUbIdzGG9ojS02lOoPqXzIRopGSio9TuPpZQ1ctdPvD8XA8bu5ix2tvk0Kfzf8iwosEIdw8y9YsdSIirfhJycvp48drOHWIEYRNOgRECkjMxAABsCcMphFDYGbCwBgZEYHRGCgwM5MZiIJrYOrAf7LAzEXWjFQyREAGAp+yjZFDz13HoSfukCMgiR9fyXiduukylgXnk5ZZVciAgRFDDJ2aKRQxBcQAFTVck8S0MvrXU2aeJQAARi2O1iO2TUvRikFSU0MwQqh4SfOpJDI0AVXHEBGo6GLqBAtECE7WIlM0sYKgcYxDx2Csil1Hh7fD4asdK/XCh0P31bv74/5wPRfEEMexGwhJRSxQ/OarUcRKtndvd0+XlAvFjpck14s+Qp4xC0QhQRTiiDwMd19N1+8/nZb37xjBUJKJaKmNciUNUXYsEZcFeux2zHf5epqvabAaSW5KVlkOlVICaFrj+hAVmLBnOvRdf50pi1eQVgeZEDbm/Rdy8H+AZ9qasL+nXoWX0+6w/Zu15nE/4OV8FpHDfr/b7bu+XzH0q4hm20fE5z8cX5TKAkDMuCbxbPLwXrqkV5uFj6h7KSuiQBSj3qJ+CFfAcRX1PO5HrU6OwS3Q13+teMOj8hxNnci6nW54ff001OFb+uAzbsPn69p2XMbAbhV/W98M7PckMj8zDfj34bNI7Q3upd2jv+cm/eyHE2Ls4mF/OByORpBKFoMQOmBEdIjZGoCKgBgCliJrsrETafveMe6qYqWImYc9Vg6AB5ptu8LMHGNcV8kQwjoxswrE6/feurlY4QzaiN7bP68j9muWgGfHwYvJ/ecvR+K2cgJbo7G2slxoc8EQ8TZ7ikTc6pPVRNzYEeAkDf8gDmJOKfkn6mL0/JzArIHTkkRz18VhGErK/m5cCp+mqYXaqXtsh2FEzDnnvu+HYUgpp5SHgboueghejLzf7+d5nue56zpXS1NKIQRVKbkAQgjR5cuWBWwuo8+nCw9D10VNy5KW/X4fY5iXxYEJHLjk3PVd10WPYvMZC5HCHEJgFSWi3bh7Oj2llJxEscxziNH9yIjATKaWUuq60Uw9ji7nQgNZqag7Z7X7cRcRNeu5Ox4O9/d385K+QFwBcJn+Ok2Xy2UYhmmaP3z8+PDwQIjv3r379ttvY4xFRRZxB/o0z4DYdZ3jKdp+tJJDvNyapnmeJwDoui6EoKYuppsZcyUguVQiqmCQUwIzrmSP4qY6AFxSyiV3Xez7viKzwaQIeEyBmDRWZrvIqwuhwfda7jDYJgIRfai8dVDRmu6j1RhUO6z+V60YhpU5apucHvUtXmCrLEE0NQWPz/FpPAKmtpSjARk0B/Tr61Ugfn39oV6qJkWqhivqfVIzAyAEMgWHPwBgSvnp8WmTDaLNV+j0CG3juOs2oBkcRNbxOmzJlf5M0mIla0rOUgczf2xRRf86DNdA1XwqfEVr+a7FI2awMgBwzYxWUXsmeUJtclWnajVcqXmeTbUuOw7HTFTFVEzVVJwb0JQ8MwMByMT9cID+kCzkggoATqO12xT/ixY7usZsz+ad13Wooo7I/bfkU0irH2Sj0PngGN1i1Sow0NrexnEaSDdHMNBqqFQgBQYyAk8OAx+FBVVriXbVILypUbeEMSIwcQOBgwlxFaBv8GJYVekaYucMDM8b8k2kIQHVShNJDdWMmlaMVvJ81uWp5/LmMHz47fchhrfv3wXmv/iLf6sqhCwGcXeI+yMNo1Bo/ftaeJkINrbAWk+vbvcKlCAEID/pXqXVy2NNTt34cTaMteYOvKXa1ChyAkQmZvYhXG/HAnBlN5iSggEpVtRK4/VXpj/c8t/X4lvBUMRcHgHC2ZAMhahD7pHEhMlgHS4HVPc5GpBnRBZVcqezvNhIfG5IqWfQAxa/lIuyBUp6iVP/jGBqIYSh79T0sN8/lmJgKZWn8yV2PO46IvrZz75dprvz6XQ5nZ9Oj/M8G5KWLGKBQxejiWdaIjBxtYGAJyyAFlNEZs9sDMQ8hKE73B12y7LcHYbT+Xy5nFPOLhFjYPd95CIeNInEwAGRrSaHIBNDvVFfq5Cfki6sjcCzXtitUQjrhOwaMPcCN/zs4dyMHoaICNT4/FbdNNX1X+dn0FkyVt1AbRltky7N1INIdbTWk9dr9noR8al8tGqlomgxW6mmQzMffgQ1IjocjnfHIxL65MyaGem7VlWtbG0kQjWTjXa81btbZDWANptkG743U7mcnwJiP+6GyB04mMGQgBAIISAeuz4QESETMmEIFIjVFAAduFhtkQyGKIaV3wvQES4tSwUNSAHVSOv6w8QxxhB7iqMLxIrMjCGAXR71+tRfz0fWLNdZEmhVltEIBBTEVAiMECMRE1udC9JS3cCmuaAZV6azCZipr1Fq7S2ZQg0LR0OC4M84QTOfawiTWlETMGQa+jiEME9pTrMJoJGBjRTGnrohAFtRNZDDO7o7jhx64v3hfjy8ORjZPXTd+H6/ix1BBAYtKeeUChANI725G66nyTQThdgRsanCPE19Xw4DvTsO7+72P14RLvY0X8Sy0kjcHb/6WTrxJf16ybrLxfLMFMfdMQAbRQ6qBljmISQ1JN4jjvHtu6RLlmsA9c64UXVZ120haLGCBh133kKIiLsu3I/DZPlSrKiYOD6I620Ea6OlmpI2oRFVm62K0Ka571fyBpe95q/b2vDVjfjSyhz0qR0AMMMiommZ5snVh7vjse86V/7htuqaF20CymBoJqoOg4I2XGyAn3eS2sZVb0b09oUtELl6w9wO5nHzIm7JNkUgoj6lcRzdvofVEYwbJRoVtHq2cK0KANTzE6zewAotxsIUkXwW7lUi/smtaa3c1JupwjbmGMTP2iwttBFX9w7+Lg3XKpjIVvnXmgu+fpetcLpNthVsNwn44idrjeYkf9Mhdof745v7NzH0j08P13miELvY3cwzN0iLAUCMXd8NzRecS8mliMcmixTJJZfKCHaT7IoRn+cZAIZhcFl5HEf3As/zTETjyGaaS27DjbZKwIjoLlrH0eZqWVJv8FR2BDMiiikZcuAQA6CVYkWEOfhTLi1ZROdp8sMlogYQY+cbZg4h5aRmUDNLQRWYavCGiHZd8Pi7GEIIwfU4jnHoOpe/Q4iqxsyHwyGl5P7ZEELXdZfLRUQOh33gbp7mvCw8Dl0MKoICkdndFVL5GcUj78yUKHRdl9IiUhAhhODM377vhqG7XifV0HV9zmmaphB2d3d3zuTtuq7v+5TS4+Pj+/fvx3E8nU/zstzf3x+Px/P5stvtjoejqM7z3HVxN445JyQjJiJMaen7vkg2kxDGfuhPT2cq2PeDSLlcLoB4PB4eHx9EpO97CJCWBB3sdrt5nlNKoVZQ2ndkZinlvuu60F2uU4xKRFKKqCHiPF1LAY71eSqqhCQ5k/t7EEPovvrq6w8fP7lfe7td8s24X1EfP37y/L2PHz+klL797rtvv/suxOgtPb+E5nl+eHw4Hg6x6wFJJLteQkwBvcHOKaXz+XI+nzjw8Xj0RlBx0R/Rauyb5Zwvl8s8z7thhDYJh1QHkR1lmUtBohBjTZIwUN82CphBMSgK0sCh3llkIlwnQd0haIroITE+tuLx5p5rA+C2Nc+T8XuB6OaFaMBO14JaCYsVW4oQYqeGpYCBCWIXKQReLQ3eC3F/cYNb1rh5hNeZmFeB+PX1B64+apPT5/eq8QGp73tVnebZb/Ii5XI955Ijc7VH1cJlRTAagPmTpNYS6DDQ2oaCG44XAMi3i6VIKSJqPurvvuGIiMTV++PuJwPv0jrlt8EXkBCQkQmdpENMAORPnEZVxqYagA+xNzCDgYoBiBRRERVzmVj8DRWRYiqgAm2IuPqLKFB34PFeeBBg9Z+vNX2tFu3o8SLP55FVbwKxqnMsgG78rwr+QTS1Oc9FSuBQp6gqJRrIc63dKMw+GoZkbrKkGkVUCQaVTIsGrOYUCQIjALF6eoQM0Wq0HjLAqrVDBWY0IXpVp9tDfQ0Dv01Sv7Cw4G2IBa1yqGth5jZ1BCKON4XOlyhLki5lehxYvn37dpnPf/u3f/Vf/df/gkJ4eHhYlgmJiqFyF3d3oT8A9y7h2y1wzCr5mta3W9VqqsY5BPUNXgtXVq1CogjUM4nOIyAibZp4dShbw5qI+uVJ5MAltxUqNVKIiZJHDhrTSuAwdJy1ARgScn3H0Ewe68wfEfr7UwExQoXCOBuqsrERdaoCZryStWsigQHQNM8I2HWRgWtQ4WeK8NbhdXOg0G0/sh3P32pnW7tEjWYmJMPAoY/d8e645DRfr6JyvpwRJDA9PT3tx+643x3Gobx9czrdnU5PT09PWTICMFNgDkw+3hcCh8BMLjRAy+VBpkDMZoBAxDV573jcffPNVyktyzK7JFdEDIGIcy7X6/R0vnz69HCZplJERJt5EptZ+XUF+Im9/DF4i0j1VQIQmQgARMX0Foq19dRvp/9sayysPR7Hh5uBNO13taHfxi6sGYu8heZvaMXugxohK6hICbHrus4xih50XmtjREIMMYh66vrq6ajTDl0/9MOOQ6w9TzWghi132YAr26kOfViFLG1gMtgYN+vK5nzu6lhDBESNzPdjeDP0ERRV0W9JYiYOhD1HRiI0JgxEzExceQ9MTMSVcw8GQGRQtFK/m9WKXEBQEJNsklgQGU2yZDZABgxggZAYgQMSqqhMMyxTGFhQCD16lAwpoxbJWCVGMrAkGUuRlQwP4iiIYooGZBlNm2hOaia3nDMgJAjkY0sUEMiKFkQdx2439l0Mjw8PaLYf+/1uOO4PQ4ynR5tTtZRdp+vQhbfv7sZdTwGIYHfo377ZSZ4ZoetCfxw5ImjOAmBJimmMBaxonqZlLjZKF8O+H0a+78UUUUspp4enxw8PBHg5IcWOQhTprQQyCtCFwF0XItMOy/HtuFw4lJkgjMM4pxQ7jpHAgohmMQj6/qt4KHS+Tkuy7nDXMeff/gIldVYY1IxMWBV8fqoNjZI59QcMwQa0r8deRCEnUREAQUJErrSTxlFCMCNbtaytxxigJuQ092xNhl0Xmiq+1lxhqFE7Dhr2YDZDrT5g72wXFV1kSfPlejWw+7v7cT8SoVpBQEJeDZhNmyKxCgIxM2MOt8URVtF6Hfpuy2Lr5hBqi2ggItevtUUrLCnlVKS0sWbEUopPRs/zPI7jOI593/neu1EvLYSABiYmteYjxhtbrMHIqGUdm/PJxUd3X/Xhn85LTAsgY/VveGfEn96B6nXg652KaiUMgIqZEhGiVsrtMz3YFWFnD69a84YfYVg3CreISLxN5BjCFxDDn+0pBcxZLhhD2O/3x8ObEPtc9DLnIrbrHNVbRSYicDusiC5LuV5mROy63iXmEGLXWYyBiZghCzqUf/X/OotARLquIyL37K/qXkrJ/+ZyvUzT5ElfDjdYqRSrFdeJEw4jppZlmVJaP1jOKeVChMRYREoRBl5yVkNEUgAQA2JCQmY1yLlM0wIAxLGUUorWyFngxrC6KWW3+hyRmE3V5y+LSIjRnzKO5fUHRc6ZmR0vAIh5WfJ8jYH7yLmk6ZJ2+939cVdKmaaJKQ67nWSZ51lVuq7vuv35fElJ7+7ujsfd6XRalutut4uRUppUy243Itr1ekW0EOJuN+ScT6fTVp72EDxHRozDLqV0vUyHw2E37gmpzuQo5mzjMJSSc8rjOO73+4eHh2VZ9vt9SulyuYzjbr8f52We5msIfLzbp5SmGXa7MeWcy0LAqpqWtD/shcsyzRrj4XCY5vnp8SnEKEUv58ndyPO0dLEzsJyLmaVlDrFPuhZtkMvCzF0XVUFkRuL7u7vj8fjw8LiaxLesCTVIpXx8egSDJaW+67/+9rtvvvkmdMPpcg0hIJGKTMvy8eHh6ekp9v2cc/T2CjESEBNyAOKilsQwBoodMmU1KBJCiLFTsyWliqVmFtU5F0Oi2AGFIoqmAVkROXZWci4KYLHr0+ReuzinsqRIxu7KK2piHjRkar5KOxdpjTCqK+oaTl71XyIiBgIzKGIABVu7FABCwBrLug7TgGkN/0ZmAkRpgRtFFyoSYvQ9cM4YuxhDCJGRCQxQLZgFCtwQHMxooK/enVeB+PX1h3z5QKC2PWg1IFQrJC/LomrSdsfLkkop2gm2Wt9Wu+W2AvEaouZvNOCNNfXTbqgsj6RFIMeguwppRIaoZrmImFKrgL7wsDADvAWjeXvrNuvLWIkZdnt3twARMGxgIBd+XcsWETOxUkCkhlH7D0FTUAW20HWH+zjcKXYKEZsaK2KN0a5mpICwDg67sqaKPrqlSo353kgCdgON1TFCLVbAoI6a4JonaE5DbhY4bfFpgE6oaKTbtpdQ9CFYVQRCH6ttLXtDUKrweUQj8/GPNXAJDM3RHFbdwbhu3+ALA6S3WuemObonq57ujc3Ph32BjKitMIooYIvMp2DL3a67O4y//sWvv/v2G0D74be//eHHH13DyAIWhzAcKY6GAYzXywc3qIltlprD/SiEthmt1GkkMLNciicTttDwZ8MtthEpb2ZiRMOaOgj1gjdCXEn+PgUGyIyEXPWQBgeF2ucAM1mdVOBHoinyvo82BHB+JyAKwIImCAYcY2+QRLR3ocQADQmZkAoSx0CIFNFQwJ4lX6/VT204PwuCt3ZxwdZKaZsArhbXXvfGqzOFEJmoi3Ho+rvjUUXmRdVkmpdPnz6eTqfvvn6PRIGwj2G/G7/+6v3levKy3t3zgdkfO8QV0+G97mrRbP0golAv2MoQdxgdxxAc0lKNiEiimlI+X64/fvj08eOnv/3lL3748FGKIhIxS/HJtfCqEf+U1GE33Zlpw3RChQL4Be+VPryMZ1ydRBtJeMMjhpr1DBuYN7RAaH/CUg2Pqv5HVpRiDtL3mObaeUEigoq1xVJbGkWWlAx8tgJbcU7ulJIibqivz9jKo2fCaFZAC2iNETX/2GArtZ8qsNU2bPrbMujPBbtlWymYQGUtGIJ2zIcu3vVdADMrvilHII8BYCJGCkSBKh6ivnXm2zBHfdT54wKQsP4GqAP2HEhNlrwEIgIjFVTBvBBHjn3XD+P+jnFUUxHQUpgoMItpklJMlUhMk5ZEmk1ZataoIogVUVFhXxdNs4IZoRiqCaJ2iFER1ZhZGDNoAckmamJEAEYIsedh1x/vd1kWRvvqq/vDflCTu1OgwPv9LjKVJTHa8c1bRq7dVNTQRWTMJUUO+/3+zfud8VIW7CiWIg/nT3dvjm/G4eOnTx8+fuzH8duvvx76bugH5n4sEJk7CJTh6XIZdkCsoNYpjMSAZMwP58uUZHd8y7zf9QwGyEA0cSnf9vhdzJnoks+w9PH4DkP0S0REpmk+XRdCvn/7ZgRDSDnnRfaH4xu5PM1PP5qWgVCFDMkEC6lhM78jmVoxJYQQcAzMSFa6smQRk2JJlAkdyuEXn6rYBpLl4lQ16laqwlpxwEYFvfUvm4vY9WZd4xjxBtAyL57E55q0zDmnlHIuXdffv73vhx7JAN1ur7Za9a0m9JiaMq7Rjs5Z9GFehxE7+XF1XVXQp/9ulfZWUEQBm4SHoKA+HeXsFP/elWg8TZNLV3d3B9WwIl/MLFSHV/UjG9SNNxFVCzHgc2HOh77whVH09fUT8A4bqKmtdb4DhQjU15waBGVUibeqbY3yGUhtVdyLSamaBXVb79YS3r442Y2/K873MxZLq/+JFJCI9vv93d1dPwwierpecs4hcNf1DkZYi9KVe0sUpbjvfklpAYAQgvMTfCxs2I1u6nQ52Im0IYQYo5uOoRHAHaRwOBy6ruPAKur4b+cn+Dw+Mzst1+2fvuFalsUlZn9v/isAgAOHELu+7/vef51rtUTkzdtxGIgoP+ZpnogZAeZ5FhHnIZhZjK7tJkRSzcxMxOszIefsP9AnD7zeTinFGPf7PQKktJRSXBl3gMY0TafT6e3bt4f9/qI6X89MEHvOpfmAsFFh1UeVxI9SKZmZx3FsgSLYdd2yLMy03++u1ynnZDYMw3A+n5dliTHsduPj49PpdPrqq6+GYfj48aOqHg6Hu7u7aZpyzrvdLoTw8PDg8XHn8/l6vfZ9v9vtLpfL5ZJiiAggRY1xN+6naVJRBALDZV6645Ep5Jy5474bRDQt6fj+PcD09PSIgMfDPSI+PD4Mw9D1XS7l4fTYxS6XbAgiuizJJhvHMaVkIxDTkpZSSgjRtVdoQC0RWcEdZtb1/TCO33377el0SqmscJLN9tZUNZeSlkREd/f377/6ahhH98tPy+xblyIyz/O7d+/GcbeklHL2i8QhyKI6L0tK6XK95pTYLdDMgOhGYM/Zru59Ikc2l1KAoIiAGq/+JbCWVldKSXk689iV0i15mRcMIlbETIvjh1XBipm0ZCX12yqEUN1vogCKm6GfBrcHABDRuvdfj4nJDfd/Mxr6WkftshMwVSk5iSKG0HHkyAzBsxhUzTd8SIaigIqGFoK7C9gEXgXiV4H49fUHLUDMHUpVMDPwnSFRCEY8p4zMLjH5llJEminEHygAWPlJTSxuKMUWU+cVPjkcR3Xj28ImKSIg1yxpZuZghqXurdHdT074RUOqcc7Wwi6xFk+NduSgdQBBl4krDEHhOQhvpWTcpqmqsVXNBExAFQ0IScHUioICBuKBurvx8F7jrigaMQJZ7e3rWinVrXp1jK59eIKG+HGxFSqLogaZAa4NOiTianO2W+oZGWFLJTUCAzVVVEOzhnUHIwB1tJfjHKqV2MjAkbVozrZFAG6Z4EDB1IP+oOJvwQjRU3uMVvqYmwuw6vJQV6lVSWwhCbDVX6gGuyhZi1ZeqfnAnlxEAAEhQCmXR1uevj6OHZZf/c1fHvbDP/kn//Tf/m9/+eOPP07XK8dQlIzjcHzP4z2EQZFWxjJs/A5uTNJnjrkbVFea68/ZxD5M5pKj0yq2hTDfWBO+AAIigRmhn3r0iWZHE2KlbzjoxMgEkf2MoapBca5lhZYwefvE3Fmn9eQiAPnZc5sSoUqV9xUBiBaCzrijHYVSNAcT0tJ83hERgdkAxAStIIX26V6GBcFnEfNap5Bwyyl+0UvffD0gokq92pkRgLs+9rnf7XZul8i5PD6d/vpv/va7r7/uu8ihmhQDx75760Zrv3JWeIVL6av53kOSzFCruk2N39oYLN5nAXFbZ4W1IjBRF8dxN9zfH//oj7774z/++W++/+1vfvvbH3788enp4pkQKkm0vC4EP5F+50rXRYKNIQL9+qgDJTUPi9ZrvhEGX3iKN3YeIETb3AKwAtIMaE1bbg9wNG9rlto9QiTyuQEBkxW+1DRSUtF5mkUEmy3ZBVaPtNZKxBUEapBVCrGLMc7TlYgJtIZKu5xUtLo8YUMBajPHZmAm/iB8fnc7oLfu7ZsLzcaOd10gE7MYiCmwOZEO0Hc3NaYaCJnAZXgCIqhxcUYKVUsjQiYQNQUlZKL6tkV1TolUo2owYGJUcEgHEUleAMlYhNDINIZLIi1ZBYpBLqUYiFkh72QTgCiqghZoYTSKzcGtqIgcELlj7Ik79IRTLghmBcA4oAHmPI99PB52797fHe7GYRdzmfe7/njcAeiS5p//7Gehi4QgUuapY2REnqdZinDgd++/XtJyujwddh0alHI1iaGHPnZsNC9K3u9mPu7vSjJRK4sJappzXuYOoceIVzpf57/91S840n4YhxgI6HA8LmQfnk7E4e64i32MQzdmuoaEBF3IlOf49Omb94d3b4aHdPgwXR9/8Zu3f/qnc5LpMneRkWPXw9PjU5qmYXegcHhzt1t61FLCYW/pDNcsIuy1E5pKARO/BYB90Mu1fkOUIYZv3hy6cRgeT79+PD3lqyFojVNAozr15TjjFlwMhibmjQxsjUZ7sRJtb8BN9iOs6vAmJLLdd4gqOqXJCZgAcHd3d9jvu9AhkRqgKq2Q8bU5pOJMxjXaUbydU6sauHkaVMVujWdfwxvVuglldkvJ87fkiM+Ves5EHlfgz5zr9UqE4zi6cZmZ4VkaGGqFwlYPgYGhGkAN1vXBLBHxA6mviImf3hbNnguvWPsDTosnMvSuIbGK83Hc+OI7mmYQVl3R3ua9r7/3dfJ5ofgMamEGL03EXiSjqQXm3eEwjiMhLSWlec45iVDXdc6IcAOvX8MizpEgBN7eZUQ0jqOILMuSS+YuSikObAWA8/lMRIfDwePs/DZpnl9c3fqHw6Ef+mVZ0pJTSv4GnCnhoCeXOH2mBwBWubmU4urzOI4GsCxLkeLl8TRN7ud1GRcRA4e+66qRQnUFSbmk23XdPM8+Q8DMWxXbv8VhEa4Uq2rf95WdRyhSocyquuIdPDTej4wBcBeixFSymI27XZWPz+cY47jbpSU9fPoUYxyG0Z88Lt0uy/L4+BhjPBwOAPDp08MwDK6AX6/XGOP79+9TSqWIWfKsv9Pp1Pf98Xic5/lyuez3+y52Rco0TSGE+/v7eZ6dUxGj+6YLMUsRIlIRD8S7u7srpVwu12EYnGt8Op12u52n5xnYbtzFIf74448AwByY2M/vsizE1MWulPL4+Hh/fz8Mw+V8BiRmzppTSoBwna4A0K4rXNKSivqB9r/0U7bG/8S++/kf/Xya59/85jcebbq9pivLmOnu7u6rr766v7/3Q+H28zKXVNLlcnl6ekLEN2/e+FW94iJrb08kpfT09HS+XKbrdb/f73Y7v37WwbX1GV4x+peL3/gdBia2ojmnXPL5fAawYRiIMKfsZnPVUtJSOoaSJS0qoobit3wpuPobFMw0l7TYAgBMTO7hcwMDuuxxY56b3cpEX7xUAUk3Y0A+yKawySOi9vsQwIpkWUwCxUBGRVWFTbiLAbvo/mtwrzkYwQ1p/LoAvArEr68/YIe6mnztFmhD/r+c85LS823zGramq3/ixiO2Z4OBVQdq/6u7z9tvqaWtP1d80M9QkZBCMCJtngj14E4k8uko3Y4oNmqqGrHdRIIqiq6Krb5QxG7RXqBQUTlV4wZcLSoKAKCISIAkqhYDdyMNRww7g+jTW00n3e47ngUftTfl7mFssfftC8DnvMw2O5YVcbexPgOuk4V13MwUzFWLuh/3wermRkUwRDJVMwRkRKl2GxNnQVMVFNw5piZ+ZF3E1WqeRlKAZsCFm4N4/VRQ+7FwS134PArjpuATIEAxclBRtT+jGZkiFNNluT7cDbgfOU9Tzsvd3bdZ9OnpackZCEUgGdKwi7t7CJ0iGdwmxK1pJPVAKhKt+0xErGubGa6mWmxj2CuDFBq/ZMtSWOGD7Qxu+Ic1EM2BhUZ1pk9FFcmDyF19MSAwEbuZqbfJNBu0m62WDvMQJ3RoiIKAIQMaouEkZsARekZCS2CKpmKehkWiCp4ESfj5ScHnUtcL2at1K/DzLLvtYdlc5NS4zIgkgbmLcRzHZVlKTkVURT98+PjDhx/vDjuCYARd8IrZO+Gh/sGkPgcaq5Lc8GViLW93NYQ6J3WdWUD0EV0lItU65e5fTYh9H0MIfRf7obu7P757e/+LX/7q6XTKueSSwfR1IfjpKcUbNKJtW1a2rlVe929s8p83UW7PcLzdO/Wyt5rC8ZJWsWKJYRtq6RGiiECo6utjYPZxVwQTKbZSIG/cHgZErZMo1NjzgEhd7GLsNqgfNX/kA4oqtU6jqSrK88w6I+KtNNwEuNtkP5pRUxoIIDCyOawQmPyNEAGwNwQJCZGg5tM126NR7fpUEjso+oJMa0Rke1ibmUhRCaTK4BwjgpbwrqpQsqqIG38IZ7M5lQ4QDCvsVc2PaU0RQFVUIVUgw8rAYo4QQP2NgbtjVNGIWS0XE+roMPb7+5HISp6Gnoc+HA68vwu7XRSFYeiGnlQtcOiGQAQ1xZ475qACj0+XaV5iCO/ozTAGoLHrurKky9NpmS/D8cAIDDhYEOtRwJS62L893J9Pp+XxREvSabFlDn0fCKHgYGHAQaay6/pjGAFAivIYAQBMEDRG7CMMHQ1MHHDokErIS5quH+Lu7TvuZp0/ni/LebbY5aLExIFC5FIyU5SSwS6GEiMlKNgRdZ2mkGdhNAElkJowUVkT6DkRFXYSiMAC2HEIoruA8NvL/CRlMSd9EXjgAWhbgazeHm4wNqtdly/lq31Wsz2Lfnp2b7aRNZeZ3JbrBkOHkK7Lx+YWqEs2bPIq1zxHBUOg5hS+LYPWgIloL5LuW3Yh4UpzuqHMPdCn2SRXQuwqCixLIqIYwzo1vzKPoTV5FJ6N8mwGADa3rb/319dPy8HTzPK4cd9UghDVjkvViLGGmyEgqkkuKipemYIbO/wW8IA1ehk+fCvYP9NlnmG4K9di+/XwPPobVjgphzB0XQhBRErJqWRRWeVgv9q3S7NI8dwOF/Xc5Lt+DRExBye6qRsTGgCtupeqd1ibcud0NbsNcbYlz8lO2weLPzHcVuk/ilZOa2vPOAxKK5HRpIjf0X7n1vuXyLEPbgT2H+6S9Brd4a7SFxm57QjImo67nh0Ryzmjh7i04D43EXddp1oV1Rg4xmg1OIFCYB9rIJL64CJSMxFxhrKbag2MAwOCeOQqQi7FIR5mJqohRjVdlmQifd8h0zzNRUrf913fZSmi0ve9JisiSDT0/ZLSdbp6NGhKy5KW2HUEMeeCYI5snueFmRHJm3lEnHNOyQnRKEVSSjF287wwU98PiHS5Tn3fdX2/LEsRVQMOcV4WJM4iHrfgkQ7EVEqp5PYKydQsuu7RVRQJ2e3bYDmnZZ67vv/2229SSr/5za8d0wy3Bz8AqAqGEFzV9ctvbWNM0/Tx48ec8/F4XAMD1yu8hhyuBLPNdetjlGubxPEm/k9OQYld551IdxqVUlLOHhbnw99IyDEAQk5pMcld0JIlJd9vincZfbZgY49TMfGMJSTyPSxAhbcgOdmy+fMIEJDaXCwAk1ZiY1UmFFoSXjUSG6z/rurxgMVzrkohQuTAIbB1HRoSMJB7g5BaEA68jna+CsSvrz94e/rm2nDVF8n3pcsy+1q1KcdXhcZrXF0NpNtZA/BKGSscYs2yXH9f80asSty6W61x7dZqF7fZ2sqfqNyDdeL/ZR3TNgz/IVUcXthVtH1SrfgDW727zipgBTWKoT/E3T1wL0Aepufa8E2UuH2wpiZ8+d08DyK2ykF4dgyf6R21KNzUjVZZCISOaSADqhjomkBESIasqEDOW1VSBRNE8kIAjSo02qRlmSrAjSGhILrie6sxzzWRl247s+dZFZ8JNo7/W2nO7WcogiAggKAsmi9W5sN4xyBJ8n43DuPu++9/e7leTZUoJLECPAwH3h0Ng0ed4jYxGW7y9XpF2vMjDc+kXcKWJ/48guML/g2vq21zKVa/cW18qtNNREDFVMVtxaufuUbD15OzSudrVM8tVtGeuzuoKbxqiopCiIZJDYDM+gD1ZgPLAGoIwOhYGB+q/R3RdL9DLF6pzVvuRPNxvIBO+Ht1wzW6QQ8wEHcxmtkyjtfrxTIo2MPj6fvvf/j5N98wDUYQQ1Nv6Sah15RFQ6lG/hqWYkCNfGGNZG1wy8yF9S0RM6kSGRgD8jbmMTDFOHRdfPPm7v27N10Xfvjhx4eHx9P5hK+FyE9uUVtRp5tt9ssnUlsDKjhizSLfhl+1ZzjABjOzjmRWgGAN4sStgryVpNd2ICEakdaHNDKz+e+tzhF7cWMyESFJ3S2zJ0DX6znGruu881qJDWqrXlRbki0lpI6rt/EUgGc9sc8O0W2CweVeRgxOdUZkrC5h59ESATlhz51f5BKgrXoGADAhAWQAEHU2NBOgNh2iOVq4FRguAyCzA/sUwESkaEE01YQkSLPCHjmAsmv8UgARvK/sTWcy91EDsk/nc99zZBPRZUHLCGKoFjCMUSWLlfEw3r8/vv3qLjCCJiYzS4FtN8Jux16DoElkimGggPOypLQQ82635xBLkaJpmk8T4DS/ffPmbhgOIYSFoSysJUdi1827wCXZdJoTdGPoDmGQ8nR+OgW1UCQniWRMAMbjePz2PZUl3+3GfR8VykM6o8IwxDkn0SWGY2Qbh7jrkIj6jki7aRpOP/54nYb7bjhA18n06befDt98DUiqhqrIGAJF7sy05ElhCR2EcMgx0hBt6fKcopqgGKo3JCuARJ+F0PoDFqX0HN/t+jFyDEyX+anYUsTQ2+/1bkOwTfrtl+s3+H2lkq3iyDOW1Go+MBOV0qyFMcbdbtcP/a3Y27R/2nuwF4XWzWm/ysG4SdG79U9flDrPbqW1Pluh3215VFU1QtsUTq4ZpZTSEkOMgdnQezybQw0VBOekiXXB28zZfF5Tvr5+CgvZ5upqt5tvB3TFea8RpXWBgUABGAgJSpXRDAwYDIEYms8GAT83CmzL5N/xl/bZF3z+NzdSTIwxdp3LdilnkYLPs2HX93DbSmgVSZl5tUqIFEQMoSIZEMGsKg9OMyVa0flgBkQYQkU3MHOMAbGKdCEEtwy7hXn9vTHGlUe8/diuiPm6n90Qyit+1Zg4huiwAsej1bW7dXpU1X+RFxj+Sd1auxYb68ffkiX8e/39iGjOnk5u3igWkZQWROi6yEyqKqUEIg4xqhWRUhSJY+xFTVVTLjGEfhhKKVkKxzAMQ0ppmqeu6/phEJE5LUzUD4MDemKMHIMfAeYQopZSAHEYBj9B3gDwsCIkCjHklL1dG2K4XlOR0oeBQ5jnuet7DuF6XZiw63qHHe12Y9f1y7KUksZxJKJ5XqjypWFZkj8jrSUaLSkhUd8P12nGrCGGfhjmaQJaxC8bq+hIUi45QwUmaFFvJPsYmdUWCyEEzy41LQbz1I/DmzdvPINumqYKeGwA7u11vlp9Xc9V1fP5fD6f+77v+35ZFjMbhiHUS5b8iK1NQQDous5d6u6w9o/v61dTo7VJ51THcCsNwqOS0cCKFNViAByimS4pBeXUJ8rJSnHpRAB19fV540atTc5Vtqi7nNzvtfYp1dTUoWfkPXszKyJg2qaF61OEcGWV2UqxuC3QhmYqqkzKRdy6EwIFDloclcMQOATnMlXT8epjeH29CsSvrz9QCaK2ZnSCoeeoecP6ep1EpJqlWkeX6o60mKnnPnvXjrYNT1gj6kxVzRM0fQiuEeJFlJnrBKgPztepVyQiI1I1UTGM5BZfUKoDgHRDxKpbUNYnuG20t5UzDNXTBPLChGIrCkBEtZiISVGV1oKuuUOiqmgYBos7Hu64Pybj4iWW61TVfYWVWQGem1LRiy/6863qx62UWRUHI59wvMkcsA5letNebLXC+NR0Y1IyGJuyKZgtBguYAFWdnoORApSouTNgk2KSEYoxgbOAAEyI6iiutkxuVRc+EY3QgucuNEhElS1Xr7jZJj9j9Y9vWJOoRO5ERgJkxCBaTETLzEABDWW+nj5+8/YwMHz44Td9DH/2n/9nP/zw4S/+/N9jQGRWIyHm7hgPbzGOiuwf0DdUL2pqq5KrmVQx/MZQa8rxBlh8k2c/99VuTh8hKSreqlsv3JEI0AREsn88BTV1m5LjnExB0VreTm08CFREJ1UY+Grd8K8idJQINVVbTBCIjAypmEftUaD/D3t/1iVJcmRpgrQws4ioqpn5EkAgkUt1TVV29Znut575/w/zF2Z6apbKrEIiEQFE+GamqrIwE1E/EDOrmLkDfWp6zkFXHNPEiXQ3N1MTVRURJr506bsRKQUkUCQzZLIiFBgNEBmR/6s2ji2bVt3bCC2k7puScT17fd4R1U8KIoiREYfT4ThfL7OqFLjO67/8yx/+/rd/w/xuGsKWEQFTSsQcape+ojwMUA1EreSinmWI1LKJTE093xKeO8uwAq2BCFkByBSUmdmRFlbvMUPiGGkYwrt399fL/OOPP/7whx+Oh+l1IfgFLWnNEMRtI2pVD+4KrN+dXDut7RnC/ZrYBjHQ3Eb0FX2CWmmMu/tGG767gfd7cdx9hHUi3ayW2oDMQSznXHJezQQrVb9uMom4lKIiiMXHTfzmVaHb6LdpuyFXPBFWzYcrzAnI6IB6aJoU7t2It9Wy3nsMRUGVDSJy4hCRyNQ3EITABFRn3t2T1PjL1GC/9a5Y0UuItYHUCgIfnG9uSgBDI+YQA4dIzEhIzMiRQgRkMQSgUqzkTVWVBjg9SAh5u8L1HBkYDNVIxZCdteQhdUqoIXI8DGmM43i6vzscJgD98Pt/2c6fzCROdHd/fPv2BLrEke7fvbl784YCosoQT9ty2RbjgIfTRMSPj/Pj56fT8e79+/fTcTSTL5+f/vDjj2lI//4f72PkwPjd+4dS1s+fPn/86cf3b46HNBDh4f707u5wma9lKaBKiCi2/nz98Q9//Hz88v3Dw/thODwuw2r/5lcPpvgI86dLXlOc7t+Nb7/79393dxoPf/r977/8/BOAjun48enTd7958+Hp82VdYsBxCMcpmYZ5ni+XLaRh/P63nxf9zx/O//2b8TQ+vNfwf/t//7/+Pg73390v61VXGaf07v377Zq3bSllEy2q2/2boIVQxq1onvO2rimgNq4tIXCbriIM3sRXUUZEFTRjoCHg9O7+/jD9/vHy83W5etC6EUFlV3VgFhpSd6vXk+7ZbIpfR20HCt4jcM/gi9UHEYEIzIrq+Xx2LcbnwY/HIxOWUgIHQGQCM94pu9YFIB9e7rKO12li6pD7/ouaWx+6orM3+++u/ZuK23JQxa8Lz5/sgRNuMROzIrKuSwjMiO7VR8S4m3Fuv04bRweeqcewJ4m/Pn5Z61nvnOEtxQVRCWo0d7dupBRDiMREgY04l/L5y9N8XeZ5zaWY02F8u4FGUFle3yp0bwY+e+6x+AvDZ/sV2K/2EILLXu7rv14uKubuWjfY1r5+cx544pkKbFth7gkZuq6Scx6GwbEMkvOyrinFGJMqqVqMtzCJGIObUh2G71eZmcUYcy6qGjilNPhmbds2/1d3BzveV1WXZdkr1/49KhKYcEgeeuFaMxH5gX3+/JmZEdCJyV42l1KWZVHVDlyuKn9ja1wuFxcQ/T1xNo6DI3xX6BwDxCIiqoZkaRgQaZ5nFxD9JRyPR9evDcIwHaPply+Pg8jhcEQOyzznrBzocJwul/O6rH6HFFUHQaQhaZbz+XI4Hu/u7vywRfXNw0Mp5TpfD4fD4XBYt+18OZ9Op+PxeLler/M8DsPd3d3lclmW5Xg8ppTmef7y+Pjw5g0SXc4XBxMz8+VyHoeBql94axp9pTM3F228XK5mdjgcxnF8fHxc180Bx/M8h5iGcVq2zZCQQs5ZoIQQs0Ke15b/KSGEIoIi+ny3n4uos1asOr5RsRvVOQQ1c9TGw8PDu3dvf/xx9S5Fu9N7fQfzPJ/P53rrFunSsGM33rx545QMX1m6kdylXhFZluXx8VFVPaHUUSc5523b/GD8E/djdkBHjJGJvZ8pOxJFLtnMluVqpg/HQwEDKcnguq5RCikgoACIajFFJFOHEIsrHLZ353l/UT0jA62FF4uaj71ZHfyiZ7ZCBBMDBOIesQyAqKKicpsuq+4iADBqmT7uH5zGnAUUmVME7LhNAzRi6hTB18erQPz6+Ks8EABVQaSmtDEHXyOrMFQJw4IMRGRqqtKobADOHb6Ze63Htbv2JaoqAg3B1oA0IKocgsu51mPT6wSfx4VUboWahlDRd0hoiKqCFXDT7mtesZsZVqOPO61sN5b+nGpXmf3+cqyO/amIiBRVgQ7fAFCkbGachsMDpkmAiuu/pszBDFTM+96+hnSjmX8FdoJv95XBLiCoLwaVOGvwLDqsfgaVfdvi5hENQKua7IiGqDKBJtUZ4InDRuARuIoMxmSYxI5qR+BicjFZATKg1WQ1qPv1StxkQCADUR/4NwBxGl/NgcGK/cVbXJ6vHrsUwFZnAoKYSy1VPTcgNVIFlZIoMAjktcxPA+vf//Y3H/74r4h2d3cKIfz800/MLhqiGFuYDvffxfHeIAAGQxSDl66gVsbSTS+qPosqYhtVLCjdmAXQPiokh6DZrgD2wGdqbw8yobaYGKueOPawux546MehCgiGZKHuFdEDR+ovVKmkD+TOn/aeBxEZVC+4uikc68UoqigCyMXYfIiaATkSCltRs1wyqhIQKJkBMb4o4XvMztfm2VYv3OqA7qfovi3d1RaI2JyG4PFYrBgICliM8Xg4muh8FVD68uX8hz/8aRpTfHvnI4YcAhupATMHZqwcSCJkA1jXvG5rzqXfVRp6Utv1oT7G0ODFRmRMaIwuFpuiamlR1J43xAQQEDlwvD9Nwz/8/d/+9u2bN6/LwC9pQesNkTqCaoBI+92Cp3AAIHcrkN3Uomdsmd2uuH+REBSxqzHYRmH234OACtUHb1/5stRMVebrHGL0RNJluV6v14eHh74zdzsHU5W2jZwj7z1NA0BkVrV+l3N8T8URm3q7BM2A8M/Z0/bvRge23LyTADGEFEMMgbS4Ak1VM6sZlZ7+XsmwpgDkcXwu66HPrRiYN5Ecv1qKmZSSVaXDCmKMwzjGaeCYKESKETkBR2PeDLV4SiwDIIXAceDxEC9fwpqPxkgxKp5l29hTNNmQkDjcHehwHA4P4/FuOh6GwxQi6bZcvny08vT2cPz++4e37+8N8v3h/u7tETkUMzXNW7lc58MQh+EOwEIIYvjl6fJffvfj++/0cPcwHIRYhzFO40DMDJCQkehhOqZf/fo3p/tDGuY/frA4BCJEULTP56fHp+Vumt6Mp4nSQYZfT+8//+kjbgmjHDe2Mn35p/MHyT8+XS4U3/zm4W9Ov17T3acv61rs7d/+48Ov/v7H3/+nn3763el0d/54vizLhqbAMUx5UyT4cr58/PwlpilA+vLz57uny3saOIbL5UxFP/zw8yZ2WS9F8+EwpciJkwohpMABiefrUxqOeYs6TJLmpRRWDAaOxagXgUIRDeBz7KAiSBaQCdCvtIkQDykNcfx0+fnp+nHOQtHQiWHUL0tHXBH0APTbFbQnvYh4Es4NFP61ROVf33Je19V1mWmaXF8gIlUDplrzqQIhQM2w6qGNjpmqcWBqra/TnBHQnc/YeWUi0o3G2A6j6z499PJrIrCLVn0i3p+ECUuWZc3ICxKNbZEtIrRDZFZ6zU25u4Us7CuxV4X4l7ag1bL0VqwhANdgNA87RWJKYZimMcXoNSgGHNKYYrrOy5cv58+Pl1y8xsdaEDtI6FvjU6oKO4jEjZP0X3nYHr+GhKZaivhcPLVdj1tuX5DHt23zCTyPHvaaeds232ptWy5SiCnnrGqlaCllWeYQwjhOl8vFw2lC4Mvl4r5XkXK9zm7FNdN1XQupf0/OOefsftg9v9gZAtgGZUII8zw7osFUty0XmcdxjDGu69qREXvXJ+5MxADgGm53ELsS7XeMvtHuxbY/bt0jEZfUvZ+dYohpVJGUhu5gBcDD4bgsi5OI0zCEkDgGNRARJAopuXycNE5pJMN1WVV0mkaHO2/L6kq35LLOSyDGYUAkKeJ5A9u6umODDC/ny5AGv4uVnCXEFOO2ZSnCTExsass8T+OwhSC5bOuWYnqal4I0TdOXz1/m+Xw6nYZhOp8vIjpNU4zD+fwIgNM0reu2rlspGuPgCriIFlFii4m3LedchmHQbV2ua4ylqb6VN5K3vG7bfhSsriZFbrOHeiMOIaJyJTGK6LKsMYa7u4cvX56u17nfv1V9vBqc+Hy5XNwDLiIfPny4XC4ppePxCADX63Wapo6H9nMvhJBznuf58fFx27ZhGBDxer16LqL/ih542I3Gl8vl6emJAw9pOI2HISXv7pdS5nlWKYjkMRgO2RfSArxuikgeASFgRU1FRYt1k5TVBEs17VKvqge40m78zdpkMEodHUZtQFG/JYiI4xNv214PR1Lrr4WJQkhI1S7hw8toRmZzts1IOYygxpjAApthIACjV4H4VSB+ffx129N2i9TyBdIHgpyhU8cDb3xWrCF11YNpTNRbUbCLroIbw7TW4kgE2pjDVjfJnkjgTi0CvDWzbsXQjc3bv8DIL3kLhuAQxhsCWAFJK6Ti2Ujgnonh/9igQDfghdRNDApYMTCKNJ348EZ5VCTgQOr+zeqlrUgKe7bx3h//nuGFAKot6LptG+wvZIsYtHLN+3jVE4cVPoamiiLByp2VUylXUwhpiTFjyIBiRBAYdDR4UHyPbCqfS7mgXQkFTRAzgCBm0wKmzru9zfyji5QAKgAK6k3Bat2ubwDeSA/derd3uLiXGYigY39NTSggWbGyyPwo188PR/ry8095mX/9q+9TjP/0T//89PRERIChCApymB7S3Tue7guEWrYiPQuxAVd+/VSgag5u51XHiaKhVQ0Db6p9fU2+QbzBSqz+I1Qys0tEUmfG+1Or6rZlUcGv5H14BkBsJ2k9FsOO07VboiEQNcmmXjC+czUAEXMFVN0pWHshMaKw5YiIAJKzAUIaARmQPBMIXhIznu20+5HdsKkvfSWwP127sxiQwJqbHRAQGCmQagzH40lEt20DoXUt//qvPxwPKTKcTqOZLeuilsaRQgW3BURmDuSGr1AoDrTMZd1ExA9Mb1PCUmP/1J4RKtWnEyAEYlCffYuRW4i89E6GIUxjBEghvI4y/QIft9y5Kl92LkljUHx1bt9O6R0d4mvLPAA5/G3XBIM9eqWNylTFpvcCCdEYuSVoGigiMDMhuYVkj4AgJCBn77eV2n9MVc2IQ4wDInKMmB097r6MXWZqJdPjHpZnPh5IL+iHt71DHVchX+CcsASBGdHqxGVTC9mj++oNso60tMYt7trBvQtcgRVVyHIspBQiPAxTGA+cBgqR0sjpYMQGpEBZqXKMI0f0NHBAyFwKx8vRdEIbOWq5AuQBKabR0iSHA//qO7o7KQ0pDTEmAXlc57LMhez+3d2//ZvDr787AstWSkymsonkrLrlslwXzXmLgRCHcTjFMXA63b3/1W/47u6e41gUWcvdYZr+/u9ArVzmH37/RzQY43igeD8OupWff/wpPLx5ePPAkTctV8k254BD1Aii5WkeNvxteTh9QtIVM6jgF91+QHiKJ7k/PsGxPObLD//64+9++J/+h//xN9/H+9Ppu7/7RyT+8Yd/+uHpcUsWj+Plouv10/VyGU/jWrZV4PJ4vX7+2S4zq32cZ7jCh8v5el4ey4dPc8mgRQvCU0zhcBjYKAaOgdOYKGyX+Q8fPyPZ6e3xLcdhfvo81bDHGm1IZiysGsg8ZZ2pVwjg4RU2gaZA6eH4Zoh/+Hz5vJSnLUMI6ps9tBo8oLVzYYBi35So/A83ssTXF6z3C10ZWfOmZh4n1ee7wbUAqu3Z1oWH1gvuCjD1Yhjw2TyBl57eb8Fds9/1Gr+o9+zy/Xy6q0Vd2qZWlnjar1uazWs4Iql+xuolNJ8XQ+SWqKFItCOk98xMatUPeDzzq0L8S3kQ+oQVww2eUG/RBAZSkGhIMcUUUyDybzUiKqCmYqaBQmCOMTBRDe2EHeMP4M+4BPp18mIxfNHo3JsyXjYfETAw1yk6M5FScgFCI3JBNuccY4T9JB+iiPryKKJO3g+B/YruZl5kQmImahc7ecR6jNEF5VKEiEOIDhpGrCGQOZchDTGmcUyuRXr8nTuiXMxyXe9yuTjH3HEBnbUoIrnkRv5Vl497mpnfTKiF7jhoGAByYx34CxeRlJIT0q/Xa6/D3b/su+/+tH4YnaWTS5ZziTG6JbmUIqJmm1tip+mwrMv5co4xTdOh5HxdZiaOKQaK56czXefjOA4preuat+3udBrScD6fs+VxHIcYn86XwHw8HkvJ83V+yvn+7o6JzueLmU3TNB0OXz5/NtXj8cjjtK7r+Xw+Ho8pxvl6ZeZpmuLDw+fPn6WUFGIGmK+zjjoMQyklb5mZc8brdQ4hmME8LwAYYzTDbdtOpxOz5ryZlePxKCKXyzWlIXBYllXU0jCsy7os67oVKWKAZpXLYVBVz5ILcw1i6INjUgrUgBNQqMOJDtJS1qZUmAce+gd0vV53dV3t6i3LsiyLQ0WWZZnn+enpiZnHcZymyUEl/vCTJOe8LAsRLctyPp+dRn06nfwN8dDCEMI4ju4K9/XCH26EH9IQmEvJzQ+nIg4apErWJlxziUzMA8Zw3bZiiqZgVsxUvVpV63FLbQ7G3TZep7pJoOZGwM1b58FEVSA2D1uuYclqJqU4M9v9EN2h7DY8qB1QZmJfvdxYwQCMGBBT3E5rWVXv1uF4nKZpOkyHASlEeKXpvwrEr4//I2jEVeIVMx8VVdGcs8/zdemNmUOM1eaoBqAInmfeJg89gMSaUbiF2jV1Cysb3rkSSL78P8O+Nj5FC09re3o1pFZ3+EYEcAcDah5R6yqltfFauw3v129W6wmZ/UueYq96c0JDZcoaoCIDBx6OEEahoB6eBeiwVGib/y4I23PAMX5l2moi+u0l4G188dkP+EdTeUkAHhqqCKjm6rBTnt29xSYH1TcqUymkehY5cwKkTKhIaEaqg8o9ShCJOU8gZ9KNw0q8EW3kLALN9YWDGZC/8U3QNwABoBZw14vFqn7ePiJoUXY1hK1+/FWmcSU2EClY0bLYNst2SSz3h+OHP/3h7ZvT8Xi8XC4//fyzmcYQNzFDxjDE4x2mCTmC4O0X3boF2PUaBPczg33LBPHsEFtGk7Wfq5Ph2CxELwwUePvZW0HtvoCcPWTcl8Yb+fAWQAgexdbEk2b9qVowwc2RfavQ62lhAOziEpmiQr0oChACMgaghFAMjYh9Tt2Hv7vLcT9U/s37QD+aZ1/Bl5DGvWRWs3GgJms7a5IQmDAylxhdnSlSVPXTp88//3y6O43DGMx0nqtfg8l3N0hMTSAmxAAUCGhRVFmdEUFIesOWovXIn36rQPNdv4E4io5MSgMUk3u+HJv6ja3O6+O/8bWsXmItia5HrNcZDPyW2vvs/N83RPtf2/LWu1/79iSoaDdAthZUp9DAVzeLSpMkIlTz0fTCrJK3LUsTeFq4NoYQiFDUPKrOwFTUw3aY2BNOEahJB4YtBc4MUHse57PL+euoyWaC7kQOqOqye5ENkbESbdBbaz1/tveUoP/Znw1b+G1tEVrXq/1o1FRViogiEseYUqQ0YEicRkqDIhcFU6xT1GbMFChECoiAQDQdcTzkdQkmxiHweArDqVjgocSpjHd4vNPpsAoWQ9nKmpdlm0EzBhpCOpyGYcK1bMNITFBKnreybKUI5GVDUSrIhIS6rRoTjsPp7bvIGOerLJdZ82VKcYwMRfOyLB+fhpimt3cM0dQQAtHhclWikgYEpMujLmd8mjPAmTeBpUw43ME4mA4GrIBGQZnARkrLyttT3vD8tC5//Pjl3c8/K4Lpu79593D38Ov/+//jf7kWRB5Y0/nLEjk+PW6fnxZMCGDbdbt8OeNcLoR/+PBkoE+5bMrrItfPZyHLUtathBAOxzEiEyACppjidLhm+vyIQ+LDu/s0MZRSlkcAIq8FfSYKSVVVQIHJmSc+3US1f8loARQYOLEex0SriF5VtLIgvEhzrCd5uqg+C7C4WYl7L//lNduoYqq2rtuyrjlnU4sch5Qix3rSGO4qk2Zq/4pl0ZVoJGtJwv1ExVvAoxOYrZWYakY1jHJvc5Jnacx1hM4HCapPooLQkBC1lctE5M6FUiQXSdruNzsBzxpK5kUsmHVApv3/4vR8ffwf9lHbGjWd1PYLSXC6bghDiiHEENgACRWAEQxNt5JzkVxg3fK6bKqeNkmNcvatsMedbeh5pgw8t/Kh/UVkWV1ysaZOQQuIUyeEAbgFssd2wT4rz4yQgNEDVp0ts0ufM2IaQsqVIOHSOcVILr92qLfLc678OnPmFiKHLV0cn2W3+vM7CsD7On6c/ueuULsqHULw76wGI9N+kIqqov7q+uvy39uZtv48fvxdfe6W4f2snr+u6ioFUClZSi8MnGDrreVxHDkwC2/bZrYdDgdi0qxmQMqRGBHWZWXAwOS/yB3QfgyllBhCilFF1nX1BlrJOefsB1YFcWaX9aUIMzNRbuZrP2ARceaGG4djiKUUKWUcRyllXVcEjCGu62pqwzjmnLd1M7UUU97yuq5OtTW1nAsAliIxmBnkXIraMAxZSuv2mwvoFYkMKioV94jWA9M8wvb5NBdIEfgqBBWJ4rat69o/3OdNdDCDUsq6bjEuZvb09DTPC4CdTqfD4dDbk3uIkJ9COefHx8dlWQDAwRH9fLiFH6o3RSqqyGMq/HwuZsgh1sC9asPvB4lIYqhZjSxx2Na8SQkIYFbUxMwAxYovR00ivq2wvoQXqIiJ6lRyFhk5E6uSJ+sCqnW228SNhZLFiv8uKbeURYMWSEzYb2ZmYIpmCSkwpRCvWwECtc1AETGmIZqJD9C8GohfBeLXx19VHfb61XEQwIxquvkt28xDmT3pckjp7u4UQ1AVv8IRDUQNxEOpXR3Gznx0r0ir70ULOcWwlbAiStVzgVpv5YrIvplvyTsAtf8sgAhcUTgOGez3IGx+pBayS1An6G86NRggeuPQ0YcGBlqklFKkqFaBWEqp4+veEwMwCnE4xvFeMAkGRUIVUNYW1Fs3E8/z8drYO72QHrAm3z2bWd7LFp49wo6gUlUVIiCgukPDGiOHCs4sRo8YVQuid1p+pYW1fCf6BcqPuHwOQcbjYkUMTDPKOul2l7f7bbsoXDAsHK4pneNwjsxMCxIibGaiCqDkWAhrwRjtlRqaqrTxR+rZgPsp0Sa1+4uto9xSii/DwJEgIEopa74+wnZ+9+54HOin+Xr/97/dcvnpw4frfD0OIwLmohjjcLyPxzfGg2ORYJcLBbvhSpdCkZxv6AfmnmWfJLVdFlydTbqdJE0W331q2PWQNuZXTz2qWdKAYCa6znPOOTBpS3ts50Cb1WknNmBPgfaBG0VVv158mlXV1IDQqDZcK9MTmbG2ZqBFxQIAGyJBAITIoihkIcTE7QLH/y1RuNfHRO4Ahn0Q0J+DMu+yAfe76GqDJqKAmDSOw3A8HB63VUWeztcffvxpHOPpbhqHwXSB7kcGACTkFrlHgZk5KFMCo1xM8qae1g1ewbBf82po6jFF6j11IgABVlPWykgVYsbEzIEQjAgtGCFVXf412ecXpRCrGfZOG3XmgQoR2rfO/Be6MD4Ps7pJNHhr8hjcbnG1gUpcMXXdMuubVTMQ6bvmGinX5gjBjJhjjHPe5nnOW74NHhgQUkopbDmXtYiKFANUVReyiANz0Lz5zaF4SCQR7MbRzUAQOODXF37fw/gGw/PzpFhL2O4DIWZW4akt/s45cm7JVPDlH5rLiZqgW2cNOyMVa6PQyc+mUraybW7qZ6IYIsVEceQ0YhoEWQVUgBrZPDAFYq5peMiJQfPnn3+6bMIcYgx3Kby5bgZ8VnoUK5sstG2GpiBFRCWO8XiY5u1ssmXbBAAgD2kIIVwuyzov85KlICgNNLBF2wSQ42lMeFh11XX78OnTel1yzhH14XT47v44MLCEVI4oeP1U5m0+z6thmjd6Wmb8aRtiHCOfPz3aFbNcV7OT0Xd8eIjDKaRomYiAoBiI2gloKvj0+fr0dDl/DMsQ1OT3//Ivn/7449Ovf53+h3/cZv3h41JSiCEsIh+Wn6d4yAU+XT5SgmFgXcv2ZQ5Zx5R+3lZDyGQQpy2XfJ2BsZitmyyrmVGkULKu17JtxsNk8bBsaRznGDY5jcfjG9KM+Vo0swrVsEMTKKAEYAzBnbVM4CGvhuYcpQk1sYYp3EVKHP54Xj8XXVTN7eAetuPbzNpN0L1U9Pzy3OuhCOSQeim5rOu6zHMpBQlDHKZhCCEwMQGhoamzzVDNyNSMjdwObFhnoepic5vyRjMwQqjwBqrhwIaujEvveFSkeNNwu7xVlSxPbRe57ZahQrrdeYW9GuxJP4iIIKrLusQQiRgRjKhfW7eObKsfvyq3XheyX9SDANiRKFjbd36rTIxTICTysx1cRzE1IFXdpGylXOZ5ntfrshaxIpAFxer53OyQAGpGtanXmy6+cr3QqV+sHS+St196kM2vGCQirMQVLVLrVZfAehgX7jh73qchDGbo5uNq2s25T62RUkqWt81Z3jnndV3HcXSrpqMY/IrrhIfmtBX/nlLcOkA5ZxdG96SLDoTtUIjeUq25ytAwa23v4AcfOIQYQoh+b3FprzTCQIwxcChQdkOr9bbgfmF3nroO6z+7j61zQzETC4KZFVHKuY4aGORcnK4TYiR063RZlsWPJ+c8XxcdjJDnbS45D0NKManC4+M5pRhiKqVsuTCHu/v7y/lyPp/TMKQ0AOJlnsdxmg5HFSklu8l3Xdfr9epOamJ2kLGn3l0uF49cO5/P67q6UXpZlpwzIuUtxxhjTCKaS5mYI+CyLEX0eDwSh/m6jNNIHEspl/M1DQmAl3XzhsGWs6pJKR3yW4oMQwLQUlTNU2nJYdA9Jwhu5oDbOezn4TNzAKLlNazBzC6XiwfN7XK5a3moKpfLZdsWEdm2HGM4nU5v3jycTncOneipdPM8+ye4ruvnz5+dUu3MZceb9JO/twH8KnSFWQQcolKjHaOxQ1sIPbhYRHywFYBykbxtmWgIcVuyzFdCA7Mi7hIg1VwbFyrq7fnOlzAwgKKm6hGI1e3geIgKRALQ2l6tP+3isBvUslhRkB4b3mhL9X2z4gHm1QcnRYswABNG5HEc5rLO2yGLKBDHgZDBqARL8XVFexWIXx9/3R11E3Gd+lJRvKotkayoKIDGEI6HKYYAUNy8itBBwfZcIapsAmtDe+4cJvJZOvLlsRJ40YAIvc8HhkRAXH2hXrcwYdWaFY2RsLahe1C7ke2y3aCaLQmeDRFXDapHjPjmQ0xK69+6k1gdsgxO1SE1NIphvKM4bcDqwqwIaP0OH1+uaQ/Y6rR9Lx1u0SHdTEr40rDWY71rsglzndPwjLOv7MVNkne1GRGQTUeVk+ZJ5R7CUa2ogPCVOVNQJBHJUkpeOa/jloPogGHjcFUdBBhAmJWDEZsBWjEyLGZq2BgShBhuY8PaaYHYlILbq2y6IdZCF6gGvIGpggJ4phmiSZFtTrbdTW/np8f7u7vI4cOnD4+PjxwCcpBNVCmGKaYjcyqKhuoyYmUKIPX4mGpeQzUloMZuvhV5HaPvJwmaGbmz7SYGVYgnPvNy9z6ofyYuCZGpekdEVUrOTgDF3gvo62U9ztZF8JF3N/6hVuZG13Vc5AIzagK3O2YNGAGBnIDtw7OGhgoiJAhiqMBmIIaEgbDiwFHpmwrvzi7S/RS2s2N3SswzAxfufwp2mYSOtav5Q1XvDYFTiuM4XGMUEZV8mZfPXx6v1zWExAQ5F7cMAGBAZk4ajJmac4ZCwJhGDksuoiqIYIjq7ySRBymqovMc0ZMAq2vbior7qDkQAGczA2e6IoAgw81h+vr4pXmvbh+q31Crz+75RO3eJgxfmYjh+QRu+x59sTfumeOiCs5yMXPSg1+nt6wt219xiFjx4hwCAmzrlnNGQ0Lqrkci8kFdyVK5DGpaNwUIRIBkVOWDnWxkePNGVY/j19PE39CVHBHv6ddY7wv1DqAVc9zI/lhXWr8DUL+9+Uuv4JmWeloLjcpG2o83alMHmu5FxP50PpXon1tgYOrMIDImZKK7U74+ARYCTQGPRgcIGchU5nVe5zkTWkj+tENKDw9vpjHk80/5SbbNTAMBSMnDkDz/lojFjI0GTgljli3R+P7+uzSdLk8/nD9dfvrDz/O8ieD93RHEBkSYUrCoiE9Pl3/904eny/w0r0psIW0KABgQB4S0yl0ZRuK7EN+l4dfpboIQqZ4Bs+SnXL6sGwxH2LagBXVdn/KaYgQ7f/zwlLfy9DgF3kQuRddSuBQMts3nL7AwDpd1My4ciRRwMUYKnE53A4KtWrZSLpLBjENkJoxoptOQAoVCpoWu83Y9FwuiZqr5w+czAPDdkNJBykaiTjrk4JnBQgatSW+e0eo1iSJ4xceEaDiiUiB8OAKinK9b3sRAAZnZ1KTcrL21t1IHwnRHIr7RuxrEH3IpJZd5ntdt1cbojDGkmPbE/MYOc/pxz9F1Mbd17nfdIKxnO6iqR0mZkVm3GHu4lzVbFZkJ7BA0LasAzUzajPzXcIxeHfXekt9SuIW1FnctlIIYAFDRwPESjQujjW1Vb2vfane9Pn4hArEBWRtoBGTmIYYh0hC7/NrRfGyAWy7nZZm3cpnzuuZlLQaoRgpYNxKte2iKSkjN/FGNE52Hht82E/Rv+YuzOGBG7VnQ1PyU7nTvPkffBeKdF6HmwlQprOUk9z+4tOfP4GKuW2hLKdX3itgJ4K4Iu5TmXxcRx8j6w7W8vaHHLZ/9r90Y24XgnDOHUHIupRBgCDFyAPBubgwhqip5vGxgzepBAsRsBFJERbt71B/9LtEj+3rtzex2YGuhdsxhYOYiUooQBx9KCDGq6LrmnMs0TYFjybIuGwIyc7ayzgsosGNqiyBJCKiAuQiFmIbISFJKUUvESO1sIY7DuKxPuZQ0jEa25aKqDw8P/i51uq6DdA+Hg8vuOec3b96klNww61+/Xq/TOCFhEUkxjtOUL+dlWYY0IGEu+TrPzvcpYsyIREU1GADium0V9S51StONXI2YwK40kH9kNeiscrOwLhwAiNYw+D1GpZdANdikgH/68zwvy9LV235n9U9n2+Z1NQCYpsObNw/TdBjHcRxHxPrynSZ8vV69C7Jt2/V6dbRItxg7oaK73dtaAKVUqvK2rduWPbmRENeyGmiMMUAopYiqd4YUVADKuuacQ4qGuAGc14KmtUmpDuIorur2688hGz7dpapFzODWbFLzwfF6YfZoHRX1qOU6C07OVwQFAiLmcDPqE1mjbKParf2rIGBFCwggyFXV2AwLxkRpGoaNIIBiSq9r2atA/Pr4q0vEBgZ1fJUDmZmAFBUmdsXWs8qHIR0ORzXlChqv1iES1B4BprXkVjRFU09Dd/tF9WHcoK1goKAKWqD4QYgCYFCKCuyewDp8VzeebEimoKpMDuNFIq6x83WGwcuIankCQNW9IwXBB9BVzVTcPdxul6YiUswKVocLqKHxwONdPLwtfBBDnzE0AFGp22MjBFNQ8Owe99EouA8U+1anDlZKR2x0JbXeZB3bi9V3ikyQe01mimakKABWd8lGCmZIrCDgDizkpDnMT2MugGEkZuaD5vMiOkwLTVnsvNmXZR2383stB9PJ2CCWtcwh/1jmjIPpZPFgFAFUWYBQa/8AVY3AolX7nIt0xBj8nJFaUTkZwcx6gKmR0/6UiIhZsSYEIBiJQLlEWO8GGsj+03/+p//5//p/Wbf1p59/vi7LMI0KcSsWh/swvKF4p8ZWxNQwBkXU6hGszLMKR0IEIGZ2ngnU1FTQdkoQWqUhVnW4BUE3uEhtMDTehJgZKFnHTxARKCA7ad/QShHZimautUkTUtFxoII+1mfgQzTWKujKoUZUcD+EvwYBFXQfX4P8m5maYEZkVlADj2NHAqr4KDFRK2Y4BuZhkccsG7LFGNTUWt7WzbJhSv0IvPRhbO8ivPBwqWqlmYAZgOf1VYODcx3QuRrobEkf5zdVQkiRZRymw5RLARiXrB8frx8/n4kHHVVN6vuhgMZGmcKIBAxA7UrgmEKaqJhsq5hYY5QYoCiKmKiIipkxASnKLfFdkfxDEjAUgiweo0FRzAJQjQ15Hcv9RbU8XyBQ+nTB3hd/U5Gef3Gv9fTgqfrf3q7Bvsfo7JamBQMgMfq6o/3Je/cFEM0nZvyQVEVVCIk5blu+nK+lSHK/IrXVARmRRAqiVjqNY1xaUindxOFmoFal6GqXGqKa3y5gZ3nE57qV7Zyb2MbffdITfMYIGcmotf4MDZH8FVMbf+/xqfWdJyRD0Rro6XcpVVARQUP24FkwKXldZ14OkWIgNi1kgVwfJozI4GZKdA4s+YiNkoXDdPj1u3gO6Xo9LMu9lGS6gayIawx8N4zv3wKnFGIEAgUzW5Ylb4WB0DDP6/XycSvb3/7D33vEJaExGKqxoa1y4Onf/vb/9O//u/+e4kgyBpl+9fC3T5flTx8+z/P25Zw/fPwZpJhWyqQRKiTAwT9nRAXTIgYGb2D8t9P93x6Pb5gSWBAkUwBewR63/MPl8TFnjANh3sq24raZkBa7ns2siInqf/n0+P/5p3+macwgZiUmng7p9HC0ArLh/fQuJKaURG3j6yny/Uh//+vT3RQN5D/+8GMhWVIIw2BEohKDJcJtlbIBEQtNRQ/LNm0brfP2s3xUlcBv4jAFO6NaALVqzFWv/wxR632Y1BTFgMBHScUUEDHwgByKBtP4Zoghly/L5ywbBqVkZobak41voaO31Nue/Fa9hGZWii7r8nQ5u+7jW+thGGKITIRt51/F1opIUTO3H9YrxlN9mhZsYEYEHcsNCJ4e1UUrz38vWsCMkfqxNclgP4kPDR3pc9V1HO3FJJlH23cNqNafO5JG+8Ga/mBqYEK3wFhUdUH52UXtL/a13/nLWcpUTQTMAJSQDodxGtIwRiI1WAFAO1Kegiou6/r4+PTpvCzZliylmFpotDXyOzBa923UyCjE1gWxv7BJ3CMp/IqkmwPxBb3NKzQ156CKmGMEXnRTuoO4f5GIYgRV2tbsd1RqoOGKUCAqUoqI2zD9Snfwq4NcU0oAWEp2kaozHPwPRPzm7Vu352/bBgCdn7Cuq8/4O3sBmsnUDyy0hwfqDDH6tlRRAnPgAAjLvGiROIgBrNvms0GquuXNhbloUYroDtvolOF9se0H4H7njh72Q1JVgMFVSEAhgm0rqpqGNB2O67LMy8JGbgwnZENbly2EAIaENF/nYRzH8ZhzLqprkRBiBF7zBsTjOCKV8/m8bjkNKU0HKeW6LHd396c7PJ/PWR5jjCGm5XoR+Xg4HO7u7pzGO47j8Xh0nK4zndd1/fLli9Oct21zdd7Mtrz5zc1Ax2lEgsv1ElMkpjzny+V6f/8Gmc+XS0ppHMcQ47wsapZLqReElE0KEZVST6fAVHL9FTXcXsRPDPKMlpourjV85DmwqL/5IkJMaOhNhaenJ385X2WiekacuSD+q1999/Dw4I4WX69yzqVULofrwpfL5Xq9btt2OByGYQCAy+XSjcbOknYSsUgupazr4r+tlKxqwzBsmwIYc1DVeVt8WK1FtpICyrqVdRkCB6Lz9ZoNwt0dMTHz4+PjTz/++PT0FChiLaqab6vOJjvPjzlxEyoQoY/NtcvTaqpPB7nUNmnrdSAy1lDK2tixZoFXrbM8YKamIlpKFpEiknPO2/bhOj8u149P139YSuBRlfImd8ep1M/99fEqEL8+/jrqsLWJIaszO05fIuw0XV8gT6fTkBIjmZaXgF37qoSoDSawXX6d+Xh/jdBRaIA4UwO1FwOGnXRDu7GQmqNJjiGuv79laj4z2Hbw8deNbrttSOpLd3uyqpjjehpm2RAppjSdIKQbPGNHfLMakOUm1j9r4tjT4vq75GpyKwStR741JEcrGtqOyaVMtZsAidRYmPUdNhGxvMmaAbIQcYqHGI5K1yJCEny+08DhrQxApmBCtinAtMqUbDHOkHKMBIygSFTMzWDVkGpmQM8cBvYCWtv1l87cqJ+ly7nYXWoIACaoEggiIyMcj4fT6ZQ/ZzMj5EBJC2bFYTjgMCnHrGBgbMqiwIZ1gwqwI/Eh/kXxCJ7h1fYFq30zbuOrD3H/9xvqX9Vq8GAPFDfYaSUehuDZeHs/kV8VhLcf8nOSiFz0hB2PDMBMxXe+N1CJYWN2g6gZkiGJmZoJADeyNwJ+fRLCDXN8y0Z/cd42NnEtHkzthWvpWzsL7DqRl/gppRDDJkVUl2U7X67v3r3NIqFgKUpUNiocJOSScyEqAKjUySFIDiamzQQqQwZUDcRADVRrlhEYGkGDaFl/T0UNSiFvefnIQTBA4u7bf338Ypaz2wagMQ0qxfZ2z/p2Ms+fx7Dgn7mn9BK6D91+/Z3eO+mLoEuv0Fqp5HRCICaudieV/c0HiZh9QMVuVyEiMXOIzEG3teGDqzpudmMkN/fls9vY1yzyrxivdZtAXEPyunYMDSz8DDFTpWw1aYGe+Iyxvu83tWli7Lc7LSLLso0LhAgUKGaKQ0AgAgE0JKBG/a+3WETwXjFQ0ZT1lPXOcDLLKhfZtpCGwzQ93MM0ZQVVKSZWbN3yNp+vy3YAQw4UOAwJAgJiGoa0lW0pIRCIRaa8ZOQ0xAgCm+S74/1/+Mc3SPGnj5//87/86//y//yP1+uWc64xhByJgtWUUyIEMzEAMmDVweC78fD9cDwRB48CB1hzuW6LBLoqXASvCgSg67aWbYYtoy6gl5LPuRQgAxCwQohagGCaxuNxOt0f3333PlAEDT50kkWz6GE4jiYSdOXDMY5DoO9+Rev18qSFhohMAgVgQ9lQhBSIAg/pugR9VG+eiuZ5mZ8u430YR4xCUQzEYMslMnS5thKqG78azKiCRDw/zu//SCIj2psxvM9RrvZ5kwIFbhMcZn129atSrVsO3S0oIrMTh82YOcY4jqMbrKBZw74pbNWngn0QI9wCL+wlWx9q+/Rl58SLH/1WU9HlZmcO38bSXt5V0KOrukbs4+0551w27UPrvbl0O3LYv4oX6287Tni1EP/CljMACDHEwCGEcRgCkxkUNXeUksu+imsu5+tyPl/ny7wVLXVvIma421jtpmr+d/ZgX5yc9o3YOtsVtNrn2Z9z8Pdnb3UaEvtLdsOvF5COyq1mXlN3X9a1tbEa/PtdYEUk1aovO+ACEVNKLmJKEAcv+G2kW5K9UoUdINh9kN3te1vtiNwA4eonGBBTNTMZAMKQkv929592r8n+ftJbWS8gG/39cY3Y7w/9tTj7IsbgjSgR5cCu2Q3D4CVEY+CSe2ADB2KSTcwsBBYppTT+IcO6qXtm/QXmkkOs4XiqOgxDrGo4EFFM0UrOJfv7ubXH4XBwP6yL9S6MulXWScfDMPjn6Fr/tm2IGDhIEHcfu3LasxC6x3zbNg4BAFSkAh3xNge5V2/3AsKzL+5DyG3/GVI/hazdz/2A53n2I/wLmokfs78uVUPUeV5cgHZp2A/eU+y8G+HLk59s3Zbe/gAh1KTEGFNtMIqYediymtkwUEvA45w3z05EJGKSUkwkHqbpcOilY0ppHAYViTGOwzCkiZg4UHBKRZVQKizMwyR323Z7sQuuI2PtsPf1LfbxMa9OaQ/zqKOeUNFkXiIhs8+++GxB3pZZtuXpuv7pw+d3dw+JAwGEgFFf1cVXgfj18VctQVRFwMyAAyNgKSqiSOheBBcEU0qn4x0jw01M2wUZtLH4ms2FPhVV/6cqZNjqWny+C8Vq86gYrJpCenNPVGo7ubuy33GwJeM0xfbmdOwp8A0sW0d+n7/qmhRaX0iFS4i1jCA1UyVlSnEappNxVKtapCN46Vb9+BZJCMGe77SfLzBme9ppBW5VopVVKJ7ZSy5+uwVXNRABXcNWb/ExajWQqojKKiVnKWVDQCMklITDQXG0LCFFsaCGiqAIaggWDMDEld8T8cOmGWKGsqIyElAkQCan8qIa1AEtusmw2JHOLz6drrt156qpuo2hCceEACZa8iGG0yFs63p/fz9N459+yiIWOQaKVxHjEcc7jQehuLkrVw1ACBkxWC0X6oRqzQnfgQ+6gukUkl1B8ewz6qGBzcNtz3Z+VAfGnxcl5oiJhhxsfOw6tHNbbaGxql+cGH3atKORDXRX/VDv4e61bD/160loNYxH3Y9vVLFyRGCkiIJuFHk5M4g78BZ+Q/nCF8UQNnx4b4RgV5TxWZxJs3DWJ/GyexiGIaW8rVpsWbfHp8uyZmbcinARREEsIcqaC2+bW1o4NqIHIMcUUtnK5nhUrOeVn1AMKAaNY67KTIxUQNDdhmrNN1AT35XUjJ1N6bv914XgF7Sk1fPQ6/92sqMLtYDfvkV/fdf9eqOOO+IwtGHDfkcxMHLoDT6TTzv9xmqoKBoBaLXp1ixQQg4h561bDttvQULkwCEwMVZnVhO+Y4wpDXmeK7q8xcTedPIGIer618uuD+K+EKgb/tsOv/90vcVbNQtjdy7W53S8gN+MaiomWH/d6q4mv735BqnfK+sM8rquOF+MGJCII3MIiEzIhEZg7DDW2lz0t4DVYFO8boelvMt2b4hgM+qTbgsEHhLHUExVTLYMomiUczHAmBJZgIA8xjEeERGIkPzjlWGcANS0IJpqyVsGn57BgMRb1pwzIOSSc8lFBQERAxFbCI65YQppiEMIZVvy9TpYeYvht9Pdd3EIUkopm5oUWLb84TJDiivYl2JPorZtuskq5QJlQ93QFi3XnI1DSCmkOCQytBjx3cP96Xg8nk53d++GYQo8zMtcREouRWyahvX6pJAvPCYcKY6/+s13MJ9/On+CiBRAqQBm0E2PRcQUSGm4zvjpZ1gLn6/l0+O6bfPTZXiaRsRhoJHU2RKFEKJUToj62udIbLCuvzrhpeIb2NjKAPpmoL/REQ1V1k95M05Yk24UCF0gehYssJtGdyqoj5OLqnuj3Fo4DEPVm7Q2U/f6C/TzeL/M7696MALyUtNthmrWpoewcVF1V6/WnrzaLQG2BzR2ddgzj7W1gWrkI6ALK9M0pZS6Q7AqJms3DrfrbqfC1ci9Xqi02efunXjtdP4SlzIzgBDjOA4xxsgMWBlHBqSGKlCKrts2L9vj0/l63fKWFUmRtF5RSEYtLsraDNj/H7IM90rcy0WzG0iwba6k7raswSL2Umn317f8c2MKKcbiQXxcRVJnkRERJdq2DZFiDN46CiG4bz+EQMSOSdyjh1XrzWTbNvddvNBnfRbBJ/09gK5f/h1W24M6aBeeVcf2W7SsV+tdfNznzvlTiZQ+nyQiIYSaQtaIDf2e4Be4q+FdKe76r5srEaHkbKqOA95a8yylBFC/v2+HRYpq3A0FoiuD/tuJKMS4bYuDg/0IL5fL3d1dGpL4qIVqTFFUnJ/rL99/oz9PNwt7Py+m5CZiv4U6S9oJ1Ou2TdPo5tmYkuvx27r55FQpZZ5nVXUxuvIfTRrW8rbH12+1FSv91isVoorWNh+EhR4b6A170sofQ8IQwjzPl8vV3/NnhpfnDfX+4XZYimeRdh1/XVcPu+vOdADo2Yz9SfzS8I+vfzTO3faMPsTsCj5zcD3Xmwfruua8uThLANMwDMMYQsilGGCdYglBzWKM9/cP03hAAm7glsZsKfVNaOKGPVeH+/aZWtBiX1j3/QztZqiv8DSIqOpJmz7zCj7QU9XDoKoppZiXNM/zl8v1D3/6iQDk7QPSNLwKxK8C8evjr1uCOOu2dc90W7MUQSQF8SEnJvLY1i2viJGhNfHMVDuNQW+7Z7wFyUEfHLztsBHQ8zpgfzPSG4CqBZe0mDvGnZO2HfYNvtvsFWqKijUxyGcGK2Sg/npX8fbKuKmAiSPjat4OghmqoSIDJR4OnMYNUKtQRy3Ls6e3o29ybK842Evrme2ECtjnrpjHpGCVpdvGAF6EJimgJ7M2R65LrlVBVBUpi+RLKbNZAmAQU9QMWpQDDClklKgWVFkNFUyahqEGUBj1qOFtoZXKTOXMhkRkIRiEQGIqhoK4EgiDgoIqerIMAQo+DwSvp8bNoOMbGM/QgJ4KZh7JknMeTunu7vjppz/dv3m7iX55OkvRGAeEuBXl8U7TJDEJsQCyR8qIgBN3q4G5ZazBbWL6WdhUy0jqnjpsDevO3n2+7LUo5hpoqFjT6CowxMz8fWicT21K7zNTbe1ltAKlQwNbNVmraHMiSY2IrRCSqh+B+TncN4HUncNWXcoVTgoIiKIawJgJiYFIDELTsJ4L07hjh99UrP1Huav7b+SJHWO6VU7PRbSaF7z7Yh8EvlzOapaLPF2uj0/nIb1F0BAM0YisFNm2jTkCsgFHZCJ2fdsHDTmkkksluyAZMhEBkzqkxaCUIjkTQUoRUNkhpn7EkXplKeiKF5I6CuN1X/0LemB3iPQr+oYP7ldfn0l8YTz5mj78zAb4rBPW80Vve0jARihvQN6+2rSRO7xZiQE9NYSImcO6rqXUWOh64bS4Rjc0aVHrFn7ENAzDMM5tKvBm/bDbMavWwGtVo1sw5kvKxLPBnXZLqlB+H27l3m6rgGMDReQW2lmzN5E8BxTU8+nall93f6jCmfZmIiKClLItC7Hj+dwxVOLhyHFErmh1Q7YaNwoMGMCkiFxmnrcTwAlgAVsCnAUX5gR4nde8qQJJLqAaKIYYx+PhGDa9XJFKGMIU70MM63Vel7mUzAGPpwGirV/WYRxM9PPjl/P1CmE6X9ff/+HH/+8//fPHL4/F9DrPBsqEAMCMSCYofeVIw/H927fz0/nzvIwYfjUcv4sjlbzK9mVZrrlIoS3rp+VqJa5mX2SdbduWYkU3sCvCCraRKaMMKaY4HqbT3fFwmtS2QPBwPI1pjHGUbCuoJDsvGcxAzMCmaRIQkfzZYslhpfibd7++H+dMg0A2yFnXOOI0xcheAagAlY0f39l5tc9POf54fnzMhrAoj/GwyGzZAMQUgoixy/+oBmKGZqHGFNT8iQql8q+gr9k2GPxqGAIwG20fz7Os2Ugd2189AX2MCvcOss4YFVFCDCkO0xhjdDtVnwPzK7l/pe7bb9et3QSyip5op7nbI5pTr313rVm6SFCpxC+t9+DspSaXQNOFrbscqg7s87iErkMNw+C/UU39AioaocElAEFElLRncwER3YIn2zXbaupm3gLEV1zSL6rXWW+eiAYgTvYFAnBRT9Z1XdY8L+u8rMuyFQGpMYt9NnRHY7Xb6dNqVdy1TV7sVP5C93X3k99qrlt7dtiZYYuUvS7WV96+2LnWVkoxVQzAKQXsnsoIzdPaddIYY8c0lVJKyboLVyXCLkw3f4rssrQ71bfqs13SdUG2347673qRxrH/cReU3SVNwNDG6lNKe8axtWAxasneXcrsAnG71dAL+Ean1nb4sqo6ncDhGF22dm+1/4hbWXvqXVd1XZd0M3IIIec8z/MwDCmlUrZ1XUIIw1ApukR0Op1yzlveSt4O45BSulwv1/kaYwwxFinXZY4hhhi2bdvyZmDuI+YYiJmYc8nNzS0hBiQqbVJ5y9kAwEkL6zqNEzKuy6qLhhhEJGN2qruZIcEzaGT1AqBDHbG9e5623dISqGchuahQ3wRCQgohAIKKigoSAdjlcvVWBCK493xvfuofvZnlvC3L7Ode6wtqf/QYRj9DeiMQdgSzToroJ8m6Luu65ezPWcxg21CkAECModvenVxRSgaAdd0eHu6///WvhnHMIuu2Lcu6LDMz89N53dYQ4zQdhpB2Tca61Lpc3qpN6pf0Dq+E+zHWXdH7zGaBBn31v22ym1jsY3O0S3W+DZOBEdE4TsN4SNO6XM5/+vxFRDbZAN4dp/S6CrwKxK+Pv14JUrd2REQpDcu65ryZ+tXsKpIyMTOLyuVykZLGFIZAz0ZMm3y7c28C7fg9O3ajizFI7nk0ubHTDOQW9FbT2qibPfCGnAekmpfpobyE5JFn1iZ5HM9ecaX1zq5qLQ2g6VdWQcQqxVRMnHqMLhAbR05TSEdBzn6gbVrZiQGe2INNrTZRZyf0kaJnd09/VX5jbQpjx1YSkbg1smuLCEwMAExMWNPWPOBFq4dTTRV9vVMpJV/zdkG9IEYAFkGDjLaBAiSOwKBggpJRC5hCJWMSOMRDZFC4k/CkMpiSq5liQeGUSNRWsxkREwMBKBoAFFUAEMVK9Lspnj1kpvlJAcFRyWBQ2dWIHi6cixSOxziMq+r9u/eP8/Ll8QKGMY5AUUAoHiEMgAGMGCgAAYFbAsCTkSveWVrTvg57ErbUm/a23yLJ9rhNImAin1Yzw2dyZ9OV1GPLW+HbPDz1e2vZ13G+3US1u0TULdPf7NGAt2nQO6t+iYgCE1QdWmqQ3fP9n7heowoIjGYogBoQIxOagigDOP+5Qk/teRz8C0P/t/aWXQIzBake91v9+i1p7lm/vVsVWkwzI5GYXubl4+cvD/f3phZYCJVIQy6AhTgjRSQhNgBFQPMdOIXAceOgIgZmwIYGZAjAljzKZZV8vl7zuhwP05DiMAwhcEW2EhK7S78BwEFJ/0LUyuvjv0Fx2DWYZ42heqlXvfhWyD6b99wbgvY7QEBUv7E8/4beBn0xE0J1wAK07cl7m+/FeYa3n631t6rN8zIv6/EkIYTKIUIgQke7ZZM+Q84chnEcp9FXalOXrmoeHbRs2NZT7QhU3KVU3676Nu3T7m0VfOPdLW0rJmNFtHf3ryJQhTMjirU0rTZaU5u+HW6jHuGHhMG7SJXiihiRyQxVTIqWdV2slCJmaZRgA3IgjkZRLWibZ0RkZF5UZi0roTBmo7NRGSYdRgHCAkRoAEMIRBgohDCMkfMWJDDbxmDjMBTJPgqaUry/Px2GCTZ7KjrwSJaylt/98EOaHozSh8fzP//+x8+Pj0A4jVOII8imqkgGoAxWTNUMjfJ2Xa4JTLQIGh7iAKIfl6dF8qd5vW5SsuUiG2jO21XKWdZiYqilSAaylJh5iMxjGu8P48DTFI+n6e7huOarlKLrts5asqZTvKxPKpd53cBUtrXk9enp05v3b7YilMKl2FYWfFrCEO4efrMsl8v5y3zeoKT76U0IhcJGKAFQEqZUwnkbDsMwnT5+yFnG6fSGYCu2AgDkGUGTgUnNWgBsGjGgka9vhkYmhl5DEAAYMhsAGxyZmGLAMF+WHy7LKigU1fHeO2yCiO6zp9yWi4ghxHEc4xDTkPqWu0k5t87z/sJHc8w3itShFvPRdbNAXP9+mzPYLYUGKoIN+02ILUOvIcVtpxl0TblZnpvibX4PAUIgdBugi0r1pkBefKnVbKUGQBPZcu5V5E1LclMcmrc5eef0r61ZeBWIfzkPVSsi87L6sP9hHCkwIuUi61qWdbtcL+uWRU0VjAK0AFViMkWiWwrjsym/G+bb6hgj6LeE4K+/Yl93T79RN1o7K30NNVNRE+ubw67P7tdTFzGxovu0T+W7HRXRxnFo3gYchuRQYEQBSDEGM/E85BijSIgxtJuDiCgzDUPyTBrmlGJyQbnnibkl0y29rsE5vsYtn52D7D5l/4q/BLdVuhqIiMj0PALhZjUNIYzjiABSxPE4+2mhfjdruORbhF13bvqv87uiP2Hv9brnVFQB0QkP3oLyt7drx6WUvdrurtWO5vDBf6uxIsxMACZSAGzd1mWemXBMCZlKKYA4HQ7MPM/ztm4xRkCc1wUA7u7uEPF8PoecmdnQ1m2bxikOKecMhMxctJwvF3+NRYp1CAqCiGTJqhopiopmRXC0CNaxPw/7ucUlIph43IJXf7bbvTSk483iWjPXCUMM4zD6KbqsaxGZ51mkho037F5/shvUgojMdFmWz58/xxhzzqVI6wtaf8NvZ/XzKFQ/pX1pSymdTicnbLjW7/iIZVm3bfXSy/0HzkhBREc8n89n/3XLsp7uTqe705jSfL2o6vV6yTkP4+DyyDiOMYavs8e9i9DnZXG3AO3zyffOIYCXfI/2pAbY8wARwG5hMYCIxq4RQEeIoJp7F2pkuyGHNByI1svjn758npeLSn73cPe6CrwKxK+Pv/K2mhA5BKJQykWrAQq7BZIDe490ns1EA42JA8IOkutOTHjmMGKnmLsSCpU627U53150DVlU3XAMAIaozX4Bz0eAUdQId3p0jeSxBpns3tAWQt2b6J37693doiotuTSblgqXqJgIFAgUD3G6D8NdhiiAAihiHhLHXvZQdUq6G5o6YWsvk3k971VPrxvqOrgPONqNydT7NbYUXzcus4KJ1BCSmhjmzEcFM/Fe3BPRBwRBjD5kQmENaaW4EWa0BAWgMAqCOAYY60iwS9AwZh3ZUlQ2ETNSOQX+jtKqdlbZEIwZmNDRSaDV2+IugGrrbMtoTY/1ZQPNmsAKgEDNUmaqggBimk1CGobD4dPj45pzCDHGOGczDvF44uEAFmoEFPi7gepqhSJSf5efDU2rSGcSdx6Cy4X2fBtJ7fNiRN8LGna8r92Eofpx1vmlJtNayVlyQWLsLkWzzkHZ+TS0dVWxO83VNVBvbXum3m157uyWeo71Wr9uCA3MBMSna5VZU5AEFAHI1EyppbDbc0tvL+PRukT97F/3o3++UQFTBP2Gp7JXDF193pE9YDeP77kT6s2Mef30+en7X+VpiIELAhswcRHLSIVYOGgI2ukqBghAxBGAgOrnZQYCrtxzQM/xw2XN8+Way3YcppxLGlIMIUQqgqRQmzrt8yBVQnpFTPyClrJmptv7hes1xLck9J3I21mht9JZ1TrAuH2dmhbz3EbxzFGyhxHDzbqFzUBYpVY/lVVKdRWpUimBIyI+Pj5ezuc3b+7HYawWDOcTB2Ymc/m1luEUUwwxqAqYeAJce6X1qO0284r9vvJCCLu5ynYNK294Qg2vLSKsgBpQ1QOKqnJl7fb2nP1eG8J4GzZERAABAwVQZAStMj2gzy4SIwFR86oAgank9fpYtpnTEFKMacQwGSVFRiQlEqZwmOzt2yfLv8/LFiblcDUVLWmg0yEOUzDCsq2JbCBT1fmxnOeZYRl5GyKUbfn84WlZl8DxcBiHaRxSQoUYGO6nzz89Phze/93f/cNq8T/+8++m+/eaxvvvfk3jIQ0pcijbtly+5OwB6ygqqEYAauVyflyeziCasgZO67r+8PQkellFHteyZC1qAJBBN5UVtKCK75VSSinZMNIw8DSGMQLb8YC//e1333///u7h7o8//fSf/um/fP70GChNJ4z3KGBfHr/kTRAQNGtZr9enTx8/xGn8zW/+FiIvIttPH0IMKYYxcIxv3jzcXecLw1vZHvO2oW6yrJ8fv/Dh+HjNHx+3L48R6S2P493btxE1nUa4fMmff7br5wgmaOzzTIpKCIZoaApKvm2vqYk+FeYjIIDkjfcB4G0K/+779+Hj5+3D01kUkKQuZZJbUs+2ibUwPCIapimmIcQYh5G5nmp1RX5+xenzBU5USPlWJgKQTyW3lap1QSrQrOsydUtsz0iXz5lhCshwq4Mdpl1yyVKKiLY7A7ZYOyTmEKNzTkUEyQViU/EJNqt9jybr9MK1euJ8S71vx+JtrM49Faavq9kvamdmgLmo6mYGhCjqRst8nbd13bacfZHr6DiDmnldE6GlOmfsWT+jO3ndYGB7Se3PW4le/PUbslG/7m4DATW+WD3wHJtY1rd+fVF2GIIahBBd63OxL+e8LEsIgbn+1pBSh3d3uVbV3F/pVtnr9TqOo5mt61ZKmaYDIuWcty3HiITo1trb721AWNdneyOny3l7yUx3Ew/+cKq4gwKQ6Dpfe4pmv4RjjAiwLmtHMXhVfL1eXfDda8ov1PO9It+ABtJ70qp6vV5rOGeLX/dn8Mi7dV39ntMdGyKyLGvOZRyH5u0tiJ70CcuyOO/idDqJyNPTU3/C6/WSUhqnqR8DIS1luV6vzMxEZlZy8b3Ftm0xRqZ6VI10Iaqa15xLnqapfyXGaCrX+WpmoHWrDjtMsKpn3demdH+j9gZwzyktqowYQsBmu3ZInivsfo56MsowDjFGQqLL+eePH8+XS82b/aY1fsf+8jzS8/m8WyBwP17ZT6f+6JmEfeDMIxaPxyMR5bypiufoXi4X/8g6ejsEFpHL5eLwjfP5PM+zP8PDw30M8eOHj+OYVHXZ1iIljUMIgUMIKQIAI6GimbYY4V3mURtrM3gZpPFiT/0crXbrpBoYAeie21TLv52RQlShRaCDIQHfXAsgdWgbOIbxeFxn/DSfy7/8y/vHV4H4VSB+ffx1TVeAiBQ4qImIyjPvpLn7L4RgaiKS8yYSDLj6Km8yUIcJaPf/1om8OuCBirvULp8bvw3ggCGoAUN1narntKExYGcWQB0ifB7y1YYZbtvTNtvbmfe7PB0wM1ERabTHii62xo0ABYQQw3AIw51xEmQBMzcp663EwgparNmo2BLk2ma5eotfTOn3TXi3n6nIi5g6j9sC86R6NDAjFAMF8X/ARoYUKVi9aiCIT4gfmEsIyYyIC6UtDk8hXTFsAAEMURHdsOnMinqIhATGZEhmZBIsA2IyeQvhOysXyaVkDBGsZpO669aszo2YKhiomhXB+mxW3TkOP/DFoFmuG6FETIXQXHAIzCp6/vKookOMZrCuK9IQ0wAcSJEFCQiBDBGYFNTHQBFQXrY0rWbiATVYdZPmAdsM9c011M16SGSq7YOtJxJVLjHqbRWt2YnUtGMRr5+e1xXYxBZnAFfjOe4EFQejiB+ndQhJU5r8RPa02IY+tJ3P3lvpQiasElBYChQy28jETD1t1zjsq/ledfV2xJ/bBOwoh3VHzQhfC8QvSNvfMEsien2cUlq3LZdSsl7n9TqvTBxYEYVYchZAKT6rVX1fSEw+aGmIxGw+L+a5CoEA1MgUtZOuXOdXgTXnoppLiTHGGELkGNjHfNnBFSZoxvSirfP6+G/5YaagBHqjD+8k4n0MaCeUe58L4AaQqfMm5hrQrYSG59kmN7b51/Di5sl4dn3cZgpa3JxbCMEAITAxUy7bltdSyj5PCBGYmSOLKXUDL0IIgQMrKIKACaj6vRkBtWFrrBEnqpPDG4t2k9GbcgwtM69yoQARpQJ21EwNVVQrFVwJq/ke6nrU3s4d492qb1prPIHHV5uqmmgpKoYAVOeBAQkoGAUDAvCwbQIE0aJZxVbRwsmMBCkQMYaAlAxDfHhXIH94+rIAjwPxAO+C0RiHqQQ8z+c5rpf3U3hzCMj2QdcfHj8e3x7v3sTjwVQ3yYUUOWCIzExikq8rcAoBWQuJ5GX5+enL73748Y0whzGOIy+ziJZtlrzlYgAMCFpEBa3mA1rWkkthsQTBrFxtLvO1yAwI2VAJxEyJikFWEwBjDxAnjlOYxnA8wMAWCMkQ9P7t3XgcBfTDh48ffvpyfZJ5AWYV3uDpihQ4cBHdtqy5eAUjImLrxw+fhuGQOILxfJlTinB/nKaR00DF1hUOx7vr+Xo9rwh2vXCZYZa4LpCFEFHzel6uKUYIh3QKkckYluvHAQoYogICgiAACYCiMhigectz1xI1BCQgRBBTBGOku8PwG717XGY7z4+bbUpZRfO2iYhZUQOgyCFxDEyBKabEKREzEiHWBC7Xg7G3MFvx1COVOuyoexdtFwbgFgGq/ZM69lanYtuErC+4xN4VgR7Qi9bb/vXVur5cpIiUIqUqXEiqWo3UBIyQAhuCC9uihuAkjeJFoN9oqjlC/dLxBjZSvV61t3O7ixn35eXrUvZLWs1qVeq2d50XHz6XdSvz6jFWhux6DyDViQ7yP9t+k9SWtmewpO6RBFVomtEtr/hl6/X5kf0Fq/recHBjkz0fzuvqXj/IPSAiFwkBGRnApdXUkREAYFsuRUKoDVyHuridV0S3zSf0pRRXJIk5EKGjAJiZkERuEm2XX3tzqP+iXsp2gEOs1WRwsrA/iUvJDor1PBH/J/+Ke3X9OYsINl5E5wjD882Lmbk92R2mroPvXZ9+hDnn5qHGDgJW1djIuC5Pd4F7D6BwkdRJzR2z7sl1/teci2uprrabQUoDAEjJyzybakpDznld1pRSjNHU1mWdxjFwyCWvy+JSdd4yAXIIYLAs6zgOCOgtbDfZaBEAn76tN/Wy5RCCxzlIkcot8j0AtXu0x7Z7vYJUS7D6HlamUbNWAQLUvwJ5l87/KYYYYxyHkQMjAFMoW9mW1eCWwrov6poR2f+nbbeu+zOHiLuK2j9ld4u7Id0h197V6J+v+5H941uWZZ4Xb0gAIDOlFFMaHEy0bflyOc/zsiwLAE7TeHd3/+bNm3EcipTPn69SCiDGlKZp8uGVqpiYT5rxTWGowMWWHIXwIqjmRVviz3aPGrSD8Ot71y2S3Xwx3j1D2y9XJxYBlIoHTQMBkM15+dOXp9dV4FUgfn38tfvUxCHE6+JbUzCAPmpS8Z8pOt50K7JtXIZAPbLHtNLmbqFxqmBoaB6H1u6v0m8Gt5tN3a+2bXu1jDhQtT1XizXwfbwpGD3LQbtpad+Sv6ukdftnbcu3M4jNtE5mVZgyKlIYj/HwwONpg5CVxEw97BMdvWdVO8C2Yrl20BkFlXN3Q76/WGnAbpwDbdt0IIQ9hZYJgT0ORX18FcRug4yColYUALXajumzMcR0QRwokNnGKYfhidIagiEFokJQCDKDIppgs2i7b5aZIpkFzZMujHgH9g9g7/L8edtykY9+MmA0H0UhA0MyIiKHSqKAFgVRQ7V9mDgZMQEGM9zNchthIRMGQ1UQY6CybD/9+EctgsNYVLaSeTwQo5F5Njwi++KLZGAFFLjOjYLdtBu4mcdr9tCzZNsX4mVtqlurVhEJUevHuztJvYPRPjlVQQNkwhovB+w0W2sqQfXuWSNq7PJhfUzVbqanm+d2V7NCS4QlYvDRqrYhdGeh58IGsIhywHUECbKyJtXN95xm2pNq+wj5bb0Hez54CF+l8HkHG5vStre53waR+j61875b5bFH0BgROpQNAIvaPK+PTxcHB49DUQPAoMiccywlFSkiiGw+yt5qipoQiQAEREzohggBBJICTIDEgQlBFVyH4rwxUYyhjiUyxxjc0E9qxvCKIP4F7ajNTAwYb0lxNxJw8xu2kLUGswMD7yzc0isRO3Pb/TUAtz+0rVrdMHgfpd9hiEhFoV6hu4sWCMlI3Uuh6H83AURiQqYQOJdtWRY3N+08+MTssDwTyUREwJXoE5AiQr69PF94K5Ef2N1cQARQQ0LqrAvg85Yl7ABRPaauClRiKgalGDIBq8vvTm9A86W++pX3MGdo/HQPsJcOUBQVlaJFTNXVZUKEQGnkNEJICkzIIQTw5hCqkxZREajEGCJHsySKSoHHA/CvymE6b0XDdnfiN++GlEC0lO0TLz99z/BvTsfv76di+rtymeVPU/z1w/HucEqIRDKZGLCFwwiE27Ku1/N0uAOR+8M4EH786acfP83zdZ5/+CGlw+Xx8XI+Wyk12Lay4gkMREDU1FS9n5VLNCQopegZtqRSVAMhEgPWpVKBlcEIMBCGSDHhcIrjQGPasMy6osIxRMDh54/nH378eb6uYGErkfgoYMsGNBdEI+I4BQtBSwlMkUBLzqWsuYjMmQSNTEuRqGSzbIGDFv3Tzx8etuHx8/XxyyUOg9rpaQbjRECH46BherysP/zpjykM94fjaUp3p/cxpu0DXK4fUH1l0YDsuoxbBCKr+LRHJZsg1Y4yOLMYDIggMX335ljkLUqeL4+frmUVNRCgAMwxpDiMh2FKHBiBfRSNg1YuSSUpeCYeEandEt1exk7aM+iCqgIoESmoKVItG5B72pxbEdqTiF/aTcDpvwFrFm4lqHSaZJFSqtoLTYAjH5ViolClGwNUJFJTFHTMdzfy+6XrJoheCUJNV7Ue4WG7/EdsrS6okcmv69kvZjkDQ+yQsHXdiDAX2XJZizqWlYwM26xJcPMGI1DO3pIzIvMblH3VPugzj7vJktus3Qsb0X/FfrIVzo2wT7dgkLZWdsfuDRfeqHTaMC2+TxvH0akIqrkR+26irWudjiPvJk1oBN4OLHa4BAC6NEaEHNhNvj0+rtt4u0DsbAd/8tTy1nx1dmuzy7Ju+fcXUkrx5LcYo4vItVnVzJjdodzD6/Yk4r7b7WgIN9juR/e8DqnU44a7rdxk1RjCMAxIdL1eoZGdu5Dt39bfPbfBNtSylCLMRMRmLq/nEEKDBgATATMYrMviBJ6cc91lmJVSNpfXRXPOwzAEDk4KQkRTyzmnGBHAZfH+DlTMehHXKksuFbajVnIxM2LvynnWHDBTj+9z+qUiCojutpzsmX5tyoTJRWEyQ6YQAneh3zNOu6ta1BDBybzfkkRtv/HpjoF2KobAwYfNuOVG+B+GYRjH8Xg8TtPkJ7NvkDzFzuPsRDTnbZ69/PO6AmOMh8NhHEc/bUTEf6Hbnx8eHt68eZtScjQLiiBbCOFwOMQYAcFLLg/GqJVK+zB38kPf1X5tt7CvndQvh0cNkJCotsaft4meR3ZQ33HvTQlW265mSGAAxkxhjGPK61qW9XUVeBWIXx9/RceVaR1cpXVZiygANfAgmBoHCiEwB/dVFJGtFK23SPe3ElgdjW8Fs3NUb/FZlU5XF8hQa90svdfUWq+o9bbSOId2ixTwbpMbvfA2V1fZN1/VP/h80r1WOdpSctQ3eFpMS4VLqCdCoBAPw4nSZBRFUV2B7YBLT0RzVuzOWuaryn49oecsKtjFAeGOfIFdN+2AXL3dlytGy6CW/uZVn5G6bm2GHiYIYLQCP4VhAxpQyCxT2AJlokIESBlwIb5yGEGXImgWobZKwZCIjRgAg+pJyoHwPdpvDA+rgehVbLASWYRZGaX5cOsYmJu6Aaiift2RoJ0rpVCAFICbyc/ftUwqqCZFci6ETEbLdVE1UTe/ocsiBmJUhQ8DJGREz2pz6Rg7H6qN/2A7Hw1u7BHoOKretFeo6jDuari6Aey55Uje9qYuw4j5WYstdtmjQ5zCuWuZ3KxU/sO3LJsbwqVjUW8rthem2K3yTVPuXXKnIgIYg0WQkfQQdEAJpoFBgURrxRSIsF0x/aSqg29g+C2K3HMV7Abt3ZcLLzMAoeNhYGcZ0f71PotQy1+DLcuXx8dtXVPgIcXDYTqdTmkcD4fjw/2qBsiROZkYklZDlaM0TBEY66i9E7ENDb1h3wnozTKGIiZSvFQKIaQY1Sz63C5iuxZfH7+QBe35TR9v8eJt7rWb3J+RJeCr2A1E+DOThs8LZfxG0dwdFLBD2DnNBE3RPZWdsoC+k/FIxXXdtm279bTaxAYzMWEu2TCoVXWMmUNg1QKAKNCTQTttmRpG74UZBNoUS6dRPsus65cxVJKw+m3SX0C/ulvOUb3TVpelAmLNDIcK5evJXdCXtp6lB4ZIIYQwDJwGihGYgRg5UAhuMRZRERBBMyEEbyCrILIaMHHgYTCTQnm847t7TlG2Na/5rPjl3zw8/Nt7fnvAi+DnqAlW0iXwaRwGAoZiSoqRBMypAAwEoiVvMUYt+uXz4+WcCejThw9mn8qa87YiGKFjOJwRAoysJjVhEAxR2YwBEyCqFRVmMuKCgAACoIYiYIGAiSLBECBGjJFipBQNtZSSpRCzWjyfZV4uyzKr6vE0GlEYQs4FjBCSAhrydJwSASEwYyJi0GVZxee2FA0xDmM6JGG4bhvYhorbslzW8zxfL1fR85LG47wIJQZmjkOI42Gknz895rWULGuZ5P50n+7D3Xd5mzeZ2QStIDD3CS4ffUJP62snx22ZcEQkGCKDDcTv707XdT2v8mX5vBWJMXEaOaQQUxrHFKJzWbAtK90GfIOG/ZlN7E5+ajYGgA6INANg4r544S1b2MwEDLtk3DRgL7RwZ3egnTtT21h3lWl84WkLtifOdsSqd3F2DojnL8Rg76xsAA1nxWK3blZlranku/uVvq4Bv6yG500p9sFKvyNrAxDd9g8I03GMQyQjU1yXTMtaylJb9U2PudVru4YHPB8n/99ZEfUJzk4P782XXirekP0AftV0XICZhVDBvq4Rd8yumbHP2uysx/sf7NeOF3tO7O16tIvFhBxC9IiXLpjun2r/5x4NBzvrbteR96nO2Fbafgn3FE038NYX2/AU/SX3X9f1X5d9O22ma+j+Zz8kTzzzOLV+/D54F9rn2AXo7gZ9oVn7u+rbjXac0RP5XDF3bobL4sxM6MwKKaUEZiYqIjYvIQQDWNY1MKua/2AIIZfS04ABoEhBQBeIW0ha1bul4vVQn78/u2lLbBti+zpb+FtiLnQPG9YsWQZAV2xdYN3j4P25KoX5zzzhN/XTfvslIg7BP+gQQvT3LsYY0zSNwzAeDpObiGOIRIhE27Y5QWW+XmMM5zO6nu6tC/9ovMnRLe2Hw4GZh2GIIbof2WndMXKIIaRARBTYaqcIUdFda0xcR76QmkVab68SrcVW2At1+EVx+4IqYw6W9O35V3eCOnFr5tEU2CxZlUTadqbY8JHOyQFkoDhwDGF4XQReBeLXx1/tIaqiQkiitq6biOcmg6MmVDWGGOLAHFyOyUVzEa9NmhOLWtyaS7iOaWVwL19IabIYfHsLgTjFhIhSytOXJ23IYLWbkqadK1dBFQT79NxaF918WZVJhNQGzB1e1TblqF2rcmOjah3ea4tu1RENQYHMGCjGwx3yIMBqpC2em/GWIoeAbTSDHJlQ64xbmYWIqA2f1HE8+Lw7fxM1K4K5wvDqzVe18bwADKk32z1PDwywsidNjYwE45V4MZxQ2KzBhmvVsiFdib+EgQJHKgg6iLEIqiABDmlDUoRo9k7lPdF3qt8LQsmGdAU+iT2JbgrZycJdim2DI0wEIbiZShBFCkhxQ7WYmAITIqIWUSmEuJXNRNSgFNs2NQ1AMY2n7XqZswKhuS6CpFXos5p6Y4SmTEQMpKBWeaHOvIZn77HDB+FZbrIItLNEQMXJg9qgUUhIe4xUrzX0ZsWFHiZtomIitUqvkqiaoWELQHclxXENO9jbs4W0grGeR+fVtdXZnW2wHAjr/zMEIJMIZWQ5BIsgQY0IRAl8yAzcS0kv0kUQySPpe4/Xq9IXa3//yo0q6h75ZzWx7aM22h7ViOrUbTOqKCKEQCEwMUsuucjPP31wswQzDkNMQ0zjOI2H9++/++1vf/t3f/cPv/ruNzFFCqAmquI3qyKFCBgDUrVRIilVCc3TPIwIgAGR+35IVJdlQ8xbzCmnYUwxBLcZvArEv7Q99W5T1MYjYM8a/ua+wiqftFGDkPZh03+mdK6yV99k3noqNx8V3NDzTcImItBqIlawUgoaEDEireuyrmu7cOpQATOkwIF41RVJW20P0ziEELecwSkrDphoUjA2On9vBXWDUscjv9idNiS+dop6a9SCqqkpGRmYamWn422OBm+kf6TGW3IzmBM7rOd8tQl98FYtMg3jGKYReTBi4oDERgE4UMNpAoEBimkR8dlYQiUuqpGxyHZdHn++n5Zpeoe0FlmLziZPJE8Pw2mCLSiyIEoBkUAwxZgwbMu6XK6AOJwOT5dZEYeQQkhP52tQQONyvX78KJ8uds10frysOUeiyByQDFQNBK2YikgghhaKpKRkRmgJ6UhpQMPsvGmQ2uYlpMiRJBIFpCHAISmTICgqopgqmAYgMFIL16stGxcZkGDJVAyRyYwQAw2HNE7GcXw4DFMKgcAkIh3HNF/nvGZUQ8Oy5pjC4eEgBOu6XC/XvMgiOGdTnpZE58drkFzyQtsKlHi1NOHxdH+9bqJWRM9LsaRlCu+P722+bNePWJ4ABJUQaygDmLGar6DaT5xbCIMR1CgCQsyqhxB++/49hEGJ/+XTYxjvKAwcEoVAxAqdG+yFXzXS1pzbZrcFuKET94NZu4tXmwei9q4RtZkaq/CwuwmYmfkAcZ8oco/wjm9eZ5z9r4rUfXylFG0hHLbbDNecSRcjGssMbzZOvxC0dVibSFfxFw4Vt9usTseh9uFg+LNa+evjv+nFDHZ5W8AetFrc31LruOZlCCG8e//23bu3KliyzvM6Xxf6+Gmer+uaXbW0nhIH0BkUrcn3VY/zpdr27Lj+glHddlnPCLd+JFRk0TMXDzxHu/oWMoSoakQIwGrqTtJSCjHHVpSLiBmUXNQ05xo06lGWIrJtm+d+b9uWSxlSEpF13Sq+RaWU7JYFQCCiNAzu9Ozpl11udrWuuphF60aDyN3K3DgPOW/gU0HgnmVDPHRfsL9MX9xxt+B20lRVbImYWZuvW9uSXUrZ3K5bvUekZlvOJRdmijGFUGXEZVm0wSX6r+6Cb+cexBi9rdXp7HXH0XbNL+YIXbhkL+uRkAiIAUW1NCo05dxJ2bbl7LF1IoIizAGxbNvmeexmPplhIoIN06yqiNwPu3ul+12tEUU0BK6+413Ln5lNTU39GdwK7cIvIQJCDIG4zRDG4OOM+5VCVRzq9GdmTb8RNdxa8UBEHDhEDiEGDimlEGNKaRiGcRgH14VjCDE6qdqVX0c551LWZTndneblsi7r5XK51sfFDEMIAOZQe7fJux/ZP+J1nZkjgOWyujrdXj67hx2J2MwHskxEah5gbxjVUw8ABAV2C8nLWZznf+7e/+o3wn2IJfYLYZ94TLiX4nelOBhqrQmVsPgu2gyRQnwViF8F4tfHX/Hh86vM67bWG3cTZIlYUadpGoaBQzQ0QC0ionWCUN28a2DAgIYIjEwuDxMR0umuhr0O4zgOySU5RjKR+Tov1yVvWVtCm0t7Aiaqgio1KehlwHT1NDmXgSo/rofWYWN2ube2I4HMjbeqIsU9Hh5v67sMURU1BQZkI+Y4UhyEowBXk7O2o9AO1lNj112/MaHeW/V79QGfV0U7fDPupvVbCaWmRdRtLKqoxgCo6pbVegAAYti8JQ6xjRkNEQILmyYtIIJYillmAOIVhi9MCoKYASRu+WAW0JApR7yabgZs9AbwN4BvAQ6laNYShhOHA1ECLLBPXkLcIaB7J9JHuRgAiH1/SBSRKMQBETdYNx8fKwpGwoOEcYXhvC7paXl4/zfn/IfrtnJwmABJEYWNQkgYxNuc3DTWFkrudoDb7qt6Cuzmy9kFSjwvc2/4atfxFRTV38/bp+Rvr1Ozbls7P7VUrRRQUWr+nRbirE7HJTJTRGrwCdtH3CEBET8rytUU1cCsWN3VemfDS0NmaJzUREhSUtCEwlpMy5JXJFZA4EAAiCSixC+npcyHo79hh/zGV3rK7XNzpTU8xq01sotprKlcL8U4wMA18dLMLperiaCpG3/FMRTD8OOPf/z9v/7rDz/89D/+n/+n77///nB3QkIRLaW438pnlhs90ogIfN4sMMeI1WASiMlAwIU/EXN/X85iWlRiDEMcQjB9ZUz8spa0npLR7ryVFPw8b+qlVcpTU0HFx3r318t+ohAaR6LvT7594eyiMH1HKaJgCrer3EPeUYvkktFgHMa8baWUNsTad85ATCEGYhQVUGQI3pCbpok4uHrGxMpWpKGY/Lo0UOj5sbcW0V4UwG8MF9al1PdjpmpI4Cl7aEYGaiqeKm4+IYTPGK8OqQJtiIk6/2p1mlFVoMEj1Yw4xGHkNBgFQ2KOFJIHNCkQUyAMHmQnWqQsquL5eFyTKotuueQFpo0wM0URy7kIgIB9fnx8w5RCKIJmllK4f7iLzHJZynUtc1bG8YBktMxbBp04fvp0/v79d6c0Xbbl8fzlh0/lyqcVkjIOEVNMicImZdvWVYrnyaoBeoysWbP56TgephAHUmz33FxUETnGONxpDBeGQmiJNJGAFdV13RJgYiLCaKgGQ0qG0bJkKbZlNcFhKAR8HMN0GL57f/fmO+RIKcQUGEGLMqAAFKSrnNEkIGJMK9LAh8PDXSxlo0+zXMPwNh0TBhpVTtdFy/rxh//89OVxW54UL8N4lawDJRpTPJyMQzZblXIguHtbdIHLwqakCpYDByAgICVFQ6z9CuhjK2wA2nqbLvKamtmB6Vd3R/vtr5XoqZBhQg6AJCoKVhf6hvpvregbyfuWe0NVCbjhThGNUBFElTu7oY7ZkvWkVwBVFLPmqHNpGBvHojoednnMfTDOnU9gUG167vnaGzRBtcKLfSPdNtU325pHMFk1DCJ8bYJ7AcF8YemyhnmszPFaob4+fjmLWffCIDGbqo+tgQlzaKILhxjv7u/fPbx/c/emiK45U0xpnCiFDx8+lc9fSilE7Myffdix1QYDdl4w7SLKny8Ilc1tfQ8Eu+UDnx10N484CFXNtHcwq40eK31I23Bm5QVHNVNQJG+DFVFBIkYmDm7hyFtBIAQWKapGxKboADwVExRAGqcDIqkCh0gcUkoEiBTGMYTIyEDGpFJyTkNCpGXdSpEQbcslSxFTAhPTsomaUuCQIiICY8TEgf1YrWRVBcJ125ZtO4Tg8RkA5pM9IgJgrtSpFgCLMVSrKeCat1wyIKppUUmIHBg5BESR0stdQBRRM1BAkWIGZkVEEJBDMNXsZEgzUVPNCOASpA/JunnCfSvcJn9ruriZt7VSShwCKalqKcIczDzIbksJUhpErJSiZCkwERdVMQGkEAdCNCAMgaySKwJgkVIUOCQDT4FGRSqyRURkAkPvmG0lq2Q1FVBQYGoYOTQiIAIR6/c0t77WzkgrwAAghKCq5MFnSmYGpB6IyBSq/QppGBOHAZGZiZn7lJR71Zd1UVEzIK6ysurzfhtaDwVtMC+/6aKCceA0pmEaXAMeh4OLwymNKQ0xBmYOAUMMFAIymSerExFgZKJAcQin7aDqkyhaSl7mZZ5nEbnO18v5cj4/lbKVgsyEhGDEyEisVoiQGrQ6hBo54w76EEIIjBCQmQJ7pkvt3EPLH3cSUo9Ob7eIyvoA89UYd/aL/QQAABBUoPDNfk09R8dN/XvNqdoXbgq7++MQedcvAqjWqNfHq0D8+vjrPJgoxAiI1+vVFJAYqgKpYBhiisMYY+TASCrFx+1JzIgDciAfBGdmJCaKwaXhGnI+HY6q4lmatRmoZiJlzaoQY1rXTbRBA4BaUW1iPqzp/Kza6epVclEhn5Gp4XXi4hkDYPBhmVuyfJe3rFGtnJpkNTlHfbNqSIYkQAo8Hk8QRsWg1kybgP4TNfCsEdht1yS3b6kE327LI5oqtalnn8dRUNTqHiFAQFSR0iyaqB7srm022cfNVMyACIGRDEVBUQk4DASaTO6KprxR0RXDGTFztJjOFjcogixUIiEIH0yB8THAZ6QsMDK9A3oocgc6ABSAkXAKdMDIaCrZMIBzNv1tUGVCD6aDSpgUF98Z20LDTBQQAgIGVhwQDGAoZYsxBY32qLDQ+KerII0WjyjgixsDWy4kQFmQiqGtCAgMSFCyMjVKL714763KPI4aeNZLh9vwplML4OasgDonS2ZtHvQ2Il6FFvGStv6MqZhH0JsASG1RdNtE76ya+qST1KZr06q07X93HorK5VDxcp24U4DroC0CECirDlRG1gDFJKMVj+dRg1IqYeLr2fnmWrJ9ZCQ8z5fbqcPadXJ6dhr3GMAG62ggyK93s95C8EChGGNKcVlmBGAOxBw9jwpBQd0n/PnLly+Pj58+ffn555//3b/79//4H/7Dr7//FUBFe3jXxz0H3jAnImAmCykNwzit16trasxk6GwWYGZFEBXn5KhZyWWjjXdRIa+PX4LpytSvmhfCygvBd+8grkqNKSAyeSbM7Rn295Z9qvgLD3KnWNSrWAFUoOHn3Tsp7S7vQyHVsOzEuhiJCRDmeVnXbR8k4u0pDhxTAFSRAoQEyETjNA1puBqqGtWWjFQVy1erWzDfswscd0o67OiqeGv81dROM1IFBVMCvTH16+6oNmp36rDW31YVBHW3sWhRFQNR6OREbSP/IcSYEsZoFAyZw0AhGiEQAlFNpQNCZFQACCZ1p6KaKwxLNSU6THFd5zkU1ZIzMg+YjufNnlaZBlVgyMJidp7XUjivoBJDKgHPH5/e/Po7KU8///yFH94e33xnFM1giOHd+/eX47RMvzov87aeYX3SnJcC160UwzQe0zgcpkHW7frpcc3F7zwEZDnP27ohJ2QKhGIhjJhSOB7DeMjAc95ypAKKgTglMlsvl7UUZA5pRAMQBYWccwmwMUmMQCHev53evg2HyRiMUNKwMqiKLRLFIgfJkq/z/eEkECFOAApMzGaqc8lyPiNiSvHh7RuDAadkMQgoD0uCMjI8HT9czucvT/N1Of/8ExAPw+HuPg5DHMZhCIRmaw6J0wHyvK1C2YykDlhZRbUoKiEhQivHAHx01MzhSApKpgEAEB4C8v1hLe9+9/FyLVqsqHKFXDdeg9Zl9fn2tAOM4BlCaneGV2mrybKM+xBFJ7gaEFXf2e6J6ZYE8Lx+6/9tOZjV7tRnwG83Gc9MBSKikFKI0TfK+6FyrwS8YyoijR4Bz9lNFYrWv9jztdogAMF+1X1dA34x6nCLpDZV8xFthDoqRVqDSwjTMB6Op/fv3k/DwQSKWBEtKgIaU0pD4hByEXveCbT9FOa+e/rtVXX3U50b1/WerzBlvrYo2I0kdBOHqFuQtdIvOhYfXLpz5de3ae6dHBJHil77iShzdYC2ybGwbus4jMOQRBVAmhkJzKAUIZKYEiDO83WERDSI5GWZAWDbNjMQUSQGpCKCiM4fAIRcsgEE5j0r2Tu4Urw7iO5EdvBrjFEVPbM6xui+2lJKtXMiAgKHEGNUVVkEETlwi7Arzk8wsyJaRPtb541oVc2lIsv3hApVBecUYyd7SN9pQmMf71kc2oqBTnJARG3cDLfWunYcQlClRpxggyAqpUhKFELIOS/blgA4sOUiZiGEMcZPnz7Z9ToOg5N2qQZDY6m0KTUADlzMsB2qd+MqTZucGV1lRN+L+aapx5D2PZ1bv6UIGHBgMy1FmTjGyARq6uMgBupZDh1bYSaIBGAi27LMIuLetls20As7UQ2nsEqBb50/M/PPdBjGIQ1pSNM4xTjEODTP8BACccDATIyNJI9ECIBkhBgDIw5x96sAEZyNt67r9Xr98uXL+Xz+/Pnz9Tovy+wfEwsTIXPYhSeb72i8E+lElMC8QWVfdD5yL8SkiJr42+7UZCZy93eteH2tMfPy+PkivOuIPv8iI7tGUod7n+sjN9BEc2D5PYFv1jkwwtdV4FUgfn381R7OVhePwDYlCFpbZ2BgUxpjjMSEiEBsSDEOISYAJo7MTIgxpRACEzFT9LxYBFMtJceBEIzrLsELBVEDUS2q0Cb4oNPiqs1Dm+Za/1NnB7FF6LzQYtUhe6ZmtAt/r/9Yh1BUVaytrOJx6mYqYtrwFYaKRJzicAQKgAGMHD/saaA7u5h260rbI+BfDvbt4uNeOe7zvMaM0MWEukUQVRAhZy7XSBKtIxq9vqt9PHQaL1pNcCOVYHpvdtTCIivFSHwmXoEzhYKEaIR4AAOhAqponwJ+UhhiGCiekEaVoEohIAN567HOKaupmKi0WWwwMyPxalDFVFVKc+MiqgF5cBJaqd1gJkYkMyZmHBNCES04hMWATcbp7hhiYkoxKg1KMSFFoACYwa6qGVRFs2zGZBwAgzmjpMPOKs8BGk4B9wpR/+D0Fq5M+6XLLQCOZ/ATht23S1h/kYNBDdBMi0jOaOY67s1vW+OwPNa4JtIhuuwLiOx+IdtpqdTdSQaoNYrRh0xvdkIQBKjoYdCJZEQNUAhcLWViZjF2ppQaMX1TF9tPUd1ko11XY7dh3hmQKysDegl1y99or2VPB6t1pycaGXgxl1JkIhUZhniYpimlEIiZACFLXtdtXpZ12Z7OT//ld7+bl1XNUop393f+W2rjSH3kthv1EZFCiOOQzsyiwl0dQGuEavNg+7rlNhEUaJL96+OXsqnGhhmiDix6wU6BFxnNzT78bHru+Xd+s7rt9/K99uo/oqC90q8Tpn2Y3ZuX0IbKoeZvqhkxl5xzzuu6TtPYfyECetAiM6mYt5U8OedwPDw9hlxK23TArvK+ZbjeyI9428E/61l2jWAXc4UdYexvB7XkPgVFo/pkqGrYyPk1UQDMDNX3m+r/57gkdOsoNDKxinoWLgdWDIaMTMgEWJuhCgamPtUKxADREEGhrtxkIGCqoIWJ8pYvUKRIyTIGEgmzaS5kgmw2GKZN6Wk5AN0FBsYL0qXYZVvoPR6Hw2XcljWfDodlmWcsE6f7+8OII96/S2+55MunP/7u/OmDlIIxTeNwPB1CDFqKbqLm1HhrDii9lPIkGRgGhBjC8f5+OE53338P0/ivP3349NNPwEgciJBTRCReVrKsakve0BAETfFpWeFEOoZwmqbh+PD2u3S6MzKxIioF4LpspmCqs1205LLl9bLmN2/jkHzPtmmOolIW1HIah3EICY2NDLEU2FQWkW2ZkYyAT4fjGMPheHdedVn06WkpM5SPNMzz6XQ3xgi2geYRECkWZQVVg1LbAsjo6fRmpISgjYZkhF78EQKhoUEAFGx9ykDf3x+XzX6+LE9F1NSAUWvZZwACN8yxtXADQPwzV+VuPmB3nfpZSi3uTc2wkUlt5zzuiKo65lxTk+sy2GeubyWmmajmnFXl5Y0C6ogeB0am7p7aL7JEjFi6f4LwBnEy1SJIRGRWRKgZsRpb2S0LRmS7KajXFeCX2vh0B3wLrkNs5X9Nsjocj8SUS8mlbFvOWy6qotrsNfjCQvECxA/fAD7A1+6WPh+D8L9FaPUpAT9m+zOvqGEcdrs5tepvdaOt+yJ9ylMRhZDcKdn4ReoysRRRUScYuIDrUmApJedsBkjUFF6//NWVtXYZeq+ohlI4UsYHE50g7Hl0PS8OG+3Yld9mx9RSsptA/Ybj94TnwFzzZLa2+2YXbV/4Ktonrjnn/nVXbG2Hn+ps5YoSBkBAbdTjb1Yv/fv3KX/9dUELketqsr9w6JwKkVvXiqzT5nvyeocai9ue/cZLrurW2kFV1fJu9KFHAvu24nbkfs/rZq8O5KiDKVz1XCIC7nsnCPXBHrVLjL6D8/d/R3gHx1XlbXPwYH/j4YYs2vVBvnobu06tqggYQxjHYRynaZpSHIiCnyXuhqY+IYxV/LxtnRBAiRn3eYauq6qaiNzf3799+3ZZlsfHx8fHx8+fPz89PXlMovc/3ITXT8XusPb9l4gUN/cR1bfGfX1uqCZURdHS25C+1hDvpBuF/Tv/QguughH+WUzNN3nON5YLIH2TaIGvAvGrQPz6+Ctup5GIqORS25XakbwIYMOQUoxE7DoVcYxMMY3IkTiGEInJw0CZmLgFehoKFINiiOCxHmbNXqRZypbzWrKAeTgeVqKfAtKzBjZSz8CpJs9dENmLtp7/RRWI9nLAbaFVFfV00hpPV33E9Rc5KoI4jlNIY0YCJARGEDNgRDNUkwqbQGsu4kpzbIasb2jEt4iWPb5nxz4A2DEp2haFEIuqYm0og2vfPdYEoMuz6DuuStsg9k9LjQ2OIm8kJ91y0GgJLYjSElmQkSKDfbRgjLNpQfvC/IQWOA00HgHHIqRoROohtSh1XFmpxnarWdUHwVFWlcCrpibgtutKHTNSUkUHJmM9WiRmYAIgM0GVYINJBllO0/E4DBNzinFTmgsdEU7MI/Ns9AVwJtikbKUU4wKoTKBq2LEQ0MblsH46LbnixXg1IhKQvaicGxOwJia3Zdb9R0iIFYzdAoZzztvG+L+y928xcl1Znye2LvucE5E3Ji+SSqqLqO/r7q+ne9xFTbdtjNEzIh/aaGMASzRsGJjuQVEwBoYBAyXCGPvBY1O03+wHSi82bBgQNS+GXyyWX2YAPyjleXEb3SPW9L376xbV9V2qShKZybxEnLP3XssPa58TJyMzSUqiJF7WD4UCFRkZGXFin31Zl/8fQsXjGkMAQQAC7htzDsVki9caLmQKsXf8K5qJpf0IFhKLAABKKqw5gKywnKqhgVRBQhAkBCQVBREmqAg0K2i2SPS42x0WlSOHhYlHrg7jPPbip72nwNHCyfG5YmlLWg4ApRqfqhDqqmKmnGJT16c2NtZWV6rAIVhqXWNOs1m7u7d/9+72wcHsN3/6J4R09uyZV+tX66ZGwHJbcImc9wqXhECBQ9NMqqqaz+KwJSE0NQolNYHWvnJcTYRZvSf3GVrODsn5gQL14/fYMO4iijSuLx705UdPW/qV4QjRVz8dVqvAPlI9qrcffOsIe9dWm1l7RUWrn8Kc2na+t7d36tRG6Z63JYOomTR1VXUaUZUQkQM0k42Nje2793IXe7fMYhoHvYtRyYMteiTwpPP8wmZnqRjsUNFZCaZBL4xacoElzbLozyhtyLowFCjLry4SwSqSUpIYs+RgzuPI0O8KAMkkrAQyI1oLKYagSMXOBoSQUHPWnGMHWqUEsYuxiyBKdSMR5xlSJs2KOQWFiUCY5VPr1QtNiBIlp4OugyzdQVtN6o2NtZ3dfQq0ezALAJPVMJnU9TwkDtQ09bQ6ONg5mM8EumlTr0wnTVNLyvv7B/FgnlIGZEvkKaIQz0C2U8yI681kc31j9ZWXm83N9Vdelrr6M4S9nbtNxcFGQFXVoaqbLs6SiLZtRAwBa+QqIYa6bk6tTdc31lY3p9N1DNV8fqCd6VjkGGeaM2GOXXuwf5C6BMKTerIWmlAHVUrSzvYP4sFODe1EJhVNVqbVvE2dpHZWzYHnAjnFGBDn7aQibqbrVXNKqt29DsNOEuzivOvaNJtNqqrmvMqdasJMnCkjEGpS8w8FJkDBwZw4W0qPIPe97JZBQCXb6xVjG9Qzk6rdWMkq+WC+m5KoqpQ+MQEonrWgVFwTR/d7rxJ+JK9ZQrfS2zrY5g1poTEqfYdRScOOWtUWL1JaYQcZraWFHGwLYEGrY2YMJra2YiSFY5QcmSlo/5ZYWRhyxj6xhAiiLCqghIdi4tqXDSiWzwFwxDreebqDwgt5idIFOehCDN5yCkTMVRWIKaumJG3XdW3XxSQiKeacLe6zyGgcKhA4fOOM86YPris6KRI0rsEoaZjjshbj8tWlqJOV4pvO7LipLsYMAExsIUuL/MZYpITtETbxQxG7KwdrO5srrZOMmZHQ/MoMALTzloUarZw/hIA1DpZx4+ahIV5pIblB4VdVRdBOmlpkDTMi2hnZstYAKJJTWpT0Hg7Kj8wBVO1TDEpW1gQ7imjrknCWqcnqIFljxRmHjz/YaxHYdcO+UNRC7YJoWxGLIZqac19TDDF2Oac+8h6thy+EYM2uIbDltu3zlq6IUsBU0lrQhyDtO8KRjbWoKJKKKuvgx2kRTyIywWIFJaJy6idioqqqUkrZRIfNkwetVJasDhqpFMYiB6RibMRsQfki5SGgTdM0Td12cawFP5Za0ZFH6HAlB/VkqzmrqmoymUwnk2kzqesGifsUIZoshG0IaZF411LJVAQz7TMtDlbMTKTMXNf1ysqKqp47d86qib/66u7e3u7e3t7e3p4NEjjs/Ti+Q4kIADOAmQQSc1FirgITEzESopjDsG3VREEJifraeQSlBwaIl6aR0UEY+u30IUn1/r626cJcYQdj+aEQzxczDxA7P+iJGgC7GG23kfNQ1ARM3FcHMwApYAh1VYVQT4grxIAUmANSQAymSqzIiqQWqUMSzarAqthLaQmCqEbJMeWYUvlbJv8AJDjssKHXSho1BY6s3vo5ug9yD0duU9jiMrkMOoeSs4jkHHNW6QuXesNxFYAsqMgh1JOVVSXOAsJYOibLnpt7VQkdUvcA43fXK03Q8L7wcJkZjD2DRQRGfqzD9s2i2KViGVRN6BFKlq24maiaeO2w6QBUYEIiUIKkIIBJQk4rkjY0ZqAKpZV4HzQDZqSYZa64Q5QBaqCIuI8UkU5RVXE1QeTcIdE8pg51T/OedJlqFcxcZTN6zaKgCYCJVMQsz8iqh3rdhqJWq9ZUlhiZQBAFBUSxqmtVTZIAICBVZGIQ3QrQJtVrIUyr5iDB3bZbQz1XVxt1NROYKO6yxiw58Iz5gOkAIWlWRVACLAWh0nvWWTS+ZC5G5dtDrmFcsNNXMSgIarEi7P1olMnawplY2dwMQXJOsZ3PQuCqCQoqOdsu0M5spUIcUPo/qyCIVnRuvdl02LD3UIl5f1iVPs+gpBKkm2A+O+UX1mrsuti1WTVTyMqzeaugTcUIiTSBkpgDYTHV074qCo+qSRTpuIXK1qGzhI7/oQtb4bFDF4xuz/E5ueQuiEJgyBqICFGzMFFd15PJpArMAasqNJNmsjJVhf2D2W9+8+d/8id/tr+//5vf/OZf/PN/Pl2Z/uQnPylbXhEmxX6f1e+xwAwcptNp184tQIUAtg8Xq74nAOnlyu2G7kNazrMBHRIXwiHNMmygh5E/skAp/qp9CW05CywFm5byH6ZEsejx7Gdv+w0mAgEhGNpvB687e5OLpQ5URHNfpyNZ9vb27t699/LLPxr1yysjNHVVVSHnXBQamUOFm6fPfPXFF93BQZJYThjWKaNi8m9ZZDHFWD8K4bIHy7AxH1xXTMvfSkeshBJRFXISIkAkE5Us3T9gjrU0WIfJUJomQ/itr9IU0Kxqek8555RandfzebOmgVkpKDEgIzKYwyqqoooZXJuELCMoEKui2Z8AMSplFckpHBwcpK4LFCgKJzmIcZ67eSaIKUusqlozkHDAkPJc2pm2HVO9e2+H1ydUh/X1SRWwi/O5QBsmVU3nTq3eJfiTL/48rEzXz5yr66bb39P5LHfdve3t+WzWHhxgFgJkRNFiuitIGsI+Ik8mq2fPnfrDP9z4yU+hatLKFOtq88ep+u3vUbr92QESokpQzRw0NJlUCYAqqab1dHXSNOH02qlzZ1bX1zBjO+tS26V5ki5JzqIxpxlJx7XmPEdJgevVUy+sb764tn6KKxZNMba/vXd/tjPbbGJHHU7SC2tndlP83d2v2nkVcQWryUpdN5hFu6biqqHEjLhSrZw5/eLP5m177+72wd5Bu3dwb28vcNYJEmbKGaIwlfFMqiASkslfAQay3UDSordt8R6LwioIWTkAAgEEhAnI2ZWQtFZMshd3YxatTAvYfimr2Pp1tA5x6f+Hx4txHJcFx5RnimMd4eDXJaps79Fa0RYaZUPu09ZfgkX31uIv5p5+bpGx24Gd7dk+OoBJgh4u1aS6ri26ZKVmQ49w6Unvbyge5WIPNUCUckgq9pIeIX52jmdWGKIA1nghFgRTAJNZMPnanKVLaTYvDmDzedelaEG/tp23bZdS7hOfulDJO5zXH4d48Lja/EPPf3D5MJa/1TdI0lIDzvDyR6WfEDGVkK7dW8rMTCwiKp30sadBA8E66E0JYQiwKUKM0WoqrZS4ruuqqnLOdV2HKtidlZJJJTQAmFKMMYXAzGT3sgVnVbWqqqHYNufctq1V3VqVrv3bfGWtoBVQK6xCCMwkgUWz6WAQE3ccMUlW804f9iSjf2jOGQBTj01iQ9HxcOOPRXjtathOZ9xCMWhNWBh36ftdCs3b05CIAQZNyCH3xswAmhIMMfSua6uqbpoGAObz+coK1XUdYzefzwGUmWKUlKLN+jknRJCcFNSuv1n/wUKVq/flM4uZIWNHmJNYIa5toJhZJJt+nCIIKFchxshUh1CZNZ3txfrdXLliwWLEiINJaM4p5aSozaQ59+I5Qfziy68sr0B0NFOiCFjsj0by+jadi2QibOpm0kxM/CQErqqaSr2Czf8LuZX+YAho+noLR3Qd1TnQeJtqb8LaBc6cOfPjH/94Npvt7u7eu3fvq6++un///mw2sxFro/fQflUhl746yCo5ScqpSx13IZikBHMIxMUWGKy7OptXoZYOtsA83useF0patusYXIrGectRfbAVv4FdoD4BOi6Z8qOZB4idHzJHrSmnLrYCanI8avKIRE3ThJJeYmZG5hCwaZq6mYRqwlXFgSkwh0AhMBFiORQgqIAIloaPbKpz0ouW9gVTMea+J6/M5Gi5QR3pL0BRb7AfCJkfCaqaHCISIJKZuqKCAFDxoUalQRfV2pMsV5iySlYQK2hGgpxUEYkDh4Ynq1RNomBiNKULACAEyaomKFm6a3rrI6v9HfzeVfs9GA6J3JFzF4yrt/Cwdt7RrVj/31LmTVtgTMbPekCYrXulCOEhCCpJNgsYEAUVBKkZMdAcJGgiEVSqsK6JakRS6lTnqF3gmRJ2koBnWba7+UG3zznNU+5QdknvBT5oViNUIpBRwGRErFWIaGjSl0WB6qLIDhRFMwFkBVRlzAyAgDHObe0YaolQE+cOuxZUteM061JGiAkIYurmNSsTCUyq6TqGKtT3Ce8RSqAWWRRBShQmi1gAkDD09RclS9HbT+miKGi8QzUrVSylGtgX4okKSraKdwC0qD2aABmopi4LxS4QE2PJXFhyIUtW7WVRzKnVkru0qAbCxYE29/kQAC2ePr34otgbqTRuBDnT8M82JqcbyIw7kg+SpARCSkxMmFOXunlOMdQhi5BpfKOlRbKKWCtwMR3oV+yyPcFhYMuhBRsWBYGmjgpHutWOmV5ULRhUqqWIVcXMEookiMlWCwQI5jmcY6yb6blzL6ytb66urH3++ee72/d/8/lvNjY2NjY2JtMpAGbJJITIhKKAhGqF3URYVdXK6sq8ncUYUZEXgo99eSVhUaguRQviB+pnbEU73GlOw8Z8qbx96FIs9UXWrVmipYud7rgw8NiT1Uh4SEq1i+rwTgYLx+GeAlgYQFvYSVGzZNv9x66LMc5mB0PdUFnPTKo4sOUfqU9kra2tTKZTZJauQ0JWIpEhkFXmk7JwlfyPiFofxJDm0VGmx04umEVBVTCL5iwZIaMwBEHULIhFDtNKm0t4Gcti2Is6LWqHB0EA6+Sx17SdBgDErt3f25uub4ZqQtSv6sxWyaPmTdB3KxetH0Kx4iAAklRNqo2VU8Q7AFklmdfB/KCrU0yY7x/sbdd5pQqZVSv88t4OU1ipzxATq7y4sX6vzX9+7652dbO5xnVQ4M3Tm3p/f97FaS0vbEzWJmv/+s4ft3n97OrLFLq9/d/v/f7PZd5BiqhSEdmajyqkIEiowFVYP73541deeeHFH50+e65a22hX1ucpa6YpTdZfePmFV372r//JP2pjBxXu7twHCARhdfPsynQyWVtVZlGkql47dWrl1BoH1BjnO/dnu7N5m1OiECoiFskB5fSplfWNZmdvD7gL4dT6xit1s64YJKtCIITp6llKCnFnd29nEmZnT+dOVJSmK6tVtaHVlEih203ahWrKVWgzdRmzUjOZrqzUTTPJXWr357t7+1naFY0c56mDOTFpJ1ECQgWIBJ2oADIhiyVfCQQSFnWq0rsjSoTJcrBgGxgIkldIzk4YtEEQvd/OBLKqSlYEJCBzaoKFHe44sHK0kWX4zyw5K6MSLGR8hZWI2eSHLHtCRJa0ZZO+JljcC6YdYrlkkL4qAIpGakpiHVViqejFXFECRosSOaW+V2CYiJhZQUwXMlPZe0MvG8rMZccwSuEMZVl917Y+4NzuPNWLWd+8PewEkci2PVn6fsI2xoNZG+p5XTcx5bbrYspZJXVpe3t3NpvnnBFZFRB4KEGGw5rdYw36Y2vhx+eUhwy2YuA1auHsfchHrZKLsoil44+dJYdUa0oiJIRU1TUiquhsNht0VIctqAUuQwgKIFEseltVVdu2Q4Vszlkk90G0slgTkUgJodraXdd1kZUbLev2+lYRPAhcqKoVb9q3Q0QcGAVSiilZkE5Le0GWuqm7ro0xWrGo/e5IasYc2KRtOwCIMVrprvSZVHtLSzIg1LOoe+lnn/FMOFZ7q6qqruuu62zfbh+z67qu62zO0f4DWu3zoDUBgFUVUoo5pxBYtVKVlBIzVVWwA7X5vw3Jrd60U1NK5QwriyD1ULxcPgICEoYq9LMnAkAIIaaUJJGSjSFiKg1SRFZkXTf1NEwJrdXKysnLRIoIIlBi90xS7BEEBHLObTsX1RCCVf5aFnx7ezvGZHuuJRNjWBTnLuSLzEOiaZrpdGXSTKoQaCiM0lKnxFw+YH/ekWJjLgKqpuGJRypVjvpkDP9pY7uqqrW1tRdeeGE+n+/u7u7s7Gxvb+/t7e3v79uwt+FqW1xFYiJAMvVwQhTBnCUSUkeIQAwhcBWqUIUQAoZgPV9ZxOqyQRfqHOP5YalhdBCpGD3B/ugg3DGEeIZCqBIgHuUq0JLOjgeInR8MEWm72MZo+Roo0RJkDnXVWJun6daYkU4znTaThkONIQAzEisxIIFNcgQAmnPKWXstY0VAte4FBRWwrU3bdV2MJNKLF2ULtvUBMllsYkB60VdFFRQrPwHqk9SgvZcJIHCRXixeOaoq2eSHkwWIcxJJmpNKUkmKIggCyPWkmm7wyinhaZIKrO4ZSvgZJWfNOjqboBTVi6GCUQdJAygnZRm0lfpS0DI5DiEDGlwcRKRoMlg/JJgllw4BTRDrFUYFAgI7PQQiq3crrZcgGQEIkUHJZBaYOiZg6gCSIiJVyBx4FWhdcRUhS9qX1IaqU8a2u9+mL3LH7X7VHrBIUo2EBww7wjtQtUyiAkQWiTXRydwLFPXZ4EEnWfvgZi8ZqcqSFbJpVeSYBaQOXL4wxSwZJHYp7uY4F6UMnWKrkFBnRE0gCJiRq2plWq+tTlkFDxgoAIUAQCjISUmAkZSJAmG/VouqaEbT9S12tMRW2YxFKsscdItZuiVLQBQEFEhARYQgKNlgVNWMyAzIAhhFtYtUQ00cqOgmilBJOBdT15IWByt37xOk2DseaHGPBSv5RRgixCCQBXOuMG9wfnkSXlmrf7SCFbTSCGTSWZ51ERQCEORs5oUKJIqMLNlcfRddqBksN6yHjiEoJRZVYuWleAnHUexDp/GhRETwcHFT+TMjyyrte6kAkUOom5r2EQlEs6gAMChIFiHFihAhEL507uzm+kYg/ON/+a++uvflv/k3n7/00kvn/+A1JkqSU0qoRSTLZjJAAQRmmk4n66ur2/fuWYEaKhbdscWBq/c/kazexPRs1VwVr5tyZDq0216q0j90HrbM0EK4Z1EkNdQILxVSDWP+2Ap62/pbCbOACRjByCTS5kbbRINAVvPnYUbCrNKlFGOeTA7JAQfipmm6eZclAwgggcJkOpmuTKoqdHOTfxUSoiy53IF9qBr6GQUGlYzBqsXuTdQlcdU8XrtGhYl9770OTcQApkTcz3ALkXdRld6xrtd+FVuftV9QJeX93d3p+i5VdUPMbCFGQoUMisBIQYfiN5OVIULbmkAWkMC6ubHKerCxVpHG2f5Mk1aAEJVqiln2Y0LiBMBVhZh/+/u7qOnFsysrTbO2siYy/93ufcmlu3PWzpvJNM2zJpgf7B8c/E43A0GKOWZVUZy3Xdt2EFvOwggKQIx9rhgIpWrq0+fO/MW//Jd++tOfKoV7e7N79/fObZzDplbkGWKbu8m5F3bnWTEQVmFtc7p6ajpdWZ9uNM0UiJPkBKkKWDGydLIX252d+3/+23YWharJ6ZfqyZSqarbX7e7ura1udilQtbl6ikO92kzXQFmyddsyUzhz+sUdpNk2gU52Mv7L3ylCg82a1NOInDEHIiDsgHb2M7VZ6wqriUoToxADI1eT0ExWmo21mGKjuc4tt3t5p253fq/dQZ0zKFLgECpQFSmlVkGl1IMpJAFryhq6SHFYWxCIdYJKSAEbVoytfHGQ5kXIq9SoU9kGHgonHbWghKOSqTY+TUoMSrIT++53GWSeQAksiFAcg7VXXlGFLNk2l72xQbknsmrKOaVseVMG7vuXSshpIeukag6Vw7QjKoPUExISIDGFYEYgMkQD7M+VjI2JRvUN6YNAjtXwi5vUPVMB4lLKggQIxScK+sYMO0cIUNfF+bybrmZmmc8tPJzbLh7sH9y/f19kyIwONhqwpDA2Xg3hGP3QYx58SI5WBGw09pbRoxuxbHjHfXNDnHfIp1pgCwC7LrZtCwBVqJmDFfaa/r5VENu9ZkX3dV3b6mW33lDXDwBWjWvGOUTYNA1oCbSllActQCtMtl8cosNDUNiSuEvVtfZbMXZ9i16OMdV1XWSjAREw59y1HSFXAYf3g4hdZyW3UFUVcwDQruvsndvbGN7AUMU86F0ciqozicBgBjLWFLYaZIsnDqITxSWvL9Yuz+zrlFNKzGyftHdEmIYQEKHrupRSXTeIlFJUjYg1ALVtp4oAVFVVOfAg9aF1yLlMj4OO8/jUsNjimBl4iauatI4GIgRk4sBsVdV1VccYGYBDZXt/qsg8eEzWw1LpzGy1varCzEkyBe4FJqHtOvuYFsBl5lOn1kNVE9H29o4ZGI5vkyIohsvxE/vumqapQgUKOQlCDhx60Wwwd0lAYArIBMoi2aoEcs5qiX6rTODFjbZ0d8ARrTP7Nu0/V1dXT58+beXte3t7X3755VdffbWzs7O7uzubzeyCADEQC2YtVVBFAR8yZEgAiqSRsGWuQqjrmphtCaurGk1bOufhWxt0S8ZS5sNAGlcLjYTLdJwcGpcBojUi6/HqbY4HiJ0fhpSliymljH0SEq0hhQNTCKFiZkBSQCQOIVT1hMMEAwGxEgsSAmWrGkLNoiiSU5tysRpRBRYFUkACARXNOceUYjLJRSzHUu136aCovUfeyC4HCWgIHmcFsuKh4nEy6nnHwTjXVhe1cqWcs+SUk5b/Rc3J5JEzEIYmrGyE6SmsV5NUGYIK2OHB0pKKhIymTbvQYFQddOtFRztzVeizYeN5XQ/n6weHersm1jRrc2dRrZWsqgSLImHT6DC12f5Qs5BjRkU0W24RgKjQRUkt6g5xJr5PVYSaKEwwoOiK6jrABNIst5pSTLnFmkX3YqRunuOsyglVM2JGmiPuAd9VOABIIhmy9MKUZCHjXg25DzWgReXK91L0QJFUCYWSQE4qnXZzzSn3EX0BANE2x7mkvdSRKApkUUGqEAP1n1thlSdheiZkyIExIEAlWTJVCEyCrMBIucg/lYMVEiISCiNgxrwwbrIm5sMhUDOgU8C+IDwLKiqQkOQSYFaTWJSsmAAjiEim4jRNgzlVL95LfcRpUaI4LIS9o1S5ogiABNy3eJuiQq4gB+02GM9vTF9eCy9MYAVago5qQpoI4l43l9hlCkmQUIkCISpxFuVFRQBg7whc7pfetMrCNqL23kda4DryxyulkYNP4iGnr6GYS3vJN/sworq0gei744PdugjFSwysk1xUs0rOCHBm89Rrr726s7O9f2f/qy+//OM//pcvv/wjLE4iApIFgCwCXEL5gqB14I211djO5/N5792BqH32BYoasoIKin6dk4/zpIeH8dBBt4gqAOlofj7kRLc4pZSmQgAYN0FA3+JHIwu7RYx0tKMdOgFHkR0gKAWH2ldP9GuCmoleUepFJCYkzFIKbMy6en19bTgU2F0zqZtZONBcKlMUuK6bUxub99buHuwfWEluWTVFx1Z7RTJYBcsBHZb0iIeiXx1ucoAsknJKFCpGwnIqpl7wHhYbfOx1aRRK2K1ot5C9EVER7V3ZVUGpSEIpERJC27W79+4R2a5jQqqqfc4YCakSBXOjMy08IOvMpBy7g/2dSu+d2wibp1ZWVkIVsKm42++amkKo6zjr2jybpSbUOQuovvLyS7t7s/2u3Z/HM+trIctGqF5YP3UwYaQ6M9+7vzfb2T7dTAG4PdiZ5W53P62trejqqYCIVf3ySz/azvFgZyfu7w9OgBTY9k5VXa+fOXX2xbPT1cn2/s7O/vzLnYOXfvwXqW5mbT7IKYqI5Grz7M/+0l+5t323WV994ac/mayug8J890ApVFUTWAW6PN+799vfbDS1dHG+N2vv7YVmNaysVCsTbCrk0Kysd7GNeTJPUwhNXTU257ezHYzttGIhykBKVbN+OjSrrJkwzykTE2HdaswoyMhVHapT8f4uAE/CajPdVKpR2PpYzJUXCKmpqxAAQWGqK9NqWuE0yN3fpoNdyhkBESUgBFCUvo/XHMoRgFFBTYODqTxWmjmQmAg1NwgYEFeaDMzV7M/uHxTRYsFe/RqKdPwoZ7NktLUkOlHELqkYCPaZjFLpb45Ig1WO1TAAACoTkdnDwsIEruTriUpvbPH/ySlL5pJJyohASmPt0UMJKlloUyChZEGCwaPDhJKCakoJ+2q1slMZ2q36bZaI9BouVr++EIhxnpUY8aBeBzZVyvBY0YGHtotZdwVxMplarqLr4v7+3mw2l750F3rP46GEzzofx0Gck8PUh/sa8WFeiKVGZFFC0OuKLva9Fksd7OYWoSXE1OdWTcTJtBHMRM4Cmqurq4OAr5USm4iExYUV1Cr3LYJmUS17ERPnq+qKmbuuM/+3EKqiGFykGziEAL39stW3LlzXRFQ1hGBvvtdeKEHYfhusJhdTttvEzCbpG8yBD0YWcGPtO3s/1h1kse+l7qVhV2PvZ1yWkZKFwsGsyiyQai0I4/a+wcGsqioLhVvJbQjBWmwBsalrezMi0jRN0zQmoJFSEslE1HWRiAfZit4oD0y4mTmklIcIdS7O8IMb4XCdCymlooyRxc5dKoqETKRJJGcmtjwYot0BWHGoQhheh0MwxSoCE9PFqqpsgBGhpQoAILbJmphTijF2MSVEqis2dWAARaKVlem5c2cB8YsvYowdEy3sjrBfzkaZFZOPKL4/OacYEzOCJrKeRlthGEAAQvGkMbELIgTIeXAuXdheHDFvPCQOvsSwslhAv2malZWVU6dOmQDF/fv3v/rqq+3t7YP9/fnBLKUEo4tvNdqlX1WLZayIaM69OyoFDvbKgdm+7rG20jB1DKXoR00RYaHcPRjZWL+aLvqMh6L3Rc0SIrrnqgeInR+UnKWLqYgujjLJllWrq9pWAjtpEzJTIGLTHFRF0YUniaiCZM05xTZLgn4hhIWsDIioedLELuWcq4phMesWc2oUBRrvj8oWvQ+uiSoosmCvHWDxJVLTc4W+oDXnBKo5p5xiSinnJDmCiEpSTVaBpZbXm6xWK+tUTzOEDCSKKWVFQiKTMwZE5FIUc8h2aLSFGq/luuSishw7GALEaH5oliMmi5cRIJTZE1R6cWXbMhWVKFvRbMNTulNs+yWScpSuDbGNqcuYI1NkngHfRz4AzkCUMseMXUQAlSjSiUoOjbBQxiRprrKLjAxJISImpo5ozrxLPCdMRT+kF4gmRCXzCCs9x/atoUKfbUXAQAhWq62ikjS3mlpNc0htlzKaZEGpF8+gGSRDVtBiK8MIPOgWqc6lpQiKHCeTXAXSzAGEs2AQJVJSwAzSt+woAqBp1haTeVMTtN21Wm9YH6QUG7elVMiahACsBVxLfBW1mNAK5Kg5AWSADBo1swKoBi01iFwqgAD7xtMhFNq3+mH5D0Dtm3KsWApVQFEQhCQG7dY4/2ht+srG9Gyta5waVGJCUqk4NvX9KubYWc+qAmZQAeQ+YtbrnCzEvg63GBalUey3pwvxE1hWeByOEkfT2kNjWvnHqOhwcFu2jxyYm7o2vbbxnqN/n5ZCT0hw9syZs+fO/umf/fnB7OD3X/x+f3//1OYpyQgiAolQVQkGl3otqt1VFVZXVwcxRzu0Lzw9yOwTERH5cM+U89THiPsJefS1Lgd2h+PZoYFtszQo6nKMaWnLe/SnY/M6O9YujsqmKQEjG2wcqx2XHIwVDQEpEeYs89lse3v79OlNGGTQQc0zPTAnTCYMh4QYwvrGxnRlpXfDHqUjRa0IQwWURMHqRobg+CA0UWLlogszWVA47N6IUoSeBrG8QS6915dQMHvS/pbX8R1dJP+H9GipfjQnT0WF+eyg2t2t60nVrCCSImAALCaiJeSAiy5lNJkekQwYEdqcY91Mq4oIG81RU6qlWmsmYR+g3etmUSYKogRa12GyNt3dm++185hXSNsKQw16EHOcJwqNQtg7aCdYIWlWYNb5/n2cnoltG7u7kCLGZGfRBCgigEpENQcOgRCpCkCUgaLqwf7B7jxG5tyEnYOD/TbPk0QVYmw4nPvZ+WbzTL0yWT97JgTOKc62t60GDVBV5jDf3oT5msT7B/syT/VkWq9v6nSlU9HUMcC0nq6unuOqVlpBboACAKTUzXbvYdw+dW6Vq2q/1b1Ztbr5SmhWVQU0iUZFVmDVOZrgMDcEVK+9GIhDMw3NRABRUVJZOARK8g6IMpEAM1FF0hAEFMk5tnNNCgSCIgTW7tVnWzAQW8AYSpV5vxRp781ritkANeJqhWdXGkWcxbgzb9usSgFxaMdZDl0dPZEulRUX7Rfm8n5EgamPVaFpbPep0mFEm4kdQu+0O9xfCnaU1pxzSjHlNGoABx0VQVlb3dJ0VEqCEUFVsqScAnJ/3LcIFXJvgVVCF6X6fhEtHjp7VItW8qJU0yPEz0xweDD57P08DsuhleVKc86iSe7v7R9Y5CXGaMoShCTLxqTLcS449LKPM1/elwqMtP779CUiDAFiHGkaYLExsVAmWodYMUxLAoCDssRY49ucysoKBgoKFiE1q7Qi8E1k6ZyqCkSYYlKVEKr+I2NvbYtDSI6Z5/PWoqiD7rBFdYeb2jKVOuq+NzULM9ATkV7RokKEPm67aCzoTd6ybVZFSkPOUEw9DgUOO5ZBndYuXc65t0Mo2lj2YS2012tryHiXMn6posgMICKDPYm9JZPTtXhxH2om++KaprH3bNcZ+ppoAOi6LmcalV1bywUScoY09tazCuWhekZEK3OW6+PgOecqcO499CaTiQ2ppm6GY4WNqBACle+wZM4semuRa+vMSIO6dEoiEti+RxHJVhODxGvrawDadfP7Ozu5uDvCIptZ/j2q5iECgCzmVh6ZSFWor2bmQCIsEpiDBAkS0LIaCMQMyNCbFmUp5QFHShmWt5/9/UtwxPTFqsyrql5dXU0pnT59+syZM7u7u7u7u/fvbu+PHO2KTQSNFjZUBFLRrKJavspEiYhSilUIFVd9KHdxbtJFdcHCDnGpwh3G0ieWJBWTm8aF0HAxvcexl6afzDxA7PyQFFF8XCTKhtYBk+axDCQWfR8aPJ0XnpkqklVJUUVylJxS7EQSB1vdS82F9poEkiWn3HWxa2MTSgStN+0Z3G3GW5ki+LvoiV1MTItG4F7o1TbPGYBEsopYgDinmK31XnJRE0ZUIMWK62m1ssGTVeVaMquQKKSYlIgDM9NQDnUks4/HdBz3LWDj/ReO/1HePC6MIhaSr4ukYNEwwj7iLNYfjCWJ2i/1IILEIAqQUSXn1LVz6PYxtWsqWDMxz4h2gbYFWtCsiXMK0uL+gYoKZIUMCFRJqJmBSBIRCDedwkHSGWJLmAgjU8tVRyRFSneIfwBRKAUOw1yvoijDyoWqAZJqBMmaI0in0oF0IFEl5dyhSrlyIoxo/XNFy5Io1KGqKjWBkJwBNYpouysHddCU84RTrivUkDuuBUIGUgQpwhtIAFRiMwhUxDNtq01k/1EsmDKIghJIqaIVArGOUkLMSTLaUk5YXhZVJYHkEmi2s7egopgcGZXDoC6ESHCIEvUG7oOodZ8zQKKFDY4KQqogTTCemYafnm5eWOU1TQ1oE4gZsuYJwKm6OpjUqUuaRZCEUUD7fvnDoTFYuG/1w0/s72NRlxBQHHQXjp42RzHmE08FYkLZR00Gejk9q/gIzMWia7jncTw1iYisrEzPnDk9mTb3d3YODvbu3985e/ZMppRSFlWl4kS3cNcrXzBNp1MAmM1mKcWcB4Mjs/JAVLQIMbMHiJ+5GHGpNOz70fVQnmMpq6Fj26m+9HZcurDIbZxwgB/VesChYPHi3Qy5UithWbjQl6AnoBm5MFV2XJzNZve27/0k/sQWwb5gH4LVBFk5iUWiOayur02m0+Ecicce1EV7jT57lmk/LNp7+9N1r9cM/eQxrLBWbLk4k6CaDuBwFUvzT0ayPpZyYw8yUocC68ORxpwkEXKK84OD/WavWVmzfntSRCqFk1Cqh6Cfm4oznqJMpzylgDAXYcnARKFirpCBKghrstK2B9AlzBCAUWF3ti9cKeNB1+7uH2ATQo0Q226unfJ0sl5Xk1BPouIs5YbDSh14r53f396J2ykrZUXN893d1HYWSifEUFXT6Wqo6yySVPfaHLq8KZSAcNpMq+ZA5P7du0koAwFhVVVRoF7bOLe2wRUrao4tpDmnfUiaMihmwNjo7LUzK3HeziQFrprNl3S60QK2KppTTYzV6mSlQa6BKwVWIFWVPG/nexzv1kGrejKP0sWwRohVJZLEov8akKpAjJyIFLUSocnGiwREjEIAoAwIms3AHFB6fx4UoIyagTM2YboxIchtyjvbXXsAWZVV7dxOaC9U0gu97RuZqoPtZ/p0QRkFqARQI6xWCFjP4wpq3pl1rZWa69Dr86A1aMlYsl9JzVRgsbEciUiimsj/oremqJSRLqyIh2MsggXLc0opxUU3um2ey2aR0Nw7xtEQu20sxz8oukgWZSoRKKuPBhiqsRYTzaD81JcS291IJSev3gfzTIaIYZSnI2ug67MsAotTmKh087nVaVp4MWchtK3O4U6RRUQYRy2OePiPjlZJPM6SDh8a2e6ljnXRNVJCW2pafDho+w7RTyIapB5K7wiSqhCxVRoxcQih6zpmhoWYaYkJppwoESBmySbdUNd127ax66wY1u6UbNIKoETcNA0HzlmGAJaomkw+VGWvm7NUFZTQ9agMYhAZL2LiRCbCoJotLty2nbXm68J0Lx0VTLdXGMKyKclR477xzLZodRo1+DNTCKwioIJEFrG1ALGqtm07dEENAeKhyNoO/FYWPQ7Ww0gqejC7w5EJcNHJ6fWaLUCMCDF2OVNd19bCxEzMBArEhJmOFqeU9wCoolzT0BFsb4mYAdEUkyeTiYiYXPI4bo6IVajsdIWoIiUlYLLOKccAzMxFfiVn64cphmzFyg/tZNc0FfOptmsl5/u790cSKL3eUe9AVOSGCFU1pxxjyinlxACamBSkqOYJqWThrKLC5q8ogzubyQr1+ntif6O8/Oh+VD2mOLc/1h6q1+mlh9BkWNbW1l588cWu63a3d+59dfd3v/vd7u7u7GDWxS7llGMuF5+hj68UkzroC8NBckopcqkmNvEOG11DdZqIFhvww3XN/RyCS4OZFt4w5UysKop6dLT7GuABYucHzFGbVD/3RznLwbFFh0erYClGND0EUhYUzEKICREhEyiq5NTlHFUioBDXo7sdB2ceS9+1XXvQzlcnTVEYXkROtbTJDjGfPpRaAqhF3giXo1aLv6VWSiuSbQ+fUsw55pxEsuZs7g6KLFRp1axsnuNmNVMjUCkFYBAz0MkKCCFwaZkd/g7h0FMzngdxvP3SvjZmUYgyvHOwTJkW1z4dpsicZQjFW1kxmN+cEgJZUyb2VV92qRiBQHJMWZJIartZ282CpAloCGGlXpkS73WzTmUus6wti05iO5VuLcaJKAfOhBOlGLWmjDqfaF4LXE8mKcMc865iaxVDSIKkQBZlLXWxfbcKLHyJwYQ7EBA1gwhoRs0S55qjgkCOKJk0I2YlzaRVU1UhhBBySvP5PMeESCoApEjEVXX6xRd/8qMfHezu3v3qy6/ufgFIQrgbM8x2VzVPJE95Sq3CZJICZQY77xKiZBBBMknfTBoyUSYoSX9GRAr9MkUmRV2Kg1QYBBEViZTJGsFFFICKvj8RUIUQFVHAouakAGL7DCjKhmTbHhyMo8tXLkVvGwCARM02AYpjTx8/yShCKBWmNYovr1Wvnl37yXrYxK5WqVHrQIgqSixaB8qrKygYd3Y7zRAYGQEEVCTnvh3R1LiKA0AfA1rkhYaY9RBJ7hf3xZI/mE4MWsVHO/fhsDzi+LAxxJ6qqp40qa4qUJBRjUx5pkJOKcaYUwqTsL62Np1M7u/stO38iy9/9+r5nxEjZfOtKi9LpXtSLRnORFhViFhVIcbYtvOu6/ochJjwq46MCp1n6EhdxqEdP23OBISxetrYI64csURiTIu63l4//mgo+fBQN+l+GjtND+VFRYS+bOvNpgv7an1z3ipKcKhChDkDh4AiFKPkPJ/N5/P5xsZGv3oSADCHKlQpRM1iPazEPJ1OV1ZWQuB5m21xJLDc1pASKjkbOtwKcLREGoeEbVYqh90sgr30aTEXt6LKcvYnHE4xfVbLuokka/H+E11Y9g0zj2kuWwwegUkhxe5g7/5kOs0AFUBAwoBAApCRGBFQ+6VPsej2QV5brzcnKyG3B/u73bxaW12rQjVdmXKU2e7uuWYlTGpOUhEhNwdx97fb91ZOrU9CkK69t7M73VyfTEJA0Jxj101zZqDV1VVC7OYt5bSOcRXaO3/251/ttgIVIqpmy84Gorqu1tbXJyurm6dOJ4WDNsUYWwZZOX0fptVkgswAcG9nHzIBB6rrKtSkoDHt3t9rmqZqQor73Ww7xIONdP/g7v1uFqtp2NicvrQ5/cnqyn/957+PUlXr5yZnX7nfCjKt1EGUVLFTZA4Cinno6BZUQGTFsD/Ltaji5NTp04qcQQWyaDIpAxSoOBS3eKUohFQLpgRColzCoQJoOVRCDKRi+lGiIMCCk5kgVWH1R3VX/W725Z93+3c3iEAFMZfSKFv8chZQ7stdQUrDLhXvC1Qph2QkQJVasqL+ZGOlQfwdH/zZ7kFM2XIs0pdwLUkPj5qdF3GHIRRi47CvCEM7zmrvRZlJAEhFTAlxIZE5SGfpUDiGgApWd9B2KaUkGUZK5USl27e2Fhk5ZDRkW9ssgmbKpAopIZlkKiqTlXYddq7HRdV9cfnDDEooQ6mA9cgPopC+CjwzuU7rcxNRybm/eWwMiGjfioZ9ZtxsFaxCAwmJLDW+yMOAwPh4tXBVOdQUYsG1RWi4P4Lh11qGVVEPtZ0NVZelnEd1kNM9dC8rIFJVmckKxJgAsOu6nDVhbtt2b39vbW2NmVKOXTdHhJTqrpubcYhIFknMpCoxRiaipqnripms+nhS13VTR0y5O1BR6yZMKYNqDixWT0qIoJJzCGE6xcmkCSHEOFQaqaKKCALmmEQlpoTFMAYIKYSqqoJVcxMRcwihUoUQKiK1Vn1TGbaPz2Up1JRS16VBMWPQxxibztldbuFmC50zc1UREeU+z2uH9z6gbDrLaWQ3ByYrYfrCMca6rku1dexUxSrDck52Veu6QYQYY9tKCNQ0TSnW6Q8F/Zdol45CYFUZjHBNsz2nbH/WUgdZcpaspChIRIECMcW2NQMkERXRuq6GQuMQKmYy70HrDjQVC7s4VrVtla0m5dyfVpSImDjFLF3MWVKMVllvrRoIKKaGaW0uICo5EJ3e3NSc57ODnDJgv5dClF6QEIcji6pITimmGFMXUwiAkGK040kfIBZhAQFggRBAGIKkCAjIzCAVMSNRCFVfWFNMaUZlNbZvMqu7EmwQgb4gptT35Kx9IfwiiB8CTybNqfX1l3700qvnX72/e/+ru1/du3vvq6++ur9zP+WUNWM2N2AqaU4t+zQzV0iiMSFR6n1TEQGIKVRVUzehCkRk16HtEgD0w9LWI7Lun2EXWiaVYsDRRzPsbaMZafRVAeprmQeInR8yQKwqSsFKfsoKPkg7DdMBoGaRlKWLUQGqQEMy01pDUDPkJNKpZNXEoSxjo8IKAEARiCnF2A29RUWHQKwAlUaSW2Ue7AM6OKpfWj4bjMNStlaZZ62q5JyKpQ+UYJkWvVLkZhpWNqrpRoSqExNxD4pAGUjRJJkQkbmCQZR9USJ86E+DjuJqfclz2W/1CrTQd+/b6V3wUNwZlk/u0stX2vm+5C55ETgXQCCFHNtu3uUcs8ROOlBt6mY18AogJ9AYoZ0HogkiKjSimyArIGt1CBQ6IlFoBVc1sOSadaI6Rc2Sd4v0HysRWBluImIEBqTiEWQfc+gUAbAGU1WJoBkhQY6SY04dSouqiIogaCVJJrYH1Suv/Ognr7xy7uzZ7e3tf/kv/sWf/smf9g11NKmqH7/66s/+8A//4Pz5djb/zb/5/P/zX34Sc4SACNjmVOe4EtMEhSFBlpYhqmYQBIUsgIBoegtUohoEZoEhSGIaTAgKSqQAHJAFAEAIgYCKOQyCVdQSllKNoq6JhEgMTMBgDunaHyZhUbMhQzbcjA17M1e1avzSgS5kF5EIkRAIBUATSWoorwR9eb167ezKKxvNBsWppqAaypMyA1jcZz1QaqovULosmjHnmFMWDmzmjqPCAYA+dC1FhFhhUSxQRLeh+OH0DurFYm4kOrzwsx62oeO0EyoulQmMq0+Yqa4qKq8OQz0EjGTrUhfbtuXAHHgyaZg5xrizc7/rujpUEIJpohV9EivaQgVCBAIEO4MzYRVsJqO261KKvTr5sheZ8yxRREKllBcNhfBjpeCx+5wJ1pPFKwdjtkWzOC61Z46XNu1dUheGVEVqe9Hubbttq6rMJQtq7m19u73CUJTBzCoyn8/39/eLwQiYzp2GUNV1E9suaURCWxIJcWVlOlmZHszboZbQNMWVzHxvcbjvM5qjQPa4wpGImZOASgIYxXRBVLMooMBgeDQ8wQTwB9sRyQvhSTvl9roCdnrXaH4A2pu1AoIKWagy59hGrFpAUtBKG54ERUFz1RQZ6putDDqlKKmrKj6zeXr/3u+/+PKLfCavr67WzJKSaJxMQppXKbddTFBPZm0UqoArxAiiOeaqqafTei1PViDmEAKh5E5BsiAEltTN9nZf2Ng4N92d7c9nKSlxUQRirOuwtrF+/g/+EEM9b7MI1Q2sKIUqrP/oVV5bjUlS7LquS/O0sXqqWV3VwAqqbRcP5r//0z9jhKZh0T3W/R+fWTk3iff4YM7dSjM9uzZ5ZbO+/8XdnX2hjXNh85WOpq0crE5XoKqSkrmLWz0rKEJWoAAIhIzVFGBjf8adNFCtQ1iNAhA7hAQial8CiAoi2d4lE9YKWSAhZEYQZCy6nNBvRRiZNGcWYEIFzgwK1GquJ0HXIs3b2O61khRNIEkRTGmKStpfATMSQSAdTC9K7zEHSyvYZM6oDQoz4+oqUtjrUncwzwDAwWp9x0VGSyXDx2ogAkBWoZwQmJmzmIMfDneBoDIsSunLj7BvTCvqGn0uXySn3kVKZaj+s5XRwishMCIij9dWRECLjCCTnaI1Z4w6iJkiISOpCBGKLPcAlRCz3WZcrCpUl3fCzrMSHzYdd2SrXlWBrKhARAQMOTGx9XQKAKkqEpoazNADVioVbbu42JgOHhJQ1ALHCQi7ZXFR3GeZzd6D9MHHyeG+hL6GwNYUU48dVzMPVm9DstZuRuYAQDHllLqxrIGqFf1IVXEIJKLMFKqKGJGgaWokmkwaFQHQGNOkaURypwkATUN1P6eu6yoOVcDYpbbtAJEpIEAV2MKmgyuG7RoVJKfO5GA0J7OZVFNv4NC3AaFmKeU/vTWrNbblbNrEBIAiklKWUmqykAMedDDsCYOL7JC9hpHbh2k/Dv/JjKbYbOFaZrII9SCaPCg122RlgWCb4qy0mUYaaxbbJVPRKz1GFkqmts0iOYRg0WH7dbtEJqbR76YyERCDZEAEZhQV0WRn7pyTdQojIAOLSsDANZvXOVcMVaUKdV1bJVnO0jST+bxVlbpumqY2VR8rJTaBC/vTIQRkNsUqAEGkqiouhV3XAUAI1M67GJNYQTdBFUIIle3SrO0xp8hMmgEQJ3U4s3lqf3f37t17vU5G8flBWByLVAQEEQhBck5diiFXQAARAmgwd3MA0cwCIKgsIllDpSKms2wlBChMxMgBkc09x0RERndTOUhq3/7S93BZ1RgSlbCJFfIC5D4637eYIISaN+qN1Y21M+fOztvZ9r3t3/3u9zv3d3bv797fvR9jTGJZRiUk6LfHQ34TeuF7K//RBNDFMJuHqqqqqrabvHScIwAkEehVtpmIOCD2Pet2AjZ1tb5TgYpsmK26KO646gFi50nYhgBgqXMF6LXjrZmg6LurqIjEFKkjVQTlRTgTlFFz6kQiSEQQRGGuoLTW68K1ulfT77oUUy4FSIOdTa9Np4Ilz9T7HFhLOOChvUVxqRnrpZqPG/RW6WrVGAKSQQWlLHiKJEgQmnrlVLV2OtEkZkxIoESKCkCBGUkAcs4xJmvWGK+j/VEaem1lPbbFr3c+AUU7MfUVLjCSywBAhazS9++qyUT2usQIIkDSh1+5P6GIqKhkydLNZt3BXCEDQVVxszJdq+pJVmpT2j9I7byRbrVCRAwA64FfqqoVDEGBwmQXUGNSTRsIFcR1hkoEQXcSIqBYn2SoAMlWRkWEYNZBNHRekunymkpmjppjjgeQImkEiSiJcgTNzHbJxArogABUmqb+y3/0R//2X/2rr7z88v2dnbXVtd/99neSMwAE4lMbp87/9FXI8Lvf/v4nP/7xH/zhH/79f/D3727fDcQcSFUkR01tU08BpFUx1V7qIxGISMy9QSyQKIH0dqoqorF4lQsRIQlTsBZYJERkQmRSBkFVEawUM6jmTOVkacVVgahCYDXhJns9UCQBRREhKEqfvdLUYgtdNLVBQZVAwMKbViuoQhJrbc801Usb09fOTV9c5VMhr0huUNmyKpYyUSUVFlBGacLZaa0x7UlmK90TIbbbQIZU/CDj0ssE94UJWCqqFAYps0XGBYphIyyVHB77jxIOG51XB7nSoXAlcBjZWy2/Zmk16LquqgKH6XRa1VWKaX9/b97O6sDMKIKqWfvIAwohAhMAkhKyQhYkIhKiQFUV6q6dz2cxxt5xvvj1eYj4GQsOq6LkoVAVelGZw0rxNIjNqIVlrPVbVLTP1iGZRryKSK9uhyICvVj4yJ9de3s5LF20ooDWe6I2Y/StMTIUoFg+qShaiFrXen8n6u7+3v293SSphsqShIQYmJq67qqQcwIES9SFENZPnVpZW/vq3raCICFk7AX61fThDxV3gQwO0YdNqE3jHQEgg5AqEiIzEgpokkwEKGrWc7aRl36BVsUkxca15IwGa4JSNY3aC8Dbx80WLS79AyadRKqaUqxiTASqCSQCIVYgAsQVAgr2HSpIprWukgPS6sokzZq267744svcdafW11KWmCJWyE2QGJh4Oq1+dHat/XJ/gliHJuEBYkLSrFjzpCGdpUyA09XpPKd79+5XxNNmsr/f6d7B6dOntV7fnqfOwt8p1RWHKlTTFZg0meqDrsNmUq+sTlZWU9PoZDpLwEKkXCnkOIt7It1BFo1ZUpekSyASKmKN0t5v+OCnZzcn8z2cZ9ioNjYmmxs1pfnv726nei2sncWVzagcxWQ9QvkSwNINQxdTCQetnnoB8wYTQKgwTLKyJAUs9bMJKKWEqF0qzqUIQASIDJARFVhLWwYsZkjTvoJed6EMVOYsMFeiyRqcOpf3d/dndwWzoERFYVBEFQn2pWew5CshWf0ZIxSHY0lQJGGUAJApEIdMGBhXuNsUlXtfHMwEUlEZ6RcllaxIqllKSLr3uyjDnwbtlNIcJGJbOUtr2n/2WR8oWxQAVDJfiIWngjVzlU1stBZdFQUzTwLCUlaPzIFDhWROs30rjflMFHnTsZ0mZRWQrIvNslX/K6Glb3t9mT5vBYuSfc06RPPYgn2+ADxDJ7OhiA6BcKT3NVTWWJAIcdFsCYvOsMPl9YdPfFDkHo6VTipa28PZbTgmLgWCTwoQQ+kKsFE/yNZbcO2wwalVyI6Tl0QsiiLRzkBWj784djGhlJvIjmUWHzw4OOiTqVbr2vbxxNxHojMAVKFSLXZwTdNMmklVVcUqDYCJrIJ4+MB5ZKOnJnQLZFGwQcaXmS3fbAFZE1Mcvif7c7PZDPsd8aBNMbjepR5VsIKkcYB4tG/RoVt2qJGylt+hllaL5PEh5Sv7aVHL7bEuYSLquq7rOktrgVJfa4ymX6wqbdsOlnQxxmEjNBQjD1ZjdvQeqrlgbF4NoiLm7IJcwuJW3dx1nUhWlUFax+qp7YtYWZmYBISqWqmHZGnbdqhgs49j7ZrMRTfDAsd2EbquE8FUrI8SIlYVqSoIYKCxJYT1mQASc1iZTl966cW27Xbv76pIH4LFXpIeiv/jQosjxxRjjCXdjwDAI9duBdGciTObKAcRCTNRFosOExMLUWDAMrCxaE1Q2TLZOpXLGNLxXIC919uigm3wPxpiJlbkRswceLoyWVtbP3vu3MHBwe7u7k7PbDbr2i7mZJXdMFK2UcCc89DOUpwVASjnqms74sBsDpBDCKlETgBFNcc4pCvGyV2Rst6JAooO3xqUGmnHA8TODxwdXqicDfewLQn94qqqmnLizKXwsg/rEECGnGKrmkAjaK4CEdV9Fz2qSkmbWkGvGcblsjjiUENUZjQa72FwNNeCjqu7rKMCi86VSKkZG0dsiwqiqIqaALGqIisxcM2T1TBdx2qahBNiBrZZDOzYTWCbFlOoYO7tO0uyfdEsNXTTLx49LN60VHE2hM+Wz+w4CquBhZMzIKoS9tbzCIoi0Lfgpy5KjGnWgkoIFOqqmtb1tK4AMbeaMqQUcj7F1IBMVKZVdaoK56owRQQBJU4pdyKM0DDWIiuSUSUDHSADshIhBwoBkEqTNCGEPjFp/dMKRMoQVTLkBKmFHCnOMEXKCTQBZFMoIkAChiJGr6goWSar9erKSorp7t17G2vr58+fD1VlCfcqVE1d1xy+uHvv/u7uiy++WE8mVVUhoK2lRBYdiETZxKIRlQaTJpBS1VauXDlWoppQhCiCShZQQgEyu1rti7QZFRikBm0gm49AUkySU85KmK0b1NKzzEgkSVWk1A6TABCogGbTygBgQHt1PRSmKSO7LJAgYrv7CqWhfLoJL282r2xOf3xqskZpojphrMrBoBQnkn2VIDXSSoVnV6dxNo8xNZY7VjWTKhyVpEDfgL+4rxbb/UMb/0FHYtjqDftUmy7GxspLx4aTlYpxpM2qC78qHYQiS7OYqqacY9eZbTQhquR2PuvmM5lOA3NgzAJiAb3SCrGQJkNEyFASHYRsezCCtuUYYyklLioEzrO0nIFaZSXhWEl7OGvBqCqDrH4S1FoOoe/YG1IXSCaFXtygxgnCQ1HVwQmyt4nTwTWqX7p6dQZLII2MORehAEhdDFUARFGNbTufz0XLuUAVrTzDFHmKjZv172FYWVmZrEwVoQxo7Gcj1cMd6ssJnqWj/Xhpg163XYsBnRarAei9PYscaumrkdI6WjJSfas+mFiSWM9L0Vwuqhd9lak9StCvbTlHjKCaQTMRo6CyYrBIWCnxAhBrRkxRYwQVrJvJytpqaqOCEpvvqCbIAiKAHHiloZfPrO4dzIlQFANXKysVMe3stQkCZEgxtl1Ha6tV0xBhSnkGmjLtbO9Np6enq6ttSBQzAGnOdaggsFbVblScBJlWVK/w6nq9vj6ZNDHHPJ+RCKfIeR7j3v7edhbiasJVjRAqDpON9YaVYJ5UNxo6s4ZEuXqxqUIzaaascO/u/lezDGtndLqWkbuYSodVFlEs+mAIosAl/G5fCIV6jXAV7IStlEQV1D61ACaRaNL5vWwXKSJE4mwNNCoWdiz2rdBbx5D5AKuiEFgrEIiCdABVqGn1VL35o4jaxfuikVTAiuTL7CwMiABMpm4sgAgESsWnNxCX3ENZUggUapF1ppfWVmJKovrFbJak7NNsr6jl9hgOrX1DiqpA0ZkxeysgEgRSyQJDtp8IRazUzvppS9bQTIIZuF8HFaymCbKoxJhijDnnUhRpaxCCEhAxhUDE0Hs6LhbCrAJCvadHv4YrKIqomfb0t4VpfgOMzfMUrB9e7ANKmdSGLXQp2/cF7Zk6nEGxq1bhxdZGoLdi0UEm+yHeEEtzPY6lYI88obS8FE2wRytLH7kzlmBVHhcBLk5A5hCNvafWYtPW9+JkALJi2KHQ1UK6tgu1WCr0lnF9tWm2H1m8dZB7qut6eH0LoVahspDu0CZr93Lx18piWn/DqW3crW8fYghKDpuBIRZWCky4HKJ7x1odh8PGysXDBzfrMOYwCOPaCw4fpJe0WlQpDbHUxdsDICylpEOB9uCwN3Q5jEPMg6uY9hVbIlnVjAHBypAtmmyGcjHG6XRq/7YIr0W6rX6915RCyZIwjdV+bAJjIhAgwhDYtirMVFUhRhWRpqktTmuBY/vCicr3ZR+fOZiD+VD+XD7XESNi+7A2MGJMOUvOqXcTLUrui8bHfqItqixAIYT19Y3NU5uzg5nJScPCz+LQTWrfq1U3d13XaxKVSjDV8gUBivR5hVKCxzwEWyxAzJwVAxMB2wIMpRMbiRBNuXuQPVpY/hINLZvjUMNYmLgYbMhQY8eTSWiaZm1t7fTp07PZbG9vb3t7e7fHtEdijFLs/nBwj0AYCSIjSs5RQCAnwpSTPdncI8vdR4iwEHYrQ07l8NyyCN1Y90wv+ux4gNj5IXcho/ARwqBZ0yvuLxzOc4acQ4Iup2iTsYgGRJCUpQPIoFEkBp6EwFSsmkGFrFQoZ405dzHHlKXv/y3h0OENmKBBEf2x2a0c3RX63n0EPWJTYnGiQ1K4knOOorkIyIoosGLQehqm69XKOk7WIoRsLfaKUtLsBKqEzIEtG5xzVk0AwBzokJtfr55seUQiHfnMjheq4ZFhzR4CB0N8wU7yvcEwgoJ1LQELkBYthBwt7J1B5u08dpEkM+F0utI0ddXUVBEgQtdijJWmjUk4W2NNeS5xnvNaXa9V9YpoDQiAKadJ24rkNaY1BtYMqc1EHbFylSlkrCBUSkEG+zkiYMCiH6hWqge5hdxBmkvqMHekUoEqpCLqqyLWA5eLGvOiFBsxhHD//u4/+af/NMb4V//KX51MpnXVQOnlpDale3fv1lxNVtd27u/Ou3nMMm2aYApHAVFQSZG1rigECIxsbTsEghkyoFiwl1RVsyhmBevLJtMZRS5RDslZNYMCBaagjFpJmua0mlNAIgqAkjV1kqLgnPBAIGMNIEqAASQqaVYlFSAlUlBlHEWHzJunFE8gEoqN+6K2AQA5EwgB1ASbEz672vzs7OpLa9XZKZ+qpZJUA9RYoemjQJYhqUMAqiy5IjqzOomE3e5+S2T+xqqZmIthCEhxPafeF3AYqgJo5c9a7K/69MwhKQnbRvfGKYfcBsYbEeuSgl6GdeEmoYsD/HB01kNNAJqzEin2X0qMMaZo9QWiuWvnXdtKTkBAKMgkqH0dY8kGAJTCLyYgZCUVQZHMBMzU1HVKsYsxdrHr2pQSuO37s0Lfyi2iwGDqgsdUPBU1tJG+SN/Cd6g2BxaCwjDIusHSYO5HDzGPS420rxxcbNa1L3s17RpRSYog2OeOiCjFOFi0q+q8nccYQXVIm9rBKVQVBy5vBpACTVdW1jc2VtdW27bjLFFaiQlJBg3VYwPB4915kQ8uRUrATCTSu8sSUmm7sELTcV3pMJlzv+mXknmxSDFIUZNDU30toWEdGZzb8YZKVVyMXRU7IiClJBkUKQpVGSoJVY0VAwKQZhFCUICDg/bevXhmDadVc/bMWdU8nTZNU6NIWJmkHIkA65BBUOKZ9eYnL6zf3U9f7nZ1oNWN05mqr+4fwKTuhOadpFlEnMcuM9a7s4Ptg22QamdnPm336mZFiSgEpQoxCFVhskqTSaymXK9MT61xvRJCxSGg5Nzu6vYXAKmpdFphs5L+dH8vSTVZXZ+unao4kILM9oJ2QWeTVTq91kygxUpXJ9OqmnSR7t6Lv9lJ98PpsP5ih3U3j103rwg0pwyQNGYZjBkQABmkdPYoZgRBytkchEujMSBrX9eHACCpz8ebzESWlNH0rwSRoGhdIiD1hooADCbkI4CkKCZHnAExVBXz9OWfNZtref+uzPZzN5+3+zF2UdOUsGIFEkTVjKjChIE4K6IoobIKIxUzQsQsyZYARkSAzTrwmVMrkxp//8XdWXc/pqykqIAEgwUWqAkdltEpJbKmIBkyACCLIguQQhYEe+XeWCeX5JA1ECMNfk2Du0SvHy455y7GGKOVvKlyVjGfKAZu6knFNROjgkk2oYlywbBTtKJpACmCjIz21uXQwX4kyXpkwzmSO7fSUHM2OMFL03maQ8Qje5PBorEMD+pN3/TrtkE9LOyrSwnFI0fGIy6vo+eoGTn3jacwNKgvmsoQDgkD9jdhzlmy5kwULG6mCinFlGKMXQjVEEjtizK1xMtFmHkyaeq6SilZaWnTNH3dq9jvIiEhNU3NHCziPLicDfHiLGmITQ/BuFH/awKgqqrtPdhiXSQO+jislCpa7PV5TZY3iMh8Ph+mlEFfeDgV2gsyk32+cQmwBRP7j4zji2Yh2q7rip4hEygMddlDFNueg4hVVYXAXVfUh02MuLj8mQwgUs4xpeH0Kn30vNRKq1rXheQsiJVF2K1WWlStCHQpEm2dfLZNshwjAFQ15yxZpKrrqq5TisRc15UV+ZpigW37A1eBQymPJ+QqDH7CJlVIREWLW9U0JayO2D7j4GtnF3/ISQzieCKSJZMiEdlXnSSjUFVX5154YW9/P969K6VTSsfT7HAjZFFMuW27hauFig0QZg7MwqwWABazfSLsQ8MWJ0Zi5szMIsxEzMSBiEiJgBDZ1iU0YaLiMrwI6y8085e2dkXJ085lzON8g/27qqqqqlZWVk6fPv3yyy+3bTubzXZ2dnZ3d+/fv7+zs7O3t9d13ZCDof4MT30jXX+CNI8hKaslUtW1psUfOIQQivoE9SrDI6diLEe2wcvRmndUslcQe4DY+SGDwzi2oiICs0Ot6zoES3xZk00WBQbIMcKgSgMAooKAIKoRIYtE0ERMFEZ+Gb1hrirkrDHmlAQAmRl7/VME7AsBB18QC2iNylWtYLnIWC0badkkSUiDx/WowguLii6ich0ma9XqRpiuJayTkCyS5jZhZQVUzUVogNkKqMtUS+OSyb6U09yGkEDHjUXLrfc2rxZLW+j7fhcexTo+dvd1nYqgBFbFlUVSEs0gCXPMnYLUddWEatqshDqAmcMIhCwrKhuBTgfa1BCkq2KuRaeAjSqZ2YsCCU4ko2ZUnWpW1YQgzInDAYeW6oSVUJUJhQhokDUo6w6olWe12u1JnGGaQY4EEgirKmQrYFPMilKENk38GfswuBJhSml/f38ymRDx7t5eO58jAge2aPs8x3u7O6+d/4NqZfrFV1/+7ovfJ8l1M7HuI0JQgQQopNOaa8UaIRJmJiUEDNq3q/aOGJABLHbbpxrMKqo3VMuKqgRCCoxSSWpymuTIAsCBUAG0AYnIjBIhdcBZk6AoAVBfXA6KasXLCEDIgzdIBqAiQQGAmouoigWqRFE0IFQEa4wvrU1+em7jp2enGxWsUp5qJtSamJFUsylBgFoFlwx1k6hSEW009X7X7e7DvPjTBSKAXNRgtK9JsRixFtMSAM0AgEQiJW1RxrDoyC16GNiLTMxQjLy07egt6pbuiN7Xun9U+6Ce3WXlbwow9wfhvmCk2PvlnLpOUmcmSkRARArWi4BDFzSC2nvUYg1JJRQHGijUFVdV6JiYIEUex7idpztAbDI+VNylB2n45ROswtED6jjJMV4f+yqeQ+7M41l9ONoNbadm6Nxrjy+06YeEpwBav3/fa94HiFMSFZMhFpG2nc/nc1lfr5ix9w6yc2wIYXH2Q6rr+uzZsz/+8Y/btu269Ge/+2LW7ZR7ltCEWPC4BuHRh9WhdkxBgcAm/SEvq0M/stWQEtk6gou2BBgkY7SXYiwxYkBFsnLSXOLHfeirN3Dtdd1RRFKMdR0AULKkriMhzgSiqAJYARMgIwUAQOY25t292Xw+nQSoOWBd15OKAk+mtcaJqE6nU6HQztu2xbWV6en16fb+9sHBnk6mGZtZ5i5MkoaZcCcsHcznB3v7+/ODuLs729uPiE1WoqzSdVTXWNVCDGElh8n09Lnp2imoQ1TluplOpwQgqU2znbjz53HntytrYbVZ2Vxba0Jzb6bT+lSzcjrUE53P5/u783tfroYYqjhdT2s1YW4RFAS7KLtz+GKOX8Ymr/0Iw3obIaYOVAJzSjFJTgpJwQQGGBl7FWg7uKWUES3wsRCaFClJaFYkJEElQqSSfYaFhaEIKCnJ0Mbe6zVg8XwkVHOTIQEQtJZsROJ6GiarL8vGqbx/X2YHefvLdm8nt7tACKhEas2yoJqFFIkUUIEIEEgAuVdzEESQTEjEQKq1yHrNzKttimFnN+7szVNMSoBBoVTMDUO3b7035WQrchYWUCRbmaFomoCo2S8ODa2qKDmj+TYT6XC67tcmM7VIKcVkNWsEhP06h8gh1FUdONDQRQ+DYHZZm6S/AYsJAYFmq6MYYnbYF9QvMlCH6uP0UI1p6V8uFhceIH4Wo8QLveAi5j0owC/Sm+N+mWE2Py6ku2Qg/Ajx4mNziic+cVHS3Kcmh/8uSvwwVAPkoaLTCoFtqRVRE1EtjfrMFtW1IlBEruuqDxNzXddWpTt4uzFzzlJVwSJXJimeUs4pAQctAn4yxEat0Nj0FixYZ/FN0/ZNKdV1qWwdQtImfLGkAjGUpuYsiElErAZzkP0dNgwxxrFDbM4557TYIKAsVQr3j0Mvf7FcLVuidQCIlCXnnJumMdWIYfc+hLMtXSW9jKHtJXLOglAFRizBa1Py7ZNiGEKoqtB13Xw+H+12xIZlcQcYlUUPnnhDkbWKEhMCSM5Zc13XFpslruq6iZFTajnUHKqhX5eYh0My8vDO8+CjqKDm3RJjBwAV8xAjthFV/KIAAQAASURBVAvbdZ30DFXqtv+wL9fGAABkySpYBe5jGxoQ19bWTm2eur97f952cOJtoqqSJZuuBVu7ImJe6Ahbna+KCDH3ZTq0MFAlQpKcJQQSsagxBWFmYmZlIlXrgCRiW1vYzjVqUdTezvTkG3ncyrxkrTEkIWwwrK6unjlzpm3bvb29nZ2dr7766quvvtrf3++6rm3bnLP2V5LGTlOmEdGnrxTUaszbtmPmuq7qpqnruqIKiMw2ui+Ey4rIZOV3kHLxNi494Y4HiJ0fihdeeunCX/8bTGx1Q4RQ1fXKdLq2thaqyhY2ESuwFEQzlqVB1NDiilUgUQFJAJkIT5/aWF1f4yqYSLCKZhHJOaZ4cDBb2zi3t7t3sL8vXbu+ugoqqeu6eZsVlVisarVqkmCXkm3AaSy3g0RMjNwbYJYuW4XevgNKz6stutk6kGIUkTYpTVbrtQ2sp8p1FFIl60PMxVveFiLqZbgAAbNKzr18Eo4+PNChHZxYTZkM6XwZSeWVczCZ0bAUcyIYEmlijVeDxEZOcTafAWJTVWaGoAoqKUqyCmJAqKt6UtWEjP2aAaAh6ySlFzSfA3lZ0lrOFcrBfB6T1HVdMWvKoBKQAajLKYMCYsWcNceAbQg7GCJUDTc/4ZCFEoIQAAOBoJqFmYKmnDvNUdMcUsu5I8ikggBcxgeJYhYz8UZiKPVl/T7Jsqsi+Wc/e/WVl1/e2FjfP5h98fvf/jt/4+cAQKFS0CSZFauGVbs66Msvnnnlhf+mVS5beJdFa6Azk7W1Zm0fwi7Ws6qah5CgVL0DMCAXkVpRBAEaV+QQAyCKIoASCzBoRcAoKF2tMlVdVZUc5ymjZrs7oK67euU+VjPipHm+9+LB3TMaO0QEUWZmCmD2NMhqGWAkQO4HatnEW+ifkUCFERm0Jlirw+Zq/fLp9TPr0/UKasxBM2siUCYiZNGMmhGyaDaxQuuGlaxZIGZ9AfCFLp396u72bB6ZeTJV5JzLaNbeDxJ6r5u+2FFxqKgcWUQCLpdgDgHiJX3hxeG2bzhAa0sXAdW8kJIQCxDZdpKJqlAF5lCFpm6CmfswW99ZYK6qejafc1X96JVXui5ubqz/7A/+4MzmqUnTFMvbQei8FwYbol3Ui5v3zpTWDSAqIJpTyjlnlby+ccoXgmeDU2fOvfYX/m0yqy7ivnbW5vaF4INaxwlhbySnMKrFWkR1qZxlzZ+HsAgUYllrSjutZBGxWFvxLkkpIw1KCja326HXpj6zTC2HVyniNCAqMcZQm4F47rpuOp2cPvujs+denEymtlzYvnxlff/g4CDlTJZnJUKEH//0D/5b/25Ewq6N//if/tN/8cefdUlC3XCoNQtSseQqdykt6mhgkABQUOltXSWz5DMr081JNQGtEBqiwBzsz5VKluK5Cv2ykHNOoLmUD0sWyaJZityfIoliUulE5ynPc25j2uvi/rxLClQ1RbkViUOYTKdcsaV1ERmQuao51BQCMmMduGkQQLof5/mrUz44d4pW6gSQFDVUgauAbcdtXM065UrbKPPZ2bXJalOdJlx/db7x252Y6fQL56rppEr57t7emS5tICTmLsv9+7vzeXzpBaAw5WrKVE+bKYB2IpkZqmm1emqyempl7VQVaq7w4GB3b3/31Ooqa4qzlBpOzeqpP/jLZ1/crOqm7eDPvpytnV6frJ2hqk4p7t/7/bxOuHL61AqvTWltVVdXaGO9rggQuI2Mc+hWuXpxwtMXgSaSRUWwyEvkrJIFAQmICdlmzKGpiojKkCuWqGViJySk4jFIZAlvIuRhE1MOqyJ26ibqe8FtnRBBUAvMY6/+RYxROtXMAAGRVEw6qSJlEZ3tpv29g69+G3I3Za05kUpAYEJQYOLAwRJ0FWJjjsimg02qOZOdhgVyhqSQEH6aYXs+/zdf3r23fzBPIFRlCjLEySQVU1hb5xQZ2fZHzMREzIxcwt7W3A59mzYiMjEXVwiwk/lQ+GhThp3wJUuMMaekoFRiAYBAzNTUk+l0GtgUq8DsJTVna2xCQhXRIZRTVCHZcreHQkI49O9orzA99lO175QQF7o3oEpIktNkuuILwbPBH/yFf2vnv32XbT/N5vQhCpgFDrrUtZ01pBQxIShdYSaBq1Ck8rM18hMs2kRGKQbTJSVmBBz67ssYw8NB6nGs95imq8OD05YVxPX1jcl0OpvN9vb2gQbzuzKDrK6unjp1yqK6OecYO0JCYi2h8BLlDoFFpKqqnPNsNkspn9rYUND5bJ5znkwngcPO/R1VXZmuZMmz2UxETm+eziIpRQvmWqCQORCxZDHZhLpumNkSsSZlFmM3b2e9aC93XUeEdV2HUInkdt5lkelkmrN0XQuAgzIvWfMiYpYiqQeIlsQtJcaEJuBglzqL2Oedt/OD/YN5O0dEM6Ht+/DMmRYAgJgChz42KsRUHEHQTJiDlXcSAhPbDnsyaYgoxpRzUlUrVB30hcdlyCKaUsxZAIEJJecYOyQKHIgpdjHnbJ5vohq7zkz/+hMuQPGhtSVCEGGkLxxENKVkAeXYxRC4rmqLR0+nkxCCBRCrqkaEGFsE4F4uWbIgQTHz7NuNVAQQm0mjWWKKOUtdVyGEGJOmRIRVCApwcHBgIdEYo+SMRCkltrrdQTyzL80uNdSaKbBVXluhdgihCvXPzr/2J3/ypwcH+6JKvBD9GArs7NTOJXdfNU3dNE0IgQMOGioAyGjWpBw4WDVwXxNMCGj/z1xayIjs3/YM0/StzCpjsWYRmjBmERRb+LHAoNV5KITbVzlYBTCMLIv7DMRwputfFTTGdHCwv7e3b/Hivb3d2WyWsyAC2axkr2kxDsJFddEovWH2y6W+oQom80JW0Wxtf6J2/9j3YprNCF678/SnN72tyXEcx3Ecx3Ecx3Ecx3Ec5/nEY/yO4ziO4ziO4ziO4ziO4zjPKR4gdhzHcRzHcRzHcRzHcRzHeU7xALHjOI7jOI7jOI7jOI7jOM5zigeIHcdxHMdxHMdxHMdxHMdxnlM8QOw4juM4juM4juM4juM4jvOc4gFix3Ecx3Ecx3Ecx3Ecx3Gc5xQPEDuO4ziO4ziO4ziO4ziO4zyneIDYcRzHcRzHcRzHcRzHcRznOcUDxI7jOI7jOI7jOI7jOI7jOM8pHiB2HMdxHMdxHMdxHMdxHMd5TvEAseM4juM4juM4juM4juM4znOKB4gdx3Ecx3Ecx3Ecx3Ecx3GeUzxA7DiO4ziO4ziO4ziO4ziO85ziAWLHcRzHcRzHcRzHcRzHcZznFA8QO47jOI7jOI7jOI7jOI7jPKd4gNhxHMdxHMdxHMdxHMdxHOc5xQPEjuM4juM4juM4juM4juM4zykeIHYcx3Ecx3Ecx3Ecx3Ecx3lO8QCx4ziO4ziO4ziO4ziO4zjOc4oHiB3HcRzHcRzHcRzHcRzHcZ5TPEDsOI7jOI7jOI7jOI7jOI7znOIBYsdxHMdxHMdxHMdxHMdxnOcUDxA7juM4juM4juM4juM4juM8p3iA2HEcx3Ecx3Ecx3Ecx3Ec5znFA8SO4ziO4ziO4ziO4ziO4zjPKR4gdhzHcRzHcRzHcRzHcRzHeU7xALHjOI7jOI7jOI7jOI7jOM5zigeIHcdxHMdxHMdxHMdxHMdxnlM8QOw4juM4juM4juM4juM4jvOc4gFix3Ecx3Ecx3Ecx3Ecx3Gc5xQPEDuO4ziO4ziO4ziO4ziO4zyneIDYcRzHcRzHcRzHcRzHcRznOcUDxI7jOI7jOI7jOI7jOI7jOM8pHiB2HMdxHMdxHMdxHMdxHMd5TvEAseM4juM4juM4juM4juM4znOKB4gdx3Ecx3Ecx3Ecx3Ecx3GeUzxA7DiO4ziO4ziO4ziO4ziO85ziAWLHcRzHcRzHcRzHcRzHcZznFA8QO47jOI7jOI7jOI7jOI7jPKd4gNhxHMdxHMdxHMdxHMdxHOc5xQPEjuM4juM4juM4juM4juM4zykeIHYcx3Ecx3Ecx3Ecx3Ecx3lO8QCx4ziO4ziO4ziO4ziO4zjOc4oHiB3HcRzHcRzHcRzHcRzHcZ5TPEDsOI7jOI7jOI7jOI7jOI7znOIBYsdxHMdxHMdxHMdxHMdxnOcUDxA7juM4juM4juM4juM4juM8p3iA2HEcx3Ecx3Ecx3Ecx3Ec5znFA8SO4ziO4ziO4ziO4ziO4zjPKR4gdhzHcRzHcRzHcRzHcRzHeU6hd999Fw+ztbXl18VxHMdxHMdxHMdxHMdxHOeZxyuIHcdxHMdxHMdxHMdxHMdxnlM8QOw4juM4juM4juM4juM4jvOc4gFix3Ecx3Ecx3Ecx3Ecx3Gc5xQPEDuO4ziO4ziO4ziO4ziO4zyneIDYcRzHcRzHcRzHcRzHcRznOcUDxI7jOI7jOI7jOI7jOI7jOM8p4QE/u3Pnzq1bt37961/fuXNnc3Pz5z//+YULF9566y2/ao7jOI7jOI7jOI7jOI7jOM8AxweIt7e3r1+//t57740fvHXrFgCcP3/+xo0bHiZ2HMdxHMdxHMdxHMdxHMd52jlGYmJ7e/vSpUtL0eGBO3fuXL58+e233/Zr5ziO4ziO4ziO4ziO4ziO81TDFy9e/OSTT8YP/b2/9/f+2T/7Zw/+tdu3b+/s7Pztv/23/Qo6juM4juM4juM4juM4juM8pRxTQXznzp1H+c333ntva2vLr6DjOI7jOI7jOI7jOI7jOM5TCp30A9Ma/vjjjz/++OMbN26cP3/+6HOuX7/uV9BxHMdxHMdxHMdxHMdxHOcp5XiTugsXLnz88cebm5v2nxcvXrxy5crbb79tPnUDW1tbd+7cOTZ27DiO4ziO4ziO4ziO4ziO4zzhHFNBvLm5OY4ODw9+8MEHSw8CwFLI2HEcx3Ecx3Ecx3Ecx3Ecx3laOCZAfOXKlaOBYADY3Ny8du3a0oNLBneO4ziO4ziO4ziO4ziO4zjO08IxAeI333zzpGdfvHhx6ZFHdLRzHMdxHMdxHMdxHMdxHMdxnjSOCRBfuHDhpGcf/dHt27f9IjqO4ziO4ziO4ziO4ziO4zyNHK9B7NfFcRzHcRzHcRzHcRzHcRznmYf8EjiO4ziO4ziO4ziO4ziO4zyfHBMg3t7efvTf93Jjx3Ecx3Ecx3Ecx3Ecx3Gcp5RjAsQPkBU++qMHCBY7juM4juM4juM4juM4juM4TzLHBIh/9atfnfTsW7duLT3iAWLHcRzHcRzHcRzHcRzHcZynlHD0oZs3b167du2odsT29vb777+/9ODPf/5zv4iPhdu3b1+9evXo4+fPn3/jjTeuXLny/byBCxcu3Lhxw7+Op4VLly4d+/j3Nmwcx3GeXq5evXps15TNn+fPn/9+5vCPP/7Yv4unfcxsbm7asHHtNcdxnO+Imzdvfvjhh0cfv3Dhwptvvnnx4sXvZwm4ceOGF8k97WPm+9zsOc5TBF67du369etHJ9mPP/54vMfd3t6+fPny1tbW0m74s88+863wY2Fra+ukYB8AXLly5YMPPvge3sDFixf9pPo03cCID/jp0Rv5W+KxDMdxniUuXbq0tLEZ73A+/vjj7/oEaHO4qvp38QyMme9i2NjJ9he/+IVnfB3Hcd59992jgYuBDz744LueKm0J+Pjjj7+HYLTzPYyZxz5svOTOedqhk0b2a6+9dvXq1a2tra2trffee+/1118/uiH2QonHzsWLF/UwH3300ebm5s2bN2/evOnXxzkWPcKnn3564cKFk8rSvzE2IfgFdxznWeLjjz8ez5+fffbZlStXLC/uF8d5lDHz3Q2bO3fubG1t3blzx6+54ziOce3atfH0e+/ePQvGvf322z5bOo8yZr67YbO9vb21tfUATy/HecKhBwzu995779KlS5cuXbp69erR22Zzc/PatWt+Bb9r3nrrLbvOD9CGdpwlLly4YMPmqG644ziO8wDOnz//wQcfbG5u3rlzx7f4zqMPGztq+rBxHMf5Ptnc3HznnXfeeustP/g4X3fYWMePDxvHGTgmQPyInXF2fPIr+P3MX+P/vH379qVLl27evGn/QETLU1ko/+gzxw9ubW1dvnwZERHxtddee/fdd4/+udu3bw/PuXz5sp9znuphs729PX5wPABef/319957b+m3bt68+frrrw9PGNbLmzdvDhIoR0ea4zjOs73yXr161ebAd9999/Tp0/ZvS6Iv/eLSg9vb2+++++5rr732gFV1e3v77bffPn369NLE6zylY2a88o4HwOnTp99+++2lAXDnzp3h27cnDL9+6dIlU0788MMPL1265Psxx3GcR1y17eRy+/btW7du2Qw8LOVLc+nRB086DY0ZJvaTDtTO03teHg+Ay5cvLw2AB+zrrl69amfkIVzjV9h56jjGpO7GjRsffvjhAwb05ubmjRs3LE3nfA9Y7fCbb745zEpbW1sXLly4evXqMJ3Zg0fPnOMHb926dfny5c3Nzbfeeuv8+fNbW1vXr1///PPPx+rGd+7cuXTp0ubm5sWLF7e3t2/durW1tfXpp5+6fPtTh42Ncb7n5s2bb7/9NgCYbJYJUHz++eeDRtLVq1ffe++98+fPmxKTRZO/Bz0vx3GcJ4rbt2/fuXPn/PnzwxR6+/btra2tJSW7YyV3lh60Y+eFCxfeeecdkwsw+cLx5Hzp0qU7d+7YIzbxfvTRR77LekqX3fHKu729bQPg/Pnztq26efPmrVu3hm3VnTt3Xn/99e3t7YsXL77xxhuffPKJpf8fr3+A4zjOMz/92uI7LJ224N66dWu8attSvhQNXHrwUU5DZlV38eLF8+fP3759+/r16zs7O645+2ycl99+++2bN29aMMTiJ7du3Rrvyh5lX+c4TzEffPDBxcN8+umnqnrjxo1jY4JXrlz57LPP1HncmPHX+fPnrx3GvoV33nln6Zk2lw3fhT24JGG89OCFCxc2Nzfv3bs3PMEmPvvGh5e9cuXK8ASTKRj/deeJwr6yo4+bdDUAfPTRR4M8IgBsbm7a123SS7aSmZbivXv3lobQvXv3Njc3Nzc3H/rnHMdxnkZsEbxy5cp42bVD4Pnz54fZcngmANy4cePBU+L4wY8++ggOK9/ZUvvWW2+Nn3zhwoVhabYnXLhwwb+dJ3nMHNUgNun/pS2TjaXxtspS8sNS+8477yy9mu27hmFm/3lUPNFxHOc5xKbEixcvjlftd955xw4sH3zwwdIzbQYeVthjJ/Dxgw89DdmTl85TduYaH7GdJ23MHF1GzTlgacdla/R4V/bpp5/aALBHHrqvOzYm4zhPEeHKlSvHlge+884777zzzu3bt62OZnNz88KFCxZh9Kj6d8edO3eO+mwOvQ/ji29O2V/r67AalvGvXLt27Y033lh62XFB8cWLF69fv+5djU841jZ1bPpnyHa+//77duYc0pvWCmAdrBcvXrRveZwWsie424PjOM82x7ZMbW5uLhUZ2aJpEb1HX3aX5lU71i4l4MeaXUOHh38vTzJHpUWGSMRQRGb1wiZpPX7Chx9+aL5zVnq2NEKG86pfZMdxnGM51jT7/PnzR1ftixcvjmfgb7BqH3saunbt2vg8deHCBdN7HHLJzpPG9evXj8ZYbLUdiuSG8/JQaGVP+OUvf3n9+vVbt25duXLlEfd1jvP0Eh78YwsK+2X63rhw4cJSf8qdO3fef//99957z1oOx8/8usH6ixcvbm1tvfbaa7/4xS/GNeNLb8C/haeOo9sR2za9//77b731lo2Tpcar8S/apsdG1M2bN+/cufPmm29evHjxwoULLi7hOM4zzzhzZvzqV78yn96PP/54PMF+3bOfJVnffvvtTz755I033rB21KNihb7yPo27taP+ECbM9ctf/nJQCzm67ALAG2+8MQSI7d+vv/76lStXHjBCHMdxnIErV6784he/WJqBr1+/buqL4yn0jTfe+AZz+0NPQ75qP3WcP39+KYZ7584dM5W1yC8AbG9vm3bE0jNtL2fn5Ufc1znOU4wXUT8hPKAf4d69ezZPjbUgHqwmceyD9+7dWzrcvvXWW0OXzaO/rPPkcNJdPMhHDG2qjzIPLIlNb25uLknK+KThOM6zxElyAapqydqhZ/DYZx47JS49uOToa0JSQ+vio7yC87SMGTthDmNmaHA+lqFBdakm/cKFC0e7pF1iwnEc58FT4qeffmqHlwc886ESEw89DT3KKzhPy5ix6vJhzIxL8Y5N+T/Kvs6DJ87TTvAQ+ZPP5ubm+fPnTQT922QsTZXCVPw/+eSTWz1uhvNMjplf/OIXt2/f/uSTT8aHzwefV03V2kaajZAlOx3HcZznhHER6LcsdLKexGFevX79+q9+9Ss7yjrPEr/85S9v3ry5NGbMfe7Yo6b948aNGzdu3LCO6V/96le3b99+++23f/3rX7vfkeM4ztddtYci0G/zOn4aek64cuWKVZ2Px8z58+eX6tOHx31f5zwPeID4aeLrLktjJSab+6y94q233nrrrbdu3Ljx3nvvXb169cMPP/QA8TO8Txr+8/bt21euXFkaRVtbW5YFtUYba6uxle+DDz64fPmyZRG+luym4ziOL7vQyw5Yj6oZXm9vb7/++utm8OA9qs/8smtDaKn5dFhthyX4woULJvn17rvv3r59+/XXX79586YHiB3Hcb7nhdtPQ8/hwr21tWVjYNiVLa3aQxTF93XO8wD5JXjysQwVPIL64dLR9MMPPxy/yKVLl5bU2X0We35488034YgX09bW1qVLl0yP/+bNm5cuXbp169b4CT//+c/90jmO8xxiE+OjiA6PV96lOfbq1auXLl0am9tYS5Bf3ueBixcvbm5u3rp1a2lv9vbbb1+6dMkevHTp0uXLl31j5jiO8y1577334NFMesZzssX1xou4n4aeWzY3Ny9evGjF40tD69KlS/ag7+ucZx6vIH6yuHPnzlLO6vPPP7cD57Vr1x6w4Nk55Pbt2++9996VK1fM2m684JmG+s2bN1999dW33nrr/PnzW1tbFi8+to3CecZ455133n//ffvGbQDcunXr6tWrm5ubpjtx5coVs3eAPiaytbX1/vvvb25uLhWYm7WOX1LHcZ4NPvzww6XDwIcffnjnzp1hejyJt956yyZSe5r92ySh7Am/+MUvtra2Ll++fO3aNTt13Lp1y9SiPA74PBw1zfr80qVLwwC4fv361tbWO++8Y8volStXbt68efny5V/+8pfmJGyZiSVPpM8//9yvp+M4jvHJJ58snZc/+eQTW8cf3Hvx5ptv2vnXemq3trbefvvt8ar96Kch55nk2rVrtm27ceOGDYCbN29ev3598Cp8xH3d9vb29vb2Q3MVjvMk4jLMTwgPkEU/f/78Rx99tPTMo9rnprM+PpmYFM7wzGO1kwbJdjepexp5wF187949+6l5Gx47ADY3N8dDa0l0/+gThr2RDwnHcZ4BHlAgfOXKlcFy5CQLmk8//XRpzvzggw/smcNzjnakXrhwYZiWj53DfXv25I+Zk8yIluxhjx0Ab7311jC0jroHLz1hrGnoDkiO4zznPCBre/HixWFt1ROsyQYT7/Fab88cJtgHn4bcpO4pHTMneb3aGj24yx47AMbbtofu61R1+HU3mHWeRnA4ijg/LKZuc2x0eCmoZ8800bqlJ1sWa3t724SGNzc3B3m74TlmhGKvbM95wMs+4G85TwIP1h4ZvujxEBoGgIkeLi2B5mFoQ/HChQtL2fLt7e2bN29ub28f/ZHjOM5Th2nJHXvOPPaZR3tXt7e3b926ZeXG1pwx6NONl+atrS0rUHrrrbeWVuSjf+4RRaWcH3DMnNTFbD9d2jUNA8DaV49uqExJzH7RRtHSeLAh8c4773g5kuM4zzOmEXz08aNzsj3z6DkaAG7dumUnHVuRB93h8aH4pNPQsUvAg9cF50kYM8eOhPGIGm+6xgPAHAKO/tZJ+zr7qfV/H/2R4zz5eIDYcRzHcRzHcRzHcRzHcRxnwdbW1gNyDFag+YD6OUtKHVsE8ATiAWLHcRznRIYCim+24D3Kquk4juM4juM4juM4TxRbW1tmJrEkfQ4A7777rjk8GRcuXPjggw/Gp+bbt2+//fbbY52AY1/niYL8K3ccx3GOZXt7+9KlS2bWscTt27dff/31y5cvm5vHa6+9duyq+dprr129evX69euXL19+/fXXjxXScRzHcRzHvI9Onz6NiLaqHtXAuXXr1uuvv46Ip0+ffvvtt48+YXt7++2337YXef3112/duuUX1nEcx3G+2Vn42IOwLcdmYPjRRx99/PHH165ds3Dw+DkWHb527drHH3/80UcfXbhw4fr160/4uvykVxA/VNPHRXIdx3G+I95+++2bN29evHjxqIumRXvNw3d7e/v69eu3b9/+6KOPhjLhW7duXb58+cKFC9euXTM9dFtEx55LzhPIg8XaHnFpdhzHcb4WN2/etIOl6V0O0+zHH388zLRWrGSnnuEE9Nlnn421U1977bVhfrYXefLrlZwHhyceetT1RdlxHOfx8u67737++eeD2PTRlfT06dPb29ufffbZcGKyg/ONGzfMyfC99967evXqlStXPvjgg+GQ9dprr21ubt67d+/J/eQ/rEeeXaxjTT8//vjj8en0nXfeGfuJmw/p2ETy/Pnzbh7qOI7zWGbmd955ZziKXLx4cekJN27cAIArV64Mj3z22WcAsLm5ueTh+9lnnw2PXLlyBQBu3LjhV/iH5fz580e/U/sSx0YcFy9eHH99j7g0O47jOF+XYQ0dZt179+5ZwvXatWv2iKVXz58/P8y6tha/9dZbw+vYrwzr7L1792zG/vTTT/0iP7HY7ujo449y1PVF2XEc57tgKWo6rMXGRx99tLT+Dsv0hQsX7D/tKL20/toy/dFHHz25H/wH/NvDruXoamcXd3Nz85133rEKtaNfgF3cixcvXrt2bXB29g2Q4zjOt2TJrvdoMPGhC96jrJrOD4IFFI5+p8OKfOXKlWvXrtl5dRyJeMSl2XEcx/m6XLt27WgCdYgI23/atPzBBx+Mn2PztoWVLco8PN+wWpxxQtd5ohjaqo7+6KFHXV+UHcdxvp8FeilAfOyD2oeVj/77ob/45PADBIjv3bv38ccf37hxYyhPOxogth+NH7c1b4i1W/RhfMS1DmgPPTiO4zwubF49Gkx86IL3KKum8z0fQT/66KOhFunod2o/Gn9l9iW+8847j740O47jON8ACwUePRCNF02LDy7Vh9rUbZFly/+NJ207di319zhPAp999plpVg6iEEtPeJSjri/KjuM43zXHnmpPKgQeiqhOqos6tojqieIHMKm7ffu2uR6d5FZ0+/bt27dvX7hwYVzF9stf/hIAPvzwQ/tP+4c9OBx3L1y4YL/rmimO4zjf3RxuC97S4/bIr3/96+H/T3qOz9LfP1evXr18+fJ777130hNu3rxpkYVxp+rw+CMuzY7jOM43wBxslhbNra2tYd3c3t7e3t7e3NxcEpl99dVXAeDzzz8f/t8eGbBfsV/36/zkcPPmzUuXLl2/fv2k7+WhR11flB3HcX4obOo+Kvtujwxr7gOe8MR+tPD9/0nzWxiOrEcjBebr9+abb44ftCD9YPln/xjckIw333zz9u3bt27derBh3W6M/+f/10eACgAISqC8ujL9w58OT1BFARTFDCiKCihACri4apgRSlafUYd/PwAECJiXHlTArKQACpAPB+sRIKA89HUVwN7hyX9XGXX5EVDsHxS1TwcAkE98KYX+8Qd83oAZj/vgBEKodqkRyuckULsCCiCAApgXl3r5KiWl/nLh0o9AwT7Lz/7Fv/yzP/rDpb9OoISChx/hw4+U71wREQAgKutoJOTR+xk+AgIEEhpdBwIRwOEqSf/NnkRWkpO/tZNgEEItnwuUDn+z6fBrJqWlb1MV8+J7XFyEgHL0O7VfR4CoBABJWUcfCgEYpf9HuR0qFBsoDIL9/cWj9yn9V/koHLpECoAgivZSdh0IhEAJl6+A/aIojq8Go+BiFB/zwe2D0JFxH5X7j788isbDyUapHr7aiI9kAZr+9Z/8T/7m35qsTB+8CN2+/f9V/a8Ausc0EyPiX7t48fJ3sSI+4nOc75MbN27YZb99+/ZRN96tra3t7e2LFy+Ov7LNzc2LFy9ubW1tbW1dvHjxUZbmE4buoVX+wfZ3zlPA7dvgtsDOs4sZdT7e13yomfbRnw7O6TbrPjg1O0QMT3rO1tbW7du3l/SjnB+QK1euDF/HpUuXjj7hoUfdb7YoQ594ePTB6fi67Dg/IEePEo8FXxBP4gcIENuZcxwsWMIS4EcPkOfPnx9v2o59wvDrD2A3xf/V//B/PH5k46/95b/yf/xfDv+ZlZJSVuqUk5IoJgjjWFuFmVEAFAAaygTy0E+NAFNajuwIUCvBIqSdsB6KZ2mD6VHCSxkwSjjpmQRaUxqHxSrM1eFQdavBwtOdsiiCBV4PvXm1RxC0xkwnhL0aTBY1O/oeGkoEEkAYxALWqxgRdKZVAsyKCTgqZyCLxy1dpbmE/nLx4R8B9EHD/84//kefhtnw5i3wxygV5nEkt6HEx3xfKoqEIICtVEMMdKaVHApJawAJmAmg4WNfZzGEOg36wG+tlepr364oNWYo0djl7zEqj+OY8+U3D60GewRBA0rov6waUzjyxc20UkUEmGkAxblWotT1Iw0BakoWK68pIiiiTvsRi+UbVwStMA8vLoCtBH20yHinYYgm29tOQBUKggbMFUoFKaCMR6P9iv1/VB4HoxtKaJ9nNKrHNy8CNBTpcKBcAWdSKeC8HxX97SkNJgDgcn/pcC/bi0UlBawxjV9qGJaHpwacf/z/+zt/428+OEB8+/btS5f+e499NlZVcJ4PHnz8s4X1pFXVfvrQpfnYsK/1DI0f+ev/8X/07/zH/xGjMHzt4deePK+q4rB8IEBFZapcXhBH02YGsgQYgy5NpwnopGxWhTKe/JeWGC1ZRvw2X5YAdsrjT2TTjq2wjFL1b0AB4wnpRgIJqATKIEszfFLKQBnI0lpJSUYftsJ8OLm1nFv7o3/wX//z+KVdZxq9meHNW35RDy9eAQQAjr6Z4W/A6M/YOzy8IpAA2XNsZTnhEmvTf5UKMMGEoK0Gez9LX0088lcePGC4/xTjD2vf0fBSScr7HN5DjRlR68PjpFOWsihAjTnpoew4AjSj5WNp2C+9q6XB/NjB0SBfGu3DZ8xKeZQjHz7d0uvUmPC40T4k5q02YmlzxSBDSjsrpcNfWQQaCiyyYh7dMjaSrT7DZhvtovw/P/7f/i/+k5dffvkBH/nmzZvXr19/7AfRoTjmUbh58+bVq1e3t7evXLmyZJvuPBs8OFf64EV5XDD+dRdlOBKPfvmv/zf+g//T/yGXugqMSgRAmANohWJzuVVUHD3wKlA8XELRz/NljqpOmPOHuSIDJuUMZEuePMKlY9S+wgM7WfxKBspKDMqYrT6pIhnNP/Hw9A4NJlHsYPn9y3Gn0aT06DUuDBpQ5Eh9ycDkuC3K4g0odos3gEMBEKMyjJYkq81CZZQ/+ge//lfp3yDo0lE6oIx/5eRdB2XFrATwqN/CcBmP7BkWH8EKaDKgfR3jVayvHoPhaBaF82jhKEvP6JWjhHzcCmWLbIPx2ME219Bq6CR0wCXcIRUAVJQQFCyyAVBTGo6H/VkbU7++DN8IgSoglfF2/OAcyrmOcvQjdBpOHudybKihLJSHP6kd7a1cCe3OUkzAS6EAG0IWTwgoeHIoAwFif8WOffPDlf+WW4z27//jS2sv/Z3/8D9k5pOe9Otf//rYLNoPewo+qeZpqUbqoU/wAPEj8YBF8VECxI+Y9q9feuH03/r3rACweenciUMHUIH08AEpKiMqwTccVYS6dLsSaE25k/ANXhEfds7MSg9Ym+2vS38ExOPWK10cueUBnzoq4ZGy1pP+okXKppj2Ryefb3ZB/+hf3/lP/q8fbuzvf/rX/q33/qd/V0++JggPKPdGAWgPfwV6JAChCAoED0sJRGD9Ft/aSSQl7AMZCqiA448TMOujlegqYFSmfgx3GhAfFO/+2hMuYCthShEAREGxvE8b5618g2lHbfvIRyriv+E9CFo/Wmrn0d8hoqoFshWjMh+JyNh59dv8jX//DXzjjfqxvN3/7MPu88+/4ZV8lBXxEVdN54ladpcak4dH7KcPXZofcNbd+Gt/eePnf2T/nv2lV/7hvT/9ZvP9TGp94LQzrFZN2fovL75TjLo4TLIlHRmkpjx+ftRwUrjtaJZxStF+97i04jcLENNcgmXUxsc8m0AYpe77NjrlpHzS0cLCeUeziUP67aR02uGF/tCi+h/8v//L/+6t/+LfXVv5z//Wv/ef/62/2eAxp9yjKdLhPVQo1Sj0eWhJ6o929p9La1nUkAGtM6PGdNJWBEGnlKC0KMEKJktFq42QPks6/N3ZAzO1jNqMYgr2FYzHSQay7P6QoD36zi0TOaE0XnGGxHyfxdd2NHKWSgqWhj2hTg5HOhQgK3fK39H8MIz5E1Ls5e6zEIYCdhLyMQFinRx3V47Tq0PydfmsgtnSw+nIxxznkmF0/bGs8pbGLm9bZ23+9L+azWYP2VcjAsCVK1defVVE/x/f/gL+7/937aM/2Zo8tra2Njc3b9y4MZb9cZ63RfnBR91vsyjXL5194W/9TYvNNS+d+0fbf95JsHCYrX01pgqloQyg43n1AffvePUZbuQa8gO2vq2GBDTMh3b/PjTDOppOcT6a1W2GR4AJRQRgyDXlYydVm3unGAVwrtXS+89AR48qUTl+nTm2wvyAz7JC8QG7oPEbEKC5MJbXlHE7shWp/IV/9fn//P/yf1/fO3jh53/p//Y/+x8tvfkac3iEo4ddOlHMJeL/qNsYKwI7bmLHqGxtyllxaDztvw4JfeZvCBAPw2AYRfXhBXfpCcM3O6GIoKvUTTEefSf7Wh1I00qYa0jKuf8eJxQBlFAbTONVlVAnWEb7uEZtLgGskxg1oGLft7q05TtplbStUTySPV2qQBotQ/Y2AEARkMvuCEQpYK4x6/IqKTWmBNwJo91ZR3Z3w2JqW7Kjm8Mj32AYt24vXf+jO6KTIh54JPA1/pyzO3/8F091jxLJfeON8//+G78HyN9+gv3PPoyff/5tgwA///nPb926dfv27aU+j6VWnqO1z/bIz3/+cw8QP3HUL5176e/8DwLK0UJdPBS/s+TCcjDum0emUBtMR1ejbwUqfIsTaYXZ4sgV5geUTT3KmbZTaI5MFmoXcfQGp4sDQEkeopbS5W/A+v7B3/iH/wQA9tZWHvKlUz7pVKkA3cnFraZloaWSWh77aHxwVF31mB+Pg8VHg84Kj2W0fstBiRaCAdWhlvZbBk465eZxBIirxxwdBovC9DERPHYIffuv5I038D/93zSP5Q1/8kn6/PNvuMSepCM8XvAecdV0nhM2fv5HP/m7bx6ecX+IWQmOrxbIQFGhPi4y9TUXwe9j4s1KEbTGrP3K+X3y8u+/+Iv/+nMA+Ic//0vNt75i0BdBJ6WAavPksYVaFaYKsANmFPrur/LQOLW07EK/7GI5n0tF0EmoHjlBOxzaW0BQqCl9+48jQN9ddPhJICnjo2VYrZ/Jqoa/5YX9xS9+8cYbOeZb3/79P3qA+N1337Xi5StXrly7dm0c4Hvwyms/PUlKwlde5+gp+Md/979PfXBOR7Pc0f3qAyozEJRQ8mNqX6hQHizQ9405Um4JjPKdXuH4+ObkBy/za/uzv/brfw4Ae2tT6MX98tc/b1nh0bdvgRqORQGlU7YcswJkIJNqVAWEIlg5/ksMKqOVl+GRNDwtyjw0dh/d3UEfYLD90vC9ZCD+RqFGhtIA16BE+Bqp2QjH9NYwyoN3DlbLaG1DApjK9u+7xeL7+eQd5rineTyEBHApPo6gFeQEnL/1uHrj4vn/9X+6D9B++w/4ySf52weIx9Y7J622g2r8eP09yafnyYHAOXaSXIz4Ps51uAfza0/uRZIVGkwn17HqN/oKH9BrOcz4X+NQ9O0OuHj0/K2AEWz2VFyOv5eAMpaL/vXmDvw6AUeEE8/ufQQWjz3qZ8VWuFW2K6kP+54eMThbimpRGWWC6QH/O2kTow88TT1U4/ixRBbw5IC7JV314XubBwzFk2/Qr3tLj4Ls33qQf5MNHIAq4GPZdT0JHHtSHS94j7JqOs7jvgcfdF9bdvY72UkX6R5oNcj3co8rYFKeSZUftovDb52WO2mleFyfMymlXuq916Y46bW1fqzNLnBCdpZRa8p0vOMCPpbrYMvQY4kOPzW3Jx671V5sGrF3p3jAsH/o/RVQJpgaTPwUXtirV69ev37dnFo++OCDpfLPk7zmxsZ0Y8O6gZPc7RznUXa1o47746eyb3CvnRT7+zY3bQY6qV98SbSnfKjHUYcoYF41j3Pd1yNFqeM/99C/RaChr5umr3ne0a+/omm/BXpgSEFFsRMetDK0XxPG60LA/HWbRPvEodYnREJGeke4tGRH4Uf8uIc9kBZvWb/ZHXWY+oExHNulVJi1fDvl39ALTRA+/pXOVM6Wsj4mAtPvkeTYOUEBo/DRdBHhs7nbeeuttzY3N2/dujVWL3j//fcB4Be/+IX9p/3DHjTu3Llz69atzc3NpQqqJ4onMUD8xhtvwBEF/eGRixcvWmL8pCfYrz/iJDjUEyHA+DAwuvlRFVVJi0QvDcGeRz+aIsBkUUGpUOQRlyf0mvI3PWk89PT10DOknmBOh/p1IokC2OmDRWb15D/9DSeOR1z8hnISS2AemaeWZJehVy3EWD6RrcoPOW6PGy0fvH43lK0JqymdLCf+76RvJyuflLR/lCvSPUIQ+eEL83GNRcPPv81S0Ct9H3+Rv+6rDSnxoe30+5/ZhjvxG0eKVVCFHsv/vuUFeOiC9yirpvPkYKvqJ598svS4PWI/fejS/EOfZbV62Br6HcVuWw3fc+7HPBIeYZsD4dHaSx+6nj6WD4hHVqelkF9UnkuVlL63MXNszgBBGWSCqT5GDQMeV9V2g4/nvPQY39J3fanxsFq3KM0lDArL1IuonDQCv5YG6FPH1tbWe++9Z9Hhk6bTY/3HxlZmD32C83Qtyg8+6j7uRfmxbYxVH5TLYdCvlcKhw4cgwuMLdeIRPQd8tM82iODRIgjwSHqJCBCVW3kkWYyvG54b/sg4/NrLBD8qR5VqH7KUfP3jySMWHWu/dUnLrgnfx3GsP1Efcp7/Wp/xu+vReagi5Um7MkRtMJmS2HFhDZB+f2VpjEED6qQvy55mGiNLNZFZKUoJGvSmHccJzijqccHl/vSdvp8OsO+Ta9euAcDly5dv3bq1tbX17rvv3rx588KFC4M21JUrV86fP3/z5s133313a2vr1q1bly9fBoAPPvjgSf5cT6LExLFec0tCS8fqK52k1n/iEjXajFoyJCF2R1SHFCApWp2OdbgjaNSAuFCUMxW5eHLAzm6kQcn78e/lH6IygcdmBbHv+7Bux6U3b3YBIwnzR81DWpvo8bPcCWszfnONjEd6V+MZtu7tSlpdyOQdMSgoVS1DJsCEMvo/dqLK8aNEh/sxI82jLdvj3lU9USn64cvbNym8PdRpq8d23Q5foh753U5CjQnw8ZyBH8uv15QZvtO2sv7TjsSXl/jGesSaSbrHtEf5dgGFK1euvP/++zdv3nz11VcvXry4vb1tXbHjBe/atWtXr169fPnytWvXNjc3t7a2llZN50lbdo8q+I9X3kdZmr9Z5AjwcTU0LPbNX3fO0MM37NDX8oOH1XS0SOnXbpr52hybP1PATiigfEsJeD4SAZSjG4+lZQu+3tKFqIc3Q/oNanz6uPD/n73/D7Ijy9LDsHPuzXyFnl1xq73LnRXN5aB3QjtLc7cHTVuyJIbUgOxlhM0fDdCWLZFcDhDBCNP0H91g2KL9h4yGHf7DosNAR5gSbTncaC5FK6ywgFEwFCFSDGBIk5LJCHbNzJJaWhoOdkVJO0vSriF3Z1Av857Pf5y8N29m3ps/3ntVKDTyRkV3VeHVe/nj5j3nfPc735fqV4VhRnkI6tnh0IRXUl8CZLZLeplfCjQMYTm7oEJJN1AfP348wvP9yle+ogZ6ugVLRA8fPnz+/PnNmzfDKn39+nXFmjXUhuj8/vvvr5HulYvL46XuOQRlJEPqMDCpVZfkkaYKNteys8nLv6hgBSK81TA25NTIDqN/HodsITMz1TeEkmULo1aW2gakvblnmH72uYGJjWEcsGuBoyu5heHFfw5DWMwBwoJ4qVdp9om0+Ugjvs8X55GNpuRhEFdS7HlHJqYTZ0EJyTPckx9naQwyUtM/ENmm4ZmHVIAaRncXlE9mWDZcu0agkhUpDvdRvHkApwCEKrLVLbIsK3Vo12/s8FIYwhWuhRdAJYOIbOTMHga9lMNAcR988IEGWYV9iejatWtxLXx8fPz48eM7d+7cv38/mN/eu3fvkm/ZXsat+LABHndRPXr0iKINcP1Gf6nj9PR06SY5d9Z3BMiEPRiI9H5ayprZ1OorbcZ0mmgQLIdF7I4qE8VoIEzSLljBMk4/IooOx/IU4w511AlmhW4iZeGA6H1C0Fi0b4nZt1jfsWCn7jcaNT0kjfh84z9URhh37eZE6eR0QOWDJRiKv5Vhk3yRKMfOfOEjb1HKRDmCHnNrHD+8JkB8nAvaneZsG3BELpi3VZDksONQd08d6qhRNbWJq7EPXn5pWGIa8K5du3b//v0bN27cunXr5OSkF/A++OCDe/funZyc3Lp168aNG9o5e8m3TF/nQvTatWvPnz+PuUjPnj17/vz5tWvXtNScE5qXBy85MvUbXBfsdp7dvbDL+WbDkTEw/l5GvHUwbkn2P7dwjZqNnJdiuHAgr2GFVIdoOhkWHvlcwpxJ8WKGjEZ864+6t169vMdvS49gZaY2bnEA3Y5XaZjzEWW6XCEtf4TAAb7mfJKuvW+99Ranhr7m+vXrH3zwwfPnz996660bN2688847d+/ePT4+jgPrxx9/fHx8fPfu3XfeeefGjRtvvfXW8+fP7927t4o7vXJjstQ9bFDmTApvBxG2aBosHEdw5A6BO+kKsOmWpQWLUbOy2bkziLZiF63qlrEhMV1nl0WXTnBeInI7vGkveci9xrIMTIOaq6zk0/wV562kWaK2J3rAieq4V3HxOYaYzifiYG/WOfj4fMv85seiMpw5TEUV5+xcWBXZP4o4joW3r1dEWCJeYLinPMCFYnRIE7zk8e1gvJwTHoFv5N352uMCg3I8bt++/fTp09u3bw//6cMPP/z2t7/94MGDe/fuPX78+NNPP+1F22vXrn366aePHz++d+/egwcPvv3tb3/44YeXPPpcRgbx8fHxBx988PDhw7t37z548ECpZx999NHx8bESuYno/ffff/To0UcffaSKE6enp3fv3j09PVWq2tJPDKwWS1KwVAk+S2R7naLHcmeN45nglMpKbL39a+/HPtDJ6AJtk/FDVwfkz9pZEstyRoVuKFGEqFawQoaIathi4b6oEJ+hZGDD9aB0bx3qwvbm0tggMC61V5a7Rz36sGm/r4HStWBrFCCRiANhkc2JXO28JzYMDNzFVVVySNEBRTEKFiZUMBo2lqyuCU4WwLoDmcJPm/9OdsGgW/CzV911DfW+DpP8bN4W7ojtD9olTDbsKjJb2IIFxNslKYBhbLhmoi0OtRhyOoloQrJ1sNiJPvxShra7JhdVDXjqRKfKEkPGyocffnj79m2tXq5du7a2uF7mce/evVu3bt29e/fx48dKXLp79y4RPXjwYH5oXlgfSjA13bB7EQmcxU/oeG5qGBt2oUv9ZcFVW5yL5CkPVu+FdpcYgfzGq1lDAjLwJnKH8untn07+5oZqSsCG5356Dx12U52/iil/z0eZpHFx2L0OTWNLhRoN71WcHtADaocR94QuuhcXOUxD6XiFgfuZAO6DBw/efffd+/fvP3v27Pj4+Pbt27oahxdcvXr129/+9t27d0PkvfxkpXUkx2Spu19Q7lSsebIwxWKjig5vGqNOGBJHxrIQ8dnC/csNOUlbOqcjmSEBWebFYKLKPI5LTBjad3tXS5WDdNDL+UsGGa/y8YKKetBKK2Bt7zjKqAg6MBHXMKaL5jPRETsQbalw4BFKUIzYWoaa057rAp6EBYWYQcI8/65phd7GRxLwLAGKnc9N5+cVroX4jAqALbukT50jU8PovnjIGWqvFwHwsLGV/XXIJWMqaLab8IhhmLRaCwyJvFJGaFevXh1py7h69epkd+zNmzdfoUBcXM7DUt7Zo0ePwsap7pCHHOjq1asPHjy4e/fujRs3wl9dv359Z0ie+9tZnQUFBFADoQaViXTAY3c2UJfnUfvXOcsHM65w7RqF3zmnwA5GwKUZMRboHINaokskexR9s7jXFo1kTxGrziH6OCa8wfX3UbgOiXjWoqNYnm6gJf+kIlOghU179OHEXfaHoCvgmTSCkuKPSWvjhv4pzGZJLe7PeubyWvqjdV1dp/iPK1g9fdphyRZLxEVXLb6CJYKDKVmGO+0KaG5nQDAC9kgrjpq5x71q+uDxP+4Kn/nK8OOGa9NsKJxjRobRScKXWI/p+Ph4XMZuMuDNiZrruAzj5s2bWmq+9dZbcSyOJ8BkaF40Ajo88sBu2J2N5qbjhd+eC8v8dftihgMTmc3s7aXc5mvBTojr0TVvY1yFYMzC53M6ppqBe2qZsRsAf0ZzMIs2W0iiw1ogGcaVXV3vR1qq09V794OucP09bC5DnNjnXpwf0mFYShIQOTLnx+M77/H06dP5a/V42NVlee3XedXHnFJ356BsCAU7MAFmdlNmiw6TF2cQmH22vwxD5mGzR+zOiMuptGFpdaYYX1z6KnuJZxRu0jVmVz7m0U5mXAqWGRJF1g6SwAwJwr2QBIU7EU6zWTy19syfeVASIIB7EIc3Uqsx5s3QOvpoYa45SWQE12YvZpQe15vSNM9EQcjodm8Fa1iUYHRp1wEmMANeyr8ie5RBPzIgTztdHUySXZfrDwtbBZNZ5cjBD59Z5Yq9kM+so8BnYLxkgPgrX/nKu+++O4Tkj4+Pnz59+ujRo69+9au6Af7+++/3Xnb79u3r169/9NFHyl977733ksTvGXOXUk0u4ReNNZkIM7PP2nnEzpUHcFhKhmmZvmHEgU0zVywLPLeUPLaoLy/9pyO1XpCHhl1G5AhzcVviWb9v3uxzXCtG/OsoFwZ7nvealuzLM4o0/e0LKSjqxWh86sAVitLU8ckgd2KZoFUatxU7RWVq+pq9LAYoclcbJBM7VnfSbHUwEcJZgKhCoaYxb/A2JVg8geOELYFgSH4m9g0je9aRHLYVDlHy9SYAR9z/MqOVdpAhZFwm4TOMy5yXrOMzWXPeu3cvuRP+4MGD995775NPPlHRw6985Su97YE5oXl+WTjvNYiLseELmgWCBVNQY6AIWQZmkHQKFs7nzS+vVFgwSpaDLy/vfOM/0W/+s5/4Led3mrjYjbMrUZo0PJKtz6ZwIeTZId9t/CPlYh3qDkIixoBIsXsZw670l6gk2VJR4TUSAFnHZ2PkCL+Tpe4+QblkMYwtFU7xPsb4Y61SinueaU+yZkNupDKKZUzRqsOf47AkG6YXKAyJZVMPIMuYtXOWSg8EbBYqydUwWxRM2Ji+gMGcdfLHvvP39Ztf/fwPx9e5F0eY2jq/baslB+I61fuoaRJzPxgLWk5VBRtuChMZD0lr2euk6FHEWmABRKxlbzpLKVlUA7Ns9rPt5DXNa4t1VBmFzFbsxpDxMrSXNmCwPgKM0l8iJTYtaSJjpH/JIa+Wvg1kNDOphw5T+ZJs3tdxweMlA8TjkO7t27fHX6Cbq/sGg65rim7UUEO2j8UHuBZTGkyqIG24PqNSukElEWVNnWm0R0rmGGg0krJEzhw+68OPck5bUu2wyX2PJ563sJvBHpFKnm9Mbb1rDHPnaCN7utjbmhduTx3glX655H4Ma0BP3kpRcg1iPWjl8EbaDhx4x8l7PYeGrSpCPe0t8tDtIJ+wvvNrd3ihQkHeShjRKefOJf2OkQAxdocycvmrC5zx+KbsGmvRi3PRb9SS8bwi3wjxf8HJgOlAjcZY4/vrOq5evTrSaqOtrJOBe7ft2M6jTQlOQZzLcrcW1UUYCVwPRHTE7gUMCNw0PGJYZyo5lBlXuKrIDlsCMUAAdYWvyQJ0SWDiEZWJnnzQPodrfKMP5VUIf+0HP3d+pzkwOk9jB8Auku76hxz9+Zw3kW4xPP+z6NB8t+FRhTrw4PFrSBc6CIn4IKbw0bOAKHs+dGxb0eZ1nP8YCcpzSt19gvKG6y0Vc0wgTdrDQ7TFdmbDTUFzRRi0aN3fVtocaJdUVewm6b2hsz5epYnYpE+Ea995qcVXv4gedagDEcCf/5UGIP5OBBDTQOd3w66MVJKS61wj8BqdC3Nt+/W+yaAQ2HQv9aHU+pWoHrnKtymQ3lzDMhk2Q3qp+tRbsVcy3HfMEJ1QtF3oMAbLo/V1bfZwrqmRkIpWWdENN9/HL4jTSBzEYn50Pdkxr16D8vmPYr0E1EXuvNiridEo12qxN7zLsdaLvOPk5PRmQmGk6ovro61JZhCPHZnaxxiBcWRtI14+51lDflXFWDEDAidOSjFiNsRAsq/hiF0Nw6zS4yTgioojX/bPCdgzFXgDahBfwlAAo1GWGLk8rNrEyAh2jV9e9lsCIyrSSZWDgkVIDu7fjXwh9UJK7PEE7VzoznzzrRTWVPu/58bUvbxzJ9wZdJFbqbXB2YFcqlaO1Tpe6khZ09QvqFyUbWOgOXtlKtiNhk6uYXpbp5alIKnJbA8jc7zvUJWJZIOhAwvx5hD65uq7W7JzuKSGbLq1v0WxdN3Wpq6KTMmyJbtI25eXVyebnRqidwiRQlzDHFZxRZtDh/QuAVvmPWNf7u+ZoO89WTpuYWuYI+MKclHK5ITIzaCbzRrCOFsLpXV8xodf6sditGXZDCBOQ9iwnMFYls1yGeKLKfB3XhXNrjJTAIMBakDGClbAb5hhrco1zPhW2fhnS7PTNguXL2iipxNEAsppGy5NyZJaBP6dMQd8ZCJm6TR5QyOdVdUC9o2hPXPaHtsAcU/xDBxFfReu8NjlKlj9b2zu9h1QFj+ZhLEX35Cp1uQBnsMR/tthG+gWhWWxTQezOT/zAyXPvZBycel6VoAOsOUDWavg8RVjHTOWY0QK7tpzWiZWnjjWVkApPaGJeagWZ5aGReFtfnNiSA4Q1DSWX7CtWGkY1lnveDSKTuEcEQXg9jVahCexZgptKe1NARP+m99sOl5P3v6pkbMuyCnn5Yjqiowao2+oBpWOmAYKRxjc2z2xQJ4qd4sOkz1GsZfhLDOmB9ewzGnf4QOWl4cti2tYG/khzJmrNWzSxK8coMO7IBQkIxN+6sAM0yousY51HHhMrjnjXjS5uGNZCnL1oVCnvZMUGZCIL3ar6uUnaVofGhYsuikgJiFvpHPE7sVoD29PCaHxIZiYQi9BulppXwf/yFzz75BEvMu9yOZCOOK6ZjPHzDZ5yht224NixOu6uo7Xs/iNH/Ar5MaDzEsPQB6PY+6TP3ZeAB2Id5Cs2cKWRDVMwWI4CxPKIRop5t1ZzGNtT9dVMnvPWAVJAuFaUxQtykZqn14A3bCY6Ef10RHicpSld4XrMxSuyx/AQmHPsXnGoCnboQ07N08ZI3MbOuGVCJYAr7TGRJbcFXI1m+0SGTTX1J4u1KFl2wHMZ2KFWGArHOZ5FLDl3jwk0B4NeSCCWRlOFzBWgHhOvIkeLTFsdF+Kw+pQcj9qGkpguodhkRw0ApfkhIzzpWbBzjEhClc1jJ3RYYBQec079iPqNmlGuld6cfONnFz7wxOwI1sY+Rs/81v5D976zd/51a9HALEH4KK/ZCKiDTnLwsCZ1tgcNhl5GOCJuCbbbjxC90MXLEw9dfYRykwQl7AkBTUmdfWowU4UbskuhBqxk/fg0qlaH1j4P3HMPJGw8pAdz0sexrFSn3fv540VoNaxjtevEG3zO32ILkbAwTB2JhOV7ECmvgSJaZJE7GB0C+0cQIMOQvrv/+w/9/c+/8Pf+bEf7nWzHjR2TCyP3LjO0oblxULr8yPjIkYSrnD9PZQjR7LtZkTko61eF0lgCoIpA8CDD+1ELmb3g/bUSEYK9fnHsMO96M0zk1KrHDsFjB3MWdSSvI51rGPOQj+uZrDocQJYiA1fJG7MWxQAH5mqsUPf6dPVi6/2rnGGeIf8RIHRyu+jjZi17X+Bvv7lL/1pfu83fefvffPLX8oU+3PdCCaptctI4kwcFfhCxsEYEiEjLADH25oFCYhVV3AkgE7i0yW54VXVmwCYHRBb7c4Js5p4ei9W/d4NkSOzgwYFc0dgjQmW8QZVuqNQk2HCFXZQxIDT2wz1wnm7hVWnxKWjYHEp1RE0yo0SgWN4g+uazAus8ONlH+sdSq+BugDVMA4G4C5rtVl5arGFARFZvrhSwDAKcoscTnW/KFk3WkaB+owKXUQMwRAxkYPRJg4HNrP7VT0gOMmp5F4ZE8ACtFEkDV8iWu9CDfk33v6t3/jyl/7pb/7Nb7z9kwVk6/X4Eq0VREpBtdxTLkwkEdKI2XO3plrczWpaBBqWRVL3jiOo0XjpYQsmoppsLmQLjCM5by8fEG3InU1oXPdvUw1bci1kzqM9Ge365eygZ6pgFxs2IrrIeizzhYYV3z/bu8Vm1ftdxzq68I3TkKQ+KobwvW7PTS/quZUvMFiceiRiztdR7E1xdwPvEKf7Uvy5/+4////7sTdP3v7S0lA4/B2ypbUZUVXiyG50/6V1D3KZWJLLU+cEoYnJjICJKhhqyA1jJ7hofxdTFe9UcivlEnWULazLV7NrzF3HOg6YdBckHPV9WhImEuL4GTQsljj0pKv5laHRRYZE476Cg/vsE9cwdCDahSEULGE7UMickxFoPaqh38NJR1TmT97+qa+//aV/8ht/65tv/xP7yNDP5BjvZisPYoGhBiZGMUBZLUudd0tT8c8ZqhQoWDh1XgjzJLr+G55zWbiG0f+qkHRooDEkllviWmqGu4rsISZmYwuxYaceWZOXQtDO2wDyHDzrKNgVLKpFVmOs5DcEFTkx0QbMOi7tWG8PjUrrMqhZj2TAjJC5cCGSNVu0lrklTyPMQjx6nIxjUjoDGodao1LM/aBkEEXmF7HixA7SfsnVxzJSuDAKkoKwoRgZROcVE7HB+t7S9IvRFi3FGYoRpCN5T0NdZEmsT6eYYQnKDg5fvQPrnaxlZ85BtSC5BeJZzygpqYZpKhQEnIMZGqLr2VzSuCTu5RfDJ9fwgpZRuzf9QYhrsbSOdayj+wwrOsxTDfs5FdeLpSY1B8Ozn/pzbRFwYBUKDF8yWoR/jqujMTFcjN+tPaX0egJKoZ7PbXWPfxIf+r5f/EQ6pyHgLSzPmpwX/eBcmafFzJ0UcYV517GOC3pCbd7mS3s1ekF5w65seinQoGZNCbZgFNwY1lmWXRf2Bq121KT6IDo/4dRDx/HxJtEGbQexg61hZZ6R4D4CevCfeyjx3DArBNw1Q5uRewwulxrF73JeYKD/YfUSsp0CxAKjUy5QHMbnfMEyR/vJjlLrjNeXCE/fos1UJfwhAovDV1yz7+S2p3B8oxlSwfjOZqY0aCDdb8jQKrR4ScdrzSCGUmg9P9iSGEKVaOpnlecVGJtyhhkfPceYDdVEdOavvMJ/Uy0P422AvthmFEvczKzfEC7ISduJj6wKwu7XmWsYrQ/jd1Ghie9TyV5beLfs4Hf9hb/8u/7Dr/2GX//e//PWz/77P/vPD0/TsKLqiIFOZcXGfOT4r6qwmEJDAoNsTm0AzbLIW1jts/DKEvMiKFMI56aLSFqCJQeypuF3wxE5Mg5sUypOluDoYMvthutq1JdJ9yoGDrvNbqrAHLDC60Lz3Dru+vCZs0MV4q5twsWvMyxro+s6Xu8BtG4YAWY94jomJS19TK7M9jI91Ci5xoysCcRnKAh8ZGozcMKctyhO69g6sMvTV72QDkIzjiXZcLo/tBwlSaGJcUXJNRM++D//mX/ym3/r137gc3/yj/xL3/ribznXlZNSKGE5uwVkJjIyrjKRyciaMjVwtPXO8svmrvKMF5zBCviCFfBn9qcbFs2ZLcnG0BwZ4uwTxGDwijGvYx2z4ACP1VI/ze48v9ywidvviUzBcC/vSStZaooV0cnBJhG0kgREL4W6qJ9b7FSfaas+EVkWpAzSf/bP/5X//l/4f/1jv/7rX/19/8Jf+p3/lGXsCJF7Mx4HIx77mx9JU6+HISnInVExiAA8ClBgfpS3ilGOXdvARjNEJGKMkf1v6OjBy9I5PLJbwIwy/4aGxJAZyZ+VSszMTMaQCIwQhOAi5KMefYfcNQ14RclSN93bVDUw+nQHksIyK0J8SSPCa37+TNAWdUvYsICo6rRsMlRHqSHqMzE7MUUKzi2542BTktuSBbHt7Ls26gHb2aHUDBiahlCwq2CNF64V4gqWl6yn5DE1IrIMAzQw8X7KtBrGhtioRJLNUToCItDUphUTSpYz2CoV8JjoH//Vv/fON36RiH7sO3+fEsa76ctiGSZvhKltUzWsNBRUEpCw7kAOANFmm5eDCo/AUH43vn92lKAPh6hgATeAWhwML6/u4i1EIqphytHqyTIq1V1eOEJqcjjfJEgD05syVnzpTuY54a1g9wr3TYDpUIe/9uyv4wKHbmupuFDQl4jHEdeCcp+PuHhnsFzS/H0UutKeSXHFiyHqP76QYmPcJMHHEI6Me7E7OqZ9f05TkahUVlXZvVCzf+Lv/PIXv/XLRPSDv/798ymkG/L1FlbAG1PbvlvL4YdhaLK3MIEWsANIoUwvnnjZIwy30Zk/YyzdYM7ORBuuz6jYl0uINVauYx3t87WhhjhMXSmG5eiDyMWSJ3RNcDSmX6SlxFIEWciA2NAEnFqLLWbjkkkdXgfDRNR16AHxj37n//vlb/wiEX3+V/4BeRKxmzqLgsQQ1cSWxEVFusr1Cgy6vm4gcvktN5ORsswazvtdB06Xn2JYzAyE2jvWqvCUFHlTUX8yXMMWQntgxBOTtjBje9iOGMQjcHbg1bJn8hkCE0oSSW1vKF0sKUMsEezrYIjE8ESiroBYfNn1E23iwnY8lsJsFFhl8dtRK0JVmTAki0nE4DUoX8B4HQFiZMoDSyLElqSOOJFo/RYjqimGECFZhiOEAsOyMFlg5GPnqaAyLKO7qwvDMJDSaw6w18fJPvMw6jdiCCUrECnDK2CoacDQfhb4Vh3LZiYttSmxZjy5V6j2PJzWCwWpwrVpfUIhGZNu3vfm+9uqxGH9Ec1auWjPM7ECTrVVMrf+ckoftoSSnCOuRh3qHLimWfJJ3SRGVZy4YBEYsNQw3CcOkII4mgtu21ViFgcIg6t6kNROMzCAMdtpwSHBibNLtsS7y8AlCEjCVB9IrWKNr+u4TCF4v4WdmHBk6hdS4kKObfLIkV/wt7CfY3kpsFxBUrCcoQg1Bs+6DHyRq19PgLj3wXPg9R1u+xtcgfh7+21RvAIPVTctpEGL26s+SnYF44UUBwOexNB2NWtZx2saqRWi6kFRB3pUpYI5IECspfqkqF2ghQ2DmiGULEzoIchMwnnNKLXtcTCWG0LlDl3zIBJS7YJg1Mm7bm6xnkj485zdaMliSQRFEb0YaNoukSjJeZEmw9R9yO73hgO2C41SDdGmKfE4GSGDeG8NuyFpzpfZXOBGqVK1RrYKmNGItzBKFubGzeiIakcsaLZV9Nkc32VJVsE96CPeJ3bKPzMuzEMhdmKEmEwSI554Hm2kKWq6pK6CXQ1jGURLesKEaWvpIN4PslbBE0/TOtrVI4Z+Y2OW8GuMQkhqnZkcmoWrvkSAZ8pdU3NDKCMSVs6DrrcEhFZ3lVwYL8sFTTiUKSmi+ctqXGUGn7qSnLmQ6lM3S4lok1qMVJxIw3wmKnMTLLHgfHdQsNU9+ZJEmcXaq4Joua+bnV7FTJcviaRUXP9jRvVfZ1QR6YIVszQE+wnES6QnCR1MRavk84skawvsOl7fmDtSPWyMu3h6Yz1qj/ZqjXFYV1MINRjp/dNRpOGAl7RUJUPthofo8GHaVHRn/A1TXTFVJpq06hy4ZKu2o7SJ+ZwZ8lkaJbuCBZfu/qxjHZczQKDXeDpkCDKrTU6rBHV+i8bIm8/MBGpMu4EZwhG7ZMO+8Q2daISVQ+0jdsYBONhKikoWO5Jp7VmJqWBDu+1ue8icMiIraL7dKKtpip5CLQah8k3FxBYkSV3M5kg4nT+MLNNlqsls/1yz94mKnIK4HpVSDO/QuyOB2Du7IGXsbR9oCEfUyHUWJFfYLRItwYAArhlvj/ioGLR+1X4XRydD7xaP40519CwYyprQ2ikIax0vZawAcTM7i8gnpy+81H1smnUTne1EbXCwDE67kClvkcIarYawlneMtdyVRee9b2QxuoEznm73yMuqMrGF3cJWXfAx+SaxaNFyAx3MOdiCxJJYRmiP4tRaVqWgUlWNcGJ9/ynv0Ig6ch/LrqaEJSnIEZFhKEZsWOEKRDGmoys/3B6sYdyBjrB9KNpNBYzck547RA2r1gqHRZIA2iHQcub6c/S2VSa/7EcvNPjFtI0sZY2Y/O0WrNXsOl6LcrQzNiRmCiM+z8PJrWB8qXAzQ9iD44kpdCB9kXtpDIgqWMGsOmrmp88otpuyJI53w/yKiTbmYJLEWvJlMWKYGtZhbEkfH0fcalIfcX0oc7zzUFYpeQpTeOlRC+kV5rBTYh3r+OzW/yhJNlQnvbvDb8Kqy4ejD5s0odXlPNvLlM3pjBw/H/tSr1WqJhNUAHcTVWc8773h3drnrD4uAlgby1k0WsPiRYcXoxmcgOEWsT67L2ekkEFqcVUW4krM8P4ecV2yow6EytSxk7nQXAsDDrhrJLx45p9XXmM3AAtXuC5n47OK/s8kuY/cQbWvL0iOuKbMTM5hIhLZHqLjUMfqq6zHVsNspdCvqKLnXi/7Ig4Hd3Sg+1j7SuW9lAHitS9TyetLUPwI6WPcvtwjmDABIgzGag00vCQfLXYqDNg/6UJcHZTlNBDqbT6o6SyIVphigK561d2maTbm4QLc/N4nGDJ1Rzi1oiUpXYbEJnBCMPV/G2+BJu+UBrlkytK4KmnfkAFPSQ0odqk3yEGlP8ZG2INlAne7RQy33UYFiSEA2uuECC82GKQuS5jFUE3exicwAl4rWAcjINNVkNdN/mGaiO6crBqJkiYhSF3zBSBveouC49I98URZcnGrVy+2WZKSXNifcNAt4jTpuOraSKonrHi6dLzDgejUBKzASvzw+mMTtU8s1o3TdbyWYzJinivAYwnlK9Jczy/bZwt+V3L+im1Y9ry8aNfeiTbkg5cWZioSdWPEgrYi5qacU6GwTWTSuOSSnF890ILCPMWN2sK6l1dB1DCS/3SmteBcxzrmlH6SR5jA+0jsdRPm0MYaVzTDDN97p/edY4SoaGs3DN4/HZskqrDizwqOrJKmvlJBgsy/zhkOds6l2kpqwxWEPcIa8lIYyeszp9siJ+2I7kvitzJeJtb6WcTtxdEm3VCV89wzSx+G0GAigVpoP8hlZN6RJz9VMFDZjZNYppk9RTpF1dB+OLtiKKCbO6ELspMhXOF609WhHp+Nw67ouFUaHu+KoyryZ4Vd0H2EdzMkgfTA6z7uJR4rgzi7wvaYREAsQ0yzJbIx+VsmirdGR4Te1SJNtxZjJAvEbsmj2qC3+VigEdqJkahHhNsNXnTnEDi1XHDjGtRZZaJjDuWfZaa+4BG4QlDoSSsxGYZl18OIuXt1fahg3TdT3PYMxaBJ1YBYCd0lu03cUcVgIlXKN1rdcR+RRT/5aC6y36zjkZnmWi1IEEHAybLHcCM0wXsvqQU59TbU/xoGR4kgogJMrxsziKDaQ0zELKSXYnD6jX+Cv2WeOMyZ5C3buDSjzA5b/fGN5vbIwc2pMWxrHMG9yWk7Z5GNd0MtMB9QWZrfo5echf+6xHXyN3T1V1/HOvJrY4Xi/EznmGD4pSFxcxPq/YbQYRQe4bOC0ri5xRwOJlZYsBjCKCcLF1xmDDBikhn54IZr5YMbbqxdzGxiGo0okh3u1IXionHWrHiJwFa0+7tG0nWsY5cwuIXdohXs7i1HltFVyVtMZ9A8uSZTwWy9fBOItmRrLwEXOEaOTEVWKS+lcb5/Xwkc9kyafGDY179NCZKCKPAf42AqxC9QVGRVNWgYIh3xlqyQ2ZJtE3vkzi4Zs2bt/MELF0ThA0wQZOULOP3LtioUjLHHAP24ULL1OUxICdoWpkXzOeLcmK4mZzgR03iXkSXZeLkqrziBIOwgZEBGiJOiQOh3ViZe40msnVGD66bMV6vbAsTwuVCc9RnGqC8RCbGQ2SrbCWMHYxunNWSANhEE2mwj+LuVgiJceCs2/DMP/pwT02BBwjLhneir9TlxFH5LvBxgQeNXUomVMdqgVGKs0fuyjhUgzmSfJF74taGHAG2EmDmhOW8A0vVggY1ouUwoWSy5pF6PI1M120EdVQcZJRT3bCIDTRWZaoMTkBnIG9mVfZuviT5WkyKcBjm/qll/GdGS65UKsmugYTEkhhNLfBfna39yIVNJSdNq9aWCjNqkw0QFZRsodLdti2KLItYliNnKMgMAVVmDmUtzkzHMiAwjU9SwAqMK8iIKIYl7GTIPqzAx1yqRHHNmc3IWrgueJoOWqq/o9MjRadE4Y7gR5wf4O+LAsfSwJVEcfORSFV2Wcb3QN2MIFmBnS8rpdJtJzGG+1qi8jss9fADm7XkixcNAYC/Bzo3sqio7Y71afCUDNDwfh83xmHa4spMbaQFNuMgbhJbv055XlaLqhL8wnjt8xPUOjSMmtS0txNtd3VpsSkQi2iG29fnMwMMgW/7SbxaKMK5jHesIUcaNthv6xa3dNOr10k2O2hMVK7I1WU8lJjQtCCzEATGspGMAo3FHn+5RiiaPrtKdUte3CYb108QYsXZ/phG0FFpSwSBlWc9LYqwj0660TVxh73DeHwU7y65HdrHUSiQHTF0y8ddryxq0cDCnVtbmFsSkKyZsTAArUHI9YLv1v+NQhfvPSVg9gZOyjQEiD38yor3AAatpmNE8qMH7HCBr6uiaJQrYLWzTLD5guTG3B9Og+XnJUH+pO8qEei+2UkjiLhxyFCyG0zrjO5O0Rh+7xOlXojB9Ayn4/Y+defJrg9BFjNfXnJdTgE5ATm3D72sYo35lWQz7+Pwbw5DQO5iCXZAcYoLldLTTXVYiEqIaJiaVCHGdQfxjuqKD0f295MmoXK93r+Xkyqp856rTjK8bbINLxM0eUcmiLUVHvvOjbrQR4Fm0bSCvYdTBs6cJULBsffZgqDkjQ0P3AL2fzQk7GMeGyE3eqQqRSDSjJhQkNTq3pn8T0ckVpBEe4Zq4ZAGm1z89/YKcN8nNtsJ0g+xINsa5xduSA3U0dlVfYpBR9QB3bNidgZVya5pIF8dRS/kwgxFIgmFZyvbdULL0VIzDBC5Iak77NgR68NCVbg64ULDE91c3b5ThhVEhsDZjiGQ+QERgB3ZkTCzZhnZf2DZP2U5xsTbnsASuYx2XuI5dkMNi4cQeI+OcA6q4wOJ0ByTXdJbTVIAgU8HuhhEfZMFwMDXZETXJCtYtxyV59llsTL3n/bX5i5wst0B01CWU7T/BBLyl4ohr2pHJCwUxeFfniYlqENZdVHw5dwEWEFWXFyhfxzr2mdqTL9Ctyjf8iqc7fzFBZFEiW5MxQMEtr6eCUolpsJQp4pbUYJiFLAmxjXr79ANrmIps92VmC77CldZ0Z6CUHx0ng85BgmJMlQUxkTQsy0E5aFl67cWGYEhK05NZ4JpssnJRRNiRAUzZANBuyAoqjIOwENslIrMzQgaocT6fnofMULaWOgfWnlcukj6iEGTjmxKz43NpAxNKrjmTrkibjDXVvdHuVe6iw3nMUn2D4FWMJSqxVWNEqcQ4XHowkiAZ6kwhhYPOT+eQWzQGiodoE5WyJ7+P5lLkNmbGquCD7F6vQPN4QbFeAs226wZ1bam1dqCClFrCZpUmk2J8PRLxvLWYpdGyaTpKVPB3TtT0j2KiBJ3Z+V6w89Fl4gLoSqqqOpvor4hoC3uGgmLlVq8PNZS48YIAsCqM4NMSy30QMOzfOjIO7DAmsjV21xRT5o6cwsiJqmoH1P2zadth0LQM8WQ3riVYAnE2YYpznXBPYwS/hgHY+sDMRJZduKRFYw2Pfn2LBt+3LOyJw8N6DBFNAMkENOUpx77BRL8Kds39HT1By5JJGecG1ZzNcXyErnvpsosGrKTeEN4KoI5a6tDeTSnZrfoS61jHZIw7kyI0lk6mv+xTz/n1jLlAJWLlTOE8U9JJdButucLOeAL2/OPxuwka6AFFN9fszRXdn2g8vMhD31r006rDw6XYXaRyhgHdTm/rq99ZiehkKTs5Nk3ect6Dm/J/z691rOMVHFsUHVtsYhUfFzJCxjU7jhMlJ3q+79GDHhr5pWv8rnJ/Zo9wU0vRWy1BVFGR3MMLhX8dKUtEy/v5oxDkCUa5yMXK2G3tTAzJxtSlcbHnHvs+Y2RuQSBxV7CpdsmwYInxUPXiMD+6mA7rX2Twd/30kp3CIyOy+Jwixo6kOiaCd8bRgYjtG3TPOp9YkJTkRmrzCoVixILg5cCDpCjGi84xqA1PdpEHwqKswxAKM8S1OmRwpoDVLEEjsQblixivL0DMkdSvxifuQ1EKle4+hwpy5CmK5xNRqO7Akbl7LMmyCokD1s7zWStG0Y1lqkCUAjqblhe1Beusm2QqPwPDNl0NC1DdgK2Ju1aosCxPxwlBe2WQWLVNAAYsJXt5sBs5BZ0oNSFDTF45JCkJbwgFiYowcrSk8owl3sEEjHjQR4bYrM9ykOMEodeS49V+WVUmxgGIIdLNaOH+ZOHVnumcYq8BqaczhOyoYTJKUUsToUaGOHN/m6a5GkbzsKBitqoPr2Mds2Mc55gFV0zb3lh68sjSJ2tUifjwSUcuvX6Bcuesff5QIcgdMiUt1LWpQv+79E0cTOAFIwpPI38yMM7tKB5egtG/CFtp9CVqGJl7naHCxIvr7L2z3+LwGPFeuLDPxBZ4G6oApVn1JdaxjvOLWUjEkRcovo/i+yjOBgzNIYpXN5VIzAHinkah8ohnZuSYK5bKqaIsnWbEn45+yWCTvbmyWyPOcNlUmpcUVV4sKN6VtKxkHRohrmJwy7SmlmiHGLGZSnRHCiNMKIzLCTfldRd5pyuQvZtBi0CvwMYfD/JIMZrTIRqlDxe2LmxN8+i6XmK0JQKje+CqvcmZU4EHwb24yoT7zmGTnMPioLXMEmCMxTcmH1u+gIxnHTuN1xkgppnsg53RKDuVfysfdklF0tuJ5brBnkbvcQqQii0s4wNWtizPOl8VI27lxlUBoxckYqWe8XNroheMqtcTkaSvMlSg2Qz69DljvMl6vsSxH3odiS3YbMcoFaTkWVewMObdI3g/0AGraHSXLE3ojs/RN7Yk7qakGEwxRjx/VFElDy+tUngB/vGm1CSP+BwCYf8i4KAhBkT1HlG1p1eleAH2PON1rOMVH4dNAePSxTI2ByMCX3ym2hfgE+JKbHym+2B5yOQPPcHcGPlVXbwoDFHL2eB9D8OBVeZiGJjiQ+qJWlyGpZP9jUiqTKAtvBdsU5jBuTHRkZk2KBfwC5Tao7pr3XjpirK56eLu1S+fXaCg+TrW8WpWx5iT4iYRH93j6ZENHWwNq/JBLlI/EA+ZSUaF9lClw+Sb93isoSkElD2walB2TY6NcakrycGCNbc0MUnBdXzyll1plrUd17AVWYAFag1H4u1VK9hG95Ip2IhxBh3eZHQnJjuMNH9I8a5Sv/J6FAF7jehEFBvhMGFgTd8Tns7O6OEdydX1QqZCEWJOdJXaeMoTzwvrXZBzCEC5Ty/YmUPuBE8fuSEUymqnYUPyOl6lUayXYAnas9coBzK4Wm84WPiu/3GpASRa+NmNhiiVKPLft3K94+4ErLpImFgVCpbK0yfRHo+JFQbnlZSBZzq9GKkwglatCnz/Bz/7O7759k/+1N/5pb/8z75DaXSbHLElUxPKgdPoFLwuDGvnrbBhh5BUpqD/VxM3a05Fx90SUYiJyZGxfd8xb80H0wMX2As1aNtOCLT65g1G3/5SQytbFoYt2Dlm8aazvXsdJSJmGK13y0Rj7Nu06tjnjusIzHzHZiQQn04vT5NursThdbzGcbSG5Wg37sB4MYOx23tGQDPBXoqHlIe0rBlXoM8JVZaoyj4SU4+x28MxDUE9AWiKG/XR/+QP/re/+Tf/sy/++Ld+4sd3utyc0+3BmPLyy78vAb7kgVTF+W1+jAapBemEzo0al5QUEnClc1+IwGuhuo51jCBApRFIn+Q73k4r3XVSYBzMxmOaGv21BpKmymDLqBq1iraE3OHRlCkJCCE2md8HGLQmw4SNL9KFzBlZytvTjQoQj7S3DgUWGrW6EAFzF4FH3+0/+NnfcfL2T/3Wv/P8P/4db48DCKJKuDAbUwuJEC/V8RjhLE+gw6mXYOKvEr8pTNzyi013P1WbNWPf+BEq8cz5hlb5GhL97YYciCoyJmQuyP55cF0+j/3ugkTI9fS1553jfp3ymatqPM89fyxM52n4sY5DTKrXMf5h5qJuM+IMOwbdUYpTDBaPPsk8XuZK0/MeQnVLHw5UYgc2lBXW9Yv4HBkDlCxxlYIEvDh3Ozr+RIArMpZnuRP9yud/5O//2H/tiN13fuxHerdr8s+rRoS+M0oWJlSwBUm1nGXvPRxYiGuYOV3PANWaxPB4gdqBQGQehFnDhPzJkiNm5a0XHiY2BOlqE9UR8qsOiltYJioY2+hlDjYlChzNwHxe2cgZT8WlkD4qApKLd8qmHymYi+5x4kAUqmhnuNHaD7vaKjsVw2EHCMPCLAeq8Ne4vI6LHb3G0prsHKH/8x4qnqCcpkmRd2riOA778IHoDI3n2F5J+cBfVJ02pTG8OUwV8J/+xBd+5Hv/6Otv/+Qep8+7nN5lxfX62ctlzXuXXr8ahhey17VbfHh/QXwGezSiT8Jk1pi0jnVcniWt+3yeobjCaYdPN9jzU4XAeC/GNzVaQ1SyO6PCUO1JrKHBbpcVYDtquwqiMynMgCiq4m+GEYXdoS0c7SCbE3pxuLGvxkjIyzXTjITB5FX6lc//yK98/keO2P3q5384k301lXVQOgZImIUM6EDdV/m9t4LkiGvHyb3hjAYxd4rS+MR5kBd0BYhJiLdkVU+jgnWdvugmKVqWu4IjL0FWx7rSuJJdRZYwKWrLXvrZP0DMB88UfJKXPQw+UJSfmVRz4kZnYK3Ls86to/PYriMqX3uLl+lo3QIwfD7sp/mTObeuRfZ6PKl/J2SEcJCHqGDZthuQ6Z3F8Q7ZCiYAa9GmX0MdrckkNSJVWNkQTDe2TVaRFYyJUABH/dyiZNEAX5EpSWqgx+xmorr7JhQ5wnndYbYsDlTDlOzqDNM2Lp8cLPKvsSQFcUV2hzIv3jDIU6Fjt18FiEVxT1XYqGAUJjYklp3uZOhtUvL7eNgSNO85J2LFR57Mz5J7F0JGGj2HxJ/EJpA17CRqD+LtlHi0gB0Z0z13R+zAojcUzESGxaeAe/sjieH6MI7qvCr0r+NlB9xzi5ML3pkJhkGYq386rJDPUGymlHnVoU68RckZ9eFggQlHvX920VOYrV998I0Pfd/PafQEiHOuqi+lVLEsBVE92/57EXLRxiikg+t86q4lsYwt7KWYeUKmWguldXw2Bw7zyn7hFazSetJPaKVvm37ACrYmDihRaNhHhgiiXS48+GihHHmTw4dy1EHbILMgMOeWaEfGpZSRefxCcLBGcDWZgsQwbcXmzigue5vv85xOy1JE0o4piCD9T44stQLQjawEk1rLjK/L4AUzhJPrecl1TSZFF2Np/xCDzwWNggvJrCwI/tJAR0vHxrgzWbSktwrCNewRV57o3XCiTdf1Ln2XoR53NsdnP1iUJykyzeiWXRIB2CX3YKSeURiGQ5IFP8wKdu1mEuaqYBwA0V6r4Ik6Yr0E8TPsRumiAO9gZlpMEIfJsszs+wtNHEPdAICH6yBH+hKp06HMni2YF0gNDtE61+WfmtG+3ZqyZYAjNmSSp2CYLEO/vvJnvvqHfv6rRPRv/dzv+eQPvpdblRy4YK7JlJHURuZ+AUQlSUWWGJb6zG6BERZC2whc+xdoxxAa+nMDGTsYy9JzM1MceYCZ5tMCYq+GhZlTZQ6OYCIv0fjTaxjDEhSjmKkg0S13Sy44DmnbOGUw4siVwjiigiTuL+bGuhBESD56MX148nx9c3TnTwyJYfQuq4OZnN+YUUgrrF+yCxkr65OoFs+NYZG1M+TI17GO13yc5dsAx8cR176eBBNt2G2xTJjVEK6Yinfqd2sqkGlkuYO1SZ5A0hMg3m2YbnvEYdXf/k9//H/327/xnxDRH/sTf/zrb3/pUG/rmT4jCARG6sMNuy2WcVG2KHbz3BupjQfCHXMvfYUC51yuNJaMS063hnFkCnLFBYYwpvPa0MCOl20tI9fx2RwVLPN59fEAoZIERwWsEBOxZ/4GkzQOUrMlO4c+OAviMxQlOSYZ5u9VqvsWRFuxV0wNmDPhK6bqhWMh3sIu6t2x7ITITVUH6uy98f7nzIjRg4hZ3IodNwsUM+fXK/0ry65XcMVV8L/9h35XfulrrrZH1Vm6DnXDEazqxom3AYjngSiw1o8hAeKOIYGpyRIqpMQINuSKeT3ccW9KmGA5/Wj2s5HnKYii0VT0PnUgivKrksRRvaUxt+PWDxBtknB+QSWXXB6sCwtUGpdEdTbsXoAzeyHU03PbUF1RuTweMy+TLJ8PX42N09PTk5OT4+Pja9eu5V5zcnJyenp67dq14+Pjz0B0WAHi8801g7JEmWniUHqmmzKaCy8XHwjtjKltGAGZUr6tchsNoWTKMfuZ555dLk4ElQlvawNDSC702yaos198+xU1wElz2wxqrEg0QgCI9YYdGfHQcD3jgpfsKjIWIoMDQKPb0FeKjC1KFRSOjzr+0LCX2L0sE/XtVBvL3LVPaa2cEl4IWGcNs+EoIyFxjaEOVHQCRIFH7PHx6daWLkDc3DVDCOqDhoWXG+vlgfU0e11bv7jZBjD7rQM8EoiFGLDU6mPE2IEYkstM7Hv27NmzZ8+I6Pr169evX0++5smTJxo1b968efXq1TUurGO3MY4Oo60nE8t+gAjPUJjZUsSWpGTl0eyebO6PvQ59BeRSiikwoWR3flTkPF+VN1xPin0tbdnU67wUHRj5/HERxg270VMYq9KPTMVEL6TcsNuTV2tJCl5IIkbWR0I3jC+/jCCIKrHEVB+wn3od63j1Y67LPhHgwZIaUK2gt8qji54j80KYgho+DBMZopoArlvmLHgLC3DoxjNMhh2kEwq1BWdLtmRiEk4EYh4e56RxqKLYTFDJBV3NGh2GTP8iz1112leW7GLFhDOxGy+kq2XjVixHBXucGwQ0Oei6ztx3TCpFCkwNW5PZGGfJyahGR0iNTLMFqwZr6M0M3dUujQuZGGdqM+6ynEcAWu7SyUe3h6m3HY7QszW4ADHM3XWoG+8AYzXXDX8ergwTGSYGKC9a2OLLxAuTxouJrcsA6+QjIPk6PLrLnUyCd7UNueBxcnJy9+5drYWJ6Pj4+P333//www97xfKdO3eeP3+uP37wwQf37t171WHiFSD2kQwsaZzoAOnvpABxeNlAzQBFBCEBJDACw8tFWxQ8rWBqWKX3YsbD78C2xdqa4rBgxy0m2EKWI3Cz17hpd0a1ztmS7a4gfbxV3QwG74kiS+aWQVbDjthESvw1jMsU4UPdnIJRo7070ZUxIyu6soaFObCK6j59uJH+qaklgyfPSFtXNLlo3q/7uhrGLIYpUPRbXxGksnrb19xcB6mAgl1NLA1fmF1rrdDWnEOHOuSDuiWxJEywnr+vfPN6cNMNiSHKPKTpkzd9477+nyhEvr9vTx/i6Ro8eudG6qlM2GY/4zKCQScnJ7du3QrR7v79+1evXn38+HG8d3pycnLnzp2TkxP98e7du/fu3etFzXWs42AozxQ/NPjUqdH2VorJ/Tazn+7LOOl15jjDK5OG8R7nir0+9/AopMINmTPCQig2NBJlfe3NrkJ7TGSDM97eBdX+c36ArRwggBlCec64bUMYBO81idexjs/UYIArKdjUkVAgmNhwv/lVCbxHXHt9hgY0RIa9Gz93NaxWQLYxqeu/BuCee7j3CInablr2JY8LFtewlsQwKimOTDUefcI2oSNTETbkHJktWSFT7bEb19tMHdCueNv0CXFrquYLh/jchIyDKf0uJqfow2lMg4wDDyU+xKtM6Iei22cfyVwxE5Q+zA2PWDaMMylAXBrXE82IS/h4hbUkG3ZNkaWEcoQi2jJRybXkcUVD2JDbknFkeUbhF4tVJqvijanPpAxzTP9IZ/JopGt1MIYGEkwTcoQBs6aAjs+o/AxPHNWcSQiieircOxg1lNozoUpecCGupNiYKgkFXP5gfHp6euPGjdPT09u3b3/hC1/47ne/++jRo/v37xNRqHZPTk5u3LhxfHz8wQcf/NAP/dDXvva1hw8fPn/+/PHjx690eFgB4nYS61wdyJ7yhU1iJpRdnzrdMES89mFsYYkFiIO+hHbZJ5EyFeQ1Hdp/8OXTRcyQb50oPCO49Nhi0FUYVcnQ90eoAXRnL4KGedsK+MZm947AI5zaoQBxroJ1MJYQdqdHGKNlP0tpjtGycykJXcrEp/hmqQAxUtcHxDXZIiuf1cwBCzgvB5xwhCMjJE5h4hnVOHcFefX2gaimhBlw/IlMVLKcTdSoaYf6HEZcsFgSIioY4xbmliEUdkumnXANieVZZTkTFeS2ZPRmWe53Z4/wzaX5k5Y+FrfRxSZ1BHqFzNMVHb53754Shz/55JNHjx7dunXr008/DZuiig7ra05PT+/fv3///v1r167dvHlzDSjrOCCyU8EK5vJqmbAxtSFsTD2JEc8ZDgbERVpCh1N+XLTh+gzFvF079nWv8jElqS9hGaC5W1mWxUyFqkXQtnKHdQtw5y5FB1NPKW5dKDJCQQ+6JEKPR7wUikV+PrwSo8FTXp7sb8jcLKFkdx6XcTWkWcc6klEsToZL4yBcJDymSIhfoAh/4oi3aITjZjx6Wl9bQwTSBxyKGfnmiQb2VZJpOBLxYrJz1oRG0Q4MspuYpEydBb1X6ETlZ4dftPOKwaObqdH5egQtotr0zwjcOyqewCKHRO8uROCL6gpW/YFCawuICnYCLo3UIMt9MUZuy6sFayx3gPKO2MgEg5ipZLGkAAGSmV4uK2sAd8/21X+JthzQJXcnsWaOvulIRVNEWw4M6+Qetgfi29yghjUzDDiYsOHaNMfJu8/Dwb2LUrIGaTlEZBzTfMg1VzHtcW4XNR49enR6ehqTn+7du/fWW2/dv38//ObOnTtE9Pjx49Boe+PGjSdPnjx58uSVLocNraP3zMyWPT1YZrxAojS05KQZrAITfh/0JSyjZBnqxYC04Y7bCoEQ1ZZwMPCLObeH2qyDAUttlAq4g6kF0YxoGW2b/beR7jCIarJBmUF1XZVMiqky2DLMQGe541c6+g41TPK6q08dEZUk5BUVilnm9QxiafSg2RvWjW0uAi3lNpcAWRJL4CYIpXdN1REi2tsYSyEKVus50f+W7EKjqHTlIEDEjJKcaqHsris/Fb0MNUjxzFGQmE6ax0NIZQQdhr+wmozqpdDNiWogcDFSNvv7O0wsGI1jnqFoT9u0GzCXdzx58uT58+e3b9/+8MMPVVzi448/vn379vPnz0OXzcOHD09OTsJrbt68qZulGinXsY5D1a5b2BrZoLxJ+arrVpkZlaydz1jcAfWzhB14irpuJM+UZ3cyWV3PCfNPqshYl/SW06BFuPOt3Af14+Z2O3tooM9h2tf3sz0sS2mc4X1uLqlk1kwcZ7wwPg8ZEy+EtdKH17GOMVxvHLXpLeNKtl3kdIdIeLeCddTSgzQExqK3SfWn8Y9r3Oe6ZyCRzq9ShjsFl0cSCXQB5f822gMGCB3N1g586bHjltw9CagJGd3KzQF2QfEZKQHiAHeWy0PtnNWVp6ZfHAjCN7m4nyuH9Rbrf8+kNbcImhIb48L3mUPiMyleSPFCCt9LxIjOUf9XkivJqTNhMuWrG3A74mtjFi7KHMNzB5iTQ4c6XOCmKXIWEnzZ922/+tWvElEssRhkiLUcPjk5OTk5uXbtWvya999/n4g++eSTVzouvI5p8WJx031kiLIBrLMOJndrM8G19T2L9zldXkJomG0LuIKRrpBR7FemekwgQ0ROlFLdLCbREtNVdwUJ2HkyVERkntXSF3VwdM432VSiuJ4Cbb5PP5mE9N+w7mJ/CkxHV6CBgAt2G3bEKrlIHmefSR9mkBEyGqVqTFTFyo8b1wT0G7ngUVn9eG8D3i0QKeTUn6awbglQh5dboxW4Zk8cNg2KSpwmWWefnqgjLJkrtphO0b2PLt+uq/doWNCO/8lwlBGT2j9TnMSIlyZG0pi5c93s2bDn2venKygnbpO6msKmtgf5GpFdVdWIL3zhC/Ev9ccgKKGRT6OgjqtXr968efP09PTJkydrxbWOQ43xJ9rulF/ywpb/GjzO3tW+yz3P1MHsb0+3g8GXmSfBbF4eBTM4Jhg6F8VbLBf6MCQlOUzVWiDasOM9NgWTJKmRe1RGhCAXMQbaRyZSXrIsXtRyz6vaxDuJdGCYcMT1UWoLh4iYpBzNe4NbYw1THwLB3xn6YbVt3u9rXcnXcTkHiCopdn465ge+WIr0jBQapi2sVklBQirGSkvjJokjKptA8KZvHeKnPvjN555JEaoSiVwNxDc+OjJbJKDIQ0NpnLuA+kGmFaVsSycVHEjqS/SMZPR0krwWgAVcw56JFepc9pk4CY/VejNnQbJIHHvxQsle9l7x3AXf20IrueMe/0Zb1hB/gQlUi0XzNg1bi7mBWYbvyV1yOtA4D2E/WHSHB9Vy2mbWwTq/WXJ+6Z2G8m6nAnY+F732FxaU1VknyC3q0B8VJtaC97333otfoMThV70WvuwAsboknZ6e5l5wenr67NmzAFvMxaz2DKggYNZjXKQc6iqyCdCTZemy2sGYugl04NWaFI9SxZXm5Nzj6FXpnejCedTdt9V/NYRiBqEpvjFAX7S3fc+GEC0zoQF9kYoO16P08FgnGg19WPWOZVEG1Fi9NVRimzzZGBEGJYz4ktNpqZlSndrbj/Ul4l2B+CYOo2Yw0zvYksFkun09PRLxCJefU94LaNQ2eOFRoKAgmdJsurglVCN/u4lJwlMcuPzSUgJ77vYNlTjJQR45Xj5QaBw5PQ17X/va1+Jf6o9hj1SX3J6d65e//GWKQOR1vKLj5OTk2bNnvZQo+ZqR0HyIwvUAhMRpmG808joY3VbE6Mp3ENoR6NzpSw7mDMUZCvcyEKsaXC8UMSgTEep8apipRVh1NtqZwz1QlVNVmVgWswc6qNvhC17fPSpJEdINQfu9lGxeNt1RE9Nmt5kZ9/H0fCYnN2mCW+PLFe5gHGZTdg0r69hnaP/WeHK1c1A+1+cr9NcrWwJBA7dj6523KuFEAd4bmifE2ULjS6mShl5pqnua7GDCihRkHByZ7UB7s/Y42nksMBStcs0Rsi7R/UKHU7WPbXbaWsTNwVRIiGvBL6ri2awSqWvOLJc2pm40QHgZTEFtATsLkfZefEEdYnR+DU6TvEkd8mTq/qn5OBg45m1ihgZrbuNXG9ZhBlvXvU8MfG2duph3qZMvtIQrVO8wycavneziDL9shYm71Y+iGbv8vQ5Gk5qTmn3lK18homBSd3p6qmZ0N2/eVLnFX/qlXyKPI8cjiSy/WuPyAsQffvjhm2++eePGjRs3brz55pt37tzphb3T09O7d+/qa95555233nortD8fPrrtOpQiMelQN5NEPH+TZ2iHOn/R2JkdrSiZRNRm9oSmEfXeCmYoRQQF6TA5fVMyxKnaxvlm/8kR4OCCHTEsyagZghmylwmcY++G8JNC53mkEApmbjSFEQcWrUt1aio67GWIY6u6RupIr7mSiBGRur0ehVMdEu5+Yg7idDBegGl01vi7OZ8PCK+8sXO4ijEI3ukdAjs45LF6/L3zVckRDCpne1mba27evHnt2rVnz57dunVLt+j0G5WboAw6HH7z9a9/fS3nXtHx5MmTt95665133rlx48Zbb71148aNYUX67Nmz8Jo333zz7t275wcTL8IxmVByvehZZsI4SiWU1T6uYHaGWQGeSVk1XVxy/zTdNVX6S0DcdkD6zLKGlfMECvM0W995058P5qBqCYeSbwZRyc564vAcSQc5EEQrK5F2HetYONQBScOxlrpDYtpFBuXlQdyciT0Tq/46zndMbmGFDBMBXME4mh+VeFg6DSvXrgDxQI0XzbH1zEhbHxFE7Zg4rzgEIgEBXDtb71TQaN1hByBp6kbYjv4G9LyWUmpicAPDS5rPZGTDLsHbzBS1TNiQC8ykYPPWM1c/GnTYYKAavIWVfAbYvC333rnfzSzEtd9yUM1i3V4tSUqquSv/WMG6rlu7+KNqrvxU1pe1p2Pig1aOSiJuYHQsngaDv8GoikiLEW8uix3FxLh+/frTp0+J6MaNG8z85ptvPnr0SHUX9QUKAX8mAeJLalJ3586dR48eXb16VVuYv/a1rz169Ojk5OTp06exRdKTJ0+uX7/+7rvvqrHgjRs3Pv300yFs8dkY3j6TVcDBDJ4uEO/JP7Ik0hqo8khAnvlP1MpIocgQYWqyFIXkrnTGxOkMUbahuo8jE1+uGkb1dnPOY6UXmgjAaE6C1vnOxwCYoo1j7MAFL5IpGD9TKYhDxAs3yYFNV2Dfs2jZkVVqOXsU2LJ4g8HWabB38byOvrHsFPQ0XZM6y1KSRNvpDf1ZrSrqflDkkWnDrbAyVHWaR2ACkCFmCneNi4ixm9sitiTMCICIg2Wf1oz7PDiw4YmauYblBHzjGQFgATOTYVmS+57j+PovvvjuP2qu2Ok/HAvPT58+DSr7+pvj4+Ngyaq1R1iKw9DfXJ7KZB2LxqNHj+7cuROseH/pl35Jo+rTp09DVL3kdr2WUV0UnIjZD3Wj0NpdoxyxNthOxH3un5TACFFyz1VdbV/6XZCGdr1g1Cm0vUeM2lCjTRn0ZMsMD0XZZJtZtgGHq/PPmehqF/rmTdafr7ppm3onVGJH28JkBxBkHeu4JEMD7unp6e3bt7/whS9oqXvr1i21hdg/KO+8CKAxlJu1NsYau6JgGVoOqgqyMdMWdrnu7QQuCWIm9CWJI4po14sMoYwKdV+tpjggs2CXbu5ZVCiC+05QJJgst0O9aUkK4zhHHgOBO5Y83sGPNUQaAuAw6gY/EkT0ysZHN87VzSlKD4++ZFd0S9Rw4oVxIiS+YOT2nxAakQe0rfjAEM+HmQpOyrb2MAzHpwNtlEHP27xPVweCW53mJ0XB25ErdWERK1yuEWXF4RMUJxJn3T6/0rikO3R8lwOwwBe+/d+pgv+Rm7MCKz9VVYa1k+PZs2f3799/8ODBZzv6XEaA+NmzZ48ePbp27VoPDn706NHDhw/VN1CRiwDtE9F7771348aNO3fufPrpp3MXOIZlmeqJuFxDwDUVQIKVLHkiZ+8diNINDAWLg+H8Q2sSqCJF9rBJRQhihiEkO3mrtoxstJBcV3theDuU0msoYU8X1rL2HSKs2xFb4ppMQWIJNVmZUAemgmRLRk98eG2dj7IUlesRTL9UEILGu08aRFXVARCOwViSERuHGta0nGiVBKFicB+ZiL3iQep6gogsOaFiQNBuTrMmYxh1xrFt5OFSp8HxarVggEgINQGRInYc4ThTVBfsXpDRmVDBeO3sibDkYMp5pAF0Usw4FrKDNSSmo+f8Msf//F/7ztf++q9Pvuz58+fvvPOO1iTvvvsu+S26t956K8YK1/FZGtqRc3x8HN/id999986dO3fv3g1x9pzserf7SUkwoSTZ0twmUBBZQklSXVATVU5GZpG8TGdtoUzsO5QHZiW2NI4XHlgFo8hjTpmqBjOZIYotKbS9x2y1bdhibQzyCr+JVdqNTqftQrX6w4Ob5OrD7Rpqk5aAiwHs68CGzLCfbHF2knmOPBB/vsPBaOtSPBmafMagykumGBJmQytzeR2v5lAucAwHf+UrX7lx48bdu3dDj/PuQRlUwzJjHJYdJtgORuHF0rhhKTGoRDj+wwDkUet9EnRaZ8FF6JSQdmKBkuLIVKG1v603u0fqYKou2wPh3L1KLzLHkFje2YVFB1PnImDnqakTcARDBYh1nRfwuHOswtybzkmp1oetYUvjZC6rLE0uLdnNzNy4/UpqEGeq3eb13AYsJoNOCRzu0hG7M+18bcz3GqIu+wwzQjDrrZSLEJ5OGYtEWWvGKUdoaexOrGEQ7cUe43PY+h5Bhwt2Dn3AhAkbrs0eoNlLKYlnVsHxCvz8+fMHDx588MEHoVZ65513Hj58+OUvfzksy5/JcRklJtQ08P33348Zavfu3aPIE3BokXT9+vVr166pn+D8rNour6ac9CUULmp441GYmR+b1HYQMhJrtS9YkhAkazcJQQxG5q9MJkq+QHFGRZwZdF/EQlx1FY03pi5YmEml/cZlNGrYWFZiUV+tOqsoQYkj3Yl0Ld3GyEbwSCeJV9Dr2BKGRpWZlz1eTM1h9hUbZYkePyt3MEx0hWrjScex3w6YamoUQkZklHM7/ArrlDS3vGxJCKPqVzXMFjZXMUb3AoeKVmP64EqKR7BhfJnj5977oX/1j/5G/frCbypzL7t///7p6em9e/e0LLl9+/bHH398796909PT+/fvU54pnGMWr+PyD9UuVHWR8Mvbt29fvXo16BGfn12v+tVUsHFf53wBYu2ynGOGGoiTxotLGJI5tCD36vMQ3RKzL5daz5mozHiOqcKsm0pOFnlyJhf/kl0AwYfCeSA+E7sVS+A8O3vuMQhxJXOP1jepzBKzsozNDBm+mfwmVUphpiHQc94CvnIhciVDICNgDefkW7iOdbz0oRY7V69ejWGIa9euxW7A+wRlSdufJB6oLQpqPd8ar62aTCUdm5OCXI+61BOgQwS8UgS/gvp9fTwj0+YBaDskFCPqjCRl7A74pYHXyakqchgKmakebDGi+wIi2nB9ZKoZ9kIcs5hzdYhvuKSCXcHOZPHWMdTPd7qQd+cjmRYOpuE2QBI/SjK6iMiSXOFKJwZTXyEBoxG/ZLnC1agIEo7YcddrF8RbFE7/C+4dW3glT1Rv7QPRTlSkT1P7knPlYc/sbgdHuC4YjSOuJ2vSQ4XFEcOnRZncJQnSM6tgHcoXvnr1akCHtcJVQFKNeZRENVS41d/Ey/IrNy4jg1gR3p6iR0/OQ0Njb3f0vffeOzk5efLkyUyO25yslrnf8qHi8b4bpWl4dGDF73YH7dDulc3PktPPM4luMyp1l5uD5OQFqGD1Ze0zz9qTEzdlMHMbPJlgPfdqw06Ia/j9PZAQiRhjXDfhSIw4NfG9IZ1MwsEIG6aW5R3EIjibQLCQcovYsNCu1ZHtZis8FSnjs9CrR34+qNxE6Tc9QewSelhckS1YQIZGAVNuGmQI4KQUEZM0zSxT67GNQpph0UvXJlJSXLGVeGndI8j3tamHmRAo1dPZiRC7piB3gwKPLMEQFhGQho7wjfx/5PYbpkceluVGZJnbh6t9ErnBOwpyvZxR5ZtrMeHxH5rtxHlb09zkWfsCEmJ9vR7boh0qFjZud6+M27/7h8P3f+mv/fov/ZdV8mW6usYRUX+8f/++xjxdYIdbcfobtapbx6s19N594Qtf6P3+6tWrz58/f/78+dWrV8/brtdRrEvABzdSYyZLMigyYRn11GopbdC/6KFbs+PYrmkIlZ20vrc9PJk/DD+ljuA/RYdtfq9UgYAzseP1z643FaE6MlOzqD14FBuzhx0KsZtTBKFVtKxhJ1U+Sq+VwVNbwvMZDIbAl1I1gpsu1IJe2cGvLAH55OREe2PXXdtXNygP1S01TGs5vE9QxhAJIzBxaRwkDhYsUYt5D9AMy5glKVl6Cya67YzcsF85lJ8vUKgkca8DXXsserVShaJkNxJD6uymMoeg4IiBjpNnhWLDdXIxDvThyVHDWm5VhJlC76wLwTFXiSSvWBdxRunbnb2LjDPMvDyqxqW9JEQhmjkQzRD0DnFmGqQmMdrXZVqzB8TZAhM5EjS28C6acvDqlBN9YT1omCI0VnW9KrLMaZ51aaoFF6057MKz4hHxq8Ap1z49ry0K8bxml8qOvK4IZuKqPA+ZLVhE0ZrZo2Qn6Oc8Cc3oofBw4rw5OVWQeiyxMHFh0M5dQV/5vW+2VfBf/16uCtYxR19Yv1erusk/fLXGZUzakqlMYKspnD9yz3r3KTf+4Td+8S//zj+s37/55Z985//wx4jIoSlKgyIeD9Rg/DLXWQ0UR3MyTaY4S7mLZotS8JZstCXbrp5qdFYmOwc9z7f7SHKmmmIh1tfXsM4vVdYIC0Lw0P/VYtjARB3BllUkAqxoI0MV37SNBVxRxqC2VzAgodrTHrP2rirQNtzx+Q9/5z/zzbd/8ovf+rt/9Xd8OfIraAjUSQ+iKi9aP7yeZdO60pRho6tWYi2tYI54EkhtemzH5888jusuRaKDFbJxO5hhISZQIw3WO4Q5qK5iqSATxDpjQpZuqNTqu54Obw4YEtnYJCQ1OowwM9WqVYktjEgHX+fhTrvKEA+iK9S90EkRB/gaxrIE5c2U6AcT+rvMi3XDwSQHKlbz8TUpItxblkO7Rrwbp/Z0qwbFqzhyCIJOBrUoHLHrDSBy7v2/82f+3e/8mX+3ef3P/Z6f+EO/i4i2sHvZGU8u3aauIjU09OPpJR3S7ClKOJHuDq5wpkzqI4ajzb/Jiq5m0z2S+EcoTftP/pF/6bd/42//f774W771Ez8+gs/mY01aZWIymuyw8NVkSpLcBKtgg9qSFnKbKWKO5T7fPO431csFgkA3GXP312BqHQdoiYXBYSQjxoNmzaZkN9N2z5vCQ3NmBiZzYz6op1+b6e15YYS5ti9lHVBhPQyq57t37yYbJYMQkK7YarauP37wwQf37t1bYeLPRlD+7ne/S56/tk9Q/v43f/Gb/70/FFfBCg3PZ9X4VLvR+a1g8+JC1sEqdQmN1hALVA0gdlcJ8BK6eCnxLFsa8STNkWNuPkXAltv+1SGYJWTicCZgR2SZALIsjjok4oFmbrujuWF3RjTPJl2RRBO5ryMZ33v04b/4O/+ZX/+Bz/2tn3jrO5//4YlVlilINAjMkAFTGhfYPPVAuFIbec9EpZPRw0bidxMyvRcwE3uGtGlEIIhZqVRKZudQnPSo1DF7yTRuSRPJQo88PhwLCLBRODcGhpuWNfiETcgMg5dEVR46SEh320MKItrk0WrEG9UgmedSF+HmvZmjx5VwieAWr+XoyTUR4YkkntwEndXSMclQApk1JCVLDVYvSo72lsLVUBWUmhZEWAaxK0gOoaU2dR21mNX2yng11vir3OGbN2+qI9qDBw/Cax49ekQDDusrNy6jxIRe9F53jF5uHQcxDSx+8HNvfvkn9esHv/jj8RpUw1SwM4AbpkhFCeB68MhtUSACQ89Q1EuueTgYEJ/FG0HcLO5Ndz9GN3z8cplrfmSfSW/jJZgbBXHLTpejmGGaaLohUn/SsHZJgxSnDyqIP+r+7WRfaq2ag0i4+vzq53/4m1/+yW9/8Tf/6iA0JtsPK5hqSv5vC9vsgHHjQVeYMcebKuPJA2KJkhV1NtsP1QNPAKA8zMwm8yo3QEgDU4yJajLxvM015gwd2+KQKaBq0K4l+W5f47dkCxZLh3Recp5jjnnPeCd5YjEKlHB7I0BqrtjIv8g8adGma+nykb40qsVLLnk2SuiX+cpXvkJEH330UbwsP3ny5Pj4+FUPiq/n0DvbC7s9yaZ9Iu/m87/xB9/+rf/Y2z/1G97+qfLzv1EjkSNzBnuG4py61Icd93Wqz8fors/lwojNReJoi8a3vvhbvvXF3/L1t7/0az/4uXg9m6lFKzupTORkhao9JA5MVxZrjv6GSW0SD+gzo8pNRNr6uqfu9qHnG1dix18wItJVp/4p9KVWC3QqET+VIZ2wLHbGjkLtU1xNF+n8nQPPb5ycnPRCcByLn6VG/LfqbKa48PXr1x8+fKhKtet4hYZSv4PEk44gLrF/UDY/8LkfePunfsPbP/Ub3v7SD3zxx5MrFjP1YL64LU+It1KcSaGcG0edpzQsrzVssB+vYZtqjpgGO38gqsQI8Zas8q4KdgWJV6odUSdoLK9LdqWpcxxHyxJ2ARVH5vxSjYSEBeegk2GlyTGouiDB2GW9+s7nf/jbX/zxr7/9pV/5/I8shMi4V5eZ1uMHSfn2mLZcGMnBbjNcynVhd+FIMHj/5Hvz4B5FTnft/SwPRT5gCi5Kwby9hqnJcgRaevi7PfiovmsUmK0RTpyC8oRCszr6JTZoQw3+IMQvUJwtgRF60VM1M0tT95JeFe/izAyJfSa7zKpES4E+iRvjkmwGIfN9FFsE3e2lMfqAlJKJzz0+PlZ5nxs3boS1VB3qiEj/Sd1B1cQl8Gk++uijoETx6o7LyCC+ffv2/fv3Hz169IUvfEGr1nA/Djh+8Iu/WVnD8WMQpm9CZYbBLHGV0g0ejMEOpEK3G6aazJGvTmcm6zWMEmADNupgwDkI0jhMY1KSWa8rWO3l0bOuYTp8zHn9dUFRHrEYMZK8YOqtbjWZpLJPW7rAeL1/dkQA1WwYCO4rX/zW3/3Oj6U3TotBaTGnabT2HqlhFbGEEXKRQ4cSNVwWK5iSpcpr485czCLb1qx2Uy+tERjwhN0QH2hZtYwK2UQkee6T4p5e3YnzMJAcce3IFCRqiNze+gyyjLz8Fo8ZCHhRb9aWIiRNe1OJUdhM4jZgZ56Olz7ef//9J0+eaLTTFfj58+d3796lSPb99u3bH330UVilgzzxxx9/vNZ1r2gtev369WfPnt26dUvvcrjpBxlv/uw/9/k/8PuM+lowhBp3i9xqzARdMOe51vA2s0U3Z+GaqTLxOoySdqyptNhjmJJFE5hzOsLK9zlF0U12O+ZedNhtIU5WOJNv5S6BZyklatTpi99TJFOMXvJPH5ZoxXAEUqh8GYEsi+3i8jGPu45yKiHewhoybt5qcAmHsj61whx5zQcffDBioX5OVqLreCnJ2P3792/duqUEcE20ZrKgJsfRT/yWL/7v/1dXjFjCkakoAXGi5zcz5Lg0ViuwNCCISFOcmrC3pCZ1wi2bsmQnzILCV52qNCixtFFgvHrIDzGqpc7qICq4rlBEf5L2VQu/FiKBDbYEQ3u9JHsjoJ+xFANlX9guaEyXUSu9JluTbMglw9YMBk3/vFSiesN15m/VSZW9xEROuhcpH3WU7AY1F5+huML12WAbsuEYYfoUJrvKmJUAh0CAA02bmKcSg+Ydikyv0sao30/d+yvTfm5rwDvT6m7YXaQkA4WznX+cVU+1YAH60i7JKhX9/zKa+AulmRulIjMInXVDfF/+K7F3++DBA43Ib731Vvjl8fHxxx9/HLbl7t27pxu6YU9XX/Cqt+xcUomJp0+f3rp16/79+wEXvn37tt4kLWIv8ngMiyERNhk1mFAkjOW7MyTYvMaNl84Bo2zUebzwhVinBTO4Jluyq2EaPVMyMlgci3m8y7hWqWFqz5627JbQXRHrrjrYBpYFw8eMsApXg4aCnGohQFW3kUfVXAUs3Ox8/sGf//d+7uf/PSL6+Z/7vT//c+9p/RCAwkN5mLB3acsGWsTiCQ2NqIbZMPSCYIlnvQPXZMK+ZQxf8gRkj1w/bg1bnltD93DmF+wMwU550C22fmIaSGKhYDGAITHRg2DyzcU92WKaleVpGtE2fCX1lTD1Vuy36C8tuen69euPHz++c+dOvAIfHx/HBaf+2HvNvXv31vrz1R2PHz++deuW4gj6G0WNHz58eCinBYkUjabxO5ZqniMr5m37jUX5GTq/OwOaBxG1sAwhmRlBZjIuU9nO9K35P/4v/rUvf+MXieiP/Yk//vW3vxTfhw07y+JgHC1A6IaGP+NTaP6yyUQVzIaxK+qNkl2VyoIcuGJTkHBm2S+aXpNZ4HWjoJVDF/aaNmL4YP03Ah7W3O4cnhqOHKRNCrcKv+w1P8U7xK/iePTo0TgbJicWH78g6Vr27NmzTz75ZA3Qr9b48MMPv/vd7z58+PDWrVsh9Xrw4MHdu3e11/Z8RsvJMH3SbudxCxCVKjagsWCJq1ruEQy930zIhxuDzTlL3nApMKrPS24La6JPL9ttqZawyY04Xk9AOb3oCpneyu/5HI0mb6kKGSpVRA6NiES2CFBlhnO6Yb//5//cv/yn/xwR/emfe++TP/jeEIKYU3+VCVm/Vu2VZ9jZgXgrhTFV8uUgYpKCuc43TsZ9JMFxh4k2XDtiqGxlt/gKAobDdyvZKf83WSQ3c4PJTCK9jfCmkwCnEtWwFSV0PvNBHEoiLrm2lLd966ouMmFjXBK3qWCvcL1onhhCoGwzwbIoAcuyGK8ewbzYUV3J+FtYgWF2yUarmkyFwnGtynK6m0uXHiNWQPLJkydf/epXdWfu3XffVfvu3msePXr01a9+VUX/33///VddgJguJ0Csdem3v/3tJ0+eaDKk1upvvvmm4vGBVtz7K/3NPlEzDfIyrBHnBGMlKALCG9j4CidtYTfs5itLKBys259bsopL6v6M850gyhoGi4NFBgVmxmSxV8P0+CAS4Ws8u7yhZvepySrgC4kG9gWDuSa2xNVCgQWMpvviRazCj5oUWIIjzEce63l8k7jkHta0QwN3f5sa1a1hHaX3uugTnFmPpyJbkJQ0lJmmGe5wzUHGTnQOXDAV0xufe2WWioaoYwMzRqrTGsxsRrYxiq6jVA3jlRn3PX41alDZbL3aTCjY9RiLPjVxivK0dwpghkG8rztBmkPqN6o9fX5su53HzZs3b968GVZgrTaHMsSffvqpvkaVJT4DEfF1HprlqNErebd0rUv11r/77rvay9zDi3ew69UWGcMvk1JjSQpv467BbtGTWJCTVnY2+9TXByIz8hI/T3toGQqth8cXXu6GyAWw42B7+4BDrRp2BohzPTFC7MgYgleK6PPPDIcW3cmP5kV4+tIbZy4NcQ2Nc4Y74M19peHg4bh9+3ZM+x2+QJtYR4T+z9tKdB0XPB48eKBNXaenp1evXr1586by1A4elONFozBORB2pwZkMVvtWSxNUSRsnrkleUaOu1lWZLdiZ2VJyIDJdygUzxWrdHGDcBlxrmY7c2LBrIq8L9NA2vEUe4+VLacWWnRABlhsJvlbvNZbmGwbl2eXJwTKcRYttcyXQmQnq8qpc8qEsErd10phcQEDNzVT1WrKrvdjChpxVvimRSV1ATJFyRmJfaer5l6Vk930m08irAO18YGQUDzypNj41qcCi2/Czo1YSvxbiMxRCfAZrFnkVdDfLA4M7ZhnzvAdweCOl61k1BCsqMmewKhQuxDWZFyh81n2p47hWxJOxW0UnPjPjMgLE2mOl1Wm4JerGG65+UoA/p9Y/P+QQcbCn6y0Q3X1Rv4gjjhyNK2sdYUwbrmvYzcKEmNtkmvXptQxVuUVjMdlIGg1hR051ymgsHwoQe2EEzF+YekOPqmnz8TrkAFMEnIUVbQubA8r36bXn/LkPjzYmEwWudK4FcgsL5IQvzP70TyW+9RBSld8aJhkFS0GOUQzDkarIx00oQSrakGMiB8ueO2x4X5uz8caW+RiBF6NsXu8GGKthKaP9ZEfTeFLBMuAQceqjWyaaSoeXLI6kHrS0K3Cs+FH4iArGMBmAuSVQaBudG7g6jExP+B2OmXeEhdkdyDBnRg46JyjOec06Lv84PT09OTm5evXqtWvXYvRBXWH1Nwe06xUyFWgTNTRUsAfX4w67PiPw387KEoZhvDvHZlTDZxHFcmd9BsMYd37D7peRSnbF5Tb3qzMKuedUdgTTFUcG6OdXPFtAooIRLJjPZX4+d6e9VLDndJ17rIJlD/6UJMgi4nl1MTrOF4hBX716dXwtVeDv2bNnwaru5s2b77//foAC93EtW8dlG8+ePTs+Pr527doHH3wQfqn2dJp3HSIoJ0A2SzgydW/93KKwnrThvCWdiCHfqaBFdNjtywX0RlEQvfg190nmBm6razKB0Vmy23p9CXQgQiEvYX/UZ2I2Nbvp0k/dgDusIodFS72M/OK7JRHzARYL7OtV057fng2jMW5oGBt228j1t4k1RlS/HsSVWGOkVySG62lICnbb0fRGhTuUcJbT5eBgZEi8FXslgnoxewpFuxGY8WIwETEKri1L2EGo83JGlcc9geiwD6Yzwo6YmxpfRitiB6KlWS6Pkh4wiNdI6ELHTyuibnsWMi/AniDFmkQtSHrhzZgupAp+ncdlNKl78uTJjRs3ev4MKsilzkiUslEKyv17ohWOWrGkIW5oOnBqB4RSD64YYPIiO3Pjs6QItt6nzjgYXRfrjNdc975iCDuqIJQ3nTTbgRHfJB1jYIjXlLLq35qTEworSBIdrhqp8gOn4GhSln4vZNgCrWErmBpmpLCsD8TrWUoiE2LXILzswwwZgvW74qqIFIWKAQPLazoH1HLnExlsGrdKC/G16s23HahkQqamxBPHE5Y/vZkvJTvDTe8MiGpKGsF1Gt842vlPwgt6Osomtj0f18EDK7NDHUCyyKwezO5AX/SZIl6tY8/x/PnzGzdu9ESHHz16dHp62gu7SmWKX7Mo7DofZXqsSXeILbfhsLNJyqoyYVk27OxCavNubRlJ7xos79lXQQlDCKUC8i+b/7YVrMcuYVku57yFd00YiXG92mOo55Cv7sZnMofsRf14l0/f2Lq9E3NzE8bOACCYm/u1s9LI+PN7fpis+p6PT/UNu4LFgesLQYcZbGq729df+mvfC1+HOp7vfve7RKQyFNevX7927VqvYjqIifc6Lsm4detWj0iubsDXr1/XG7p/UFaabUq9ob8PJH7FE+JKGtVg8XJtzZdn5rqxnU5GXldwDm7DA3ccQ1D8rjT1sDOpIccMoLSei3j8+zh8RMElqWMgzCjYdT93Zj4A/dthDXjZEnTfjJKQBm5lRry2rPZiBmhYPCl4TtPY0MYtW5gRoRtAvSgZeHRexfThckaIZELBNTfb8I6Ia7KhVBePgqJjLMcgrg4aLtHSlqMrgIkLxVO/sSxJbkENK1m2U+LAZk56NG6WsfLMEghoj4jc+1oB4ql87PINjWofffRRCHiq/Xz9+vWwSf7+++8fHx9/9NFHup0eDARVyH/nhw+Id70SbQAmL2YXetV7JRY8BjoTSUy+c1wxRvxiM1IhJBdi8WuZNEfbiYKVh4wFJl50LDv2y4fqTHXXYlKr2+GeTk9/KlkC1TtNQkdmpIpWdDjZWKrljaLDwwMrp8zckmvoeCzzEtKz3rhHH9M+1kEwnu5aDb1Xc6Bhb/OCZByoqE9RL4ZY6hR5LXUH2dEE+X1HSIhkw67kJuX1d9wED0a1ClRwdtRKfniZUbAoU48RY/RxmJy4KYNgv451vPxx7dq1q1evBlERIjo5Obl7965a9OpvDmLXG+9m7QzxDPeoDlH/oGSnVNkL68rPLZsAzadUWEac6hpO47m6xXhJoMBOToJmL3M3uYDJGBefiG5UT/rW5LKLnhuP8/Ww7x1psjOe7XyQMg2fTiompnHbljuL6ivIJpMKgrsLotDCMGyeD2VZwuOJGbIkNawcime009e/8D/9T8PXoa6Rrs8ff/zxp59++vTpU/0vEd25c2cFfz974+bNm6enpw8fPtQfT09PVfQpBNyDBOX58Q7RitdbYytYJdw4MrqC9TrqwvfwoqXh8Sq8BKr+WMkuokPe3kMKrjndBJ9bzCcqOD0RX+Dz8Op5C7XaLKGzkO/O4UtWB2guZEgWHljMEm1wzGTf5/jOpYpLFBSK8V48hbK5A4IelV2t+WE0ByLYQay/ZTIfBVNs25I6o3IjSdYv57CFlVR6AzpQrgoS8AsUL1CcefwkR7ybqj77t5tTr8+gN7325mZBaEvpqZgLf2UCMgYsv0I4wNdKk5ooTy7hMV29evXjjz++c+fOW2+9de3atdD6+vHHH8evUZ3+eHP1+vXrH3744aLP0gS6or6Ki0Nf+tavlRiZq8NfqnSpPgYluwpFOaopHm2LcQ1rSAqWHiU5IFcCQ3vryWrDIMBxs16MAlOkr9Q72BgQ5451GPv1JbZ8jZZp2IosgbtP+qxnFeCKTEHimG135QPa3TzbSHOIYbEsllB7s7sKpneCEe6w7HrWsA7G7iHaAFBNKvRBAq7IGh5zF+RZyccyrHUH7t5SGXsB1WTjfXIBOzI77JLPObc4/HOApYCSxZERcMlGgYmaDbxSSi/ftSzoZ3LisxOpGJlrwL0LZbIZAuOSedmv43Uejx8/vnHjxjvvvBNU/odWvIe16619kw0W6u7FpI8KtjyQrjpfVDM5E5Wj7p3adlfQTkZzhxYgPtcRBIgdMWBKcgHgnsmkniP0HEvf5tonMeUoqIoludxPVadMhv20yCtvnz5U3b9c5Nko+e123bEuujsQe6pMzEmAw0yOrSMXTmy+mB2OkXHvD//j4fv7/9f/6iDvqXBwPK5fv/7BBx88fPjwo48+evDgwRrIPkvjwYMHulP7ySefHB8fq9bivXv3YnHhwwblnZCrhj0qPqGVvitdW6l5C9NO6juwwlPpuTkM4/Z7byLCKklMaIminKBnLD1HRoboE1QmeIA589TnzSTVHnaoCGy+vEJpnCWxzFux0a0ca5IBcSVG9SXIi+Q2v09I06oxmsvBxIbagKSVlxbvynYXR0RmE0HA6nsWH5wlGuiCcmbXIZcOcBNPSWoYZjIMQayoaw1QsNRkarJD+1zdTuga22BnUFKIX1Ahg4+YE+P0jk8mVDwqIFmLNUYaGebBxYoRM869G0jYaMbedB6AHYzSsddx2cYlNalTi8CvfvWr6sb7/vvv37x5sxft1Mzho48+Uouk9957bwd9aMsoyRmCAwtF6hADyIwHyf3gCRnTv9M1ooYBZSWJ9cFTsoZyHg0xiFVRriGi8hzyaII2K1mGiKFmO3fZstX1l4d6XzKD0Q/sQuxgjD/rBh3uUlMBzupVNZdCLwKBqCZTUoPJStTR36hiReuUevVYQsEO3s7ucKbbB6hAAhAQ0OFhVHDEthWSh27qzhcJWlqVjR9vye4MNuhNTzxfLSmAazJFFxNhohps2FgSIa7ngjNY8NvuVA98va6dgnLK2Es3sr/m/U9o6X6cdXodShibUZfblUG8jksy1HXw0aNHX/va19QqfWg8eBC7Xhc51O3p0FjB1LDF3rrqSxeTvUNH8J7dEQTUNdOlW47aqsASXOZlDkaILcl4gcp0eF9T3R1UoQAX6fzo/q6GbBC5JTNq/G76SYJ6VF9iAiBOuzJwrxEksGhinpR65RlCBSNkykh9m85n6mLvvcekcQXlvSsio9dZn9yTCE9RlVrryPlyGYpAEdFLV0U5D4A4Od57772HDx8qufg8XMvW8bJGCLhf+9rXTk9PtRbuWRQeJChPLyzIZbBcibGMggRkcpzTQB9mr4u68wIVaCUlO4mwX0uoPSaoC4tfrvfa9+3qBqQxNa3Qh/0KJdd6tFuxoMMp0O6ZfeQbXAp2lgMnrH1ZaRy3nanYGLcVG5uwDZHKeJOAvABxDRPc/Cir1NdnYZuur5qJvBP9ZxmQ2yFz26Ss6pRA7SWtYXytF+8Q12RDtqCMaSYu2cUXAa2USnOiBQvtapm7T79pkvrATTLZ6EuoNmMtxpHhFMAlxKZjO8dJ+CvMnJKliiggig5vYYlJ1FKr0TFnrDSpSzmKS3tksaBEbiiPeM8PMoSSHLPdzmw4yQI9SROqtuRQ1Xn9bwYjZi8Xy7qMKo+YvfQFyDg0dERHLeSaqh7RW6lHGnbi4mrQ5gnLTZuJg4kUNvp6Gj7kAHEXElih55q4DDVYdrOIc8ti7SN9kIIN51XBusgH71DgL6swyLy8ooYpsou+guMz2jwHkgvx7y3F9gizcEU3Q2kxf9+zl8WyMOyclKtkF2OjnDnrWvngZGoy+0SJXIrWu1PBnliicMstpOJqFJnTaUpiyyLev7jLZGCXYTjlkyDGihCv49KMq1evzunC2dOu15GxJAdhIPqoakZwvR0K0ZTX5csfARcu2FmCg6m9AUD8mrCPZQkbco54ywkIVY1BZlBBsQ/+rpexp6QhvjAQsLsooTOtVdzAhnQ6BZmDICDxS2sQdxzXMM6LHYFow65eEqNn1oElCZoSV/bcfWkVyWAwj/6sro+znYKmXSINwbI0W0pTb6x7Hvrfz+T6HPope/Cfagsoh+aAVqLruAxDRSRik7rzCMqTD+sWxRABrERXMzYkScx3CCBGrlaMwarrYAzLPCkktiS50sqQlKZh0myM49Q6jxS8NSwZJFZK9WeoXRoFiWFsYb3pXh8mMz68MhuAN6Y+k5eMuoxzaM1AYpiSqrUkRwYAbwdqSLphUKauuSKtlmW8VI+w6bTsIXEPHyYQbT1hedHVsNk6N9EhqtZ2loVBYPaCy96xjqgHGWhiAE8Q7F7eRdkvDpLWNmfBWsY2fVqhQVzTS8cmuRfkxCBqDR85PkRYARGkaecmIbOFVStLF5RO1Z5uxYcv5TDrJYgfHCHjwEN9CWaZxPhADIIqnOoXvEdqqqZtWTPaRorouer1AihCqnKN0kg4cTAfy6XU5Bv0gAX7VY5M1UZEGEZhnG7KaqRU2fWYPqxbaoods18WnVjX7BG1ys5JFz49w2QokEb/zmPlZHt7huFfx6u7HXCICnY7Wkl2yxIbkptBsGwUEus9bOLiE1ST3OZ6wgDswKkik90Shz1tkDnUg1SwK9nZLmTjXRxN8uz2l1qw3p5uvIBsklSQMsox9VCHUlYxjg27As3W96CloKsVzj3uMA/yUu3LM8t2NcCH+VrHOl7emLcjNReaTDp9tZDZcp8uQ7Nq1Ave3NGAXrJrGkpYRZM7ULuhjoorpqSHd1b+nV3ZtBzhPrgAG9Dh8z8MqrsewiMvy02kIsVpBhJSfZyCUzU5DOax1YzjWTo9Nr5pl2mxK8DIEOq/V31R6g1BGXySPux87i2f3XJTrURVhTYeX/3qV4no3XffpQNZia5jHb1nMNXbTvC9tnFPHqLkVpptOdMtaTsaxAW7IAoXtGunFsYWaNNuDPZvFRbeEBZD/+V4kcXZuj5IJ7aZMxM2XFsWQ80GbRGhBEMpVt3AzgViZrTlEtIA3FzPu8lCiaHdGBzlCbVYWQgHGULSyxfEMpaP6b+N3gtG06Ka0fPgVLnv+pkG8tV9MZzhmwnxT4QpwK1FHGoyL1DUZOqUJn70RHTCZTG7f4gbT/jERT5DsR11t0L/IsCyyiiTZWgaGRBtG4mAcwYco4SAhn/we4iZ/3fDreIWIlK5Pum1WFqO6a/jAiuO13v0Nsu0w9ENHvW8Nx23RQKohqm9Tr9+0bQXJ5LGaDzv4BWRTBInDaGXVUteaCIu0qRptyfDYo0bHlLdwN/NL5XBFJmZAtCEgIdNCtsl9GFFxkNiMdSJnoOs7Wbk3XNmK2aZ13EOBR73qQN4PtOHI2hS2uk6NmHGPXwcjICYsKhEH3ldwa4YoMPk20kmxYakuVYasZa5HFsSVYyZU/EukncoGvVhLw+NbJdWxEqGjVJGdJM8zZjVKM/NDpAshl1xkK8VI17HSxxqbz2eGi4QNwBXmSU0AMRIJ0BS7NGJXhyIB72sKosK4DLfrmhZRvy+wmrv6NzpljxrPvAlwfVylsKG846C3dnF81QGl+4ZT2K+zIcEhcdv4jmxdJOT2TSOSRNbv3Og4YIdLe3ZAbOz+38d5PqolejJyUlwLSOihw8fPnr06Pj4WAmkB3EtW8drNZjgM+dsNBlKLMYrmBpdCpGQqcUKsZOWzNTbT1J0GF4ropEMjt5Wpc8lj/cFiR5msiQb4zamZoIllCaBvjFjY1yuhhgybHo8ydheL16X9IOUmGJHjUnj5780CcjPmga8C4TTjrQFqIKds+AKTDWKGyZJInmuTOekmLBZbuTe/fTpepzb4+yPkmdlXHrpypRPXexAG3DMjHgUGW62HzbsNlwPHQgCXpTUf0CmWjU8q/piP705kW+wo0YLYrxuDVdb0WG9IENbqYzRFNUD1Kjh/nu7RhANnd45Sk05Mz+xpPId4CnmMEF57d+dKDde65NX1aT4YeYYxpPGzYxGqgJfg6mQQocPUvuIMr5epwCyJrI2nrCtCSw33nTRMTgwUuoEPLAynxSa2HYz7PmrWMHiY3yvZ6hdN8fdNue4dQVjd6CzsqAbFXq/t6OdiXPqnPlknB0bVIni26dtF0Jcke1dMZ77SZ1JOy6UHLjDO1jVJT+5YLfoEjl0Job4O6KbnEvxFzuD7D855RQ9qds0QqMdFSRM0HqVZ+gmDUjE/cd8uaoUH8S8dY2L63jpQ7tVDkIfwCiJuCktKKH5m2PBLFptLsPD1CMOTwc+ulxt+Jw6I75M6xSmSrnh6eDAl+gc8d9XeyWZhw6HOL4DpkFi9v060Hj8+PHx8fHdu3eZ+caNG8x89+7dq1evPn36NNi0qInZo0eP3nzzTX0ZEV2ka9k6XrlhWTaz2RUKAQOq9M0VitpriTbeU1GxmfTRQgNgJUAagaGmWTYiXVIHoe6hsZbEkmzYNRjxgKHJkSEKZQrG3jnGZbuypnIvT0LDnA8VQ8gv1Auhahbq7Xmni3dDUpLjAXp4jnF5lFqjHcZ68MhGyrlOrZywLRUejctCHPBKG208pHNCM25zAG44tihYlHldkFsU13duHWbCxtRDK2PpcofH39xGXghdShN6z77Nbn53TCZrsRIEmcPMbBykYnwiW/lqk9YZiqqhD+9wZQ4UkcWsFvHjo3htz1xVZgoaM4rRIsqSgFlYrH8+w34jPH9WdHkfTHdVpw2RpmQ3uRorLkweHdb1VB9I9ZoTsOGGPmxZ6laJv30GTaA6zs6wt7OtRRLrLLuK7GAPqu08EuIttfICsRWM0oTnYFYKwesti13vupBfNLlZcotU2NCuYTbs5i9TBUuSkBsboO05PHSILdmiv90KT9Ye09NA5hbzxBFCMjsZFdly4C+XS30mzg5UU+daaUTvuhC0ccvR4tZjS8KMAP03TIe+ZJXutSTOxKuCcA2z6f6RUhHV1pYPIR6JFHlhHev47EI5HJM1DukvB67J5NJcVWM4J7ixPLRF3g7DDPaDF9wUOi+5ADTFA/fW/JmABZPdDX0PPkg1dmFuVgkdpFZfQi81AlaSyV7sXCXNXaLGxQ812ZsP2du9jQ21X6eewWJZtNtRsHtV9keThN9r1659+9vfDq5lN2/efPfdd2/fvh2DvxfjWraOz0wt3FCjUsbLSp/sr+qR/1gNK6oiCi1RR5J/Q16sF8QAGTWpmcDxmlWXaYL9b/1rLKPuvrg1WyN3RgUDU5yk9hwdrIBt4/6T1n8o2W3Bquh4oGA6/T6GsCEx3BdiduCK0m6r6tRSzetYnXEa0Io4vhQCAxaBoUZrmKdwj5FP92a87ZYrkydBh+uzhd20WwIdY9WS6i0VuSs5Wq5CjSh6z0LkwYiajMH4rq3OIt4hhjOTTfnSxXRAEOu5T84TnnpByMkLdo5Z1SC19I57BUCGON3t3XHH5f4s0rKaCToznd9bqqVYV+BLO9Z705njcUQRDyoZhgGM8nSJIEXWcgrDSsPq8jEHI44ts8T71IUY3L4MLDCGRQFiL1/Q/i0PykVky3VjGALeBx32Hxv6VtoFEa19nIG/uKoTFy4FiCoyM0mNw0MU4n/j9/+Lf/2nf+b//TP/DUMo4AIjrEehirv7k93NhUeK67Q9HUqWgkVSGUCNETGdtE8d8jr9uX4fjmSIw4U1aaGDgUITbJgSqh8yLPaSssVMtB14QGX0pSbowxSh/L3z7UXiWBEpeRHGS1NLZAgVrJDhwXlpoPL3keetDTSwXEjM2aW796v60jpeq+HIEJqOk92AJx84Eo9eBSu5XN/vBKOpneoDnlS5ZItxfOzvs7rDcTgY5TTNXI7+2J/4V377N/7233j7S3NOx+8Km5Ed60l9ieUnhZIFU90zuc8atnzF+hIxWVtgajIAS9e4gokKgqHDE36VzVTj3Jv/ekFZs0079yBpSMzXd5h/AGbemS4VuyhYXhWEOOcXejlcy9bx2a2E+9k4cjUvPI+YGnCQY2wIXfVhgARWWIgblnFcfAnmqgzx4tNpVQtsBIJrCVZM7Ry3h4qseJAlMMMCNYdKl8rZUrM7V92KmxvG//3nfvcvvP2l//hnflsNi/yVTCrjJYu+glxNJsF660dGZHy5eSsWxBGi2ogFVbCWAZJ8qtMepPHXk4k2JMloLjCUKTztjH2F3LUtWLo1XqNkHUzcejT5BCaSmq2q81Cw22H3WtlUneeLDJOD9xze4fEpuvRh37mFWDdZ5m17VLADBAAeG+s3FghxJYUj1ib4tRK+hGM1qes/OI0OL0yd6VljltRcTmvQ8OD58VUxL32MyWuBo7tFNllOKDSZ1JcIlnrh4R/hYoyWWzCc2ynrXxa9CFXXqW8cRBupmV30r0JjlujaZDHkStd+7dv4VbLK2LsV3LETHFxMi7HrRj1RZngRkj5AQGbkRDiWhh+VkgRGVKc74pWT6sOcPK1dW6t5Bi5gvfmv3VXlc0RrwpH1olGszekYawhrtqy1x60kUfqw6Qp59PZpEtdrAB6vYg/reK1GI/HfVSSsYYdCE3aUk1uONq+lojCihhWqusJthsTSZenc974CO+dz2O1cLOOcMvRZAsSjAUi3E/Cy78v4vwoxqCtSOVu6ZNjgMnLlOOPcqLceSw576qYsyDMHh5d4CqvmST/wqAc9Ri7vBrGOdaxjfLkufTf6ht244GxPhrjn1akyxL20VzvzHFpSY0FOCYwxkohlC3AqapDrhn4Q0YbcoLS0Ncb4SZHIshmakJMKEEdiswWJN81DTkpi5NTg166LXL5q6RePJbmFrV0J0HlYkwY4Ylw/KqdBbA7RqoUFzwK6ja0oWZh17xMh+tQwWXA2BZ7rWcwU8BweVK5kliUuDm2TLkmREpbp6FP3BMRT11Np6cMHhD1QHq6PgFUPqhLrVJp1X3riOs5rrAziTBGbx0mtdk90HyIfBdnBxMsHvMpE76kbkigHcauRm/AsZiHV3sVip1FDQmRzWGFvXXNdIsxQMSPXOOmbL6BYGHMLgVGnHckkzxdgPbtU/w7XsOwvQrsagnWR/U3f+Xs/+Xee18T/1Y/+yHd+7IfjI7eRCKwlMWyH3GEHK4ypbtC27ClYdtj603O3U9ZoAnZRo7RORZDrLrid0KINYjWMIYVEO6wfgEsz4d4bZIh3KftBAjO0pNM5r7dbQJ2T8j8K2JE1EZtv6Ni2m8rEOBgB6GRlEFUwjqat5Jlow8KEI3Y1eEu2xyDeNc4t60cD6GCqSWsBvY4Ljq0eCHMwNhL/1eU9xpW0r/BiBMLMoE1y0ZhXBF7QMN6mzHRrG/3xUKLDX/zWL3/xW7/siL71Ez/+az/4uYOgEmNXeCHBPPI2PMz58pRgV68TRXOhEcBdO4pCS2xNB0AzDTek6fgwLGMydOLQ9oCWJbNXijrTD6vb5wXvvqR0kyhTw/B0UreOdawDw5XEANa3A/pEN9NXDqP7skJsycX8QRBLiuai/NaQPTcrYbReatUcl3s+H5g+l5IcmCoUlrEhRz7NYF+V9Hy9QCRk1fdlk9J7Detno63Mutp7wQqWgp2+rFR+K+ciGjZcb1Em8YSYT+rIFBijOiXHj37nH7z1rf/8+yj+ix/90V/+0c8v+lshgyjANfbahJJcTcxT9ZEh2J2K4pEIXlKDM+TEDGNm86JVfrfjZMKGZUtkwIbFsjgYPfGKLCGtsu11LG0IUsU5k8oXPfKWRP0Vx/MxSZ5ad1UINLjhPWHfW0DUyEuq/6TzG+pC/NIZAOtIjhUg7j3P6SdkztwFyMHUKOA141WFTb1HrSefqvzuuCZNkCF2YgQm7KyGWAVoLw+cl0aaQpy4H/ZSL3JIdPrHZC4eXUB73SseI2+Pryf8X8EEMRq/xNjcranJHJEA5MgYxRbZEImAf+9f/Nof+bf+HSL6N37/v/hv/oHfB2YtjQzLkH+6WyXEkTZIyU5ojNW6w0oHkGMuEpGba5iQOnXUh/O9P4q2n9+Twr74ZIFKPhXd1Kpg0cslfvuxJhOobSCuyOqPOhXD1RSvu32OKBVZVUHToFVzmHKwLLEKs7/A8HADSpJIBosMw5IQhmDB2MRQcrTiX2gUY2afsRipD7Nor9rH63iJwxEb4hAvNC4UC6HA3Oqk0dbNZhEq+1ITVktAKicegcP2fBB3UAzQndEAww0FeQru0KItScGd5sTJkxppKvyf/al/+8vf+EUi+mN/4o9/fYbQxOHmjJlHk0F5UDM3wxSAj6HWc9QIMmu6OZgtig3X5w1fciPgaCePZ+b0U2WzySdU8YXcy5T9UHCfNxcDIrqfMUd9uB4wOcIMERjDTmDQNBrverVBkLXVch2f+fK38wy3xJrUWoouCtYoijIj/0qJOhLg6caxp3lBLn544x02ow2FKV5xQSLRBptlIeKaAHDPvmVQ6HfIzo2M8mAxG29+1+pYoWFmMTTeCoMthu+AGrBMrnN+LAuXq//On/+P/uU//eeI6P/2B2/9m3/gf7BP+lR6P0DLs1IoFRRykXCHlva5C6FwvxArKp2Mg+o6WJKzJHUihPX/pCtDPHawLl1gzgtqMMwI2+1CbH2uyKnY5BpRhfYqauZWsDN7PKi8z6Md/blhxOiwojG77RYPc0X1warIRnRJ9rZADQMyODE68Hw9A4DhDB1kQ2KFpUfHChDPAncMA9TnYgD9IqEmG/uioJG1pS3sxgfaCrbM2nd0NOxCQAW4t+sFYoE1DAdrl8spCowMzlXQp0CyR/rm9PibsLfae5K7UFSMauqlCOq9yOxRN2RqDw1XZK9QaxHj+k6vRgiWUOwqTbD/sCwONoiyR2kKyxDQb2+oEU7sk/euaAPEZ4SfRks7N14lxrdpvMU7GBDnYmkA00NKxJmTcmAmu4nm8HT1n1rXDQmTgceaJd8RE2WEPJztdcKeqGlpD98o5VB3j0HLwB1o6sMijbURj+uipBKVQwG7K0C8jpc2dN2O6YQVrD1EC6H60dESrYZAImbChuuarFzg9smG3aI1xHDj0g4q9DjVbveAh1SybHc1iFucjcxmsFZ4OTgdOoVrJEDc9Ls0WvaqvxnaY3NrrgpYdUnEzRMR/+YSqg/VMGYeLTfn28O+rTuJ2DJDu3o35Iip1vTJ79zMX1gaspKvPEHM7OzOHCUwnKV1rOOzOJT7siEF1zpyauOVsobXriaSroQI0vMSySH23Ntizx6FhomVuLHQkprBBIA1JlYoQCjJbalbzHKI9VSSfD+xwC5bcS2LbYFUYeq3MoQfSnLqzfWq9NHbSP1gh301NKLADcohA4ta4zFWTVqSDFZuPM+1Eaovf1FTH/VwMNtuPhm/XicD8jVVuVP6FEjEw3yBG5jFjEzaBU8ouSgxaGh2sXJaLmcBUcEAoRruTNCQQyCWZIuCJp59GjoBoX/M3DRygbYtB6szGRQdbjAuWoLWgCGW5AAZ7yptMVUZrWPOikkypcjDSVuw8P0WdrJeBaiGCeIS+9SoSxf1oAtDRDKvo793OroBxOz1yDPStwqg160Wsxk/4KBKAWLVjuROHLqMj3fBwgw9cjUDpWbfjMZLHRnsBOQCJ08LN/dLu5EinAdMnKHtUlARUn19zuz6MlESqhBk8ZrFogxEzP1tfUvQ0n1DddKZMPnAYkonMmyKF9Ru6mgzL0/t8cx5JIHDNUKvYx2v1PBmoYknh9s9KsxBjd2BoEOT4bNcsqSt2f5U570RtqYlhFbNSzv2THVmzrSdXd1ifQkmdHSu/NsCzQa2RO09yVMKcsPD46noMsrmykIRpMNM78gPcDOPoBCOVjr2EiYmAO7FI17HOj6r5S33y9vJmKvlgINFBwJuyEDRkp7h/YBjvNgwmBeJCGHIOClYCv8+KUl9hL+1XRuh4A4yLgok6Ogpm0h1EBHrtveJTFSM1QvnXtpPjrrfN7z71iRSAg45pREaMFhTN2tYUiHnLqP2QkOZ+3C7cxvMzBN9YOqtNwRkh3vbSmlvNalxAOkEjtTY9Bc1TA1Tw1YZuCCOobqNYVni1EXFoMNltF44W3/JU/gCBtMFxMMqeOhVq6jIFlbvlGBFIC95rfG6Dl3Xhyu6BjnETqekqupiPS5mVIyo687JU/KyXYwYw88V9WFXRi06xFtkoaWefkKzNafSCqZx4WREjZBdSwEfJKLaRlc009KcQW08DjRq3jY4L+IVh4kMQUX4osVCfSqbM4pX1S2sD9DTbuM8iAfaRIzOrTpAMcMpuUYhzjv5JjMYqEAHsm4zcVjCyERF9J7hNgLLnd8RkqHMXB3TzeDKa1GZ4S4/iAgFu5g+3A8M0WqTuZJ9AeLkAY68oiDpBSTOi1hRpjOIB7eVB5Qo79zMg3baceMFNoNTXvHhdby2o864njKrSgA8bX9aRX3P50jx1oLkUAXYBQBR3PQxZI3pLMsVri3L6zzHmKgiu0VRw7rlMvG6IdpWkiS+zrFCzE0mxnPyAk8f5pDA9FpYLuGQZhcnqUhmzgk77npIYkNzMeI673bIeV7zOtaxjrkLQkTZifEdAddkHZltw4mZjI+Mgy57mF5SMPbvowhu0x2fP1jLwtzpW+2hbHmOKuaflCx3IUofbdwH013Gu+RxLPLSRtOX2ahMIJNoTfroRl04mLw2cXhyjU9a+l1HLh1GM8MNO91cLFg2UwlVb8NeyOTU/MrRpt45E74nqB0fcw9DN5Q9+ZwScQZCSN6uEc1U9LZztPnArejwqzBe6zuEhCEjg8iBRG3TuhO/bAR54f8b9a0wFdxwnUasNnXDJw6fQW64p7HAnTXXEBjp57e7CjAKFv3yNXYAFFUluVWnzYkM6gadvkkAx9lvh2pVoMfs968UNNeFgFVi1VKr2UeszNkG/ttwPZQUGJ6+bfr6MVnfdpxz81wkIZ6/m+fJvNyuxRmt2KTgb8FO1Tn0K1UrNvFmVnGI8CdBuosd2cwKy0gt5RxpAJnB/oRuM7Kfushra4K4QsFMc23XUyV3nCKIpylV0Q5KbnIC2og6N60cchMMCSvVndlk5D7CrgNHd7/zzJLRY463aimPRxuGZWq3Zy83KLCOdVzYcODLQOpTeog5EISEfqE1wKp2RaKZVdmmKfPKJfzK8bK/Gxxxqcz3htF5h3PewroDrbgO5qzFQbhr2qrIQFoLiAfZYO9t0bJvsNM07vxhsIXIc7WmnwvOpFX1rnqFk1OxIhv3WtmuoPYksrCOdaxjdqjiOa8JMJwWpD0KoRNbwwpY3XHmdISgIZpMtPBFyyjGH3N4+ov+1LNFiXuD2H90DEHGEslTl4tzwJmk1k9qvM2bsqyMil+NuTmxPklhmuLxtZmr92RZpHJ5nX/q5BtNMW6WaDY2KhOZqTWYchgQ3Tx5J6MWHP1LWqAvlV1lBRmAhvjMg7q4OZfoevYu18gVUM2W+GHxVX9rUsVzL+YCFMsRb1E4X2gm6WuxR0UuN7DUd7aQ9gFSCWlO9v/FRL0Zvc68IsWXdrzuN6YnigSoqZoJsbAXCMtuc0q/6mNn2ZXsLDsmylWbW1iHVsKpaiTYkzs4PCJkQ+1WW+MmZ0hM0y7Uk4prnlNvIMuxdbVkPM0sJ7w54Fs5ggrweDbQaFQtrE2YUbBTIL6YYpDNLursonombn+mjKmXT18SXKG0twOaWitxb2bUPPCmn0GKZOcyqfeagsVyg3U2xguH64oaZCedvVMH42Cl2wVcwyQDP+erypnQTsFusp2NU90xYYfDgc9QVJQ102NKzHjT7fHZcb0CDYRGdv5axzpe/qgXkjrtVDgAEhUUaIJ6A+IaXMPUZA/CIt6wy7asMjZT5BEmxNl5a8JDHbnhYmBPN8Ta5kS9IZW7nLFOzi9a9kIMB5uF9VS/UY1EX2rBruR6aVDLzRyOS2gmYg86+I1A4mbDPnyiw4R4V43YbWmZ7gbSxXbbQ2p3klm0LOXFkdCbyvMFbNwOPF+leh3rWMeyBzy1kVX7WgnE2g/eJucYIGhgiSxM5iywzB567H52MegVSNJIky3wvWq9a4PZd1BXogazb3ZlSvrRhShsFCyLLpV6jYZ1SXsXpKPUx/6j+6UWtaAwkhQof6Bp7Gz+ejjnRWZMeIeJuGBXsphk5+gO0Xxw8MNb7CUEmUY0AHks00imBwVDAfqCa4oIvMEilVNvonygHfIZTgDfYJKU0hGSEwDRRZufn4BM3fBzQdRRvupMbMb4xEkJvwTyWYOSbdHYdfQ2FUqWWDd5PG9Zg/ulHa+1Sd1gcQmypKyrmPG0WWUu9h7dsAUabDTYr/v635GsWmAq3644uqixwDADA4lGtZPWgGbZ9TYhLaNgN1j1FN4yRMJkiKyDA/M0E6S7nm8jFz5AV5E4csBwa+inTiMls0OaUzMSmiyLa3Rvo44FkGMT9jPduSwubccKMyyJa/WnmvtvSBzx6Bmko2NNdkPLfAU7glkLdAnyCHJGLUPnVdji3r/InykuKbO1QXKYiyMjZBzN0ro3GXKfdGXRSnY20o0B0RlsQI15NOUqqHn6JpVAli1ZsLWUB1r91qi8jlcjUFtGgPyOpqBVNMpF/ZVjS8XnaIup9bm6HHQGTbKjJasxzl70JjVMPS/adiGDfbnDhmimt9gcAeIqWnVnrmwVbAAI4KnWO6+TNdk56KptKn9RTU/FZDfsvk+lpo8H9CkatAdBTdi4X3s3nGLz8rR3HfZVMc7tFmuf3/mXCSxYTerW8dkcww1XNQYXMpvG69XGigMxWIaE+j8bIuPdnhVgVYaTYYBknC1oGW7gBj9zJYS3ha8GXuu6+HOqj9NEpX2qgoJhAhJGat7mmkp2auEzx2C75LpC0Rpic1ztutrLSzoyxX76A94NzB1ihpx77OD8yj+Q7lRxp5AbGBo0lHpdzfQ08q3JCcWhrBMSOgKJh4vbHobzuwXxxzGhJlOyQ15XEaAt2ZgO7IjrLgVNt6UdGZdi9SZ3jrWl2O+X5D+eyaW26huGclspY3KuCnjR9RWxhENsWmOtgsfG6wkQ8whEgqZlxkhrr4lYasCSOLIKDZcshqk0IoMMvEgrsZIjY1MdA+iLnY9l1cywRvQTTUepQANep2wYrJv+zUEVZi3+PLrgIXFsjmEsCTHVsAWLkKmmjCq5QV3NcEHlrnRyDXvEohtcTs4ld9eLv4VloDRcwTJJrFldsDhiv0m4JKEBOWIzaomQu0KYZ602GZ1yrOfQAGVJqEtV2+1Bm2kNtERXa+zUazJDYXF9RqA3iyFo0yYMYAU0e6cCMBM2XPsnpCHr12TmXBTDMOSISJjrw01RXEhJvI51XKpoXXJNLbiGTGDlnBubsoMJVLOx9PJ1SO1y5xLVst/uDVRp3jIO2JXG7dk7YliKpsl0Rh17Pog8ImiyPESdfJmeCPTwd93ORObx0Pay/T932BIuYMPj+SHHShrY5T4mMmHlcFSDnjDMO+xlBwB28lozadbxug1tXd1SB2kCUYXCdQUSh4u89k8odswNW6gpDGMZIztDWLyGMVNt+HXjd9fQd3Shq1DEbx38DOIltOS6JiPMycVBQa7J2KRXIzBLkK7a2kWqZFRoS8i6+UM9cnIeUhMyGBWhcjCGYPNxbdLQxRKcmpJFruPFEh2JXNitYRapvY9I2DpigpVGzsifO5kKhUDVru2ccqgkt53anUUqORHigkW3TA4QuDNK173orDBRSaL/HX9OB4BJrO3LgT6caxPP6kswXKKWBk9ct2YW0UAzZCwJJCNEZjaKAmKHw9iFrDSpqZTvNQx+E3ouE13YparRG11JF8/RrdjkmwfJ066PXPuEDVmfQ5jPcEcR1QyIM/DRxbWRaeZqOfGMoVENCs6trjDLahImKozjGcHjglOlrdic/d249S2nV0OuU3X+zMmEeUrKI+ZsObuG+PUbI0y0SSEFeNkL1kS+SEO2Eau6aGncptM3jdwlUglv/X7DLhIEpzPYYNY3s6gefRBAq6/6Ol6XbGMuUgNoRt5SHjbsjrg+4jr3FI1SeHTvh6rRciKGouZL1ow82EnxB94DrzQEMy8vznWhWhZ7gZrPvB82F19MWU5ErS438RON6PAuV7U0Lp5R9gBm6W3BmbvOheljOkt9/+xy3SqhBHvLdQWpciuMUWkR48waZNexjoWrU91/yhqYTDKqO7GfdmNFk4+ilmGmXMnjtYWJhk3rrCZg3RK6aFrjO8Wv8dhcSY4amTtYbrzcObWSzNxUC8LxPYdMDFQKIwxB+4zH0FiM8mbEdzkPl8GYETYSFQyjZCkbO6WG4DZTYHc8gogXz9wZVK3Rahc4YiGjolKqfIIGUlzg12cbadBxGWKTioa7pxBzCu05jyEGhzp4UwTi8HBySh7UnRSe4hkM266uSzOddj7fdVyyku11j4LcnegcnsAo2iUnOjamNozMk5JfMfxLh6reXtXXVGKb5WmUe8iRSh1njhPdhzx2VBuBpuI4MQLRctvlxy+kYOZygPDS1AUaYq+GseFaZRw2TY/sy8/vkZTIyBfbhlCailuVkvSlCAJMDqZutTs69zAoHSNMFUxKgoyTtcfg43EM5UxKpJ+dRVFv1mMSXaJ9x8a7OQWH3CPuPL/zVaGXL7LyGaOwrWMdO4yCZaZT1khxdajqd5xf4yLDzJ1HyQf2eettAI+WWMZdguxOt8d6esq7jWqhhcCh8kOnzkvnczFV3HMHcJe9loVqK8c9MZEYmuqkza351Xx4K7aCcVMqz/Fz6pB48eBmwc6Q3p4kvk2uMLEGVGHchld0eB3rWDDqzK5VBRP71NFAzaZXeKi6rokWf8Mo2C11yyw8jFVEDkDVQBdxSHgqO/bRYKIjqmNtYmaao7Nv5y2hwzVTkJR/pWBTxvlis0bahNxR66+gaYzrw8QcVaejJOJou25/aDi1ku8YNB2Ziuy2a5+ATPumzxWZom/yyAbygd5iYJUnKeB4jzpXRUFne/0hKJ5NxEShvlUV8ilTQK6T9GEsJpJzeJoylxe7Xax1XIIE/jUeYUbWZF+o+k+/o63zdG1MZVhAtOF6KKV/hes3TGXyC9ALKWOpih4+C1AW9fMvNSyFcd1jV2s9WJYrptqwsyybiGYVO8Bi0FO/fDdLYknWRoM4j39yfx3h1NLGWykmIEPe6/4eZmkfXED2DKlcksFEG1NbltKkvXEM4Yqpj4yL37iGialPeuobrjckNKE9smNl5VFsbEx9xVRXTDVhA0X8AuULKWQ5AcoycjRAIqphvydl3d22LdlFqR5msm5zV2nDtWFsTIdJB+KtFNJVLhvc/XUrdB3rePWifIrJwlWmjeP8U64dodKDwKwvJ8tklIeQOFASsVygzA68jkHl1SEPDlJX2EWYWOWPlFOfZUURO5hitr5E4KM5mK3M3SBB6hSU7TW0PRweYY/f5Lr9VXvixetYxzpGg1G/wwMRJTb+pbbz71A3xSAUM4wRNXLvVdA5TErNoof2aA4jzYQoUgZZqgk5XjKlNWpYDMMohBrxN2uYLYokfTj1CdiQGxS26b9BXqBJuqYmGpvmKOQG594kb9Semyf5nFiW/OhUM2iubDQV7BaFflOhGGYIBbkZszehZeRojOk+9EOOUYtUP/RsdDh6GJHJTHzQNEP6sG4eDOekNnqPIyq2ZXL0IXNLjtMJgHpXYDdYQvBq+NCenJw8e/bs9PR05xe8agHidR0CU6GI7MjsFgU1/QvcY0eW7K6Y7ZB1GBa4K6nfxy85k5KIFCOGz4zPUIbPGK4CvTWOmawRIkQwMVlCaZwlBAqJUks2aQyuhWhr2HoJRYuJjoyLMDXW0KituIiq3yNTbUwdI+Hj4okqIDUZQpbe3y2sO2iHKZqmXSaiI64tS9kso0nktwGFVetqmISltt9nBYx4D6MnRRLncBz4xqmlOt6+1g0P7Q2JN0be8PTnidg8Be7PHzWszpOt2DrT2sNMV0z9OVNNYiVV7LycupYg2orVi3nWRYeJiLtOTSD+vs8FlyfJY4/VZY6KT548uXPnzo0bN+7cufPs2bPhC54/f3737t0bN27cunXr0aNHa8W1jss2QGapdO8cfQltQV0amCzJZleFX7U+G4+Sl4csuT+cLYOwr1htff5U4hyiqjyjkSp3pqSG0LnLfBxKNnH3AwA5sBtkd2qE6ykLPN4oIJmNnFkz8ND8/XWs4zM2mMnMM4fuomCQqeUllmgw3VhgGDbiAocld4rMiynaSvvPBaMnKRBXN4agcCF3Ta2lS3pVd5/QgWEJhkV1NlyjfmBrmC3sFnbOPp9KIeshed+8Q6zzNKJE0YqEBNWpnOxsMQD4mNCT9UBDMN/xwGXMlobzhWEiHvcOQ+VQtAmmjjYPCp+kFVMhd8Cfo9laXgtgNO4e1QgqMsJcVlPE2le4SB/DhD7EpL4EDRBt7Qkou6KLQLM45LLTObC4kJHLba7z6NGjt95665133rlx48abb7559+7d3guePXvWe8FnACZ+rb0XkFogvI0bAQwJJqZz8/kjrs+oGJ3reCGFtS51MFlmaFgKDcO0RAwQdwoShYZ7a3xvfXdiDcMaAaiSgk2dKeQQ4YmJ1RKgMxRXTMLxxhBtuOYplYPMbq36pCF5JMk/+ZO//3/013/6Z/6jn/lpQ7A0t5efJwIAD+dGUh+ZU2+1v89PiNlH0dXoOdSpUwFxo60514iGYViucG0JL1AmXUqvzEOHFz1f4yOgw2FsxZIZbvwm3rUiuwgDOpoh+GB5eBH4+yjeGJvY8OCC07I2TAxtBD4Y9nIh49atW0+ePIkD5IMHDz744IPwG4WPQxR88uTJJ5988vTp07XuWsdI3ShTJmkvPSXI6UvEllylcZZkS0U9O6/NqbofaFFAechFpikhQGaoWfzH/sS/8tu/8bc/fftLnC8wVA1DxDDt2KLpov5cARtmJuS8VpJ/jh2vJB2x+97CozZq+MPTsDhT49zLCwF0FWKe8zL22Ot8jB4ptlHvBOc/tMr13qJIvk+RgW4FihK1kIdL+0hPs434HJqm17GO169GZlWciIVrlNUo6ZSbIyypMWQzjIKknifUY0h4J+JETu2XuyiVIWzI1WSYUJCrI486gB2Z2PLdslg20nXrEjJCYBJ1AximCjWM1mIND6V7KgW7Clb/e8Bk4M/+3O/+hbe/9Fd++qerVqhQV1RDo1EgglATC6ZlMHoW8Waf6ZTMrCwjD1ZyTVZ9hiXSPxmPVvCXumQRKiLtCBTselx43Uwt2eVQgUPdpAAXFCwg69BMhvhehG5v71AHZJ5KIqrJxrT0eNsmhmxcN2JyXl9i4viZiMl0BUhTfUJNR3JJstVHnjtXVheHnSfSxQf1hw8f3r179/j4+N69e0T0ta997eHDh8+fP3/8+LG+4OTk5MaNG8fHxx988MEP/dAPDV/wio7X3ZwXAyAQYHjZl4osgQY+kkMB4R781MeIe8IOTAD67QdYTipJ9djMeg8HS0LGZO1umLAxbivtIR2xsyQhwIf2A4BGSDPcqNZaO9BiesNsvy8l+rRNlFz10oUjrr+HjYaELRUjAgWLlo8jU9cZq5PemwjxVqyamQ4vFHcj6MxDWMTd7sw2aDvGAgQREVkYg/c84npL5RbMjKGYxxu7I8X8Yob3t9LBNrwA1t8HQzky9RbFvL1KMNEVU8ehVnnEJUs1sMQ1JEeGate6YFmWkmtHpjqcB3oNq70I+w8ZDc9379598uTJzZs3P/744+Pj4+fPn7/zzjt37969fv36tWvXiOj09PTOnTtE9PTp0+vXr5+ent69e/fRo0cffvjhhx9+uFZW68hVIzKD23jx7WYhfx2hD1ewZqyS8Q8+yQXr/yroVhxa6LxkB+KS06A2M47YbUGxRK8hSH9hxIjuVu5G9zi2/spjJp90vGnppQzn3WWbb5ZP8Plc+B3owzJV+Zezrd6CLsfikKSgNsOhGE1fzcihatf8AbegQFyhpHWs47UcodMUftMuxvhUwQmZukb7SISMYRjCHH9Vy6gTNlxZPiTQHGGZiTJF4Oo2MskoWBgo2QnzuAC8yTTlCLFkKMMOXMMYRg3rMcdcLuSwE0bmwIaMLnTjTUVz1ms7byNtJO0Roro7B5yHyGemXoYk37XTLMI1WRn1UE1mm7oNoL7iJbsKtmSpYW2ULNUwQlxSzr+O62jbYP94EksxFCxxJ7d+So3443g+NCTU07sI++sdfm5y+8WQUJSPqWSEcKJliolslBMi4VPXPmhVyorSMFmW3QFicCXlQXDiOWwDbZM9Pj7+9re/fXx8rMXvO++88+TJk+fPn1+9epWItBZ+/Pjx9evX9a9u3Ljx5MkTLaJf3cV/NanrIEKhc78Wm6zxQHTUaJg2xNtNqnzqKlFwjOmctSoTE+v4+DrIgz8t2G1SfSvhs7zMcbzFNKqLQehVBdyeUSsGL8Qv0IN607twoOjjid8w1cyV3rJsTLb6/U3f+dUvffvb/9Q3f+G//qu/ykRVRj5veEwbricbT16gOJMCpE419KIDaid96+jI1LzEsXDRdFUScY0iqQi2bbpOEBvO1dKRZBpxqCPCG6Z6w2wvTI5KW5a+J+XM0ncfTtCRqefToAJr3hDe6JK4t/mu2IIbPzpFh6lpKq8PNgMuZDx//vzhw4dXr15VdJiIrl69+uDBAyIKnOL79++fnp6+//77GhGPj48fPHhwfHysv1/LqnXsXZQe5vkY3w3qyTJo7958e7qkpMDGpH14enROezhB4cIk0GGZ8qhZWgeG8cVv/fIXv/XLX/763/7BX/veEddHxlkW5cXoGjv/1uSKhDov7deFAl9K0pjGtbViD0cVgwtMtEUhxLyH295M+jAigUKeouLNYeO+WsOyWIbhA84NFhzga13V1/GqVcfcNazjehAcAUY+dedod9AcWkNf5R1ApiZTw0pHzQbFgNfVaZbnBj0MUhjSeKBxDRN+qVRHjd0cQYRJ5VkHUzVO40xeJXlEqaBkx0yWZWlJI2RUL8JFadLnv/MP3vrWf37tG7/4Y9/5+1Ol3sLlj1CQC8zQdBDpCcfjMMiSa6Rp96pGg7dhUKAuOq42FJn+pU2S3EwhlugTc1mQtyhse501c1OnWZ2i9egOKM22w2n64fohHkk4xA5SWdX+zgTZ8Fwv5jUyYe/Ul+VAQXnOlfzoo4+ISMtb/Y1Sia9fv/78+XMiOjk5OTk5uXbtWkCHiej9998nok8++eSVDgGvOYOYM0xeBikLIdngRhuutA78nNlGWz24wvULmsVPdDBnKD/HW12AzrABeKGZdYNOGsLG1CXLplloGgFiTtFFuwsDE42rTEw+6lpgdLjMhlCaukZRct1rj7BMJW+J6IVsJhc77VHdyjRueOsvPvujf/b/QUR/8vf/j//U7/8fJl9Todhhw+qFV7vXMwU4zAjliTNZTutPqIG7qzISvTtFPI4Tjhqmhu0riswNG2k7iI2pD97A4cgIbI8YHmCgHRQGd0t5IsZ0dUZl1InDW8lW7CovvrxGdXbJI3TZhqLA77//foiIRHTz5s2rV6+G3+hrbt++HV5wfHx88+bNR48ePXnyJP79OtbxEkvckRXGEEoSZrzwjMUBBWNiKMd2qDJhSKSrot7TlyhYSq63UrqMzbRp2vR2N7VTHlNJy2jFvS3hZIXwf/mjH+o3v+cv/ClqDNNcRaSJR8lui+K8VzUmKo2rxF6MXAlAwqxXI8dgVVKSNY20X2HEHhQQmRcreZGTnpuqRT3K86oVNqu+xDrWMSdZpbTeSw0TK9iiyxIlIhmoK/ScUYYFnSEQsg9mQTJiSsmpI+z+C/dWgJh0MnQM078wLIV2PKi+BIljU1BdsMRnZ1iocauT3voZfhaviZRfLFGSq8gGYQFVsTjIQvWH//V/55/+qydE9L/8X3/wdz//eYANu+y9IDHEQmbSR4EJBcnIftv8VpXRJpX0MdRkNJxFc49rmElMHRNpm8z5K+x6X6yCIlFq4mAUUWVSdWwqWCoQPGs44EiqpOzIAK4iUzY3kRfViuK9XtX0dQBJYRQTFBDrf+dd1/4+hO1KSPUmmEqQv0Lb0uq+0yMC3759OxS5Wgu/99578Qv09bFI46s4XmsGcUrbJcgmTD+OPWC551+3GbWtQ1dUF150ZiulGpjWM9rSmfvPXkCHLcnneHvUF/NtN0wcbC129LxQeuCY810OSNGUDGHDHWkCR+YMRWAQv2G241fXMDZcq6UP8cRawuczN3oU7yQha1wH3hBtTM0HPiqO9xJAXKFYBGrkGcQ4nL5Ee993E1hQnzpOzfk5YXI72A84MlWKCz89qfa/fYak5Lrs7lpf5vG1r32NiFRKQl1Znz9/fnx8HPQliEj3TrW/JowvfOEL4Z/WsY4LjeYgt/BhtQTVKDSza4FJ0oEuMht2I9GfGRuu/YZc+gXaiGC4tdkZ+cTza/goeJZoMhNiX9zzOJ6ZdI9zGkJcjeoecBdVZ8L4NVhKG3N5HwxWDUfP9xEy1YHkNZRAp1nlJcFb51Cez/WJWMc6PkvDpATBQVxHJs/wfJT+kzioO9BfPdTkrXWrKxpn71Q4zvvUWRJL0yZj40sZp+3EwbO7eWy33yhQhvVruC7FVWTZNBwLd5SRh9Y+O9Jvf+DXv6ff/NoP/ICKKY+Qly2jZKdfk3a7YbMtpkF5ajnP1/rPMos5ycRrA5+QUX0JanASiwwoMMW9TWRT9XKvAssyKaBhqbMR4sN3Gi6I9SvqVkK6ZS7nbiWgZuw8SFeMg6mRRIfT+hKWpCBpJgPDshh1euQ5OEnn6Ep2BTn2uwtEr3b7zMnJiVKjHj58eOPGjRs3bty9ezcucn/pl35pWAuH37zS5fAqMRHrr0f04eg5YhMwpjHMl6cewjMpVV8ivEDAZ17dLFn8ACwz8DUtdAM6HD6dB0eCyOMFXoFlK0XQ09iwu2IqO0/YCETSla1IQqIgrkZjnhCfDZi2uVM4yDiaIk1zRB8eexn3cdWNqbRxaTMqNIGp2dLNbLp3cFbrEGj2ew4P4g1TfS4SmniDKzPlIHwBo2TXy+R4uUMdER1x9YbZWhIQv5BC0tyC17cpVEPa8fHxO++8o66sb7311o0bN05OTvQFuqcaN9To0N8ovryOdcws1Wb2X49LCniyMMdhZQ5PwVLTfDPHt3qoD9A7F132wyarSUXSw2Jtc5iqF6kkoIacnK/JdxsVbL2r79z5p9FStkyylkQ8MpaKqGxTeSB7Ps6GqyOuSuNymaRCvUtvh2XZcF2c277mDsIL9QzKs13pw+tYx7xYPO9JSUiR5iunUAxCW9FblYnlvlj+ie5EUmVZpmqQbGXEiQodJTnDaSVf9ioTaPi2GL5hPVsPl7sgIHlhgeHbgqieIXKlGhfzL6VDX5VeMWKTt6ejqVyrzkvtLT2Y5prQnus215nLUlCzzz3k6CggC7RIsZ8PGElEh8fpqGOfm7ykzIslGYZJaRezUrl/m/xDIZOLsDxAkHQn2EzgBklSMccVuma/BYNbq9j0W9lXgS+lNe/Vq1fVg+fZs2fPnj17+PDhW2+99ejRo7he/kwCxK+1xASIKrKm67KNprOToaKztnlpYZ0hDA3oem8Zv2DD7kXEOgmkzzMprXWphSDhaweQE1tYST2cSO68WZKkk5t3/zQCa9gZlgqWOdHEWrIDciVlB8wF7cvrwSysc2zZ+m9982/qN3/tp3/b7MTI1/NcgWY5kACJNhueWnkVKW5ca8U6sjXM0ULVgg3VJakxWhAZnDrB0VowHOQVrl6gVNUUB1YNYu5MwPb1ID6T8vwKLwezhdXe4VyBvcNU23C9Wf5nhnFkqvg6iLfduzJLY3q36H++48/+hb/7y9/5vn4fvskFxVu3bhFRsG199uzZjRs3Pv3002EgXMc65o+SpWeiFSzIxkGfkl1Ma5oMK6odv6xeHrzJ5DuU7GoyoTbo9tZpDtCpWAxhc2g3uWlYjUx9IFnAOUBzEOEtjdtG2YL2VwK0W84wMAmEYRxE3XXP95kkB3SuXtbRd7F1HTOOeJaRg4rjV5TVdMKF74cq03lR/Ns/21zHOtYRrzmGoMhaTK7s+c71xCWyHpjz8tmYU7zoUIlIDcfUxWtREj7crfRudbmDhKpMWJKSeQRrm6gaB7/RU1DDNFbtQoJliaijDWqZRNCaw2A1hs0mEgJykbWa8nDH8iuacz25iqD5rpdafyLUMEUmWZDuwbCX0tJron9Tg7dkdasvTD+/MZAOlDVaHQYMwl9NdqRNTE3wNlRTo0/tNF/SqT68EbYxWzbdkxpSB7B/AbtzQpKLlap8rc+gySjMtBBTv5W69aZzMEIIVzXeBTGEoplRTESp64CeistLqoK/N/5iNdR59uzZ8fGx+rET0aNHj+7cuXPnzp3r169/tsvhSw0Qa3fz6empyj/HgphhPHny5OTkROUvF90qId6i8DajCFly08I/eJwjDdP6jIqShX2QY6IrXJ+hGNaHudUzU4smXjcSfrmzAroefbj3vbYIxRn2/DqNJ1L2fmTdmFrLQmYcSCb/3BfTiWuf9rhzNRvmiQZl3VeILnV7xbSD+GyKJB7pD7EKtO8AKzaEcWRTudbVbpT4rMiLLCiKZw1Fh2mGrss+n6QeSlsUbsK6SumKnKJ6gxo1mIni1rJsWBzxiI720tOpyZztsWj//J//L//qN/7+zBdrRAyr7t27dx8+fHj//v2PP/54raw+w+P58+cqKnL16tVcAvT8+fMnT55oaL4Al17LomawG64dNrNXPx6Wa0FJdgqH0qA5C482hJ66BYgMQRKSRLQ52PbSSxiYUlqYuo/YcD0CUy4N3CU7wb7kaOZGmF5rb7MHsWW874SJzmByR6t61otOf8ipxwCTAIinuMPaKx3iO5+PSMgQwkg8myBwdnd7Dn348MdJVJGldazj5Y3T09Nnz55pqRsrfR0kKIOoJlt4qAhRf0NPXKKG1U0+WbKAB8XbUPXM5hF3+TBMJU0gffHfll7qN84GVFx1Q04t6cwoUdT71yVe5YiBRluWCeGbYcQMVcOG3Jbshp1yb8Myy4SCXd3xeSMHw6lgpM2+hpwu7Q6cNFoHcU28mY8EsSioN9J3hUgAgbwOSbKCaeRHuNPONbJ084CW68hUZDfkDInqS4DYkQURgWuYwY5ma6hYw5S8b/yCP2whA3BNJvItFD3apfv8nLG1T3w6uKZmzwYL6/1Wshm93xuihofRsPtJNqMeFeOHGjD05JkWzeU6fC4hxBUZ2tXg4c/8+f/ir3zjHyz9q8ePH4eW2du3bz9//vz+/fuPHj368MMPP8Nx55ICxKenp7du3dJG5oBWPHjwIPY+Ojk5uXPnTuh6vnv37r1793a4W7H6QRyOPGM0oTp/xDWIrniZgisdgbZJlnEOgVtIHiEiglGV3vZ2ylHCbBSp7Nw6goXstGyS8oiJ6MhUkoqsG1P3EDSoGAVPXwoVIO6d6UHm1dkUMpitiqUoUnZwHH3F/1oax9m6iCsqwlYbd4DHiWUarTBIu4vLeZy/hjWDnfYNO5M2qcNAtDp7Qfa5C0NYvEZHNnErdmOI06Fr95lwZOr5rkFMYJI3mgsSU/t5C1uwzHtgYQmloWpC73uXJ3CH8b/9I7/tH/5682T9q3/qm7/wrX848uJ79+7Fe3L37t17+PChrsm53plcr806XpWh2wDxbz744IMHDx7Ev/nwww/v378ffrx27drHH3+cLFkPMtQDLSxiZh7vQDJ1yxkK9YbNfZpvn1yAQx1x/X0qexXLhmuJzDD3eeT3KHIYE80ky/Ly5Va66XB52QbrTUSp3+x8jEO5D/T3D3i3YizxekY5rxWpYPHVGtR8OX+LTSVFyc6eG8mdGUQY0oeFTAUyjK2QamVcHtVjt9KW1/HyxqNHj+7evatcNh3Xr19//PhxnJ6dW1DmCBNsKJMjjJgBnwKGhNgYQrwhZEiS6vYKUO6wPHp9SAKhJFHJ10J7ZBslfQoiAzXMht2W7JYsM0ZaOkZIjgImYkdGQA1ATIhPSrH1Mjr+DUu86BXsRoQ7hNiRsaNi9SBysD3tIKFgxsB6nOMbqCpAzD5SuPwW5vAmVLPTpJwAsSGx5OaUNYHVrmedR7HZpajNBbktFdTF4hVTBrGkPP3EM+VBXJMpSKD0293t6+YGErWkKiE1GcOOuirNyE0YMLVOy31YWRqsQAKbXpUlxnPvg6ABUfaT7hQUMC9JuWWPXqL/zR/56agK/oVf+NZ3R14citmeoOL169fv37+vaorvvvuuSk/0XpNTYnyFxiXVIFaxj5s3bz59+vTp06fa5hzDweHHe/fuPX369PHjx9euXbt///4i08AGsuzPdQaxk04TRMGuGIifRqVOs3CpT13qoeIzaSKFyhALguBD07avByPEtZglD167v1o0yhIp4ZvUyhK/fxXJEOfquuS/SGZLzBA2xoHoTMqtlEsbGDmKHzFYLGBlalvjyl1qmMRhbLgaETTYotxKGcSp0b8s2a4qQzjKO9TtHGAwECE6VJXO3CqWfI6r/WEFBdaXTKf+2Iqtu9Oy52KxXSJAHM5ow5WdtykbQfP8wvdKO5ihZPYw6wqN5Nzocr58xaWf/uIP/bNv/7B+/YYfyCqraEjrdWzojzEEnAOI1apuHa9iIfrw4cNr1649fvz46dOnH3/88dWrVx8+fBhDxk+ePLl//354zb1793Sn9sIO8ojrGZpEPEnwz62uO7AUecEvJ5TcBcyHg8YqmNr7nMTHsNO+FG+lOEMxu+so0VTIMyqrnowAuh0zAJ8TarhbtQHiSbu5Dde88KjnsJhzktwjn1SwFEZo4S2YVbDNPT8Eg6bcJXdkXkg5yTEHrUZ06/jsj+fPn2t4/fjjj7XUvX79+rNnz+KYezFBWRv8s1ZjqfXHUJosrByRIUZs8xZ2c8p58m0lJcVOAK00ajkgnShNOLcJNK7RrDxW53tzh9Cq055d9AUcCnIUWdWF1bC37Atohx58CTZ3IEDtVe0IX025w/ASwBe8plrGHC1alYAYQbprTJSVoeIrI1fGRoA4cJO77yALpLdnwSbjiEE6HaUsR1sFl6Oj7fyI3ZMaf8XUs25KeyR8kGWnXPgx+ebu7Qax9iII8YXJTcysgnWoPV3uX/WftBxWq7peLfyqk6UuI0B8enr66NGjq1evaiy8fv36hx9+qCSmTz75RF/z8OHDk5OT27dvf/jhh9evX7958+bjx4+JaH5QRD7MAIxGfl73JLMqBJHXGWIesSLFyY8L3TIB69RegMh5LEhAsHSJh4ZxZOrSOMNSGmcUe/JAJKee8COqOxEUPbSYt2KH4kRMtDHOzNo+yivdUGM1OtXQy9PrLO8l5VPBVgtXH4AZdIZSwEh1bs4ptg3hyCQlApmIDc9l7HYQhBnFW5Md5F9mCFe4tinFks9x9QNcMeFz3LRCv8Fze6KZcWUep0kFp0JDUFYYMXWrr5iKSa7sYZ7DE2dBG1PbrrnznHAbn1TvMRyqjqqD8OWscJV40sN/9cfASdEext6G3Fe/+tXwT+t45cZHH31ERI8fP7558+b169dv37799OnTOOyGCBte8+GHH96+ffvk5KTHO34pQ10Ddkb80DoQ7FwSTFh8jOtLCJkalhnleYoUl+x2U1FAJpSkijHpVb/kzevmwBA9fepY0WgLK/tlrUMAIqRwc7CJXnnnwJNQZsbaJQuqehbzxFnMpA8PTRFyMzC4FmvlyUvoThWsLGESzXmW0Zdt6WQ+Duxee5PtdbwmQVnbZ7XUffr06dWrV1VN4ryDcliKa1g30EBAvr4o2MVIUNAdjgWIc6ZYNkUunoMhhu+Lrl+MV7mFdk8WzZGgIGdJ1LhMYJS02zsRBRaV8twJEEyO+kajknLP4waURByCeZAwNJrI3TNy7f4urOo/gAXz7T2ZRgWIbXRgejvmiRFnb8EkzKd03alZ10DtDg1w7zoyxMNkhCcNbD12mYhBEuHps4GiHUvN3JnHqRGIXcQ099T4/mWs0NCnBLxIINtbRExY6VoW03xhMidkbwBYck/UeNxZmmpc9iA+Uuq+++678QviJg+1sHvVa+HLeG+Cb2D8S/0xMIi1ZH3//ffjF9y8efP09HQJibjPVVlKneAOeb5p0jcz3KIxCGnj+0qREDgUb2ICMxQ5tSSf42qTKhgSEnXEIkZk0oB1bFGI/H/6vNohczYIFy5aa5nxhqmOzFgVVPjo3hvbvg9s50wjWH9ZSYxIEGJjasuu0QEcLOAqsjFWiWXUeYZoKcdWhGimqHrIxi+runX1+GmpKGFKRRhB0CMc28J0AeNl7VFKKXvJgtUc+eSfx33i3AjCYPZzjZDALSVTqx1Q8gAVFL78UUHX1Y8++igOeNrA+N577+mP+o1WLzpUI+/atWvnpzawjguOvL2wqzlQT+5fZ0sMIh84R+H5hAveotjDyYqxq7y7ri1HU/rCPGvx2XfMuQK78YiH8Xe+4eo+H6fNVftvpzHRhusYueAoJM05l0GAblMCH1UxM15UsDMnavLceTonTVV9lCUR6/5EXLIu2YI9sHaIkOn1Bg2o/avswzpex6Dci8vnF5Qrv9ZhAMCpyKy2vAwdy5mx6a4ehlGwaCOdmehqp8IXttRtTs8syKyc2Th2cybeac1Ver2dTfdggKxOrmWUEZwtGZRzSCJG53gabJqj6DM7C6KCRftphMzo3hj//9n71xjLsjQ7DPvW3ufcG1nVo44mZ7qbNM2K6gaHHM50VxQ1hAUP5YoA1UPANJCRhA2IFqmKtEi9bLkyBYuECcGZAcgyHzIyEzb9hJyRHMq0f2WUYMHiCxkJkKJAG8yonhnOcERORVEDUz0cqaPJ7s6495y9l39857HP+9wbNyIjK+9Gojsq4j7OY5/97W9961trVDKWZyu1tCjC8MZAFQxaNx5OBoCFJgrfbGlNxShom4pJaFQF3udgNwVd3+BospnQhvbmWEGdsxxgBS3+TeQAiOmo5RPkU6VA2FucjFC6t9WPDeFZiOkLcOy8pIXQhFAc4WhddZtRpPmD+hLNoI42vPvq7W2veBQCBoXmrXZVbm1tqebt5ubmnTt3zs7OCiGg4+PjR48ebW5u6ntf33EdAWLFF05OTkJ4Qu+NAvZFaKwhEe+9916YzS4BZdVw2+riLhsmfcskGlG6QMZa8WSjim8mudBEYcnV/e5Fs1xG4r+A5AtIKnkO+jbxqbd+VAGnE+gM9wdG/A2TbJjEip+aJAS9nWDOqHXJc4J5IESge4ta2FjtCjTcocy2dVAMGx/Sqv+rTmgY+wRyaio84p77XnKZ2WJyWBUrrp9F4q3PV3j934JEPEVqGxg3Rd4a0c29+JUfuyVq6kssipJUbzX1lN9CYoVTJG+ZpNgoKLQU7u0M/AaS6n2Rlz5+6ePBBzNCpoti4Scm7Z94GEesu8qxtbV1586dk5OT999///79+/fv39/d3T08PNze3i5E3pXPcnx8vLu7e//+/bt37966dUtE1hZ2r+/QeBpK/9dUtDS2apxtxuvBZ99g4b1kTYB4BJIoXjBr05cYE09dr5VKz5giBVYfp5YjUoW9h2zznNE+XHth0RvdafQU3sajpUNQhZ37qJ87PNxYAxp4iEzgWjNzCLHINQkhCSNe42ls/Gil+7HzpRAoC7cN4c/Ni5x1GrHlFqyB1fVYj9c3KJ+dnWm01bh8kaBsuiUUWKoPowsQFKI1fyySo8LOS3fUMVJzgba/Ntg3M21L85bfMB1uCiK3AnZLsER9fuIFIuloxmwwJjl3WFUmzCJlWjSOIaXxAct7VNIejALKVDGBkQGCgmSIrpvHoAx7LVQvupWIO+dhKsaHMlltDnW5vgQCnnufc1rckdh2avv2bjy0llmcV4G5t8KpSmRWzZNiAxZVCeZ6CgpMtyHdLY+CZ02AOJOnSGgTjgR5golRgbBrIjD17UTz+bFtcqyv79ja2nr8+PHZ2dnu7i4AAHfv3t3c3AxV4O/du7ezs3N4ePilL30JwO7urubCPfIUr8W4jiZ1isc/fPhwd3dXjZKOj48PDg7099KBDhe/+eSTT0YgR5J85zf+f3/xKIaz4je++pt/7Fu/L3Nwhhh4gIKMomtAmDqbsm3S04hPK48PAicuihQGL/S1OhvEQAx8104eEAoaQFJ5FAzQN+Q+1JmrjJjQN9Z7QxpNhCiAeKl/a+bK2hZRmFZf7MUYkZmPYqQpI6j0MDMD9xpIVysdt9ZgSczFTpGScOqxAzEg6I20yOcjAB00GY5KB1KNHKa/+VFbpaKsz0gssqut9j5qrMfcz1Sd0+KsPGAi4+Fp4XUvZaoLKwKdB70yL70JsQwnRoO0BVN2Z6H5xwACgR86I18KpNQI8kYbfFgeYfmDNf6tQPJC3c+bBzPzUaG4AKg6iogQoVAkzQXbPz21oopGki+eUMr2XGwyTiJKUXXdrar7nGdUi9/V7R0c7Tnjt5Dk88q0mREus6kNzyUC00XMcJ1gtqJFu387++DBgy9+8YuPHj0qnE/29/drZmVPnz49ODgInetUC36d1L2m4969e7du3bp169aDBw+2trZOT0/v3r0reQm9iK2tkffk5ET5410f/sNv/93f+I+cUmymP/WT02/81JhDGkMf9kHqx0rMrcz2OW2/AA4vYL95GTtgVM1aew+8ljda1VWEMKG5sKvoAMSg9m5df42Nmw8pto9fw7vyaVWdVpJa1w3KlSjpu4H3jdGEaBmnL3HBU/aCZuYc6ksY4RTOixR6ZfqumY8MfAwXNeTv+eqEjYDXTzbYCxKxsh7r8SrGRx99dHh4qNuwnZ2ds7Ozg4ODs7OzlQTl8+/8N5/+3H8iAER+5Cubv/Vn/7kiVBSwI3Op1mLpAEaFPqMmbzBevF9knfQKiqFIW6DpCCuYoImrfZAZXQntcLARCsSzIskPTalYJI9ihQzE+SAkVRajWWelbsg9zQSpE4M2Zqiv8IpYaOhP4LSDhMMhoH318QIQHnA0IRW09wMLk1JkuCQpqPCISenSJxy/jdBrqPm4DQjXrs7RZkaqhY/g9eJ4/R3KG+FYBjC20bQdK1aDZOjQlm2Acrafl4YrQ9dUvuC2iUGBXJEBCgRAnkQqhiAi2lcauudlSaiYuK3Y3FS8dFloJdn3ZDK/IJ3HmwPWIpLS1hnEGf15IMetCqesjCVQjciGqwjKIw9L6VCPHj1S7PHmzZv7+/sh+Lu5ufns2bPDw8OPP/747Oxse3v7o48++hy4tUfX87AePHigSsTKSivwCL0lyixuYvPhXwfH/Dv/+B/9xaf685fe+/Ef+9bvqz1XGCU93PJgsA6oxcXvJjZtPrxe8NJPzn00r2a2gDeGKkNs4GMzTOeESCJGUwURcWKqcFJGPQ19VMc18KJrxZkYNWBR8FG8mJmXqCGuaoUT41ofTo56eqmSGrUEMRWTevvLX9v6wg9++E/efvufvv12JTIInJim7v7MR1OTmMBt1hMCvPRxjHTubYV1BTZ5zAG1ubbaUjNVa7y0WPq26R91IBpdqxirdyTO72DICIvhE/jIpF5MePIcvscVIvNLRhR5yfgGkmKGT01aOWAIhCO5gY6YSfQWEi+Y0yLo2NWoXygwjJkV/fG7WSU2UmlbC6Utiw9MvPUS7k3lZfY0XRbEslibgKwswx78HOUOK/i7vb3dut4+ePBAHVE2NzfX0PDrPvb29h4/fnz79u1Qyl9r4/rzRSLvP/n2L/+Tb/+y/vyb/yUzBiAeSR8+H+GcNqjR5kd0R141mjYKn21XDExpIJmWcSIVtflc0m75leTkm7/rR37wwx9+YaO4dFdzQRJaQDxh0Jr8YE57A+2MMNXF0jJt4oOmS4oHwt7hRRwCRwtEcOTH1V937qMNkzbrtAT0xV4wow05O0X+r6oXxtQq+ovpFQYnSeCCJoGcLqUu+sqHW7Ou1+MVja2trWfPnu3u7h4cHBTVehUavnhQzgBiERH5Te/9+I/+7M8wt41pZQjVl0cI4FkquS22sjjC5OtYFRLNqBgGLKq2tSiT0kTwIX8xoHGICBKx4RsMRATaQxlQbss+VRU9RxU+zsUAm1ZEdTULExCtTEAIrXGkXP16hq5icG2rK1uoqCH0lh3N3//ab3/r++f/9O23vv+Ft3IAof5OlBhFIewLW71rvjdlYLe+hJSefgwuHht3trGHgX4sitcoJu5FvAgyNBA9YddU6gfMRBSRBUEjPldsyLQuu+IccJHkrOUTTU6iijJCXnYYSngvDiYl4i5hUuikrCeqLlDAcAK1zPECCA28p0GXBBVaJkYLMgjvxTS5gyrQ0R/EUzHTYKYDS3CrBiPyavbq4z9ka2urRpBqjv39fRWd+NyMawoQv//++ycnJzs7Ozdv3tza2nr+/Pnh4eHu7u7jx49XdQOmX9v6rf/aH3nLzGO4yRdujEdVNnLPrincGClbdv+XJ2YSaRZXCyQQbyEpI0Cscbm23cLQT67sXjoMwPhS7ibH9SKoWr8rvLlGPstog+0KLSojEps0pY26E4OR+DRyjFgFKFJvi3D3Z/7V2z/9yS/9rW/8lATdDXNaeEbGFUtAkusEsYz+9SPRRqFzRsErc6jCJE2NQmUbo3o1QglIFSOeBxmpkYz+EwRS9C9hM4nCFN/Cb5jkpY9djgLYNmH4HPCtSw3XTnuKdMZo0rDL45gbBIlMmnoTFgkz+nV327EjfEuchqdNq2r9PdPhvEOxpDW2o8o0b7/OlDltYzeGN9wpvQAHu8bm5ubga9bjtRh3795Vaa0PP/xQ9UOePHlycHDw2WefXVw55Ee/9fu+/LM/k6j/1Ze/cpXnpdBhUQolxQM2pwyjkuxdayQI2eGPYnAVTTBNmNXRJHWZ/kXmyZ/7k7/327/0S9tfe1vmClAuekPQOIvx0GpCa0Ajy/ns1cuxFMwY5RVQzHw0NalZ6S07H601PGmJfThv6Et4wZzRRl619QJfZ9PQBlJdg/vDtu1W+bNuUA1ohDNZftos+mgxwMHXYz3ezHF0dHTr1i1tn/3ggw9OT08//vjj4+Pj999//9mzZxdsYX7767/td/wb/yOjfNIvvLUo5lKgUQvmczmQRGtB2/YWxVhjeNP3dnThXGlHHUsVWlsbAnIss6W+2DR5CyFSFc1QBNDAm8BrTjWX0aYf2FSyYq4t0HKROw1Ny4zrz//rf/j9b//K3/7G7z5nZEitAqJ3dU9pI4itotYjzF069SUKIzilgHuOVd3yYpyeJjNNW1/hz1a4WTrleuYqUBEVfrVbOiO+wBq0ipA2POUSRjGSJDemM/DDT6JOViIVE8FY8czVQgSYM/scbSIfCxs1NTEgyHP5Aubt8pbsmUQ6hxu7FIGIhXdcm81e03EdAeLDw0NFh9VCXUT29vZu3ry5u7t79+7dgtrdLI12lVLbn9u333r7mz/xBTObmsRK1uDPEoNzXcGuBMLQiXjOGI2kabC9pOatEXoDEHCSFZdg4K24viJYZXsdrs5gJlDQvtLouQALx/jyDaVzGIrgFJtUfGRQkfZ7C8kPKx2poy6UAcGKLGNr9ltcUk1BfaUzaFxGmqfWM0bh2tq8ehO4lzTdCQxIfVdFLnBi0vFXOBUzo53CzRgVbSXIG3NqE7J1lopIlLG8228tAmO6rp3ES0ZdvbcqAGKEFn4Kh6B2HE4Pk+erxT1q2vEVO6QxmrxL1Q+L4yLbJcgvcS8RN1p912M9rs84PT19+PDh5ubmixcvNIbu7OzcuXPn3XffPTw8/OijjwoW+XKRd/qVH/1nvvk754xSqmTbKzxXnDOawKViQE5XpgBOT1R8P7joklJhkTQBMs0257lx0FD6XZKILz56acKLLZsRvAjmHbBymNEltJdKT863EAiiv2LEy1+04q6x7fNHRv4FiczNpLRTnKTWpt0qkWHhbD5tIrhXJZHvxcyZ6VxfwHlyPdbjNR6q8vT06dOiDH/nzp3d3d3j4+PDw8M7d+5cJCjbt29sfvPHQ7ahazhAh/hvQTpRnM7RhNRAgBY0F9CwcQQJiFi4QdAopUVeQQzrhSlN2kEw9IJULAsjr46MphHa+hRrI5T6uSG50sLHcBO44gPD6zIf3SBvGqZq/VHYCCPxXZ/fSM0ua1GlwImlVJI+Dh9/Ri9LiUhMDWHO1SCdJ3q6OpDpX7taYps2brqFT2n6AVkFN+sTifDjgQtQZ3UEbyBpZ0G9UHhwjqYHJQjJW4nYDXEMkn6It4BjZMULxItpdVbQXiKDspaADM4uQy16NmctD6+J4FKa5nRFTkk2DUqyzU52Pa7juI435uOPP5bchrUYOzs729vbKs/fJcDfqtbfu5WH/ssWC+FEXDe+40aTVrLPzJk1mHVDup6Y5Qp9XmSeu+ugkjSWYLQq/Uum7tenl5eIGaT2oA33HFNzY9tywzICIficuqUahG8hQRv7uCNnVuSRqqnXfPHNv/bs5l9/9j/7S//P/9av/3r4aT5fxwejoMopqBvDOWNSo5SRuoknN0zSq0M9Im4Ke/K3YotT5M85Zt38QtjchLffcaiprMTqLpBDt1hZ1ewGNQoD967NVJvhUms7lYy4Wctc9LAha8iEQeZUQ7/28sMSupNKz5c1GWo9rus4OjoSkaa0lrbsqNJIlw1slytA89npYCwSw6naJQ1wdUbMs0DsIkcbLRdYJRjWkHw3iiqBAO5Ca8pyyhKqvVOc2v7Pffytv/o3/8c/9/+6DNguWso9b4mTUu6zOrnpWZz7KAt2rTLW4+D+hFZz14Q2rWIrc5oxWaWqYQy+aGnofFCjCYtsBa9gaDk5XaeR6/GGjZOTk9PT0+3t7VqTlmbHz58/X0VQLpzWMmO6hKb26FUiNQpkJ+PJQlFRUHJUdIxLp2Mldqg6bcLISUh9pRXfk3cn+Yoaco0T6ezY8JlahczFKgo5kKoNAyj1dnvFiAPJ+66Up9dFpvK+UbuTP/BX/8a3/srfuP0Xn/6W7/zGAlFydOBs3q9lgjJHbMaqMzOlKX5ImButd3+5yVPROL8RxYfPGzhMDAdV2myZY7RwBh6QJrPHiemHNSmZ50339RwmYvfu4tDcn+h1scKCpmDFx0hz0zyFC1CcwlxsSjOXzA2e2XPErp15j6MjM2o5UhpdC3TChI8Yqvvb9bj+4zoyiLtUk8KCu8TdAAEAAElEQVTEtVWAv0utv2cxUrUj7bhUsXaL9m4OYOwi2PIbtggaeGIudgLHjg25qkw4WpV9mZpEZVUtvIhz7Euf2cm5aFW6YRNN64+UU+NC2QQRodALUto4PyN2fwiCYmp/cm7Fb8D9kEZ9Tltvzd5fO/7pn/9FEfnbP/WT3/nKj5JIaGJ4wnsxnt4OJcXMCdfakfGSkQ9UpACZIC0qCQ08feHkdJzfPYKJ2vLyMIvG6JS59bdTpDPamq1c4/b1d/RkJnXNyWPhBylIjqatrLqy5HSK1C6ij1ZMhpc5fXuwLbdzlyD+hkmWBTHWYz1ecdj94he/GIZdadjAjkxEBdIla9AqNAzhJFdz6t8rL/dgFTq8Ke1s1SZUKizgF1/EAOkyql1iecx1qxh2trbeAo4omxXjw794pD/83//o/6ArRtT2DFYusX+CInPfWdLrunpzRrmXjpz7aGoG7OkUUB7nYoeORG5py/qWgwlVJha5VsoKkDlbLF5D6Q+20YfHXGGu9NamYua8plJ467Ee1yEXXj4oi4iI9rZHAmTO3jYN0KuGohEBFrRigEa8p7EZykaLUTCQ6kuoDDEpCTNHkNrCF8Hb3hVloQqlJwiokGBCU9WagCxSEsu1GX0jLyMyiYx2oXyNwjX+jWNNjNiYBfs2/sBf/Zvf/OTvicj/5xs/+Wtf/vIiizMGLylFFEPMBYiR0lJ8BJ95Ay4QfVpuihcw15tWfreBUJCIkYxQPGB7zpwEpNxzg4KuxBG3klFGNy6HEYnhUtg60kJJZFSh14oCsqoQYk1VbCRdhJ2peGsEklJTvxQRL+LyVmZUn9MQXWmWbZwUV9U7ga1+gpEMLDZCL9RGYQw9E7qpVruIqaSJlJRHs06BX7dxHWvyN2/eFJEnT57UIuXx8XFhhfThhx+KyKNHj4oXnJ6eHh0dbW5u7u3tjX/qcmF5FKTQgoxp4Sc2HayFTuGq877yBM16t7aF+n7ibVe6CGghq6JBbOFi43p7EBBo75Y54eCqNoHLtf/7lgG0CPhCxSXm3nq2qKrbzKIkG2+Ny230CmT/Fkn/lCfrifEsp5eM8guVOefq2fbjFK1VNbWqG793ab7O0bxkPKdlnt/PaUP5p7xM6gz8QvlleLhTpFFWM8AELhKv5O7+jVedCQwqRizgDZM0pVfCq+eJOSO03K/iBXXBr8oD5SPfW7mdiIuaYBNyk8NyAi+woRl/HyP4po5kv4srhPFoPU2KeJiV/FsHv/UIh8bNo6OjWlKqDT3KYNrb29vc3Dw6Ojo9PS1eoFFYI/LyeOrQr7sC8RiHutbhxMxpUjErR4crcXLh9xCjjA1GdThqJ4pSb176+KWPu7of0nHk1v5DOveRfstLH9dBPchliskufKm1l7noNWab1O8CM7X3+l9NWlRDGYayzZbbbcVHGeuNPfvD/i1xAdav5KTcNUCHGfhqXOTfEl99enqqrRut4+jo6P79+w8fPgxX49rbHz58eP/+fe0OWY/Xbuzs7GxubioXqhmUP/jgg1UFZW2MUxMOZggmpKovkUEGYK3JQ7fWFmxYoYxZIW1CM2d0NU6naoA2F+tzonFKk1KjwCIeOW0Bp0AAC/pw16fNJarDr0Fc9v5CnRuZXGRAqFJZ5AymIEjxuQxuP0taebv6zws0nLE8ZqP7kM64wxZKFwOXVFI91kzOYEVBY9cIlU/CMetnxZoVuSBvcRdqlOdal1KrjgQ6ptC8BAqG9wrImqKchaumxuoTODIRQyLWCxKxgXgIPA1EfM6zDk8nqgNTA3E2lTqjWemSItSJbdHO5Q8nq54OM1/Bip8h2qopF4jIrywov1HjOlbm9/f3Dw4OVJtfW2nOzs7Uv7XQndjf33/06NHh4eE777yzs7NTvGCMlw6rMGJC2+A8OgeTN84PZ3TNBSXrUmeLQHhIVFEScQTvBEk1P1EZYufFgqYNGx1BrWqib2x6s2kwCzf9GKYTtX0dM7NRVBX0lKOzgWSKNCQOhwas9SWYmIudVtUkWiHUZvwplqSE1gg9nBdYYa3fs/VaUTcKyMKAigjboTkAkaly0Ik0YN/4RjOvtr00u4a1E1ma7jFUiXipaXf0bGBiuCBgj6qdFkjx+Ipr8wqY3ERxQLciz05fStzFHGcJy7bLBI84vkx5s3rHCeEGXEKbjrs4kmtreMG5j7tFNob3k53rL7yR9Aej275TmPmKqnp+HR3XIxjax3p8fLy7u3vv3j3lKD169Ej9AAou0r179+7evXvr1i19jSohbm9v37lz5/KOTSthoJoXrxZYvJSR0iwnxGiEZsRqoA2544haZpAHkG1UQA2gGHKp7komWzfcqg11GRdZOTXL3feC2JKIjeQS2x41Bq1knqliYLDjEiel3p+vNoN34iMERJKODlmAsThNCDvTS4zgD4x4os1r4k5DwQz2lXz17du3j4+P2VhKTk5Obt++XYCGd+/evXfv3v3798PX3L9/X3OiYnl//Pjx6PbK9bgu46OPPjo4ONjd3X3w4MHW1paIHB8fq1tAYdh+kaDsq9BSjghnZbOk8YRmKwN8UWsEMrgNS6UPKS/r4UortFz9T3oW0FWWp88ZJbRYVKupMQoBYtMNlFdVGkxzH0KBp5FcH3YJqFi7OaOgZSeCj+DmYvN7DSfGE5MhHYOkZJhWtPVcvZl2IJUL/1NlB6wUjLcWE3VmbU8ZRStplDOV01p+eDUkFWTVCZzPtZiS6i4oRuo4KeEIlDBIDQxBv0Ng7eJnodObDAbJpkRXE21Ca0F1rmM+i7riOAVzMQjmsxcTiZPSkTibmVZ8t4Njz8xs9q/RgqC3GSAmtrt+rCoTFt4RFvCC8ULbC+0SNSJzFf7xfp0E9wMU1/CYNjc3nz17dvv27aOjo7D0He6BNjc3nz59evv27YODg2IbdO/evfH0YcmFBdhq3VgiOM6KFy6MA+XPW93ju/Z0ORrl2zqRpKpXmK/BpIiqjAM+EiatO/u2g3Jizn2sy40FI7CtPTJ74GN4XRlRruYLgF6FkmNenMnW8Q2TWWBrL1KbI5DGDBsHzZusdhshD3vC2i1A230pRHaglVIVYR8hkK9ZlhUKxYzcGmTsVFIgplqILi7CpFDkAIWhSrJqOwoFFj5uWyIpmEk01GbVEqgBieDShhEc21K4Dkq4nDOeDjV6FwAxg+mUx8vC1rZlqnQoSxQh3I2k1mopewIXi4vg5227PYiYoMmFI3p4Z4ymSAsScYFoe5q5RJNRvcbDcXGhML4OZ+txeUNDqpZmi1/u7e2FZdc7d+5oObZ4jUIPl3pgVmiEMZyvC+FlTW/a52jHbxkJJ7Doe/xJAFy0LU57/ZSKtdqLAPV6HaWjPgythiqH2mmoOGlKuwQRrBVKKHK5qDvnWRoqJSSlNUstwo5YSHWaAk+xWDETWPtGWyvQCmHUWE5z2licLf1mkYi1i6DbqqXWE81NXoGN4Fd+vrXAp/qPvo2luB4icnh42EUfVnT43r17BTnm4OBge3u7SH+Ojo70NwVieHBwcPv27RcvXqwv7Os1NOfV21f8UmNuITSxdFBWkyvJNA18DYzzAQGwmSY0azwQrjDmmXF1yi42kwt8XHTMJIolnedMzDyMomeDvVCVF5m+BAv6sKk247LMVrL1vHku3he02bEqEyRcbtZXLOOmpY+z3Nt4wonx4m33RsJ1+LBprOc4h4jCCS2IayrgKxEqvZ45fTjLDX0GlLfqjgz41IXcvuAGoz+T0nxZM9bApY3xInFQhY9j+Ej8TKIIPoJPWQI7jgCUwV2RIS4aZWK4Hnni/ITgxaS0BtStbAR1xx3C7Mc8d4FPHUQi0Z2Ak4CYrDsTlRahqFAMJVBQieFycbNRLGntP1hsB7Gqnch6dI9rqu21vb394sWLk5MTBYi3trZ2dna0fFp7zdHR0cnJiSpL1F4wZnL4rPDS3QCOimBuMaa58ncLTlpTV2gLmiQSieLcoLnASdvCJCOTWvFTk0wznysO2mQV/PmCxwpha/MggvxTWmPmOJw0lK4jUYSPGsO6I9+Gp0kk6jLyompdURaSZSqFmDnK9wy5HNKMERnQrqu7og2T5q0WnJok9ZPeNqRMxCf8hKJyS1YMQ5t3x9HkQtX5cYaiQvBqChFQyTiBn+cJmAci2/hY1lUmhJFyn0MNEGYbpIrG/NSkLxv+OSZvMavpM0IYI4XQgK3F6v7+pq5eV3Ze6mExBxHZQJqOU6by2TTmQoc9sODCr3X61+N6Di27qljT2dnZ5uZmyB0OU9b9/X19TYhKDOYxF8SSmmNe7ryV3uJGolqqqdfjSavNlVa8FS4EE89piyXDrzJfFiuMxKd1UgYGKZ0tZyedIgBLr2z9PuB2pSxddcq2S+3vGdCHx28kUjF29O7DEx4YM2dSGov2eDKnvVGNFDkinI5/cIyQAYKi0czTjMHHjfAiooE1vrNuZWufP0HqBckCnbbh2XlISVpXxhRef5XD4+Pj4+Pj58+fd6HDDx8+PDk52d/fL+gy29vb77777u3bt4ulWMHEp0+fak60s7Pz2WefHR4ePnz48FJbPdbjMsb9+/fv3LlTiEjs7OzUPOuWDsra7w8gpTXZ8lDqpzereqgiUBY+JCADgt74q8tO8RoVIO56ZqPAd27R0USHJWjrHFxt2Mgs2vON9mNmkZ01hSYoCPQlmj5jaFTLhhc0L/C0I0OhKhG5TFAYNm9RtcFqr1BjKqY7pperbi/zCp4mhZ1kMSuDNcvkF5UqteabBYxuxUzQTtRSLF6kvQcFsgBOWhQ5EIhC8ALwYa2Ab+FDLeCE1sKnYgtGdjquEaqQwwrmRI7ACiIBxUh1l6Wt562xXoGOSkNS/kMML3k7uJRE7xyZzsUijHAe+PFG4gOEF9VNizIU/dpm9rUb19r8YXt7e7Alam9vbyHWcGXi0kw6ApoxWfWSOabDaqXSYGDtVqHufuxycOWyRguJDDWIMS4fTMXM/TDDH8EqrQLEzYYK6pdXLhVzrQw245gX8cx7IYYCcb+nNjKFivQHjMfLAqQ0VmhFTeowF1NjBM+8nZpK/lOoRbPcNlVyrYlxQqklIZBGkb0ttiMnEVsRY9z4NIYi7IjTbOweYjgbzhMhUK0st4GbtdMJ/3TOSW3a111NKYrpm/xf7vpTYO6UZVvPxu8FE5rBEBuEN77ComE/hL0e6/HKx9bW1iCIMOY17SnFkk/NmL8gEWtk/OoK5jAWO8BcR+NErHhdV83YAJQdWbJSQYzXl+owUjdjNOyIV3EpFvjOlMb0OpiP+VgKnJgCWHcylrQVojmtrJx0hMcO8/Kz5AVg30drqtP98gJMSaCz8K1elEow7//w1mFBI3Q53SwRG/FyWc9XM5Tt2/MCdWcp1PZ0Nd7b29OGS/3h7Oysxpj56KOPDg8Pnzx5sgaIX8cRCkqsMCgXQdCL2qFXVtqOFJUtoTff1vZXlRSXjPJKm/rU2W5+zcho2+wBVn3hlvAh8HmBkGz3Cs+pVOKkpXanZ+cauwWTp1b6B6v2MI1cg2V7a33Fcx29QSuPdizjlC3YKnHDS6kr6/QBTJnQ2lyBoVA97rSQqUoSOzFg/UsYqAjmmXg7syCCs4LzYJa6zEwnu4M20w8Y4PNM4M4vE7hEZzKajYQ26igSIwigSvZHJY1n9WbVuQJWvJN2nrUTY4RGnOQkbRsYL2mvXipA/SMzzz29wgZ0LGaCMXlE1qMsWvq0khSJc21LCqrWuOtxzbbub+rI9CUorXhRBTUDFxRzKYPBrAcjJhJG+rIkYGUaMM4ZoxY+Mk4adj3xiN6TNgx6CERDdjkwauGrQV3wYlTOiYuYxrDv+MvAo1kKR1m3Z3pJKa3P9C5MG9+5CnUy06NIMvowxuxXMNo53ZT7qmwjNemgxTXmiQhlTlu13JUo4w6XfhGVO9J5B9BU25giDXdpN5BopNXIMfN9NlAZNIyKBdwqdzFDMbcpNj+BC0+n2PqgIZqS9HaC9zy/np3mOXpfxpzimk28Hm/QwKW+PM9ARr2mTNIyb24xabdcmqNJvF1KL/Ua7Xqr7hyrW4yvdixhpjewZ6BcRnLCVVQhQ+/ibIvIqgp/Y8JzkPw2btaGdCrFdnskApVSVNsNVml4nKCzchPuW5abablQ2+dh3L9/n/lofYFKD9eoM++9917xJ/1f/U0x9PU1r7P1WA8RuPo2uJNm28auyBJG9bOy8BEW6PNkNWtbyjmq3rDL/iDITMAhoSWby57m3ezawxdls/rvS94PIRKZAYuwJHOdKfnajlcmdI5adonWrLM9H1d9CQmt6opMMDY+Mr5r59DSXd12hwLzHohkRGYO3XiKOFrm+hKm2yewH+25gl0QOaqbDmCsYl/s6pqt7F7YEcfHRE/XIjXe8rwDAkhksuJ3NXvNQG7Nqb2YnINcejZ2QCiLikusx9WNN5ryzVxiYuWfPKfNBHkZduhXHOp0uUSeqRYCxPrAFKoCgZhRUDDqxaydmFl+ACOXxUKAOFhqFkzDMkkCow2MXOCNmQ6vp/Zc1L7X6+ID0IqfIBnzgaRo54XPbvFAtAxEgY32+PgcSA0lOMLbNyq6VO4+JyF3GNJKqrINeJGNsqq+TPdhBX9Z6cNjkIm2QMINpG8hjXLwunpNhiYSCPGFYyAa5dDW0NUvQHyROK0JZwy3YdIo19PMs1Au9FGO5tzHMx+xfbfUfoBx4yZaadlWZmVY8XHVj7H/3Ams5N86+K3H9c1ZhRNT2GYuENBbSz7V7hacM0IDPWTvsnCpCCkvGUjWy3Lu4+LfeLBbQ8+8t0Yocp17IjDzUchpYjX7pWDG1TfSpb2muONvXG1+ql1qUZv0gjnjzFGK4qSzbNl/p1jfhLjA4MhpdjdBansx4ir8sQCOb4SxcRA6mmSpe8FLX45W8G8loxUdLn7zySefFP/b9Zo1RrwerY9PscLMvQoQYTAyGOHEpJFJAWrmYvr20raJgSY+UgQwYZSHp8iPPuxmVJrR+u7duSPmEnnBnFHHalmhuWTCuBxedYrrpUsZ2jcUYCbbWpJvxu+IuOzC1Zu5tNOEZ7kIVTE3Em+DoqGS21Bdw33NqJxVxvRwbGJWvU5o1fN2ziil1R2Ia6BVzOnVgd19pjSoLdcjr9LEuDZHmbpZ1CzYNy40JkjDZH/OyAsGhQoRTMJZcLUZSETqTG5izhgdFZVI13yUYqRRScEu73Jz2hcXS22WdG7na0gFaoyNW+FG9/oE5c/xiN7Is8YYoCca2yTYvsx1rfK1V84kzsUCKlCyASfiExojjJFa+KlJrdDm7rG9ZVLxnTW35rpJkT7pqNHQFdKsgpddVQgj+IRWlc45KguqXzcrNHDnjNQGDYvEyYIk3tFL1DL0KOe0QpkLCtB8YjxIjMa90ZEIFT80AxLLVa+Q6DJeMAXZPZGYreauQeHp1z/B4MSgxqJuHnJ4XhnFWziBq+XbRuoCxMrMJVeQ16m+hHRP9bgXNKdgTtvUR9aWmakq8S8TR9i8vr3iyKNxB8FsRVU9v8aI1+PaB2kIB00yJUjh2rBd1NKwYukk8gDEeirbRPdU99ZcAhgF4dQk5z5eNrfnYAKwNIiWMjJDLt6+cYWvDtrgwJ7k3EfZ/UWx4EcsU19cUntjm4H7Mh9y7qONalm6sFYOsuJR6XcXaNCs1OJiQarYYLAhyNg1rPiJkXmjEHsdhhfMsCS57//0cz+/2oM5OzsTkcKdrBj6G/3rmNesx3rUJnnqrYXTtkvpFZTXXX1kXOqjIkfLMxeiIwMJ10BHayEaWRIfJSNkf5vL0ZzW01i4qpQq5ox7k82SZTxitWHCKK1uuaG4pO/c+YcCuJOqWZH+NMtj/cjQgzYTl8GDt/AxUlPndI9TfsytuefeRsYjUAfuS6eq/zHi3Npq+Rl+woKzrGhjaxY8RXrOuC3CFYKcBAflB9lMaafGOW+7JvCSeFNwmXp9pAYvXjnLKOUmVvnEEbwB6cXCSy8Hq0CHHW0inKJl+61QmCcGaYMMGHUM4OwwyscmnV94r+iBOQyxAsb9Wu2xf7yJADEbc7p+UeCFyvB3reYq7JheYc0nYeRHeKN18Xy1UUITG9V2yUQJQA2NMVy/VR0FThDKEGNZ4QeOewMZ4rxA0I8TiZ909OxUbgeRiI1L8BRQpi0zWqteBNeLkYVbjSZDHL0kGqUaUfXyCT34XHe4ByrlBF7tiZCtvEY54OzwODAN/7ewXwMiqfZAiYjYCaMILT4/NrcaX8TPTXjhlZE5hh6bNPERRIyIEW6YVIWm6m0pwbd5QUIbPhrqB9Vz5CltyswdtUa7HmxJQ6DsgbZ81XdUD9juUIc5zWSkuXAZF7Pt3cWRiDWmux6vbdjtrFlefM4vajsmIqkY0AItvbTsfaLHV0zHH8xyNR9H42D6E4DkYo2rXpByGLZ7JRJyFEm6j00LA8xNVEzeShKEsIiU6WhLgIUnmJbG4UREbW+Xe2q0clBjwc8ZT/NuKi74+FwNQb4ovhrxRTdAH5whPjapu5Y+Nkt3wP75v/AL65V/Pa5/aE689QI/Yqm3hhY+9RbShJMyrYkYzgl6kCB2J9GNV3HRHUWPyYp2lLbW0jiuu0JEIjhPSRpBO5DxLQFH09ZZP5bIUwUWqjmRMWJa1TzCF9fvUQCWMiuO9ux2MPfWifE+66nVeMphqJQU47ydmDS8sBwXelRcN+/3zIwTdYrC1BWrG5BmAcK0psOdgpBGqN3J6N6Xepq5RG1c485oWyTmE6S1WdezZYrh5ot00jhaMnOYR+ZCNLzbCHkDrUhUaCCkAIUdmq1zb6cmLetADUPgZSyVO/alXM3Stx59I3qTT75geYRTNoIjJYWR/GFrvnGaR4KpuK5nplC5Tb1VHeH+uUhKyuyVxZo1zdpVMvJp9vCDoAA07FRKKjTLBzO35mKKpZ7gEJYtokjBh82N4Ae4KSyPvL5cGW2LJw2YDvCGxNF6GjEpUci3UxNFL2jo8WdlroSRE5Nm0lTD3JdYXCo21wBhGG2V49NccGP4hKYZY4CSX+xoUjEk8h6fDOZGI6gg83hxTW8WZOVrN2/pucbFl04V4jBCQaZBrKYxY/i2jcLJwCwtUH5eILjkWvjlN82rOPVgrkuRmfq/AyL0xFzspFuqbFKwj1HsEpysx3q8kcMRrejPZEitb9HFagx1JaeoDFnNto3ERzDp4MtmbcsLR2vWX3yJTofQ4ZwoNNA8xIsdxqXu3Tnur2wkJnNGngvsdDyRiI2QLnT8RZZ+EQC9H7bwxFwi2xZZKBLBNUGEUQKIlWR7kX1D9YvCFuCRX/p5Svb+w//g9xc//yv/i79+8Q/sYgGHrOExr1mP9WgNnV2vCYXaOhvYkbWiortp09FCxI7bCU/y/JpDy2xrd6AeaigMWCgH9mwS8t/35Qa1hTFGasQjP+cJnBFOJa0JHbCNVZ14i4Fz5ELrpQL080boj+A8RMu9KU1KOzFdmXSlo7diquStZNA/Wu+xEcZwKhDBLBk3iUSFSKYXQ6IjYJUi1Amt8T6uKBV1oYsN3YP8shcTlbmgx7SrVAlBABN3XXn2oiMTpEZ8Nd93GyZ1znipXCwGn9b8vKa3/MAJZ0m0EBKJj+AgEiOdMVL1wtaNN1sufu10nBNMkDoxIla5ei14UQN3Sry1xufdWtXJ2UkiXkO113FEb/bpg6zEMm3YBCQKnnM27KRMLkxk2pRkilU1oREBaUScZsJdyaoqJzY95UpRgoocrjCXdOlJrXWF8VJJy7OqpmEz1MVwar3qBQmWyNmh5FARmjZxglZdBWmExoxELJyJiZCqaeYUqWNcWI1NUAlsv/y1rS/84If/5O23/+nbb2s+4nPHuUyDOF+JvcB36014Gv0X5ja55k+24hdcmIk4C6+c1qlJZ+0Nwg1fUfjQ37wr91tII7KLPixtohyt5d+JOAvOaV1ljpW1kxmjnkbvfNe4UpO6lSaSRbq7Ia6o/DPzhR810b3ueGiCDvU+XFtlsGoIUfO7IniIO18HovV4A6LtFSA8JBIx/f6fJM4l2hghZ18bibdinB1xnK2YIDOGBZfFiLnQJWNbwhz+JqVxNBF8RxjCnNa1pckn3/xdP/KDH/7wCxuSaVZG1c2Miet6R8uM1TqPsaJUWP7vnPYG0jGBYAmQN6XRqvAlITuZgwXh2whHGv1bc8tCXqMzMYCz+b8AB3G8/Dxu6SJKmmFP18jx5qff+/JqP7BLRzg0pnvvvfeOjo5OTk729vaar2lqE6/HmzyS6ra/Kz8NczcjPgZrScpI3uJCffrF8pXSpmLbcd2y1a/ywXPaKdLarltRMJ+fEVoTNiiSxYm4ROIu5CBM7IrjnCC14rXNt0ovY/C2mqAiyq2LX7TdB8oQShj9/a//t7/wgx9+/+23fvD2jaEoVsAWS2ixItjMRK2tIXmuLQmtlidTGgS+RAMugoHdznL2DBBaECIbkiaCeV4PVhL0hkl63okGZDFG1h/VaaC/nIinYN7Ga9Im2rmPRWRq5rUPVJC9xza5K6YzOIWiNDv6AnLOyCC1FYw7+5fLB3NSNbQPtrtNBKzy60LLC22bDSHWCPE1HG8uQExqJiOJGEOjshJWaMWnQVCx8FEV/yrGVFrx2QrElnpLkdTb2FSKS9lfcyEC702Xh6nJ7UGmJsmsrgjVl+h/8nPjO6SsOrCjxiHJ/sNkJag6NplxIAeS0gws8zQQpea0NCw0L9eMsW9Z7DSGmeIATPbe0iU2HH/mX73905/80t/6xk/VTo4CT7SSeZsrrDar6sGkPgKczVBuTsTnPOicyl2KHKH1vLouVHMLpb0zerXUeq6WFXdJWlv4CD5uow9LXr2ctyy7dWb0RJzm8ygd78IbFMVwvjNQM4Yz4o14kwMNZqjm34uq1GJTZzhcUBJRbxUNPGgw6i2Y0UJ4qbRfxZHXcWg91mMCtxKFX47oY1su8VgCIsz3xFz6E/I9tI8ugHylNKkYKz6uG09nzgHNMa9tG4Jx98/9yd/77V/6xe2vm4CeU1xYfdfFl01e+O1hRjr30dSkat5b01IkZTauYDCGTI1GunsZD4sSh6c5atM8MKNGxy0THchbqaz4uEFViuAsfKuRCy7UwzPyvMxM0EEmuNwJ87qM7e3tk5OTk5OTEOoNjelCw7pirNHh9WhdRlKaVKy2TqrIPvP1obp4oNR1bWzWjdCKR1uC0zUSb6ShGNCLG8oUbkZ0PexTOAyxN1Q2gQKltRZMI03GI3HFZ6O3lbZLrbEgEU+llB4Ofw6PvM0cdRnuix7n/+Ff/8O/59t/7+9883cOLoWLClz0f3v3nyodzFlST7DOIq9jC6ECMgVJ3ko7Mp+SkAMOBkg+ejZgrSXJ5hwI5DJQ7KxY3e1MxSm/MCvQsuCVpx3eyGifYKQ06h5NsQ4SqdgJPC/qu4YeMAtVZefB2cW6Qx1jpIX9w2IzaT1e3XiDAeJMdUVJpgb5I21qka/bDXOMUaaCfQwSrYlJ1RM8oSUxy+nGnmj3QAMNvBVvxU/gmMssoM3jKxUzz5RlMvJsGCzRsQ5OGkh377rPCVyS+9HFWVQODU9bZH+jDhm3QaosMq9SGtBg2NfMCRwzgjQJZYmOmQ8uIw4j9dYTRiBZt1R2oyfG1fI/1ch3jC84D72gwJ2bKg3siGrI9K3YQ+wVSCx6s9BMmyVAhzWlJ+GCiA4RJyaWZo9qaF/rs7szerOh+7Na66unScUY8RG8ozFYcSaaazOF25eB+5JNiaGWtAsOpQAsgnqsY+mFxtnZ2fHx8cnJySeffKJdt9vb2++8887Ozs46f36FA1dbKWEbore6D88WDQ3HrWSlhfPAZddDlbMXkVRUFde3potzb0NB3uXQ8FmWA7ziNYqZ0GS9IUaJKnNaNqqwYw7ZZx4JrudS1/rPZIQOBi4wx3oapU0H5TxjaRGpWFd4NVZTwdZtWB3ioTVt1ggX35Y3lgK8Wvj3WkXcDz/88OTk5NGjR48fP9bfnJ6eHh0dbW5uKmV4b29vc3Pz6Ojo9PR0a2tLX/Po0SN97xUf7fHx8fHx8WeffXZ6eioiW1tbGmp3dnbWIe86ZMEK26llTtZeyQKba6x1nTkvVdkgqlui9S1ftY6csHWg9VuMlKpAVYG4jLFbvHKuOoGN2pgnnBg15tHEf+4tq8ueFT+RNNBmXfiihgcDEVMlls6yvnuMVKVfjkLbvx9wuf4su1k488yusL5f4gXWYi9GOXPFp6ViTD7NisBUMLPntJBhezQJ3NpNxnJjqzVcVwqmCG/zKxR1KfQ6SMzFGmFB71U5yiQ3G2jdx06Qzhj1wNzNqVockn7jRuaXbuYNv+WCKNzg52ICNxeRcS4U7PKuD1CX1o752pjTApwxMt5PTbnvXW1Cv86Bryb/fcM1iOHZI5c0vB51PGb9eFCuxZNhx+iEjUxZzww0iCVukExraCM6j5CtC1PRC6N01DRTia+cUfh9Fkzy8FvwH8PX+ID0qkauPX1/vWGybNrQFb+1/fDmX3v209/+pX/2F37x6e/f/Ydf/mqQoKrKxDDvpThaLyb3qUPVRE5ai8BGil5aTuDPifGZ4eh1EIk354g08LByI3wrfTiCc0DC/LDrZ69GDdaCYZHDCKdIXwYWwDNGrdus5lw1ocRE45CM0MIXgpgUOFoIw1mR10iQzR90R9MRlzWGJyU0M6zmveTojV8BEydZ4QEpEa0SzFqg5TyFOV+FeasU+shv0tC8+vDwsJnE6g9bW1sffvjhnTt31kKN13OsasqqkJG2bRTsjxU+0rMMgsyTwBG742X3z+106cKerkCHSwRTaMEuGbsxV3j/5z7+rb/+j7e//Ut/6V/+g4tE89WMxBsYjrjFXXuzflYvhubCgL146iGmxIgT2h7qt2pQxkvJcNdIxONHKqV2x5j7FYmP4ZoprqqoAWNpgIucWmkH5MXMaVVa8ZWsOV4wW1HMXcnY39/XKKZJ3dnZ2cHBgYgUeLGI3Lt37+7du7du3bp3797m5ubx8fHh4eH29vadO3eu5iBPT08PDw8fPXrUlEIWkYODA4Wz7927V0DY6/Fqk+EsD2I9SvY+dxSBUdnTzEp9AXGhECNWpYsYXpnIk8wfnt2xEt1RG11FSh9AaZ6YtRi0qOVPqR4Rfk4o6V6cpvZQFsfSL69UuIGdj/ADXGj8gb/6N7c/+eVvfPuX//K3fua/+sqPTcT5dg51qTabeBOZTpiAJV+cFEnza5XklVe2YQuoheDqlqJIq5VEbOAZFCgVjvciCSOlGOuhKsMphlOFrs5YCQGowdQINyQNwZ15N06qAEhX24pK+s5ySF0BlhoCo4ZvkLQzv+vd3s1oN5q+RBV0ArVbox5Faa79whYy8ti8UveH03yXUtsADWX/bXgOtG+7sjU1WU9zZKqY+5IRWQxXEZTfKLrVEvnvGwkQs7ZgtQ8LbzrIERTZaNOXQDDneubdxKTnPu7N+Rjn4j5aSgoKkqOItGS2vqMnv0EW20oQNoMLFzaSTmg8MwQNpYoQkOtjXPxeQWjFx3Bpg3S899eOf/rnf1FE/vZP/eQ//PJXReBpPQ3FFTTq2oLYSgJKtKmW4mitLkQtU0ZEJJZC2AGVq7fS1cYTeV+wcTRz0YpueAPZWWkPfq/OeDUSscsUeOtvDKeQGzcTlGRthRtISaQyqR9Pzv7OVar1GEzTHlwr/EMTZriF3Ig3UtH8Li7cBM6yIpo5Zx8pLMxa8/hkFjU2t0IROjGyHq9inJ6eHhwcaGjc3t7e2dl55513inrp6enp6enpZ599dnx8fHBw8OjRo48++mgNE1+3odHkfIGODYzwQM+WQFVkakHTaCWgh4z+Vix4iJya9Nyvfj/GOqiXLZ5prra/xPjwLx7pDzWA+GpInsvt6XPq1gC8e85IRJbQp+45PF7C6VzsUox6V6FqEhSAIZnzbd5ptBS7YszNCuVB/AiVsEtNF9x1SiM3NzefPn16+/btg4MDhYZF5N69e6Hi8J07dxQ4vnXrlv5me3s7RJAvb5ydnT18+FCh4a2trb29PQWyi7+enJx873vfU8z68PBwf39/DRNfzyyZmRKjLeJkmH5o65ujieEAtpp6a0dg0h1oFCNOkPV2JLQAlac8Ebdc5amHvOVzDeJc3XGx57qBOlMka3conM9DhzS2XNK8qbeT49Vsrxx1Ef7AX/mb7337l0Xk5Ju/67/6yo9aZLuZpqRhwP2q10qn4ualR0sWMbX/iax48iQsK+tGGMMjv92+4kkwuMI3HdSheLSljUAIVWVR8YxBspcKO+S8N0F31NswyUsf673Td3Y24waQC2nSNqZd11yK4V1V1VDJ70leIaCEOtq9D2PtwWGEjDbXQkzM9UgHpk1Km9JauOJg1F1pTpuKQeWzaQKFyuYHzxlpQ3mnqWK+M0YLhMWFHnAPrMSg4g2RpVo6/30zGcQl7b3QRA9hRAsnFHQUMJm9xovQB8JMksFkXqHGuY/GzGBdHWoCxMiloPRgI/FTpJ3+m73hMPGmkRxWAEGT285WsDAxLhBn6JZJzUBSR+NEMVl4j8iUXSH6o1lcy5V5lpLvRXwEb8WnQ2ktc4c6aLtK3rHiaDTIhT51VnzmYpeb1KnRqpVMvw9QvN6FJmw2RGBRFhka62arNAQLG0M/5A7haIp74wPKthFfqFJYeLXLc6FEWFDiNeIBUyzbJjsFrX9kv52Ic2LCRMhJuzYlG2eoymUGjMR7IGQlocEp8Mwwl65T9gIb7F1SrkSYVCiIsotGQBhitcw2B03EPMhRlVQ/YDrXt2sRusDXfj2ubDx8+FApS/fu3dvf3+/PRU9OTp48efLo0aMnT548ffp0LTpxHUJ1sa62rgUzRmG6RWIuRmX6B5VM2QucOVpHu3SBsxBi6lkWClzYXMJmNaVphstACeqiI3Soy1UdLjQi+DFXW79rgtR0NEV1bQyGz0iLvBdboGvHpJJil/2kFK3TQ7uj4d6ZGE5jOoSRZDBxIQAKnTtXAtmOPKnP63j27Fnr77e3t1+8eKFOdErFbQa1+/fv7+/vHx0dnZ2dbW9v1wzrLmkcHx/fvn377Oxsb2/vo48+ao2exZGoMsajR4+Ojo4ePHiwv7+/jnevDg5GkmsQS9Uou9a1GeZBUDYQShyt1j6IESBMFbIsVR1Gsm3agCrr27g654w8VYM47BnF3FsZ7SITLqQxnOTCxwgqZVNxVrghac7pqX/mrEofZidAsXyyoEelnKr+q8cqEqp4QMFU9QLVSlYmTc5+qyMJyh+fwAkgAFCEmWEpP1Qgi5J648uiZDNCpZ7GBTZFtXM3FTnBnqSsJMRBxs+38fckM4qfSKkywaoa8pzRdLAgTTmXqPGYACBFPI0Ta8Urdm/FhyIYg6ejqtCJcCKuuJUhVhCJ92IiOCsewqmkEM7FukJnIwfTim3nontmq4ov63HN8t9offn0SQuZEEYp/FqEEdaSltBLhxQElZ9CiMDT+KbDR4CR1ZKWAkqG0DYc2L0gYRSRBk66N+ZOjKe4jKSZtdK0CdpWV0kUpbNQfBAW9Mwgs2bKhFyEAsGJID/apkmZUlZNVc22pOCyPShrD0WUywMl2XrElrJo8GND8z47A9+eEtdsdmqy7NkR2qq+RCKmCEI1F5f+VLDGfW2DJEwbAo7ir1qNDDnCRrwV73KpqzIsB7W8sIzvaLzUxYSc1Lt2fbc6VctJoXM3VVGfyOhI3g9HL5S7hOaMXeoxT8XE4sMGW6lI77NrO2JYGLCG93dxcbLiG9YI8RWOR48ejc8/t7e3t7e379279/Dhw+Pj4zVA/EpGjgtT9fEn4hIxtRXpPBfDYQvMZ+Ya04aEjT1Nj6rsReT2RkpGLKEs7GVsrbU1GKnKxKrulK9sbHDh+97+ESF4UW6c0HK+s9y8fvyaPJNoivSccfDGCwnmOW8QqEz4q1ryx8HQ6M/Tcoc6Bnek4BBwEQjlKk/q8zn6hXr39vb6Yd+tra0r05QoQu14jSY9vDt37hweHj5//nwNEL/iRJgZRqwFobYOVFrQBht4iI9M5m2OIBu62BMLL3bkZySMIjgRr6iyIwwKAE7OGd8ooTd4MU5sYd4+z9WlyhUGkNwPRle8qFdrqEZ8maAgoHBDUgs/FSY0kjv4pTnpKixVekHS2znkxYi4cDX2IkIQ7SltDV1GK901h/WbJj3K7qxU3APW80ADDnKpkg7TI3boE+Z/NV4sc7N0JQkVFQtPeNBTjIgxYuG8z0BJo/27ATO6+JoIPhIOFsPVRW3lyFIs3hc2xR17Cmb04fJI2lLv0kwWIhY6K+iZTeOaHuZIwV+lD9dwksp+AN4wo9oZMNK9AcToJWUG7BTISyJRjLTYm+kjGQXt7xnDD9KW1K/d2q9d/rsGiHPwqN5xSRGxqk0TVFRUhj9rLWk0+M/FjmhjbK7htMY7pfpCigVRqvhdSkQotFDbHVpVbzcRk9CmNKk3o69Ag1wMD5rB7sg5Tdxe+al3tjoirji8tUOQNSDaCWIRJ5gxSmmSQfpwa8JGE1qpRBWVKHSXBNn1By/G05vFOVhjbNB9hxABMl8FjcLQnVyXDLHkFoKq36Qk4mIuecIDYY6t3OFESsrbBOkPZTJeTqwfuC0UiDJSOcUR6FWTSGldt8zLMnm7GGVG5Lu0yh3RA9M/WfEGHoKEJoZzYiiMxbvgibiIbdR6XOV48eLFomIRm5ub9+/fX1+6VYfZsSNvVcssQRQdzjksJbSnYwpXExOEUJe+mbf90ZilLmEbXnbJpAbm9JxloNRwHVrwvZcNuq3c1TPCWGnLWro1fl56YiZRjixEq1WZuD4D/c2sCypGRDXUvmFtdLnnsl5Tr9l4/PjxErpM+/v7a3T4OowoA0wFIhFcShvDUcKeP9YkZVViQoLNcJQRGC8kpzZaBsehsv4gNK8LExwGH6uwY5w3p07gZowLbiiqlJ+O1bItdQUnSCPxhUmdqVBZ6dvpNYzg5jQlGlBIN4AxfDsEDFFXwGZY7M+YkNsO9YP5q0lsMIYMzb5o1JtRTo2beUxNOvMxyBgpQtu2cWlaQc0z7eVPBaCXlM1FYKu4yH4EMuaIy5AuIsiGwIlxQZdQBBc2BEg1XnPB86lVjCCcIvUG5z6GSCQVl+O5jyxc5UuwxoFfp/z3jdTEBJuPSs75rTzbzaxVE5WJtPSVFEoLHLMCVLfs4Zo+ZNaJpnSgF8zFJqV4EFKBE/iMRDxwl1Ma1d5Ns4swOhMTcTRJC448HN3PxS6SR8GJ0Su8RF6guKrNk0zlyARLZKZ+1bq+X+V65gUjG0O0iGey0jQla85t2Su0Jss+84rFrJrOqUiF3ppIvIpPjYznvT1Tuu/JquvFLGXvzPRDQEZKkwaCWZU/VeUyBncotZ2EgVc75gmcKniYjFrFkbO8UFtuPr8lK389rmTcunULWF/vVzxs1ZRyaH1jBbwLGkKL1xQWyaimkxBOjDNZpO8U+3O5e5unOWfUKkCsRpq1w54gHVO1YgZz19eZeqPGZbbqR1k9u/7L1hsRtyk2LBnIqs54q8g0FzA+mjGajVZ1UEOk2r24oNWeamGNfPEKL/uCG8+LjrhlIoUe9CsYmpn3HYCs+1Kv0Xj48CGAwvRmPV6ntDjX00O2B2ZsHED9oWPxQKOVn+jt27HjRIRGLmaotid2Ld1a88uXFMZwBbU2F6vNBAzjXIx18QiVHYypZkhFW6fPBS2bbzR1XQ5KIyWppSqR+BjetGVIvZ7vbMqAcEHRhJHrdtQGXo/ZMgVLOvs3A3qpTfX3gJ+iRY2z6wSnJumoADCkvpmlwloiNuWlgGxQbyqR5oytCSKHyWYEHy8o9TmBiypBNntqVKp4apyBgjKMTWrgJd/3ZrO9+jyqs9GbLBv1euW/awbx2H2zEjZzMC6LBG5Zv5TqstWrmdCGPaVVTJaClNaLQ7GiMUuMKQNi3rmtuWeDaTtyjARtvSARG+fNMmle6VW/deRuoSpB0KfXzgUYQqgELaJFQV1bJRBqLFhxr6TO1XOnUjFlLTqzDKgwzY34QhnKdcCj4b3Qf06MF19LUAu+QAQ/w+B17UzUU0bxEA9L1a6X25D5XCzCglE1TLpGvUdHB79JS7BqvMoI3uaX2mYsA29ksbjqaTzRSu7WboBsr7zg4+YEyYqqeus67npcbf7ZsrpNLoCO9ZlZt714Ul0iAseYPkCw6vbpbG6Bkh2/OJcVLwdWSYrMfTQ1qf7v1TQfoMOlFh0AwcW/jm0pypJ7U3jfsYwvHUZbD3rl+CxGe6pBxFxV6SptV68aepcYkK1dYis/8A71qopqmHa5aifZoDv8qo6K63rueny+o7MwCgymYjhH49uC4MiEywprpEsLz7a+2+UeyQn8XOCJOMvKBxRvfUC8NKBSLBUsfslYcrKnucAFLBHnIBrmx5almT2xCWCENO3uKMrlkssQA2Es7sKr0xJvZ0FeNtnPFdw2hlvO5CCj3HYQnkQEZGxdT4W+qz4RI3Vt/samN44vNFXZsh3CcveDvb9Uu+aZRApDcbFZOjDmjCRQ29DrGRunWpGxZBdf5aqrWs8cs5NcSTzl5bfBrYe8oQziRvrXSoqs0fwKKVUWVo/ilw11LbKqtgSgOp8vCpTk2+E/TifQHCAnxqKZEhgQwXZfneVYIlC2xji2WOY027o1lP9bRlCN2Z6mAueByvCNVViKmDFKuGQaNUbSQY3swpdqHeySaJ41kGJMzpaKSWgS2rSqym86gmhhx9eWJVqlD/ucYF78qanyeZFLXdzu/qmfOQp2gyzFGbngjJIqcBDqWA1eSVZz5qrEhNcuAQOve6DikTFoZUYs81w4QnP1hNYtiA9Q4Fb0b6H4+vDhw1bJhdPT07t37+7u7t66dUs9UtdjPRaB0i4b2ykf7/E4YJdVWvH4xzmJeAQUWGmAlRW5w11oDbq0rdRkpSp+a632VT8My+RUV5aJOTH9WpySE6CW23VTRLVHl7gCMzEX/7eegetx/XNhQG21OATxZE1yoW9WDpJmVcKGYR2L5pVebkSGRoVkDjRwKFNFoyZw3UZzLbq3qhc8NWm1CZj9gbWssVEiVDUGkVGwjXAqqRVOJQ39V9SBjb3xrjgY5O1WgIKtmQhkDWFH2w7KdrNEC8MVrGi2FPuiHCYmxMdwWbrUf7IduWEkfmIS23FDkTuntb63CwBFmSFe4nZp7m3Ty2eJbc+kJcZxatKimQbIntNBwnuty2eM+KkXmTNy1d5cUzYWlPUPdDCvawsFh+/8YsMLZmJXEpSXQDxOT093d3fv3r1b+/3Z2dnt27e/9KUvAXj//fePjo4+B0FhzSDOYpnOEy9wrEi8FN3lxWOmtjkW3i9cYerJ6GjNYG8eElrXnZA6MZ4mETNnlCgO2ICSDWjFeUJq4a0gnzLTYHWCCE4E2kGwkuFFZhIF8g7hDqNyeYAsQFKQEqq8fEkQQmfGjs59EnNKr7not7ejqLXVMKGJxLiqlXAmFb/gBPQ0ZMEgFhFJaFRl242ma3Ux91SCkN3BOxbXCgQrTNx7EUxVCmNRRm9l5JKm4gW2VMwsZMezdvi8NAJHuGoj2wWgnIqnUyKW157Le3h4qOGwhhEfHR2pZXnxn0+ePOkyXl+P9WioodW219HELEkojsUlElXjmTKYoiVpLL0v0F1yLE7dQYuVoUEh4QSuJragckbT1WGpiTcwrOXbEXxreXi1wwinSAsZZQOuGxOu/7BCBy6nbTKBmxP6v27VwDE7143MOOuC9MP13FyP9RiMfbFRZaRSwVe3x4WmU+4hVnFMj+EncDH8FC7pbKlh8C1+TvE5n6kWVoiiNEXFuUgovWMD6UuJWTWaNh2VWoqc+/iGmbeEeJSm08hwVR8wpcyMUaOxN6uWRXACmbkoPGaTq15Y8AYSI4zEv5QMayORO8K1wJsQTkx67uLi+DT3VGTTEy8ZBZlUP/bas7Jz5aqJNd5o1hMz9A0WzjYyuAlSkciAhqRQ9f3qIEWFz6bzg6J6xLQTpNM2XcQpUuXi3DCVltbmxLhgOi8iM0aCNOqof8wY+Q4VFJTbSz+Fn/mYIgbcQJr5YKEu5yutDoTlR4US2K2SUJ1ATXG0PWLiYWVlw7hzbymYmhq6jXBr/Dlox7l169bJyUntl2dnZ+++++7Z2dn29vbm5ubJycmtW7fu3bv3ujvZvNFlbQQKQawGgPzZowV16dfVPxYfZyZ19Wk+F+MXXE0KRm2xLqB3H+uq1qIFWVh/8DkxMKVxYlxbR6HWnZpbbVZZmRpubUbmXUZCvvjYkKSpx5bkXnOkngLGX6vBr2NxJUOt216R+i6MGANrqPHE/MIFw+7PR7mxINqm7tKW4sUpZ3oUvoPJR5FY0pHLOYm5RGlAic3BoMDDFJVZN0gc7oNFeosl/cNJu81jUCbNzNwjeAtnciuerGgkJcFcJSkWeOqrt8gTrizKXsehHOHm77VeKiLPnj0j+d3vfnd/f//4+Hjt7bYePXgihrbXS35y21tXS0+28La6wOpzO8k7c1uV7ww4qe+YZbUuXh3KhgNQWrQiLUjgcwi7URstV5RJT5F2KRguzYcdOVplJZqPoUVFRIL9cABy9KZyuS7Lm85InTVsc7x4PdZjPS4jKVa8cmrmUzOfmMSAU5OGKE9rrjS+flOCVsZtmKQWidTearD+hDZ0bMFlPlsPJ+ZC9dpJ1oAvEJrA4Sa/JlLoS3A43+GIq0fUZWEHWhsnksbisAICJ6sCWYxN7Xz7TsyIn5g0gouW4vc0yWQbZdGCrdBw6wdcw3Tr3EdF09RFDi+lSfKtyzRHhOM2L4rLWT04uLq81iSC+/fvN9FhEVGm1IMHD168ePHs2bNPP/10a2vr4OCg9cWv0XhzGcQADQKRJaGvMm6aD2oMH4uDMBZvRHy+9OvLVYq3Bon2xUeKpzFNJlGvC7fPVSYSGlIssq92hEOpIKzsSN8LqpqAIUuKg1lI0Y0ijjaC76piSQ7str6mK09G74mPX6dQiFL1moKSfT2/gyt1uoxpXtZonPba+JDoBkAX4NFYcaz6ASrT3LME0RMah6w8gAaOMHL/wlwZsHrXem3oLuAF1DoZUjFKCmhOrYR2JtEG0jRXLu6617VdVEEojsU5Infby/5khBGcCMO72QS+ffCRr1cF9datW5ubmwVNuBgHBwdnZ2f37t3b2dkRkc3NzQcPHhwdHR0cHNy5c2cJK/PLHru7u2Ne9uDBg+3t7XWieLnbDnjpphI3F5YFzEwz7w5e/AhDsrPSizoArDLPbNO4b9s0E+cSv9pbYITXfxmK4ZI25DGlKTZvbCgOta7tE5POfeRFkm79pRpI4QVJr5uKhY+r9rYRPFmfskqsptJvJbNeQBujZ+WCuqMFIjSKZdtH9aUoGlpTMYYDdVBSt62rz/2anAmMVpRaj1cy7t69O2YD8OGHH+7v768v1zUbbAupSZAwaUqFEY9tV2zN4KrJBboAFf+aLbuXtqA28RjxU5POfGQucDBFyrmBNK4qSVTt0IXClz5m44Lr0mnAyLrUFcxldmR/lVXRCqfGhZXaCB5IZz77nIm4GF71oJErgYRxYbkuq4BRnkktW/GR8ede9za0YOstXvnGY2TgUfowhDdM8tJPXmEImTMekfxy0UvF3q3UJYRmBtefGyOqLDXrrNdrZTw+Pj44ONjZ2am5sJ6enh4dHW1tbd25c0d/s7m5ee/evdu3bz969Ojx48evb/77BgPEIlZtRbXZnMY3kKNCZUL38ZEUJnUeWQMORbRPPJNBIMWxzk+0xtUeki55Viseg3kLjRfxNFUypnH0QI6iBrRTJ0DV0sdk3SseGLVoWzjTggJDzzSCa55y+LKE1kid9JGwXQ8OuUlr9ROMdvpfPAWJ4JuGgOp7l9IW6b3NUIbVBxE12RupPtyz9yqdScX7Nkg0Ep+IsfBObAhbOMKpxASzviwnRqWM0lGWcdljk9IWdeDgSmGoirzwqAkQ971SjDDTjqhjCmISMZOsflO41UsqNn8cso1XBBeJj8Xp00FKCmPFRI1nU6VmjNCCLiiM+sYB+6BZrzY8Jb2ukfLu3bsnJycvXrx4//33a39SiaUwwdvc3Nzb2zs8PDw6OrqGid9Ia/UmFL4eKx/j0UkK5rTTDsx3apKZjypxZEVsfPWwjuB1lY7hV8j07LfFW49wnsTGJb6OEZPhbR4ohGt2lG9gMJLo6ok5o7KnKpCkr4ICjWnT3Uhm6gz0yn9OkBrI3F8WFTecfjGciKntQi2cLWWyK81qXjBnxZ1iAjenuLW07no0xkja1AcffLC+VtduycWwJZ0Xk3jb5axOzZSRppxcBibFYC+dq95zTBp7+ZCCiiNXTOqMRvt8UW3G/YlxM4+JSc79RPEEgJFJLXwXuqrFRbWG603bfc0V4JJsdaxwYpz+r94dI5wY14pymAs0UHUwoLlh0pe1fWD3J9RUJlYbWFe489kwaQ61jx0pjUgUYX6159dy/b1g5qOpSVreQ0jVcfG1GGdnZ7du3drZ2bl3714tl9RceG9vL/zl3t7e7du3j46OrglAvFz++4ZrENMIrXhmvd6ozuK8QIfsZYVJXZgeKNKnDEEnpol7Ijc9C58zX6UqZ7lLJrxLPTADtmKIPkNm68uhF5Mwk2LIy5VQYVkjFcVhdHN+W5fUmjJA+EfHDCBue1/2ySmNhdREeRLazhpaLkBc5Cf9XLP/+F/Y+Udf+bFf+/JXfu3LXx4OZtVUv4jeUr0pxhRwoV/Jyq8qV45LSlI4gRFDyVIyIDvoSLw6xs5pG32jPhVThYYt4ESENJ7GA7Xia0qjkkNdkTZkS3kaLoibYEGaUUoDeLeIlnx/Y1qVjwYROJZZvpr+RfBWfJTLShAgUeiLVTcrXLBNu2V7wxEAR3h2CVaTkw/ehOPj44cPH967d6+VUXt6eioiW1tb4S/feeed4k/XbYwUR17Th19ZMO6QIfY5aDWj9YJZICusPjMzH0nONh2TxU2NI2XGaPCVEIlz8dOVnODM24ZG21IfVP2AxBuinSSiKn6rFSN+8kdv/rbv/Pqvf/U3r3wOpDQaKMNMaWLcIGzKPDZNWpQNnQb9ST5VRl/jSuHBjO2errwsaoTICVwqpmZxrDKaRjgxnPtoiRzaZKLbtu2S1vm/WqFRGSUK8kkuYRNuQiPBG73UPCsG+s0gnJia0RBmtBTkqhGVZ3zMw9s1YngKdM98ndP+N2SM7MKpbR7W4xXG3tikSbbsUEQmJk29YVVAD8IN45TiwrHgXfsmuGtMjIu6HzgVID6XuKbEumHS0SGVU5Oe51FgiIy1wLOPvPHXCG8gscIbSM4Z6TXxpSt47wJu3NwD/UxMaFJSX5z+yrd+5je+8pu+89Xf3BWXJ3AUmcGutNODrScyNe6lvxSwHosE3wsOm7PLm9+TZLwBF8ZZu3BqhtclvEBkapzN2e5TpCltsnh4XBXn7uqvmgoqPn78uJnefvbZZ0XyW4zNzU1tvT07O7sODbXL5b9vukmdAS2oNmj9S1EBkk7Em9xuq0EhQSFvasU3PzNuLwkyamDBgNicvhRuoxVhrCFKFHGquZ9zPVIa0pQ2NTC++5lSGC48Yc0o0sy+zLemRizfXi8mt9EkkYpqTUiSZ+ZjsqBMTEOQMiTOVr7hP/4XPvjOV37sP/vGN2aBSqTJIdRBuY+eNkxFALv0eVNZQF9CL6nrMHdloBCiTom+KgqR0OZU9wzWVWK7ze4OTc7lSbvhVEeoJonPC9qFQ924RRnd8imo5YsrWcEdIRJxddEgVNxn9QeV547gjIipZO/M/5NdBQMjjJGKwA0VM3RSKsrf7ePc9ziksiqAuG/qar10e3u7VVNYq5EqLhGOnZ2dg4OD58+fX8Olvnm06/EqU1KRqNGYMgQCQhqxr/DuMKCQg6KugFjxHmNTidrrYjgjviVrZTROTN+IuEu4mEgbGUtx/GNONWprEmq9GjHcz/2Rm/+dn//Fb7/3O/pWKiIRu2hjYwf00M4jbsZQ9bethSGT79xUA2SJyIScPpwLCoXbwrrKRNv1Lw9GuczNmxIjq4sYoSx7kK2mya3bGwbiUezIqwflKWI4yUnEFFFCkBekGUmi8qBqDTt33TBSD6O4CKc+7/5hweFIaS38SpQoPPASazfvBcb29vY62r6OA8G/qXEijoKZH230imH8J2qTQ138yecSb6odmQWnSLyYl37S+hIvZnxBEZkhmP4TNakLrWK4gODPwCloMqIk4uJPf+Vn/7vf/eqX/u57X7N5FEAG8fjwZehFUc8Z5Q2uow6np9ptxskaLHI5MEFqxOm7JkjnVTYeMkniyxXb9WJmAfX1ItIN5z7aCOjMOqcBvkaoMURumPRlN9OZ9eR3BSx2LziH9asoBo+sxD98+FC5wFtbW02AWDtmmjXR7e3t4+Pjk5OT6xANlzuGN3rfM2QGKlZ8LRuMxavEoXIWpNqxXnkvvBNjjffeBDFJ+ZsIlwQMeMFVNtmtYg4UeDGqIKfitk6MK0HVrIDZncsZL0boUhrkcGEEB6HBcHrZQMRUibyZwWareaFUq69Ja3lEqJtBJGL1lMcJVpa3NIgT5S+bKgHsNtbM3fxKaRE92ignvyzdX9kUIFbkVznAnvW/6u2rcWOt0LbohYnqCze/1Iqn2GDCwAtSsXFeAAiR5bnYnq0MKY42BFgTmrhXN6sLcBkc7gp6sXNRyJx/RCuciAOERCLGqvUERcAA1S0lvLXGo28d2i/A0SRiFcowcqVmO3/1L/8Xv/6df6o/fyf/oXVovfTp06frrGk9VjgiOFVYirAyhskUqdKB1Sumf/GZIGX2wDpHuyiIWbilx+JsDvXaRYT7595OzMqsyebeTIx2QS2cfFp4nwPudcddRl2A3UiSZigEr4Xti6RSJkM/K7oHCW2NiErBnKYgEUM4bQD6tRHLsHBemVQ3+q8hNIvguSUKXP18g8u1qvNiPNsD8ZhJE9bCYzgSXqCyGz5nV+RMf/FEK37jr0pWxdGkhBcTrwgjXo/1+Pynw5AIqaEPm3gQ9OiE23svJvFR8zFf7gmP813ByBiqPOIF1xN0wVhG/NQkjnYhTWRSDyMqDiMrQ6I8rBtIvMQzZrGpNdM0Gal5ATkOdCt0IUj3bBsQD2lylBa9aZyadJ7TvKxwYtLikFTT+aW/kMXCBE467oXJ0eHqpouFcMQNkyo6fxnPSA0dVg/YCL51b7Mo0Hvuo42LmSVeyeAGUiM+lbBlWQUxotdCVriaBX9/8PUnJycHBwd7e3tvoGL+ujBOtj3JmeZ6blye8zQzLULFGXVNdNInGmDh/QgYsdZW2ba3zjA7pZfmFnCSW8C1pGfqRTY+cdWNtRUWav097fPsygm96eJ7eoGv4Z6ClLbnIAPicN/4d/4vT37vz//dP/b22//eH/tjv/Du11uP1ovx7YIAYFfhG8oqLa8DM7p0S9/o+OCuNbSunl8/TiQxp0T58YmlViwkcNStdTylgdVP0ndTCgHlUqshFbvQVLmeS0FRco/gNbckADKB0WmNloViwe8Qcfl1TsTGozuXVzL+2l/+lW9/8o8GXxbWS9eJ03qscJgykRgPquKckXRX+21BIh76TEBsbiNnICmXN8oI88BFc4yVkIi1lyhC2ajk1PtutEu0ERppRU8HmmH/t//On/lnfvDD73/hxp/6D/7tkXcwpdG9SrQ6sxTPJhFVfNUtzaK/YCAGF5/SPoZcRCHh0gObwLEEDiJIuuDRho9JCNYbcCJuTjv4HIWv0bawQQ3NxTKZ4NN0i+WJOQGIqK001kjxeqxHZ0IRI5GMwFj/08aQbCtEpDcg5nY+LsaSlIgJUseYbU7atQ32jFHcaIhhJRXiNLfdU3T4pZ8ufemmxmmLoan2MbQloT126D6XIc52F3G5ZrdczOYV+Df+j/+P97/9yz/8wo3/8N/8H/7K197pyXGwggSNEySo7iUmCwh9DNxokahTFAvltLyB9CWjJjQJ4eVhxKMfKDnvOYsVbKS9+u6G+bu0ucoPXM9FbvoUaVSqTCSpCFlRawkTZC+Y+XijIYjMVw0LjMyCdZydnd2+fXtzc/OaSAlf8VgDxNlkbWUBF9PdgipLihwmrvWP6PPZho3SGLfUEdU36JqB+ECxVHm1qoHgBSp5kZVhF25TWHz7zJa+RU8z/ovZoMrq4m7rPbwZTKxqrWiwgH/nr57++K+eisiP/OAHZPuldIQRNJME9Qsi4Rq3r5URqxixAe2yS5zvpdJ4juJKZwK44+y8jXhKSTz3hCOIxRhnOtPCa6NYJ0qfun4feVpwTqv7J5VjXu4CpjQxuMReJKGZwDvR02DrJVURiWIGaq+ADzSIqxuRCz3VXXPy8sa/9j/9577//Sxg/5///N/61X/w3zRfc3p6evfu3f56qQLHzV6bVmHi9ViPC44mNDxjNIV7wwVCfdVLnoJF1XhUoXjRpfi9b/+9hQ4y8baLP7XAVhWeHK6e1kjEi44ZIwgXers2Wl1kJhb6EsV/zhhf0pxZlPLcccBOctMOA/afvXap+4rrXTu4PzgBIow1AAyfCAhouBYTXo/1GJNZLLSP9YK5jzZMiy+WSrjOXRTDj8GFY+N6VNe6DizEJdm9BBV+X0b8tH4wqoruF10gKDLNXeD08DaQxuJuBOu5AgU+VzLsF9IxuRh0EZ1jpI2UFbAt5/r1X/0vt/7Br4nIF7//gyncrK0EiBIauKLFUIUQ56OVOiZIKdFCR4dFXnnDzC/1fGc+ml6MBRw45HBqknm3VQYqkbGch2pVN6nOzAvuGSamRtkutWjy32Ykbgp6qMS5xCLGT4lLzoL/81/9B/91z4sPDw9PTk7u3btXOK/qD2dnZ8fHx5ubm9vb211SEl3SE6/ReNNN6gqpdxIEwm7EvObJ4pcTKejDGVoUmpikYlqfihprNezN73kgrXh1hxu5VKoagxGq+VsuOjE+1GWVRWX1mu7WPCt0udAbK+dlFlKRa5XmEBEDieuefpmwRkrrBbF4CIFVdixSxLUEVEIuw/ME4/k7SvUFqAzoAqYECPTv3MLMyvnArc7RejFe4CmEOBoDcoi5rL464UOjHxWNYgTQgBG8WuhcBCBGpvKxDIM7FRuJTxt0J5YBj5E4oxaRwgk8KXMxRrwVrqQpng30xPHqjOC/9vXSv+ILX2gnTSjIe3R0hMYMy+hYZD9AXFPrf+Xj5s2bN2/e/NzE7PWQDGAqSlMyETeTnp10xse54PMbD+kVjFwB5rRTXHovoZKL+5kjRi697f/iwovloVZVJnr2QrKkEQ+8ejnAXdlMbupLmGv/9Bm9q5k0E2MMkIh9myraoiRiVIyjfSRjedAUSb0BaNck4kse29vbhavt6enp6enpWoz4tUuKLwBsXShjwurepW63Nk9Uz33cKkDcjJiTJeMyBJnYva1ew0KokCxkiBc4ndaeRVzgOodeghPjLknjrnAPXkJxFnWgoOI9sPROYor0/NLKrrUxY4RFJtLMx1OTFLfaQCZIZj5G5+X1UyMvvRl8kidI5wsC7q373t47VdGXUBfoduFyivDVa1BUs+ABaZezszMROTg4ODg4CH9/cnKyu7u7s7Pz7NkzTXjVqi58o9rTvXKHuovkv2+6BnGxW1VBhkjElIAXdSdqhBSx+aI8yX+znNp2mrmNlUTgZkiwWXYnEXzY7F8oAyg2WoOeC6fUhNbTkEqggKm+TM24amAuqQ5mWT45ETEdi4KFl5Z9eZmIZi5yHGw5jHyueOBpTG9Klgkr02gqZSBGvJfh9IAjXqBhuzWhXPlitmjp1hMJo1icE4Zs05EHprrDrAIrVCpWLjGRiBGKU/USMVZKc79IfJq/nVzeHs3kcslY6SV1NAKJ4czotjVH47vvjAFVQ8YKY3ETtX6keIFV4/U6V4o9KTEJ2y7/Uj+FBeaDIMWqTOrax9bW1r1792q/1OgY/n5vb+/o6Ojo6Ghvb6/45ccff6x/ulbr/N27d+/cuVP8LKMdXdfjdRn9NMZQWaK5IIyXIVZZiUGYWPflM3bSKPxo/NITc7HL8WFb00gLb3BFuue+IXmREhAbXSH8utzCOKedrOIglfSqRLNZoFb5Rj19XRd5CRJxOLdN5wbbuJbmtvaK+nqsdjx69Ojs7EyNbQ8PDw8ODsg1KP96JcU0wo1chpgiTT1ZjsipByGnGH6Wu1Z2fdiMdoo+M+epScNYTMGMkW886lzg9JddA0ssmBC5ISlEzsUa4Q0kTmJSCrn2risfm2TWIUbsxaS0UyQiFEpsKg51VVftvrO7DA80pYqjJE1nMsQWfoK0x6pniUOBcANJ1DElNkzSdR0Q6BQvemqzZemuEJnRDsZ9dlwVPdmFJmpCQylpW2h/jZUG7KuFh3NGG0gXsU+nyGKR1dHOr7EeV23s7+83ecF3797d3t5+8OCBgr97e3t37949Ojp68OBB8bKjo6NrkgtfJP+9jgDxycmJwvZd+EXRwnx6evro0aOTk5PNzc2bN2+O1JBum81Qbw0HY8UHU57hXj+kD0uuU1zdm47yYmYGyBq09bkb6dw0+5JLG2nPfusrvSAV42mU1QvDUFjKgKT3MPpLn8m0SSomEl/rI7DwXVGtMI6zCyacBe9Dt44q7xCJa707zDSXK0RLtSY3wraVF7X3D9GXWs7OwOf08PYymCMMxpu9FhrTvMgmJCQRN2v1Ft40+iwjeCcVZndKY5EdSk4bZ5KH8ITGg3F+LyZwaU4yY+DVzuEgV08glcU8fKHALskFT3gikKCSVAzIDXAwnmlpAUJ1h3MVH78MtUZJImaU98Rpu3Gqxr5s22+JGPHNPRCpki8tT81FQHIPJCvC2H33AqsJXjgUIA5/f/PmzaOjo0ePHhUhULtstOPmWgWUzc3Nw8PDL37xi5JznJsnGG4I3kyJjLOzs6KLqnWE+6TDw8OPP/747Oxse3v7o48+uqQrltMMPS6tI7JH9yBsaVc3khIOG84rCMiC2AhjuKRhXsoLaxZb0EvWsQG5RBsR9QBMGLFA5djA6QQr6cNIAnWjVY2iLTfkp1/wgqDNle5zMGI4Uvz1ozuvirFebh4E57CyHuNC7fHx8d27d7/4xS8+f/68P9Tu7Oys+cUrDMrHx8dPnjw5PT3d2tr68MMPl7u2qCjBaFd+Umfgsj3p0owpEm/hf8BJz9LRrMh2FORaZAw3kJxLvCHJsm0iQWIinCA9Zzw1ycxfkF7KzP8NIT6QAccsJCZau2YDvq0RTodwzML+RXUv54zYuQ/x2qs0EUeRVAC9xRdWGYLI1KQQPzEpghOJ4VQVQa9tsIqaubeaXBthuhRE2LF7UeQX4/hgI2eFm3Vf1QagYaSBt6ptBhbP9yEybeqKVA7Pb5j0h32uhmg8XKuSIV7uptU2tKuJyH4V/UB+aDca4o21SFcssFtbWzs7O8fHxw8fPlQo9uzsTFPmjz766LXOf68jQHz37t3j4+Ouv967d09P7+jo6Pbt2wWUfHR09OTJk3HQeKUBpGPKll38VkrB2UkBE4NkaeOo0HAqdjnFd8k6Db1234fPlCJNOeuHXsR1mETX8KlCrdgTtd46gFacInFKGm3iVsgkkJwTk3TIQaS07E6Y2bZ3dzRF+WiUNoEgqdeZoTfFjyMRjwAI6hiBzWimnUCAo7WLyBBDGF2At+UFRuAoBYm4lB8SAnREE9zvP2vftlmByJxLM7wyHLmrRpILp7A/NnehvU5M8GAw1eJHW5BQMe4wJ0/EWpYa4qnYlgmPbIc3gdPjjOFJScTY7NpmL2CZ/GebiYRS0KsHbAY/L0DB/v7+kydPjo+Pd3d3P/jgg+9973uHh4cicg21/Pf39x8+fBi2CNXahWoZ15sJEGvPVG9Myebu7u5uEaCPj48PDw8fP358SaVySumjprHgah4gdaYOSDG48IlIStuvjbOclG3qDQx71RtphJfE2tU8sPQ0B5MruUNcEYYbXqelGb6mDdz/fA8jvCA+w0uwqrusybaGKseNDz/88Ojo6OHDh2NCrVTxzfW4SFC+f/9+eKkPDw+LTPnCAFz9sWV3WQiXXIOsAk4XRYc3kHCoxFUD11rZl0WQlcyqLjuwDUnTwBhcdXlGHl5TgNgTM4neghPxMH2fE4kTcMZIr9VUXAw3oy3kKTBucWOWD6rlEqcmPa9yaVG/nulgcQ4CvXpdGDEHAE32L9JTrMArT8/lfDRGfBnhVWsGXPEjs8CY0fY3DZvcJ5AiTatAyeWGVZd5tSSP62Yp8Pjx4/fff//u3btPnjzZ3NxUkmuhtvT65r/XESD+8MMPP/jgg+bvtX1Jr7h6C4rIs2fPdnZ2zs7O7t69e3h4eP/+/UWDYh5o0bNSW/GkSsVlJnWReMWhtEaUQ07iZckHwcBHQUYaPgmJYKMwfyR828JaaBsVnJ2elbqVpMm2JFkBa6+tgKy8jcGlC8Nelwa+Em/DJCo8QlI8UOgbGGGBsoX04WXWhaGYTIIrXW/G7wPqQh8dR+FojHiLrBAdCkdG4qxwJtYvEgUyyyDCEwUrtymPRREjdFV7mZGXijnvONxCRXAi8VLXs0LHI5HQeqmrLegr9XLVJnlKa6siwmwYqgZ4EK1wKo4QdagrpMRao28E75ht2Tz7dD9Zbhal5nL52o2nT58eHBw8fPhQ4cKtra2nT59eQ3nfBw8efPDBB8rEefLkiYaYrhe/sQ57rdIiIvLJJ58cHR0Vt/X+/fvHx8f7+/vaYHV8fHzr1q3bt2/v7OyMFNuK4HxmZzqIH1lWa6EK4TUpMxDGAUzZsUvmpJeaUce/gmfTwkcXSHu1/UIbemLjQJkFLiIXHP7ClEkLfxF51oVw7ZSAjHKytfCq0mPAxC8Q4C7oU7dUAnZRn7pLGimNF2vFhW1eVryBubjexQVJxBdUmViPazj29vZevHih3bXPnz8/Pj5ujSlFLrq+YisJysfHxwcHB9vb20+fPt3a2jo9Pb1169bBwcESHG00dBsg3DAJRc591IM1xeLGLLkhfViFd9yrITYWWLZXKFDVCbgUvjY1ic290yHcEGcK1leerDFgz5z7eGOE3EFRgPNiclMvbQiGMJPp8IsTVDvS/c5VuvWQujdOfor0ZYfar4W/SFyudeCiBChXIFLcOM1XHJUGc0Olb49xe2ti7mnAbhyeLDmveQkPybZc/vXWelLucC3P3dra+vTTT1VoQlHKe/fuXROtxYvkv9cRIG5Vijg8PDw7OyuYSgcHB4rQa/zb3Nx88ODB0dHRwcHBnTt3FpOFDlQIyJIXgeqzCpENZAZWPW2DYyhOjSeEFj5CiiBuFX+CjDLXcTRpDlFl2NzoBMBTevQS8rwac2kqRlEETUEZsqWK7MXUEvjwCFVl2BovEEAmcMtVz7jw8qV1XdMqQIwRabOvRxIkPpqMCP+qFl29iT3+ddB8D6JLO4udR6B50hVmanrTKDSI52JzeqzMaVUqIdxzTJG+lLgxl0Yb5K0my4VaOxZnOutAghLalAYVJfH64XkBqahK/ZRMzju2wimcZE99mtAs4uZUKXs09NBQ3OgILnpNbHNalQR11VWDV7Vzvc6JqwaOwb7XNzkXbV6Ws7Oz3d3d7e1tbc3Rzim97xpkd3Z2PvroI/VwCBW4elMImnHtIyoulNDG1dJpa0pph4RQu5SIx8gQqxPXQmFoAjcv/VUydqoTiLexcXLx/tgRI4IfY4NpLseOtWvzM6a9VLuXiKw4B8NmIlRQUNuC8iifutaSvOSAfny1WskxnELhTrDSqw2gIpFgRu8qh6fNKiax3sc1SPz5GIXGlJYS16H2soOy5MqSDx480PR+a2vrwYMHu7u7d+/effHixfCGFRIjTb2lAOI1eVOTN9UgznR1MwIp+qPkFKnKFQrSHqEJHWqiNQYjpkgTDVxy4QJDk9g8WV1sBdLm2qLMBgjAG0gn9S5JltBYrtbItrV0Ytzc29ikSW/mSxFIwXShrXbwaNDvuNTOC84Z4ZLddlbyWROkrE0MDmso30Bixd+okog1iTtn5K8TNDm+3wjZdGWzyXvp+9J2ERcURGv8okkiRhUO5ueiFBwuvLV0+PHjx9ewg/Yi+a95LW7JycnJ7du39/b2CuxYa9QhlLy5uamXQP805mkpXVyY5ateTLE7DzHOGD4oe2blwVqvi8+NSn1Dem8oXEmBDteePiOcBK5aXZivF6Q5vdeJSWk9s2g0JpqmtMrnCg6btYX4gkGlqTygvCffZuqK1rcLFl+zxiBffcvWmCLbjMtXWTj6HGsTDtVSfA98OYFrcmlVriGfHvW3njNm21Ow1M4AHVGthCSGThwFdd2OUyNlR6HSE8zcEZWcWJMhphFOkSr7uCgCIeshyAwoWI3cKKUn2DhsScUm1VItcw0KroL6dx1Ga0H12o5nz56tHerGj9u3b5+cnDx+/Fjh4MJ4ISzBahQeGXaXGO6Srb2a608E3xTWH7QOV1C4eI2V9nzkMrKU1JtW1LVQ2rFgl1XABenDkpeQx79+QIQnu3o0gSSREbarCdHM/ZKQAUR6Tvzit6l1FrW9LA2ijH+9AkIkK9AHDx2bFx1xsRtfj2s27t+/v3aou4KgfHp6enJyojqYxWu0U/jk5ERFJ/tX7ylSU+5pRcUEbO6FExI2N0wKoRMk3rYmbqby+pantc0aa4FAM7SMjFqN1Dhk42IdPKhzyApLEjWpc2+JyzpLKhrEfWdX9BQCjODYAdmYxlePPGCTfcWSQUYnRu13RjgxqRW/gdCnjlOTLvctE6QaN6dIu8BuiEwbxd0bSLoS4WvYqVnbtMx83HVbxt+vlCYJIuk0v5L505eOEbo8Z9TlK6g84kj8BtIoT3sLOL5YH1aO0qzHq8p/Xw+A+Pbt2wrPF7/RsFejQ7/zzjvFn8YsdsUSXEXf0JzKCP4zJGwGzy3meW0zpc2gz261nLBdHi35avshpzTdFi/l750YbcB3FRRs8KEt1X5ViXXpnTdKSC7okalmsHNvKZh763z4e+bWf5VQrzwyBElv1yViHmhHHCGrkb3xmu5ozvo6V04QsulJWv3vLpSffVSvNL81bEMrVCWqc/mlUkCLaoiqglRiRSbj0NhwtApJ95vU9WyDiqqMkRKw8IEBVPVCqXAninA1fsOR0LqKIgqLB7Px8BbzrcTZlWNlxU91k9cGTwBZw1ShRIwA0koJL5nWRFX1BY5Gb6WjSQlyHTIvPXyMDArhODw8DLUU38BxdHR0dHQUCmnpZdQ4WwyNwktc4ZWMCdzKBc56GLX9gJQNTC8ocmX6qoOQK4SmAyYOT3Y5uK0fab2Cc7+e66ep6uB3XbpaE0kMZ8Sv9kiKiLPyN/YYNtor0Y7oqhysxysZyhpe9F3qa3etTuTs7ExNh1S08OjoqN8s7pUH5aY01kJxWbG/DZOYemLT9EzLMiYvSPLcrQcUvp4jpAyrKsKFjzzTIAbKzs4wsVQOmReoG955AxA0wjiHX3swQQ7hbLG4aXfvi+ZfasCLZa4bN0wKqEMdp40JE1zP5dEDXNq7IPIW5kvvNGbeejHpJZgNsC/n7jkdP6lC9jW1jeHO344x7xAgRtuU6MKIm4qUbLuqKdcesNc0/42acfHo6Oj58+enp6dFpNdq5AcffFCjDl3ZnuPk5KToadX9hLQpWO3s7BwcHCiJenC8/Plf/JU/+C/qzxvf+Mkf+/f/PamogmrGhRzDEgKeEndWYLKuPYg34r0gLXthKIJi0w9lDRKKMRno58NUmtGNiEeG5S33gAMiUbVG2mNeCkgtz2LjMZaKqix66l0CoRhHM5doImmRPWanA/0c7brNLhFFjDgEYq8Tk4bGssheI5Hxvb2fsMbTg4p0Q0vizbwiV4xCvb1IqdN6N3uoSZ5o1aBQD/ec9+TLyxt+Pss9QZHYG9AIVXaTmU50q5IDvIipntScNhE9X7S2jqAqheGzOrQRgQqMqL6Ep8mVgsuWTyuepfsifFbARlfscI2+Eu2wNiAg1jCmO/fZVeq5wgmtdFwEk9Xke0ItVLraCPXCiviJKeAPTpB6I4k31APTXBflOUJkQ1zr4XnCiI/gbBD+AnhdDQmREla8Ea/T3oAUODFsND9zNAUuFcxlNdH0c0BeHjlOT0/ffffd/f39e/fuDUoMawRUCaOrbBc6Pj4+PT0tkr0aIeiVZMi3b9/e2tpSW14dGltbI+/x8fHx8XHPMf/az338az/3sf781T/yh778L/2hlRynhTfCOSyYGYVxKMO5yMwvegtGolfXCK+EN22HlMsWUfIei8RfYr9/HuLhBQaMxI83147g1X135AoXG5ebRrj0quwNLzqf1YthpUPrB3apN2onbK2uEIvzYlKi61agw+hi+DiJi9j5XsagiHtNmDTXYezu7u7s7BTqf4Nw56NHj/qliq94HB4ePnr0qBUO1i7VDz/88FWF5tagrOlw07bngw8+GAzKL3/+l3/hv/9H9ee3v/kT7/7pf9fUn2iyuj4XG10jhHF5UuMj4xfGtzoet9QDBjNvp4akdC8zzTUnS3GxgCKcmtyUq5Wj+YFMer5FBdeKnC5zq0aRd9QQMSDY9ouIFzHiC+l2TUWdGMlPFGCcSQq0HS1hDDeQqpivWvuEKEHaIGN5EZ9zgywIgCwTRVN3eBGjBuzsu9RSMrFaKG3o2KrVBIgpRgADqiRuT17viYImpARwoxeyfnGEEE/pUtilyMuG7IlKDs4kniAhYeGkTYIJwolxMy9Rx4fPfLRhUvVks71V3l7TI5BiQTdQ8vdTIzPffqKKISg6YTIoyYToh+R+HvnOykXwzPGhZle0ES8suW3IYIGW2w2h3h0nhiKONqCiAQILhtx4IzRwi/ajOzF+FUH5TagtXyT/jcI/HBwcqNRvM3fVwHn79u2RX7PCiPjo0aNaRFxNvvT22xtff0e5qNG7W1mPOXwrfSMRC5GJwOdQl1S5okq5PR8hWhsjSQKcFhVcElWQWrxgTmuWoUgwzISR0Xw8A/PQfHFHAMtmPyi3d2oyCozWip0WjcdVe5Tza+HVsa1YWigoxATZEB8oumxqGnk1CUhUyd2oJp/Mzmjg8WeHH24EB5GJcYMNxezsXKncMPV5Lw4s/H1sXGG/k9vLkt0s8dbVTSlUc9pzxuniWn5ziXJmsc5t4VKcLLUZLCIc25j42f1S1H7UdyxsPsC89JLQGvExPKuTxGTRGRhhuVBMVIVOfENBTO+pC5S4LXwsSJlh+LnoWFkWiKqPoSwSG71gVQqVbw7t6tmzZ4eHh+piur29ffPmze3tbVXGKKKMNmM+f/5cTQb29vYKRb/LxoUfPXrUpc+wt7d38+bNVlH+yx4PHz48OzsL67IXHNOv/Oj0Kz+qP0/yH1Y7IjiAnuhBA/Gm9rh1odW5B6yzoAJhi64wbPMh6MeI82xBa2lSYMRqSddzCgBH5v6QPLAtaKP3+Rt2nNhFJ2jbAJctSC6wURk/ka6hxAYF8zVAPG7cv39/Z2fn7t27u7u7W1tbe3t777333tbWlgbcIuSdnZ1pqD09PVVJx+tgWKebBM1/t7e3t7a23nvvPf3TZ599puXbw8PDw8PD8Qj4NQ/K5u23Nr72jj7GG197pxWY49DufCR5M4aPx61CeQKSub6bPKF7ycives1ZbmMcthQzzyVLB6DWftTgWukrzxltIC2yQpSpbqrm8BN4J5h5a8RrqtiWMrRA0my5nuXGJ7wRU+MWpRIjz2dXsWHzRZdVV9newueTsHKi521q1BnaMOL+KlJ8A4nkibkjZoxjpG0fW947XGZWNWMUI+XYSajTxnc52SDDd2iq/DAGj6QRUVWKSBWuOs+CEG4EPnUL1WBWm3VqRF4JQOzfAJrURfLfqIjrjx49Uve9mzdvKmW4SI9PTk70I54/f64BsjAxv7KIuPJPnn5t650//e/GcJ449/GMnQlk4TSlONE5ohuSRPky1IpU1hCrCoG05WWVLzSl3jFrJbJcHGDgYdPoIgapt5L1wrtmhmDhjNBnywSz9QK1EyJFEp/Zl+UaFOP9xMUTBiiUcWqRTH+TbweySmyzQaZHVsPA/7+/9c9/56s/+l9++cv/+Ku/OYJP1OzOA6Dp2JFUIUtWsEKMxew0Me5DQhu1tRgurM4ZyVhvADVOU3xCy1zEoo9gK1YoU7g5jd4dljeo5XwblHAhxVMKykBC6wRRgzbbvGVdd+Oc0VRcsSNRHd7WcI2OsnNdyTd4u4WLRu8vlaKvNygST6LQcpkgndOmi9j4FoBy4TJRRJc57RQukHIuKfC1PVzr7L2Iz8B6jB/7+/t7e3sPHz588uTJwcFBzyuvLPfTvlplKmm0LUhA3/ve9zTmaj/pwcHBvXv3rhImLuqyK/zSH/vZn/ltf+Sm/jxnlF4OYGfFG/T1rEH8xIhQPBEBKY3JYcrLGxBGxqfeXE/avq8mkIPjL/zRm7/lO7/xj7/ypSIILqhgUCn9mmpLzbWVlF3UqPD6jNpVpWSdcMvpTsRS6pCkvJCMPkVSGt1zekHqzVov4nUfOzs7L168UB5uv0bT1tbW48ePX0n5szbU5Obk5GRnZ+fDDz/s6ZQ9PT09Ojp68uTJ7u7u3t5eIQT8mgblydd++9af/lORyfs4daMsMqOdQqX8AOEGknNGXc18sUmb64gTM2OEgSykMx7NGG0gRfU9lxc9uUhKWyT+G0jPJVLi5cxHuRYHRORcbIhFbkjyQ1hIRcaPeROlQsoqVTdFOmdUNCNa4RQyo9VAOUEqjezMC5yY//RbP/MbX/lN//VXv/SPgup7KkYYWcyrwHr1oi4VCvWinfvoLfgLlN3HqEEW+RRROWhcNCGivJToRoYIswBYnJhziQqysxW/AfdDXkWNkBR1j+dAQPcbSF8y7rmJ2nI9FedzfnpDCaaiADGI+Ks6ucoQK0F4YVSXtutLInFyzTqH1vmviESnp6e3bt06PT3d39//6KOPWjlTqna0s7Nz586dgoH87rvvvnjx4lI5VhoRNzc3axGxS1ypS4xpOFvpXd8SsSIyoXjAZ+U+5F0Cy7mjFFzRCkbZpBU3oOoy9VVWrzW+NWZH8I5WtLG098GLwpynVyR9sHGHbY0ZVXu6Kr6WizUVp41FGnjzngj5T771z3/nKz/6n3/jJ885yZ0VxJoV5HJoCHJV4eAWiI9jA19+s6qOupV9Eo1rRzrKD5/L+M7Z8miV3+0Ec0aSa4Dkfn3oMjinYOZtVeSosucjcS6RZKUUmfnoLdPePIL2S+FrSE2FZtvK926bhAmtyYQysg8xUimSA1woDw0sJjCnteIQ1BFcVifQOOcFSErZiTwI54l0OGPGQ97rcfGxublZ6Ak+f/785OREQVjJ6UKqoXQFrGFtFD06OlK38Z4v1Wj78ccf3759+9GjR48fP74aM0CtyzbbflcceVc05rTV9bZPa8JAInEEDDNo0oArV31tDitMV8VexgKZnYX30qlunxJLeAA++SM3f8+3f/nb7/2OWPw8Lx4vlGAvsW1SfYnmlbBwjqtH3qMGFmwgdtl5ogaGc7Ge16JCYMU7WRLttsEmzfNCaiSZDFTWK61U5TVA/DnJSPf3909OTgrFwlA9SUPt9TG2ff/99/f3958+fToYwrSZ9c6dO8fHxwcHBypSfDUH2R+UP/vss9rv9Tf9Z4Rq62rBkiIxl2iKpHhNWcWjJphpkjNdaoYoaGCQS6yW2igyY4TMIHqVywI7fuNonJgp+ovXZfiq5sOg4CXtDZjm4Rb2fbXV/5zRVBK9WpneoBJbwDh3SLLwU5E5JQYN/Fsm0bbIcBX1gr/yrd/3T7+6+Svb77Yus5e0tLKb5WKEMdJ5PkmsVNQQ4gxWHr3lAU0AHuRMYVPwiCnyklEsvhmjKXLOqJUrSuKlRJG4PM+EMtbrzc1DHUiORoQFL3vm7dRIJH5Om3JhIDXLFtF/QWScHyP7eUhxnnQPKbNJzdJ9kbZXmdOq45cLhMtrX7AmP13D/Dc6PT29efPmnTt3RhZCFa7d399vFaNY7VC2c1Ncoj9NrVnoXCQFC/8zERuLjyrddmDvg9T5gEEMaI1zgdqDgY9BijiaWlO8ZBRmLqA5jr7nnIstWNnr57T9zad6OlVEWO3pSiQ9NOxqSEywm0DEDpwxANkD8SkOX6Dq2pQzqArEk7lsCEr4WqbGzXzUXXstz4jBBAlJMaMWVrC1QqDBmNXCH8s/jbqPgcwF5owi+DmLTlztQwEFrUQeVjyNBSKxSbu/KxRYaHKrLytRVjZcJqypewVI8y6EgbanJsESN88/nOEdouS/KacAi4/NoWGUXboaJhOaGty9TouvbOzt7e3t7b3CA7h165aIjOmrLaLt6enpwcHB3bt3F7KgXXo8efJEk/za77tsYF8tQJyKYR009B1SSJVU1oq3qDQEpH5gN596AzOW5artogmjpZ9uBIWu5YaGVNe5vi0NrWYWuCPRYZ8r642DIFuq2lZ8ipYLb0E/9KmLKi9BZKF02kvWrdWPyUKuyIzFgBH8OqYEk8RdQRFoPWpje3v7+qDAPePFixeLHufOzs7Ozs5lp8BjgvIFq7bIeyMcQZSLuSdmEltxpppSSSETx7qzFkRSMT9gzItRO/OmW5BQ2TqIaLMmVFuAF3IRaGXkOGaU55loU2A2kiGMT+nDsUkpoBgvOJfohqRGOu2DGKRUpfMJ/FT8jNHUpM0kpRA0RDVvZotTkbiqDDFl1RB7WwSc0da8/oZAzMWOKGsAlcpKznoC3vVN6JlsXswsLwwoQcoLzhfZtrGRVs69naMkLswYDdaGZ4wmSFXTqZukNfbJQkUBpsVfCuWWeJGzbPuql21yH9W9ovEsWFbr8drkv5HGuSW+5go6gx49eiQiH374YetJavtteKoff/yx/uniXx3BReKLFTxDeQiPsJJaQZF6nqq6DZq6nbZlgxAxjYTQC2Y006USRdRJi17hs+ZXdx18IZI7GNQLKVtHS0mklF5Fcxmd+8hXMGIGh1q5tEb8BDJv6KaLiNa+/vyf/F//yPd/+E++8Nb/5o//K7+w9XUDXxBbWrU1GvG6/I/IlL7zEyQ1k24Eys4MVHR99+dDOIFbiWBTSiPCiTgRSWlT+mJKqMUcepd2XZ1Tb+M6nBI2n7au4BARTzNrI+UVJoM+MMhjXrbsyMxVSpLoVmjJbSDYvFvNaFcVdy4wdIS/bzyDeosdRKYmbSIXYV+bVnQLzfHQR9gJnEQdUFR210Bbm4QhcRhYK0e8WePBgweLpqPajXs16ahKQ7a22e7t7R0cHHz88cchbUoFlAfDrmcp32/hvYhvy7sSbydtzR9aVlmVZJiqMDmaGC6o6g3DnU5MVHSpjEKmmOQCShF8ShNhbLKmpiha5XKEETOoJGvgjfCyXaH/o3/5T/zgC299/+23/u0/9ydqaVgrLq/IOwUizmI4M7SrFppwq+4PVePTtBTOuqg0fLSiTUIxcyJZDCBWN9cF6U5Z1EwvwOCmyGBV5sJXIzP1tfDrUux6NMfIcKxCi6Ge8pXpS/QE5Z2dnc3NTVV2Lv56dnZ2fHwcCk32RxkjJK1v5HSUrNtuw7hzbwe3ql1ttVGjO7D3Q+CFc9oJSGImNhFbtDbq56tc7BJhAh0ZRMFlUcO0QmGgTdK3jtMxeGWY1Z6LLWxLWi3N9U8GjMSxCgQb+Cmco5nlvCt0Xy4K7h/873/rd/7xyy/c+Av/5h/6+1//7Sw9w03CCJLYhnrzBM6urmzGBv3Mip/AvVxF8C30N0K6a+8F6eH94LwKJoT6G4Xc1nIRbe7txKiBG6r1k/ZPmzGaZp54mXo1cyAVLTHabyCdMVrs0oGLKYgNgUhtj/zY6dG5OIhP13Ho+o36o3v//v0u3ajDw8Pd3d0rO7LT09OTk5PNzc3W4H3z5k3JEWQdx8fHGrwvXrIOl3LtxE/EJGJKlyqWdlUUmXXXT1pbMFpFfDF8UAuv2BbeGtewKGFrftLamjH+e9NAjdcTc28dzdxb3/DALYFISuJCxzyBQofFxgUOwmmWfLHr4EXkd/zqZ//st3/pR77/AxGJ4Qr+0Uj32xKIDFuG2t48Nbk8P8tEf+bbJ0DTQE+GtX44Tv64Hg7HlOacN+zoOCkkFHxHLJiL7SvDCs5zxbGQctsEfnN9lfpnGfiQK5dW6eo2L9iIyBRpSOtOaTStZdWuQSv/DY5D8xZQXQRtL4/Y50ixNJQi+p/YQje8dvUW2jEH+BQSmJX84xqWvt7pqAa1kBl0Nemo1lmbruiS9yKdnJyob62OnjpudRdewrtWOjEh9T6uuswhoaHAL5BpsEDcFJltPts2s3imvSpqofJJLLxKzw/19JXosGReYfXT98xCYxHiTaYAUDvT5T3KWsdXv/MbX/8H//C9b/9y2zbAsD3hN62n8FpumsFJBzbhghpGSjMSmNZZEd61eCmBrKaatu1wXW49qeUmicpEXKCdHE7MFaC2aHs0xh2heODi/9aB77UYu7u7AFqz4JOTk93dXbUNuOLRE5Qlr86Gx6w/j2FxAVSOcKu+X94O197zpwLE6hzTGsrn3sZQG7QFxAMzrJbIA1+LKutCyan0Z78iPrfqChYlzNuaQtoSKFRz2y7R5PbUi/nya3IMVG/KFE77hzbgIL6HH6bJxRe+/8N3/8Gv/e5P/ou3vv+yNXlpZh+Dgu8KlPej8H5odjV2QQskPjGcOrBBiimUYamhvkSIVI6ZZJ44ZxzS0DwxY8QhV8aRU3eB1zeeKi99sv5Ay+Sx8Bsm1X+FTQJy4iIarPNlA2itkyCboj3Tcp7pWNpeo0tGC4ZHQrxgHZSvYNRrESpg/PHHHz99+rSWjp6enoZp4WUP/a6uXHp/f//JkyfHx8e7u7sffPDB9773vcPDQxF5/PjxMnBw+QN1d27rLTVFkgYRmUkklLQNJqr+N1Jnm2K4bcGS4wLZYmmMlGZ349Cs2uOdkbnGCBC32IkmtKaRmetCNfeRNNBzBBrEGVEXmRYV6CeQROwE6ch72nZO6Hn9kOxU64vR9bE101U1ABWRH7RljIXkv4hEIMQn47xfmEm/GycmoUl7F2K2fWbR4jSn9TQQb6u3bNEVlIKXjMOCvBRhSsQIN5A4qATE4L1BMy4iV1th45VJlpA3RaKz9jfdfiWZHBVrpP4JUtNxRgpwzMo3DodStX8sZrjnajSWvCBdEcjCdXC8BuP+/fsHBwddpq+7u7v37t27MpXDMZH38ePHu7u7t27d2t/f/+IXv/j8+fPj4+OVq3Y4mkK5RWWXokX27RBRt9IILuf8im6d8eoohGpVp6tCXCV41jzKpVfxtjTEzNkuFiXMbYQWPqSCmtxdrQevdIQFruziGFDEL0HstSDJV+g9XaLD8LYh7qxcJM2ovZTKQouOWHyyuB4F2m69fcN6OlV0e4VazxQzuyptkPW4JuPu3buffPLJ1TixXzwoP3jwQJ2BPvvss3feeeezzz47PDzc2tpqCha3LGjVtLSBuA3seNG7l9Qevn5vz57UFxmtsv0YVOm1tQDWRSZSi63WZzxMHByNW9B+E1JpLOpggJX4JtBMc7LmqhuZ9DOLBW0qci6G7UK4INHK+3FiPBHDFQh7LP4tJEV2hlG5zOq3QeO3GSWtKgMHKrfYt8232iH3qA+HPwPaIxvF3QrUF4+jc9p+dZQ5o0hcz5yvXZwpnBLMWy/pFKkXk9A0vN9VdXGhHXXmkrWBVLeaPRyp6u40e4S9yNyXp2+ERacgFrSl8IIZrOcKNjZ+TZPqHVFXNHr//fefPn36CgWkPvnkE+kumYrI06dP1SVAY+fW1tYFDpgiVA5jk0ubdburvgTBXGVisFpVoQ1WqKn196EKH1n4WNx8kVaCRqP90I2vEBi79CUwy5HcuS8ZnaP1jEqSNUqMslw4fFXQtiCWApyKCzspIMIRxmIFHKhKr5oqF39NaLQDt3XtQ0dTiaoQ1MIE2rx2mkojaKT0zYhr4SdwpMwY5Wt2/3JZblxSsWCp9pv0UZbQFZAKMFsKOQVgGV/aXIylFnlYuTOlF6oEZ2qr9OGe0Vu0zObbnBaZh2F5FBpNrTDN9hyYws0IX4qB1E5HNzII7yzHbRQsfJyXkQK9i4U2yevxBo3Dw8OTk5MxJjmXPc7OzpSz3NWaurOz8+zZs9u3bxd8pTt37oxJRBXn1U72US++cCEEgUAtwCjf175K9KqR1KiSeyQ+kcxas18gwsBb8fNuaFW112uszFaM2AUOdV4Mq06elzdIMSCES9xiK95hMQX7GK6pgYBM56fV/luibgJvIX9hhLZN3Nl5A8NXZbZmhLE2jIdTbsTVYk5AbqpMOMIIFgKa9WG3cCs8tZGHYQq7p/VYj6XG1tbW5ubmaxSUNzc3X7x4cfv2baVJ6SsfP348iG6H1ODmqopxCOGIXjp24WUWnMDNWQn3pMwliuFmjExgUgft1lWyZz0dxIy2SkfiDZOMP5gy0wzoyV5MuB6mNKRYOHYyWqBckJdikUvZ5goGLZc3TKUDt8A6q8qAoL9hMi/xts0SWlc8terdgM/zVWWLs4fQPV9EyEvPce7txKReMKedYgVSAexY2EsP+I78tJmgNeN+L/4LdhB4jXAKd04TgidF92rlAjbqFrNcNXuwzVdFt/uFkACZSPqSE2TlBHaHQvGlQEQfqhDBx720bozwu+u6gTox6j1zWJ6rsRZlvML9ZGPcu3dPXXF2d3eLeHP148GDByR7yFObm5sPHjz47ne/++zZsxcvXnz66acLiimzAuhk9KIWYYGENqFJxKRicpeqTAupR1mCFOetdMgTA31xC4snso5m5qOkUU0yeUNHD2c57pUiUipxHr9BwayhRcVuzDjQQoIW0BR0lryQFZTUgtDVWPWMcIJkYDYHOGNcUR8OtXHrC5gG79i4AMyvkH9ra5O2clihr37UvCrWjGrRuCuZURkNA26YNMonYdc1bAQ/mYt1pdEQFgq6OV5f+ZOXFo3MfpXt4iBf+mhGi1KNoX0DmVWD0Vo9GYoNQ0xcLaenNCkRlMpLM7oJXNlqiqqoSD2wyblklL8ChQ9r1OzYDaOidAbp2L2tx3ro2NvbOzk5ef/996+yR6crqpJk79O+s7Pz6aefvnjx4tmzZ9/97nfH06ycrEZEOB4NPClayrY4a2TFwgtLjyjbxisDlD0AmSLsg5oYmeV3EzqsKvJ7uWqdGZ9B0isTko6GGmAp0tXAWFN1kECfIbqA6kh/i+hlDwhjqWznVC557MMCLw2TQC+mVRukI/zphaXnivO4rsMYTnLgDH2QDLt1NF6PnrG1tfXs2bMiKL8STYlFg7Ie86efflr870hcO3fjSC08Kv7YCm62PO8hDAfxsXHKrBpcZUJa0pw2LdJVVNJtJyYjZLAUl1B7Oi1w+jagjS3tvByzZBWpkKP5IeOEFh2vD/b/aF358xxZcrG+8qjQ4AnllCC0Kuoa8IZJJ8FV7UJ1Wc0vnGBelcvowT2lkaSxG39DpoDBxmXPLWfEzIa83VhOBoZtYS4wvJ00rINqIicUzgN9ieLnociLl4zPG8S7an6NDrnIbE/F4F6E8znNgXVFSMJQtZAzW7+TG8RvIAGkdiRtL6WITMXF4vUFvXaLVEnPnr3lRWKmwlPFeSnuUd0Du3il5eT1WMlony6PHz9WS5zbt29fcX/rErFzZ2dnpUxn9mz9veClROUGs4GlIQ9ywUNeCTeDYkxKKe0/ku5HGFYUJK2I6kZw0xx/rAZOorRR7dnzFwuxadXbdWwXqK0ChcUXFHE0i8phDLCZ+tKoO9KyzDWW1igINgltG8eWqJazGqzhlsU010NCfkEaIlnMZJRV2aD1poeyX4U4bxYA8x8dMfO2vxs3GZI7bFHsosxZWCjkAsSZG1v97GeMC9L3zNtAQIOtsS1shuKqg03Hk1f5fXkkjVkUViAyZYn852ldWbLYWuVvGMFcy6tN2q8nlGES8TpdfcPH06dP7927d3Z29mqLsguN7e1ttcdZDUgKv0j7ixv/yHShwJfRfU+RaEkeLgf3x4MavoWMbI4Ft2PEZtxZh6xbiERwMVzcd5tahIOap7CErETP3FjtHYyvR8Fg9G6PkawmpzI5vz67qkuZBKalM/DAI6DdTmkFxRCX0wVW6ygIEYuKRFUEvw646zGYVz59+vTOnTtnZ2fvv//+6xKUt7a2dnZ2FqI86x5YOROo5BTWs8wFINwwGZclhjPipybJBIiFEImlyFvFiZm39cGEyW83uSrbLSe0XpORMitaaLlvkX/cMEkPhqUEpoXKe7X855w2yRwx6y+DSqcGxkWqaZAX0qhKspqPbJh0ihTiI/hp4cTTFk9nGdRQhzi9GNVQ9jQJ7eBJzWjHNPQYZNOg6yL4Xg6PDcSUa0gIK+SqWqJV8MbKlwT/UeLjvdMD54zUKrl+6wXzzAlwgMoD8RsmjUqLoxqYU07UwZw9vPIVXUTmaXgnFpOJMm/07hiRb/mMeJSMxhZYp6APmwEVUe3B9bUj6QFJGuBAdgvRoA8D6yz4Oo7OGby/v//s2bPNzc2Dg4Nbt25djX/6q78cWT9Lc+XLgDMfUAhrdMLqe9rECkwKEV1euwifhdzBBTfFtiXhZJFuTY3TNS6Gm5pUuyEmcHaAjANpl3lAl/B/6pvlxOykZ6UeTZmFmra+g2a5qRsLYJMXVtMtSmh97Xeoe5eN1S4nZj5UOCrlrFXqPieuBq9AKTDSUkbLGdBoBoVg8yTtt2DsAkuqcnFx5EhoZj6a+SgVw25RMPUeZM6z1/ncHZ5ayg6hZd/wto59n54w8mwebflIOpq0onkkzf2HlkwL9eEeJTWf0RkGdyH1E1EpVd3v9jePr8cVD3X6Dl3gXuG4f/++9oTevn379u3bn/uLb6Wi9jPkU4GmSsDSsJpmsxf8nLSjEzOGw1Ko5ULoJNo3c6EScbs7mRmH/WnvZLgTiuFjuB5onnlDa/P3rm3bMN4VLYIftMpZekQXAIUNXiUJHbjQwddnzjIfBeYPJhehTnsRRxta2xUWlF76+L2t6f3YBQfecC3l9MqGuoi/Xsf84MGDz31QNlm7SSY+IOpHIsY3muKLLClPairsFlMBf1t0bZRu2W/OrAyeorWUWX+6cSsy3jAdugSFwp7kSDH6EuHyhylSwENk7qOUxotxgpedgCwA2TBOBFRjbZb0YQhNhginRoqaaH531FMXvGGSDZnrbkEBTV/F4lxm2V3q42XLZtviN4HTfYIfB74PohNe8JLRrMsOB1Ij3g5eZBGZGG/hw+Jz6GA8077k7Jr3nUUtdpTEvaAq0CXoXGIUdVy7M2dUX59kSHe49lffoHt7ogYi55Np2GOw9Zax3kLN3AapF+zoeHxavzc/fSTVnJcde7BI3Fpo8Rrmv33L7s7OzosXL7a3t4+OjnZ3d1UU+PM9mkVUtYRK8nzJ9+FXnCJtfWhzBaJsxVfeKEBrwv4Rrc5VmkoumD8oY0jbf1qXX0DqjmuN16kTpV6EBXvz4KsdK6x8WaXnJrsmVZmbot44ErFFnqJXsx32rFB5VwUksw4ff+3bq3zMXDsxjCW2oeHoted1tI6WDZUl5lO0Nw5lb0tpczUMkDKncQXSSmiwROOKhecF4cSkvQamQR2Fxd2kegz26BlZ+CgXsUppuxhzxb7KBagrRc8F1ctSaaspjnmSa+13XeyKxW1+r71gzpgj5mMRm33e8MUF4Z6u7VciZiX/+AaXbO/fv//uu+9+6UtfUsbu8fHxu++++8pZQlqU3draOjw8fP/99z/fRVkLbzDe1lyqeOUFYiIkztvZLqIy4ZZteK+N69lYp7JFbhWgvBfjq4GJueLtSKFeKik1ny2t/NZC2WB44gUUb7QBxK1q+BDaBl23dgqOxr951p9uFQ/m+Gm5HFSE6hRaaDDvHbzgv4XStuaoJXKnp6d3795Vv9DrzG89Ojp6//33Aezu7t69e1dEvvSlL92/f/91iW5hUL5169bn7vFlmI9l7poMU5gFMq/aozqv2q5iSP22NRfVvpk57UvGJBAouq4w62c9PLV8ftrWplmQLimg6D4fPjcAmEnGwinMdaTl9OsSE7UXqPptkfSpZFCNuBrCu+xYwcKTKiDamvNb71XitJEgt14rP8zD5WCkDlUmWrNFBvgpRUizUEZFkUJrQsl/SiLOL5QaBg5T0yKwC+zWlLnfOl7HPMB/cxZzLQfPklkEU2L8I4m+489mQiTe9tK2Bp0fILKBNITdRcTTzEvVkU7pEmCxNWslEfmNFX4cn/8O2KCpsNHdu3dVsP9zgwJ3zLqWxhCy5L43i2yNUsyAsaN0RAIEMvyLFlK81Ks0QT685NY98HOrNPh0nXjLUdEkXiaGDYkJiNKHRUhJK3uIYvfAPGojcAQcf38Z0KVdEwIgw6WObUFn1CLVs83JbEIxys8vL9+FWsyL3SxHMxQUg7nJ8rtqzUetzrDBpcGoa0VVq5DER5FNpX3mt3yQijMECO+gpFT9NSy3Stn8KQ5b5/EUrpQYQ7gh5eC3+MwvuOVK55BxWNgWsFSWGDqRsRPPCZIVkSlep27q1Q2VcTg5OVFtItX83dzcVD2l09PTVyuptL29/eLFi1u3bmnMlvUYGukQQaO52E7gvMCKFzER6F4RcUF1G8bDkasaRrzp3RyrFY/+0JQLeO/bf09/+OSbvytcANMFlAEWuF9Rw1fWwrs2HSQLPwhWgoxAJ+yIsVpQb2Nej6Dr+rXWfH539V5cwwNbQl/CC87l6lp/Tk5Odnd3m7+/d+9eEZuOjo5u375dYKxHR0dPnjx59uzZdbvghW3azs5OkT9qW+rz58+v4QEPBuXP49PKtvQNsphRdbs27nDy4i1Mp1JwQmvFWVSYtmEaPqOdomIIRpGUNhpddlUfuY4W2IpQBmUgnWOQGCK/jOy4Sk08t+pClAktOmIu1oCGnMKlnVrw+D3f/iX9z59/78ebN4KNm66RbqFm5XYCKS9FI68GRyoyMJXUBnDAjFFgDyMz2om4Mf3XM8aSYzsFk8vTzEXiqujzIGdWqX5drxq5H/DVI6GIo8wkYucDRdP9pW1Xspy52qMTsKOIcdqnWOC7ahhaBoUkbOnhgXDRRiiNyG4VjOM3zY5g0fy3vtw0BYw2NzcfP3784MGDz/eFs/Bxm/9mmpOI2xKA0bW3fExNKlUEsw3AWxxDaqNjGvGqFRUtw1GqfyCr8WvOqOMgoXrEaY48Mrf104MMZSVqAh1Z41IpCJuRvFSDaTL6LCgSZ72f7UteTWViTD1z9FcXlOxS2aAqQMzazsyICk65sJjfnDmsC1kMy+rXl+nuAy4+03cL5CcjCqHKqj7PXllqcDPDzMsdVC6+TEdTFV6gXBhLTWhnPspp0QguZUssRKFE3HdPM4mJwFaPMD7cYjaaqvRCZr4GDNTcaqgQ1p01VzgODg5OTk729/fVyKXIAD/99NPt7e2Dg4NXrjixubn57NkzVT9c368RD7vp2qrabj0ESMUg5cLLvsRLSA+jU3d4EI5c9LtCweVoiLvtlmovSC5HP8cumMRecAxddmrhvGYE93lCi2I4LH5qRWN4eddwDeOa5qLXOuBqznbnzp171VFYcGsuJyLPnj0j+d3vfnd/f//4+Pi6ucUcHR0dHh5qbH327FnhE/Ppp5/qAV9P4vODBw+a2W4RlFcou39tHnlBjuE0+UlDzma6XAy31HWpCmjGUeOLeEGi2B8zNmXn89xS5+tU6u9V5wvThFyPuP3zpasgnZmvECLyktFLiRtpZktjaajyDOEG0htIN5Ba8UZ8DD8RhSwZwU+QNiE2duNcLmePFWldDH8DaSQemTrtRRfDi7y/X2uixr0L1bEKy5ywZce3lYcpirRWcJvwXee0hXKgJ7gKj9kl3j+nnTFSTWpmFKuKMHGX+x+EoSxy9RgoVVlLydSc0MqGHIEHUUQm4uxiXDrMaVVxovZdRjhtSFpf8eq3zn978t86zNdV1NXQ+HlNWfv1hrTQlNBGcLVWjjHzmhVaYUYTDotOBWg1aTiEBmsfBu1By925eMJlFrHjnoB+/0ot/lTAcXZeNlZp0F5kThuLb2byDMHSnD5cvAigXiT9Ad3l7DZtIi2QCjor27j4wtEMJGTIya3sOTIgUtwPc2PASaaekemNxBUmOD1NWC5OadRkvJh1en81MAT6ElgiZCf52h3BUdIM2lx4o4Bzr+RckPWOpygn7qllXy+a0Hn8MVyXrUHt5gZIffGJ3MjrzyFuoloZzfal2mMe7BtywndJG861udHcC5IEwaoDQ/kfEdwEfr7G+a4wa93a2nr8+HEzA7x3756yhPb396/sePb394vMv5amvvfee0+ePFnIcObNGWOqnjG8a6wzl7QjnMCNV0lWQ7DoShBGhYY1FaS0iPZ4MWHBLOXlKrVykfgUVYWqrfgeoVuIGHi/UpxaOUSFrAEgVrwFp+ISsV3cc094wLyGlT8jNIvzCZgJTWCJdy3BHtKN6OeV+/O9731P1/+eHO/s7KyAjDc3Nx88eHB0dHRwcHDnzp3rA19+/PHHIvL06dNmCHvw4MHh4eHz58+vMtSOHD2G558/mhRyXHgibi6Swk/EzXOvnYS20N/rffsww2YhFo66pBBQq29PKSSBVXAWInPaRQmwGybtzePgaFIxVnwMr6lK25mgO/MtA5zvSj27tyJGuFF3yRbliip9eE5rOi5tTdrI0eQZFlLaRPw0Z79BaMVfE1ZK/6yYwM3zawYQ4GCHtWKRRd39XCKfGwLN25gEuUlgZe4p2KJXbKHtypxmAnrCiYlRN4GYB71u+rGpj6J8TpbgKdTvqgLdKAzVtORlvifRp7gFY8n2MJ0CHcXOasADAxQQIlNxEbxr04RgP4YW+OaVbL+c/h+Jj/BmNrVe6/x3gS4wdS1/A69pSquoX16wyjpN2AaSFv8dGmS1LYv1cJNzKjvjB2UBo8dW+katXhflS1jcpsMgFQFiLKf6FCrls84aRourJpYh876fN9ecfPN3BZyssR/VKuLeA9b3AA7FUljT3DFCLQtrFTT3qGW4VhaOohPjMCSwkL8gc3WQTCTannvr2C4m3eLPSxGRhEq2zWqnpCwBEKhta3FPGzRkhILLTaX/8IAsfFetonZi/bLLDCZYTk6vPH2TzKExlHnpTPhZCmpnUbl2OD6j1UNPIXdVKqjZwnFzbz0udZyennZBrnt7e/qCqzwetR1v/ZOqH17DFPo6jBjLmFpEQWoE8VaIDjO3nnFBZd5M9xYL9MQsDfZF8DFcjFQVn1tJ054VjWD3qtXJjfiCwRpV2SWD3Gfd4Yw+etXx6HLTyXz5YrMMnXatNTFmz7CEfrGjcTS+TQ+0B4Yw4vGaONSdnJz0YJSa42l0CLM7DV76p+sTajXANf+k/a3XxB72DR8QTiTVRo2sXz5Le02okDCVdJSztIgTc+Fuksz90kvFMQwiKu87p13UtBYiPYHeEQqueSKlTWg6oUhm/9PUPhLBXGwiBgNZf0a/mdFmIgkUycWFm2+0wqmkXQ0ZHabimcRqolqOshpi7EJ7j4k4XHhmVttmqRQrK6QgaUwAVAWga0zhsDROERXG1Rc4Ign0iH1AKo/ET2WsCBmZWZF7Yt6IUM3e3FbHgkAjcfj6aPMxC6WL6piKU8eFMfUbM6QvkcG7uc5KQ7REl4jwKWmfqwXIU0E/QLNOhK9f/huJyEKtSdetj+lKNrIZW5OAE3iRGS3AIUEidEXQ5pMMCFaxejsaSI8AE1sld7u/OqOCJqMTHgYB0BOpt5Epq0369SpAnHjrK+5hkitlsJkxTuFeEhII9ofjf/5n/5e/+1dPf+lr79So2ePvcNsd4eCZsnenxIaqFKRu/lv1qSPK7ceo6+wCMYfAja2TROxojZS9nwltjMpE9W2CFSz/t895j3X/xtKJuHKps/+tf4hFUMMcokGH7ueoXvkiDDsaIyauGh2IyBQupZmLLZj7UzgrnGaQbvMugxWMWApRYw3nugkTEVIiOAPOGRUyMiyxfqx9Wl/5ULml1j8Vekzrq3R5w4vx7ZtRWvEUu/QTogTSVtgICg3nkg7M8y7COyI2nC2CAaoyrxWmhLnGRNGeSltziTMCR4O2OnHu5Jad5t//2m//t/7sn/qJXz09+eaPF0vuoACxhhXTy0fLtqTI1DDM4qodeqgpzcg39oC/BqKaY17M+rHtj8Jj7osV78S8qkclMv51yT81hTs9PT06Ojo7O9va2trb2wujUivw+s4778iVVzcHQ62InJ2dtYbU4+NjzUivw9jd3R2vL/zs2bPPE1NKW0yQd2oWj7YvZX9zZiuzBTYMsory1Br7atliU0kg7fXzzHgYNAKnUKABrfiCPrzy8puGsCR3k/aCniJfRmkVAiEfiCQcDYFzRjeQNvleKNsPBSIsRfAAVKyJNvIUvtAgFnaq7ykW/Mf/9P/qm5/+6j/8Hb+leSN8hbF0RctgUyTXCC9gycsCoFQplGZcHsn2nakZXcWGyBT0Nd9grTVPROdz2sZPKonAxHKTlERDurorqg7Y/BowEu9parZGtQQ/CujDvVbqJcFrAu9aTCDCEsiIPUNBH4aPZE0fvo75byQiBwcH47/gcwMQmzb3SYrEcL6R8DBIcs4ZGfCckZclVdZG0gbHeLOxF6dTAeKe5Wz8mlVAikb10Rurd8rIwnlaEk4s4BytgVd8rdCZZRko0cTQjdCIv4GExEuJyz+BICdwqRhUGa6R+F9478en8Cff/AnxYoVjDFIyniw6ryRFNoZIauyeAFXC9Sj2tYWnuDG195p6g9YqOfwuqEJ0BhBTCAU3M/axhTeUzllNzHwEkdgkGPNdFKHe90CaUDiR1CFuqjosYc8YfmFKZDedxaYNniVtqJRkUgVk1twhOvnmpdEcQZqmRlttGsfiBc7RKHTtxHiaCSsdsRF8iKpgzTa7qrG3t3d4eHh4eNhk5j569EhEriD3u3///viYG3oTfQ5GSmMk44Ea8QgwoxjOiVmuVQW5H2mrDh1KtV+uMEFyGdi9MiKwgmjj9g9LYgFGfDOzcjRG6NrcQhxhq7Tc73/hrb/zjZ+IhL/y9S0FoDlCgFiXu1i1AUZejWo7kRX6S0huC0y559hbe5kh3kpH0/KlDQUv7Oqug1mdAUP/gcfGOY+rEf3Tk1ohY+4q47OCvKFD6d27dx88eKABS7O4ZpDa2dlR57frs9TfvHnz6Ojo7t27zYbWhw8fisgHH3yw3pC88oEgSWkTW1NeTlHYq7tjaV3W9kI8psW6qo/QWlBS1KTOwFB8QR8u3pbQxFiVeUzLIbVC2CNM6uByjT5UPOj6VSdKf5SNQO/RAEJ5KUaB+JY4y6xv9f/7jd99A+nf++bXQiJnBXMMSE8RPIlUxjdhSJd6+wJlwguwRE2mmNyCctTy+kHxSNemdUlBIjaGa2m0bbkaNOJ17vXsHBIatKIlvcOXdO9hjhpaNqVw3sYm4z9ZoZHOQ8w7rsr7MoGbE66lM15NAjMSlRVvltyGZOdVbZ7moo4FkHWL1lXkv5GmoLWXPnny5PT0tPn7z11orLtjT+AFEosjpZmq5YsspHyGB2Zp6qPYJLWFVB/IuLrcZ6x7cILU05wzUj2dwbyrIDDWUk2B81rnrLpY1kbcoT5MSiLWCwpLNzUNSMVM0KHlVDhxEZnxQVbDrMBxSh+utVEU1NqslNqo2qk1tmnoH6Ak4RZrnJ+LjOhARCGljI54NmSXhhntpFsJK9fcEfXZo6An2UDIMsZiGvDj94H57FX6sDNZJLOKERAm3CfdQDqrzMCi+WWgGyVUX6nNPNWSHgsHj9ZCZnlHkdJmRsao7M8uuH0sOo/Y+4GQigR1TQ05DLdLHEki5ocrclR/M5ug7927pxbwz58/v3nzpoh89tlnh4eHT548OT4+3tnZ6W/vXY8VjghMuRocB2AMv7Ak0JVgehHcuJZbRsYnnnYEzXbJLAs+EszZucqlrDfiOxqi4hHvqBVfM/d2YmS8V5unSUVs0ABkhCMxcRGJ4NzCejyMh3UqGcM107yiH9lk5hCVTJU5A312tbRUjW4W6QqnhPncxQIDj7ZCkVkKTvIiL5eNuX/9yd9Y6PUnJyciosmXpmrHx8ePHj26fft2oSPxuoz9/f1Hjx4dHh6enp5++OGHSlw6Ojr6+OOPDw8PNzc3r496UtN6R4u4nzOycH8WbIRNo5eR0dn0AmFc9IikpGH2mF16lo23ocDrUscwlMjT5JTJluNJaQwYWnzrS8/FTkpVK7Znmiz9zGvocIYVgCCnknrEYIuNKitGbTiXqHYp2MjClqgLGhAiMdycdgI3H22J1AVN6tTS0+mVCizS/BCckN6cezETnbxJ1CYiihGPfHAwTCAbSJZDGeISRRnxyGgvdRMgytVFwjy0Bf9hxynkEwOtV9Ys7hisOxb1T/KEyfcayOnDRmgX9yF4KdatorD9pvGWF81/2yUmnj9/fnp6+qapSSDwi2tGSgXUvBjJdevYxkdCR6ir/1bZMayBg5wgNaK+ViXaVl0X6x/G7pxZiMHHD+2KtTKnLYiTeRRUixuSlZhb/J8X27K4V7w481NQjifF0xpTyNDUwkDfbqayC/8D/xP94b/3nz5JaEcydsMrgFLeQdS1bCxuSMzFTuDQsc8oZlTXZ6g1gRecM8pJxCaM92N437kScf+hVooUbLw3VeGUCrXWi9ihDVY4DZAwiiWVIXI9QIzodkppBZwi6S1WMrxEhUdEgXQnNNMcfN9AOqctiBLIlSVqNsoz2huoQerZs5CInYxi/Oahl0LI0t0GLfdxRcn8m6l2sbW19ezZs1u3bmkdVUSKH3Z2dp4+fXoFx3D//v1abD0+Pt7d3f2ckYVfxaAV38+L0Wc/Ep+IQQZQ2p6dqG5hF3qsQq2MnKA6VjrDKNeSVyFrQKmvS+kwkI1vfvtX/nd/4t8Xkb/zzZ/4t/7snxqzuWfYelkF8mxHbDS9onimj02cpSL6H0FoXmwr2NUMa8FYfLvs4yqXVPbzmnXqXhwbsrno02BKRkHzVi0kImzhHe3FL9JycLY+iVjcYUEpgcsd6l8+/M8Wer16xWxvbxdYsOZst27dunv37usFEIuIhtrj4+NCwOHWrVsahZ8+fbpWc7oWaS9KlgxaNdbYlcay6CxB4wlNvC2gwIWNKCmpqAddhrKlNC43wmnDguvKAM1nfDqu2QOd8ql9xFKVpIjEFUvlOS2Q2RVkbuRhrkTM85VQ11WV6YCIDYTvPDEXa4Ubkr5EbMipSWNxUbVkSxEnOPmD/6L+5vf/5f9bA5FAgcZaoQfURtUK5zn9qysIzkvT9Sy2gsYg7MBF505GXNdmDAFjun9tjcTrJVJvWCtMcr7anFHNt7wnQdY5M+ve4VDE0xCOl8BPTToKGJ517cFcGGS4Tdf0yGmivuNt/AULtdMtfUX0qopKgpCmuRRAN9gLJMg64VfiUss3jCa1aP4brQPkiHAFncS+Goes0Io37ZvpeqgqVPE2THLu48rL85cBYspH2lfJj4RI2ml1xQ7wMXO37N8U62Jd6zxli/1a9vIifY2NS71xZajrw6GYtwiFKyMJ741+M7KmY4pQxQGCS+0mkBm1NNopMWhA0FNMsSlJcq2rvp6UemArtym2zGrRtQwj4MA1dSom4ox4R4lQLm25J6nPtw56LbwTm2e2KPBTpR4jAHgh2cVBjTvdcRO6wGvJIPsMrBeIp1AQCUVkAymCc08ZtV4FTeNTgpnSP1IxVaAfbcGGEqC01QAppKLV3golF8eMhKRYeJ8XNTLzGYUSwNRbz1IjWB9bL3ACk18rn7upGnFZPYO08LE4qdxHCDCTTB/DZBcfApVmM2qG0NYuHUohlxizkuupdAChHzCVXY9LHNvb259++unR0dHz58+VsbW9vX3z5s0304L1qtPREVPdE2H3xmC3eOhkEhvnvOnZNitPZ4I0ZWzFE62MWhb4l4iYKlY4uKOcdGtljNmNGqHpcxEI4/tFFTMcK04Ao/fnLbe1+x7RC1yQmI2plkXwrdCzCk0U8DEpAC08c8saiMTw8xW1WYyfxj6LCC13s7eqR9/wKy9mUR9ADFlOzxFBt40FlakQDc8T47NwXNkipqMtDUmJ4TM73MajwSq6048ZXE35ZCXjjz/4w8XP/9e7f2lM/tasEe7t7akq8cnJiUoPN7WGexzhXuHY3Nx89uzZycmJRls9wg8++GDtvHptwnG2G7fi03zbHCg8RFOmtdUsjLa2lB0gg/1uGJYKsqpqUAzKGjhCAHokYqIMrStwtEy8Lsx6HFGQl33b/kILaVG1qucFc7GTfAOff4txYvSAEzFtEpSKjBYeJBXqbgqbLW4Ql5eVUzHKd7UZ60udS0pjWEAMxArzmh8jcREYiXeZwUFGJiuk8GywXiJLbdCFXKc0sYgXANm9iLIiOo0wEqT5ffNETTjXgKA4qd8zlysvowKSoBArMLn2VDEH9NYsIcxr4A1NMd8QEJI8xUuWpDuBFSVxS97x/P9n729jLMu2LTFojrn2ORF537M7nmSwLYxvVvPoL7rfjUKmhYztyuTLICFVpv0TpMpE7V8WykqQ7QZkMhMEamSjzEQgJIPISKtlyz9QRckItwFTebHwD2R8477X/pLhVVwjRL9ui44rv3cr4+y95uDHXGvttb/OOZGZlRVVN7fy3Rd14sQ5+3PNOccccwxCGEWZ/ldm9SXGSdUi7tHfTk1lbDPrW1OfFhUgscvnIYs63Llp02yOVZ4jR95bCTHjA2uNcUZBlAVWKs0Nfxt7ZH/WJa/kvSwz1i5sVWEjPmrWF7NMcmScs46gPxc+o1CaJOZ4F4WQlcTVBxni61f/fgCIJ8/TkI/ZUkk0PbIEN8cM4KWE17KKU9Jw3XDTOHoIdZ5zPKt2VMAsa2Dtclpscy4xtRsYQG/ELVGEuHvEJpT6J89NQJcz+YRpDnJ9F1+f/gUqa7v0s09J+IuaphtE6JMjo4bbzFGX/1zBoiBO9Y6HroBYPCdpGcTMmocspDBXMIMusqOwrG/F6aKsle57sQScJnCz+1bosXHs9TeTBgLzKj+VjDKkF7gQEdkwiAPW3H2H5LkY/1NIz0zPIz9jdBm1gvP0EaovNGXAPkuKRZQgXCOuEGftiatBNbQMRgApdUCa0OlSj0IYQA5R9g1DtrTqh7Ygsk7K1NgKVYksMA6y5AscAcn/eR23MnjiIeTBgwfTuu709PTJkydnZ2c+APv06dPvCy3ozp073ztC1g8EICa5VXc7UkXYZGaTCrdAig3MKkGbYQHAgDgKeaH62FZ0arWxj+NzhSBfzacOYryi6Rn7VXUwWIkr2LhxmeZjdjV/c86p8cqekq+ZEaYULeN9mFOMjQKVmRPbJIuI4hEqIfsmcT5v0VnP3jdwwKtD2P6K+Wn0mLJk0WaiIeEUrJ1tlpAU3buOQr596gsHEQg6CSYiZBSEZUkrZj8m2ZqE7LMvMTeeZWCaJFLpltTpxNjut4r/mu1h9zr/V7/Q73D748d/9zv5HAeILy4ufAJ0CSB2q7prWJF+EG66tjVvHfVIX1xQ4XG+OKSIjVnXm6kdC3v8tKOmAfM9ZByM0H5nlDIYFCn1I6rZ8EhQEj3TiETVBOrSmiKXbGqlICc2GiwzeRP6HKk+oG+CaeD0im9JWYBVJTuMZerg+IKELt2Ib5X22XFbW6qVWtHBG7D9+iLSkW70rtqirShTG54QbKhrMAqMIc4gpJCB3GKazqxbAo4He26zkggM0NXew4kYxZo6YessQGcg13wvcYTVoMci0th1TZdOX83dlk8UTZqEM2iv3wn9jeClPceg0Qj6SBKbJpNdn345k5qlSWp1YHGuO1/ThKymYXeHpwLNpaUbWCMRk4QN2c+wfFYn2lBXiOXwWgkdQ8wUjSLVQUEreslwCIqw6xVWfXAKpBgkjJ4XQUwMdEpuUazS2IG3C+i0LYNeZ52ri4uLZ8+effnll46o3rlz58GDByNE9eLi4uHDh24te3x8/OjRo+tcYO5Z/34AiOvwo61wLbEsxx01MkCspYaqPPN6dXkWgPtXm3WzlYOAhCHAt8eQ/66ydmD5AguwAq4tkX9dgJhj17UdX17M0CJDZNxYs9aOFeQ9rTp9mbhkOBRUeq8TRawJUhBnkHFW8Dq9Et1SwXKhiuau8nqr46coelkuztTJ8/Nc0y/xoQxyPIfSMrgPW0vdlwW2U9WhOuV1ILm0YHt9+p63x5UVwThpAKwRBaYwlz+joHZhLt+D6likl2igFuJ2Tn2GclE1eSDlZzndtEbjgsbVgmckx5AByaw3TRXD9WMQ379/34UCixKi6xbVhjOu0+fvubi4ODk5OT09/frrr68bRnx2drbk3DpbzX4Yff1Otpi4NjurngE6vEbciBaV/LaaYXcyaeQWBQmdg+F2f7lRXY6tEw3v1KdubqlEneL3BC68bULtEIDNoeRX/6itqvTchox7zdBS60rONfGXmNTYPt1avfGSYcJEZhBr9O3bcpjmV9Mco8vspw3D1PWoDoUkzJvEFBFsLMyeK73aLKZM75yU1/E7Bk+3X9ktm3tRtMvD0YM7XE2/PwM6Dx8+PDs7e/HixYgLXJg+Xtqdnp6enp7WBd6XX37pv/pu9//8/HwKXi9tN2/evG6U519bjJg96oeK+Gnb3VD6eVBBZZ4JCqKEDUMQ9izgZSkD6cvqksbTH3OPBUCizdrMmCa6Sr+oHuNwUNhyyB59vwk2bKaD6kZ0EtawGYA4L9SDcrgade0YOii2AfEzFcKG2kkoA8pRdCNYzycVMIHRnKTc5uCCmdxmxAZjJ6GVEMRicjVHVespxfKML6YBiiItVTOe7nmaZw6piyBiGcEP2Zo+6/JJpJpgle4EerIXRYMM2gZR0ORh2brAL9ndINjuSgDyPvSk+C23cdmNyckk++p732jpLN0gVhQVPMPh3LcUiUsRKGylY5waaVa7h0SiS31Wt5bTBVyuuoEFcJggzZfhljS+vU1Av/lNZnh4fslaUTAEMVYFcjnP9R2VdxUjaKI2Khwx+q8tQHxxcXH79m0f3/FS1+PvixcvCmXq4uLio48+cmj46Ojo7Ozs7t2710Qz8G3q3w8A8bgY66x/jK135Up388ZC0KZBnNWh849ZIaqw0djFMMWHXnO1FCJd0PYABaGuU/qtSyGX6IqLdVTtCJdmBdAHOSTl4hQIOzZ2Rd6Td4x8x5i0dAOHvdDBmWfChSP1tTRM8nawrMpUjsgEG4bSDa4/rTUXIB7UafC5GfoyHb2+0olk+1rjxpohRi8U2VhoEOdqDGwBXDHppIkMtOf95DuPdQIojq9UM2m/M/djOe3eLxTwuwT1e4u86f7sJAotYb4hp1md6Kbq4XPihrQDPDKFSiPRMd81uiQ2IlQ4PWGxcMYwDjHL7WeiBFFJimPXcS1VsJp0xJZvkTzP68BHFHYM6qNn12wldFki1yTyaHF+fn779u2Tk5PPPvvMIeOzs7MnT57cvHnzZz/7mb/n2bNnDx8+vH///vtR8r1S1V00EHduvw6+NN85BjTzgA9m3/ZFdJzOv3Vlo84tnp3o24BGHYOCdWB6yw/cvrR6KXWVEzNOD7arpm+3rCnDgzU9R4YyuFs/Hgo2sI3pFsjPA1CoFvEl3Vu3iTPoHgCxwFvIrG4GhhXcHcWuet9ukf31lbx7i7Xcs6N2oPn4tluQLMjEUk8OzGPf4JsiQbzdTu5iTWBgvDFz9zoGsWH4Dpesb2l79erVyclJXVg+e/bs4uLi1q1bHmc//fTT09PT58+fFzj41atXZ2dn14Goe3Jy8uTJkz3f/EFz//oEZGaMZs/nuggQR9GNY0ZIKHBL9YrP2bg7IYYiA1jvUOPIlfucEwSi715P5wFEWqrIPBGHCVkWLoxAuNzf7DrsjbpWQta0QJH+IxNqXqcr/QCTICai5UAbd8tZ7ZzfQzEkwpmJkFhPhIbrj8psUDVqK2GWmTLq+xoRk95A+cBRuoVZPcDy5wLkqryoCmj+kcxIbj3+6x8QBUY0lTuQ0eewZ85GFG3gWsPqx8hJPlN2reqdzxjXsbKiuRoONLx2zDf2nhmYCcyVmvMZDGIddKHmTUSllcSWIXlF1qAHXAEmGNFKaIY2v1k7ZSw0nCjAe6g8e9+lEWlFY0W7n/sr+CAUJ3z5nbphE9cEDPWueNU1670FZe/afv7550+fPi0B9/bt2+4K4EH5/v37FxcXT58+/fzzzx0v/vjjj588eXLnzp3vPCi/Tf37ASAe33blvi/EzPyU89LCgdJEo+CSjS0b0KUcFyKUJsTRMu3/6yr+I3TPJVNbC/n1ETS89FDA146QpIpDHqtksebodpmYdZmR4dBbJyrMZl9ZcqhjCLArLrcQyegwpeKI1cdd1nEXtYJRomBjIYztB1IqgwW6JhKAGL317WohKvTOs6IeYOEaXRHuKPvTMqzQpfMALFmRsvJD2w7IOsz9DZtJdCEqqHoJPS9LfJbc0ks2EPOiussikg7rN7soV6M8KjHlLWQZK46SKe6+vsvvQT27Cr+3vajbE9eWiuCQg6VAqKRAAs0lJsKcYWTywcvbpTQmGyUEaYzL8qR5lsVAUZYIeRrrGzav9/XVGZ86TPrA9dVUl8m+oiFCJ/rNO5LX3NKwffnypYjUehE3b9588ODBw4cPX7586fHj+fPnXuOV93z++efPnz8/PT09Pz+/VsygUYQuLKcSCC8uLlwl48GDBx84Td/J1lZYz1VBUGz91RrRS9Z6wPOSzRIk+gYQLEQud+B6DOCbaaeawIY0WBU2sJZmom8/fKBCwHSbjxBahgCKMFbkqcrJjfudpW0w9FTwMVI5ZzHXIEZIHCy3LkM8v1AXGNEZ5SbqYMZaF/1tZuWPFVZkf/mO6hOW4DO08uvk7TndEoQB5pi7AZE1PTBpd5H7ls9GKABhK2HPmy72pMLd5Z7nA1ven1Se3ns31UQu5T0h0Q8ePHCM9Re/+MUnn3wiIj/96U99lKdUp/fu3XPpp9u3b3/yySe//OUv3WSmHu75rjbnWJX/9MAqQ16SF6uff/75h0bs9dkKCsbl8JpkJjJLuIw2RlHnIcJZpWkGdJC1bjHVnA2LmvV6O9FGJFZSBRwuSjaQeOoL1Zam6C4ZVhN+TxZeSApyHYPRWZmj94gKDOazHVXZkphMmNAs0befI/bDvQrF0gHcS4S1RBW5lGCscxI4KThIjNBLQSRMsNOffHxQuQ1gA3huUM213KEs743MHK36EUxXkPDT1Yp6azn7s81QRF3xub4xYoJc0AnjUK2eIpuMuu5D3GGWTCnfu9RQrHFbTEIMM0ARk/kR9j7b+0drltkgF4nG4uXTlcR+GhtsUnN9jIkUf6IlNzr2U9roJMSk1oJhLT1zC7u+NsenAsN+w+CCQKRBHCWZ1ezClVPiS9H4LoLyPhyBUfz1yrHM8dy7d+/8/Pz09PTmzZuODks2m71///7z58+/87j8NvXvB4B4/kl2cQkOE9MC5hgRtw54rmBGdRLxQhEyEvHpk+BNYtrOKfEsaxIkPimmjihUIcR8f515MYooiefLGjPqW7UFOI4MpemH/aBDDNnN20UeOMhU1Kgm0IUFfdZDoAD0ZZBhjdgK3Y6skX7YcI1OhTqn3eGd0o01Qa0OnxTZsFmjRY8OTzMEWSG2DBgKVeXcy5vSizCrt2TbuTCG6vwYYaIqjJKU6TuGuCC22BfnTl8d4/u5MS51oTrasX0i4g6ckxVMXN0JkGU9xwSIm0LrHCKd2DU6hQVYEAvbTO3T15jgNZtD6YKYF89rGIRGzy/J3PUx4hAdBa/ZmKjJ9r4xXbBiPbbTpfRypSMV8nS+3eIQuEL7lG/q4X6lrR5oHYWZMkB6enoqk5nWO3fuPHv27PT0tETK67DVof3s7Oz27dv37t0bySW/evXq7t27P/3pTz9wmr7zrV5KdGao9KqfxvVkYeSwDizr6vbPkavnsjVO/Ton1pH9GKrXpWFrpuqhWZNiIBW2lq5Db0tiRASaq5wT9GBo3HvxQcsFraFdaxh8suqKdvZuT1rW1ZAbveijBnP5YZH6Tri3PqEy8/pkQnmLNIcjF/uv6pGaJ58QRTf2tpm5wlboxtx5SO39u08KV1KEdsKa34l9t0TQ3YJSpdFu1IBOEtuI+9zDV5LbmOWs7XXbvy+6kpuMP3z4sHiLeyE3Ep344osvnjx58uzZMwdbb968+cUXX1wHnd979+7VU7e3b98+Pj7+4osv6p0/Pz93F/VHjx59CHbXofgtk/jGMYqHMbiU0tpVxrASdjmY4h9HSf/Y+tELsCIdsP0pNypB67uSPVHUdWM5F9bNrVkgkaFJ7mv947zJrJoVomOsLYNzV8ffLuSgWC4qHOA26xqISCvBBGuJ2GESX4ZiNXvKGcF2/L2OZWtAtJyrOOdm9gO7BTc2E7QSamWtwocDfMYnSdyuEI1BFmQxIpUDm/H0h2SS3fevcBWvUvTtvDFy3IfMjMxKFLVBpsStKA6GpCssk+QwCpKjq7l/xNyyNWKtKIfE5yrjpeTOdO3FtyW8DsMfp9Ora4mN7DDsjaKdaBDLw+Jj+ZF6a6mdIPOrUKeFZM2QmhmDdnJe0c72BaeVUAuP7L9kdaLduzC125kxztbCIvKTn/zEuVBbauH79++7EsX3t/5tRGRaEvthz5bKP+z6mZO2huv4BIll2chgH5eXDDh7EeSIPjx6wiO1cbLq5JblDkkApxFFWfDIttQj7Vxr2Fhn1c4rsf0elb6Jx4FkBfuqifMPnssQD0case1b2EOHHCOJk/Oz/GDrQJc9OZ6P6EuKHSVi1V7rv8uS+wFbNrOuOGlUBNHVuzDBWCupo9nyJvn4VfpE/QjGyLelEy3ymnvO0YQ9CF+TT0FNjnNr4xXa2W7twsM06QQwn5Otd3g0VaVOrrVfTRUG4RrdGpEUnVCLpoh1FkpLxGFHiodEb1QI7CBX5sAnZ7AzB9pNfRACbMX4jawqZF+aSvXbPzzfnNdrm9WIKG51XvtdXFwcHR2N5HrdJOcXv/jFtV3hXTR5GrO9CL979+5I2/HD9u7x32SYCR8OnTpzlue9gTWIkbBd4OMbPEF5Mk49xHuhuB3frF1eYyZU7v+NQcynFloJK8YOqsJLayByQzdSEUhHy5gJOgnrcULcRzSvfAxWczatshUa+Xp5YYwelLwqgnpltC45i15xG4GSDWJMRJ7ip8qlHODbvo1jroGXoG0VQnffhI6wtAxNYgZJu0s5Abs6CtMImMZWkoRlRtIJQN6/Av7O7wtg5vfJrMyIJCVii1RvD+9zG3ecZxVcq+34+Pirr76a5d6WzQlNjx49cuLP9bSAOzk5OTs7+/rrr0ekJAfBf+u3fuvJkyd17fodbrdv354dwr19+/b0xR+kCFXWHsXQH3JJTk0IuoiBCimMom2S7mFd6JGI0CA24opqMppGvWDarjCe9405P1eKkah2ecnsPU0HrhELQar313HkkeMOcc0PG9WwVg3Icw7K3DCUYfyDOfez8dKU5BSmvjtThL6X8V1CPG1oXV7/rYlEahTVLJLJDBS6s0JVIzu3a6aOs+RomPk9uVvrnF8TFJUEl690ppflc+UCxCOY0hlOehWujAztGeaLzazE2O7Hs3YxXxczrGpb7B+8hp+GqhNvXbHZqC3Us+BkSXK2HPJIZaImgWNsOcAAqiyKOZa2UBQtIi1+aaqiuK97NwyCVDjX8Jf3LeouSE134zDz15GGWBLRpl5XmwCPVtMQ/NOf/rSUw17wjhxivToulfL3tP5t/G+WPuvXByB2vipEIizkez0yRAZfNKOpU0o3FlYaVsKNCwBtDWy7hF/HbMpRKNpelmkl6DMmBadxjzLSPlinpjvGXal8eeZdfhF7LuFIYhor7WpW8iTw58+nd3thFC9jbBj8mWcbSv85zJXNw8kHqkgjY0LPOkF1usR+XWobFg+9QsbZUNcwEa7QbdhIL1zQZzZTOtGMSV1unC55BkYGzbYP5duLysTO6zGFA/bhEI1ZSJz3TBzoPjueMjzmCoLpZ1u4cDNUqDedRLySWNKRA8TXhgALHq6QGFj9uoYYYENueo5JWYekh+A5PucUXFJvDItJCFfoWjaTIpyy0CoYBtkEBzu07f5L3g+4bi460/rn7OzMNSU+/fRTWW6r+iv+2+u5nZ6eLlV3RVv52waI3dxvNuBOX/9hCzWu0b2W1awDqq8hW6b5i14t+uXxClgnZQfuXG8N2CQ5dfW/6hgCJOxhT1fmdteIlxJyEMTGQqE2R0FYQAY5xPsqB+0Jp5WIEkJmvyZnGIk+tCiQDUPxUnPWbe3w88bo3tIsrS+z8Z0ubiFLAyFzh4PQG/YBBmoUVHfO7k2FsW9IzLjQeyameznKbkOTt9wYUsW7uJwzFtqON6H3K1BZ1b2MGVlwxt8+F740Mmd2/tuJWhgoU6UMRKuW/+gENYi29TZORTK+TwtjsYd9y/d8h5v75s1KNjmofZ3zhF+fjXmYjfMaxIvPVZZZiF6muRgxco3ATHF1VHeJK1qvkHNkoFoDV32ER4e1EyeYV6R6kdsxeCtUKYCTvQZs0GWA1VEzmziW+WiIZL4kl1Ds0juMohTDHrNHrrcrErkjlKg3CI1Vq2/v2O2nkRQK+swJuyMaBS216c3WygA0S3u4SEmwQs+ZUhFRwIhOdDqtRTo52nZZv2MaLFaIlR40JjCImEjHZovG5lStopkEoG5hrnf72eYoVGUS8Qh2hxCSnOUC4hbGQxZdiZI47Ev4OFG5Ci0oYyAyKKShuTlk51hWfW/kzWGflZhU+VKVLU3MkNxTaoeuabo3oqhdVyPZ2SB7cnLy6tWr8qst5bDbA1yfMH3V+rfxEvRDmBwIsjDd2YlRyNTuFBGXIY4V05DvwEt89hkHr7YSDcFuAgP94v4t/cAmrPJpQb0WmKBBRKUv0SUhIQ+Nso8KH9MCZL5S+EyKLDGIiwYx4WZxUdAyHKD0nM0L7CJElaU/ZmKGCFewAGsZfORFJ29TcPup5fDe8BbZJRvpqV49szhpCSJxy9+AmFN0RSL7WRgUVRBRUJi/qAgAdQxxD5Fc7CsTOWNShz20I6afrlnoY4UovUffgE7udrq4wrMppVg90C6IOd46OUAuJTxWobfIn+Z64bXo/mVuC41TB1xVSn+WE0iVZNiUIfv3FB1/96/87sUf/NJ/vvhrv9znTy4uLp49e+bA5YsXL34A3JklR1cP89en2fvDDbWiIgCNi9ETe5BAD9DVGv0UtGz2f5A6hiL4wyF7txfzmSCDEBstk5HSYNvatSQX4Jo2kqxQVze03RXiIUmrFxvuPMlJJ1HBpkKxAyyIvpmX2ijqLRVZAfQmXwNTsIuLPOU3kJ9LaCAUrhAlbLRrrYGbpMNe22qfz/TMJ4itNH5j6wAasUY7d849D2knq/q+5xAiGzZTGsEms4bL10XKhs2S4fBa4+v9pCfK41PLNI9HUrf7B1Q1pImsEJMcE3rFiSj6RgvA1QxmoqgQBfFvXLv/Kl/WaNTrWn/+4Lcl/tR7aMTuv3311Ve/xpeoUtflOOTttrciKAioZ+/mF/ap4Oye2UIsVCFxs5SykjLzt2K9qPkXSZoYiKTruKVX9qzFCsd2WhAlkuz0AKkDMYsBALqonm4+pszkxSfpNHKpwHcOadZ63usy1TlSsSLkAowQK1M4jFMmbWCxZ15jkIARo+neAtomMyfCoG0mS8XUelStBqEwcAnaiuRmDmuAdZzW91J5qaHbG0mfNiBLKtVrYGMcy0xUKDsVtLxvMeIyu3ywojYQGqr3SqyKcZLSSqiHpNewSHSiKhaAUcm/iDVToiAwqWEiXfoE7pfT1VFF0EAagUtMBKFkrveAQcgB3rT/A55AjzdMJ96qCv7lX7u40t+en58/fPjw9PT06Oholln8A6t/5yUmfp23zjSHpTA1Vy3jKpcM3HpDN4i7Dak5kISbYIXYsjyO0NXJ+1BJYsyn5DV6VdNRfUVo6Z4DxaO0YtcMZoO2UqSZiK7bF+jCHd5QV1ATYx56qumripmTNb1GDkr6eEWXDMFolRtL5g5PD2AevzbTjcoaHaqv4969zsGpm8TsKRI60Ytw8hpt4OMEEUbqqLE5u0sriW1K4fpL79YNNqfsL/vddttvwqoundOeSDfGvE89F5MDFFBVhY3wAHGNGIma1e6QOuY+0J8sz1PXsDb1gcbfWLQmLh1yInh1SAUy4y+ZNE8yfytp0ewNN/DtOlI//5d/9xdnV9B/OD09ffjwoZvO/TDQYfcWODk5KVKJdeCXiZLUt7E9fvz41zDm1o3QFWKAbaSZRSqdGeEeYvv6Q15dqnjoDZuU39lPSCRhdx1SNVeIIqGr/nhO/OFNtnjF5xp9e2lYsQsg3NO7BnNjJUs1c5nJ3XpxeYAuipjoCjGKBpCw1sI0/HULgvt77LOp6ApJUF5htu/nJLrTWqMK1xrLPn/D1aR019ZCBUeyTG4GMVdeeoeCBVf3W1/cFLbup1D9PmDMMZGDLGKf4k09YciKH9+qSgMntk8J1gkScWWvc5MP23e0ffrpp69evXr48OFooPXi4sJDrU8jfdi+w63SVCwqE+mpc5ngEV426TGJCYRi6LUpiouMM3kdrlVnvMqbiIAXZWTkuthZjuIIl6BlWGXHuQrNDGt0baZ6jFba7Z7eksdxagV8o0YJHNqJd3mSNTKYsGWw4bi8W6ut0iLcz146PhAZFPRJ/CiIxAZNM7NqDYx8hnZBV7vcrg7cZa8zGRmbZaey2So1qc1mbhaT8mFPRDaqiTQ+XOIoMOGMY08zHCj3rK7IKFsOTDFJAO10D2ZdYLn3rH8L50Kq7e5DVxboedraadpzwpgD7MM1r3yGew3ujFAuNDH5xP4PXaelnnBthrM6jnc3+W0QWUl0tyYlvdVdiYHO74+Jxjx+nc9SuayjB0FNnNxddKUNtAHAlKa4sLNE9eI3WxEO9sfel9TiVavgunB7/vz5xcXF1BXgh1r/vpUVxrUS13ibGDkMlqhAIkg141bgQ6NGLIiS1jClxj3MRrBcLcwtSFsTao/opaTZ+4HDsGYYj/8XHnGJVbX2jYPp3HEgSZEKE2I0mRY6H7GxPifwqKmbxN9Z/Pxp2ayp7vXVdjB6vEZcSgvWGp28XIDdcnoxmaP1VbVlE2TWe4e1fLCJdtRBpIEE4cHQDIfLNfxYsyLrn9Tv9KRHJkfn8vAY5nflQrCXRZ5nEO95A/vZWKMT4Vq7S1stRKZa6zPdGqP276weWTTtoBDRNLYMFQsSg1AgSgIUsNbJrlK05pDtpTRr6QTibWoVHiC29Km1mdziNZso+prNpYRyLb1P8AYLDHL/QYUrsQbWMcStSprTrRX95i3MW//+f/S/+uf/8LX//Op/+Vf+xv/zr21Z211i3/1YP//883qpX5KSWJq1uT7bo0ePXr165faypUD9+c9/7j4Djx49+j5G/e9z1N0HBt29rZPTxdtuJQBd8a/w9qfjcoloPMMl6t3DR+fRBzK8tt/ne7erTNRcnmJDNMLsPeCWM6CgCLeIb0wZOtOTuSQ7myuoGIGub9nRPYH3uQq+gLdzee80iCPbBxUxE5WkdFTOdsfwdtddRVyecYcBaZme2XmYtQ6Jiq1gjVgnMPbgjAtE4O3k722PwaQoKVyRW8asWes8Yhi7CxBD2VdYo3xOoxbemjtsIq8/uHlffbt3797Lly99GvfOnTt/7I/9MRH5xS9+cXp66jX2qEb9DrdpwbzPdn5+fq140G8HE2cojXAWbDNwysL24nGkdeBSOZkpaUGSKWus6KJvtloaTWfMQjUl2BwAWy4954VBJSmLDUORpAuwbm4EM8FwVR2c1dsTidjB3uLAFkUbiS7h2jJo5VntJmA6HLb07zVTj7KuExiBjjp1N60xCvRLq05NBXedwESGNSr7eIcuT/ouGAzUNabXSugYKsYoiz5SJAxFgTqpX5ogDPvQUdxo3SSJZvQkYhMNmaAa0+nlMmSRxko6TturyCTi3bkQiU50BSv+t150J/u1ZYcFl64GEoEa4+4mdibAWQiivzFWiDsx7ZEuyFTqUHuVCc7uNgQKuEmdd1zc29AEurWxmoCaLDWRAze2OAYiG88CDMlPeAAdXIneYYJvJMQ3XUb+gX/0v3LZV8H/8l9froLrwvb+/ftnZ2c3b958+vTpKFgsSUlcw3L4qvVv8+rVqydPnjx69OhK7LA3+6vrHiapnQRHD4f04fRDa2Gl0fP4IG5WFrhcieUpcllpt2XFn32iOMdQtdw7UmGjXa1PmPs8kTMutD5Qz0ZImSkdi02K9QqJw+whn4poqq5BP6QvbSvOWUOrRbdoFuPugWkTLV1KztiPDba/8Jce/Znf//rf++N/t3/YcEKqmNQJt6LDsqDL3DKEBXqazz0FyKxrZ/055kfUX8RwgHY0TbPPyGeWxtZ6dsZEG4kKbpvYXVQ2lmhqhM4pCu6/bLOqb4EeWXCAnqyHtRz6x+LeYp5Lld9PCA/EBFxJDOly00MaZm8rcXJ6E9xdl5oRc7dvWgqGsIGjAty04UqRDDMn0TWIzWWII/v++Z4f+TZA2H/kt/+O8vPBbx5ueeft27e9+Hn69OkUM10S4J9V679Wm1sA3b179+zsrAa4b968+ejRo/dTsroO1FV7qxcXF6enp9enqP520eG97/EgjMMV2LaKesfqt1eSIZ5LssUn7l9zO36U1ih5wycX86F0XDBW4YZj321mb0/OhaolEvFKY+Z6YJOR0H/3j9/8R/7S/+DPfv312e/8Ca9nGsRoK3cdPdgF4QWwmYFie7efjqpbuV1SWd5t7x/Uln0jjHh6jQ5mXtyr1Cv1GN/oUeDIQX1B9ldBFVur7FSZKPRhCB0d9jCnw6wGpOKNiyzBHioTFLQWRGMY5jlzQU1dDuVKq4XubU/3dqsV4vdLwPh6bD6Ee/fu3VevXj179qx+3VvO12dXHz586PXsnuH1/Pz8yZMnJycn18Rk7+2DcaEQsqLCNI717fHnJoiVIpOl0Vi4tn5NIm4lvNmzZElRUBZ4r1oK5Az2xfKH9RpbTOpcVNf/ZFRlkwhzEnNJvRdgRZKVJMDYh+ROdC0RIp2EIJbIs1snTh1orq1ZsAsjNsKhbS+L/pG/9E/+5Ovf//3f/ruGRzqS+pWiL2EDtjVWwEL5SW8AhEyPZQLlg+SqbmjGXlQs+nlrFwlZsStaH46rOtZvPavHFWnFRY1U6FShN2sqlIJ65/Rnrl4Vo7IxcWbBorjto7dOp7U3DAqN2EBOAQKhgqvsDpVp1NhSkTvZDqPUQUTFApjb88RyFc98F9WSLB2DyJxgRxYA8QG1IBYGdWsvkFI/ZSOw3OO7CgNipDpXvbl6Dp4GFN50POhv++2/s/y83loFl9X+9u3bFxcXU6aUb7Pe7EtG7t+v+rdxk9zbt2/funXrwYMHO9uhJycnL1++9J7wdWaKvemCkrixqSGW7D5jI1HgSypaC41G7zXtGl7gWjuZWJbVVV9yG+OInVoTeCsGYumS1dgi0+sj/1nJ6jZea7XZoGbLsXsMdq5raSB3mR0cLTiS6H/hFMjZVcwMqlbFDCERqSq2DIaVdp8rEfsKNzq98/jcv/7n/kwQ/ux3/lSTLpEAspIYwNZda3IEKxXIGnGP8UNsLLAyA5zmCsOyM24KCwYjwu9g6ZzFBP3Au+w/69qRlhfdWtWeyf2TkeoCxK2ElUTddjNukb3HCCwYZgfjW4YilVEb12hbC1KF4ZFvacY0sdQS2GdznzrJ4s4Kg0gjXCOm0de5WOo61JK5YBmpR83ILkgxd5Wlb4nu9GFSipYng/j9db0UEh8/fnx2dnbv3r2p22nZ7ty5c3JyMoIsvQ95zTk1x8fHX3/99dnZ2atXrzyEHx8fv89O58uXL+/fv//gwYPZbGMWGn727Nnz58+vFevqbaClGhbcOzjPP38H6F5XAy4UXFqz1jg7CO+yvz9Cy6wz6COTlodFrpSrtgy6h0+dCxq82eox0UBPRWgQAwiOkmZ4TTW7Qysxosd5+xRwgUS8VJX9h7/xG//6n/szB7B/7z/x4xto1+i2kJiQ4ge3o70OaM5Kcg1N6nfDtZrZ0xRsLNzQxW/Xd6c/EMRE5XVs3ub6ZmlLtAwkDrVWPZbDJILMAO6vnFCbOXnjdagU+YYl7v4OdY4RB+32XxwwpzIxu7kD1VWsKWHc4anwYXvnGPH5+fmrV6/Oz89F5NatW15yXqv9/Prrrx8+fHj//v0nT57cuXPn008/nd1JPxCvf2/evPnFF1/8AOjDFQt0Zhgfe8gQ+2NlhHdMkwHaQKYfKjUa+CbosLNcVcYjgm6KUwYzXQXCGbKRocE2z7fZwEeBiTYTs4G6TLYh5FwTqMuxtxJahiBYI+5pBm49dDseV63XQRONecS2XKb/x5/7M7+h8fd+57frVTpSVViGY9wNKMEFc9Dz0s3hboShxox7JnX+UyaozypNRabaH5nHPYojajIjOpxK4OG4TK3pwck5waSYzaiC8uoPA5LZQ4UyZ2qRAwsqRoRoy0FsS7Yw7LugEPiqfi1mmxOD46IQgK1SM1iCWIAJ1WX6Jz6OjGO+OaKoiDHbJjlfe/LVKD0MZxmr2Apuvdifc46QHMqQiegNFDZijoA7r9zf0+D92fC8wXb//v2Li4sXL14sFV937txxYeK6X3hta+Er1b/N0dHRF1984azju3fv+rs/+eQT/6HExfPz85///Of+iTdv3vzqq69+ONzh5fqFOaHsJPgT2JqKMu696GzvfVEwthIZBAyNDKtMbFlecnY0eXUOHwywkVNnvVep44cIYSWhOxCh7xWBubRE0tuJ0YLCmFtMbiyz6aspJEVaeoyBY/Eu+eSxzSlFr7Olz2j7e37v3/o7/+Bv/Bvyp8o5X0lcwVQYoejL1IGc8U4V5aznKMuDkYOVUfNbV+jUcQHpai/XCWLLeZg+K+0irdscxk5AFIgFUq8uzTYC8SwXgDsRzYV0Lb8XxLwOI3J3ZOGBGwRRFQtzCv2OC2ueYJIe0k1leSPWCG2+80HFrOGA3/88QNdRq5YHCHGfqzViSw1Vb5NzRXLRPnPZ60yrX0QACkCsQid2dUAAr1vB+vz5cxcd3vKezz777OTkxAsqL6WePXt2fn5+586d74VKw/Hx8XfV4Pziiy9czer58+elHJ2etIuLi1evXn355ZcnJydHR0cPHjz4gSkXr2CzpjHcY5XyV0OlsF9nqBtrDrXFVreT3vVFgovemGjH0LwFrfIdluxFt4H1Eu5TsWKH2rWml5U9notLrNG90dfNkIhXGlU4PRe/+Ud/9Cd+/9//zV/90X5wLVeInenWeonexrM597wNwwHoI7qlz9c3MvPa7TLEjjW/pu7h2ipZ5Pqq0s9UYUpXro6rFlWHWp+B+QZOGMFWzuwB2je9o2RUf7q4F8Bl/a46wRD3YFDMcocJvM3w+BscxJt8y4ZN8wEgfr/bzZs3r3lf8+jo6MWLF5999tmTJ0+ePXtW+M6lyL24uCh8q1nRre89Ojxvf+KlyNYwSpiowqyvQcAr4j2RuoXm6TOXluioqAQVA7BtAe8SQDw16Uls0EwTditO7YtfShQtXiaj6tj3oRMt3gOjPp9LRnRZI5H79J3ppFoVTJvhyMFRRRCJKGHaFft7fu/f+jv+xt/4Pfnt6hiTzUk1MpVYsZHaSE3oQaQGKCXut5Aiy0okPpZ3BXzwt8KCiwRwef/gdBoRBbPEptk+t5/2UTW9hflUuNLcdu+F2TCzEos9oXvaPjcVUDxvxGzbo5DKG9gWZeciZ5Gz4igLtF9SOlGn3ELgFe4q3V0MwgBGjpHuAvG3Q1ctJu3NdL0K3F/RE8d3YiY+p3EBd2ymSJu6DqMCfyZ7CUO0gJkSZ7ymALEDqffu3dsSwm7evHnr1i0flPHJmIuLC/d1f/Dgwfe6/m1KIPz6668LO/jVq1dLH/rgwYMfxJTreDHyStWoEUoOVGsFfeBMUYqysQag8W2NF7nI//e1VfeB7MjUGHRbgPo33laKRAMzsWKgOeKKcoIhO3MnDunDbwAn0u1ZswJvL3lRNHCZ4M4UCImNBRM1H7rJ87QKy1o1aNmsqkr4f/MXn4jI46f/q7/3X/rLkoiZljSIJZrIzrEm7vjVTGWS+NocLeZsNEJMxdboHPur2W01IILJ6j+6GRSExAA2iJ2EzTCTi0Tc+/ZbVhscB62raxD3WdE0Hohg9gyPYzxYj+iyBmEtrLRYpgIUpxKvJa4Rg9DzPJ1Ivcxy1V3dAsmnjopoFCTpfWzYxJQmmtfql0sSk8hFfv6vkB+oKFo9ZVOlch8mimvvfBCdXK+C9ezszKdjMHcGb9265Zbft27d+vzzz589e/bRRx8dHx97BeWF1nVe6k9OTpzKtLTdu3fvPQDcjx8/vnfvno+pnpyclPBaas46BN+7d+8HJI68DeUpw/V7PhGH6DK4OdBVuO4bJWLb4KQvEbWYABdA5HeyO9uViEdf+yd//9//Z/7i/1BEzn7nT/1j//Q/VuJLAN9tkj9S9FsjBrENQycByDKQ+WbaX4b4jXfHw/wKXEvcSJCriHVI1mRYwSCGPJhVuxR7WN9Y4NVEh7Y/aWmos0LVOSUIKbjd+KijBmgQS16OU745GLYa0L8JajW88/kuWEYU2VhDyoft2962FJIll7hWNCPfn/Pz8+fPn7umZL3/R0dHt27d+vTTT0tH/IexsYIOx9zYPApZ6xqNsEsHLkPymBqzaEkY4FTQLdJPUea1dLPvWVrY0/RDpeQAOkEFo+lSlzVQxI7qKHIlB6EOaRUNYh9esYQA9HO0/kmGPgyVGq2eoJ+ziJd22D/b5tDudRxSbeJ07BZai90zo+RS2eLVUhgi8s/8xf+RiPzF/9n/+r/wL/9vpZJmHiPjGZJbY7zCN3CgHOMyKvGCtZB4aus2VDoGxvwJTKfL6PQvUPhtZGjZ2WV+Nrraz21dBBnY8IxnnvJxLRbQlqd+l/OraLIt6CCPKTcwZxrNzswZQegqWedtywZRPbn+L6s5LyPpPb946sfjFHJCekNFd8LzxkAnQYQVYe5q+UukthQTvYbLo4eAukyrt0ePHjlr58WLFx9//PHDhw9fvnx5dHTkRfSjR4+um8rCVevfZvS7e/fulYGgn/70p/76J5984hj5D9XAh+JGVaRIZ6EEgMh5W0YTjcJl5h/dojQkEYb9k+HtYN02iDnVGZNdQiZRQmwro6pyZc1H3Vkor7MSCUrtq4WRFDPNS6FrTbAyqesJ0xgubsyUzAYxSoorLkcrc6uVyggKH6yMlRWc44B2JcLPxsJKu0JN89PbSlgNDcrm9BzT4KqCirG+cO0sP1vekwMg15UWAW8MjvWRnWBuhMKmPdi5puWS0j7qu8XfsrFmrR3mpbCX70PKRsIhoghX2rXLaomsK+OtNzqTqIs1OWGCyIHEBtaIrREbGAndgfOLiLQWvElRJCaScH65ryrxL59GjwOGRX66JcrWR8kEsqAg1WPTiQzoKpTXq2DdUrbVAe/p06effPLJkydPXr16dXR0dO/evadPn17z2sk7oNuP/f2EOedoP3369OTk5Msvv/SKdLQnXo7+wMLulofdOQ5rtDufZR3O6Ilgw1nnMS70Nb9LNLlWupBF0WTmEcsZU4FhdfQdAApTbHSN7vLdeXlRsKH6GFD9+hpRKPHqRz06yW+kL7Hjllm5NOFCWrjAY8quq5Om6XYp7f2fNS0KHumhwQhvDbA1YoTO2STOlNaZbo+a3L6CXenibvEhxIxS2oftewkQO4vqzTKN72pzGyL/2et8GfZuf3BbTRvEzmHE+aJPesUDpxV7veKgs4Je+Kyy+dj8CplBKIUxizbE/IPDT9kAzUo1GipcyUdyjepCQw1ix2bNri5xSglGgdvHLS3XnagbjFcqUij6DNzPNX0UPGalBTt6KReN6KgroKWuYNuvglFd02PPjCsKkPm8w/3vI0K7DNJFYgVIgggzXj+UnU2f3KsYZUOzNG+MuUHMpDLh07rbSqFaSaQ/nzsqVNcNc4H7feosjKlFECJrLnMUpwSL2o1G9cMNYlgOq6hQ6QbmE2ABM4RaZE2PLnPb6ylkzIkZNkLNsA8XbkgX80W+7olZn3nstUlsgBnRMoQ04T34SqvY/eQUv3bu8Ghmvb/xYiLIX7vN+4JbgkX5wXWK3IL1+Pj40aNH11Bf4qr1bzN7zNeHI3x6eurEtKU6eecbrrrZcOhGqkmBDDNpo9osL9+OEq5UIHwzk+s6xO6ZcFcLE2IGTzEZNNhZs9fzFAtNXd1elKZAbkAZBu0bvHOa6Wlas0yj9LOWc5ZcKS74iQVGSjeSsT+uxBpYS+2gPr/UwFy8b4UIsZXEJYsVS8J5llnCKVPxyO36PttVdDEGc7FhU6PDs26xW9IOzL9ZjCoEdGyjokJDfwvt9lIdhi7/uEuGnZJhLpZfvqS0AWcTQRNsXLB4V193Uk8ODq2BOWm3EQti2SOYC4mRIrvlhnz3hkw81GGUZRpE1TX8EvckYoisEFuqTk71qvIsnuwAp3hAebNWIXyfLQraN1pS5jKYRQjYOcL7bHfu3Pl+yfB99tlnn3zyyejFX/7yl64Y9fTp0/fc8j06Ovr88899LsmlnDwEf7eg8Pn5eUl0Zq/vzje8DdCWKQwFIe0NMMuqcoAOO9Tzkh3ZJVezyTGr+kGuLkD8ZtZYWbaI1ROtG2tu6Ga4ApsK1zoWZ8BQdG9JhvidggecxuuFt4m+HctTxZDSADGGmIrk8bZG7Iisv7Q33GzNgXZF0sv1Jd4GJb+qsuGGYeoSwRFDlkXCiy6T8vZX0H3qumxEI9Jb7nI5M9x5crY41I20I2cvR2dhpXHnWeRyQ2LPZxBv3X+lXFNy0zXflurqL7/88vz8/HrWz9Nc6PrszM6Y6za25+fnN2/e3JPmzIGXV14ZqgIPe3yCZOItmabOZh/brIcbl5NbVbGQxVhdUWEEH1dyDX2dHjmoxwvbsTrG7DNfKZ96aR9Fr6iN088Td8PJeh9Enm0EcmKFN/ptK2EtiIJW9GCOFDVKPCyB8j0QOYC2M7ltdHolUa8S0j2a7yQHfXMH9dDvtvc+taVakgWoUdq+eq2KOyTJZlPoAFhgXlGLyoQRJljBliopDpDhcWE89MrzC50QVXcjDMLVwr3HoWLF1GFeZEaQEg6Pc/FmFpqjvZAtGWia4PE+bkLlEJeAIxPZMKxFFFbI9CvQOAD3kQV/w1ZrRC8Du9xliEw6y6OuiSUREXErRVANFRyc/g9b+F6ArDA2oHqLOR64Bvd7WHW3i0uMSrkXL15c8wnaq9a/zbU9klevXt29e9f7tyLy8OHDp0+f1ta3Z2dn9+/fL6yrhw8fFr73m+aBszCKQsSVSzs2AbFoye9ytTYR2c6jlCVtU9PB+oFdRfWAGAIThIUsP4CKOPY2zQ+104eNakStpB5NeUWhVHdRq6xdYVRdVOvvHeqsMrUjsQ7z61oJ0tPhDmT9ARV2UBcgbhC9nlwhNogQCeAWRCDP+9SgOTcMRmQTdnB5ZGZUV8+Mbs11HrfNEQ/7+qREC2ZJG2HnSll5v2D5LeNSykRF0LLZxwd2P/QH+/vbLJ1YL3TX0q0R1xKDsE1yw/OXwBvdrYW1xpLEqHAtsRONeaS9hqFNtNTRLjjOHMhnu8G66BPLIOQgL6GKqUgj1sA6UQJXAYj1Ut4NQMxfS2bWUrB/9OjR7du3XVL5u9q37xwX9iLz4cOH9TjV8fHxF198Ue/Y48ePa2rY8fHxixcv3m0tjQzvtgxRggic3nignU5k+zGI1zMzNLPLl9vDjgSIZX4uZCzHxORQtyiOnGXTB8P4/u6NhYJOuqXe6PsUfakglTOpo4vLYkFvIkO8E2hrJhDt3JvTNMabKSDX3+UyxDvb6oqpe0OSIX4TYHqBZj6TdnybW1FLbNms0b6Tz6zanyzwfRTv+3I7rEwHta/+5K40um/t4KlEOtVxlxLJPtopjRhENrtCIbKU9tucwyj4hte3ULrOAPEsRvz48eNiB/fhLL2roHx6eupmSqUcfvHixf5nODnUuVChoIJmuQtfTlqI1lvUJDlaZ/K+2SGH5DXaG+hRIPS1Y1APG6VjCDBMqCQOHFeILdyTtqtIxA4dFgLTwBWNU/mIFNM9XrQcSBe6zGsEIlXRMzc7akDsJGyLIa5BPEeKqrX2Kwg4yRB3os1QONh8N2bdHSgmiFJ83gYXuEa6NdmmWa1fnLkpyHoX5skIMtxnRKS6lERxqMsKBkyGde5LlAUN6sW5eNOFPdi+HPGz3LatXGgXPRgCBavd9hLznrq7JCh3pwxBjBJCnuvFFL7JV9jJTyKLjkEUbCQc9JY2cijdBoqheJSH/i390XR7Q8SvF5LS98RHRyI1gH5lY9Zi7XnR1eUegd8UYb8I+LQuFazztDcYWYjEa2m6d+HdE3/NWr9XrX+v6dk5Ozu7e/euQ9pfffWVx0Lnb5f3ODr86NEjf8Px8fGTJ0/qN7zVfUONhFGjqREEommkttYk0/P97uew832cOqUiJiF27LkWeWCbEURGYRCzcHyCWAMLw+KWlE6CKw67onHxDYimlqzeNTLU4gBLxMkS1F1QKZpGCy5FtGiHQtQSNo7Cxwql1dwAHDRshwSrLoUrFn7oSuJKTPMrDpFfeV2xOoBhLxx0Dn+fLvV123CaB9QfNUxE0GVNZyuXKWuDeIyZ6G9sO+r6b0fhwTKbeGdhWEEhMw3wjlpRX8ss21LExc5zG8AgsYG5yvasbimGkaAQ8x3qDcK1RO3NWOe/N+e86dZaIV4pmNVy2wVNXiGuERuxRmx/xdUP27e3HR0dPX369Ozs7F1FkO/p5oWoK01/9dVXn3/+eYnFpRB98uSJF6hfffXVo0ePvFN7VRRpH2xLRdZJkW0Hyslc4G3YjAxM1gtVQRTdj4yPBhw513FOhrXe1ujcP+eSDSf0E3sL6mojlnm1RRsHu6qU2WUtiaGHub/WxX45uOuKzgB8hWQy+dWbKSlDymwri17QCrFZwCNGNV81MkIIDypcW79L6REkrTNeuXvHBRHPlUR3Q0Xl5cjB1y2c3koZ2eZceq60b5tUeS4+zsPMkMNzMrYJwnsXZeK7+PdhK9uLFy8uLi6eP3/+4VS8k6B8fn7uIfjFixdfffWVs9ju37+/XW6yPHpu0cZcdnXU0eO2A1nO/zisYV3Y1+QK0vA2/Or6dctQ40hEnXPsTrPkFCdz/ijuShcZ/OsKXmwTWxfOFqq5uzybzjDD0JL1MTrRLT5ppfIqJTznRGBrgUCbIwjvGyaoHbVbOM9Myhth2VGtL5Qo9YwwHPztJFStAjBzlpkVkFu6wxC6rPssWYmigOy2uG/1Rc/V7oDuiklYTAWtF6H76BjoUA+h1KrxjTQQskdCbBBXiJkizVEK5BlXUZnAVr8n7EryahrBFvA1Uo2aOjos5Lz5DL2juuC4/zBgEA+vSGG0xeqEq0iAKViSNEs6rso3uZM/BOX3Uf9e08b4w4cPLy4uvvjii4JnHx0d3b59++XLl/7Ks2fPzs7O7t27VyjDx8fHH3300f37999JX7rodvdy+3myo0nuVc0Burcf51w2qZuKFi2jq2lXdRFwmyv/AqyBtRa6vEAMzViVMMvosIhQ1BVv+73Zq5oqO0YZskeZiMbV8VJc2zkZg1YaxJio+czJE497kiFpEO+B6S6fOBu+uGFwoSuZ67b1sODgXpqNHMCwhbBASe5La09oFJbob/QufTSGKJI9BDBVLQAWzIhT5FaKYe4O81Pa9lK9b4j5OKegiHlxn9t0uXY9kA5ZybeS9OXSDnWmK42SlZJKPFbn1AsnSadsGCCa5UF6IpVeDR2emYgCmDUxiqHih+2735zudHZ29mvLbHr16tXJyUmtMXLr1i336jk7O3OOsBeihb5069atX/ziFycnJ8XAd3+Mj1tzdBeR2KJVeiW4eXZFGkaiK/xtyxAFzZvtEqSVsNpbAzcPPbAsKaNGXEcF2FxRVHeF6DY4bZJrGBx/zbsslyCXvjvOd4ApzFvpBXVdIbYWGtgIww2wPXg9s+WQ3xtygE5FXrMxwWoymxmJAG7Y1EY0Lq8PkUN07npXfnWA9lJW9k57dlvQgfrGy8z0xgQbWx1k1ZF9ZEO8ZlsPdFcE6OvMTCZazJ0GVQEsZDq2V+wNIveTuwa4MApVPxdICAu2RfmCMrijVGHreY+ko0LyHO+H7XsYbUea+x+2Nw7KXi+/ePGiJojdv3//4cOHX3zxxc740iY/8EHBm0X5WIEFNkXuHOlrQMsigZHK5IWJKKo0EW0mavJBrO48OdPF17owaseyL8Z7+YLsnIZBTVk+LSgJsEvKuTMYrgemtViFUWJUU0/7hZR5DWLfkxopi9SWTZC4gm1JY4xJgz6BbsmTBJ2gGWu2Zqy8wK8EJO4/a5+HVJKubn1EPcTBwcq80M+Tehq1MvFL3c3SPi8Ec2XqAiYxk1y6SnbbqyFvIzQPVlqV8swBo1wjdsJuzpGvANMlbcOuoSivDddVNpUdnhAlrCTukScyElN5aM9zGsQoCszEuwYxocOZkcSFArmQf0caxN71rwtV7MK4kGfd+rsRwoXDdBAZgkhQB49V9rhDjUpHhjLAxFzt1ktHywbCNbsPaO31rH+vI4PYXfJGQku3bt169OhRkc94+fKliDx48KC8wXWXXIbpzSBaV4iXTB8evMcGy6WTW3fmy0t8lnYyuFd3xjIrdkypwMJD3jHYsIYcJeY+zI65IjzI2N/MKpO6yGBzM4ZXopPUjda5qYnxwUaitdIulmhoBzTh3WBB0SAOiTvDMmhZKM8r2T14mHWmxiVxpEZRk8WKfEqs3jm2XM7P1BE1gAfoPGcyDsa4Sjqy0x+2Lg5V67RvDAiXK7GxUMJ8lB1dPk7qNAhX2oXF4j+lKXviO9G0tVCNINlhkpgwZ4iPeLgBseZQOxW9teA/VLfEIqc9CjrRpNsl+sb9xqnwRchP5WGmt+NDdLwG2685d7hE1UePHtUvPnr0qLziGogjuX+Pwv63VwAoxZYwzX0eBlatmj21zH2+ci4wie3LJv7Wtymj1kQ3FiqxvxTR9hf85S6kOICrOadTyfTPWZbWUnyBuBoltTfITXDDUka0xAmdArXFXBQZjtxeAo0Y3NM1+aCKUK4gdIB29lT4aeegvtrrgl5W9gOTXcRAHGzOeWJjzU4A2ieON8ORZ+nHjziKMi2bbnl2BXM3z4ZNmcfMPD5MvdRXiLrXPYl2SPYf5jy21ujvc1pfMaios2sVaxDfeIz9w/ZdbRcXF9utcj5s+wdlr3ndJbi84d69e0dHRx6v94kOnMwKeOuusrHhGhFpSNwmFbQTBtEyOP90JPXgBXUNwjbDiBOXicZek7pmRV1OZkEDna5WzMMuszszXfDq8XlfnaKleVmrvL4TVkhMlaM6KdZtyUd9w8Zy/bil/UxKzAO76YgEFLQVwFgP73eirs/QMXRDBvQ+4chSG2AQbo3omMq9emx36z2TIHv0x1F8cerTlYabUw3FGYxyWvN21DZxS1GRyqfKGym1KOX82Mnd56H3noBJbOhJTcwFSTNynlgQqVcCSVAJi/lQbAZYdSgAMrrr4DIgmSEtPh1eZ5JVPrlILoz5/Fimb4/0TEpDomPI6McAiIiu+FzponIuo3D3oPrS91/xYYz2Wta/15FB7KnDp59+Onq91hf25vNI9/AnP/mJe9a9GQWMebjGQ0IPlQ4XjM6CalxBWgsC3WLMGmAddSpDXPQBooWg3QSZ0sS03YOywdSwVfcKMw/fwihJ+QUT7Gzpc4pQvR87YDLo6Q1kiK/+NHs4Mc76yvSVvhRBKyMUjsXjSkCAE2cCuBLbUABVWtElqIQmuIzjpVPh9bkuDq5i4boziK0kZpacdzLhTJyq1rV11itg5c4XGUTg0CryqtqOkoAkFZ30gPYh2aGqsXdFf0qvzrP/pUa00IT+fh5L3TN5RLSJYoB5zGEO9yi6KyXgBbARuhZhEBvN1BQBJg6frFKBe5fYrXtKBHWZrWbeVeBNAhgmlyA5WGZcO+CNNE8+bG+6nZyczM5d/vKXv3SNv19nYUSPvKMzUEtJetj9yU9+Ur/Bo/AedLAC6hVp1Le68Q/RjTC7nTHuks2PsOlD0oLaw9u0azQzH/fBbevx0jTTgBklX18zb2Q0MYjdQLuBfkfrBkZYtlZsFyQHUQZpRSRCowV/zxb1hhWiqw+PXm/ZKHp2iQoPEDuizYSsPT2URkXg6IdyOAdo8w/dN1yNr+zw0nSc8QvFkPhjWTl6U4k4DfOH0fxQSoHQG8otjR8JioUjsezkRlc0oshra0aF2Rvf5xuGKNpSw8TQBu/uJqsrW69LBTNZDRYfd/kQWL/baLKEAjvoOS3xPmxvHJSnHgDHx8fOMl5yCxzjdIXXTylES4yFakXFGhQ9Q1S0U0TRjgMWbf0VJpBdPnXLKCrcSqRGe5NuIZwioz5YWYF0AZTgXEgmix0R6SrnbVJMFBiYyTs6bFQF/ZMNTLOP7GF0Llik9jOXY2iPs4uuO3aGYCvpTLCR8COZcp5ROe7RJ/2NqmJXWnWLzH3Nq6VIK6Gjuk/PPtlQxm1TqpOjXqpJKcmPLBF4C3F48uGRmv2BZjDWOCkh9yy1hpgGrojVji+TybIbcq5VbV6IZT4ujwZ8IQQYssTEgXSG1JVvJTRDLvPoZwXXEmuzWbc9ryQydqRJkQoJUQyQLG1aXym4nrUKG9Dd/5hQY6nun56vzD1UIqf70FHkQ7i+fvXvdQSI/QCOj4+fPXv2/Pnz8/Pzo6OjO3fuPHr0yIlLWyKiiPz85z/f51te/79+8fv/xP/Yb+jmoz/+t/6Fv1BiRjbIpvvbgK6RQDdpjUmAP0aAxArOJV28uYOwFUF+ziuBG9degMxY7lBBBbOOu6nQJDAvqQcSJRFeYoPehjVNnSAN8I7nDdkP7qXlG1sCQV+9uHdsloDoc3efnBkJTUxMgWp9Bw6t5wmNNK32KLVN0e8AarcEHenezHgIYA7nLYMtCTjWTChWsdwiowhWGjdDfxWIkWIGBQExAomOnYzUFVQxj4WoiF3Wv8GK1ADFsxiaaBSNVL8xjOKfnxfoZJvj81PmmrmeC2VJe0+WEvRdQffGRFHPk0JlJx1oLhGdVeFt+RWEvgPJobdegieGff5kZeC3JRNeg4VCPUE5GXpOxrUuu8UEGyURioL6pHOeT2knOkrMKOkpmp20KlHTLw8EQFKSznPKhYstnZvzChzd1t7SmQpG9hCAX/FpHPSyWXq4xPL78+nypFNgDqzwaoV6JFq+m7GPX0+TupcvX27hLt27d+9aGZe//8h7fHx8fn5e5P6Pj48fPHhQqEkeW2cj79nZWZl4nd3+5v/pX/3D3/23XQDnx//gn//xP/jnu9yqMZmNgTsyRiYsL75m2N9DtbY180JrqSKa2sFBBjQVDyg6xKHWiA6fZRMVznnOpAdwQ8fs5NKaG9qOzkKS+69IGcyjenVYNYqKGERzBajjUiLvNaVebygLezaG9VmiV108QOhN0JVYN3TQ3qvk33fdY31ug5giOQROyy9S/JyZKErAqpION/Er0sPb0fy+eZDfhZQGSgWODG4S90QqfKiOQRfOiqtJNNINT1sCF4os8pIXotfVG9ejWLZQc6BnJdaKqhLGUf8VW884R230PXo6RgnYB6jnKG/kGPm1FdCNJ9gwqc23HPi8Q8YblKL2oXZ9I2Sz9jKdhow93eHf8/bs2bPj4+OdoOr1CcpvAxBf/v6//+/84/9UAEmEj/74b/6Fv+DVI4S5EkYpZ6ywgAkO+1IJNiWQKq3Kz02gYCRUcBWFdwZYpVE79AzneOK+E20mrWIvVas5yJLnhx6clbCSbgpG12XLLKo7Dmb1uuTFvcz45fqLATFOmovOixqNEBWCcC35YCPe9HLg1EyJ9TNvefo527GghFFNLnPpWCIBpAoSGJxuZzu5AiR6pmqt2KsVQoqxTOYVsFrJFD3Jyht+Oya5JC/bk2YuGImsbZLllXY6QPWy/BVJmeQgqXNbpiTq6E9H6k/7t5jf531upsi7MtZNTigwRAIswACKV74gxNHe/KAxPYWG/iTWrFtWhbn0LXNrwNF0XeUaBzLdDBx8mva3PTHq8JSbMGZqY+G9SWWeRJFYBEySCGemQaBHjTA3MXalCEspjo7voAz+UP9uqX/HmeXHH3/84MGDO3fuHB0dfVfH8NOf/lREnj9/7kITt27dOj8/Pzk5OT09/eqrr46Pj31qZrqH/srOmZoULf7oV3/4u/+2/3yYV1tkCNJIID8HWfivQoTSc4c8RoGFe3WN6Ol7Jd1ruqAFkQBlxI5BIQHmTEvHlF3+L2kvwFdJS2/L2TZAX3R8WNIlbp3IPA10tq085JanCWV0FBQSYEDsUpVCwDgIfvlcgbVhVx4OZakW8sg/G8RIVO03lDUlCFdim95+fbC5Enw5nWV6opWQlzaBMGSKaEj+dY7igc7uRCrMUNXhUSACFRqh4kmUqFh0+A89/F20qss8Jnouj0nV2DTRVtAk9QZApEEx4kuKDZrPAnphvrQpvG0gUzmLOOEUe7dDYUHFf4CYF1ERIETzwFdNS6v9fyVzchtIZD/yrNUtp70lwKBi7CTUuPNKYoeQ57FQrotmwZMGcTh1Uupw5EyxeCAAIp2gyyIYnrYmnLfH0w3gCn6s6QbmQF/fuduITC0WOjEZKVUNNE/vPAPRhc52P0NHf5bpaYo//smsD9oJomgQTidnt2+d4PIddfV+PedyP/vss6JTNNru3Lnz/tFhHwK9DqVyyRs+/vhjyYpUr169un///k9/+lP3vXmbyHv5B//B5R/8B/7zr37y212eT1wjUoJNjLkc6KyFC+o3dMSlNDfQvWZjQOS+D5GOuBsTiFBzO6dBHDmbqViKI0xBYcOgoNJKAnDJRkQu3UYcHiN0+PEDjCzZZmKGXtoNhAKT+CCH2G1rwUT97K0RI9Ux0Dr6+iBOx54gZPTTKxBfJmmL2hG9y58NlaNNsJHmUNqNhDKH6x+1TwurS+K2tgVCDsnTDDWsR0KEAS5ch7qTneccsWFwHk2AuG8hchu/ozrQjBEKXG0tEUUT8MrUptVsiGf0vCJNHwdYEIpYA+uounwypyAv0I9UpV47BgPJB0mUMJWdZB+tWjY7q1/z3ihKGtaTyFwH0TJo7N9hAlJClenVLGfLvdiKukupxFsUbBlykzdD63liINOpU/ayGhvWsVAW6MoqlVvRVCa71ySld7glc/oSBDPVgDNChFf13IuiUzr5h23ntgWXHOkHXqvtyy+/fPjwoSsWPnjwoBZTus5B+Y/9sT82+lt/ZXtQtj/61X/4u/+u/3yD4W/pGyisMv/0gLeirvPgBJRadrEUd8gR1qUYDE5piop9zUiZF40GFmHCkCN1YrGU6cDy5kiEhB4OGFEBMTWiQBE5QPwV1asMy2uiZ/IBZoQKTQAxoBaRGDYYF1baLFOppSqpVfyA8jY4LPBNEkG2GpvMI4ZpsYoABRtRlFIm+cEZhmIgmIOwHacuM8RJHEOQvPsk1Ti1WG3hF3cMmvSQx9HcmU9BoxN3AAaIZe2R4EhlpjeVdRtD+4QroXd+KrxAa0BAQhpISjCxk5c3bJQm1TATsMPR1A/BkytFzDlM0gC0bDLkzo0m2jF4Hph5Pw5o+Enu08sVYgRKf5oQT9JC7iY4rSpoAitCxk87ej2rJuo5bez7Li464SdWtFcM70VgRGgMG7BhKDnlSEukAMSQfm8kl8wlBNcJqb+nZajUxiA9UxilGdBlDrLrtRbtVubnyE9dGEzuJo8K2xusNcE3sureBVMq/pq1fq9a/45TTHckd6u3zz777DuM4q9evapF9x8+fPjs2bOHDx8Wqf633H7zd/70R//T/747b25s9ZrII2zz7NSrbt4mUlDIFSJyQQLM6Mz1LSnhCiaCS6oInf0R+q5s6aRhaGppjkDpmJdBVN2khQZaH8Wi6XYtGP9wFSpsBTPCEDfSqFhAjNSSLoiQ4wc40aLLoiDowTsP2wqPN5TJDHLC9ZCkDGMC5zE657Unu4nTvaUm9WCmU80VIgmFdQxhXLI65VOEGtNXuqUbA0iJSRESzP00tAyHSHZ5QexSQiUGNFJTgg3F/v3QrJ+OGbudjmobzLsoeKYyWOX9rskajmXmF0FpNIeba78gEp4LbtjkJitTB6K0crNz4BrxUizMTT0ndQjHg0A/b6W/WmpGZJa0eGEv5vrX0w/cMFxKaCSsJLaAilgWC6678d4n91atiDhesEaXGipDENxrUUsOrUhpBySQ7mIXkIjuJrtnyJm790FsjY7wNJQkIrSj+lPaibo9yFV6oe8wnv06sqKuG2vp7OzsyZMnDx8+9ID7nROXnAX81VdfOeZ7fn7+8ccfn5ycvP2+/e3/jX/oP/pf/4eFPNT2N/WS0qXijXvJTWCc6Won9Cz8slJHlTyhz11Vxz4Ek3o9RE6CrQLHmNw/UTFoXKEVFGmtyf3gASpdoGKXMhjbj6A3hePAELw42CyuOVg+5ijqoFvLXlHdSccNolE2ORssOr9zNrDzWUQUfW0NRA616xhWFaz5NstT7bG2z+JVDT8W7hJLPrex5tBnGXdXpmOJSa0ytN7qZ+4UjUjEU9S7xLsVulk78gXXPhygJfA665XtWU5tKkZvP/1F6URVGpPWRE1YnKBkWZGsJJ1rdJfSNGO14nRCNkNxYeRavW+SwFbj3fdSXzs2Im19S3PrY9wy+LOPlDxH1xPXBaZSbaB0ZaDiw3ZFgPj68HD33x48eODqvc+ePXM28XdOmfr2gvKP/tyfPP6n/9tHYfONNf+/7jd/GTk07HLwMRGEjXrJxiNxHJaVQeg2dCrWMQh38x6ctJibUjseSYWJqNNQVoiubu8UrshA6UbjfFpMdzCW9Xfhcm/+AUnfoEE0KMWMYZRq1K6bkB0wd8cQsWRYgsvslVp+6xAhUnkS65XfBK/ZNDMW1giwjPNCheutkh2YBqC591gv3AwTVTEjZkMBhqhFLV2ITMDK+pZvVWZkqjgc0DfqBk2RGwZkLcnHOBmJs2RBDGJpigjbcwxvZmikNhLLmHIQczGrLJ0B6ylH/vk0MYXB0m2hpIJrja49Vc2nJqNXCJFqT64qTL/26fHivUsC1imIjWZ4jKCoJlvIUZBC5xg1WptRZE7HrMMR55nLOkUVOFJCrCDmCn02ApC6BctMH/YT24gpZIOgyUjDXE4z4Mpmsx+C8nuof8dZ7M9+9rPPP//85s2bp6end+/e/a3f+q2HDx9+J26z9+7dqw/m6dOnN2/efPXq1cXFxRJfaYnfNLsojCorHyIoA+kBpmKANRqRsb/pX41g1jYrzWHY1guIHtjWWbCYRLQqEA2BvBXiGl0DEyQvjlSdJnCvkC5TnQqMdW2qBtpc24RjyhV7sAwVcmpBx2N63pRTh/lAH5QQiMI8MAAETNVUTURUTYaTBStEt3FDRkG9+RyEjZjbuyum472ZPwsGRHchC1v9SZhYusEP1tLuD/UvfHEHAatX6gBb5VlUyUHILRFi1Xx2J4dRC7dI1Gc5kQTjTvXyOBhyGa56BUQdJivTgDci13DwyfMnxtFhT5VWiEGjM4hrPVzvXroOBjM9x89egPn599vAUdd09WeHOqvZ5DLEgkp5OZ8rqvRMBI9e0dSGI7GdaCuhk9CJdqIb0a6WQxlETSBfhZCx6drfqby5S0YKLqMW3P8hMvhRa4bFV+hWYjrkwtcpXTG3hIjCmvzP7+ei9Wa53dpVFgEftvew3b59+/bt28sNMDx79ux97s+dO3c8zJ2cnNy+ffujjz56/PjxrErUe9u++OKLEkNv3rz59OlTEfnyyy9lmSm8V+RlknCpZc5WC2Pgg4R2rtK0XBVcsjHJPh0UirSmJtJa6DUZ3lGGyf5frbYmI1G/YvTBjPehR8G4gq1gXNibKKg1auqV3Sq8eG6NHctljJxVKpXJHjztA1O18jdprYv7TwRXg4eJ7Nxmc563zuMJkRVM95p5KE73sxIWmASIfXevFMMYRhnOfcwWEKHNNHC+0XkQeVvB+iwK2Yd4o0Q6Q2o0zrzjWLCQD28rxYdONai7NVsvx5amyACGzl6IfmM3w/SVmdv4YXsP2+PHj7EMz9y+ffvu3bvXcLfv3LnzxRdf/M2/+TdfvHhx584dp0z91m/91t27d79DG9udQfmXv/zl6E/8lZ3lsFZl3ZQ906SJxiwi3BMqIQM9hEQWCXlUjj3Hf/7hbbOYW0fdjyHRl0MYlkvVkp5+G3p65pBWLLIFMcSCrhSW8dad2GsOiFuBCHCF2Egc7a1LEg+X7tFeUXYp7UxXy8kRZUZ2QofRplgQtirglzNZzwTTMfec83CPi7olpfHec4jE1CYd4yK6z3mcsZR3gNtJxBN8o7/Bcu1fUq+eq9vA3H2qfqfLRaJnsyUcNg1/19yCSsesqea9mGVAmCH7iXoJkkNskrzArAcvR4rXw6PPCP72oM3RXtUnHbXOWW+kMf7e2g7R4eDktJFrao/UH6rfa1v/jhnEx8fHx8fHT58+PTs7e/nyZemj3rx50/uo72HixrWTfvzjH49ev3nz5vn5edFUmsLWsxY6W3NWX1/ByXKpSKrBJhrS9D1FpGMIKItykWdyVaNF2ohkqYcGMWaNYxtIEIyX7CZTdAXerQIrQC1pA+Wnc54jjJmGZ6RPCUExo5uMYTxwtNcyQYOVHISfkDJV0cA6BncJIMV1ZWtNCYX5oIRjyiICaEYJ2UOWoHdHp/5lWV+i+5WsRRggQjEwUv7Mv/i/+8/91d/7N37yJ3+UuSclwOTKR3MO0R/fSmKtWuv1Z4OuTG6G3AUteltA1mYSJIUHuiVdNkKo5Clzs0HWiK9zv9q75QkF8KFOzqD46LUXMAGCOcCLZVyCk+gkeFPBF98VYpf8zVko3pr8TxklNED2JuYQXocfSMugk/TFL2uC6SkBURmm95ufRhsqhgxVqeBaTipsECslJN8NHU2fYwgSyYKAEYcpUWEN69C2MSupuTAFOmpHLerXQSxpvOSQFns3ofGFY/VQS9Z/XEu0zC/MEhOhZWglNjAn332QOPy2t7OzMwcx/X9nZZgclt1ToegdBrsXL168ePHi9PT0yy+/PD09ffLkyZMnT94/camMF41CfK37v2QDuySDOFgKBJFQqZNaqHAfJu9cxQWIeizeuJ6Ds0gyTdJdszfWLGW+O9lAC7ky8sTc4I831lCw1k6LcF4/Td/zj9boyIYT+rLv6oF2vuL5kD4rm2xvYJv04o+cWe56X2nH4pvsO79C0rYrRNE8X5IaV2kJZBkAcv+TzlVu6y/6v//ZP/un/8Uv/oF/82e/+5M/8ZtyOanQxKibLJX4VndkZSQ7Mtpd7Hzms1SMYTkpP7gHLsxhze95iw4L/sLsrlI4ZoSd5LwvRbEwuhKPdZ2tjP1Sbib6lVdschTgBkYYfDSqjqScPc87npeK/D4+mSjYOlcao6mfrkZt+vSzx+HHPAxuw0GoLtAhbBBJNdFpS95zhiAftm9rOz8/90j6i1/8YinUSmbFXtujODo6corSxcVFCc2np6f++mefffZ+dn6foLxkErtPUEYm2xZmxoizhD6z9cUBrYW+vyhsEFvkEclhYh9FSZfqg1zBS3Z5b1Ge8dqmgGRRNRAFG42jKl8rC5wty67CGmE7t7oWetOEo9NLKLRpdAZTj75LaTAsTlW41u7SVpQ+hABcj4V38tJKmOCSTbZbj6PC5+/9l/7Z/+zv/Zs//8mfLETaqYCy71ioZBhTfEHnjXaffzUmuXqbMwGtbYQKuoeimMS+o48h/3o+LVz2qZOidg1M5yxXSYhSBkNdw4gwi/jvjGiFFoa+CO2zvlJCJpJcr4rkOExPQsr05IzUMGHPWf+TEB5oRGLyFpksjVQSRTiFc2meuRWW6DdsfgOt5BqWCT0Z2DmOxgJyRSzYr7XQ410c51DszS1Sd0HZj751jhtAIFwjhuwpnfiXSZPEsAvE/7B9V/VvsyUyjZDihw8f+iTsp59++q0O6jrCO+2I+q57aJx1xVmy0NkPK67xqhRpNLuHFQQ2UrOc6IC02A2Dyox3dk+amFE5wHwzhyvYSmKWL6gRw4RPFQV69wGYC2nj/DjxjKhxSMmZ609WXTX2hmYhQ2wuoJHEZ5NiJCeEawYXU8oLa1/yZYW7XIBFT1YaxI3owE8v6ymvYGt0BrR0az4VEYVMuU4dNWbR9EgtsrzlVDdgW9ltJr0FmEg3VPdjOfMeJJQkJRmPIroOL4WulpXNAQvFm41YEFshdnm2l4QL+gRJ6+NM32IYD+rb1Aes/IhGd06kiisVQlVIhgYxuIkcrJ4GyvxrmHSWJZUxahtSOzYtQ0ddZaHhBixUtazgLGt0lwgKG82cRtEgVhelGAbmgoA4Lb0B4ecKGqEu0r8Ux7zXrZBI7aT4TnjOMQj+3r1sktILIWxyrKoUjZN8cwbTRWk+VRRcWVsgIg2MWWxke5qbjygGJLkPJoayyxBrIIuq+IcY9q1uDx8+rIPilibqd6U5eOfOnTt37tRIsWs93bt379NPP30PWk9HR0fegi0zOrNhVyY2sPsUotJTkAZs09lFb0uq6gFjY02AdRQfrbFMM/GhvGpB3DZgsmc+mgiJGS10DxavoxpIRnIHeHQJFjMlaJK2YC0TXAqDeZQ0DTdIIaF0oq+laRdQQqNeMsN/rh4g5ic8ZkEby6KI3oruREBdwTaVlHCO0SOWLBa+NF3ZTTJYwy4QNt0AkdpKmJ6NqnaNmog5+9CRiofSvG260bV3sWvyNakMdVQnQ2nFtLKkxYm6B6ASo8CIOJxspYwVxZLjzVVy05wkpKSrVp7iHh/FQe8ahHQW4GNsMha2xkATcyACLihEYAzlPhP7rDM0alPrv8pBAbP0ZCw2ZBav1AiF8Sy93Lc630bJReyHiPitbScnJ7U33TUMtW+AFN+6desnP/nJkydPLi4unDJ169atR48efdsaGvsH5TcFiKnVv+G4Ime7SqOH1EdjC6BWrTnv+FQgTT1yWi+XNN6H/ExWvZHocAU50G4Tdftii4n8FERWGgPjpTUiYUqdHp21hZplUMettXttKwwJ0cheYyMd/050wzAipATEMJmvcjWDyNBaM0Fdt1nSItOVfN3cWDjQVCLVl6Ba+XuUE1UxqENxpgxQDMZz99xY6Qsb3UVtxFzNqvqs7WQwhHrHJnuylHmy5rqmbK2gwzaMNS6nm1zm0s3HpHwiWKGLlZucZpnKGhZYaTxgqiMP0faTSUSkvmZjomE8NZVNF5Fc2vajFmE2rWWPouxzfXOohAABAABJREFULdBZsgSoEoN+DHfDcOgC5Uk9OfEomZ0Zs02Re1RYQOZh5TJ5a7b+Yftu6t9mnxD14x//uAQn76M+efLk6dOn31LVeufOHTdsffToUfleh4Nv3rzpB/DZZ5+dnZ09f/7cdfod//YG71X3ijMRImFWKqbu2qEG1ycaIkDl4RnVt02PlHEFa6laCXLPPr7Izste+KlwBTNB43qsknXliUjlUH8ciag/ESBeHiLIZqaocDoslUo1cKwwwFRsBYvUFawVcz2KWXs0KUTX4WB+lpEyESBxh9mIreAw8ao+PXnVN0BWiB2Ck8hUTIH/zO/91b/nr/5bFPu3j/+TVUz1BVRb0ZYaBWHOvxqTODHCiMu8hhFRgpCWmcWuz7VCDGI29JmVsfERG5gRsaJEtxJcUClVNUUxI9Oexgzi7CfrSZKCTBzz/i0mKqTC3PxUKM2cEFRx/ANoYhExHThGd0gCNMsn+FLuFWBH+EK/kkhIEAYxCpoqqg2IusDoKat7Ht5OhBBAQFQJVdrUf0xLvWRYSdhIaCQGaCP0Xe1PAlWz+5O35V3YuoGtEd3jdSWmFWglRVKDSAAxJNAMSaRCc81vhGFbhW/UKGiyVJYrO0fR7MgnWWIijeTEq2gQ9w2et95+rdq1pUzaXjV9273PPcPfrVu3Pvnkk4cPH15cXJycnJycnNy8efPRo0ff9r599tlnT548OTk5+fzzz8uLL1++FBF3NnBG8+np6fn5eckknj9/7n+7E6Xq2KjEAuGNVsyZVHiSpF5ac6itiZKiAsC8aMnocPrbjYUbodtdB+7BX87OnKZilwyO7nnPLOQpnNpaOu0nG8tHNmdnLmFQekHmcDdfG90trUF0IbwME6stoJw1MNpRIVwj+z4TbZbD62f9cqWX4WBmWHZeLOhv+aM/+tO/f/4nzn/x+m85+P/89t9BgFX5ZNzLPrwsYlukkJB2L0WTA8SwGylOEoobNkEiZdSwlA0bSLcneC158KXcA4fonJ9lglbChk0eMyIgypnbqaXW/uMQvhn/91C72XCwmVjVkePbeiODffDr5e51+aYyYJwBBsSmglLXiI3YGjGAlxbWDjCnRn6NIhWZF5T80eH1A3SX88Z6XGgRYatEzBibKUwOdw5sYPNcvKtbJX3o4O6/3bx502FTpxIvQajHx8ePHj265sfi7KhXr1552uDV5aeffuod3Nu3b3/xxRffdu92Z1D2vTo9PT05OSkZwsnJycXFxe4JJEgQO0TXEcMpjYysVRhZXKAyYNLGKS1SBfnuUk3HiAtTVXoKce9LVq8kzlypyYnohXqm8vFLsC6bVOKpTpTllmUDq//k0N21OsNr7SoL7v5PLtncQOfHEUWXjKm9uPC//U//7r/z21//v03wr/3Z32mpMyXYwhAG0E/XVpUIigtoOQ9rxI2E4vGgg9nlNFgcJ8fp8spvVKGAVLcgrhM8jDuL8wUUKhrvQvTAGDsmeoeeYu6Xb2ZI0ZaUNaIJXlvPfvWvO0Bnohs4qS9X8ZRWgmboQIRrxG+kaG8mM70iZ+GePe5uNx0Uc9VH12WekIvHLZOFVKeH+PdElHO7FeURO5DYwPL8PaQfccu3TU0u94xCuJYI+ERyf3ArxEasu8o6sVVC88P2zurfZnto9FJQch/1008/vXXrlreI7969+7Of/ezbGLQ5Ojp68ODBkydPbt++7Rjx+fn5w4cPRaTAwffu3Xv+/PnJycmPf/zjW7duXVxceNe6vGFbmNmud4akYeRy9Y3EbO014GkGYIsnTC1K2yBKkmqd9ZHra6EVupBsoLPhBpE8oHvtAphpWf8VbCRCGsDbd+4RSdlPIb6jcuLHMl7fYQO7OSS5WBeSawRaRCQgYqSE0pKrjxRupucyAiIutaEwS0C8OULaILp6OiDGgVsMKtHeIkK/Qnzx330kIv+IyN/3V/7ZUYCJSUqp95b1f73UfV5XXZPXT36AtXnlatPpL2oGjqr7cDSbdDgki7OQ1PZ5pScpVSeTOSfw0S0PtGuJHXSNzmTVcWAVygrxLyTiINHQr9eDXh9VwUAbmdQFmFG97RnAADNBEGsAioQRBSCNJA+yJ/QYukDU3QAaxDQ2Alr+7aSUlSyLUhQdqpyJafcaxECDrIGZkrEIEG8kbCSsRSmIIp0k1c4uK0SPIl0Z+XE2tw6dDMtkOqmRoXOBGWGTS34HJkJK1xw393xlXh01UgOiPyZ+p6exLwrFm869mHgUFy7fKzp2y8niVbdfK10L1+wrvdN35XT6bjfvcX755Zel2evl6Pn5+cuXL+/fv//zn/+8HMi3sX3++efPnz93YNoL++fPn5+ent66davkDY8ePXr48OHdu3c9NL969erk5OT4+LguX2c3z2shNkeZ51z+N1+DvbZVKUE7C4doN9JEYrsbyQh7XYqMChfeKWSZCkrOUNHIVIccY72v2RhhFL3K1BxFWo65tJVwBIpQ0nbdOCw/7059rfQlSm2fIDwRrt1HpR5PHH7kn/7985f/vX9SRM5+50/9d/6pf/wbW1WmbfKu5wS5/XpN7xkSaeJYYDNRJGl07Pw4cqbazOgDmJlWfpe4GFEDazm/lPsAslHX2u0nplzHYu57YhNhRy8phxNSdqXX2duOF2VqV/SG9LYQY8MG9CPDiTaVWq2x7eF+tBYatYn6ZU/NyynFKDnkbJXb94oITibeNgwxPxRFSqUBWzrhbr6qvKr9dBS8ZiMftv22Yh7z+PHjJ0+eXM9Quw8uXIpfD8S1Z/udO3cePHjw8ccfv3z58tsGiPcMyj7jK1mJ8eHDh0dHRzuzBaS0NqOuQzPVA8QSfD18XFozHYmQiV8Zq16UoPR68aZYcaqefA/zXnlEdsPrHH0S1jmApnx97kcfQCVXGlsLNYG3geWhnJGOX0EMkloFt8/HTCL0hs0B2s1M3s7qnIymOPY9UcVO9n/xT/xP/JU//3/452pkcGfgQOXIYn2A4IZhBZ/EzZJ7kAPJeonenkdlYzCQ6WcPx2P/Qxm7Q7kUsoDZZwIQ8RvgNZvS0K69fMufHyK+lgaYV+A8UOeD113A/j8CeJhqf7rUr7G0Qln1120Fa8Q6CWkGF+JKuypiLkBKdJmKV+VIxWVHDrQVkUPtkMlDHdW5CJeUEQ08d0yzk80wmE0w4rERxRjpwj4eEf0Z7iwkW8W+U9Lb0vZXgTAiuhZNP0/eaxC7CLJWNwyuEpLdv7HlO2Ac/5pUwW9c/zb7hMYRruwudq7Z/y0pMT1+/PiXv/zls2fPio/B0dHRixcvSjv66Ojoiy++uH//vis2ljC5X7ROi1cj5g0xDptyrpOrriyM+nFKD1zH0CD6eGlHHTmxTJ+4BhaEDeI6aRBP3+zi7kZBYpsKOmoDaySqpKUgi5+Wqfw81iFUSR57SfBhMvKTovVwR2vRZC4UZgqLI8GJPOlTVknXIBYRVUPUkBQPXdZgMIqo2TdWoY7TIWsXBLEw5BePYP0gPGDsECN0U4Riq7c1kxKi+MUVhM7/oMEIDE0+vCLiWYI7BgSwo+PeMGoUFYpRi4CAm9QZRSVML6uKrcQ2ogBnnXpr6zZN6LkFWixi0+ORGcl2ELTJjRYJCBSIApKopFEaMRVpxDqHhvOATCPosi6+jvlWMFG3JK67xBh2QRQGyEqiW7GNdspHbp1dzuRRM+gAM2PQSWMaZgInZWOxg1PnrOJub6VzUw3MVqrHYlkZRiphqazXmb2bMmPaL2WI3qvIo0MiWCO2oh0NC+CP8yzqZ9OdPVzlw8fDO2pLbUUBttSMF18dMvmwvUWkvG648MuXL8uU6FSA+PPPP3fj8m91/4+Ojr766qu7d+/WUfXWrVtffPFFHf29HVtCs8so73/35jpknLfyKuiio8wBfM0Vk66olXU+sYrQf/IlmxtoK4sQLo2vI3sAlP5uA1uJDwH09H+p9GTdriAza9KCxmHBg11+MiOYTzIQKRW7x7YaWno0n/U0T+gwi2tcZlCBAjYSI3DJ5mDyt96l5vKYfzJUIC6tEeENtaWSeYed+PKrs8ZBS/tjQyWT2Z25ZNjCaWK+YVi1aUsx42fOpJ5pHZwuLg557LnIEyIH2h5mg3svHfeDMnVDOahNbziYl87059RMhYQV1QbDPeOKvknjL4Pgs0YksXahaaEkW0UUjFh6MDpfQYhADqSLXEuaTLeF40Jx0iuu7kJZYQL1Mgs6izQSi+JWAzMgzmm2cGiHsCdyET+Qld4IKf62FRi+ja02o7t165bjwlMerle+78GxYJ+gfHx87OXw/fv363p5DxEPT25nBEkxiFm9aFLs17d+RDXAVqOonpqp0lGbNyKQ9hC2Gg1GaCo3hrVhVtUvQXaNKBjpDPCGdhT5xlZZD8EONA1iNhLLHAYwRX+J8QqeVrUDtN0EflyQSp/xTT0oGsSgM523RMylWQoVrjRO9aY4GL3tEYDlUJ75K4KNKxOmSIEc2rwiQ0UNHWRQfnUous7ubcAO0edx9gIORRXguLCnLtZHE3GYuBFTcewYl9Zko6YxZr0FFq/B8c4a0Q0q6QwdahADaBm8Gex9guC1YVLIZBEXXiO2iFIkJRO3LOEPComUNaJ7TmDIN/eS2aeBy0BMJfiLfg515mr2et/1hBkz/8CpS8Pkaq+nsJJTwcJNlXnWcLiqSpKrijidN2EGxLRzeOQq7rtOq4rvohT+daMhX7V+HAPEH3/88VKNOgpasodB6lseyYMHD05PTy8uLm7evDndk+Pj45/97GfumeNTNlfStHKJABkvrJSepGkqam6tVjWYfHBmVJWNluyZstNdlREpAYuYVxI5XSE6kOQCT5Rp07YQduZRo74tgyudEtkOyZW0IC2FIOisq5g7Wn5y3K1uaDwK1jMpWq3jmudTtLYBnVRNruS7ktgibFxLcOLOOWxHIk8f974BSVqhVn2SniHuAGWschoM0VLNhoGSj6WBdV4nz/XVvcDW4WXiqHQf6nIsXbSpqHRm9CBHU83wSCqEyq3YDJQcKaBCQoro0iT/KI7XfWrmt7r2w3jHHGVWMUeBVYzDqoyCyOCCD2Ol7+GN1+v6QxpYmPE2JYcnIGkcc5rADXh2KqIo172/3BiCCJ4hOZLifPAcgPO0kYtpFHWUYfe2QMydaChmykJLyhtJtjhSO2gr2omqsHM5yw/V5PvarpsxzrNnz5z4IyJbnGBdi3DJ8Ofdnp+vv/7ao6qI3LlzZ3rGHj9+fO/ePQ/Nx8fHe1KokmlY0jxFrUbqP2yoV9FaKVarsmEQUoH0c8EBrTnUzsc7OARq+8Vzsmg7IlxjxENiVD/Q6tzhQpK5ZLOWbiMN+zm7/rtcIuA1V8Id8wIxCRzHQQrLbDFXwXl76jx2DKBmNRtlHn2orTtReawWXhW3EjvcM+cQLdNgTbG6k1nng/UyTLBZ8AUSEJCDHLz2bT8UDWLOANOkEtylIO9GsiFDrMwStx7mdyD1W5+CbeRlt1/fJF0oVijM/gXPYGsl+LzUKE6VSaZek5ozRgg1HWxmX4ctj6kgTMsmSFeDTWkCSah9fsVM0atSl+xzmG+eECRycEtrWz3pVRqZPlPFZq9RPvwPgO+3vhU9wO/X5kHNceHt+//VV1+9nwPcJyi7MlVRf9rT3raEgErCm9MHOikU5RLE44KKqMZoWsFtfWjN0rHShMg5wagrrZApb0cZ42B2P2OkAurdZWcKT1qzkpWL+1Zf/Z481sDlqniQM7A60KkMFheCoAhe2+q1NeN45WV6sqfr8coNwwFisuATMdEFfR5RYR1bR3i1z2WKCHf7poAiLdVFtFS7XsoZCcHIlnrMXqKDUlqFQKdih9odZrVMDA72SuBdb31mohPP2xIvEna8saZBbNmIXA5gEJnPuA41tqYTr3EpeGXRzU8KyEWFMgGdbiBUneoiNwFqpnD13GEXcupvpBndERLmGr7s+9wjICIBxFSrNELrS+8aUyPaYssQOcKEFjVIMZfs+Y3dMhxk5AXVZbC8RFTWPj5lRBm0EGjiCLupiIIHEp0Y9zZtpA/bt1T/NtOgvlSj1tutW7fIb53KdvPmzZ2Dq+7t88ZfgZ6MO3ixqprYiCnM8vs21INhNu2lr+RZhmkhhBEwWkhBA7AshVgf2EfBoZJ72NB+uiKFpHdiOhS5w6h9btquVry1LSmF012dQOpwuXNnLtnMaBBn/De50I7Og4hk+nCSKaiozqyU46tDZJhTO8LEJ8EELcOlNZFwrivAQ3Q6NOtd9dW4HCB+4xqX4GBd9jhNmIcAZYBL1EoQxvFXJ/xQRQ4Q/4hJ8LFexGNij6oJDqWbTZU4oMHWQSv3MOBm8YOR53xnD0KfggKuJGZjiiSxv06VpNaes77iO3GmYyDRoJWsAubnwVssQewA3WuugliQmakPE2ysUS1yyYl7nnGVPtlS9/2bSEeV5K2l5hYrTNABrgJZKWinJKajBlFPZJ2P7PpQOvhwMu1wP8QdTaMFAaNopKvyIwgbMeenr5JIxVjByQSb7F9RuNIrid5yMBGwnzOq/70x1vBh23O7ffv2q1evvvrqq1u3bvnP26u+98l7Ku3Pncbo75P7vDOq7hOap5DuxsI6j8LMKdXOmqhwWloU0eFoaY6ExCXhMWj0aT6PphgN7M/3VnObMDbz4Q8cC94N2B+XTKbklwzg3JS78HCPPLjI/7HibmQsTxasZHeAht6J7KiRGsQJMSwDqrUYgzOA1rlLXacWy8LrfZut3YoFX6lCxI6vnVydXgjPp4/xOjcJ3qBI5dCuLaMM/bWQ3APAjArE/Pe0DMiN8J0YL0RuJOnhd5ZsZ4/7fkTJRNthCuGYsgkuJcwR6JZS6cE7Wgt5Jlgq4kX+ciawZgWfWR4/4LUF9OzXWW+tjuJv0VvhzTdh8EG78FvdXFbi0aNHjx8/9p+3vNnfdt0OYT/ibaqC3+eO7QzKrgN51Y/1WT2d8HLqH7JXGEyk6Mk4XyQXqoO/LbWq82Y6C6JsRiDmFdFC9BrE2bBH4yauark29/7aDMY1OaoKfc2ppNvplE8KROJmUsD2U/CyrbPEVKGEBsptFTfK4VBwoJ1P3niBVsfNTpSUldjlmFI2dAedvNhV3dYC7G5Zv4elVtGcRO0rXu1YLV9pPVSCBN+7rTf6S9aXn3WfcvEiDzhKSakAEMN8oYRc5s+5ViRGmoILoh2cznXVsT4ReJMdnBZquaP5JvhGsppVxoUP0CWrA5QPB4lWGpWUnWbsuI+JVWPAh1B14zGR48zFcYNWgqJ1Qh6GiQ3TIFHg+OaAzDjH7ky98ocTLRurNIhRkdpzhikUFYnl5okWAnpAwu8BhWwYkpw3RVwYSuKHqHwN698x+/Xrr7/2wq/+FOcK/UDP3sxjUmCykMlEMgmcdcfR1dAurYnL/lFFP2FKAs0KUIP3q9gNtAeImoO3JM07UJQcFDvuD1YvecOkfEugGoDFdVxJBp3j8JMdb8EDbR0crEVdVayf73ClWqdOa3QSK8QG5x1Z1Dip2doh2kONtcREOdUZ1c1edhNyTUijOgMcgcOB0zn6NlECSSoLzetkVCEkSq/Cbokfagdos8QHa9Hh4YgQdUhbdlWE12w21nC+Xhl745aL22QvuyplmbH0HYotzBxyEAbYAboGMYhP69ioEd2j4Vl9ScUO0R2iLSpCAabCG2gbmGJ7NyLJhGnVZS8Fm2PWK8RDxCB+q1AoxQ61pKqXbL6R1a9ktWHwKnEj4VICl2lBvp+STPYYhlLLUkEwrpTaWZNPIJJfrZhmweUA6h7eG1lxiUGsydGd2RyyENwif73kgD9s9Xbv3r2vv/766dOnO1u7x8fH143+fLUKr5BBOBXS5SJINrddWohUlw/y+tBz5daa6ecsmq9OgmOp0KYBuvq02eiZGCK9zGvhW81A4FO8uwbv0hivk2qZBN3Uu3Q2FB26CtaJYnudkbWUjawlNknPpzCqUrWzRmxkNP06G6x6NJ3vtN01V6tzJMkzdXFxUbxRPVnJFE4BkGnNiRpSlHrARXod6lGHelWliytY6THMqnYO9ncXMnKYZlE510h4kyexs2DUrK4484zU926TDd9yajdGwzFz9WvIKM0e+R8caneAOJY23gWW15oS9bZhiGnqmSo8kPgjdCtJLWGZIQ3gQ7T9sG3Zbt68eXFx8fjx4zJNKyKu3lB0F39A1S/dpK6RmCC4BVme0hKbsqkadL2txqSAmV3gOoZZBZjF8llN1WrkDkKrR3n6xWRGnLCM3CTdAwwi/rAs5MgDDXltP9SuSTba2ys17AzNhxoP1ddAHmi3zlrPoz2ftadrcmRpEFeZdIz5SY65+YllBKRoWHEgooW5oNzjwjUKnxTqhb1uPrbszo67YsQgpocqmX4eKnovRjraGF7QCdQzs2dl0LlXJEvDW1InAy6poWI1axhgVtdNX2p0+4E0/uWfd4AYhPk24AHacixWuQLY8PZCAe5T4MbM0PIwb9nx+GOgG77lvuVYQJmzT7qxT3jqWygX0QkGcWJZmRfXCfz1Ybsm23iNvri4uH///kcffVT3fu/evfvRRx9dw2bvG0PCO58ZzX3RgKgLZKKqTks/bxLlcPqZpuAhWp30M7dvDeIhkqtJ6QJZxb/EsElYvOOkqCnNJdy5ur7Sienr2zzpU+zpuEbrirSNWokTmsSFo6IYwaU+kgslF8aH5heD2GRXylFSRYJYI3agMdVgk+n8Civ3qYfx2PJUs8eNuSG8gc5hxEPE4fwzk42vhTxplewdPLsKM2p6g8ganL6aUW8f4cHAN5bbKuNsY1jXvAHW5JoXg3FjtAxd4qti9sBVRGGNWBCuEdcaXdVhjCkIWms8UHkwLVoYh+j8wJvcaA1ZdX7XilNmqfr9Qj6fKub0cF2YxL1kw56VhChww7oomqzqWCVD/YRUyikLebwmhrOuHv3RIKLLa+QdWyH+CN0NdM4grnlItUdTXfYCEsCVWPUIo2XYWOgyfM/e9vDD9m1tX331FUnvi/rPW7b3TAtystLJyUnd2nXx/fcgKPFdwMRiAu6Rv26FJB1o1ktr/J/NVWWuMuFcoVrtfWaBXo5/jURnvqDff2mTO1a/brx2R45MH74qU1USLlwPzvcM6JZhVLm92WlPGsRVaYEFoLTICMpWOzcn71wylC7spYWld77BKjfatwPEH6GrnQZcUNiGZYw3NeveAEUuLVxaeDMCaSKsiR1ILCezpbYyc7BuyV3/7WW6fDMfu0a8Uc8zLfRHvMpdDxlYlrsIW8q5bfcb+/mVOdNIygLJaI3oYl9hbPmA1sLGGhPljqybC2nOXCa0+HSOH3nN3I4VLMDW2gWxNeKhdiGn0Pwg4v9tbo8fPybppaL/vGW7nhXl2dmZ17/FEkBEzs/PT05OPvroo5OTkx8WQCwh58Y6pi71Jt6p/KH6EjpdG+d8wFC5Yk78b65QovdrRZXDG7J4a10+FTBXMe9uWk+TbFmXZnYnzb/2iMlsWjIrTD+AsAcLbM0m2pEFTWFit0db65h6Gald7i5PaN0zh47KCIlp/jL4vNd27fVCUQqShAIgDEMeNET2dl6YESlK6cpQg1iG3f15VZTqbT5FunD/zb+I/n4r9zAqu6BEKWtQ3H29Tkxk/DW6VW6C1gZ6fdLVq07zUDsMXdOjKF15eUKLZjUQtiuWYeeFq6H5jqFlMIcZZm7sPpUaIUt+XBsGB1s44n9kD2dXEPVT14jVUBggHyLz9ax/xwDx3bt3T05Obt68+dlnn5UXnVP85MmTopb4gwGIEyeIqDXdXff9EF2TO3tTz7SlUnaWi+E1AEV+hHaJZYmJalKD6MtuyJaRZZS+YvsQVQsLM5/JrYsypkdRnQrqvLoxs/yFKyc4ZaZzc7wAa6qgBZGgfYPUodJDdEm+A533n1XMW0xDkanBsQTwR2gPsgTHzgXFAUS/uJWgO2dPu4IUHqLzFqRWPeTcosxu2lmEK8AOEb0JX0DwWgOx+haTXisKw0afDq47mM3isoUQkcpOdJNeaNHSlehdyh5xxlizqRfwSoBpgHMHrBFrUk+PQ4BYIRLZkCojc7ns7BcSAMrG9YgXbu8y04ph96K0HxXeV2QjbMTQ6zXNbJ4udKIbNm2e5K5P2lzbgMNrOnPbO4bifL2Yu76FAO4/NIlN3H+Iz7CPUCEKVbiWeAiXWCKqrHAjeskQkwDxFThNPl70Tv59IFJdh+3i4uLjjz++f/9+DQdfXFycnp7evn27eM78QLBhn2HMT+gqFxVXvBGTUXKkSiLjw6gjuugmo4EsGC7DG+Sgw1UoMVmKojonkbQv++aEj4elS//iawtT15CSmfQTfJwnAXl+v72k9Gho0tOuUbnAFQWenLLPV9HTEu7SVta34hbd4VxZ701TNfigEmZ432NSG3NIHeLp2JPbNQkK6f87yaXoBjITeYo50tCMd/yBm97ybjDWVbmBJ+zVfQvmzvcsywYL8VEvM0YwicLpYkWqx7gpEQnbrkg/4o1hHC2nZZNg4nK2Z+acUjqkWXYTldTUCFghli8QJkVvdb1E1hqduFB1c3FV2rUP7b79vw/B7nuxPXny5OLi4tGjR3/zb/7NusZ+8eLF0dHR/fv3f2DTtNlpvATiAQHzAF2VuGIU5lihaWPjOAqvtOAv6Jyv1FIjKluB1RzeXFagoje69UuXKpFEoBkzgmf3zC3Hp3u2kq4RyxZdi8qtnYVkSzA5sg3D68l404FGyBs3fLl84rasbwvjR6jAEB/GYvBUZybWghCutUsUOjEnPynY9ErKQ3GJ0G1XmPVgNElpNM3CGjKNpmfg3kDbawSLpvqLM1kW5ka0l4IdMoJ5Q7qiokCpGfJ9Q6WMDmeYSA6kW0kagEZSa66m3KqWBmrF7sFcepKYKLTlua5Cn8hxEi5ZvZMV/6BsTocvJrFe7W5/Gv1jW26Z001qmZdsLCkphxpVL15TeXyZDWyNdK4acZfLvSMy9Z0E5Q+Y9PatGRWrr169unXr1ldffVW//vTp00ePHt2+ffvbdlF/j4WqDFV70FIxzO8p0sBcS7SBXQ5NvOons46aG4YDDHBV5Nl2ScqkXhL0sTYXHoNAdSgdRRR2KN03XKFqkbL/I2mEDeJGGgfXOF4ZZ0nEfUdrFi+ODCpRRDx931jTCxTC/c3Syiig0iVZGQk3ZFsUPs9Gn+k8FD1iuJauq+nbAbr8IeNICGGGU6liCh0dAyaju86yeW0rE1lL3DLMWF0gi6JrdDOgJAF4lywdTiUfYciqOhuuDtjWRYsmUf+BSR0pNhSIckNCN5Sf9tRQjc8MeHAodkjokq8OejPXXvxaVogmKkyGs41EFTsAJTnvaY1WO9Gsvmd6I0GIix8p3KROfoT2G6ycSc35krW6jpVpaeXmxJDIxfKHic68gDUTlxLAVRDzIGfV+DAFrkwqoeqMg0F4o6cPc6bUTIwqN0PIBn25E+C48CG6SwmBnGNMiIm2KSj2sEsjdgP4Jl1QGDVC3WlqI2HD4P+5L0C8zBq7+jL46wIQn5yc7D8ceu/evfdprXNycnJ2dnbnzp2nT5+W7338+PGtW7cePnx4cnLy6aefvo3I/vXZjNpaI2hLCosMikXZZts2uk1fW3DefRTtTJ1BY9SWUi/aOaGfGUmE8IZ0lxLe6Kkpqw1H9EaKwOm07G1JPPc/yMSlA3Sv2YjIDe2M+Cb18ODc2wPtplUgq/ZVEivA/LPspYWf0pah9tlLbUuiYyDFvUlLnrCCRbENKZC1RJ30UNfaXdpqafpYBFFwyRWEB6ARrczIEF91wUEFpmLvNc1y2CJBTAHHat5Y5m+7kmm5Xe0q9WVrDGUsWOHB5ZJhI7vv4g3Dek6GuNSxpSg8rASIb6C7akvPiBbhYMg7rstFshbB7+lslTYEayNHiBy4egNIygqRlE50gu3O0aXRCxdmmNzTJznIdkZ7ABwiIp1ULPsqfmvloLAwzIQ34Cl50fuhVtxne/Xq1f6DL7du3XrP8zp7HsLx8fGU3Xzv3r2jo6O7d++enp6+gdTv9dzQI1x5KH48vJniTcVjQBkpV3Cl1prm0VVWYavmauxYuNqBtsBAqy8BbZRaTxYDQjLKOoBUV8G5Ry0bH94fSV+4DLGHyFL9rWAtdX7AF30nVdLs5njUtbNghGJeYWn2RQgPNL62BuOpyh3bPlBahZZyFleeDU5lXMm1Rnq1+NwtuGSDWhjTA1b+T03uf1J7OKXrhe1FztTtL01L56JsINtVWtpdtqWppJNn4s6W+38gIFbQTBAopkGJNgQxJul88agaaGkSmmUSWkQMpCKBu+43SGKFBLMCg1BbYxdZvUqTPOaE0VQIar5LY/xD0ImSOEC0IfmPC7j5nB44MKVRJnpchr37VkPVNGLyPaqdYFlZHwfhSkyFG1FHkFxrAld04jXBRpr2XTjN/jpUwW9T/w7yHp+p+eSTT6Z/dnR09ODBAyc6XcOg/rZRcuiojiTJ16/FnHCtOV7dBsaO9UffQCfuJ9a3aqcfxIFT6tBkPHlllubkgKDK8jzb3KqLyaig60uISCuhDC36Ix0tQ4S1q/TkiDTzRjcMhxpbCWuLl4SJrDXGpD/hbusJj2tgK8RyEmSYwTuDuHEqrs8QpT3vdzyPciTQbYXYWhBKqArRUfu36L0mBefkaT7lWSfbawWNOET3K1nlSMDeIZCIDMUdG9mp7wa6X0mjY3ckiECFh9JdStCBEFI6uRF6yaZ0VhsYKRsJfbRgr17CdDXzuCs6l0IO6GHcEkK8H2jDynA4TcwgbGCH6CJDJ1iJUdANG9NFMLScMxW6bc43XHlh7OLFUTRTa2nz0leJdjdWMEwYChyz9lu9gWkSc5zh479muAGi18ySX3G1oQ77pYNmSRBq7tP0ot45HueoI0lfwpSCCDWq9V46dojOe8tBenOnmfKVwURuoHXC+Aq2YSgjrh1V88QxM+ZrHySYvs3t5cuXV6pa3ydA/NOf/lREnJ002o2vvvrqt37rt7788ssfBkCcBPQBE2HVuywV4HJ4nZlqtawvv7Hgi6cuIn7z8X6wri183Upi06+izB4AaQEfeah5GeAr9oaNim0YVsNGY1kBp0c9t5j0g4151nJgW8chGtiJegSM1I5a++x5KPFlJ48uFpCu53+hZ0hVMMCAKjqPEfd6PpD93fO2XiJuwRWWyonK9lPqU1da/huGA9lhr/yNNQXX6BX06qbmwAQJQx8k7vswTILkGvH1mLFFGQoQ4w0eurlXeufDrEw9fHYWR621MtJAbyY3JW/N4FA30ELkj7gOwnxQA/xl+t2VH/pAMKQU3gVXyubJdIZBnDPBnPXq2edu/MAz2h9d3W5MN4221+0QLi4uRrG4bB6If0hKxP1cPFwAcF7SJWNSSd5dhSt0lNqLjCvENaJVqJAJaE3Mwn2sMuRuzHKAw8SlQlzDOupK48ZQM0s0D7gMvQF63HAFayUYocK1diNzOVYgr2J+lnQEKaKyhMe8h9B4VVkifMwJ7ySMtRjAXHVtCsKVxhE9OVKNCBrLnrGErQVlSc5bE42BwwPpIrV37atGq12WM7JXEdzfY5aLwSvhocmAwQFnDC6NcNE3eKe14LTVXiGnCX4pFOCStSZ3GfTyLDk4piGnA8TXeR63h3Tz56TpFsQb2pUb8ga6y+QKoLEneM0NY1E7hhVoldTvKMBxEOywLZMePObu7jp/e7RZSUwmk8RSVdNByPEjgpI8BGdrMU9d57tlLXal2/6DIMX7qX9/3RvjWJCt0eTMtVdqaCIbNo3MqxUzh+EbaAvQyTxNUGXbGcwCvT3VIB5K9FdEWBvUVG0ZoUiABUQb0hzqj10hNoycrJ5vAqVndfbs8pl0x4ECJVJFGo1dRMh90ZDfrzkwO4OY6DvDToKuStbhsaS12H6E1gSX0jiSuOWiZMUAVD3t9LEFrHfpjxU6iB0ivpbGkicbRORQ2z+K69yi1OKG5CXNCvYjdB6kfdxGcumYKHKggofSOYFUhw32DcMNMSOmOo+YBzrF6TzundgxoDDJJxPMLmM/NCzI/BoUxWeHiTuXPeoEqHqS3qXs2NQNiWJon0ZFwEbsEN03XDU+LQJOV25O7A4wQUD8GVlLDGBIICw5S0UfXmIdfhN7o42kBOJqic4nPkT3G9iskojHwM89C3oofTiXMEvdBVfSgMgN6QQhVA2kCTqsG6p3lYoujeZHuMixOf/RaD0E/2H71rbPPvtstus5u71PdNjLURGZrUiPjo5u3br1AzPGqSA87BFtxsvIho0rC3svB5mwE8Vdn/f60BtoJRlbzZVbOaasJPqAwkoMwm+kqYGqjiEwjhArFisCh3+B/fYIO1B1l+GrXFKHa06w5CiQpAMsr0Wo6D8pFLL4ggIChWsrpbPhdZ0LEK/RtQw+FcQtUG2ughZz9yu61bfUSG1gARFzjM9p2TltanZsGnQ+5rJhkIoFyx0QYa6vcvSsqdblW2LuLI6IOWtEIdqFj24ZXKl/w7CGjDR8ZzslNSQRhAfS/UpWVzqhLQOQ9ItTmKsGVz2fidTXRABXiFcq5GtISLjFFFdGA21zQAVn0pitjw+HGYWb1K3EDGg5nxma50Uftm9nuxLgez2ZRjdv3lyKuaenp0vB+vu7BeGhdBsJmTAqGe/jIdoe7SVM0uR7FIiEippDzJbRPsPBMea8FdwBq9VgJBDs9SPqN1LMVJWVuqusJW4kWMVPAujV96+4KhVKPY65pSGNCYAo2+VilskeNYxbChA31HHxIg+7cwP+O3OIgZ6sDLEFJyF1u0YPLYUD9Ti1YaMSm1FzuGrSud84quUXkiZ0yv4E2EpiuxVo6rJI4EyuSJBqFRloAdqu08v+hGixzuPSteIcbJooRKVgrxKnoVRC9qOTrJyAgX8dZcjbK190IN2lNLkB3Jbg6DlkpLYWghqp03Ni2Wo1649hKp3J8Yz70rFz0FQQrQabOC6re30zDHIwYsOGPaIthUhhFjSffM38PxEJYD2GO+o0fNiuT/3bjAL20dHRy5cvP//882kUfPnypYh8r43U9wJGIQBXGldiGwkdQ2mQ5blMIQc6ch6sWjZrtFhQV3AHMIc4Cw/FLEjT1sDrATr32gqwQ4kKO5TYUbV8UT84mWMvMjo5F6K3lKPbGR9L/iFZZ0BEoGKQkFu+0YDXhoSLzWXhrk3haUeXpwySbZ1YEGsQb6D7Qwad61CtYCr8Dz3OKUFu0YXeSLOhmqBlExmYiERJAeMAsRELIn+UUXVfiW+g/ZWsD6X7RlZeVeYQ4gK1AiZg23FDFxcOAp0d4+jpz7XgfYESPH5s0fQZD0hrNRISEJ2ROhdW5zDZPJy1Qudn22ngkeoyxPnDq/lTqoiYBWjhoaeUy/OtIBZAl5j4FVdBpmZ94pPgQW10IFOziIyzs0nmsLMFHgLoZZ5BLxnCQnZXi+W7DEim8SJrVyXlRBN9zSYmJwQVl0k1y8gIM0BMqaSWYQtGFdUxBrFGeAPdH3KF1AbXKNwwtAxrVxQR2AeBwm9zu84DoR6Pz8/Pp8C0Kz79MOjDkogPDWhVx24LiNhPs9bJaJm58wm7IrO+Agm0EorKBEU2FpxDNCrfVMQ8yR0XXsxUU64kFpsR5ysVvR4bSjHKZKVdUnDyXx6gm2bzi+hwRiFziQLOY+6LBS5TZUgrBtnDht9aYhStJ1eKeex2eWgjNlSHREuV4u5tDaIvsy6Jc8XEH1WTjweSHMYOJ65oVdsg9JxfjhS0OMuK4q5mwuukbp9wCpVUXldO4mP4cgUj0WJRT5OeFYBvzLAGRMk1ui2iB5zg95x0aCKbFASZlPcV0hEUHmKg1ImFzHmd9CXCrtsYMnRLl2GaIXO8vFkyNrceZvHhkEyzmKqxcEEg+8P2DgHi7/uA6WefffbkyZP79++/ePGifv38/NzJ0T+YiFyeFAWVA5O6Qg2ue59WK6IysVqCUHWsSsTqIb/SEzd8ZAdLl2bmZjE2r5eoPL+Syoo1YrFOrcRtMC3/XW5iwybAVuJKAtNExF124goRGOrCzh3CwvEOzsOhtiLyja1GLB7M4LZJUH60rWANYoaV49I6WYR6lyw6a50BZnPXToIKkxrmCADIgyOoZjHTvSS20niQk64Zqfo9Ylb9arY3gFEX6HosKdmGq3Um4R1KF8A2k53Lzi+gIegY1okZUADunkqcwn2mI2hW4kpmayCY3IMOpINwg0b9TPU3Qy9+lYWk+n04RFseNw/H6f1jr+ZetsWRYpsJcLMnFntCYZzv98jQdaOcnPphT/wDgc3yP8ogLwXBi2iyKJM0Yqsrkog/bO+h/h0DEw8ePDg/P799+/bp6amTm4phzqtXr1yG6QcQFJcwU6lUmViHhOEfbNhYxbffku97wurz5uImdXPQGHrfzMT1qPzfGCQWzQEhzMJUi13mlRPGO9ZRa0iR41oU+9wxpReUxdqtUqGjiq2qLuhwHqSf6/G/XWnXaOc4oyu9ylDiY3SWSsBb0JiToUpvome2VNderGuJQvJFZjTn/CRlHofaFV2LpP5ugZ5KiQBsYD9C9yO0QXpAs3ZvKCchCA/RhXyNTLDJorTV1EZfBGacYjwCgnnRD07wAmQzqPHZW6Er4vorGLJn4EpiAwv1VLLb3BU9RyLL/PU84kL1hchKumQIs1AbZ0EryjBpcNwaWdg6CBuX+cc4twDE075LNt9wtWGwGYeixO9zqRN3AHCpkEqDWA4lBqGLkLxmk4avARpIlRhIdZcGiKhYA96QTnuJiZ05oqhwLXYoEYm/TBO494JJif2wD0r539F2dnb26tWr2qz8OylHReTu3bsj65uLiwu3hP30009/GGe7kGGHyBplqnk2BwCNttj7xWmlvTAFarFcjHBSKBqTHahNpOtSUPAvarNKTBmyZ5Ub9BrEC+kH9sKHe2A9mksG6RJGvPvMJ+K2228mvxcHgntcoNrfA8QgPEDUCVF3oGvh6snZH9XPjLiXZg+ovrniBKqB35GL7yjklT20LFDJhUuwjyxmJaDZ+9I0YofSISuNdP0x1pKLO2rgHLOutt0YkpK36CpG6k6R+iRt5EasY4PHPotZYVqzcXgbD2psyTeAjTU/e5CFvTfdcujkbMW76y7KPIksGG2ecRU4O4B10+XD9j638/PzK8kTf4fb559/fnx8fHJy8tFHH92/f//x48ePHz++ffv2Rx99dHZ29vnnn7/nGaNvuRYWTTXXmMRXCQYl72tbhplmEKWhSvueMSvmpi9E1jqqJnzMNJmp1it4gQ5rsHJYeLI63nHxrDDvK0PmQVTAoQCbMasfLsWdBaPuc9qnzn5IzeO+aIuJsi0LKCuDmBsFYXAOUZOIAyzAuFzj1xRhr1BqdmpB1Vcah4eMImKL4q+e+N3lxbeqbAoRldLneN5ib8QO0nQyi7xVdghMs1uaGWl5OmqMP97I1N36NKCynktAUBr3hmSNDk3oRxp9RgVK+CR0rVNBorWmtTLm5aAbRXioLcYwnOPCWpXwAyKw70nRhuJSB4IDLbLl5IrAXgIglVRz6vh6iijj+a3+eSwuvtUV4UrsUGKTKn07QHTu/FVliD9s76f+HdMQHj9+/Itf/OLk5OTu3bujXx0fH/8AHOpGUY0zAt7pAfaWY4O4kriR0JoOAS+5ZPCuURnZI1F3ufI0q9AbrVKAyPG3uhHWYWY/BdgNiQHx0LUm6jKPyCrh/oQn1ZsAUpLXBwpdNC+O8xI/LHyWq63bmiy/2ksJN6TroIfSfiONUA/UOiYxCwFBadT9ZJmpxxkgzloTgGvTOKeVKvwRYrGwK7MSeQVBEPtNbDYSvsld6r//r/yzf9/v/e5fPf7tJgs59RBn1lusodgbVd1boqNTRCk4RPtaVllgvjCGlNlHNV0FKT4zCLU0Q/91Mpy+SQIRwuTw5jRrv3MCuBJrRUfK8UOPPpm2FlQM0HpKipToQ7Xs3epdzr82lg3ixmup9G0QG9oa1rHyP6VEC6Sz6vONmjUlHFVpJP4GWgr+EKswKzHBmlBQaRhhYAuQAoZ0DayRQ838JhnHbzE6S91JxNgk37Z508giiKE9hb8XTKzLxYxeOdQPoROK3aQu9YoPxS5Fc994B/KUgXi7ITHUcwNSRKk0ORLsPfRqgk7ekUkdd8ePJ0+e+FjlnTt3Hj169AMYHynYa+mA+nbv3r1Hjx69/9rv1q1b9+7d83L01q1bP/nJT0Tk5z//+atXry4uLo6Pj38wfjjS67qqp/6AHCJ+Q8g2tVmf3B97ylG0IKdBo1Fb6gHsiglA/yx4njoFolaJ2sC1RJ+jT2ReQAStBO8zbWpvuiw5xd3TSjxA16ZyTjYMTcWA5kARQsg9pTnmU/ystjRgEqHCx2vN90opfkwN+7/92Z/c/PJ///f91d/913/nT93gxisMnz5eIQ6ZJm9/x9CDV9iPXZILKlS15RRN3taKmD11/VQpKKwMAwdWENvQWBFpGYxDl6fdKG7uoFzldHIrZ2sQ8iaN5AnebQNQGCIih4gd0RULnz5dgbcfTLBC1CHSiwQ4cY0YJxgKZv+rehynte4ISi5jSWvESHgqVd9I5aHnFSUm/Pb+riLU8fHxo0ePvr+s1cePH798+bIWbbh169ajR4+uLdH46Ojoq6++cofYk5OT+vUHDx5Mzeu+71vIWJgu8HIKblU7B4yGJRecdfKP1Sq8XehguBYN18AkwmBlwGUYDMdZxArRxyxqgXgvWg8GExipNANn66xs9p7nEXQHkgXudDaotkPtvrFGRQ7QlQzEz8OlNcUAto5ES6vmrb/y4s/8/Pf/1f/UT8Qw8s/dtd4NZlttDBFUvYL+WzNiihp8Z1nzVbiW+I00b5MIZHgaJC2jpanqhJE4RNdxnb3oG47PzEBQeNZ5aCLO0KsdHkh8LaHfDXoRjNrXMUgPQGvqHzh/OX7j+DV7Ax4Dat2PA8RIPdR2dIrMPSQsBI02udecqBvZCDrjzBiTCDrqBmGiODFz3zjuRLFRRJ7cMynbiaZBMXpG/Px0FlahY+Y6kkrTXoAYZYqXkollIaMQB7gafTjNc7+LoLz/3Xl+fv78+fOzs7Ojo6NPP/30+1uXXan+nZlTe/HixWeffebnwuP6rVu3Pvvssx9QpZowspXG6W1ZQNWVGindrgHJulPqKhPT6kJEVOxHafyBaZ0pTtFzN6qLSwTEtdhmMvZS/Emde+tyNgULVpiPx7pKrwPcsxjW7PIhC5SusuZqZpIGYUyT+zxEdymNmwOISJIhtoDMyVojBmHwdTIH2hJ0HbLUhNL2lBPpBTXSonwD8Q8Z3NTFENykaAkCM6KzEKmK+Qmj+n74EbpvMpn0MF9HTclBrisolidqQ8KIESpUVyrCbF9ozShqJXfsqnctDexH0nYafhUXEI3hfFNADNAaGk55E1MgKXS2Kk9KIdZX50N07iv6mgNp3W+4ck2ivqzKEfFGsqcgE3KamiOrbFJX73AU9UHdAnZUd1+v7kimXXL1kgZWuD8kRk3OS4ZDkBSDumNGl+n8HN/hKIG8yRrEQUxrohQHjj0kUnsY6tAtshffDYnoVTUIWD1aYKIba6qmwKC9XNoPVd9CLxk60XgV0CdSt9zwV9q2E9levXp1+/ZtyUKBp6enp6enX3311fd9gPTi4uL27dveNS3HcnZ25tXgF1988f5L8RcvXvz4xz9+/vy5n+Q6Zv+QOrI1fdh6yg93FjC+fjo5sTwpBe4UkWgBapx8UlaZiAvzKCm6REHHoAs6DSPTtpG4m1VYm+PCQrgG8Z4wlA46ajOyyyXucAhKXokLyV5fQirZdxa/lK43gufOiygVx3ZjSZrfiFbClTD6/WHiGZBzOeiTpY87rqo58wMurZH5/KrOhvqysPYqTJnc8nXocv/vSsj+QaZruZnbu6p/MsdqcFNt1ZiegRIgPICVeay1xk3ucBSeRBI+Tt2OgSrlfuBJb4wulEidc37qja3WRaJN4kpiAFpqO+mkZgOAqwHENneHfKsR6qOPPnJo+Ojo6Ozs7O7du48ePfo+QpP37993jNWPRSoq8eeff35to9vR0dGLFy8ePXp0dnbmqcLx8bELMP7A0GEgCaeGxIgcrnqVHs+cUgSqSoTNUOVgmPC/CSJTvqMBG3RJihADi5qemJVWejtAC0iVio+kz7PcTdZFPUDMmGPMw7W1v4/4cGQjbJltBbgbEOCEelUPdhRY0A3NWheAXsTKMz1W0Lqm09K55I4gwPHQsBxK99pRoJ4hWzfksGCsl24e7fln6epYKdjzPIeKrRDtzRrbBKmoXXDTvWlFZqQkllPN+l7jYnLVXOIDYwpW0dcqspCs7OkGipGpYq3EuILYobQQ2UjQtHuD3e4JW9K1EqbIz8iXjxOdSQ71LjiXMUrljLdTR3Seuotx1kQimne4ARl72pZEwohLySNEHKSpyLrMFCgYaNpPhJtehadoxKU1rb2DVHNPQ4LT09P79+8XRPX09PTly5dfffXVD77+nc97fgBKUm+RRvdtsRWiCLKQzTaSSK0qOylsKuKwiC7OIbKKScnY7YbEKNA0uV+PkvROXK7Z2sBM0GQSsQznZYZCNkm4thkYkmBk1lz725RFM1dKSVHBNYj9tyRWiB3Vm7EA60gjJYRk+doOocBnClOxAK5gB4gdg84pZoScD1Sa7iIi/82//MV//K//wd/+1//G//W//Ofr4OoCAtbTr1JUm3UhyF6irXNj6xSqlDbZviy9v0kmdWzpcszF66y/omHQSh3qvicVTNTVl/TjUUjFTM+wo86Ml7KITMWE1UPGA9f0AcwDdCarrB5lTdbRb8RWiIGWJ4aQQ7IK/aiZXJeEFKrIIboNQyNWbs4m8WTnBfFtOK9U0pBKzpsl7jYSi8twpCqEiJIVQNwM8LWs3CUgDDjyg1K0oMb5piWTuIShUpMcdnqyvUYvepWELyByQyIlNCkboG619HF7qwOJnaCRXskaohtqS11BKIiEXb8ocv/+fRH52c9+5qzhs7Ozjz/++P79+z/72c++12XSw4cPz87OHHutD+TVq1d37969f//+d1IHPn78+PPPP/eRHxG5efPmyEz2BxJnTQ37AlKcqxZEZGOrzIdVsyAigNX2rRiCO8Oaaox2Tb+LImuJzaR1PHKiq17p0WHLxcw+gCCEeRSDO6rNpMHXlf/EDI4psqx25bBppuFIuQR15/UA3WuuVhgLSo5cav5jf/2v/8P/l3/l7/7rf9Bo+/Pf+ZOsiwHOYKWUN2QRYY7CLFsd/TJFGh2bRlpLuoQdBrXMWJx2CnyMZlCQxfHnqvd0eB77NlWgz3ADZi9S7WPhLHITDCu3QRr2BjmtWxQAmfzeE7IwwHGy7+4QBU7J5awGcbE0JMUkYHJlKKkfypl6s4R7WWukyGtb1Uw0TmRMOmrA0vOYC/tKmdQTg9kZGb6pysR7G3/1QvTp06eff/65x+KPP/74yZMnd+7c+X5N8HjNeXx8/MUXX9Sx7Pz8/O7du8+ePfv000+vc5l58+bNmzdv/pAUh2fX2AA7kHiJgGU1iDLxtmEQAuCoETgSJM2bRhNTfRuVIanGWSpVQxnzdJMGsSgki+QSwgPtdDhHP0DlMG5cuTgs5nC0vtGFsdnmdrpVHWUurTnQQTxyo7NsT9fH6wGM5Wc+h36KeMlfjgXgvb98+rf9tYu/9f/7y3/hP/9fkokr+9IynGjLHCQbnQU/2Ea7qs4eu8eP1KMg0gip0aUDpBpHCjAVMDGTrOVeHJccm5yilYgFk90vQl8zgvu6wPhGZbdQTnhh0SqStmfvWVQpgiCLB/ZKm0iBUjPEUTPNa06DV5QpnaDcQPsrrm6gJxFnmFWLEwPHnH2UebJ6GmyqMT2+i+cewKXsApObechLkHoSij3tK03cVnmFIifS9Tlx+rBbSxYN4vXV6uB3Ze2+e10q5bATpJyBe3Jy4upDP+z699fRHAm9Ins9Spl+qYJm8tisEAOs4tWSopoXclI2bDbW+DNp7CURjFgh1lMYo6ZNXv36uqqBubJEAZRXQoqaqLgwa5JlEGQhiXkCC7BCIk6SYuJ/0q9E5XA89qNCsUk0Gexr1JpKfcm/PSYnvfTnh4gqxjSf7+Bjr5vMtFSwQd8pcmkkyaZkK7UgZL4hkyZAFsrw/1PQZWRvoHV2kMOr9//yF//F/+O/9vk/9bIAAZcMHZVJ4BWx/88ZForv89LAgvqpQjFawQSJRIMUJKSaIvG3rCUijShmaSEo4MhFU1YoClawtXTM3ewEyQICHKBLspjgCl1lH+zaT/3eRgZKodymXzgeGsBCaUYKgVhL/A1pDxFX7r1HacSKkykdE89F2EqZ28Lm6MYaBpEb0q3EXHhkpSbzXU0QEqlAz+0t5oroVSbowheNc5wh2is6OZ1f/fpSpgPXSUY6MriB1VCcpKiI1P2V3qmeRXSlaoqyoiGUIF3fxqPGUukGlVw2CNeSLmWktmy6obaUa2xdqxXy9PT0/Pz83r17pSJ1rYPz8/Oa4vp93E5PT4+Pj1+8eDFCgW/duvXixQsX3P9Oduzo6OjWrVuec9y7d++Hhw7364BPh2FGOnwYoHUOyxUKNtb4b50oYXlugZTMMgZFYlam6whSkMQW0574mizZpqbGewsu5sJHw0R5kBBL5jJLZShX6gFJoqspMs6FaIpI0HnddkE9nwQvFLOCsGT/Va0Wf43D0itJsadeaUgqSayF71kL6rkWfJ2uBLGAKGQettC/66//wef//D/3D/0r/8p/65/7F2bT7NKUZgXwySJsLbKg/FgP/Bwg+glUGa7RaY01CJ24rf2tBqb28CAeGXHJRqRctZm7NIoOI6znUcgDTzm6p1KnlE/pQHIzct4XqKW61CPrGx59qok5TPJHaA+l278oMuqGTXGX6ojIJCSKvuZUEwVgoq2bNJA1N6i4DpT3T8tLTy2mCuAF2vAHqk69iqtSpBhFKlsCjAaaAb8WmJmxG9x0DdigCFnIlORUviVcY8N0j7A3b950dNjjwqNHj0Tk+fPn36/V/ssvv/SiehTLbt686dwrtz2/nlfh4cOHtxe279a04J3XwoUsGbIwKMbq/BJFU9bac1Zqp1MJld2JSTDRHN7R+6hfAdKZ73LW/jFpNUYtxNRTstboVHig0ecRMfyQCo2dQofM3JTeRCcMGl3MBUwZhJVZvVcVE6ENadRTn7qy/lfG7CPBhJkuZlXU0F2L7v3lL/9r/+ef/qXn//Ox7kYK3uLyuDrGynvYruJlu3qs1FfNdTB8T8qHIIsG5DWZrg6cNRUnKP+eorfZgb4fC4N49mICjxoqJB3T6FMvHxS2ajg7bIUdi9uE09QgbISN9BYUE8cCoNI19pFo51r5fVK86wGikt73mjQOh1ry0ze+0Dmn1TzvAkmKCglDkL6Cdh+IXiC4YOh+EhqhCWL2uSmQSgM70OiM7xp2HzHzvMQGqkHulMDD/dXr1N2k8qKqYBJUyYC7+BTzqiDR15xlbtl3vz158uTi4uLBgwfezjw6OnJ01V//Yde/MwziqWjU8NHl9z8oZuAVTqK0LHcAEbYSOkEzqGln71wuT3T4U9S3R34D7W+gVZEfoW2piSmpJtI1W0mIIhJFv5FVZUO3nf3AqX9LQmiHK122kZk5hICo4IbNgbQqbG3IbQF3MZ7EBK3NTP1Pt0N02GoK6y3HRuwGOlYjHgcavxFqJHadQIgERFnggG8XR4fIxC6ci1YGImvEb5C4wZ7HXEpYycweKjhSIxk1RoOaRgaxJotULtxp8/cl8mDYnMq2V7BTkwSZzk9BI60RcOQQWCbEb6BbakIWiRCOTz5M0IkWPbKqC5pknuqzrVmWZAl1YnZf5CQbswxIFWHK5cdnLPCFSi3EqlbqZk4F2IveNqlW9d7Brehr0S6F4ZFDc7n1r9ei6qXdyB7t008/PTk5+fLLL7/XWkMXFxdLBGEP/0uB71vdJT+xs7/9IYk7qVLzIMe2FbtCBpldvGPl5VjE6ZCKRUQ2rRHCtXabPAaqEkPSkoeAQ2VTriX+EZL4YIAFgevnNDCP3SuJTa+Zs7TIuSRcz8qsxYizv/aOmD0ngdCXow1iK437zEhSetWSqTMBwT4SlJjURnQMARYQa0XakszU31gb/rjxyxpRhQfoIjHimHAR9x8gsJ0EQFo2muxxsH/+5F6p6HUn+7rlAJGUVpI1+RpxhtVbpTmU+kZCa42IrLV1Y701FORcz5iH2v2RHUg1FxnE1unkDIgCWGYiU8SpQG0l9FTfveVTNmysym38OA6yuMRhliYTQPgmYsQm0ol2BS6HGBP13ohougqSZbVr43WByArWwqF5W0t3A+1sq2PZv2pG/9EErQSW2fAllhsGvZJZfyXXBy/DziKyRixjzmvEDXsRT7wllfG91G8iMmKt3rlz5/79+6enpy9evPh+hVovp6e/Ojo6Oj4+fv+hdp/t7Ozs9u3bWyr/7x0osB0gPpDYuB8JYsh9uPJ7ilxKU/V+dj49oLz5M9Ygzmk9lW5ppliKuqiR9c5Ag93TZH1d9gWD7IJO8mgxLspsJYiiCgsaSXVQdTxEU20bhqwRh8igsDL6WVptVeKBdSUZpAv+QBAWAeW9LuLU92Vhae4dd2ANKJlqM1gcnT+EOKq5KKn7zhr4H67S/ckf5HJbQ8TWjKLQZo3BqbUdtRNVYVzgkGJm/mlbyZdM0ophLyaCnoNDHDhmOLyLkrfkyVR/pmouYLbvS3UfFjIi5MpT1SYha/AMVklIj9s6r7xj8NdaCa+l6bJ5kmM7q2UwpHyYsQh9Yig4mjU3hvnn9Gxlrn1P4rKqJC9PR0gMKjuQ7koyxO8/KNdV2NHR0Z07d05OTk5PT79f1dlV69/xGvTw4cNnz57JD3pDLy0UvRrxGiD2NV7TgA3tUhJDp2WoQbq1ptJxIuDOSIS+f5L6JP4U/QgbSU2nqIgKK4at2z1YnMNyQ9tG4wZU//N5bNcCNuWvOtFfcXWARDxpqd2AcBSMGnYBrMP1awucWkQqUMrURJB+IxDfceG1titEl+Tzc/4jdH/IlffXVui2sy/XiAHWUX3pXFgP+wKlE90aaiNg2MZA4RptW82ZmuBSGg7B2WJwFyq6bgmuhXmq2CHNU7SG6xBoDKyu8qg+d0Eo1x07lC7UfLhJzQ6YiABdbgyIDAhcg6IP1aUG5BDdr2wVhKIxUhs16Yl7jLlvWTkzeOQYyHY3GiPhg2NLKGpxk89HquUTvDsamT459m3PmWyEnEEwmAhlKdB9I4H9dWT0OSyJDWzDQMHaZc2R+NoF+HatYZsDr51Zf61WSA8SU+LPd4KfvtvNR4Rmf1XkHd5zwN5OSvrkk09+IGEXBCyorbXTq+SC5jArMWLW0EJN5mVFZ8hIqIpY3aytF8oVbM14KbaC6zIlF7K1xEa4krjOXSEsWHwUtCtKUnvfMBi1s0BBo11rjWFjVMJst+KErDDwBFPhSqOaFxixIhqjo7YWROhBvJ6+tERyAqlFZLnG4IDeeXyETadiJv+vVUO1AzGk4TrWspGBJkNaYCM1VizdSPVpoSGC2deYtSx1AzvU9lDaG2gLR0mF1ichM6IES0C8+0NYkU5Kbp8QmVek1eLDjmQvnGduEqt6LdGpSRwgI6y+zkdYSotxOWOYyMGv0XOlpSL1+HTRgXSvZXWlR88S8UqdTNRa47Q7VRFYpHYMowFPDqzq6KmUa1IVHJa9rzmnyiTN8GaepC6lhQ3zpgI1ihpxOLEV3DL8Xp2iQt9mNffDZdmV67j94he/EJEf//jHIzj16Ojo4uJiS3V3DbdPPvnErVan+3xxceGDrtdwt50XdufOnQcPHsy+4Ydh1ZsXOnF0eCXWiDWwAF/2B423ncvLazZKm0g5jR497EKHTcacFa4QO0rM5EQTiaKRGhMdBFkSb4DjUWSN7nWvFjijH6jLygM+t8o9+knedxzq8susZPMa8TW1rJ9ZXH5+dXIJgn00hi0Z5C7uHvtzi1p/0otzmxjzQBg0wnOPwfjITKyk6IbhR8tUp7rwbLLcc3AQc0c2NO62eiEWJbQMCkZiWsphq0Hrlm9LVTmIucIZqYIcTGD3mhvJYajvFmtmJRdvdzCd1e330iBcQUbpzTSGbtgM+jleKbM8BeMp21KkLw11VQc+IAY0sJV2luetJWlqkzukHsr5BEWj6GsJjXgy7O4+1ghXiCtcTYb4Oy+HPUZ/78rhq9a/zShsP3v27Ojo6IsvvvjBaxB77GkQXWh8+gzOPkIqBgDCRlOHLbIudhHZRCf7JGCLo/veyQ4BBjFkS9a1xmlPiUSHsZmkqgFsNDZ7A7sy7zDwZhX+lo9hCpBMihZmO/z9CiwepqEaXCOuNIY85KjFR74K8PvYgUNslwlSfwgbrnY4EJTZGU5BfMvGgLHXc5gEfpcc8Vb5gcaV1nIisoZtXN95qMixWFsS0ULMtehsBKr7sSuYzk36VHhBr74Q0uQ1pBYY6V3Xdqd+KjTpx6tNdGMhwDpRK44QvdKTVE611iBqFiFZEksaSoIOeL6s7ODMPWQJAhsJlK7AtYMOdxm/ZjpFzgJOBXa1XPpYulF9EMFpd0KJggA0MB9ad/AoEwnHDGK7uo6SV/jvZAHc8iQXY5ZpXfR9n698+vTp7du379+/P2JjnZ+fP3ny5Pj4+D1rDp6cnJydnblV/Wzx/4PRmkDqjJrC1iitqd2PgFX6+AP51Dkpm5a6yvzTtDiwp8isq3EHiDRia0QTFUqQ9My6iGElqUQZ7We1+PdqyIKWwbKeQ9K+yEuHESaoBvB4gPg6U4RcKnFjoZHE7+jTfScRa8xY6kAwHZChUg2Gpwj92MQ4vPZ1Ry6n7Ya032QN4kN0tfvK7PJbciYjageemLvORffW0ckGsWNI4lRirktQAlaDaKIrN8umFi9c5zJrGlw1l/aa1u15dgStzViTQYq3nrTWBLFDbV2fdyJryAPtLm21RgeV2fmV5P2LyGRTkYNsFkwaeQmKc6+IzsLo01wvZa3d/5+9/4/VNMvWg7Bnrf1+36meuTB1g8G2cJjT12Bjc++d00EQyUjpKqz8IpCuBiQCAncVJCL8Q1chJeSXUlVSiERIUtVKhEBCqtPExFEsUqelSBHg6zoNUjBIoat9jcHh2n2GAMZjwNV4ZrrO9717Pflj7b3fvd8f3/lOT09NVXW9GvWcOuf78f7ca61nPet5WnPX9EEHY4c6d0uHkC38sZge5Dy2C7AeurGuNx0iJmt9w4HqzhngZtzo14TjR+8BuDuCX2IHmDx6rpbTVA7Dqumi96YqdF2U51j5lJt7Ae3QYl5JdF2OA8RVkpFxuwX5KVdriecUg6wkHki/lbC5ZCZMIr4oiHk28vpvTk9Pnz59+grVZbdv3/7kk0+uX7/+5MmTOrS5huPVq1eXENhf7OZDuI8fP8a3YFPwCuIKDGKrBBBbN9ZvWYzLWwZ/9LxJOe6kClX6YiWyYTdqEFYrjKuZJ2scF4gAsEozMYOElFEj2LNILcmkzEnQp1a/viK9pDJz3wdZhEvcqXKYG+uYu9cjfI2Tyqhk7Qe6LfD0gfbPbbXHZbK1xHOGtUTOFN27wXfBRZOy01Rtn0kLznU3l88nqhKSQczXfGQzpDnIuB4lTXpZPgoTqAap9aMyNXuvwyTwnKtiRC+kinUatelej9hSFIllMLRSZV6CWtlgxMVbqBW2utIIEC/Cta3kSC3n8jWBnaV39aYROj2knAoOjvFGycpRMnsPiRpNJZ/SnnLOYCI90kyPwILoCnGNeIB+dtJ6x+JjLyQoO2w6DbvXrl27f//+p59++nrXv900OylaG699aOxgrn6iQuVet2cd3vz579GNoxSb58q/qEJFU9kT1MCYVqW5yGWQDcIBrHlKd47bt8+zzaKE9RYp3X5PmQhChrNlZzI9HrRcnjhaSVSxAFtpHBmvhSwau9I+zE3hpAXrYktZdMJeDMtTFY7tAugr6G0JhhtscIdX5hBVTeWsxrNa7dehmWzNuQuCuLjm/qI80iMYxCV3w2QsqKD205tfMYawZUFlInc1BjujkBXlWysn1lpOyL1oM6lhboPEjKSMb3iKMX3KSmOwpImWkNu5M9kXRCbfew47GdWgCb4pGM1wdmQ7d305Tn6cA+6wLDYIYbxIOPbNDBnblt77GUwUDeghMc2hp9gcKy3RS22R+rM4qv+lf+3f2PzoL/rP53/hP8O3b/Ma24eDjo6OnJ/76aefeh5wdHT0/vvvlxe/AHmHItT4+jmkj9ccMS2cXEFSc6rihTN5rQ2mkpiwA6nBc+U4xQGJ3kKn2JYPRNxa18mWOV6MOsGOwCp5Rbc+CrCWSCQScV0NJgSNY7pNb6pe5zBVSr2Fik9UrT9ViSgT+pJ6kzgXUT5m9JzrlGov0Xf3WC68GIvV8JC0q70IV8lytjvIlbk2FONFKa2eXSdxZNVtlVugQRyRNGp0GfZ0coLRJAntp/p5aUSpcn1pvMhaqDHj9RMf862FttKUWMGyNhcckThcgzTnbLnLlq9UVINY6foNTDf/agtB4wAcW5DlmaWBbpZVJq6g/ynWHpEdJp6qVdag+Rbq9sWEeqqwg2TtnIaKic8L8YJaJryTPor0DA4DDadRdkMM4hTm8qU9dcOwQiw9D0E2YNDYifn0bo+wkkgmyoVnZWtJlIIV7by6YQBJ/QbZhVkv1aLntvp6i95f+Jf+H/i2bh5qHz58+Mu//MvXrl07Ojr63ve+9/nnnzut+PDw8M6dOzUC/uDBg5dkz1/7WFzXiQG2Alegz8iHhPxcUDn6731xE+EV6SP1K6xGVNYyreIzLkulY13K1V44LgDViaGaj4k+auAUk7lhwKJul0V+R3Gf+52ZXZCd5+EhmKfxkdo7j1gAiplQhMFZyIO21RXtz62rZV73JDnleNTsUieD089uDHeCYDTXd5O7thmgMNtbiccD7jnD6pJDkIOGssSQZ6l33nK5iZgkJjStzOxcuOPcOkLW0ndib0mvF51Uv1jP2YHoNEaqSoOZ2JDvpeCSpLQ98SuO60Qn8S3ddnlSfMgQhNNMz7+gKHvomKo/c9rP2V3BIFfdSTSE1L0YtCBQX8EV+r2R4mY8p+raLqIfq+r0cgcalGyZyvxT7gRD3a9PgZBm9eLqMg0Mg5xbt7GvyZT6S3/sX9/k4vf5t6wKvmz9230L42IpkFaSJSZ8qF+GgGMERUYKrQFGhBZFGtQGHY3yCZ1ICdnrxvk4Tm3oshOrf1fMVEQ2ojaLOnOuKqhiFy5/KqyX7FGTs+x/ROCYCrpbk3e3p3Y5IaM3LYabtfRTvFuBNfouOd2h4PhTmFX2DfYsS6fM/ClZppwPlK5GSnKU8VQoufQ+4DPYwbnVm2AHqVa40rixblDyFR5ILU1lK41qFlL/fMfplol/ruzEPQuSOz11ZR5zLFjMgeCLbFKXztKBRB0CYjrP+Vh2uM2LTYSxantxqWJhp0o3uVluafjwLCsemR+QM/uMhabUnJ9YrOrYnqVM9s1KUQlcniqErhLrEFXwtgxnePiSHrqFK6gmI6NI3VjXi1Je9OjrX/pj//qP/+S/h2/x9vHHH3ssfPbs2enpqf9ch8/6ny9M3uHbEHmLUpsOxFUZTYS05FzZMKwSvAWjJAk8Sl+GOouUqoUeXOmWSGK9ApgUIXEUK1eZXwzTEubzttJKrk/pqgUdFg1AjFCXmOhtaH15Z9TrWBMhtA61bvL5FVeo9BNKEFlrzwrUFClDGDPxrmeaxjBqD3ZirgIcMESQiQ1gcyy1mgGAK7kAkIvIRDYOQLJhuCLRqD3gHNsIjRZm9Hkh6gUOpbZzc2eIlcQrsv1O0pcQJxGj8ZSfILOL4U+KS3tPXUlMpGaoguQFM8Q6pyhF91AFkRUn0IytjBSHh9PutffWdK3cUROO4IyQL4dWD4gMMHGchYk5eBuKy5LYBekEdmSepeF9ILHnzCBLEYLoXLhzr+pUjDIdXua0Lq3Q3uGBBdfqrH8eIObWLEeym4VEPKRwl1y6vvbs63/6h7+9APHp6WmRK5yG2rOzs5dzPvfGjRuvkw3dBXUicCUBxEliQoUGADTgq2UZXIP07FbSG0SZBUdZvG1+1lTBZ318jN1naHJtIpYkJhYphEVYJoUz7QG8lSssd6jb7KHwm9zC59IYZMdOa8NrrkHEK+7R4q6wA91+Q5dOZK5zuXsrLgXTKjKnZ5HiBqp7frLsJhErbIW4nTO7cm3PC8deQT/Vku863TL4G2OOaFoV13qZ0+KJk8K9MdiJraVHltkdOAJldDjnHgZlNj1W8T7J7Egusx2RXHjGyLHjUa3YWT5XpVGriNANtc44ktDERRG+52ACNPY3pizYbkGTtzzrm2dJDFrU6lQkQp4zdLCiDRJgndgK5hjxpSLy1w7K/8W/9m98a6vgy9a/ze14dHR0eHj4yrGmv24QygxiMXXgtSIN9Qwq6CrC4Eosah9NSdEKSmNTqgUVEuIqORg0Z3Eg/Qo8kO1XDCG5hM1QRAVcV0gok8NGYl11Yk4I+hqipUuPUySqKcsLDMFkh7o5vAYGF/SDLhv9VtqDK5cauCJ9pW/FABNSlWJ7fXBIDGKsJ0p5U69rQ+Oa59gEB+NalrleTizsVhLX0m/QXYSkeyMu7rg5Q9FskkUCF9szawxAnA22hb4KICRP4RYUncztOpyiITKKoJaYcNGPiyeQVGjkLEur/Q2zmFExqUsn00ORDDotbr6UOr0RonlIuZZxqBQw1epB7ywr4WIR28HjXqoikFCDaPkFiZp4lWObBFCz3n9xe1xL3DBochZ2xczh21v8YmTH9yK23/mP/oP245/6z//xP/+Hn/+5H86+7Ojo6OnTpy59MAoer7oA34MHD/Y3mXkB8g7vvffe6enp2dnZayMlsVgqiK20D8msY6/b3rkGEbqxLlYyu0OISTCxiqYFJJoGNafu+FDFWIJtBPNlDeIiMXGQNYi9zCvLFyfrZGJb5EZUQYcjO5XoTtxp/WEyj673xLOIK9ob0liAq8OvtS8VhcBWEj2gKCxI7KnPuTIiZjmFmj8bGQyaZingDgf03/h6WFURXAJ/dUQddZvbwTSvyU+2o5KGdcOvKZ7redIhJ+Fgeb3KY6d+cpy6eyB9wCB9W+qxA4nPeQGwONq21NqkNFLDRaZvIlBMhZ7YwdbSbxkC6APRtT4Dq4TQ1Z+QLB8a9Y+tdasKL6inkiuHun5ach8gniOspCcTD7pDnMVlemoWgkA09SFuLqUTg4amLIC/yO2ERU+6le6afCJkw8ptkrK/+tkopwpigRKhK4krRE3dF1l44y9Gifh3/9P/y/Lzn/0n/6kLX78kJfEqBt+bN2/uP4r68rRI7969OzuE+7pWwS4Dmn3qLIgxrSSjRte4NmBSfKUTOV2D+GuIGa7EwLGKrWa9t5WYaxCneb7kSSsGZVpJkrVmvWivkaaRpBpAKfZZehFrV2GdwKCzxVdhKG8sjFaVaMFCz6zGODsNg6Qy8XPP/Kcrucxzg8brvDsAtTrU2FKX2n5OIuZCAA1iXZuGTddzFetalYl+SFekyDJ4DtNTA1RnNPpYtQcuBh9Y457C9SA3OvyheOSqRpf3HPut7zqfqXTtJG4HHwH3uJoh+Tm7dqljzSYFrd0XZFuJdAYw5LNyTiVWpZUbWlXFmp/REuxl1rl3pcmrtvxqwzC6BFt2a+mrs0vNUi2eA/vOOF/KSfEZHbYXVgvXVfB/8s//4a8WquC6Bpz2MmeFiV+/+nfc2Hn8+LFHx7t3776uJWshByUGsZcfwlGt4CRizMmdrHbKjZciRLK9sv/+IM8JugZx0NhRW1/qxElpVl6kRbODOYAbWqEc48UeAobFRLxelC/kfeweGJwurJeAD+bOZwc70FjvVcgcVc0ahcJ9J4aWZApGA7znrQyxUbbsRCBiqoVBvOuLVkmDmBcer+cuflAd6GPIhc/uPeilZkCk9hjXhMYwV/ipl/Hu39JJzFZ4WKgDm7+oxqJZXIsnBL8hYUtAw4FEowSNZmMQwThGSzPI2+yBwwSsbo/6XT2Dg/7pbDA5q6Lx3ZOCERcAegOtLFMXDagkgfCD72oP2UyYUwq4D+Q5A4C1ILuoM1EiiWngd0R7dmL657e99SuD+034pe/sCAxPnz49OzurK9JXNCJOK/CXrYr++OOP33///ddfZSK1eejrz9IdP+rhGSSyuES6j/bsolsWQIXBMWIb424D7nlF4n/J0HnRIeKwtUtMJD9rYQeLqUG7O9hJ8YUrOCAZoPTBeaOYqGHeIrUoGBTRpFoOwZWdVhIN4kJM/oFuUtdivnnFa1DIQXWnXjxn5eOvSP+c3bqaWq00iOexQiwoQfuF2Ixbre6Tpt70HYknyrK+RKEPrxGjyIbBMWK0OOM0BPUWzoECuCefQ0toe9emFqMtgAfaKyyAHeyg4goE2FriV0AQW+vgE1HL6DtY7wPI23RLTE9Us89bdiWXK9F5GqYljxun/+b6FvOcH9nSaTyM0K2FjXVGveBBrXMwMX861hLfkq1bLlcOddgBJdf3AyFZQ1NGlobG3QU8pmU/Bu/ExBqT5VS0kIjxwkHi7/7677vU6936xq3qylbs6V6tAHF4ePgqZgujIdzZGvu18alzBnEHdJlEHMC+4cnKuXUjWbMp6GZ0bRl8DZTH0+wOkf4st17OqdrisFzE7FPXKiEk3f8MS9la+NxWkz3lCnG3jYemgDufldc2LR7CthaqGjz32IhK4F3W0vdZPksWqt2fC0JcBWinD+/gd6/EyGywNB3TmXOAK6J5hsXFVQRBohO6fay5ExJWpy7ZmXYQZpxOx0YLUbVH6KFd4qKN6m7T8R3IDboloZBzrgCsNX5lTEKjaBivZZ5VxBMzqw1jq7wFBFZzU86S72H/yf2HrFVwWg56QywmsLFu6q+QgFcRzsXfViziEhoOrnocKpuKTiKSkcYgijJVokhnTBgk9ujKPwFEyIbBZ+kixTLVzBnEB5Wq20tSBe8DEI/sZF+/+ncMELt7wPHx8fHx8QL6SbziW8q8BSkiCl2D2CpoWKUgp+LifbmaMRXFQo2UNE8lA1VpeIGjQVqHvYIwgiOPsoMFVqnPxQSxThMDy5czSyu++LDhbLXmQxlbhp6XE20hhTLSodulQcyWh1It9ItTqjpU5iktiVWN5Eq+tYn5GvErdK7YqJErGPdTlAsSFzwHdkHeMgDoDBI9fBZUumobcCQZ3OWadulqqpvUSd8hrtEH8IpstwwmcoD4U9KVT/aQmLgQvxh2K7ObsQMdloUcrlKu9HrMd94OEAsl8GJSMWGiBukZ+iTiMeh1FEYeEzVagsSgYi5rqGbVUMzC2RjfwCMG8RIfYLa4rrjJKQxvkLw4ysXNP9Mf3nMKYJ0gZHExg/YpIo7HsQ0IEAW7PZnwL2p77733Tk5OPvnkk1qx3tVy33vvvdegLnIX9aUI+iLr8JFQ4/QFL0AH+cVsQbjWvpNCIh7hwv2mRSdH4ZUUVCTi2S0yBIlGpYkAnWw5WRakmdmnyKC+5KIxHWyF2HnnRnyAoJkWmtUgdivz2PrUWRZ0y0n8/MSADGqJqBQnzD21vnIxO450IRsntOUTopL7viPbHKmnIIVrWKRdkd5X4wPpXdDDg52bcPbZkmh26y10agCN2iN0g9xwQ05hmhj1kqPof1Q1KkRbswePVmvELqVmnJLQjbKx0MLlg3ZBbi1IqZoMGuFcpNkEgHkWBCoWsjJYB9sgHEgUEnMt555dzNh1mYa5UPfJBZFtQcnEBYj9DJwDB4g/vYxPafYCok/M+JjX9AVuHsAJ+iMVVB0msPVek8jEOcOVubnaIjExKXr1vOouVKJeXEgjU/NpNBS1lrihxGJZ4eZ1yXr3Zdxu3Lhx586dk5OTWpD35OTE//SKrvyjOdaXHEEeDeHOJg94XTYFD9ArtRPrJM3Ujh40w1iahi5hJD0bKDnNK3zdqjzVwnV70p9fiGWjSDGqM0m95cYkgjwCJFNcuzLRc8gDKObL+1LRJ0LlgkN4O3OabVdbkzqmZY3Z7k+Fa1nyo3tBww2+ADpM7FDABqG4yLie+1a0OLpOBY55EZy5E3LhRLlrDAUAtV4t6okvM6W6uoj0DH3WBR1wf40KrrUvV62AmEun15K9Kn0WRyruLZJ5jJ67yIkgSzeYJFGsITatGN/S7QpxqtVZjrRLzIMLIvX0l1t25PYcXayGay91CTYMPbUTC8K4h7pSSZMKGyOIBZGeQ/68RfgpOwCz4Ts9ZRrNXCuZSSMOes7gYs3Mqq0rxDWsA/VlXSRv3LhxcnJycnIyLYdf0aC8f/3b7RnLX6et6JetEFcSg3hQNGQ+Zs/gcoRTNGrl/csMk9XlVvaMDpqBSMndwlpCV4UhCR9fjlQvwk6iiDkB+UD6lQ6VdgBXYps95J/2HwLaMpT7I2iEaV7i62XGxZSHeXyypYdxB2Rga4+dGSU3yDk6FnM/sQPtQ6XrWhzeyojubrWN5Jnm5BFZDPfjyLHcCE+EWQUEWwamiloOJLrshGsQS5VI7FA59MGWWphS0/hq9NaCXXQtF65mw4dnC8To3JxRbUlUQQk2VGi5BpNkqmsKXBl2fvEgJTczXIHxuXVMoqJqOaFkwWGhW9DVIfPlBlqo3SgqsBwti3BEBpdHIKxWAM2ieWuKc0METq+VAVCQmJdLpR1ofG7m+7nOgJe3NMAQYK6hRkgPPUcXU3E+gEQZunoZK1UvU4+Pjz/88ENvOT59+vT4+Pjw8PDVLVNLaPRDW3rBkydPXqRH60iocfqCF6aD/ALqkzy4wNlK1SuT6fuMimqV660jYaZW8SmMAebAI7yT572ZrXUhl7c1YZWA56llCMNpoQKuEdfVfGUbIEb0EQfXvGqdem9mkzqKiRhlY92B9i2R2WWIE6UooNEdKgOPCsryHIlRItWoZbrIKJHBtbOKvMOIsNN6kyQcsNZBDtI/Ryjd3aL2s8QTIqU3XSnri2WQaME7gookjTXYlyNyQk/2iZAV4luyfStrELsnQYVOTjWI4Uoas/V3Le9Qn7oIFbEwe0OKc8Jd6SKrDXqVSG9ejvk8HiNGSkdTfQmHa6OpagLuDbKxbnRmi8pESMLQW79uCeBA/xX2dU7zXoVLTBCgDeMspPYMQoYy91KhIM4pq817DySWVHYt0faT83XZ/Su6PWfHhj48MwfNuaypeP7USc1aIiX6wnKA/jvSd+1dnbXgBtfKKKp48eL/+26Hh4fXrl3zoHD79m0PWPfv3wfw4YcfvnJr/r179z766KMlRPXu3bv37t172fb5wiHc14Y+jCQxQclzEp1YJ7ZGL2C/LCmQMFCRrXXuobqWbcH1dtM4du8MgE5sUJxP7TXv4+b2Hj3qKRfZSiNZ/7nhVIlIGsfjZb+DxVSYTN26y4gjIjWHV5nKB1Wa+EUQ2Q6031g3kiFeSdxHEPlrbNm4G5lgKjVMnM1LK0CzZbWKzHQsa8cd7NLQ/5pXf8ffvb5ziYlIJaxuR1QjuelKnLeOxxeiBCuJHay4ATHPXnvB22lUiZkjL3UfMmkQz2MLxd+CdamLHXftCPRxSetl/hXTbKtuFyBWyxrT++sseR1tIu2lYf4QGsSorqe664JW83C+GxV5X3zx8dmFNayDvZyLpPOlPvroo1L8ugzU0dHRKxcLLlv/dpNU8pUnCO+/HnViHX24wFqY9+Jt7UOsTDqwrPVsKsUzfwa+I32tkR+QMOIVIi4xbyIqPJCouJwRM1t9iUiZzKXKIAfYbo0AhRZR+Wa7IvGnc4Ouu48qiB2g/6kbtc+trQfa08QzhiuJrGoEDhB7hAw37FpUXOd3Lb2JLi/CTbVpEJDnXKW6ekLREizOMyosCNcYWLre695ixGxa3DoxEucIrjTtg06y85pGC8YxJ8hMpdFkkFEONJWYmJ3wXYW4yT55edR3XrlSqnQTbfMAQE4fUYfeueCYAFOnil+R7U9kvYU6J6Ds25bhQLhN74jeUs5w+XC8hbtXS0zYzAVNAlvjWldQIbkaIRt0IZnDSiDXEp9TNKtipCGpDIKU9oARBFxB1afCfbzasiDmpdKrnnr+DWWTO2r7q1evPnr06P3333/nnXc8Wjh2+ejRo1ddBuH+/fvHx8dXr15dCu0v+AAvFGp8bYSegthKt3sGOy9F1hIrFGlAu6JXKdMFLKHJSKpnUGZxc0wmJJwgHGhX8gObOnOCVmMBuWdW5g0h4g51LrDu5KYB5zILqmZ1gyrJGc/B4m3AWiqTRoKAdQ7up4IuhexfwgzCKiJo6MgahhsZ0KVZh7X05+wMcpB5xHlgk7tlozmUcPN1HRJRtKYzJ1N7zkXYEmdd4bfWINaql+ksME5hfMBVfTwY9TYUir2FoHFrQWFBYxAVoocejDUw4bpGa+9PT1bKkDWIR3Va0fDdZsggUtnqS/isbrkcWwsj+rCr+NUB2qVIYiXH4UXpKrsteU64ZUimx+MSEb0zpk1juyfmbWgO1gqJ5V1E0pL+VaI41HulSSQ6RumfY+Wks36hLM/xd5zGeIzeWOdB3Kgb61TH9lDlafcIKwAZtwiu6LVCzARnrmCWZSWymmq6W/h1JuBTevDC1slHjx698847d+7c+fjjj69evfr06dNnz57dvXv3latFT05OHNpeCnAvZ2h7nfDfPapgrBkhmjSIkTzb3XjDIFt2SwEpl0tQgOL+n2aUEYb4NQpzH2NfSeypa4k9lSJlatP9RSPm1I/q/8tbZQDOK7L9MQ8KRqxiRnWYOGQZ3Fqux8lYoySjrF1b62rRdlKLk54HuCDF+cY8ahxMUiCV7F79cyESJ1A1JG0HG6VDM3kaoqU0x0d4h0JyY11Z21eZAXNuXVBbT7TyLyp1xyoTk4xi3m82yRDn4I45+modcfY6R5JQoCDWwQ7QY+wuy4Hf0J64JcZDUQxTuYSwQ5VNMeTsd8uw4/RGiD8gs+PjXw/Om4IGAjjBf5LAezqMWTvHemjboOdcrWAHspX0Rh/XsxXsgHHFfQFiI7YM228CqtynheAygKenp9evX3/33Xe//PJLB1hfRZH6y9a/Hb59WykU17AO0csPBZ2VmFPnZSeOpmoCJgwIqzwWa8PHoqZaJCZ6IsDWGmXns5qhnH1FZGpLsZhtSbgAEomgv0SrDbos+ss8SEtorPxzZl9/IAkd3gkZJBTYGSLjPcmH9Zs/+D2/9OOf/vSX3hq92enhdc250OUbOgPntqpHcUe5ThIgTgmETI4o9uiNq7X0PtDBTIg+R/05dO2IHUKc7qCoWFwyY2qiOgSppE7ZbeUGYpt8uBXSclQbDhZApz0pw3CQzDSW62B5oP1P7KDsRqe2mQonETXVtyAUzJhONojHSqzXuDXlPP+7wRecgJwlwMSgzuwbkGJPMmV+z9kInTX+s64iionClOvrF3SpE9uwixCv510F1YfNXYwSQ5NG+7GG2r6R2/gi6E83btz47LPP7t+/X+ZbX8Uadbo5D/qzzz57SZDuV1So8WsWfpfJVx1A3Fpw7dTIMKgEsBrq9OVFo9OKVWPBiJ0+wzHZdPQUDyCfZB3GFWIn7KlblE6btMalZXTD1wftrSPFSc2kmKmqgjCvtJNERPqMVWUlKuCB9ufWzSbZCq5lS2mkAyN1O2kKYmj0NmsjcYFKfz2EdNBCk0MJXtXMf/m73/0Tv/pr3/vJT/7027/i39JXwtAEeroPUOgkei+wN82v1Ah1GAILmsio2my+V2vUBsIDD10nXjSNVzgrFCOjw0aFiWhfJkuc3H2OrtjB+RV5bt1aU542ipUBdiD9V1x5ExeTPNAaX/tdBeLWApS19ohUbKMRbO32dF9lDk4RI2ZxjqXXupwAxBItOKoyiqQL400zHjVTg98aQ1lr30NpA6VAEo+Bu7HXQeJ/ECSRmmWMtpMxGt1DpX3hQpAr2Ba6lmjEBsHVh91t0t++1v5SNBi/w19kRPjiiy9caOLZs2dHR0d37959FQd3Pv74YwCfffbZK5o2nJ2duVXvtWvXjo6Onj179vpFagU7kGAHFwONSStPxoDg7gfEPU5yJSUAVEwnBORI1T2sbnzpCGI9fWgVQqogQtxw2xnEw7wOZVrgrxE3CJ6KX8kL6WhYREHUS+j05EiceslIuzL0FkiQaqaqRvOxoeGbaohwKQUiZYti8OXL1Db778k+k8Gf/frf+N0fP/9L3/2luRJJGtRyp3CECIQIEtPA0ByaJlUWFJOO08x9UjhwOzCKyySEoWdwDeKeWhDYogfFtk8PJxHvUS5JHiBTGCTdJK0G8XAppTKk9TsqLDX1JTOaBVMfiNH2nF3tOZ9Mj0BMLePEVlqnTmpz1XGkPucqwmrFbWeOL2LN5qTg+aRlfL0EG4bIlGhNr2bNKvAnJUIiJDIN8QQgwDqJK9pK7FISyT1D/00AxHtmAo8fP75///7Dhw+dKXV4ePj48eNXMa5dtv7tlj7lk08+cZ+iJ0+enJ2dnZ2d3b59+3Vy0XHF9JVYJwxinUazsGUgvR2aVCbqZdTFBAisdc6DMukYcNR6Kq+8gh7AOUKAdWJrib1Yp/2FLY5zdNnmO24kWertOjThag9VU+e5aKMyvHtkAMtmIMPzVg2vSmQQMSzXSEFsNWmOZTUJdmJv6daJq+PXkMWp5n/xv/8n/ubP//1//+hXsPgtS8rOJsttttguet4Q20Hyap4rmbcx9A7BSmO/0BVUIAgDqVllSS4qsdJ9YgpQdcfVY41066T5vmQCDqDTmPUlhsq8kGc1WcFkkpdYicr+4pEbcoREhqnD3khVM38XgjBytmpFkdVuBrtMjUHFIEPx6ehwGS6txfsxUhdVA2RobRCz+sUB1AEdji4VUklMRBerijmFyn0jybD1EIblpRSaODo6evz48WtWEXnJ/RIGMpeFOj09PTw8vHnzpk8wvWa1qIIqY9/R6baWXobyQ62I+VIWwCsPPQGIZqFgxDok+jWcBFfaXSESsgK2CAmIzCOEKggwEYLcSJgkxigdN/fG9CfaLFST+wJIz5DaVJIIswXXGwOO2mMOQBeB+50GWMirjefHG3YOvMbp9EMVFERRCvUMnVsRdU2QGWJEzcrBjnryT7/99t//T/1v/8Cf+lP/5q/96ho9xrMIMpj1QckGt02mnyJhvNo3UVjBA8RV3u0Rl3a0S4VgflEhmCHISurBRF1g2qj1+0M1TRlgIzsBFWgyCUCHuM5wfxHLZm5/RmqkT/nM47DEKA5jVWU7RfPXwWtx1RHaGvEcYYWe6AqJeGnrfSYXEimEkhpNd4PC9cVYZQnmsDMVKTNJ3lEuCieO9cgyLEIu8rws8wxQcfmXMl5PiRWs7X8xMLxS+3wtkbAeL/WgpE/wvIoEpVFEw6tJyD07O7t169ZI8en69es3b9588ODB61QFO8uBRNGXCGLFzGZP2hAzN6hnkLbKmDgzy6Dk2JRL5jI4zRPtwxCuveTvTrOABR2W6cLlQfMASZkQlQ34Ug24mugROzTsllwLlq6lpsoSWFWM4kXaC67y/7xat6dTlcUizGSvxvo//k//z3/f0z/35G/6r11qbaspUMwXgtpfWOkvnZNx/rCMVHTCIH1OorQKWCFSp3V5EkqiuMRE1i0kgCAUpryxAm3E9hXrZxCqNKrTbNqThsKVnWwriVfQy7iTPU6fwnIcRKJGJYA7aG9FPVTmTre4TkjkzqcyQnTiwLGjPTAqSxeggOEs2R42GKPzaZAeIcACTRx5yzzil1ZiwiPygwcP7t69+/Tp0x3029ev/tXp+69fv37r1q2Tk5Pi3Hd2dnb//v2333576uX3igZFFNIfzP0rpVqefFnhRB90LTGkRYTNwwog9RI7L4Esm1lNHUu1SLIKO+n3XoVdC48H0q+0X0u8FI2QcybakcrqBghqInugyrhw0U0efcxrEXeGSZ1O2oJXJOaeHl0YqK0imE6jXIJVPQ2za4mdDJ4Mowg9Oyrl8MHoRFWzn3SN6ele1aOdZZmekoiD2HewPZDeaVZdy1Fais259FUzMWsEkaYaf4WEhTk4YFewb8Ie/BoJuIZV412sRrqgYKc2aUtUeos56Ba6X3G3X4l1Yu5SGAQ7QIDETaPWd1sxlzPO6EtssvOGtAFMKijCr3IhICORDzmtjYsMcQd7S7aODnv6uEU4R+dJLQAzF5rIdnw5GcWb7YVsN27ceNmimMtC/fIv//L169fv37/vxKt33nnn+vXrS04CryRALFxp7JL4/gWvTM+OBZbhdAohztap0urQagVLofGaT5405mz0Dw+pqHBepNOmeCD9CraWvqSq6mVDNd9Q1TZRwWjaJyrTjMEnk+xDNqmDENhYGOXrvloG2O4itnQceyaHGaMm6cMFm6+kjGwD04oYpwFFeniWHyqNNv3lNg4GJtN9SyJXo+DXwa5If0X6TjysxLekv4JewTXsSqq+8kSRRM0ZQv6uXalAb4VhhN7C1jpHb3czjET80sxcEa8GnSWUr3iKX1mYUvs8wpJzgKYa7y3Y5ISPmgdX8u1RvyYIy391p/VNpPYMRo3QaGqW1cYYOBnvnYVrpTLgrW+StcSwTCjutC9WHEFGlXCinNfDPX5X9NbFdG8n0m6J0TJpo3ZirtkdhnwmwxwVpi/tbgchBG+2F7C5n+0rVzM+ffr0nXfeOT09vXbt2t27d/2Xrg19fHx869at1+kaOaAWshhoV5nllJAxWweRDa3e4ENy+2LK00UjDSyK1UZhmha6QffcZUwjpp7PTaBPb5yLqr50T/ON8aInNpuW73N4Ve9zGA2pv9TrO6kQ6kudrk4s7PeW+rQ43FE4pJ34iOqofU6Ry016lS/aMvCS955mq6GaMTDNUkZAamRwELmK3VxrdGemC/npswiv3wMNI5BimU+kwk770qFP4RtJnV+z2dqoFVrMGzrp04hP/vNm59C27nEJavEKt9vd/1lrScSS3TI0pQQUJ60XAZDiWFg4gsyHYIu7x6BR4P8tK0m3Yeezs8yDto4Oh4uKgpcEJvZpkm9P/Tu+q7xxeuPGjS+++OLJkyf+y3v37rly/+sUHcs8qQfIKTTWp5nW8VIyS2gtYvg+2+5MZMcxg1Brk7qsQbx7CZg2VA9066SMNGFX6eWXNy0yNZZrp5Gv1x4YK3dGIynS+MY0b7t7rRPheoZEzCvSryS+JduDyV872FqjkivYSuwf+L/8P6/9q3/i7/0X/1+7Y+puOzuD1voSsz51uR6z+jwQ8rxKodbSH0xwf4O4ykQJimvpVXiQBRanEHkHW0ksqcPUjC5R6rwwzir5HOTyh3qpvr6V6xGnt7BUte70ihSacGneHoyX9aEMq5npWlNxXf+ec4bm1TSNw9AriSvt9aLxE+8qs/UFKgKdSSOiohjP9z3GGh2lTTowiM8RYrtmSmZSS3m0qyHo8o2RM1+d9MrfbC9wu3v3rgeyl8SL3DuyDx8+PDw8vHv3bhlivXnz5unp6fvvv//aeKaX5FKS+M/FUcdyr7EOi7EJykVoQkGXnkCFEaOPoUjRiWBhdt6Kurpi3HSUyeqWzcpYlhSDWpozDf6/0ob2aierrzqlZUoUatbnK9JPBzPdYts1BA2tk+Ykc3C7vBoj7i30FjIthTXiVtrYBxLfkt5/uJKTnCmJ+Hf96Ee3/29/5O/+jd/4e37jNzYMWwsuhc+FK9ibGiXtALUs9SOuSm3nWyShQsrN0tJ6AOsSKaxYmFopP2br95hw4ZEKsAtDa6Qu1GlJftE9XQNsdFF0oi3IRlZiLJVQIHvfHxcmXioRBVgPDnUXdVPAVRYGGQENBilVXDSNfryU2QehTmimsL4LXtV5sl5EKJZl9KQydBru4YTyZyuqSO1rZF440rYS0Ns5B9KvENeIb6EPc2JiZVdXMznzm+3ntd28efPo6Oj9999/tTBid9V79OjRkydPiofe4eHhkydP3M7+deraCrBiVh+GdWDh5dQL12zCHKkbC1uG0u+ZKRjF0FqkjuxS6wJtrYWvUxXprjCen/0hrlHJwGa2ZB7DvdLUj6K4QBbWEbSdilipetrOze5kAx4Z2fCo0PfkivSOBpTCNnXEKXu61Y32zSBbhlv/0snf9Ruf/uN/5I/MQhNeTtbR/GuIPOzI087ZxTrYVfwqP5+67Ce/dKobraGUyYRowYWq3Pd7Y+VbbDiTwDk7Wyj0pnodQdwZvu8kHqQo39jQiVDFgsSV9C4XsYVu0IC8OkM1T87oobJFZT5jc5LBtQZxndFhw+DcAoGtJqeRrQyF6zYs9BW4NANdEyJzhjbQpYJwrXGlZWUYUriWwi9b6/yNKpYmj3NNH6k9pIfE1JYY+lJrWqDhzfaS1b86KlZPTk6uXbv2+PHjkdzS7du3vWR9DerVUhetwJVYjbpWj0r2/t7Nl50wZHufM+VgGBqAt6S/kqsL7w51YmvpwzLyFSHP6cTDQWzmQOKBRJdnmpKIg9Az4MkQgRiU0FnuRGFMX5hJdBqD7NHnmVf6nbv5xLCsyiRAU5JlVpfPn0qV9//9/+IugLgOhLIAWwA4t44VNLzJLFcO599yacqVztJnFl11m3JO4wgOcBC8hEkOLCHWl2nUJIyZSrZ4wea2tfYdTCe7WqQPi8yIDEleEXsqZTyvpNuvCe3lLQeyPZBe89RnpzGlEdZtGZDNYUdQLCsUdY3omlAhMZguvvHYOLC7daRWJD7YvLJS/d72UqZLINlmSpmA/uaCrvOs8Vuy9f99J5GIPY0Wo8ZUFcso+9nJsH+zffPb0dHRzZs3j4+Pf/mXf1nmttFg6c9784Lz5s2bX3zxxb1790rYffTo0YMHD87OznYYzr5aWxA70P4g93tkbp5jIXOVmppEqlmwMa0zzTawdCUBtlHP6bqVJYCtYGj80GIyc4ddQexgLTw6r8FTeJdMAFpaWVOXFHC5232Iiz4hFGAriWtEgXlBskrUlV0VnVEig/9v0F7PGHH5AYNExmBVV05IgB1I7NKxQ+ci2vu/8cc//CP/17/nj/+xv/ZHP7IMsBb1ht60nRiVek8cqnaYMqY6bQatXKHp5q5TRxbFJUYxdvfkfBc8YZHRkmSzn5/8s9qypHsnca198RMuULVLVHtC4qjxyKNvhJVYBhGY+OwJra5f00/g9SVcWBJzuSHBaQ7c04HoNCou2dmJ5XEgCmNo4HQLF87kEhzcicm+k6GzVERp7RPTzni7typ6KXNCTKWpE9L/bNTacahLgHUWynAxZXnTlv35b1evXvWZ3Lfffns21Bb49aXaTk5OPEmYra6RDXtfj03Jjgx0mIadWIdhAjLTh92kcQYJ9R5bpEaGIg1cFGxKwKoTb0K2cxix5ud3pM6nQhUEicVgzXI0yU9/qz9UDTtekV7a8YtSS64Rd8GvOxFkGZDu0FN7C7FWl4IUb+ryYl+0vdFY9me0yCfM/fIe1IT8+p/8M//wH378d/2x07/lN//dcVKUUVpN19dCy9gdwq7EchVkUSZRpv4HZa32UaSEBkKRlLt6lwAqQXwPku80zRIztQwNpxQif8v07XF58Gna8HDv3CAWhAFWRELy/IrvuWBofKaSUC7CQWRm3lq27BzTn4Xy5w+Hw8Brq4MhU4+feqppCQnZjWkVvhSBLjs55Xtj/JFTw4Oh65+kMKyW7Y7ZHMifzQ62SpZLb7aXrv5tFiNvjb777ruzH/3ee+8dHx+7Zv/P+zCWCuNr167V3+4+uS4LcuPGjUvpQ2mZuXDSijRgnAgCYir/Jq5c6jktERf8mlHp1+gwS0L3ykikUUmLaU6+OcWIv5rzkJWdoqVdgolrCFh7ak+f7NtXVcog4ZLQFVsN4gu3A+nP0bkd6oib7OQgg6bABjuABdgK/AqhnFi9aMkTuByzLEGm01+es/Gp2ybmL7oQewu1roVzXiqqLK5I/IpSe87shgNYDfB6936DoLlWD2KRtLlOY+WHcyEojSkLPkwMGUpPY/Rqx3YPtC96XqUV6jf2OoMsE0dhupNPuWPrfa5sHFisLaq+JR0muCJ9L9qLKjgV1TaIjk51Fa7oXIOMznBZGoy5LTR75jI6LM8ZviPj9rvTh2uViXIzUGCUHvocDtm0GZVPN1+yUo3ULVffyBpr38pR23v37j18+PDl2Z9PPvkEwIMHD6Z/un379v379z/99NPbt2+/sP05Pj6eJXzVxbxrYlzWQ8kD384XmEhYIY4UZi0pS8h0uWojlkIjKEQQiTYYbqAk93WC65xct0IOmY24zo26ADOEFGolWX3Oxgsm/ffmjzSVoHkVyg/7QoQ6kP6cHZLgElH5j3WwtcTz5YAfzT9/wH9HkWKpTFryGh2pGVxWYoIT0rdR8vlJ06MBlkWZS6aUWvXlVsn6ElEnGEAaf2E9IiOuyzxLdisSwA6dC0CJvQVVcxlizN2WMjT4rXbtWyNuoFfQG2TbVn+DK13DVpYaJl5aiqc5Q+GXlR/cdsn1FoOYkivETSXp6WxiTkJGnyUmpvis72FE0BRgZ4jYXfbM0Cw0Eame+ob20nQStwtJpvdKITOZzCjyToelBoc6uUCDeGZJgQISYAJ1dNguqXXIoZnxZrvE5hMwr9xuP3v2bKmK9Pbti+dI7ROU/Z8ff/zx2dnZ4eHhBx98sA/+7hrEAhlqYbH68Yu5v3hBtThoEF+cWC4pEQ+Lv0SFrRBdTQLDyCNL5pzWWGoZc28LT669zTln9JJQtotKtDnxt8HkNjXSqIRW3gP+s1SLWBbJnYTXpbp7pgzLZOrtJRcitnXuMCa1oA7kMO5aIiGzUmBcYJQ3H9KkGckrqKzPIqnhHZc/h/NmbkmJKCn7Q41ao6XrnSK/u1GCpNrUZp4t2ltoucyBcpBHuCLTIeA8fZW0U4Z9c/DaKYA1vZ1fx7QcPcKWWpn6NvThDfQrdv0iBTDzIKtrkUWo0r7sGAbaLgxgeZvHBwv8PGzZKa1jF5jMpbK4Ijuwo2sQX8qkTuM3YlL3LauCL1v/XqJb9SIHhZ4+fXr//v3ZPxWA+N69e/fv33dZkGfPnh0fH5+cnHzxxRcXYsQl11+hDNcgia9kGMv9rAR0H9WuqZq41l7BDQJmzcRT6BGBaILGAOAK4nOEzHfIwgKCA91mZhN3Q3tIK7itFxSIglio6qjRgrs03TNftFhQrdPujIs1Bq3tNwxxsTGh5k6MGHlacFI2xx78jmzfku0BooIHMEt1lLhJnZDf+/FP/C0//aW3ppd6JbYVk3TUs9j1LtrvSGii01h34Qh5ju4t1FbjKU4cJIU+N8CZkQCGoHbnk6INREBwAHlOW4kZ4rSlXK4jIXYR6J8r9uGW8MkvmY9n4zODRvMBqLr2a9gkoM18JiHOm95YB8CgW3aR2tvKqCpWsNlZ7pK3dpUBMyIw6mlBKeRsJKGYyH1qg01cMbpttECzduSwQGQ+dUp/ozTHGoQH6HvqWqJWiVd78+SEr+iQsinaeXnyMCHxG1Ol+DYCxB999NHVq1cfP378Atqce5ajAHZUpC+4HP3oo49mR2hLtfns2bO33367eB08ffr0/fffv3v37oXlaICttY8WRLikL7GSWJclLkPsxUB0mLi+acvYT1QEAwUWCkYMgClplqWb3jN75GE3/++qETaeNiCb3xRklv4mU0Cghqx0YaIXWnmUOnbRpI5cD8N9iWKZ9m/ofo0UkBWAJL9QHRnK5zW9xD7nTbMos2ccUIpX26UWC2+MqbC3GWFKowg1iNULoObL6fRhzVTuNUzHneMZvJxMIpizO5MX+YRHRwuiyH5Hgp1QRagWdkkeEklyAbm7EGDP0QHYMsRKd3hEH57degvFqbiIGErFL/Pk09lwE9dcEwavx7YMs5kME/9IXb0xxjByUzQGEVawvkzpw0VfYi1xBVuyrfeuBveLNyQsG8D2WZXFr+OUYrbEinDWm2Jf3cxw+ZKQc2yvN9s+oQTAgwcPXmSD82ffDg8Pl0rdYmH/4s/k7qAM4Pr16+5we+3aNTcN+vTTT4tK5A5orIMRGirFxUJ/8WF8ZoVZ5A7QbKFkVCnW6Bc/i4vqOj6c7irAATwngsAIgUIk44M6DGFw/kN8DQmJv1JeWBRybI24ReBc/aLJASxxpBKRpxrBXyqlSaBYDmQU4DJA7vw1cmi49LP3e3/eYy6enKXzL5dgebmmvHY7XZGmmj8riZLaDzsw4ikooVGd7qadiPPtKpDXcov9Al/3DcOqKoEF7BDXgzD04D1DJqmrlcY0SpuUAzMWhLhGnCKwZQLVp2916GcPZyImXQrWylQYJ0vYQlvxqKm2VWpyB5jqkEb689vjQogAnPpnAD01i3Gb0b8lqYU4Plaxr2YbMMxHV2B97alBNHpHXKDgCraCHSDub1LnbIDtN1EIf9sA4svWv90Ie7169erHH398+/btacnqXKcXU1d7OHz8+PFoN0psdgT58PDws88+89c8fPjwzp07t27devz48Z7oSJFs1zTbYhBsrQPgAvxhBkfjQbb4lKWnq5mMG5JXAa4gbhBUuJJ4RXtXK84KgP3FV0tMGzhycVOx1uNSFmqnxCSq/zfLWXZRBWc9q+yPa8mSsM4IG5WMqWkVRRwXHrGHrsB+AvXFRYDv/9n/ODUwfvfv2nHeuMwglmVEeFPbqQ0axLMrE50hfpBL/QOJvmxv2gVawbX2fb7urJKAtKvEOUInVNqIezu/uI91uBbbDGutGGqLQyjDu9bSP8eKWS+FrV3MBD2ZnhauNW5trMc/nSrFnGhjU5qKSe2JQQRJsScOSqAy0kthzlxrDeJIOZe6lq6ogSmfoohBKJmmYJjRiwxgyBMAzq66gkF7OmbV6fylWkQqyvheNfz+ZntxgOxoDOUXXo4CcNbPdFddfeJF7s/Tp09v3Ljx4YcfLr3A5atK2f/s2bN33nnn/v37N27c2O3e4H1WVe6YgJnya2KGLJ3H1AoQa4aJBaZQa36QrHtgoNY1D9vyuAgsJNnZVbHGhnXAFjrVVhycMClJDxGSer6+S5ps2YepWOjGwkGGAh1rO8/Nv7kxWK4Qz6EFLpzkxyHabI0q/r8kNSuJ8jPFiEeBNcDWICEbKCEhscn4NRaotOKx8KHS5fPeZNJnlBnKzAq2lriGDxSDmaO6ggVgk0Twx4GmKlFktA/FzKdSV/BSJyZwX2R3ihgWwMfSXfC479K9pQ3ZU2PWHjE2zorRNChzc3SQpc7ICEo1WHJC3xNCDhDPIWvEc4Q14lfosECIM8imIm5HJgYxJyrYBTevy/LG2kisyzB9uMDJdjeJOElGVqIc/j+NA5KerB17aKtZOX8fZnvJuIYFcAUGcANx7JgMa7FzikFWYqT0b4LtCwy1AF4tdBjABx98cP/+/Vu3bj169Gh0OE5aevHJw4VB+eHDh24dVIrf999//+Tk5OHDh7vPvwJrRoiuaCuxlRSYhmXNTCrzFABB2HMKOaZJu5BWHu3nQOTI4I5z/smzNjydRF8D87wCFUr43EeqHcrEzNI6JOAB+nrs44r0BHyccY3+HJ0vs0KeVxhIEFshddq61DODowEqRZFJyrxjb2GgfTAgk13yUMswRoyZmAXUBBrpl8Ql6lGnywNg45Kqk2gEFwjcK4kklnQ1p8ir3x5BXRJqT7v4ghH3giRgHcQ8aFYlnpvregEWIAbCvb4tiXtEy+PdAh64JZorCF20D95g8GRMgLXGrHVgxUDIgAj1AR0nQYeMazeNbWEA+znQRIiCEVd+8jOzqufsWBRdqkDnjRl1ibUKzi5p5PCZMsPxchGMPbQZx00OE6AiVClsrURS1nL17dAXS6GlroZGf8yrolg37AJiFGVxWoKtEDuavtFafPnq3/FC8OGHH56dnV2/fv3k5KSOT++///7p6ekLK1Z/+MMfArhx48a1ditVtHen7969WxDk27dvHx4enpyc7Ml0lkxRKTBxpw0td1ac90DHZt89O3KBRilp+bgyuGfApYg0r7c75HEn+KOtspeOXKZFWwxVp6/pGZzb4oE5aNRmYEd2w6mz8YMz0/q7Di7AvBByqfuKsgrXjJ+lh8hFNikzeyAz7VxpA1/tUzeqoPIDYyPAoFCQDqopEllefzOk2Pt/Z711igNvEPcW2HXGh7Gm/MPoNVw4ddPmxxKyg+yaKlXPQ4CDwVBocWB59FgNQPzkprJK2qlY+a0kqoyBkG0G7iP13Lo+Jw3V6U5QdqUQmqyizpHsFLaVyUC52yXZP5aPIAv/Fzu4UayRd6kS5wiJGSqKKempoByIppGrN4Xri9iOjo5eKhn9Dz74wMu56V7duXMHy4pPP4/NQ+cPfvCDa5OtvODk5OTw8LCUnS40WSLy7nV+H1GgWVyppL50Kbp6PSiDDUOcTNoOo8VYdi1TXEu/hh0gOmoccmuquDaTTb3XoJNFb6bepRauNUqssDkHPQ9klxJiyOzmqct56TlJsp+W6utcW1byz1N+8SBpJZWRPbKp9EFGA8XHoOTrJO6ZgCPZKG/wzcOAD85ERsk2AwUfXLc+1wUjLqIHg9EZp4G70Iez3q4pku6E+so8y4nLLKdFP+HCcdbaD3bOoW6kQF3JEKM3nWPfWAGFZXJLDPOwYt5FWLqDSp1fpPDNZJ9CcdTP1kq9N7G8ZezBIIXMK7uIPaXfY0nLUoooGdsp11rJWoRTV0AAzu+uBYg1qRkWLNtVJlK/x++cNaK8qUVfSKjFL0KQ4Wfcbt++fXR0dHx8/Pbbb3sI/vTTT2/duvX2228/ffrUy8wXuT8XBmVUZO3yG//5wqBcgp2XG11e7mqaiC1quco2dtsYXAAqUl3DkAszBGwNoGery7J6aA7W64xZS94ZjylpYIgzRZaLCCvojiBXktFoQfSqNVym5S0nP7PZ21plDxKZBIgrpo5UYz1OMu0VPEBfTEquyFZSzZgKwGHZ5De2No2onUUSV5eLDcFiw5SQjXWbVi6fl+Rgur9CXeAHiTIZEMkns1EfIhXeO6S6voSlDMVhGV/n9x0lKbt9oNvUC3cbtwxHeLXIhLFSxTrpxbWMxqUgZbEqdDZ6vzviWK0YOaUbZhCWrC5T9YEReqEI0p4hz/Oiqe7TaEynqEFyGd8p5oTlmnrX3BVCmKvmIjER+CYov3T17xgAvXfv3s2bNx0Rvn79OoDr16+/8847rtw/K5X4cwqKu0Fux69H0of+zxra3vGoCNCl0siZPzP89pS85udTxhhRrYKX3J/ZcmZ9IFGBwaSuwogDrJZWKDKv0zUugG9J34mtpO/EChX04gce2nuVyMVovbxYaI2NSjpLrIDRBYXkVrycu+6/RlyiGjhl8LkDiW+h97qdcwuW7N231DmZ2VnUoBCC/L/bgbZGFbQqE3iOjo2Y/QAicKIvMdklyGSvinb7yHRlR5Ar4RPUUbtixNIq503b20wmPjBZVtM546a5uZp53L3OQMzzh1l/eKIP143HKsqUTsZK4ndk2yWfU9M9Zpwbvnw+D0Mkk3G3s41tMxbMUo8aQQg8bxnl5b7SVHZiBXsLcY0Y0vohPcMGnTOkGm3K/Xyr3mzf7Oa2OS+P89u1a9c84L799tu3bt06Ozs7Ozu7c+fO22+/fXx8vOSW83OtRXdE3p8l7IZk57j/HBl84S0PcrXQ5byl5J9J3iFjxBBQicQ4rp/0ORKiraXPcBJXsDVsXTTR2k5WQ9AwNea1zWZdS5EcMhfsMVeIuyeHXHzJG9izJbpV+G9BhKcIaSqq2/NQ8NYRSTYMwg4JH9+BERMSK5STlGjNKmeUapBICkacMiuWzCpt3rB3IO9KVuLyT1ylCeg0oNO1rOodkbJIwJspqWbq4hKGpGY4fctaYihjmzP5WHI4nA21uSWQ5KG5GLvSTAmA3vRreHgnlYnlv+ZiTMw0DdPYSIJp3GvxxMVNcbvWLbDQh0c8YkeHu4JrT7Qg51Qa/NjHks0jjDgON+2Y/u/ko9SZEWpycUjZ1AqxNDnWuUxdOQqAN27pL2L78MMPr1696hjrK7RdvXr1yZMnN2/ePDs7c7nG09NTTxju3r37wkrg/YPy06dPz87Ojo6OauT68PDw6Ojo7OxsVpuiji8rxBUtkB2zqk/1/G5tHngiJaZpAJ/sUfdY21roqV9jHZPUdrKJTh0HOgtBiqHwYJrRyRqukuQLNys+s6uUcEZOhSDbvGqweCgp1W7ubGa6cEJOOYC/KkPxFSotiylWuPlGBW2qWZD4lmw7xE5iqNqKI0ZXJ1EzIl/3Cbamk04nthN7VcxTxIbzNg0cYa5NPhHHEKTkIXhcqMc6PQk72IM7vASBdbCDLDGhFQ083wZcSSzD1gTqiWT3rV0h6ox/Q5J1FrmwUF7sxHgmbFiQwmcWAV/qytAv63wOOdvFIbDFxXqkzAD6akH9WeaEHHs4K1EyDc5N6viGQfwS1r8zQw2PHj364IMPPv7449PT0xKcPvjggxdZqboV3vHx8SeffPLs2TMX3S8x8tmzZ+4kMBKg+P73v4/MPr4oHuGnPz7/s0//w/8cV/4i3/rL3/mr5O3fO70/XQegT6rb7h/NfN83eXb0B9iUkE5ZsYpEmzIm1WOd2FvYRpFzdkh6x0lN1cHB5/nSDM0cF7wTBkSmUb5uR91WW+tM4WB3gQ8aXTiA8zhuHSDQadHocfndcMBZeA7tWiajvSrKQQK8NSmPfar0ivSSMeJUJzfYJVeIgs4TmulOZ22BYdeChz3OUHylyjB8F926N+lLsJzNNDCiWCJk40DicwqT8wMMco6urNGTqEmXFhlhxEFsjXjOsJK4Ytwi2LLIVD7cecoyq1grQhKdxHIbO3GsuLfN0uucv+zUdSZBEmZnXpNxNJ9JDAJsJSBlrfG5rXp2cAf5QRi6wUx9XqYBat0YUOrhHM4pMc1JKQ0AzdDVXwqKlYv70EYqhrbmquQtDyLAiq2W5ruxAw3xedI+TnbPHDsa5Vz4a0gRv9m+7nZ4eHjz5s1bt2598sknP/jBD6YvuHnz5gumCD169Oj73//+Rx99VMK216U3b958weWoF5PuQec/v/feezdv3ixx1mOrx9m6or569WoJyksf/vwv/Odffv5nemhPPfgdv+3Kb/+rLgzTCduCzJQcpuPBTWcQCqAGEygd/9pt/RFgRWfWQaVVJqhq26ytRQxkwLCCZRB1QKjFYApVpPp5oo1eL7ATI51I2eYJ0EQXZSIROwWjb0i4I+6wTCv5WmgiiFWTNEkgzxdFX8+3UEt0S5X9nK/JGa+2EYI8WuSzvEPz+mSwPvh/NnRmxyU1E3Pq7ikXYGJnLgftkyKwObfad9gcwJ29Ll4rZhjaByFjfc8cuNMMsW0VjUrBhjwgguWqL5pKHq8xNF556+w15/2DSmuCK0RCVohxDwcR50f7KLTP5wKuXDVTrFYmrhIhblOciNKVSV2dGxhTfUjIJj+is0rEkZLj5+g86DRqxyRR7ftQGf6MQSWuJB5Iv4IhqyQ7ClFD2LVV3YH0P30Tbl9gOeqh5L333pv+9aXSehpFtEePHj148OD09NTj4NHRkQswvviduTAoe5E+TVoODw8Ldrz04T/+8fb/8/lf3Er4L2X9k7/ie93fcBh8BicXjzZvyzqmShlVjKJ2CdIDh9JrJbFYf3t3kJWkTCfxAP1Wiu2KctE4Rsp8zJIQooKuMjGqkMr7a7keJ/Gw3t3W03oibSTDyp8GL5dA2/oDpSYOc2GpnBUPXCK4TDWXslfKOCaNRqXVhQGZWo9FIZAL8cVvkq3pSmMGJGWDwJ0XvTnhe8GWPkLi2ZQTUcW8ayBDNd3SkPekEkMzcV4bRroUr5rMLavBn4HVm1WhRCpMtmpstGCu7D4fC3Gc2nOqc5gq+55BBMIwHTXbMuT+N/f/SmbwvcgQz563NDEw9xzNbhG6YQiwpEHsI2tkB65oAfamc/uy1b/zKeYvPHI/e/bs5OSkJiUdHx/fvHnTZaFKzB69y3+zu2Va7uMf/tZ/9n+48y+nhOAHv+f3/O/+ZwsZtlea4tPivsgeaL/1KZa8yHUaLYqCfotvLUSRAr2NUvAgzuhBzwSH9ZQtdAW5IrYS21IF9K5sn3VLvWzrEQAYEScto8xXFZf5czzL9e8qey5/GcyjFxEFmsJdtbZmqVS29mWqkEpV0FFsy+u8646HJERgSeeIdbCiEVsLnVjXtovTAiyypYigpwSQIj1UEXvoOXAFMeaVK4lAQftqjpKZzun4dY9geT65Z+hhBStUxAIXusq+B7nC+47D0EcSipqO+kaK5TElv7LP2RnEV7o8JMWeukGI1C2G2Q3n5Pol81SmqNN6M1CFtAQubC24YWj2TyXhN08KYBw+gKNMJeMIHutkg+457Aq2BtkgiM+nQAzikgsJKS7wgIkIPWXpoQRUIOLYd3gLvYJFq97yGKizy3WQ8WKAGYLCRGJMrAQWtKXcYITEvLflQPwEkwAdpGYYRJBLjOYs5IuJZeLiigDRBJ0k81lJ7e50cp5jdcD+OTpphMYkClYJOBiBvxIhERqpcZCzoDHxyr0jnbPwfbOZb4p3/O0c6Llz545bzYziSx37XrwLzb179+7du3d6elpscH4hu+HDR7X1/Onp6f379588eVLH1tnI67X0jrThh//Kv/3Df+Xf9p9/5Q/99w7/wb/T48UuhBgwpgzY+YbV35gK1TpppyRPc1Zdv0E6ZqjNJC+XPp8OIkhiJrcMF04z31q+XGAoEvPF41aKYE1CYEvQ9Mg7QrZbJixsrmKStITCVxKrn+JshkOSeWEhpTSIpyeZc53GMGT5UtcJAz158ToZTQGPFGmtljxEs6Q47wqDrNrtI65uMYwvTGfLCVWE9FlTWKoW76gkdk9deFc6Lc90dWYzVZXRRGeJxcZ0zZQm4nh0yoYsjYVRWUlDska6fV1frOpb7L5a2Jl2oGa5CtmaJPtNluQFa5h41qvAL0Jt0Nr+2c/PkPxJOr2ecyJCAiFCpQWx9htouWQNbZOzViJWtA1fFra4V+OFs1xN0Ur6p0h9FCgjwH5zy1DEux1QTexiWS5GA+/CSzOV3jRwv952fHzsor1Pnz5dKspeToC4wMQ3btwYjcv8QmrhfYLytNr/wQ9+cHJy4vrFSx/+Z/7clzf/J6f+899w9Ls+ePB9TXKmiFkBlvQiqH4QSso9bjWVqTt38hCIzo1GZAiY6aFuHMNKPIod2CNEyGRaVNA41DGbjScZnELkItxUXYqaBAmt0m0vTJBeKW4Cv8qen3mlsrK6VgORiAyTjiy9DuJM67H2tpUA6xOPkrnpW5IYRjrjGPWy72wzn3oJgLnuszQZiqS3q1fTFfWHBEkoTCj00lgkpiGetBpb0pxlZZeqLmMly6gmcwjJlex8kSIpoxMX30+xiUqyHV21IKIFPkEuItOHZw9YSY3Mrlxr0rsLHbxhqXus24zESm3R2o6F35MobzXCHlk6KE5Hq03zUJWQ4zsg2x6iZ5MtyKAAPubRB42sXJrred8CNFlmrPvJ6qlJ4ZDoGYzJCpg5gCqyy1GpSRtuO4OYpqsgkm2WMgiR3kL6jLUIjExClCUPFpgUrWoxhUURy/JolZWXXK63BHkTlF9A/du9hMfgB1B77Z2ent65c+f4+Pj73//+hW7pe2wC4Lf9jr/yb/nv/E0/ZfeXsd7+Nb8zjbBQZntXPZVEpwaBm9TpDlUXSuJrTL3Fc9utLsA0sTgrNhAQKRuEHprQKA4iBqOqpmZXJTNZiEpvEM2driJEmKf2yu9VhnGSGa5QNPecnFST1b/PJ3P3O9NrMUikSBWzMUwrMEKNkRk6KILxcDnX7Pmz8RHRqqtmkHOGNUr5LBUaLpD0vSalWMqe5pAIPLfVUD0uGN/LckvXKEVrog6QRkToluEcXcGjR8POzINFRW6YQzdyoL42UyQE6DzcErZsMBGudl2kYK8wOhFXLJ9J1+B3Dwoftp1VNNyyi9gWNm6knEun2Pq5lpysREifPlyLGkkZtBGmujrfZuJhcjy5nUDqdCgriX3WCuOAHZeKMYqwpyo1XdGkmGypASJ7+irLCH5SmOtE++icw+hbUSGDJPGQXKVLlcMNt4qDIBuGbesIkcxbJdGNLxUaI3Vj38yi/e0UuPjggw92q/q+eFj25enLfvrpp8jMZScFP3z48P79+9evX//iiy9+Rv7UX/2D3/3bfvA3eOPk6q//9bJLvqwqtyiklzEt8SUt4XkcxRcGHXChtgsyyP1zBCDmInA2mrNW8E/lVorEXiVpBbE1JYW6hF291kulTouDxkJ2vPrN/8FnFUlf+WPhNpWhh5moNTIR5W7EK06WCGascHn9pIIUWh6jFGnOxO6VVy7y17aqHrUcuSK0x8Xln0sHejvWKCJSiTUrMeX35HiHsEbkRCvfFpZNZrX6FNEat4NFn3ZpiTm1Qdw5g+tTR+jInzDm1njyVeZwJ8/t23Db5ydoNCBbj1RRBsFNVwrGss6g9CnFhasJ17hwECL14NEzOMV4S+0QtdCBxZjavo3KhAprQ8Xaa97FIlNhX90MrO4WHXJswdB/vbhJvLQZZGsd3myXD2c/4wt+Ubj2bhubFzxj9HMNyr/zt3/nxn/rbRP9Kbr17/yrZH4NFncp31gnYCdxSwUoMk8ykKoL6/8NYhMSYlYNkjgrkuPE0iCMTIC1w22Tqqz+v0T2LEFFcmUdIed5pHWqr9p+oriEcV7oC5OD4xpZJovi0Gyr5VnpehezQGHpybm2snd2PZhqS9udqiByR1GeYlzRtipe36mtSiJS4gCCQ4SdWJ9VfQrQudK4tQYCIKVq3Q0+dfssrSXGdRIV7OdlKiFAUFMzGTTqZ0aj2Pg9pavvIEm8qMCpPjQB6AGsRCpS592GCTapgQAvUP1PPXTLALBDrJW7pq5xVUEdPJ2zClNGNRQcNDYKD+KSvnHLTsbqiENtCAR3C/TB1ohibycccuWhfTJrnzhWVcPghEHAhueouRbVI2FBTHKW7J57DoMohZLMM8oSkRveAzCyT+m6sbC1b6CAJb9dVfBl699uUoTIRSf05w7cHx0dPXny5PDwsOzrtWvXHj169M4773z00Uc/O0DsB/Dbfsdf+Xd88Ad+hCt/3r77n9hf8Z9FGHTLINMEW6SsF9L2LhumYrrZpWcX0FezpWNQ5qdcVQXYjEYhM68zugBgfhg7mArO2TXYInWTlRa92Ruc8pzXP//8niH1FSmDtrIMxadAdqpMtPGJqXVpCzrEbe00tInM0UJRg5UuU5nil2T+qWxJVf7X8wyXp4+SpHdeRU2NoLK+i9MZFnpBJmXqvzFGoyKZ9iY+NavCRGSePZWrfUpbSRqGISWD9nTubTICtjT/WDcAQcgW2lNDJZohxV6mskevepDFmG5XFTqKdsyYtWG4+g5i9tBzdrGiKo9gC6/HvmIXhN/BxknEHaLm3YvQnuG5rRQGkXIhFGCS3zLNwhRm3qiIE9OnJurXFlRD4iXDX/PkFDuJWzFPDqos82ICUG6Ay5AOZkscTzEjZANVdM5fBs351wEWqid3JIrmqUOEMhH2q5claiGx0wbkYiD7zXbJ7UUKJe2zFdbwy4AaP3jwwF1u/Z9Xr169d+/e559/fnJycnx8/DP60f+2H/z1f+Mf+m/nDpNu5vGspTy+xT4lkgESgTD8XSqSsTQlXNWCYo3MGqUXJbHOS673IMNE92YS2Qa2hWDC/1+cyBxaXKtqSThnt0OJ2FPznlr7sloKfGkdTHRqoarVSHryVEngss2CodPdQxKamDbLZWpPn4zsOCPxLMX0htPCVcNORTyZkxX2QiI2BvE7m9ctGdw5VS1G7Bq1vRshTC/zqG2fczMZ6WwOMyV1cSWmVUFVAaA2qsp6hlV7A/QI7lrhgekcwx1SiGwFgCg84oXh0bpirWbFht5Gw91zQl+j5TT53G12kEtEqiwTEYR9Tn2CEGBP7akrMf85iLVktyVYvwYF0rNWWt1+08cKJamyKekhvYdsDhSNlUQy2Nftidobt4CvBRC/zAThpc3FFXcf14sEiH+uQfl3/vbv/o/+oV/rtfsv5OAvyFv/0dwCIrmaSZOUQiUNS1NvabR2S1U4TjTzpEv1pO98tLiSWL5dh0KgxaaFtc2JtBbcXpiURzhWU6dljasCyqJpfJDYicg8qY67sZMwOcxR29XzIs1kbYFwvmMtg267CNp9bsIehTJI02Zr8dzLLBOfsKyQ4PxrbojYKk5caISTTLwv0qIa1JDFVmIkFDNJQLl86asnrT02uJ6Mq6rMtr6wUNpYd6DbBMhmV4ORJZJlifz5KahqpAmAZn/1NWIPmVLuSoZg82njcFQqlDZhS34D0jtjdwmOqJoc6McGxXngTvzuGULqBTUnsNIYYJYRJMj8CWHRXMaQZhhFROH3FUMnPgjeHLKJcG+jdlYiGN8IGPim/l3aLtEYPzo6ejEaTFevXp0mFkdHR0dHR0+fPj09PV2SklgagL3wzuAY2MFoMWI1LI8Z6R9pAWXQJfbmKxypF5dIieyCNmZmlhLcbgvtsjtztlNnWd8xoMMJRiOE1F4oZCeSe30yo83HQEo9rycj6Vfs8qU5R3gLFGAHfZgUmoYwgnph0EhTGVt7R0jPcIBtFGXTTRqIt1YJ/RidPzL+kJCbcmUdcW2Qyi9I6nrPkiN8ujTnpqRs2dUvm2uWD7NUGLFUmJrdBGLC+tXdVw0actQut06EPqe8Jb1DikVwoOz/hsHBa3ImC+FOH7xBSze1DWQjXY+t71IQsmLi+Mk5t5lrSqKV8ZUNgqI3yDbD35ED1F5HEBWCJkqzlYwePkpD32NKKv1b1hJ9VlphgzswK4BYHHRWB/E7iRt0u2/dpT9USWeRmEicBaNE0QjdIoQ8RGYAqCbWPlzUok7llSo1UvuGRDzkr34cb6SXXpJNRJ48efIiy1ofF72w0n4xOzMbOj/44IOTk5NPPvnE7d1npST2iby1IIDkWmWPimJOxbXoS5RhA+8qYhEsLGBlB6uao5phaqsDdJjYz0bqObs6SLuSmok2XRuZeMCNkKYZYSjpoQe7svNE7SmyyGwjdKMrVAGgowVHk/7DUEjMzi4YpIduJxqCRQOhvEXzjk2uZDW0MVMHoTLyFSxXBWwx4orRo6lsm2OFZlP4GBlaoSJWA9IqMvSnu4HgVjtuh5X0kwNLdbUPymyLhZqk7KsFgpkloZqAp2KlO5jvCi3sOE4QagO21R0yui7qutKtquU0C5icIyuWy21GwVbceZykecB2+sJSM2O7AMWmPkLO7WSCzqDiCcrMkRa6U3pot9QgYwnjxClOXfnhadUMEr3psL4M2/Xr1999991vYh70G95mOVZffvmlD+Q+ePBgzwLzRQZlAJ9//vnoNf6bi4IySg1VhSyOEFhfrDKJ2DuCi9E7cXgl9Sx31CYXwVKUwfo7zexmtpRk4+oBQJQZ/1WPaKOZ3abfw6qGqjzSbSW9d0PLolo0fOf2laNO2xRx3lGGOODrXCKFKWYZSTUjrdZfwFT8kBwmUDN1DQpbw6LIBgFMSla+pKuUsRFOV97RLFI939ke/16AXelz80KHAy/BnCs89vfGnJ6Sg7NWMpndGWZVsydYE1loK+tzZYCVwkHgsSmHKzaVGFQRPfQruZ+z+jDTI9PGTHMnJ58bf2Fq1beixlNmsQFG2WYAwZ9zn/UBuKko5JiMTVegWIP5LiG5A2VeisQb3XPKsvKkQK0CxyphSfemerO9XPVvN4GBZh6os7Oz+/fvn5ycPHny5Be49wWeXnLFmbXQ2WN1zpFjgdDQMwSISN/SQ4bgx0nqnrBITiUmXIgAlnTchXmZzrl4aUmpY4U9NFvDUYQBWEvsqUWXYAKzKikdjFnbLxGZR+bmladYJ70AcW+yvXcvXbBpSZycECZJ37GnuSS1wmZkKGsvOkwZfUwoFwMOm2KNGNMIobiFUQ/9y7/03c9//ff+0k+++q1f+etyATk0QItW7BYSoJZ8w6TWcHB49Ny6uvc4KmlXGmf9fL1S9VWQQ+hqOsM9dEstjoK+Dsog1zUMJVWOeI5ewMFWZiq6tCnFDHe7nQcV1IPZYsQ5uiBJi/kcnbB3HedIdVVHo7ZT2G1UzmW5ESpFqiLV7UViwoDQ7ANVSASFabrs0vR+88XaIgh5RbYbjvv8g+t91ZxZIbqbjeboLcuzb5xLQFkdXW/BIP5oB4lFYsKgPdUVt0OVXsYJ978DD2A9sElkbd0wbNpltoTbcnvzDUHpBW6np6cfffSRS/vV2/Q3L2BbAn8/+eSTs7Ozu3fv/sI1EOsIO2sDu+QZO4f3JcFZZyHFvaqJnTiyLAm0TMc56cyOYVmm1k5WSzpCpRpxnXp/VgMihVG0nw0XCzBUz9BJbHc3WZYXSYGlzd+4hUoleR+L8FRyHZhPsEcz+zsqdGbAmstX8D/+a/7qf+vXfvV7P/nJn//tv62TCCDtFQeU3HV7RVlk/XdvHSxrKaKHqo9tAJP8IcEZWzpAKbNHIkNxlfxpXe/YJZJFUmZCH1/O4MhK+obVC11NJnnrGsxh4tFX9/mi7AOLzL5uhSIzhXMGTRrKi+nrXgkbyDYJlIXaWS4Kmhf+SWeob9xSHcLIWd/iWKtMPngyupe73ZAog75EB4ZKMTwuS7W8AYhf2OaV46xiw+np6e5Z11/UtsSxunv37vXr1+/fv/8Lj8ijoOx05ulJXjKvG0W3WEkCSWmkcfxIMjMi0w8zbb96AeEU+5sITVxQcJaHvRN7C31P1TqJaIu8QnJqQ3keTs182+fsMHE19xqwRwg5PZAMERoRJZQ1eXndnipNYSk8jVahoikfKQZFkh2Y7awmmSAWycn8+T/9pbee/vrf+N0ff/VnfuWwRmzLKu8SE+p1W0U/ctFY7qRO1zsyBU+2pqqWC+FLxCZJPNlZ770BR6481KvzMCm0cyLkjfBUU5+38MgclJHHzyZkXuSOeKRucyAuu+eIRPKAhSb0cyC9zZgB7siKDyTWc+H1bnQS/b/1m1QMqXvh0pQ2+sh60nrwea5a8pqZ/v7gFKX+5WS7bvfLwrOQPjzAgmZqsCcfA67iOpaSVYqZbXj0zZjOS1j/7sUgPjw8fPTo0bNnz95///0vvvji530A169fPz09/eyzz+rm57Nnz3zwxyvqGzduHB8fn5yc1OHce7wXxm/O/dBDeoT5YQ2frCSpvVyQZ7p9JZNP96R+rQ3bXHmtgIY2LoR0y7BlWEkvAkHs0l+K+4sj2iMx4uRNV5TXOEGg2CrbolC6pOka72gTbRiuCM/RZaNQ55xeHOwxzNiOlgMZXPXyclaTmv03zxEUNDAiFFDyP/iV7/8T/8z/9J3P/7//zq//3s7iWsAyIOkOOUmJKUH2aRaGxfssxYCsZ2m1Bt+OAF927Ct0/pWEnKMjsEK0AfV2m7JgVEMKxiNzNlJMsKGunFvU3plZhCRr611U5Nc9DI8xBxnodNOYxLyWhBF7IbopEhNLelZpNDhxt59L9x305wgHuQkRHSNmOLcueFciOfUxE7qZDQzHKI/nARG6gXYJ+x5JhaaDL5oeXuV6QqC0IR8VuKHyUAxnr6TRkR0gblJ7ZoRE+HzTkDdESo+gwFZCh6ikCrP0h7bUSAyqNBCXmMCIjoEkXVqu9bdNCOkXGx2vX7++9FefU3nBAPEsRnzv3r1bt269yHLUz8yNGzceP348gqoBeDF/48aNO3funJycPHjw4LJhN5ddLo6m8WdzZcwqE4QAtQ1OqdOcdZSZDP7QrbLtmSUV16iTYNdDBBLygllboQ4MIzGBzpYWSyCe6zaaTOorKIAtwkGqTmc5NQwCkDH5kEpqEFKdMqyJD4s4lYDISw3a9uGSxITtQtAEkMd/8G//l//2P/i3/anf/Dd/7Ve97I+UCNa6hOq+aoJxky956OUClY21rO9YzFenpyaRvOqos9J96J2KUlsPtpVVyLKPqhQaTYxV7zBb5FUQvM0KK43Chu/YCMKokAidGBjMaP4G57Flo/DC/3I0pNwAW4QD9GzHjW3Rfid9eykmR16vdP3/huUwi2ukPemhSu3E5ihjKb3sOSbwZpXSujKXnuLaiFa9pi80t1ZiqowJTz9ZJkriJawHUMG+2PVUnEGCIDrXod6rbH+zfQPbs2fP3nnnnaW2q1vAvUKHc/Xq1QcPHly/fv3k5OSlCspHR0eHh4dPnz49OzsrcPDZ2dnTp08PDw8vZBAbRl4wKWaORF68Iltp3FiQObVQUo0sDS1JkgNScOEpZCz76aUlcFM409bKBq2DrbQ0c5PIIWPLzoNLGEOcumHw2jDIdIBYWI3ByK4GE2exP9mvR1UQgEj1aD4tWLLCkgoYWr+ZP/u7/7o7/8w/+fuf/tnTv+nI8wivap1Sk0YtKz0BL+I2DFpyg/xtncRIqYWMKul66Rm01ZWsppEuPszmNks86WnsRqeRlK3pwBWelzadJ72WpM9Fx3aqoo64801YryVAB9dUgQzoShHw1B56QDJPKumgkrELm2a2552FZ92uxgWIx8hdHm+yCWQfYJ1kexti7DMsjaz/Dgb34AQ7UaLYmsocWOY7HGobeYHlB90HtVeMxgZ68tLe3oTll6/+vQSn+7333vOo8/M+hvfeew/AaPD2zp07qLq7H3zwgb+m5B8PHz48Ozu7cePGnvpQBvQT2tDMGlfslaEcW5zP91zMQsVU3bFiDiad1gquO1rqCFSkZjbEYOQquXk1+/m1GgAaenK74zWjpF0pdoBWpajjyCIHMrtu1wMMOXfXSCF05OJtyU/A/wp1hYGhTiv+2orC/GWK/dtkcz8yBiyiBMlV1qr/DR8CjVmJ2NDoDREXoHelT+tgqw1TJ6nZa9BI3VLPGfrEBR5E+q4MPCn0CF9x5ZTwPAySestbdj1Du6rOST+LjSyDG6PQvGPe84wDNloKb61N/+pABjQ4u9vxOSZuVX7jKhPpnz7CLbbW6AYIB9IrBrvYinCGIJaLZCFwjq4fyWBlaMOqgSetoB8V7oTMWy71HPDBCaqSfYAT3/A5uw11yxChkXqOLkKN9YGwkSVNRhBKIlKLfKfH3ZUfsoCX7J3W3Z2f7X/fxu2jjz4C8Pjx4y+++MKDxZMnT548eXL37t2rV68+evToxcgo7bN5U9Z3+MVA1VevXnXf8/LLp0+fHh8fl8h7eHh47dq1s7Ozhw8fFhTAI/WHH354cV+WEKeL5gHRr7GlJa5WUJW8Drn8gLKCI6WF6oaAxQX6cWzQpdSs7avSI4gVl48qBo4rptqCbMuQoVuZjSeyUBivBk4TZa5OQMWWlb3JkbOv20Lryi8LBVz4mZyTmGTWcB9zTKaH7whCh4ZfFiF9WuBHFXIijdZM57HZbQbxAQS1DOiPR045iQiN7EPyXhufN085pteo0FqNartEn4jUIEy/iBXGOuExgRyLdxiln8/b6Sen6HvWc8dTZCV1DqpDLhqOBbPwAIeWwbVlLeg58wTVgptD34VaAS7MDxFL0B9KYmGYERgcbjOZ4Y5NLlN2zysXq4PpjgThsk/Lm+2i7fj4+NmzZ3fv3v3iiy/u3r3rYffJkyceZF+8VsM3EiIxp234iw3KpRz2Grmul/cIytI3Qt5NI2troRCHK3nfAv5OSiEO0vw6KDMsTOZKYzc9n5S30bAKNM7vbSQCql1q/MEqDb2ZzmgpPHeWDwB40QtSCZbbn6MPnOLONX9F8oRHnkldpHFKLAUmZMFxN/Gi6tckmUph6cUWjML3sSqgEs6w1n6t/fCxlK0Fm+tNpuHOtqawOceCOl4XyY5Rn0DyTuogRp9fYG7Tuzg4lp0GhvckrUguruLFnXV2V4vlfXO9mkIMPXSDEPPsbIuujnAVqXNCTpwG9wxOJb9a/GslEuX3ldsPJjp51u6QBeHo7EYQJwNM89pTAHpLLeH8XLsTewx1yT/gWimFKFCGifByVfCb7UXUv5c2530Bc7g3b978+OOPT05O3n77bQ/Jp6enZ2dnR0dHhbh07dq127dvP3z48O233z46Onr27NnTp0/9CPe+t4rN8S4BHdYSPBw8yXVqUjcoN2V2MGfEf6ufEwtYBTbRevM6hJRegpIrMddPFKHrS9Bm1hNmqumW3do9QtOou/iQbJJVolh5nvM0zejjjEEkTkXWtwydc3FyIJyVrK3DFiGaEcCEcooapV14JFK2DGvZZjiQpRJItGi3rhOWNcWob//Wf/Q//uf+77/0458+/fXf+8/9Y/+DSDUZn3NLes2pGCvzKRuGHsF/v7GVIgKqlZbDlh3Q2PuMKpNSx1irlhgh5+hWjI7vZ5MEIWUlib4s1bpZyVuPpSQsM80trb2VywynSMFU9r7W05RzBBUmFF7SGE5MAtDKqldRPnxj3VpjwZHPuQqycbr0W+gNKmCG3TVmPeK1FPWrJB8GQRBr+tgUTJLIym510tRxEcz0yebZmGbZxNy75f7hoyJ/YYQllQ5wojMLAdsy9BI3CO5o74rJs93+6pbWc656hGiaXYMLSWovAKZBr6h9/GYc1b+dtOXT09ObN286A+i99947OTlxbX0PNC9mROZS9eGLLEcfPHhw69atd95559q1a+++++6nn37qUzuPHj0qbVd3i71z587HH3989erVp0+fOgpwYbWfRx2r4UFc4EuR4jKnNZjSaxz3R/M7Wav8XOYbRKN1O1I6kT2aMbUMnwSxmLkfKubEpbZv7FWK5bFEiYklKrtVd6f7HITbQRXQSUBT1s3iaSz266Vs3rH1CZCU/M95dYj3f+OP3/iNJ9/7yU8+/u//nY//4N+OYoU3LII1PnjxaqzJY910gYQ1CuU9ZMsQB27XDgoMiyta4is1Hycjf9d2didZy041o+vdC8KAMu/pt9bOhl8O4UUtWi5CcFpVyKXCeBxLBOyE5wkumKFC1waG9Q0zfQArPa5kmTCxzB3ftxMSMXpqJ4bxtE11mCmlpAPErMCF8npvJMRGamLInYZLQDGoW+9KwoW/fm1JSm8d3myX3D799NPDw0NXGb5586b3ET3OHh4eXr9+/QW7vf3sm8/KvOBtn6B87969Tz75xEvmw8PDs7Ozs7Mzr5Ev/Hxb5H4OXRp/JLemSIo9obzIIGYqQNCIdqjiwgfLY9NKogp70zjX9yqxz+sIjIYN2jZkzq4hSYs2lYr1J8+tWkLuXBmEK0RCt6LOplwsd6sypqgyHKCfxR/HWrGQSHUBwGXj91Q0WCnQBAB+95/9D/+Rf/aPfufHz//WX/387j/yj1axI/3oQXaF6HGwwOKNU30erF2lS+nnVouwQCKbTyr3rYXgncTmT0s2YkRq11mf9S4wYZKhsvKu0F0xqkJ8JJRzsGalWJi4Sht2tWHAPEgxygwq4ccs6zEO1gVXGRCGBvenzks2DYjBuXUHsq3MBi+3LfkNSPsUFyaEDWMB1BqgT0FTjUElIo+yTVo7LixTxCGItg1TZa221ljGgAINrUFfOVGaRefiZZx4SOkt9PYNSBZ/29QdL1v/7pv3nJ2dOfb8AiL61atXnzx58vDhw08++cQ7pUdHR3fv3h0ZGjx48ODdd9+9f//+6enp1atXb968+eDBg334X5e8J2oViOQRd0X65wxeCfbs3Dqs1fiXPRjEac3tKSuJdSWQJSa6nmGF3jIZSRcORwYiRoL5itZhobj2FYcx68mi1qQb+VLu1J6Tc4YrQgHOrbOLxmikUXb3HilMmhXBSsTKXc16meuh5z5ZAxOiE3qvNUK+8+Pn7/zJfw/AX/6l72wsuBxSXV5aLhg045hu11aqC0vCuwmB1WokJZ/bYdZqrMGUXeOssTt3KjQiOquAaaNIrpHq0+KiileySZ0wFK1MFMozVZEEnCvAd2Bhq1rWWGzIuZW0/LAul+TgHOpAQGpIAE7QPmc3cmJ0swCjWJbm8NAdRZIeExODeGMuc9xa0QkBCfXIbaIUzdGm5mDc9snlSmIHW6FfqZl1c/71Mu+dtAcuo4IgdqBRhcxE/p4Bgp66gqnQk4Mc2GQypsTsx6hT/YqKq+Wp3iW0u970Tn+W7dmzZ0Wk3mNZsVzzIvb09PQl8V53VaUXuTM3b948PDz86KOPTk9PPareuHFjBP4eHh5+8cUXLjTx7NkzD837jNzWUI4AegnP4okmjRg5cocjxkJsqQdbWd01dA0b3i876+d2oKTt3y3I+6aXaFosqzd83ae3gyWP1kk1MfJAm8OLOWCIVUnMRUBcZksRf/1f+6O/+F//zT8F4Hf96EdBYmSYm9AcJIAvtAyVGahaNU1rjhfwlBpBe6oIdldWIpXFUCHLEDDJJhIXtgfqqy/Fuy9CekoAO1h1fsb5noqppDGosqsqMaMMu4mwY4h8d5W76zhq/yQmkehChJLJhZs2SGqct1i9bbkIhQdhZC40J7dQA3VUmXBALNS/rPWfvssvVwfrYJYUxhSDINj4wrlBRVbz/Bk3sTcaUF8rfpVqsYRajxQODR8fH7+EJnXHx8ezoslffvmlV6MvWBljn6AM4LPPPrt3797HH398enp6eHg4rZeXksk4EITG+Ff9nPrz6KIESs3yaGLmM50j4cZiabXbQDujzzBR0mBNjUvHeSPERFaw6ah7+ayRy7qjVP7YjsYiefl0WgAVGAnZrTLRfuzgEECZ+9KiolOEkgllCnzzBNF6Zqo+t7/045/+4E/+GQD/xXf/CoxtYItJHQNoBf1kZdBH+JRnpEZo3aldpdPImrA1kkxqtTQvIL34RfSdiVmDOCaZR9QhaZ6rXgtNc1wkVqNdQ9AbjQXP5glaaVquEHuoDCpYtRPGKIeUQqXyWri+cGnyVXb1ZtrR1Z+1tuPCDTPaFOgQIRR0pR6f7SLXAPoqt2b9zvEp2NhYW5WrYJoVI0Iye2fKxkUife5W6qzAFtsJSxixGt+Yu//c699u8qjsukgvrOV79erVe/fuXRjhbty48TWi9aI/6MLq0ZsQ2knvq1CelNe5jykm7ULLGHHuc7bpPp1PmmCmyn2rrEpOPhXqimKVOpLUxRIlUldqLX85kW1HihPlMebQdpV6GAeDVPmwJu6QXFr46+KbWGkNN7tU1VexHhJOuySVBZwoxIANu+z9OjbBq2NVNnOrxCVYz1XSfxMTxbjQhy8cwGfBl5mlk7McFjloDDhEGHrqhl2K0CloDFywEl99prWrHNWzQ1qIlE4YOImJM/d1zXhj1eKDs7azjKO46xqBc3ZbhMhwbquYIG8BsJb+uSSl6foucg3it9A/R3fAPh++ZDw0qaOUvXR9QAOT97CkTyuvkKq1MpLpLGGbLaFPE/VsGJ4qwV7E59CXfHhmeWq1ODQF0cEdBWOeAlbhlrpFWCMSskHoENsmECsiQ+Kg9QzbVqFbqs5tUUl7E7pezHZ4ePjll1/WAbJUg6N4+WI2r/pm//Txxx8jCy69sG1JE3kUnR89erTPsM407nrSLFxkGLkGa9E2nVeeE1OFmRaJ0Usppnhzsad2sNkcM0LoTholKqUYMTynARYgEWFG20F2RMCvUwQI2IkJsKGmsJILqiQvCG8wu3GoTmF5FQqs/dPsBFIaltky2AQdHtU6CuvyVFCpHiHDjGG6LmwkrVJbOrejZa4kiSjdyrF/g7GE+IsXTS9+gpgAW2qq14s2YCXA5ONNU93bmmDlJoFIHVbtoWuxDtYnhGW2k9EojbjSRZF93AFV+KhWxRvAhiEIt1Dblc3KRV2WxBaSxHynwOpREpkjEdd/3WKQ4druJY40pL49tfOwL00grheDkq6oGCBbkwhdSV46hmOQHhJ9mq09zC20r3rhHOdIfKNB/MJCbT3+cnh4WLubHh4efv755y/hbjvGugOuffHKGPsEZQD7lMxj/EikF9Eqax11reqEVlPgHg38afOcC4KagluoR3nPzCcOdeljVxJ9QFMnxncqXEvsQFJDHhNcWOgI4SCZWu12ZVLXvE3mZKGwAGpLcjG1zkwuwPK4D9rHMSwgWcGvMI3KZO/sp+81j19ByS7KX40tUlyj0jMu5jItSNywIVyrmCCgbZROI20K7nLB8uo1VicWxISDZuZYcyOflXRX1ILYgnoIGByRqzniz+4TnPyWviL9WqKAAUNr07lBW+pqojGS5B8R3JYgQgLMahK9UKamfhwDuPNtk68JZU0a6vlCxwTFJ8+GIuIhewi8COBPolHRNAk4a1KnuQfQSdxSy3JhrrEZBuceDCZ1b6rgl7H+3ZdB7H3L2prmVd9G8oGEMGG0Iw4F6YQFqnucDL7Xs89n6iaJ5f8CCJWs21dc+XoqGaplS1Pyl/XZpE6E0UmHSYKQHaJg7aBnmuMzrDViMJmRCM1OXwkD5TKU20lUsOeYz2IWRGO0oDpj/Hpuq8UCfpbClAOba5aPLNeLHEdMAO4wiLFBQMYlKaHLvMtI6dmQO1iI3kUomZUosKRmconBXtv7+Tm3Lkjsqtq1TZIaMpRmBpxBtwiuLHzOFYED7aVCOS1VMkpIBHsgUFjVocktF/JTrhx3INOkjgfyWMR/qSYWJuG2sZgVipjZjMOewyKAbC2YuBCHCLhh51ybnm6dI6HRsAfAjXUr7QvL+xydoi808JAt3Q2I0DKYI4KV9F4nrxAhFkUm7fRaMAoRes5wINvy57XEyixeauFIZxVphgBk4AkOF0smqcAViWHCZMqN4kLHLtPcLPaGWwYKe6qJCs2yHNiUEi41gxgaoX113Xy31xpXGiOHHvWb7cXUWsfHxx988IFbuwD49NNPXctvljf0AgDikdp+vR0dHS2Zqr+KATfVhLAo4tpDcwBxVDBWcrsLJnWmihi1pZEYZiiWgnEuK57Z68Q9rAUoixecGHTLrsTQAFJiLyqZCCElwLbg10xlWCXem4lI3w6ss6rMk9tq+SBVAwQGitYTJDlftyARSJoGO5u+QsoWuhkyeCxN3zrQ14n1E/dyma/j09kiNZdgg1XdPH7RXH3vHye9puJWupuwJLnh2suMdG0S7oCtGprvrgosm9KIXHBxZ7Zx7Nu56m8QVhj2aoPwFnpMPMRXsHNceBeVUdkGvPa7whCmR+xWSMkuabhQUoz14tRrFuyE3t1Bci9sdqynhgxGNLKhNfAjtcFUSmVLJVkSkszjHiSGC/7jAXfEG5izpn6z/Xy3d9999/j4+Pj4uOjX18Crawa+hLv9wQcfuPnbdLtx48Yrp5t8YVCOtQL4AqNCmhpLEiWwrTxIp+5AQRVTSiH2YkEi30HJHaugA4jZXhLayBFIvYpL8xUVLYbpGHsGAdbSgxKEk2UzfVoQKmw7E5ddB2lXxGkl3aVF2GdGYUZhhVRUJu2z0IIP16tYl/FfV2eavDTT1FJHtmalpGtnaR60EZKaFYyeeglKe0AZwUizsGuJO4OyM0zJBTjUA3UnFia2AahIb1MIxhu/a8S4g1uwwGlTYUBlrTaoagylN4CR2qT77mwQtggo4L6g+hDu7hmwlsRoT74rNY3e6nT77WRsazn9QS3ZzOqxyr6OHJ9kjgfdMjXbhSk4pxGFAcWXhPuvJKqYJXlrceyFdG/h0VyRRMibKvglrH+7ycry+udPZe5gOzQ/2wC4XCHIcm5f+JC0ACURDDNVMCE/YXeO0FJOxg+bFeMviCEQ26TmzonWXDvbaKY9dVVBbBMzbgGEpmSiQcuCViBrvGuP2mn+bLflnw0EovH5i9QtuwPdjv36MmfnOcIKMZXukup2qzrYlheagimXP/VUTarwzRiIQZg4y0KqVa5xdWEswFojW88BtiZ1zIrMa+mrPECcbbRxADp1DQRtq7N8o85kEolprnPUHlIThgmoOp9LW6Q+KxERhPQWVBmhhuAzoGwKb+VCDC0nLR8sn6O7gt6gIU96RoZI3VjoFKyOMSTYpuRt3Nm2aXKwViUD05GcohfcSVxrv71ImWjPHm2AHWiPJIoCd0zqEXqGDTWIpqbR5E7u0mEGQiLLfNM418xPnPIy6ktvtp9x+/DDD4+Pj995550HDx7cvn37xo0bPjf6/e9/3xm7L1hfYsfXHR0dvVo+7xeF3eRP1cEA1f1iSKM/B2qFOiUxYkEyVxMTpxPOYMQDvaheckv9sWM/vOkVqV5Q+dqRZIgb1GlMSJKsMjHr0+3v2UB3r0W1B1ql3Yya6CnDyZk9muT/Ti4Ak2w6aZaEFKSCIONzhB2XSxpFaQ7LsiSscOmG2OEL75r4I1n9YqbqhJ0STZb1LstBc97EjyJsqr7ZJIfjfdO+unByuawo8elI2E5gd6qf0U9UDb0MOx+kwy4uF5F4zVBYLUY1qvliFmeYZSgXk9t6T4KY29PFPAhFwBZaIJMcu56L48Ir532iOE+EnwFZAt5IRby47caNG/fv379169Ynn3zy+PHj9957786dO9evX3ch3bOzswst1H4h22vTkd1zGzmRyuIKLwBXYpvCdRhrG41ZKXKRxMSeubgO5cOIB5zz+YJEy/CbGn6y3GciuwP0TnKsl5PaScgXrtiWUTuWrwkC0CzF/rs14o55C+Yx2Wih0y1bE9QO5q7gW3bpcKiDbXetntQU2j5mORyXDIxRchBQ2qcm2ieqSQYuFLBZi9e5yzrjcAugkyjJ7JRTWQvOx8eUxQSxXALP6IqsNG4sLJWEAq4nwkh1DqDz6YG7YZAzNjYje4DF03yQsqzGDyAVtrmbrolxT2T29zLcXGfdwjbOSpVPTq0p2P5/ontX8+27K2nvWKylDz67lqnrZR9Ih4mb4TGr/JzebC9P/ftt9F5gq1HbIlNNTOupucIZ2noyLLjDG2XcyhLj8JnSBONmRMIZiMax1UakM4i7TmLh0XSwIHzucaLK7n1gVgb9b7XEskHFUJ6uI1L4m7qXq8BS6BiRlqZZOytE1RnEEimcy+kzyNt4gPbUc3RIo776FRQFQC/rGWXL0MFIYSWVUtu52vC9MmDKTNlAzFfZCHH/U5ZMY6a/h+qwW6JTCb0SXW+BpQ85q6uY6y4Gg7zVjt0apWcwSsh0nqZ1Pq7SMZbbL6mSJLO7PKgLE+kZesiG3ZZdhG4ZjAgi8/gOJUKec/Ud2Tis+ZxdkBhye9AAyyZ1JVZVxF6ESpwo9U44lgednp/8gmzvm28lAdaIB4gumyVLKMAE4569h0ehXXOLFaRRIzWyo7JPetZmCbgPxVMRFZFBkguWbk17cyPEUOJqSYyS1+Xedes+Y1Nvth3b0dHR48ePPRYCePDgQfEExy9igHTP6dHXZZMqeu5507eyBmLGMJbcFXNTuLTITdTvRRw2Jsdvu0CZwqNGPxigt3Z0AqQ5fbQwpifKUcBQDd/01FULuu0jkrCWWJbENLVbp+aCRWXGMS5YO+eMJqgEC/6ePlrbWgHNfn5z0hXWDe5wMwVmM1IqM58bk9/pOIdg0kdqZpqWdNFk0GuCTr6ImXvmWG9hHo3urbFb9zx9mBj7DI8vsbcKitmaQUC4K9EoqRj1J8pHbaHVSdBuMCrYI2rQe8mKJJpssqC1Jjux12nlWcwMy6nuxIpYlhu6sgWUZFK+N5hIMqmTGuOfqpZz7As0qHZ4DrlFMEiHuBpwB5Nm9dg/5r7ZLr1dvXr18ePHbl0D4Pbt25988kmRVHqdhmNe6Vo4osFKp+RAB6o6iVt23msULjZVS7NQhMrd+hJYbgVhWshopjHOHsdoz0dSb4VFZBPn1WHFoK6yrFyQ0VRLFreRWgG3nB8DlByPIhWmiy/4Sn6V8ZYxY7N44UCNgYwlwogwIJF7YhY/FGSNLhlA5DnMU4rFqAIqAxe77B4r4zLJ9nGxFXyQuvE7QRIitZN+4l4wkroav7GDabUzI08FFRq9/poN7oI5s4RST0kVOEpl7fBtgI+8zudITmmvoEzYjNZZYxhrjfMQKuUEWahG5xvKQUxmaYqCkPIUduroMFRmmJzel10LMZPlSmQwsEhpSaPlDNmRcrcurxPHizmNY0kDuCtEIFRzbxoZrBJmLEZ2BtjlFq4324uof8cA8Q71pdkv28cU7qXdeugmMXkBSKRsGVaZ/pmWAHcYo3Y6nrWcmU2t3MxAGXHpx8iXz65SI8Iqr7AF8LUM8kaq5V6cK/J4eDbK1kJLJWYtTk9ItGCi2YWzrRaqJLuo0iwH6wnWmztm59YBWGvvosCTENV8XOaZqgpHM4+WRyFixnOrN5ZKXnpozHbnlnX9GwRT0jmvuseZKVa0GioA14UXCNla10lPysZWZOuwswgjsKx0cZjjYN0NI8UQIkJRKrABNk0LdIQ8ZxfALcIKjBhB55qFMnTSIZTRj9Vej5T8pSiZbBkitIekTkNOoaKjxpBzmymikhJC1pl6zu6K9AJEhueVk15SKWpBHAXXEhXcSJDaWbeSDGv51A2qIGMdTMmUBjeJYqA1VuyLzL7FWD02FwI9o/UsLD2GQM/Qs4vYArq10CHGZicZYCtYnx/GSlC7qW11MKmTS8mSGhu1im+kT/Zt22rl+sPDw88+++zk5OTs7Oz1GyB92WpRVMwF3Ys+LCVkLAhNkK40IC3NdIJmSmbjFukhJM2iCyIdl58UrzfiTOOJIiwOdXUpZfJ1JukktdbQI8jMerXXEue47YVfXh9MP4FoRwV8EOuzYVGzYguDxMhFfrRP/5QOYpdj+u6jKpqAHNwFuePARbiSGMQA2gioNpcFGeRHVmKF7tozdBIx6Sn6KFKclL7TixJgmViUdlOzJ3t9CYwaZNchTMvgYldQ5k897qQB2YXRNo4DUIqYfleUsaHpu21Gl7g+WOknz6bfFZyUr6nD3U7cehrc3urspJ3yHi5TUjCvWFEjc62BeLFNhks/KzOJQGR4s4B/vXK0lqp/8uTJycnJ06dPX+bhmOvXr+9fBe/pBfcSB2X00G2DSLGgY3U+rJKMpTqxOC8dP44OlWj4LFLGkSJwJ9FGeugVnphM6mSmPk3rajW8UvqetRlPlYdwXNpw0ReuXqyybjvHSUilTqlS1HiaV9Wg84g945SdSgBqaWfK/CtHor0qnE9dmEQP1LX4YMErd8JJaZVd2CBioKQlRlrss8LPiMCbo2EwCtCtELnsBJgheFkN/dqiicy5HkO5hUyyac0cCjFzhgY6USvaOaHxTbsaLbieTzKpzFZ+mBSqPcKW2kNJHPgsm8CdFWefEU7L6smLxuEvjwqFnQ2VuVHU7KGXI6ZTrFToXf9KA3osJeYfvkpTQTP85zzINrbg0SQxkRotAYkUl9B2FzahUrS+/+NlNIjzsPI3UMDy2zdTdKn6t5tGx/2/6cmTJ68i+2mykAkuoOYVBTepGl4Lfhcsle3gCyngFcSvqsnNOtev4sGAlSWua/JiHhy9JLF956vWvAqkeOMrP4sm0fgMyGjqUC54WGRrQQTn1glwoD1q5vVEKYgAGSBxsrInxnQjQ0OJUDfJNSjbhMURzHOGtfRWCSsb1BqUWWxkx1ddPooYZNTqzLRi9ZK1eB5tLbQg9QX3kkGeWwfIgfaZP1rWMommG4YgWEnRhq4jjSOJY8pSClHFI65xMhS2sbXW8Sua0W3kE1I31q21z2u0Gx91EWJEKrwpswfMql9a6MPfka0BUnkARso2dp32xsbO1c2pAvPQUDve1YlVeovj9Cjnf4PNUcrWMsyaY1IirAU1MyNVxXRv/YbypSKEWOmyZkuosGVYKXro1oIJE9VdZprtQ9qXQfOYu7CSGH9lWpjkpTCjl06q6dmzZ+5FsyMWPH369NmzZy9nQ/Hq1au/QCrT8fFxaefuU2+/ujYA9YyeXMKNQ0j3o2s2f67d7nQMXIpxnF6nlXAtsSYe2h7ediMx07aQYBA23CipyygRiSUURqoIucc3zp6WTiyA5+wqh24hES6M2lUHKhOQx/nAUo2xZbCdM8Je70V3XZOhKh/4Vnv0v3yqd4qTcjJ1mIeFZUtNerMXnUlCnMu8HXQwAApMEKQ1ySvDKbJhcM0i7r/8kiRippKpsEPsEaa7GGD73PwENghXYFO1ym0r3KGJvZsmcnoMrGSpG8ccPUE5ulW2cTX84XNpq+oSTgnd+0gHOo6QaAEc0m2ZdoNEiiSiyIwhr8tEbsdMixbcyklXyZl5UePhwifSqG/Q3m+8On1pQe2S0pSs5lLEqVcrKEcZiiaZIwmVUc5VJhEruaBJOABFcpEhZNGFWCEq6CquIrMiyAjCLg09zAPNMmiaz4xBROoWg/Tf7HnY6VSPVRp8XBDMEYrE1HIbBnpkR/Hop2aNfoM1h9K1OJbPvqVMU3BJuF9q/qw00hmhdcYmpGdQmTEkXMEIc9zZxejrlXwlRT64jMaKDSYM7rA6ZWq7QpdUA6MzJmlJethNgLOTag0IF4HfKYVW0EhLTOWKVhJn63eZzE9XWRYixUyD2pT8W0ZVthYEjNlAzyNdMmS+CFSZXDtRoZDNhJCMxMh2pFWtry8HkjgTH0L89FKgM7ItDQBeqYdxdGLrd/UWOABY7MTWiF71d5kLUhjr6VavAC+KN38usWqRat8Mi/gbrqa91D08PHSF36V6+erVqy8JG2l3/TsGiO/evfvJJ588ffr08PDw6OjoBz/4wZdffnl6ejoLAbyi9OHZQQlePG3aSOa1PtR1JBBYgJAtE1YHtqCgZSdl7C9lxInrSukZtuwColvMDUMBg9aFEz+1kz6DhjALDnc2GGgWsAvOrqLAAvIiPqNBvExqKarm51yMuMv1T1F7QPYi5xX0P8UK2UrO6Jhvs65mGWKHy9OYpKPD9YjHlmHFyGRQzqLT76MNvdGylCQHQZ0B9/RPC1mhqUaZR0zdQk+uUHhp6dtDCDEmJqmQllnM0nKU0eoZlW80l5iwQEjHyJ3iV1WV1ChUVnYNqWMRBySdhGzYbRiKv5w0u8QqHKJc+gPpi6RJyEhoZFZzrjyOpFKbCrAwaRonyQVhz9ADBxLPGYJYNTZVj28NnC8nJh+g3yJIY6xHmUlOZS8QJT+tnfBA+liespxR+TEqjFlPY8p0lqFdoT01toxsyWJSK1gca5G/StvTp0/v3LlTaqerV69++OGHI0LN6enprVu3iv797du37969+0rPnXyz29nZ2etafC6hga4jr9ifOi9TdDhIBBChNR9IxDjyPsXI/8onKINTQbsZps+4fmCd1DrAJ2aUACoMiWM7ziZcfWKkL1EBjrxUulppxlkjnQQRuFqflU9tRTbSB6aZmypP4QJ7ZTAim5nGlVgxvyU7CG0KS7VZUHdnAheVOXnfOUEkI7RHUBoEHWw6yjqbxJRqTSC0RlKr9BgkXykAGwaAKxHugS1K1QYoCYm3LQEoLA7IgluqEiIiFzwBG4YD2Y5uUTfPCAsCEf7XroWV50IMRczv5DLuM4rLDg0saTYxGynPzdC6RoQS4jhvn7jkyeZO3amy1XF2B5sdIlF+s61gzwFQIpIfI2sVsDyFbXP+Im+2N9uF2927d09PT69du/bgwYO6hj8+Pr5z586NGzdqTvSrDxBLHLMxlsBcBOGWlIvUCKW8JUGqFhbGx5NDiTDA6pWzih10pMl5rI5nJYJIrKZWpCi2YYWYqalpPy2l7gp0a+nZznuQzfK4FH+DFGnCWb/WKYFXFovrylmhS/JNXvJrD125l2wDnNaee1KxiGT2qjGRgpO/bh6/qDV/OZBXREtJtUL0Sqfuea8Qt1D3S3e+sEF8wqb9UknTIclnTy/MborUXn12sp6y+GxoEfpjC5NP3GgaJcMiLbJ1SlJ1EZfykaV0lFBWRkdjyDsT+zLtQFnU/GXC4ZqJ710Yxt041nXZNVrEldhmYUJroqPlsIm0pz2NWC218Ke2w+tC4aL00Gwh6CduMLPKCmMxZOUTzSi5UczUtCbJseQtr7oG8b179z766KNnz575P6cR5NmzZ/fv33/48KH/8/Dw8NGjRy85xXYMEB8eHj59+vTx48ejNu/p6en777/vh/TqB8WUZ28GEXfBZMUZHjAOT5q/7gr6OCPfPDLIVrayxf4hP2XXoKUEGiW1AsYlY5woSWsCLiSUtRTzGF0Qlv1CmYlwVYqMACYoc5CTqOOOYCUxwC7LkTDK+VhWYn6lqjWMUiOx1nSWJEdr2RDMGqXdNAblegiRamWtocRGAwijSh6DtPG4zh809RMkrT27TrYOLk+1jdprLBUIiHN2rkPSfGPi4YqLJkdqb0GU2Q1vSB2akV6qoXT50umJ1c6Pm/KpBVvLYuYUquD51XF42N8yRCb7b6cPM6lfyYadkFo1Wsu+uCsg07XDObsrsn3OrpPYIRbxaz8PtfRHHu62DvG5dFK7vEojmuyznBvgQLZznVVUlPyStjJkiYm23mYrNLELi5jRIBam9nXO3grH3P2RQr6TR1PqFdZAErU+TJ09ZhTbBAETf/lXBR2+fv36s2fPbt68+f3vf//LL788Pj6+f//+l19+WViu/pqrV6/evn37e9/73qeffvrw4cOzs7PHjx+/KURLVnF4eHjr1q3bt2+/9957TrJ++vTpycnJRx99dHh4WFOGX2lgveind2IC0b3tcMfyLxLLWECV3ZqqiZgZGox4CHVpGVlL/IqdG4cGxEjpxWMrAxhH/Ivy6dSywq8ketDpne84TxJZNKarwvXFpXtukqVyt9jRVA1gOubo8lOzRYX/XkBSd4uYJ/kCqNNUR2Uzc4QaVcUjRenCBalllCaTlX4k8xVbhEqr1FSXZL33v0UArMR6Ls47F9w288vGGGkqnmVwAmS2fyFki3AF/dT1ZRa+x5xFTOlnlFui6CC3UW8enpB5BzbZS3J6GdOuZ8VSd5s1W3DaMGgOrM/+FjsI5p2YC6zVBxIZghizP7tImEZNmVdFBKqbX/IjSUicDKj1kB5hh//kG/nCN9uO7datW8+ePXvy5Mko2jrN6tatW++9995rYx7rLbfROjZSmCjSrhWatgsjVrGVGJnEx1UosiQcfHGT2OFjoygKHlY5bA21RHb0Elbmpaixp5jmThIguEb8CqssaLt7RSWBlctcXP4krxD9dF1B/xzdJFJwKE6pJnFEInZK73kJjgyGuG7O3WLjskRYGUDzppgqTTURBGHHfoOuzoLCwDp1/3N61dwGoWEGmilz2BWeVjAXlVKhzBCBk9hIitrC2ueNmXY85fnJcGdKzqB0HxqCCBQ4mLQxsvRHjek3mK+1jlYj8GFO0bs5a5HKeYnlRB8WoEOcTSbDfozbTDf0wSbWetMyx+BeQM+xRuzENtRyWnQguqVjCcnOqvC46XI0gZYd/MTVussj+fUkJl7OqHF8fHx4eOjOq59++unp6en169c/++yzQiW+devWycnJtWvX3n33Xa+X/QUvs7Bhg3I+e/bMK9Vp/Lt27drNmzcfPnx49+7dJe70K1Spzvxyh+w+JDLkFZBvoQ9iU03E5kl34uqEmNxQUytxCU7+FCGOKkaRmBm1TqD4SV5oOATBqtpgDaXlYqwSCaxLxLLkVaKok/Vlj5r/3DpOxdcnOpM5EComNtMFxk3iGGyIupl4W9QYxIuTTDceTrsTk1FLMWQgnlK81OpznrWMWUR+MelMzhLNiEIiHmwGcW7dgWxLUGVjUuf/K8uuHSB+hc4Ptqdu2a2krzSUa3a5jHVCWmsXEQaNACNbx4k8eMWh/wxDofrKhp2LmcTBaWGG2pR1kNHevajxZUvM965Db8NFTErBKghMqlJzmeLwgIwMkWulpDor0izUUPtXSKnJcz3ZibWc6JlwzVaNSJP6FbRqtvfs1JkOFINuGDqJxiLJDRkLlEuE9NTIEKo6VrOKv+7xiL202507d549e1a3Eu/evfv2228/fPjwww8/9Bhx69YtAI8fPy5t0uvXr5+cnJycnLw2JdbPuJ2cnNy6dWvUkT06Ojo6Orp27dr169efPn16+/bt16MWBSBiSV9lrjaYT3AnPnX1oufxQSSZ1KkyxplHfBTdWJmb9wwQON8hjmZI6YP29chFksTxKFYzlfYJm+S+0hoe4zqpxYJQ+oHuZqPZcmQIAWIzyBpMJ5TStoRBXeRsdipLTHleU1RadpatzAbrwBgtLYWTA6Ej35vaw3bk67tjEe1gItaDY728fC00OwFOtZ1HKdHStMeSln35t1bX0QF9VG2MnqGnrhbv/1G9t2+8aBukWdYo+RpZLSzIBlLn+OukSTJTG3vhDgmw2gmqflHPMBrynQHWhSrWCY2covA1HS+1K2TcY9hSt9Ue8uUTZXqzveQR+dq1a7O92Bs3bty6devp06evEUCcrM9qcErmECsMvMUgi5gvih+a0yd3P3oiWGX1eWeZzC2qyTnNYdbFCRsZxk7dVc91YJEVF0fLqQBdLWIzCOtxSbpBpUjikrYIjkvGGUv502VYuRMKxxPMA4qdaL81sYxrWJ4Qcqs6GEUl1W4KdoiycEpYUDl6/xsrMIo55Jkkj9tUIEilY9he/ToKzyZpzD43ggvIZipcSxRwmw0MRl+nYoRmBLMu1rP53owobgpyKxih5QRvGWavqNfa1Tf6eEpsAhNrCVBBK+eVlTwd31RXc2bVgVAZC2Fw4vXHNvhWlrbMGd0lqkOyFVzKlLsK8Kl94xOePjHvnZGA64SNM/LUzpdKT0eFKhZAf7RDBQM5DuOEPGdXF0kre5XD9Onp6fHx8dHR0WeffVZ+ee/evfv379+/f985tV72Xrt27cmTJ/6C99577/r167du3arf9bJtzZPsOhLf+973Zl/67rvvAijDwq/TxsH1YnLrZxogipq7lP4kMbExKSauRU6hho4r8V9ULODO2BCqLMmeKh0DTQxiFqEladFkn3x3IQKjmmktup9BUhjD1rrkxMKKhVkX26VQtECKMSyIHaf/bhJ0PgntEyv5VG9nGHEqvWrULYNlfgrGnTqcs3PE7Tk7E7ijmjVS9Im9O1p8jQO5ePLVlbQuB43di3QTOWo2GGTDzhpFaVTWtJpWxtpYNhO+DHLOrvZXqTrDYlAymAVrrHJn861x3pamtKQvQKffbH4JzhmKhmBM5j/Yocvpp/fcOubL4UO1XzHka5F06MsZDrC19FJJTMgY/h26kDJXEq8RV7DEMWK5uHIgfYfonxzEZ4YzH2qkKiWXI+hKgrML3Jz6EKSYaaRuGRxDiUxqSpzJp5N4ceGnVzqGOe9JKpCvZGg8PT09PDysK6WrV6/6P09OTjyauB1NPUTj/dX9VXdf+81PxWzBee3atcPDw08++eR1ibJSA4Kyj0nd8oS4ivmovkPD+3ByW+pH8Q2/SGKCKbxGysgWQwa/zBnUd0n9fJ9839uK9QB+8MVztnqXRT6XR4QgpjJCppdUDndZenHxus4oVSTntD0Od4wOZwWkOC1Ccjo0Gpmc/xZJiHkncZXOAJs+xVALzZebaCd5mXdvixAnY0VLy/gMc1kQxEbdxJ7dvCo0R/MlshOhHvmPexQbdVQBMKh1YkFMpUGKF87A/C06uxsrMRcVxUV496hhU37pJnXSuLHXYzeop5KJxh+x5F1xF33sDV78Zvs6mxfIr5NAlgFxoZ3TLu9cSZQsj5MWfCJbUktlElCe0wul5xPH0F8ZsrdVHGgoSV/C/xqEy7JUueVcRaISfSrrFMxK4vACC6Kh2C+BfinfqJxppU4SdkfSmruTNSfhZmKtOoczjVgmj7NsAhYCh5ZaOBVKSeIPheoboVlEcRdFDq1w4hQHsL1VOktsCrBsYzjfYNYi0zT6YMqsKKg3BrIrWjpx5jpIkyAciwtMlZF2TVCWgjyAGI2DR+gW6h5RG4Ytg036prWNTYtNB5fpmJV+2p0yuTjh5JWM0B466fcPkp4+x+zwsYIrcTp841G0fNuzZPAy4WlV8E4y3OrANeJa4hqxS1c537DZp46TNpW9squoiwR6bVs2nzjxWrgUevVrrl27dnR05GXyS3toDYPYI9+XX345+9JPP/0UwKtOH8ZEg5gXJY6tsOy4loimNGEonq0C06RBjMmTQAHw1VAMtB2q4fMTqthbiKLlQ7SqZ5yqyfKxUgUYqGX9eFQIVIbY8ph7WZ+LKk21uPkk7KxlmePCa7cJ2sOiZLT4cYjZUmHljrUVjWDxISBXQrRcMZIaRS1ZhGuk/P/+6t/xf/z7/sH/6o/+wr/5a7/WM6wYc8eMw8dCjMGMltqzYpkcZAmBVbMOymkgKVFhFDpE6vokdYA3CAfSZ6aznLPz7oJRIztxXu0ECM11r6sfdqPhC1Rz0rut26ezmYMcUslCKD00Zrh8yy5SNuwcBHHN69krWoB1g2xstda+Ob0ZfDeqWWfBynkruijuajrcc6YAZYWRTH4dNdeIK4l9Nodk5QDnGc8a8QD9cwSFrcRMthuozHcnsCSJmV2Mh9OnYAe7gu05QqKtMWQGcSjJUOqFtlBFcBhbWm9iipMTVaJkpS25DGY01MrfkGHOz6Jr4RFxGgu+//3vA3AZJg+N7733Xv2CGkF+s5Vz9fX++iqG3cLb1J8Np+ncL3owo5vWXGPryMljI4XqyBagzKMDQsykz/UPCtPxLHuai+wkzg7s72NSZ5AtQq0zu4J1Er9yk7qJpOGOAmMiOCA74YDduycA/q1f/bX/8z/w933/R//pv/Nrvy+I9U4CksZGRkHnPu80qZOazxJyC7NP8kfSU6cDWN6W6xmGvyxQ0V3Dp5PeW30KGzFlSot/twntuLqDPmdYi3Top6dxIodCBeP85Zi5ioJL1ouLqewQxRqcN6lc0LGMTswFncdtnIsCUw+NywMAnVhPVbEJNk5yMAbU8g2cNgw4CydVGY5MWVFtf0U30CDiCEsnpkCfVI/lUmtP1vR8s30rths3bpycnBwfH4+se549e3bnzh0sdHNf2aAsPWQLWbWyDE1lJ86vjAJsKF1W9amn7jjjE0ARKl2pf2l9Hm8BsUcoS0Q9R5/gNl/DG+W84nfXvBKVU3QxqYsMo6F+I3oqsYdU4kULR90SJncvoqPGm+R6VhVmE4nhFosQDAP7afuLv+O/8kf/0H/3l//8l//6rx6hCDO30EZpEmfnbSTiS/tFHaxtnHMndi59karfWzOsXB2dsyWUvBudRM3aULKPUkR73csZ8DRPdiWlw181nQEtypwuL9a1b/LhM0ryN3IJFOdI1Yi8P1ORDbXLoMiD1JwYsa4Qt+hGQ8yFC7WW6PnMOTuI9AyrbEDlxhjTUMjkwzR0NkSYTOpkTB8exXEdce2EaMcCZA7CVjcYBDqxDuauvInd1RLIChRiIoa9C1vKNxWUv5Hh3Vlo1P9ZKjiveUex47333nM5wZdWZaIBiI+Ojg4PDx8+fPj9739/NNb68OHDhw8fOqfpNQiK1c3RiDzM30AcQEzBVKxtjj2T6agjkaDc1Kp86poPd18stSJvmqQAtLI1q1QIOVvPSN2QLM90q3Gcoi2z9kDtXr3HcyOknCOsJYI4RziYK4bbSFmDoVmguSVN5xEVtUb2ji6y7nrHEYOwnWO7/+Ff8zv+mb/vD/2B3/zNP/Hrv/8KNlZdUJRZVF8ipZYhlnxmpDjdlWVrFLwF7LTf2oozOEQzxlgkjCPUSab5f4PyTsIiZaawHBQ2ZNADyfpBMgIs2FJwlh1+53hz1MhBYqLPsglG0cnMpgBb6zrZMmsrR8i5dQfaP2cXJHYeGukIfj6TQwHpZqZxjfgVOh3lhY1l47DLGyiEB1KP/Iz7xg5MqLBjZtbLXszEBViknkZ3dhWVzJNEmnIF54OLFXCcLTpfKXL6KQ1mqmoDBOATcGJr2FcphO8fGtXsF++ofu3aNc7lg94mdcrwD3/4w1kQ+fDw8Ozs7Ozs7BcSSo6Pj5G7u9Pt3r17N27ceJHR+ujoyAeUprt0fHz87NmzEcL+igPEknHhMjw4v4U8HwrsKjy8fiiqvm5SJ2KU8WeP6hBLhY3lRVQqgDjNNlbxdL4MTiJrrN3VOUkPhsPPknOXw6fyjCplbKUyWKsFEILI+bpSqkWOg0b9/KyocZmgSiHkT/zqrz799d/z3/h3P/+Tv/573pItgF4cIx6CvA9sujXZfofKDtHQ+BSNErPGY4BDCb3gqsROYwUFVKEhT10WiQmRRZ2KUcDtGWanpmUJJYFptRMqFLHQMnfMRJY1G7MqdCjTr1OVpA7W4xJBYew/U+ppzCgizs5+OvVseu5DVq7w4nDL0O6qzE/UjjgarTNB+bVWzMRhOGwCL+c00ilyss5a1R3M2EF4+fxAzMIb5PSy2+np6enp6ci0to5uZeTopdrcpO7WrVsfffRRCb6ff/756enps2fPbt++/RqUwE1UErWsAt5yKZqGnwsdCDWIqZMwZBFLlWqeT3Z6bY0XEGHk+KMCjJlPOi+qXo0X1IDmAD9VJnXTd8dKWnC2PVahz7skolRGMlayhCm3XjIs4oqWNHPkIl1HWrWWKvjst3/vj/6hv+NXPvvhv/b7/2ZsMRC8kvnQYE83+N21xktSeQaWcqhD7BPhhlV+0xxT8jKl7DcK2Xq9zE9EpU5AbVJ3EcJeayYkicmLWOHzyPIKUevLlHGYXLo1wHkawGWNbEj7CDiZT10QKSSBSS6dEECC2HYc49kNihNGp42nqWgV7MhZiiqXGkSrkalKg7h9pqr7t0wXiYzynAtOpl8414QJSONrla652uDDRPdUjpBLyXuTwYzfzAr4M29FNWJaaXot7LoLs7VwqZRfzvp37LT2+PHj69ev37lz5/79++V1zhe7evVqbZjzqm+WzFiQxVhTP8d9oyoll4K3Jg1WJiPN5LzBSRGV3yS1ckVaykV6k+kaVx71DTsR9gg9kxZE+eoIjdAOhiyI44sOIWvZCkyKWOuAJ4qBhNb0ZDqns9rrlNZXPUDXASDL+GpGkoUAXVYCTPoSkmsmK32qsty5p1k7IwkRAWM1U+nyF4P6BESz/KvXgREaIRvrOoki5TehoWAz1L2pLcOGXWrTIYlvAOgRtugiJFbSVK4lJDLIBZAiwkgJ+fBiolT75RcyixcD5wxlYiUyGww6UsxAqGtYu1hERChKlI2hGbRnULGR7Z4fGghTkezTQBbjIsnASw6uQlpClv3eToZ+SbVZtPQ/k/BIimhZXVeMUg0u5bAnEEl1l4CuNXFFt1YUoqUpJr2ALFW9lOnRqTS1DFhAJQ/tZ08035f1w9JlxTHPCTqxlacRRBBqnWXu0pcgHFxuOAKWLHRTTpxVJiBmIWg/rB4WOjGKqKBYKjk5HUPCN0hgV/HIkZoEofO1sM1xfs3Z2VnRlNgRFH+BALFD2LMB0k1mHbR9Yfvz4YcfHh8f37p169NPP33vvfd8iOfs7OzTTz/1Enoplr+CW5LkC65rmiNOEXlvh/2ZEaVRTi5IVB2iEdUxFVOJ5gWTBU4K0ZEt2Ja6quDayrxlMroBshWjGGXVMqEYaXUgqUgT9glWG4qB5qiasqQGGbGWmMcnWVMgB3K0mAjjguFJvWsjHGC08rhSECe7hEr6tihLev3QISq6dglNdCIpV/ni8gxzjr7eSk+DUMgCxKmDnru/mGHdpnovZMnmbvQVnNaWZAmiVXiwahCVwBYTG4AK40y5AaaFaTqdQcwlL+rRWmMIZHulyKZbiXOGIFEb4wRESAAFXEt8niSqRnapi0y0+sDHSJBwRM51BkFqq0At50F1Lu33fCWdwVFJaZRKtWlwvmJqlec7SrIfY0vedwZcJzaawBrLlKX/Fpmy4fArWoC88al7MQDx/fv3lwDijz766OUEiI+Ojp48efL++++Phn8PDw/v3r37evgBNEsc5MIU1KBEtOzYjB20wzTL6o+wtZjS8PPgjpVn3m1YOa0MwvsCq2lx5rC2TAwFwrKJTrKsJCxVzZJ8QaXpO6bCBigzHw4rd6yDms/FYEfbmnOS9Hk1LppyqITaZaABZWKNSgP1VaP9AyGpuNDXmh5SaS4ljbt2Uief9ppt4yDAIGdRkhOt5LNYpwEyC1s32UKeocxXIUses9ofLR+Wcg6WS49iLVsQlJ33aIaSa5R0nDdGyqz2kWdW5YrFBoZevN6EJhUj+uwva8KQj+90oAKdxEgtX93N2PBMIF5CBQHRh24iZCRLhexlx5kUsj5skUw7qyyBB4xFWhsJjvPhcbsFDWblx1syVskkaAuwIBZQPIea+4aUkYGtXdqkTr6hull+TrHPx01cU2I3QPwiZXsvW/92s9Hx/v37Jycnjgs7NHzz5s27d+++HupLZV3uk25L82CUCY4hCa5cwoy6YSdghG4RRqz46Q3rC3QENgiOJFqh9Lr0T7rPE0+kcDAviuhNlYKpU90wOVIwUMVUGHFgeZZjHD81LYUHfeUL55yaLq+ow0D9TLdpaFcWFRtfzbdUTMz6tgwbBAV76HnSf1QX7jlnF0DXSdgy/L4/d/a/+hf+he/95Cf/71/9tf/N//AfGfzWKqPMcsV9GMTDs39CKmFn/MPTAXpE7xl8blFglUoGolv6UF1AOUhMRNpEYAmxuK5TmZ2CDGJEFN1yGCzNpG8pSVutp5y0+aUBjqvzOEunSjBlLPpWWXXEgcue2lP8mm4RSvJhkDBZf5PUNXRLrKSXAcNVE7PR4GcmAvlJWEvPCr/OUb/WZnCtT+2pZbgbFdkLTNPcztpTGc+VDu7wkpCLNj/gmKc88Hk9qxjkloJa0+UonZ9yQ8nQ3fHrvpUQs3BHTJrOI1kuSYfC4cwMDoovShWx//j/xLPfSsfzw9/6pj725OSkoMOz3dRf+Hbnzh0v9vy/169fnw2QL37HDg8Pnzx5cv369ePjY+/u1rH40aNHr43iIQf5Pqaac+igwJtShVHic6YQWOU8XiJyTdWRXK66D6SK2QRcSlSadnIIWQvew0GEBjACPbSDsREplkitU3xp/5tZyMNsqC/J6oKBVcutFEWaKdI9FKQIe2iHWI+JuHKcIkYo2bsw+hjUk1zW0jqJYVok1ybtrIsoFumhCAlwYxchtEcwohMDi5JSOjyAf+8f/42/94//xtWf/Pjx3/0H/9X/5t/mFzRPb2T9pQyUZi0mL3Oc7l2TdoeKLmbLU6sQ0ggx6AaKSpvYI2yAgEnSvuja++Usjrul7FlJBNZJWd5HdJgTr4FEI5q8HViA0WQ+k48nZKK0EVEkAAbRkfdvvtHVy12wjqUhD0QPZt950kyzB46CjoMHmIlGEQULwJpsb4EeEsQIjdlbfFQ1cazrN9TALuGtsIGC5IwtGfcPipYXxM0SguWGSMw+jZ7lriT2FBnaq0WxFALxE6W5Ri3GyJpvYMmqlForYIiWtMGNpxxiSZNhIhgG9ViIw5aH8EQSmaPkFdipsv1m+9m34+Njr0K97p0NtR6Ia3OClw0j/uKLL54+feqs4atXr46sFF6nLQW4srpOKAuuWJptbyRPu1bpNVNdKVl6vpMY2RXu5xQkRlPIJETRK9nSX/QCrQP6TBJKKOpEUaZEn5JRuwytDRKCUnVtJS/sRXfRJeA0kWaKHRy0z8WdNwB1oOKO0WAVm3P2bk7mhh09VjcG9YJBcTGNKSc6DmUruoIBM0zRrCMcFPzr/tyf/4f+2cdXfnz+q7/6p//X//A/JlW65NyyHmoEZFZzliWnImVbaVJbO0ATGUBWPusjgDgTXhr0QDJUrUU7nsV7BoO8bxLAlAGh5lwXs0A0IyFBlZEFcSIBOPerZwhidVcAleOrNz6RFVcqhydOrucAduduuhgQKSIpUBrFv0ezcLYrORQSd+2aLnMCiKVYDimFEEOeMmpKXkgb4f3WYSWwKdmJwaDITxZbNnRDvZeiQFq1JTiA5PUVZMWYHi0pDi+oxAGXGGrnenY/WQXYJefqvqkq2H74H3yzH+5MKS/lHj169JJ0QL92/dvNRsfHjx+jEpp8nWZqyu1Zc+97BEwaVHEY7feOh/ZUt0gOoltqTxdiG5Wdw7ck5VxKhPS5GvT0dItgbcnqEZETb5bRg7dJCn1VE2mOI5kdXWS0Uk+7J148N+oHy6fNfIkT9AwAglj0kd6snOh46KCtIZCkR8MlpL7PXiJDDS/Si24RfHZyi7Bl2FqCjH/KlbO/twyR+t2f/PQP/LufA/jyu991zqy/XlvfktIJ92vkkGiEbumavxeQnJxdG6FBUp8wQiQDB0i5SBKQ6qlbBiV7as8QGYpjoRXQFtpTIFpB6hkUoG6pEJaLUv5slJ5BYcaLxSJz4a09NSIM2iPi6sOhoznI3leKEyVRa6Mio2lUjR7p0LltxZa6Et1CqzvNRt0RS3e1Fkw3iJWqmJk2vkHoGXqGgLhlWEvsKb1ogBHSia0kkQTDRcMoKgwaow3+igVFyqIlo4jstTGDRBYeUwVLFf2KArP0Ay8JW4QeuoVsoOdQSJCc3bqWi0MkmpvhJNzdLlLcPvGFUYh59lv2py+wTL1+/XppDc5utRPr2dnZrVu3/PV3795dogv9wjcv9uoG7+zLfiGMXS9HT05OPv30Uy+q33333WvXrr1+FanHwYL3WSLpJJvTnoKiF0G4I1xjopUH63oLGqwSN5wbNOc0erpNjU5nISPkHJqHPeF1KbMj2QbBFmTXkm6jL+0hKReoa+0AncQ+24IBCMJOel9YspaunKNboQd4zs51ckti4Kt0EDtnuJIYTmk5GrfHipGdxMzbtfEahxqaHAx/CNlCBQweLCAbBk2DSihJSznXf+2PfvS3/uafAvDb/9P/vGQW9RBokQMq66cKbQjF6r6Cs3K3PUO1tAogW4jCNamGoqISg0KZ6yzdhU5jnfm4W1EQW0kMHneUmdw2WA3PtvnrJoElpxdHrnULrBN/J/eY82SXgiIIMBNo5hBoI9NsIqIwhalaSDp9TQ28se4t3WzYdbCV1FOnUrtiMJEPpt4J6d7U7BJTrpQLZK8lCiwOQPkswwHOohg9Mn5aNhZEuBJjokGoCs29BQZcngOIM7nc4k8EWMB0L6cDGMGV9CbJrVHHb/c8SqNITjMSQlOBXJKScNEtVYX9G+7wz387OzvbJ9Ri4urzEsLEL6005DdaCoMQF5rIltoN7uOTAbPLY4nLdbas4q/njm9EQuXCFjGkciYZjUi18sRMts0NwuwDNuwPIUMX0ygbhq2ol42REjPwN01Fsj/bwMlNpYqzuOiqFPASzzP2AK4lhqShFPtKWbFIGLW0lOwBTunhhRK2CNk7XTbodrJDvE3ILZXzFXQCf6/85fPf//lvAfiL3/neyIDFM6sttZemMB8lM1uGtWiNUdR/Lw6xkklOC1c3gRHuJySwNGvLgXvEfLNEOv6evigP+1rpQFQE53mJY1nQ8ipXM2MLbsAuChMYkiUseoZOIhOtR3NLWKQqYktiU+7w/IxU4zXVWO1IJgvjGZ29xAQlE249nHkLlhdpj0SIcDwNkDqvYkQsTjs7PiQ9y1VGVzpDxmK9IzHD/auUcA4oFocnVwMtIb/i/W8DQ6G3e1MqijCRNV8QQLxPFVydkAv2qi57Hz58eP/+/WfPnjm55+UJH1+7/u12fKjPAr9Onq2jdSRCIuWcxZN6pF5fSO8+IqoOYKWkmWHD4PL2Szp4JW+OUMA2mZSUUVEpagb+aRt2WyjFi1iMFia3hgutmLdUhceIPeq1dJxpduYqI8eLoktb2FI1i7kMpZJCUQp9ZS8liqV/0rKgO8sgLClC1Xmbgi3DhmEtcQvFoH7YgNo99Zxhy7Bl6BEE3CIEWI+QJnZbENzDuVEpdHcCSx4sQ6jrqZ5D9Hlvl7tX0nbaE0u6LJGxuMFSSUQEZ0VtGGhikN40WmpjFmXMJMsgQjBCnF0+yBBDeqgQsSFrp5ZDT033QFsx1Z53HOZ6Qs8QJfbJS00ImIlpQoT9dPUMRommRlVJ7LnJ3G6pEunikkx3coiwCLjg4GhAuKcGiY6nExLAFaLLElUAsUaIJnJ3el4MGsE+jYHDrWnbIdYLMGJoBEWEwKJeeP17halrC7fWuu3oVjqr3aRz01M3Er5K0k7o245LGgOHlQwjQi3bQbywqnV196Py8+b+P84//XT6mg8++ODdd9/dHRf8h+Pj4zt37jx79uzGjRsPHjwY9RHfffddVyEcAZ0enF4w+vngwQNvkPrgz5JW0i8Kk/XA/BqpScwGXNkgbBEca+sLJ6gknVABo6QixNeTLpeCxR+8JTcZQNXkW61izvM1nyiFiPeickCnyDm6Anda245lbqcFMAr7RNUcuoBz4cEF16xIOkmWvvWBzVrEzX1+qjJDcumrXpKUuaVaZSiTiGUYwkgwsUPk44l+FYoaLYxQv0IJcaGDktYX0mXMPDK2+r8bhlkh2noAJM2EionMnaJBF4sicdhPGcA+lq9OFONE1elFA2ryUUEAs0pSFnpaqT3nWAOawFqiilcyBV9NCHMaZxnVVGyKggI+Jky/yr5GDf4sXW1BTbNRREh3JoOXQjmpC6SKdWoAOrWVeueAo7sxj/3SZtjBMushPHpGAqxDHKpLoeRHyRX8ReaDI6pBNINsC9iR++VeY0tq9siWQYQKBWkNU3Bx92R4iMwgrjvZwVZqvalDvCtxMcSZwe0tdcViYpyIYOcIPRUDg3hQr9ow9AjfKoz46dOnXq++sDru5s2bHkY//vjj4+PjpYmiF7lLX2N79uzZycnJ559//vTp0w8++ODatWunp6evZYB2k7o16AOR2SGmmo+RRXcTEWNCfIpowLzk7uwq0FN7aO6vylScp1QcuawTo9J0IDcKikVqoYJ6ZbcV9diNOeeY/z97fxdrV7a2CWHP84651rYPJJ8/QHQISF8VIATddB+ftBIlEsqxbyIlCJ0qkVyEJhxbIj/KTdlcoCYSVBmJBCJFdimJlCgk3qVuJUL5qV2Cm0RI5YIglARx/NHpDiihPzdqRGhE8Ad9TnmvNcf75OIdY8wxf9a2fU6Vy1XHU1Ydn+21955rrjnHO97nfX58voZrDgsExWeMdHGMuXQlLiBVi9Vknly+EcEn9AM84aC0K6KoGDkbpkXVjpOIeeK0Ls72iKAZLXHQHmjrFm3zWZEqQ76Js4KN0KUAQyYDw9XAsBrlsVKs0laxKG2/FwJpU4IWSUeq355hGRg7kaWLPZg6lk1XtTuIEa0SKJqzEwl1Y8geN2eIicdG4ZI5C00oV+i/6FGECFUKV4Ta7BdBW2UUi22LOJlNIrsFCuTldy0V3r2hFafYNwzI+ST+FlNSbxjIjsXeJEDtTYRC4hHpKGubsD4X2hq9XsWjZQ0Nbz6oEpw8dDF9gRuEaCDNtnxsfHAXjWVjMKVn1RuksRJzneaOr20x8c10wccHH10NFn/88cdX/7Qods+fP//www+fPHly48aNx48fLypFvGYNy8ZXrm63v9v+d9gsjffv37+4uIif+OWXXz558uSrr776+OOPfyicprI6ByCbYdxwAmXvjYMy27Kj0qWSA0Ff9RmWOh+AEpUryiAojRUGPSAtFt+K09mBCSo/fIFWHzCMOBqUTwVNn0jIzir2u6trMHGIXMg171KyuXBgArAiyixONejDo4xEJJnW6dncC++0A15WoQl74awdMd8AAQAASURBVLcuI8sPSoHFB0AcDOKjUoIHTTi7ee+JI3PxKDsqVeWjLVJ3ctR+xB/z0+GEHl1emuD+WOd8csxhsH3DeyF+eHxD1FIHRw1ZJjfJJHdZoMljcZRWxoQ+ZBG1ilcLfFs7YEQ9E0xRwlZ+wbF/83pTjbXQqg0tqmt+IMgFRy56nKunlDbA2WUuRQ8fVl9cwaYOc+SDLJpjQ6FxWenprNj7ypyK8pYAB0aR841jgg8cMzkwA9ohh0t1LvogbWDEXE3TT3zaRfGqDRez1TcGrJPXe7gBGpAuoSEsUGTLIAV2y4KYSe8/stdZvr7VBu9VXhZBLjdu3Pjyyy8368KmAf8pM6Zv+2iz3DjVt7CQXVxcPH369Kuvvrp58+bDhw8fPXp0586dH9J0VnWBGmkOjLBDHc1KU37msY4e50NQb4Mr1dwvQoP5pU8YU7IMByxTRnPIzDzYT0FSyBPRI6x1eKkUzJr6FNsRCciHOqbSyx7CgTnEAbLc77t3dIOqNHf5YwIQ90IvssyZr0V0pMHFOSiRqu420bHI6APHkOHXGBD5TDOjSr2ZNx71K9bNhkdYfD2W4oZQO9iF6PaL4eI6FD8BWAMU+j3UhGu7VOWlPbpdTveoNGJSUgq8RHqBxJINEYtqtbwHDkjXQAcOSm0bFh4jp5ORVNrVZKiOt82OKH5+b07lcJ8sj0u3o9Pwx8Dc9zkGGb2YI3HK+TFI4eegbffAeC6CRNzPp9HbEIvO3jd5zW+oZdFksWeRdaTp+Hxeng0Td8hBQw5Ot1Kuqi+UQU44YMQphcRNU2O/UbTWYK8MKOnnVK8gDuvh5irTE8nR5dEVNxKlrNl+vlIOi1jnUkm/VoztW7WWNsXo4ujR2CjQzd/w3r17b8YksElOI2ng+9gzXlxc3L17t0luf/rTn4ZS6sGDB59//vkPjFYcFNQ25qnTU5IlZspOPC9B9nd1yZbUmkh7xaoCIJ7Z4cTDFh3iGN06ojqsmtnJNoF9Pa1cE24i1Kqbdi364SLujCWOWclpwVnJpzcDrfRYzeuua1vhsUZIyWWxmJiWJoOmiDzRZYnLZTze9bhpMlEHpblDhH2eeq3aaOfpw12roMo3sra3a7xAMzyEtWld+hH1yH54Gx6VsjgqQQUjHGUHpLYxQxd7UIyYGWIdCzlyqQh0Kap2BxAXx4ZZOZFKAE/c3j5h0MtwRXU4zxFpRBacNQsnAnA6v4WyRwqJVeXVVkociw3mnPFDrnrJEpBA5wb7GUelqJspdryiwxKCGGUZ2s17T1QRFcoM27qZR7HzGkqzrOrdwTw3RyXd6K4m95lArNiUjmVIv7BGmVBhzcjL1Xmju/jcGNLMIiVer5V4pTXmGzheURQb6PCdO3cePny4WWQ3o3dOBbm/Pf3vsB443759+/nz51HmYxfy3nvvPXjw4MmTJ6ewgO9hpwqJTTp6on60vxWP1OBaBhB2LMLY02NSFWOKAIjHWgZyc7QQY+jUu/wclAgUwHHWi/CoFJOcsnhB65zo7uzLyhXuM4umhUHW6Sr7FDW2rNSaj3MhWXMkiDW3edvXVC5MoDn1Ur7nUeaKtL1JkiPgoGHHHOXzqHSUZaRR+hX3UT8ufTd2nWHsDOJdH2UDvM7DoS67OsMCbj42vdKpHUxVQ0wrmluaHDmCMlwdANsFAaVk1TmoLsRFJVlJzXEvmUE+r6lek+JUls71vspKiK2W03pOtPeJ2R3IrxFjpei2uphlY70zHaYqudKGIzMlhf30CBuKJRmOssQ09q0+lzG+AkcUJKiTQjupmGZKPMqCmJzLX9KRnmryG4tBpJJ5WG3umHfM0dzmK11Zphq2KintRHfIjVJnXPLY2Y2RT+x0cZAlWlIyikgOH2V59jSpA/enGcNakfSyxcv0jSWq/0b1taHDp/qlDz744O7duxcXF33JDG+m79CYqeWSvz3H06dP7969u2j4Iyf24cOHP6SQuiAjXCrFWq0Zy28KVo3aWgdmAJFiIZwTJovhLDwjkQoyZjL3bKQDqfGEYpqVYZcarvHY+Z3RYS80nCGPPMZMMbyDUhuanlQdtMWBLPh1tAkifIrROwlStsgvE/RCwzWO+66ju9SQqDN6M35VMagtPq3RJSTzneUEnzydiFMnTJZQaeuS2QUcYRDOmCulOqQtBcdXgYm3ZTakkorktk06V5aBhV+MmoUweRZPU8/J9NnmQX0xWTfoUilXLlLtwdm71xl8z3yc1Eir1ZNiC86pFhNF6US+0HDQ4ODBBwCJ2nH0PggXmxeXVWRaLojVrZWDJg2WVYOAACWEt6A3N2ouCVC49OHK5XoCRk+VpdjnBKfbXBWhFouZUvEgtlrYDE5uynVLP3+N40HpUKVvfdmqk3gkmsf8uGNhd/1hr+aZZFvFWds8WW4exFGyraqhOE9mXyiuvHabmt1O9Q3PrEJ+rYXrG6u53xiCeXWyTfRxN27cuHfv3u/8zu989dVXjx49evbsWZgHvrGh7HvvvRcevt8vdPjDDz+8ceNGMKLCrvHmzZsff/zxgwcP7t69+4tf/AI/oKPgfdWDOBdpAlDNUjl3d93aO3aR7nO93eneKjBcj4ExIU5UXPU2FMcKjObiydZayyjxlZlYYtJxVBppI+xQ+L/W9cjqASZn68qLq54rLH29ON3LVGyFSr5ILH0JbnAoEOFumQhCqtusX64r5AHpWPL2ZrTl6mURFNklp6S54m7CtW1vM61sKw6MVBTP4yZ/q1ta1ZnzNCB7CoMRXUb6abfIOWzSAdyhFSPcK/MpYg+EeeuoyQupt4ZA47d2vgfktsXEBD6KR5WWNisJMBpRyu5Race8wDpLzlCZx3NBGGKjWLHjpbFg9FTn1XmqbEd1O6VWZjCUE7otwTTmFE9xt7SmwYGN4m2RFEd5dyPl+Yw2OAc2CctmkY8+r/jzGS3mrtaMDjesnxqzoQfe2n9r1X4JDnOioU/yt0ULdH5+Hujw48ePT73mgw8+ePTo0fn5eUOcQ6Tyhtvh1+1/h3Xb//z584cPH967d+/JkydRHe/cuXPz5s3bt2/fvXv3D/7gD34wdTEYTIdiX8CtMjYNA8VCFz0oARqDwTrHZxcGL82uJctAP8DCzqJFnKnj9hYYlKFDsWUAzgTjBqnWyGgtEjo38dmvhjks4k0WHZ3Rc3vMp+wOq33gKcQbkpX5aocLZzGMIwvg5YtB60se47iSzQOhq4uW4HHBC8sVCdIohYNzqYuztx0EqPCAtHW5nWbmYck0p0edvlVUTBjCeUdT8ltNe2suJaUBHhUfqB2VPFDs6FVUpo5eZ8KaV9YmcwbR+QJPmy6vP0F6KfzXHCSMmH5a4CCjbIhAp5h8uHUB96FqWbKr46dx7lYywrMmH6Kl7cUM1y7lJLECKI3uDBtVGM2kRiUh58JNLi2swXf0kRkhPCcGtvDZ+SQfrlU3eGrPSmCgF+tD5krPl0E75HgSTw05gvB4UDoy7eQvSlGMyzLRzDuCQtfTyryYgn3/jBGfPHny7NmzDz744Pnz52vhTAwXozt99OjR/fv3AyN+8uRJZJe/VLbz7R1R0aS35ZI/e/YsJrJ37tz5+c9/HgogAI8fP75///79+/dv3br1g8kA8MkWAG0ulVBi3DzcZtm8XGbT09okLJG/ZJ49cUZFlEFO78U9h+I1D3SjUHXb5RcaxIIIZ5igws0phUnbQxUCKugbLUM0y8nyUI0mUAM70/wpLxNZ8VLDgAzmAK+tZmHH+plpgKyF33UkFKOT67NaqkcXLhPtfNjZ7wZwf6yd8AgacKlURY64Yo0yaM/8dZfbs7Fa1lxy6wxD5q1FwyJTBgZM3KIMg5DJyrDmnMYyCysf6EeF9XMJEE5zCXAq3DIVp4XJ5qLf97Ss7Sh5bH7ZmqGiyORuBdEasKsWE2OwAdpu29yAHXNCFlMkxW1Z6nO1RzKu0uf8NEFhHTNVTP+DoAUfmPccDRqVDBosJ8tb9bFgFq1UH8oOlovdWhYdNsgdtJlwR+sT7K+2EQWHgletgFL8HRpsdFn1IF4w5NnFBbPrNpfz6RYDlX8o8XTPnj27d+/eKaFo9HEAPv/880bouX379sXFxcXFxRtrR+/fv/99JBVFwt5i8n3jxo1o7IMp9YOJB6gu89yBTnYw6MyDOEaG6oGyxZS0WpHOG8hIZ/XNnUD0IIQN8jD56531j7JLpB1zLAVZZYWZdvXBk6mDxioaKOYSo2xkCtOMNm+uvxpHmUGjDEKjELF2nQMiPKY67ynSAiblvlE7+o4507QCb9lJOtvik2HNYsI61O9SSUV42uLyXqlzDp8ALyF1nk8n22vSuXabkj7pt9txuRAmPIYl7zPYSzZL/+7L1VSUe02rg6jZ9Vglcq9nrvOyUgJeJ35PZw2ynjH36Hn18UvRLBfTIWSvpPIs29GbCXUHm8ycfLs03WYBUkET9iptCwFNcNSwhOCRkIWB87SGvtjvkX9V4TjOPLLYX9uN7rUGIbS3MIpAyp0Yq/bsatuJ3MUmt5vCZsEV6r53YnlXruR0m2/uXmKTYJolYbDaW7HZgNSxrr9eEE8z/PjND35TJeNnP/vZprdvFIuPPvro/Pz8008/jXSZ8Gl4/vz5m5H1/Nr9ry22HU+fPr1z5869e/fW0+A7d+4ER/qHMjplRNAckSKrdGNtlU3wnCZK5lhyvdIspG5NGKoexCPsgGKcvzaAr091c9q1UyVhVHEo7gQCJyWw1Yh24uQuyk8NHK9hr41zEXfGir3avHezm7tlD+edsItN8feChld7Q+Ilk6FjFEi0GLfZ+z0qLlqxcYhLFH7NL7TLMKlzZC66kkBF4zPlomONSt/I4BkbJgBbmsheuNHovZOBb9w/Y80tzBN1t/iQQKnmlk9KkGZqvNC8xNg8KKg9EOxg9lRtQDYAz7ljFNwZBkmB6ataiOTylTC7SPW0U1YqlilCTD6CoF13M1bbReT6FBzru97k5qjuAr0YQiFBu9YVV5Vq+VcwLleuqFAVdhVj/UQNzEPn5DjA+/5/gO+Yrb6y8bO6cl1uhR1iyj/bLRk8UalAJ+F+6EDzqdxYU6UgR6cQpx+UDkgvlOJhz5qKeh/RU9J1KkLkgr5vjWsUwouLi9tbR9CEAQQH5/z8/Hd/93dJRnF6/Pjxd0gpimr99lSxsHJ6+PDh48ePb9261a7MnTt3Pv/88+fPn7eL+UOYyCIdq4NBiTPt0kuKsZKAEwzQRXJ618F64RvSEzylbPRF/aqMS4wqrrXrih+I8DFA0moBEUvxYv7UVoOW+ca6VmxuPwn1BsSYFHYlfqfh1N4tGg5e+nD0ofbtzbpXyXywPEwhOS1gPfI2nYBZXATNxRAiPNLwCpJeL86lhjCGPmjI6jmqRXurkxvqSTVp1Nbuu7CqA9duf5lHik/oXvXnQSQQRAhb7sxkJ2WoNua73UXQ2awpLkt9sQ8Jrvdy9Z0y2uOe9I475h0RNcMOVaHcFLILl/xwLgIrSlu7TisX33fMr2LZeamhbzub1ipXt6itvWs5hZh9Wg25CQbxLDanfCLbgT/FjrNG1c1PoL+ZDdVUClsTBU6gw8btEWcYGu0BOeq4FQVxZpdx13rUSseoZRTMsoNSy3+W+lGQqgex+SsFBb29R2hNfu/3fu+KFzx9+vTmzZs9jhmJcNHKvpkjrBW/dw3jxcXFrVu3NnVRoea5OsL3e1iXmWM6OCP0LcGYU6sTJ86HuhIzWxakjd1zSUApneNszhct4bHoDmOxTQekrLkhmwkW/qqOKZWdrpJO1uk7F1U+TbPqouJl4asK1Zev2e71FhOlnpv5YH7CPnGC9lp5Kp5Iilz00pl6GR9yvXSPXlonnK4ODmsB4wvT4cUCO1ZgoZtxyuDVumeCznNRNXHtg1zfCzd/xSYG0jhovsxz62DuSqGbJR+ouNk2MKMPQpwAxzm9vd8PFDWz0CcqxYChZ/V17Kta72Atpq92giXHghU1KvG5XbQ7KuXcJwL+7LxSeILBg3i04LXtEZmxG1c1SrBvWU2ipLwu9Vq95Uj02iG6TXXjGphA7rLW+1EuJ+jZQ5rmQiAwxwp55YauTHccNaO7lWSLigyoYzNM5mZNXn+swP338YiK8OGHH262w/Ga9957Lwa6t2/fJvm7v/u75+fnt27desO57q/b/w4LgPiKncfPfvazkCn9MAhNxSFF7HWR281duaWbfUFiqOAL9rd4fRiyt9zPeAB4rJVA6BUoxQqAVKw1kfY2yjaR3whmnYpBcftW36idnpNwFVTXjO4rpVGblNtekDsLe5VToKFk1lXLwhJHU+Q/V34Ko9IwCYHZ7yTCIqrGBaQSaCCMUoJnpOyWldRRsL1YTCSXJ+b1r8tlmYvyb93EkqfntDGRQ31rs7WvbUG8ylgIh6ZtR4DpNaC79ZlR1NkRXacSVYObJjuw2HTJCvWYUDhFLgb57m0cWExRvCK/nd8TVKnieQK1kxQQsBrLuPB52/MiG92cRJpmd1npiOyToaXmO5h4C0nIcc8MyBFSl6LokmExMSrVSD1LCGiArAHlIIYANaCBPkwduDKmKXKidvCBeZQZMSCPSqn0w/2uArVSzqpji3pP9MVTXQVNsq105rCYAFKiSzB6ksLcXFsqc02p65Vl/H2jEF/NoGn/Gh4U5+fnX3zxRUTlfPTRR99t+Xj48OHt27c//PDDL7/88m2Qvn7xxRcA1hPZuIzvvffeV1999QNpRGtTFFOfqKQZZoILLTWuVTp1vgFehDJ9PzAROFK4AEN7ZpHu1nRznXAVuQZ5x59RacdxVWHtCKN0ZHWkXVWwsv7UxiKZm/sUl9fxHMMkZ7Mce7VKiCsQ3u5jqApUDDFYAFweNEQz2nnY1eizSvRIsZx6gWKrjKdvq0INiWovgD1z+NxlEMV6z6q9LPu2WuAmg7p6qqMm1/fboNkknDF7I7Ib4qJxwtmb/XSeqLIKD+Id8ghLKN6xDfhrMuHN2WSM91bQcLR5Xi1yexY2t+esZQQ+BdsFTnqGsefTtY3UMJkkFCdHQ8Fed5bbZxeQSqLipyzsmJebFthkIdI9TSIddnlSGFM+hzo3bWy7aYDPrjjitFBmhB1ll4WIx368EW8tPpG4+zy6+Y1eVoPlbYyJSJYJ7ZitYhYDfTA/eCKQONtnzywmNLOYiLtorJH0LXTBEVFCPGi4lOv7HFQX3rhXOOGGcHUhJg3icPzTmznu3bv3xRdf3L9//+bNmz8w394f2CEwh+trzWUFNnhMoYlcu0y0SADrNBmnUcTZU+xiqAZRK3Vv5hZWQrkE+VjelITOIE6qMksiW7UmDHHV905D2Wo3bDtm1KlboMNSsbbIxfB9uXDEODCa90RXvXrqYLKjDMBR6YhkyDU1vXCDxi38IZeZqO2WKz/dw4cXWSnLd+Q8zHyVWANmpWPlrFix0yh7BlsHnxbxVqrhb20QS5zwWeoxwe40JsNiLzJWtXKbwcuqG47Ptw4Sui677r7qtseFME1S84aKejoUW965WyOIYm8Y+UBMKHfnOPNorhGmSBYKmFKRWZy4iDT9ruJBnOC5xkrVt2nNTvcI24MABuQBPtDD7bOOPH1EysJQ4/V2Nbm3H+RPfbcs6RXMOrv33jZv4bSp8lD1jCX0OHKcVY2IKJOeod4e4RIZIRDeeRDHYxUGL1JZCPrIwdx8tzpEu/lzFICYhUPp31uA+BUVsRHf+umnnz59+vTGjRs/+9nP3rx/4Ov2vzOAOL7hD//wD6+AyX8wsTmqhIK85f6uRTp49SOPuaJV+MxLntu8FlZ0V5VBHDHlh0BRxSNSTLfaAC0hF3ITp+LUmjqBY+uulfxETux6lOcxXt1uUYPXP7VnPpcNLudyqo+0LHtCTYMpXb0K2l5yZpdpOctzzW4wHYsbg2nuYhO/8QhLJbhsClITMMoT0ghbX4raOsYQLziwCyvYUn2PsiPM4rdf6TFRDYwm997CTCmTz7CYmHivBd6Vpu+dQdh0txBzjbJj14THT7MaFlFNQljA5brMTgziKDfdFXbZeqYd/FyLSYKqoLjGDMYdFVA71AbFDCPgDlupcDOKYQWBgOBrUOGMkQQgu1VTjjwiQuo4FZ7QyNabsxg6yzJShmelozxR7bInaM+8Y/bIo68o+CJFSlWjGjuhobPz55WziqBZQQ3pmCmmWRlwjbAcG8oGux9R1oRjaf41au2sNCVpxCTDGVPu719dDJnMK774zp07b4+RbkhkHj169P777292rQ8fPnzXzX47BRcSw4NYnQfxoaSQVQP3hfU+ENvrgg6fWKg7qEuRDEYpmadKII2+8VLDdR6969/aP2XYUSpUxCkm1K5m98fiEMnmybLAgLpU9tw5a1hPSWtPYuE1vOd48GGwg2CCh/vQpYcH8REdBQk1kHqZkjm16KU/78WYNgsOap2VTwIOWBLPSjloat/qzDhn2ZxaP5sHMVfOBz0/NHiklbI6q1M9O6kZAmRY+DXtMarz3p06yTm/LaZ065QdEiUftTOoaHNBVR63lmAxazwD/CovoMlh36CdZZRwoapNsSpesVzZzaxmuxgs2wlcGMClhh8V4+xlT+v1XBcS496it5HrjZ7FCPmJMmdd31vvq2UcfP/pTKmSkZnuKRLk2pgzcznwrmWXfAlXQFWKW7XDNcPHqKGm/M33rxMrzSex6pJkHSDUJcpWX9//hTQasSdPnrSoug8++OCjjz5qFflU9M1mTs63Wmp/9rOfffrppz/5yU82dws///nP30KH/Zs3bz59+nTTOjmu/A9rezCxCJs8ovkAlJkNNCCPReyS2CzCObPHa0tKnc5ulgmPxar1zF42z25b3kReDCJwUCrDp9US1S0sMfe1sRhNJGha1dcB2tMSJ+TCkeJRxkgOR1GaVgZxco1igKoeHXGLh40tSzQsDqgCfy0Kj9KxxpiXTJUSUodOMVwLyKoDnQOaJUh2GmF2OeebzXvxVJQ51x+LeuZ26EQFjOAAn5XCplvVyV+k+c4K1Qg4LHENXrvIQEWKEV9DVxxh2QRNwH1FFSma06265YqT1hO7GorT38nRmULwaK49ZfMkkmi9bXUfwkHGyM0THGVk0d1anbuymGk+uZqgRva1zo5HJMcIMDW9LCGhnjYSsiMgeGyiD6tYgordC0eYnd6JrBN0SVGqMxKtX2Pwgdk5MQgXxTpiIXqLNuAK2WvNTxJjWYgoyOoznqabrQ5+punQ9/N4dRZw4xF/X/rfYVEa33vvvfPz85///OeLb37+/Plnn31248aNH0B17J0HY+ZT4FcPcm7eWkLDScdysUSwJktxmTFjI5iljM4CjDsgHZBihz12usV5GYiRGo4yx0wHcdRwVEqQoLxEnbYpJNWdnacB4slVpyoylhixu9nE+2gpaqmzB0Ij6nhNxpvUCtO2Xh1y3RwMBuFFMdao4XtlEVQ6MhFjOCOPFTR38RKRAcRR5m6aKWhNsohMjXMYlYRlmFuWjZiAft/y69j0E5gcM5saq8qR2gJcIPIajl5quRciUdxCjrLtGLtI8eC5MHIblEgsFVUTAB1IrkGT3ZPWNy3lxVbSWGIAmwkys9Io5UkmY66E4t6LtJhaI9UUiKLQacWE9Cz22buko04yosuNkDp1BN7ElTioanPCNeyseBBPupUEDRwD7xmWIp0TsMWS96aF6+XYdNMMD8SWkDPBCk00Z138gLoQANSgp0jmGeA7eedeWtaGFLBG1W4X/5DTM/nTixe/4XXwt+n47LPPos3bdE9G5We9yXb0yZMnm7aG0cx/h4F+38bhXcBxnhLJCpeWUq7Z0a4FuucuzDNDAnP0DAtbVaNc3Fke3caVqrWZ+XSVt0CQX2tI8LPCGjajHB5hkluK2tmJTYYG9bWx7Ow4RvkzaK059EmriCzuiNYOeX159SBGGd1VKo0VD+Lyl3ZNbGZkoZYDluAhUWJzGyiOB5Oo0zsLhfgI2rzzEoNP/hJ6aT/T+78blMxjpDlwZg3fmyM340svlB2NJJQy8iVS7ZvDzGoxVJsxiAnsOIo8+NaiWoaLTsuCAS0MPWhBA+eoaDu3xpoJoyQHnNHxzTSVLXLNoMgDzLAjFGE46MSVrHdvMLg392cHH67boeu+FyF1ZW8Q2Q/HanZRNyqzAJnAblj9JYzaMTStusTQfm6iB6d+fUpNke2TtimoWMnoJWwDluSZZc9pJ+6QDtMv9zAanY2y4v4U367CHebEeu6VyLHx6BnE1S0anQaLLR36oPTrVM83FZj+ikcweB48eBAmEpF1c3Fx8fjx48BbQwn6nQPET548efDgQQ+tLo7woHjbjo8++uju3bu3b9/+/PPP+wsViPyNGzd+MAbEqJr6I2wH91qRi51REeS50XfMgbWFcmadYY2mRZ0NmbSxIRdy8Z3gCDNopxyPajNFXYfUhZ+Py9beU2SV1Kg20chjy5ebQsI30rOP8+Qbr8k3XmlAUQGjq3VSYKpamai2hb8yeevLRJhXq6jyD7mm7xo8lcVcjVzcTss1m4FLDHulIOWc+AQn0vcJiDBA82IxscDX2TF9m2hVKqS5hdG8uyUTTiSjlkZGRITchHlI9EFzjtRRaYecOMvB8w4DjQCe3Pko1qhwoZpHxckbZjSglSV9cVbMSqhfbG3bKA4M9psdmc6QAYwwg7M+ApwN10uqXvVcBvqNAUq8/Cr8Zo5QBOWZykh5OxS2bY26kEOnSDjdOCKdYZwjvDiWbVsBXvuNWrCD46+5o5q1k7LKruDMSHHSf6tYkE+m/zncqGcREKH/nuzRRiQrgJXFz+43yZ1P9LQTfs3WlXh3fMv977DGj8NK486dO+E1EYZWn3766bNnz77DcKFvdmrahpPHkjVXAnNO2pOpAMTheBA74+BIRjrnem3uksp5QIqfeyj+aMVQv3F6spfwlGPJWFtPEXFUqhncXNVdJPrYlWbVGdpmREB/Jdhp8YJA2g8Z1TVjLcm0dGj1HJPyKBuYhcmod7HKkIvtRFujU6IXZFx9Ql2KtzxWdHhUciUXC0FXQc5NmrkvlWIwSs2IYNGbR8xaZpg81LEYN/PfFzFrlAxw1bi2rN5iIuoKhGJOTao4XcYft5DP1m6KHWeK81xaZpCqiqoNrHqDdrrBKpe5p2wW1XFEapBlBSZi4FFI3xLRMuur0KswrGtX26wwwxGCAJEzzDXPOJ2flAsBmicoaFwpLClZ/CViQj56cjDVDzTLMlPLeTP6np6ZIyAijJw01chpPlkyW+fOyNwiNYyTkT8Tkeg+abJFYAdnXIwTEbIxqBCLWyWEhGHP3LyoJBIkA19uXGy66JwH2b1SaTTk9A0ug79tx8OHD6+GgN/wBPSjjz569OjRhx9+2AcKRZP/4Ycf4vVjZ9/iXnTaEcZTc/SUYQaXJNjRBzMdlMIYt8+WsVJHZmwgEjtkT+Y5Yqyw41hsK6hkefRh8aiixbf2Ra1beI9Ih7KvjVMtf07sX2eyiYFjaRctFP3ln3bMa5VStZ8qtUPIlz5cs2PdjhdpzqUPAIKkOS10ncd6Mm8mBpoZ52Ez0qTxv5r5oMQME5XhMU08+GBhNV+RxyuEpZMDjxSiIokZCRxRzZePGmqjFT0I+xOoc1xFGCykXZ24XyJF55/D9ahO3XyyaS7tyhqwFjYUwagstim8G1daTDRyGVqeRBJwBKJJm3kQU0kaGBBAQMZerJYFBH0YTijBQQTyou1OeyIxpEL0nthwHT2W2KbdDYJcTDNquaaJRXcb1J9RoGRWT63Wb8cjcKmEaqMpTSfZd8Wl/8eQUIRbVsnL2oSWqIFj4s5oib7DmEpCXUGa9uUuQlw0QoA13taolOTtBDJ4qaGkKIdSqtKd8BIC+MsK5a9bc8d/6r/3jS+kwRpucHBglxEh/lYlmoai9ooXvJ1ehXfu3Pnqq6/Oz88bx+qzzz777LPPAnb/bhMUvjWMmOiQmjYLjB4q2tQd8qGDCziXjVsXeBXGRyV+5qpHLvzTPWwGF2mi4ZQ60gaIkBcDujWQpFp8HdLk4IewA6KDhy2XdgliaTPVj99qTzdWNliTimYYkEMbtGOOb4/1vIuomSwymgdOwQGUjko7KNVxsdQ7T9ZeW5zNJpVe+vH1XgHYuuTl7cAyLC0YMCf2JGsGq07Phxeju0rlTqi0Yp/l96CeSV65UvT2BQX7ltim4J0uqkX1asd1wlmxpA9ZahiBZjHFFa51IHhdCzP9DDrMFLPX7j6vYLHLDmAk1qDcHnHaVv2gecpdpfhlv7Tx6gyXVeayVwQFq94qZnTM2A+MffJQ3YfDpHuEjXVf0ddiFGmXVkyIwioTuy00HOJg2fLMdaaTeSGHAVXDV4jq5lwjoH9tD2JPyPpmlr93/e/p/ncJEH/wwQeRn/7o0aP4SstVv3fv3hs2VP626+IBxYdeXQqZhx6/e51qGZIH+GiESqjXUrO2+EZqCtPMzWIC3eipLPFKo/IoOyK1nLS1BTsK/mh9kVZNCRi7GBOyGBSkK58C9pNDVcXh6SsmmYfjIuheguyC8RrzTy/TQu+kCssGLPtUzI4aVB/0tbrzCI6wg4YCxxfVj+jmSmNOs3mygGpwEZdocjcuhaEUy0SPkml8KUzGds4T2UoFOwigoRgNx3Qw+F9BJoVc5j5ZTLTL20wGwOyaCqyLYgpisug+YxAvsl9ng3FNV08Tph9ovpvbxPAtylxZmbGr2h0oSQwRtzoUpoqsFVizlw9XcRknrJyVWdxtCgMJHWF7KvpFg+/hQw21ICXGM5XqNsuCuxcexJ22uoDLR1pYTOzoUeHCrKNMQYU2zz+uXCU4p62p47IFZj3QMw1gTUYueQJcUI8rCaLO59NRSVCWgTTpDCNZW+T2THGJlHW0/XfHGzreNgXMe++99/jx46Asvffee1G8f/KTnwQK8NIe+/t1HJWOskONiPFqYlDjZeACxAOGhT/4ULV4pLolZhLEhW8AgZ1lOa2LjIstaplr1uABdCYSRyESQuraHgl14UXIo9LBhzkEOWcxBxXUlLtx4s6ycXsfGr+FsTFQMWJHB3c241Sbky5VdPpT792tS2qSjiLGV7s4MyCb1U6n9XoOHJBiDJhLRWsY6kSTgYqX1BZ9rPonMB+nnNveekuVpZKDszYEctpC1KkQ6PSfa3SMBw0A9sojJ2v+FquNykiad13lKg0rj2m06wOhWuw5LCGjIbBiU2N6dRXUXPLlmoRT6uaPO8sD8s5yoOSsHsSa9kJMyEaHmIDjHDXl1NKXvx58d90OGUzgQU2UOtmCpW0yF1x20HCdTniiDE44YQZP9K6D7NhY692meFQisLfxjLl3rvCJuDDkwn2zcOpUT5Qm9syZ43GuSupo1NhxdJbJR0QnJfqLasDdvC928B39WBATzotpsfxqG4ZK/2fPeo5knjfZE/r/619/9Rd/8sknjXJ7chMuffnll4sv3rp16969e48ePfr000+/WwXrorR9T+NqHj9+/NOf/jTMIlEZ2bdu3YrQ3R/epkjgGHr/Es1qfVUqNq/0E9qRkszZYOUEH7iRa3fCZ4lH2K5arAaSFfLZESkjCzlsCryCZb2yCCw0z4GeweykLBXDqOiUS8DJEjPtwmOAVi3Lmj9Gd1Z8D6zL7it84b35KCV5+CbV9J1Vra/tm8OKoWKT7lRyUgR9z7vs5ZVeuEy01j9oOlnmq2jYroq11HTr3aLaNqp3cA5gN97UWADH7r24LX/VAkTWqgyVlZkuS8xaKWJn+GyxsqSm9NGkUrJhyEF1KtzeeSJif+mlGlIXW5rIhFdyhXIoR0efzBsSXWuZjTIDnL7o+4KCwEIvQCINY/1F1lvz+9Y0PcEFW5j+L2YtnD9TxmLC6TLG5oc8iVKsqIHNkM26txA/YBQPSvvJ4KKJeHIQipvym3UGPMISwjy1WFwWj+NKCu6foBEpvuAwm83Ql/dGE/2M1dD5VUe24jcE7v520aRet/8dNieoH3zwwcXFxVdffRWl8ac//emdO3d+GNl0mA2LJgtUV8neyhXm86Ix6Zcgc4/kLpVh0TJaej4GqjYrZa+PBMBPxqFwVDrCIwEvx9xsnlAZLgHHyri80jq3nLY6DsXpAQp7WeLpEUu9Jg1MdxBwK+ZKAeC6Wx85ymXqKby6AzeOal8apWmxNmpsw8/gCwsZsSbRlSD7d/6Gv+mf+fv/4d/7K//ff/nv/JOoWL9JGS2DrqCiM3QYNnbt1ktvlYae98Z2BRstWXnlNqmoX4p8IgV32NtUoIbpobDR+8l5/FMum6FeKFo2DcFi1kz10oqriS7BvWWjtZw6G9RX+nAHTiVHOGqnFx3QCbIYVXBkqwOSNhpJozjIRsyGEU2wHB1mMIiDaDaUHtX7UXmcqsOcHFE8iINmG/U1jCki07xf3X0+P5+XZE4hqjUdaHsdDG9KVSpYRycvGwWiQ/KtB4NC4QtplAlG6MCUpE0DU/XB6yy7T7xDiN/48ezZsxDHRGT58+fPv6sCF7X1008/bQlCT58+fe+99z7++OO30KLxN5nIztR/pfUqC8V6DLaxlassfnU6BgCDjQ3xJLCzMdQ2QDZ66EAPKqkvL6qfbN+/BYuKsjEEm7QDhrG4mr5ko7qznNwNUwYX0I14t4r0AelarE6ySw07joH0NXnHCDt62lvuDYhKRxxQWhi2MsLxZnNpgw+WoyRhgQ4zyFY5Fc/HdjHDNJEZTf87WysbB0rA/+OP/9F//j+49e//kb/u9//E3zlB5JBRrkLiXu++bUL5MZW8aFcqBTi0XFY0UhPIOIqk7WA2ywCYNl0rTz21gIQFumZwoxuz04xehB3V4+LShyaospL9YC0JoCebh3fEXs2PswegY2CvAT7Skg8GF23PsXKoUWwTqjUhVtysRsOJ/upSu13fq5eQOl29aYm6PdDhYXwsb2bQQRQq/ar6NnIb6ASLE2jdVvWtvgqyMCRll2HlmzG3rqRmNiOtd20UZo+KvLN86UMYYlgX0qNZYHo1iWZQ5EqyCKq+27tXHkqORX5ji97+z/7fp6f+H/wvXP3i3wR8jAjxADR/+tOfbtoWhaT0zUOcz58/f/r06ZMnT9577707d+48ffr07TcqjOCEOPPoq39gxOF1KfNpJmqFLIIGMHELkarzveqsinm+1hUNZ5mxwQjt5Cre5RyYmzVi6PlCwjIWLhe1wWFqNn2RB5Mi7jXMGY6Fx8q+ktdyZiiieDbdbHUFtGbP6NWJOBLzZi1GVbqEGXHB8jDXz1buc5zMAByBAWOY+we5JE/Ds1eyIUa3po1iFv/yH/kb/9k/9eHf9O////7lP/YnGqENyBKzWzILa+bc8dK2x4rN1p8YYbuK+RVOkuxKhVKrFF0AQvWljNihdnPEnTZlCVT3EjRWTcftZZ0duqyzHt50RC60ce9IxBIdqTorkgq8ItXo16mKHZBCshOVtw8E7jZLpR/3OqX2MtClyjh5uRthNXlIUxY6EnLewt/a+x2oY2QduVkqMA6LDXHizE+sPVMxBE3H0v/WmQ0jgpgsbXuwdztgC56YE3u/zYlbEJS45raxkIkvCFDB/Tf6qARk47RxXRT94hjO0BS+O97G/ndYfM/5+XlU8bcqWehb6VfFo5LCQ33ex8Wy4rJeeAIHPNyICtsxF9Ll1UW3UHKCPhxUl6NS4qkg5clvd/1vUe28xKa155EvATfr5n81lSxjInXr+Bbu3OWzFYDS0NGfrS0NmvX5LN1saDGWb3fU0Bc/YWGbwCOSVZPcADFRPhexs8z/d/76v/mf/vC//V/+80//pb/rT0IjRFfKKg6A8xEdXBbRaAYfYZRcL0Hn3GntKkWD1VjAnS1JyyqMQWvrTtX8JWLuWbcaIVkaS8GbdYcRbTcWzH12WRQGxAGjbzseWLEuKYzpsEZqRsMhYpoWd8lUKOFlTnDlBqLwdOonmKKv6yXYXPWokfxeGNYMT8w8MLe7wsEgaDe/izyF21rdOPoOeac8kunVAl2NPkRRDJCZGxQGVPVcOOgXf8+CQWsGEL9k18sQ4boSqYOGgd57ZbJ7VIv0dbK25Ds3pTdcGu/evbswYApXpYcPH34nfWAL/Yuz+v5yr156TGw+cSzLTu5c3U8uPtaBlqOnnR3n+KPvOVoRQDDBBxuPeRgqxhqb0RcarvPYqC4j7CgbmEekrwXnOCIdMQxBZVaEZy6hrjlmXUi7Oxuz77acf9QNmWZTJa+CWZdd+vAjO/pUssMV186YHWR5JasBcdAt81DCr6tTnhoS15KCRM5guIGeqJ5607ncZK/Otls0n9Kf/Gt/4o+dmf/+j/+OgX4dR2OYSKQ98gsN/YBwZsERkDTVu7cTizRbrrYuLIQUcUQYMswm2Vq61xVkdmMoLiQWNL+aLcCWLX8YStjodmZjIVN3FhNz9wl6R7NrHOFwmYxzM8mgHceha58i1RBTr0iDdjauOeqXPly34zwiZgYfn1KrdtsJhnt+ROV4rXF7jjEdt0IdWk5esUqlz8uUPHZzmpK14IXix8X9P90GPJkIbFD4S9TseKfQjLZtzsGvCPXEpA4u0gFDb+eifqKPtz0P9lWiXwOyXBeIkJ5E8Yp/iqi6vurhjbs6PH/+/MGDB02NeuvWrTt37kRm3VsbBhsdXaRM/8Ach09NbceaS+Z1v92mm7uQ+nWjOG50iOqx2sULvKhh1hBQRFhDGNfGEaOSUc2DOEgYVXXUjAIy4DbZBBVlTS6dLEfY8YRFQ6s4qsqDaL0tCKdu2aPlhNO8M9+ovkxoSQCsSfIAHBrDYalbfAKZDT4Q6UNxH06hfVmdEl6LGhmtx7/7N/6R/9Wf+vv/5L/xb335x242f1pOlCOOSH1ge8daVS+prAt4Qyem4LKqxmr6jKV9ZSsK1XJhMqVs8EKzTHTYodjld7hwhyrUrUjpYk3yqv6xCTLWKdvAEOmOSq3ndVGMxKlURczss5iOssSg9SjDTNnQq2q8waPxcY+wlhgfyunMFuYEEAM8dVvGgcEU0wB3cKAfdYW2e46lVv/PEHGNIqFd83Xpshza22/CZUNQsuTgJYY51NCaZSU5T5xA09anguTDZU5TN55BJzhDcTVJgU1jbm7GMlapGEjDB94db1//a4vvfPDgwWefffbDvkDdDDPYuMn1UnJ7Icp4MSeyXBLS7HTzWKmCsKPSASn+qyr3KOhhfWn2VGQg85NpOpEyCwXz3FNprVDAjOXah7pMfuKM0JLZcmzBTtUVKaVTkqmhes+3EjvRbMu6iRAFp1VkeUMYm0ymLOVYYMQlkTZ7kpvcpOTe6K5WTqZF4Kr5PIQ1PpvSpNuvBOc3fKbSFVmcDXKdGsIKZLeNRSzcYbxY5S1Wr6RpylZBaFZUTZyrD+ZGj+fFdtmqg94aNGm0ravBmJ72O7k8h1VI3QNVgHtmMMKFbKfdEs3yIkpsM6nQ1hM0mUorXPwjaC6H41i7A6u4uBeEljlNqcFllqUdc/mzFVKX4DvmvtENupx1nkrc4kLsIliWCnHrrFUO1vP8E8i9WXa9pLH/OyhdajjAamZ698RNd1Uh7L+zmHjzx9OnT3/yk58Eu6pZ6r/33nu3bt06Pz+/e/fuGz6f27dvk2zVOjCCHyQ6PJUkNIueOkAVJR495ZoipaVzkwYbrcsrb30UGxIK7DnuLQdLdBObRgeJ1mWNGXZotXViNxcLiFcIkAzLxaIKtEmdNw2WAgHcl9BNdPPFgm0hwHFZ7vFZcZRd+nDQEF1HdbRQLFOl8TAf4NMom1t7kWnWVf7V6gUMZuVBKTcNh9jZ4jeqNXoUYHEFwiTauB1z3kV9Tn9saTpZ5TVTkgEuNbzQ7qB0RBpbQl0X7Kk5rGzUnuEaP2k5rbJIw6wwEYPllEZasIlllWsj8FJDi2E5KjUf23Wa6Ag7FiAAPu+1zjjuyiei9a0Y5xZhR3vmRF+iw0K/Ybv0HSZrMizv4dU/tQekzKshEouQuhgV7Jg3e+y6PbNjeRCYVex9ezL1sRGKOya+d0bJWG1T94X0xI1pLvOOYyraXhhg8Gs8lrDHPqSuAzCKyHcKDZ5+u3cb0eBh6fvfhT579uz27dthT98fX3zxBWrsW+SaXlxc9G6D5+fn7Z/eGDp8+/btR48ehRqmFbU7d+48efLkww8/fMN5sK94xHm+nef2bRxH8FA8QK2lRYkkMTDX/fOGq+rGolN2y4uyOxPaYuY5Wwa3ufYmi/LhNQFsrFRQiQhQNdBsQxelhTZwHSeLCSw2/kUK01mTl/jNkoaSqude9JvWote9Iy8btLM80Hf0Hb2NpMI6D32mWZgQ1mJR6URY2SIBryCi2uzKG9+ogPuaXerGucmzlL+eARMyHWsGU63ue4+Z9D+WoTQiZu1iJxae1mH23C+Jqiiqw8bFzLVznOgi74q+hNUht3WOXFGF1IHLLWinFilrSEiuuHz/60IC2zlxs9QdTjdQvRtTIa614FZBxZvF2gZmqMDEwq17x2wvAZvArUnGun4RSisZdOtdEz0ifzgFLZ0kFLL7rfHKAaV31jwbtmzSxM7EbLnx6JyI53lUdWPWArpyJf5nvcOI37r+d3ajRmv69OnTt606Pnv27MmTJ5tndXFx8cknnzx69Cgm5K/Vr0aWxSu8tpFyooULtUuqYv9Nb6UZ8BrmEpedxcRKMBI+QSWNbf2oCDxoOCp1/hJXnXCBeovIgguvZHJmXiG1FujkD3SYCjxqVZ9KVBg0R1R7m+5O86urHvpRw7Fypb0zmhgbSK3mgVDxVk/yJB/q/7W/5y/86//RP/Sf/+Kf/u/88/+j/y6czU66zi03cm+9Qvzq6se67mbNOorWs3mH/qtE3EanVCFjVQA3D8VfwmdUI69uX2NhEzc3jFlZLW+htf4Fvqe7KQivfgVGXCALr3TmopzqZFM5DLgLkD3h4DrhkuROoSDLWd1fVA3mhQVLrr21YBiFk2BYTBimbIHo38Le2mXrkHpWCHhAJrSj75FtjiNFx7ufwtAngKBj1Z2kR1ul1y22vwspU6Hk12sVWNJYH97AiI8ajmqeZbMiqgqIe5nn893s9E0en3766fPnzx8/fvzll182S/333nvvyy+/DGOlkJS+a0fjePLkyeYFefbs2aNHjz755JNmi/HqZbd/OiQc6miwL0BHpA2V+sytqHQle46daz8I7S1fDRAXeMvTwv7Va0faZaC91GKi1FMAO+Y9xz3HM44EdhzPLJfuYilfKKNBlx18J5iASx9KVvvUnrWp8ELQt+FHuNEgzPgfs81JtfBDt+PnCwy5JX11dq6LH/rf/9/+7/+Xf/qf/L/9V//UP/xn/0/zdRJ75vVJRKSPsXTUQWU1LgWScTP0hoytCuQyb+OlhrEkf06D175R2VVCUvB2w79hP+/HGl7cBt3XahJaf+rN69anWDxuOzDP/0+U0h2j9iOtEFirprrRPe432sVNwHdxgiUYJ4SxOCVDUTul4Fupb6pb4922C+vfGyOKY53cVFCY82yfKZGp8Kdetaipv0MqLrwcM3Dass5umH6G0cKC1p2qgwekI+0HUL9u3rwZPVqj5QJ49OjR+fn5jRs3QvR548aNe/fuPX/+/P79+1FZnjx58umnn964ceNNxoxHMb1z584f/MEffPLJJw0gfvz48cOHD0Ou+hZe4TBxbtE736Oi/Pz58/Pz808++eT8/PzVdxSNx+DT2KkwiHfMi63vaokSC4fXO9JKh5Bu5WmrL4Iqbbg2iDIFa8tIxzpR3tDodCuDSnPHrMI4zmXmOhNoFsUqCm0Fan1rpbyUTtYWo9weejNMQejseplGoFZnh9UUn97J8xsxc9ZjamPLtNYT9+/IYf+5f+Pf/Nf+a//A/+JP/5P/m3/s4/WrKrZQFFprJXHMO3O4b2lJ52yXCG4Nkq6kn+b6ix5Z7npJ+uQIzOpn1VwB+40fO4fJWX1ZKDjj4rdAhQRfYZSsPn5B4ytVaS3WDACn68GRK1C+bAPrbeaauRip24JpMiadgUet1W3V7YrNZLyDRb8pbU83I4xn8Y7andwy4Q2eUOzIBGz/qCkJsJxM7NamxwplkKNqvNEsLLaCdsuVrKb/Hb7ffUwlsBo8njCKfHd8t/3v8iP5/PPPb9y4cfv27dfFW7+9IwbRt2/fXpx6YOEffvjhgwcP7t+///77779Whp4Dh2IAxCue1qKJqMQXDxV8xIhhi905azkpFf3OUan5uWiqUhugpHf1YLGeNXRYFVHliSSchspd2XWAdbjUhBibLT1mdgeVA1QpMjHoKyzawizmunifwIind1QAUBavw6PsWAz4U/hLtD8NHUaHbLbMFVWPgn6xLlWt9ns9HK+lZ1Qjedmcn12obRIDWo00uQCvSzWK0fRkK2HICW500tmAyoAIc32Dx+5OiFpVnZdLOhCaY/7UD280hN6PK+pnpFr/WnaQZH1Jm65h57PcaPKzDdk0Tk8AS06jUmcxsbgdCyWhi0coiRZF6cx+RFGg4XoFknfhrSXgjnlXYYVdndWvK5PBdx13OHFiR68CDdg/C5iEMHN7RChGtbYKzJWKdmwM+rDvDhoi6n3Om5hurYoR94EGr4wRl8HAN/Hnt3Jge3FxcfPmzU33pGieF9Kbb/v4+OOPb9y48eDBg7cQI3706NHt27fXrfInn3zy/vvv379//8GDBx9++GGL1HvJnStceoq0GQfd7egpT26hr+BBfNrppU9PY/V926UlBMkZtDQ7jrAX2sWAJ8MuNbzA4DixL5+7DBt0xuOi0l3xftR145h4OsXqQdVgdzagrXLLlsiX6NdtrOlAGpiv2XFv0dIjMVsxoOguS8eFaQTeLqelpHjF/32hIVdn3nxye6C69ddqHzLhtkWKyzLDC67oQpkhINJo+w6nSUmOSlWHWNdMbyfPrVVydq7X7Hg9HcIdilNEm1vHZ9mEYieAoDS60Bp9neYX2nPcV3VLTAtaIhyAveXrdoz+NoUR/wlQV1vjjb4Jb/qwF9ppo+2fzL52lZlb6dJKbDTzSeK0WQ96wW98QFl28GHspGbVVb9kOXoMGKaPvntCT0ww+kFssKqv8chlj615KZ2NkHsEpxoNN8fzicX2QsPXvn+hnfg6ta/b//9Gf76hI3q0+/fvkwwByv3796PHa/rQiFM7Pz//3d/93XhZILNv0kApSM2boXn37t27cePGV1999RbuEILvfH5+fvv27U+2ju+2NT5VlC8uLt5///27d+8+ePDg7t2777///qvMbufP0Uwx0zUSsNXDG+tdbOathk4PNdqrvdC7pJ91A95JeaY47lbGj0pjFYBWK0hbjY0LJzGokTF+zkW9hyzGblxLlkaZrh1rHG7XLNO7PLroj3yS4bLhfX3i656eNvLHulDTaY2aCEnVuj01KQ9Wb7BqWUzz+KJqjzDF6F0xsyx8oC3/H1teFqucrZlTiKZl2IQivV1or5vnT5XglPBYlQY5bWolOw4vUHhsrDIR07R1mWlxmhGyQWcc00yNNNnm5kY+KOl28zlrqV9yhGN1cM+Z1WhJ4pL63mPB/b3EiddVcX/VK7yz3BXcDn3j6d1s9RqRmD1B0Csbj3TGUOWn7ZnPOA41QXZz17SqxX3BbUjFEEyvtiWo7IfisFVmCVWAlUXB2g9MFtq+It4LlvcRdnhdiwm9dUX5h9r/Lk2y79+/f+PGjadPn77//vsn2rw3rYe+e/fuZkm+e/fu06dPYycUXlcPHjy4efPma6moYoDpm1lSMwYDAuCT091AeZulXInmBEvoKAMLvNskeLnWrdi8RkYnQUqn1HABeiZ6ByLrdENOF+30CTZaU0nrVgs/3XagVxtPhYOPhZ+vV9VGk6YuG/WXLmdtfMfpspfqUmHKCrm6dSb+XCXpEMkkc0fwRdjisoEIMHUYJcJcaez3R3BuyCKL3VKeQFWW4RjNJx4cJSuAefB1vF6lllDnrdzUvO9ZEA2bLiYjZWRKlY+MVqfU/m//xtlafVu2ySi+KGGcXW/XwGGL7kaYJMIwNTeuxY+SDJBkAWh4jbhtJlPre8YFKayaCk+BZdHxAW7mfbhEl1fArHRUGpjVQfwDncIIolgGnxzDDpOOW/049/R3aYCnqWiwf7JYsZVhFeDLKkSoaYrpqGQajkqDsleyWzxoiWpbilgWfh2Lifb0vTt+3XHjqSb5uyLzPnz48P79+z/5yU9+/vOfr//1VYwpv43j6dOnmyyqi4uLqLMBbT958iQ60l/84hcv+5HEZHI36TqrUV3ZVb/w4Xo6SjhoWISIEjPLf7JsRgKGO+PY/ilRZzaGNr8fvv5K+wbO9hjxCIOGPXOl9lvJQQWPSsfTkh1CZzYelEDsMZK41CBxbw0v1maZ7ueX7naJ4ZqN7aVZ6dL3Ro/8uuxJiTv6WVn6WkqpGmm38WG5jJufHBIB7JjPbDS4lW19TMoHF85SrvKICsIqcsnWksdN7B6AzmzMOvP5EomQcWjNTJoFlwkzirjAgw/hgDEgj7JAw0vBJTvsctkVG+ECiR/ZcdL8Ctc4ZtrORi8zhSl35WvfcfUO1Vkhb7ZVWiHiRr/GMShshkVbOwWUx6D79KbIXvjumh3nzez0f6RIc+Mp2D7AkR/ZZdBvC3EbMjqLdUOu3/7SsDtJfFGfJk2eEjw6d6bOVT+inFikdVQfNnhmwemuPpgsN8bexoOnHfMZj1Y8iDEgn9l46UNikKzVMh5QgvJwUNrPbIjtUkMLH9aUQFXm/b1J4uscRH6Lau7Nmzf/4A/+4Pz8/Kuvvnr+/PkHH3wQKeJ9Xbtx48aXX355fn7+xRdfPH/+/ObNmx999NGbNyBGtUXerLZvp27m/v370SRH0N9mRf6uPKBOFeWwlYwZwHvvvffs2bP79+/fvXs3+OYvBVscQHXx9vm0KUZZ1zj+UvsTXaSqHqUDXVZGE2tMsPrw4myO3HEWY2WXGDg50lYQqv1yqlsZUPWRhb+VYaeWNgdj2qe1s7zongrXJ4ywwnQCJmAPv8ajF3Nh7ZgT/BJDLI4HpA0ndzHLYrq253jpwzXLBFy89EFTeA83z7P6X1kjmXWNM49K2We+lFrJTQIqzZ0HcdkMWLbZjHbqtlwwzuSPWo6/Fby35eRPiPy9YwFnp7j1PJv+Tjzfwq2e/LVQse94WU11M5f3guCWVocz5q/Va0esWRh3n2ySsnf2gEcfzuzQg/gvMGQkwJtutSmt2c08+iCEeEdZJiW30Wtff0AKr/+hlw9Xf6c4znj8WntiPTmd6AUCQXTGX9sb634kvNhx2sRjKB138M/OekYF5QvPyskKqmK6027S2gYMiySJCmPXq2TdPEk99KSCdVgO4TVfsyi7IX8TUORvmb3j6/a/S4D4DfOnXnqcn59fXFzcuHFjcd6R2Hvnzp3GGr5582ZMUF8RIK4R1cXL/CUTDDWML8aYysEC0aYb8AxRdfCIYYfDAcNBQxAqbelqmspTZd3/nTdR4XNaFriZEH5Tl8Iefd6s6604xloc3NIrCb/B3GnyDi8YMemyxDzFtHTi1LkuePt5HEPTqkkqPIoDpebG65WQ6zYtg0I/BSJATcqg7KBFKk4PWRpKeK5l2dCZB9JOBmnGpLQZ0qMDNZpx84wWEyheAYhZ6MPlw2wexHQFh2oK0GsJ8q6INKLPt1rqCcLdx8IFgavJnghYGATnrqo2zwd6f6rtx236FMlUgIayCWvQe0E6VuaCZeitkrEjMMDyAcEgdhJl4mKQUzJWMwoA1VcLCKEulKgR/DWmfh19WOvqENrkxJzoAeNymVC3/kZKtIrOBA4ePGK6Hy3tkCodo9wbiU5MYYA97+kdbvvGjmifNv+pBcS94QL34MED1Dyfzdd8J7nzd+/eXZfdmMsC+Pzzz+NC3bp16y/9pb90fn7+6NGje/fuvbTmxhCogLBlNoZAoI4+0ATw4EMPSpIYOLJslWd76L0dDxrqUE7X7BjN5Fj25NpX7kbFpksEXFtIRxmQAmb1LvCqd5mP8afAPcetfB6lTjp3xvESO2LF9lk3qCj0isZTjpz0npDi4NF3iV4pmaoOBt4r+0quEoiwYreclRIyZxxV1ZSwgiafMQ9wlctiraipd76b8ILmyrfRnCT4mR1fFIxV6MJw2qg42M11+msBAg5tuqkN1FVVqxj/jXLp6nzuVtO1eF+/0iCkTUPkif8V6QhsQ8oeEi2fUdaQcWwL9QgeK/6IVbRsM0wI9TFEh5l0xjE+hhhXE0id5POlbYuAr32XLK9BlivS5NV5RAbKE8MDq1bRe2QBv+KOlR82WN5zPGpYnEZWOsJ38wm690P0iiwsaG7zfcTGeSbqzPLXboXLRqVGzaOS/Ed2VEuWmO+J1Xxa0HkQozO7rE96M778wTCGwkTipevtd5s0HgXi2bNn65IaUXtvZwr6z3/+87Byvvp9fSe9/amiHF4ijx8/7i/p3bt379+///nnn7+0KAd9MtcBT2HLMtbScTHH0tZfW1JciFT6xR8rSUSuJMSoO+ucmL59sApe98TexfjTupAuiWBxCchzKuW847aDhrbad/6BwcmNH5xAL3JPMK9+js0Zpg0Is8IFKfv8Sw1jRcpcVGCe7JmeYXi11XGLJ6qDRlFIPk9tRUSpu81hX4tAlywTiRlXRosLropKp7WlT7FJ0ClwoDejnwD37rdNwX2yFu6nSc054yALzJ5g5ap6cKOizbSSDWPQxjgTKr2zsHRAbhs/H3Z27Hx1q4E1ylRAoHWT+GkIAR5lBuwKk24KbMie5sLQCT81CETzYGnj0yva1f4RUt0rXgWZyhxMzPWUasLfJLVuaZPsY4cHeoJG2M5yBEfPjWWkyR6kSWAb7rG9LjQLFxdPKX1jp32EHZCyzN95EL99/e8SIH7zBOGXzkvv3LkTHsT9P0WS3kcffdS/8zDRuLi4uBojriUBx+IXMXnQnOjpqsy/eikElVJuoE8Tm7W7z2S+g6OsaR9GpT2zeryvoq3ZlxBtsYAQyvoOHGUtVuXlOPjKgLgDiL3NBqvFhGGraQl3gom7WvxdDeZh+BAnrxY/U1fOtYv8CnstVSFUgW0UNiIlaKwGDtW0oYKeMNA3ZAKVXCWw45pxBhCHXX3x0ymJpK90MRUg6bSlKJYIboo0Xoms7UwlDrP9Vw2/5lSzxUSmKo+KdtcY3oLKkzcWexJxWeqdVyGiDSP2wgXzzq6xqzw2pakDoHXTbPWffru8uU2AlWJHGHYKo3x+51svdcnFgzjQ4WDsetEJwyRFSp44Jd4ETTs4zgN9gGfZEcywPjcjx8M7f2picGH1dmkVjCca1mAl7ehHONBnz04UCS3HSxzYJjdsDGJAxRplpk/vrJdq8FGlD5Piu9r4xtq/YLw+fvx40X0FPvuG0diX/rrvhD58//79Z8+effzxxwu+UgQfffDBB/024qOPPjo/P//ss8+uBiwK2AS+8CGwyNHTYB4MhUrp5SahsVPBa/5MqStnbVwKm+OYDo4adhq7mjg5zIxKAAceok871upcLYkjQCOlLV9j63SOIF8oSTjjFE/dDKo0R6eqVw8vfbevRFG1HrW+5qhd3y9h8o3Vic2KOAujW7ysCWO9ubQ30PxrDUECvfThjMe+sXfRr/xgud3uNPaNrJo2xlcH+igekRayX5TudLDSjvFSw0FpAEZY+0Sa38WCAkbomo3AFcmzE6W3bla0yPWe202gMyA+9YPLv0bLmipgUVDOKB+anwOUoIG6xuPX2G3YdK5w+LWTtItOpCvw13rCVQMeOmhP8B7LrrmssI23x/bYakOjDQFHL+F1ow8DclDvm41p92BuVF7WLciZhX0T0rS5VHc/45TFRPuAcocfHZV81gkDkIOXssR389g3V2rPz88//PDD3vui1RfUSL234Tg/P3/27FmQjd5O2PqKovz8+fMgUfVnfufOnfv370e9vsJXZO4JEDCoRSYqa261dQ6/81LS46RSN8LU1mRuvigV+q6LRw17jL4y9ik9NTnKjj4EVXbhdMQWIl1ZO2MUCzHehbfldHPnr+YzAICjaMXpuMULUR0TCB0PJgyFCBlhUiw4O+YD08CcabNRq6hKat7BVTMPUJevCfftMOdc6cNbn9z0juYWE2uxUkvKsVVo2EIcVDSstrASRhPbENIppHI1LuWUFFp727BFGmW7wDHLJYpwo2Zk0cbAjcJcPoxhmpI2HZVaH9sYzN4MiAO0bbwucZH2NpMradhxzFWaI8yy6dpuKjTNZD/GLu12yyS81HC9CtpYkgZGAEMdsp5x/Fq7mLhvlG72KRFtCv4qgcmF+BiKHBSNDs6Q98xHWNNIRYpjP8ldqL17QUC1gzDRO73vtLuYTrptYkUHWVrg9RylaKazzGkREjAivSuab1v/OwAgeevWrS+//PJtezMxL3348OE6tDdMD2/evNl/8cc//nG4LL8aibj1fvbSZw6gie5hSJQCDAxag5ywUz9hshw6YDhWz/sYraxBWAeNcJm0tKdRk2wIxkIx5ipKa3bKao8xOkvlpblqtGGNeHvFNKusUCFSjArvgGFt1LsYqF6dU9c3RZWjColHWOQMeOCtEbidiZJNlpb9WvXqlYwx+C1wMDSVQgWkCyslk/Stid1mrWUtt5ToLCF15YuFxFXj49QRh2MXleEDgG7PARuR9sjz+S2F7OLY6XxXTW6jQFEvhWRQUwS7t6ney9i7RDeeCjltNGcyFE/l0lWkA0alnu6ca1Jw23aoGHghoXkQYzbalUEQI7iPMSrx7rcn+g55VBpYzthRwigWbKyB7rAEAZkdbnLF1bLKsEsId+PeYuKqOUchmillpexGRpJkyhufjtrFb3NmBTPy3fFGjnv37n3xxRfn5+dPnjyJMvHVV1/dvXs3Wql79+69AX5QaFfv3LkT6bHfCQR8xXFxcXF+fv7w4cNFeW1l98c//nH/xXjZK9gQ8+gpmcez2Wzi696am+kZhHYcDdrbeHRjN7Xi/OHtvytRezuq8CPG1qtgoopwsbyXyNAWazN1KVegb3W2FGII6RrzCySts8y4EWXrldQcC8XXGq430eI8Ty/7UDuWNh4sbq2XZQNTWvQCjqsobNZhX1jRu5rQdY9cZZ5hZ9+LFjcTqwEgQWfMvxQJXbPj177bTMq2GXk5OjpUe4dYRXGUvfDdGY8Ki4Aalxc7tFH2Qrtc9TedQMoOXUWIfsZOl0aj9jZ62UqtfaXCZWvqQ4tUiJVErKQujm8xZYxOLCwmQJgYEun+cyfVGMRGXcN4iWFOn5md+9e+v24Hnw03WXnfK9hlDSQwxDfFgNiqH3Tp6eaefOtyFXkDA7LESySX7W3sgYzmPKa23dVLXRyWjiWRcHiteiV7mQFvNKvt28NuK6jBwRZsOu6hoQ+ahHJe/BD9XRF8Y7PPO3funJ+fv//++x988EEQlwK1fPbs2SknxO/k+Oyzz548edJn2ESG3ttTnV9alNdfv3nzZsTZXf0WWjRrLoZ+zQFGkbY6N7PjejZp9MHy0Yd48cDM07kaXbRarbCVvBK4cihjDkoRqukqbFBFyPaqRZsYLmquBTXdThYmRauFkd6HDFX5Dj2B2YP04wmeQMisDZ809RcZ0EHD3nKCYPiVM8v6pJNCtRHBYvjjsj0PmIiudPDgO5/yNl/16NhUWAejrStaSQyrdgHBG80qrDewQRCRac8N1SRR0+mvQlQW39b89CRDDy9GCJPqZCJwcDWYuBkZVVJ2x7olJvy+kbivceT8lxZTi3JrJXiCjRJHH0YfFsPd9hszTJIXew3NeULdSFJw0Qp4gt5uQvOs1FnZnkjE5cvXOGJr02vUjuMLTxLdk1kQCuG4KieX3bgUwhmOmNECxKtq81o12ywm7KhEVrZC95tXm8LpaTp42lMOpg7Q78kNXljtxdxG70rm29f/biObn3zyCcnv1m7i/v37T58+3cxVuKIiAvj93//9V/n5l3/x2b/7px/8e//Yx3/lf/CP/+E/+7+ud3ezW1G/8Q08tM51Qr5XtAIloMzNndpCV706uoZ2jwU+K2SZGvocU5dUErq7ksbOD7k4JhcycpM/YAq/Wgz0SuXopUBz+TwbbvrysCz1lg6Bxvo0R6sre2nzC++SYbSnrZVI42R4tMCXJaiG19UTa3BioIbaCnOp7yzsqLz4gVgf2N6LiUalUc0Rf5IVQ9KJfriu82XdXF6iSjMvuGaDiTUbWVcGMVsgrLqlGYvsso5aV0L/2GBLdR8+OjS8Lx2sO6fuUw7LJK9egRvpSpBOtnYS3KfBePNKVq0E6EqRWlCypjFCau+lqhbaiaGkEg0+p4Yl+ADfwfcY6/hSYXK/LK5dXU9z16fFVNyBlhXZh7eua3CHZaPqyufiLJWNThUZ9ST2FqMxYcRerbJ0UrT17vjmjzBnDFVKBME/efIk4tQ//vjjzUSdbwMgfvDgwULpE+Hj3/n1CTfDW7dubdKBo7aeqrxXY8T/yb/45C//Yw/+4p/+p/7Nf/Sf+Q/+L/9KeAq1jJrYuM8zT3DUoGqTWjLWZjnqJQpsigSnrtvxuh1TF8LYKkqWXfqAle1gLDiXhT9bYqMvMRyU1uKbJRWCZVbZnu5rzKQAXuNocJ4k1jbX9arKr3iWg9nDcBAOHotNIUuDwZkH8fZgdtU2FDSQLah60ht6tYRGl1a3SVntL3uc26V2/WkYdM3GMJib6VAYST55x6wTJ9l5RzR3P7R4g7EmFGmV6nlqrrC+6HFvDPBpc4Lq2CUK/Fo7AoLF+5pPbXtvRy5uh5oTgMaBPWPewQmk7g46s5JZF8ziVBBznXGce0FO7+jrav3ZcYrjnpGuxBSateUO+Yw5hck+3agEXcdxx1xrJY0+bNinFIqfOrC+i63DUamYYtVJ5wKTRU9s33oQ1uKvBO3h17tuP8GrB/Hi8ZlQGG+R6BEx320dY4UpKm/xUknviu2bOh4/fhzRN0HRjZr77NmzO3fuvIWEpEUdfPDgwVviuHh1Ub66Hb66KP+H//a//8/9I3/2z9z/s3/m/p/98n/+f/auqbEVNxMI0W1b+CZX0rqETyDaHCfcbC05ejSz7Mj+DWNkTX4exrLyr9f5Kl6Z/ONKPc1laGSoRvbTTFmdW/Hkkr4IW1us8Fw7OZRUutoOrE0byKntnEeMTrqcgw+zayVi3tFN367pDdYmtxSjEtKztawWPEGFcxMDPME2l+O4yOMyMUzzmTKxEprPJpeFdt0Gh6aG/rfPXTZF00/9LXu8vpoq9D5jJf11YDYuGT9NSoKi2zZf4JwzQUnfzU0k7sJpbVeg4hgzAWghEacR6aihcH3c3AtDPPfW+1rR+KhrHLvxZyeD69hInXtJIxXBZUclbkEeTeSt1S7COiZWGQRoY7+UuBzBoouI738VJhdpnE3vpcXflfQ5tEwCtHm0djamcHAp18qOSJca8jt/ibey/x3ezrfx5MmTR48eRQDd+l9PpR/EV14x+sB/+cuv/9yfb3e+UWERwDYUmtDYqnPAyvKurC82tnVwDbQBwXABMMqsE2N6G511a/Q0ZqEqw0UuEmpWGLtCUlXxcuAsTJPExP+nZ7GoZVjZrXVbX2NV5QF5T8uU1o1QIyTRKYo+E94XVVE4VzAiyFpw9iKnpZTqUWmgGoWqzaarroFYwJ3qmcqOtf9TKlaKq/bzJNaZlYJa4p5SCsVTwly53J3Aqj+NTUBzAabXIrL129iupAlWow/YjeLLViPMcKm6uJtDpLlZdi80biSHE8tIojZHXCPamnO9ceIqaTGl5jRUYP8xqKbsqAZPeWmSnaAxhyi7ic5qorGLXFsqGJEB0BkyWOYpJhiKLpHSMT41MBUfibXU2tfRiGUTWd9+DNJjz3SorAR1sIjUo9kkkajgJY3FfHkbd+4nb8GAoHlVWLtVfKebXb/m4FT4xowU9dtbIx8/fvzw4cPg10QrdevWrTeZ8L4+Hjx4EJSr7/biNIvhzX/9TSrv+Ff+yvhX/kr8/Ud//I9eZxGSCwzaoC1pBLPWVEIKaG9qCxu+dkzUGY8UQla3mzsiuAprcrL6LanlrUYrkjMHerxmQFYJnGGCD+YAIukLhZ0qgwYo5LECrvE4wg6eYkv/QinVzXRWKvvv8N4RU/VU7qNF296aFCUXjF5B1akQJiiCamMsx41iXUFScqFg3dEjK8zKVufUujCphsNOMVXDqLZ0J/gZx6BH9Z1G3ZkUK949j80mcoD/yI6/dOSSdmCtajZGqk+Qfuxb6LBmmeRgbbyDTBRs6YLQxvscmEUcawFq7dMossvmHej74rcQFhlKyAcNCOZY7deLsLT7lDa9gyNoJwaHBh2URliihpgmolyQM447ZoIx8myNU1xJqxWz1a9rPPYqY9bfMlBHFYdH45TFWjtAQ7lQk+VIEJZDuPMCg8kZAQGc9+JCrePlNMIae72hUUcnVDcJINGufP1L76VWRLiBUFNKzC6r9ZQ5JONteAM7KP2oJCdLQNz/5MTq4oxOMQ1vqp3x5OGoq8xSriiU79rXX/P45JNPPvnkkxb4FqKZ78rG93t6vEpR/p3f+Z3F1+MrVxflw1998ZefPqtTUhbOEGHx1Iigdp0nz1kkzUCD+eBl+UpsM8IFlsrVxGrCWEtrMwV314lpIy1VcMrFseQB9C44YodksjG6yn/toGInE/8UVngo+npmWFZMYXksmQetU2h+r9MyZB0+GJ34USmDqZr87Jkvu01FDPxsoqewa/H6NsHzpKwvw8ooe2Olb40KJmw07KmdqMf105p9PP3CWkOjyFoWR6UjQuBoYXXRmjESxiimrRbDhM5SAKgbsOyMcbXDRmFAjiyiHMESLFyrHAFCHRq7gDtadJ4KksFqG9LRcmGCR2p9UY2Urq3aFgtH2AAfYSCOsAaa977DJ1ZyuuzgiaasJJjDI2+gfjTTIHkCRtiLqkzFJpGVEE1ogx1g3Bhd7+qr9nQSex4TtaOr6q7IHFlKPlVpOUwqd0NcKwccoGwoAjCObrsphGO6CRe5CwQSc9yuCZHG0RDz0hcXt6jy0XiZ+JIhZTOC1iy4WGf5CN76obtFY8tqZqPSKDsojbSaVvdddMHv+t8r+9+3ESB+/vz5hx9+ePPmzV7y840f1//4H/1b/umPm9Z1VA61NyfYd5VrxflwNOSCMrk5rbg0nOZdAjx0LIxmbdELMio6HOVTA92qbR8mL7xw/sbCO7eyR/tQgdI3Weh4lk+ZQcxI0kvkLUJv1QREC2sztQJbrBpAOpkNPoS13DwJdLb977qL6rODmehjE80qDY36LPpiEbzhcrEBhhWbCBVPD68qf8kU7Jztj1Gdr2IF+5aEU526iPSqQHFTgsMyWh6ojG6S92FEoQkNNwuAzKQb6eZQjiawP6XlCYQgLF4gvG6629bLxRKORADuBjjrVsBgQtkbxNvZsRCqg+40gpewXUS6aYugXXNlBvqO3hzQrBgWK0HDLGu1WSCVD8zgxuKdH4GGm+ZcR6QE91nFnY4sDpw9EaGby7T4sBc6q036XoDCiW7MVkPkXVOhfdmlPvUokvmbKo38LS+TH3zwwSsmmv72NPNPnjz5/PPPvw2s/K/7B/4bf/2f+q/vOZ5xdPAPx4bg+JzO2UONay6/OLfZRRcDcsajJmwIgHYFDC2cFwdf+G6muegGS/Ez9wXCU3GR78iPkT9zDaOTZxzDBSf84K/zGKWXnPYPgkfT2x7w4leA8J3HegxpUNgX1Dw6oQaL9Wc70Gv556aWZmn0Ot9jYJtxrDoLPLn7TnM5zKbDbL8qxhUz+M48HBspi+T3Q+HCzAhE7ag27suPaY9xQB4sn9loNeJm8e6to1rPTqZKVPY8OmO3N7uwhpmTdYKbHRN9oF/j+CvtNF/vNQtMW9hsNRPDibKNyU5XVu/Y8CBuH8o1Hg9IbY80xeNslZsYWGaZQS2VonSA2qhNrAnm6mD301uXnjnEK17Hju4UP/PSh52VBEJu3Zmn/EwBrCXhjSN8UDoidfnsmi8IArTjmCjXyVLH156NsiM0vzt+neMtdFJ6V5QB/M0//r1/8OE/OBCXGF4o/UfSnuM1joeSw9FLVJWix6ISS1hOsryVonZSitqiqBbWeQSOSEeZ04R8DBPkPiu1MWk8daIgpMoq9WraNvqQkBv3wmfMj7IHiLnaQcnBo4arFkGqQqLV31aRns2W57YYzw70w8SEXve57DLErtqUV/HrnJXWOzCQGfYy59YuhE0cYbnva7jRelhn2KUynxs6H06GeWANtoHLaDpqoHyXxlA+Xfru4IMrPnGTbLHp0JX8GM3Q5OXke5QZ+3Q7BcIYd9EoOyqNzRVEvJIOhTrSsEvf7TjWT9naJJzTrHFKkghV024CZ0L4m7KnIBfXS02sbL66fIgNJ67YeLDaiMWMwejWwVEuHjQMzOqsRgKAcigzwTlwdLOtK1y+MMI8tkD1GoWDdpXxzYKIrO5YUjmZGaoT5G6a75kBeZdV67LEXB8Wy57C/zNurQwewyr6dSxWCCKT+ZtYAX9bgeZX7H/fRoA4HIevSF89xVc6xW+64jAUy7O474K8kCdNhE6GkTeKicxlnJRrLLBdRZMXYGOTjo6LyeFE9JjytY1uHSO0mg2RNMwCuHrVKiBDx5MwyrVtourV+OllaFEr6mxd5EzNUDSbbuYSzHJiti4IpbZhp9K4igkyIzFTfXznCq2dj5wnEXD/97qDmLQVRO/1oGJlkOB54i45PZFLXchiBqhqUCujgzCT+/S7TrcfE/tNhTzOuq2BBENgiInVDHdAjrU4Lq9Z3tno9NGTK96CrdZVtm1NcSmkvy4SeDLhh2JNfeg+uCBnJYM38pcVDpGM7pqyB+PMwl162a6VrRi4nLEjFWjYi0FwVTjF2xvgIOIHDvQkj5lpWJ26eKr3rUyHPmXOHBxhu+3LiiCINWY0O27FAsNq4T9mXpHilnOxfhjfyV7f6PHs2bOLi4uvvvoqIlx+/OMfhyPwb/M1CeOLe/fuXbFp+AYrb9t5p0IlXj74W2YObC9rWp/41yBfGOEFotVZBGVX8Minnofr/XILwoqxFhrZh8UqN2jOkT/Gqu0IfU/kkgXvpgtOYUMJGxx80DAgZzCLx858nxWCizc10M+Yjxgs1lsZuVCwKmQrE2GK6PMFjBrYU5O6Ijube2Ehw6lJZSxsEaEi7+ML7PbMxmZX/ypVpVTymjA7YdNW2hLN08bat7WyONvjFOVMXHlecV8J267xQmCyHMqnVmQoWCzjrFCIC6lkzr7Ewr5NJi6Vdl3ivYCwJA5t6QHJ4Nc4JrhpnYxcg6F66RRPjpwdJEPZ2n8gSvBrHF9UH5IF2KoTOyt2kPfi6o6yXVDDrrgAXMVgnACUZ60elaTBxjWSsqzXhRUxzSqCR68Ooa6xOCecFqkz+Ds/pzd5RITaV199FZZKP/3pT9+Bxd9GUf7DP/zDxdfjK69SlAnskQ/VqoHQjo3ZMx87LZpgTrEA/dzRF11y9W3oEkpMHbRWnYgtg0k9PYjVUzWsxk91KZNRFUQnjz5kO46yo++CN3XpKfJLgzXcf+O8I56JepsPXmnekRKGakRADzrRywphD9IdfDBon8bTZaSXGC5Hv15IysgeCObLBYgtCSZXA4TW+Gz+elJ7y0302ZO3llc7omhKmRbB0ONWXUlNIdNGNz3KijYaG2lMR8yioSafT0Uc4cwyApUzN8KOsEQdkbw4fy4NhZZYQpHkcLoPAYqZkXw+gYgR+TDKenV1SWvo0IroH8dw162hcHvm3MW11S3rmLVfnM+ZHX/l+wAZdswvfKjqOu+L7+TMxpnliINSMgGUxRVYUJ2WeejENGct75Q1+agV0YHupMH3zFk0ivCBY2L1GuHs/pjydepddKjWNAEiRYDTKLvUcGAaZc53HsRvY/87vJ1F8caNGyGriSOI0Pfv34/MulPmSpsROieLIpHohY0LH4JBJFbZXDNcb544xeZl9nB5WbZCRjExiKvw/9RWtVSydZJKQIFlUdDAbFAzaS1hzWL0V1rXoV5PMdV1b40x54TaXBdivaTCtf/h1sa/OFdYsHIrd7JGo0R8uV6CP4ouM2bVN1LLjJ3Y66M4Bc1VyXPLhbn/8ryWh9NBsZhwygmaZNnJE1cktgspXCZVdkiKbp0iXNNsAFv5N9M+KitFtluJWC2bM09kQhNOFiJ5mBkn5iFoa9BBhCcYuve76Pa8BJOyWX9w9q8v+cBXlO2iKwmUf/JeJItXQ0YZugZoYvRkvmM+oCC6GRxlThy2o9eX1LaAgwtWTt/DDTp0QQmbI0e+KjO2uBYKGGUHDAcN1WHtFCmvcdAKuXvgaMVUZNbGh/o1EJDKIM4GJ22x48Q78eobP87Pz/viAuDi4uLBgwd37tx5+PDhd2s08d2W3fjv7du3e9j36dOnt2/fvnnz5sOHD0/FwJ6yQbziqA9FMSsnnPA9R06jRCX6jn4sLk+BNjqhZGN845nlFxp6PtJE0GCZ8e6YR20kpJ9qzCKCbMesoLhSO2Qj5uTiUlDOOJ4hjzBWsHPpqxtFmToUuzo1/V2PyWJhAFTR5wQ3joLZiZxMbS17bIKeq9b0/ic0rz6R2nNs9ricBpuFRGbsPRZ1jaNv9WB92zTQhxoltGDC6qpz21QDTWM59OEBK5KOwdUrgyUUKVWLPM3XeNzR/xoeHJTxax9YxxV75gwSTHCbn2RoJx3cM4+wSw3qtnkbIiZWiJy6hjHy9GpYja5xBMMbd7LqY7g5b05KunTa0qBGsnHHWYhbaIBalPn6yvrLhSvc0nJt76WJjZu/zAeogGb6yaiDlxWICW3QrmMEbVb2/hzCHuQADcwDG8dBBl3tL1bsp99VwTdyRO3oB4qBeN66dWszb+3d8WsU5avb4Ve8yAu1bBcLydn/JcLyaOIK1biw9lj1YKLRAW3mwI9KUYiPsqThGsbQdB6YvMtBUcv0lmUN2yuD0NrGms9amFhq5kVThM0rU2Zqd8k5+JXDlEBJ4I4vbzgulbq4GuqKnX8f3L1qEWr8CeOSjrCXwjfq+zdZiPq/xm6s2OWJ963JhaBPJ+rOvVnwOTC6DeZOREub5Jj8ssJ+YQOcDaxwTY0ZkZK8l+kcZbnE+RohFBPbqSIEMCLoCDuKwSBu/OviZNKss7bQmLju4VwR0lLvdzKdAIizU7Wxx1WCJFsjE3KAxTACZxzrLrfPjdCKh8Q9x8ogLuaKBu+tnHyKxVo4DscMlZKLJfgnPkWtojtmWzWqm7Bq8xI1U7IUEbumcIW+RArg21LuQ6jc7ahhz2MuIXU9MEWXHTXEJipYWVmmd63w29f/vo0A8auMl2/evPn06dOnT5/29e9UhM6pRTB6gBEpMOIdASQPT7tyT5u8xU6eAJ9EKEnVBm+u4GgPYTd6muqEl2HmZKQ0xacEibjAuzE77V0R6GTCsu/doL4WRE/VWmi7TmfZq5AYtakoZZFCVFtXG5gTcwO4bW4xoa2wbG2e/CIqh32suk+GVxPq4Ai/nvrbJE5SiHmH7UpBWnaYKwXt2sGsZCfVC5MHCGoijZAAmXliVul5tOE8MaEQJjkAnwLZy9syyjByqgplyhqWHclyMpcEQ5a5ZXmZKGwRZLuG2ZzFSnJqk16qs1xQoSsUvvh6ENtTVsosKY3NGSNavpaGNMIukXYvw0YbhJrqmMEagzgQilJWN+j5Ezhy1W6pFtoaIHkoRS6A+5IxGw9FPMLBhk70MjOnhpLvjGHlAV3HCwpKePwJrxhTQZZ7qprxXa76mzsuLi7u3r1748aNO3fu/OxnP2utVES7Pn/+/Arlyg/7CHfIl5ZdrGJgfw10eEJq6EYfoBccVp4AMV/xs7CsgTz0j3SXWd2wGnp1TLGquMbxa+xrtF2ky3aqSfHShxXGpQF+DaPIHXKsMzuMZ0gjjdN00BOk8nRb0EtTJ8SLtnmSOIgZHDXskSNUM7yDp5rP4mVxxnG2HS+OsZ5ByLnB26X6ANNFeHh3BCWqzC83EMBSdq9xPMgMHlRom4O5e8sHqe9VgqbaQIT2mwfUESs1qLyLHcegnzSuijGsnApVZZWJV0r7qJRhCbkN5xK040hs883ZWY7k2mVh6u4k6BpHkQlx73ln+1Dqu1SsjRDij6DEqVf4NgnzJBnm6Q6H8LKdA4ba/hX747n6BEXI6V5smrGdIVtPYwRGT4nePq2m8EKnWuqB+1Hpa9+JM0x2s3XubCqmofnBE7GKHmbh723egvF+9xyPSp3jf33LbLi2+uqM5azFhNyvD8GiYHPHnmEAumpn8+749o9nz54FOhylNjrPZ8+effXVV+fn5x9++OEvfvGL39px7DdelH9DgBirBnff+TsZcI3jf1Lt3cIH6Wv6jtnBnWXCU9kML8CgjVw5bQ6ihFyMArx/6g8htaxsoM0zPygNyJ0ikD1OvVbZ61UlexvTsUAP86RgnUZoJya4LUx8hkheES/KrZNw2FHDIg7OuVXvZ+zPSjX1glfmTma7ab9YjbayQRWLrHJqa3EGBThmgLaG0Y30nMawna0ZgCGTDX8CXyEPJpUAm81Lr9kdosU7rSJvoosBHJEIRE5pe4GEIgE65XwCvvBdEBQuNSTKcenNsbc04JpHrVa4frq7CmVqlB2RjvUm6d/TWdVVx3GN4wsN6xydHX3PEVM4h5e4Y0nisWRjLEfRYlxq5WA8csxhaNm9pGXf9cmDNnmFaW1phUkEVsCLOKtV9AXYTyOKtpiSaW741Ojn8bwfkYhQ7b9b79+6/vdtBIjX+ba3b99+8uTJw4cPW7H8+c9//vTp008//fTx48dtO3JxcRHOGq/+uxIEei4TttiyW1sBI5hyDuqu7mI3QKJVPSU3KUoHDSc3qsKyM4QSc6oNcAeFFsm8wxzeqwViNVTHBEI39WWwnMPDYdtr4uQAp7GSBV6hswy+cBgMW8HFYinRwoIHZbC8jT8Xl14y7CY6/wGHWAzoOBFA/9z7f9vf90/8z/7EH/x//uW/808WkeHS1JULVLOZQroSkNtIL/JeV2GDi+GbllwtulkpJtwyOxK77UBZh03Bug2HphVPKkx4MyLZrBg675jPODrt4Bho2XJuvhYbPmCLyNxuP/BS4hBhpeEktu7RJfEX1Ya4coYCBi2hA3F63ZBytROw3oCaJdjBMVlYKsF35bnw+MmjLLhd8YB0slzhFVpDqYydO3S4UMNacPABaY8MYMewUxxDRsvOFGb1fsqYyIBE7Swn5gjVSZg06QuWNN6pXt/U8eDBgwhy7RunyAe/e/fu+fn5Yuj423PcuXNnEZEXxKWbN2+2ivzBBx/cuHHj4uLi2bNnTZH06aefRkV+PYC4i6AsjzynqYnqE92/ckc/WCZ7WivOOAq0TrKToJHlx+6ZOa3bU8+2WBkBRIBkgg/IobpIzf1NSCWrp+SMZdgZaqwHlZCLQRJmmhbVgJcAD1uAiYPN5m3PseHarAb9bQk1CHAaNhnEEy7c0T6MPoBHbkN1p/rg5msUnVy8zUPsjyZ2sxL9X/yv/Jf0nxr+4t/2t/x7f+Rv2BjFEe0tDHBQB6SYdya4aAMcyKNC3hJU0LzmFoUHseZYg0E7jgNH48ApJ3yj9lEyStA1G6/z+AJpXrJl9AC4h7nFBOfzCaENvztx0Cp9qRGsTl3qMErqTLcQXOyaOlB+V+vT4uJc47gqXlNVjnlDZPh4p/Xk/Pduftw1ndhfBT1tm55jyVp0rjZFVaVUonw35c+RgLSQzdUOHAN0Vh1FT5zwcu9infFxcyIGMTBrrlC+0kL53fGtHJ9++unz588fP368KCt37tz56U9/GtX23r177y7Ub1iUo+e9uLg4Pz9vL45uP+r16/7SDi2adVCp4FZl47qjv6gd68B80NyZXa/xyBE4IO1DzcnFylPaXtdJEfqk1BGzD+AYhWPUsP7VUkSRD7gaJm6iSSzmXiV7LRxme+grcuoWrdJBQxnXvRokvdireOeugMmPuH2lbGP+wvt/63/zn/of/vE/+Iv/0h+7SYqFgzSVtepqaCtzCW0VgMmPy2WuGciujtkdLgphMYEWJEgd46MUiwHxCXpdIej4MCq9dGwXEEcLr2tdbrCsQu5zlBw8KrnSFGkoOz0VDANrM6oLeVKW5bJDQaPJGzVgBPeqc9Y5j1ftIoddYeZ6cwSbz4PnJX7awtXz9ooR94Nebs5a4vqMMEqkcnVhbi/YMe/gYTwVJ2+1yy6+amyVtNiXdWYyLaQumlnnis+RLMfS4TWV7qhhhwwNvWdUYNYujkqXPlyzUdBGMs+74y3of4eGrvaJcF999RWAzz77LBQu/fGtBse9VuH89NNPz8/Pf+/3fu/WrVvPnz9/8OABgIYX41VQooIRewpCPitzYUpd5FXfqS7muiTEsZiVzxZfbgGyZelfY5Et0iqkiCpESdO04MLME6k5MFgFBYRb/zsbFSiGUa4ZrOwi6sTvCoC4FKr2frm5q5CRoPY2DuYJ2rHEiy37hAVFt9lOaXlBOocIIfczqrIr+I//mh/9K3/sxwb8uff+9m7k2xo9adPnoUkdw3G/kE6SlE99ZFP3O99GWPheUnPwoc3sJIq5ikLrvkuq+545zbnN8RJ9QE7UjjmZG/NgecdRIE2xvErbEXws9lC+nmow5iDTDHT7M98xj0iuJkI5uZ8R6E5nRAw3VNdTl+w0WUzAKM1T7+chjXRCA/JAb3dbKsRhpKnN1gHDDtghD2TkvA/wHBm4U/Sw93bgKzMv+nY8Y7Vq4bQ5Hqr/lE388cKns5I+N72YHR9tsLyj78JOWkVovH0vvtIGEt+YQPa3sk1++vTprVu3NiHgjz766Pz8/OLi4p309Yrj448/vn///ocffvjxxx/fuHHjyZMn5+fnN2/efK1Wn2zPCJrpanOY2Vk+ekKnWq0ePupeNqPhN2ipCQjObKwp60jYcEddE2c6FaFsYltoR2+24xNoCyXoDOMOmRhCQngJo5ZIdHPlO3oaSl4Hu9UexhZMVxG3Gkw3UGJuUob1YnD0JGKAYzad3LS3WhZWzYkklZUpaBH8VVTGO46J/h/+Z373L//t/9n/94//1skigBtD5zKVJaDQgsigPbIzDEMsl2Q2YqUfqpypGQTZsNFEJWhfjJ7WGe4y6MxG94mra91H7AXlD88fWS/m6GwkWMIbmLCMHl5IO7Fy1VgP4aMmXmMOf89rPBJI0hlH1+CwPfNl3Y13c3jVeQlW/xQAeUhr0UmY+09fOBE+UU/SNrlnmN8b/T4Qq+K1s5zzFI8u4qjEAvpvdMjhSHgNY9uBJPgQ7tuIaQF9LnjKSEclbfTbvmCOc5UfC+CANPxmU1i+611/rVIbndpm+3b//v0vvvjirQKIubrBHjx4EH1lf3z55Zdvm4fyxx9/fHFxcf/+fQDvvffes2fPmh/ja97nQiytEUYH7Uom8kJf31pfH7hcl1BM2+ylk6c1XJjBQVy1tEXtt1qGl81vUyccPBkHboeh1Xw52Tjj5K4LmNadrqY0vETKOXWs2wJj9G3Ey7benZtT9LdHJQmOdCyReqn07w2sgGVP//Ff89f+q3/3nzDwL7z/tyLPbQQ0vesMW+R8Xo2RBAnroCHPP83CnytJ8ciyBA+noxFMgrcRb3Ha43bo+dwT/2qopqb25cW3v8AgyGHtwwqHB4nyNGN06SVYkBe/TTo4It5g7B9I6MTnWz8Oh2Ru1WIClpHsCluvrljPsPzCDPA9/ZJDCu3R3LBys0aXbYAoeZj8Fnih3oXsPIhn3Ii6w9kzX9Jdm2PlOtimJ7hZHiI3r0DPY49fC1NUUcDBmj3UyLLRB5d5seDQ66HDAsV3JfkN9L8TQLwuhOfn5+uf8pYAxDdu3Pj888/v3r3bl/CPP/74tejD8cwH3TfB4z7OKH7DE9G+eBhhQ63SCiVt5gfYdcLaroWRJR2uOrPXWw3+jjwuJ3O1WGp4VrgTaI4QTx7EgW3VFOywWs5MWzi1ZQ2uUJVuzKO6Vyb1TlOqmsLKxCoDJQOJwfJQnd+tCoQNGFcD0gx2csUiNcSsZnCzckdXaIFaSyyuQSy5tc0lhD1mOgPlApYtPPEJMy39/Nb2cRYgMMNzW2DRyqW6IZBKaCFGdTBbrLUixSiyBMv8kNO8sVG3dhwH5phnjrKjZzfTycSgGIWSV+X58OTWaNMgi5uEo3AHSyZvRODg4kUtaXT6EfZCyYlLDHHbn7rOTcodZSlBCZ7gzWiiTyjuAKPwVVQfKOyw8UQtqdmpCCp3FrVCT/r3mehZVoe64UHshdiotEBGQjm+Yz6zsXpNqDzaUpdl/LqoLpm/mcrI30qI+ApCzRuWuzZXwXY8efJkvfR8/PHHb0nNjePevXsxjo0sWQA3b958pbls9852zAHZVLlARHRWi/Mto5g+3yzKjs2N1c4KxqruT+XGzgd70pqCoW6ogz18T48clT4gbm95z5E16TsGrqk4AoUDxrIEtMHxwQfUmFkXU3c+jR7SRoNnzEcOnUGz7LRtTovW3orwEU6g4QQuw1Cru7zW5X3VUlwDE2qkWyou8EpQ3kIAu5k5aun3neU987H2HvG5D/PapOVfymxzxzE1m0vB4Dsr5u+LDVmPFdoMH598k884Svzad6lEiWpWerrIXoM0VaLyjlTZN4muEwX1sEqWt2Io0VjzAIp52TXmFyoIL1sn1kIOVkJgzt5V68TYiVpk1DWOOm0zLMHJg+yo9CpIAYDDla+cP7BL4dLqMwoZHINe18ZF6FRODevhZEQy+7ED88BCYeP8vl2BNbNr9rrlk8I3VXPfldrvqtr+sI+bN29GO9zMJW/cuPH48ePXyt2N1bWfsvRPZSU/FvPD7NbRo5YlZ02u2oy+XHWjcJlmFvMESzKbitRSm7rG6kTPanARolscfTDklcovsNdBr/Lwl0yRWs1bES/UF15uiIOLCkq4GpnU5jbJiH1hUIUSv+XmTdVVeGVScoW6XRzFDBuVRp3EiOdWPyX6bHNRVBGPmhlGmcndxqzk3WhcIThxWwTIY77OZ5+yASdUXmuQffbFNhWIdxfnmWFHpVHtNlhvT9adYGl4y5xVUEh7K621F31uCbnY9cIlDHCERZ7b4uG4Our2jMdM7pivcRSYJgbx7KavDqhwMTwx4mfH8CDD5KC5zz3EWpkeZRHF17fP/QvaR99uYat8CNCq9+O8O7bc4dTTm/Q6Eu4GPGVgc1R6oXQGA5D0OhixgMxvxprxt6wHft3+d4gW9C1/Vw8fPnz+/PkC9r558+YvfvGLyMwJlc3rlUMgpqNj9TIPPWnxOUAnDkU3ggF6j6QCxTph1WRnKV0VhAxL8FcBamqbWhjEiTo4gVQt+RhiUm9D0Q6o1HIFrPoICGBiVqeBLH6yWzPS+gKrvRJ7blMr9XTSal47m5eNF6Gu5eqlWwDicDRfoJJHT/sSYF0v3NwN+WSAN53MNP97/sLTi4//EQD/1z/6k7/vn/ifmjkpd1Qxh2PC+KcmL1S87oGDWwH6Ay9WMixBVQKBzAXw1/GMIuA+r9v2Zc+qfqIQ67t5NZIXIpsuCxzqtLAlig427mwMtDHgiSPHwcoITnP+dYAsEZ1XpEja3K1tlkyemHMCgJlzZbnb2jqXoTZ7Bk/Me8s75uxVDlzZXg4eiq2ENvvM/rJViwnt4ZVKrNn2DWgDHkx5VnxZLaj5yLJLDAcNBw0lW7n+K8CsiR23o0MQzDrpuk1jA82nRjJqb+NOhTVmFREIj8vQqfEVNg3vjm/w+Oijjz799NPeIWExEH2tEeMPvu388ssv1/uGTz755M6dOxcXF1GUf40rxqpri4diz/yCOxYWgzcmr8HPmCM6smFnzQwhBqFzAmwpQ82D2ICdjZcTz2m2oc/iqDRU9u4OnngMuUAHiYbhT0GfK4SqM45Uqq6yM/HHov9xmLLtUkbxIDbfyF5rGzIZcu9B7LBUKsJJi4nN9jtZbmjnWKkx9Z3m2JCU9NKuk+Wi7Q/w3cawfUj0P/Vn/oU/9Wf+eQD/3D/09/7v/lt/76muq6K0MBsHeKr26/2FYjVfkuAro921Trk59Z/ycthZrtsUrl0P+4GrQQNyWEw0t0GbdUpK8IENEA8Ig0eluBlG2dEHpMN0R9dfuCK6BZ5efvtQdkRItTe7xvx1cWeOsj0x5a/Z8WsfcCKO1QFXOsp2zKnzQuTK0Ulz/l8gszvmRmbnWh11egM2geWcocOzoU4NyD0rTosFhFptK8pgZuiBodJb2igLVbtqq9neU6V4q79peSX+u/s1gd539fnXLLUXFxcXFxfrAvHkyZNnz5599NFHb8mprl0Nv3dF+YMPPrh161Zzf3plcwkt5lhnzKOSGpml26DaXKMTFmo5eIRzacGv97iEt+9B1vQQmkBSOpaWj03SjqoI7HXxAo4+aC7qVPXknUhIepVLVBa7o5LBcuTUwQjfrLxFcdhdCW153JDrhqutZm2h3PDqcdjog8FhJcfov/j//P3/wz/+jwL4V//uP/Hhg/8JqBDpTv1+wS6tOvtbVtrE2Pr5rgs5aMILXa8aHa0Fwakazpqo0VPltFm1AuKqcaRWlTzy6IZuO5BlRx92NmrCKvN8FFEI5llWWMzhdBGlbRmRsDmZsGAD7O1Y4MeSFWFHpTY42eyQl7wz0JVGpbCYGOrNeDYFMm8CQL23VbdLCSm5OSLBtqISQX7fcez8M9uWKWUHTV7CkGdCsii1udB4k8M7WR4X4caXSPs5skzKvJCIOZM2oW2bUewplm6b1ad0gvVjMzxWvOV18F7+FmK730n/O+CtIQVfXRRP/dMHH3zw67X0rFvS6JQyTIpcME3u5GGdp5mzQbLs82kpjPBKIi4Vqvcy58HTdfP1Drs9M4syXNFhByIfvaZ1x5RMNDhQvOcm+FE9oj1bEoPtMipVy9eyuJttp7FNrgt9C1qtYiyz8ImFfouf6GGsvrMxQQJ2lhPc6+XczI/2YrlQ4fQr9hlFUup1riujtyLHeb45Tjr3V3sfSi2OPhjblkMkOckw5mTw4FLtmJtrx2B59KJMKR0v9RKOigAvr1MNqUPZcqG1jsG9NSghD2Y7juFBHHfh3saDclaCw0tKbOWPT4y57SX3FUdvK6hYJahtPRMFXeUZaBGLwYFitSxsSUpZnDddc9ouJw+HGuEKo4aqRk8dNUxbJ9yYg6eAqWlDCWQwPIhVjC+tUenjczkgpQnU187cu7CMGHtsgV+oZ+sJOQVXDsVMyqSe08xfg9T07nid4+nTpy1I/datW1988cVPfvKTjz/++ObNm6EVffLkyWeffXZ+fv748eM34C/xySefvP01F8CNGzdOaWnfe++930QdrIUTC0veVNcVxv447BfGyMVqThQ7GwkPJ4EXGvoQmGBfCrpmxxcaAhKyDkHVrFuj19W+xrKx/aIE3zHnzg0ZFX3OsINilVYJMdP07HPWyxUViQSycmqWlgjeAVGloQmFbw2ID5bxus3qFfbLa8ytmJelGQIAcEDJYQtG7RlHM5+P60rhGyp8HxunM44ngm6mjUifxN2w3dYFLdbv/qetw4W62QAWLSJmc4LyCfrGALIs5mccB+Qor2fUL7W/xuMvtW/aHTKySRlBdmcc/yp260HryXCi7jjjSHhivs7RoB1y5RF73xbuWw/J4pLRQHafle+4hoXmk1UmnZ2TBgqfnT5P8ysnn2EZLphQNsB9FYuusk+qKf0eNzcImv93FjSn5R0bSmNt3SrLz7Q4gNYfshDcDMxBQTqziAfAKQnwqzwq745v6nj27NmzZ8/a/71z586HH3547969n/3sZzdv3rxx48bTp08vLi4+/fTTO3fuvDMg/maLckQPvdZPix01po53WvDPmOf6xLL27pgJndlxlF0iJct7y+qyrdbaOPZQWLfO9Avp0Ydk7qJoB09eBQSjp1EhnF8kwK9tfybZgSa73tkvuvShH0QFj3ixLVn0Sq1pPcJ2sAHuJTmmudJzk+myY+6doa6oEV2+6HwZ1Pz8hcUq7VcuZhKl1KQlAdcelEYkVSBgqz3U3nKYWwp0bTgmTWLlwGfdzBzEKMtAWEwUX8pO16ECQQLAKBuV8gY9eRYw2FbusaYKz02QmoDGcsDf4qh01OCzCakAwA1pxRKqt0F8OXvKsDMbXVOQFGcexrPvH5HG7ofGXVcMiGUZFjuQZjS8WaF+xCNnm5NoG7Vj/hpDtJBib8BFFWIZZ5y/sJUUI9zWiyX00oxh3nizoha1k69emAsRQGzRUTBrDdHJcu6VQYXAzmdi98UMpsQbZh/i9sgyUhnvPIjfxv53+K28YpNqZmIg0ndERIZzMVrU0ni+V9LR4ymxslzHasrZCqeqfejbNwfzXJmOrmcONX2NZkMLHYvJWLWvpcus563oNCTWoZwLIFg0L7zd2nholbxVT7tAf0srBS90IeYEH+ADvar/tLwY80LceenO4076c44LEK1SnU0W/H4Jd87jsPUyJX15eYg+E2qnlH1Dg8NuTWxet8lczpAGe7aXoK6hkRUkVwlarZLpbi+R6HvLEAbPyZxZERAxsMSyjeSO45HJy0ecNO/ZSF+kCZ98FDbumY23buZbntwEKDfRnGZoPLtiMdHfgQ4eZZlsHsT1Gaxwv/XGlxiKkkXTD6xmxKd2XcVNiYI2O3nlUi+FLol+Y3WYbj3to5+n5/Ag7vR3AVVo9vxOT3GCn1neKRuwY/ZJvndSMP7DLlHRIr75337//v21mX4Y9i2Ou3fvvkpu+Lvjm6jAAmfWwxWfnSFHFVRCl6jee1CE3fDRqC4fUkGdPavcw8Xj5t1jnmFwJstcEiGL3XDgoQNy5HjsMFoI9CEyPIg91ahMW/nVonpYjT6EPtc3mK1adKf1HHygAxphp1QerzLee5UXswgvFguU+lacxc2559jqDOPXJ7aRQRCOyhhGDQ4McCEfYZuTvFTiQDEqHbu9TfvozzjukY8c06wrm7qn6ROkc+mmV+60M46XGgbm6zjG6PF6oMNdJNGAsf7FG5KrV7uz+/+zr2TtNF3bRq/2Su+Z7rozjCO4Mx9dC+DCVzu6hsi6mGZYRE1M5lRhFx/Oogdu+96j0ijbtY2QkosNQT56oiltgLwbJ7Z1Qy7HwgQSfI95PJ2UwSAAHjCccdQq+jkekLneKCYQG/gRoJ2NY7YMe0c9+vaO8/PztVfho0ePHj16tH7l7/3e730vBqU/4GMOoU3o8I55sdNmXX57yLhDtcrPyeLBZ140MctZEEVHWZ+FM3qCqeSyzPR/pe3NL+9lCjvKPUXg2FFpDd1O3nTaWK8jkG1ZL7j4LagexIMVBcZ2CeCrFYmWmNfVfdWvp/bq0OmrW8uLNOVV0Y6wmGjqpZMRgq0Q5AIyWPEHuHL65p4IF8uvEJg9qSbvIhtSXvedwWPNC/Mi4YhBICnPdpVBYpcOJ4TtveVw0gjvY0+R3/Qqxbt434MHpTOaVwA9bvWBvuc4liji2XeRMmTR5BYQ7ahiMeHdYITANYx9xOvCMOU6x19qf2bHHfI1HhX8sBIcFRS0xsbtNcnlPlElOrtszINNno8bH+5iW7VD5pZ6bL5QyIA9fIeQw852ekPjGoYtjHjwgVCyMRgS/RY2jIlH2aXSXsnBHcYfUlWOQelmw/trex58J/3vbydAPD0txhLXGITHY7mN19OM9mWt4EXSayUxzbqe+c841CFY+Klv/orCvgyAmJnEmHdF7lF+/WSjHiuIUZj0mPN9+OQC3DrA+enLsienQrxD04lgvWUIqTmz9bY1JVvPmHfMO8tpAvWcsCYg4KlC06hFmhHJtFGgCxnZTEafekiCdJsxtSmVcdopu11p3tSryV54ajuFdiWLi4PCj5JsNNlXaSRZ5cYbrZTNg7kT8455z3yNR6OOGi5lA3NCHmdulouKr1/TaXbD9rlt2qbtiVqMU6z4TiVD1UcHol3uT0araQekHfIR6cQOqlw9q4ETFaPxBO0qRmx1pL12Otsxj+BB2+VfwCXSKAtCffFswUY+ct3RNjIj9swHQGKmhrjVO/rw3Am8b7m1Q65IN4MNbRThidqEp7+nR4Rr37p1a6HWfPLkyd27dxur6N69exFu9ibP7bVIwe+8Eb89VLh/Vgsllkhsqn9PXRZHz2ba21h8AyiWxai87IwjoT3G9W9p+2/OCiO39J6FSTEA13k8wzjAwxDJiB1yE6cnTl4EYRxvcINf4/FX2i/KjNdde1WMhltU6hccYpYv1nyTDTAiLCa4ThObd1ma3u7samtZYbn+INpEW1ULitNcy7lNRLlw3GLlgDD6QGW3FLbOyIRGGMJGnzb3E5yapSjBmifbkNNOI0x+bG4l1MIJDRowZuzWpzS9L2IoQUyuir93AaQwYFdpMonrXUC3wXoFh03WyhW/+gwjoERcw/i1dg42H4bYRS464G14oWRm8OgD7djOit3nCGCHvPkj+rDExFbLloFOy6i6jY3rDKJB4QOmM5sxu/c2ssdEfKgtZdFdYfbYTqeRZSNSOEfPScTBQmDzy+ZLNzV8Bw5/u8drjVffTHv87nhpXd7DD0hzWyFwksPCoOsYf8ld7xDTLCYWi+ym8qN/cteYYNSv3FFim8tq/XsElLEzC9wuhVHix5x2STGU3dmxh4MPGhw2asArLgbEIh9MQiTHELa5GO44HjScWpAW33Kc2QHHSsh+mZ058pdouFrQ8Sqj4NqgwUI0GSPA2Tn4QBvX/V+LadHSh5C1AUwAaF5S9WSCqbKPBVM0bScB87VlIUakJGVPk01EvQ7ZU1qJXSrobw5z2UHDiOSzvQxP97cFixfDzkgNXfHJgkNGLtTP/TXpKYOCZaUsC/vHyznC1vi5FRE+fq1+l6LrPP5K+1SJRwM1UAOU53kPWiViqXheMyMpohMrV1enNi/dVqeE1Nk4aIj2fOWeoQRcwzjSErWj99PlPcevuW8Sgpgr1IexyxVkD7xEDpNFcL0z/WC0Pc+fP799+/azZ88WcaZPnz69e/duZLcGRPtmAmZ+k/73txMg5lThOIYvz475iHSclUn2vBQUmV3XC0QRc1YFDldJb/36PoF2R09t81+9gHuk1YNHk6iIL0M1Yi+WFGLJTlUTQiJ6TjVD1I7k3OsHx3km3qKP3sIqhXXs+3K9DTPB4k2zow/wHfMIq81JeS+b24W25Lknq+HXmn51lwXTNQgheRgsd4iwzJzQelxYjJjn76+Larcu8n1rVV2908FyFpu6oxm0n0S/mxNSL6Ys0mOqF7NQCcU3oznw7ug75r2NP7KjBJFnzDuOOxtGeeTC9x9PdFyku6PvvqTXeDz6XVFinhzrOZ+RC5DJ4eZRDKwG+xAYbLScamID6x5im2lUPUM0MO8KOWji8aX6Jz6qrO1o8ZYRV7e2zrkdUoDUzbUqyw5KWZZLrgWtTaRhqSijXbIzjiJz3qXiQaytp7zRD5GgAfnMxoG+Zz7CjMWG2GvreyUQ8H2qiC2yrD+ePn16+/btGzdu3Lt373d+53e++uqrR48ePXv27PPPP3+Tp/e6Wd7vjm/jSHCbqz0aS7cZTZBLu7QOsFOMf6zSWhOneI2+gHbkYgHcc8yqUVfipXZYGOqhGLBFAOYlBquW+lXaOrVTzZH2GsejkhU3WxG4zvEF0gzEKkWZWSnZWE1j4bBL36lg30dyBuYa/czGo1L4LBu05whuWEd1yhv2AKXRB/qoLckssF/Jbhb+d3nlQdyKUYJ3uSuTSeUKRaw+lfDBfIhoO8oq9cWqr59OdHGdOngSIFnx4PLeKa/95j1zTIvDnCRBZ1W8iU72cQ3HA4ZrPAZH2KiMDUC2mlzHh3uyE9+QOp0oqQl+DaNR1zEONdIwHEsEvNBufRXObMTys5hvzgQpNUOGdv8n03Uc4DtIZnIslc5HT1adtfufrPnW9xVzkMLSKp6Uefc+m3xgmoVwK1Ax7Lx9gF/iDPNzXkTflM8ILiTMDIj10r3NOyHrt3fcuXPndV0O3h3feTPcL8EhsDBgMU8hi8g0FKJfY7d4cptpQbHdX/V3i+jRTeQ08t8EHDyprHChQ4cLapaPK2tE10SQaoF1zQVCy8WkkIaaccHpSyN2uTGh4h9huTKRXdz0ICa3zRIFHHz4kV12F479Itm5q06OWA47eII4zgwxVvSpzZZ1wuWZYUcfxqI31aaew+YhddXKdrZ0ek3xKSfpCRAtq+WkeXBaoXb9esK4SiRd9OB9Ql0t+loX2expy04aJcYwaOlIoczOzVk3eMRdx73+0MPTOW62uKCBjGcM6Miz8/stHbaC/uItZ9gIZrAfg5xhtG6nFpf6RzyukBUN8MYMa0pcCULanIhMX/TikCmggvXL4bYtQx7VZVHOIfl+bhGSLAoqCFU7mYZrDOZkz1eYoTYNSKpPdMqyg4a9jzAk+A/GYqJnRC2+/vTp048//vjWrVsR9P3gwYNfL8TljfW/v80M4vJUJJb1I/j8DCS2oYehL6ys1qVyrWHEgGzDBu0KrkVzeee0TS+IWGIsDZkwC6+AlijqJjHRmvkRJ3IxC5/VrVXQWO8Svb5AeW49pNNTSLmxZ7hqJWlRb9PjCXnPfMaxZqnJwsVfy6RpbXRZbA1hb+0n0ZHmzs6lvidmKwnjbX8j0tl8IsKZd9LJzkt5rPnNkSIbUpHY6hTJGSXXtLRh9MgZ861c3dl3mqbYzy5VpUbEEkVOoqEYEU5X1eCJ2HE8Y76GMYhUo9mZj5fMiT5SK2elkp5XrST1yuDw6XdRRxEbAwYnkgcHPDaJhU5e6lykISHDjrOApu1dYhT2SAeKzjPA1p1ydfwUgAOGvUadGtJPQyD3E3KqcEo6KDnsoOHoyYGsRGaoSI2uU0EfflHz64zegyZEyYpn98AHmLJj3iMfNVRHaVQUTNSrrBJbH4LjhG34r7H+fZMVsZkcLb4O4PPPP29z1Nu3b58Krnl3/PA70Rm4ox1zmMifMX/NnS2nekEUHY9dZo6VEZ3WoW0GnQXkB7/OLNGNBx9Yve8blung0XeJ46JJjsezViNZ2zRTu8liIl/DOMIukRL9GsZ99WrcFOh1LU3fu8LBg6eAfQ1+zY4vfMc5IG7wHZ3wg5KdfIhjv7Lt/rN+4jWXGba+ndQ1jCMZBlI2Fw0ZdGZHuOYexLpW8/2ugB6Kpx61CGlJ8AUzaz6QLtuVTaR136x1NSPy9H+J87xeX9lygYw4w3ipYQe/jnGA59rqdBS1CAn0KD2LWNQ1IqAlULI8Qk1FyiZF13SDLSLKrdpebwLT7DZe1aiXLnM3JwaOmDJnevPE1tnaiBRl0ZeOLqvxg1ZQ7+nSwe3PX1eXucagH+CRR1e8TjYApuVpGJE1c53my37dK4PeC+Dq3fL97vhhHju4zZfQXrtTA3ki9nOaH5m0R34B7SwP8EQ/at9+ZnaOndGE5qSlzWP0lMwdFuW+iUdr52s62ZfFa6wa5pIkiNGbxcTSrliKPUB6tYVgKpejJwVBUnb0tDO8Cqq1SFtdFyz0QURc7G0C1U2LRdplGYnwSlPiS9cwwXLxfzi5Qs4960tcWyAPkGC5MyNZmsnLTQxvh0niXPwlnEgTGN5W8h7wzUXsu3G4JyuJu+XFR0+Dje3bHcxi0FEvNYyyogzOaW3UvCYAdslRJCQF7s/54ESbVW0xeRDpYUAsyzLvI5fn7+4My+lvHNc57pB/xGMWX2AYmIfCkZt+rU+x8IutYGwybVQ8TWV7MHlcb5W/PqQu7kDNpzjBuEoVvYnw3mpfjj1HUjUxDwsNgdehyMGHEl0oSiThsgDTkzzr9dS0ITf4BpqSb5qadX5+fnFxcePGjUVH/OjRo6dPn965c6dRhm/evPn+++/fvXv3be6Ff3s9iOcK8bB48dT1PwCCqjIDdddb4DDNdRJc0XObEL4YEOfORAZbWdwsA6+g4mZBlxgwSTaK6buvWK7FzXYDntZ6jz7/RrsKOxQxaeE3lpdp/syCb+45BvNlVBqQR4VT+8sg1Fk1vbIVYWHyBgbXyFCkBhtrpUGf3teu7UlA0g1gmM3WaPrNZiYYoF45Z5Gf5iOsMMFPGdvOLDCJbGCqNsQFM41kwtbcxi8a6HvLoxTI+445CE0H2p77QFiKlWHbKbDgmKolJDH7K3renlaQcurntcDMQUEGWg1fa2c+1lwCxe7koHTGMVeaADfbxao9R3cpUscjti4NY+s8Ra6oUOvbvsweuNxlili7YEMGj0e44xJGspYfw4O0TSS6bWWih6XUQHehCdLFX5/JNE0a3o7j0aNHFxcX9+7dW/gMPn369OnTp80IP46PPvooHPHfZFG8f/9+0/W89Hj48OEbyKl7d7SyW0Lq5iQTzliBwBxW29uYOHP7JXTG0aru0YpUX3sbsUKOtpaOZgijjNySQmPN2SPvmWNRqbYSEeBNi/EVnYKv2iZ1KsjsKTxzgiQVC0wgYkYQumbHWGaDQWPtmjBWpW125Cg70evpVeZBM+rQ9IvQQfBxBcYDhljQJosJqiEIa0JoZ1JZTGb3yM1Wov9kt0C7RvtaOEjoDL6jH+Zhe1oCjuotrbkCPgy6xuMenqhULar6OzCGCjv4jh6c8c1rqO6NSiC1R95hMxpei72lFVfijW1CXPmzqvmNoYXmj0bZuwlRVcPok4UxECIVbu55Iqy4WKuJXJLpT+3vXnJ7rQm8C5+1EKK+0LA1yVBCiHL6p6a/ydMRVobz8wvVkTI2UxyXv2vP/Nr1U7D8jnb8qu3xZ5999oov/vnPf/6ObvwWVOHZkxh/OUNOvVkq22SxCwBgJG1gz+xz8Ww8vwlKzK/8kFVCLnvhPI4+HJW8mivO1o269h998N5iscDEGpUGjp2/ROP1EhseDuszImfsItTsu4J++sti4gqaWTx8pzNf+ClLDMpt12BTL63dYkZy1yt+wpFaliMJJhi7XHR+Exi6x5ixq1D44LD6bz5Luo1qUy4DpSRZaJs9PIhhU777HI7Isarj5fEK5aetbS66S+GwXGBiBkCsRUhdA14a+JXGOrYvvyWXKUhYTLBp1NjtMl6GxE8Acf+hF/pw707Fk9OIaIGNGuQxfXGBSN5ogrIRac9jP1wuZHM3kiEb8gIKLSs1oFEJQEiIAkupYq7W0rPdhEOFHQicYdyHQG1iEGvOfEcLJ9SMzj+bnsfEwsFRNtAc9uoUNgrm/IaYUt9kZX/69On9+/fv3Lnz7Nmzhe1vlMWPPvqofeW999774IMP3gBf6jfpf4ff5sLYqJphjHCUHZBaCrn60REXE4du4JdBp5JIziels64nDIiPUxYnHZExqlUjEUirAlRKdLbY0BYL1hJCubVLR8/tnW2mt/goXT4Bl2uo2livp1Avf4zCqi9EizvmISLRKQEGt7o6nN7BN+yRAF/mzVpsakv0Db1/81dMdKvX+wLfRBUNT0BBDLg2cGnKoGGasipW2B1ygKAHJr4Mfp2C2TSzs+iJwzvma8wH2NcRdxYWExx/xOMAmfxrpL2NO8+peR+vxJ3GHLWzCDz1eovj4t8qfbiRezjfR1mNtQ36sFKlD08e2aDAUXaJ4ahTF2pKnrFCoFaCkpYAcfuZm6nopxra+G+kO3rZ503fOnpqm79FZd1bPjgEGhm2Lbvml1oACy1a5ZJFi3zGTCjRQmfNJTFO319nxKiIEVO+AIgvLi4A/OxnP+u/GIUw/ulNnuTapP/UsUmFfnd8A/VWyzlQWDZZdUE1Tqv3jhmCQUbsEY5+BVazaglUA7hwjeO0eHIRraNw6uesEeV61SGwg++RnWxBbbsaLxaON0cko0/uE/D2mKNwrNxmdFCqmdqTEERzzDyF+v9GClyC/7I6Mic6wL2Ntu5P1BbAlywf82HZhrlTE5z2Uv1rGIXdjl4UQAoWia/ORFy1H/0LDD6w+jVrtkEZZsMutoxCFRWq2XwaVnyi5fsobVjrGdutxvDKwMY8M4oLdhiv4TjQr+P4S+2uczyUCJpWfdSAXZ5s15tFIytovvFxJCoB1zEm9jGA3uarmIet9fD6lZ8sHYbYDZILaD68AtvGbm0l7OAyxW9ei7REOoZEx8rUuLSI7OWrrSdUDG8m+v8qHmoI840V9X51tu1i5uvAUZbLoz1Lrbx6ZxMpke+Ob+lYN8ZXHD/96U/fXbG3ByYumZbBXaL2yLmbx6jGbO6YCe2BEbZnHmWY/IIW0z5dDXGuEM/Gb208qqa1Na0mpAKGMrhlYVCJUgKVlUBJHDEk5mIup3TGEXNUt4Gz4W6XJ+KzyEyq2BZ17Y7LXEkwybfc/zdW6XlTpZOvIaYpWLGg3MjTczcANK9DQfynf/nL+Kc//NFfi40l3eTmsAw7Ko1K66LZoIk4DytlqaLhVT3MzvFyYlYVuJmyUaITHjTwiQzN7W5YbHYTL5sfLNF8zTyIGfD3KDtqyJF73yAFCdMcnes+Md7jKNtDgO15dLEWl6hrspcx2wDADSbBXJZhucDfWgRBnWLyAvgRx19p19DYAT7QB2YnKUi8xNA7qMz31EWSHneI07an7LUfH5UI7QwG7RGkhbLnUTfbiITkulFXbAIHuNe4VxJ75q8ZzhjSZOJMl6WU4bPzbCeZxaPSIDvKdqf1Ad+j4+7duzdu3Hj48OHacTEg2gX36Mc//nFk1n2rAPFv0v/+VofUBW1Bk4/hxPJYUna0TGNp2hWKJihTFDvBY5CKsTbw7SoTsAxuNxY14gDfw72QdGqlnHkO8iSfZV6NWp8T8NyiJAf/WZ33gzZISdMIqE0Q6Z2lXLFi9IHFZSLqcWVP4xWGPQENS90Of51CVoZHlNETfWDug8KSuct8axRFNvFO19XO0tonhPpUya9j8xMc28lm+GS6LJ2y6RwkzgOLVJPiW9MVQep5z/EM+RqywZ28zjEIxRWHXQfRxhAy++Rb9Irr75wKMBdCDZbHPr9UFZYHEebC1eUkPCIS/GuIhBwOjqVkUqutUnsGY9gQubFRcqyANQWLSVfaZSzmmVrZL6LkVKCyEgpM7LXijp4Gy/P4IwDa2yhxFAfTrkvTArUYJ0SrvIPIkUgD8kA/yIzFRjl3kwzi+2qL+Pz584g9/fjjj9cjyr/0l/4StoJo3nvvvch4fWMZNQ8fPnx12Pcdffhb7EHnz6mVOd8k6s8LXzOWpwma1kPSVZuPMxsvfSALAlWhZ2+WFO0vCyCyltT5+RQAS3tkgy6RSoo0PJQiO/i+gMK4xpzBa8ixRv2I4y+1s+W8KjbjdE8pZXSmfv2iav1siRroZ8wHDgka4Am6nCcIzbumMm6aPOLrEtSmhtE42UuWzYK/J2qPnFqlq3LDsEIe4H/H7//b8S3/9o/fX6+9O2Zi30yUDH7GokG2aZNwHGWHuWuttIatucYvAuMzaYd8QNoMhzPgGsZfYgDS6p90jWO4Bw4RQAc5dJ3jr7SzOnVg530/lAHyS/pDXulvWy0mgpyVryPn4tFRdLIloa7ew9c4fq2BwDUeq3a7J892I1ItZx7VR9LPYnu6dT5HH4walfXSB3W2PeOVYwghUj2UVlK2JW4bEu8KqS8LqOMqiwmWO82znESCV/uvxbREp3YI75LqvqXjzp0770LqvoeVWXvkSxihsyo3tCpm6V2PrnGSNcSEL2Z4Iga6z4UdWxC0TrEhRk9mclHCWJ3oGutQG+urEkebiIkxXi4Se8GzDyVLrY+8q3HZ1bRhkhOdOGlxlXUSncLoZmZ1+vvyayzwUonAnuOp9WfRXTrsqKG4KIjZTYC7SRYpNc2m+e/6i38xvuXPv/+3bb0JhMA0MDsBWcmBHUZu2BCruQIG8Ipt7GKr4okOo9cUtTBqyqSgYcvatsM0To8NGLE6ixupjSIuNXhlc2clF93beLduhhybxKHguzUTj6iXhTnUkQqsMuMWwG4whRf3S0W9i1E1wKAPB/02gyNwtsywmb7/Oo87+HUeXfyau0Qf4CPd4NPedTl4mN3J7X4rwVTzh9C6MUWjphlc4J7jwB3KRpL99D3SpK9hzDCjB+rSTDNKTkb3sbo4emKYtS71sqzoh3mw4JX9RN7j9+gIou6XX365zjnfRIfbV37/93//re1/h9/iooj6zE9b6gTnpBDsNTfqHOtXiGWGG+izPjRUCZxvuCNtc23j3dMPraKfiS6ZNclJwYgNIsxX0s66gZ47BQfbkUQHDbeWzNCsdlbLtHzmX+dtKCemHN4+/W58RnQdytBVAi+RqA5LxlbYziyqtXUCm2kG04UKT4ZusqdwJfapFlVWWQ8PlKtUoeFwaPASUioWL90Vg7iYWtjq/EPOGf9lTzA/7T8tVCVopZiViQXLfL7zjFeMEDuLCSdwSbvGcccxsVB0w5x6CggqnSFTIVudyqXnqQZxfatbNJxrNrIbzCshGsVEG37GsXF8AI6yoxI5bu05xDB4oQfKkODgFLGaCjrsQ+cDHveJLWMPy9Xb0QXMJiLqXVci8pUZdvA0imPX1urUZSEST8i9u9LMLnqrMYgD62ksqh9Aj/rgwYOnT5/+4he/WFdEAOHT/zYAxO8w37fnWGGjbvBrGL/GzqjFbI+FklAnbizecqjpnQZcs3HuTRG71SxZBi8xDPADjQybpmYSrq3BkoYgCwdnpEyJuWfeoVlM+BlyBi+R0hSe6XXFdi6zX5oxHMliazNviriwt2OPnqMsF31e34xEHL3fxvKuhbXOdqrJVuJ8HdGVHxIXbY98QOp1x3PruumLDZhO8GvMAbLv4XvkEbZHPiIVNnF9pbYUtdHQpq6kWufLb9SZ8i9PBqrIoN4Dor+w1zkC2CE3AntnB1xIMZENe8YxwXfwofXMK/0M5hdWwEEpHCriK/FDBk7KGE5ceHlFhH+pPdu9XX7Nxn6jN6queVCzMTOgOOcXGHgSJy0d9dynZXmTNAB6VFInWZMWvCTMDWHab9U2jrwhKYtBuJ8xj+AaOFjbwsQO0MGC6bM4Zb4zg/gOj/fee+8d7Ps9bYfrljUWbQ+fpWo74IAZvW1cU8GUhya47b3UXwXrGT01E9XsqaJFNidCTTCiwnxR3GxdJgNGTZGY7paqd+1Bw55HzME1r/ThU3BtmBn21clhXj0e/eXMaM2a3BUesGnU01/DHqJ3WLtikrmnZIXL+/J9lwKoCLMLXhFKQ+oM2VpE/CSRWTjtc0qBm7QiJlnpsMv8t3aimvlBZaWs1OSoQcpOXXiQujMnt69ps/vwauwwyo4+5MZfzqxTiat2pEE/L3EywhFDYjBkc9tODPDrHA/zkfOcqMcG1DhSRtOKld3UGcahipj77doqebXwFEUkeZCIk7wTngZfH43VxG7jEzwtUl5FvVsWEx34LtRPqGbkdLdmPzaIHWmI2oeovPMf2yxcamJkMwf39uzkSkQON4zRB7fsZBa/14X7yZMnjx49igC69b8GPrtuk+Mr37Zo9Tfpf3+bAWLtMRrgNW7lILusFgHxBBa7WK/prPXZ7Amn4ZZtgHu3v54LQfuNeEg5TrkoRJ0eoIF5QBZpVbSo3gNq5dk/f0EvKxWJsDk/njJbkr1ac0/0s9ZWaRncDSVqT98zR3bNpZKDBrMiXCJrn4+rQk+o9d/aamwllMWoxLxjvvGrvxr//Ff/2h8N9FHVJGT2Qcw7hwW+5+TcYmITQUjMZO+DVx8hjhkpIR8jiPxKnk1lTTGMNySru5+y3Hb6UyRoxxzh7JFQdx3HPXyAv2A647inpzKXWNosJGYz5W4T9tpIzup5qW4eMzrelOU4xbOq9sMFVma3zwuVE+ZgRxiGNHiiB1ibs8ROagagrbwKHJCdPCitdo0q7v59We1upkg2OHhycNTgK1+wBXoemuX2IMdffDkerUhEGSfkHREZTb+qBsS9iucUbP/KH8vrHZf/x/+x/7v/VvlJf/nf+k1+1MXFRVTEd/Dru+PVj1GWaeHYsCszIZHF3HbPPD1fVHShR6SzImsdW0HsupMVvtmhq9cwCsUhXsIl0p55M/u7PcX7JkkpPAo1i4kDUvzY8JNqSW5DzUP7GmnGPKk9DED3VEx759bnRENje+xPYS4f7+WsMH1e4+FvvyC/2vrfhbMVZ4ZFfFng1KmbkSf4dY4uvkBauwOykUPLbKyOx8oitgYTF4ql9R4pPBnQ/Gqd24siy9Y2+Lm6jnGsAUqdm0dh8ibosq3wk755uv6pluPa3PNUzHr83qPsiLhHULy2qtf2Gcahu2+t2wgZEGfLrsQEX68neXWsLcXd5W6j0pByOysWV+tNBVY3WZgnJL/MywJXU70ieZXd8KXgNdTmUza///ubTfOg9Rmivc4GmPuigq9QI98hyO+Od8eph4JlpcrWsS7CkOcFUiz7A/yAYaDvmQ8a5iOzk4Vq1nLJ+sZE1frJl0pzdjxWXvEYdzwb1nQfTsGwguZurQ0d1iv47M2QaMEVlqmUbOGM3F614xgOWt3OJy1+8AnC8mQCMMXqitkN87FZ839wpVdZ1SL84CjLSFmJJ2S9TakT6es+OcmuXugs3cyUnMfKUipUNjrp1AxhZ1ZPkgtsN813ibO+1d3MvDrmz4YQNTMGLnh1/vW2B1xuITau0kFDZM+MSpY8lcrILB49Vfqg2yonI8siGc/nmlrJJhvienGiKC+O6zwC+Fq7xROUCuEZA3yAD8hp7l3ZTJMjZf1scvouW+MIDPQTQQ7rDTPnBonx14OGPqareBBz3PtuYK5GJbMf9f9n71+DLsvS9CDsed61z/myRgJyQNIIhJhskCwMM+qa4I7DdBYQkv3HXW3ACBnTVfYPXyDclREm/LMqHfYP2wFVFTYOIjBRWSbCgfGlsv/YAQR0DhdjLEznjCwhhWakbDOENSMI56CZqfzOXut9/ONda+2199nny6y+TXXXtyOjO+vL853LPnuvd73P+1wOjNCphbIQ4Pvw4IX/4MZwxJ40OTJ/WJV57IL9V/7MS5Hfmx9w7969u3fvfu1rX3v99dd7AN2PzWH4oh5x+91hvkIJTGpi7WFWbdE65mojVqVgCnd0mHMzUuwDopOnnUJ85pbWcaWQFRxRurV5d5norZzOa0x1guIq3nFlrx5r9rrn+kyUi+aLNFgGL88cwXpXKLGu3WEO7oy9bMvexr/xEYAuFVpm0ZGguvyG0Sd6ov+hP/8sfvRn/8Z7K4r32NZtX691IMW2EqIqq+XuFcMloW4MvscUWqcbA1JGjLjqS5rfMVqSmy3EYT+gHJkr/crKkfmK5Q78NZQ7KHeQ7yAfq8XE9rLrSqVkhZ8dU7wUiHQutlomIt1QsV7DnljtILqvdc0ObhvK3ea1RwyFQ0WDe6r9mVUz4uWy1tnTDN5SvFkQWzMxhkmElp0OvOp2678EIboG00EGv2Ie8KyR37dwh19j/gnOrzEHRGJcAO5FncTPgPtSSOW7/6Nf+bPlz/2J+KNP//LuS7zxxhu88XjjjTeePXv29ttv379//0eiIsYnikr/0k/36m5Nt8d3NXfqPad6mFhHdcMswkYZRAzA4i+sq8zR5rSwXHcAYqyrbOe6ajXZ3OyENKEcUfr9mxrT84gSN/tPcD40PXuDDr26BwzmyFuVuyAlDD5RIxWn+wtzvTuo/gYsd5AjCo/7dbPyiLNs1ibGZ+kzi+xc+I8zJ4d2opZKtHnCaWAQR04g+ZINRGy0NoPMEQYdKsmGOLbdHYVaMxwwbgAjuruFLRFDQ3UHwmE5Vu+0Co5b0MZ+AUwrG/2LPXXfTmlBt7k5dSlk2o0IZ3ut2h1ka4JY2xK0+73jLTWxw6bD8J6bfm+7z+xZ9kNfqu8aUx1jilcXw2pLoiuWS6+S4K8hHwfAYo/qDgEnpHmAEtIwUDkHi8+PA7+b7RAE8+/Dny/C8d5775GMXUH8/Ybjx6+d/hHs/8cFcFk3GqtjJWxd7q9WRWOrf2S2ZZndN5HY3s7Dfxe32NQHRjwP6V7xsCAkys9zZbflo8NS7qnW3P03Q63RYULpptCremZCBOlLSvwmxeRiD6UtPWVnUWVrfCv9GZY9ASjO4tMukF2BwpsrsFvXqgYuv4f2XvyuWkjdlj0zYBFDuE5lrSb31Fw6SYeVNUGrlaEs0xlbLHs6m2qzT0NdPC8ToaQpsIKUfdKYlaDa5p9feMNn6X4atqDYo8yFXdSLgcHMhX0cT18iMN7ifbp4QsrrlPTNJMaGK/Q1zvEnXK3uICeGgLh6LeKMXa5hT6tBQtMzqzZWxdxDYY0a4W+uQuCHG6Tte6cq3fYRGbiycmUlVQR/4UD0AcMZ5QCCFZ9cyQV/Se7U2f31PRRif4UueGwebz4ePXoUjsOffPLJpSe5xBS+xCz+/PS/X2gP4hASNptXn6DEw+haBAzx0dXQrUvk2p1aQNEccu32StrzbvPWK7IKGdC9IQw+sVRqFTS1hNAFz5VJ3rDFipFpFUFdVSQcJIrhNVE2qSTVsKLcfHsO/Na6EpqjGNqr94GdHypw5gCulQSLMeJyFs9tOroCRQn0xXWBo6HzSqxDNl9ay//GH/l7/tSX/+CXfuk/+b/9XX/3hJ6m23050I0s9wMCyrqj7ytsjCs1vLRkVlfSzmQ5WB6asTMyr/Y8EtcP76u80UNiQ+DAmppYE5zghyZ0jeikOyxXLEfmiFY4b+bi2q42DR3WjyQlc/eb2DYEDswnTHq5E0LQh8nqGMrWDFd49FrWtwajplU3wecrFRm56v2CzzXck1u/Qm7lv+023rochsZ2BF6YZYkxzKHDTkreSFGdw1hAsIuddSCybI8Y1fPZ/Q5LllUOXXOZGHePrz6i4RjW89mP3/k/+Bf73//yP/ffLr/8H5w/5utf//rN6TH37t179OjR8+fP792713u8cBx+9uzZe++9d+/evbfeeusrX/nKkydPnjx5shHdRAV6dafC2+PH5phYsNLjda0AY5MaLj1XzNc+NRk+jijXSBxmcoaVzcsdZq4nNHszp7WwbujQNOyAD3BfxnVT2AAl+gEF4AwzuAGqgBeu4McAELtEpvV410qNZ9SdGNS94QYgGBuLCWwtJjBYTJyhz6vSeIMLLiVpnR+kLZossId/b4E2Ng/if/Wf+iP/36e/9Ct/4Pf+2t/0e7B9zPi/6raVqdk3f7oGQ88NEPubm5Wy7KAxprvu1ib44Pu4xQPZWA9rTazGt3oHJVET/A7KXu2oZ+AAv8M5ek0NjdNeg3pzoeTah0RYAOgeUofei5qIxe5T5LgNXUL22MacEWS09mhUa27FvYKbfTKTgl9Pt6YQ9legXF0CUHhmibjebGsvP1b9Uu8k5aVdh2VZmBuOIQEV7YUXoGp+uQ2pwwWC3it9XWc19/sUmH573B6fvy54Z+cMAFfIqh41i0N985fwKyDDwntU2Prbv8xigucPLkpwyWzU9wicfSpIuhg+ve6yI3KcJeodAPcE2/gX9caZr7DObRzSa9sekWjWrYBecdCEy1mn63meFsgbo2alB3z10VVxAviX3/gj/4+f+Zk//OyX/69/59976VQHs/UsW2VnZtBPtKuxUAVunB7OuWU1d922hsbYV0xXZrSSK+Hm84I6Yh++hdVE2QejCYnuPW7t/MTv4PLFrXiKTxkOJV4/SMEwfXyFilj3NYHFFwSDmHE32YW0vteYg0TcL/EJfoWiziCmp3XOzd4EvdHkA3M2bxfqFoogNpn2NaTOq1PIklO32lFQiX6F7DCL7ZwVNQu4I7M3s+yhUoeLi2VPo2GIhqlTxGIFYdxeuQ+OivxdF+W/YuiCf+N/89/Jv/Qnbnjwt771rZuf7d69ew8fPrx79+7bb7/dfximww8ePIjMulDZnuf0xE++/OUvf35bti9yRezgp7XN8bZN2/5OkzWMAokOZMZPbGW+xiYm9zU+WQOyZKjK+tKtvBMj3VsEp6WvYNg49KcNsFYDerua6Q29cfw9UV4V+mcNzpkScP0ADRGuGvzp1FzdFf4SCYrg7DifRyKLoT2sUz4ahURkbWDUVY/pzYt9aFeaZ2w8TU03cgN+7af+6l/7qb/alX7t9/41k3te5K5rNUoN3NmjzDvoJAnBGTaYJnnkDKbaHFY2a6IfrIS6ZHPKDlbMAdqZ/nSvd3LACCWXuRr1XBVfSJ2Iysjl9UQFrWyCCzjCjzFFwErRPJQpP1g5eTL4KP0Mlnu7LG3vS6hITZQSP9sHsC/SGlRcQ6PeopY0Jjy4mJlm+ZHZZaVH4q5rFYe+tzO9x+j5lhq01JscDH7RiMG6Qa1njlt7e+OXOoOsv7j+dA1NkFxjNFCLsxAmhgRvybdlNZRcuH4rTnEN41rJlCQI+rxpXt96662XPiZw4UePHm1+/uzZs4cPH96/f/+tt94KL8IAjscH4IeeTjPW+JfW+9vjB3bIZQ4SSs3nYTCo264yamWnTVNqcs5EnbTggGj3YODIBZaaUWqC59jO0hP77pxn2wAqIDzWZ4vSEySOmWkpsBWw9gLOsALra2iknK1sE9TMhbkO44xK1iJql6FrfekaERNnposYqmF+zLS4VN8ikpUYkbaUJRuw0WF3AxEeS9/o5BA86AN9liYovPmlwKmrkT2hX/0DP/WXfuPX/+Lrf/1JVwNuS5OO1jHNWPk7iWinuY88wHDdcQR9oS3aNQ03kTfHorUBOWVD1c+wQ2XpSqArIAIF9J9QIlgJXDnwTigGO9AnqpZgrrBmMQz1uHjtgaUO+Km1n++633a2qIAruEFX8Ayy2kowy67h7Qu1AwqWnZuG6hN07NUVTLBocmVIRsfCCiwTLG4Tjwu1l1pCqhKWuOBiD2lUiH8DFyhnRh9SvMsYWqwSEWNEPD6YRIEdsJKzOdI6lbmeYVX3klJEQFP9LUHKMIcRnZpkJabO9PgCtZACOM6GtUyDthOj25C6H9Dx3nvv9Znx+Pfb4/Ncl7HX/jVekgPsK2plMqonx9bCfuRooRBWBik4SVjxFi9EfSrapM5vrS1L9fkVFooIz56n7aCNWobIYRmvRGbUBbAuRPHGtHo/rT/VmalR1Y7YwIi0BbBeg3RabXWqN7o3ROxAP7XmOw2jLo8mK577zMm9ocPe8fHeuDWlMAH8x7/7p37l9/zuBPzHv+enzgaC7AU36ktgqZNtRwIldiw73h3oVscC3JspZZj8orHR0rl3Fymy9KZokT5Lu2miOnNukpostb9Zd1jrshwmlGpBH9loSup1WyNZriEnbcMZtfJg+bqkuAfiup1QjEmMMQCxo0S+lObQUt/qpWu9IBoXsLyIsfcoYqJiK2hQFpeUmobrNGmdTy2xoNttW9uWahsHgHHEXzcqYs38YJy8hdDYs3xQAajqnMLhRLG5ZEiYqCQ3KeDzhkmLq6wjCnBZYrkBgevKeH1GBvEP7XgVJtOrPOb1119/+vTp06dPR0vGiKf7QZs0fi/9r32R62IndERT8QLTSWmWabOZZNWYVXy2Z6oOfrrVQD/1BS5anQZ3giefTj751tF83GH3LqL5A8CPqxFWA9TM8eqoEpfVv6w+2jiNw02RaufPRpRKhqwu/sEBmdY5fdqzrrsQgKZN/+ywUZXABekVKRomlokF0E/96n/2h3/xz/6BP///+Wt/7S8116d4jHeyJRHiFFuxTEqdMUYz6zaEE6pP5AL7lFXX4yrXiRQ129YJ4SxIqK1+8B2RIesQFSFIsQgw7FM4P0tyL7AMm2EzOCNlpC5yGQeJIKzB6EZP5qRs8UAZ2Eg7Lg8L+dr3F+51jE0VG6m7V3UOnYAi+pKmGtZOdgpu3QqQ1d5Tb15jOQ9taqJGNeKMlJuzVTTwVq9MHFgMiqbXB1GYb6n9mpoElXSDH630UWoZxhWjObJBV8xHC8q/G7WK3Vlf9r32nw/Df+T6QK2PKDz379/vf3/zzTcBPH78eFTWBKYc/3R7fNHmsnEjZ1UJIQfDuyVZBpiVKvOCEfk1rVahzhbkmPfNE1Lc49fNxKaBTDxhYuXAlqWacChHhNNOskB+4+UyUm6sqfEOnWHlTDBwjWl3m6szVZ8GErFj1TqfIoN7Rd7l6mNfMOp1UDf038O4ug+6YiU8KRXY0K0RwJElcQgcAAAW2bUOGfa7f+lX/5pf+kt/7dNfufrN61V1bnDqOCErsGtNRRVt5KURNCL4e1eJUdvUrvrsxeWkVBTugZMv2EFThnL8CnDH8pXlUZ4i8AXS9Tp2hhwn/+s9kDZefksjtMpmOPuILclQdxCWUKMTUc0QxxIKhOsVb+PMs4ENkG1HYkkcDZlXHPC9XdaqqW3GUL1qL/JV37DsqcXChcOurPWQB278xF6yS43CXWAOFDDX74JLPDQloAgCZ9mstNkaEWe9MTFKv0X4+R72FiG+PW6PupfWFXasV3xw/Rb4qQ4vMO1mhocv4nkjUZTWxrudA7tfovqaU2SzH04+dQmOxrXWgtFTl53WsHPHpXgJhav/cl33EjWbbvNOpAh/s9VT8IyqucIQVjMnnVeuRdKpQx2g7nxwnGthzlivO910+6/f/5d+9e/9U7/4tzz75d//a79KerLc4GON+mAuOau7pknnItvRr2Ct/qotzZgov3pLfRYdVlwb8WMNAFzB0K8EaXRbrfV0ANvvhMMYlULyGl+0fK0DHL+8E/bgu1mpYJRvvwLM0vpajt4M9R0otnbRwr/QVOp0uU5iXP21NIYoLSh39PItxma9fRqRCwHrIIjWYwa56oDwhFm1ohlphi0OJ4OQV3sYze4J4JmHRqL3d5g9ab2v6re0Lpiu/Kgc3zo7AvN9//33+9+//vWvA/jwww/7bz179uzx48d37979PLfDX1yLidCuVs84UZSDWeaDBVLr7zoE1jbQg0GTEtxV/erGsaJMwlymKZWTT1c2A5j9sLdd77FlPjFzcCSssnpqsjL71CT1aVwWXnZXVX1KRFFvzOBhXhuWVyEyNt1AmVrfY0DHxRrBM6ZeDp40haRFZ1uKg+VubDRaBPY3UWAnTXufT4CMJTWU/I/86//3f+Jf+iaAw1++/l/98T8WFjmnnii4GutSIyYJoLCxmwd57srXaXmHARCH7W/wy3gj7VpYmkfRKWvENm02TCXUKKCLBoqa0SJZ1/kDvTvKqJOMJb13cAta0oFYFgcKLt5h2AnQDTJbU6SqDff2ynbPuIf50uqu+UYCHHYKCHvAZMODuPN7wfVpXOWuDuZQjbfVbl7vRdArHZheecNbGLdX3GtMk5Sgn+CsPWS2f+WGirADwTrntQ7NgbpdhM0BrBtwJ6pU0c2Opoo7W8BXu4N/NI+7d+++8847H3zwwYMHD95///27d+8+efLkww8/vHv37rvvvvvDfCdPnz599aDY119//QftCfUFP1SjHS/FNK5gqUuWKvHrV5yvdRga2uBz8oWm6DNZDdqrhsIWndDqHRXZtVKmnWrMdx0bzw09jHT1BcmFfaqDUSdE4F7d5W/oN7OmZXkNHT9KCdXIAGWOPXksZbwJ7d121A0/tQLPe5F03TmhTzTr8I9WGiXWBxPb7uDR5Cn0dnoz7L/yv/7X/gu/8OcB/Avvv/2ffvmv3FvLVjrZ+FDl7MN2b6WsNGPKwR27wCMJNkqRBRDfrpPFei/w4jvtYlHDAs6X380J51mjft4od23YgXlmOnDp8zMiH3XxjjiwuJgb96KTgGzw+xp7qt3TsrzDhXFQrf2ul4tqCAOkggKMgQo0foR8FgS0xi/2zrkq0dhlqboWBzZdP8XEiEbIJyWDmynhM/sflbqfMZeN2a1r+xFm2YwkzMOVD4EHliuEh0k50CJKceAlXRpy3x4/kOPZs2chEnqV4969ez9kLdHtsdcIy/biOsI9MUiO/VYaF8wEHVBmJN1YoUawsKvOz6Kz63BK9V+roj7saNsYdXD9XSTsCPbV5Ruc2dOVzQJOOhwxuzAvdvw7caM60xhdtG3i6rfmFq12Ces0dJHNWIwWcu4NZJFwY1ivz+YOMwfwx771r/3T/8rHAP7K3/yNf+Yf/ccFmLkU9FtrnvP7x8nT0Vow2mr0qB4eo0GaPHw6vvwcoZkuWCTTlOjQs+yG3N2FM0CRkvjdd0zEsndbpQFHTmzV3MSrjFE0LUyP+qwN2o7bvq41HZEJZDHLnLzWdGQREPh9AdPAl+gbpxX+DPd6OqaR2JeVZuf5iWFr4dtYXRNKASf6leUsQ5t/aB0MeKCn9Vx1cxLOzohS0+lim2A0DMT31oiOXfx41+i33nrrww8/fPTo0U//9E/fv3//+fPnDx8+BPDRRx99nvvfL7QHsQ22a0FyOWGakep6xFLtCrRK1W6M0ISWUCWuhKIralJrvXzwZzmvQwHqGWXwQywLA9W4++26W+Ekyawklp7kjv1+sgJxL+sxm3PTjTkaicVpIjzJSgCQjc/LmtVj9COLwY/I123afLayhFCCByuzp2XDwQW4rGIfhvSmg4QFsGDCWqMq7whX4wths9wZVp6BQF3TV7vydRXIGaYOGPU24fbgYQx9sJKVyEpy3i6ULBnVqX+1ESDcvPZWg3OGatqpFVk43hbYrBTFY2ejUEEEYMk74oaZHZfTgXnWZFBZKDkjOtzee+p+0o183cCLG6ojIZjX4Ig426lwbQv0qSY1u+3q+kB2qhSARE/mxW3caXmPHuYaccfSfYZdQxuFV1SlvdtaqCImDsRc0yqaYA241uRnycjsGl4r1lwsuE5CGDCUarUsykWDJ3qKMUBzELmQntRD/ZaP9uOKEb/77rtPnz599OhRN6O4e/fuRx999ENGYB88ePDq0XPf+ta3bv2Rf+AYsbgZ3+38RTj5lEwOzJqOzOvebEyfG1s7RakIjkaCPgszZVEYpLbYDv8KADMSUVTt1IOevC2cWpYObjFtVjKsK4Fw4drTawkAX2iaWArM4ef78AyLuGqd9Y0uTmZGO4uAH99PrYkHuFEBEFND2PQZw7cH1mlgHJfBxDDQ80tNnsOudQhTprAF8B2xYe02fclaWX2EWSnRs9LE3AeBwXoevxfFI+XRd/0ETxiKxblY6YUOgO5wbm8Vn2oaT/oV59gZXmuaeFJb95v1/IpBMLr9ttKACAzoZzKtsxNxOUjN12DNJtqo1ceNsmqhJHNw+yU0w2YYLiRhjAZlm95vnD3rrIRFRN6nqtbhzbhM54zla5/Gye7OlSm4WGhh87JsepfshEV+NNOWL10RBhDeTTCurn6vOvfp4O5toD0rTfTb5fcHdzx69Cj63lfcHtx6UPz2Hs2EkHsLUUWE09q+X7Xy+hWy8zDrs2E72pHubf+1INxvYv2x6ifbFiTSUdkbZ4tk+BCe2cyGDumIDGLWtLslkM5N/IP/WiJrffMpjREPvlq6xw8yPlH0YjEXH0bifVhrxdMrJIVeVNhsNjIGAV7C60A9mGd1RNcJurYO/ktmwnICVZ2Iheracfa97ea6S6modLENEnVgxpAmevYJNbEkymsn1TKfRPLlF/OKdmeCD1ubNQea1LEFCHVLBzSXJzjukAXmL2vNzBzO5d1eGEe2wBsFgzjeQpa9wMHFT3EweLhHjvW3cR26gscnEAhjiv5pwxaTF/CdRV5mbYB9hdw2cho2UVxZR5+5NkuQLkABAJqV6Pkmw4Wi9DK6A3+8V9q7d+9+8sknb7/99sOHD3uJfPfdd38I9OHvpf/9YnoQt5D0xraIu/daUznzcQcEw2AxocasHDDhbdyXNs2Pg507PPtGPzi4NARm2ZwQlzD3HgBWqyPCKPZopYWk8Tygpt+sfpbQRdTBo5f0soZlWes5SBI9SRbWTMEg9uOYFNTq0WZwSYjkwfK1HwgFRqxBLCzAPWVPboQCoVey4p5IAYX00Fmk9RZhjR2sbP1vLCK7a1VQTpvpO8N8R4bQdzR2FZ17Fg1brWmrTzKnbGjJ4zxaZKfGeu2Lv+F+mkF4HcywJsZsE8Kztbvj30aXOFkOyHVDNx4wYiIJplV/qP3CTMislI4OL9SfwVyiejKyM5ELOcsC+G6uW1Xgs/mMI0NAbasqIFeEl6nz11lJB7NSkUW4arh/dgHvbrjQ9YAyxCcKVnu3p4g0wg3DoIuXlxsWusM8M8VLN+xgB1tf52iN6pvPwG8KofX3Zxn8vk5s79279+67724IQXfv3v3Wt7716NGjb37zm8+fP3/99de/8Y1v/PBJQ+ceT0F02iUL39KHfwiHX16DY2qIQS3RAcSTljTtfutesceE1pvuWunIErTEuTm6khGnM6x58BEtyrAT0gHlpDTBuQaSNGz0tZOxM1Ce16vrNudTCcjV41UpvICvdTgyt0UyWL3bMhVifJd9qsNcu5Eu/KTD/MYOqhsIcBmKBy8Ys1KG7ckptDjCixl20jSew1iWX+hwrQln4WADebMO8OaQMQ7QpLSalCuShbhB7VfSY+e4qRjLBIPDNe2QWLffl4MEX+gQ2OILHRxLnMuVzQ2Q6K+1ZbhwXW8Tq3tJV+bYkHses/Nd+vD538+SjPhCh00mzwpOGd5Sgo6jBG2NC4cbYF5lHOESeqvVhHjxc2hxxBoVVJFU2zyvcWCZK9mNi83LMOMJAW9iiZLd/aY2MHST/oywC7PsBEtwP8vX4jLSqJx3iU5KEXVl310XStwykD/DNmAzXn3+/PnTp093ycK39OHPQy/cssa3XUHI4QssKxlwxdys+VsLyc/EblCgYwXppkg4VOPXGIMFg3iRFcDZaB7kBWR6WC0qYUXMPh0sgzjpsD9Dbfzc8yGecUlW16bLxCLKvMzEqum1vZU42owVt6nBry/rBVqXVyuzgJZvPzwXNdFj9YPCuBIASZ9SMfOYIHbj15FD3aIIdQeF0IsaUTg+sn2aTYJDbQMdVtbWgA5iHNyxha1dyBxsIhUosSQmZ9p7yMWLjjuIets+CKCbVdPOKNBNcxNZOIOfFe2kKRy0d0k8ZcnRqSEZscXSZRylAILldk9dMQdzq6xY8atWr/lOtAoeTGcY4aEXOkOGVx1r2HZ549vVllZM8CvLlMLqbZZ9ioNuvnU3I4OKCC2nxaCy6OvPeBv6vuK/o4fU9/xUP4jj/fffj4Z304d++9vffvz48dOnT8NZ4odTAb+X/vcLzSDmkEzt1dYgZa2JoX2J6fLMc4iNDTPlzh7fZSfHleWxAJyPZ0bbl3CGOqJERrNRS0oK1fHDzW2nC2SerCGhB0jm5r6rN3yZ0URtGbqZTPyn1ZBN7YKvm8am81xUUbkyu21345FGyiq9CTjSPS1RBfSJPrHwBoiXRdzlzKz0DtTl52gQe5C7E32iH5kTnFQGMy+1HHsOy7WArKdlImSLxcTFRa9bBRmGqPFBZdwMFeDDAq0Di9OM5eQJTa1D7pVYat1x73akS5mvmjErqqjH9q1ea3qNc0d5HCZZwuys7sbj9TDucJZK2Yhbi66Mi8XEFUq32A8aXaiVbZn9LBFJvWVu1L/RBYKNz7tKqk3wK+YNDTDMlFmZBW6s6vVgl0+ULUT4de7s+GH53Zcniub8/q1/38/O8BIb6K233nqV4Lsf3PH+++9vfvLee+89fPjw/fffvyUL/3bV3hmpyCYUCWPilVfRnE1nEG1fNDr1A+tksAIWTXeY4z4tMg7+NX3gemS+xqEbji/YtOwalebjSnPLO52R5oYdJ/rckKbd/kYvucuayb7oiJgRFoWFMU5KdxQW8/tuAGWFULfZG+uEO6GEQda0GiINIpgWTzp4EE95kPT24wplagOwcO8rMteq5EkMmrZfni7XPRWs0Apc28Hpyk/jhmmZBJft+FSsE33CiVjgC02Cxajg8pSivrqvm3Pb28NsvsOzr18cTuHmRblmEB/h4VK1zyDWeM1WJuwLHX6CvutZtIV7qAl+hdyx+FkWE4W9nrzTq3Y+sjeDqQ7l22A8IuDQhvSbKW/ED27enQ8/iCdP7PMDeI2K5XmGZCcLx7wHYDWj4EWMoM2kbXONxXHSZPwMtY+CFd7aFr/KcV7rnzx58sYbb3z961+/JQt/Pltgwzn201T21TueBfxUU6z203BfRzbsvMuS2b2TYqMe0KaS0V00rhjKzmC2MntymVYuhWpGN7pwQ+5n23QPoiNupFcMz3oerNdGa9pdgRvBtp+9rU3UgVnk7NOaRHyxzzL4xHI69+KQvQTToBOkfDK5TDS1mL89P42t6qPRobTE3mPIWbKyFZ1wkJvuxoESMmcqfeg+UU4/3Wi3x+o9GE3rutCKMl1QD+/Vt75DaX6GXIXUlWuf7Exy1IIitBkRcjFR5PjdG0q5IMLuTxhBUN1i4g4zUKoTcbVS4caeC22Ie8XsnOINBTYc1KiTpmPTQrUtA4fLfuEq9eHuHZgriAjeN0JZVi5nkm02ZhzMwOK9SVPNBuT62293H14++fgsq9ZWrvzdLoA/mLJ+Q+7cm2+++UM2Hf5e+t8vckgdhs1u8FMYyc7eXdgjHpwOFlohXRwoQoPXaQkP4qSNhb0WOS0BnDztvo3Y2Sf6ofFQxiqS4AfmEL8n85SKXebP7h5ZaWSORKDW3o1qZ6MeLWUzwNuWcBlMa9bcNhHYVN+mkrCTT2e+TqMZEM4t/l12aiSURUfJ5tRuumEm1Y18eCb3cDf1bujSpr8GDhIaEGpWD4FEP1puaXXabqp0tvAETT0tnKfF6KIqKMN92Lyy12+A58/1WdSQBLrZ9rV2zrtghOf2QNpsdjot6KLFRI+nt+76PyDb443Rfcf623bw5CkswFpfeh5wwVlTQdIgMRKQWQtYV+y2SUNIgaw5SMQF2vGg2r7GWTopfaoptFeuvqXTwYpBk5WD5V5HOYxdBkiIXFhU3s0lJ7ixGLx5WmPMRNaKFbXdNH+f56u3x+3xuexF1/CTrVUv50SI+siTksRZKQBNKSiZN9Eeuw2x1sLPVv50tPn8GRpsihjXrZitYG6O6n2xm2V5u4N6pQ2nK/SGAzFZ1VyoBB14MG2/3h3lrqeDksVUNYQUJx2KbN0xi4vbe3xGdr3URht5B3miG5eFaeECDxVq99yef5cO2/UgxhBP90LTSVNZrCH3+5Miu66r937fgqYOGb/6V9wn+Q4/t8Hc4lzpsd6SeHfcpQZjonHWKGMNqeNqULElwGILLixvIi6PrJUBcWzfJ8vdYJrNbMG4vITf6KIY1S1RE4rWGMmI14/7N1s6QB1ZWgX8bIeAk9dMZx8c2IANBUmIBGlNs1KQ0LXjmLHilXVTlACmvWrMUxEH9dLtcXvcHqt52LhUllojOq+islhGTUy1drlx/R+aslV/57LiyddrvqppkuXS/HzHG5YCIm17jNjiq6w22ZNuXKUGvsgeYNzWnES/sny0bK1VHxfSeSipe2iDhwfx1RIitwo0H1/twGLcZne/1C+r+gu1xHhjSZY723qip5s8dlZDxPp9aYNGYDcW6OKMuM7pFhNOrlqhm4fs6zMSktH+Dnh20XJvOj9MIeOxU2TVUhUJab3k5kqQOre33xG83qNU0nxiacLlHXVcszS08JfIqNuYssjjliLY30mlVTXvL6MSFd/g4Bs+eECxIR7U+oaqI6DoUuPPFecDsw18RYV5l25i95+Qyt40yKhBo7Z/LbQbWa/QH9wen5/q8AWui12OJzAjnTDNmnJFr0brUe9muwvO1g2IgXXquGPtqhtcoZOncVO7JilrVKzvvtWwt2ewhYKxaP6ymtgJzRxaHSsrc59LSV3Dq5snKwv5kRLktYN2UtV9dWcOugpYH9HDoIARY/7pirhatDC3o1alVMxKA2pLGnRGm48dJ5PrT1eqBfuY80mWSxVqXREJo0KSfFU7oj5lHVD4joOPO40laE3q2yGOWSxhMcEyOGDuGXVphmVYD3PvD1u8dKsZNiKv5hgu1Vtjfg04+NDZNZSgc+obb2hvLkv0bceCJMdEjzqvCuPVPo50W+KNOO6EBGm1V+vATbz4MbThDcD1Klm1Fz4VVdA6+tj4jg4sBgU6HDrTa6Wyhr+5auyX3Wc02Nd+uNbULT777T7B7zC/xvmKJdGDWt5dOzN43VCq7k25+F7XdeCmYIrb4/b48TuyUj6zJNMZWjfLHDz5FKBkdIm9VyRwB/N6W19L7bVSc10wXKTn7N9zpU6n6Dto5vKTWEkcPMEy+EJJemWMWAgi1V6/xy4liYxWDfyOfXWOUNyyM6sP3uhncUAcfHL7NqUMDgC9rblinjozdLF+sgquvYJOv5fYIpuVvOXL+XYGMCTXh2YofISUyl4nH6nfZX1690jHAb7vdCh3kF/DYoQl4IWmT3WoXvnYDlnX1cdqwTrPq181+hf3bwZdobzWN45nvN2NY+D5pERnl2VwkxNLWJP1aEGs/SsyLGvrcVlkc8i3BZ5NXHrI26bj66SKSOtteAR4MV2Q15o2gYHDNsDarbSyVSEwoYTTcUx2fUWGou+gOQPXTVxcrVk3SPG7N+ZZ3R63xxfrGJaL1UJ0rVQQY7a6YdZw256jijcf0SHqzKW1Fik332716wC1eOva4oUos2ozeOOn2gHpgphz0nTyKQ88LV5sfve9DGobFTo+biHSFlW3+qVoQNqvRyqar4zs1YmiI56O7wJKIzCxHFjMSmI1lDDzZNmG0WZ1ed6rkn0VHQXWTTZ94SXPFn+zYrUfBJoX5c5p3H2y/aHCJRrNaknfnrRGT2IDKzhYjB4tL3AKPbX8QBdzmU5KsSfh+uK8OPxgZWJVUP7MIzuYB2ExUVTH7TGJeaEpD3fWEaWBJxjMS2TwBhB7B/11c9LswO6OeMAjyx3mCd5VTTf4p202J+cU43X8UYdORuyFq/Z6/d683ge87YI/n8cX04O4/p/FytzofkWsUdqqxgKSgwbKLOx7hky6dt17wuBf34E7DksDc0mHpKAPh14gexq0n3WJiWFsxfXGdTHmM6pQWvU/HgrYfsty1tbiHA/mzTmii8qjg96VKN2WfqvjLL9i3tNmbutKX6BjlHryw/m4qXiS8UyYoBbl5wkxHT3/1ENOCweBkUCiEZQIMOjDrLKgjX10J/qoB4BG2E5CYcUc80QjE5df5hhitu6tBBLmKGl7dgox1dFiEE6zUuhMXui88Nb/PCF9qikP4TPSZp/WrhnAJIcAJSstjhbrgXCv6oG59+ui5hLsRRw0MpQVd4ipX/nciEPBYXsR/hZqtPqgxnvhSrTkkTSlhVu+cRxi0HVb4VR1cbLYnEE4sNBE6IhCapaBC9jNIbDuFfbNak5aOGFKDKlAbfgTArZhJAxMizNjBcEz7FNNCX7FMi3uH7fT0tvji3s0af9L0m2K7OQT11vtcQlKexTgaH6uw2ICNq2k7ZXz+EKHvZfjpzjEOmNnfr55fdcGDJ0owU5IebTWXa+r23VToSW05jW/HNdKCXJZYQsHGySMJ9inOhxQzlZXSiaaw207CabE3owTviBo4boIOylda2qVbgWd94l1zMsddtJka5uIV/muARayYOU6MHTUQxKgavzQXtIJ1bLYCcxKgRGMtK9ZNlKurtfJs3eY0wCDxgPiWy6wF5rGy+zKen4dT0pXQyzPRG9k2/NOSUc4oRWvvNGHbQiWOO+Eb5iUYLXB2HlhW2Szy7Nx2yWidsJAaYOTMPK6uPlrYRv9qu4w9JE5y05MgA7M0sQBDclrfL/OQshrn84/Qgxyzm2ThnNVv/Qsi2cusgPlQFq/Ya4xFx9S6VcONrwtv7fH7dF6uD3grVv/Z1CKXLKCPcUGL6JJ2qCB6PSinao92gSZy7JSqA9daBlllaSVWIAbLCa2tKHoqiaW7GmyIr0EBdu0UTdUuV0O7Llpj1F7/XlL9InhqBLp/nKYrMGblyFBqwNfzAY4JNjqjNUX3dX9dx7otvHsyKobzFXtJhyFQwqAd3SYNRcucGGL8KSJeUJZ+Fm7dYdnIDJ1s/elL333niV2DTYsKy1yF4C2wKeAONwRLaRIheWCYFT0mKcLWq7l1JlHK2vc5a4xhtxZBvDkVoyf6hB6sr4RiluyhBk3bJytJiqhJNCoiGvQS8YGi61iXIeR0NDR4QSP96MhafnAssZelGUT7eYxxUpFxBUIEAjL7kBC+zKq2+MWIP7tPBb9XTj0t6ElZ1nzIObq/loKTyzqtl6SpQlK5zM2Fk+p4mz1uXJJUyrr5liN9OokEvw49IFcTHN1sJLdyS1J5OZ6rcsr2qWHSDtlIsqzrFV4E+nsHsRhF7A2XjifCxl1xfLCx35sbyWVnRY8d6y1Hi8XY9JNuFmCg8iy8CC2CiJG2JotuUO6GDdrbh5J8dqyZoweQWRXzCelKnPezw/V6n/ZPYiF6NgX+LOm9Hr3kkf1Mry0MQmvosXVXmM+YT2pvbc/sjhZZLHoN3PA3UvlnEHcA2rOeG5sSHOE+dEDWE41AWA5TpXNV7lRsVHre8RKHz5z6tiwrL2OUjleua8hnxi1LQw6GmlusJLs5icjGhUexKdKIu4XwKJ+4bKBELEYYDlIMbUptA03Zoh3UtVljziRFgeoOubZXvC6VbzeHl+YIyu10Q5fasbdLdgi3PK8Tzp/fFE6MBfw5FOWwac7No8lz9pML+qFUbNSbMR/gnNrjA1ru6SO050UcalLXM+6mFRsba7SgZ1db0BXDth6f+yyE+wqFCGDsCEwykRFeF3EEgQ5t8aoAgVM2pxPhmgmlLBVwdBs8LunVqTbQW2Gx21Xz+XZGF75fT2cX0F/5rJrpCtYoQnI1Q93QBEGIlH/yYjgNV0Ou3TmJMtIbHjxEu8j03CR+Lpe2KIFpgMnTVfMahutsoQv6Y7lNLCMy1nyjVGuXf/EiK7dAY7DZeKcjHaF8gKp156TJguLfgDAp0Ok0i7FpjsqRh4DVxDCTl9dx+raVFtdRIfXire+ETI6YAcUg4wroMR40XHQL+xOY5JqQmJW35lzk7iDOgBuTyUwUurPzvYiwJo1Te5uP84V9smTJ7sRcACePXv2+PHjSMu55Hv49OnTx48fA3jzzTdvcE68PX58MeKL3P9utRRiixeainbcf+MHiX5YjQ9ftQ/dAkaStx7cPamajdfCZSzWdS+ghCxLVoqn8/g0xETWkxkycIiV/saTEe1YZ6xczDQXzLyTr3W2DdAe9+po+eRTxBFtOtu2wBK4GZF+yQmMtlTNJdasTK58GRCvpdwTDVhrTLl8tIpSDD8Orarq/1ZFqGOj6w36cPKOya5zTTuByyRy+VoBYKIXem5Kpth1VOXyq+veaz/tXIcskLJK5dbRyosyLUHHza8/bNBssf6nXj5a3NkWzDKjX2sivLTAoVnTkcVhBWpuY50FtcywI2KuXRtI9AnucKtC1S4Uo/ZvMqmFtUIgleCJqgHOsFlW6nZXpanNjKGtb5elMIrSLuJpDEpWLjqcd/RFNxm83NKHbwHiz1dJHBcpVvOgFGrWAJvaOuJCHV0GVVYLiX476lrNQho2qJoe44EL55ICIx5v5m6T2lz/FlveBN1hSfAjc7igG11KJIw+WVmvSjvuMK10qSiNwXQVnqw+7AmI2eCZV/AWUG6wpNVFg6HOgMe7fY35amjS9gbOFUf2RfS6Y024KApVI02LUpwiq+jwvgtzqjBuMIjHMzNYK9wwrYqKXwwmpCVqIGjLE/2q2U0bZZec1QM2TYtxM6gYvUIGOpwV+GRgxPQL3lVa7xhmJB+sFeugLzq8iEm3ZaPQgGw/WJGfyWM3q/JouTm0iLEJ2+aXRkqbleIpIhEq96tF2ow94SAOjSLEatfYHCo4Bsi2qAcNwpMa4Di82zSwcYN3Nsuy0kS3uGdXAG6v7pJ4wkRmB1ycG8uMwMHKyRPAg5VERUjdvBkFNXZAQM8Hlok6CXdYJnqCW+vtdxnKl3RVup2d3h5fjKOnrPZ7/hqTYb5h71g1m2uA2C4CxHQcoOrg5q3Q7K/TC168LH+xe56wz+Zx8Fwvf75ENOefC49RwMFYp8nBYUWWEdrGlcVVal5YS6LaOBoMOrATjHAbx7o6cI3iVQsOWBO3YlewH+neUvXuCFK2Vuqoi9srF2ekA0twogt4wnSN7ji5iGsy7FQNfLDHMOVQSuykqZ/hk6eIPMpIdNEUPnp3akgdb+inw0UkvspPNQHwCHBnfrH2+W25putquSe9shua9rPEAjYNyhXKNVLsUAIEb67TMTPenloHrmWCyJUYDlBiCSEXL7zD5eN75CNSFx1RuvVHEgguDsUczJSr/TGVmh/xd7EieFxgbZMxQVfIv4WJDaLQJt43bIV5yepQ3cYqnlbij2uFjQi4d9999zwCLoJo+n++/vrrH3300QgBP3/+/O233w50GMDDhw/ffPPNjz766DzZ/Pb4MUaH7UIvFMnPRRHoGOTHJe1rk9WGZm6AC3Mgbtrui5WxFkevme+x7a8Fyti6htaAQCiwXCbtMl8H7BUysWSfQkpYlAClTWqO0GeuTUx50ViBo7IWlHBSd7XaVsMDS6zS56mAK37PjdzgS435CAySmliicT6aXHZiIMZIlF3IZK/CqT1ri8VUc/dIPlgpgtxTpHDtEdj78GZMNFJkWNHh4qAxnaUR8oYTsU1htRJDBLPGuYprpk15Ay4IlsDoZx3vJ3ty5kGJ/EoVhGdJ81F6CmhtyF3VXWQBD0AEZkwofRKyHjOMMcs+0QvKmvY0VDduQeoQxAe/Kiwm0uJEHBQ3nOtsbO+c32weXBnErMJubqc+1q9PssgIv119bwHizzU+vFy2geYUWdbK86gCePRkJbH0pksD54XogO6GEsu+3MSdH+jwss1ta1asqkFCPDJjKz9U5x4aZXRvM669ArGuwRTAosQzkxejJ9KxKawXF8GJpTKbiIqqmUA3eIB9YXrbQv+0ci8aUmjjpY5Wrj0JPFjO5bD0ruqg5IrDFXUisRiqBQ94w5crsiezqSdxL5peNXsHYV/9g9UwNSjbEzWxTCxXLBlm0EXbvRF87Ua95vBUyyRXmGETz1bEXc2HpDRNJZtphVqQEYKNhWZsPaDexCJyiXmyq8Ll1Zv//Lu2sowBF45rfcKitHFrjrzE2ZmsyOvgfoggqK35iGUEW+3AMtwCdfxukKwQKM2DBUMinAYLf40AMZfvLkQ6Ds5KBj9ywXCtsgpqKQ0C4HUz69Tmm2hf/MA+XoccDmeguUz4kZhlE0pq+9fRGWp0qyBWscDY93S78XCwfJ963duh7e3x212IR/eYXTf4k09eV262v+/FrvcGr7aULZ2DvFGeuAEN7VMdCB1jLnn5FqzGqVIhu13Fp5o2oPB8ZrW8YI6Vyuknn2hL2HppFhPn4GYW9+Lmq3USoVrPz3z4OLif15VQ4allEUtiZ6PcI8ISB1yQd4txo17tex2x7BpJtNbranDdDU2xhwYI6GSWccPiqmF3vRnq0XkuOg2IddhGkIJnk9COC3eLCe9tIZX2dkLnQ+5zMtE4jNz8y5CqurMR3TCL1T7LBoWXSMhr+qKFzxVxWO9ml1fpG7AZds71FgzwC/aFq52bo0e5xmesNe7AEvLbWt3oNpyTyV6eohzjHKO8JStcK00sdcer/iliE2LXzQZEYELRHh9iMKpqpDN9z/NXoRGqPl/H8+fPHzx4sPtPjx8/fvjw4euvv/7uu+/evXv3yZMnDx8+fPvtt7/97W/3xzx8+PDx48dvvvnmN77xDQAffvjh48eP7927dx56fnv8GJdgUzPrPrNEL2029kLpyALwQvzasgS9FOKs+bQyd1tyUwWrLQYFunNR8Q4reTx4sqLgyLIL2F8tp05pak1l5yUTnoghFGETUvdSJGHcyV/kSHbE7ViNbi+SJnUROm9GgsExam+hlMSV7gfWinlWUjDbSACRJLTznASA2dPEcqhvVRUBR99QsYbWmEODS88SFXSjad9ZpgPP6NBGdY0v6/rfqLMrG8gbBgxaXcaD9iaxqNXQjif076WOb6XV9oxVWW6v4JBLeoLPIKnE3L+RWWbt8vQzi4lMC1Nqlzl9c47GRKL4LiZqomeY0ccx/NRQo9ZYL2dyiCBWC6mTkE+wA6bUOtoIJCjiTYHpKz+LlT5pCGAgznn3G3Aq6F7tFLX8ic/Sj6ralt0etwDxD+ow6IgSgk0ts53ki1VKFCF1AFQSaBU6LGRhUGFlqHYIe8FxCqMJK/0/ayFUathfFYaYVfNjbIUetYOeWBITUrYqKhwJibxQtW8g8Gvrg3jTEhh+TD4CdxEXEPGaV8hpTwSpxVp35RB/ZeXa07oJiqKV3KWUN+DdxBwM4gSv7vsXPteAwa0iUCU1M8C6N4hirS24HmJbdFqZtZiFiX6HxeBHlJrzrgs2H1ydg+V/N2fUGSemu0yEWU+GYojakYLQgxxZIkt01mBAvBnPD0zVI8uMVIBIxQVRloecv++CVnhi8Kh+PZ51yN0Fuy730vCp6lX3QpPGNyk2unil1aNx53Em0x4Zbd78fLu3Y2rJ6c0j2FwM9XqPUWpKmWSVhMDZ7WjjS6wKP9vujevsjlW6sYghC6hf0jGbDep6FUTvMOO7qdYWfXh1lwneAruf/Xj69Onz58/Hn3znO9+Jn58/+PXXX7+lUP2gj40G86TJ95urVc/h64qwecIXw5MEsiwgRK89cPI4mMlu3lEY8h5Y2CDgvrfNIpkOWNkXqL5o6ixgXxQPDZo8v6/d0CiN49q1NM8xHGUrTNx+/O7SMHgQ07FL3VnX+kXm1IK91RXEFSS4QplhB5QDnVomZI2PaXnFIL65c67dy5G5uUPstAw9wtSrPSV3aa0tutY20LnWFgRh3Nxdg4Md/DvOOomWG25qHorXSgcUu0BQ6j4MhnAzXDVIceX0M3zu0Rnjfxve7BG+B9ouUpuRRnTdGM1toLIUwfFM9nz3Ucarl80gtTaQ4monxvXd2oRunQcXc+jGHvL17jq2lqc2vdgfychO1TVrIPtzidpryI4BTPIZKd6Gk3vmXlrtXgYHxsiI/l4WrM/V8d57733nO9958uTJs2fPdh/w9ttvA/jkk0/CeuL+/fvf+c53Hj169MEHH7zzzjtR+z744IN79+598skn8Sv379//0pe+9MEHH3z961//rr0mnj17tnlLUWTj3W4efMkZ4/b4ITfCGChRG3wqfOGuVh7EbL/oR+RrTKj5V2XWpfC3+uw50kqb9sVD18hqDE50Aq/VBlmIORYJ0I06MFvLu9t5neo2CzN3D6ZRIot7MiuQbXRIMU4188kxa9rT4OplVXWvEonaPwX1bN+xDK3MfLCy9NHlVyNErHyCuJ6BKVmxYXmfWlzPuamjlioBHywURr1t62B55nK/KVw1Nm0xckRwRa1x7HJiABeOM6IMVtYVYzEa5xYvTcc9BzIFyuikU1CbvMYM8mg1NmkkVo8Vs8imbWW7PGhhMcsAjKNseZCmxfhf5rJZ6WDVvcqXPGH2tloNUK5ngn5EZiP/1qgbVY11UfIRdVh3icISpDRBE1zEMZ5HdZAQt3kWJ+4r585nyQsDEToiXzNRqW+NSCUruVG+dNOZ+270Pd+3VLsvQDf9vfS/X1yAuNqMqt+N1u/eupSbS5SqL35iKUsxDXnEYFNE1Zt04TCkSGYOtLF4miwDy18GOK+vvpdiSJbqYnCHNQNlTUMkyA9CRjdylmr/Y80irzpvKNGPzIm6cPfVtrZ+BKo0bsiVlWufuDVeqq46ESmwfT9Uoh9Y7vA0oTYM452uGveHZEVOx+gDsadK2QPIWbqAcbEhDo8tWzBBN3r4EtwYZNCIOLsO99UiuXkQN9wkmuF12AtPmK5QYt64fkViK1NaWKthlNw8iNexsKtEgCUskS+fl0rgZGX2lOgyi5G+zqUlSwxR3Wsehi1av4x9r4SMvMKwIc5tAmPUlbIzVF0MdLgoGXMUDlsZQWTT0XcCG7l7o1UGU9sNOXitQyAoR87L26an5gMTGXQGN6ism+otOnyL7/7QjwcPHpx3p/Hz8x9+61vfun///u1J+8EdRSnD04D9ttufs9LUvIPCeviwR5i/Okuu676615qiZXJ0UcqyiCdIwBXzKtBtAaPrfr3ISusZZhk5TZgZOXLtrm+vu0oR0bbHOVP2KHLhTeslKPxSE/yoXMh0pmoMkDrM07tLQ7TTYQRYlCgluosnTNqTFEXz5vVPFEdmpdSmpDHyTBRX/jy1t2mg6vKtvWiGD2dNdf0GsxKAO5gL6LLxsc0lY4Xw3nDZjPXxbNKw/h5lUedmpQPLJnlcQ+/bsdcCm15iTwkCR+QTJq4hznhXPaTlwOLCkFOnVEsDruC5kfIuUXUcTOsi1WXLL3S4xALoKC2hAzwsGvq+izeOas7/PbfIXJ0JfK1SK3LGcm/20nYYXCYEXvu0ZkXxWmlj1ulVun5+uVY6mFaiorq98eaFepbLpzXaXm3UHPbjZDIxekecH+E7/Oabb47w6ze+8Y1Hjx59/PHHARB//PHH8cPxF7/xjW88ePDg448//q4B4kePHu2+t0ePHj169Gjzw11njNvjh9sFwzbBYG1tjAJR1zfiWtO1JkojI2miQ7lw4llDct4yBFtoLbIJ/7qte69iOllvaKs9RA3p0YEldPrERSUpKbLGuoOQGBhx1pRYiqdND0RuwsqXVoo3hPicdS1zlSBj1+/xaPnaK57eS1/j4kQSYF1Oj8wvdLyhFq7HixwAaKSz/F6hlFWE2E2AmUFXKDMSPwOOJnKlQO0Ib5uGL6npE9yok2ydKTpC0gIw0ROKcQehOm/ZTxekWrH8Gz2umVH9VGU9dIDRy7e8mfqOs6cDTRe3JcsPE52Q04y6yVis0YczrOYnyz7VIS6YLoficCNENobBU3uVCWWCpWr/VQf7rov8gG7HX6c48CPcgBPKAXUruyixsEXDL05i1iciUSb15ne8cV6Z/HTrsvh57H+/0BYTvUBIKGJB9YFFDxWjSwo3erK5ha+XS7ch8nGPgBLhYKo46a59YUVag3YRSeVc3X5+xRnUCx1szVllt66TYS9sBC2vfPwnM8m9bI314sF2Jv0okzXRRKwkKdC2cAT2dNk1XkO8mJpo5Y7lFz5hYRPvoqomeXazwYB4YrZqedyiUaRH//ib/8If/4d+9hf/3L/3Mz8zgNo617C4ty9X4GUFJAuVmkmGEBLRylyGE7pCPjEZKwoJ4MjSGWfJCt0HMVadpwkF1lmohi7FEgI18IH2UsSCHdw5FMEBlQY43pRHm+U8HD9ylhn8aOVUtdnrhs/7FLCeuJDeHDjPSAOHV0WJRHZNVjp3m9RkJXslFi36oM1mZkABog5lWUJpdpklx3UYseMyMc9Kx+Wa4jruiUeUCUpDGE5pZS1EZMLCwR9M1lrMlE9Hy9UH6kJlIjBBR+QZx8XruZobVgcrQ+RJusAMBsG8zXU31LYNkK9kntxzXW1uS+MP9vhM7e4tffgHfXhdBBJRJm5ZS+OQyauYsXrLHpvRTQfj7jB3yEk9ELyDd+C1T4cUrqx+5Ky2oU87c0EV2Asdwuit0x47BDnDZgREa0EaTRRwEX/c2W54BQZjpmUrW3W4SFZVb9qPPGcn0uYqymsudZIDxQ2GRNcFyyRr8oUWUoee/7Yz0CLiNdT8ImZNhP5H/8t/+u/7k7/4nZ/7GzDMfaOnPQ9pCf+fQpYBWd7A+nEyo0z4ZbJJfPDZU2YQvWtWvPYzhBDPeWBvWHCFzLaGX2s6spRG0eXy0rqzppnHHibVnRgmua35v5280zFN20IwSov/wyrkgYuAdIfVtb6cqg3o+trymFmiBb7Xl2sSXcEuNPdyt4x0TPP59Vo56cNVUVNuuv9SJCBBBA4ozoqwbNLgzuGb3f7ZzxXIwAQ/orzAFAAKiYCE4t7cm78O+/kh/MC1XVV+DI4u2NoYDccRzKAvf/nL50Wwk4biL5vKuHnMd3Hcu3fv1cert/Thz0EvvFI2oPmwxV023Jgs1RbJ18rOm0IpL72m9lJneq/qskXp7hUdDs6H0Q+WE12wrnp5RZCpY8RFNxB6trqRS49LdK2NlbUE6iZCaY92Gj+8Y/OZeQVH34bqkLuzkbjorvC/+Ee+/s/+sf/mH/0z//4vfPkPRpkzBurs0RYleuLLM+078wnDZFH9HSq+kXImkFVHYy+U7ti2+cRSXZKJ002dT4C2I6Vmww9eZc6FLygH6wuwQFMjsTmpRMEbl5aqHsTQwcoLXw19wwIlIg26/ZTOA1/HL6a18onlkr1ut5gIsH52y8YDGB7EB5Tt7hdNxcvl+pnoU3xBw15rxNZJP/cgVj2lStAEAX6gTyjdgzh0adrmwm5u2/0bZgkk6Nn1i9cWXwUjll5ZyH57/HD73887QBzI9w1apOfPnz99+vTu3buf5Sxs3BvUFZdFSaM1UoVufbKc6OA0j2vl+CzWEaSy6DIE9xR78Zhe7t4q3c90ol+xGjUMy0+wdJWoA0tmwrqB6ao6ni3KayP8TTm6gcy4E1bD8WMHMwMeCXWGy6oEMeS6Gpoog64shwQYi3R/o0Dt2goZHQ6HdX+JyUqPFzjP6u4GC4Hp33gJYIcvq+YyoSXhrC7N9CvmCX6lPKEYnMDRCqEmr4B1G+F1+SRH0+I1Srv4S9R6oIuxs9Fpc/Qnqo1b4cauK76aE5PLSEzIBZzHsL5qKl1GbXTMKsIMWmLzIaGI7gtG+ME8+2TUZMWVnGb0iXnUDS2z0NbjqeXCkQQYwY8G+cZxuIW3duhnbUC8ksU5KikvywxyBr2aNhDzu9h29gmWjxea0tU1T03c7Avqr7B6cSNRE1QAAybUkDrSRty9DwrGO+gMEbg9foDHraniZz26UviGbj+ES9+dI0fc4DPSFfKwkd1Z7k6egjS08Wxp+/vA7la3Z1CPq2drUJ4oNkn+2K1NLKNvYLguCpZhxzWfNItAqol5TRVhez3AWYz6ui6d9ZPrjbI14QiPzAUMGNprc15PwbpvobuRMXKUu4FIg9VVr49c64hdLEizUhHT0LQf6xpeba8Ch/WeWQTLSgX2QtNm9RyDTQqIKlesrghlTXKRwsy4w+WWlSCteUVn14wsw0yauBSX/vgss/qKOPlUBmeDI7IN/sKoZPMUgbqlztk5tvHbHcHQmCYo70LwF4r2GFJ3gE/1XCVeKPG7GKv2c4MXGVyfiI8yt/i17FbOBEzdYvjyZmP0Ymq68hq1FLckEjTRWS/O+o0emGdN/jI+eHVKUYtZbx6KHEhJyxUlIxIAhxnKkftve8RrwttNVr5oGbC/8Au/sNsWvv7660+fPn369Gn85QcBEL/11ltvvfXWbQH97SrK8ZjP5N1hCGVkGlfvrKkAERxCIMyXWrpstWdsJJLPdndV12DZuhdeOyK6wVOzRPK69BrMqgG6BQfnPIiHuME1sSWycq86Lw3Q+j3pUoNwZhPXTM8vQGwhnbxqtgYcYD3pFfoAQWfv8Ayqk1EHlkRJmMgsM1ZXh4kl0W9+nQ01rXfx6r1wN97b4r8yc+6giE6jsUzMB5ZAkA0VtN19AxM9og6q/eC+1bxuyjpclSwZdbBcZCKL0mQ5DJVRiT7B//NFcdYqiMsiQYrrmpsGLnIgElHsUptbTyslDU6awmir69Sz0sFK5Q6Lrkor642jhnwOtWKeqNZm1vC82lZ3bxDuMBS0hKsjQQe4gUf4oTHeloopiDiwRDbAeLX4OSa+whE0bAB2LEjcEwCzchmJuT0+j/2vfW4/1XvvvfeTP/mTb7zxxhtvvPGlL33p537u5zY06YhoiMf83M/93Je+9KVdHvVLVsNmNVu6O5J4DhXFHzaH1hAuYAh9rLxaLlb6DSNm6+LShUFK8D5kTaK+uf8IGLyNp+pyNsGPNk8VjBb2nEy7jaGGTXbRZ/3GR8FI7fUaslqHjYkK9SV3eE+1sdz8vPdgh7pYrwuhJznzMOlNFrNHpMBqKxcLBH7vr/6nP/eLf+YP/vnv/HW/+pdGwH1pcLhf3BdbROeF9qj+ctSzsJiY0Ek6PnjR8iK+jot5q3BYji+fsWHyV/h2AnCv1C2NdnvLUs8WHZO4pNbUhp8tjXyYQMRbIt0WQTcvj6yjV1N8d0aEx1MlIHPM560WhJWw5kmDngWDCcbKVlKr0KrOX9Pq+lENzAn8QlY8FaVZKbS9a49g9KzCmH3PPjWbjjq3ODIHMkLgwJLa7T26OQ25c86h54/t8gFebakb6WxvKrOy8trbld0et8dv5/H06dMouFF5f/Inf/LBgwcbB6snT55ERb70gFesKyt37/WRPc2aGtHV5jPWD/dHknRg9hTC2KZdIKEjz92KFkyzyK79EBaK3sJ5NquutzTqgIlDlDPLNuqcV9rviu7MA4951oRmdRVoaVgiNsNZLolhO6/Fc7vYamnX24a6OGsJAkKE1Pek7LrApiHlrK9UWvw37Eu//Ct/wy//J3/oF375zm+8uLStClVTlKoIP3HaCWkwqezuQ+gcVd3oLKe2egNjptDYonfnpRXHKTZO56Ts0G+2wLpJO4hDfasR0DdSAmyP/WTYrd8cIk8rm3iTVsoNb2hVm3nzDnbYyirB2zZsKalZdroA1+py6Wkk4tUZ5lKv64e1gAYGy+AAkV/p9m9nK2YVeWVgqjFGYkwyKI2Av37zWrKimyuFq9lzrxkEJzf9WKt2YjU+n9vFT+Jfdx8zPuD2+NEqys+ePeuPif+95E+9WUBiRToro3RZxEieNGXZyScMXuTGm5z7xuqU6EfLE/2SzqZF0mGLOA0Ky0ikS3V/ngPYesV7OMJ+4n/d08sWpXO8stguHbhSo/ag5r0a1kfaXG/6x3XMdVP5a0lx/cxYX0L/hl/7i3/vn/qF/+Jf+At//a/9WqIm+pFlYgnDriGvaGvMdWr2tZumlwNkvo2UO3PiIP0COrxAHLZ2n9jH3wlQ1lDLVmf1UmiiXTfOc+Q6VM5QRIgfWsttCA/iChOv838pUV5pW3u3zGob2cJ4qm1a+JGSmpUCbyngSVOpKBMLzGGN0FBJ1676Fy5hAz3mvb5EQkAQEcLUK93Kznp3m+2LB7FP8EN/HggK92Erqhk/Bh2tHBpinlE/xfrZpXUURBruWBLnBHldhPSJPY/j2+PzcHxOGcQPHjyICIUwyYqAhTfeeGM0yHj77bcfP358//79r3zlK7/+678eD/j2t7/9Uipx738OKGWg5BSYKwEWvsPjvGgRO3Tx+niv9M2q7UgkO3dy6UyGuHM2C6SuejhrgOv++4r5hQ6TlSDd2LpIryUYGuPyCpJUp157urzPYPdd2R1WYkE0ehgvHJkP9DvMR5RxgrvrxBp/OVo++ZTO0uQwZO9UW6juEgWEkD9eF9AM+6/+6//u1/+lxwBe+41P//k//g+jGSFN4UGsHYll75drB3buRlnI1BhtailkIZCJbEMm04oztX76iLT1CtfCSSkSEpRWdN24emonYwIzLMmmtVRnpX8B8sCVEzalgZ2RfUQpYHgQTywhEOZYT1dFtrtE9Zasf5FcPCXdUgORDZqszM42ODkPWGCLpMCmPLT/jFbTCbvQtaq7GGvltKUr5BPCFhMOa2h/tIX1MUeWEGDHE4XDaYeJ45FsuzcCWX0MI2sZeuMWwdtQKSY6fXvtYNX+DJuqLHuB6YiiRTum5lw+nOTPlt9KlO/TVO92dHt7rI9oMp8/f/7WW2/99E//NICPP/74gw8+ePr06be+9a2xWb179+4777zzV/1Vf9XP//zPf/DBB8+ePethR6926W1DRseLMeDXkTJ8Hvl4ASBeILasKdVcnUpIvOGCV6VNRaCWH+AAMjcu8CO2SAEnWYTXvVg7R730jpYAmGpWLU6Yipg1GXxSdpJQaeverHR5I8MWMg53K1R3dh4Sb1ZoL5e1fWGPhoi3b1GOKFcoTYUjqSdN02X/1D//v//b/+SfBvA/+Wf+h3/6y3/g0md0cW7NZ0H0RcvwcFj6Vnjo/rRASWCkLwQfvIio9sdsjiUW8UQn2Z1Xxg4KKPCkqbaClybFQKm9k08jUbpmiJfhmgz/xMWGONb8dCblRvUT81Pj7lUN2vpSvyEScMgMUrJCwIjpLEjI9/c49UlvgEo3UW+tXvethU0s3WHkktI8vpoDy7yOHxg/R+BQzrN5arNDOU9gHuLdt0A5Gjrc9a1duptlifLPSotZy7M+0/HrH339My2/LwX1bv3xb4vyeVF+/vx5IMLxmN4vf/vb375Z38O1N8tqAQ+MWFZAkBmcZYl+3kIa/ICcL9xWsUMeNro7rvGtZJgE9fxp7xrH2omFSDHeg0neupKiZA0y66sC6RU/FYVU/xfF3cz8wv53jw1zAaNsidNhw1Rds6LfPPflP7AY/Kp5EO+v6D0F5oYvaiu1rcXij/38v/o//j8+AvC//fS//i/9t/5rhKbGch33PYkOYi4J4Z4v8/qFrkTVYRyUVt0i6jcSNa1s+NPgGruw2mcFoZtGT+vFn7jJXG+iO9hG2j1Hz0BduMp0oJeV4T5jzBHsLhAmWbt6SRgVbshR1nuqalHqTPDm+vjyHZ3BD0TBlOhmdTw9WgOXmMfXUGLLSnQVCwZxeBDbiMA3o6fxftFiMbGcOha3yYp4aVQT+lr2O3GCAzygt6twVc6ZNR6VjVqrNmQVLm7UbkgwHPfD7jS7LFt/9YZUhBvKbQf7hQSInz9/HujwWN6+/OUvP3jw4MMPP4wd0uPHjwMd7jXyq1/96htvvPH2229/+9vffiWssw49+rrQEuqqRaxbxYVLirIElWaWenFlo3axaMkiSrUtJyXuw77kdy4qajhsWXkQw4/MM9KBOYtgWW2mx8xRcVxS6iRq3R9EDyljghc5ZbrxNA2hoq0c1vCPyqtN9AnOfXd8bNvUZrOT4IER89X6lppgC0/UgX5kzntUFaOroeeNnQtBS0bcsNgHGfpSZmf/oqu4g36AX7FMKEeV5uBzWefYIFxSZi7JPYFFzYO4orLO3okFq8tpgEdi+7Quq7Ns3oIRw7C9LbJW33BxTQk6WoEjc8vVHRsu1mzZZeqgrSg5LjADC+mTefGUILAUsiuGuAsGqQKyxZPRi+ywyEcbZqo94KBl0TiQaR1qDbw+djBqfKLiZqx2MUFuSpAPpTSSbWZPByt2NuZnjXysSaw2zM1j0k7guPgay6pPYs3knepI1mOs4aKTGdbJ8p13thqk6zN6EOsW2L09flDHhx9++Pz58/fffz+CjAC88847od0JYTKAt99+G8Ann3zSoYo33ngjyvGbb7756gDxDVdxFxlkpan5Dse136mjBO4wE7jD8kKpjpFks6cIGHHQyO3ACjrQezTZ+b0VEFJpnIuXyuSFRZeAYSDKhZtz9gyesB7thoNeqU70NnoQd9psESO8fMikjbWp7TFampnt+wB2YU1rfqqXcXIYuOppownRwJNtHsQp4VUF++MTtiAyrvP9mstBfGthZYRzsz/0shigc+hjMnjyFK1Llk0G0LOSwWdNx8GGSy+bixWtLCYuzDNq2xaFYzwtzZF/EyY8nvaeILdtsSZo3lTYMzLaDSkxfacxSqaM8XZ0YxUZqq3AfebRcE4GYZtBE+WqxEO1DzhZ2X3RuAtyFZVvc2Jn2VHm6w++8nFWJAFaXB6hWtsLJ1zthNRO3aAjk4PFTcqfeWX8bhnH81/4E6/+4EsJb2vU/uXl/xIReGQN37179/nz58+fPx8BxEvU49vjc16UHz58+OzZszH076d/+qcfPnz48OHDl+mLO314x1en54KGxUSR1ZA6nkHA1OU1bIUoaWwlQNLXwZLtbi0bkUaV2KfqUbAYAribi+et4DoZoKe/QDJ3mPn+PDLW6VpDW1T5pea4Upeil+ClyVO8czbh7MHydjV3QgnJX+2KaFDBXqEP85+jlSIO8E7p39SGvHUO1cePalAtNdgtgrWZ5saD+BzSrlCsYOYSAks5X6vPcEF1vk6CZ1j3ghitJHdXwB2H5QjHM0/QgbmGD69T3BN0YPkUB+Oy1QlqNlkCWn0Ve9w4b0EcbsjallLddepFLKLRCnit5LBrpWntQex115ROSkdG4Qt4tySY9SRnVc/Jbv65sVgZYW4DpupBrMYg9pGGfBOH4kxPvOQ7BmxV3S26TG1JKh7AHN60HflsFfn71AjfJgC9ZPLx+TvCKeLNN98cdyrhbNUH7OchvPfv3+8eW5/l86vfRS7zavDS8FC4UYaSKFtMJc5WKTpsz4dXCwYkpW43cb6yBDCX6HeYr1jO3BIVgTaJi6r9s9xm+wbEhBM3CENWv9mENt586EkqWQWIL6uM1iJiwoCj5SvLvV5ypWAhKozO5j2/+rKMSigTil2gGwU22sDKtlTJFHqcUocC4S/R/yy/XmglmMVL5WJLqDssUHgE5enyWrrN/yQXRDDGuouTQrMh1tqleHNas+yElAehcQMIeObIVPmtR5bEkuAkJpaEsvpgC419tGRu71wXUxEshpmW2Wo5FlnQOR98wZqLLHvqWcaJ3gAgne0kl78HaJKHnjAtTr5VjFPcilL2VNw0zF2sRqsHfR7ZU0ZCjRtOm0830ZtvhhJDrlvfWdT1IY+ozmODGnZEmarFRCeQ77D1if1W/Pa4PT4/lXc0kbx7927AvlF5u4XlSGSLKhwV+VWOOojdw+C20NKawjL71HXorFQITENnGy5vqnQMFtnJk8b8bsZ8VBfIjBWuddmMdIk+3P0l+n/u0jz3i2KpajuHxRhpsxT4fhQuHMxK80oQ2qLQq9TUWtFkcesfZFh8FpFpIwXTZSWM9s7sHVaPr2yynay5gA82G4ydvgjd/wEFlmFc/OVrOHDTrPASHO+wvDxPnae2SNtqXo8a2Ms9dKKe1WslB0+a4k97/tqB3mG+wxwt5QtNp8or3zzddod2QAlR2nQGtVgNl9/qkXfbJj/71EEh7+z409qK4exdfaaRIy8HPfV4Oqvpvj2dlYo7qG9TQ+KW4HZZkY3Gu998tHCDaTsEqka/Fg5ulw5mWVYq9X9T30j3KHZs/CYGm++QCs3alwz/QI/f9fBP9z8vffBbb731rZcdr/KiEU933geNvsO7dsO7xsS3x+e8KMdoIYDj/pj4e/z85vt/lyGr5qrksnlwJtzLh/wMEIvHYlILFiHKDed8l6BIOlG6VxxIGTzQz0reYt85cFwPzfzStlpKl4CqjedVg0r1UrC2PXPt0fyMcXVgIXxiEGoxwa+YVz3vq7nMLdDBZXQsjLMSwvhRB/ohZJQXvmVd/kRcPaCH1K3f6tDVhrXC3luKPCRtbEbI0dKDG2AlNS+jwQiQGHYIe8aNO5+RUAqh8+B63IlQFkRaDm5aahixp6ZG5Q3g5vaTtr8atUFpQijT90JsmRPdzqWxBjViu0UmgfADS3DUDuG1wsUsWatdzrkau5t4K8EP8oOqy0SiwBB4WTlzS1vt2PcpHYp0h6sayPTqJ0t9vLGkWt2u9Z+/43PKIL5///4mhHcz3H78+HGAyONjvvrVrz59+vTx48evssUZVuXQclppRQvari8HZKOuY4FrdmcRF1k70GopoIsoq3hDFkiQYqbuC7NK+qr8ltoVm0vFZRMLdyx8dtCnHkrj+i7mAa0H6EbM8JXFRHV72Dm37bbfGmFsOqhNQYIIT4I7a5BorLzNgzjC4nQjwFZtjAa5DsciQgwBftpumCA1OUmVAAEAAElEQVSwaqIWBnEIUiaUSFW6RmoFQDue7KvKu2S8mrm79U0VBStwa/81aH6LmGUCZ1h3z6zGCOCsqQzqYJ0NLayNEALInlcVV+c9c/0tq7F7HMZ/N8iyEwTLEjPNKDa+8zYJGPRhcxOCpkXJMqpTWZHzdWHjOVY+sgsqxABrZadW35asWFm9audwAmZPPeWvW3T1fQmbWeQU89hF5d3fZvWg6BVxgpr2x7kajYxfi8gd68RbD+Lb43Ny3L179/79+xsG2Vh5o+x+9atfHR8QVTj+6aXVJELYyEpb8GqKe3EXmT3F4g/UdbCGgl4WfmRPwTVOkMPO+9fwGd/wfYp4wgQgoRQyw3qdyqLRJnjgsxuQtKzbldU/+bk6p/JNexhpsKSHFnqEgNuCH4BvM8bJiyXc4moul2iiB0JKLNElEmjdQWhZnXyYUZ6bQY+M456h6lvsdbFf2LSp8atNVlmB+4IIy+65qEtyq8t4Y2chIYSUsxtNY4TO+SUUF8BoPE3giAIiayqwMNbc9G8EIoR2BLKx30WvwVlqChoYxXPxUzMgPsgzFx/Ps2u4JrjOmhLnEV4XEAyjk1I5m/dHNk4nKdtngYnPNV7VtqTHG5wlQVm14MeRWTAXxreUKH81ylWgz4R7nZRo2b1Qk/zYLGLGbWTk9PatdqIfsUDVrW1m1xX120QvM3T+bT8+U7bYDUe0PxFVdwn8ff3114OCOo76bgHiH8Wi/OTJk2iZx8fEbz158uTJkyc32JLcsPWM6pxj/aGffDqj01xcr3kZ4jyzet9azzWMuBrXLfFo0f3BE1RuVEjsc548wUojEbMbTZzvDiQSBvpLt+broOlarFVlt0vnGb7DiUKoOYEJvueVwHWbXITD2RnkzdzJAfrURM+yA71Ylk/RxfulLNUVxqoRhNXwohTWud0lDCXiz6hFiZ9HuG6iH1gmlO6dyAsVatxLGXY1r59hDWcHcKwUIXHKSp3fc7RaOGzlDTi0rtp02ftHohN4abxTp+S7rLjNSDnViT4aC2q9IVnaXrYU9ImeKqINnGXz3PC62DCIVaaIgRVaoWSdbZxr3s5o1BzKfeQKuowVq17S6pIVL9Olm/RSTOXtcQsQ33ScJ+FGHl1vTWNwer6Xip985zvfeZW96fO/+Ov/1sf/Vpb9ZRxOv/v32d//RyWTG4JQ05DVOoBqTueo7R2DauoTFkInz7WMVBjrK8HKTWs6Vh7EZyxKEbqyUjyqNZ06wBM9lO8vPVxW9g2Iz8rPmROfmU9WKtO5pouJgNED0Z7oV8hXyGHMOg22enumG4sH8eDHtLtvsZDGRIr9VI0+fKIfUO4wQ2l33Y5+bGIpNO5S0wSo2tbuI/qZnEJOE59bsTXpIXXhp2E3Rtz2AR8pY4kV3wzuqbfp5qjZh22NllhEx9Rchq3rgxbQBCzVXmOIlx2ms2EGcoVSYEZR28Fp2wA2S6lwwY6LcEg1vSRr7fhsgouMeb5A407J3zCjRxx+eLaBNRfs6jqGUecyaPUVI0i7ITuNSW8JE6VAYltPvsyBBpJ1Gdr+mDpwewlFAEVlKC8EClH96mQF4gOHCozYqCEZksOZxCaYaINq3ZbH2+O3/ThnqD158uTRo0fRbfbault5e376pSf/y7/4H836P1/7wWGv/czfcvXlP7S7es9u45JdYJQSfZYFFybBj1ZGQPYOy2+FYX0QSGGzkouk7RH5FY6oG56jwNwMmvyM6ugwwgssgwCyUgEnllkkFxsZ7fXDAGgut22dbR9wQsnhMuFWUimycHtcmrChmXTYhkSMFs7eveyNfp5O0HzVpSWkzkqwU7nf+XMx1K9cYxs07rPs1Fzdd/cVLmYlQjVVzOhQh1w1tGFYULzVYpjdDuYcvgWJTtOQvj1A/GYtATzcJzY88XirAV4PKhzOSoQmZBLTHvt1NIsPiVneAyhsrbgabYhT5dhqZNHGgw/w6/b9FhikzLX3Y5iQcHslACD9wNIUb9XmIqJsXiC9dE8I7Hh5rVwaGmmrPWxJ20PV8RSRJtkeMh4OEhJPsB56s9vBaqzIVZTdMxwXIdEMpioGGmIVh8Do8Z23GHqLt/HFWcZDfPn48eNxQf7www8BfP3r1RP561//+gcffPDhhx+OtNPNY26PH4mifHM7fLOr9a/+6m/8Kx//v17w8ILp+FN/ze//o3/nuD5Uz/dagypo1YO7r5hj1Z1fQYjM1c2+v8AOGCiXquIdcYo0oAgco1HwGDHGNKsGyxh3tbwtMYQusSV1d0rKEoi9VnfosqXBtk/XsFYTrv14BaS1fe9qM7B+nT196mWpvhYO9YRyQPHoDpUcluRTteaQ7xlAZ5k1t1/rVK3RffcGU83a4e7UTWMJw4HK3qUm+GFB3nsiy+ZaGD+V8wbk8+XTDpmpiWhpwxzR6BNKFWSzjs+XPRXC6NJeZawYpDNTDRsg95GBHgvclFuq0PAyWhhA+UHe7INwdhqsIThuAhslb7SY8CqaGRnEVQx9jdQ9iJs+zOyMAL42JLkE1a+CdpuRtrqDiRQmq76cfPNNXOQtg/gWIP5ujgcPHoSs9fnz5++++27sZr6Xitgv6F//i89//tG/Hf/9V/7hP/T7/v4/uhY7iJCZTyxWE82EGuFV/28JQ47JUL3I3cy9YoteeTxeXSYq5WW5tb3zepobsso6vic2uwYZiiMlKgsmRdynRTSeqtFMbRQEeHAozCXJSpvFtS21BC8wLhCWGhom1ZppoC3DwwBTWx/exk0VRoyUsCJeI2FA9Mao9ChRS2MmDrazvKh0bBizqumHWHFMR00e2C5mXp2Dxj/rWi9uoMq9K2TpjidzVj8q+CB7DKnIrERtrOGGj6N+OcWuocGvlLN+f3174EuyUIWYJYTfdBETCSG3jxxcvFXUbzXTiL4oZr1qhaFM5ImpeeBqZPdGCm38Jc6Ntd3TMI2Xoe7EHL1Fl8W+zRxyVHOGnp/OLvceLDLlotUfrsuhiCHr1hemmxWwgDnCjMNZH5yRZkylPb9EEawO2QMM3u7PWZao7BYexAZ5cL4a2F3DXulRiY8oqY5tc47M9jYVCNQ4/FY64bonMkk8KGXZFeH1a11C/1Izg97F02+P2+O3/Xj69GnkpIehxEcffRQ/v6HyvhQg/o1f/DO/8Yt/pnYO/9gfK3/4b7bKB6S1DAAJUdwWh3I1HrFpokPKsqmlf7g4o+p3TkoFlpu7QqwbAIpzZn9ynjBJPGmK3iPC0zrPxUXCTj5NscADDia6SUIqDfecEcJARPhJIq57ErRSRbsGzErrjA+B7pZpk4fwiEXxzqOSpiI/eZowRabHIGJoYGuL1DtrjuhVcVRdF4qnZO4tYiGWyiIrSqVph4NuWWQnJcJFFLAAM6z2M6gJdRxaiAzLSPFmZlnwsnuJV7OONXiYY3zq04ElPo/Dwl6gzURTDJ2LUlC/eymfvXfvrPRzBA1KsefxWvJQZKkOU+sAdVZ6DbMEBw7sHhIrUpILOQjXXPwHXLTVzqJ7b2rdiNY9Fet+LGqzo26QeiApe62FFFl9w9Sz+3gsmajdJltiVNXJvL3cYNhFBGQfO6KEcqzuW1qxghUblOpNbC1WiLWHG8MDF9YtyQsmWuzqInKZPTB0zRLhiUVKqpDEEvrqIlktI9AI4DHROWk6omRYBtPQkfY8KY9OnGJVsVlYG18jHVnCNbuxsVi13ortLON1OSjqfryPd99998GDB1/72tfefffdu3fvBqT4+uuvdzj49ddff/PNNx8/fvy1r30tPII+/PDDZ8+evfPOO7cM4h/Fohz5deMRP3kZQPyb/4f/3X8Yf//9r9/7fX/07/Km/Fi7TPhEZdnUBnWl7mlZwBnpJPMmNPG6UKcY0860WNa06C5ikbBGAaGQvKoWBl6HV5Sx2ehZVpo9iT5rOvk0e8o+FZ/C+8iIWke6L79bU+S2lzNCCLJmIQFkFoqCFU/y6h0oymnuVozZzRh+yc7gWqkmqGTYSdPRc5HNSrOn7Cl7MqDQiiyxZNlJ0xXz7HZlftJ0ZJ6VSlRhp8d7cxNNbtlTTF5nT7NPs1v25G5el1hDIVjqgkqXp3GoGqGgBhVwVsqqz5ZlbTWOry/1+V92CqRkluKrzLAaHCpzbyQkJ52yXvSiUppoLiu+cEIllOhsG/VbsScRZ5i5SEoMyyBXCjf7aj9io/m8tW2hLRA/6G7FLVvKsmtPkfegWPNHyhTqldacuHC+Xypg9bhfEllXj4mtRVC55vbVx4iyCrLpLkPjznoYPbPeQaB8QFa4BrGbH9pihRTjf0HeRO1tq9Y2J1wiOnqwcKnxey2gnk4i7ENbmo56pU5QzQwIuJlhjeiJaPS73CbZrI1qTR0cEOlmyVXE0HMneswhYm9WAfatq1bbylXApCE7nzmK5/a4BYjPjg8//PDevXsbcvF3ffyeP/B7/4F/8o9cI/3//LX//Cf+6t/SQu4jGYZHicWsWtgs/iqxCiUpVtykBnYF4BuzsgHdgmG5BVSXS25MJBrwJMwwkUndn3AdJF21o1Xol+hyNIDYmqk0UTPH40/QTVUdY6lzH42atrJMmyKxVJH9lc3kbRkNvBsmt6yUYbPSDPtUE6N8gA6cZKeYX8myKkMk8mfD9S+7NSLnuVn+apmOoJ76uRtNRkOS9fk8MdDb2hIv1SUqMSue7WBpzh+xsprcYD668KnJTyrrKpLxKj5Y66ihMYMElrDBrcvyzrCcbLN5iw2JZLF8cz1FDMPl+hEdPAXLrJkwOs4M9Rp8X8To3vsFFhPUY4xSK/TaA06ddGOxSqSthOLEMpsTbsyR+soKjy8z1WbFUI7MGcnohh5HwKxK5Ytr3D2hQul0Nu/8xt4NRZI0bYbpwVDItAzLsAQFhzo+YK53Y+wkF5Op4fKoA9twn7CIX0exlvOb4EdWByXBHJroB5ZD9XsqB5agLoKeKkqOAs6wa4ReSQU8IXWfRFAFaUa61iTgRMv1gmGwySb6xBI7JX6WhlXVte37cdxW5NvjlfvSTz755HsML/rJf/C//No/8A++0MHFw+/5XS4TPbx0IBakMeptM6zz2smYQSfHRC+0a6UEZSQBJ1lBikZx9tRdlbKmHNAtrMAID+ueeFESgSlHBFawLQosXMU7RzUw0FjZilKOzEwlkgcog9CUYTNsRoDUaQ4Du/N7TUAxMMlK8WRJUfHRQGp3czJjIpHhs1zStaYXmurcTupwbYX2CKyVgWrvGU2mEiVnVl2RMlJZ3IeRlWophyUETCwHP9V0jSmCAesYewRHwXiqUyx6bbw8e5o1zUpFKcOsuSfPSEXdQykAYhawKJUaNKQKRktBfqlQYECvjN8yoxcxsVk2t1G0nSkzsuzapyubtXayInb4XQ44cK10xeJAUep85HGn0czz+smIDsqtzhrdIIOdwLmC+IG2syf1zagmG4HCl0Ef06bCzDRE3wuiPv/ygM0cvdksKlQsm25s7HdV90AFQ1APuXWFGlOCuQbKR5Z3z8YhI+3HDd62oU1kShVgYtX6qM/XNWxjasZA3EE2w4K+MGPs23G2JtgsA1Kiz7CrsCqOq70GRtWdRTizGeWO78KDWIL8R8wG6p133nn+/PnDhw+/9rWvdUS4Q4pxxH9Gvmj85M0333z33XdvS94Xpyj/jX/TT779T/6XfoPH38J0/Tv/imPs3ht4I9V8UXoSmWUgslJUOhergSksI0nmLTh0RipIAdjNPkUmd3cbbx2ZdQZvI/tX7hHDX6LJclQMbsXTCz9EFb72w6fl6lQOxafQsGfQqOZu3GquTyiVbUk3UTCiaVpgit4tkM3ik3xCKOIpYSrM2aeTlSQnlUSwSTzD9ocs8JOmWXbth5Mfsqf4p6JU5BJgzHB6goGKjNlJwIwUAK6qvCRyaFJRutYRzqKUZbNX43UPH91COOWE9RDZFcM3K73QcUZx2UkWm5+oxagBtiytMZ/pCV5aZLq7XTF/yuMBtU/PSq4UqH2VuiIWw+Ekm7s7SJqrohBq2QCEaObGMnuKE15oBxYHX+gw+xRjvODPRUTNzDTBnZzdstIC3Ht1fnQvRelah+Qxo0fddClln7yeTwMg8winKdUYerWGnzQlukNzm+5XU+xg2UJI6FEHLsuw0qDzIqtJDwHHDsEzip3MxlqTCorxiL1ocVXuqEUtXllWCQewCZaRZig8ryqIXPl/JpjRvWXWSaElCrZWZGiF7lmbGHlWjDj69zkrTfQr5ivkRF1XMyubzCeVSFnYhhzWwEJioScX0gYrsyV7KS4/Y9mBv9bqq1coyfBC+W0D+4UHiHsG6wcffPDgwYO33377BkOlz3Qcf+edv+71L/2mDvDfkf13/NbcXXM7XKVBm9mIGxQpN8GEukRr2eGzB5u6KiWzkUuXJ15t77mMaBRdWYFJOpKXMk3ZcmOD8YQlnIerRrTOo3xMBh8TCYxKLG4mT20evJbnyBAwqIxsCHV0QDCv0y3LsGtN3VRoqvSilJFKG0GDzDJ6ogHIQHVGP8kuZb9KS8zOMNlbmTD5AFZ69V4UBx2Td8NYNZjeSXXSKbHq4qVExzZudXy5Ako4Kc0wB+ogvZGbsldUGhckjcF748AVXkjADdstMjK3GDQnkBGiY0LbpJdtxLmoBo4XWWpa41jZg+3bfQY7OtwuBid1aPnvVkMau4W/74p6bEkAALXKPPRo/mXZa4Um2D2IeyKE0Q9WAsB1L32zE7y5E9MdRG2mk6nOwHmqiJI0uAmvFaZVelv7c1lMrQ9WS1SYgh1CJdD5+2JItGoEVgWLKzGtnr3Km7AXSoU8wHuEVJa5mCqyEOOEdFKakWakdqlX2nXPe/1MpVF+W7Zujx/s8frrr4ey9dmzZ1/72teePHny4MGDDb7wWY/DT/3uq5/9W92PRZbggmelWKmiQDmYNYU9wrm0bVYC0RfnIs5MDg8cLWDiuneHFU8AJiuRvNELkC/+BswyKvq0aRm/QEZM5rO6wJ0J0QvTpLq0wrKMspNV4cep3v5pdstIpbqir03WnNXVp4Wmuqx4giGIz1nJpBrE5+mEQiYHP/WpsqErU6UKmtr4bXn77jSr2LEG/o4afBYhb95EhQHsRrEI4DIr/Wbz3v1Uh1MAx54i42uQTaHITpqkKE+pL9q5Vp8U36+gWemkdK3JoIgmD7byrCl7eC5TdcNUvfyyrHiKIFzFZBoocg+9FFu+mZaubNepp04Qz5dRbAtnFMUZ6QpF4AnWrgC4WnLBANFaGIy1zdtEP4bHorrGyDJSjA+bvozOBSYeoeGR3NTA7koSf5kPZg0mCoKZhgSI4aPGJFLVnf/lypWbnEXr97U+hwnuKD2cJy6+2Pj2ZAKvRs8x8EZsCVr55smng5WZKSOZJNaP3ziJiXSjXDYrHZSKOCMBOMlnpBOm4L7NStlrHl3ztmJIazPP3a5erep+XnvRt9566/79+7u6jffee++tt956/Pjx8+fPgy+8ecDdu3c/+eSTSG0JdPiWO/xFK8q/43ce/+Yv/77/3O78Jqb/DFf/OXySH+Gdu9OgMYh1dJqbni/urGbewjluPSSXzZ6yW/HkUKZZXdJTVqqAoA8AMSAm7/Msde4jhKZU9OQ+ncoh2syTH075mMtBgeVFt1v1GNPSa5fEnNB8/ELpruARm0EuY8EECjCVhJKQE4DoD11p9il5cbqpCkJclmVeedAyd3LKSiefTuXgMHcjmWXJzYxwznBazDA1azoJr1EF6YQpK7kbSoiBTWbZ0ws/CCxi8JG9ocNBH16JT9WLjTWA2H7TDxNTAMTRf8Uslp2h5VNRikW1wDvP02gvdPgtPxys1G2VxmSmFt7uXKogCTcheTVtDtHGkNVCuaNwuvaDh5N+hBfBTn6YNdWPBsjlTMXs5AcAiZpVP358L1TFXGTBHM/F0rXHmJKn2G8oydvQFoBMqEjrZhcQzdoJiVCuvxvE6mZ5yNrXd+/gppZm7DPV3MYmFRDFe5CjNcEOQ/d8RBGQaZ3Juymss9JEFyy2c6X6pFVI4QSbkQ7JC5syu0m+AiAOlnTbStWj5TB5y45auvK+ozDqYH5UkdGEA8sV8xVLbJwElgYaGHzMGBw3LT2KKbyeqK2PYniTmtXMqlAC+XCZVNz8lSuzKlPq+6EFujW2+JEGiMeR+M///M/HuDt0UpHuOh7xk6985SuveGGclKL/UVPTE4jpGhuIc2CJu0vj+IVqi1UlFC/KvAWyUygrVhBeW3fGy7OPlRoxFtaE+ZvtuRbgtqbDBUu0LxbrD9hGTOo0xTX0yeou7+YqVWkYBM8GW1FuEZ5mwGJkURk9VjxlpZOnTLtmChHHHdCo0tQT3coq0QtSlo6sHX6syH5TLo0VWfGUrIzO/6PUYRAjW1gf9PPahtV9O6JmE8LRBHH7ojb8sDoe9NYIIdWpVBdPDaCPZjv1qLSW94qLOQcUTJ6kRX5a+WsFNjVfEtQBKTMSUaItF3lmwBFGxtXuJwbRod3uF1jQz2ONXq5YE82tOlRHEO0CQMaaPjFMEVVVvduzVSm3WSDDuhcSTkgNmIjvJTCRiBhm57ipDhU8Q6NxMFocTZzqXDFiABZeEzPspHTSlN3UaPiD7W/tY7tKrjk9mVCivSdkZBgZH1AiQyk1n6wD/Qp+RDmiHFgkZkzBX4hHnpRiZYizeY3UaqpJTPLJpyieJ6YTkoeYfLmGm5nj7Rz09vi8Hvfu3fvoo49+7ud+7vHjxx999NFXvvKV3dybqLw3z263Cg8RrGCrwUOyl2UWstPuXxZ7wejWVO3CT57upIpsBptJwFynUIvFBFwzLJvN6utzc2xwi8SzwrRKF5EMuNZkriOzgNg3u2j0GPwEOjxrIv2ARHhRBJql6JAXtHks3g6MLqzVHoFFJg/haopFOdT3JDKSQR706jALbjiohGjFpTGwE5I18V50qiguWiWkBOtkhp08VTqMerYns9JJyYEDXJocfKEpaES5RvhinOYWcVYKk9lFDFQZxKEvjpBuzUzRgxGBsLNqcuv4uU7vAHNPORzte5yRV7cKNSDbWbdcUVm8+U03/6fdWrtIXi7hraOSKZ4/d+1nT6pRtdpNKEfYTHRb3pBnTnC1LMEinmBgBBuyNHS4kZ64BoihgbWHdYYub4wlCgvgxNX+r/lQVYUTK6WgeMv6u+FOXTt310zFxZK4syHaezvAM6y0/LoCRpN9oM9KCd2dg1JFlBaPMtHdZqaUvGqrYcY0V5eY7ohiCQp/8NKcUmZPICZ63yTUOT0aDvUFWJ9vcPW5d+/eaDF8CXa8xYV/pIvy/fv3Hz58+PM///Obh8VPXkqo6v1XeJImaGKxutqH2DLgUrrMTLVxa/vqE9K1ptnbrdduwIAmQ3NTVEWQlWHaLAvgDbaz0LxigfbqO2M0w3KTp9kPgYpmP+RyUDmgmkgIU+P6eFoMeXOybNUIw5sbriAjTBUjro2doUzIidmAkAWbfCr07FmkkQ5ZlSVF/w8UygBT9nTyQ258WCMzU6KbO4wJha5gEH/qhwPLjCnDAkOvqlZBblLKfrguOfqjk0/FD41CayxmhRBo1mfFZwBxeuHHoI7NzUUqR4mEEh1k920o7jMt9SR31zUOn/JwRAZQGcSoe4yoXkvujyqagZJqyWAACNZD2SFGC17cioyaHFbgxZOD1z4Vn/r1ICq8L0wqSJAXpVIRZKOThQSdCZ7cUwlPD1ZPifAUyrED7IphLjw2DkERudozxr4iTlQqI/28dcDR2tfI08j6WStaIvUhZt4uM9YWuRke1rRAF5t9vzg8wawksARALBbwpGT0XHveaOSVkYpKuBpi8aeqJvulOnLbmCBAtvQsOOEHlKkbV7aXN/iEyn+a6BPKHeYrlIA4vIqlYIMTIxZoeNkAXKEAuIalikqrJyS5G5qfVUDAFoZPdGmROJO3SO3n8fg8Rje88cYbJM/x3y9/+cto+a27dsOXInQu9Ks8IZ2QZlkRq4ELBXj1MaAHXmb0hRo84r2BDld/iVhBg4JUYjWl+crl3Xd49EtC3XD3VlmittkaXTNoVMuy1Ai3AVjGPNVfog6+wgZopA8PvvJitF31RtVInNVg0FON+LzOpRqDOJ00Xetw0jQjXWM6KeWFk8zS/IY2GEH1oXvJylBNFaSe9LV49m2C1Ly2Q2hNWrOY8MbeckNb9qiXJYASwwmpxSDDTrBTwwIqItwkJ81Osb2oVhISNI/o2uEGD92W71YL52V08a8o5CybYY7mY7DO82kTCqLhDmVxeOh5OKURVwOh9mAQJ/rEkuhhJ3SwcmBJzMbqshKDBAyhvfEGOs05sRwsbhb1GtyckmoYcQWv3dw5SkcvuU83AQ7bpjN4u2FGbCelE9Ic+1dtpbdaEsyr38g4PonzNtEP9CMrBBxJUwk+sUYBBFJ8ZDmwHKwcmFOzgnExHCReaHqhdFKaVUe+XtlzlgNIqndHRUOioT1aOcS4tQ0rbsvj7fHbezx58oTkG2+8cY4gbMruJgb2kjHxHgA3UAAQPm4sstnTqa1UpU1c+yM72bAgiB4Mh4QY7gYgO3t1mxknWB4M5aaBzQpNOudKAU5ZKXv7y/J3y0rXPr3wQ1glXOvwQodZ6eR1IlXvd59OXmfMp+AOK4W/RPbkznWwdRsMeRtYtoYkCL+hsc1u2VMwR+KpTp6yp5OnT/1wrWnWlJXCT2M9LV0tfe6M0F3BvI4MrakcUvdfapuHyrIJ3eu1pt/C4bd0+FRRyvf1fyWAZqWMZfWryiE1vMCn2Q/xujGPv24GFKfq2GjVfLAZCrd9S7CDa5KetHR6QRyOi6eBy3ZpASVWqXM6A1sHP6mtXZWD15pm2ShIimlEQhWgsKXPTV1aVWsE21WXQltdmUewGfYilKpYRrWruT540nSKkcBmIn7hxopU1WbuNNKF6mQ0SL4TfKIMSlbI/XMWM5tLM54go423c7gwJfqRfoyM9WaaPA3BdGwbg9Lsg5dZUfhLeIpre0adXqAl3O69SV7HI2M+IbrqljIr7qA0eEoKu7fK7XF7/LgU5XOv4Vepy80wBwSmqvX26p7Tgj1i1lWQujAx15Ja9Si5Ok5YQF3hFFzc3FNQiFZKl6aYRfWRiD9J1XTCMPrXOWrQhxOecpnmfDiVY0WH5wnzxNmQE3JCmRrIW/9YNptpM9PMNCPFX05mszEb628lhLNESVZ/xSwbSkJJXm2O44M04X+tXFNROvnh2g/Xmqobsk/y5N5KFRKA4ikjzW6/5YcwfLiOs4SpVH/XoNaEQMeK0qkcTuWQ/VC8GSZ4gps5rdDKgjEwk5mDxYS98MOn5fipH1+U4ws/XPvhVA6zH2afQrJTW1SwIM0etXi6LocXfjgpXevwqR+ufYoOt7Rvik6r+heyREdIK9aCWqxaNHb/kBLfSLgoprBezD6dfHrh0+xxxpLaXih+Pap87MTmCqAnZGMxy2QhC+Hmsrl9tFM5XPth9qnSjZtfRz2fzWJiPdtOHQGfu/QTpvOCJ3QGcctVsg1G7GJx69EO8thNscc5xm2VKn14Vc+ybNRAe9iUybKY626HEloLbGOi3dJTy4YuG0tjTk9UosIAKu0ogFVZwzbfsfk1m+9wPjIHGrCARfUa1QHl/EmCXHxgmcLAu2641NW9/T+NZbIGQQxpQ9ykJtwetwDxDUdQgM8L3je/+c0+EQ3B1KNHj/q/Pn/+vEulXgkgFpp9e/LK2Rnz0lbMnHGby+ok7jBVXiD7rCX84GS1rK2GRX2ANN6f7J78XZYum5G6IHT3vVtznetwlcuq8KS90y5i7avG+ovX+lZXN1BmD6xuU6DA9dSHQyLqk6eiBPGFH174dK10rela6YSUq68iS4+4gUmINJJZU/hCzi3S5xxGGKd5DTbtQpcVKLre7lSAOGwN66S6/W/LXCXL4DVcX22vXWr47IEFUP1SlooSPUmDIXoQ0PKtjmTkwQaiTt/li8iyEZTGdL7BMNErLJIqW3zFpdaw96qJQ7GHm5EaCKsDy8QShvRDTp03FNhTY7hNwU9vuHDAoyk8O6EQswSkEpOGQFoTypgn3mHiXphbgkGTV6P5X4xMOyqhoPtxy6JdnJvLBGpfjRPSSenk0zqsacHaNcRolPZNhUm0RIsYOubXOIfFcGiEo9UPi4mgNh9ZjiwHlAOXU1TAWfZC02/pcK3pOkZNCKk7XcwNTpo9xSAqNtOtUY9c3XA5uT1uj9/+Y4xEH4+oqmPZDdlyf0BU4ZeWXZ0FdFRr4MHcbViLF85mcAarnWtDryIbJ+pj4+1WoYC7jQL23IDaLBaluWbdTFnppMO1T7On6zJVcFMLXnxSOnm61vSi5sZM9QFIXfweHVQ1l0Ca1fwlms38FpUSalcMq9OyNYjsSB4IV2C1fojha5dARunJjQENoMbvDL6xjahVX11NlthN4Ytbi4ipbyNmWjF1+y0d4s8LHU+a8ophvdBPvCr6bW4g+1xRcgtiTvH6EqVxigMBPNWJWphQ1d1Xr+1F/ReTe9s5DKZ7C32mhZL1S6u5kYSxso2Ckt0Z5Bp7rduJa02dKhsTiCFSPLSlqw10TOvDpK8mg7PaKahZDzdvwYCYLcbMZxYTbBORCnSeanYfNvwagdHqD1Le6AP9CuWwmHf2qooVd53qo1ysZ/ZRT33PhyE2VE39mnIjXFfEGZ5QwmE/iAupeTQRmFi4jQmCA5HR1C/4XG8lKwOxvY+LYh7Qz0AYdM6t8p6Cl4B6Ay5DYt2qSG+PH+eifO/evddff/3Zs2cjp+rJkyfPnj17/fXXXwYQb++OMZU61Ax9iBub+dw0fGHZ36pDzHisF9CiKRi1ncSava5mjT5cIc46MQ3r8hoSQysBDZMFVshiyEmBmZaDlwPmifNkc7I5pQ0o3P/MpCP83aaZUywTM9OJgQJbAMRlQk42p4CSp5kpMzBiKfVmJ2Di4kN0mLdiHWTYQKgbHhqfN7tlpOzpWociy5pe+OHk00mpY7U1F8YJN/cqzJ39kMvUyEYJxVhomRZGAw20ZaHlhevlSgH1viiBnx7ncph9ymXKPuWGzHpl6sSnsPhQ8U8nb2SvYYcQPWv9UtTs//s3WMbws6pwDoS94u+xdfFDJO+dymH2qcjcY2pZXQpiq1AivSAkX27yRE/MTDMtXssNHk4m0+zT7IfZD4HXuwdI3cqdExWp3wpKsqZ+rcb+LU7IEPHCzr0bmHYr9q43ov1iSdw8HgPu6Am05MICPCMzITaxvuScsw5gKtloakN9FvE0zMsrSLJT4apjdEffeXavT9ARfgf5Nc53kF/D6Sc4v8Z8xXKo38qidg2vy+4y0Q2XMVhahajdOJo9bujMYVnZqY0NBKNsE4t1e9wCxJeOiKF78OBBL3jPnz9/++23I7w1iuI3vvGNu3fvfvjhh/GY58+fR8BrhPa+QqdaGcRzm4J2R51ogkhYxDvWlc+h2OYKdAbxsysdudp8V5tAum0YxOic3MUmrs5SAuplhSCD1BxP3eLLVy1NdQRfCJuL80MDeysTZ9QGVjvwygZdNgRmpdvE1P2BWhVXo/ZUvivbMLNixJEbE3GuL2L2iOnUGEPd7hBLZFDoc2PTwKK0dZKJvml9cWqg0gz0YfjQchRwsS9ciEVcDatVDXjNt2bQzcO5/W9/O9RkZWr57G2Oh7CIcq/6nSphji9ryUlYXXJoUWwLuG3SQiJuV1LzzRhlpq293HoQD4+rFlG9eOTaPFdD7almmypRLUpRrACxT/TJtk57xhKzxISuVangjprjc/1dlskq+jw2nOHJWzz5mj6/TozVOLegict3uvhL5GrridK4550YWNMLa06d9wJWrwTQm945tmsCSU0sB5YjyxXKEWVqGuEDaoE8wg/NZeJYWdUVAQ9/ycCFrwOqjr5UKB1jagziCo7AfPiwDBHAhfJ+e9wevy2V99mzZ2+//XbHf588efL2229HwQVw9+7diD+KahsP+PDDD+/evfvSdKPaLAW3KJaF6ufbMbJAgRfIrDQRevw9N8AxBK2sNripl8hOOO2c2dKgz9ktCMh96QiwOLoRr7Sgih2/KLVB6oTiuIVPwX5trKhZ6eRW+bCtk4QQUpIVM1SDm1SofFq+dGnyRgDuJiHeT6Uzo77i7FMjLgUFuL7t1SSx42LtyUPi582LsOK5zSky/lVebfRztNJKTRsRhOXAo1P/OoYWi3NjEOfW1GUs7bTLfGETxxmzk6Zrn679kDVVg4v6bkP0aq4FkA1LRwiNJtNjzRfzBw3Tx1o11Kx+lnO/JLHxHLNfpssAMJ8xiRaLibVHxRJSRyV6VI1U7ezZzvYSLBNgMSJUoA1Fzhy3OwzKWtrOGMRq+5ARpLaoWSwDb3cYNhM9oyZKmGFVrCvuXOc0m5NUXZW67qc9DFObmAY8cEBJSxtcx9IHy4fYOQ95y6Um7sYWMdxOItohpABVMuUrDN2Kr0y3SzvDzWIiCMXoNhSb8Mbb4/b48SvKAKL4PnjwIKDkZ8+ePXjwAEOEzyseU9Oht0CeLkas9OGs4X9hoRk9+RTykVphG5DaR4+lmRRVPLRbFtQ/Nqpq6l+8+q0GTGxB+C2TyqRyQJ44T3aydLLpRJs74Fspw6gYNlLBNDPNtEzLnGZWsPhEm4N+G8iyWQ50GGmGzWSuNNjKfq01t3Z5MbyszOKAXEuqYzJPcJOSK5UqKrJrHWZNHZScmzWwBxXHzQrpRDFVJrKVMinqSZlQUvhLhB6KhSgIOm3KTBmRoh1jvFPwav04l0MuU/ZDKUGCrvThJtmp2p3ZD1lTfE3XPn3qhxd+uNZ0qq4LzRW6MWwpduye8TYqETu1784QpKMc9sqUVzJZA6kj0G/S8isdbTD3ar5RG+pi9YsrmGZMmSzVZcJjDlEOuX3AZikZb9jQP6aWRPfiqc+PG0ew+RRjzCuqoQ4Lg9ht9qTGwWoWSdgkqXq1z+4CWR3r5Lgx7IjEMgaqo9pnVQeqUscwtiDFsDaeiTCb5rAf/T4qmF5LPYtZNS5h8yPlDvanQ+twr5h/B+ef4OkO8xHlyJK4YMpGpRWAK60xGTQJQssrwooZ13CPFHk/7MF+GDHi26X+c3h8Hj2Iw2Lp7bff3ihrukl/POb9999/8ODB+Jj79++/9957r/gqDp7aSt1UeEO0Ij0y3KaqvldWdXWolzQXHzxW9b11IrDBg0XCbRvSeCJtcRicBNDS1RhkVVUUO4x1ODf6zNTmMN1sSZusZ4EeGFw48mgkkDSEK96xkopIsdQozhWuaXBH6ihzn/2iWiZ5+P6kyKGDIVEmB2VLPkzl3bCCYv38B88I3ghHw4LhHW93t4JktsDInQ4T3do/94/9N/7n/+g/8Xf94p/+d3/mZxM8zBmFSh+rC3IAxARrQu7yKVdtEAVbam09BdTUKDnRO82yWVPG1BUf8QEDvnQfZ5WbXktGkSpIC/vZlkVXWuwOSYRCpDowts/jrZysrAkWC0NGOGGpkhlhMZJHa+S8jwDDhzqu8+HyBoCJJdMSfWJ2JYZR11mMusGt3T3bdlfE4o5tkCkm0c3zRHvNWxg99avQm1dDpmXgGE7QsHbz9qu2Z7a2EQmYkfKZPijBa7I5a3UMBvEsFlgjRJeonRUgZimiGE5iUkufh+jwAhoV8Mdcac4V+DghSTgxnZgmqVs2p5GN/1ka2M9hFX327NkNSTiv8oDb43NyvP/++0+fPn306NEozQHw0Ucf9S/u3Xff3Tzm7t27H3300SvMZdGdDRJK20xbkU2U1J30ZZSE3BdD1RFjMoTXW5AET0qUN4uJQI2rxYSqY28q8rAMFqPKWIChYR9f6t468FyPzT0BJp18KuSBxZpMJyQ2bEr2eG/GFJyTrJTBJgxc/Ox8dKKvBlJsldRk5m5RAmrP5rUiUMhyVz1FxZPDCE90wesq1LE4J4ygVjSZurmoUTqlGQFX5YgQYaqCXDV0fvZ6fgJ/PHmaOyLgJiQg//H/2f/0H/yP/sNf/PIfdI88uhTOSy67YozlUlmQXJOQrZJDJWRNLeYlPtfCUQJV42OrmT5JeKNak2pXSHWnjOFqxCSE40OvIcWtY4Ot0GofIO5hakHBbr9yasIULaShXmZ7Fex6aXVgpcOjcZ2Q8qEGFfAEOyEsUwL85aqAt/d0ai5S44QhUgT71D97imulTXBbGjGBNXPW6qjYScywPqywpgn1GkBfx9NxK8VuqWu5GoVqcULrnafBjzVZiL20qYHIK6SZ3YC4p/nVy8YiUB51qprRxVgDgC52tsHE2Rv/S8gONojKXElnpfUWKr49fiyL8ptvvvnOO+988MEHX/rSl/oD3n333c+U6B4QT4IfUAxJLQ7aG2umwVjVtcmb+1+uk90q3GwY8SSZqOJmYLLGvYr1piGMIFjoZirR93X+DyGYQ2jKC4eK1ZnUnNLJppnxJtxQRHcAmHLtXoL5FRQwFFYBJGEOmsxRBHNmUEa6bGZ98NL4mackJY+YytZxVetCTySKU4QrbILZKnMfgae2oEtCYV2GDSn2DC6rVUFkoSag2hTQl2mjwYmCAIgFWAGMgRHEl/HP/pH//r/3h/62b73+ZV5dW5lr0XFbClSgnQApBUwfuXAJsUOQkKzMnE5+eMF8IOcwinTr0lsA5nCHwOpQGKsxJa/4R03fKUAmnTaZu0vJi0ckjjqt1K1hygANpgoQIxFyR/ZUu7reyBGWwcLwpK6j7brXCj+IbvPLyIhiWFH1dCKwtP3nSZaaTb+PEITXkLog1AWQEld7E/20xwsZU/ISxS48iHupafnwOLBksb2zStg6t42KXVmY+Df+XGQVWoZlLtQ5VxdVdzH36kaOXj7S48eR7QqThUhNKFfISXagH1Bew3ykQ8Polx7Zswe4QXkBNZobafhSosxgWI3soL0EqhelC2YNfECldtUkxM/QBn8u8eSnT59+/PHHT58+vXv37le/+tWgum564Q8//PCGB9wCxK86Nb1///6jR4/CaP/evXtf+cpXNmczHvNdn24BJ1Qfw57KUX0hKsOihtQlaoyWqgCWWVAfOuIo1Wznydwhh3XX/Xone+9Glv/rf+kebY4KH/qgcxSYNYmQGOawU1OW9hyw3hb2aNiYdLF/OCJI/tFvGzWxOFnX+7APx8bsvE6oDN7g5hj/mtzDezcrGb3I4JgoSjRMrF1HmPo7klGTWJBmeYcG6j6jqho3+WcQzBUh95UB1GZiHWVu+g7RAYozptSsCzTYXcFjJeKSCXceem6CqCglcQa5Ej4Ejbc6HlSKd1CWqjd/NPltDM511nfzJwGNxZmWjqwVlSg5QTVjE40WhsVe2GQr+O01cm6kCHkUasb3Hh7WG2hxisEuu7Gyk25WJvOJJdCHQ0PnQxISxhTxqeM+UQ2Up5EA4k2CBJRbDOtChmoq4CX2sG0SFluWoWi1/JsOu6cMz1wsJk5V4GZzOEEjBUk5bl6uGHuNZdYuj/FcBAe/20cQENMsNIsJP0AH+AQdWQ4qmYRYWGubN++LJB3BBG8puhUYyrKEZHBQQTAEi4GGMiHOqhs7XPTKq5bTy/dH9vG92x4Hk3TsW15//fVPPvlkVDW+9957Dx8+HB/w0Ucf3abifD6Pu3fvfvvb346yG1ykKLvjF3r37t1vfetbjx49+uY3vxmg/ze+8Y1X8f3fJHuIAVqFSsbQlmSHRax2q2iKILK6/tKjz4gMlgSEReyMqc0FOe68w+rBUenGpQ0OQ68XFNeWZ0VFrjlhLpri1xN9Mg9ZUOpGQ805hwJbQEwXAzajOtTMlmWJDgMnApLXjqhG0oIa6MBFRsmUFDQdpYLUimBUMG8jzSHzEktzUmuQqSPsXlNcgj6TmvcU0VbI4AJLjEU1tEGzpmabY1rjbI2FnWrSt0xgoodLoyu5T1IC5DXCKIVrUHOrtBo7XnWpMVcL/iyDokXCzLs3UfsUIS9VqTLnwJR9XN4zjE3+rLX/9Y3X50ICmpGw08LVjQmXTkztT5WeCBZz3J6lVsQqC662JBbvsIBp4QSMGGgYsKT2rsZmkgNfHuGlYPVtLPPd824QNX4q8mGGCTYVsbQx/F6bF1u4CXdXL7XLL2ISq1MpdEABk1cTf4TLxGY3x4XKvSrE1XlcKdDqWTYv7mqjmDehfcCw26I011JbjSaqZQ3qzVJzotdxOvxuCuX3rebeHrfHD6IoB4781a9+9eOPP3727Nm9e/e+/vWvvwo67OA1k68x4gM9KQCgyjFq8JlSj6FjmP/whU8nTeFOfvJprhEpKWZP7iicKMm91vEwI3WmYmmGyALBIvYnAYgsMrSQlMiCq6hdTipGZzrZ8QXt1GSQJqpGXqVMKujKpMBMzKYS40aFsbGZYlfhCZDJwMJppmUy104MpjIRyVCmsJYvxZr3XdXoSIChaIISysRcY8BkCW4ekV2GmHSKhdDs08EycQhFFGUslkpACFROSgCObqWSucMasZi5BUdGFA2+qCrAQhlSNuak6VBieBobgGYIGViyQNHrWBAQVUrsUgggF5PMJiUrjlxkRZNXqQmtwDKRxARZbKFoDivMspDm1i1bAbNNs1lhEYDk5koWSHSPiq8Bg4UW5gwRUstJqLNFKckTi0052NMUlYiSzXNC8jhnSwZqvaYNbiyk6JA8uVKWJZmtraUiFjgrzZpK9z+pWI2BQGocwNhBse7TvMl+F+MpVDssiUYXijcLpqhZAfYnxjcK7m2MBXOk39LxCnlGbCan7InEjGlW7tvOlvqeGtnZAA8eQGfRmSmojYk+NQOvQHZmWKYFXeyIcgdFLEbdYf4dmBOkFlkZWHML7CkE7jBfK0k4KRWRRIJe45ygk6wZZleyY/9SDB4pPgcWIBUki5gMNbh8zSl+WUmmF/PyfQCJv49Jth988EHoNuJ4/PjxN7/5zU8++WT8ySgEefz48ccff9w5r7cA8Wc77t2791I6cPCIv8srA5wbwNRCOZaAR2OljtqaVLt4ELdwuDBvjyCxaqdi7p5MXqOzBpNuWBn5pNEvpgXFrGOoGToO7sWthVb3fLE2I2KrWDUEL5CybpQguGhcwCALjTzd4sasqsPaJJDuFYbsKaUVcFT1QW8KWScLFR5McaoEgSyQyeQDRGhBL27cXiaVQNBKmzwDcCXyHLRaLBQ30dr9S/zb/+Sf+tlf+KW//ld/TcS//7M/4+A0mHioqmNowQ+yDltWHvG59bCoegoIUDYoQWq2LGxuauWilOqouzGh2hCSTiVukLjo3RO9REMdKQzmpAvqnTyWLL76SSIpFYoxqrYmij2RrQPEQ9RMXDAHuFETDxX1riOBMCYOD41wW3YAEwpwSCwTy4FeAEmZC8M4clfBCGktAw3KDgPh2isSMZyZOs0uanPNsVldhRCKM2hogW/VwLEKcE5N5T0m3ixwwOiyHEwHWVGyxSscR5Yr5mNLcXUxo0S7G477YTfRGcQgsTCIbYadNIVN9VFF3X9KFEilVPdliPcZ3OFWp9Uc/T9rkfs+OjV9r6Ux0OH79++HwvGb3/zmBx988LWvfe3b3/52L4EPHz58/fXXw/nnyZMnDx8+fPvtt/sDbo/P53T2paPWV3nMecEdo+egZkNczSLSSFTkkIepYc0xWWE1AY/fmgcL8siqqsKUSE82tEjPQHVTH3wuThSeqv4h4CqvNvzGYjGaVGOnSAaEi3EHiA3lij5X36SYV6U6DNPeXLpXB7Ya7d2l3QB3NxDZASFZcWfYHdZxbeWG2hAAsrdEtK6pPmc3gpTX4qtukRyLbcShhDFCOnmD2xoduC8X/9C/8W/8fX/66d/xJ//k/+Uf+Puf/e6/riemejV9Rll5FxogD22pFVf1/mu2Iam57xs8wVxOZ0L9+urJqZbKcG/04YBfa4KZurnt1om+jAmwF1a94UobQxR5ft02zLFqvQw+hUNXw4hjoFhq2jC9hQyXFggebvjNNIlFJN2a13b9IKqT0T7GG9vf3alewLh9tDl85FWeQYwkC4LVVh1PEny3a7o0Phwmr8tZjQT2uY5n9v0Eu+qLTcHWXcKLOFcxlVd/ktDnNO52XL1tNMus1JBiy33IhOrp5II8HMbGllOJXr7r6nmrf709PvdF+f79+5+JMoyzoO8QldZVFYuUvsgcyVDKYAzlsllTLMXX1VCI1b7Ak0qCCKtNTczMVBdLdgcJCJYpo9Oq5DUwYg0ayxLLLgWTyQoPM9OJmC0KKJMSYj4VaKlSJkLEn80zVawDxLRgAlVe6AQ5I/ubzFRuiviElOnF5KnOH82HptKgBFAooKGkmuqtMPkTUnKVSvgyUJISGEZbU9SlUi0paAUpU4Q5vZiSo0woBpHBfc7NSiKIzAVkS0/LNOff/Ut/4h95+s2/49n/89/+2Z/7d37my0EjagRkVq7StMj90UPOA7Zt9b04Z59OPsEQjk+NaVrHmyYyIQVIWZAyfZIVeqGsMaIiSS/TBBX6FP4hSVE2g31HwYliVupJq8aY5gCLT6TcDW5WGKxhZNJgpkoiLn33srY0qAaK1Q10iXGrzoQCMPtk1BXmHjzoMikNBsT1qcIZeWWFHzNs7RMgAiPOnpwmW9rb7tIwxJJ3eAd9LF1au1pjOWKo7yzMAdFH8o36+5FB5ixYAO4KWFmzlKwRc+twoMZu1pHFMQuYoCuUOygGZVpMeWMbYETfJ3Sl+wIHNdXUxJDtNG+KgVAQeFqijD6BefV+xtPyo1qUHz9+/ODBg85/ev78+de+9rXHjx9/8MEH77zzDppNLoBvfetb9+/f7+Sq995779VtD24B4h/eUWMuKv+l3sNcb7sZ1/R65mPRl5kAN3pKBZII0tEooIkOwsVG59VlkMZ7ElokbmeZsdq8dqvvstIb1kzMaAxizdJZAl4DBne4skED9vETbeDGts6qOuCxZa8FDB4uGGT4C5PZzUUnLLnBJ6U4md3LPNhAHBaa7hK4Tum5eJ42gdSomlD8nX/yT/33/uX/E4Bf+anf8+//7M+MzJRqrt/0IdVnYQwOfAWpAuEDraaKantYthD8aPMlFwixdWgnkpdxvmbsXPnj1X5ojFvtS358xW0Z5d5iyvBQCKeM4H2HqjdS6SYWabLmN4/W3E6saeM2FK0D/cAiIrBjQoVnwhHFkNUPdEOp3wgRfs3sTWBXEKs5m4FAatrSncFhaoMZ1pTz6gRayKlZ+Lfw2eX+PUej1HpvKbjMRihE6KnZDR9ZDvAZluBHFgkTNQGB8QSf4kq5wObmtIgmH56VACZMIJoWgfGRDchWAeKMlJECER7VA9w4uvxIHU+ePHn06NFo+3P//v2nT58+efIkzOIBREXsnOL79+9/5zvfefToUa+at8cXq+aurvQaBi1RZB5D6kZsq1Fc48YRvLesgvpwKNYHb9GpvmyXXarzofDQC++5XJ15p/pI1TWxgoDErMnEicVFNx4sS1MSCOUGECe6ixkTVUp1YOQAj5734j26mXI2MK0tX0PbFlrJArhTYpXriqSchQZHGUjH65q/rC6sLSAbSbkKbhh53838V4EOBzQMKCtdBxW6AgGV9FoB4n/z3/x7/t+/CODf/Vu//Od+1+9v8Sz0oBGRjT4cI+8YB4alskVQXvbJq1FApQN3UZBkjQs8mHEtD5BgEl1IFUOw/mHjcspKUYDinOcmvhkH9X2fNNEHk6IYQKYDymj1m+DhqoVajKw3VxNdTcQ70Sdogs/tOyhgVmLDhUszR5pb+HAQDYbNSH2T/UaIr2P97fL8Cw8RcniOhZ/DLj7bHXlDGxcjZ3tlAYtWBmSsQQnCRC9g39fNZN+MTqwk3wN9rpQrNJ9xehuPSixuNFmjrjc18siR72/DpMFtAyGFrp7OueuFw8+0XglVCxgkw1ujidvj9thrSXAH5QTjcL9XKCo0Iqw8mJ7CGjbE6lM00dXN8Vmze8wlL0S3du0xdCnTGRJRVn8fZ6gtUrhXiBREwWmSQBlTRjoRc1KmPLjGbsHcqFv/1nwVUzYVlmzx9KRI0mRRWU1GWrQZmZrNi1VwLTjImZoIGgxyMkz7lrwfwhMguIXlLgU3MFGjYdRqMB7VRaGSkSwVWqn00UogKQkAs9WaBJpb9RdwAjATwtQ96MOFf/cv/wf/8H/wTQBK/91/52/+2yr8GmSw2si3/YgNan5RbmT7RJDI4tPsE6FAgDu/s769JHN4yKcDCClMlHt8F01f7Uw1B15lYv2aR/qsKb7rGiPO+JQeOHJ82bWsFWN8EdloImNTQpUEK1jgGVU2cYMordBBtgFzBCmFKVNMPq41GVSz34M6EDsNjoPSmuWgxs3yjeJHVnEfWcugqsQ4BJN38eivzhKBCR1YsIqar9NQ1A0Dm5GLEd5jnGuYQSXtdW8Grm0tW6hVTa/1YAof4Bk80dC2TdY6XIMfoddQrlAAXNeYKVyxnAQH02XxTXNgq1G961a/hdTBDWViObIIDBHzshve3dn8SB3BHe7q2LDd+9KXvvTNb34zWt2HDx9GRlrM8O7evfv+++8Hg+qdd955qUHfLUD8wweIMSuCj1NoQKxHaFRShh/gB+aR5cfFh42x9CYUEV2Dww65WrXQDQuHamrT2T1cbfkDqhuALcU06fyuURM2TlWtoOX+WqeNN+Yvq6DjgsLOKEkCrdrJ2ZYfUp+n9c8efkno9jdZZkA0TpM8uc9mkwxkqTYXVpQspJ9AtHARg1vcXr4yqLW6S+O7AY7RF/3EBcztwX1hq18Zw1HnHHA0+vLZC3L5tmwUr0QXHT12HfEFOhydbePJrsZjw9Qt0E+6gMJUbLH5aqc8ODVVvjlmrISssvaBEriE8m3IThLUDIxmheVuPWkJ1dkgMvvAaoMS78q0XP8CJroTE3VgMSBXZ6ZqNJbMvRKpgmhfofSikSQ4Zoi3TVXwAbqJkqoPch/SpDqVkfcPrjChsgxewR3MYAFnsQHEbCYt3DAjeqSsL4bX9ZqZ6EeUA8qRVewyh+8KqgHxVI0myiHcilVOgEEuFFVJHSkiAZoxda5iE1BbeDZHKuNEq2od+JHlFCKoH9m6+PHHH6Olo/Tj3Xff/cpXvtJnqs+fP3/zzTdHLeQ3vvGNR48effzxx7cA8RcPHWY3egsCAhmkCZuq5zjD0JZD1mXHklS91OHiydMVmTUVYa5hI5GxvtgW1xXbq+sxiSKqETMjZ2aZXUFVM+ikhZuhQMwwg7u7C0fLSamaICsN0bSi1HK3rYSIslbMzbw2hJ50qA5fnUrGwWIipoCg3AlLHKJIoFilVCBVesrZ5qDHiPdmLHyTluTS+ia9O9A2bnT8K/7/7P3Nr23ZleWHjTHX2ue+94IfUYJLsFyyM1KybKsKUEXC+nJZdpJdw0AGbcNQwY0kG+4ZrmTbApIE3HODyb+AwYYEw7DBIAzBgA2YkXLBcgmQwTLqQw0LFVkqVKMgVAYZL9675+w153BjzrX3PufeRwYrWeUgeTceyBf33Xvu+VxrzTHH/A3grHbRMtTyadAbfJeq8O4bB/HGd7KdfggLtLUS/Fo2VrFt6Xn2qXt7xbYC5rRsfSWBV+k08zoszUU0wXwu64yN2JsJExPNe+XGJdDpcSA2pNq40Ld36aomHmhFSf8gG0KA0OrwxmiIU+a1T+DvIYDBioMx359jeopN6Nf54pthOXOf2pz0XOh6hIpVjd7GHOqON3347OoEq85w6WEW35DxVpM+mvhZ7BFYeuAALPRQN0Sr/bylk6wzvyJknoEW1BPYrhr/2oafMaDknOTxemQaz2PvvQCTWZyv0arWETFTncfeYi/LfcZN70mFT9fT9XTNNe24RdnBzacpRaWT0QxbTKjP+ZisMlTRLM3DYksqc0MrB7FVicStHMs6IFns4bDUB+3QhopyNxUc0NkhEc3BlVrN1ypZEvTEB9WthvmwGByjgmFImeW9ASoQu5AGGhbD3K04UE02YM5wm+A71UxwzKj2KlqEQa7sa5ZS2VG0OUC44WLzQNLMPKem8ona4PRmMEd4RZggYDPEeo6cUIMw0Kc/05EKuDa2QBDDaubUDQW2Sh3VVB6ig+upofJQJhA+oq1Z11DbjE6hN2OXT3OCCTNxxZKCn3pfsO5wwAAbiG5wgVHoxfx5J91s0MTgVN6DsClbJ4BiiuAKSiDN3M0ZYibgIcicmrb67eluZmbNRJ0ZqsWrK9DZyB0tKrWvive4JT7Vx2RqIJq97bTBz6zdOp/OpPktw03PMQ505H3XvrFNbKG7ea+qVypT0K3+7rPNX/hSPO5CS0EpE2vzHNbmPh5IGjJO0Am+Tp/CHWKBTggAy0HqzYfQHogaus6hewZPwhgfozbkoHzLZC/l+37vWG/y16/o9eMf//ijjz567733juzEd95554iP+OCDDwAcp0Defvvt99577/333//ggw8+tzDi32gH8Qw+3tCo2NxLNTnIsA2/UOUXAJIBGhhmbuaKsiseuyKWwHEeztsxVcc01ZgmknBrRyojmC1Bh2WQebxp02qbyh2oSmJeh5VlZZhTOIc4s7yFMNBgjZ6YJLNINvyuvM4x2MPAbLFeLSgmKIEeNb4RrJi+hWOVZk9sigJZHM7wGNVRo/2MyYKcodgYkZv3Z2dgXI+Fpv8oQ8M1ORvZkc7xIG2BgsE99+VqJSvAYCoSzHBwxrGCGijw4ojkG2S80sHPJZTYrsdqOfMQEQW7h8XcKjjZ87mP7KtzNllzccdsuKdIfa0OZHbPHvi++XXz+xZWLG5uqqgYxuJI4DowTSUo+0IPWJGLma1vywqZSReC54iQ08YVC3K6D45bRrTijkwCZnY4t/GnNlMCJ64BQ22IQ3QyjUJek0HNtWkEaMnGnlO5cch8jykKu8xkKsiD39Hf4pqvy4BRsgIQe4cWRWecECf4Cj/RfH42p3uihZg6+yj4WgXmWlWwAbSMLT7JAZLqiBlruy8Xv3LXhx9+COAmdO445PjjH/8YwF/+y3/5+A25g+Y/PV2/aR3ZuZJX8yZm5TnU0gGaeXHtGlV6VV9lKhoY4GUSSHUQm9IUs8liAbhK9troPZNqOqsC8RAVYBoGi1wNmWMbANEyqTMX3smTabOrlQDiNiPOLXfkW97qPFNbUJWUeThW5ImfUiWCKiJIk6jMRq+DgzJ4Lgdqp354VPOw8aYAIAzcivw2pC10W1G5CDMhsK1okEa0NXqxbrWjBZMKgkO7NNXhmAzi+XWLsJ2bRSgYkc5iG1FG79kmNG3IfqQIblNf3t4qE0wkTQxxsR1TXry2BT/QzOdI1KNvyx34dZhE0bQPb0chXb2GGYmnMQMHGmIakGrccnKua7Y6RCcH4MCKdlELcB4Cbt4gzK7JZBDnsaGyAfSGh0CowVv9RfkyOapfu4GtGpVuoDceiSe16dH82O1BDVo/BNQQyLcsargtMgM25eNZIV69KC4ed2fLMCvLbZ0D5TyIHetRx4nKWJYNFIqzeCnklh5Zn3TZFAmeZOGn6+l6fFOeMhZO8ECzOTw3wUp7hzJC+SmrIR5YJnm62qU2vm2McurMYQgTLV1Ik4VYRHY4CNKUh/WcO7/Sea+CO5lFnDlSHV7XJoFEL7Li7efch8Ww9TGBuAuCzGQHgdiHDbecMG0e5mwODyqJtIbK1k0YQgIlLJIR3JxtreMK+2ZOCl3PEkmMaM7I1i+cVY2J6Vm2dba3s2hNvdVhTjhzbBcRqSsoKKecB04BLQVihzm3oi1LLLEEjD1jNc8JG0qzUYwRPcu9irkr+3DeGdDRkB5Xps2ZjIpvA+cmwQRukNEcnkSI4g6jAigiKcbZ+CccMhORaUcVthNmTjpjGKLM2PTIL6bsWbiC6SBHzKns0kMoMcJkj+wDPvMSJrLZdgfaAdiYb/iRHqOt9Ztu4FRXgrOBkJp+lM9reg1V8U14yFLYWRPKIdfKzatoJZlRkaSv7R1RnRtDthPMytmstC0W2Dd/dcNGt7g5NiQ8W4AW+DP4At0hAki+InexSI3xDP4Ma4ZC63DPM/S+rMp6/DEyDZf0Ow4vM6KmReCfFDHxOauFs9T96KOPPvroo7fffvvdd989An8SH38Djv+t3/qt7Z8+n9dvbvaClGzQmjyd6+XmLklgSsY4ahtaZI1+5rBLNKozzGLL/aBVVmOFj04PxVzIeFOVXIuelW0yyjDFN4qmM6HSNpxN1J/aZfM/d2n1tss0oTBh+UDMeczNmwQfap9fKOEyMjcH9Lp9j+ItJD8uE6jnUHCurWUizioawKrms6SMN75CZYaamuleC22nmptxj+TTrRV5V2tO5sPmfd419MdKxE0Xzr/U9Oiks2NOmCYStwh6JZ3PrPs4bDO1S/GYTX7VqC/V9+q9kLvRXvhRnHtSdRRnKB+vSuBUm7nfSFmWsC3BS74hykFc7/bGKAYxPCu6pNEDyK+cONL0agw78A1jWr8bsDAS1Nsxjk/mFvk6c3i3rZcPXzu7AvLu/q+B5qXLm894wGztbFRoTY52Z/DQv82sm0oJnh/ufC8ZkP3SZcq1GTHUoU51qCs6okML4sRIEsXcNekVbtBWtYt6ApFnok6lIuTwdb7nV7V8INvHOtOBDPoVLV4/+uijd99996OPPvra175GkuTv/M7vHAPr/ubf/JubIvykET9duRxt6c+bLykF3BKDtiFR7dt0qclhERaROjJdxjlC4QdXrDYVeOtLJX4uWoQdRMwWMefQwwovrFardzRFj/yRmBxe2PaLyjmbie07j55ed3IL6jhsZFPiqjO+Y7LattGTXdWd1maTrNThaBgN3hAtdW2JEddjQ1eC4dYE3TOiPUwbU3IPU7Wjg7gWtOhr9DVa6rlHFXjr9s0npGaKNf9eOOnj7YdFNC83d4t8bt32b9tOKduzkT94DNxTcSQm6n3WpMJVctp8EiaVq2y8vN5/bw4BQ5YZANv2s04/9cRVHRIqdLNtZcPe+/SVVXSwuNZRIXf6Mopd0GJ2K6Pu9kbQKuvx2H3N1M8UOLntfZUwgaVkDGyDrvl9vSKXNw5+PHQcZxjyDfVr817r2t63IQg7osNPcwO1R8gVWzd+69C0Q48/jzTzczRTB7Ym8bRu2Y6DrPTjYk+t8y/ZnIhtXxXfIIg9XU/X03WjBWzLQk1sqoK4K5x8G0PJlT95QdlH1OSJR2ZneYNbqZ/elB9JlHY0oX/kMDgzf8xGRrEkemInxGXKD90wzAZtNa3NL21d23qx9dLGamNYPPgz1eH8V2pQgzE4VhurrTffvzZf65vHMB+mYRzphJ0y7iZkpUG4RG2Dk4O20gZtsKU86oYw1ZTSFNmjQy014qi+b5qpSyY2h0XdVB9sKxPH3IpSRIWVIjwsn+Fw82Gbg9gCbdBW9sG+sq/omeW9skRVN47kNhjcMFrCjpGG3NHkTdE8diwvp6YPrziffAVrplTgSAl7jsE6OIhhGqx/qhex0WnDDn+QBZ75ZGHGPLFEq6y5AQ3GMB+MnGDeXheBzrayDbNRwXSZ6TNvNmeFdwfxvuNHv6gfpr4e3S+2g2t1NGY63K3cqk0kOaols/ROEWl+so7Kjs7qAi8zkDbA11oGto9YnpHgkV+ZHOQjYmIaAXGI8TCW+rQ1sI85t07bPvInxDOMO/hz+AuMO4wTfIEaSlFf6Cd6w1auPpITdYdS6+swxyPrDDVqn38QnVEqxH6Agf2iXdzP0zb+J3/yJ1nYfu1rX/vt3/7tr371q7/zO7/z27/92+ka3hTkh4D4/Mof//Eff243hd9sB/HM4O7lEUbC2HPZa4gO75TVkH69nVuJUJG6aqMD5pPJxmmk95xy2JIytgXoeqx8Q+bMJYpTBKzm33gM0WtQP44CbY1ZXcuG0/k7g6hTRFNcW4HmbYYRGVKXH+pdwZ7mrDkfBAvI4EFlZK3kago1RpFhMUxKN2WqwxkZcBRzk2NFPZq1wwphLzjvVQ71AZLFG6pAoqamOpzUgwnvIeB7jaAKMjtG+AXCYLtofVN/1/THphSguJDacRY7YsJkcVuAaSvJJqNZxy7+FuqtjewOjWJ7JbIgNevHCsWCVZSmnzLK9jAILfRVLWH56V01hjE6fUEs5ll0neg48H8XRoeT6HP6V7P1GiIrvT0yCLGxdYbvhrjK3sH25ETCh6fXb752mXSXrY59CjgHhsqdVwJxNVFgYxNelT4CXXd/oIq2s9miyCkuoSZ1I4lIp1lOr7ATHaqon5SGu+LEdBDboF82yQA21FZ0ARepoSd+pBzEMpoEORqFMVnJGQDZEWAs+idRhxXwX1ai+p9hi80ND8Dv/M7vbPvchx9++I1vfOOP//iPv/e97wHItNaHcKX8ypbl+nT9xmy4G6kQaavE3B0AXTGI95zQKfDFPp+R3a+ArbIQkpwr2MgKtny2bdtwaxgQCrSYQTFRN2jw6TTMNlNu/uRme5AYAbATWlkGF4/mMBYPlYM2rSgl9ZatNV2fs1ea80VVR3VGWpOkMuckYyEOA621hs4GW8xg+Ynou23wH84YDKuhW1PBoGrwoklFPzw0pk0zki5yvYo2omdDERFg0uSvOPS5rQ/vR7dBAFN2z0J6JmrDHE0VYWS1J+0t6QOdcH8UViCH/a7WrhGFUT7Udbpaz5L83jDnVJiH3SBw2ceY98SVxF4dcmNsHEgI+xzzNm16ID3n/GYHsoO4scKqR5uxTqCDfU4CjbLoXjmI5xmABwm+NYztOdIbNeIs59IrFNd3e/+evTlN4efRhx/+WwQzBCH2QIj6BQtdM37O0auovQZisDblq18ROwbNCt6CZMUY9/l3BiwiE5VNkGAD6MgRvRqbzQatwwKtXBEy0X9GPuFnX7l+aXvu0/V0fc6uAWtXZSC2c+nRPqw5ULMhJgKW5eqqVkb+6Btfgm7z/J/icuzyUXqMotpfCjWv4kAdAHO3qFomUMj+MBokhnOsbb2Yr4RyOp2kPeQFljq8QqOC5NNd6S0fqMzUc1ozOKaUDIJk6ylbw3x6atyuMmGCluUA1Zw2gJFUd5jDPQvY0KFcm2V4i8hwIku2b+X6VOzbVNXS2NLATO1zKhhOGloWrUI43elucRCI+0qhYvf2U5e0pZUd/GkbkHFKB06xqTW3rogoixQstrh0lUYcCQImRLRID1ZWRykWJxTCKDoTnSHKhtFhYp65zAuqSKI55QyaNpu2WzYP8qaGW2agtQhztkGYONBWEhgdxdfaEuWStBvbe5i4Or1M41o07dpmUZ7pllnjqJ76oYOrw0TRQRee4FDhSp2oytSgxkesslsYwwW80zp7yTblo3TgtcZMubChdlYTsBvggonWP+6tBBo3PSrZx7oNcZoMYgHPECfEHbwrVtjC6DNML0cK2qG3yi2Rb1qkW3GWa3iIfJCFxUQhB4nO5FeU5ZlJBoeEXyAOIdzcfwkisX4ZQnO6nb75zW9+/PHHf/AHf/DlL385s3a+9rWv/eAHP7iZsv3Vun6jGcRpXCrK+EGuTY3YGJub8lASCECzCNEYjd4tGBy52lQVCBRqlizy7W2hnOiJ/OY0XNjBK9pqlYPAAeP1sT3rgcZAaoX74nU8jrNoMHX+nhMkKRTCQjAEYbljo+wn8o1Bl3sAmYiiDSCFmBt88n0ikcwW0USslMEHbaiR8FnR1jlbzULD9oFfV2t8s0ymEmszZCyJHYfllddeM+ZTN6VJlAqqREww6UZMY2/Wrsdjf1rJlXO0tcQxn0egod4GMwveRikCRGxcCDssYFfjUduVLtcABhNUksNFYQyppPCpVSTbNw7UoUyxOyTU7cPV3B0+e2yrbbVxxYwilrS3swTihEss5gYFtMxXYqEPWEMsHIvFEBo7r93XcyYpElIs4qwwhtfodw176mgQQ41RY49KLk5FY2yfMkztPDHcW93oGY4IJnFijqDm3NExj96kfYhl45yEWo4tCWZpDUacEKgIwxLue43eBOYztiA6g8oPXZq/OGSXZIwQXR6yEeaakQiImvOVLtFPbNMvhgVhGJ390WGcn3f9mQZxzv/3/63/o79bR5P5l4e73c9WbzfNN8PofvSjH+VXPvroozQR//7v//4vmqb9dP0G7Li3+5jmoj0KsJslBolou7hUeIT5AVXxxMWc+BvRjtbLKydImEwxB9XzL4q2z3x4q9lLs1pxsmtDAdkpZICWhYMa5Imcc1hEI+UyoFlo2mybhGMIzA28qhATgjw1Z9YvxcaJ3R6CYHN01A1uBbGqdLEH8l7av3JMZltaNfdoMsKaUWKFCNX0aE3/Bxhhw1oIqQ5H9GkHKrU7cVWHs/Vc3qc6XCrhwT7MMFAKU3T3vJE+04pyI7Ad96SDPr6LxSz1nBkGPyeK9n6DQZt6O0vL3HS4g4AB3NEBvEa7HfE8lHOPyKPa12jd6rk5y6XjFOfGtPaMDZAKgj/DZ1YVYqKBUSRlXCMsUrhpHq1sUdDPaOrlZ6PNZq1fcc12S8HMj49HeX9bEvKNmrqNgvqB0LIfY+f9NWoOnO4xNTMwIwBcajT1OD+eOzITEZ4b9DYK0Kgkn8RkTwNx4DbaqLuhPI/FREy4TFeP8pcxovNkO366fh2vQELbikR3gl9QNpQt4Rl7Ak0NkZS9EXZRT4vVqlbV0N7OrDJallvbFlWdDR8yEjsgOtlkmWozti5xLS2z/CyNGKIPW1eLC+/uJWh0phYa14gJAWNYrNTQ87O3kGYGnveE19EsW2WI4PxmgHQzH9bcLMdjGz24V4szQyZBgiJs0JwYBEnLSRl63mHMvXoOxAhAU252DCZgF9l8dbRM3Jt7YpNy1lRh4RZBA/L7JYSzvNLb1KmzrdWbtrF5vGCAWQbUcZvV2ZxvadOeWrEpmsIjX7is92fyG4IIMY9LAUVSL8ozlbt3St7hJidN9Miiu1gZKdY3QGkVZ6askTn3XM9MydZBOOU20ihtokXG+jFgK22gr4iGNggoKuOGKbLOuW3TzIiqzqt640DBHNqhpZ2PN7kjk8Q1e9IBcm9q1vMdBTSrgxAZ2xFrG5l5Bi8oNWVlQ8RNH7e8dFtI3Uw7T/vCxE1UeN0evVCm3vQZHFWsMMSJngF0qcw+3MYMOsHTAnwHfybfyt52tYPq6EG+vREKwDP4Ga1R16PAwEQMN0SakZ1MD+XcnOtH4rPvsn+2cPfPUgVv17e+9a2f/Q1bqfvxxx//6Ec/2kZmf+/3fu9rX/vaN7/5zSeB+FdUIOa0H9Imq2GO3ieBIWw/j+pgKsppeTP6Qu/ICqqJoYlCaCUpc3A/SDM4Q8WOftg4zK5kTFmF1M04vN1EfHBcRsdE/mAmft7K0LyiEz44Kdv83G6LhfbydNIk7HjvEusPC7SgPNnyLOBvNFHONtjzyD6zerb2HTKqbkTgSITUz7KyHORFHpDsisQU6ZgQm4G4figdCXFLpWPxe/P5nWDmg6j4UIvbntYTAxtiInb7cOar1MEojs+SHVttB9kenR7gyp1YbVa66mxOEptdajKIkxEphqnU8kdLF9YWnohnOlh+NgpQ2oGrG0El5SD5Eq2cOPvtJVZiMV8QTOP8g3jAzEtcEI0KodNtJoxf1Gfr2nZFQIeW4iO0jysFVEBmGA4bqct7ccNtTAfxVrUe9rxIlvceUjcdxKn95+5uGRYH7wiAffL18+EkpD8RE6fSkWt+NqBEKG7Q4dViVU9j4/a+ibByQRqGItGKcXC8b+38f5aX/6O/6//F3/jZ3/PNb35zMwi/aUfcsul+8IMfbHrxO++8853vfOcb3/jGD3/4w6985Stvcgq/yVn8dP3ad2S9wD1k9q5gylT0rSOpptSGttJm+yDHFIjNtmg7F7EDZOZpvsY48tipaQCxECOaJeIBnPSDbBYKLbLwm8bQgJhZXAHAQIXLDAq1iDZpcYIkU8ScB8QkV6ReOuFUu74YxTOkY0Z6zBUseLsQUsixUCeVSSwGWYqWj8aBbPt1ZpdXuWVRuCdsod4TAZGJ57WjwcURFtEULW2jFW3yUFxQVkdWxw+AeYbYFMIgIw1ato9DhqWDK+vI+UKwctbFwxQOa1Penc6ThilmYp+27z94fACk/3f6k25S1659NDw27glgRdsE6LyFmFtVGd55pFVUFzoRE1umXBnCwoa1rPdSwUxK0gVpd5NrkwK2UxADHGgjGg+E0Mc/TfMOtENFxwddxHl4yjpSj02uKMBV5rqNKJ7HMOAAYp7N6P1UmS9tGhrsOi75lLo8OzbX8FFnF7b4J4ERzZMvocA2E6abIF5ub37JnG1YK1djNYFsb7c8Cb1P19P15k35mFO3GSmtCo9pxMw5dYupEaf7s5JXZorsrNfC6GaRBaAQW3uvLMO5FCoYbmSwZarNJA0f2mXK/TFYkApJ4rraWO35a//y63vAXp6WT9HdLK6SCyAhVmLF3SW+fH9u4fnLh9m591dqA6YGwEhI9JVccVpD5NrobtrwF555djMSKI09UdKkwDbAYRomwkxlf47NN41j0zrHb5V/9xR/c/jCQKdx5plSM4whReTIxDyFNUJSIJXTMbg5iBP4UCY3z9zd2q6bKRo3DsG8/W3qNK1JFE29hTXWMFAlmisRE9siOtXhcDMoZzc4UqQG3WJYBOmp5yrtzJZp48HITDfnrIspzxlPCw9sFGYHncPpnlNfsBLurY0oeuCgCWyl0ZQxOV+CGlLbKF6R6nCm2Y/osTW540CA0E1JPW1bGRFRW1Kb2+CBlCAoZ1+kdClxAnyxt0du1c2rkDoxTwUbxUUioolevoRSk01Hc1H5l68ONZMgWnFzmaD78LDYUiaW38FfYORsX5+krE0aavtUwa20Pb0J1aK26VzGYTZ7Sg0Jmtg4V9pyijdj5eekCt6ub3/725/xO7/+9a8fgYqZWZf5dYkefsgafhRM/CQQf14E4jGRuJLdxIqxxgajzXDkOslSzbyrudRTXDOXk2X0z5XDeyJ9rZlPkEGus9qz0Wp4huDu71BWaIX/LSfILWWiPvyIWZFNpG26YlW+HG6Qmj1f7tauaCV40aBuQ+KKVmiAqmZJbTOP3AyZChhrF/TNkwWEYkQb1uZsIPclODuhx/JSloE9bxy1L0vRjvnnLmHved+HpZYuM7jmJMhGD8pUgExiU1DXgvuh4FONiqg09IadQF0OYhSVMipfZauPqvKaGOiKiD8gMbblMkEl+edaQDgI/UeeRlSmORtDQvDBcuqTk1QVl4VsVWsIGEgsCIGtmoHlkU+B+GTeEA67HKy+C50pjDJ48OQkvcFqi0ca7TtCRFcYdfQ3773WwEybjeqYZEl/zR6aQvv26lTLdOSWCbugjcqW3HLqzObDyci79MVdVfWH1J2NrJ/u4Lv5zWfEAs/npysWxCJ1JqQ4FsSJflabxiUb0VZllk5bw7RBove4whwDg5N5P7fMybZJCRSpf2Zl64t/99/f/v7qf/+/eHSb/M53vvNzHcTblnazt+V/bvF0H3zwwY9//OObDmr+60M28dP1a7/hRn4EMpxMlHJB2ITdAyX8IOLtGH0RtAkvLqLLAEf0qT7vW97UDYucyDngGZtdd2IQGDXklgYZCxM18f2RqJ2AAHNmY7QC7kiQJC1rsCtxKqM4rzt5VW1nwEyTBT3tw81LEg27bfexfDQVDAuEmZqVr+XReYJtyicD4kqKrPw3j4n92aLMRcgUJbsnaKKox6RCUVUPH/ZuJdPB/qycr5jPbbIjCXkjwoqQlOn2AnoK4xkmw4rtEXZXdb0k2slMJGxPHJUOSa44Rg1jk4lnSM/PLz62QasNCLjKhlrnftLId51mJ3K5cu+iJy6aO4M4e9CbOSjKQWxrhdQpyJu0iQQdjmhXrX3qwdm16J9b/dYeOHd0WwrqBM85qsbYJlowUb+BDLZVuXrT+3M94JV7+hAbSihvk7ycxuyRebZVQ+/nXe73vG/78iEFy0jF5IkPtRyzvVWTk0RcIYF5CwVnXNXSo71PG+iKm1xv6KeF+Ol6ut58pc8xrTOHffnYbd1xqDnzmp2qnAetrJHYihELw9TmCuI06QSWSa1ywrKMEuaAPbeIsCDEKH2Q7lxXszP+3KtPv/jqJcjuL8S3XrUewRsLsQZM+OL58sXXL1tEWsDC7NxPwPNPuXjQZRU8veL52d+6rMP4k37nJ0YKkR5yinA7KnnZ3y2AkyXjODdcT9rv9OfuAbuce66lbycRCox6jGBYENsAiBunb0lu4RZuHgQYTgPD4cFwalyF1HHYzK/bBGIaQUcbkc3M7KgaSrU3B0Qb2a4l3NAaamSJezZr5uqmbzqgHX+caXIKUzJuNdkX1qw526jtoQ0UbDpvM1NZrBzEFjmfZZJUbArC6W6+VviBGWNCq7WIXjW0hMZyCc8pYSSS2G88v8oZ0A6MzKKYBTEfNk8ObenUExQ7b4o1oYRDA2CzGWr/QAGYyvwjCvRemQoB3mtJ2lKOykEm7tm8Omya+W6moMacKiv5IqOGsijGdph7xI006Vg6wZ9hdAXLRjZBlAkyYw2sEzghWtmVN7ficYetxWL/oISZOaeD+A5jhVmZ51MrkP2zTaj7LFXw4bzx8+/Yt771rQ8//PDLX/7yw0o5VeB0Gb9JIM6ouieB+HPXO02BiTmYUI2shBRtHQ+/g6+ymVe+V67J810YHRF0I5xlPe70mU3+EGZex1aCZiUY25zfyDm7FJICxyCy26tRnbsZpIptzdDS7A3aIR+yyozbKq/Rk3fczA0C1WrxztUHZojYcuqODGIGc4x/0ieigQr2oNcBonRm22LuIDjNZI0Rcxi/tfgs4gJ2X+1tA/xYTw+1FrHf2yqVa9ikTEu16OMRaa6mX+Ytmoxa6Al8uFcbYoaohJrPZPnQgS+xITh0m0nInVoYjWYJYc48O2g+XdXPP4giig3GJzm48GYaNA3QtDlPW7mrV4u4TvQQa3ikIgrV6z3srXhDiXFAZwzZwljoC2RE5+RUJdR/hphn2bkwJC51O8cewCHVQbhBSZdUcXhF51Z0HLll0ZdgQ4Z6x9pGgg4x1fLOojpAPA4Fz8hXhsgdYrGzhgE1WEOcGBnt2lHZwy2VYsYCdXib4Ii6D7G4jKxcIFfl4aqs8ZpFbx9qGUHL6rLiBD/uwZ+f6zNKt++8885HH3308ccfH73AqSynTJy3k1F1T+rw0yXdbD/b7J41xXEU4DhTki2pfQaQgFk6mEZAwtSbitemjUhQR/aqaRNgOpWjNDpxG5/MyGwELKx01WqoEjRYekJawAntoGEhopNqFuUt3Wy5V13HbdHbV+Qc7mC2Kq9AE7OTW48iJ0y5JZKHE0HYVgw8aiKuW6DyXJJsJpOZhIq2my7jkmWzBxnNcxjIG7xlpvncnm53y8B+O7X9lcGqpjVzw1XRrg6Zdcmx8oOiXZJh3qDv56bgnL5K1T4ptGXFTcbgFbL+ASrhMQfxrbt2+86DYHpMiuMuZc4jQ0P0SmvIVl9si/nBQZzU++lnAlNMuaCd0bIjG3saEw5qac6ZWmJ2DyVl6aGENkQy51hbYxiuY16vmgbq9DbxSp0+aDFv5PiMpVATMkLNIngDNWYCfznRVXel99cvPcYOnuZJWHOaagb4ILMfsT/equHdWkY0B7Cq7bO0c8WYIbTM4pPQoA9rwrrBZ/RYLnq3GGF4UoifrqfrdsNAR2Trqx30mg1APCNDJbOY/DoXL6ppUS8ifM7FWep3DKhPB3F+9KKIf/lFhSFnTAKKBPqlibgk5tR05ZkEkJoj/WJ/7vXli69++uz1T0GYj6Bd+hfWTvFqEXu+BqUvvX717PyJRUy3pS39LsXic2+XhGCEnp/9S/f3b53vV2vnpb++az7Y3JgGWIN8RwjO4DVY6nEjQcCWFlJmTl1KtJusnOwCQEmRpDKhLq24lXwQhkngVXL7mlLtDacH3QnQPPdxuDNW2IrdeRXUMNWP5CxO8RKsZQAoIg1kE0KZI7bmaOtkRLspG7phCMwZXMop5lSx8jVSkjRgzZ2TesyAO8dgOL1bD0OGC2/5dWE5LiSfTnWDEeaS5ZmIhWB0KOhuGlCkYGHhhJMJavQdF2lTZmC1CglT3fND9vtWnDai3Dz7kCuupjqn2yCr6Tk3vLfYJ3if8laZSdcM4um41oEjqkx+e9jH3c4MRDIltjEvKBnE2nSAKRBr6gzZRGegTaRD4abVmPhj3BwWe40ToStOimfwEwRpoKy+rGngjLyKu3lC3ZzB26zzDKlD29KEcdQ80FJPg6ePuB/i2TkZFPErO9+T9WxG1T3Uf/Nf33vvvQ8++OCDDz44+qV++MMf5j99jvuFv8H1qs8R9U2Ss3rr78gAAQujW8x388T1JoCYYzFv3PKg603fUImNtjkYNibgcUngbomtlVLVk0o7z4r2aP3XZl9oRn9Mx9DBpnRoi+1zIft4+3F8gFWZ9eo7TbX14EjFASBVhKlco2XK2JmwyqtVC7WYIdRbQreEqPD3BPRw6mhvPrNvhNmqTm/7b0d3SS7crPw0m81qzjtMHbjAib3fCukHT/E27pS+VGS1o4ObNXY+EXDIxJuvAmfld9sgINUz47ZQ1zlwUUulZtjhcZ29+r03LAwe/k+1kWehGocCiQXK8Mwxn2F3kRLwHf2OY0lHPAPAQu/0Tj/B7zgO9ZZmG7aIWq2suHUL+c4/vDqciskk1+swLIwZBHCAxW+Y6dovZyzGmJ9T374YzaOH2tb7mDzLPbwex9ACte2XGtGZ+AhPPH+b5X0+ovlHfTqI71AbG4QQXeZhEW1EW8NGRVRhT5VFTTZFmEdp2Qn6aNPy/IsyiH+JW+if8aZ+//d/H8D7779//OL3v/99AL/7u7+b297bb7/9wQcfHBun3/3ud7effbp+8/bcw7pdqpBNWWcTee3gqeT+JwrZvSHhUkSrsNMoovFcCSemIAwJu4+e+5TCtEeozfzxZDikfydgztpAhxU+Lgzb5hWFkkCyztFCFtF2bsMVWvzQHVQZRBGw2NhHhNsBumcTlJibl9Fpg22wjexx8jAO+aYP9typyzS1NeRsQiH2vKBN4a2EerXYY+gN9YwlTeJhcve0p2wx6IU2Ngbynld4+iRIpkZwyII3uO2UQ9+wevvWWQCwPTY95zYsrqTAW77E7AQcFca9RwuwXVu8tkC5h2eSAizsszFs0JLJDVMPbTjCiGuLHGFjhqfNqDoDONBWZTQ99WAvzyJwjeZXPOYqa7dHNxn9OP72vuMCbx71PgVmb177twiEq/s0B2lVDr9HMBQ2G6sbhbBdAat4YD0XfXh7aqWkXhoSOAOb+bqcq8H2fuPWA8hjZJSabBtvKg40ye1d0ebB4J9g33vCUjxdv65XTGnR9lkM2fWMJo9r7Iy/3gYOjp/EqBU+513S5TR30kMBYSrbrAIRDN9pvIl0wCZ7JcRADKe7jWF+sbtzvP3pJ89ef9zu/7Tdf3y6/8kX7l++db48v/jzS+QfOu5Wf/v1/Zfv75+fXy7nT9r5p/38ST9/spx/ejr/9Av3n3z59esv3V9Ol2hr3F3ii+f7L75++fz+kxfnly/OFwy4mwaTAmE+3UVR6IPmsFHbnJwxOIbFMPkxem6W4cNKJAgwamNNWRbBiEysZaRePCzyj5tGwXw3fTycISgQgXDawIvLWHyCJIL5sz7/jIQUD9Mg3fJ1qb0nG89RSF8qjxm03IW9zzhzFpUxZtUMKBhhHhzDPKtp5zZ2HImYGAynnPS6ZTrhjGEalocrzfJ8KtGpreeTnIBmi0E4T2vYKnnq10TQBjmoYRo2j0xJuN6VFnp6wqjbhDZ4mXqtWB8xUaNXAjFnY7hwmhXtc/geXYfobjMzc9IId7jy5PKa8nSIxt3czW167PbjWTIMh+yiFltIXRxa7Ifk2PwVC8dC35Qi3LbG1aUuP8FP8Dv5M427iVJs0/K2HCZrT4dm8Dp5F5l0l4/RDlrWUXRKcelEv4Mnv8IOKBk+dFL+Sm3K77333jvvvJPzstsX33///fQOp4Pq937v97b6N68PP/wwU3w+z36p30QH8XZOzLTuzkjExCESBQY0akHk9AkO7Q5DdLrITl/oC3zQbA/lEIFuYdDFsNHjq3Hart7aE1teBUYcFM94bC5Sx/uAiJIRq7apyYeoI/1UJ7m1vLY1ouXWrAag0RNDk0llbfNQl11k9hn3UdDSiHP+f/dqzVFTRZL924DvKdWZQyIkZWKqaSQN8MdOLtNAZNsaynl82Vef61GNVOV8KycKBx9bUE8WGQfC5UNduFA+s7KyYzVVfrdZSJtkoDalmM7Nt8U3LGY1d0kkHij/7CWUNo0jba3ZqGibIilQcJfl20ZXxSOQUE8hokx2qITYq35Ar2ZmVva+oPzRAS6MBrlOpSYj7ugd1VTMhINDw9MINKLTT4gAc9r0RB/a2gNb0Pw2VppG/dgasD133jKkBWYzFEJCYBq8LMOwOVeeSGLbitV8bzduEAwEmLTi2LsUu4nJoAXKvVAQ0FrxYRJAHB1aFINMJPEJMc3XNhOGsyJtpnA17p/ZiaMqqDi2WI/NDkagH3KNfoG1KzB+SYnqf0awxR/8wR9897vfzeTWnKD57ne/+8EHH3zlK1/5+te/nt/zh3/4h9/85je/9rWv/eEf/uHbb7/94Ycfvv/+++++++4f/MEfPNVmv6Hbbrn48yNrUqTmlZtDDqOYxTF6VHtuG7bMOpctqJ+VNi6bHXai+qmZwI4dho7yfZqzZd4LxRzodLYomABMapInx84UlnNESo7ETP+MEGx+sRqs0zBloc0XvBXcUeFaie2LYFEgZlAMr1Ogt+rUPPP7tvhZO7ZR9/0LRFSlXcQLHDIJOHHAZaBG8Z0TQKEWu2WMgKGZYFI8YngppjB373M+KzPpJQvRSHxXNgHdMJiQxOjczlu5A+xEu41tZdd8ppQMkux0U5JdWU2v3nUzBeKmy44lpYgr1zAu0Z/bZetAADeA4CtkJw/qsCGWgxBy6EoWnrGKX3CVSRhoQx4s3flIQMrxZQBr9MUG3pCzlvNSi8XGIG7wZ4gV9lgcDXaBeLYFHirF6ZvWG40jhVHqjImIqSvZ/QDPdcLJ/9xD6upNf/NQrtJrTQFZbZTV8t8PRTZfxo3glPKxQuZhK9vGmam35e7MyJb8P+Ecq8Rf1p77dD1dn7drhfU5PB412SIeozuLC8S5ZZenSnvbxrRvByWPpuYoIrYSMp2h6fcMRtDDCFmXAvSZQsljA7Li6YbbWBmDbdXbr1+/ePWT9vpPef8xrDXpzpYvLc8u/uzTZXk2xrl3SF84Xxb35+dXy+WlnX+68Y8ENr+7A0G7G3eULr2dhn/x9au7+0/6+tra8uL84pP1brglZcI8Jph5Vj4OG6RXRRTDUr8ms41s5fYMZl7ApAkWWte7gDnS6pbe5EC5ZpUGYTdS6EmlTcQEMRgwd8jgATmXNb54Pt+NMQsE+mpCxe5t3U2azI0uc+ZrZXP/tED2nnPs1ViGaJhKuE+7d56mgnISJWePYT5IWri1CPgkRzvDIYcPyvOkkbHjlJt8Gr9q089a3eieuEADxeIIu1ODpxFfPF/Ovb9qLekfbSiBHjGsNjjLqMNNQyGJyiuAPdzUZkujqCrbIc2qelUZBg+jvdxOpHO+V1ezvqlX7MHIGWPbK8ZiS4fQcSOSjlt/gjorEjYB3DBhGikOoImaADMl9OFqc+OcD26HgZ5HtnPoDnGC3yGewZ8hBrgoFsW0kaHV6WKfjsqfPBgrM3arlKV6KnmzzaeDONKFVjfO0q2uX4DPUkrQhw3/JajEvyy843e+852vfe1rX/3qV7/+9a9/+ctf/pM/+ZP333//7bff/t73vpff8PWvf/373//+hx9++NWvfvV3f/d3f/KTn6S5avuGJ4H483bVh9CBTQLmHDbVJuCmQKxdnF0sPBqUJuJYzM/RyGN4edW/N/ZAc3rbCtfNQYkKS7OKdE8M3IAN0YCxo+K03YfswFRu9M5SuLajVJ/W0GwamMhDzXP1PrA94WQriXJFZNF1o8ZdhdJbkVmrs550AwFvsrJyrNlYnlWc1GA18JtZ8JnnIxoQswzAQW4+SM/khk3warXVmP/f//P/1b/1W//Kxy+++Pf//L+QvD/buH7C5EtQQRI18liKuXSj5CY2+CAQ16AV4MAqG7AVbT3Go0mwyZA6CMmHMnoCicRqi3PCrHkzv7k9/RUqU8uoNEG6hJD7uImkdrRuGvCUT1P2/NNrvMH16zdsKa02Zz1Os8fYpt92w031yd4t8fcmWqYqw+w3xglYGI2KOD53x6eFENSy7uMWIqf56Uq+BIGFUeKvUuotgdXFM9rGc4y46uUeW7KpCo2ime0MYoWppVC7sYZdUxlPAem4oVIyyvLDPuPvEnTosogeak5f2Ul5tCitwJBHlSmR51De9gFtjKbQgzfLZ1m1fnnE4j/TtO3bb7/9ox/96Gtf+9q3v/3tDeT/la985Qc/+MFRRP7444+//e1vf+1rX8uvvPvuu5/zHfHp+qemEJeDtfIopqd158wcOHFbgKiwx5fDk6uwtejo+eHKhbGU4unP8LmhVeNQ04a8HcZpaTwBKDqmP2TOeKJVJCiHScAyc052n0RlsgUxjckGnx1M4xVUJ0jRZt4bRVqt1dW+nd6cGVewa8oWsAEGG+Bd7kRS56ZmOvuaVgOsFZEGWc7NpKFSoE2YxuZgqk5dvjRhjGiIzmEcpq5UvQNWEbHi33rnv/n2py9/8tZbP3nxxT0aLSkQGQVblmFYAEXLKocUguZmI19/yz0qB57M6QA75243af5Zs4Xl1Oy0kOeZgZv1bWMXXG9P0/6DQ2KKNgORdfrRnBswwNOZe1FF1dmUNXOuC8fE3mkL6tBpZ23Uv+amcwgfL+X3gua11dq219uUsvMtsMZmEyaB/oYc34NxSMdctsotuNbztymwSUUs+P6DsjknWHde77XXqX5Ee2jwUWve437me1939FA+IdvLdDxJ8FjDpvw0ZF0+TyMlS2UPIYJmQu3+BsijDWtbAKSmBi7yGM6svQ3AX3QL1ZOL+On6Nb0iQ7vnStpg7Spkkts2dJisT6cNDwf97ZvLlFMc2Bq7mG7H8kDNkjAgUk6ZkUE7GH+2nLqkwwXkxMAy4q3z+bS+xrjHuIct7Jc+Xj2/3NMapC416fmKk/uzy+vuw8Y9YmC8nnfRQNo49/UstmdjnNxb+N167n62OENxGpc+4hItGRcIbg7S4xN3ICOlo7b6lOmjMjFCLAgtrhSw2QF9cLYnQnKEmIK23GYSfbKh5l+gCMJxGnE3xj+6++f/zp/7V//xiy//yRf+6+5GKpEXc9nNGPF6CcjK2bFI9PFUh3P4tRjKpp6NPc5deKbIzpe7UuJ3c/EGS6KCDDZXGsDb9qsnSxo++9lznyBTSS+UVD3bqrt9t47TcKcxWpqIWwRMM+pQqnFhXUGjeJRh0sulaVPQocl7rCKJmMkNx+mvw554XepviQ4oqufuAgI3BvHGoaLsiqBoiT1M5TcyJ5YIzd5MNsWpUoe21FZtVNR5COROET0OptsVFLiyitpUWAxqUldkgkIewey6eWz7r6k6Pe1cKjLrHtxVqR28Cnfa7sP27GmipzEhq/YLFaT6JW7Kvxzm1HvvvfeDH/zgm9/85h/90R9ttfB3vvOdY0jPD37wg29/+9t/9Ed/lCHw77zzzg9+8IPPOW7xN1Mg3o77CTAtmN22JQHTzI9mUKDci9xP8LvkNWniWdBahoeYFPBRPtP6VrFSMMtmy2aMS/Sz9bOWs4bEi/o5luTeLggCa3kPdWJmyG7EFtTo4lyOczSD0zBjdYYWwsIszZirDCzAzaFEgas8PKNm9GwrlSuP1Q0A3TiYEaVoYQMYWYo3bgxmWaAl2nhNKmuWkYTUPZqakQrP3G8Ebbd3he1ep3RtqKFD1lf1i5azltc6NcHF13E6q//7/8P/0f/3S//yf/Sv/huwQUREd2SEqKWJybYbPIz/RxCg7dybwxRm2OGMwlX9HB2Gs/RKp9ex3MdyiT6iR9AyuWGvIgoUPxEVVf1pxtkFOGRL0irU5ozGMY40AwdhMzZpI0enVLoVbtPFzPmbrtY6qZy2TZnqlja6YomYRUN0c2OUWQl2gV1UBEDNHNI2zzVGbGyK7ZdMvkQsiBWWNoM4jLqYbe9IqOy909cTtqGB/dqTddwIIvPfVQX2NM5xK9HzCTFWktGQZR9+zPcvcBUEtH2GdaixO8KO8DXQgQGutAvszHaP9qmWey1nLGcsF/QRPdTygxxW3Khd8ApuoBIcGi4Oy07DaywXLWf1NS3dv4KTrO++++7f+3t/b5usydjWm+/51re+9fWvf/2DDz74+OOP33333c8zbunp+qddiLLIDLFnkc1c5yuyvJhxo9VNTLurT06fmqIN9ftQNiAjuqQ5r7Cpw4TDwOjZibyuBEYFiNuoTNesSdqgpYCbjUIYENEycLyF9cpM8zaByJSFFHP8oAbb80QPdiCTX1oBBzVp7BYm9lXRj/JabsKHfVxozrYiGcSCcmjXhwGECQcwYq020RCWCItA5qIzOuQEU0FmBc0PJspXZjKLtgxSMo3WVmuDDnhrsAAzK8dC/N98/X/1u3/n//3X/9K/NsYzrEggxkEqbEmW4EySAWAGDoqNYrm2AYpDUBcDbSUdAhI3WesvoAawYtkr67zy9MxlgaYDj2InUKvE2Uaf8ziWGL7sKwdM0KrWGAeF1FwN9FAGqXHkmBTrGU5MkoUWRGcQWsATfWGcECdEkxLK3+acU7armUwR2EDk9uowUykEZNlv8x7a7CB6VYD1nPYH1uA5cIOHWu5MQeLmJ8qRowyp2yLvHpqIp7fcbqux+fbMPkOZB4jDXN0WzjH52PNujRmHkH7qbZBW2/lzx3Zb+QAyxy9/g5KpFQcveKkMGW23AbjAApFXabw9TCL2xAIb8bQYP11P163kMpVD2eOxUbym1ujRJWIvkAnxWq07ir/Hjya39WtGwWtG5mxunm1lE4ovoJS187jgLRzCEgHg5DVF6tYXrvV72rI9kDmLam5N5KX309CG1YAl2ZUP1aMdVGBUmxAnHuPHtUsDaa96s45VOX8ma+UZym028cT7E0IBmYirG18XhSaI9n/8l/6n/9l/5V/5v/63/vvttMOn9mh32/nOR/E0DbyPtct4xDFUxWU5SXX8+X3LUVXWe5+W1++LRNrm5q6kAx/vjPZ27s37cpM2Y0ukuL5lBdiuH9dtB1WbPJ8DVlum1HVHdb4oDeLVdG75r6a2uYss0HxRruj281S7wxZYGW7XFbQ4R3a2XwHtY7pHvlRVytvb1Bg5/BbbMSEqAqDyizkzo6Y2sE0mOehoHVtogewqLklvkE65wuLgI9btAlL8la2ybvSZ7KXjDJZm9G7x4KjOGPjV3pjfe++9995778c//vHHH3/8zjvv3OS3A3j77be/853v/OEf/uGPf/zjt99++1ciiec3GTHBuE5LnwGX2cZpF/WLWoMuaBe1NQnlh37JjDFhWkpHNIAXRg4YNraQXdR8o9LN9hrcwCZiAGeLV/QTx2Iu6T76JbrARLQYMGDKXpJ5iLkebYP2K2yoKVpSfsxn30zwBi7kMJkpmke7RD/b4lG1h1EebcAyTbvTBJxjiRwCyMGQhAHkfXHYShsZJmsm2KCN5tHhMzM9DUdhl1hoWtEjOrzDWz1nhnQQIwyjFeiXAVhxD6eMW33L+kIMW17H8onfEXI0Bz+J072fXH0CBkwBmCoozJvFRqODgiLabPYi+5Qir/vVmzfI3Dy0xvI6Tp2xahD6NE6v/O4+losvER3qEWGZPZY6cMq4DRAt95JpGw1QM8ndC5nXPHoNNgvziBDNosGT5YcrU1LeRytOwrVdfPNbb+v6UFujNYtVbVUbtKaQqkO4fRZWtIsCwL36fXRHOq1rzx2y3HmqXbmf7DLmbsf13hwrDWH0Zk5zNQMz7nY/VwhXSXrpOWrUsseb8vBtpt27lIxvJaZDYJI6yMhOj8tW2Iq2oPlOebna6uLwh9jvRgAJsrjACLxmf4X+EssnOH2i0yc63WP5VMt99LEfpM1lFD1BivlFPhI+F+Kq9po9ZJ/o7qVO93G6jKWH/arviz/jG955550npsTTlYhehVUNITu25W7rAjHCNrZvgnpri7EWtqzu+YGK6Jl5pWxXeU91uJh0IEZXC4gYrbYhgIN9tT7YRnmCc9XJqcY8MqeZZcAQkkXIwL7vXLmqZDM0rTgyjpYZ4hSKXl/Tjo1iRngjEEHKOMKA1h8xvrYx0a+q4O+kApBoK7xTWa4lvA+HlV+kYGPPWFd2QhHZp4SlQExbrQ32tTAOMlPvkSnml9ZWtpEDHxbWaiUOywcV0UYs4R2jJb45dWdRcFjQBsxpKzkA0oZsmBgVhjNK/JUxRqKKM8GTMqR3Npt71WhNsTu7t14C8Yju3vKcoGo3moc5yWlLOuLwMO0zGwgYk9JwfOMNmKkBSMjmMWOtMe7ogzrR7zB65n0zXmA9FZUoIM6RzB04kvLlkGWKe9FVeAvqrZ9iGGJhuKyx4mQB3HGEltktgVWq0/FYu+1fVXTdYbxGny1mLfSFcYFl7ISXJ3fThQvO9bBVWRBKIGOZk0k1nyI8OgHD3bfLCzoRE11qeWbOwbJ4ZPiVachAtHV20A9iAQHEFgKpbCG3jY7isptglTSCrGqGmCaJR+htT9fT9Rt+HZ2ArfpVejT2kji0pDKjNWj0MM9p/mjyjFRt2eTT3qt68Ftpognt8VG6q986ofr1L+2UgmW0uyOW6XXvYUbphYQLSj605SACUraELZdleb0swwySty4aSFn31tyYwa7IR3SdxhqRVqiZ+0Js3T6zz2b1MKnJO6zLek0VVXZb4RBLTDs81YDVfcxNKYyXlqGA5I12TLWmfQ81YR+sfcPLn8eEh4KxCa3KvyMD5LF4pO39oXQVVQqw3bT/05T6uAmUs1Ox3+aEVP98ZUeHRsMWAMxSVBvDKWMNb85f4KAhJeO853EQiw/S0IFiPFnLdJYD7MrnoINtdiuKKyeAGw64nPhJ8dYWdTA/X9xU9py4mxNIKf5adlrzhFfTdiVuqDAUV2i2lCBWmIAxqTJC6OcJZce/5/zTGT0O7YZj4exllJydHgZpnI0UPAjKQ7aT54no12AV/bmy79tvv51Ixl+J6zdYIH744dAO813V72N5HctiMcJW9bWoAmXuiakjg1jVNk4/sEAMjIYQOYrcbdgBvhSR2mg0DPN7Lq/tdIoB6Ky+xhJg5nQQNTLRK4sUXeGqKcWhlvcKaczJsnBalQHEChnlDRYRfY1+iT5mny81LI9mVIBDBHiJHt7Lj+xZqtGG1QTuICeJP6TmtMEYpiDdcuIDwQgb0Rrb6i0yD30YBZkBwJIQA+PaRAENNsNq3OYI0jR2IUVxi+gXP72ylcBQc+BTv7tE/yt/62/+1T/+v/2Vv/03//pfevev/8XfUTAARZumLVAo3nFCMsIUV5Mo3GcQiW3aN0BxeH/tJyIubCRe+fLaT5c4uS9KhL9hEvHmDtFCYWoKcMKCKotcwJANGGWjaI8EEdE4o/BapsZZLPBE8fIK4q6sshrjEOuWu5AmVzgjZnNLsFXtEm1lW2F9GsaPZRmBRDHcR7/XUlqtmLDQM5rtnb0dX5i2n0wm7dhsU1fHuYZodGvu2apsdvBJpzWgQmYgGOMNn9ZMwyg1Ob+4mHd4oze6wMzWyyDUHE5f8yGbDXR/DExZ9WqNNPGCNit1DnBFMg35Cv0ll0+w/ESnn+LupU736q/idPZl1FAOZckgjvJRbS/XgywfwS5q9+or2stYXsVyH8saS78WKZ6up+vXUSCmYgvqUC0hDB3YR9i2ZhgEV4uczHOzkQKx3BpayPrIxSE6ao5yV4fNDZnUCtiw6B2BVDOnQIw2Mv6biKQ9CALd0qhLK1ZRznKGGcTI5dPJMdXqlkHgFfjG1WxUVEs2YWOTOC/GUcDBxD6QJYNBW0OsdGGLSeGpqJaZqkeR3gbVFHYlhOXdFmXDrNy7qAkTTrydQlY8RBtsK23MEUyz0TtkcNpofaU5AMZgNMNmbXX+1f/oP/wf/N3/9N/+23/zP/gr7/2DL/6WrQTArUPM5AHVHWAYTM0ZA6JZYLax6Sar/B9YkJ55uQU4smzlWm1lbYBGANENau49TFKm/XCOP5tEB1samohj+3/IwDLRuDgyl36WgDkfJuAS3SwctqplHTtPCrI8huV0F31BNFhHPIPfwU+IrhDZpNJ5S1fVRf2sfo9+AjZuflL5KhIAqj4royEW+lDPk8AcqgKAE/3CtsABnGwg+jjskmnhSdPAvl9P0IRdpWhgYQwqxOlQjkZdomGzMQFHRYdMJpWT2nBkK5qjFSTqzdXlFrmsygPIU3TDzhc+nL+AFJGz9TvU8AAiNTMD99126yLHfMdrfxRl4GiIHOnzp7X46Xq63qTuZfoqZzwZHho7xWleWThiIvNqucuPoO2mnelovJ5UIGiyps1y+4h0dDgPXG10eW/6CTEgV1tkyyZCv16Wc2siDXhxuQASr0/XNLS7sD7acmnLubfVDNKwLlui3YV1txZGy6V6g/bX4UXIKZ1WeTxZ5ZnJmizF0KZoV08a46EdU6J8Qd8E4hQCo8TBOhDwWkknt3YdkX1zg/Bv/Zf/yf/4v/g//87H/8l//Nv/5v/rv/Fv1TM874AZzPLVuc4A3vcJKYmRNpkIAI73mWIr5ZRv1lWuTnGZn2N4c5ZulpgP6j3NMIXDjaYWexUOF2+eupxBUjKoFXvR6k8EjDfmKgs0w9Gy21LgFuyQuL7TMEAGkLAjKWfO00S8pz9pi3cEsCD6hAJzDgdvnqeQoWbYKsthU5brsKySkkMb9reS87h1TiYJpGIkBEJLjmkDK5gTSDlwExCg0zx737wj9Jhj40I7IRwcMvGq745pTx4V0wEDOuMCNLpNh9xZPY8NN28TPgXBPgnEn6dStcwjcUjDyIzpUFpmbUS7qL3WsoaQ/NnoLhJc1VVZkxxiRBJpW0QLmTNReWwMAB5Ne9bkIaOm/FNyWy70121dfGnUJZYR3VXlShkUiaAjGYcTBThoozJDGmRZa9UimuOFlQqaJuIuixF9jcU2dbTg6znVYA0RsjV6eFtWcuQaCIbSisVgW6HBGAwBbm1YW2OsZoD5XLFmjsEaaS5uHGbDsr6tNc+EStFhoMFqB6hY2LnqiFBnpN7OfvHltd0BHGoBvY671U9/5W//f/7d/8d/CAD8X/71//a/Dktkr8FbGq90WO2yexlBd6sopGOW5mG9agnaj3bxTtxdzAGeo1/8NGKJaPBCdVW8UR6s0rXVmAqrrhun5f6OZowk2GpWcJMRocaqEtsE+Rl0yI8/YL+uD25qiE32TtyubESjxap2QRsy5+xPzulUZK4L4LKzlkt0EB3hyQBlzSEBsG1AhoVHyrI2+RIzcu14ylTuiDObB1DMgWjley/2gdMdnHS7N6nSXW9iG6drOHHJFTSwcUvTBTzSlvDYBhSVKZ8RUFd5RAEO8iIb5Cv2T9E/0fJT3f00Ti91Oqu/jtM5Fo92TJgVWsSkqdSQLmGVA4V5r1a011gu6p/G3Ss/XbwP74gnQ9PT9Wu/7WYu9vTry96c0ZjRXhlk2rJxaF6SpcyiJe0Byl5gmSEa3DiMqjxrq3YpMRoCqZxuH8WUR1N7VZqYBHoKTGLbtStGhtxB1mDpeKU5BESDeksdMxuoLQXiwBz1tKwPM8I7W1iakS9GtFGcnGN5k9tIuUuDFe2SArGpraFmN06f5GGQyXZIEzGROtwcTQ1YtpDz4bdBDoJoBtGiQY109jPtQgabInqCmupxgPqrH/5f/p3/7D8F8Nf/pf/eP3z2ThqNK7oWlM0AnwDdNIwmImyokRZqKziskBGRsUXghF2A9VSnjBfMSEOYE1K+dxQW0YlQdExeczKgk/c18Y3TfkUZlDtgJZfK1uiNjjkyukYn4Vg7NGSrejmZVPMn2bs9cRjthHGaEe+5953gTeo5BDPbpccM0jQRM72x07Gb0d538AY9w+iMVrJyttEdU6nZGsFHl9/C4eo354ELmEbpqe0KkwWxpShbvVlSGlY/tGa52ZeuB2YJ9X2fxNZjjiJK4YHV78FuK/oMQjwO7UmTMC4CPlOw6l18c2jHDLra490TMRG2sk8iTd4/He/OOgXioTbEJ6bw0/V0PSKpSZnGMWGpj7t6Z9AlGiJXj8E5BYnDXNCxK7X963RP0mQUjsZXe2z50G3tXuujLSBhJ7RTrlZBnpfl3Puxu3Venp2uO6ko+3C/9H7f+7k3J0w2Wg9baCOsj9bDJnp1CzXnVFezs2Wzf1km6G3SIk3HV3f8NoKLZUyWKRa1NaZfONmQt7mqpMyqpfxQU3Xjf/e//E//5//5/wn/Of53y//6b/zWv1l7Prg5mlMd3sdMHyoiVqcQMXNiJi7xcB9IsB2WVv4ckVi5fc+oYPiDcHje1np8hC2rTHCIFOwPs7QVUPHIvciQgnwHCibaniKz8b+un4FDR7PNO7YN5k5E0rw7xZlOhELW+tg3qCN5qVqzffIY6z5sxabsWhiHjoFYx3tV9bIZwqhWwbcbJ6TyD8tBPJ3IfR9j4gCJOgJlsm585kmaKSvH8SPeUSeoC6zPiMv53lWz6HIPyzo9lL83M5zs6nYYHXF+WoWfBOLPRaF6tRwBgsMuOTM+0yElrtHO0Z064HTtSKUJcqh3egrEUoPMnTKTLDJGSy1TqrhFx2RudVAhoYnLan7205nDGGv0EV3BFUsS30g0eqTbiOgVyYNtjt6rhAZHuXiy6kMHXW2lSLnJWli/0Jc2ZnWqkQ8K6ky/c3NfkHTCgMKAsBq2pA3aMHgmSBopudmgOQlaJsh4JrbZUEMoBWIb1i553ygonAmZMM+Kx6rqdva1bMuz/5y7hQUgtmjLxVzgoAXs7Kfhy77d5UwnisCeniY64BaBif+vxPbsQF41Id2yr1aBs2UUb5dYRJi6gNX78FNER9qiwZyMVUI9thW+gt+Pp6vqQ+QUpMtG2BTTue0EpBq9c9xxPdEbVdCE6ybb1ngc24Hluh+Xv9HDvBnVEzGxyqrbD1m6kyiIq5qBq9o5+lmdEqzCXlwmFijwjn5K9WU/I5acnZvfAaQy/xWx2Og2IkenrB1J0DOYdR8wzwlWHFJltj5pYNsP2aCeiAkLUwhM1oRBNesMu6ifo584CKTL6WYFKCtZsS632EYq0cOwhgbgFfpLLT/V6Se6e6m7T3V3iXbvy2VrEgRlEem92vLTi1VyBGVhVVujrdbu1e+1vIrTvZ/GZkX/zIuX9KQmP12/mn1ZN2R+9oYMmEnlN6VCnps1Ix+TZttqeB6yJuuxnaWjVSaWSNFGYXs40AJhpgFM9XZfQLdpGHHD/8UmEEvsMfnxOUCaNiGZs5XBFtHggejMFapl2zYqDRxgJi1bsK2gm9xiJAEfkFkPDjNVJMkWLGLOjbnKoIKeYzoMM7Kjrbf1mahoLHHZK5oVAF2NhJSghgpYyPuzFj7YgK4cQGnm6GcyGc1AWyOabU7U4/CnubWVbcyyZm7cdMJJWQzKmQBEc6ihrcz4uxwZYUBQ9rCREWYtzItTAYEmtWx7Jy6D5owwhIlKkjI9zdPZ7c5Uic0UU73HBQ7wjA7IkxVGrOqNq6teIwhr9GbrUBsoEq5xTwZO4vRJfqIndDjAjniBcQd/lkNjsjbhS2nLzfflBe0eXelZrm7y7cxNq4FsJSAiqr2g42zNFbjowO48Bq8FbEU7IAVBwUxHPBSgVub9a93nKtBmq3pnDsGhk7mYG0OHSOM3acQzGGdmdZQSVWaCkpHcJsOkNvoR3dEeXUa0KUnKYScLm9nuDxATu4wCJujDQ79oNM3Tnvt0/SZoxKlk9bk0HYqJ229LndakTs/Trs2ks4yejZaD/UoL55QebxcH3nyyPwNFIEi1O4FMxETxCxTEJakK8ztfLcsLhayh3cHPR404Wl97v3QbRhhG2GotzBot2jKsu7El1eCgdGuCBEOIRvOatUzEREuX7mdcKqZArCb03L/K7HLr56RoYMgm6/34j0EWJePm5i3zY7CHtREwRbt68q+Q9k0IbAj32davua9EVXHuKHk/zR6YWzaPbQNiMnD5mVdcPfKeBHOAig9vRLFjQncn0JGnS0wHcfKaKsP9Z71OuUe1AzBbB6AzZeYGEpEdjkYX+6Hg00SOlFl4QSVgtDk2tItIwGQQVy9C1+RiHHBZh+ONrD5o0DFRp0Ah039QQvN0YVcwD1fYCTEzIzHbCTchvrxu8SLZFHHwqm2hkmO3W3FFj/lpJwO0KYgzwFUmIGd6XJbjCC2fyV9EwdNTl/dJIP6nLBPPOMhjJmVBhmxEv8QytJLuYfmGFnbWtgoxQfdlRKtI5WggQwyaWVRzJxd2J4FSUcnMFc2UTrW+2nJvS2NcYpE3obmbcvmlnIaGVSGgK/IonFOQQ82jMWwzQ23NWEa0QUDFsTOL1kf4DQ7Ko5EaIBOFE43ebBDDtBmHR8EQOcyHrcN8GC18WB9sK0HURGoAUSZiR4toGJbTrK0C4RiOsDlIawAtWNV1uyBNXppzPap10sIaoq++SOlp4hhLHMW1NA5niRxGZxtzUlUWTprRItEimqh73TCIsy4VmyNWhjgilXoF6NEjR0tHKzOs2d5oZc1Qwijj1oDYagzJnBqUISIyvi/vkqRa9K16jAkCk3Zmwb6de+41hB/QBCVONh3qI65qhIb6qjbQPFvbB5JU3uCQXaKf1S/RjTJJMpFndF0FnTMDfXPzs8NUbK9Sdj9aMP3FHKe2uiwCkQ0B5wGFXxTgI7z4+hiwDe3kfkgRdxzPMBZ6/nYRnd7pjRrSNomzsg81e5AScciLy+Re2sGXPRnEPLM5+BL9E50+0bNPdPep7l7FaY12jmWkyTsH0mumrgbPoEdt0KawaFzVILyK0+s4XeLkscwX/LOqbO6/nGL1aX99uv5ZC8SaKW2YwPdtgi+PshNLV3PiYVucWhs1h5DoPe+tDqu55rtBZsNsZQ1KCN0TXyuthNBXFv2W+eHnJtcy4fATT1/bckqnZT+pscewSo2jlxrLmImxuUUmsyIIU2PGhNfuhsEY5tmwBE2yYbaFd1YlMxf6yFTxeSedESQtMa5mUXWIttq1yO3mMAfc4EYGOhBqIKW021RWZt4f3w2t3SLS/3uxuLQcjbH0XlqJkWq7VGaDfYVNzb38QcwnliGTM5wMmYlDjUpElZw5tMQEDwc1TAG2qDy6qHlJbkNXARiMmgHrKSgblao3VacOSiYeM16u5lqSQeEyFwm47KJ2UT/KiBTXyg7VJrxu+51RJ/gJcYcQcEI8h98pTogOpXG8zbxCg/LXQXCx0mInFDjnhKb5W70Gl6NBJ64XLJti295EAj1kJD0KAm45CXuFmBChDjm23J4aUeoIGS5R4nLIOCv8inKd46I3m+nP3UkCuSln5zyl4bYvAjio0ILL1ui0MXtFRw3jMH1dnf5kGTePXlDGx+5NMi4czWWuX3ij/GXtuU/X0/U53qArN3amRkb5Z6/AroXKzYgUp2f2rJUAN9Xh2XAtJsPPWiFEUyaJf9ZDBBhlH975/Zfl7ki6vSTaQO1FwhHaiSkQ97v8ZWF9tTaaZQ5qGEfr3k4W7tZHy2GckkFnct9U8BL+GIqJk8qSqhyuP49BrKaZWBPqEY2xaO74FYxDPiByJJRjizHbORBcmz2UOI+7XvW/U088BsEc2F46dAiv6larrRUWdXI7TLPyiAer1Vhb81LcplgOr98vog7vwowV7veNPxoZm8MjXyoTYWAii+/fqFGipAPwVMAsFQEmTBhBtDhYvqZwIXMpd9XIUt0CQNBKQd3f6jN1MBPYIAIN6nQ7HEhq8ipsip64wkY++ODkHG07ICZqYHoL4ZusrZBpy2867MIJocoxpl5qxY4Gble94YeniR2Qhau8w41BTJetB4hJPletFPl5RlYTmJkBqTLzF6UPC3K6/1LWvKd1/0kgfiANzw/M1b6kQz5mRFu1nGNJF0O6DwA2+rbSBZAjjaOCdAxuyDafKRSgHw6y9Zkra0zAAi5zdrVY27jE0hgjutQQTcy8nBytoEXRzTNwI5s2Q22EeQ5gbFOoAkwGYJghRNhgNJM3RYto89OrZrEN5QUtZzgVZQqWU06QNqgmiG1Agz7Mh8VKdotBzqAbK2AxIqiwiCYivDF9RivoVnNMOZsDIHKYhWkpswG7GCMRkKTlfiamW4rmrYux1pQiYpvYmK8IB3MmMzUFq6nePRRUwXBzt4mYmAtZmOCbhJG0YnPCW3jXhMTLO8YCt+RjAIjOfWi6vC+CZWsVW2tP2oWPZFXPeBYqjOWD8Zy2ONFPHG3frPVgMgfC7chSGNAPgU+TzLBWxGK17HjtAkClzbSL2iWWS/TG6PQoqJI8ZYL5W4wznBQwqlPTceANnVchdQJjMV80MvEoCjexwS24USYWxoJwHPhKxxWchVWKeUqdOXVBZi5Q4S9qoxKNHLJVRuExI1KqEDbl6VmrTmfxCgtowD7V8gnufhp3L+PZqzjdRx/qQw2auRWBeQxRPfotY+/BwSdD6iL4OpZ7X1bvGh3e+LRLPV2/AQJxTiAUHm2vKJi5nfOTQmULNcsytxwuSbIthAb1lbGYMjxtfgytdOQta64ym9NsS6GlmmkIU3ZAay8L0qo4VpTZqYA5CcnP1FFFMzUjB2tYB7AQPeDTSDl5wRJpez4JgxyMCvLGcJNgxj4MmBT2nEuteEvWtGBQbj4s3KJ2RlkXh4xbM1TbWKoMbeTOxeqJepCAZD7dPam3uiEshmE6TRrVDHBoNR+FimaLNtKbzMo0mYtVgobpc8Gu6FeEU3UGYDjNRA8bJAA3jZlWOqqij8gYA5hgDUxfTcwMwFSwg8nYNxedSr7TsIJBQ+mzzuFKK/IADq3ILaelcAeX6MnIu0owB3IHnD9jkZaqRDog7jgMOsEX+AIJuIPfJfpa0SGfWXOTuSQDL2oDVv7luZdaDdnUn2ccS6nDcaKvaieuLJKSnnF06AJu54GYWQIbkSsqbedqL8nhTWmfyEo/3GLD662ORnU6gMUwwvhIZuTGpNoGZPYP9aMoyHxOB4wTKV6RsGIcPGw5PDzBU7tvIxMCcno3qgt+IIDl/EHJWfuPTOcUb17T3HZz6q7q0qfr6Xq6HnxmN3Zr6r+2R5rpZjWYM4IyFaPGpiimKaqC2ORUcBorj7qfqYLg7Gcab+fYHPeOkmAnxAoumb822rKFmF2arc1A3K1OIpJB3J8BkC2gqd+59UtraR/OfXM089ZbLG7NzapZWy2tJN+URpzLbpii0QRlB9Smb9R+jolYh0lTdffFhmtmrcDerIMm5flnR7VtgKAUHGsxZyEmtBWOKlH0IARP6YOPU0UOdIurbuXV146zGTPUjnyTAvyogWD6hOJqViaIsJ+lvc/W/rxPQpF4Tcjs23SqTihVipJm7tFRebTc9dKdlxKzYKxdaaKZwsrjhzAfWzbbYUznMJGzhdTNonWmTuQbO9Qmg3g2pDfFl7NfvvEYuQcDaEvG03ydY34Cq8OxfYS51baJXry7HjwyqCuC7Q0t3nptV9kMEdTxAWuP/4VEozq903ziaHIi2agjOapyHRNWg3hahJ8E4s9PuxR7N/DYQ52NJ0+rIAJlQGioHtP8PFYytUWOYSR2IDmwEbCEGGkf2ptxPLkTyDOwjt6a+nKxpZl7NIwObxmMnjQ2gINq8saY9QDLkKIWaRx2hpchyBQRYCMpa2ojd3JTb2E9ichkeGQkdMv/BJS5qjaMToiZOJef+xbgYAwbqQ47BLibhtkINGWUeVaMyVhMpTvNXxyGUUcImPak11BDoCxdhmHuxuwqt2DLwV50SEzX2CIzt3SNNYy+T0EFLUxQjSS7JYB4E4g1kwmzSs9ynQ/oAxa0mJ3hYWhdskIyRePa6JYzsKLK7JtLXpqdLFmJkgkt0OJw+rIQPMQDewSgArCAZJZzqbHQT3SbpMJsKeshHWU7P+UZq8zXeViziDbYacPVhtqAbepshqEv9EaEUkttF/U1uiyRKfXRuEc3RQ2lzioRe+B8MYhNeaa86lo3aGE0+tJWgG6uGdhYB6Xpvb0ZdL05T5SkXmTO2hFtwppFZj57xkvlCLUHV7ah1h/LvpN2xETgeASmxMHcRHFG+1Snl3F6qbuXcXcfp0u0TEIfsSQ7BYDC6zMeDd5qN5whC2Ta/aqFO9CG7D6Wc5zcF3jD2vjEIH66fhME4oqAiyNI71G3glLOioqvblk4jfqp1mCD3loakJn8emcbNeyS8iUGWBHmolBI+ulj9UEfHG4R5XLNTQHIIb4gLKf7s0dlgM2QOgwLJ5iODiuXo0C3cMuCloENdpAm2exN5m+s1JFhNWYE5CADczNxRgnEpupoMoIQW1OMMKPlTGi2nGMrGEodnhglgEaPPWG7OliE6MGoeY4wkCxsVKzNh0kgrbshE77Ksb0nxVjMet2JfOoEiDEPAB6mLCbcEKJHeop3I3Oz/MEYOZpFDrJN+tM1u7LueZCehnFt1vJgzTmXiZjTCbdVsFuOC+jZjSBWNbuKvUlDlRKDUM1Lmg791IQOnxgL4g6BZPxJd4g7qSlE2ydJGZzzKxd1FwebqxzEifhsjGfwBrzaKP+84VFXhfmM66pTzqMtHOfowtH/lbVfu8PQXvKLCME45Z4F8YDm8mZV5lC4o5gSyGPJoW6k3jA/rBlKg5zIziB4VcI9Jz/j4fixZEO9KXjbFZ+O5zhQxUw5x+5SMStucJ/CQNvK+xxmemrIPl1P16NNnUMGtQ5sc4Ca45w6wFXVqKxpZkhdqr0pRG7/eVhPDo27K8rqZzsCbwxitY5YYIusb+eLvH+jZYgWRrOLtexDypbt28KWMHOz0pQbJIyiD9DN3Dj3HukI7ttIvgnqtUPG1pzL3BjFt4LpgzNOnXSavAOCJazp8dU5vcwsK/EuKNQTF3aU3ConJiXCwrYfPEH72s19yka87hL8rPv8Gb4TmzB9+4jeiOs5vN0w30SYe9yUxnVUb66z5vZdq84C25sVUYiJAvLulbRRvg1hbbe2/+59c9O16ccQZpHnw8mjvH2xj095m5NAx3x4bfZbGRGVCHX05h5q4s2+nqeU/LjVT+hwjJ4PXhUUtBMtNvvwEJm5wsdHtL8wt29BFSfKssOtB/dw2t8Zh2588icxm9YBDlmHsvq+ajXNQeSnRfhJIP4cFKp7FXoDtdnmSRhhI9o5lgZPE4SHme2rhArS2jRj4lKlnc0dgwUS6D5zqjjjHi0BiLnq0NRaLN2tC5RX0o5miYpmAoLhbIOe64CLg7bCBizUktAT6fnN5cZgFhQ5aBmu0+huaMVjPWS0W+1LWZOPltk1OQlrQajcshimYTGsrwXl8cEYljE1CBiLr4EkJVAMs2FcibVoj9VatKLzsKmGFoMY5qvFsNS1d18VZCubwQeDDUa0BtUU7cFBDEbl2thAW2vSNmJWJokAdnM3DaJhi3g/7MKcEiMB2TBvvWRJMdP2mNnrkagITvKR9r5nsuCvwbJliDNFtjWzZIvN+sVcSRv9jiOhRQ3haDwMgd4IxBNdtO0L1/SoDDOMllLpgA1wKedRdHpjCLgkpDjaGn2oQ3C1gG2ZrZMohGIQs+qwdB51ZDQb2nXvOU+QJ67PrE2e4+Ib6z/AMO1NUU7nQpzoN6cMzZjybQubGGJfzDWburn3V+Nnsp7f5M4NVcMz9ud1R0+sMIGfanmJ00vdvfS7V346x2mNFrDhXZ5KPrMhgag3JFUB6oet8woevaoFcI7l4kv4wtE47BDw8XQ9Xb+m1xGqWzkzwhtHS6dLKZh4swxqy+WgWbTBxJDXiu2wQRs1+cH5iyAjo5WERgAczAm1kmsHI2jJkxMiU2CZPbdoyE1/9g5NKaH6mpmroAWl+h4xIud4qnqpnJ+Eq7qF053ujHTdNgzf8TY0seXqOoPsPOnDHIPupgAEb2ydNgwMXjmA5paex4XB3NkbqxCsQiuPCgJUWQIATJZoIhLhHKutq2VtZsOshTVtXL6tqqiebqrD2ZzOzmsp4PQyswiUjdgYthFUYj0kQBGWlupO0AFJkWxBmIguhSWckfRi3WV9OIULol7rOaBzRNrdrsCOTEu7HeoMYI2+2HBxaEk6096u2AXisg+fEIS64g7jpMjYOkFt5wtXXGkeZC7olEYdA3eRZbtrm5sYB3uOHeLCt1rVoBP9ojbVCW2lpoMXJBxFdxj3aBvTcOFY6Gt5pY5Or6tPoF2PAdcc8WPfef2xfuSYzUPE+YyZLXywwo4nFYZhvlk0sYYz0e4gDm1PADBNxJqjtYd14zGtwmGFudAvzCB+up6u3wyNWABt6ll2yFaT6UAnnQEkCMGlJiaa0Oewn0JRytsuHE2nDiXKTBE8sm7Bn9OqqqVj8+i2OwCyk2Zi7c1P3S/tUz/9cw/4vAJHa6MZDDSxZX62OU2w0fowM2ZI3Ww7HoS01OgkyhRGVnRRISZS8637Giwb9UOltUQBixbshooEJw3GByLqLJktecSmLZxNxNpqPudGLd2MKbSgRVmhj1ro3Io2MN6jirYM0WRG1lam677qXP+vQwpRXmbBkuf7Wd5++WTJ4mHXggFssyQKi20e9rEbim2kMx3EVGW7UY0ae8McpB+xjHPQ2w+V+0HsrdRXEer0k42KnS9rwYPz66zcF8QKpoN422FzuuX4HOoKaTUzD2srrZA6zRkg7thF1vgamIerPM0ZcAfvCCiLcxuwi/oFTeAKD25nmzfJ9ftH5iJ7NmvzDW+Fa8TEgKWCPKPs0TMrmcokoVUYaOOwrRu00JcndfhJIP5c9UqL5ZMIFzHI2DKmwhAtoo3oOeXnoqtBOa6Z2m7BGZIuqsrS2ReaOUin3dGwZWE6OUxA1nytM0bzfhJXReMwWwljRLEdhAhzt0QTMGAX9AWemRvKmQmn3NwrsdqAmh4VjGoD0RDD1NpcYqHMrMlHkS3HaHTjoIbFYGSN7czAHQ2OYVrxfPXusTZ7fWo+rA3Lek6upLrOszvh1mqYt8WosLhMVq0NTzVwXBX72nwYqJ6YxlwlTaSaoXVT1kw+yw63zX1pgo080aittFHTMhLTfmUEbSfSagMQ3yyKeZ6J5DiTwyYUkuaWc8r5Okabj3T2Pc2imQ9A7Ec6n/baJnNUpNh6ewQakOny0Rm9zl77Ec1uBFMQUEZyh4o6rIaA1A49jHzTAiPaKhu6RQ5tl8tW9RHNoxHyGfmydZr1oHrcGcQVrRMsxES9v1LtvbMxMEaYm13MPaYBOQ1u2sNh00ZreBhhixlus5sN7pJBzDBIlQi0FdvpFWoj+rBm0mOYoQOD+ND2nIO6tkID9kr9ZZxe6vQqTq/9dInF1ULmsShadmCZp93Zls7QJMwherPdPlzBkmGOdo5l+KLRbFgf3Ka/n66n69d201XyHxgth0uVKAbgyLHb6pbpfnAr73BSj0RKmYXsnZH+WdAcmZZWi3Ou/G4Ks5zRKPr5XOZ98iWGyeEZ/AEgvbZMaIRJanPLUBQjOJyeIF3CjBaBJs3g03BTILEVPXUsSmFJH861QqMgEgNzzaPq36wARwpodjfdTQ4MAvJOH2Ym42HksinxhTsC2C3czCKYKdI1XFrYik0gzkOCSalOE+5cL+Yr03XUurGbDT2k4DJ5EYNACsQsXbj+goiSjEk2twQp+ShDtJmaSSkQrzYnKwFTPoEoFV0qZEeYGV02FXYOswEbgBXb6pB5yGtRde501RQsieFSgeWZitZo4xKdiJjBhDNUDaQ645nGHf0OcUI0RRZgz+CLPCHCkbl6nJnFFIVVLRXSQfNMXaCuQ+p0hww3qGPByTxZwIbYQuruMM5o2UBtjBMQYpseIh2GTTEj9bhL29gU2UQNNvoJCLAfOrL2BkhklsTLtX14a0IHcam8okekZAEh85y0U0rDOAzG2uEjX9N7hT7DZ4h8CpsSjPAA7bRda9JTdoH46Xq6nq7bj/JcKLRRJrZQssNSMKcfEAs9ZDBXgOjEzkrKZK/5Cdab5N6piR205xvflnBDjLldE8jRn6lwFXQeILsCALcmNmqucmxgEofJphqpN7jZ2trS+mg9GjHHSLWjzg+RKNXkks0KLSlVZTH+jE94phZ0RnVAGYFmN1rv/sww1eFrISMaLyQegCc4NdBjYGskvTKuntJShwul/MidT0yzimSV4oce7q03P0kDJP6cV//nvSVRh640aN0s3dpOdGJ6g6aVqzxNGSSflbUxxdnUZ29C6g7+202cPjivplywc3UBdPpCB3kxv3YQ7zntPLRY0tVkM2Foq39jN2bzEIU3KRO86ir44WszGdngMwtQYPXIedMsXdEIrWpntLNaZ8QVYuLncJe29rPe8CrN1rtd1A8xV0L5t0oNJ7Ee1GG+qaP7dD0JxP9/2wnnWEXuRKG2Rg/QMfm8Kv03ZEMtQbkSTQp54hE1c+oCTWqJSsy47TqmytIukxoij4krabcJMEh4v9BPFksLKOfW+2ogvCmkEGBNailObftttWvUQo1ucg6nu2W2rELWSCIgGm2gNcQwb222F6MCbnIDZKQF0kYKxAwxPFmQkStVuPkgB5bhXzrf3/d+/+x51tg2x0ksUms3eQeCTnNgMFYbw9yZa0QzWQsjpFIMM6h9XW2sRkILADQLlFZLW6M3QlZ4yEw/j3093xnxwTbSd3YAEGcl42XFSml4lsrb6Sjj6WgBxsyjd8swQWaM3oBVJBGpRB8a2qRjMRpdRm+hm55YDVfOya0yvHJ6WJkraaffcbzAOHEkLfMwxiSA2Tdt8HQu/6z0BzVArmaKoTZkPlu/xqvQ0mSVeLSI5pCXlFzqcMA0xezUrHPpN6pPjXiaDnDoQ6szThiD68XosjOHc4ntgJXuAm1zMki2xvXUEAtVPCXd7QiTAyyLuYQTx8KBGZEwMxITmd8c9lh3NKUGOuwM+RwnyxnklXZR+xSnl7p75Xev4u7e70b0/ADKO7zR2QZFhFOtRp6xDRs9eGFS0DfGGm31JbzTe1utXcj4Rc5Mv6zy9qlMfrr+WQrEgVw8RxqLjDI9PBzmqlVSUZgFCw3hNYNCEwxtjbYQmjggBwNJz58TcUXkj2EZNRDH9m3B9IkVzZWYOlPifqgM6BElxRSUmurU7mFjTcQEzKKLinJ5ROTkDSMmi4EgFWFFZ3JqgIMWkjFgI3VdqlX3VjDIt76muVusZIADIGM172ouWhSHoYkOgBVEMyxSiQYiShanCSqldXpMUM+AGCaFFAA4nH4hV4pw0AfbMNoeGr2XCF6NZADhcDcPKug+Neg8ABU0ODJKbiT6OWimsHIQ+0olNI9sxijWB/os/sJJGU0FpB4mQ+7UmBtxRoWn+Dt9NQ/kxNSCZat6Q6Yi8BJ9jYYd3tVWtYzJ3hAKKeR3xgmeVKUTvEELokknxJ28SVvKXENls2TRd1G/V+TI2EC7w7rFmvMQEdNqhmYMtTtzQMZox/hW6SjC2nxVtE1E3z5obf1azhJ27zrT26HIT8XnYcGWX1lstDzmXY8pb2k+u/nisfIyNu2+OiLzUJRhjJizBUbJhhoVxgf6VRhghxvlJuDvEdNvqDdDlgN/v/DOp6e98un69d2Xr0/bi8pswcMf3VYyGUmnGuxQ9rGqAsqAncT3zbCvNxw3k5G6BWtnyLZvv+T2pLplxMia2InAgTKQleS5t5y+BME1Ceddy3NeXgKQ9Wh3YX1YcxJWU0EuhmHty0Vwa2EZClfrphIokcBABlpU+p6ZTCoeBaxFZfz97JM2N8exS5KZelnNorXsixmV7mrysAhbGTMN8H0PwE35sC/EAiccGabdo83t329e1EoGuhWh5zNPPvaIHvtiRvbNwL1fQlUya+A3rO3BNk3KOob2FAVbqQ5nTp1RRvl1hA+u51ZBcX5F12J4mpEB9iz2M1OJhz4Ht5DA7XNUzdc2kwmO7VWPvgkU2i1c26dv/+6MWNjdE+Vumo8gLemx9Uthh+5Kmp9W2Kq2oq3wyVekrrV+7S60m5eFF7WbV567g7gcV5vjuTGAMdBS6fAZeIxCfdb9Oo4pPG3KTwLx50opvuLBb7QhuomQdbc4fk5CIRihOYPPwMYKIMPMYRMoEcKgRR3eWSmXUQdiH1TQQgZYhw2Fb0wGtjU7nfQAF3NraC2sBS3ErEZdlqqf3MzLY+yDIFsLGZmbdBButGhDPhjdZvY5doE4u4QlEJPDwm0khTAYo3qaMSwGn5/9y/evXtx/2k7P/3R95iN1ZFMC0oPmKhc2mH7kGLYOW1eTE5nb18jG1tJjJQLuNoaN1XShDAONBAeIoJEQhrVLzp9UD65o73N3tEBft8ohYz0ZwZga8RaHLScH1LelHwDo+3zjBqZta515LEhHc3Ac2FxE1VPau5SWd+t2YoJbBncxPXYHcdqHmWvlwkhMMMvyo60Veey2ZxkcpS5Xv+NhukH2PD0sE+o2qfcw3EqXjWgjmkdX9EiBeDqIz+qN4eKJo+ejmztvQ3SqA20OzB5rS2N+g3X6MxtD3Wzi+fcNjw/zKY7w+z3cD9xMxPn8dFbse4A5N5QuvgmabCP6aHsi3s1rse1nDhh4mUNQAgdM4r36p1o+1elVnO79dPGTopUT3DtGs2HNEdws81OiCsa+r99GC7raqj6iK9XhlW3U8PtnugIxnhquT9evokDM/HS0NK3kwXIj4+xCz6ZoGbKBU3yJ9KiamUjYQltrYW/pC3XaSDpt7ebhRBipUEVnpOVEKRA7tfJ08WerBxlGCi0kcm08o4kI1vYhIaLMU8OnQAxYQ7mM086Tqm7iIArAVwKxJyZiAIOn4YsHwFfonqmmyaxnZm7XnU/JNQYROF3ibvggL7SxWGtVd7EJnvajyW9SgSkSigUGE04s5W54EIiJNQViKGaG3mC76Pl5Hc3O+buG2HaBeFvjoyzYqUQjfcEKYkw2bajOU04fBsEDY1OlU7+G5MRKEtXJ65KQ1mYCalPZdFir94MNRs9uHumA8mC0q5BbVjuvkbQBurbAtH7i4J4NcbTJ0KMVFnCacHO7OdFPiEVxB++JmJDfwe8QDfKNFDFnWiukUBka0bBJHJiZOdAJcQ/1JPFV+Oku7NocjrlxbKVefJCGEZMvse2kDfIpCh9sujpxqJoxV9cbIsVn1g1B6JQo8Yy3nSeQx3LqdjuUz4S6KfJuERR2LenuE8Ue7Xo0m48oCNrUC6jOsXykkKwmdAKIDb8ohFjQEwPq6fo1vZZrgO227LTHwrG3YNlcvjoCHBf1SG9m1in72IIqu3tGfd4uERP2mtpl2ME8/GgsR4eCQYx+15fnVMgWtaV6ew/LH2IYw5pAsYOI/kzW1uVuWMsa2UwEwrRRidfenNbSFroRl3EA1E4NTZbQe8oKM2WGhx06kz2iEUPGCFAmdC9WrrPuUIqx14Bms+wI/qzzf6Xkzac3/86NCs0ZbJptuRuzcy7Zdv0Vk6h0W1sh9SpL+AGGmLp+Daaz+WFZugXoPRjhfbSDwUozjaqhf+ZqTaVXugajDQna6sWXSO7YlUBMCx2iU1MdJnUkfUxTIMAsdaNznOiB6Iktu7nLe0gdtmzYnkF585ZqT5x1+sFZtLdCDvrwTpRojJOmG5FVGKdVInaqNA7Gsjz82Kp2QTurL4gLWvBWHX5j3amaTY8JJN2sYHn2zZPVyI+HSMRCl7hw5EEgZE5FJtDC1kpZrmGFX0gjzpN8+C9FBHzaAZ4E4tu3BK/6Hzf/tEVyR4vogDMLHSAsd7ANpJSWI0tcQDoKbYanZ09SVspRm1MIGbcdbuHM8DPr0S/0uyYK3pqzrYRgTRZcgWj1K6LZjqlATe0lqLFmPEdl7ABVYqmhZe8x41wGs8upDvhMpZ4rtQ3rAxhbGYkwFgxR8GFY+db9+a3XL5f1UyhenN96OU4+LGnCmJZeC3pMLM5gKtdxYRtomdFm9BQXUQOGHhyr4YznZ18bB8zNmolmBikIExlNZcOdRu/DREjAxrSiOLfA9JzS3XKBaui1Os7H9RMVErudcJxtFIMg/chwHpjvAMOi9Prcxhqjmwc4LFD/oL33EAYLbIniwYpsgsFI0hh95q1NbkOzw3hThMHkkOPI3UO6ZiNxwfvMKSMszweZU+cyEQu8MU5z4jppvENd6vAWiJgO4oyeiOnGusNoWzuUmWIcW/xoO5wOOGPfOy+5mVzYF/MLI0stKs+DpkcAXbg2D2TNvwUH4BnHPXqTGr0hSKaD2GEJyCoSizjCFlJ6BE+2vapboOxmQE9J6h79VcIl4nTxU+QEcN41b+ZmXjkPlZsE0ksDh12HHhx22QFbo4cvGM1WtpVcTU8hdU/Xr/tlqqmVas6k2qTHTqcFeiKDlXrqFm7DzT1FT9iwNmLDwtmguWFMcM1ETISbtdiANjEF4kyoW9b44v364nKZ8xsyhWiX1n6Ku3vrsYUHCBG2Eglh0EoMILdmKa3JpDSTABjKuBtOgTi1VwVa6PllPF9Xg8Dnr9Ajn4oOJoZBgOCOkZNGK/saX7o/P1/Xi7Wf8vT61EczArT0Q5ZHOLXMFJfncxWAkUEq3Dw2/gMBaLCtMsmZxlcisKzxhfvLW5fzpS1/as98Me+yFjDuffTZZy3VW4iAD5ODjj6ihSi0gBvPMIHeDIxUh0um332jeHZxN15INUbAnb6SxMjOc75/LOjGKNIWBvvYOsHijMibycPbGObV9G0Ik0G8F2bbpnDZuWBVc21F8NRqcSoGcXSoSXepFCtM0RWDNKlppx4lUfqCZlrqrDZncRrVoDt4/u/GayJxZ+M+FgB5I8859rLvsY1SV1TJfRfOIg2TMjH/csyKvd16uUUxHOv8KQyd6O3gWNM1geoxdbjsQjmQt+ckbL35OsVZbfIo4zZhj8xgHe9X1MiXnGCbHDC7pn4BoEe7sJFKPwfVftHe1lMZ+XT9RjRxM44yF7dsC+3tpysV0qjOKKONDUVfGAv9nLDGLYLF4pADPScdZrmFRzwtj4tVmmf0kmZJANGfAfJ2khHHYmjrJeVkrxmAWJ4f24SjGZrMlKprhIVhNa6tDTMZbFaDtYjvSqVIR0aRJ9U3NWLuRNbjQvWmAOosgjPSXGnVij6zdwTKWsw8I9EUbrjey8grRf/61gu5sf142diathr0ViArs+2bg/XSYhy8eY0e9whviv2DN89eblN4JLPuVpPZNmCR557xg+nlegDE0NUbQFS0A1+iRl1rhvdG/90fNjMJV2YedR6g0kqn/b40+sJIUEMrT5geivXZ3D3BO0JgeqrskAFQUkQ0s9gikbJfbbekZ0oWFRVRDYb96U3RH6BXp0U5KrTr6QxxRVvVBuwiy0npwyzPFRXqBk08vVm4qAUMV++gHO3Nk5Vpz6GUJRSEIhT1NNpZfagf31YL/ES3X1TYfdqUnwTif8pS8XFib3vbsdDyYfAWObqZS5ntXTPtEwEVRmJeVqZ0lbaISCcJ0PxgfwgWANHNEni4ytbgoNg4aCsxSBEhC3UgOt1N3WbQBwAO2Kh8PHJThwdJ+KiEbORgLNQGaLIhG3XYl9euwrDcGOicAGL6sBKIHRE0MRw+2C/x4vxquXzSxv0ifPH+/uW6FBIRoGVVr5LMhLR0+bC42HLWW+f12boSul+WT56dhjKX3iAMJy58dh7/3Kevz73/Y3vmzUaGAs0uaGM2ULVPTfDQat5eyoDckBhlTxgiY5aj4eSAhWJKh7zB/ETZrmHa8j7hZPIlK/ZdpCYvcv+KmafIuzLcHGEsAXsOkkabekOVioSJaVSvtvwJ4znWOw4JVxUV9+1TE6g31RdUY8+Enmey7OAjDXRDNlCopNkCxclcQgDJl5A3hCEBxKLEM/pzrnNITIXByqiE7IjOOhkzln3bs5NBbABtDfCspXOk3euYNVvh5of9JjvcN5aFFHw3ov8d/BnXE5ctpM7KpaDpGGquCDVh9Qcm5co0ry7L/pRqt77xrP5Ky6s43fsyUhPwidAIo2DONhiEubxXomxKzuWRuire61cM2Yge3m20tpqtxHgSiJ+u34DiM6NZRQMs5qi3fkbOCJMnkLubO8dIegNJtWE2CKqGKwY1U+zmOm+pk3bAmsIpccyN2J12wfPz+qXXn95d7me9lZ9WW9uSheVoBsAiTPBGh+V4Z7/E6RIiL82yEwyCpGJXSBNfP0BaQQYh2NDzi791uTy/3PdIc+ezV+hp+EjkQaMkuFu4acWyxlv36xdfv74b5ztra+P96N6Y6TgV5takGV8Sg+G2MZTcMzZBERjZlg4qAKBf9OI8WoSbrc3cuHh84Xz54utPl/V+LHdraz89ncZirRn7LKjmeclrzIgRUEADtuI04sXl0iPcmsi2BrXcs0WnYD4MFx6oUKLUQ184X4ZRdhqdAjXANaNmSCrzXyS0JjnN2YaMMKfl1pxLdimD00S8lxFXHpxQC7VVrSNW9OO/7iJyDYts5WtKujDECXFCdMRJnj3VDp0Up0yuEBu3uLlIp+2qTq7ZHWyTYJhTopPLVCOZLee7tSupVn3iyoThTcE+Z41vy7ldFNZCrzPWPKnYZBAveBQIqIcluhWDeDyMGtdjpOBj9XhWd2z5B9MvzGvNNz3wEgSFRTSayAd6eJB6iJioTfmoJ1RLCluIXcJVTOnbe0L+P11P1wMBcKfQ7FOG29JyTIGsf1XOIqi32a4p0coSoj+5ijpmos2bLMDUcTD/jVoQtplMIg6roHhg5FTRWXyJStimubXrot9EerPkS7Q0aZnccOkNoBtT9CyuUBqSDLCJmJhWr5wfjiI3iy0gyqSu6D9zjckyysLo2RPNKBW0JrvFDHO7hzkLpEeM0g+kyfmXQkwo7+rOi3hwC+mGToFU187i4i1xUpt4Hft66PNdUyYmNLk92obgZxf+8qY2ONBMOKARfBSazK1wnE81smUbjUVHWThWXw5vijqSkkHCzAGYuebLX2qPqkTtjIXjxBFgZxiTQHqzO++YiAUhWKuYgfo4lEFKW9/9BjFx/MhkNny9+SbvMbbtlzVQTOuCuOnI83OKEAZslSWDeClY5tXg3nwuHpq0KeCitvCRrVPAGW1BeJW/tvXUTxwiXGVf3xATV0cOitSCWOhPi/CTQPx50oevG3K5BDBSnIWiQYGoUC0gMs20jKH5kcyOVBiDFiwFbFT0dFsjOmJGoFKc9uEk8VX4G5ull1BmNswGMCxTbhgyizboYVBT0ceLNjNgnsudI5xIf65Rg9FApgZqOXViw6ypjcw9AcFKTY25HgRskIMxDb+AwhhBH6ZADL51vjy7f9kuLwG19dXz86t2+cJYzUxowcbiAjuiM2eKs4y0VV+6P3/51ad3670hLv1uiS/+6fO7DJMDoMF+iS+/ev2lTz++LHfn3j9pJ+9synCeTHG1A8W9VuF/8KW/8Hf+hf/OT5998R+8/V8r4ENAgzFmoXhYguVEwKRna5xhOkSHloBX1tkU86wQ+yMtbDk7nH1LkmpNhbycDcOMZYNQHUWL600YewkWzPdDIAiqp1Iemb3W5rK+HdQeWZUfbrG82SRz2wcoj+baeWB2CJ7VTPdGGLyhbQ7iTTndqVZ5x7qNTDFe4F2Z3o52zEYnSC3wZ/Qz2iCfcSz0Zsn2nO2ZuDJ8EZnO55e9wTiBkgc806YmN6ohRHaGIdo0uWmm3DhaqOlNseaaU2SHJzV7MAN2r34fy70vl1jCO9aWJWi+apZoiEEzFGhbyAGCKQhvreawbQQBDJlHk1uqw1pN/iQQP12/AVcAnrE3YZ1iGW/TuMIb76OYPVdzIIodn1My2eFahtkwYyRrSE7lgr/nlmC4jcHkQIzBVF3rXx13q3/x/v75/ctlfX1QrARrvZ3W1tzaaA1AC28Rl94+5SJjG/HF1+uL80XE6+X0Kvra28bJOI14to6Tu9N+aqeRgKQARBt6cR5fOl+en+/v1lfdx1x3nq3GCyypq7lhuVMDfeit+/XL96+frffNL13xoveXl7tLs8Gcak3ZFARlSu6fB2NYeAWsp0QcDndi5QbWfXbxL5zvTz6CtrYWZnfr+uL88nR+aX7p4/mXWn/1rF9OFp2bFfdv/fN/8Uv3n/zk7kv/uH85p5QgaEVb8fw8XqyXt+7vW7i3HmYWYYqwZ+dmELFiWeM0Dk3d0J3783UdxmH2aVsiaEOnS4g4t31kN/EdLQhH9rmvwgOyrRt2BfLjbq4ScK9Ws0BggBe10wHuM6ItNkpqhrka6ccdszPu4MUgVqQoXEoxwlS6cO7XE82vSeXnBY2IE2BzyrUddnZCHeqMJj9xrGrPbOSRIEWP5xwvdeLMYUs/lDNxm1dl9ZCd0RriDuMe/RAqiwUu4DV6svx3PBaQ9ORQN16Hsc+zy2LeHoNAPtyXuefkTWSXmAl1O2LCcjA1MeJHzbd2/JBlYuT1medagygRXwgrduZVz+kq4ScC00dnT4vx0/V03So1u/Qn21mrePipm1VJARhPdKe1mpgVc6gy4RJ0MoRUbQ9XzWZos8EmX+JxdVj7J3mD2ooGypdnMQXIIM+9beupNWkk9c+2kLqwNvoztzasOLkZgc5oxYnMuR9DJdRNB7E2lE4WAJk7UK4QakMf2M+P1czn0ua8qcRBSRwC2iJ7k3aq0lt1rRETaPj7X/oLf+vP/8WfPvviP/jyX5iUCdGw4SbEaYfbXMDHm76Sjx9b5DsiYAFF3hPiwWCFrt8pnKMnx+/QbsZ+4zPzqJ6eDqmbH4vgtfg/G7oTR1+M5pKG95A6g3zbs8rIDO4CZaXsHN94O1NDysTaLNUD1hi8Nkrz0Iu1w9/7ziAWdhGp7dq4rpu1G9bCqV598AR/5/uHaZra5spVBmhMBvEdRme4eEG7oF1gq9pIH7HMyc+cqAgB5/oU78EJRwU5A94v6gFuAM0Ak3M169/renzizp9W4CeB+Be7Pv744/fff/+P//iPP/7443feeef3f//3v/KVr9x8z0cfffTd7373xz/+8dtvv/17v/d7X//61z/zbrh1zWIvP+rDO9kIpDak0FyhEk6XraQ9E6OGYZHqsDJLR+CQ+QPjftRsZqxZ5FhrzUZrq6JFWm5jtQijyRRmskE6FcWZz5G9UrhyW3PKra96cRnD7PVdC9JXSqDBjGZGEwfbEJIY3Jke2bKgEAz0AY6Kd6dDKDRhpsRo8MX5frm85OUTALC7u8unLy7rT8bd6CRpQcVEA6c/c9Qjfeu8vv3q5YtXH/f1FRFLuzNF8O0/tWc5ntBWvHW/funVT+9e/2lfn315ufv0rsew1aoiMhPQzI/7i2j6P/xr/5N/+PZf+H/+y/96uYndUghQmHJY1adPvLLJcLfG4n5pW2pKzgGVGS2nVuUmwRoQFsM0ZvqQGxBmoImu6SDOJTuyrxhG29EFR/XRdr+MT5M1LMxzL2jUwrjDeMb1BF8n0urh1KcOgaeHluV1hO78CSHjFjNurk4nUyNO/oYpGtyQaI5jSJ0Y8xBnB6J8ibmsYTQ9mHMyYEHc0UN4zvWVrScr17T2Ym9n+zfGKQX+63ExbGGvYuz683Rbm0tYOE70s+onZ05dc3GdEzGPCMTzz2FQB6kOZ6P1tZZzLMMXjIXDcggmp3jausdh2bYx542K7HWyMNsz6FXqsCkavbWVtlLJ8fSnkvXp+rxcH3744Q9/+MMf//jHAHJXffvtt2++5/333//hD3/48ccfv/vuu3/tr/21d9555+dvupphjPkxMR6wqI+oydVzdShpvE4NcgCCw3xYyxEcA+bmmD28+rgFcuUfA8lHkhCDJNCEgRfn9a37V6fLS1s/PazRhDXa3XPrmOajFt7CL70HbZg9X9cvv3r57PIa5N16t/jz87IEuDYz4fm6vnU5L74GzY2f8CRjDmU8v4wvnS/LGHfj9bK+BnF3/iTrlHPvn/B07gabFAvPrcq/dL5/6/XL0/qKcYHiRb97cX6x9jsnQ7Ra0ZlDPArGFJezt51Js4BSHW6rFo/sM3/h/vyF86s+VgCZXrusr5fzJ1xfUSv7+tb98vz84nL3bPSZXw78e1/99/6dP/kbf/wv/ttjbTF4cEavb9/fP7+8Pp1fWXi0JawngevS2qWfQnZa4274s+HP1rV2oojF18VXNwti7Xbp/TTii+ezk6M/8wkdpCHclJtUn1XTsGLxZV9fc1D2qo9c/1unkhQfxYnP4yX61kse0bYzXg4PbzeUSN8EEC8TB3EnfyY/KZFNarBpH9ZUWERgVV8wHOZU3zbTSn7AHVzAp4gtxGazQKWOjIn4t9pn45S5hNPUvU3uOOycz06CjrRvlwv9RF9h2xPUGEZllCuIzhD8+Gl0GWY/mAAfV3Dqc3yBnRBISPFsP1+ia8+ys/2R+RyLigfKryg1SXoY3qqj4luICToTI/ozNIYR2TPmDAf+9Vmuv/Wtb33lK1+5KY4+/vjjXMBvrnfeeee4VmeR9cMf/vBnLPVP16/Kpvzhhx9+//vf/+ijj95UL38WIWiLi7MSY29D6qpDm0x26qKuYrzGYsN8MSbszq40JF6PatamJVBqP1NU1SONZgCjP9u/ssGM5wplTSDYpcFhbSwvlssnIMfywq3dn+5SBU7EhFTD+PmAvQGWpSAexF6KmZybiTEWuxZpO4NCn+0w1OhGndrKUIhhtoW/8BBFum9AJpJmCgkbM5cA8B/8pf/ZP/xz/+J//Nv/xrKU6Lerw1kVVmusXHAPn9uySFE0vumdEQY0meONGq8m+QdoTZMLfVPNIQK/AOVnZjngmOuSsqgmaLF2Qe7Rpy27DoFKpYty7x5zdMrHnRSm2uvJSFBgo4uWUanaVV8QaJaVfjzj6rDOu3TQ64jn2BnEh5nafa5oE4Rme1WbxltP060tTNj0CqPuOJoFJ6ORh3iiDXl53QutFISL2lltsc1BfDQsXylVN0bx7WCuSpHeTGalDg+ZF4MYRnUbAla1HbUMJOsyhGMWX3vSiJ8E4l/o+vGPf/zVr371448/PlakX//617/3ve9tX/nggw++8Y1vbN/zwQcffP/73//Rj370WZohDxQ07ikggjlBKaDRKg9MAAuZehCpOMO6zNJF6LaFrRtAj1x8dj6cmAYfDWQSXYijW1/NBmzQBpFapFuOkzRTGxk0XjVMdmkMMdTSZ4EgBp6N8aXz/TBze74qpSlaxxhFQrQmDrW5B2S1YRsK2ckBeNbVMCktt1lhutNWnc6v2+VTnF8CQh/98ukX7+8/eXEXi7khp20ZQQeVkW7UMK74wv39i9c/We7/lOun0Gjt+XPgbbZLay+5WOity/jy61fPXn9s9/+Y/fmLuxcvzi9e9iWnbpEeEVgz7QZUwlowPbgySAkdViCGRVTPNB+FNtN1iMLzdV0bz/nIta3nU8XIEPaUiZ2xWvqgfeQCTRpak/VosQ9KG6PRG6NztOqc2w6dPy7C1VQAg0Fty2NKzJ0Htv0cON2kz6Nmqv02585iByTgtjsQEe0YPWfQHYemPOrJ5gujW4QVLhAElCF1ue8942qTXLxJtGllCrBaJft2GEk6NjqgZxgLRytmZM79IOYDyR9pjIV+3SiuiKA5XFO//BnHC6yv2O/VBfZKjQ+yUE1pT46bWanj/lc2MRu084QmZXdgwBLkf+/LxU/uC0drl2Zex+c22AbggBulDE2iZAMWVGKsHgzeRs0fWESzHJBfM+XJIn6RpN9f1k76tCM/XQ+ub3zjG++///6x5vz2t7/9ox/96N13392++NWvfvXDDz/cvuH999//3ve+99577/3c95vcJBKyoKRIhOjDYYgJerJIvoS5MwY5sKzRQ6/YxmAfJKddoiBLtq0aYzqOK8pLiJU2EAuS6vuF8+u7yye8fML1030GlpR1tvXUF1oTjRB9WIxTW4I2Wnt+uX/x6ifL+gpk78+6j3U5Be3SFoPu1vPd+XX3VeTamputrS0ehL54viw+nl9e9fW1jddUiLwDIN0tdwFelrsMz1YAjmWNZ6svYz1dXrb1FeIM6dSevXV56/603LNFAA1hbE0RqFZuZDofzKcZGQSlgdMl3jqvd+4tgsKz8+u788s2zqhZ3Wjrp7y85Poaclt8aacv3H/p5fM7P9mR9zfcxrBMz7MBSqfVv3A+f+H+5XL+tK+v8P9j799iLbuyND3sH2PMudbe50QwglkXtaoNJ8st2VB3W8WyYMuGBGfQgJ9sOJmWHuQbMul+EmwgyRfDMGAw6W7BFxgdJGT4yXZGAQYswzAYCejBemIkoEarIQnJfFCrAFlKJlxdlRcmeeJc9l5rzTnG8MOYa+21zzlBRmZlVZFVsTKQCMbZ55x9nXOOf/zj+12dMzgbs7GcTOOQUzE6Geudacp12kzjbAFW0SJajMVAVdKovqn17rCvzPsuTy7NSBObq5Ebc3UwUDmgIu5tBpkCZOtLOI4f5wws7mAuJkJWIQlqoGoCINRhOwyTtmkirNC9Gbb86d061x7WQTuoAeIuftgZo59qDicqngICaU18aHzhGSUBmXPqyNFzCQbx3JQFgA46wDZUMIOYFi4wVnbZNYmRW0id8+r8QfAO6oTqMpe1WB1qb3HyLUbmm4VcPLrVEaTd52XyDo3s0dBV7Sfx6hDuYIUJKAASt1aLyyS6zb1yBys1RUPhDAoH2c3U24Ny01yCf2k2ykePHr3zzjsArqmBUUDdvP3bb7/9ne98Z7HXvPbaax999NGykr/33nsffPDB83T7XlxftE35O9/5TrwTljfG+rV+PiGumRwnuLRB07ktdJTX4y05kxxAR3X0JA3+HUpreE11HtgPsLjfvn6s84Ce944etiIjduKx630ZfDgAJ1pjrXJkzsuqA0XGIA6/c5Oqo4BRJmVq8FaaVTryFYDYGUYMs0BMhMuYnDx4jibP81gaxLnjas4EN2flVFkx9y5veXnafaC5w7fqlhGYb8sXZV/dyUXhOKqxDugQsSbAHzJew/xtbmQCVgqQ32FO9Lh7F6e7hZVM81Pn7Mdi9O1rql9vRuDYkHz4VzViRhjXrt/8EHTaLL9MFg0MmWdzwx2cuJpT9bwMiBOB2Yg8kYZJfFW/twKcY3CWtCPtuZpz3Hg1czsfGOg4tr1VqQfld0VnIsDXtfDcrTj6h1kgpjm7vqW+00FSIG6noJlJuboDBpqci3OFFOc60x2Pz98rhvDs3VjQiw6avCnLOM5hb8DGaw8B6KiWNqoLC3UYPFnWucMRjOYXfIkv5vVFdK6dnZ2FOvzd737X3d099sJHjx4t2+TZ2dkbb7wB4IMPPnD3Tz/99Fvf+taTJ09+qR1xEYXNSZ0jW3M+sJIoszIqowqqzHaSlaYcfdYGVaAg1VolXUy4lbgGq/TQ3gksoBTcGaa7w5Qn04m8EleSSqKwyrXIVKQU0cJemSpJXYd6HTo2ZhKSKKtvp3Iy7k/G4XQqfTU2p0ilq6RKqgylYBxLAUfseyE2SCVp/0he2QpRQT/ppihr3GHWSptJ+2nHOnrde9mj7Gi63A6X3aQtFN4Oi5TUwxOSip0Ml2l4SsMZ9mfYn9H+Exk+3Q7n9/f707HeHcr93dWd/dM0nGF4SsNZP5zfHQeubpXcyApZ4Vp5KjIVHieeikyVtfK/+oPH/+t/53/7//y/futf/Q++5yEKG8d9LpVrpYMJyEHmfbFkRmg4qWX9JD0k1HkLOKIIaq+Vp4nLxDqRT/ESU61k4WaytYNYO6qZNLqUtLbA+KHFStrylziwHtr2kbD59KgdbIkvn9v4c9ydz+qws/lxMXTzfNDez2we49ox2Om8umPmZC6YVUsK8/UqO878kOG7UJ/44CBule0aMTGP2foJTXeonFDdUumoHg3jOBo18ghNgWuw/IWd6M7rIACef6mQ9VR60gPd0Akm7mKzBcyPy942DuNUjw1M87/z5DJ6GjyXGCQqnCZKE6WR0kRSiUszgHujhTQHcXOpPeME5DFio8KFeeKwD5doZjznZaD66/nzQiB+cV27vvOd7zx69OjBgwc/+tGPYld9++23z87OvvGNb6xv8+TJk29961uffvppbM1Rwa67ubdvti2alb1ysxTaszDEbbougP4ebJ9KXdE743RvGDajarBZlC06svFRUi6VS+WqHH1BLo4CK2SFpPimKBdI8ZOpngxXMl3SdOHjpU8XPp37dOHjJU2XNF3KeJXqmOvQjZfdeJHHp/3w9O7u/N7u4s7uaT8+lfFMxrM8PN0OZ6e7p6e7py/tL+7sL0+Gi348T+N5Hs/v7C9eGoa7w3hvGO7th1zrdtx14xWXHZUrmi54upDpoh8vNsPF3XGfq7mSlTgPYFv0zjhsyp68QgcaLzBdpuniZNjdGad+0kBLuWIFaEaEynbFTqbaFSODK7yQVJyO5d5+d3d3eWd3cXe42I4XabyU6ULG8zQ+TcOntP8E+099vPDpCtOFjOfb8WozVS+olePP3/vg7/0b3/+7//b/+3/wz//kP0rFT8Yasu+dYd8PF3k85/Epj+cyXUi5TNNVV3bbcX86ltOp9LX2ZTwZLrvpoh8v+vG8Hy/yeJGmizRdbsaru8P+3jDc3e/6Mm7KdDqV7aTbSZM5KVwRon9kDMSSHamAcQybab2HOdYbGwrpDFCqJgoqDdGwSJwUzVEzWeqx+DkJ3s98ieTWufWuGSZuGTZvghZGoeQuISUAxaWY6GELPnIQ99DZR2NrSMXMXHKBb6kAkJumpIPFj5oZ148+RTyfcaPl7DNQeO0tir7sYf9d2ZiWrTZOIJl0s8IQ+yrZtWEKIXabOhL5AbELk6075QiaPznxwjqbQdK3rAlKcxrh6gszretZ1uAjYqj/8gIxgF/LhvtnYKN56623bv1SNPDefPPNt4+vtY78xhtvfPTRRw8fPowi6+HDhx999FFUVS+uL9emHJLxq6++Grf50Y9+9Oqrr77zzjtLH/c56+EWLu22nOdXcNmjI/psh/QM66km0ljuuGV8tXqEyJh1jh659oE+DA48iy9xVAUsZhciY44gtrHb7PutUctgCb9WqBoc8abklRlAySc1nwBQZiUyJiIQg8RYLEATmmhMDCZiZ/aW7BJLEbdM63AQC5SXiGt2W0gU5PiMYIXVA2e0alFIN1J6KWmR7G5CHggQuz0ODiDC//Ifvft3n/zd9/+t/9Hf+ul/3H5FkKDjUfA8OMF+TWm9nux3MzU8XNLsINiyH84/QWQF6b9xiKMY8OLbouR80eUdt7UMjtf9VZfiOTp5fug6REJduN21USbosIHSqunAq2wEIk+sHMETuF6bEjzBMmtCk555Psse6/nHW/kMoaJ1aRv1qUno98u5pVnS15Wkz+PNC2IRRmEYXrZhO5TV3jbuQ0/FQNVl8jRaCsTErQGztyr4fiR8Hb0ULWcv8oSaAa+FT/LcTCLyCOAJPeHam+SX3o/917Mjv6iCP/f6IjqIHz16dHZ29uabby7IiAcPHrz99tvf+MY33nvvvfjHd9555+zsbDnx3L9//+HDh48fP37nnXfefPPNz5mT8qPz8/H8A0X6dkBFDcRhpSWCWfhx2jF2lt5aTqoChkAllsrulIBUIwnTAXANOYnMSJU3U315v4N7su2nua+VU2UpypVC1tQabSmwctY2aYuVt0WdAh1Lxq4s1U7HIZeBcrepJeCJYxIUKKjlyFVO0lRL1uYt4VnPYgXV0JF5M2mnBmBS1rgf6ifT2E2XKJdtAakD1at+vDwZp6FPLqRGYos3FqKAkiudTlM/XPJ4hvEcWgB3rcSc0/Y0b5woaT0ZLrrhKcZzlD2syHh+OlxtTrZXHaOAFYBrsI+iLCSACRl//dM//ps/+UMA//Cr/zVXMuNI41mk4cU+DENfLZudTlOnVSxFjBv7YdMKpQ82l4uVVKkU1ompQKqxQ5ktkRuso4OfZe4JC3kiFdLjPIEFXRKYAmKbG+3hzYrkJbIMzfAoOBVMqw0mdqew97pDgyjhtPK/opG/3Gf4CYdbx4x1tvAsoeSrB81u0c9oRA6bx0/m4pMZ6qDDhkcujamkMjuIF9zShgrPnESBV6KeaiZN6wlWX/Y83LAWzHdtCRqYAyGjLQNQT9qRdlQxk5EPIznzrHHAlMmhLtc+5gsERRH4wjWDhCpksjRZVk2oIoVb+6TFOAT2lF0Z4qQmFa1LFN0Ci1ziGxM6gWI0pkrUPulcK/mL7umL6wtwvffeewDef//92EDv37//ne98JyZbHz9+/Prrr5+dnb3zzjux28ZtHjx48O1vf/udd9555513Hj58+NnlZ6zDHiVkS1yNpNDjAcJwEMdQjsWOSVRxMtU7434zjQb62elWK0chZ8a1TXhwW2u9HSL7yabEXojcT6a6+GnuDmM3XfF4iekKdTwaK1KCVJYuTZ1LRzpy2UEn4rwhck5S9jQ8pXoFYvCYrHDqndhrDzDrwOUKWkDUcb7DqUrurMRikKcdW6E6UNlBRxA3bI2WLcl2exJReKzeVT0dx+14lcdLLjsql6gDEXG57Keru8MmjuhTkki5IY5sT3KDK7ZTzeag5AXFGEBX9M6wP91fsE7sBoDrwOWS6r7Jilq87GDzqbnsIF0/XtwZ7u37O3WuCP71D/9v8Zf/5O5/6XQsd8ZCbrlOm/GSpwsaz1F2cKfUuXTEORFtiO+mrtbU1WkzXuUykE2sE+AwC/2eucssJ4OYZNZJ6pRY7gydbVmZudjEXFJk5xKczCiiCFfzINSau6vS75ofNhoT6odAs2sFgpqYNyzgulKf8+IODuIUVaJbRs2oGaqghS/RhkkbmJocVFzEOccZciUQRynYRdwrTGAdaXHpOZzCxodYm2vxRZA5g84BBQ2erz2cTBoPllc8l6hRE9SphdQtCM0233OLkcQ7rkFV1vnrxUWP4YvHMfLrudQ5MN0XiFTspExr35u3GW6YONzIidxMbkvOax0mAlkjwyzePL8GUTYXdzdvDmL8CgLxF6yMDOfvYv69eT19+hTAZyzIjx8/fvLkyYMHD9588834lzfffPN73/vekydPYql/sRt+WTZlANEnePjwYbi/X3nllYcPH7722mtvvfXWD37wg+f8RXSUFI1F2bl5y5DYYtzBQe4phTmGVSzGJsyJD9aW1Ypw+HnsuEYzpc//oEVRNeStmJeU1wF0y31lcWIAzuLKfDSeR7TrT3Zd15QpDsvryn5LjWkwM4ij5+jzvzuxhWNUAx0V0jbDGCwRVu6LuH7rsxwjMWEnYrKeDIA6j5yH9gPXDAg/iOl8vXXXfKaCf/mP/r2//fN/DODeeH54erm5d4MgGHq3t/HmYzU2HmM4iK+J0OvoUyYTHMxFtOjd9Oy31LHY7Z/5CvtMXyR3xjIHNG/Fx35lp8Ob0+F+1MFAGyUNf5XFbG6MmbY39o17EnyRZh+Oli2bqswP0OeTKpg9k3bQDVUFpzlbg8gwkyWvWZ86N4OnpVClAzLCVwxi+IIMm3nD64bDTFmMhxDxNpgRE1CCMZktv5lXE1ShzxaXyWXyVHA9pI5v7NrHz3bzQa3fe9cU5NCjJheBxg16rg6YJZpFbHWuLgubglbgyuenTNBRauaL68/w+iI6iH/4wx8C+PrXv77+x9gIF67W48ePAayhw/fv34/bxJc+7w32TIsfzb4INhKbmd/msQgcrXbNj8Acxn6l4EtopVq4FlblOBovzRL3FlJ3Ok6n+4s7+6cv7S62g9bCFlPnlUxJK9FENKEWqoW9kmhj2nibP4mILbZI+jJKRTfTLpWrPF2djvvTaeyq3hlLX5QrTClQp+G1gVLABbhCypEDWivz5HeH6f6wP52mXA1K7qCKfhxkvPBpf7CplJ2Uy7vjXqqZklm4e6iZpiu5EqqfDvs8nmO8CHW4LTjDBY1n3XBxZ39xuj/vhnMezzFdtQT68aIfr7ZT4QlckdROx8oT0YQ8WL/XPDhNsHJwX4ZrOB5prVFGHst+6uQ4maastZ+GrhY69q8tHJ/oBIRZqRbWiXnE3X15eTd8ZTfcHUs3abizMZvgqE2yaE+lizQ2tiAcLZUPLSlnlZqAjiYsxt0IcblDzUs07lye0bMaelEPtYDd47Dgpa40grHZcos5gyJwCCAzQrxqCp4bzYu6Hd/VUY2k9cVBHFynBIh7uoFMojAXwBL8BGVDtW8OYouDILU9nNwpHWeYXu+Tz2TJ+KYNNJBPLdVnZSWeJ5QIGsAtrpb0xioXoa7R7bTjZzWAG8VlQpo0WROIiSdGJapMlck4PsUWKUQLujo+XEcWJz/85PasMilzZS+shbWQF5C+iFV/cf0FXx999NHZ2dmDBw+utVdjI46dN/bW119/fX2b2IU/d9sNNLxGJGObyaNnMIhb82yxD0PRVT0Zx+1w1Y8XL+0ueEINrIRyzK/USloxjwHBKrF6MttOejLVO2O9tx/ujuP9/XBvP5yOl2m6xHQJHWZs2/zHDTqi7LhcSrnkckXTBU0XPD4NXzCPTzGd+3jlwwXGpxieyvBUhqdpPE/TRYik8SdN55vxYjtc9MNlN1504wXrxHVHde9l52UHU0wXPF5Iueimq9NpygFyM2xL3ZZ9N13JdEHThU+XXnde9piuZLrspv2mlLvjtJ00FacCrzFnQ15Jqneq21JOx2lbalZLaqfjdDJc5fE8T+dpPE/TOU8XmC59uvLpwsdzL5cHdRiAG8ouDRen41Uu2uA75fAivTRMd4cxa7kzXG2nXZ4uebrAdIHpCmW3eLF5ukjlajNe3hkuN8NVN11IueSpPasUmvJ4QdOlTFd5uuzGy8VTvJ2u7ozD3XF8aRhPp8LVY1ApGBqmHGnmZlEaBQCRlhldWqZcl6S7SGSNDAlcp9/6AiIAzWM0vMDyBLaBhr0uuWXXzq2H9mityrAAc5TkLTD9IEGHfyfaupjRe7FDJ9fQlOd8WqNVPi2vEmnpGAexfHXh/NpxCScHuMRRszp+4BIdfmwivt6sPTih6AgH43Pj9jY5xNEAxC2uo0kp7TgNUibj67JvtOcPGT+3bIqkgXgiPh4unp2LRIssf9RqppnGxstU7pf6euWVVx48ePAsHMSHH3645g/cvII7/M1vfnP9j/Gf8aUX15dlU/7oo48+/PDDeD8sN4j3xocffvgZXYRrAuDq8+brfK1r7ZYZieMyL1Mb0hbIeZTYHj7dYDYcJt6P5QcHu82xVREf9rmtGScCYeg2a3X4WtwW88F2Wjkcx1EJ8aKHtYS6cBBHsNvsoqUFBHwo+pehjQDUeuJGVvc5yy4eAvi5lKsQIrdcT7iccNly6bgwtQmTxTDb/sKtrKFjjZgYJCC6iSqea6gVb+FA1L9x4PIWbwTcGB9ZdF5rAxiraqyRfMF8iz2c4MS/3Drrz1rz1w9n2U/9aMrEjA9zogSTxhf0ABCTpdmuNE/3HjYIovWW1+zDC0L0oPbMzyZjqdNVYLlxjef9qSnaLUpuju05dI7pyDl0aI+szdu0bLi07hS02zB5T2URiIlWQoe1Eh6HVHkQMEHGIEu4qPN8zDw84eLKq6r1WpaggwaXvSc95NYeNX0UVMG64rws8nSCAagmLe1gKbSdV+QuzzcjB15cf9HXF9FB/LWvfe2rX/3qtaNP7HPLP177z7i++tWvLl96vgVpQfLM/LJICq3EGv06cnJ3ImIlW1SqsFUeSLIKMrixGtWYeFVSsCs1FO3qQx56bmimZPXE9KV+89Ny6oUpsRlrZZ6wHYuD9hDN5DEVowRbbKJtFj7oRzCWWvK05+mKdHJKd4GsNqW081QJhVmZVEmUiUDiFGjjFqYX+3OLzOqKno77TZ1GybnLo4o5paL9tKPpClYPi0YdebrcDpfbcveiy+Hu8fDGVoKRKdPk22HH4wXK/lo1QOOF5DsdwF65nGO6gNdWmk6Xabo6GYcimYBktilTxMqc1CJqlfmq7/aU7g4X8ePOupfcyDxeAnKdPTHaep7iEDcx20yDmIobma/JvivQO5m27VQr8YiX9tPLVxe5FiKMaZP7/sJ72xCMyGfVtQ2beGZtUye8WmQdS6YKLaxgB8+s4OhDZ7JMFi02OWQkON0YO7o92YHnGZQ5hY6MnczbAEjjJDFZhwpQiR6DMxmzQipICfMQrntgMqj1+7BEjrb6NhzECV7bvT1sqOGnTvAelZG2qD3VtOQDzIOlq8/UswCIjb5kHrALhEa8hwmshzqhJ82kO08tk73dEXZju70JRt5GTBYD/WFSpjpPkMlStQwVLiQTeWE4xdkLYXs0DqwqqfEc1gQjkN8+cDWn55FzsLm1sBdKBZ3ai27oi+sv/Hr77bdvKg4//vGPl6029tbYZ9dSxfNsu9HAcyfAOdQcd7r1Ex8R3CECGpsSVWyncjLu+vEylR1Am+krQ00mbQHXABD7YXciQ1/s7ji2pBaz0/Fqjo72VHY0XaDucWuijBvqQNMVZIROPl1BpyjFiLOXHcrQkpmrwc3rQMzQAhbUwWOXJJB0Iom5b7ze1lW9orLzuoe7131b+a0kyttpOMmdONhsO039tJdpF+ow6thQu3WQ6TLn003qQ3YkT0ii3gAEBM/VttN4Mg05dUYnRixmp9PQjxcyXUAnCoBtHX26gpUDgvnapSOXy3682k73ppQA9OVwiO9L2U57wEVrKlccgnvZR9I51NwqJBMRc9dxBgnryOWS6gidUEfA3AxW4RVawUKpI6tcd6gTccqpPwVFoIP026tNLkamzLOK2RzEILNlmmfOpF286DdagGaskeJgIqzaAMTp0HONLbmxGw9mijWDOLjDqVmJlcgExG68chDP3teWfSesYRggonDhzVs84B6ExETGjp7q4ImA+CEANlSr5+WxRFu0Rg3Y3tTXi2taxzEfDE3NwRSb+kp9nvu+8Os/pM2BehetWXL3VgeXeQO9rdrHTC1MtoxqO8GCounLjhlTT3UpPB0r5CKv7wgr8cr/ywonEBFbtIPXA/EzgjHMZYQF28j2pVeHl6iVa+TZdbn0yiuvfPTRR48fP46U72tdvVsLqOdcyV9cX8BN+eZt4g0Q74Rn/fA5J5Ou6bFyWDH8eqlBDVInZDN+5zC5zyvUyyyQmRPpsx21uBaZdqSIzR/h5U62pd0BrK3Bu5yNbxGWmWCMfbc9Ha6caN9v2/LQhNQDMpbm9ZEJzAcH8QyaiB6URl3D5BUcJxjMymQoksaf5faw8IuRM3km29IUD6hAwkBTlw3H17OWi3ZJdMTku67yX6+cQtXlhcnrR6Rmv6nQ+i3aPJkLyMWDUEi3/tLr2Xwsfp1W5Ivqcvv58EZa6aIO38I8cIcaCS/JdMtbhZrRdq7nGbN9eHYRESyTjp5aG5UUBLVIao2kdM+kxSBMYYf1AyO4RRF0pBvSGOLhVVe1MTHmGCGG92jRyTJDqOYDyhFtCa0UPaS3HTkZV82K+BUHYOO8k/ocnD43yD1glSMkuuMVEibi6lJ92btvDx5Yv7vsYNula331Jd1dmyRFTsSwjmvE10eIQjBRAaizmsyU6zZNRfAXFqkXAvFzXWtf8HLFEE30SIOsdDOk9cGDB++88873v//95/kt9of/4fQ/+RcBjID8rd87+d/8H20VnBEmJqoQovhMr1Lp5gjNEIgP6m1gFskrweAM0yUYdVnVmluzn3ZSdqhjBjbjXdS7Ye8NZHCa/KVhcsC5H3pWJVEijYM02wxNtjgUWyTSVNGBdIBX1juitaPRie6aOTpNHPZeq0RMBJC03ACah/49vDlGXalJFe5Ja6fKCnf0VVOZKMZCV6s0lV2eLk/Gaddn1/DyEBk5OxSuRIpU9lSHW7ajMnC5IhC80rTzsjuU66Zcd9tpMOnYXUy7MpJDXE+GHQAlTnZS0+l/+ef/OL7jP/rtf84MGiOolUjnY84Kr3Q6lZNpL6YAxIxW5x9fysc29QxVcsArTqZ6b9ifDudi1YjJXYWnmgaV9QmKnQTWUyVIUCaCBbHsGu3ZRpuj4UoxdS1K1WnOiLAOtkFV0HQ4tNzclNdHOrotbrSNcM41Ms/2omju2cISmp/wBvhrhaaTA6Mnd+JmCucOdabjIyZcJJBfHhERqwPlDFXcQDOsQjOpwFqShK9PPg15ASDBNlTUefDk104rRNce9gbaU90jwSlIMW1EtnWQWy7tTOu/HtKqbdqFq0c642L0d59lYnUhE1bmSi15MswOMchs5E68xC8Y5gA/zGTI1aN0GDi+i5VgpEqmlIp39YU4/OL6i79eeeWVmwT/Dz/8MLj/sdvG3nrrzvvkyZOYWX7Wzx//wb+Jf/Bvxt9PHvzPtv/tfx2HfLrr3LnZlR9bElh9U2oueyl7KpeJ6HQc9zVZJoZrWEr9CPRJ7ptaT4e9uDnAbt145RR+Eec6oOyg5dnng4Kygwp0XMRZKntwQZ3V4fhwa4HVNu/I7GUHre2QXvYinWc0IlP8o1XXqa2BpgB8uoI7ySaXsa8lQu36OqUycN1hukJZCdlWUXap7PqxZ1P23mnrBFeqTCUxOzZV+2mfyuSgkzImM3brp0HKjqbLRRF2nXBtQ7++QzvqmKb96TROqQNwOk3LF0/Gq67soraTskPZo+yaOtwKXIURtHAdvG7AwuWK6gCdUCfo5DFRFBq/T6gDlwGpQ52oXDknKScEAnGVTVdLrlo0adTp8+SkGTFIDgy+NW5pERzbW80wo02cFAI4TPxoFJZWURMH/WCJqc9uqcEEG0MpQYU0cTWjuR5fxF8joFpLCzBnDadW4yV5ED8ZPiMmmi6z+IK50SEiJu5wBu2p3ijKjz5Ecd8GpLSi9spscetRJ6QCFniGFgga0/AWKHjcn45Vgk62YpI6SA9h6L5qXdPKtU3qkWN+LAXN4P4YsoopHGdvTxuxO9+S4rBqhbPBZB6/VnILE6IfvXRxH5p+TPDDTv+X+ArR8Hd/93fXBdTDhw+X2urWGmpdXr24viybcrxeX/va167d7Gtf+9rnbsr/6Q//ybf/W38//v43f+933vn7/z2Qrw7e19W9tUxLBIa1z34sV75A4drqsEwPxFwEKx2sTqtQllh0mxVlthkdQguM2FoWChxixqogVE6RScmmmzJV7qrEfL2bQeY1VMxzmdwNQC5j6Xo2Xc7nNyI6Qe7zwWT25kab0AjMcDJvKWGw1VlliTSK+URqYSTxfMQTauKsZIx5DhjukJhjdWYckLDuaBG+Ae8zgNtYhM9oguY2U4B9lV4O85ma2LTCSFZqnT6fN0iPO29OaOMnviycTcRemmwRuOJtJ4lJnWB/GTwQPxTZP34tjw4Oj+fTEGAoc5jNoyfmHkBEbaFny6+Y3z8UdRac2L3dSXFTInIKDEW8QgEfaYG2NL8Vl4jZ1tmwUPSJ1JpevlCGmUydQZCgFjU80eJ6Os6II5fGZHbxoyDcRXGNx2gNztDmgBlHSVbzO4autUjoeM6djFwOTywvEfHtLBPPArW2iS/as/uNiJ1ASusqwehms2B+9DcbCCgucsj7OaTtxehtnVeDMC9vqMYvpXVKcDR9fan/g6hp/qIOfiEQ/2pnnTfeeOPJkyevvvrq51AOf6nr5C5/9Z+NLhP/7u8SmZBaC+hC2IadXcU1RZ/QYt11wJzdlm5QWI3hICYKkLwzSMDiSG7sLuACMjYjNYKCTQGCJGcxlqWR40YwJDNWnRk7TWVOyqWyqkyWRyoKrs5mJDpnlIDAGcSg2IslVFFGK3mikJqD2BpKFXMEWTQnQW7MsVvNlCa08GfJTnItINpNWcc74+5y6nc51US5LZuLKzQWp1tO5ZQ2IHIWqgWm1wJWQqJXYrHKqo5IbQfgqY5MzLahY0JE26uXlXoOIAtriTIV5iKZTdm9RZkuCr4cDx6u0lPFbDPtyaqBqnT7vLnoN7suIcVe1NC/ISmq02LMMaNmR9I2eoVlM247yNGv4yOnT/uzxJ5FPbgQ3xlkjmtxLQdAFHvbHP2ah9YTVEEENVB0/udAA8xZt04EA2eoAiNk53njleHmFKFwiVXmcnwBljg4zwkADBhoDzFgAk+QEanMyK5lBngZw0mkQqbOgUaqkNowVAY2Zk3cAgGWnSmS362dAtrUTJukaptjHH7ApM0ZZtEYIXUeITukK88ZwZQmgieyHtpzzUs07XGbvB0GjYmDxt8oZk35NlpFC8zHS19N/s4zUMxhjLutkf/ienF9Aa5333037Gnf/e53//TR9nzvr9NL/7kWk3Xvr7eq6bjb2MqwVRwLkxO18fGZ9962O6dbqHRtrXOQQolLylzGkrpu2isn0alNm37uaTRmUc0OYwtzyOxte5kTd8s46OoO2eGITkFGJHIlkqOtjoQoGWdniQ03+s5O4sREfPPeEsBuIIqGJQAjKNNinCV31kmY2TpLZJBmxeFEVgFz0yZkf9aTQJDskp24Con5mNJqLVSyACgZ3J7BImxARwLcIi8v9i4GJ3LzRaNnIeIoJ4l5LfSrJGd2YosJWz9IvtEdjLV0dje17dhB1VN1KS5GtYDVWWOS5iAi3oq99HVbUmjd48Uadr/UReZiZtbY/W1yk3Hom0albkB1qS4FPA+vzNzM1fwNAYOneIhKrE4gN6cOmsjJqwHcnkef3/VtzzOwORJZhjrI3SsIoI54LpRpvrERqDpXsB8Aj63ePoTDUnPeBgo5Qauzz4cLAxnxBJmgHZzhBp5cSpPCUYxDIVLjwwDSGgFNNE/dtKPyDG2OD4G5xymWwRJUYtY2ad14MusVQNZuRwMsUund2ygR/RVgOS3kgSWj5cmTJ++9994bb7yxgPheXC82ZQCbO/3v/DO/HSvP7/yN3xxIOthEMkAGpMnTSs2J5ZDVJWbsdp4dVMCjp511T/XkXLdXuhnLptYuWjfG4uRQQc2yz3nHaWCv7EqLjZfNIIeNFIV0EqtsxrWwDiST9ZOxedRi9/aX2+EKIJPsALuSmRFvp5N91+/6bp+TZipCcE+j/fbF+Z3Ln5OOAHrpNqnvyr2f871BhAmSDECtrHs+uapZbd9LARNJz57YnbxmssSexDIPJhN3zGbOPm1ln2USmSCFqFIc7GMxjaozPLyzQEwgVKXKvssnn5IWSLTlisulntTaURGeqE5SRgEhG4kpibOYG2kRLVJqI0+SQqo7A3PDukxSR2FxVmYxsDM7i3N1UlJlB/JIsmdMTASpxtUlca2kmZ3BhSUCk9gtsbETQtaHKMlEKIQideJpSGViFAJgyd2R5wU4Xj5iQhA7CAC0SJmkjOJzOUTk0Qk4pN45CcBmIEDJJplGKYPQgO1YT8exiFz1XclsDAhFe3euwozIaaKUyYyN3RKBfdJ8Zf2FlT3quW4utb+yXk3MuZqYc+jnbWLYmSwJV3cUS0U70wRNIHNmdZks7S3vuLvyInAFTZj1VpM4Ain55Hnv+cryTvIekmE9oO14MBew7EtK+gwGOfgllGjuJJsBEINopBxlUpkxxEQGcRPnZAxWgbELOxMMHD1gmxEvTEjkhazl9a2kBgNxgwKH2kVEWMSwOCkRKFJ/QvUQeJyOinN1Dn5FdQ56lEATFECChInYZ7+2ulgbxGdzHsHZZfpCAm9fCMRf3Ovs7GzZDl9//fXvfve7n5M+90vVq//5/2L6X/2fkQpLyVJaVcrawia1zawFnccljAdzYeCNJdpcHQDprPYFMCim0cWDPbPUr1AyY3Yna7Rxa3Vjgx+GQCwWGWWNf+FGpMQVMFaX4qIQmxuzB10US4FKcxbIIjc6LXmRdBxIeaMkHHIeJYnWMfdVGAJiRJoIpR6THPxT7jDlOmzGy5eG7djd8Z7cj4iOc53Z3Vp/ejoBHTWUrtWW3hq4xqYh4nHE/DFmvXh+QcmZPfpQMR7kTg3AE/gGIhVW5lXXboYn+Np0dONDMmOmVPKU+qu+v+pTydQt+QdGpqxC1clCJ6BlmplhApV1um+syg0ksWrYEfm1WRVvCODWbw/GXozJVAeIl2zug+M2Jr+I0bqo103H1JxE5KBEmsI3RG7ilMjZidUXjdu5ulzBOljmQPKbUd1QzVACJnClSGVr95nb2a+l2VTQCBk9VRdzNqweYptytUzaUY2gXQMmTzGT2xqhrMGNWrIfZt6ZS+uXUwVq0+j5GkSRgMgMhM3DP07qMlneo7vi2pF2jV6JCGXeuKYYCsC1nsVsVBYLJZx43j2pvWBzPxur8WSyBlo7GMrjcFwTG3hL9JxlK6n39dfjgBocL5hPL65brydPnrz11lsffvjh/fv333///V+LptD9899I//Vvm1EST5uCJSvqFt4pHdwYBCJ34Sklk+ycPG2dUxFBGHp8KV2jGXawMRbhKqlR3yVFvAjcYDafhOlZSjER5j3Lmk147mhdl0FZSDoQQzJA4ASb5ulImgNhCJxip3PitQAKIpLe88bTZt9tL/tuSCJMfelOpUuSIRnSQcfDPQtEVGDtSYzImCqzCi3gtyZougGozE5UUm9py7JzV9LZJvTZq430lk9Ld7rr+iJcGGV1zw+R6kQuPRGDrh3xGZKRNs7JiQEHZxcAU/SjARCJW4VVtFB5dhKQkPTg5CQ19SYZaGrr/CZZFGEPtZkOQ77NuVNNjHkCT56q1wqb03PJQWbCbI1FcByjQxGm4gw6yjdieIfDqLSCpvAgw8mF4OaiMWh5mHdpQ9ZxCmx3zLm4FG8pMdY+A4c3ls2bvjrVtsUTkWey3utEMkusPruDF/9Qe/EDtmiAE1VjA/UQW0Kc6JAwcIwtplVqlB8+kNRQGF2bB+IGr3IakXZuCbWHhhUoWITxp/GaXKqLzchluhlqF+h+CXUh9nNbjqztoMkONgi7LkOx7fmyoDovGXyRzjSfAlskbywj+FXaseSe9Vfs4Y7/zr/2S626n+veveknvXndv3//7bfffvXVV5d1+8GDB6+++uo3vvGNt95664VA/GJTXq6/9jd+6+/8/X8tEWVoDx3h7lpBA2TvafKkC7l2Cd8Cghuzg1fI6Glvea/dU91e1e1Yey09SkdKIHhKgFNlniTvRHaio4QpmACQszgbEc9cGCMtXMakldSIR9y5mu4O+9Phis2Mhc26csllAJFzbh5aUxDncnKSN3fGza7bXnb9mBO7399dvXTxc9n9jOLBSWbp79XBCT+Rl0eWpAygTnR6WX7r6VPRenFy5xc4LSTM3rFnuCTXBEtcO/ZOLJmzubLsum7HaSJURiVTBoG5Lai0TKHMZxIRgJwVzknz9gJWPMWJx0Fj6b10aRQULpOUQQC3jrKTJAshtRYuk2gFRsrFtqWeTpMyJ227eZ14HJIkE3HmluLLyVgtG7g6CDKRj2KTAOBkXE3EuZh2BAJX4kIAwG7JI5WOrc2YorBV1iJl4jJw2vvJODnRrk9lpi8TQSurMZO7Y0b6UC1cRsEAUbScWIJbuHTbJpSMWrOY3CqXKZVB8pW9tBtf2l30004lX23uXPXbMUtlLpmdQ2EIT5p3hdPgnmBMmr1ymrS70r7nmlzPdXupm0k7a2UbqwrR2sObnMwcRF41qyZolMtwZ7UQiLud1ROaMqmDJpdZNoqwQjeTYmlv3ZV3O+Qd0obMgXHuCi9ARSYzmmfSj3IC2vkRZJBAC6tw7aR2pEwG0IaqkDGbzyPMSObJTSyxragOpnMKNM0kzBCIZc4pih2XgIlkINZDKq8BmEIvvuFRWOIKZvtwK8AdYLIO2qM6aJh/S7MNhmLlcVSDgorLgFSdn39H5vqrb8rra/IX9qwvp0D85MmTN954IwhKDx8+XG+Hz0JlPQvGdLtD5DAKs1BdnBr3zJu6GupweIfFqXV7wiEbCXXE9Ya4QwCHM9g9uXJLB4UjAtnvTMaukRsKllmybHhiGCV1Mgc3mcmMvLKokrKbFJPJxMAKab5UPzwop2ZNjIdQWQZJTsRs3IYy5uegTR1wTI8cBh0IU+6I2JjHxDHN2arBVoqtHqxV1DFNV3d3JxebfldzzI+QBzEZqwr+tiqclnRSv1mr+1y9sTu7spmJBMUDDvJrMSUgAs+Hmb6aEk2LF43ghBqBgsysHkNLMnOHuR4cx9fuRESnw904Tbnf9V3tmBJYjpJTzUSdzRtecIaQMFSgTOGzRUMWe2NZH+67r2LNW6VzVMLRQe0PwhHbkcR/lE9zOJr4LZEDLtQctsmVl7c9rSY0QT1pBalTMSF0HenWYCAm66huuOQGsEAYvRfUhTTvroe/YAKPnkaX0VNx8eAAatuUI8+XYWEHRgtgpOLhIHZiJ3dh3XCcOldhAXBBmPRIQdG9tKU3snqLNfMSwxtzGVG47j1fodt4FZTQpTIpHCOVTMqLwavlrbaJmCYjsEeopQtM4l41NAdWEQ4tyWeV7hOVMM1RGGH9e962lnvWX4+uO77YGV9ctzVl33nnnXfffRfAt771rYcPH66bsn+qnZcgYtSQMssSNVs+D4OTx/sLgcWdUYRVkkkWnVxSEQlnLZFTLKsUza229LgjljYVIfcquaWwWF3JinzraMtqO8mYD+9wQ9qCE0yPwtwkozsFyDnBnXhaiWAHzdRZot0F2SBNpJPXEUSUNki9y0bTdtd1+9wSc8aUasodJych5qUnS4iCr7PUxUSmMlUiXSAIFJmpvtxzI6rCRcRS59KTqZthFQr6jCeAkU+su1Ml73LSRADsaMuNJ93jRYqZKej69c4kHTiFQBzjR+QGdOHHIc4wJR2j24lY7jkBvZuCGCzOsqycndpk7OsiipaTztEwkRkbczEpJBPJBEnQKJnmsB6KYG6+/XzoREbXI+MxB77N3mGiySU2B3FXSIXoPCoNIFGLvA+zTGzXEdUyIVJi2t6yUj2bOjxaApDclBrs0+GZjBwGhHdJmk1tXbCB5rj2CB6Ku1Qgejjv+q0ISj8u/laHExeynjRRIzXErKiCzZndM+qWqrgZBcEDilkahujBYMXX0+HWXKo4e/Bswl5yeeKFcDYR5+thuL4igjjmZu1BowmRfIE5Xoveec49F33VX205Hf7k3/ulSp5bgcK/rEB8K5fg9ddfDyht5NfdCqh97gLqxfWF25SDSry+1pziZ1fCLY0DDTKjRmmA7CEDUonjdFiK2GaSKhRt3Rs97SzvrRu0a+pw7WnqeExcCQRNBgIXyiPLTnSfyihmHC1aYhfx1ATiZjcqE9eRqZJUu7cbfuP8k+1wztNl9BfhTnUPm0AMznCFVnIFMZddSn0eN5u8Pe1Oprwh9zu7T9PVz7D72K3E+ARJTnW4R1RS91O5O3YMRzfYb5x/euf8Z+SadADwMZ1OnJiRgFbLi8tE2rNmd3ZW9Jcsg/jEquyVzYjIWRjLAG2bwrV5kMZBELUOGHKnbDtLoBAWyGqmKclIdZI6ctobOyZjByWDCLlRKVwHSpOdjuV0HLbTsBmvnDjXNoiTRsOeSpKaEOqwsEsyycpGKRkAL1KHVAoDkMoiTmxSLRUDwytp5bjnnIwPYHcyZSuslUthG2l7VX/jancyXBnxxfbOJ9gWMAAWr+EgJlcjbjNbqJVowN2rKgCDWwABAABJREFUaVvKU9vsIWC40hGbIeKCEhGgStMosvPfPL946eqsG55K2bl03bS/059MqZ9yd95vlFmFJ2HtuBDSpMIOdWYngwlbzYP2V1yZ7KpuhrqpmheLGBoHsm2Jhkri1RM51LJrhgqUwAxjNZk0D9TtuF5xTq4E1CYQt0HheDhV02h5Z92Vd1eUTlAVmCB7JHUGeebaQ/YUo9NLWLOvG9LUgGgGAokmrpGFm2AFHDmHTFaTaXYpBERe/DK1HVEBbTvsSLdUJhIjynOw5KEtHYzJefuPZvBieVofCpbe7DIIZKAKKsvkEBHDM2lP6qDcTuJL+TzP2TsAqFMBM1I5zBF8/o6cq/qvg81Y3V/YpL58AvGjR49iHurtt9++edb57DL1WoTO58jEM6JU2NipwJ3NBMxLwyXSzQzcCgZHE/6ozjqXHzuPCCwey65mN3EwcWlx225xrI1PYktRPZx2DWSe3diNQGQOXbZxYiVTqZaqCwg621PMVozaQxor+SG4ZTHoGGZI0OHYTMtsZvgs1iO9tDrHM1IPEmDFejRFHXi66Lk/HU/3msME3VpE/hmncUI+mccabj+7LNIxwciV3dwJrqyTmy5hNKtydcYvuMMRwxaKwzCjMinzmDfk+xhK8Tk7zmfHybUSggAxTWVPbsa877ohCxJYnBl+YIOIucTohCwiR8NzMCu3fBVaISRu/KIZX7isvI2iFN3O6BYyjGHLM3NblbcKIqCVT3p2SXOz7HhUsHxwELeRqLZXkcPJnCfPZtyRElvcjQjhCQexA3WWsLdtokSFnAB12lNyYIRMSNXF2szK+vPiQi7kDBNSB7lR8RQlJUAMZabMVdgYvkXdQFviMcXHhB2oczBrZEawsa9Gg4VaLI85R1OgOk+eBs9XrltUId+gRvgAEzaoOeAbOH5DtPkAeOvugmQV5H6I12gvszlXS0HV8AbeoMN7lZfG1Je4dHny5Em4WsKmdPM2S1TO2tP04vpivpqvvfbahx9++ODBg4cPH958NZ8VA/s8ygKxszhm+wQFyc7bbPk8yX8I55ipcc0yW4WLZKcEwCkpMy8hM7MfH0QRqO0GAxXhqy5Hi6YvJGbJqrFwzNnf4nhdXZLBeZl9aTs/C1iaFzgkW06QvnmNOcMNKqvlIn5FLMHJU2KdiAFOoASaQAmSPfWeNzVvh5zDBWxGU5IpdxvOcu1OEoGTs1TpSsoxXBTzPYiwM1odeYM1TFSZx9SVtEmphxWygpn694xXi5C23t+11A/dRhODr0uKxqLSpzrM3yLE6SCOs1DqPW2QNuDsJGB2IyIGszPIGFEawMgN0nneunTOmQCk3sHOcq0wOG4eNGcos0NWqeZOaLgnLp4mT8W5Eic38wWYCzdxsZt64Vy6xCFPcazerpf5ACy4U0R1K7i2hOMD3U/m3Sf0y+KSnacWFNPOj3NBuDiIabSkYHMIcQUDFNpqJBzYbKznVQlHQIILagVLC4yCGwIiUYjDtJVIc1Am6BjAed0cdJBwGb64jYSMGlKSqjOIYOi5Dl4SWQdV8OipPTpI8CgUYi6rT7ev5N1VxFP8iXNYvKmbvW4O2eUQvZth+gjF1dowyymnmcWFw2/FNnM7f9lV8U+zOd/7H/+ny9+f/t//xueKv8+j//7KV4jCZ2dneEaC2QuB+Mu4Kf9purYLb9bmwUMC9pC958FTMTnEqMyfMnMulgqn6r6zbmfdTvtRu7H2WjaYMg8pDywFIGgSJ0iBjKI7GfepjhIlrTMgUHE3YnYHzKgWxkinu7KdyqaMd67O+suf8niOSHPlBBLXCV5BDEohELsriJGuWHpKvcgm562mDTnSeIbdx/MAEOCKarBPMtH91A8pn282DLy02909/4lc/QywXseXHUb4mO8MLL2BxFic2VMyKabZwWAF7VIdRItUZVMKUZgDRLk4SNhFOCrp0MED/pg7Kdx7lsVGQlV4Ep5omkQG/6fOL+D+qd25QvYeZmZGOnE32P3d/qX9VT9dpbKT8QIE0ZYN8PLV7v7lsMu5ZDYmZdLknCgrJVOuDKAWnkapE8Oh4iTOzFJckhG7Va6VATCbJIuZq9hZ4wWqRWjCyb789vnZ6dUnUq5Aksrg9Bsf82klIXPTlhJ/mMFxSPG7V+NvXZx1057sfsW9KpTUks3sXEI1KhBVYkKt5Hu6d3H58tOf5f0nNJ1j2lPKedql6bRLG0v9ZnOncq6ShpyfWl+Z6yQhdBC7mKfkU82l5ivqmbCvfak9VGa8Ex3srcEchiuIyOAUcAmqAiVPBhM3U/LR8qB5z11PyvA28GoxK9zmTlXSqHmXuivrdpQHKgxUNMjV0tNkMqI5EIiOcNg9VY55pghjZRU2Id1wyaQCXMCFlEmd4566EEwcAmFNVA1UXZZxdZqd1qmV8C1E98hgiPWBxBi+8p05wcI6Vlxa4Gyo6k7qgfASBYMg8A7aUzVwcosp4YE85hAYpuDGawUXFwD1l0FMfAEr5uA4PXnyJErdr3/962+++eY15sHjx4/feeedqJdff/31a62+FwLxc10fffTRW2+9df/+/Q8++OBWxSH64Y8fP378+PFacfje974XX3rud5kfHfjJmFvQutMh33FGsgSTdEb8WQuOOySPrZw3c9HimuCCloPpASAmco/y0omNWWPkDx6JK6RIqms+rRlF2hspuYmaFJfGi7Vma56Ni61TGbV1Zd6ntJqi9FkCXnHcHdcUsCnxZZfFbEhJYyo2EIepd5Ibcq5DJyq7JJebaWA9tYVB3J5j/wzNQNN29nDdCCo9eHgCbm+iNddCFmR+ItdrdR2xY84vZXj4hUCE2VStRNqGOmjtYKEFz3/bnRULVLMZyyTiKSp0I7GV14ZmWDBh7YILi5dyHMEOvJEDuPbIvRNjHR00DFSYCbYLHZ/JE5s7Vfhh6vaXWUTjMYeGmxo7xGdnUQs46LjGSxgO4krUUe5QmT2RMdBzSTPv2MDaNGJfOp8IHiLIHFEPTybV2I8E0aagZ9KealApDGxOxUWdYwdNaIiJNaixhw6QMGtH6Fzsvn5dffdgVYXaq01tcQMXk4FSsm4v5QQliMwpcgI9peinXjM8zU9U7JRHKvyizS9cyYO1iWbjk11XOxgQfJZS8wW+Hj169NZbb0XBGdeDBw/ef//99Z53LWb91Vdf/e53v/usVf3F9Rd7xdnlW9/61ne/+91nbbvvvPPO9773vbWQ8fjx4+fZdoO5xKstd7XnkEUG+TyXQ4vUJxY0iCpcU7aUMbFxV4UozMUx607E7O5RnsFAnNyVKssMq/Vs2ulkJGzuFOTfgNde9xBQ6iA9YrInIgXWVNzAxXnAJXrPW08n4UomV3BaZXIE6oecyCWBk5FIvXIiYgJncEY+8bS1tB36kzELZhmtJBlTdunWvzrUXufkLE5Qljg/GM97XATgHK9axlSFpyQ19Zq2qY7tTuLZ6rD06F/S/v7Y3316cqK5ab/rLddIApqMyO0lAUmTV4khXZPOORln4xTBRk7JOYTFBO9gFebEFZxabgNn5dRGtSjjM8sGOuB9fF3IRFBE8ZRMJ06Tpx4abtZFSHbQM/bIdkxiNj7WTBcAigMRbUoeOE0kNwNN1Bj6I6TZqSjqqJaWak7VU3GJjDgDX3PoUNtPebBMsOSqTkZE8B5KSEI+ORtICAnOswVmRvvD4QmW5tmaCiqQMpN7GUiBgXL40bO2PpgcbaKBmGDyDVVq2Q1k4Bp7NGNAGpB6aHIvM1+iQEZL1bl4qsZmh4MW2D2m6iod9kn2wCzGaYLImJTZYlFwJ+UENpBcP80EAm72OrTMvDAlUxO1D/6svwJx6QEiuMmoDTZxbL5f//rXnzx58r3vfW+dYBYF1Ne//vUXW+GXaFN+8ODB/fv3Q5hYjl7RuY+2/Wf//BHCMwsuzrt7pCukwXPxbIeBvdXKHw5ix167K93stS+arfQ0ZR5THigNRIUBUHICvJKOMu4TruhkX2IGbkwypaSZijOxu5MraMT9q/1vnH/alb3UQfaf0O5j6BQn5wPF0Rcm6gKjV0zVsQMnSCd5y6mDE03nvrQwl+XdKvafbqT/belPpnsMu3P1C7n4CYYzgKiW3v0rRMrpF7wdDMxC7MLGCanUlA0MKE27NI1JyxyK7ojZDbijGVcARk3ODJALAwCrZaBL7pQ0M829MaosI2Nim+jO1Xjv4mM2FVellwewZYEhDf6bFxcv7c+74ULKFZUdhvOoweOx3bn69Lee/mLstlPuCrMy77o89jIZubfzUi1ie+oHZfeSxISVoALKRgyr5DUObEzZOV6aeI6NvFAa7d5uuL87P734mQyfoO4B6etwn7lI+pS3liLWvL1KzbPjfjJNv3lxdnL5Mdere1ACF8lZazIluBEby6e6uUJWFSKg0r2r4SsXv+gu/wTDGeoANyihDFQuU9p62kgZLHUm3UnuyV/6hLe1Y+bIbnBxS8lLkdp1IxsIU92gZlSZ51R4lcxKYLS8WyIYoyYqTJXJyAmWGM6mqVA3cN1b3lBNpDXMTM5QalO17GYzrdhzBRfwHhjBe+TF3rWMrc8Zun6tdm+ICTYAwrXjsuHSUxU44BsuiYzbwJLHPufkHuYLCmNvBAYQllg58gztSEMm5mXODERAWaZv5nkpHPJyPZOFmEvwjiogy0CVtlgFiRheDiIWVOGzVbmlDxFsgtCMrDGnAgmP15d3lX78+PE3vvENzMGhH374YRRKP/jBD67VwrEmn52dPXr06PHjxz/60Y++yBpx+mLuiGdnZ5+hDsch5vHjx++9995Sl4aR7dVXX/189eEWJESM+cUZPrASZDEMvhxbwxYbo4JhLjGKkbh10nI4imOyY76hc4xRGIX+ezpNbA0UayTK4tSSUt1Y1FNQmtCyTs3JjViZq0HbuZwAsxZ9thKTYyY/0OU0p5fOaQB8XA7cpofOY++0z1mX0pSWsp1ZOq/TEUdOJ0wgzt24y+V+9ZVVY73iHQMfKW08bUGyigDyW16nFpri3FzVTm7QEtTn63I/tUWW3TelApjC2zXLuEYwYiebcl9F5szBlXB3y51x8caHVpIxCYSIXLg1hJvN1NiNzdmciMAzPBnGzVOkFMxDm+3BQXei1SAn0+IgPqjmdnSrVqM6eQJFJtrN4va2vx+pwzyv2gkmWMY53ZmcndmWMspciie4D2QbKp1XgWfSDUpMoEwQ9TITI7BFDQZxhNQNngwIS1GZHcS00uKpuZNa5nt8mOIdbk4xnCusHZWOakeVVmaroFIwvILb/uRifm1SBxE9FxjtymbGwSAuLmxZ4APnwVNHtYMnOMM3VPMq/H39fgy/MEV8csvPcVsUJF9Cog6vwNyPoYN4zjMm+pq08eW5Ijv0/v37UYienZ1F+/SNN954//331/3SV1999e23344a5p133nnjjTfWu+aL64vzgr777rsPHjx4ViEa4sIrr7zy4YcfrrPR33vvPQDf/OY3P/vnOzmJYXEkrT8mrZPoLTrLqOVyxmdFTIRVqDAbJ82nJsmYpCFiHUTL5BpzW7gi2ivO4GNiuJeU9jjJdQwzD5jBGVZXAnE4lgWUQOzSgTO0kDskEsfzjFOIvSl56l02xALAOcMKsWBJn4wJoXzSttXIaiOidAJTmJN0YHHpNG2G3JfEweB1gwlNKRkLrk3ehROb2EGFZZBAUvhqPTlwcGLtieHBIaWrru+nXqSjOtwiEEfzLOLjujvav1T6u1eb031OzkhiIKw7ZsrsxLU7gVseL9s3po2XAZTAGdJBsscdZia3BiN2gMTZySvXPdIGHEhodhKTBFeWPjr2N7FT7qvMJGrfdBD+lJEsciTcqYCLcWFRJyZEjpzPDN5bm9e02pJvPTwuhgIFObHC2b20twgCQzy7hGIypr0aIUmrc3Upcxzrtd057lUgLOCibSymDRj1qAOkhzuhxgjTwf7kSwbd8seByH2tkCMyMvwZx4Prj7sBmsg2aHVpi0ZwCp3IjDJ0RJq4EkGdolyMux37+Fw/83o4YJnxxcKN4nlQr7ke5oMnItNVG+1tdbRxYBkVOtiHlxE5ssSVyc2fG/P/l+J68uTJo0eP1m28d9999+zsLMTE6Oe99dZbjx49iq05JMVHjx69SLH70m3K8Wo+evTo3XffXV7xhUfxOZvyvI4FpbTACNgj7TwPlqo3APr6O+KzP3lSp711g/ZT7V0zpsyj5IHSwBhECwPEyRzQwtOY7Ipefnr1lctzNjXiqTvZdf1F3w+WVIgM3WT3d7uXL36xvfwZlT3qgOkcS4rp0Xl6lq38Ru1jBV697kEJBD/69tWlE139fCubPA0ES7uPaTxvJ4FyRTvriV6WpPxb57WL/msVIfHUUcrGBFUad4n3flJ0U0pXlYAhpSElcc+qymxEk3DppIqDuTII4MpwdIKeas2EBp0DKdJAWgQDvnL5tLv6GVm9C6ucPqa7o4mo3dsPL19+koczHs9RdqgDdIRj6dym4ZOTy5/2eWvSGbEzD93pp6d3rzRPlkgcDoy4ezne3+9Edeh6I3aiMaVdn1R4U3QzFhDGlMZelCXIPU7E6qfDeG+/u7M76/af8u5jjE8DAM1atpzu527Ied8lMd8UZbdca6+aVAneT/uTq49l93NMu42qOKlk0UpWA2LpnFnvAS/tu+SE7VhevjjbXvwUu58fAnXdoSNswnRF0osOIr1Ln/LG3aeULje5MJg8HNycjIvUmgp3DkLpaMpkZMxICnArf40I1CD4FD1WpipURCrBSYmgBBIwqeZJ8mDdQCUzlchydCbjAEpZdYhUy4N1QZkYaBKUCrF2NnCCd1ylzWk7rTeodlQITcCUjOCJa8e1JxXyBDMwA4lUWMFmyas6M1kCJMCjMKe6sBGBICh2pINTcCqY2p65MIj9Wu+VDu1nrIhQPWl41LZUw/cUAOLqYdICwzpoR6qwRG0YKJFGUb/oxQC0xctTfW7ExBezKQvgBz/4QciPZ2dnb7zxxuPHj999990333xzkYxfeeWVH/zgB7Hhvvvuu2+99da6Xn4hED/v4SZk4luBXB988EHsfH/wB3/w5MmT11577Wtf+9rTp08fPXoE4LP30WeZRUBIMGYo69RoafMIGxtYiRUL7jdcksaijd5EqwNr2JqEncQtuSV3dkseQdNmlNQ6VXJtHFmW2iRQMocZumpZK7nBW1a1G0yJlbgSlM1k8kQtcLPZ/NeIiSp57PpD9R29sRUFaZWCBrcl4WQl5BLVkK0JkbjetOa0gfSgy+sYYlcM6MaL7VQutG/43ZkG29q+JPAVm0ISODvoM07uK8eJkbeQOnIlKyChY3k0RHCaCQnJLKT+9qUGe6DKhBZuzUtVdXAQLz+KDrKzaOW6B0iFS2ZOlrKLGEfwaA1gAztYIQYBlQYiciZlriyFwtcSea2Le/toSSbwrBHjQDyktc0nNoxMFUBFPIRrFV57znxRKIlu2GCRYB0sUneEnCneroA62GjueDSEvCV1YviWx+Tas264zrFybqBKsrAUQ+1VEMWXwNVpjzRE5EUMtSixhlDuMfPSU91QNacKuJOCq4tBEqqwtR87p/MthXS4rdsvaiGqK0ihLyYxT6SZq7ZooBThOaNnN3LgxKaXSJSYgA6WYJVqR1UWB/EKz90q9aXIZY9kApp7qWGxmivXeA8u8QWKmWxO7DP9+ZcYmPni+IxDFnz48OFShLz++uu/+7u/GzSJ2ALfeOMNAO+//35YmR48ePDjH/84KpnYNV9cX7Rt96OPPnrttddufvWb3/xmvNDf/e53X3vttW984xvf+ta37t279/3vf//Jkyevv/7658sKDIiTrYIzr4dGNSsHramhNE/HMVUR5QRAOYGI19wXQhhnZwcxSN2Y9rnZIKpwUemgRmJUZ41Ywmk8r7+ZJAGE1COfgjsAkO5wf2UDFnIHCchIskvvaRMSMCyMogmN9B9Qp1CTyTlp6lIdTE7ELkFMKYOzpxOTfkqbXdeReLs5wwWTSJV0g4NBICmpH7s++o8WKzwH7tA1NHL3JRAsfC3mVCWV1CXJxEJ0wxrGOZ4QpM7zS9rfvdrcudhsVWbRe35627a/yPONHRy3E+QNiCh1Jr3L1qRzTi2xFzTP6ya4ibElYndYceksnxj3ysmpIxC5zU8H/PjgspYvY3rXpMFxV3gfqZaYtJJEdgqRHUykLu4Aq99mpWbWa79rqWeahkukoBES72uG965B/YsGhwMd2QlPl9atmL9UTIituNSGmIAfi7MxdDlYGi0JTF3mWJvWOd5CJ2IFJYq51uvybnRbZc4+qpDqUknM2QnLz+HbAFWrk6QvQi6RC1qNR9TOVGH5icHSkdLoUsAJVkH7CFL2aMTy1OpnwQ0AcRt8o5ixsQZFY23s4JCnyYXMHUxJWyiIhzlDl8SGwytn88CfR7wBkRMZx0nrr4ZG/O1vf/vRo0fvvPPOj3/846997WsAvv/974f4+/Dhw7jNK6+88vbbb7/zzju///u/H729P/iDPzg7O3v48OELxMSXblN++PBhNON//OMff/WrX41TVrzEn3eeJIspb7A5CXEHM/DgefAckSFH24TDnSZPybS4DNZNtffSt4GXWR2eEbeUxAEvhXXPLz/d/danP+l3n5C7S+rz6TafbrZ3P7XTKaW+1pf2u7tXv+gvfkK7j1FHwOC/0oE3uIFePufIrCPvftrVPWAYnsKW6HVD2fPVz044/bbjZHxJmSvzlNKYpXRSOwnE1Ml5/Y2L8+20lzqxVyeuqS+pF61JS0w/Td3m6eZ0zGkSjmVIE42WmNHBc7ZWESSHEY1sI6ehnlx9Qlc/h9UMvycbY3lq267Wr1yed7uPaTjDeAGdbnl0wzlf/ZTyFpyjmO+6O7mOZ/X+mW2rsJi9tB+/cvHpdv+UrZ7IBgRyV877zWlN3Wba9ePOgZo3l9u7JSVRY7iypFrvDBfd8FSGT2k4x3TRJHVX1CvefbztTu53J2xbcZxOk1jdTPtuGlgnglMdZf8x9p9CC8EzIXNHrq1JTwzOL2kF6KrfOnB32N29/Dk3QsiNl9gLvGJXSDpKPdXtidPLqdttXy7MoQa4o0vOk1HJJg5nTElGIQOyGwBx6MzTBJl7i7xzQJmKpEJSqUW1GkfwqwNV8yR55OxG4XyKPjwrgUDKUKkalIl85d3eRchGbyQsAjKpOXP73cSMOeOqOfRbd3aepElcM1Uh26B0pAk+kSSyREatynQHNDmxJbZEZqA49sS5JbDCAtvOLON1nrsTFaJ1GF3s2Xq8Y/cH6BaWiV6b297VxYwBEvKOrIdWcDqmeMw+qbDnkTkXCNx/KQfxF2rg9sMPP/zoo4/WiMX79+9/+9vffvz48fe///0odaNeXtqxAN5888333nvv8ePH10BPLwTiz++aLlvjZ1zvv/9+kPvjlq+88sr777//PMPLtCh/M3GbWqXRSqzlDBoDEsGBABbhbOaG2pweAqzSrRuHaBaIzSNVBDCDKW2rbocrmDpzFEsqjcPrBjdk1aQagMZWMziZk2lQxNlNzITJZgbd/FlbRFViB00i+647qqMWyttBFY20FqeVgwqMKXNJLXEskBRz2c6Q7paReHfUvUxXfZnOvW8OYqMIBZufdDoSKfOp5ZPanabp8vZXaSYgN06dGbk5mKzClLghJv4ff+tf+ZPf+J0/+so//Udf+Z2GX6Y21SJmEhsPIQaQlVlD1p1DBFaPbTa33PAsBV/K4coCgaRgM8XTjOYU1pWDeB72DNivVJI6q88rxEQUnVHdL4yHdQTLEgG3OIjDmxy0hARXYgqlefVTmc2MQO2Br7yss9ICDw5RgmUcGMQgdwZ4bcEldVKTamkimzxtUYSmDvWEap5915HbvpihBBFBEVkWWZ1GlwKpLt522jXryGYHsYUR0EGTJbWAc0HIElvPdUu1I900G5IvD2RGTIR9mP0AWD6ICELWkSp8pBRDALGfOeBGg+e957s+MiHBemiBZjQqxe3+saBLto/GQT9wP4hcreq1g2aB6DvN0nGMqh9znz7nErOs+mtZZsn9T7kp4gbhbonBefDgQSjFkY1zrXb9gz/4gxcC8Rdz2w0w5c2vhtAQKv8HH3zwxhtvhEcpDjqfW4g2GUiMjJYTJt1y0AsZCgBYZ26aeJyASwimoCrJ2Y/x/84ziZgAcbi4Kc0sCBThwgIiZZFAHBDHOCqRAO5uDbzACSxHWhJ3ngB3cBCQhaT3sBin3tOmdHdA4DpxdeI0J5/xgbBPZCxOXNNJ8isnRj4hqy7ZWSz1Y7fZZwmRV8TNSIWKiEp2XoGE2iiQOPPEaZcz0NyXNK8n69bmnBALEEqiXU4nqes5yyr5bfnJFA9HOk8b7V4a+rsXm5Ndnz1BkoWDWJX+d//it7969k/+uP+dRW9zYs1brjsnISIKUoR0SJ1Lchbj5Cxo8QtsklUyiFAnLg7ZsBVwOIhZJQGkqQ+QY/yOMW/0ENXQrGPcfNO3YxJCIVeX6qm6KFjcFRQVWusI34YboBW8/kb7Yi5v3GNIq4IYYOJCTPCJpM5J5Uf9xIU+RDDn6ly83dJoVaMtHMRInfAY22wZ4luoAQMkwwwsQDR3r0Wv0TwYxOHhBRXn4qxOIMqwI1r+tUC6a2p4RDXDhXyLekKlzi+JgQPxzGRTEDNcNlANS4VzdR49VWefHcRRC18nHJPTcgZiJdZQ5xkuXBPr3NlnJlWyQ7vcb2zK7OADYmI+psfvdmrjZf7LIibI/de15/75XK+88soHH3wQBuHwzcS6fQ068Z3vfOf+/fuLESfk4xf78pdxU75///4PfvCDN95449rL/bnDyzGhqODiUsA91MBXnneeRkvVk92YUYwap7pMliftvHaYMhdO46wOj2kckk4EoAYraMJLF8Nvnv20f/pHFBgHyam7w90dtklMS+o207DZn6Xdz+nqZ7gOhfjVrs8737phvEAZZ0SDH32p7OXypyfwbrqEU2xbJfWX29On221JcjKVv/bJT7e7X3DdQwvcwCmnzSb1pIXqGLMtm7ztx5embjulvooEufHT083AAjhXg4PFJZk5dEo28cu7q7T/BHUPd9p/0qXtPUlZNel0svuE9p9gvIAdaab/n3v/lZ/ml/8kv/wTuePjOaYrzNuldKcnOrGVTl8ukrpaT/bnm93HMj4lLSx9MDcyS7c/dem47KjuAOrSth/uOScyA9w4kWsan9J4gfEprBzJ96aYLvPu07vdnWAvJ7eT4aIbznm6JB0AoE4YzxsNo+zoykg6N4UpYACTpGz6EtN2OgW8Gy/k8mcou8/qBOjkNqHuqA4CPk3dyf70nDYWBZolSS5TrUVcMpykSBqbW6uC3T1qV67hnmPXwGODKkshKSS1zQG18yQJANU8Wh49AZgBxK25GduqJjZNk+XB8pXnwfOWtIAHJEUbJIuAc6KWlUvwnsrqqDfD+dmEtOe64dJTYYoSmyMILpFSS4FlI4cY8ewgBgXYl+FpqVOpEQ/T3LOdERPw4yM5HwdG0424owMEdY6lnWd8KMxn4UJb0uzn+Pg4CmBRD6ISf36BmNw7Vddfg0pMvz6lec1aXP5zWYFvBfG9/vrr77777uPHj7+w2+4XUSD251Mu4kDz9ttvB/L5l+FarkYIbVVSgBhGrOEKnCfgHPF5m92LzZOqJMHZOa52W2qKOItVgSdb5mDciJQ2pYYf1sFOZCzaDEdwJyhlrWzVYmrWHQ4z0spJmJS4kpmYM5G7MRvBFjZTI+G3O3E9hPsGcc7bwCbRAcxGc56bzwjmVg8wjd2mdqcyPr09/N1dyq4rA/Ruy5P2FbChTcAeSm40/+2SQe43ChVa6l1yo4bUc7hCR1glNxD+rb/93//4t/7aP/xn/wVKhtqqOzLvp0HcxbpZ/Y8ZZCzZ5Nae4LZqBUTkFuYGIK7kboAyE0OSixhF2hkaZcIdiPGKprHPmEMjrohJD8zGrmgaW4ixq+V3ttn4GmxrUdMewEAxhg0mrweL62I1bo5pv+GXWUMqBJZhCZqgC593tlsHk2pZ+tlMTFPhPFk2GQS2oXpCgZiI5kibCEeLyrFEB2PvgDS6TJaKiy5JNSu9W2Ad1Z50co4Y2xJcC3hGTWSZ6oan3AxDvkqTbzucO83jLevhlcM+l0g7qgpOpDT3LatBiY14sKyzWzjBeliBdi1uYDXLOoMrG0g1cg3j2RRfQOS+COy+UNKACBdkzKEgcF70LH/+6ddO9c40/VqW2Qtb+/l/6evVV1998uTJGjVwdnYWqvGCYQLwe7/3e9e+a/nSi+sLdT1/RNKDBw9+9KMfffjhh5HG8JwIrTARkvqaen/oyfkcGGsrRjkBYqgs7DUwxCxOpCKYu7DQWewNvgTDfVbUGJ5A2qA8EVYFCj4Dg9gltShVgBBIhOSLaXn9seSumWU9ouqYIC6dS1dTb8wATLpsFTS7bQkejOO23YiDEQzXtKWiLh24s3RSpd933ZhFkol4NJiNYUJFkuPYJEriJEYcR+xoEBMv2/48JAQnG2Nioa2Y7lVkzJ1JBqXrbF9ipM7zNoDI0+ali+2dImICSm38KDIG/w//jW//y//ZP/r37/1Xv3J1taoVZsG9O4WpEyCdcadpa5IdMBKm6kTGXCWX3MUJg5nTaGy9Se+cjVklVclWJzEFwGZYL5HHGxsdEslavOrSi3B3d1WTylJcqrODzMWezfSZSyB3EJMlqokVaxaCh/zqCV5ABpoaHYMrIs6nzWv7quPByxkHBPeg91ZwaYl512VZAzUHMak6WdtvnOAJ2EJHMMEr+BCHu4I/LH3T2OnmuRm2G5p18C6KS0e6oAav1YFEYDKZnQjS3jcUgz6RSzPCCkuB7JHMaZhD6oI1AWCxMpDdQABTa5eCW6N+HoujGYdlHSkxKqfK5nQdLNZyZ9Ek5iC+ERvImCyzElyd6dbj3fM0Zd1+LXvux3+Oi/arr776wQcfLDvys1bpN99888033wyHzefCal9cX+RNOboCS/Dgc1rSHDRC3HkCj54qhICd5713k2eNuYwbn1gHFZdiSWtGSTKJhDo8io5pGgJxa2I+Zgbo3m7/m09/dnL2R7T/pLlBdUCduA5Zy6mpSydlJ/tPsPv416QOP6cSYNBn/DpXlEu6tJxP4O4gYuml2+7uvLR5SaXvym5z/kfYn0HHVg5zotQ3BqOOICYSyZtt3fX5jqbeSNhVpev0/s/ozuBZssEhyVIyMOokPthLl2c0nDUftE68+8VGejZlnWT/Ccbzg9l5EYjv/ws/717+D0/+C+1BucFqW851Yq1bq7kW48R1TOM57X+B6dJdQYL5CMTcgRNsghWAiFMaz8EJboCDM9wxXTQW8M3LCg+f9vu77GzM7JaHc9l/guGsPcnusLqW4L3s5wLWAfIKAjJRynvAaTqn8fzwLc96Czvg6mUHlpz6+1f3FOJMyjT2UjP3E8skziBHHjgPLf3dGeYUOCTRVt25sJNBiSqniWQiMoDB4pSJlGOHNklV0ySJ2GtjkjIrcQU7zMgSu6ZieQjEBNIeMiIFojcedM+a2CSmxUFE16eZYjcU1MSauW64nHDZoiRYhRN5IhUyYkNSC9woO89SlTlVYrgnameYTLZFHSFCwV08wKbiXDSRLKcXnudzjlMq123Zw/cqSJ3VWrteyDNpB+VwEM9nLoEm8piAnxUGmhET/Pw78mmZcvk1iLuXbuVP/UMW8t6jR49ipOPs7CzargH0Pzs7i7Haa7twhH7/+Mc//sJuQOnLvoM+D4b/M5VixoEW55mVSJdUMG/qsApXXvXLPKh3FWQEcloNClK0hpqFNfwZ5mKAuBPMt7Xk6QquQHZiJbEFsuCAeaeVrToLYYHDwx0WknRlNQ5/5RxSRzOyP0GWHOhVfigO2XUU7hkCjH1uGx1Ze2+bd6eVWO7SEyeY3nLaLnspI8zd109Iq2sbsjfuTuo9naDdVcYziHirBo/BQ7BjcpszMK3dMXKI+xK21sCwLqZHmWUU4YK0TlZtEvkc9Hdb6JuTGuoOaaNMEGdxThbGpSVLiZRgFCHpcGcyYQVAkeCm1H66rZ5lOooPpHnwM7knmBG3Vb6t3a14ax05cnMIJHgZcG6PAQe476oR4jcEU09kGZaXJNNg2xOBjvy35mQmsKSqk4k5J7KeqjQVuPUA7agkNgcHAmlAqs4T0uTS+BJHIP7mKJ4zVZu12+ccIQKYTMgizpXneDoHemgBD4EFd4ohF2u9nRVEBQ7yRNaRGiyHQBwkykjmZRo97T1VcBT/HXQDztClsD80OuIzKXDMAGLMjqz5vbf224fi7j4/8OXVXkbC6ZBo+1wNzy/MwrvMsUZtGTvi2dnZYib94Q9/uCjC13bTDz/8MHjxLyrAL+/1y758zm7izD6Pj690YROIHoA/dh39HSA1E6qSandSJEEITQylhiFmjxw8GBETmTO7EkUuqLMXoYu+P5mmsNo6MZF4YkKGGxweAKUwuuatcXdYM62QjiY9mZLVxX3s0tfU7zan5Mh1FCsIzEJIrvEH5CCTNHbbvgyaTsh3yKesJRzEU+73OUMg4jkZALOWrlVY6CiVKxzEaUx5yKmVNMF4IDAbU9Akl/Xf2joaQX+ZxpSq5I74elOK2Llz2Wo+rd3p5fbO+XYz5GQCZhcxFguNmMPvQtdlVicBJ3h1FpA4d5Y6lewkEWCg6FyyAzXlMXVOPLnnOp1odZ3QWABcRJTZc8+mSSu5T7k/2IfXXeSZQYwQhFcoh0aZMHFGNVaXAPQtB7sVMYKWWarE6oAZAS6k11bmMMUsKakKGsGFBIC4F2KBTeBKvCITgcl4JU2qJ4euRduFNrimG8e5SB3aROTW7+hg4SCOU5PMw5vrkxs3xEQAykKwbpg/LEaeWQ72z9lV2oRM/KLYcxuDGGTOkyUDMdXJpTj3RBF1ZWj0UnOulmwJS/eQdA1i889eNGIDKZNKjBjM90zIMldyH0lp7pXTShxY+ZGPHd9Na17cy/7F2kG/MMXRC2n4L831/NIwVgKNIc7AORaTnee958lS83Ncu71TtQRC0eSaqEgeWEbQyDbKNIrt+e7l9JXLi2xl120Bunv1yeb8j2n4xZKlBgd0wDCxlezq0lO5xP7TP1d1+POfGsV0ielqVcZyytvU33XpqOyw/+SoENYCK9EFPOxQdU86Sb7itAUxeXXOv6EjOX6KOyUL3Evi3Bmzl4m7ofT7M5SrGamsVK54/0nvBptoOHN7Tl/H3Dh0x3hOrlknJyEdMF6i7mc6xOqn6QBb7rxDJwyfrmjxi5L7DGHOHXWQ4YxInBO58XhOw6c+XR3fpeN76Mf/OV4y3Oue3H08R93/Elr/eMHSn+7ux/6gnD7Rk7FnTJwmc2Y2pIFoYncScksNsNKCUZ2MYUogJiWpxBNx0CIlUPpEBDI4i6uopckSwxtXwYgVEjNBDK7kKqpptLS3PHBS5+I8etI5WAmxsQYj4hBtfHTkiKSNjmtPZUNlS4XhHZmgFHAmy6RMpuxI6sYQIw4vRHNoEUV7FssoawftUaXV/q1INlAB6ZxT18MSnOCjC9ONsdzjlnaQrBQxQs1wMCzDelg4xlYzSVEYt8jahpiYWVVf3oX3/fffD6Dwe++9d//+/XDPvP3222EZXsfD3qyhvsh+qfRiT423vZAJeW2VpTvDPFIvjFkTK8OW9sghad1wk6xNoXmymzhEFwexOVi9LyOZwRSmDtY5KtsdZiBFVytZ+FE8m2+KDolVWcU5wlKNLFhwoQ7PhICW/kXXh29xMBYFQwDQVjPOD+e4AhUgNTPMWpdyQFNv0gsn0HiL2VaL1AkNj9GU9HDueuoOBw3JSD2YS3dytTm5+4wRkiP2rjvcyC1ID7AJzlHV/xsf/L3/5h//w/N/cPc7/53/xT/+7X9uqZHIlU3Zm2FTxH324VzlTItN3W+o09cEOwdDY6NVJhIwhxtshfptZRf7jJhorOpWGROUiCLW7Gg/9OO9l2d8u8CzW4N7gKLr2E4oNEfQkAutf4BhHo+l9uI6xOByrekX9V5qJuJmDmrvDQoL3+E7LOC5Kk5JXQxIsA10cRCPJOK2LnQDNR2IiYrwE6WWO2cRh36413FnOugGVUEhK8ctYxZdYB3qlusJlb7V54vE2p4KC8REC8YhcmIjs8M2lqA9VSVKZuEjtPZo4caj5epiIAYyrHNT0nkuxq8jUhfE8TrYfpG8vI0SrzDf1Dzfys2EGK0jXj6p+DLm54Rj5bXXXlvD4h88eLAYXq6N2KyrVtyYx3lx/aW/jGEJXtrEyo3igoElpO6opUViLMbMSlRFIpztmsF38UbOrFYXgaq3qHMJvhA5UUTHNBslJVC4N9ghkAyOMXX4QoeYO4CQzjk7J3altHWvLp2mfkr90832zjQBXS4jSIjmzLhoFBPVvFVORjx0J9vxSvOWxwrOzrlKP6ZuTEJySJEldmYoUxVxFlBab8/O0tDDDqO1HIaZLzVrZd6e1HhmlGlMUiU733AQgyGd5U3tTq82d59uT4YuWSJKHqZmIpAYgb73//of3ttfnKe7/9N/6f9yTbkGJ6cT1ME5m3Qq/ZQ3Kkm0RtfW3Yy5SB5SLill1TtmVbKkHiCTTqWrLPuuy6p9BbsNsjXmzzq9BYAv3K3LPI07TEDqJsot6i3DzJtTBha5guV6M7h5ZvXW5tz6aBDa6wR2gMETOC9WGrR5lBxTlrRqMAK6AIj9EFI3j+M0MF91Hk0SQdFMswSPbu4GOoIZGOeM1mufpmVbbATqBgc8iNGMNfeebm9DrgHfsETWoUocuWZdKaZKq0umNHkKQ3RswbWlAkhEwroTZtO7r5vWtP417VTN7fNPaWZNMExAiZRJje2gLBy3ZlsPnmzJ5AnK/zy84y8W4RfXi+t6/wdUwZPL4Ck+SIOlveUpZK/bIjLmHOmEmmRkGcEj6yjTKHWQk6vpt59+cnL1MdvUpxMAsvsF7T9GGW+Kej5ekjtx5/UKdfziPUHXikNDuUS5orCyXDfSXk9mb/85XaIMlHoiclNmyXX/G6bsf+2q34jqVd8Pp4LkPPr93S6NT490Uy00fEpw1+K38xjxP//Jv/37u//sQrb/p3/qv/v/3fzTt7zO5QpaiKjRMD5D5L394T/f4mmVxnOWDO7gSuO5T7tfcuE1ny5RRofdNEo/j0bc7T+R6Pczs738x9t7NrFMABEZaGKdxEGJnYuyzIyVSgBEUBMRGnSCK3mN6s7CaAwiqrEZs1oqlplcI9rciOfpISewktZGmSgug6cd8ohlgMk7ssmFSZlu0V5x2MIswuU2kVAHC43YQAJPpLEtggwQcJt377hm6BKIJzAAHdXsqcCcIOQJHnvzeinAMoaMJjUEwirmuK+B/IV8SwWOyKFVF40dHyRRSkMReX9zj/wA0qT2UbGG0kpfaoF4oQDFAEeUtz/84Q+XPJ4v6fVXWSBuDIUwEs5z6EwNc+bgxiAWskw1sDE6g1xYgcjeXKV60IyUZXIX9xCILUZm3Yy66l0Zue6i8ejEyqLc1Dx3ZvNcJ15ZX8MMbBUqlAKCruIuGsKTxkAJGSdNvZRh4bs4rUyk5AczU9zTxcxoBG5O1kVHnrO9wOIiHsFCTjAm4yT8rLeNUg0H8RIPtnhkqTnBHCSdp42l0zaB+wx5bOa4EuDkRq5slbVGZh8oaAT42z//j//mT/8QwL3xAg2hCzYXU9HKZotgGvcoWldXXafz8+MLjMPpKI7soJIa3N1NiZmNknsKlPOscjqg1BjEcw2GFqNNVNmVwC3N5/Deu1Zx0lLagQ4ghYW6txCEjVtozMHDe62680Vgb1CO67uOwBO0OYhpge06CIHDXz4hBoYJCgOpmrhTCsQEalOW53o4nowtVOAKD8TE5GnveWqpNdKstUasZM235TLfhwQjnwXxGW6SSDdcMtUwBAWDeKkNG2IixluiBg6AlLenmggMRKSegTpSJo+AxwAiO9lkaZnATfAOZojpmBuDVHTwqdnCuYh8AD2YIn2lDs+OZjqoyFgwIk2PIPpzql0/+eH/fnr6h/H3Mv/l2hXNz8/4IcHzefz48Te+8Y379++/+eabX/va1z766KPvfe97T548+f3f//0PPvjgS70pvrj+TC7yYI1T9aMorHX7JY7mTmwHAYhWnZjKgdfnA0KpRX02yD6JkXLwRplhEUKyrJtEyvOmE7jhNtfiAFnauORW9c2+3XkmJR/QGAGRoOTc1dQPuVPmi67bFuolOwuIKeZSicFS00ls9EYRrN1o/iadcVdTN+Q8JWY2YRexuVvMVagye2NWNKO0c7h5uTJNieHuATHg9kTNvtfmFmmcm2BduFeRIslY5NpAI7FLV/P2anPn6cnpVZ+tA4mnZCkZJ2tDM45/6f/3j+bNnmboRgh/3HyuaQMSk66mbkrxDCcyk6Zo85TSkFMIhgQkLbmOTqLSGUkRqUzKuRLdMbslw/ZoWgt+2B5X7yVjkLkLkZpLddGGHl4Zn2/AiK69F2+QeQ9faoUN8UQclVkFk2PC4gtu8ie3KJjDkcKXRBfwEu669G6bkzb4DM4WDOKItYH1sAGS4LZKottQXU4TfnAQe7w51Ek9vE08EySIVybiG/6GRk461KiAwDtShjFF9k+TntXFnaul4lIggyd1Gi3VOQ+g3eYQS3Odd+w0/49MWDNX4TBVcIz0Caxjre4pwuvo2HcWIe0yH+AoYgJbyySyBwheI9CY8GulDr64Xlxf9hq4rTYTZEAy50w6eho9FUvNT+RzI0eW8GpWuKlQ5TQyjaKjlDGVQbqdfuXi6en5T3j/MeqY8xYAxnPU8RlCoft0BdrBvySfS58R+L/Ut3hFqYc0mLrPVr7i+lI+Ya377Z2f+m/sunwyTvcuz2g4v7ZGuk7Yfwr47WwH4J8Z/+RvDH8C4I7tn3kfdGqQwz/DJ8dQdzR2kI5cUfcO+1WeYS+/Yj+vDrw/I9fARN117+6c2CRpYiEjJRuljInYWViKKQXdgEjZHSTKCidwRSpAYavsDiZnpZjB4QqHa2WrolnU2ZzciJtAHElNHvqyqhTLg6UR6crz6EmdfU692lC9UpNoi1K9XgZSYzASrOey4bKlskFleIIpeIuSYSnqdzKIwhlszBqVdmyWjIgfAAEdNMZwOiivEo/myb3rbMaQbItLCvoi1eJiIIB60hrqzBJShwYgdjQHcQdzIFgWazNVC7yNg65TdS4I/uSfdxU8nf3hZ9/41nTQ9fXNb37zwYMHUQt/8MEHMY5zdnYWGQBnZ2cffPDBC4H4S1WoXm/xNUlXEGQAKytLApEl1swKeBy1wzjKClciDwUPbkdcPOIohv0wLwi4U19V6khm5OqOyL8ziqwxuIHVRCd4CMQrvoJBlVyJKpGSe4ttJ2s3bBVIiJOzNbEyVaZFhHLyZWoyPB1h7rgWV0XAEmSHWcYyol3uuv4kjbuO0+2R4u6sk0QU6GF8MQT4hHxKDreK1EN6J95tTh24NsZ/7fiy6s1ae5Zd3ZVAOA5QmH1SjkBMmLJVtjbLMFs1fR79b/gAn0XU9irNA6frZ4O8UtmDkzJJxA9md/JGoG5idmCX2UENhtCUS3Ilr4x00GrbDf2IPrsKqTukB85C70rbJc+kmTQmTHEDyces7nz01Bxu41hC6uCpCcSNVDLzi9szNvdzyVW4srOoJwMlsh6V4WF6ioC4aw7iLdXJZck2nTwVF3NxF7JWfi5VXKJI1PFF7TVncwkGhJBtuG6pnKB280TtwrxfZmzDzRTEtGuyefyKDaqBEqnA3NGSKI2JuFiaTNQptt4Oao4WUkdHI6toiTmtr9QmhQ4smNlyvMzONyd35OSy8fIGgHPIRy7PbiD/2q/p6R8OP//3P/s2b7311mcHhEZM2VtvvQXg/fffXwZU33zzzddee+3JkyePHj168803n+UUfpaz+MX1l7wWZVhyE+IYYcFhx1qLbzwvRW1XYA+ygbAbcxF2osoMXgluc3hbS2lr4F8PnZhSZN7BmHZZRNVaY5JDbyU3B0BZ89YkS50AmOQopSx1AFgL12l+IOJpC9cAEA8577NsCsaUatNeeW63NjHaiarIZd/fmaahP9mMO8onydQlTwGLELA4z45SAkLHrsLgVQ+1+XglkAtt9yTHjGCejdVH5mqfUf/OpAklJWcBHe/gRC55yieX/faiT9aBs4u4iHPLVHCQr3EXKjJ0m75OY+634y5YD0RwJJes0k2p2+dembdlSqCYjTXiSdIkUoWSuRhPKW3biYWMubIMScQBFxWWG2Opvm7gskcdo7LOaj28o9xEqdl1BxcNstAK/e9+A/w3oyGEbTkh0urnLmClCp4gBgj55EKAEW5hEIdS304I4iAlqS6lxdkdCdCx51ojJnOrP0E0+4V7qAEVJAfW8DJV0ybEZKZMxO5cDyOclBved67Eryvrh3fP6k1n0szLNke8kzUGsahJIS0mMYUT3eIYA3KnRjwLB3E95pIsUOfm/HUhTVwZDnKNgzQ8GB2JkEiFrTYDViRGux+d431meIFZ4xsDftzS/K4dKl9cL66/6gIxAj08uYyeiKDOg+fRcvXkMV5Ix9uEs5oAbioyCU9ko9RRyihp7y+fX9w7/ylf/QTjOeAtYcw/G//tXxp1+E/zTK8folZc/SJblXRCWtL4EplfnLy0HYd+/wnqDdet24HO8eu6D39GlynGC0o9rPqvDgzxX/0bp6fsxc1AnN1f3n3lk+muFWGCK5VJpkmIXcRSR1IBBZQ9hOBkojACV1AhLayVARA7qbF65L7BWbLbRtRSIVUTODeSpDKMyF3YNLOpVEtjSMPgAgmNOFCH1MRTW0LXrz12gguZkHVUN1ROqNyhsm394FogIQUIK7NaO/NqfAu14QBix5KEAUJyA6Ej7cnm01OITFSIB2I7OjnOJoP55LMhjUVD5xk0mqepIrzLG2LCO1jn5kBaeuQEJutJB2eeAxLMizYD2Z+Tg/h5quBf6nrvvfcAfPvb315q4QhIe/z48ZMnTyKpBbehJJ6FnnghEH9RlOKZI+sETzHSTkps3qyezmSJtKPiQKVUl4aLEWyOqYI3icjnMHF2ZwcbcXXjJhAbbUuROlINBjGMRaNUi+aNI1cTncgquR4depWskiknJVJyY2eDMxlmxITPkjYbzaVjK1N9KVcPR/PGdl/nwLcvMTsHXFWPKMbN+pkyJD9jcVaqQ1JVZ7eICw9M6/wjmIHs0lnqS3/qROebzd2rGRp7U3AOo3Ogg13hBloYxEKu1wQILCO67uRKVhsFFohHFH6elhY3C+Xh1WZ91q7kZBpHHGciBpJr8rWS3ITf+SFHWUhwOLGSVTZladMe17RnrB97FHgJnmEafOGQaFc1DTfksDMskR6VW60+dIUTma9TAenodwodISaaEioGgElB6KhiYVgaSSFlVmVzTvCe6gnqUmfrMZZCyAxMcAOPLqOn4lJNtDEbaC7iWi0q8B668A2bC3gu40M+3lDtSGXFdcAqjSeU6MjMmdN0jj7mmbSn6qCOKnPjIEYOFJxqzsWTgciR4NnNiDJU1rE2SwmOmMwJxIuv1a1mUIrXqxm4m/EeTjCQkYMQgHLCMnpMz60Qk5v8KRLV//pqKvyf/Lt/Z/j4P7h5m4cPH36ug/jDDz/86KOPXn311Wv4wm9/+9tPnjz5/ve//+abb/7e7/3e48ePP/zww2vJrV/8TfHF9Wez3bqLR+wNDLSQWI5DHedG3WrVasRgd3Zl3vcnVTiGx0nMvUW8tg1OjAhkIuJmbQNhNnVuIzcNR0pOAoJxR8QOcxLlziUZCWHduiMAKp3Nu56MICoANHVj7oacjLHvxAqC3uAkTaUNxToWSQ7pG0Q0dNuTUYOoMKVuSgxxEafQYYMyYIwGkZKWQBd7DrFxmpKMiZctYTl1tD7WMuvqPofqgtkBmFAVsSYQr18dUen33eayz5qJO8/JYn5oFm8d4uteshE7swPKsu+2UgfCCTnc3Zk1xUMTBBLE0TUyIBeRKmRMhWjfpaz9pj9JqiV3Y85VWJmUyOEnE8stcbg3FEa+lr5LgDekj5iHPApOgZhYY2sdN6JxQ5eEzMeo5ca0+hPxDQU0gSuI4QUsZDHUqTgKleVrIrDTHMwiBvYb2nQbujQh2MxNahEF8f8h8g4AQ9cM4jS3L2VOu41cvoaYcDruQ+MZfIljru9MQszzwWPBDppHHkaqpMWlBKcRLZtOwcXE2hhrxKovW//1X4nmIDYhS6RzUEbrAfes5jawSkTO3xiJWh0YjcUsDnnhIGZ1oOhc696YD3uudetPsee+uF5cX2DZkqLRVSCjpdg8Bsuj5dpsG4y1CdThLWeFYcKFMUoN0W3AS5e7r1x8nC9/hvHprPm++OA866lX358RPYU7Txd3QF0dpQw8PH2W1fpL8rgcOrlVwP5idH+tbheYfe93rz79xXinFknkXnmaRAeCUE0iVYkMBq9k0ZeszFVnRhJrlVKEyJk9DMIu4Do3O6uYirE4GEbsDSZpxuTO7FJIq6imyXLk3IxLogCho1pcElk0L8NYFo9gXHlpBZap9lzDQRx8iah5IxQhGMQxmQsyJk1UO6qZ1EDqooRVPq0DyNAM5ZlBHOfNWYegpWPOB8160YvXw1XEa95UI0O2+lea/0ytHUtWJyjCEgkQCkOAqsyfd1eOHVn0V3x3ravgP/53/87+tip4uZ7H/xsu42u1cAzaPnny5MMPP3zw4MH9+/eXqLrlNhFPF1F1LwTiL5w8PPP55nwwco5wEm7H2iCaJSodVQeNNKeiOShS0yJ7kgm+MhETnM0FEBOpCmm2Y0dfJtExIudiQlKZVpZedKqkE5nSyhsh5krkylpZKnFlM3FztnAT0+IydZATT5J2Xbc6B/uCJmy5eWVdHTWR9OCGpBYgzeKHwBuCE3Zdt5l643RbmBvcjMqYqlVb+yjX/WEiEZeNycYgwbu1ZxFY6ZARRu6wJYxP4QoEffmwcTb/TAupMzJlq+S65IDRLHP7sYU8nvmj7t01E7Eb3MlNCSzu4SAG1BBO3bC8mSxBb1gQAqRkSqpM7GJLQ66hffyo+HQmHDmIV0v2GqsXqeKJVNbxiMfP3EpxX/+SRYZu9uEcDOLlN5AzWUeVD08Pk3Iq1LApoATbwLZQXbxURAHwje8QuM+ICQWrUzFRF7cZi7/iay0ZdFHTor1fBCZO4f2xDdXouIbA3EGtsUYXc1ZLVJ8d8atNb66oe1IAmRo4okErVdxJNVWXyFtPsK4Bm0zo0HhZ9yGMG70p/HLO8V4+GNLjc7iAJJZP5jIV4IEpp1VO3fNdWeum7H8t6x/b7cNfzyPdPstivN784udEVN0LdfjFBXYXM2a/tnl44FoQ0wuRb3W9USgxBYIqZLFpLn5hmvcKbntcoA6cIl2tLYMUZolYrOLWzBH4BsBJquSp306pT1pynXj1uS+pc6JuQSgGmIK5pm5IXUniCe4oxkVkJkJgtjRz7M/RmLrsujvT5Mz7/uRUa015TGlKwmJNIE7mTlBido5DCYmvHcQsytx2NZ9bvzMeaoZEHYul1ARid4CpimhjEB8hJjR1u64vnVDnOVnKFpZkFuMUS9yRgzgaxkO3XU4YjU1ArJJK6sachiQOYjN2d6Ka8j5vipAJQdyNqlMRduIppyllJa5MJk1KVmY3o89u8rP7NXXYQc5OBieoONRaRBut5rkA47kJe/1HJrElD3b9RM4NQJ8REzSRFFByL8TJeQIXkIJGl+LckXaoSx21hK+aizqvucAxhTKHB7QcDI+QuvlQkeC91zg11WiO0vo44wuaX+bN0QFtczzNrdyE5mWY6RlP6uFYQu20MA+K+hJSp8Zm4k5qUjxVlwHZHaOnYqJhkViCB2w1QUt+JPHHACxZIo0NOl7DTJo5snSMCJmqHA0XLD/KwdZ8HquTT+jah5nWX5UtwWa/rj33xfXi+oIJxHBQdQoGsbkAGDxNljTcIw7IDSxMzN5V4UJWeBqSDXT/cv8b5590lz/FePZXwBH8a3n2Z6J7HfjiT3or0Erj0y8/LN3h+hf62+fKd7rodp9i+p06dQTRyjrwdq9VuHScKwsHsXJ2Cis1xISSV66VS+EI6ZV2cARVdgOXQEeKJrEGLyMYuVLjSTJJARdWlclSGIdrYxA3+XXLdbCGmHBf24SO7FZhb9pS2VAVWA9zeIIXcCZNpJmqcHHPAEkkZv3/2fufH8myK88T+37Pufc9M/eIzCTZrVK3NGjWLAYjQQLYIwgYSIsiIUCrEYoFYXYCmlwMtBHQrK0WYvEvKLYw0EYCyF5IWhZrKUFQswFpocWgKAiYhdAzyBb6RzWLPzIjwt3svXvPOVqc+56Ze0SSSVYWK6toF0Eiw8Pc3Mzc7N17vud7Pl9ahgAZ2GNoLBNMMUJmuem/e1ZB4O1xoks/GE+bqlcJv2m03AvwkRKfDuIKdzCvI7JnB1/l+OSRrEN73uTT78h2kv4ZfE4k/C9/J5kLmkLw9deTSpzV7te//vXvf//7P/jBD77xjW/sN/jBD36Q//T5Ldp+G5VhPuvIEVvYdHLQJJ2gGiEu9Co+S68cjsLYwsfcNlbwTrDFVqEpvESoF+mXs6lj6gv6AniEAeEUE9nBtHRMrYk1escWPyNANT+sFh1uAhMZKXCEi3iGt12Jf5SgONmEi8pV42aM+j2rC1J33YrEUeXJFYxiCI5jGJBdSkj9BAtGiK2T9SscOa4rbVCgNcrcy3w63L06HFKC/OQr/R7v4ggbruqRvurY+MLXteLgJESI93QQD7z6JhM7n7pBryPFPuGCQ7fopwg3ITWshJWw6nsIKGMP5xw+HR0OYsDgRjNmb+2Jl+hp5A22Ykwu76cgsJdEJRNL4RNtkj7RnjOIB7L6Yma9vq7HRZNFgRdERdRNnyUcYqCp+C4xjHaiURu1SSSDmJ4Ao4IgcIZ2SB9OqMjQ0twhPNhcl6gtkl+cP4d0ZOzf5mbydBBvpicJvwTNF/iR7R7tDm2GHbbN5gCvu0AMDPzLSO/j06B7FNoB/YA+wWRE/ghMYMoubiNHNYvwKWwKLxkv++zl3bnDaUFWd83U1thGCDYVYHdHumzee9Cfvlclh7j9V6pdBxfmL/3nL3MJzY7oj370o2dTM3/6p38K4Pd+7/dy2/vggw9+8IMf5DaZK4dx/tE/+ke36uC3b9/1gZkZI23EfqW58hHTQX978D5S4XVJ6ZBX29MVyPsq/nHLmRt3JMPLS9/sFoA41crcpvtej70cHqfDm2lqWk3LWqdWplSH1zK1Utc6jx2T6uXgOnedllJNwZI4CLbMlJMhEANjQz1NxyYapIu8mec38xwU09q1LEUhUA0V3y3A1M2eK5f0gPHpFzVREwnGCMhNUF0eM65elohxrUgrs0qUEqLRVZxv7bmUrtN5KlFRSujGHZa0yHAYwK/P8Fsw9ubfhmxRJmI6tVLPRZuKC1tKvWSAJuxKKKhgDVN2kbXMrVSAJuLZMleYjlzBqybwrv5t7H/u0zQRJQBwM/7SCFN0RWanhGyQhzw76TUU/nljepveeiKVPjk1MMgOWaALdKE2SEdSciWZS5VeYcJtnGj8NjRcM9GlD3wEnv4IeMBCuqtDLYYfmQiNyGmbEinabqDhp/WbbEOdAkQMOv8A9F/2seAnqDjPzgsccbheEQfYFqY3OBIICdcRuwcdAbOZVudirjEOFyJG3U4JIEamLPcpuSA9u8VVeuGY1E3ExMSeI0SFmc/+9PogDjoGJDIAiLjQ82GPO8Eem45fAzHx177h3tZt/ZVoaUEHOqSFrlHOXk9eF6/NN77E8wjMS/uKJtLEVsWZLx7XL77++Pjmx3L+Gfp6e2F/ZaW4P/LNj3n6KWy5xWl+hu9vWV7Vc7N1wCUOJ/u7r1998eHUG8MEGeDUpXfpXdwkA3JgtC69CRqj0UzCtxlQo3eRJtIlTD2zaFxoWeyLO90kuiSGGKbNy+J6jtpCFy9+2YhCaTpy6p7YdffNV2kT7SDtDu2O7TCcvxttElZpRaxKL9pFTCStY4Et7z1PIxyOuyiwSqsjZedyAHLw2RzWpkXElVwx/nuM8/LyvYNhtSGvhoM4vMLKVY77Npd/EaKSo5WhBb/Cjvx52pSznv3Od75zXQ5///vf//DDD7NSvr7NPp773e9+98MPP/z617+e+vLnc/12Ooi3dzw3PgPTLWICFF54rHlsrewTu0GEl5CpcMZb1YVIeIxK1TUglty/HEV3R+0r7Yz2CLcIOGU4iEcTJ+beaOtARkQU9xfL8maaAEzNwhBG8bTPCpwwxjCAjqP37skdIW878eC6H7R5uCLeimph6DCvhDsvLl5iUaF5KwVSPumUzbBiFn7p4V0NWxZUybDyVg9GsT1ML95BoRp2mh2DHpstOUOqY4NrXF/PuGFxIuiJmPDhiZZ9gFn2gw4B37S9/QXh2/2yZN6HOYk0zWjWeoPRwYAYrHDHBSbKggE6La3fGiGxv5z7FW7nC+yznHnHWyUGB9sACEZq94IERFjJ2wzNO2Qvji+S83VhvVehySD2MhATifkb5qrNlTzMvB6inexUiebiYIXNsAOsgys0gAzbSePcEfZIuwNeRXWwRaa4iiUu2DcpYxvs3RjEofnc08wdAtcQY6DQj2wTjfRdPd/7kJeQujQrbTua5G9sK+kn+MxOcB5tnrH9MYEtMfDKOdBa4Yj0Gl8cv1f6emIVhxmfzktKEi+oGVzLXlnVXrba2AKTtl/R30Aq4j/+x//4O9/5zte+9rU//uM/zh3uhz/84Xe/+90PPvhg75F++9vf/sM//MM/+IM/+Pa3v/3BBx8knvgrX/nKt771rdvZ9bdPIA5ICsRPsa8bzCmN9cPhOWQoeI7fdIiAgqEzCuWCld+2mdy2BtchRCMiVMKCSjcTjHQPuohTSEkRFBQnlzovpa6lAHChetS+tjItZcrpmqa1a5nWpaqFS4BrqWvVUJKARhhXFUvExBWDOB9wVz1Vnbvvu08rUyulqUBDJPkSiRwgjRuoCi5y3aoFxUew7WUrH+1PGblt48JiS1yh+ZOcQIkuYqJBeUZqb6W2oiyhxbW6lEQPJQbIo4Trc6vu9XKRcOn1GGDXupbaVEPpQDcxl6VMJSKFwPHsghCsVZdSJrMAPP9VU/kdtmsAj7XOZmNG44nxOV+izEu9TFFhYMOyMS+ZH7tcM4g/WSncGcT1XUCEfD2yxdkgK2SBFPhKmYIrtA1aFTewoG8zK1cP2sVC7SmDGFeIicEgzk1tQ0wobILF2ILHIKc83dl5ZQuSAQuWrUocDGK9ijqIt9z8+115iFxZklMu2sdOI2kSofACuoXuwXoB5F68dShkzL/uMNLrY8n4VYTQ0w+Vzug+XvwocKUDyH99jpi4zglgKA2EB0VMaEqf2Z1cwvm0X35bt3VbYxQA0kKblyUqgNW1u4YJfGeS+7PaLFxggsZYeP+w/J3XH9+//rE8/iTWh5u++essN8QjgJv5+jN+gy+v3n94PL24bxSs/Ltv3rz/+idtvvvx+3fWKUXSv9U7AdYuWf5GF+8SK8riobCJSfsC6D0nuV36CCgf2DJnuITTc2pFQrtID5p2L6uXZC5ZMOEXue9lQjsRRZ+H1BEx0Tpkoh3Y79ju0O+3BIKAHNEnWt3uIYXmwl5ohZ5iRodIhG8hdXlqq7CJOzAqNmQWV/AMzTPJBO94ekR8nigdAhzZznFpDEfKHgFBlPAK92BG0A/BkX6gPYZwE9OSg+FQ/o3dm7/61a9+4xvf+P73v/8P/+E/3EPqfvSjHyWJeL/Nt771re9+97u/+7u/+5WvfGW/wfe+973P81P7bWcQX7RdenoTxhl0q7KUUcVmdoPokF6JAJxmFMCNKhF7eAc2a74Exap2zyC7AJzaF/YV7jmCEZLTshtE0WLqK21N0u4ozSIOvU9mj6U89BKWsww5GsEBWnAwwqXEntSzWXtMCJUZHgwyXK/It0PmvoKQb49fJGJLKlOJIcmS5ypTLy5FPlEEiNL7qMGItFFdebU1RF3ntc6vD4fHqgOs8Ektom0alBFDpd2nV2JXES716gUx4U43eGf4rifGVkgHcC4ajKl7qxwlZeZpv2OeNZhlTTgkKO41PLPmNUBmVB0HVSDnXUPSdh0Mh3XxTi8M5ZbWkE7TS0L7lRdq99Vu5WJw9xlltTbRZpoit4FL0UNezW5cItPf1ZZM+3AKxOkgziEZhjIm9us3iRqjCSUnwamICX4IWygNirFdDc7RBi0LImwgJqS72mXK5In9J51QE23eiEgxiv7dQWyFPsPKlke3P+F9RmbP8xkhdUFeGcOFUWkHGoFKS5AFnGOGudNNzdVDJJFPcCISvnG1Z23V7vCfpSa1YULEczPdHcQSm/9s/DvV6IWIceMNmb3nSv0NW3/0R3+UHdFvfvOb+xe/8pWvfO9739tBE9/61rc++uij73znO3/wB39wfYPbufW3cbelD3bTLnheu5O21mUeta8ZqEEw+QaMIF7Pc+5QKVwitzSAhGdfyTMvbRCAM68jHcROWF7muMF869xLDWAt5bGWroqIEs6wdBAvtZ5LmXs/9B7gMh2whvQ1RNZSmwoUqu5OKDa8bzp7UxqW83QMShYR5yrHZg6+PhxenmLVshahIvkSG0M/TdBCScDPziDODqG6iGcSGcbGzV0CHkMko+HMbYg18zAZw3/i18F34+XXtdYo0OJlsw/v3d3Q8BJBXCNzr23IAZoUlrsclmilnkvpRdIU0pU9dXl3E4aSGqoRAfO0d/JUylpKH51VUIGI0U+MSNP3XWuPky7Q6/fG2PefFjL0hEwIAqHikSTfbYoKFzZVvH3sYBBRL9mhse+8uAJzBNgpZ2gKxA3ak/p3FVI30ecwuR5WC8AluLl6Q560jAekaJAZhGYhtrWRNXPqItaEoW1OIuJJ1KNssKbBgkgbkef9jBvsv/seEsGJT45Rz16QHUh1gK+XidSR8oquAe2uLXSJEuDiOugZiVLKDdEpncEnTP/tMJqd7wEgrjQLKeNoDGXMNEGcaUVGQMiTx3d9qWAIPafi5RLiF3ohnd804tu6rcuVcglN+3D+EUSPYlbCC0xGXPkzmYiEC7tEEy7+pTcf3b/5iT7+BdZXN33zL/HLuL10fwXHTltenF5N5y92yvHc33v9k3r6idj93fl3Whft4Y60cBEwYzEhIvmUdfH3Tu1c9eFQc3o7gta1d2oX6WSXyOOUQxxhNKOZCCMhFdKcJualRTl7aaEtaorQE/tEP7NkCFBcH0r2nZehEZX9wHZkP6LfoRt4gijQIRU+0Spt0r4aAqzSE0kxwc+59W8T5lnV5sFmgk1X5AdcJYA0DsfxUJD5jm2TwEzzoIwpZxjosSfeQeAVPoU7Wa6U6DymXlvZRgPbRf1vMM/ge9/73u///u//03/6T5Ma8eUvf/kb3/jGH//xH19DF//4j//4937v977zne/88Ic/TB/VsxvcBOLPiS58tddtaW4bb87rEIizOgqhTbSZvUNLRk8SDMJpXUK8xAAQX4WxhQtCQ8QP0jp1WEAcYkv0M9ojBvpQdgJvjtaXvsJWSL3Ey0QUs2p2H/7YixuLpStF6YSnKYNbro5ss6ZPe77M+NntdA8MB/Q1YUYMV4E/KmH5pLjRVokgm6rrJ75tGKHW4eEJZd5t/NTQA32FVCvzqU5G5rywfyJi4nrC3+kO7+yWBMAdMXH5XQ7pYXOYDsSEc6vquLEylqqpySZoOq5Tkt56iyAA3yRpZnb4yHMLEXC8U8QhNsY0RjEZW6XaCYM7PSB7NszVJOdlOJSbvTe8c/BBNhP2sLxvKTQ+wQv8yuI6pm5VzEHmHEuy+TbqZ77XZKudSkThQBkKPVWGwr63+wKIEOmILlSgSwQrfA7T1EgZAAziQGzvOEU4IISDzTX9CJ6NVpPhzo9rtdrLbgfep4BzAp2DDnHHlnTgLbZqaMCbppysRrlMAMfe7NgYxDACU7p5861sZKd2uGkfkMooEROMkApXXs3hbl4Kl83omBoxJItl4Gku1Hgk28dm+MG2zA7Gjs7ku/IZ/6ZoxN/61rd2iMRXv/rVZwymvM03vvGNH/zgB5nl+nnGLd3WX7FAHBiamIJP1KHL8tFrGiyX/PRpsGfrExQ4BXIF292n1GUwEDznRUbrZYTUeUj+tw8GMYNiUrpWo7jIqdSmYspACeG5xKG12cxJI8+1ADj0HqSJWj0GuWpxpWjUEt1gxi50GUSIfLipjAGw0bRikGsRWWMtZS3FhSquEpKeS82W0vDYQhDXgXJkUE3kykGcuQN7SN01fOOiwW2TQCEaptxcyU8YxGupqEh1mMWixBOwAmH6dKt+uoW5SIQ75TwdFi2rqiuQmXukUQJYVc+1hEAzCDcQBd34ZqolIkAjkVq2wEgTCeCxVlOFGSPGBfZKYcyuwHi04yXJyBZ6dvg2B/FVgihHzvCzFyHPEcAktuegVtpW88S09y1zsgeyQM/Qisi0uhXSBmLi0ou98HcDW1E2BGJ7Frm369shadH1jdiQ4IiMBU8zr0Yod238cpjbBeItKFw81DFGOHmVdxe4mmR5Ittefy2TObxchdRFIPPoRv5qqIf0oActcp4qNe5xUoVvMzTPX+/Nm8AQRmWfNriEUgSYpBf6zKaIiTURE5ZP14dnfFA9AIqrWHqfszE8EBOR/o+4ScO3dVvPViJxeugamlek5mX3Re592ydFXuIYjd5Eznb/5qfl4S+4fDwKpdu6rc+T7D6dX733eAL4pYc30+NP8fhT7csXHh/+TX9ZunjAOqMTEmbiRgHd6I0vzu39x9d6ODz06j6mkc3Ym9Zu0ikmtiEEabAcFzY6QRGxSBHZTFsODEVqr/s4d6TbVxgWFMbhOnZ+y5OfsgRGP4xM2ihgz9FYWoUVeqFBo4fm7Quc3EOAPI/VFY5NVr6OnOWGdou9W3tVOz+1alyWXNWtGTYwIuIJgltT2fpgEPvVQXL0a8mdgS7h+jcdePv1r3/9l5a3n+Y2N4H481Kvbqlsg+KXp+qyiVghQfGyEdDWbLYwhuqX1YrTjZTL54gXL2iIGBG6VwEB2oK+JkU3eEXc22oOGQ5icoNnM2K2flxPXUppBzeJ3LlTjXK6cxenA3CK43kQNffP+rXVJBm5Tgqv5/6ynB7PhhvNlggFBd0Yvwgx4WotRmRfUndHicgcuZXaynQu9TRpFNCu8+KfC/mXOJJwhCE6Q6+k76d5Z5t/dwsLM3inb20rjZ2XeFHJL6lipBNXxIenB6IAIvIpSYQ61ECE6B7pveWjbAIxx2gvjOio3d3gzicOWMTFCxNj6mSbk96JP6P7t99OGcpQeKXVawl9V8YZCPIKarB3IDBmW5Aa9IUyQZfB+7PyLPguQKOnQOySyPkJNsNsxCRJR/4w7gJx23YdAx3SQ30bA2ZGAjq31z3KNu1Stmi7xP/G1vM8sk8wAIr9rR07I2krgwcZDWkhevo+qkziUrKTfBjsXbRTG1oXc82uqSJqOIGaIwW82MyuaUzMN4tsjZhte420e++5kUF4cFipn4gBOawr+qxC/6XHnc/y6PSXv4troMQnrS9/+cs3psRtCXyLiP6k9yCz8/qsURfb1sP9ezlS6S7K2rh0whV06JbJtkGfIKkvl0CDk57SreqplGWaAlhU0vEaoEYS1LmoLqpdR19P3au7izqli7airihbgJ4ITGkJJK7Ha3U4MTOhgOFcJMjHqaj7WhQCkaA606UrEGNIIJ+vyJWYmxuomoiT6d8N3zLohr13P9vjQm7acReAWDQRozxDTEQmFigkg/JKeI3RVTW6hhVYecIGidG55Ztp0vAP+pqZdV1kLaWrQEABY5NIh2zLfMqaAnHAhS6yABKJzqIwJOkFxMM04Qm6/6piyZ53XvUxCE5XnnSICwImESHmDNlAe4nCf26WDQBF7Ql3c3Tbn9RLmfLiGAzic5TKWClt4+DaFViLHF3MC0vICIj7wD7EW03pROqGKyR12J2aH4LQiOyVOi6RtnhiyQ2JALN1OYAVFrkr8hlTLN5x7MLTw+M4G+tVwgyQJCiGkyag+EilSzjGQEzs/ubUjBm4mqB69vNCaJPYQRqB5hSU7aziiqiwea+l+TZiIrZNdZiRRxIvbWY3UjzegVP969h0b+u2Pkfq2UBMsEG6lRYlwG4l8qPmzDPtOwozF3bhKsfHR338Cc8/g93Qw7f1uTx5Lq/fe/xo8njx8DN5/Em0B3h7+fjK+3u9SwS8i/QIgdnYXdwEHe+d3tydPnb41O/HP23GM+tSO8VoCeN1wrmnDQEUQsRLE2nsnhjikqkDctmpUejKEITtxfvTpbRJ+pH9yH6EzXADO8RHJIBNtMpexegojMKeya7Y2sM2HMGjxK5bk3tzDMZ26sCKtEnlhYHy9JxA4MAuiCWKYR+lHwAavziIIyIZxGPwqPAS1556WqNsLjSOeannWcO/wSvgbd0E4l/0psh5ufQkkJswtB9bfdrm0xOFlgEleaWA4jKxuO+fCSBWV7FJ+ho6ojMsaAu8baJnOMU3zsCGi1vCVrBsWIOQ8NrXeXkjZTq0F296xc5hc0bQHTVCBk15U7z5roO/DN0uNkNtjLwtxnUiSzaADCpXoVrc5yPFpQTfLetmOhwcI5l6C6kLmegWRWPLN7e6W0BT0Y13/I42CZ/u8MQQC3bp/Fl5dzVsyXCGwRszRnB7btcJ70P023jlo8rwd71bxqBu+rkiikOTEOKXsBwDDRletk9npIKvFse1PxxKXFcoKS92uS59dQxFPqmEr9NF8zYT+kyr8AJ7vqNsv6h02G19ieevk44B1fT2bIWfJMPI5ycaMWm0riKgMYIJYTiEr3QAC6QnbPky4jqwHg521+7FQ3MSZ1jwr9KBMmGowqcRG4RRvSdcG1HoZfvXCp/D855nOMB1G8t1jBqQ+6/y8gQwwQ8YkzVjZ3LSIB3spDFj7pngpBgPadiTr2vlTcJHzhTtSOtrEuLecti1+hgBuOLkLuRnD+nic/x0Zx1vpZ8/mw7ZbaLttn6DKxETUI/LPN0GEnKJ8P1jxGA8P7jlYFoOfWxWgydT6iN4zGpI5xgZIYKQkVuVH0heLo6kiXbNeGo0ZShYIsCVAoANQa5FVxUAVHCa7taVoU4x1a5D3hV1hZhFTz2X+x/uE0IpSJIDW2PkqpoAYh1m4XDJq2dIMJvWLnDqdpEBKBn3ddEsd7iEDEcGn1yLIndWDgQSRBzUuOYaj1+PdlVJDnJxr2F1AJQu5wrC5WlHdjTaBI4sfELERVbVroRA1eE0JtCdm7gP2RzEGjCNtch+7QdDNYp6uGCMkVxdAC+jGrsMfHV93qZ2xIh8tMxtSxyyRvXR1uOzVi0QKsPkffEOS8fF47ofCbewB7BBz6GnqBXRKB1cIA1yHbK4pabiigZBbI4buwRQXEJgxgwNRsfat0FPhc/hDuwDNzn9czXlkooq5AliQjzGBhdXDmI8D6V53pfZBW4ZiQUxh5fNCRxBD0mdKJgIi4GYWL3suCfscryTRpHnm9C+H+qWlyuIIAt9DFQxcmA2Z2llRAi8o7TjCFHwIIWRDGKhI0Qu4Q851ParpMK6f1Z77m3d1uesEmZkJGZoj9K8AjDXMKVROp1vVWZOkHRhp67+8uG1nH4OW2+EhNv6nJ4819eH00fFfTr9NNbXCEdf6/IKjTGHOdnjuJiprBPDU68lmt+dX5Xl1SxybF984xJOc/EuXGCzTJ3sOYcEGpH/ajnhwg6KSOlkF5ha6NlrAC1UYGTM7DNtCS3Dqy9b4XytyYYyJtiR/YB+iD7RzygZPmRgOp9m9pUt5RqFJRN1gqVoO0rjq5QC5DTS9UjQaEsj+RITfAV3glcLkS3ulZcDUU48j4dqIdu5ZRx7SnhF9IgtqXYrfLkTn8YlaLST/dMKxAwv/ezdP4sq2G8fkJtA/LZWOpQjDksl0uqIgGE72jrDaCFL6Dl0QVmjdC/hKsYwwscI+tOINQ7Jd3yaYtBXPeZubOdNmQyxZepL7baYGsiIunZdH9AXRHB9czjPpZ0BqDVdXukq98f7N8sHsUg5S0iRRW0puuD9x/Px8aPaToCgziCXPq9azrUEYEY/DiBOysPs0ruEs3exzgiKCpI7YWJd3GlOT1+oIJyxsqweYG2m7fSJ6lKYrA+xok0CRFn9eHpT1tfST7QVIIvN6+m43plMXUU85vUR/QR/Ft4a0k4vzqeuOp9es73G+poMSI31MePAam91XfdLkhqkEyYwaF/ZzmwPUztLz8kRB2hGGKZmWfMeezet3mlG8R27gUvezchPUZDUAgE0ICFiAezvFMhgeAzoLQbVNzG1LmwpJTxXGAPqXgTGKCG0il4HQSKmiMo9R84VhtFvzEg3L9ma20ssutB0JH3Tw1wuIAPSckpUr3lA17LyPkrG6IFKAO4bknFL09uZCLLH6WRWT87bTlskUmzJyN2Lubqru9ASRIhR0joRzCkYv9ThW3DNALzERDuy53SMbJ4pQdiWKadX7v1t0hxwgCEyivNE/m5DNGO3vGb/bio8yXy/U4EqVqSvEkinuHroFlI3BGIfqsbmCOY1Uzi2oKRN9uIFOrE9lMCvlKvOcLH2GQnEt63xtn5z65JczCFdJmCIQXjACJJB5Ii5eXbDLsMwW7Tlqcr4iPFqL5ercK7tq9waomTkZTACDKqHuIn3Yq1ErJHwIFAy6xPXAlJxT3IxItRMIoLcpW1saakRcId6qDvcYCt0QuSdYdUxaxIK9vH/AJrKDsfPp5BtpGvcwEUM23gbxTs37/CV5si9O0UPCUeA0au1EjHOMwy/cAjsuh0aVFyBP/Ydwjc+1nbReIIjSCvs3JqJVFv3X6zlZTcQnmkGSAH76thwER4iGHyLipE68kjI8wR9FKCaq6s5Jc3GTvigOaWPRUzExoU5QfAhiJH5xhbqrkgQfVzSQn0kJ/a9oRrINNzR0nuSPHpVUAUSXZKkrK3fgZ0a7CVY6EUskyJGjgKD3M6cW78j/1q424iyJINwtHJ1y3bIGIAc3kwb0XXgTIUXhIN6AXtTGDoifMegTPqg83xHXgLrKl3FxZE+3ACVkSagLZF3469tG1kEPIphC6vBYI1H9rtdBk1sGBP4rtP4QMaMtyqkhxAoQA9pIQSSxbylUuKdFohLJntIjAKWDva97f6r8/6J+Kz23Nu6rc9hMczRRo0nnZd4q3eUx1eRdBDDyR5zO93U4dv6XDdB7KztRJ2knWJUPaG2MGAmAZTm7y9rU/np3exOWm6NUfpKuHov7gEd4oBDPdwYXaUbTYGgY6d9jgnVwdgcrfmcyY5NV9VtHqjSJ7ECd5owYiN+95BdiC28zo5FjPNG6ncxPMgcME9u4H65avNyi8VLi28iJspGaBSEY+ugBnycTPZDzr7jw4PCKHAABiEwozs57Y+BEUShV7oMFOSWc0uvtJGiJFbT8LG72YKfvgzOKljssxCIbxbim0D8y64fsNDV64kewKNN5gVdpUmwnvv8Ub9TRAt91Y5Lm6NV7QyTzc/KcISD8kR8hrN7ebRpsQm9sMvLZUF73H6qY3l9PH38xYfjT+RFK1rMvvTqlZx/BjjszIcfV+8lYQ6+cnkNynt1Pt8dXt9P84OKMR60P/ILHz/8nZ/9+fz637CdQIrOdXnf9WBl6uUQ1FOdfl7fW6cyA9otnO1U1pN64nE7WpGIUnpEwDqtSxhhKM3Vw4Qa/t7pfHc+uWhta334i5EU9/byVt/89IuvHn7K9wh84eM3x1d/Lo8/Rj+Hd1Ao01Gn34G/PN23OknE4fGnWF49x1e56emnL9/cB7Q+/gVOPw9vWF4BHLckSnuoD6//1/+j/83/6r/8P/yrL/39f3v33y4n2qqHs83LI9tDeLtbH+vSluWQl0tb9MVje/90zivvvK6I+1eHybqWFpGYoW3GdJQSiigHaI16T8WYYk2Lm4aVYFBbxvgMG/bQgcVQHNVjxkKttWs1TG41Qg3awYgCm8SdqDbrepQ+w2bYBnf3I/od20FaAD1CaRN7paXzF4DSKRagihX2iX2WNgpUxgpmhJ5Kn6VN7BNM4Zu2yw72QUUYH4YeKoiKsD0wT0M0RNxky1gHVmqHdEgmuffQE80Qj9BHlMeopyiLlyzIPUH+RukUAzoj78XZXZcoC8qKnnMrSodaFKdmprknRPh6vPlaFEmLVkrnoxmpYRlS9K6rvyBIAyM0vBAxzP4JKb6Sl6DworYUi6oUeIleA8VRDKlsZ309DOTFFRm+JBI7m4JGSct/Tg53saJjymfbFG9oxNv6Ldhnn2szEaCTSV+jkHlR3ApRBJ3cIlR3f4FnasZTgNJQPQ3KS+bXFR5m8w0aS/jBeu2LeGfE1E3dV5GQelZxIQ21e3UPYDLzRqAgUN3v2irA3JZ5fahW7qd5me+sSOswYzR5sbR5fZB+in7OxGs1UzeJIhEOJoOcfjWhlz1IJ4zaedEgnZ67sHX4hqfxTlur+dRj3S2RmYtigS4IhIl203ZCe4BMh97n1U6mKg7STcJZbBHv11W9WFO3ZjXh79kuvVhMUwo1aMd/9r/43/5P/98//K8O/55aMKL2xnCQ6g7gsJxivnuxNhcuFAfDoT3uWrtfTow4F21zdaeQAM0Fjql7gBLhRAfd2U3MWDzu1hXAuVZxL9bFaxi9UxhqUrqUdXiPw0dE37jecpOeTcK1eRHGhf/jgohw8dAc9AFhKN2jSM8nbaHZ/cvc8CQOd6pH39/S421GZE/Urmztabwl+5Ftll6km5TQ0QdQsVny940GVXRsoK+CUHYXEbUqbabNtLpFrumYAfIZzATzGbZn1l1TkgkUeBFL6BKfBuBkfuNBeoAFiUGUid5iN/uMAdgeco6yUhrlDF1zFu6aRRFEYPVyjurBxUsPfTartQ83XX00962WyGHYkAUFQPNy9glAoQF47YeZ/SGms9ceyuDgZQSeJWillcmiANGinLxWWgvtoeYaITReXTBu67Z+y9XhEMYh2oGtiln0bF6ZRDYsL0yawAYc9wGvydFbCnW+7FC39dex/vPf+U/+05/9P/9t/cKf1y/cXo23jp45BLwrrlutm94+IwMaYVsre4iQENOp7BtYMH0A4ZDBSMzKL+MsmPPcTxolcp2Ju8kC8HR3bZm3SSLukbX86NQik1iTz7uEOmSFrBRG9A3qeB22q3CRwLAGd44vRoHrYFFGxhhck4X5tPuD7fTdL1m7bKEdMm2NfGxOjIqujF3pnqRX6at2MKp0SZvX9lMUmQfg2xRZCL3SVpqn2+zJ2NVt3QTiz8d1I2tRCz1HFfcATzabVXbRlU5t7fBxvQ+whz70O7MZrejKZowN8rC5URBOSoRROmjsVk42tz5xVW/y4vyIfrqExPVzffz5+zoDXEqt1l+++QnWh1G29Uc8rGRaXSwF2enVv31xfPH65d+LQ9Hu7aFMH7e/89N/c/j4X2H5eSqnpOjykepcyxz1DtS53p1m/Wh+yUCpEo52Uj+JWNyfl7t1fZinh5jODXBKi+Nih9YObZ3Xk1oPChDz+XVpjyGF1nn6GT7Jfhheltdf+ujHs3kQ73305/rw51gfdvgcvMvrf3Pnba4vrc6M0MefvgNfFY7lVX395yBx/gg54vdERCbXNy9e/eS/+vf+w//jf/Cf/r/+g/9BPXSc2Zby/uPpcHoFW6IvZXl9OC2v744LFYHDY//Sq1f359dZrqj1YDzefWCrWJEIulE0Ev2LbY6iT3d1ei/mF1IQcp3kAhBW0p4WVgLiWzEGgYcaqpfJTKRMrpNZ9SiGYkyBGAjXCGrtR233aAfYFDbDAjhAj+gvZLmLBUAL3wn0lxmNYTkLlV6lz9JmWbM2UzgDDQVAkX7Q9cA+0ZKUkgjFBumZJwNxV0pYqNEXL0X6MPlpaHGWdFnBQpqohfXctKBLlAadYQ3xgPoQ00PUU9QlysiOc6Wp9BSVCZPwMXbao5yjnKKslJ6/FLqIWXFRq+xHdoULkGiLt5o7mUFns/QqfREzcdd8I4ZKlO35LhDdMCNkere9VxYgipeNTRxApyTecWYXelSzKcTQJ3hNwEhPgZhMdyKZXm0J0SjqMqLpuQ/LDwCnXR2s9y7tbd3Wb8uG+7RlE6RDjSEJbYM2okv4IDEQMTQ0owfNn56/jShXmpeT78SYxV4jkI7afG5L6QvtXFe918nIUuZEYCxVpu61+6H3F8tpP7K6yGFdj+tZ3Ws7qTXx9uJ8epjnR9UWGg5d473Hx2l5jfYIW0ERW9WaelcvcgWc33K5cGz2WGW8Mk50QJAJz9ElXOih1hG2J9aKraWv9IBtgwocUDdSEPBOaabW0BewSV9osMbGkdM9dS9mz12Y4bX7yeFGNUrPbC+IMS2iheFCOv4v/+H/5CP74v/tvf/xFz86HZdHhqt3DS/rIxGFwvCpVAAfc1pE1eLF0t4/n+d1MVHxiKDZAIWEZ2yCl3AAqwqMnqC+AACNYMT9utbei/X7dXlc61KlU1RDu0jzgmCIyzAiSyL6ODJ3vQAm3ep+QkmuUjiYEQ7CtMYkQb57WRkTuwcHVT5G3oyDDVypDdIoz0gF/rQDknVRIJQu8CJm2tuwwYbQt5iXZ8x8KK2IOaxIm6QfpB3Y0/JT4BgToJqA/gNsYicw0afR49xbJAP5V6VN7Pq0AKvwCSbDiR7EE0rvaLg+BS43iIEdmmeGwCXdN0I9ZPUCcEClQvCpqYKJwli8JEKsRcmB3EL14Gs5LOwPPp29mhU+e6G3p2Uh3QsRCRKxkMXLI2sPXaOuXsMVQfbbtntbtzW0nhm9syZRx4IeBOm0EHeRjXOXYaAcDuIOmojRRJdymLPZd/tM/fWtf3H4e//XD/6j/+Lu37+9FJ/6MIpjs0cr8SRwJ60He1yPgCV0HpJxJF/4ar83kR4SGMkFl0mrMQJ1CWLepkwzUK7QD+wzzcGD9EoLIMN4iMihU4M0V0p0yCPKCXqGktGGQHyhNRV6pfVQ5KDeEHJD4IVW6SVtZ7CCISIfYeV6gAyX0BzbrWNjSHYDv13C6y7xP/nXA3uBV+0pa8zSElO5ffvIop9pdY9pRybHusCrdvc92fe2bgLx56NYjW3uzFwWqxl/fLbJWtUmpbFTe5tO650FPbS1Q6yTriKdbhSD5zhqHvodsYHOGKBJWFltdqulqTeZlzdPJE5vcv75QauEm05iazn95OLMjYA14Mlomywfvfj4333w4v2fH+61hbyy/8ZP/2J+9a9w/hm8X6RVN/QFq5AfgZzq3Remw3I4PkZt1RGsD/6FV2/m3o/nN9N6ejkdf96/cJrmYvbifLo7v6ntpOujtgdaCwoi2N6gL5CK8A2j/O5FWw6v/nXtpwDKw19wfXhiNw7H+obea31V6gEInD9694CSdTz+BAA2w87z36Ctx4efvvf6Y65cT4UBD7azzKdHPX8Ma0BIe3z5+Pp0vH8TlRFfev36vYeflOX1Blrud4jpfP9wPFiTQAKdmcOnYzZZuEz38/yyzy9ly2q5TDKKS4jX6KRXh0RmcDNC6WB4jTqbSpR5sw8Xp3bRnnncXgWglPZClhdcD7AcAEFgRT/S7tnuuVK4eOFFIPat/GuUlh7hSftB+lFa7hONlkbmACf2o7QD2zTGa1OOkA4xSJ4LA7TQ5JEpo4euXnIHkOLJ1iAi948FukIauEIW6BqlwoRIddggj1FXLxYlBiFDJFXxvrm9HHSa6znKGbpCDQJA6aIG7aKWIebT/nzDn9ughhMqBF6li5iJRzGnoJhIVzoRS5RO6cPoHyJOtVD3dIupb0XnGN7plMzuq9JRrE9Bo03h1aCdYgEXcTIsfIwI012jqofKoCAHMuUjM2KzSyqdZqOZejtS39ZvVTuWeDpHNtxKoSQASQzCNoI/brEbG7BZmS5cmCefoCfy61srQ6ilYzab2qJ9obUia6yPUma6m/BcSvFgxLH3Q+/iXrfRckbUvk7trNbETewc1ON6enk6rOWuQaTHy9P64vyg62v0E3LftJXe0kSsHt2ePLQtVY5mdGOYUAIRGVWdMDs1V2twGx1Lb+zL1NuLZdWo+ZQXiht7l0HSaJxaZ3sMW6lT7Wtdm7epJQXJ+HJZ5/V0OTBsazKD5UQUx1xKOlos+52kBJ3IGBZHMVM32iqioIh3sbOXY22noKq7OtgxdXuxNjUvfSnA3To9tNrKOCj5GBcZv+/J3A02fsr4XRb3IIv1Ys20MMKNBLqyNFGlBBAhukXJdSJASaw1tNOc3cv4Ga7c3mMRjFB3JCFExHqUiu7BNVTosgV823AQSyct0upDBSpsgeauYU/4gSFZAoET+ix9kmauLmIgJaoYkanlb+fSeJHuIZO2g7R5E4g1QoBAaESFd7KEF/oMy3kXwfM3WKGpWBFTsbejppJ/koG39jRDPNOVeaUUd8gKPUNbprGP8nB/uuxeFq8EUluCJxT8U0STb99+9hqgB5uX1WqAne4ib3yp1EefF69uRfM+L9q0EB5ZWSeaKiSA7rp4zV/2hkW+zevc1m09uURU+iHaUdoszQMWGiHcIDHg1c57hSEd160E0N8+Ubf1N/Cdr+9i0Scv1IyMCFErh6blsdarsyWBMIc7taM0AsgJsC2eIEby8JWsmhuPIBSWsTqyzQMJfBILzx089nrRAg720CXqg9eT1DObIAVi2QfyMnr9zA1EceUOVnrq0XX7iWWYf/1ZAN0eW+HjtCPpU162qjxiszePzrdvo0OYYQU+S5+lifat+e1pi0rRVxiZxZcdawuZpVXpVTu2eWvyJhDfBOLPVw9po66Erl5AdJdmE7pqo65A0KbSyqFn4kmbuJayCJu6UTyS1au+z+QNHKEYxehWrE9oU1nZu0zr4xMlNBzra6HM3iEFtvLxp7+E5dTX6c2PX3z0hZ/f3S8HffHq8f7jf8XTz94q9oafGegA4e3+1b/90nwf/qXTXAC8ePXwdz/6ibZF1zdsD7Xe1XZu9aDW6/Jal1dcH9EeEP0SYTs4Gsu4iP6C5cbHn5T1ASTawztgFOHop7AFiwB4u1K9PAv/xei3kPX1/+n//o/+4cf/JYD/2f/8//z/+G/9x/qI4+mVtIfhp26nu8eff7Heqb0obu+//kl9+Ausb0AhFfAKvjh98fF+bpOMS7P5zhkUIISn+Xh3eP98eCmao6jDapoc4UDAdoTOuIqSoXSq+RTTZMrAZD65V0fp1F6lJeOvAQiWstzL+Q5tDpvgJdxIRRzQ79FesAVIcQITrHLkuRFR1FQMwCR9lvUg61EaERJY4URoOIDKfpTNQbzhgzvQoD3UsZ8E2UMkBEAfGXx0RVEPTVxoGHiGKmOFrtA19BxljaJwgG9ieoga4HAQ+0YhTHXYiEyDdaE7XdK8f0LJsLtsbwo7tBdpswz7sFwlBcVbhW6lHaRnIg21h5bgGPDZNF9u/8+NhRpQiyIOUqzQZnQA64YWFsSRfZaV2mx2GKN4lJwOcKFlJkCkI47hUkKDGirODEfaNl7pxBhKChpz/kac9F9jS7yJyrf1N3W33RiH42wZIB1ig7MiDjG6ES4OJ0EK0+bg8u43/rOvb978tzacMf0nEXNrtS+0he0EeCHFTaS4Siu1iRx7P7Rl6i1HCqe+AAhybmfti4SLLVzfUEqlvDxPy1QeYjqu/YPHN9P5FZbX2ZuEN3gTTwexi8e7yalbKJkbVZmji+4STneqQbwxbOf1wta5Pbx/PgruTIQRa5m80zgEYmk4tJXW8sa6vjks59LuOgkhesp7lry7y1XU16mvNLgxjDSS3O3Mw1fjgPP/9+3/bn7Lf+/r/0VpjwiDCQHpJ4ZJPwGY1sd7ERNh1GpeezuuD2priB5bO659rdOoMBppfuw9+2xOrpPYgNQP0p64uai6qbV5xd16WIt20LpYF+lKuMIvQz82CiWJIOgl6OJejAnMpZhI39qkIRGeM0DuqmJBdC9FBoLDIxET0iFO6SHrNg+5pb3th0lup+o4shuoCIGVTKSR3rV7CJjCsc0jbRzbvjPuSeGT9ACz6DqwH9CnGPkBGtHpipjCK/0ASyOS4u0OSRT4RNPdbf70FjmQZEHZXrPx+OnKvQIcfRgD162j7ANLtVmVg+HavZRoEeyxTRvhiR4b8iwdOiduh/bkQQtdnJYCsdeAEO4hDzpX2tnratVd9MoinYTDiHz2lqjHjER3WkAWLwBXr5bOcbv1ZW/rtsYSxgHdWA5MgZgtwkIghmt1OD84aX2RGE0zpwdAgc7Am9uL+de4vvsv//dfefivAXzry//Zj24+4k9fOgVomNuY0MIlUIpOLHUube3l8CQpdyMmubMYtQEAs2see25wOtDiEkyw7XbKNBG7MO7YHDyyT+xO6th2I0btykRMnLx20TPKGaqI9PYm0mpBIYIJ+5d22Ra34dpCq7A6ZnCjbMDGsv3ZT+YBNuZc66Uj3i/CcWLGGCNNBERmv/czyoH9TtaDrFVXEska3qXnnUGctrsKd/Y9NUEQRcy8/jUhJm6ngZtA/EveEQyX5sUhFmo2SVdtZBMJlEVbmTJIWs61rFJWRmMYNUuHi9t0a0CZSKd0oktoZdNy5mMTaQ9v1bcdy8e0FVREwy+Pwgi0h/uP/s3vHN5/PNx/4Wc/1tf/7pMF1l1mNX382fs//9e1++lwz8DLNz+eX/1b2hLtEbZS6twepzLTGpbX6GeEv5sy/KmyCALe0Gxowe++SSDsaVXyayyiPXLDU8SZeOR7D6fjw8/Ql5G13U/l/LOXZZ5sFWvTw4/x+BPYOqLZAYG8PL3+6PzicZ4S4mNdKCNBJ69tD/Phxfzem8M9t4i3nI9widAIydFbCXUR36+eKRBbNU5KCZ+iT7DJqL1Im7QpXUZVyFnPL2W5Q5thNbwgELZCDrR7tBdcNqYidgexICqNCKUJfcpKUtqRqzA0YoIqvbg5ONHuNoG4DPQlG7iG9JBMEQ3XYHhoD1+9UDyu4ElQQAecfuMXJ4BYF2huVB7yJqbHqAGeva5e3QUmaR8WA41h4l3cKU44zHXxeo66UPtwEEeRLtKr9In9wJ4bW7wlruyprLnZFFqV3sVMO6gUq+yz9Fk6EQtUt6Q7FZNBhPQgSsKOk3gKtkETR4HP0rT0VnuoQB2li3YiSFcayIC7C5Pjn3F2GjvkKQ8GGVOAjHF3ciMYX6VPfWo8vxtt+Yyug7eG7W39hrfeDbodF81YnOw5E060PO6CwQD22M897uyyc1reALErPgExBN9xzoxgMugYcehN+yK2oJ8YLjLTnDodmDv8QQPqLm7JkXCpeReln7Wf6MYMXPWmiIPW9x/r1P1uPd2fXpX1Fa2NB+0Gb7RG7+ImnxjrCgTMqMowwUa+chM3obt43wePIjpsETd1n/uGyiXfaDVF7xLBY+uH9cx+gvdAcH19d344Li9fsUJYux+Xs5qFr88me2rvtDDP6ShSthfWdp2A14bQap3e6Q0B8cb+ABDlKO2Rth4RAKod1ftxeazrSfoCopRDMZcezjFdgYC4z+4AzqVgo1kSuO9N3SV8WpvaKt5BebGsTfU1qwt7pzTRrKj2LSIbuFsmxCD2mUIsE+r2yFBzwiVE06pOWgA9SkHvrmWkptGDBmngsmEWbKudFHFkm56eZLbpy1BEAAf0O1kPnBrVRMyUjCqWnL6tJckVuum2kQKxIg5sB64ze07i1Mik8pjCjUzY1ATzASND5tft+2NhzGyz9Jmt0PLNtbOSs7cqkPQRy/bJ2bav2O3DyV9W+DnKGtqHenQFAg8G2F25D+eFPj9wX3uWnCPIIfXlkAhtXjrdQ7oV8xoj6JCPdqjSF6s9jVDXwzdXAYIeghhtkgia6+LFhBFcvbqXGHbHX83xyPDPbM+9rdv6XAnEiEI/oN9JO7C5CMN7qIi5WLBcfcpIJ2OMvl0GEkhqoc7Rl5vaclufV8kn5O33ZyAPG3K1mySLLE1eptXKIUSe6Ba51zjcJLpIdwDozKbpjt0VhuTMFi9J5MIgvNIq7IAUSf2e60RzSbHByYjAaMHmqTbkHCUF4gLP6hub2/eyAefhAZkFF8NBjGEinmF7MF2Fl/ACLxEasWvEfqUO74gJXI7q43yQTfG8N3lCnPBJmjDuZJ1h198ljAKb2SsN27fM0tfoglDawl/FQRxBW/hZhNTd0jVvAvEv0BeHiyRCelQzd9foRVeRldGUFqW4a7EQOOtZywJZxJuEsZibjoI2AnqdyZFJKV1Ciq7Cxr6S68N+Jn6iEQ/hOD7V/uq9nH72hZ/+y5fTi+nNn/Nteu87Vz+V13/+0ta7+SVAffgxHn8ambsZATc8NlKGLvyZfGZ+M/LTMEoDwAcP57/z8cP7b34up5/D18vDWF/Xx6LtRG98+AvY+UlK/fpmPn304vSFx7s5raqtS1Efmh0BweNU3hxfvDpOc1lDtpmREU0GIFxBOEoKxIPcV2hFmhX3yUXZZrc5UF21TdpmaZVWQlkCwAtdXnK5Rz+ETfA5rJANcgi7l/4CLTNDDZzRK1IXjho+s1fpQp+lH6QdZb3nKowKb6rqPtE8WGn3XI9oiR0EkAT6dTMEDUwKYEGGGtxCmpcIuALqruNZDwcxYoW0kDV0jXKOkhtSCseL1yVKC41QuKBTTNI+7D0xEIATLu66RDlHWaA5taqwqr1Em3Sd2QpigmdIncIrrI22LPY8wAmWBXCijl01GNQuMgZ5wLTTq4NjPxNz6aGAiGovVxO4e8/zwHaUtejaaoNrGsiqtHRSK33oDCNoJ0IC6qIC8XFOcDCgdgkCSHVYLG3Fv0axavIpP/K//Op32xpv6ze63ya09ImA64QHh9kTYZIpagl0dYrs+3S8pfkaWZ6Ychl857s6to/eXetTX8VW9CWskcL2AKrEUVSn3qpZALWf1Vomkkh4AQLQdmY/sy8MQz/DDdCyPr6gzn2t6+N0/liWV9Eety0paJ3exbu6l0tGyvMH54YIugklyEgp3I3hqGa0fiH4R8BWaY/z+iA5IgMU72t5caJm1qg2m9bTcDEj2M/z8vrl+YMu0kTuWrtfHrQ9IC3GV6taYw8zcZfwoO3EuUy5Hrr85ezY13QNj9fXHQi2R4hSD2V9cySKmXiv7URf6StYqq2HdSnztCpBlB73a5984KUPvZ9Nm9XcosT90M7iJh7qnd40rPjxfi1GnlCsiOmW57JBTLY077TtkCWyYkrYEbtIp2Z468iQ4P7ququIdZSaey59EHiDfRB4ZaXGlvq9TYnGU61ynB1y/CXZglX6HN1CPUQYso1sGrhSNPI1JjZwMASFfpA22sYYDmLftqeMs5thM61Dcqeb4fLkfG/KqNIn6ROsIlF/zzBNkVTmdZN0A1DalKiO7dPTM6MPo6Mcu4N44JQQrp2VgLnEhU8I+lvu5RGZ85Tg7LJ6EYSHmBe3kt2eHnK23kNaEqtC4CPEcrs3GZbuyPj47NvTAs0K8g6TLxG/1qYX/lntubd1W5+zEjgO6ApW2MxuFEA7TcW7ODSuRsnzswYQYuPCYMLH6fB+Oaq8xg1DfFufd5n4yXqxLG8ONd7SHq+5ZS5y4UkGzLjtdnvaLeGDYLZ/qEYQqsTWSN0T6mIoA9sg75H9IXxiJrRfMpk3BnEhY4nyGNOj17OWzfP7BAil9ILBICYvGbOaSIc8PNB1JNnGVcb72Ee3Ya0LUMsgfUCZ2EN1Owhh5BvtEfY4wO7YDtmHlqbiszTZZ8BIEBpRmFpAABDGJL24zWwGLfQqPWif+qrlYk3MPos3xc0mdROIf2nh6mqmgMIVXaURTbwJGaJSM6rFWRdyZazS+xCIVxezHP1/cgGii3TXJgDKwlgFDWhv3r2D/qrv0X4ur/5V0Rntzaf93nC0N3y9lNPP8h6e0hvil9mQ/was91//7Ev1x9P5Z2xPUR7rI9ylPMAa+vm5/G1nPX/88vTmZ+vLrhKKqHRnBNNQIxJr1Y+PxzZx1gjZZlHGNdgQhEmUuEqeARmFXtTO1frsYtLniMlYWpE+STvIOtFqqCLIeKmn97jeoU3hc9gUtkALfKbdRbvnmlJ0B2daoY/SFzFJm7QLfJZ2lHbP9Z5N6Q3eIEV8DXOwoN9zPbBP8CvEhDToVu9JKqMWKhHNi4olfiEYUcJ1DG/bsFBxvbIPn6MEWOHnqIvXx5jOXrprOojFhJ0wpvoTMTZUOs109XKOskThRtCfpE/SZvYDe0KZ91NqbksO1HCHDPY/XRmVVqSTTvGA8LmTcPDyBV6kC4PiocZw1V7ZBZER8JniSuAF1ztZZ13P2kIcdNVWtW/jQuGgQVUMgaCnHs6N2JHhTvuMdgpY0qltnzrCJ02d39Zt/W07ngd4neMx+KGkMQkyxGi1JtZ//H1oj/Iu3ffTfXLSkDuSKaP2hX2hLdGXiE6QZUanioZUK7PaqrYigtZAQKrYQnexhf3M9gi36GeStEXam4oofZH+KMurWF5f7aQMb0hmsZu6v7uCDmRoWy1pXaFbMnVJQzWDt7iKLqCtWF5VnbU3EKaTaj10M5E1RCMOSysXxDBha1le35/euMiipZqJG8PwPPATYq2aNVNP0AdFZJgx03ydvuZLWWKNYbAV4XRHbrsk610AFNHexF4DQc+svAWxSJmnbofWjdWV9Cjuc1uc0rVIxJje2dzA4qFuAOlGaxCd1nOX+hIEcaraNNuKkAgOht9oFBDMnD3pAhNQNwM7s1NPz/ClURlFKGC7RlwQHuExOnoNugwCPcF39PM7eN6YfchRFQSBA/os7RC1R7MQB4UxSztsaeMOrpQAVkj2QScaEVX8KO3INsPLJhDXcAMXSoUVeBnbFib4jOeM/gqf2Qssc2xy68zHV+lT+MOmEz1juLz9lQ4SckJpoRbikOs0PJi4aSBIuMuAHNqFMuEaEgzdug7Ak1Sf3KBzl3UJK0iBGBHiq1ULMVffRn2u0OS8PFhxd8k0oWRj9Cjw8FAzDVc6Mwjhtm7rtpAOYnjQZ/aDNAPhaOxKIz1pEimHZQmcs+MS0E54+okFUlAO6MsnpcXc1m19PgRishyin4b4FYHAsdtTDXn3DfJc6tzWx/mwKhEwS78sqke4eyBM4AaX6AkkAzLcLk8Yg9C0dUpztIhR6RVOxhH9hHJkn9kNYslH2uASefBAwKKfvJ5YT1GnjZGUEu3OgKr0wsvk0Aipo5ewNCznyShDlDSiPD09XxuEDehgBxvkjHKK0kImXiIWdqW7jk4vFXHPdifro9ZCv0ObaZnCszmqQ2GVktnvFlOBT2JLuG4eZ78xiG8C8edEEd4Kgr0vyvACAKayqjSJJr0pGFVCCe0BB5tEF2/Sm6pFdRcPG06K6EaAKgkDgBi0kaFloTe9P3e0x8/oQudopwGC+JW+y5ahC/9tbJvUx7+Y67/m+grP7B7h6KcBnXjbHB3O9c3d40fvn770Zq6Li0/bBZYjpA4Fp4OyBNVDrgrDrBxdoQ4XiAltyMrJcadFaX2uNMRkUbtom3RNq28afypNGO/p+T2uR1giJhQ+ASvkADuiv0A3MoAVOtF06yKmYFphKnZgO7Ldsb3gqvQGc8gEW1gcLLAXbMfMuoE/E4gtxoRKuKTdRuG2aeFewmtYSYEn0klUrhzES+gSxcEVePTp0adT1MW1uya8TIzSkfRhN+km7hvX36V5OUdNQRxAYVT2WeUg6wG9vEUNrPAVwq0AntKlBT9Ke2RfxDx6AAmp0LHrcB11cQgjp1pcemoRVfpEm9nzAbQROocSfiftIO2hNAsnvGpTeqFlMGsEQ3rPalkiNFwjJCCjD72dEwBnmIA+DMUOGnOU6aYP39Zvzbb7RFeLAJxMsAuJYJiYiTsLfFxHOS7hu3c19NN/ZELEzWQAiD1eLIvaSlthC6LDLPDAMKgJWSgSxgj2JVnIAMJ6Ei5oK9sZ1sIWWAuS65s0CEMr22Msr2FPxxi90xu9S5j6uz/tjFRf2U3yNOYOc3GH9Jh6p/en+3W+TCsjXCeNZaa8VBGPh6kW9/vlpO3xOrSW/XxYXoM6l6rupZ3QTvCnZwBr2pe526PBjGqk0Lcxg7BtvqRfC8Qd4ewLvMMavIctLAe0B/YCUAIhJUSlPUo7IQxS1Na5nY7r7BQ3TmaH3uk+eau9tVKrTbVFV9buEgCD7mpNEjHhbYKAMvVKHJd6Z6oB1qCGi6RqyDHXQaEDYgywaxAIShfZBkvppEtEDLFSLDA0Yko4ZYBJgA5pIUY2yEoB2J6mum2uH145iBMxwSP7C64nlk7pIg4q/Y5tS3pJqTMpRYmt8Fmahs7Sj1zvsksaruElRplX4RbMhLqaaKYtdG5IPxF5VDiwZ066jMJPEogx2P1oBk70vfwrowP9VPsOWUID6MEeY+poq6iRs+fplXLfRk5BZPsnQNuC1T/poxsMl/TZj1TbrgNDIeIyuViEwFS6yAWPvPdZ0zus+WlKF3WEREj34q7uBZYsrl+dMXFbt/W3d0ue4Yr+Ausdm5EQLFGKGMWDg22e2XQ0iA+zvthmOaREmSGVUsJvAvFtfS5XX6BTlCPl9fWXD8004q5d3HL7DhrkWspSZ6N4Uidjf8c7nGGZUyejcB6urU08EGQUTRD7zHGO9ma/dt5meRUx0RpMEAbmHK1v6qoF1ygWbYlyijqjJwwq3UcEhKj0doUp3CZrkfVshVfmdHQoooTXDCeIQZu8aOPDSjwAknvewDifxNjE865mWEXMsAUFgMCP0u5l3c42we3eMBpRUUa72mf0R04Kn6VvMKtfzle9rZtA/JtY8VQpTsf6sN43LY1caV1aEzCIUkB2R8Cauol19i5T89q7lrIa3HEFMWcY3IRdSjN3cJXW9O+c3ryb6vtrP4lfDwTxt9hRf/6I5d/heTm9X/U/+cVvD+X80fuPrxkvME1LE5BD2COIYHGH1DrCx0AIDBtgaIQiUSldZcSD5iBJ0qz7ZPBAbSi9aEt1+E7aQboHG1ulfyCn97DeRZ9jQOUZOMDmsDvaPVrHOKxNsATy2hhHtUlaETtIu2O7Z7tnK/SOHpCJfY1ioMJfcDnAJoxpZdsZxNAx3JqkDBeHdGhR3T8lVuBlRBd7IBFFK2RFWVDWKGsUgzD46PXsxcE1ao8CVxq1Uzb6sHXpXYBwB13CpcVwEGcOvNJmdhceZT1IV3gAyaoo22wqrzLrslpOC3C+Glm7FumFVmlKXyKdX+KgAFVs0hzBrhGo0qoMdRhb+hARiXu+k/VNWbqrMCr7JFbZPQfiqYSLMxBpuAgNaMSWppfvjjRfeOoRRuGI+Ljhj27rt2rbjdi2yZSTguFwyIbvp3Vx3xzEgZ0FFNepy4n3ybu5Rvs6gcgDJ40QR1wC1iMojuImfYUt0dexL9gS7igOUfGJS2pnhghYA8FkEHtHP0U/D2UZgYjoJ3iDNapGO6WX9ulzNniCeq24z91OtTzTyMThHVGSILw9FYd1mczm3hj9+uQQ3tlOqAsBiY4AvQNQt+JH9X48v0F/3L8lvGN9KMvrA6TqzHBNq9fzh+ri7dCa2NFd3EMswresTQcJjye0dLGV/Qxb4R1uYWe4RTtBlDpxBRDUQ5hLvji2QqtImdb5bjp21SDvep+sFe8J9OihG7WPstmWmcF5yTsGGFbXB5WylDqv9qjFgqgSgEq+N4JKoZOABDNarstAE3fSIImYCMAIkcH+ct01YuzhgTEYxD1DY0jbSyYgI19ilFVXgObtTJkevTu0I1uT0kMhjMxK/QSdstBn9kI/Sr9HP7JfIyZim/Gc4DX8gD5T+SSkbvsFISqt0Gbp9cIEfHL81Q3if+0PqrRZukMAZDi6gx0K4IyyIh3EaYzgJcVmwD6AdBD7xT7MX2z2j9wNNTLI0QW9YBOCQyK0jFN6L0/z9jiAFZLvU8YmTOflwikk3RVWnia339Zt3dbAywCStUMXhrPSCrvQXAKWIXUQyxTZbfrN6TbGNEJq1APX2zjybX1Oz54MCwRklLSsh9wtinuQk/Xa26rHlFVssyQF6aJv9/Rzz3Knd3ERAO5bSF0AhEikiTgyp27rYSpcaYW2B8Qd0I2cYQ29USOUO+chpA14pSxRTlFOUQ4sFVZ25hcAYKJlIY8LgxgYHjWkgzhBEyU8E33q1Xa4nQqGb9IGU0v61gaO7SHtOUBbBxgKzOgH9CP7Hdsia6Hfs2VLOzBazQJXDvIUgUKv0clJM7ZOrEdz2u2dehOIP4dlax5JgSC76Cro0rv2lq0helDVAfSm7jSnNZl6n8yq++IaTsg47ptzmIKcbFSDN+1NXjy+uhGa/op/lR2/HirOO9fXx9OroDix+tEdIokagkgUDYNrcRQkg5gMoTuEiRcIhVoiJpRDgU0WT9FutUUotCd9+CDrUdZ7WQ/sIAystC/w9ALrIfZS0AGU8DnsGP2OvUGMklbZknnyCKUfpR2kFdpR+kUghjkZkAnS2C3GDMgBVpDTxSOZvUH7iIgZumuEOCQQFmKhEQiJXsJLKINEh2xpqrrG+HOOIhEAT16XmCKwenVXuKR9mJ1uYiaWuY4Od6oRJn1DTKRxSeFHbfQ4SiImfA5LaVg31GOFN0jyv0kofILP7JPYFL17celjJ6YTkdAHBxeUrOrJKGI5BZTVeBabbVCjEsMfR7Y7Xe58adTcayfplb2HBCgRRoGAHkZ3sSiIEtg4VukKu9SlA1kVFx/lzUJ8W7891SiepEslCWBEgqTC63QXdxJeGAk6GDfegukAjEBYPm2SOmGgXh/jt9PtFvahvYkttCV2v0IEoqEDqtBKnQHAVoYNCTVdUW6wJez8hMUUDmtwi853s/sjaI1u4l3d1ONtykTSEMIYjLSFuEs+qNKt9hX2VMyNQF+4vkHpDIRWaq3tJGHFjG7T+oa2XDlhAnaW5XUBtRwQLu0B6ed9pidam9sqzZurGz0RE4Qbk/gRnlOW2wvswzUM6/BNxQ6DewwQ3xsUo3f0M+DZSId3sXVeT/eipmXq69SW0peguJTaW7FereYVdG6LRI5apGOnMUxIekc5HNfTSy1duCTmPcQ1SAqHddcBOkVCO6Uj4Qr0zOomAHrANz0xAsXzVwLCXCHhYcMaHNIgy5bLuu1ETIFY4c+0151NrMAMu+d6x7qydFEGDZzZD2h57V8hglgxImuVPokB/Z79nu2IPoeV8JIEw3DLh0TuiIlsHm+CtaXus0LSrVPhqRT/glOwIo7sBi6he+wMrqi9BnqUHuohBrmENOwh7SZgGSzghDB9csEOF9AvFur8digCMGVXaUJPgFRYG/Iuu2jmPzsHsCae2ZJ3/zIQEl4CAVeYwuRJHsBt3dZv/RJghhXwkX5kWyEmOkUvNJFt2D0n5h1DIM6pOCcCLlhK7eWgUlEO7Ev4zQh4W5/7gygLgMN6eqGa4N9MdMhD6WYVRhd5NU29POm9qvtk/YzJnb2LiACwPjLlxjE3s2n2TiV35kMUetk03APsDC2ImX2FRDCjhnZB1iHhWFEUfpZ6jnKOkpMzhO0Pi4iJXjbqvyKEnjFFkmF0Wzzdrg7nceLqAMAd2rTbh1vosiGzPLbMhAvRaXx73uc92wuuTVRplWm3zHM3ASiRA9P72bzS5zGFFaOTLTeB+CYQfz41Yk+QqWijrIwm1kRawGBF3ESK51UAzjCqxWFttbdiE6IOu1P+L/nlxiBJAWhN7cz5/Or2Sn9+1/qmLh8fpJjoR/3gG6EnT0ZaSKEWd/WQvD6DCBF3y+ERA6Ay2PMEhGO0c9K11eouqq1qO+pyL+1e2j3XO0kTK2f0L/L0MtoxbA6b0Qvc4R2cw47od9EbtaNjq9wM0kcV6hP7RDui3XG9Q7tDn2A5sjqDm7IcR9gBGW8qK2hgy7HZkVU6xjYjxF1CzGJMl4ABAdQphvGj5THhRNAGXaOs2eoMWXxycPHSTN118CUMNLrRjNbFO4mBmKBJpo0voTMFQKUf2ET9juuBvVycU1eb9BXtLB1PE+0g/Ri9R2uqcOzqcArfSyhz4IUoYlP0lQUCoc/SjuwHdG6RQQKU8AP7C64vZHnQpVFB1LzPCGE4QBSlOwiS9KC7hisRkSUqN+Z/JGIiAhr0vIxIuPzKWXHe8Vklqt/w/Lf1m99qn/ZDwrm1Y+jGbkwHsQe6segY+bNETzw1ALpR9Ck4Nd4OgR06LQLqXvvGl3hC4A14QzuRgmrAU7U3PybJr3d7x1MaKW2f8IS9IxrDk0E8dVuKXszQEbPZWTQc3pMYNHga4jE1097eFQ8Q6AvCoRPNpY/e3mydYbK+eX6JsDXW10KGN4RzfR3XCvJF8O1TX6ZurampUMYMYwTM0+BLuwqpk76gndBXRH9ybxHwFmHwld4RAe9ha74alCJ9ru14RwlRhpfexFaAwuZaj62tpQJltl6tl7aIp6y/0jrgbI8orohpkfdAF77GfIZ6dgwIkXT0itCpAWdeh6WTgHYwewlMWxzdJOhQXkzEoWQEBi3It+3SwA41WCA6JIdXGuRaCm2QLIS4+XwLVBkH2h2bUYThYKHp3hkB182hDKDA79gi4gXbHdsRljGtiqjhadtJJ05FTLApzLYRth3TLxuC6Sj9iLYHtGWc3YQBqlK4bt0WRQQ+UdVdogBxRmmhe0hdBuukwdCKXMa09gCfT/poOEFBkNcacQiMMGHPiFkgUmVXD254kKf3mThpl9FEEiI4RP8sTDfBmkbpTCrYr7bnJpzttm7rb6FUFgUxwQ6wI3sS52ZOVUyHlfAqcsUTJjM+18l5NxGXGnqkPkAEt0PlbX2uFa8jt1OcutXRzN6E3R0xQUDjXHQG+9X2bsYpXD3ogNOdCd2yjFa+MIiT/pC2q9jyciGZGkcr8AmmiAPMwRl9hTrZIalPR9AHklgc4ZDVy1nqGatEkCgjTOgy93OlF+PiIAYmjEJYNo34MmKzncpTyV0hHRLXiIktNCC2EcDgQEwk3HKGrZAJXmD3XBul0BNlycFTzki9yFb6RAOQJ5BCI9BDqpiD66dnEOeO/JmE1N3axTeB+N1viWA4R3fHAVC6aCOb9KbW5Hjuh2ZNZZm0KwHW7jk0UM2Oba3WqnW1aM7rstecmqHkAIJtkfnsury6vRc/v8uaLh9POlmZqr0w01EoERSougq1eFdcwdwBhsg+ySsqXelCxwYAOsp61HX14iKTtkn6naz3utzL+oLrPVvOYR7ZvoDlRbRjhrPQJ1gPmWEz7BDb0e1CfMdum6nix+gTbbMP93v0aZsnTdK8Q4iY4DMsNiqQQ3pIy3HR3C9MQEAkQsyVSdNOI444JPNIY5iMCIOsoauX1bVF8aCFLlEQXH3wJeAJIL6iDxvREZIhdRCnua5RltAOyW7nUVqB33M9oM/o+gk4lZ21lBSnSpvZziyTmBCVfZa2F+EGDtoyIPBJWlbmCj9IK/SyzcFu1CRkX/Qll5OcFtYACj0xhw56gECn5JlAMxxP3QrFhn0xj9R5qRntVCf6Zor8NULqwvhZJarfCBe39ZvcdQMxAADPpdv8dNh+fQg6hHQzgJKn9ne8W68SRX75hh8sbgkgjnfgzgK2xhr0Dp1S03yqZ/Ww9mvs4BGdbmkiBrbjNjA3i1GljLm+QGrEI/5ZLQ69a18Z/ZnqHW5MxcothV0B6FUg9M71Dfry/KVvp0jPbwRsfcfzsAZbSjsfWz/5ZA4aieEgNh/BrdGvrlbe4B3e3/GyROrmPqiUgc1f7NErrWk/hRTXKm7azxx9dQ9RGSD3KJbHLZP8KePPCqkE4a2EA/E+IR7A4Qz1IAvMQArdSTpICRjVwlI57YkKZiDEseWSEhEwgXpqxO6KEW3ICOkhHbqgNPSVooikFcnzLWlDOO1eHmCCH9Dv0JJBbC7COLBdK51+yW5Dgb/g6sA91zu2A2wakCeXjYkMxBSmlPTvFPieiXe9KuMY7Z4rNiKhb8bnGX5gd7CFKFwZa+j19274/pwZKgXuCSAOsWBgG1EdiFIwQdVjE+Xu7eVm/I+n7RxcCuf8CEgAMEoTbVLWlKcYQlOgjLtKY9W+byZIAr5NDMT10QDYDe8mV9F2v+rMToivt93ytv72rXQQB3CHfs+1h6zUiT3JbGNAPMCgppHEwSAcYZKBpS6yTEe1NrU3lAm4tVJu63O7CC2Qgnq8/uqU56WARFgmFXDMmTq5Fl6cr8F96wmDGywRE5m7HjnwFuRGyOJAouV3ZoDNni6bDmJFzLQFvYXkDp62ouHndUFghZ9ZTqF3UQqHRWzaujHJnHwWijAi6eiVnnp0jjopXGNE1WWT2PZB+mFnYg4JtRAHWogHd+D/drDBBK+IDXpZDrDOZqTSj2i6J/9uG7NszMaZlin3M2wFhSFw5fNQ3F98qqav/CwEYt5sUjeB+B2Xif0/xseRDGhHWRmrtCZl8fcfTy+WR6cspZqWAHS0nqgRh/Uk3iczRoQzGz8bSxFuSSRnOPsqv/P4BuePb++2z7V8sbzWclfr3XHtSy1Rtg1BQwDSWc1LRtvssxUODtcPxYWuNIGP4Uei0I+6puNmkjZLu9flTtZ7Li+4vmBTmCLu0D/Aeh/9AJthGaeCC2LC7sKyLrUxeJL+pyj0O64mnGB3bHfod+jH6HPyOBEGJjoMiBJRYA6mpunACm2hFjrQQDHsNklO8pAM3EOxCFK9SCfDQjr0HBwO4tAWukbxkB5qYLfSvLoVuIqRlvF0YkY3csXcrBeGk+ksdl29rFF6SIaxHtHyGR1oNaFFCMnomXfJxBtiyQqtis1oJYwIhVd2pQewRslNt9ImMTOBdCBSj57Z+VaM+wH2gu09Wc6oi5uDQhciAj2kUxh09HAGKUMgDlfsGes5ixc2cMMRjC45yBwmqYvdCBO39duy7Y7r4rXWyRhna3rGvaZZVWBGKOQvLcwkQheOai5pH35nHkY4bI0E4OItf723d9mHP8XPdoMnf92vjh0ovllVIg7dzkWJwcknIB53ix3aIra+4+eGh+XjCcqEcALUGhB4Q398F+zC0B7Dswe3viNuPhze1NZjW8UO3cQoI4k7f0FON7Bf7pl9iWehfO+UiZ99pa/sJ9FJqeITI8QbbQ2pIUWszevpTrX4pHuMXmSTzeBtADdsJQm3EnaIoKdkeDyHZh6EEUIKSUZ49v63jG8nI28xKqEwgTjAUL/SiCNiZLN40EJaSCfbcNlEe+vKvXuHd/Flo0zEHfrKlq6cLuoY+XJvOWxjZl9CDXKgveB6h36EZZ6MbMxQi1RfWSIm2ES1JPW/dcwt8ErXcAAzrV4oE8y7yiGkmeZPn06hBwzALF0YPeSMEsASpUHSQXyVlw4xgnQKthFZPDlkg9jauZ+0nAyFQ0y0URqHQMwoQnMCkLSBJ5RmNz7tcwMuEE+peuTUiY98LacY1SjGm0/jtm5r35JLbrbgI3RlW6Az+8SuYmRKQ6PqoHN0WUziitNqWkJL6AQtoH6mWTu3dVt/BWuDER/WEwA18/zK053LhEsVE1I2NjEQgcnsbu2m1beZKk8g2eb4SeMhBCGxQSnHF3JHrhzIxAPMwAP7OXSB7yJp5FiOaQQNuhpWtsXrIiV13gIBSmYiDUTDphdn5VvgngeALcBgICYiCrzG2P0dAAYyGdchdSEdukJ7qAWnGO0hbM9s70bvzyI7xUq/R5/C93tLB/HMHlHzsQGShxPhOIp7SOFNq70JxJ87YXB0RMWhjWy0Jtbk5Xl9+fjquLxC+B0lqOOgS3EpoIg1AMVNYhBF3SVRxQC6ibhTaJ2x8P03H6O9ub3bPterPbK9Ke3+bl1fHSffEHskWJwM10jYwV7mkKG02FpkJRETHLMkM/rMdieLKx2c2WdpL/T8YqjD6wu0Cq/wO/T3Y72Pdog+0yZpSpMwd8xRDtEP0RfICjHm6Actc0hhCp/Q73IWlf0Y/Yg+bzuNAyNPZmSP5jzsCKnrkDW0b4O0o8SigO4mVIkrPQOaeAp0yDn0wEQYyxraoqw+BOIINq/mxV1hknwJJH3YiA61qBZEdBf4QEysUZYoHRL7gC3wgusBfQqftng6jSiIlReSEQf7PyZamoiP0gLsIQCyLSkIbJl+uZ8pvMrgGhfYke0F1izXA0jERD6Se7T3uKwsJymGMVHr4AIVaICFKnQyVJxiru4Z1ePkfmJIWGIQAQfERqxBXKb3buu2fit226s/dE8sC92YAWjeAcsuFUG4w0zIdwie5lQgjHxGmTC+/aGKIDyKmXqDrdgMh+8QNK3FOz0F4b/WJzXS90o3db9b25uJU0fTJ62uYnEIB3EuohG1BxHV+rQuYku8U5gOz7N9xDqeSV9IhHf0TxBtcy7PG8Lf6cemNennuZ2Py30v4mQH88V3QzjZ47D4X1Y09zXWB+qkZIQBInZGOMMdgBS1XsyCVqzVdmI+077AWniDLeieuy/d6L1EIPy9MSB6PKEkgc8k8QWkBALSZUOZpGt4zEqLwyPgDAZdQnzojFk4ZXkHOqRBz1FWthWiW1icwOsG2rsOjimb/FrhngRr9gZJEblDDuiVNsN2DLFv6XOVBnBCv8d6hz5Hn4Z92HNyc4+IKQhNIn+48x390wqf0Y/sDdy2wicrEROCeCoQX26sl7PECK6x0NHLuUi0Wc4KEBBEjARK8F2UiSCdT8zKKfJKwCGd2qgNCRqOIBiljVaqPANE7A/AGZkFlE3kjZxMl/xX6ZR0H9+229u6rSuBuMIATZVnZT+jZ5hHoTGPqEFmB2hcOTNEhG7iLmA81qn0Y9GD6JH6GP0mEN/W53jVw9ij2wk4XFEaQEQE96CFUNhVJur4MERoRDVXiz1YOKe+cuCWG4Z4sBkv4cohjMph5p0H4ilNuH1mOcMknIxsS1vAIZ7+NMbqZYmyRJloFW6XEFgv8A65PvUJUOgWrJuDWMYTCkXs6vCVGL1PPtG3yeMG6aExnE6MGCIyN8JVGZcD5t3eo4NREEd02aCrzougnAF6AARxYDNwH1rKaJ/be/MmEH/G66OPPvrRj370wQcffOUrX/n0Veqzv4tDO3e+hK64P50O54/1/HP2NfJNTkJKSA2dXSsooKr1uds5s7wCZkMjjoCFwGCd96d2OP3sXSTB2/pciRce64NOp7v1XPr9us8hZl63hk8RujuII32p3OcVGTN7SQcxQGCi3cvqway+si3/kstLri+5JgsiIRJ30d+L4SCe0Ao76aTX4DQEYltoK6xDFgCQtmXgTLAg7tiOaEf0I+wYNsO2WRXkNEfse9cWd26QBmlxhZhIkJ8IQgLhIUMjFweDYipGRAaaL8ElyhrDQdw9O40lguYlQrAJxDSGMe3D0nFc7a61Uy0t06iMYdpc11ALAVHgE5zcU/Vcxz506Vvuoy648BZjRr9jAwjB2QuBREwovIUovccowitNtrHXCjvKWpk/BVudHwQO8I7+kmunzEz9mgA7SFQZSUHWKE5Ruoi7Wmhxp0QQoyKNPeUWkI1+OqATt2D12/qbuX70ox999NFHX/nKVz744INPd4F9YiCMTSM2oxnTJIo+XLThgNETeJPuwPz4aOwcBjehOkFufVkYoe9WgBgxWYet8PYLfYzxGe/U4fSOcPFe3Qho4O0fUNwBHAJEzN0OvZfeSj/T1l/yeMJiPKmhv8I/2YjxtqX3yT012lLauZjRaqZcR16pDDQUi3p1579mHlEEbGU7QZSjKMtBZhdbHECZq7WgiLt6RwTD6P1CtNgU/Ehys3sJB/AypzJ5bEW6wIUuFERqGSIYgEzjuNKn7msQowtIenpYUoOlgJ4mYgf6cBBLFk7c3DoCVHhcNSC3r8ceC3OH3sAZ/UgaJMA0cqf8muqwgQtkgSb1aOZa0O+R7V6bYgTLZN01wSPMwG10VAq9X41zlu0QovAje8e6QMq72gJyFTVTaREsjHKFotpXC10hq5ce6ttWOGikAfoAuWROIAKDihybv/iiSaUVUUK2AXYfoT4IaId2SGd0iS0dUYjiHgImicITjx3AJvheScaJ+GcCsTD4LZKDVDZ+6bd1W38r14cffvjhhx9++ctf/vKXv/xpbp9hGwIa/Qjr6Oe84GTYxpi2yA8smNu0b6GhebJVNlXTYtNR2z3X1zfKxG19rpeUPAGKd4Cln3o5bqfEDf23n1h1j5gDAtHHfwdRLHyNXi4J5GnC2gTVjbybs+TINPWosHT7jjoXMNgZMrPXqJpZxZGFIwGkQGyujWWNsnpZ2SeaQSoGQFkZ/V3HXoXX8Wcktypib10/PfWOjdSHYiA9pIc82Ve3J7aH1AkincJGdhiAe3hFHGAc6vD4rjxLTjTZkvQyK28rw0dg9e29eROIf+X1zW9+8/vf/368dbj96KOPvvOd73z3u9/Nv375y1/+3ve+99WvfvVXuW/mRUGM0sFGb9Ka3J37/em1nj/i6adhK/Jn59iATqxHrXfQ2XUu3tWcPoIvUyPeQBMRDpz5pTev5fzz21vtr2j957/zn/xHj//1//fw9/7F/Pf/svfVH9FPUztPZqvLnkYaJbyEVbj6TrAjQ7K3vl+O6YWhjBkpE8sdV0hUegAT+kR7IWs6iO/RXqAdwmbYfbT3Yr1Dm9FK5rCIRYiGTN4PsGP0NXSBNWRGHhSS5V+lC+LaPnxEn8M34w+vqRQ5JaabubiFJoM4xhgmAAl3iIRHUPJLIylcTOgkLGQJBdEhPbSFNE+BuATEXT3zUU1oQiOc7uIm6JxXe+98PrYleHzwkrcJl+6lhfYYgycze2Hcoc1bVGtSk657ngVukIKo8JKQRzbfB9gFhE+03MwcXKLs/iFlpMpQaQe2e7aZPXPwemYz7TUz/CXWEMxRV0gWxg0SI8qKK61QO13pQoN4aITFZrUgXDwhiZvOle+gCIQ/nbe/rdv6PJWav/u7v/vtb3/7j/7oj5790w9/+MNvfvObH374Yf71W9/61re//e1PJRPHll61y5kJt3VGJxxz8ySfr6SRlIuDeA8PuQTTjWg7yFXq27t4uIwAHdUM3sJ+wzHrkYiJHXbGiGq+0+Tv1/VtLXvu7bA8lH7GOxETbym7n83R2jv6Utr5rq2nNp1EnBeJ7bDa1O3Y2//yP/7f/fd/8qN/MX3p11fSw6KfKeX6qYVUSEG4WCuUXfWjLfQGRLgNvsTlARvijHDCC3igBCWob6byoNUV4YRENhLgQGzwd080oMMpHimsRnb8UriMjJjh/sfAFbpEaZR1yKNDJB7Oo3ccLnPkxYOc4EfYyCUnHALggME1SnE5Z3ow3MeRwKhD2GAQj9zTUfgJBn1Ytx3QIQ5mzaYIA4GoI93Oy9CCaeAZo6Oi8Eq2EGzEZCIm9LQ5X9eQBgmghZ6jtr2jHFfeK0/IOCQDfDf84vjXdwPE9zc8MZxL1A5tRBfv4qOcBBmMzB4krjZT7opw9l33t2tKW1vsejJBpEMsFe3bpntbf9s25Q8//PCb3/zmD3/4w/zrV7/61e9973u/VCbmSNEMBDrRwAP7gX1KswvdGZeeSjCcMNmn3wC48Fz10abDMk06RZnRH3+dyZLb+pxUwX+rV5Qj+ynKxUQs3hWLT8ftgPpUH8qTglwsSRIIYOrduLEPCfFoyR8kt5C6cXYYqnPG2sNTGC1wbqkACpngmUMrA907QurM1VNjhiht9bJIOYT2EMPF56Dww561E9K2jFxhVNqmEXsJ1xht5mxd29ZUjm0KaktVHyF1Wy404+q1Sem7bunx+UTurhIUjjFC6jalPBETtgRTJs56fGa/OIhp9da5vQnEv+r60Y9+9P3vf/+ThOMf/OAHX/3qV3/v937v448//v73v/+1r33tz/7szz6tlTi4p2SIQTvRpTf1lXen8+H8istHsT4+Lzi9oy/0HtMLUNTasbWPbfYy4OV7KRtOdNyf+8uHn+EmEP+VrX9x+Hvv++lHd//+Z1EhG/uptNPc+0PUsSMIXMMqevXQGH7cTSOuF+dQVOmVJvBCF8TEPm0hcgAqbKLfcX3B9R79Hv0++gH9GP0++oto99EObCoNpQWdrhqYRA9ej7Al+oGyQixopI7Mb8zpIEa7gx1hh7AsKZOHMap75hWfLbTTJXLkOh3EYjuAODcKF3hAwl1EHABpIFWsihFhkA7FlYO4h1qouQLiVgDCFaZ0SlKGh3047tb1uJ6L96kVsaM71QgT89KijJqWNtEnWJbHEzz9U8+qusz/ya2ubH3R/HNgB+Bg3fJb9yJ8XPVo2fed0e+53nGtsAmemm+D5H9nOvwLgMBMX7LGhJxQM+yuQxp1TfwFTWkUd/UQCW6FcWKIsSFWs7XA8GAERgc14tMOsL87ruvXla5u67Y+Yf3hH/7hJ+3IX/va1z744INvfetb77///j//5//8u9/97ocffvgnf/Inn+Je+dRFnHxbRKf2qD2KJ14UTZWWoIm3WsPy9rs4gyNJeSdagREUj+KdtuI3LRCPNBO67Z9c9Qu8ZzK7ftDqVvsqbtP6IP0MX/EbC4aPRlu0n+/PD6c6NZ2bEAQNpXs1f7Eud8vp//Pyv3P3+JMf1f/mrx+r4AZbopE+Q+suiwdAipi4VvEdGWxwS8QE3qZ/JDdjcYKFchCFCHC3VG1KU9JF4eIyIupwZRHiKIbEEGBEiIvDCQlxmIwiL/EJMdAQ61MH8bPVQAPLNukyRl4ijrQsxowNwDlKsgj5tBrdtiefYXew4SAO20rKSBl3hRJRwgpZ4TW80j0cHAF020uKwpjgM7tsgm92izk+SVFhIFpco5Mjw9aztMuouiwje5amIR7DQZyv4sUjHJFWJRc+i6RzgdiTjy1Nnv6V4pAGdIku3mVEwzPIkMBoy2JM3ozvCm7ujB39TzrHvTkYkM7hA98naX+lPTT33NtueVuf1035o48++trXvvbhhx9+4xvf+Af/4B/8y3/5L/dy+Bc3blPcKeABvQVWZjJ2n9ErjfQYfDRcjMPOcLhJYsGD6CqrlrXOczmUcqQ+hJ9uv6y/qVXw3+4lJcrxqYkYskUybMGqo/2Y6GHR66CYkVGhEcfWuGloyV9YVC8dTeZWGFchddmRtUqviIyYm8KNtoITrNJ0kJsQEHfxwX4UMLqXda+4IR26REwbseEyCcTYqVB6pUfrhiHeSmbnOFluBIntNJ1RtB3SQleULHXj4oveYcpRYhTXNTyII0Iiy/C4KN2Xk4aTPTEXAYIdUeSS5xQT+qfeZOMTOGm39dshEOekzA9/+MN/8k/+yTtv8IMf/CDV4X/2z/5ZfuX3f//3v/a1r33zm9/8sz/7s0998hsOYjrQ6V2sybT43elNOX+EfnqXHckRHssbUimzWK/W1aM/1a/Cgc662hcfXtfzz9HPt7fa34TFaCftp0NrjON+bfOCXsOrI2crN/RdoWf5VGlgHNgqLVHrHFdnzFyMHHEx8AP7C7RUh4/5/9FeRH8v2hFtklVKQ+kAQoL0EnqIdoh6gB7CF3jn4AincenARiDhEgfYAcNxXCJ9vAjQgpmuI8QaohyC6abtMi60hswEz24H3TVrLxEr7Alh8OASuuQwaGiP0l3Ni499oQBA3wHEhNGN1jk3v1/P0/ogEZOoWLizGMXEQ1uUHprlcarDieAoMH1LHd5Ptzv4f0Y/cNTwAteNtvw2dbHSCqyFKv0e6z3Xzao8foqNEeAI+DF6Kv4z7Axt0LQPB8PBBlthVayGdUgRoxrUQnS4mZw+/lygwxzHB2wcy1j//v8w6v2n01Y62md0+L7lt97WW+uHP/zhhx9++Kd/+qc/+MEP3nmDb37zmwD+5E/+ZB/W+drXvpbb8de//vVfeKbjzgbND29GP8MoPebVXqxtj6RzTicWd2CjDIclHyd+4W4eqe+941rhodboLT4JQPxXp7t6Z5h8MtuBwLyetx3Ii63aF7HGvtDab+4U7B59YT+Xvh7XddHiQifpMXe7a+v9+XRY3uj6mn2h5iv5a/+sDlsADq+ZFghoC4CQKtYyd46Jxg17Bpd4rt95w/qaokXKgWrkm2nqpYYhJBxifXQnSN+srTkhw3BKDnsZHSHYNGJGkn5jl5FDnFhDF6ps9p/nT2sMVCafA3sf9xA9GZ6WQ6ibtTaAFTLB+sYgxmDf9+PIm7U5bAovMXxAREzboyoRB/SVUhAdjj2u7XK+jyO6gyfodYBejOhzdEiF6Qgg3G8wcm9wxaBooYuXgZjY2f47ttABQIMgTAMKgF7S5E+kQdufjrZeza8mAiLhEui0pr1J3wViQEHZbVz/f/b+P0aOLMsP/c4590ZkZv0gs8gmm9Mzmi5qfkLa3amWVitAz9AULXifAOm5izBkLAwIzQL8oMV7gEnafwgyLJDlv+QHA+zGE6CFBJjVsmAIz4bJBp4BPVkQq71YrC0ZyxpLO5rdmR1Wz3T39k8yyfqRmRFx7/EfJ/IyGFlVzZ7t6WZXfT9oNMhiZlZmZGTcvOeeew4r11WgJulZkUlIWevocKwLSkikepU6Pi5MrL6z91dW48ypp/9cUIGAFzy7g/La2trW1lYzs/jFF19cW1tbW1u7cePGoQFizSh6ZWLqUihsEsFVhytr78w8qcoSiSI9jg6HRhIx8yhzhc+iy9V3yeVUjRC+gWc2RmyjjlRD+yoYfNdVY6K51vdCFmV64tsi6+Nvl061W1ZZCPVHwLkiF+uRa3kQdXrtJDpsNYibEdtco6PYUy1Y8vqHdXw66iRiq0IkqlRRLCcx4kpdYAkkTEGnPtF+Mpn3ky1E3rrlNZKonugU/UQrAX5cYoIkqJTqhLRuIj35FTJ5fUSU1ZFuC0lPdjWplWXmSRCFJu3pHl92hEtrbGCR67O/9rXTz3/7qTbVxkjliMrPYpsC9jp8GQPE6+vra2trh9zg9ddfJ6LLly+nnywvLy8tLW1ubm5ubn5SEnHzE09sX0Eja+AYuFOGrCo5FIfV8rP2LFynIlg3jkkhCrWiebYrc264LeOHisHyl+bVt/7Z0u5PiejK4n/5GayghpKrcRaqeleIqIqGTGMW1UfyFUsQiU5CJlXGVcbBsVrp4Y5UPSk6XDkKGYcuVZ7razGTOiJHsUOhS8Fak1sB4jkLhmrZtcbBEiZbXomVnISMq46GDoVcQ4dDSVKoeoq2VGiRTWtlY8UlOho6GrLHGcQUmEXFikIIqdVAtJY7Y/WVOlVHkSkQWz5QFIr24m2+RY6rXErPwSov11ti1cYSK6xgiUOOrKhDEAkiFVMgjRyjSKBeUc2Mhz4URORCKVFjtOwsjtGV6mwfqyPtTXbXphITrFb7SJvjx6RI/+PKSj2ulGiombB2iMu6xRBFFWuoytafXVkp5BS7HHpcdThkFGhSgKkiYYrZZKhzFL1qRjHjOKZY1LNgCxC7sQbLU/YSM40iIUhUiRZbmVRxtnxiq0Lz+Iu1lWokJdn+4Gn3ax9aRfRTBq5w8YC2CxcuHPKvaXhtlnK6fPnyxsbG66+/fniAePJhZZpkIqT5pcSYh5BXlYtRRSoRF1VijGq1big1nrPaoyJEpJbYx1azzbpopCpybHeKRC5t+JAYv6BFEaVPiEmrDyURSQwSS9bIoeBqyGH8eXeE18haSayyEHyMEigKiaqPsVNWviokFP+vN/+n9Teuv/h/+DP8IqUYVSLXOeWTKl7MddVmrgsTT3ZX6GGZ1KoUSi73xOVeXI95ttPb63iNHKIoRYkUKyGJYhWEUpUoG98qYj/JK45kMWJyZE3qokpUKdU6qWZjrsYUbNONDRBUp+VyqHuY14VUbA+m7W6piDsabCtPJO42Kvxa8Yr4+BwnYfWkXQqetGN7aCjmFJuZQULCk90z7vHE0sKwVBHrZApnN7CaylQPgnV2s9VALIlFmVmEohWEZhv+08HVOofaSmTEFEdmUlG1+oFUf2NRVhbLUta6QlVdanjSGGG/L+M8KWRMQWKQGKw0ucRAzFzaOeIipyFfmElTXpNGVdK60ES9QbfOGpbwRAseIuIQ/Ps/5OrCp/j8KqaR8IwOyjZfJqIrV66kn1y5cmVtbW19ff3wALEQdTR6IttWWFLocujZt2KpvARitRJ0pI+DSZORl0QiOY7EBctOp9Mp5+aqsS/3uCq0wprKl3YWfMSwUxYlIddVbrSwmYy4UXwQH1gqYfsGKbLfxCsSEVXCFbOLUTQKhbxSIqqcqyQVdiAWYqZYr6IqNYstcB03bnxV4A6FjNRz9ByFrS2djWd1KNvazFshx0AuNHoeMGmH6+Ep1ZewF2b7h3yKVDf+e/zte1Jg3OazNv+NZJEI0cms2b4T2AxdJsWdqO5WpzlF26DlNeZ1vWONdQ1iUWJPmlmFzEkhCwtkT1bTiUnDR4NRfPB0C0tKGjAoH98A8aVLl5oJStM3sKXU1oz05Zdf3tzcvH379uEBYtXGN1PR4FQyohAlBF/JeMZ9fHKBw1dn2PHw46nkXyXJKJuLvYWqu7DXO7Hd7VZeyNkclepQcer2iNjwl2wsERJXiSMmEWXR4DVkqnmgvBRf5H7cccWMG8+6UZerrpSeouNolXNnuZiXYpbKHlc9qqwYvDbapApph6ypaEzjhJBG5qASopMqs60vpKzBaRRS5rrVabTLfYdCRVxS3abGGhB36iY2dYtzq45sUdGSpSQZst/lbIezAef3tfux9gaxuxM7Rci18lw5qYSVoietd7JGexiR4LnsSjkjxYwUM1J2qGKmEWlXyo6UOVclh8Ci5Cwsw1qPOZNihBSZKyfB+SCZii+yTnDMk42qVoEhqFQqUdmx+npy+8SGcmUuJ1WfS5KCpGBXkEuDpaOYU4jMrD4Q22oNEY2ZgkogZqKg3i4CJemYJCPnyAvVe3siUWDqEqtSTkFIs7oqv3jVnOPY3ju2OLsrSUp2Y3aBuZIyk7KSTDOJyiFaDjaJRHFWbXmyR49IJzU9QhR+8DMOY6J5fP7gi5V25Lz++uvTxZ1s2H355ZebP7RR+KDkplYoSFlVlJyyU+eid7HKOCrvaVaJuBiVuRSpvETP9sWepdEnhFWk8Z9Tlmi1ZydlY+visbbZvi5Lyxodj7Nu13XpydK3n8uQkkXJw6SWwtjLZKeedqu4m+ezRTHOu6TULfaUnbJjYgmlupxdh6rxLzOuLSQWPBR2meZzVae/25l72OvtdXzIrSg971EWmcaOe0X++K69BS62tSo+/e/07Dvqe+p76jyxI2IVp+JVsuiyKJ5ImJRjxbFizsh1KZTUKNOxz5whBg6FxNKFMo+xU8VR5lQpRgmRmCPFOplVNaWj2ndACqnGUitFnbVuU0tcktvRLNPKU7TBoktEdXC23gia2dYiWwnW0KFoVZJG7CJRUK5YKoqpkH2KERPRJEyskyiw9WW1/zSwROWKxEpMlGQVFKRgmYSnpSRnRVmsLa211CtIKnochddJMWKaJPVU5BrhUwpqM0MOdSnDqMQ2V7T4rFjXHYkqkayoYeSgaqUr6lypSX5Rs/rw/rV/rbCwm6zpiDW/q8s4MrFVoYmRmGXyQ7WSD/bHx3lN/HhOHev5d50H/rhMtBJrmb/1/+ZiFVd7OAKD8sbGxmAwWF5eblaT6Pf7y8vLGxsbGxsbhzTm8RrntRDikkVUK+ZZcnNUnuDRvBvN+NHQj6s8qzriAgur46ClkCg71sgqHFxdQW6H8yAnC+dOissl4+HHVO4hiANfsKyrnYUwc2Y4c3Ivn4kik8Kij5vLld6VWVZ2vHY1y6I4fbxbJQUkiWLgwDJmd1+6EqMVWpIYhagSGWdeHYmb9CWqm7uTLTOX6sbqR+pH6ofkh1xl5Dyrr2tcSUlSqC/U18MfkeMQ2DETcSAi5igSHdc97qyTJJF2OaTMXMdKShYjdvUSNdVfn+smcGxVMq0Acaj/mrrvckEukJWytDjw44Qs27RkO6jG5DzX0e9I7Op1ZVLmuiGGctXI5bKF6kAU2kWe1dtLI63e/Wj30QfIW0KA+JMd3obV2uNM38B+8tZbbz3VTPXDd8Otf0rKHDksvND5yyueQ8akyo/87Ljz9YWZfn/wXrb3EZd7FAolZp+RZDGbjd3+qLewMzP/qNMddrPQIfYqonX6sLCVF62Eg8vIdXCefWniwz4PrjPMMvK2PB5DpjGPmpcuG3f8cM4P5/z4pOydkPEsF7NSZBQ813PCGa5mqexRyDVkFB63iZus0Smxp5h2UitRRVywG6mOyHPoELGPjiWQ9XWPvp6bWcBUtUuVRRejMrMWJFJnG0WxPqssRT3x40BcshTkxux2yW9zfp8772vvPZ37MMx9HOa2y5my6mrlXSm+ZFaq1KLCTGILntFz1XXljBvPu9EJGZ7gcYcCMw3JE1Mpbuyyccwi2S6WFMuZNDevxwsaZX67N3siqjLvdnsh445MiltMDoX1ME+ljtJoYsN5JLLRK237rYjLSaF9T9FawFtdRZssVkTBCjdPGgEpSVCOykLOxuZC3Zh9l8oxlQVLSSFQpUyidZw6m+RqZco5Rcd1JlfFUrAU5Ap2kaXgkElZuDIoK1HFpCzqSEq2ShwUmQJr5BgkRo6BoxJVHIL7nLe9A+wrTSZTu5smG1v3HXlT//SDHll/+Ach/FOuZFSJfv2v5F/7DaeUURDR0knlpQzedshbsE2cOqfOIrzp+swqQiwqEtkpOyUXqW7j8bg1lgWWJNot1TmtMrfdm53vnHTFQx09/Bw/bqxZN2S9cTazl+ejzJVZ/Xo4TJ5DnpNmM2VJPENEEmNejonIW6JENabPNhuLhSRjcSqeJCPnlZ3V5qs689uzCx/NndjrZTFn5+sKr1XGO5182M18NZMeZtQ/39n7mIttrkZaF3fWQyPRnsWRy9T3Yj4X8tnge8Fl9gZbf7kgLlo+K5HTmJUFEflYOa04ZBrGB/4GVQ0Fx8qareTF2He7FESZyWsIzMQsJKlwbl2pgJQpWuU/ngQZH4eJ68meEhfqx+o95TNa7jzOjuEeVdkkVShFij3FjsYeVTNa/2tXg7IGkpLiuJ4s1S1iUtEF25LGTE8WJq5nqpOtLRQnU7uKuKy7C9SB4LHlSbFO9gnxkNykdH6Ko5KVSK4mWUg8mSxHrW9ZEVckQZ3Ncy1xf1KSOHSkLMWF6NSJOokZV8TK9LiiMlOUx03qPvHLuIo+Dh6zrQmpiIqqrXXXXyBUVUmZhe3bQLMwpFV7VLUEcWHl+tuA2PQ3Pm4XpBXRdIYYwJdzUD58Opx6ye7rw/d3/i///K6SBOZT5078j/7z7xZUjrjYkdHpuHff7Q3zzk70IXJB7Lz6gtlF36hH7K2EWpAqkz2fFfnJvbyz0Jmd3Zn1ex/zeKCor/iUxLN4ElcXH4pBQ0lafTbfVdiR75DLSTyzkEaKlVZDqoojvJeQ87k4c3bn5FcGcwt7vV6RiwqnAvyPhw8hdipeO1nlXBSXtsRMpqb1OiUHL1Um41zqXbY2MKsqsQpxRj6Lzr6Xsk62xXBQKYMfumw3dh5xmUt0VDcrzyZtb3YoK0lKsoLH6iW4qEJRJKiyqghH27LsOXoOnmNGIW9Eh20sdaxlHaBuFHQj4nqvkthKsaVvVSRlPYetZ7IlyZh8qS7tcHKTcT2oFOpKdnvk7ZdaZVabGpNacWE7d5VZY2unYH0oWe3rXeOHnlQ4ZBLb334AAeJfwJ9lRKRJUoN+9Kfh9j+tr8zf+XX5z/6LKJIJdbSovB/n2Qfd0zuzcye2z87uPfTFHpNG3wlZr8h6e52ZnW53lGdlJpqR8yqu/sCrUlRSZdtnX7mMJMN59mWhrhN9Z5RlLMROyWnMVH0lvuhmwxN+r+93F9zeadlb4NE8F3Nc5hRsM2muoaOxS6FDwas6irZBo2KplK0zuDKnLtpKXLA4cqLKrF3NiEgD59E5rrguH2yFF9iqv3e4ipOLrgVBMhJmyrVuYkOTKkJKEokr5jH5Ibsh+23OBpR/pL33dPb9MPdxmB2Us8OyF8tcSu9L9gXVuzYdh1hPG5ljJqErxZyMT8iwLyMLEBNRhz0RFeSGMR/GIqorrdKRhU9tcq0UlWNktjpNPss6XSXe7XTqELyo1h8cDiqlWsvxNiv+EJlLEtvnUk2GtJQ+XM/SWW3DTqUSiIVoTOxIHSurzYFdpRzUkVLFrmIZsxtR1SNXkCuoqriMxEKUUXQURKN9l8gpBuKKo+V1K3NJMmY3Jl9IGVTGXHVdWfiCyCptaBAfnZOKxX5TxVyxBOZKqRJVoUpClBj4yz4sXr9+fXl5ed9clfX19TfeeGMwGCwtLV2+fHn6ur21tfXaa69tbm72+/2XX3750qVLuBB96UbeTwwQxx/epR/W7QHkNyk7/1eYgieyRODKaQwcU/qFqBNtflmvF4l4khQsSi6So7og6qTiW91SR9lFUq8cLVVZK687nXzcPTFT9LkqDpi1Molr7K2P9X9/tlmf+l7IesO8u93Ji0wmfZtJiUoRIh556VSRiCjLiNlX1SyL+KxH5DVyNSYNFIrP4P1jJpdTNku+G11HfUddHiVTccH50nd3OzMPZ3rDGc+55j6kALFGDpFjzkV8PK9698zX5vcWZkc7nfEjKfa4GlIoiSKllmFKk2ZurOLJddTl6jtVPlt05od5b5h3KtcsHECTP5OL6mPsOT9DUUIpsWTXIR49USygPXgHCiWFkYQ8r4qZoqycjNQpcXRUkYhGEmVp/L7JsBEt61yojg7X42ecvFNcqRvFrOOqoWaTSKMos6+jw2TFiKzeUaZh8q0gZlpvFYpEFYeCpEMSJuuakWhMLv2WSeiacgq8zyBYd8wryZXsynp9VMrJBG9IPlAdUrWSF2OybgESGxVYLJ1HiEuSSCST+G8kjsoVuUBSqbOWAEJx0qyDiEg4CsdMquhElYNnVbuFcHwchLYy/VQXEP6kL12szBydRs8clF1kEXHqVKPYSjhFZdvsKqRRWXjypFPYm4lESYishJQ9nyj2fUTqr0TMSuy+9Lv6BoPBq6+++sYbb2xubhLRysrK5cuXW4PvYDC4evXq7du3beS9du3adAmgzc3NtbW1tB3z2rVrT9viG56xQfnFF19s/dx+cvh0+N339/7J//kP7c8vfe/5//w3v1mRjMktsHtOhg/c7tDnZeZHUSqi4F104jy7ymrlMKXmdYFd5YKTMnODrDfuZPPd2ZM7J3u7H8jeh1TsPm0JtSOMhdixeBKpN0pYBE08uSxKFn1PfSc6p8Ss0VWFVCMOYw4lx5JiSaHUWNHjdqtPRt6e+IPWTdZcxq6jvheyuaozP+70yqwTWERjVhXd0Y4vdlyxy+Wu1uneX9BEhB1761jLpJFCqXV9Lf7Fj3bnZDn/lQf9FwYnTg5nMs3J+WhpfMQkjeglcxRR8Uo+klOaDBCcmqwpM5EEdp5d5bwXjRyUVVkjaWTbEOotTVBUJrvJbeTUKFFlHLO9mG9zJ+PgKAorE+UUI9XBgbH6FMx1HDxXQdiCAKrqOGQScq5yrjoUcqo41f+lQJPqiI5iRlw+2cq5Ih6T5CRjlmbctiQesh+RK0jG5HbJD9WX+rgdAtVFJIhs/VhlrG6PMvuaHonKuhijMkdPqkqT1vHRfm/zHeRJseMnItdsG3/V0xFpimP7NlI5+E871bV6fTaZeuWVVw7Z/4EA8S8pCkhExF//jv9f/K/r3XUz87FbqRd1LifyWZTMVbnf6XaHM518tOCqilWjuCiu8q7wEjIixyzqnDoXxbJRJpNKZlWmIFw5ry5n8RggvxxcXvlO6YWdimj0FHzkrMr9eM4PT2U7Z932Gdk7w3uneDSv5ZyWOcWsrsseMqsCoVZVp64GWJKMydXRTLVlMrVNplynEUnFMmJnzXIqlVy91Gt0UtU7PdWR5hqJK560UmWijIWUPGmmjzNqAksgtWTbIfsd9jucPaT8Y+2+r7PvhfkPq7mH1cxO1SurLpWZG4svWEomIicaPcdYl4YQipmUPSnn3LjPIwuL24DUpYqExuR3ZbwrnVJ8UBdiXfSzLilog+ikysTQe+70AvM4dxb9sQJndTScuCKpVCK3egMQEQeWSdqUKPGI3JBcQRIn6VRcNw7SQKKkwjGSxPqNEGvUbkXxS3WlOiUu1BUsY/ZjrkbsxuwLKq0Uc0axx5JrsEixZUTFentOZKZIXJAbSjmKviAXxELPrnCOSUuOQTKVEL2PwXGQULJU4kp2BQmrKGnFpXKsmKtPdfHSz/I6+FlIJeOnB7MLFy6ktJeNjY319fWbN282Z6q3b99eXV0dDAbpr6+//nraUwlHhvz1v+3+s/+CAnMl7sRXQ6aOiTk4UXFRnMRQFzSlOlPYKkg83rJnJbtJ1CJB6mNdI9xp5EbXDFKORIGViGOUwPb449zt9k7kxYKLFY8eajV8HPxlRy5j8SqexLNV+o6VhpJi8Yv322Em31XfK7PuXp4XTlSorqtDRI40cMHMgYl47J1EzWIsRVSkW5ZE3NPoQ8GqVDyiUP4Z52CUdbVzQjv9kM1UWbfwndLnpfOVk0qk8FmRu6rDLo8+i95HS+e1ALFXjpEbgwxt97t7M53O+ER3fLpXjLvFyFeFiyVpZLuP/UeqJCo++Dy4vMw6e53ebqc7yrIyE5XJfEGfuMJJJBdiEHExuFBJGInLyWUUywPfDiWNoZ5OE+Uh+KDsSau6jRmRMEeJyqlM36SNRF2Ul7WODls3WpkU8Y+iwpXKWP0u5ZMKv5RRKNhZfb1Uktip5tZZjkKm0SLFFUmmnHPMNRZ1n/HJeEQytUyh2ZO93EqWrpJVCbSp4OM8X5JJjNiNScbkqbFObF1brb3MJBG3nqlNUp5ZiApimxYGqgs9lSqTADELKbNayQtPMeMQpFKV6OoazZoyiOs/0eNOkE89wde6MIWyqLiogaM1oxMrC0Ix1qvrzE80naun8tY/qG46wMRRI9exZBF1xJFjVAnMn367jj5LSXaDweDChQubm5uLi4vLy8uDwcB6hN68eTNNOAeDwfnz5y003O/3Nzc3L1682GxiZsOxle+zUdse5M6dO1/sjBQ+T9/7Ru//+F99q4idIeUyN9vTqiQpuByT2+W9h66zp1kRfVQuWKN0Sudi4UKpkvZFKnMkCcwhusy5Qksvo8yPO/O7ve7czImF7ZP57sdSPKJySGF8XHojs2Ofq+uwZCqZiouSqcvVZcFlUerKWVGkctk4y4ssCy5TJ5Hr6ZAL0VVVVpV5VWTlOC9HvhxJNeZY1CNsCl7GSJMCVtRboLlzxC6Kjy6PvlvkM7u9uVGnV3aykLngxbY4S9CsqKSs8tFofu/hzO4DP37E1Z5WYwrFk4V6P9WEQshlLI6IKFQaS5pUNNrnku862pmL2VyVzxb5bJF1IouLIa/G+WjHj7eleKTl3qc7Z1jYd2O3Pz7xlQ/75x6emA0z4vPgs+izWA8T1mHn8cY0VdHoKTqN7nGdosdLnhZVjiwV+1KdZ40SI2tgrb8XkRI7IfvKSpOWGLaCQipBXRH9Xsg7XDmOTqKoClGHgxKV5MbqSnpc34qJnFiYtaRIzJq7Mucq55BxzDhkFHMORGRdiGiy5lCRpCTipK5AxeJVaFLAKhBXXH+LKNiNyZacLUBBrS52lTrHsSC/q3mquxGYU91LTyGnSKyRONcYJxt2+cnIr03zy/qrhWYcUv3M7NMMsqqfzUT4lzGur66ubm1tTQeIn2aqe/369Wb3tfX19daojQDxL//SbVPQ3jx/9y9TVpFUzEo6Vu+C82NR1xE31mwcfS5Vx4+qLFa5NlIVmDWrixvWU9l6S4LW31pVNTIH4dJ5dbm4XBEg/hKcGUKuU/pOcOIkstPKk/oorpjxo77fO+t2XpDt52XvjA4XtJjXYo7Kjgbbs+k1eopPdIcjLljG6myZTkgL9lUdILYtpVyyeFKnMmQfiIPapO5xp1HbHCpE3soSTyazdfxBRZlFNXWwCZPO3iW5Ebtd9tucDyi/r50PdeZP49wHYe5BObdT9Yqyp0Xux86PWQqhwFaeXyqqW+sxOYk5VzMynudxX0YneTRPZU6RiEbklHnEfsfl27E7jlkVQ5w0O+V6AZbTByc6KkgiZ9FxzCj3kUXjpGy9EkeVSl0rg9ia7EVVi/wW7GxKbFNfSygOk54/jixDahIot8+2kp8cnEhs7YaK6ELds86NKY6lytkXUpbqorAQdbmqiJXYWrJmFOxhg7JVegrEI65mqBpyOVYXhCtyo5j1ZOw4lhLKWFXOh+CjOg0uZD5WLhZOhT0px8ilkJJU2imDPuU3sVB9Zlv2PqNv6pubm1evXt33n65fv76xsXHp0qUbN270+/2NjY2LFy+urq6menmDwWB1dZWIbF5qSU/r6+vXr1//AgdF+KVcXJ/7Cn/3L1NgDhIrripVURF2Tjmwd6ohqk5CkFznYtT1ZiYx4rquv6g6Cl6DBYhFVfTxdMa+nwspkWQklYpT57XI3MPeTK/o92IQcTR6xDYRYlGXk+uqy+wLvkWHOZTMIy0j6S8cmWXyveB7o7w3zDN1zE5dpjYAxMiTzftUOCYiqThGJqLSyeS7ynwvFE5VKGo5pFjVH1v7f12emVmcxnDYIrR4zmdj52ToLgxnFvY6M6MsH2W+8i4KhzoJltlrlgWfReej+MgukmidRxNbexYpnwuhkr0y26syX876MvoquBhcsDckuhhdqOssVeJK7wvvC+/Hma9yJk/iVFKItpFzrJGrSCE4JspCN6tKX3UljFly5dFhF6764JCvxp0y73lXOR47F4UocCRiZpbJvGBSjcRmtcqTM83FyfLmZEqjUqp49cMYSeqSwY7UupvmFKywr1e12VpGsUOhp6FLoacVMTPFQFSpZBwzCp4kdbdrTVfS3Iwb7StsWdSrEMW6uDCL7Q8tWSrby0IyJD8kT0RR65JWqTWrTcPoyR41QprV3ZatNU1dDzGohMkm06hOOIpG68CuzIFCx9J+iKNOPnustutWlVPWMD8ORzdeYxremZSVI1uVicc3nmwREKd1J9vH00KyDaoy6QldrwjRpMH8pO4jiVIU0qhRrI42RZbA9j3kUw6U4ZnaJn/16tXNzc0rV66k/mMW6r169erKyooNrDYRvXHjhjUuGwwGL7300tra2srKiuUIp5H37t279pPNzc2XXnppdXX17t27zWq2cIT1T/L/+K9mVTGzW848pN4jrQJLpdazxG3Lzp7zReYC8SPiglUlD6LBC4dJLmJ9rWEXmEv1Pkrhgpcql71ONuqd3J3pzQ6fm9t71B1uu2KHw4hDxbHQMKZg+bDNsNhnS/cZkX+JlCUnK6+f9ap8vujMFll3nOWl95Xz6pwKR3E6KeujwtFxcKyOySkLMU9Gw8hWeF4CuSq6KrgqSIgSSku6mbRNIVYttmZpm4joozN//u2zv2ZldKNz0bngXdlxMSPJInsVCSlYMQ5eq2yvnNkdncz2zuWj4exwpzvayca7EktrAEChpFhoKChW+8fT2LEV0nR5dN3gu1Xeiy4jJV+NfLEj5ZCrIVUjrR+B2XUomwn5/HCmvz1/atybCXleB6+JWdWF6IvKD0dzO4P57Q+ynfe1Gj7NOj37jnYXipnnHs0/9/BEf2euwzPa6ZRZHjiLmsXoyLa5qnscILYUJnWqTjWt3ytRlEmA2BZC2FVsKT4cIwfmumCgrYMzsTV0iNxsBqdM6kLICg4jjjsxOI6Oo0R1rF0qmagkt635WF2hrlBHRBlXgSUwkxBzyaQdKTtc5VLlVGUUmSmjmNPjEhMySZAQih1OxamomhRuiPWeobr+QySyohYWHR6RG6sbk6//Ux8bk9JKxZEM1T8RNaaqQ6Fj0eo6NZjqbWAa0+TdPblYHCcJztZmtsPRk+YUPkUGsUaqRlp9FvXNP+v1KosO77us+4lT3Y2NjbW1taWlpVu3btmmzIsXL66trR20NxcB4v3ZwZqux2Q/+f73v/+0owYTc2BXOamYVNUFlwWXhY6TrnNj8R2XjWNecqycRmo2vpykOOrja0EkjRyVJLI1gVamwvvgcuc7VO7h68gv1595MYhdHl0+zjrqyTllF9Ur+ZC5Ys6NTrnd52XnBdl9XvdO6+gUFfOxmNfSLm316iOplXrQSVfQsbo99m5y7a7XLietPO1Cmebd1SQtqFLLSrZNXGxJx7mGwLZ5RYXF0uncZEo0aVSaih1TwTJit8vZI8ofaOcjnXk/zn1QzX9czT0qZ8qqG4uOjL0fsS+YStHITCoSXVCJHJTtC0xHqhkpTsjoJI/7VMxRlWlUog5HIhqz2+bOQMZ7ko85KzkjSt1gOO1PrTv0EZfC6shnwblYF1yqCyBaTWErgyjNqXK0DypxXVXZcqasSR1Ja44tRM0h0za5FhqknjlLpa6IrlBfqVgTVccxU59zVaivxMdIXsIce8vtEtJs0gPQnsxk+4yMqNrlqsfVmKtKZUyhwyU5zTRWUpbRW0JxUBeir0Jm6QMqnpV8xSxESr4MM+Onn3/Gz67F1p/1A3PhwgUrLLDvvw4Gg7W1tX6/b9Fhu25fvnx5bW1tbW3NJrdra2uDweDatWt2Sbcb3759e21t7cqVK5imPmu+//3v79v3xkbep/oSw2TJGlYUQhxFT1KpE+XA9RVj0j92khI4qQzLqSAARafBa3REda8QfRyKUqbIgUWUNRA52/kTKZPdbj6oTrJq7ryTnMKorlTqO9HlKt7yelgrCQXJmIk4VqrhF/seyS6PWa/Ke3t5p/COMnVZ3f/E2nCpUKA6lZiIoqeCmJSq4JRyImLt+M685aOwZFQVpBWl52NRcGZiYXa0b5jYKg5ns7HXr3oLOzML9+dODHNfZRIdsyPL0RYhJ1FcdD46H9lH8qpeVbTeFkjcumDks4VWEoKESmIlo+DUvuQHZWWOllyqFmiNwqGeCZM49T64SdsG6x9mawMWN7f67CpUqOzFrFN2fJiTauxcTuymOp00LmgaKIy5GrlQZFXZrSoZ0nYnH4qvh1JmYU1BRaprEE8KED+xGvFEM5UqulQHOjKzkCPKNORUBa7HX1+n0mhHQ3cSHc4pqlJGrEylxoxjptFPqthH5YJcVu/Wpsmu1Mn2IHp8qQ/EFYs9raouUvF4lbQkV5AbW5UkFevIqnXyr235DPK4LqGm8dFNGpHrJOk4TGo9BXIWfRAiz0SkjiNNaj11iKJwdKzKwVrFxUm1jih1dHg687aVm8SqQhxZWZU5OuXALMoSRURZxRLY631IVH9wrMrEk8sVxFR3X0/FhoXrglfiNAhFjizWEO9Tf5LjM9Rra3193QbK5oRoZWXFUoAvXbq0tbV1+/btxcVFiw7bwHrt2rXV1dXXXnvt5s2bRHT79u2tra1Lly6lmhJLS0uXLl1aX1+3B8Fg9yWaDq+trb355putn9tPDh+U1YUwt+d3pRulCL7Uul2H7Unf42zkdkqyPii8yzrmGCUn5zRKHRSzVtaRXBCXsxQqPkopvpKQS+jIXjcfFvmj8Xw+Ll1Z5lWRl0VWjjrFnlQFx5I1cKgkjqkqKBQaywNa2z1lbNdCkBm5rmYzKpmKlcqLHEsOJVVDDQVpdehjTq7GLCzeqk6pBophn7oHquQ77LvquyGbq7pze92Tw05v1OlVua+8CxlHX7eDJan3rzzeF+VCJpPlcFbmyYaFKGpDoXIVuIyeQqaRqZlMMglmlp06g3jnuRODFxYmS+l1PS7vK/GBs0hOddK2jJR8RRSYKqlKNxx39sbdnXHfjytX1uO6r6qsKjrFyJdDV40llKxRYiBVFVHxUXyRdYu8N857ZZbFrBMy23zEROSq4IoyGw9nRrvd4a4vh6xBxQ27J3ZnT4xnZsuZbtnzsUO2Gi1SEZMqh8hVlcWiszecf7T93Mn7z80/+sDvfazV7uSbGD8xhZGcfJeyXtk79fDE84/m+3szndAT3wtZp5JO0E4MmVYWIHZRhepl4BSnTAWDbdtQ2s+ilIZNVgmBpRSfWalAslorUgnVm6uYidhN0hqoDitrlBh9GbNRCI5zK8IoTj3FkkRIS3KP/1OXcVAiz6EjxJGIA7N2pMylyqjKOOYcOlRZ5CGnqJNpciT1FCsSaXxzqIj9ZOIs9lXrcYkJsdy1MclYZZfykbpSpVQpp2bWkSSoqziWJHua2feQkkJFZcb1uzL5Pmq5a3HS6lYzCjlxVcc9Hp+8FUnPestrzD7FRj3b4feZDMr6WQ3Kr7/++r414s3TTHUt0erGjRtWqW9xcfHGjRu29Hv37l0EiD+FfYseHtRCZ/9TwqY9EjNXdlzhuVKVwmWFZDF3Mfiyk4Vu5sbOFSxVlJSPkQrrPZHoyMpsnStV1IopqnDhXPQd/Rz71P3orX820/nK18/97S/hu8okjllU42S5kp/iSjH5Y9aj7kkiIWbSyLGq16if/hLgOtF1Rj5Xx1YeNzhlFzquOCHD52T3K7x7Tvee173TOl7Q8Qkdz2nR4dJzsNp8PJn4qXJQX0Y/0txK1lL9Pcrahta7W9P20iETqVqJ2kolUAgaPLGrZ3TMFvdUYtIf//Th//53fvC3fvMbv/mb3xKWoPXDpo6jVn5+zG5IbpeyAeUfU/cDnf0wzn0cZh+Vs0U5o2UuY5+NxI9Fx04tQCwqgbhSrktqk+PY4WpWipM8PkHFSS1mqLK1vkIdMY15/FDGs1JsS+klCMcwKTFBkbSZGcukjohUPDmn4iI5CyHUS+ZBuVKXJrfNN+7f/g9/9G//hz/+rf/qr5/91jmLDu+Ssz/QJGJbv4cUm1tIrQqS47oxYCQOyqW6IvpSXbTaUhwdx5yrQqugQk47Gvo6LlgmuduxoyHXYKF/T06ZS+IRuRnyQ6oKLityI6lmqPAauloGFSs6UaqU0ZXqRyEfu7ySbiSqQiZja7FOrqzyYvjlvQ6nS3Hrn1Jlw2ac99KlS1b00Oa3dpvmdLTf76+srGCa+sy+3TTVBvagwsQHX+ZVLY/DUYxsG/eiJxeUA3NaUhKNk7aX9Vd0VrU0CaHoomV8kMTJvvK0VYE1CkWKUaKwOGKn1vIu5PJgZoaI5nzedR0XxqxRSSYbP72yJbCUrhoLOYlKrqBQHBQg3hv96c/e/++fO/mXnuv/5X3GpqynfqbIesMsi54sJCqSatBrjEy+TiW2ixcpaeDINBLHlBGpdf7IScV5dgXFii1GvM9gGLka12FiDXXU2Hc0m4mdE0X31M5s//7s3M5sThmJ09wF2xEpXG+HEqfsIvmomQav0evj7RhTX9/jXMWV+Ip9xVpJDJPem5FjZFKqdJJZY9+Q6hj0pCqXj/WUmBoBYmvgGTiwBKYQeRhdJ+90qyJzHXE5yaFVJmKgqmBfcBj7atQpPSuNfRbKOGZR5SgUhetcWlabGaoVlxB9nDgskR43iKPxv/1/7tz51/P/y/+Sv/F1IgosRCSiHS0LcoHFcrk9qY0UXQ0dCl2tuhqsSmDF4pVzDpmKY+cm21zqpJ46aGBVjDWl2/ipry5W3aJirjOISUrmyjrUkRurG5HfVW8bcXgSs7YKGGrN0CePLKQWEW4uxEYVW6Z995/+i+Gf/Oxr/+gakzq1OsVWGzFaaamgUYlUWR2XpIFjZKtsbDWmpF7CiIdGdpjq2siRVdQ+reqIHbFTDiqskW3ZYJKVwRbm10mfA67DJDa958gShGOdm6+i7JRtVdcpUySp6399OVnR4elKwd/73vcs5tsceZs3WFlZWV1dtUoURPTGG28Q0csvv9y8zcsvv2wNAzDyfukG5ekvYE8zLmsWwvweB59VWTd2SnUhchS20jcFjUqWSiT4ei/dNocxh+gyDa4em3VSRy5KCCKefSZSqlQhC+JLzkpXVVJWMq66VHUlklTqQszKSuLkoh+CL4u8GOXjYVYOXSgnWwN0MiQUHAqqxhqKRtIxt4O5vkO+F/3MH/3hWrbwFzq//g+Dz+rOpDFKqPKymNt7lI+2XbnHseBYaaxY46Ror7U4cGSrrezIZcF1VDwRcSgljLgaUywplhwDMZN4dbnmJ8a9hb3e/F5nZtzpjLtZmTnKiH0UR85XuYvilOoCU6pprsYURcmROq2r+tWzJ+bIHNiyaChasipRZNtZ+uTAoOLrH/gTZffUmNJuGNtx5TVmGjONjSTZ+npZsQSRIvgxa8GxdOPSa5XFyBTI8pd9FaVOXg42uhOpCpNz6l3wvsokeImOyBG5uquwEhUh09Chcm67OO3L4MqKNapI1cnKrotddZ3g8zFlqlb519UNJDiSq5gK0UJ2T8yM5198+OjM3MP789sfZeMdCWOK1d7ez996+7977uz3T537n1T57Lg7P+zN7c3M7s12q65IR7t54bqBOrHqxiqLMY8xC+QiSyBRkVRF24L1Ovl//WVHVaI6bTQ+VmWKLmROS88VcyBXiStJqsgVc7C3hpkfB4htPZmiUHCRfcGZC3XTAiHNXKyo8KQFOSIe111hyXEkdRlH+5phj9nhcvBvfvetf/PmX/2v//bZb57KKNp/KfHW4r+y35psRcwkjlRYQ+MGkbgiLkhG5EbkrfRiQT7uN0BG5ZKcUy0ohskSdUEhEM9wyeSYrABxyGxD0qTRn/Xi843eS601HysxcQRqEB+Uuvo0U92tra1UNqr5gIuLi5ubm4f3d0GAuG1lZeXVV1+1DG37iZXimv5itM+g2AhascRcilk37EnJRIX6ofNBXRVdkedlp1t1sqryUkk9ZYks0Sr0k9Q114ispzUzM0eVSdEJJeZKXOXzju+2N9r90mzv/vRLGBl2lM9pNqO+q+xYA1cjDgVXe1rZllJuL/iwkOuQ76bqS9X8C+OFb9hir8TgyqGMH9L4ETVrTR5+YvhO9N1x5tkGcqfqlF3Vc0XfDc/I7lneOxv3zujwdByd0tG8DLvZUHzJVhehbvSiRETB+crnZZ5VlcQuKUXiwLY0FyO7tEjRiBH7gqLX2GGxnmxWzthTFCJbdbQZ43hn9P/9wQe/8WtnZ6hkdZVVACMJKhVzJIlKle05Zb9N/oF2PoozH4XZj6vZQTU7Lno67kjhspHzI6GxxEJi5VTrb0cSAod6ndFT7Eo1x8U8FyeonKPSOrMrcWGFJlhO8mhOxj0pdySIWIC4XpRtVgqyF82szqvzUZySoyiT7zHEQV1VL122PyofvLfzw813d3cLSxy2zKmCxGoy5k9kDVNGMSMV0kA8JqmsXxBHVorKlSURqy+jDyqkxKyOY8m+1CqoMFGXqz3NKq7bA2aqHQ0dDY6ifVFWopJ4j0OPqi5VXXYFlXMkLNRRiZMveoG4UqnIFdHvSmdHOrushVLIJHoRUVFyZSnl3pdxzprKJ7UKJzXnJ63eKa3JzL5zmKdprgJf1LBrUYaUFW6L508z7NZFRrluJGVLe6pMkaOT6DkElqAc2D4/lib8uPUckdUrt3xhFWsnEuuRmOMkhinEYqEhClxlKlWdG+t9jDkXyvd5ZuyzWZ/noXQxKnMlLjgfRJTYx5BXZafwGRFrxcF6o+1fvSHE4fbuT0/M/Pl9/k0yzedC3hvm3XHmyBMLiaj3dcJms55vKnsXA9u6kQYe5j4yFyJRZJYpKzNXjjmW9ESA2C6dZZ1WzFKHiUlJMvU5+ZmYzxbd/qPZhQczs8MZL131WXR1YnVdx4PtfRFVp9FryCh6jS6VAKoj+8282vFckBDF6h0E9iVTEJ0U5tNIqWZxXc5elIVEItts2Udy9S5Z26Rcb6oNGiuuL73RhcijzI+yTu47zuXiMg188DepemFRQulC0R3tckd73kXOiWicCbmpNcvJqZWm09aejnnSpE6p+uDD8j/+h3J7yCGzXZNM6ih2ORuzt/0u1pjFosM5RRsvbAR3pGPSwFSSZHXHgsclj6jxHaBbr4Y8/qrTHBWqSXWMajICVpMwcTEpMbGj+a5mhbpAwqQdDh2qbN1Un/jeX6cvcWNvU5jUIA4qoz/52fA//LBSzxSJn7i7xYhLciqsykosrGV0VYhRnZLWkW21+idPtWJUlxhnik7F8aTKBLGQxEk+xiRJKRKLRVP0iUAzcxQJTiqReik3RgkcI8tkDd2pknp9pmoKf9po4J07d6b31li6qAWObQGvNfL2+/1+vz8YDAaDQb/f33fkfcou3/CsnRJLS0ubm5vNnT0bGxtbW1tLS0uHhxXYBZ0fhqLjy7xTjavKxcmGnVC316YoHEgisbAKhx3WcQxBnJJMmq1YIFc0uuhdrNwkvzJyxVLFvGKyRcRYdzepIpUhf/wpjBZuU18GV4W60JJNIkKkGKUs82I8N9zJil1f7HEYcwxUXxhERVTykPWK7ondmRPj7syj/89P3InT+VdPk5uMrWol5/TR6LlsVLii6I7HnXKUV2NXFWyNg9gF54PLKt8pnQ/iKudKn6kIEUkIWSg7xbhXDH0xdKFQ5ug7487cdm9u1J0ZdbOyI5SRZDHzlbcaTS5Spuo11Nm7mtJS6wFI6qBtPQYRpaUvrpe6mJXqtfP6m87kqjfpN6ZZ/dNwoiqfKyYX1ToLNnpVF9QHdoFd5DowyholRNHgpHJSOCmclMEXLBVTZApW61iqwBSdqqdU1oLtaCmLso8slWP1FumW1J+N6iIMFccgZeAi5tZwxmXBZWPXibETqzzGLEanthVs0h3OwtYihfOjoD23e2J2tDDzaOesH458MfZVNboftv/4ns785t6LvxKyvMx9mTvNSTqhmxcui5TH0IlVN4ZOjL4iX7msFKmcC54rL8Fb84d605lOij9bdpfNRl1Q+67JpByVo7oYfXQZBaEgsXLRiSvVOcvt4lZqc/11KQqJanQhZKP63SXHMZcQiDOKFiAuSUp1FlHN2TpOaGbLuqw9Lh+9//6DH/yx29nO+WROIa83GZPViYqkrlENLW1KFmIl8pOeBCmCHOpdzjImGasbqR+p26VsrE73G7aDciDRyCrkKJYkBbmSKhtWlUiYXN0CN+akYb/mCvrkziydLFd/uhITz55Lly6l4C/v13L+E6e6f5YG4AgQt12+fHl9ff21116z8hxW0cNSuD9xY7I+LiujwqHrihNueMKN7RvzyHklLtUNY74busOsW4QsVrlGoeAoigThSuTxbLau3GZJ/Sy2LU5ZiIRKx6XP1XXZZZ9NI/Kjx3XizHPj+XM7M/1x1olOWKOvym4x6u0NOsMBl3tszQ0sGYw9uazKelVnftSZLX42qb608JV3zn6diJnUhThTjOZ2H+V7H8reR1TufPJ+BHbkOpXvjL1jUXYaHUUfM6lm3WjBDZ/j4XM6OqOjM3F4Wocn/W7W2aXeULMq+EAuapo/R+bKSellXOajQAXFaI1f3JhdMZnKK3Fl1xK1RjTMJJ60oqBESkHVyjxQNmmP7ig6UusRl1HsaWCikmOhrmKKJHbRVybrjLdHfluzB9q9H2fuh5mH5eywnInjrht5P5ZsaNFhX5USgqiSNYbyk7UQ66bakXKOi3kq5rWY13JGK0eR6iZ7NCZ3kos5LnpSZlLZN5q6fXmjQ13Kb3ZO/WQXs+UmWfOpqBxJKnJhUgVq+io72U5bT4ltS44qOVZXX87iZGXVEg3rb7q+UaC5UleqK6MrYxbr5nMqHCuJ9oVAWHuxGIovJzP/Oi9skjrtNCpRQa6nVZdCjyvrFK8sdXserit+aL2PhgvxD6XbkZ6QPopSZln0jkVdjHk15nLvy5vTdJCDdjguLy9bmYLmomvrBvtumYQvXL/fv3Llyquvvnr16tVUV/q1116zLcyfFCCehHIs5zd9HYyiTkKQGIQjSRAOxGppwnV2Zz0JlWY3qkjORt/I9p/lfdSxJUfq1EnMOBbsHFkZYh+1UiqEg8+HmctDdFGVKAgHkSDMSj7EXlnOiTCpxIqrEYto0E+3hCOesxl1ncr39vI8eLbMWe9V6uxUUiIWChU5USWKjXixKkUmEhqzC8xBWJl74zxzIxcLCSXHQESsgWNVh0Xr8ruBQ0EsKo5cR1035DNlPv9o5uT92dlRz0lXO93KZVFcrNOTrMLxJDs7Oo3e4pqxTtBOJReeDBCHmSJE4SBcsVTiKpYqSmCuSJQ1sotsa+f2DC2zpl55teiznwwOdZujOibBLHU1u8ghyjhzY58Fn6v1qWMhCgd+uQsFhzGFXEJGxFnI5oa7qhS5UwmH2CztW+fTxjSnldiODtffE62En4ToxkRR2LJ9e5wVLJOedZMmBI0wsdfYIXunrKlpzCh6jr5ZcmpyXnGqzTQVGiaikoXUChCz1vUluLRZJYsN90PNdjTf02ysPqgIaZBCiYQ1n7xzllZsGcG25NxoU86BpFIJk7zxSsVKocR68yh5jkyacbD+dLYhVzgKZ8JahVgpqd1YmaK2pppRdJ9q+7bqE4mEonIUFVdXIhbWKEphEi+yQVUopu8VaSIuanlh3lVeKqFYdxVSV7EL9TcRpchR4pf6Cjw9Yq6vr29sbKR/OijLeGlpaWNjY3Nzc3l5ed/bpGLEGOm+XK5du3bx4sWrV6+m4pVpt/InjVMkM+M4HMVR7sfjbsjipOoPEcfIKqTKQep1IKHoSPdiXogP9V79egOgqsTo1bsYPNnSYWAOIiFIEKmYK+ZILnKjqP3jeNokk1iq6NSaiUwSiCmyliyVPhoGX1SuKLJinFWlaCTLgnW+zDohz8pOVnSzmBMRcaad02Pb769MHEkjUyVlIaOip+WsK9SVISuChMga0xJT9FJ5iSJR2LrgpqxSqdSVmhfBl5WrKmIO3hV5PuoKdViy0PGlZFF8pEyj1+hj8Boz1SxGZwuisa62Xo+KxBzsVzHHVLXWFt40ujpoqmx7S/jx1Xoy3tkNfX1Nq06MioW9ZoINs4oL3pWZK71UnoPnYDXclaRSKYMvYqes8rLMqPJSiZRi+bD2xcpFelwqcFI6QYXI1a0G6qg3Twodpl8dWCq2MLFY7rOSCmkWQx5iHmIWOCudqzKJzFE4MCupladyVeWrMpci8zPeDSuac6OTWRx3qWQJFPzbRDSa74avzLFT9uqldFnkLGqudcwmDyGvKKvEl94VPT/OpexI2eWqI1XGYTJQPf6KGuuWA67OIlKJKpEkRY2L6EvJY/QaXPRenY9OYkmeiWnyrSFVV9JUZYKJXSStSMd109eYc4iOPYWK6rhwWScRq+fIRBnHSnny5+A5EpHnuvOtzUYt99ZNmsK5SZUJi9VWxI44I62IZVIyMQWI02x6TH5Efo+ysXpruqCTDcRMGkjqSuO2iBGt7qJUHCp2SiSqPWIhdWxBapG6Y3xrnCf7HlWoY9Js8hXLkWaTEo5H0kEl+JpT3YMK5B5U1g8B4k9YNb1x48bVq1etD2863E/T2ojT6o4452kmDwu+OO32elRNCrVQUN7T/GHoPoy97ao7jnkZfRHyaJf84Ll0HMSugFa5XCpinhR8i45EyEnpfZH1op/x2ayGz61PHZPkZNWMYnym+8aylCe/Pji9+OhEfziTB0/kmFQ5UlbEzvj5znDUHe11x7sSQ+nzIs9Ll0WfhTwvs6zIfPmDunzHTr/36MxsvcIZaLuY2+nNn9qemfVdv/cRjbf14J3CRMR+JvqZMp8ps5x9ZO9iFjULWR7ns+q0Hz0vxdk4fl7HZ2U0l21nM9s6uxvnRpqX5AM5yye3sVyo9DrK4ii4TPM9ni1cjC6wLyQWrBVTIAkskcSuv4FISVlJKEYKouK0cspemTVYVmxO6kkdh46riKjDcV4qT1SyjFhGRMpa2Rcm4kiulGxI+bZ2B2H2Ac091PmdOFdVs1J0s5HzY6bChcJVhS8riYFJiZ26WDkltl53zjnPXR9OuLLPoR+rvlYzWlkKbcFOSCoJ21yd5LLHVa5RImvlSByJJ+ZIPlqqmFiBY3WefEbilTKJGUfP0Tl2Tp2vxFfig/PqrPW47fVish28RNFJcD6QDCmzwoulOqEoHO1TlxNlRDnRJIPY9sZqTuojM4uqD86XlFexU2quVJejCKSVhkpDoFKIZygMZa9yTlRypl7UGY4zFDxXRJSrOpLAYShhR+KQtaBYUQwaHVWk6jnWZaknUemC3INYdmNUkYI7ZdDYEfE+U+6UgUJBRy9CDEd0Lrq5ubm+vm6JwxazuHnz5icXjGZR54gjOWJX1RXKmUijRqc2TAWJgSgwK6vopHXYJFOGJ5EgjuwiS3BW20fqjflKFKIGpRhcjEzKkSTkzpfMUUTZM5FjqiQGHmV+HOtaP3XFubp7OJVZri4TJRcqrkbsehxK3X+J0QoKCkk+mTsRsyPXoXw2+tlRZ27Y6cZMsiz6LIpnZpe+LsfITurauyRsD2d1eNmxRgrCpXPR+ShZ4bvdssjLIguFixURSShdNWyknAYOBYnNj3303ZD1Rp257d7cw9nesOdcR7NO8F3izKoPWKiSo1MrVVvX9HBE3io7T4q61hlNT+Qv+dlhjF6jC9GF4KrKSb3vkutob6z7h9qMkkRJKAhHT8FTbBQDqrfTVuRKdgWzExFx7CRKUFcFHuVaZL3c95zrsmQa4v77sZQ4VBSq+v9culARSSdoqLRyXOmkE5CwCpOE6CVmUT2rJ/JELrLVhyZHRHUhPhYiiuwr6QSKkQKR88xjqUqXR/HM4ok7TF3VLsUZjTMxdsj+C5G4srRm0YJ1JJQzZ5NE91K9RVEzDkzs6pqX7LQutGB/aPTOs5C01Plg5AK7inyh+Yg6u9odxmyoWSBxrCTipMiJ4mQdRUiyej5Zn4iFTR3VKVt6lK84s622leRMkZm9KDnnpcpYcw5COopUWurbJE9OlChwDBqCqnA9YYyiIhYSUSb1Spav7TiKTtrnEAlRZBKJwkGZlV2sAzZ11epGN1sijRTrCk3MJJGE1FV27HIXcxeFAhEH1UqpiFzFWEUOFSmRejkyg62FAm/fvt3v9/fNLIbjYGVlxRZuz58/3xypPzGmwETSCTQ/pnEhRdHRMQfOlHLSnMgLZ3YxJmEnEtk5do7zEMeUlcHHSQqr1u09yjJmVQiqTutOpRysrI8twCpTtGqMVO9JSDXf61W5OjHFLuaiTIEpMFdMpZSFG5V5LOekJAlap9syReGYMfvo8uCymGVxSKSZVmeDrXHaziUKwlV0Y+fHUQsXSymrrCjzGB5nsYgo1dtcVFi9qDgrPkBROQaOlexVWaxsjZLZqXj1WfR5kDyQ15jH0mvMYsw0+qg+kq/Eld4FJ5VwHei1OCAzOa6yVKIwDWI66RSqYjmtdfrqEyFYZVa7o/N1bGFudmfhxAN63IaVmDWXsitlT8ZdrjpcdbhyHG3fTqUyjH4ndndCdy90i5CVMQ9VFqPUtRGsjI89ZW6smYqyfT2QKBK5Lpz1eE+HKscoZXQaheytT+WAfBBf5tm448ZdKTpSZhIcR8/B1cUGpVA/jNmw6g6r3niuR+PcDb2Moh9HLoUC6ygSkZ+N3TOVTpKXQ1ZH5KNXzQL50mWld+OuK7pufMIPZ6SYlWKWix5XOVfucd0D655gVQHdWN1Y/Zh8oc5WTK2JeqluHP1eDEXIy5jFQNFL9BILVickIvbFdtJOmcQ2k6pGq3TkAzklR+Qcccaq5DILi099MDNbxFXKWD0HJvWiRJSLdpx2iMQ2GRMRiRApcUHi6z3t4in4SR8CIbGNR/HJb02FBYjVjTUfa15oXmlmIfJYh27Jk46Vo7oQOZCLrBVlVla45FBKxSxOhJkzppzJPhkVBSH2j7sdiG0HYpKortTM9gtlXDqmTKlLmoniSv6s+RIEiA9KTbp06dLy8vJrr722ubnZ7/dffvnlp6ycxdUOEcUf//vilb9UED0i+vEv8/m/RfTW53vEtnf/5N//x//Nl/3UHBPtPMXN0oS1+r//z5vN5iuiPaIP/wy/fXINpX9H9O+evePz3/zzH/03//xHv9h9D+mJVrZmIERbRP/m0/+K4tP8vCQaEd0neovoLtF/f8B9b/yv/rvP4cA+JHqHaJPo//a5vI8PiH5O9Pu//1t/82/+zU+88fsP7rz/4M4v9fmsr68fvsl0cXERNQqPPJtbTs8wLRJhpSoHg8HS0tLly5efZvdTuPU74dbvfP4vpCDa/TS3r4gqoiHRB099l3c++NfvfPCvP3FAGf+iLyESlUSP/syHInz6o3GIvf/Z8uf2Jj4gevAZPVR8uu8V04b/u6utn/zkqF8E/vRv/a1n84mFqS8q6VO2/RR3//8R6dO1xGkmoPyyWaObw2+TyjoR0fXr11977bXBYLC8vHzz5s0vZAsqPAuDMhHduHHj5Zdffv31120z8iuvvPI0GWdvvql5tkO0Q/T+ETtW4Sf/fue//pVjcmKk1LMH/9u//2V5Iz+Tviujf/vfjv7tf/vJIZHPJV7xqW68TfTeL/SL/q+X/09H9TT+h//wN57mZv+Pf7X+uT2lT0w5tRoGR/Ud+RIEiA95hyyP+NM+4Jl+7wi/o8fNPyL6J0S/RnSKCG8qfEmdPXv28Bvsu7f0l+HwZqw2Ij5NgPgpe6f8Ys1V4HOYix5yvjVLbn2iz+3Uhc/B3yJ6kejrGG3hy+zMmTOfOH595let6bIPv5jNzc3V1VXraXPjxo3WpbhZSqJ1r/QcrGrt5uZm8ykdVJsCvhSD8qcNVWBQxiwY4Nnx1//6XxeRZ2oqMd1c5xe4kD7NXHjfBuDpJ1/UdNgfw7Ow0+k01+EBAJ5xS0tLn89V67P6LQf1mnvKAHGrxw7g1AUA+Hy88sorr7zyyuf5G59y1W1ra+vChQvWcOXKlSvTZSVs6GxNNVN7Ort96o3eDAdjafZYwaAMAJhKHOIpdxod7vAAsY3XT5lQ9TkTnHMAAPDZWllZIaI33nij+cPbt2+nf0p/sB8mdpd0GwAAACCi1dXVwWBw8+bN69ev71t0eN9RtTXyvvzyy9Ojs/3V/gkAAAA+q+nwIVPd5eVla/o9GAzSDQaDQbP97OcPAWIAAPiMLS0tWZpSs2DFa6+9RkQpM8vmovZDY3tjl5aWsNEVAAAgsfH08FxjK46xtbX16quvpnmmbZW9fPlymq/2+/319XUrK2GPvL6+vri4iKVZAACAz8rTTHVt5E2jdvrzF9jyhz+TDGoAADierl+/vra2du3atVa9+I2NjQsXLvT7/UuXLp08efLNN9/c2NhYWVm5detWus2FCxc2NjaWl5e///3vP3z4cH19fTAY3L17FwFiAACA5ozx6tWrB/1rGoK3trZeeuklayLa7/c3NzetJEVzgL59+/bFixdpUkLR1nHv3LmD0rQAAAC/AGam/WpTfOJUdzAYnD9/fjAYXLp06cUXX3zrrbdsyfbu3bv7bhX6HHi8nQAA8JlbXl6+c+fO6upqWhS9cuXKtWvXmre5devW2traq6++ahPUxcXFW7duIToMAADQdPhu01SpcHFx8d69e1evXr19+7aFia9du9ZKDV5ZWbl79+7a2lqqPnHt2jWMvAAAAJ+tT5zq9vv9u3fvrq6urq+vpxn0zZs3v6joMCGDGAAAfqksg8mymfa9wWAw2Nzc7Pf7mKACAAAAAADA0fA0U92tra2tra3FxcUvvI0cCD0AAQAASURBVGEsAsQAAAAAAAAAAAAAxxSa1AEAAAAAAAAAAAAcUwgQAwAAAAAAAAAAABxTCBADAAAAAAAAAAAAHFMIEAMAAAAAAAAAAAAcUwgQAwAAAAAAAAAAABxTCBADAAAAAAAAAAAAHFMIEB9Bg8HgwoUL6+vrR/6VbmxsXLx4cWFhgZnPnz9//fr1wWBwtN/Z69evnz9/npmZ+eLFi7dv3z4+J/b169cvXLiwubmJzzgAPCNWV1evXr165F/m1tbW6uqqjT4LCwurq6tbW1sYbTHaAgBgUMag/DlYX19/6aWXbFB+6aWXXn311eNzVt++ffuYxHbgWcCqiqNw9L7Zr62tXbt27fr160d7nFhdXSWi5eVlItrc3BwMBktLS3fu3On3+0dyvmoTtsXFxcXFRSLa2NggoitXrty4ceM4DI0XL14kojt37tg7DgDwxdrY2Lhw4cLy8vKdO3eO8Mvc3Ny8cOGCjbD9fn9ra2tra6vf79+5c2dpaQmjLUZbAAAMyhiUf3lWV1fX19f7/b69wDTrv3v37pE/q7e2tl566aXBYHDkYzvwjEAG8VG7grz66qtra2vH4ZWurq72+/179+7duXPnzp079+7dW1lZ2dzcPKoriuvr65ubm5cuXUov+e7du/1+/9VXXz3yi8aDwcAWAwAAnpGLUoqjHXkXL14cDAa3bt26e/eujbbXrl0bDAZHNUsLoy0+4ACAQRmD8jNic3NzfX19aWmpOetfWlqynx/5t3t1dfVo75CGZw0CxEeHlVk4DttqbP5GRNeuXbPsHiLq9/vXrl0jotdff/1IvuQ33njDXnL6ydLS0srKig2cR/6bkL1efMwB4At34cKFhYUFm6Ed+Re7sbGxtbW1srJiw425fv16v9+3f8Joi9EWAACDMgblXxIr8XT58uW0Rbjf71++fJmIfvCDHxztt/v69esbGxvYzQOfJ49DcGSkycybb75p2yGPMBsPWnMY++tRTfCx9zQFxNMAmf5/tIfGO3fuHIfUeAB49r3yyivf//73ieitt9468tkrFhL93ve+1/r50tKSzUVboxJGW4y2AAAYlDEof1befPPNgwblkydPHuH3emNjw6qGpm8mAJ8DBIiP1Df75lf8o/1ir127dvny5VaA2F71Uc18mS4XPhgM7GvQEU722dzcXFtbu3LlyvLyMqasAPAsuHTpUhp0jvxcdGVlZWlpqTUxGwwGNkc9kqMPRluMtgCAQRmD8jNi34rSr7322tEelK3i09LS0vXr11F6GD5PCBDDl9L0eJBKL7388stH+7VvbW2tr68/fPjQvgPdvHnzqOY0DQaDixcvLi0tNbf6AgDA5yY1amu6evXqYDBYXl4+2hm1GG0BAACD8rPDQqWvv/761tbWlStXmnU2jhgrPXzr1i2c8/A5Q4AYjoL19XUbGi9dunTkF9m2trZSds/i4uIR7plz9erVra0t6w6EkxwA4Au3sbFx9erVzc3NpaWlIz9vwWgLAAAYlJ8daVDu9/uDwWAwGBzJYWt9ff327ds3btxASwD4/KFJHXy5bW5uXrhwwZpu37hx4+bNm0f+JS8vL6vqgwcPbt68ORgM1tbWjmRMfH19fX19HUMjAMCzwHY7XrhwYXNz88qVK3fu3DnywUSMtgAAgEH52aGqqnrr1q3FxcX19XVrrHrEbG5uXr16dWVl5cqVKzjP4fOHDGL4Ert+/botJF66dOnatWtHryr/Ifr9/qVLl/r9/sWLF19//fWjN2u9evXq4uKitVxI34Ro0pxhaWkJiU4AAJ+P27dv227H5eXla9euHauG2hhtMdoCAGBQfnasrKwsLy8vLCwcyb58a2trg8HglVdeSYPyW2+9Zf/f2NjYt8YIwGcIAWL4Ek9pXn311aWlpRs3bhz5cdHWEu3FtgZIIjqS+15t39CFCxem33ciunPnznH7MgQA8EVNRC9evNjv92/evJl6AWG0xWgLAAAYlH/ZbHhqtarr9/vLy8tHMkBsa7TTydG23efatWvoWQe/VAgQw5fSxsaGRYePyYaaxcXFjY0NGzBaU1k6Ni1rrcaWbYPFTlgAgM9norK6utrv9+/cuXMcLrwYbTHaAgBgUH6mXvLm5uZ0ueGjOi7fuHGj9SXk9ddfX19fv3Tp0iuvvIL0YfhlQ4AYvpRee+01Irp169Yx2fmYlklteGh+RSCil19++ei95OmUJXuvl5aWkM0EAPD5WF9fHwwGN2/ePCYTUYy2GG0BADAoPztefvll29zTbDWUKmwcvVDA9DtrtSZefPFFDMrwOUCTOvhSsgvl+fPneT9H8iXfuHGj3++vrq6+9NJLFy5cuHDhwvnz5zc3Ny9duoSdJgAA8Mvw5ptv2kxs39E2FcjDaAsAAIBB+TN35cqVpaWl9fX18+fPp0F5fX19aWnp1q1bOCUAPlvIID6CFhcXl5eXj/YGhGO453Fpaenu3btra2sbGxu2p2Z5efmVV145DsWnmm86uuUAwDPCsk2P9nhk3ygOOQIYbTHaAgBgUMag/Mt7W+/cufPqq6++8cYbFgFfWlq6du3alStXjsk4dRxiO/DsYFXFUQAAAAAAAAAAAAA4hlBiAgAAAAAAAAAAAOCYQoAYAAAAAAAAAAAA4JhCgBgAAAAAAAAAAADgmEKAGAAAAAAAAAAAAOCYQoAYAAAAAAAAAAAA4JhCgBgAAAAAAAAAAADgmEKAGAAAAAAAAAAAAOCYQoAYAAAAAAAAAAAA4JhCgBgAAAAAAAAAAADgmEKAGAAAAAAAAAAAAOCYQoAYAAAAAAAAAAAA4JhCgBgAAAAAAAAAAADgmEKAGAAAAAAAAAAAAOCYQoAYAAAAAAAAAAAA4JhCgBgAAAAAAAAAAADgmEKAGAAAAAAAAAAAAOCYQoAYAAAAAAAAAAAA4JhCgBgAAAAAAAAAAADgmPI4BHBkrK+vb21tHX6b5eXl5eXl69evE5H9//N3+/bt119//datW4ffbDAYrK6uXr58eXl5GW8uAAA8O55mAL106ZINzYuLi/bnL+p5fuKz3dzcvHr16q1bt/r9Pt5cAADALBizYIBjiFUVRwGOhgsXLmxsbBx+m2vXrl2/fp2ZiegLOfkHg8H58+cvX778NAPz9evXX3/99bt372LKCgAAz9DXR+ZPvM2dO3dsaF5eXrY/f842NjYuXLhw586dp5lhXrhwod/vf+KsFQAAALNgzIIBjuY3fASI4cjY3NwcDAbpr1evXt3c3Lxx48bS0lL64eLi4uLi4he4dnr16tX19fV79+49zWj3qcZRAACAz0drInrhwgWaRISTpaWlwWDwBWYQv/TSS/1+/ylj058qmgwAAIBZMGbBAEcMAsRwZNlS6jM12dva2jp//ryt3z7lXVZXV2/fvv2UQykAAMAX8G3yi8tIOsj6+vrq6uqn+g5w/vz5xcXFLyTZGQAAALNgzIIBvlhoUgfH0fXr19PgtLGxcf369a2tra2tratXr164cOHixYuWGzUYDF599VX7ye3bt6cfZ2NjY3V11W6wvr7eXLnd12uvvUaTsoxJ+i0XLlxYXV1tpWVdvnzZboB3DQAAvly2trauX7++vr5uf11fX7fBN42eq6urVjYxDcGrq6ubm5vTD7W+vn7x4kW7wb4j8vSAu7i42Jobp99y4cKFq1evtio2Xr58eWNj4xN36QIAAGAWjFkwwBGkAEeUTQvv3Lkz/U/Nk//atWtEdOPGjdbi5K1bt5q7cojo2rVrzQeZ3jC7tLT04MGDQ55Sv99fWlpq/iRVVrJ/sse5efNm8zaLi4v9fh9vKAAAPJsO+kpp2bjLy8vNcfnmzZvNodOqQLSG4ObY/eDBg9ZwbJPMQ57P3bt3iejKlSvNH6bfa9ts7VffvXs33eDevXtEtLKygjcUAAAwC8YsGOC4QQYxABHR1atXV1ZWbGC7ceMGEV28eJGI7t27l6aatvKZVl/X19eXlpbsBg8ePLh06dLm5uba2tpBv2JjY2MwGLSG27W1tcFgcOfOnQcPHty9e/fBgweLi4spo8osLy8PBgPkNAEAwBGwurp648YN+xq6srIyGAwuXLjQGoKbA+7Fixc3NzcvXbpkN7h3797S0tL6+vohecT2T9/73vdaA/3i4uK9ibt37w4GAxvrm4Hjp0lPBgAAwCwYs2CAIwYBYgAioqWlpZs3b9oy5pUrV+yHt27dsiSjpaWl1vj02muvWdJTykK6efPm4uLiq6++etAWG7vviy++2JrE2oPbX/v9/rVr1+x3pdvYXTA0AgDAEXDlypU0zl6+fJmIFhcXW0NwitJubm5ubGwsLy+nGywuLt66dcvmlgf9ijfffNNu2ZqdrqyspB8uLS1duXKleZt0Fwy4AACAWTBmwQDHDQLEAEREL7/88vQPW/PG6Xlmaz/OK6+8YrPZfe/11ltv2Sjb+hWbm5vNokuXLl26c+dO82Y2cNrdAQAAjtiAe9BoS5NIsQ2vzdsvLy8fNNoSkeUftbq306QIcrrjjRs3Wi3pvv/976e7AwAAYBaMWTDA8eFxCAA+LRvGNjY2Lly4MD0j3dzc3LdjrP3rdI2nCxcurK+vWw+f5eXll19++dKlS9PdWjFfBQCA48ZygV977bXXX3+9+XObhW5ubk6XJ953wLUk5dXV1bW1tbW1tX6/nwbcg+4OAAAAmAUDHB/IIAb4zFhO0/Sodgir33Tr1q0rV64sLS1tbGxcvXr1/PnzhyRGAQAAHHPNfalP6dKlS/fu3bt586bNP2/fvr26uvrSSy99Yu91AAAAwCwY4MhDBjHALzIEEtHKyooV8v9U95rW7/dXVlZWVlaIaGtra21tbX19/bXXXkv91m3uesgOXAAAgCM84F67ds1Gyae/174JR4uLi5cuXbKsYdvZurm5efv27ZRH/PDhQwy4AAAAmAUDHEPIIAb41CxrabrR+erqKjMftOw5XWV/Y2ODma9evdocPq2EU3Nmaw/YqusPAABw5FlR4DfeeKP18/Pnzy8sLBw+F20OuNevX2fm5sC9tLRkhRenB1zMRQEAADALBjhuECAG+NQsBWlra2t1dTVtTX311VfX19eXl5f3rYeYBlTLTkqz036/v76+nsbLwWBgZRab7QLsLp92Ly0AAMCX3aVLlxYXF9fX11999dU0UK6urm5tbV2+fPmge1lYuVk7wsbQtbW1NPPc2tqyuHMzN9nuggEXAAAAs2CA4wYBYoBfxI0bN5aWltbX1xcWFl566aWFhYWrV69aD5yD7mKFmZprp/1+/8aNG4PB4MKFC+lxbHy9cuVKutnGxoa108FhBwCA4+bWrVv9fv/q1avMbMOlDZTXr18/6C4W87UGd2kIvnTp0ubm5vmGzc3Na9eupQntYDDY3Nz8VLUsAAAAMAvGLBjgaHCHfL0G+LKzJjb71stfXl5Og42V1W9tKW3eYPrRut3ub//2by8uLi4sLIxGo+9+97t/7+/9vd/5nd85d+7cIc/nj/7oj/7Vv/pXzfasS0tL9tfxeNztdpeXl69du/aP/tE/SnfZ2tr6B//gH/zWb/0WpqwAAPDMmh400ySwmVU0PS63bjD9aOfOnfvt3/7tc+fO9Xq90Wi0vLx8+fLllFC8r3Pnzr3++us/+tGPmvPMlZWV5eVlG7Wt7uE/+Sf/5Ld+67fSDf7lv/yXb7zxxt//+3//oBwoAAAAzIIxCwY4qlhVcRQAPh9bW1vnz5+/cuXK09f1f/XVV69evXrv3j2URAQAAHhK6+vrq6urt27devqJ5cWLFzc3N+/du4ejBwAAgFkwwHGDADHA5+rq1avr6+v37t3bd0V32vnz55eXlw/ZswMAAADTXnrppX6/f+fOnaefu968efPSpUs4dAAAAJgFAxw3qEEM8Lm6du0aER2+NzZZX18fDAZ2FwAAAHh6N27c2NjYaBY9PMTa2pptd8VxAwAAwCwY4BhCgBjgc9Xv92/evPmDH/yg2V39IG+++eaNGzewrQYAAODTsoKGb7zxxifecjAYbG1tIU0JAAAAs2CAYwslJgAAAAAAAAAAAACOKWQQAwAAAAAAAAAAABxTCBADAAAAAAAAAAAAHFMIEAMAAAAAAAAAAAAcUwgQAwAAAAAAAAAAABxTCBADAAAAAAAAAAAAHFMIEAMAAAAAAAAAAAAcUwgQAwAAAAAAAAAAABxTCBADAAAAAAAAAAAAHFMIEAMAAAAAAAAAAAAcUwgQAwAAAAAAAAAAABxTCBADAAAAAAAAAAAAHFMIEAMAAAAAAAAAAAAcUwgQAwAAAAAAAAAAABxTCBADAAAAAAAAAAAAHFMIEAMAAAAAAAAAAAAcUwgQAwAAAAAAAAAAABxTCBADAAAAAAAAAAAAHFMIEAMAAAAAAAAAAAAcUwgQAwAAAAAAAAAAABxTCBADAAAAAAAAAAAAHFMIEAMAAAAAAAAAAAAcUwgQAwAAAAAAAAAAABxTCBADAAAAAAAAAAAAHFMIEAMAAAAAAAAAAAAcUwgQAwAAAAAAAAAAABxTCBADAAAAAAAAAAAAHFMIEAMAAAAAAAAAAAAcUwgQAwAAAAAAAAAAABxTCBADAAAAAAAAAAAAHFMIEAMAAAAAAAAAAAAcUwgQAwAAAAAAAAAAABxTCBADAAAAAAAAAAAAHFMIEAMAAAAAAAAAAAAcUwgQAwAAAAAAAAAAABxTCBADAAAAAAAAAAAAHFMIEAMAAAAAAAAAAAAcUwgQAwAAAAAAAAAAABxTCBADAAAAAAAAAAAAHFMIEAMAAAAAAAAAAAAcUx6H4NPa2tq6ffv2G2+8sbW1tbW1RURLS0uLi4vf//73V1ZWFhcXcYgAAAAAAAAAAADgS4FVFUfhKQ0Gg6tXr66vrx9ym0uXLt24caPf7+NwAQAAAAAAAAAAwDMOAeKntbm5eeHChcFg8Im37Pf7d+7cWVpawkEDAAAAAAAAAACAZxkCxE9lMBicP3/+aaLDpt/v37t3D3nEAAAAAAAAAAAA8CxDk7qnsrq6elB0eN8o8GAwWF1dxXEDAAAAAAAAAACAZxkCxJ9sY2Pj9u3brR+urKzcu3dPVR88ePDgwYNLly61bnD79m1rYQcAAAAAAAAAAADwbEKA+JO9/vrrrZ+srKzcunVrcXHR/trv92/evDlddHg6rAwAAAAAAAAAAADw7ECA+JNNx3lv3LgxfbPLly+3fvLmm2/i6AEAAAAAAAAAAMAzy+MQHG5zc7NVfXhpaSnlDjetrKy0akrsezMAAAAAAAAAAACAZwQCxJ9gujfd8vLyvrfs9/vXr1/HEQMAAAAAAAAAAIAvC5SY+AQbGxutn5w8eRKHBQAAAAAAAAAAAI4ABIgBAAAAAAAAAAAAjikEiAEAAAAAAAAAAACOKQSIAQAAAAAAAAAAAI4pNKn7BMvLy2tra82fvPXWW/vecjAYbG5uNn/S7/eXlpZwDAEAAAAAAAAAAODZhADxJ1hcXGz9ZLptXfr5xYsXmz+5cuUKAsQAAAAAAAAAAADwzEKJiU+wuLjYihFvbW2tr69P3/K1115r/eR73/seDiAAAAAAAAAAAAA8sxAg/mQrKyutn1y9erVVTeLq1autzOJ+v3/p0iUcPQAAAAAAAAAAAHhmsariKBxua2vr/Pnz0z9fWVn53ve+9/Dhw9u3b29tbbX+9dq1a9evX8fRAwAAAAAAAAAAgGcWAsRP5fr1661WdYdbWlq6e/cujhsAAAAAAAAAAAA8yxAgflqrq6v7lh6etri4ePfu3X6/j4MGAAAAAAAAAAAAzzLUIH5aN2/evHbt2ifebGVlBdFhAAAAAAAAAAAA+FJABvGns7W19dprr21sbLSa1C0uLi4vL1++fHlpaQlHCQAAAAAAAAAAAL4UECD+xW1ubg4Gg8XFxcXFRRwNAAAAAAAAAAAA+NJBgBgAAAAAAAAAAADgmEINYgAAAAAAAAAAAIBjCgFiAAAAAAAAAAAAgGMKAWIAAAAAAAAAAACAYwoBYgAAAAAAAAAAAIBjCgFiAAAAAAAAAAAAgGMKAWIAAAAAAAAAAACAYwoBYgAAAAAAAAAAAIBjCgFiAAAAAAAAAAAAgGMKAWIAAAAAAAAAAACAYwoBYgAAAAAAAAAAAIBjCgFiAAAAAAAAAAAAgGPK4xAc4nd/93f/8T/+xzgOAAAAAAAAAAAAXzonTpz4Z//sn+E4HI5VFUfhIP/iX/yLv/t3/y6OAwAAAAAAAAAAwJfOmTNnPvjgAxyHw6HExGGYGQcBAAAAAAAAAADgywjBvaeBADEAAAAAAAAAAADAMYUAMQAAAAAAAAAAAMAxhQAxAAAAAAAAAAAAwDGFADEAAAAAAAAAAADAMYUAMQAAAAAAAAAAAMAxhQAxAAAAAAAAAAAAwDGFADEAAAAAAAAAAADAMYUAMQAAAAAAAAAAAMAxhQAxAAAAAAAAAAAAwDGFADEAAAAAAAAAAADAMYUAMQAAAAAAAAAAAMAxhQAxAAAAAAAAAAAAwDGFADEAAAAAAAAAAADAMYUAMQAAAAAAAAAAAMAxhQAxAAAAAAAAAAAAwDGFADEAAAAAAAAAAADAMYUAMQAAAAAAAAAAAMAxhQAxAAAAAAAAAAAAwDGFADEAAAAAAAAAAADAMYUAMQAAAAAAAAAAAMAxhQAxAAAAAAAAAAAAwDGFADEAAAAAAAAAAADAMYUAMQAAAAAAAAAAAMAxhQAxAAAAAAAAAAAAwDGFADEAAAAAAAAAAADAMYUAMQAAAAAAAAAAAMAxhQAxAAAAAAAAAAAAwDGFADEAAAAAAAAAAADAMYUAMQAAAAAAAAAAAMAxhQAxAAAAAAAAAAAAwDGFADEAAAAAAAAAAADAMYUAMQAAAAAAAAAAAMAxhQAxAAAAAAAAAAAAwDGFADEAAAAAAAAAAADAMYUAMQAAAAAAAAAAAMAxhQAxAAAAAAAAAAAAwDGFADEAAAAAAAAAAADAMYUAMQAAAAAAAAAAAMAxhQAxAAAAAAAAAAAAwDGFADEAAAAAAAAAAADAMYUAMQAAAAAAAAAAAMAx5XEIAAAAjhtmZmYiUlX7q/3hM3x8+8PhD9t8Dof/cN/HbL2EdMtDfulBDzJ9s+ln9YmHqPmYBz1/VT384Bz08p/m8H7m7+MvpvkaP/G1AAAAAADAFw4BYgAAgONFRJxzzjn7q8Xv0v9TgNL+nNhP0oM0fx5jTP8qIiLSig/abZoR0maEejrK2fyNdkcjIvaT9IuIyH67/av9NYSQnkzzodIvTYHUdK/W8xeR1otKD5J+2HwVIYT0e+3wNl94etj0cpovxP7V/jx9VNPBrKoqxmgPnp6z3SY9SHrY9MgHab7d02/HISHs6Xct3dfYb7fXaC+kLEt86AAAAAAAnmUIEAMAABxHIYR9Y5GqaoHOFIg0FsRM0dhmVLEZIrQ4KU1ir81gaytuGCcs6GmPkCKerdh0+r3NX2f/T49vv7cZwPXeZ1nGzDHGsiwtjJsiyzQJqsYYU/jV7hgmRCTLsnT7ZlS3+dzSkTEpSm7Pyu6Snli6SzrmKWScoq7pcezI2NthT9jeO/tX770d8GYYuhnNb+UjN8O76X1M4eZ0g2Z8uRkib72KVh56+hXpMNqxfUbymgEAAAAA4CAIEB9TaSb/NBtdD7rB08z3prfuNieTBz1CM7erFSloZbqlB2zNP5uxg32f89PPV/c9RCnVq3WD6edwyKvbV2uvdCu1rbVvt/k+7jv/nz4OzejDIe/Uvi/kkIiDPYF9n89BJ08r6Ww6Z23fV2o3ayXHIfQA8Gm1Pssp19XigM45+6w1L8X7Zs6mqOhBH/+DroTUiDymIGkzH7Z1zZzO/E2PkBJmm4nGsaEZe22GUC126ZzLssw5V1VVM2O3Gcu2gGzrIm8R5ObBtCu2ZWenX5GeWErvTXfcd2xqVaJIrzG9I+lh07NNr7csy+bxPKgWR/PlTw8Q+15Rm/c96LvEdGS/dXsAAAAAAHg2IUB8TNmUOE3eUsJXc4La2uQ7vQs4zST3/XlrR3Ar4cvu1cr2ak7IqRGEtR8288tsGt/811YClL1AmgplNv8wvQO3Ne+dnjnbXdLhSpPw9K+WkWe3b26yPiiq0vrVrahuc59yWZbNyXzzhTeDyOnuKTetuRm5ddhbeXDNoElrYzU19jJP7zFPyWLN59ZKJ2zt7077wac3szfzE1sHuXnmpNOjdfYCwCdqXivSR6yZ9mufrHRNSwFWu5ddVdInsZXYm64J6QpAjfjm9FU3Xev2jUs2L9QHFaZoXk+aY0HzkpVerEVvm1FaZu50Op1Op5UfTY2lrGZ2cBr7qqpqZmHve9lshqG993avVvCdpko92NW7Oci2cn7tJRCR5ThbKrG9HTHGNFxOD7vN0TZFsVvDB+1X3HnfTOHW+9KK1O/7DQEAAAAAAJ5BCBAfU7yf6S2izQkqTW34bW2VnZ4r0n5Bw2bcsDX1TbP3VI2xmZbV/NX7Pts0120FEaYntylRrvkgzYjG9O+lJ+tapru0UrGaodJmjGD69q3k6HRMLC5ARJbUljLOUhnHZvg4Ha7mNmdqpJXZg1hUIoV76MmU5Ol3NkVSaCqdrRUjbh609JRarz1Fh+1mzZUJmkpVmy6LOV3P1B6wWZYUn2iAX8x0ed9DPp6tC0K6JDavYCnsmD7+1Fi0a+UjN391M1rdvCC0cmBbsc5WXDUVVrYrlffewrJEVFWVPX6e53ZJFJGiKFJ01Z5eirE2n3mraEOSZVl6Rakkhf3cHq0oCjtE3vvmQp39NQWpW1WSWwchxV7TIbKHakWQm3H8FDVuXVfpyY0g6QatRcHW8Z8+H/bd7dF8c1sVS/BBAwAAAAB4xiFAfExNd8hpTgjpydY6raQqi0imUGmKtLYyW6eTqpoT0WY8ovl7W+mirWlqa36bJsMpKtGcPKfUNppK5p3Ofd53X20rmNvc1WuPlpJzW3lq9tIsBtE6Ms0YLjVyuOw3ppdgpTPtn2yqn3Jmp4+MxRdalS7t0bz3rYPZ2hOdHiSlCjajIa2YyL5VMqmR4teK47dy99JtmumHKT8xHcnpYhcpQXi6b1Xz6AHA0w8BzXoO06tBzYDj9IqRfXJbC2npMtjcBZISWtNy175bRlpFdWi/ij3NaOP0Qh09WbAilei1FbJUfdiuqxbAbUZs7Xpil8GqqqqqGo/Hdu1tLVM1U5Wba3jNw2u/NIRgAeJ0DUxB5DzP8zy3X5QKFqeSx83rZ6pWQZOVv+kYur20lHfc2p4yHUlvFkpOh3e6rnRz5wdNlRiaHkzTOdPc4YE1PAAAAACALwUEiI9vdKDV63w6RWjfbvXee4s5NvfbtuKDFhtNIQOb8TZTd5tteZqhh+m4wL4hZiJK9TFpKik4PYLNvVvxi2ZMofkaLSiQDkVKzk13aT2NNFG3o5FKQKS9vRaDSLH19FrsFzWrQ1hQ2KIVzXBnyuC2Z57neeslNItv2j+lyhvpBmme3zqS+4YPUk8qe0qtzePN0ybdsZVQ3Nzf3Sxn0YwRpNdeVVVZllVV2S9NL/agjdU0yT5unpP26yy3+hPDYdMnNk0VSJ2+5b63b8VKDirT3Hyc6cLf02f7QRvwDw+Z0ZM1ZA+6Y+uFpHjf9OGaDu7vW7X8kLrkrcBfK0RFT5apna6XPV3WZt+yp7RfgZp9D/70YTmoYngrr/+gp9G67/TVcvqAtKqo7/uLDn8mNFWa5s84CkzX4ZmOtKZPeivYN31ZOOiFN+PF05eg6fjjvoXmp6vrpDWttJDWinvaJT1J4dcUTk3Xovn5+ZMnT9qw0rwONxfMUk5xs3GfPWZZljs7O9vb23YFtse34cMCxM2NINToMmfPsJXSe3jpfHqyOlC6cjbXL2mq/FHrPG8tee77e6c3vjQfoVVypHXH5kAwXZgIAAAAAAAQIIZnK0bc3LX6ifO3fXvHHxT2at1+Ohd131u2GtNNR2T23aw6PddtTqGn48itqETzkaeDAvs+1YMOSKtmxSGvt7VNO70RzSrDaWqdwgqtspLTAcHWE6Any2I0d/4eFBebDmhO73Ru3Wa6RkTzHWnmeh9yZA7KGW89t+kSmfR0Hepau61bEZnm05suhDJd7YQOXupoHt7pwF8rQS8lbjefyfQJloKeKdSVXlGrQnQzpt/MOpw+mM0bHFTiOb3A9MRat5w+91ohp2aKfSvhtPnrmpVVmoc3Zbs3m241n0bzgNjyhi3YtKKurT0Qzaz/6SDvvlmxqZBCK7uzdR623hpqbJho1sBprRs1f1HrmkZPdlRLJQs+qyFgejWIpopITH/cpmvjTFcnSKeBlXdIv+Lwq3ozr7kZ+mxevlpnfiorYQHZ9HM7GewneZ5bynCMcWZmZmFh4eTJk6dOnbICEXmenzp1ygLEItLr9WZmZjqdzszMjK10WjC6KIqiKNL7ZSfncDgcjUbD4fD9999/77339vb2yrLc3d198OCB5Sx3u12rU5yeeevS3RxoWsnCret/60rYStpNh725FNFcn5tuIkeTtcND+g2kD35rLYoOKEDfvEDRk/WjAQAAAAAAAWJ4RqPDrfDuIdFberLveTNLy2akzZhFs68RTZVWmA4ItsJGzQBT6/b7Vs5tJbROhxv2LY7cfNhm1mGzyGOzyGZzttz8jc2yDJaA1oocpbxmu5nFKZrBx+YjNB8/RZSarygl21IjJTlFEFqhhJRJ3TzOzTB6q8JyemfTU2olQR/y3rWORjMwd1BQ206hFNGbrmq976l4SAzrKU/7ViSumQ+YjsBB2fTTywap9nQz1pw+Jq1We814H016Dx7S3Yv2S8pu9mBsZk02f976RLdqVbeSPVs1YSwjMmWdW4xv38zcFM9qJelPVztpdTlrXi6m80abh6IZcm3V3bajl05vmsqJnk7uTi+zWYK8VSJgOmjefHdS08hWSLR1Hk6/j83o/74XpeZ+hekToNXQ7DPRfM7pY25vaPOYNLvSpUTaVmGK6Uq1rfB3irA3h4ODih1PF6yfHrmaH147JbIsaz2UVZPo9/tf/epXT548aU/gueeee+GFF1544YU//+f/fK/Xs4uqdahLL9bu2ApPN5e7Uua1HaWqqra3tx8+fFgURVmWg8HgZz/72cOHD8fj8fb29oMHDz7++OMPPvhgb2/PDvV4PE7bNdKnpnXiNVfaWsNKa7W19ZFpFo6Yvog1x9mDyrgfskDbfErTd0yf2fSxTWMivnQBAAAAACBADM+oZlxm34l9K4icbtCsmdjaNN2MO7SKyU7vLG7tm54OmkzHH1O9BXoysa41m00ZZK3M5WZKY3q05p7i1v73FHudTuVLsd1mbzqaqsmY4hfpeTYDTK2oHz3Z98mCpxb1mA5Mt7JNm4G85vy/qqqiKFr1OlsJYs3IQvP1WszF3u5mcI2erG6xb3ZbKyGxeXxSWhxNMuZaEe1WtYTpjn/7lsV8mlhYKzE8Jd81VyaaT48ObevknEvx2VbBzenOUa1zdboKNk2l6bXiNc2qr80qHOmHWZZZ9y27sdU8aT6BlMHaTEtspvqmne/2K1IiZ7OS9b73TSG/Zpptsw5pOvNTzu++5QjSK03Hf98aCM3U0Wb6fyuJu9XccrrAbjMM3XoT03FoRkKn04enP4att755DWy15WzdhaYq6qSX1ryWfraxtlQEnA7YQzBd0aX1AlNP0X1LTLQyuO1cav5rOn9aZ0uzLnArPbZ5IjXf1tSMLoQwHo8t27fb7b7wwgu/+Zu/+Rf/4l+0xbkTJ070+/1+v3/69Ol00bPArpUMHo1GlvO7t7c3HA7t+mmX4lQOqNvt2sdtfn6+2+02dyHEGIfD4f379/f29oqi2N7efuedd/74j/94c3PzrbfeevTokT2mxa+bqxTNLQL7nrHNzNzWDpjp1qPNUaN5bFOqtZm+4BxU6oQa62etiDY11h1b3Q7tzbXjiTAxAAAAAAACxPDMSfVqm7G26YheK+abZo/Tkdlm4KAVRZruL9d6hOmMy+k94M0Jc0o/3Lc2YnPimuI+KTxhvYOm64q2EgObcY3pOrxWO7IVk2oVqRCRTqdjLYzSMW9t4k4Rh+aGentwmuzO7nQ66b0oJ5oB+lY0zTZNpz/ned7tdptpvFVVWQSkGZpP0XPblG3/ZGl0zT3IKYDYPDituMB0qYHpsNF0iD+9Hc3HTLHjVi3UZnhxuqrG4Vq5rqlX3r51GJrtuVoJyxbcsePTzLxu5Y22li5aH6VWJLEV3J9OrmxGduz0sLfbTh57+/I8Ty9qumJJMwg+nbHYPBmaQdiU5d0KElmh1XQON6t4N5uAtUKfqapGK+JsT8kqU6cHTzW+m6dHK+06nQPN2uhpR3+rynnzX+mAKuetpYhmTQO7cu5bXYSezDPdtyrxdLuwfY8PNTYQtCrJfLYFiNMTSBm+rXh0+qWpcjo1EkUPOs+bl+5WtXp7nFYkenoBqdW2rtl3ND1tO4uyLLNPgf11Zmam2+3Oz88/99xzp0+f7vV63/72t//G3/gb3/3ud205YTgc7u7u7u7u/uxnP3v06NFoNNrb23vw4MHu7q4tp1mkOF1FbdHF7ms/997PzMzY752bm5udne10Onmep0PX6/XOnj37la98pdfrZVn28OHD7373u9/+9rfv3bv3wQcffPjhhz/5yU/ef/99qxaSAqmpqd2+ZZSaacXNU7S5YNkc+OjJZnqt/Rn0ZC2mVn769Ept8/SbXhRs3qxV/QPftQAAAAAAECCGZ910FluKhljQZzqq2wx8NGM6zVSyZrS3mQU2nQvcas7TTEmbjiCkkFxqkt6KRzcfZ9/cq1a9iGa8rBV/bOZmTuc9NROH7UA149QpcGy5cs0QT+v4p8ia/ZaUz2XlMpuRkbRr2GK+6Smll9N8RSn+YtHwlFKa3tYQgve+KAq7ewrq0aRoQKvuRAqApvexlVXdjA6n19vK1W3V2UhPuBktam1ebu3Hb+V+NhOfn6bERKsKRDN40TxXWymlzfRbu7ulwqV3h6ZS41uvtBlVOaj33fRO7RTuSSHydDKkd6QZp7ZaqJaWmDpJWlfD5pk5Ho9bnRib2wJal4LW2zrdcS4ln6ZDZBEuu2+e57ZAQk8Wv05lT9J5lc6BZg2HlDqadqmnWsDNl3BQDPqgmG9a4Gkt6jRPy+mdE63X3vzQWTAulWWgA+pl73tCtrJEW4VcUuJ2sxbzZygd7XTZn/4cTTeLa9bLbh2QVvy9mWFtCxutst3NDSgpKJz+3ExpbyVrWyzVTrbxeBxCmJmZOXfu3NmzZ+fn50+fPn3y5MkXXnjhG9/4xpkzZ9J17w//8A8tI/jjjz++f//+/fv3f/azn3388cej0Wg8Hu/u7lqjy2a+/9zc3Llz506dOpXn+XA4fPDgwc7OTrMtXrosp7U0a7m5sLDwne985ytf+Uq/3z9x4gQRFUXx4osvfvvb32bmBw8e/PSnP7137979+/cfPnz47rvvvvfee1bIOMZoKytpuaW1NtmsN9LcT5CKeDQ/C80c4WaCc7McTSurfXo9b7pDgD09OqDBZms9prkihS9dAAAAAAAIEMOzaLqsRJoep8AE7Zew1mqhY3+2QFXaPlxVVZrftjbMTkeH923d07y9hWCaT6y5bZaebIHVfCGtopmpSO50eHrfVKlWjCmF7dLTtghsimVYkm+KodCkBVAK6jWjP/avo9Eo5fMyc6fT6Xa7zV3YKehg+5pTLme6b4pK26sbj8fpCFg6cLfbTVuwLc2NJrmoVgozZQTbg1iEohmZaoZvWgWRp9v6NQP9zWBiMyN1335rrVWB6U3W1Cgj26yo+zR5aq1Hmy5+Mt0+q3XfVrp6M/V+319HB9f13ne1Zt+qx83GVtMt2prPzd5Qy0BMb9l0I7vp+CPtV8e5WRjXgnHN4r+tI9CsKWEJmPaLUpZ6K9poyxjNALG9zHRup5fTXCBJB7NZwLpVPXzfo92qaUNPVnGd/pgfkr9JB+yHOPxdboXtDjkn9827/CUVl2ilgjbrdex7+1Yh7OaRbyUL01T2dKtOSKqH0+ptmK6rzZ0Wzat0Ov1STNYuYidOnPj1X//173//+y+88MLCwkK3252ZmZmbmxOR0Wj04Ycf/uhHP/qP//E/vv322w8fPhwMBjs7O9vb2x999FFRFM2caNtv0el07MEtQXh+fj6EMBgM3nnnnYcPH9rQZknudnG2xZV0JnvvFxYW/uRP/uT06dOzs7Pz8/NW4Phb3/rWSy+99PWvfz3G+Ku/+qs7OzvD4fDDDz/8wQ9+8Hu/93tvv/32z3/+8+Fw2Ol0LNZsl2V7pTaypI8tNXZ+NBexplc0m8ny++7taFX4aZ0hratcMx7dalLaWtXbd40BAAAAAAAQIIZnNECc/pDS01oplq15XTPhrpUgTI1k0ukdyq04S6tR2CFBkFaLtlaEuhm3nW6C1woxNGMQ+yY0pSd/yLE6KILWLA7QqpXcLM/amnvbjubRaNTMiGyFn1rVUa1ERkplLcsy3aXZZS79IotfNMtWpuec0o2b1YeboRlq9ECjqbKq0023momQ+0ZgpxsitTp9TUeRWjEImios+2lP+NZO6n2f6nS4ZN9CsXZg0wkzHYdtfVLSDZonQ7MArq0EUKMOcmoE1/ycTncv9N5bGCsFXi1olUK6VowiFVex4FfKVWxVPqEnM7XzPLeyFVY1xcJn6THTM6mqam9vbzAY7O7u2lm9t7f36NEjixe3Mh+b6yXN2tzp/1Y0ICXpp1ta/ntrO8J0dDLlLVrRj1Zt8el3vBXnbdZmnT4ZmhHMFIA7KCu8lZs5fdlpngn2yM1Q+NOvMfwCAeKD6sDQk+nP073+msVwpw8jTe3kaDUqpKmk4LSWkCoaN/vjNevdp4WKTqczNzdn9X9ffPHFX//1X/+rf/Wvnjlzxk7p8Xj84MGDjz766MMPP/z4449//OMfW4DYSgDbVTGE0Ov1rAqEJbx3u137iS2KnD179oUXXpidnd3d3X3vvfeyLOv1elaw2J5z83y2B7QPqdWveP/99+2R7Y6PHj3q9XqWXN/r9Z5//vk8z1944YVer1dV1QsvvHD69OkPPvhgOByORqOdnZ20hyBdZNLRaK2fTf91+voz/Sbu22Vu+iK870A8ve1j+tSaHvcBAAAAAAABYngWtQIlzRlmqxdNc8bYyvRsxsVSBHA6IDKdmDadldkKYraejP3BMl5Tuclm1ICerITbrJJhWbGtDnWtNnqtAqDppaUyEc0XnjLIWlHLZs3i5vPJ89xqVtpLsGiIhXdFpNfr0SQf2bbkWxJoKjdsv9Q5t7e3Z2E+SxazSqwWKKFJkeLhcNisqGs1N+2NS8llzTRPe1atuLmFPptJms1U32aJyVahklR2oHWe7HsmtAJG05V5W9G9VmgjxbWfssTE9BNu5ZJPl4WlRnWIVu2IfTPQW1UymlUsUiGCZhpsOs2aIf7ms20+4RTbNRZCTVHUkydPzs/Pz87OdrtdSzafnZ219PY8z2dnZy3slYpfm9YBaa1z0CQPPX0ELMXSPk0WU0tvdFEUe3t7Dx8+3N3dtQjXxx9//P7779+/fz9F0Ox3lWU5Ho9ToeFmvDilIVvpgPQZbFVVThHzZtmKViPB5maF1jvbWsFq9tajqYzyfTdYtCrVpAT5VjistWDTuk2rsGyKfjbLkdNULYjPqtZEqxTAdDT8oAXCVqniVjAx7SpID9K6JjSr/bQus9RIE24uq9g6hL37FlQ9c+bMN7/5zV/5lV/51re+dfr0aUsl3tnZ+fDDD995550PP/zwww8/fPvtt99+++3BYGAXUgsKe+/PnTs3Pz/fm7DT2MqhWGGWFDI+ceJEp9OxX3ru3Lm5ubm0FpLKuVhFbDul01LBeDze3t624hWDwWA8HovIO++88wd/8Adzc3P2En7913/9O9/5zszMzKlTp/7O3/k7IrK7u/vzn//8Rz/60b179/7oj/7oxz/+8WAwSDVt0gctJSw3G6s2VxCp0WOglfc9XVq6NZQ33/fm+9W8HE13lKWpAi+t04w+zXYKAAAAAABAgBi+sBhxa2doM/wx3SmLnkz6S1PHlEJFT/auadZRTXdstlnb93c1a7+myEizLGPKpaWp3ncWC6ZGX7i0U74Zy2jGiVr5sykmmwKyzXm4ZXqGECzpzGJtFjZi5pQyOT8/Pzc31+l0er3emTNnZmdni6KwFDbrdG85aM2XbOlpFuS1iJtFIlL5iL29vWYKnsX4UlxJRFJBiRQytlibZbym7Dl7IXaUmnEB+6dUAba58TwV3JwuUtysKZzqgUw3PmqFw5qVT6fjF62kuekqvTS1Tf7wcFgz6tR8Ys0Q83SqaTNHPsWI0+Ft1vNtlR1o9lpMIWZ6sidba4klnYcWAk4HvygKeyYpNGzZuyGEvb298Xhstzx16tTi4uLXv/71+fn5hYWFM2fO2MmZAmGtNMzpnNbp2t+tAgjNEyAlMqdnniJx9lHd3t7+4IMP3nvvvbIsLZvYKl8XRbGzs2Nx5LIsLdd4OBzaiWqnaPp0WIA7HYfRaNSqlN1qKZmOZ7MVIe1X4Xc6Htoqd9A6G5uJ880LSOuspv2ykvdNLT+oyE+rtm86Geiz7vrVSi9tPc9WtZPpk6T16tKBSpff6TWh5uciXXDSul06x6w5p41EInLixImzZ8+eOnXqxIkTZ86cWVxcfOGFF77yla/Yta4oirfffvuP/uiP3nnnnd3d3QcPHmxvb+/u7j58+NCulhZi7vV6c3NzCwsLzz///MLCgi2MFUVhlyzL2LX31zrOdbvdsizn5+fteZ49e/a5556zp2TLG6nlqQXBh8Phzs6OneGpppAV/rYFueFw+PDhw/fff7+qqv/0n/7TH/7hH549e/bkyZNf/epXv/nNb549e/bs2bPnz5//c3/uz+3t7b377rs//OEPf/7znz948OCdd9557733Hj58OBwO0wffPggpnp7Cwc16xNMXuumSEa2NGtO5wK11voMW3tKlcnqZBAAAAAAAECCGZz063IpWNHPiDmo+0wzyNsNDKQ2wWW6CJluGm7HaFDWeruw5HQFsBnSaeXap/dpBlSIsYE1PpiqnaXMziNy813TLtX2jM+lfe73ezMyM5Z3leV5Vle2vt5zlr3zlK88///zc3Nzc3NxXvvKV+fl52/i8t7dnsQn7dRZTs+Bvs4CspRtbsDjGuLu7e//+fUtMsxh0er8sRzhVG7CYhcW1u91ut9tNMdyqqqxscSpkTE9uIW8Wd06lYA+a87dCSOnEsHzAVBOTnuxqRftVcmjGKZpxulbFklZXK5rKBj3kbG9185sO27VOhukX2CxQMF0OeLo2xXQx0Okn00qWb57wKe6fApEWJ7UTxvpZnThxwo5Yv98/d+7c17/+9W9+85snT5587rnnzp07Z3Fh24bfDG3/wrGbw6NFrZ5mIYSvfvWrH3zwgUWE79+/b0sjRVFsb29vb28Ph0MLnFm82P66u7v70Ucf2cnfDMha0M3yjvdN16VGhetWWfPpgOZ0oYnW29oKfbZCafa5mN7Ov2/W7b71c6YrYh/UNZSe3LrxGcbdWgWFp5Pom6fudCyYnkznbxZLSVnA9GTtaXqy8WZauEqnd1r8sBaLVkLnzJkzS0tL3/ve9xYXF8+cOfPcc8/NzMwURfGjH/3ohz/84Z/+6Z/++Mc//vGPf/zgwQML7zrnRqPR9vZ2WZa2OnLixIlTp05ZCzu7e4xxe3vbViasNIqdnERkC35zc3Oj0ehrX/uaXeEXFhbsDLRdLCkdPsuybrdrdxwMBo8ePYoxdjqdkydPzszMdDod2ztSluVHH320tbX1zjvvPHr06P3333/nnXdUtdvtnjlz5utf//q5c+d+9Vd/9S/9pb/0rW9962tf+9q3v/3t733ve1Yf4/d///d/93d/19rodTqd+fl562hn5VaaPQCbcflUPSZ9XlrpwK1LEO1Xdr+5zpcuztMf+eZ64fSlHsFiAAAAAAAEiOFZ19w1Px0GOii0QVMZcDSVF9nMUmxmiaaN9qlLm4UnWqGE5hbXlLTYqkw6XS+1VRjU6iSkm9nvagZ/LZBqT8DyfG0bvv2T/cTyLu0VWaWIlODW6/UsgzilJ9vm4tRx7vTp02fOnJmfn5+ZmTlz5kyv17NUSksIpUl5hxQX297eLorCUiZTwMWyz9IG6kePHu3t7dlPRqPRw4cP79+///HHH1va5ng83t3dtSdQlmWWZZYNlyLjrSIbVv64tSm+GT6Y3l+879byZvQnhdRbhYP3jaDtG3hqFtakAxIVD+8Rt++p3jq3993734yDTMfFWid8Oj+pUWqg9WKbx2HfbmYpD7dVRyIFYuzkpEk+ezomvV7v61//+ne/+10rY9rpdE6dOvX888+fPn3a6kvMzs6mnfsW0nrKyO8hMe7pfzokVktE3vt+vx9COHHixOnTp9OZOR6PbZ3D8o6LorBczhDCzs7OO++88/bbb9s6imUl241t5/7e3l46n1PCe7M6RzMu1or1H1KNZLpNXytbfDrg1Uohb72J1KiBc8gJ0FwRsfOnmQrd+kR8tgHiVhSPphr67dtVrxlHbm4gmL5E0FQZ7uY7khbt0rU6VXjw3ltUd3Z29uTJk9/97neXlpZ+5Vd+5ezZs7YIZy3j/t2/+3c//OEPraDE/fv3LX6aqqnY8Zydne33+5b/a5fiPM/tvErRTLvS2ulnybmWkzsajZxz9jmyuxBRp9Oxe1mFn5SGvL29/eDBgwcPHqhqp9OxktwzMzOqOj8/LyKzs7Nnz551zm1vb/d6vY8//tjakz548ODhw4c//elPrR7Lu++++7Wvfe2FF144efLkN77xjcXFRfsUnzlz5ic/+clwOLSk6VbViGZS9nQ5/n2rQjWvCfsWiGj1IWw+SErPb+7zaP2hFTsGAAAAAAAEiOEZNT2XS3PFtIObGimlzUyx6Xqpthe4GdVKlUPT3Ht6N2uzBER65BT0SXtmU8w0BSya/bhSYLpVe1dVUzptel2pxZYlqdkTzvO83+/3+/2TJ092u13vfbfb7ff7p0+fPnnyZErIXVhYOH36tBV5tEdu1uRt7rG1/MfxeGzx2V6v1+/3U/f5VjwlhUgsZmGHrhWEssNiW5vT8dne3n7//ffffvvtd99913KN33vvvf/wH/7Dxx9/bEE3q57pnLMcvV6vNz8/3+/3LR5nEbdmcmJ6Iw6qIzkdL2uFa6frTrRii826mdM1Fqbrk9iR37fUaTMz/WnO9hQxTAsStF8zuvSUWpVYm6/ObmOh8LTUkWIlzSZyzUdrRi2bj9+MMtuhsFMr/RY7c4io1+udO3fOztKzZ8/+6q/+6m/8xm984xvf6Ha7rVUZyyvf29uz88oCrK01kn3TgZu1XKhRyiN9kNM/tUJ+zYuGPW078y1/OcuyM2fOpE9x6y1oHv+yLN977713333XAsHD4XA4HFpiflEUu7u7KdFeVXd2dh49emQJlRZosxT79PFP5SnSa2+12Zx+Aunt2DcHubWoNr1U1vyAtzYfNJccDqmF3arxQr+0+q2toivTXfVa0erW+2th07SC1aza0ezc2DwxmtHwtERnV6c8z+fm5k6cODE3NzczM3P27Nm/8Bf+wje+8Q3Li7eSPj/5yU9++tOf/uhHP9re3r5///5HH320u7triyWnTp2y4Kn9LivdYCFmqy/R7XZt04nloVts1C719vZZm0creGKx4FSHx3tvl1Mi6na7p06dIiLb82GVUmxlzq639hwGg8H777+f7m5rimkZ8rnnnrOP0nA4/Pjjjz/44IPRaPTHf/zHH3744R/8wR8899xz58+f/+53v7u4uHj69Onz58+fP39+d3f3Bz/4we///u+/9dZbg8FAVa26NzWShdO11B68GeelqV0yraXZ6R6bzRWO6ZM2rdqmVY3p/PfpjGMAAAAAAECAGJ45rQKUzZyvZiyg1Rapue29GSBuTiZbj5Aa5rTqdbZSllIe5fQ/NfvLpbmozYFT6KfZHS69QPvVaTLcykdOj5ll2czMzPz8/IkTJ6xD0ezs7OnTp59//vnnnnvOUsayLHv++ef7/X6z2AUdkNBnqcQ2jbcAQQoqNetapJn2dMBo37esGV0iouFwePLkSYs7WHJlCMGyki2KZ/G11O3NqnlaMLG19Tgd+RTKbJ0n+waLDzoCrbZvzVoQ6Y2YNl2wonkuNeNr6X2cDvAdEgtrdTI8KJbdTN6cDls34yn0ZG+99JNmOKbV6Y6m0pBbecfNnNNmMRbLZPzmN7/5G7/xG9/+9rcXFhbOnTt35syZhYWFXq+nqnt7exY5tSO/t7f3zjvv3L9/32JYDx48sNTydBI2E71bhRRs5aBZoSUtwFjmb7PKavqkp5h4KhFuyZv2kZmZmXn++eet69eJEydOnDiR4v4WxrUuYXYMZ2ZmvvrVr6blnxSwbnZvs+NsdVcePXr04MGDra2tra2td999d2dnxyoMpJ6WzdMmHd4U6W6GYvdN8qWpMrv7VpY4qEUhPZkC3FzQmq5EPF2PuFV+5GmWQ55GegKtQHkr7p+OTDP+27yqNyPp06sUrR0J0+mutnBlhVCs2MLXvva1r371q7/yK7/yta99zcaaDz/88Mc//vHPfvaz995778MPP0xVd5qx0ZmZmZMnT9p1e3Z2NoViLRfYqlePRiMrW2Gnt623pbPLzli7r0V7B4PBRx99ZPHl9ALTupQFmh8+fDgYDEajkS1U2G1sScY+KdTYV2H3tXXK+fn5+fn5U6dOffWrX7Wr93vvvXf//v2f//znH3zwwZ/+6Z/+5Cc/OX369NmzZ7/zne8sLi72+/2/9tf+2q/92q/t7Ox88MEHd+7c+b3f+72f//znFlu3Et7N/o3Na850Lezma6GphPHpGzcbljZbStJU9nGrmSe+aAEAAMD/n70/e5LkOs+8wdd39/DY19wza9+AQgEgCIAgSLTEzVpsifq6PzONWY8JHLOZtrmYMfZfwO75B9h9NzY30kxfdLe+kVEjfVJLalEEQBHESuxVWKoqq3LfYt/Dt7l4Mt464R4ZVQDBFqj2YzRaIivSw/34Ocf9/N7nfd64xS1uMSCO229ME0kcCXLOaO24kPNAKC1dzOlm1RhL4UIyPWwyxfpmojSJZJkE+bCsKAGROwZDKFeFxF6KaHIBp9BErGwYRjKZzOZypmEA2kIsLEmSYZqlYjGXy6XTaajMEolENpvN5/MoZ4RjpjMZ3TAesFdNWdZ6vW63OxyNPN+XFEWfPB8iYmUo06AwlpqGkrkPdcNIplLFUskPAphXaLre7fVWVldR6a7T6UBiiWx9kiSoMsHWQZOjaEykA6LGMETKphYsijqNiMyCFdPsTTxVvUuTMvaoSwMPthDLng2I2Z+BR1GU54qcNITMGKmI7JirMkZ7QLR3mA0NmaqwGQv+k32iXddNp9MPPfTQ7/7u7167dm1+fj6RSAB+QSnc6XQ++eSTW7duVatVdKznefV6HRURUbALoQIuAsalF0NMXySw6DRIgMV7h5kL6ajorhD6WxgFGIaB46TTabiyptNpiKBhOAv35MXFRdiwsC9KdFRM1a2DxPV6vaOjo2q1ClrXbDbff//99957b319vdfr8bIg/qFo2BqqKMhOOFOpsWinHoqEzajxNdUgJRozCEWexEgGhyI+x5WfhLqIoq2K6BvD8RiOyXFoAYNT1J9GuTZj6FA/8ACzbRuAeHl5+Wtf+9pjjz1WLBYXFxebzeaHH364sbFx/fr1O3fuHB4edjodDBjMC6xmhmEg2wMLeC6Xg8MDFPR4TCCfg8NmrtDAeSVJyuVyXHEURhAw8LFtGw4YCMWJBsfsi4KConAx5hsHb2KeMmjQJmua1u/34VwPTIz0lI2NjZ2dHdhoHB4eNpvNjY2NjY2NUqmEzjl16pSiKMPhcG5uLpfL/f3f//3GxsZgMIDXPDIG8O2qqjLB5wcuT9WQ3UfUYER8yofCeHzrpzpWh6IF8ftV3OIWt7jFLW5xi1vc4hYD4rj9BnDhEHwUyVcoFVrcB2LHy2CIcYlIE0jIJhbzTE/yY+VvUSRpTlFSoSx43w+GQ/apOD49IlJVnO6xf6WmQR5sWhbylEFgQRtRwh74gOmVpmkS6FUqxTCL3TANx9EbjXvcvNEYjXshiNQ9i6q0ukdH9UZjOBhAMgbsxVnnsiynUimmlhNQWJRyo+fHH7r34SCQPS85GCj9fk5RfElyZfn80tLDljUYDPwgGA4GjUZjb29ve3u7Xq87jtMOgh3f77Tb6EaI2sQzh0QUhJHp/FTyRRHJc8iVlZlRyLNChIw0KS0U0/9DGvbQaBTH20mST4qwdebUov49mgotorEQPBUBcSiwIZJErq0nehREnQ1CPIU1eqKimWW26XT6ypUr3/zmN8vlMrumgILB/PTGjRuvvvrq5ubmcDiEYhcaT9gv9Pt9QC4MP64iyB0SkuEzRwbSZQcYpvYM3fjaoZrkXoVss9PpcCSAZ5ZpmqnxdNN1fW5u7vz580Dqrusez8oIeIqaOXAX2badz+fn5+f5zjabzUKhADvjbrdLQrG7kMVqNMYQSpAPxSGibuwh9+FoEEWkpWKiw0klOqc6ujx4LOTTPgWitenEywkVHRV5cdS1mY3gQz7FIZMKfAZLommamUwmk8mUy+Unnnji2WefvXDhguu6h4eHb7755jvvvLOxsbG+vo6SngjpMZjGSE6n04uLizCUQNgDDj+iB0XUI0VcUgCIUfMNtJo9iHu9XqfTISKcKoZovV4/OjrCEgp7DXZhEuNDsODginacSoJftttt/D6RSPR6vVwuZ9v23NycLMuI5WCaj0aj7e1tmK6AOKdSKdM0z507hz784IMPbt26VavVBoMBwio8l2laUcGpMys0DsV3AFFIfpIbDwny6pNqmf46PFLiFre4xS1ucYtb3OIWt7jFgDhunwMXCKm6oqa3J+0hRXdgEQ6K1gGQSrHJw1T9qShf4gJcJtH/Ohg85rokkFB/Us5GRJIsq4KbLfbeuqYpsizJskZkOI7W68lggkSqqhquawwGRrUKUCjaVhxfC448Dcrc8wadxMH3oEAQ+J4X8DUGQUCkDgapft/iQkCy7CsKMfeU5aFlBbrOGD0EWyVJUlSVZFmSZeZM3C0SkU6kE6XE2zo+BC7AdZxWu93qdAae50nSdqXykyeeuHX9OtdHqtVqKIvH2lUxX1gMG4TcSEKlkE4SGoum1WKVsFBtN/GLQgYUbJcRtfWYamI7G4RNBXChmnizjxlya536mamIZGoZxqjdBHqAia1t26urqwsLC+l0+uLFi1C4gwHt7++jaCE0wvv7+7BWQKY5193iqokhN9ho+r9Y7Y09DVAjTjS7YO6PaId4gYzAODDAuArRHfwTSk2ytFPTtK2tLVVVW61WIpGAFpK9XNkQBnDZtu1UKsWIXOxDPhlc+PLy8sMPP9zv94+Ojvr9fqvVqtVq6IoQsRLhVygdYeoNnVrQLxqomGrsG+Xd9x1y4p98nvJh4UFA48gNlrLQ/L3nVyDLCLnJsuyPgSAwKEkSeuH4UJP13/wgkIgkWWYpq6ZpdjKZSibT6fTp06fPnTt37ty5y5cv5wuFza2tjbt333jjjY8++gg+IQjXQd47cpxut6vIcjqTyedyqVTKtu1kMmkYBmwWOp1Ov98fjkb9Xg+G1BjPkKvfcynx/UAwSCEibyx2Nk2Tx2ev12s2m8DQuq6DDm9ublarVYQ34D4M7TAk6oyhwY5ZoM2G+NBNY7iCdEPpDGKez+dhDQS7GCQKENFgMHjzzTd3dnZSqVShUDh//nypVPoX/+JfPPPMMx988MFf//Vf3759m53lxVmP2wfzZXFsi1bXU5/1PJFnhzGmVhnlyKIYzItb3OIWt7jFLW5xi1vc4hYD4rj9BvBiEXpy6ZuQrFLc/olUhTe9wAdipjkrRkXABDmnmOTO+fh2EDzd7X5nMPh0FyBg01l85VMdkkgi+lUq7DAxmXqq9znbz9RCB9SICkR5nIainP7GN1a+//1XX3rpww8/PDg4aDabBwcHrVYLeEXcxrMGjRPzQ7SLiwRGZcihinNsOMBRBJZ1Q7AsegozreDxI/qQiJUPQ37W9+0ZdqMWZfI06awqRiBOAspiCnkIjojUmybdaU9CJFNtCqCUVBTFNM1HHnnke9/73rPPPhsEQTabVRSlXq9DmfvSSy+9//77rVYLx4GOmH11UZUODR0IPhWdziHxu9jh7HfB4mvDMBKJBJxJ4D5Bk44xuBY29eZxBU8Y9B7Ep8BYjuNUq9Vut3v37l1IldmV+Djqo+usvk8kEvPz82fOnEHJR1HbyI4xuKfJZPLq1atLS0tf/vKXq9Xq/v7+e++994tf/KLRaMBG2XEcsRIdTXO4nrp4sDZc1BSH0ghCOvGQtJbnSKhOoFhvM+TfTZPl3T4bJpaJVGGJkIiUyYyE46WJf4PkDAQbPM/1PHV8zp7nBRDwyrIkywGshMZH8CQpCAKNSJUkz/fJ9xXfV1VVCgLPcXzf11Q1bZqFZLKQz5+/cOEb3/jG448/nslkAt9//4MP/vJ//993dnf39/aIKJVOW4oiG0a/1xs6jmbblXw+vbxsWhbK2amq6oxGnW63Xq/3er3BYNBoNvu9nosxPJYNB0Sypim6riqKrqqkKJ7vj2C0HQSS55Ekub1eq9lErgkGW7PZbDabRGQYxtmzZ03TbDQa1Wp1Y2Oj0+lks9lEIsGOxmJogUk0BjxPGfSrbdsLCwuQPI9Go3q9vre312g0Go1Gt9uFe0w+n4d8GBJmRH263e6dO3dc11UU5eLFi9/97ne//OUvnz179ty5c4uLi2+++eabb755584doGrf97vdrud5uq5rmoZ1gCadbcQ4sXj+/E+qqiKcw2kfYswgml0kpk1QRJ8ei4jjFre4xS1ucYtb3OIWtxgQx+03qU110gxJh6KcQhTkMjAKmTCIpEkW2gRVJKIg+NRY9kF2nv/Dd6fSF+w0LNNcmZvbXlo6OjrirOeoBFLUTYe8HaJ888QvnRRIMsYVEa2I2KJWrVHrkqkHf0DoEHJ+ECk2ayfFfOpoIbKQMWuovpNoxyHSomhStlh2j8b4FX4LjuO0Wi1FUdbW1i5cuFAsFp9++ulnnnlmeXkZRPWjjz766KOPjo6OOp3O7du39/f34S7t+/5gMIDkEMeHQhxnIvJ3mhTshzA3Tp6ZMmTCqOuFGY1vAXICRwO1BJOF9JKIQLdh84IxBp9W7mH2vmCiDdUkEXH1sGPPGUUBIwYszmaz169fTyaTOH/0m6qquVxubW2tUCgwOIawtFQqDYfDVqt16dKl+fn5u3fvHh4erq+vHx4estUAbFvBo5kRi3rkEAibMeROsq6erR0WLdp5NIrhN9GqQiwZ+uBNIVogukKU5C8lkkMUe3K1P54Lvs++MJIkyUQSEeS3kiTJiiIRBePACX4OfD8gUnxfdl3f911IaDH7PM/zfYXIHg6Lw2FuMDjT6Ty+s7OqaRQErVZLeued5IsvLvV6y5Jk27blOAHRcDDAOE8mkxWigiTpo5He70sHB57nwREYWmPHcaAj5hwXSZb9sf2uOm4Y6iPHcVnkK0ldx9kzze7YMhszvd/vw/MBt2MwGHQ6nW63y9XtRuOG+BMrhWFVzEEpMdqRyWQWFxdXVlbS6bTjONls1rKsg4MDx3EajUar1QqCwDRNFEeFNhmrBCxlUKPPNM319fXl5eVsNptMJh9//HHTNGG7zKE7ihQjpckAWIj2RovahUbdjEdA1DL7Qcquxi1ucYtb3OIWt7jFLW5x++K0GBD/T9qwlQ1BMaYVJLgQ0jQbYjqhchcjP+yHGcyJMlJGyYxmxG2nFwTu2JMhbp970zRteXlZkqRms9ntdvP5/I0bN2q1GnRw7Xab3QBo7NvLDiFR5hv2/Zh0nRY/H/KICMEFURqJXzJjDVVJokm73tBxZrSoxpNOqLMnVuejSQMKkaFMpYGhS2ZTBRacsg+veMnsCKwoSqlUunDhwre+9a2nn346l8vNz8+nUqnhcHhwcPCzn/3snXfe2dvbQ0J6u92GQpB9TiVJQtkrHIqLNLLLR8jdmJHxDDdtFno7jgPiDL0kMtaR/o8LRF1H9p3AZWIIMTjjb8egAnOELQb/E5DfcDjkoaVpGguK6/X6zs4OfymUxaqqplKpubm5YrEIdgyR5vz8vG3btm3ncrm5ubm1tbVarba/v//GG2+guhcTapQOE4siiqtQSGvJi15o5EQHZFQ5Hq0JOdXqhx0/Qi7Gn33iE32F6N8TneJf+T59hsT/EJ6eQatD/ySu6p4ntdvUbkt37khvvy3/+Me4tDTRM77/dMSjmUSpfsSN/aRIDIW8aE7oPvyroyhvl8v/r0plMBhgdmCcsxXPwcGBJEl7e3vwcoH7sOM47XYb/4kxlk6n4VbseV6n02k0Gvv7+41Gw/O81dXVS5curaysWJaVSCQwJWGFX6lUOp1OuVy+cePG9vZ2q9UajUaWZWGcZzIZnDsiKMjUURTltddeu3HjRrFYfPjhhy9dunT16tW5ubmHH374/fff39vb++CDD+7evYsKjeDjLOcPLdr8AhBakEk0HomY/Igy+amPhlBdx1g+HLe4xS1ucYtb3OIWt7h9wVsMiP8nbVwOS0zT5l0ck6OQDkikITSpiCQWkUmSLMtcjQ07TLgxihtLpKyyfpDxsTa5i99MpbazWd80setGoq4iy4ZpIqOcrS1kRaEggGGxD4EbcA8RfgPxGmtFgUQdxwmIfNftDwbD4RBCsGMLBcdxXNdzXTbrZN8DsRvv7bTpXnE5SZIUWdYNAyfM+2c23/A9rz/mYhP1zYIAVyHiIv4uTdOQbK+oqihJSyQSiqqqimKYpmUY8CxWFEUdDrVXXpGOjmicRDzy/WKxmM1mARYvX778zjvvfPzxx61Wq9fr7e3t7e3tVatV6PWA+EFM+G7yIEG38x0UfSdFFoYuYugsCm9DAklRv4y7gM+EWHMIJX8G7sCwgyKGGDRN7CmmYEdrM4qhlJAUNFTiibsFHYVPgvVAP+t53uLi4tWrV7/61a9evXoVJRMBK/f29n784x/XarV0Op1IJECLGo0GrBIYB7OAMZFIpNNpWFXgBKDhxTxA97KTL0v+Q1pjXJfjOIgTsLYXv8QBMcJVVTUMA7JiaHujtQRFVTWklwDBnU6n0+lAXxziqiJW5oUFThQ8hNgrdnd3V1EUEOFKpSJJUrlc5ptoWdba2try8nKr1ZJl+b333tve3ubbAfPWKEwPmfCG4mE0zWMkmn5BkRjb1LJgIVQXCj98Wsn81KYQ6V+QJxCuAv8/RslhV5/olX7aaxc/f7+/tUwzn8t1TZMfjrgRXPLOdd39/f1ms4m1EfU8Xdc1TTObzZ4/f/7UqVOpVAqjFB/Y39+/fv264ziWZS0tLV28eHFlZQVPHwwnrIqapuVyOdM0Uenx8PCw0WgMBgPUWeWQajqdTqVSbA6+u7u7vr6u6/r6+vrGxsb58+eXlpaeeuqphx566ODg4Be/+MXLL7+MKAgcjflpLqYvcBArNHrFJzVFbHN4GIuP9RAdDq2E8UtX3OIWt7jFLW5xi1vc4hYD4rh9EZvoNCommDPIEA1hQyQuupkUEQabk4oZ9zTWhDL9ESu/Q/mIzXBals1mkzodHPbW4uI/XL7sl0q5XK5ULKbTaVXTNFXNZrOZTMYwTVVV7URCMU2PCPTK830P3yVJgDq+56GQV7fb7Yyzg3u9XqPR6HW7fhAMh8Natdput3u93shxQLSPhY2+T5GCaTTuIpVFmmOQBH9lWZJ0Xc9kMqZlKbKMtGsAteFw6LjuaDRq1OvtTicIAlmSSJI813Vc1x07ReJPmEICSxmKYhtGMpUCK08kEqlkMp3JFPJ5TdcNXc9kMsVSydB1KDrzvd7K+rpVq5HnBUHQ6/W29vaSsgyZm6IolUqlWCxevHix1+v1er2NjY0PPvjgzp07zWYTVgPtdpsFoUTU6/U49x/OsLgo13WZmnFpJnQRBhLf+pAPZrRmGk0ToIU4cqh+4GdQVoqa0FCRumhaNMuip5ZpCqk+Q38rfixETFjzK8syBgZKVK2srFQqFdM0ZVl2Xbfdbh8dHe3t7e3u7nqeZ9s2+hPcBwJbzDh93BRFMcYtRH8QE+IwiQhkfaGwWNRmlLXPIvmFmS+7BuMcxPKV4m3idAFYEsMLeDAYdLtdFBPjeyGqm+FHwbeAq8yJDtQA1iDsOKYsy4eHh4eHh7lcDoYYOCtFUaA1Xlpaunv3ruM4o9FIJP4UKSQYsgMWifDU2puzjVmmkrKpBhQhZfE/mUdP8GvwXv/VG2rTlSuVtqbh9mmaVq/XeYHCUEEYA5Ez/JzJZIrF4vz8/EMPPVQsFjG2FUWBTTZMJIjIMAzo2THyXddNJpPJZBJ+4qhQl0wmi8ViPp/vdrv4DH/Y933TNCuVCkT67XZ7f38fZsSe5926dWtzczOXyz3++OO//du/feXKlYsXL1YqlVQq9dJLL21tbTWbTVSwRKAuVCM0mvogLtG8tovLOAkZJFzBMlS79aQsjbjFLW5xi1vc4ha3uMUtbjEgjtsXbKMuwAvRSkLkQSGpEW/8xJI7LEriTHmInsQ9JCtnSdBagiWBB6VSKUiokpKUvHmTAbFRKKTPn5cWFkql0vz8fCaTwbfouq7puqyqJMuurndlud/v13u9/mDgj78RG2zXdV3PazUaR9XqwcFBvVYbDIee7w8Hg3a7DYdHJOyPHCcYky/oJSVJSliWpuug3rqmURBIoMOyrOm6YZr6ZFcoiqJrmqwohmEkUikZBqyu2+v1+v3+UJIcRfE8zzWMgSxTOg1nAYlI8rzAcQLHIdflkxgOh4PhkLvRdV2529UdB76rhmGYzWaiVrP296G1TCQSpVIpkUjIkpRMpVZ8/7v9vhkEoFmtVuuD999fLhaJKJPJQI+8sLAAruE4zuHh4fLy8s2bN1HLq9Fo3L179+joCFo5zjUWIR1wJCAIwgAh7kBE0LfyL1kdzFghpMsmwXSCPyaOKJq0av1sPIgVxGI+NU2W4xNPMqSpj9aXC/kPiEw5qpVmX1EMLRxnaWnp0UcfvXTpEnSCruseHBzcuHHj448/rlartm1DNVyv18FVTdNMp9O2baOWFHSLTIQHgwHkgTQuCciyff4nBsGY3XyncEqQDIMr4RIg4IVjBntBYF7jsN1u17Ztbdz4PmKW4ZbhD7vdLuINcJNgmSRGMpfBRHdB3Y+6dp1OR/TDQRBCVDFLktTr9W7evNnr9dbW1nK5HGCcZVngzuVy+etf/3oQBDdv3qzX64eHh0TEF0IR219JCBFFKxmK5jkkVPYT0y+iOfihAYkeECMWInSOKjR/lZXfIVon+okse4oSDWkgj+F4eCNSNUa6oSANaO/xnwOOj38gIhxEVRTDMBRVlWW5WChceeihpcVFIqrV63fW13d3dwfDoWEYdiKBgTcYDgeDAQWBYZq4X67rOqOR7/uarqeSyVQ6bRqG7/v9wQAhPdd1FVnmFBP8P7T0mqoqqop7g9uJaBwRjYbDerUqra8vbWzYY1sJ27ZdRcFAxbgiIsQLucgbCdkkiqKk02mYmRQKBU3Tut0u1kCQU1BdfDKVSrmu2+l0IMnHiBV1yhgDCLRomgbHYciNMW0TiYRt25ZlmaZpmiZmMaZ8tVrd3Nz0PG9ubg7ZA2tra88880y325Vl+datW71eL1pXlq1vovr0aC27aL1N0ZB9anoH/5P/GcxM4ha3uMUtbnGLW9ziFre4xYA4bv9jWkjgE6opF9r1YZ/M1I8rQfHeD7tWUTUMqISf+/0+lKc4MjR9qVQKNayQYFssFk3TtIPA3t3lkywWCpcuXjROnapUKuVy2TRNUT4JDRfMWOv1erVaZeALyTBv6Vut1u7u7ubmZq1WQ0V4IoKtKi4K0Jnz2UEHbNvO5/O4LjA47hls46HDRRUvZMorimIlEuAUhmlCseU4Tq/XQ2kjVlKDz6IrcBDRkYPBOrN7wMHhcEhjwwfUqUdRIy7ntbm5qes6ZG5Lrvt0tVoMAoUoIOp0Ordu386ZJt8C1p/iK9Lp9Pz8/NWrV3Etu7u7v/zlLz/55BNURXNdF6LUbreLlHwYZUI3CpDBicysSIXjAb6FrQlEobqokp5a8ojrSmEQigD6wQGxSEBEC4UQ/ptB31iEK3poMEUSdaPid3HpKnQR42OAdWCmRCJx8eLFhYWFCxcufOUrX7lw4YJpmt1ut1qt/sM//MNLL7108+ZN1E8DVIXoNZ/Pl0qlVCoFsoaeAUiCYQX76ooniW8E82WHYsZGuB2igTiwLy4ZNeIKhYJpmviuZrNZq9VwSp1Op9VqHR4eJhIJXddhtIoad5hrOCVIziE9ZqvrdDqNgSQm1LOAEXRYnAiYFyJ0hpdrKpVKpVLovWazubGxsbGxkclkYDpx5syZTCZjGEahUPit3/qtlZWVzc3N/f39t99++5VXXtnY2MDKwFJrXj1wSnw3Q2BXdMRmOh8aEjTNpDha+ZP/Vfzw52IuIbYR0dtE/w9Zbut6MJaNkyRREHi+j5JuFAQ0aXbBaSU0Nu0Jxh+79xzBJ2VZVVVJlikINE1Lp9PZXK6Qz//2N76x+O1vG5XK9vb2Sz/72Zue1y0UdF1P2Lah657vIwIA6GkYhu/7CI/ZiUShUCiXy4uLi6VSSdd1PwhardbGxsb29na9ViNJymQyhXw+lUoVi8VkKpWwLBQwPAbEkuSP5fOqoqiaNhgMNm/fpj//82ytBkAsS1LCsobjuAgWYSBUx3GazSbyTnhGK4qSSCTK5fLc3Fwul0OMRFEUhCJkWe71ep7nZTKZRCKBlAvEaRDJwyTCgwCPAEw0fKlYQxJPGVj6dDqd4XCIKWOaJkImo9Fobm4Oo/EnP/nJm2++efbs2W9+85tnz54tFAoPP/zwn/7pn7788sudTgenwWkcWIKi7kCh5VF0yOEVjIMZvOCz2brouCKGmeMWt7jFLW5xi1vc4ha3uMWAOG5fXEYcqsEV/Sea5voaKiIEMRR2uWywyECZoZX41UBmQEKaplnj/bwpOCSCSaVSqUQ2m8vl0uk0cy7mVjCI7HQ6zWaz1WpBjdjv91E7CLRLkqROp9Nut5vNZrPZBDhj4sOaaIBIEtR8lmXZto1kf6ZmfPKJRAJqSu4ubLChF2M4PhIa41ERwbNkEqcKghZVYEGbxgiPQTyTLPySubnv+8ZwOBqNuDM9zxsOBuLNCg0G5ETruo4ODIIgl8sB82GfbxgGLgQGFKPRCCgHYJ3rekUrnnGlMvStN6O2lUAoRBNY1uSGBuqnGupMpUU9cpRKi6iOqTRN2lmI7rT8LaKeVISM4DI4FAgRkGi3293f31cU5Utf+tI3vvGNpaUlhEmGw2Gv19vc3HzzzTevX7/e7XYxQur1OiZFOp0+d+5cqVQC7UXgAe4KyElHNILHKoIfbO3CGkmmsVPVhfgnMZE8lUqhbh4+3263Dw4OYGC9s7NTrVY7nU6/30eAxLZtsC04Bfd6PeA/AGIiwoxLp9PFYrFQKMC/WLwX+DA7qKKHOe9+OBz2+31U9MK4wqGA5IDgq9UqBML5fF6SpLW1tVQqBYOaK1eunDlzptFoWJZ1+/btjY0NXgewhkx1Bxaz7PmmswkGLxEiWqVpZhRiNEK0Mp8qOo4e51dv3hiY8l32EP+TZYl10MKM84OAfF+cOB7Ep+MpA8rs+74UBJIsZ7NZhI5QOe38+fNPP/10o9F48aWXPvzww/X1dcuyypWKqqrdbveoWmUubJim7/vtTqder/f7fdu25+bmzl+4sLq6inJtvV5P07RsNsuBNISvHNf1xo5Amq4jUMfPIF5XdV23ZFlRFNM0XfXeK5Aky/BkgQM7VMNsyQ25LoYZJLqJRCKTyaysrMzNzeEZgWlu23YqlQqCoNPp8OMAQwsxRcMwUqmUrusIo7LwnGX1nuclk0kcB09GDr4iMgourI6d6NkTQ9O04XC4ubl5eHjoOM6TTz65urr6xBNP4OTfeOONZrPZbrf5vmPN5xEoSoN5uROjNRSxjAjFPNhZSIzh0aSZe9ziFre4xS1ucYtb3OIWtxgQx+2LhYZFn9AQvODtouhBIao+QyahrLljaimKSbkiljZ27DVNE5te/Ab/ZBiGZVkJIoZERKRpmjUW6vKhPM/rdruNRgN7abgJ1+t1oCIgM9AoxiuDcUU41j6LqijI3CzLAoplEIDMdKggQ3XbgRuYBIFYHXMTzwO9AmUAwwVdBUgV98li8TcwYmTxi7eGCZ3rupZlYXvPdfa4YBdXKhONIMM3XVFY4XVSYxfpTCaztLS0s7NTr9fBdtGBkMKJcQUWvok6WR45gCAijw7FGMQM+hBfE/Wk3P9TDRweZMyToIDjUS2aBnC3i+cTyo+eSMYXOjN6GiGj5JCSjrEaqOva2lqpVALiOTw83Nvb297ertfrrutytcAgCBKJRDKZzGazAHBQcwO59vt99nzARBC9nnnCMq/HXGCLBnFqMyDmqAkbDUMazAXxPM/TdR0e1v1+v9fr0diRBvcdERHgNo5nYH7hK1BlMZVK2baNYcZBFO4xlvYHQSCaXwN5DwYDRF8GgwFkkr7vIx8fCxEmIEr8oT9zuRzQm67r8/Pz5XIZHyah0qCYYxGyHxFHiGio4o8RKh8nNA2jbiQnDdEQjPs1VfrC2fJNiZ4e/7/oWhtVRvPwxmKOtV3X9XPnzn37299+8sknS6WSaZp//dd//Sd/8ifdbhdclYiq1Wqz2SQiDIDhcFiv15FyMRwO8bAoFAqVSiWXy8HDodfrYZHE3cRvkL2BIIGu61ic2VlFvHE8qYejkTcaBYJsVhIcYzzPw1RiPyU8CBDULBaL6XQ6n88vLCzkcjlEDnjQ4nGGv0L8huup4jGHEEu/32eoCveJ/f39nZ0dKIIvXbq0tLSEKAueiZDhDwaDRqOxvr5+cHDgOA76AU4puq7DEHkwGLz22mt37tw5d+7cU0899ZWvfCWVSp05c+b1119/4YUXsFBjynB4gIO4vK6KFjoc5wulUPBqLJpR0KRRT1ykLm5xi1vc4ha3uMUtbnGLAXHcfgMwMQnl6UhIKSUi3jGGdr/YnLOYl8WzALKgpdgV854cCeC2bUPJCEmjbdsgTYZhlMtlbIbtIEgkEnyGlmmmMxnFsjzPazQa0K6ORqO9vb29vb1GowFA0Gw2u91uv9+HgQNYLZNWhtdwRxUzpvVxPTcoN2HvAKAgj30tWcOLHbUvlJvD5dBYZKrrOuMtQAE2uk2lUqI1B7bZSGRmusp0WITvTBihKUNCMa4IajK2oQSzA5g7vl+T1BWeAAcHB4VCAYo2qLZD4BIgw7Zt0AEQt2QyCcaHekfD4RCM/l7hPiJYEosRBYwiJpLMecXyZdJkJjsPS/xS1Lfyv7LRxFQOPruFfGNDgDikEZ5BN6aW0eP/Z2LI+J5zzMVudF339OnTTz311Llz5xKJhCzLjuNsbGy88sor169fh2kDVJBoUNrCRcHzvKOjo1arBWk5u5fgS5HAzqwfU4/dwIFWMRpDCJ49xBmK2baNtHoO6iD/HfAun89jWOLug+4xKGSihGnOVtSseYfVjGVZQGA8qgH4RCdiHiqapiWTSUyNXC6HDyONACtAs9kER2u1WuhVrFq7u7uDwUDX9VKphJJiOIHl5eVnn3222+1CrI2ZLtbnZOvhqXUURVEwJ9qLwyyEU2nSopoihRbFwBtNS/z/fOkw68qnBm9CRi6ie4zozc2LJI95GAddvnz561//+tmzZz3Pe//9999+++3t7W24owQUVA+PDg+PSKJsNgsr7Xa73Wq1OLqAUCKWcY4H8PKI/JJMJrO3t4dZIMtysVh0xy0UkBPLZrqu22g0qN1mKsp9cs9JQyjgBrZrGAaGN+ZFJpOBURKikox6sSZbluU4DkI4YkhVLPYoPmGbzebh4WG1WsW0Wl1dXV5eZoNyaOdt24YXELTz3W4X7sbJZJLtJlRVTSaTtVrt7bffvn37tmEYv/d7v/eVr3ylWCwmEokPP/ywVqvxAOPewOohOkKIiSA0qQIORThC4TpxSMSAOG5xi1vc4ha3uMUtbnGLAXHcvugttPMXd8hi3Sr+MBeUQ+52SEbHlBCyWVjlYksJNwbYgwJHAloVCgU4/CYSieXl5cXFRdu2tdEo9Zd/ySep6bqu60PXPTg4aDQarVYLB9/Z2dnZ2Wk0GmzvC3aMc4ARZKVSQUov9uFIkL8HT4lwGgDE+XwedYFE3CnulnEE9AnEZSQk4UJoaRgGknnZ0dWyLP4nyBVB5UCQ4Z4MrTHjOZGWiqX8iCiRSPR6PbYUAGhg0gf2wcRWlmVNsKqAWfMHH3zgtdtHR0cwdJ6fn5+bm4OPLYge40IAEdu2UfgILL7T6ezs7Ozt7cGvY3d3t9FowNmAfZxxEDaHRXc5jiPK0Hj4MYufyltFL1dR2ygqjlnv+RkYMZ3sMsGfpElFZyjZP2pJLFI80UgUF84mzqBgqVTqt37rt7773e9evXoVg3Nra+uVV175m7/5m/fffx93hDljMplcWlqCi67rurVarV6vwxSVxq7ZuGviVWDsARCz2QuiGgyI+QyBj2EWzCOf5ZCgw+CnfJkY3rBbyWazsCTmW8/RGq4oyPEkvvXJZBI4G6O61WohOYCIuPIYCcUtQZNBn9PpNI1NHhCxQJ94ntfpdLrdLhYrXdfhSI7VIJlMttvtRx55BIa2q6ur3/72tw3DWFpaunPnzt27dzc3N0UuLzLEEPClaUJjilRZpIhMPqoODpm3iiL9X+sjAIsbr/Di8A55ENOk7QAb3YgJEHDnsCzrkUceuXr16qOPPprJZLa2tnZ2dn7yk59Uq9WzZ89ms1lJkmrVw26vZRhKMpnJ5QuWZeLCk8kkEbHlOizse71eIpFAiAIOv8gLMU2zWCxChtxutxVFqVQqcKLAqGBkz5eJHwaDQbvd1gcDf3IdCHlBIFQgCmkx3TDmE4kEVmA8OLDQYdwi7IH+AeDG9Ge/CH5s4a+Ojo62t7e73W4ul1tcXLxw4UK5XEbAL1qWM5lMrq2tQSbvui7ieYVCodlswuwFgcZUKjUcDj/44IMzZ85cvHjx9OnTo9Foa2vrl7/8Jdbw6LIsPoPYnYMHhphLIU4BUV0+9SAxI45b3OIWt7jFLW5xi1vcYkActy8uHRZVwzSZ7M/CVd4ZirpCWZYBfUSQJxoNIw0caIZFgplMJp1Og15ZlpXL5U6dOnWsGrbtxcXFbDarKAp1Ota4eg8RDYfDZqNx0O3u7u5ubGzUajXkjDcaDbaYgKaYN8+MnPL5fD6fR14wNIYADdjDY9+Li4Keiz1bVdGYUnACFYW6wKBgFvg9dFggUCDphUIB+c5AAwxPicj3g9FoCIbFXhywW2X3ZGzagZWBLXCx0DiDC4s6R9H6IwgCwzSTRMrmJl9Ls9n85S9/ub++/v7776OLVldXL168OD8/b9t2Op1Goj2sMFhMeuHChVOnTqF7W63W+vr6+vp6rVar1Wq3bt26e/fu/v5+o9HAKQHZsC0mQ1VRTs4gFVJWsJUoaEM34m9DcE0E6Oh53Lv7DngSFL4hYSarBTkqMJVr8B+K4E9EnwyR0Xu4I/grJHSrqoqyaUR0+vTp7373u0888UQymfR9//bt2z//+c9fffXVra0tDNrBYACht2maSGbv9XrVarXb7R4cHPT7ffYXxg/s4sL+1DT27WWVMeYLxwNwIzCoeHRxeUDAMnZfwbfDnxp/xZbW6XR6YWGhUChgivHXiY7k4ryGHh8dBQgIPN3pdOBWgbAT+1SwUQBfMoTSGK5QTabT6cXFRcRvGo1GtVqt1WrA2a1Wq9/vo1yYLMtHR0eNRuP8+fOVSmVhYWFpaem3f/u3r1y5cuPGjRdeeKHb7ULfzd/Lckt0ZnS0nISARUObkACTYxuikhTdzrNYBNNsfRDyPPnMjbMTxCAHEz2+XvFfRfZHgoeD7/sYKvjzq1ev/ut//a8ff/xx0zQ/+eSTH//4x+vr61tbW8Vi8ezZs6PR8PDwaDSSDWMxXUxUKqlcLq3rBvvtyrJcrVbffffd9fX10WhUq9UajUYymQSTtSxLURRexovFIlaSmzdvttvtw8PDZDKZyWQwREejEYcTMGIx/vv9vqqqdjLJqz2WL1eWAX9d100mkzDLprFPEZZry7LS6TRcsz3Pa7VaPNpheRQEQTabRdTEsiyI3D3PM02Tq0p2u11EB3u93v7+/sbGxs2bNy3Lunz58vnz59fW1lRVxQMORi7iE8o0zeXl5VQqtbi4yGRcUZRGo3H37t3d3V0iymaz5XLZ9/3d3d0/+7M/+9rXvvbkk09eunTp3/ybf/POO++89tprL774ItYZHpNgxLi/ooMwL8VRqbvonMMf44PwnI3pcNziFre4xS1ucYtb3OIWA+K4fUFbqPI48wv+AKcM09h+FNtyEswZaTJpl50cTNNMp9OpVAo7W8dxUFZrbm4Om/xyuby8vLy2tlapVEC1LMtizusJ+KNRr99eX9/y/e3t7bt37yKBXRTJQmMLjSHTXnwXpGQwPRiNRt1ul10LsGUF5sbeHgWFQgasjFwZl4D/QlCJzT/6BP6nRISMe4imy+UyPDTEDFzPQy2oQNc1pEh7nk90bBnRaDRc12M61u/3UaAMtwD7diZWkP2KBhEiirIsK6soumFI3a7IOPb29jqdDhDb1tbWxsZGsVi0bbtYLJ47d+706dOLi4upVIotg4FX8DNcQRYXF/v9/tHRUaVSSSaTlmXt7+8zlYMtMvoHY4zpJDpfRPAhYwc+f5HDiiWSxCx+ts2lSW3vSYAY3DOUQy0COPHzIqcOVRITxXSy0EQxPrM8WPQCxfb7ffT8+fPnr127trq6Wi6XH3300UQiUa/X2+3266+//tJLL92+fdv3fdu2B4OB67rZbHZubg42LIeHh5ubm7VaDYcVC7uxBTbrduHMK2J63AjgPIxeDo0cT71xYyU+dIigVOJ0xl+xchzzolQqpdNpWFKAbrMkfzQatdttNubu9Xo4N9HJGv+PSQH1JWMmvl+u68JwlkcCk2L4MiPlP51O53K5Uqm0s7PTbrdhW7G1tQWOnM/nu93u22+//dFHH505c+Y73/nO3Nzc3NxcoVAol8uqqtbr9ZdffhkqZp56IY0wTdYkFOMQohMxD1FxyIWE8KFcfvE/eZixOF0sO/krtuhIDs0LjpRwWTNWc+OUeJKyXY9t22fOnPmDP/iDZ555JplMfvLJJ//1v/7XP/3TPzUM48yZM+l0ulGv93otz/MHw2eOjr4kKf7VucO1VdWyslDHY4nLZrMIY8D0A2QWQbh6vZ5IJEzThNbYcZz5+XkYGR0cHLTb7a2tLTyDYP4gOghj4I1GI0VRlpaWsqurHI8MfL/X6/XHkwijGiQaS/FwOGw2m5IkIZyWTCZVVWXtMBZArmvXbDZZL8wjxLZtDOxOp4P76DjO7u7uu+++e3R0pGnalStXrl27lslk+JI544SI2NkJLZPJwPkHyRzVarXX6yEvBNwZxe4SicT+/v5f/dVfXb9+/erVq1/72tcWFhYuXrzYbrc3NzcRgsLxMZUweTn+Ibo2i0uoaEojehaHXi3ESRG/d8UtbnGLW9ziFre4xS1uMSCO2xexidKekOktNvwipINEEcpQNg1gjiwCYmyPoeHSNA1WidBOYl+dzWZPnTp17ty5paWldDrNwjpkvLpj9IzW7/drtdqR6x4dHSGnnkvDIVGXt6kgFMBY6XQa7pCMz+DuyuSX03XZMoKNU7FJBgoJJXejH1CV3jCMZDKJ3GE2PvY8D74ZKEMErkdj2w00UGIieBybhmESHXv1KooyGo1M08BXM+ajyRp0vC0XLR1I0CHS2Hw25fuaqpIkkUBCcUBwc7i17u3tJRKJSqWiaVo+n0fxqOnrhapms9l0Og3hXrfb3dvbq1arkH/2+/1mswmoAfiIC4fClx1IABE4/DAVEDPrFOkbCcpihhS4m58WikV/KVYgpGkVAqPJ/iIWwX0RTUs5jAGXFUVRUDsRgPX8+fOPP/54IpEADMI02dnZ2draAv/itPRkMlkoFDRNSyQSnU6nXq9Xq1VZlhH/gLc1yjZyYS6AVFiB8zQH9wFH5mkOY2Lo69kXgm1YQKNw8nB05SlA45JZOA5gMWSksGrhim3sAwumjCENfS7fRJwGF/ISBao4c3Z3ASKE8wCiDjT2cqGxGwbmBaSm6O1WqzUYDJrNJi4Q5c6q1SrCQpgRCLeUy+XTp0/Pzc1BfIouYkh3khwyWttN9IugafXoxD8UxcUiIBZF7iLA/dwfBDTpLCSKo0Wuh/NEz+NG44Zy4McwjIWFhUceeeTRRx81TfPg4ODdd9996623Go3GyspKsVgkolq97nldO5kdjlb39x9O5wbJlDpX8Q0zl0gkAU+JCIGoIAiOjo6QVIERrihKp9NBgAQG091uV5IkSNfx+WazCesbGKkzsscJ4zLhT4KHFF+eJySjgDhjTcbcAf/lqqqihQJXZWSpL2IS/DRBZ2KEs9wYMZtarQZ37LW1tbW1NUjgWfkuJvFgiIrxUV3XkQvSbrePjo4wkpEFggE/GAxyuZyqqtvb29vb20T01a9+NZPJXLhw4cqVKy+99NLW1hYvs3x6bKNBkzk00diGWMAgVKpOFKE/SAwvbnGLW9ziFre4xS1ucYtbDIjj9o9Dh0OKSMZGIhETuQBFSjOxeohJEJsOc2F0bLMTiUQ2mwU8zWazxWIRVYmwOcc+GZ6MXq+XEQDxYDis1+s1xwHK5I0xtugwrOC9N+xKFUUBXwNUYu3kYDDgxHZWtoI6ATkRkWmavBvnDTknVgMrQFxmmiY+zMcEHQMBtywLGjeuysXUUVFAH6TAD4iIpOP74boky4rrqr2e0etZjuPDyXcwGLieJ4+ZIxC2mLc+lXWCJjM7RtM0LZvJBL0ergsgA1QFmuWtra1KpVIqldh29h49GTem51Bilkql/f19IBvcaNwmgBgaG1+oqsouELgpfLYsAY7CiKlUNwojPpU2TUyUFulG6DM8EegE6wBmZ1Gvah6foC1MkPnkDcMolUpLS0u4C7Va7ebNm7u7u4eHh/hXQEmYdcCfdzQaHR0doWAgvLyLxWIul4PiEh3Oder4/JFWz6gRoArMF9n6uL9QELPlKIt/OTlA7DqWZIr+vLIsw4qaLYN5ykCNiGMikIDv4uQDDFRRC88hBP5PVilimDGa5MpgUHp2Oh2cCcAZqDr/a6/XA1nudrtAh7quO46DsmnZbBY3Lp/Pr6yslMtl2BazrFJUy4Y0v8y/oppfht2hinZRQCzOXzGCIrLpX0eMUJx3YoUxXtt5ySWhUhxGHTAiVtFisQjT4StXriQSiZdffvmdd965ceNGEASPPfYYoHyv11cU1dATiYRFqjmUTMlQkum0bTt+II9Gju97AJSKohSLRcMw0un0+vo6dMGappVKJWh1R6MR0hdUVW21WpZlFQoF3CaUKOx2u9lsFrEHnC1uJQIYvu9Lwhg7XjMNgzvfMIxKpSLLMuIKvISKdURDzrwc8MCcGg6HMDJGeFV8XGLo1uv1w8PDer2OyMTa2lo+n4fTRRAEonkRA2KMPTyG+KxM06xUKvh5e3u72WwikqfrOjg15jvWkOvXry8uLmYymS9/+csbGxv/8A//UKvVcI2gz1goRBU5OyyJ9RjZWkocSyHx+6/PPjtucYtb3OIWt7jFLW5xi1sMiOP2eTZGGKINqwjRRLYFQRNzAWxWxZ1hMpnkbTAR9Xo9/G2hUDh9+vTly5fPnTuXy+UsyyoWi9AO41CO4xweHm5tbXW7Xep0sv1+bnyGtVrt9vr6neEQ0lRd10HNEokEIBqNzV6Rz4uzwtYaRBh0oNvtttttJJszMmOgBrjGVpW6rkMCDNrFcBxny98I98lmszkcDmG7PDc3d+rUKRgfYz8vlJ5TVNV1Hdnz1YC8ICDyyfc9Pzi2jFDINQzLtr1cLvB9FYJc7NgHo6FMxxJpNnfmrTiDV9wywzBwFZqmqUIxMWRGnz9/3u92uW4Y6t0h55ozqQeDwdmzZ3O5HAr9Tc09B6RYWFi4dOlSEASapuEIQAYoFIb7xaX5oDZFw1ji+n7swnESHQ7xWbHAHQm1p2azsFA6f5RriJaaogWnSEhFh2IOsZCgG2VaBI02O7EgeIByUmfPnj179iwEkq1W6/XXX//7v//7O3fuuK6r63o+n4eaD0JsTdMgnId9R7lchgNDoVCwLItV8PgkRjiNJfZMoyDXxdgAdIMRCmv/GW4Oh0OUiQOlwoUgWoC4CDu6wCUZnsVBECCnPggC6DohqOz1es1mE8yu2+1irMKsVpxuSMMXNcLsIMExBmapsLzA2cJGg/8T5sXobdu24QOL7sK60el0hsMhPDrm5uay2azjOK+//rqu6w8//LBt26hy9vTTT29ubvq+X6/XQfm5jBtbPE8VFOO0MTu4mBsPUXHMiH8VrfnJcvtQfgadLEb+bHhYpMPsG8A9z0JXxMOGwyEMZEBdwdlTqRQiTFeuXPnDP/zDL3/5y4lE4saNG//5P//nF154Qdf1q1evnjlzptvt1mrVIPCymbSiuLphaUlFyUl2yUylE7LU7g9GQeCoqsIYNJVKZbPZZDLZ6/U++uijjY0NrMBgxL1eDzEqMRaIgXpwcOD7PlJSUqkUhuhwOMTVoVqj4zgeoinCXUhYVn98l+GStLCwcHh42Gw2MWaIyLIs27Zhfg1Qy3btJDjVIBCCYCQeWHz30eetVmtjY2N/f7/dbi8uLi4tLV24cCGVSjUaDfgmY4ayfzfWBBIqlyLoglV3fn5+fn4+kUhUq9WPP/7YNM1Lly6dO3eu2+1ubGw0m81UKjU/Pz8ajf78z/98eXn5iSeeeOyxx8rl8srKyltvvfXGG29Uq1Ui4oc7h4LgJ8OeG2wZRIIJCUUc2zlGJRoExS1ucYtb3OIWt7jFLW5xiwFx3L6ITdSWhpAZje0UGHAQEcR6ItRgrgcYmk6nUV8esjvgp1Qqtba29uSTT168eHF5eTmZTIIvSJLU7XaBEbvd7q1btzY2Nvr9vjoYrLTb/C1HR0cfffjhlu9LkpTNZiGZZENk0SkVBY64uhqydCEYBE3odDooFiQm3TOKgu44k8lks1nTNGFjCqgkWgewsG44HELR2W63XdeF4/D58+dPnz4N0SISjhl5yrIskVetmRubcrUmqQoRkRf4vu+5nusHvu8H7tB1RwNVbc1VDlXN7fX6pmlIktTt9mSZPO94iw5vDWzg3XHjm8I4L5qTblnW6TNn/E6HsVqn06nVargLqD+2v79fr9dv375dLBbL5fLDDz9cKBRYEi72g6ZpQBK5XG5hYQGavlwuhxMD5gCyAQ00DANIut1us5cljZ2jRZV6qHycqPllJanINB+EPojwQvQwIUFHzEnl4p+IUROazK0mQVQbsm3FTQFOhf2CaZoXLlxIp9OnTp361re+dfHiRU3TfN/f2dl55ZVXfv7zn+/u7ubzefQ2S2uJCIENcJmFhYXl5eV8Pg8lI9eNhJK91Wqhghy4HlwjmC5lMpm5uTkIh0ulEvh1yH/Wdd1Op1OtVuFnCmEyIBF0u4lEwrZtCJ9h/9JoNBB0abfb4HRchmswGKCYIfoQRuQ4SCqV4kElypbRkxAjszaZ1bgYBqwOxq3EYEaYBwQTbgCICeVyOcxi27ZPnTo1GAxardbu7u7+/j4kqKZpDgYDsMj5+XmsJFevXgUfv3Xr1tbW1s7ODqAzh8po0rpa1FEy4RUHedS9JDSbWJHKxD8k4eTYw+fG2gT0zC4TWPDZ550HjxikgRwVnrySJOFedLvdc+fOnT17Np1OO46zsbGxu7sLEW46nW61Wq1Wq9fv6aqiqhT4LgWeZilKQlIsCsjtdTuDkWJZNnx7cJv6/T7OMJPJ5HI5hJ06nU6lUoGbcLPZxHMnlUphqXccBywb/c92GciW4CcaAm9eEHjC6iGh/puqIgEFVVXxTDEMA4YtnBCA6cDPIIahuN0IDbL+mi2b+MGKjArUWTVNc2lpaXFxMZlMwqob0R2xViEGAFgwVgZgccjhEd2EFw08Z3q9nu/7q6urCHO+/PLL3W4XYP3WrVvvvfdeEASrq6uVSuVrX/uaqqp3797d29vj2rMh0TqHOiCl538VI2Sh8c8j/KSwX9ziFre4xS1ucYtb3OIWtxgQx+0LRIdD0kiReQHCwgiV/Rm4NpHITKGoArflfORMJlOpVBKJRLFYvHjx4tNPP43/ZD+B4XC4vb19586dTqfT6/U2NjYODg4cx9FGo7YAiHu9XrPVckwzl83Oz88Xi0WYjXJxORoLEqFUxd4Vm/lerwfMBLgGogFJF7b0ICBglPl8HjKuXC6n6zpLX8UyO+zSiGT5drvd6/XQA+Vy+cyZM2tra4lEwvN8z/MC35WlQNOQpC+rimRo0u1166/+W+r110zToEAlknyfAp+wCQ/cAWm+c/784Xd/xy3k+72+LpMvk9fv9fwg6PWHw5HHdpZAtMzFcAe1ccMF4paJJFSRZcOyIH9GFjNkp0CKvV4PYr29vT2Urdve3n7kkUeKxSJ0ZECBUHQCOObzedM0V1ZWXNfFjYNVKOSc4IayLHPBKHiJMgJDx4KYhOBv1PiS/bJDkYwHFKnN8IHl6YAzYagkZvqHCohF6bM6buBr6CjLsiCelWX50UcfvXr16qlTp86fP59Op4MgaDQaL7/88gcffNBsNtmLgDWqYF4gnpqmlcvls2fPLiws2LbNnIhNqCVJGgwGjUYDkvZ6vX5wcNBqtbjs2+rqKvgdFMSwfcD4Zy9vxAkymUyhUGB1OZggvguKUdyC4XC4v7+/u7tbr9eBdNvtNhYHVpjWarVWq0VE6XR6eXm5VCoZhsEHYRl7r9fDbIJwnsYCfxGhgj4jwMOzgIcQl8eEgQA7HQMygikXi8V8Po/Az61bt5Dgb9s2EX3wwQeDwaBUKi0sLJw5c2Zubu6xxx5TFOXWrVsvvPBCo9EA7odmGQYIDAHZ1oMmfSRET3AeJzwfWWscKhMqDjax+CF//nMUY7KVUMg3mUX0YpyJRwviUugBhCVs215aWnrooYcymcxwOLx9+/ZLL73UbDYrlQrqAR4cHAQBmYYeBFK305clx0pkrLQlNRVH9vzAVVXPko1UKpXJZDVNRUYCskaCIMjlcufOnUNArtVqHR4eIs6BMAAqZ6bTaQwkyHXRjb1eD2s4l9RDbx9XWZTlkN8HahjiaQKbIEa0BwcH7JYD5xYxdsJ9gmcQZgoCdaJtOgY8HIo5fsaBExbjiz7sGOpscMzhBKiJEXzCCoPBY5pmKpVqNpswr8hkMvCiaTQa+/v7eFi7rvvJJ5+gZt2pU6eazeYrr7zy/vvve56Hxyuem2wiwSOQCySydw0vyCGrn5A4PX7jilvc4ha3uMUtbnGLW9xiQBy3L2gLbduYTImF5qCc4pI4LJMUt6/Ye8NpEUwHQMqyrHw+n8lkyuXy4uLi/Pw8qBZ/HWqv7+zswFwYwlXP8/TRyBnvQo+xiOcpsgwEkMlkgGmYVpMgfMOReQeOSvGgKsiK5VRxxhz4V3ZJxjlz5jsTZ97kQ9rJOcvwtTRNM5lM5nK5dDoNfOy4ruR7qiorrqxIEkkkKSQp1O0q67fMjz6yJEh7xY2zRIFPquRbCYcCw9Bd3yfLtOyErUiSF5AfyJ7fF28fO0VC+cX9wNyKjVO52z3PUwUvWqTP48O4781ms9VqdbtdlPbSNA0uE5Zl+b4Pr2Hmkq7rolifbdvwGCkUCsViEbeJ3ZmR3I0Rgp/F86FJX9cQAgv5Qog6Yla//orITIR0oD8ipBPr14li4RD+YGSPfwKyhycDOzwsLy8/9thjpVIpk8lA/VetVl999VVoLWGDAL7PedyDwQC8ybKs+fl56DEh/sUvoTRk/gUlLOIW9XodtxWi3UqlsrKyAjILtBeySOakAXBtxAxA6BgQJ5PJdDoNOAXhPNaNdruNe81wHHYlKMqHA87Pzy8tLUFRzsUbAYgZyuNs0eFAsZyOgFJ4YNZsCO44TrfbZd8YOM/oug5NPQv8IXTFMpVKpWzbhkYVSQb5fH5ra2t7e3s0Gl2+fPl3fud3KpVKoVB46qmnlpeXd3d333777X6/jyGNuwn7ZrbFCLlgc3gjSs3Ewowhk9aobDNq/v65p+rzUBdrKmIkiNp8/Ct+jwgcBhX6fG5u7vHHHy+Xy9evX79169b169dfffVVz/Ng2eG6rqpKmiq3+xc3jx5qDS3Z9JJeqpe82LATH+y5L75e+q1rfrGoqqqmKDLKmWKNajab0KTncrn5+fm9vb3Dw8OdnZ10Og0VPM6wUCgkk0nMzV6vB3ypqiq05Aj1cWCJnW1kWRblr4hjSYUCHCQ4lum6LjJj+FmDb2m1WhhLmOPgxewCgY+JhV55WR4MBijsCT1+MpnMZrMILCHwJpYe5fiN+KhFxctOp4Nij4qi9Hq9RqOxs7NzdHQEvyPf97e3t5FGUC6XXddFzbp0Op3L5Q4ODv72b/92MBg8+uijly9f/lf/6l+12+233noLT0y2thCNTUKDmaMI0DVzXoW4UIvVF2OXibjFLW5xi1vc4ha3uMUtBsRx++I23rOJ5c7EnG5Gw4yPxa0gPoaNNAvciMg0zVKptLKyAlMIVFHn4yMrFvv8/f39VquF6lKgPL7jeJO7UE3TTMvCjp11hVySC2eCPSpgFhuewjmBZXcsvxJ9A3Dh0FRmMplkMplIJMAO2BtX3PGKxg7Yh0NoBvxERI7jeO7Icdx6Uzs8skjVFUORZVkxyEz47x8ZdUt2cxIZAh3GDzKRS4EsNSzjw3r+SLGGA7fZsJuNxGgwlMiTnA1v1PB913F0IGz0PESmwOVsxgoEr49GQRCQQHlGoxGN7VBprBmE+huoC5I0JneNRmNrawvVlvCv6XS6UqlkMhlAHJECaJpWKBQqlcrc3Fy9Xtd1vdvttlot6FIZH2iahu8iwZsV5x8yahDZmVgRTjS/JsE7+wEjItHQiCS0EKoTnWFpmhmL+DNPEEbw6GFI6VGbEUXnhsNhu90+ODjY29sbDAbsxSwyQcw7uJHCFJurYyEJHaQVX4TxYJom/op/T4IHCzyIMWZYn0tClS32cACr5Y9xHTmYZmA6Q/mYTqf7/T7U0KLCERMEzgwIwKRSKXaWEJcdeBBjDIPrsfcxoDOiNTBdRbCHbzoIIAseQYcB6VjsydOh0+mArdu2jXBOp9NRFAXnDwl8Nps9jlTpOixuFxcXy+Xy1tYWLAtEYBct3Tk1eBBdckOOwyHXlNDnmeF+joiNxfDRL+I8CQ4DcJyJuSfmr6qqlUrlySef/NKXvnT+/Pl+v//KK6+88soryAWB2wwMImzbkGn0wZ3T281nGsOi5AdyQw4UzdPlQUP97z8v1++YTz3ReerpYSLRJUoYhomnBswrYGcP23rf9w8PD7HCw7/FdV0UrysUCoxZxQgiK39DztGSGKGTJE1Vc7mcVirhEcDF4kKL/3A4BJnFBBSfmAiiYB3DDBI9OnhUQCYPtS8Cn3h2YAAjyCF637NPBdTB8OqB6L7ZbGLGwRlmfX19f38f6LlcLkNkDYCuKEqtVkPtPkRWNjY23nzzTcMw1tbWnnjiiVu3bu3v79+6dcv3fUiwYTKDGcSpNnz3SVDK84rHHimhGfGp6ojGLW5xi1vc4ha3uMUtbnGLAXHc/nEa0JIoCmYZI/axcHLAJpaRGTbD2HuDIDCxmp+ff/TRRx955BEoSVkehY1lq9W6e/fuJ598cuPGja2tLWzCURuNC8fxuem6nkomtUwGAmR4RHAVe055xoaZRcHD4bDX67HXAcSGIoBjOoz9PNwS5ufnS6US6mUxlORvERkKDDfwh7lcLpVKoWKY53nDYd8Z9Ucj/6Nt67//stCTNNmSJJUkU1KSQXWg7FzSqEKkjOHEPQEbkUOBKx1Y1t82Voy+5znBqOOMWkNv5CnSaFXqpjofjYZdTzJ0TWN+DQMQXCPcNsDvPM9T+v1QBa3hcOiPbZeZfQBzgPhIksSl/Pr9/vb2NsqC4bssy7pw4cLKygquFwjp3mqiqqurq1CRo9rS4eHhrVu3Dg8Pa7Uaau7hIODRcAyASpR1uyGGy/eL7xoPV74joUT+2YCYfQlEEs3kiBkHfhNN6o96szDgxoXj3BDPAHNUVfXUqVNPPvnkmTNnoDzt9XoHBwdbW1u3b99GATr0PMIecBdlFX86nQZWzufzcEcFv0NkAl0q+oYD5WMmQm4PSwfLshhacfksvhDRRhlIl8kUpOWiQS07DEAzjtt3dHTEtQf55G3bxnoCOA57bnBndvVFPj6E/Ji/oMnsKcyJ9o7jWJYFGTsJLjHgU5BUY3QBT0P7zBeCBaHT6eTzecuylpaWWOc+HA7xpUEQ7O3t7ezsLC4u4oAXLlx49NFHa7UanKDZ9xk9FvWXiMYboiEKEpxSeG6GfFRE9e6vr8xXSO/Jv2Q5PJseMBDHXUNnlsvl3/7t3/7Od76j6/pf/MVfvPnmm++//z4RlUolSGuTyeT8wkKxkPG93mYjL+lm4Bu+JnkSkU8kkytLn9yyN1+zel1l7dReNtPzXCkIJNO0MpmMoigwue52u3B+KBaLeFLwuoc7m8/nU6kUF8NstVoAxxzEYitnjBnP83BLCNdOpGpaLpvV83k4aLOxNSYLjRNfMMjb7XYmkxFtZ0ROetLNEkcIwi2Yp5huHJXE3EEwA4pjpCAAc7MSGRME9+jo6Gh/f//o6Kjf78uynEwmFxcX5+bmsOZ7npfL5SqVyuHh4ccff9xut7Hmb21tvfrqq6PRCDriCxcuwBOG/eJxnniwYsKKsmheh9mXGSsMM2LmyLF8OG5xi1vc4ha3uMUtbnGLAXHcfjPoMGMyEmRiyKcWsRFbDyNnHHQVlg66ri8sLBSLxXQ6vbq6+vTTT587dw6GhtD21ut1iEmPjo7ef//969evb25utttt0WbR8zwafyOaaZqZbFZPpVifS2MlLDbwNC5UBekrsBcIMqpXATdDXMkCTHaWQLE7qGLn5uagQWPoPBLMLtgIEsnvgHpAwyhnpGma47rDwTBwhq5DW77yipRsSaokEclECkkKeXPknJVIB/gh8sc/HKMg8kdSo2u+19OkgMglUgNfC8gl2R9le2/bTc8d9vqeOxpjAgALlndBdIlLkCQpMRyGRIKe7yuT5Zs4nRk3Ap2JwkeO4/R6vX6/j7pkRJROp5PJ5NzcHKgxMvcZu2uaNjc3Bzn2+fPn2+323bt3k8nke++9t7OzA6TOEjnczU6nwygWij8gCXdyGIT8iMV6UEAnDzLURclniB2TUGZKxBlRvwvO9WY2LaJAuB9gpMEUGA4Gly9f/va3v33p0iUYgN69e/fVV1+9efMmasrh3nGQhiWHyOKfn59Hr87PzwOBgUMxDGV/AD5JFIfMZDLQxuZyOUxMwFn4cSORnOc+jwdGVCLNZBErJjvQG9LhwUx1Xd/d3QW65TiNruvwbDEMY2lpqVgs2raND0DmCQqJrHlN0yzLAofCDMXH0IccCup2u0g7wNRmdbNhGNlsFiQd1hn9fh+24zhUr9er1+vdbhdkc35+Hp7mzWbz7t279Xrd933DMHZ3d1999VXDMJ577rnFxUXbtq9evXp4eHjjxo3Nzc1er4dBIlrWiGXoWELOg03UpHNAQhxFISMCkdhyz4cA7q/eJCJpbEsiyqJZy88xJHb54IQSWEAkk0nLsh566KEzZ85ks9lOp7O3t3d0dOT7vmVZ2Wx2dWmxkM/lspnKXCWfS0k0unWQNz5RySfSiTQiEHKNPFMakHxr03r7vVSp2M3mRn6fVFVJJpPJZDIIAiQioJNRTRQBBgQqEInBioFzS6fTAKMIY2BIM7681wmGYRiGPO5V1LuTLIshMhyWYZuO32C9dV334OAAEzCTyfAchOSZATGGtxgJYOcfdgTicpQYHqKbhLjmiAFOpIyAkquqCsOKjY0NCKszmUypVMrlcvl8PpvNwkwGJB0Ww61W6+joCNFWoGdYPJ86deqb3/xmKpV6/fXXt7e3eWUTUw1EaTCfXrR2Il8+z4gYEMctbnGLW9ziFre4xS1uMSCO2xe3cS48kylADeAVBgehGkrYb4O0YisIneDi4uLXv/7106dPo8IV6DD2w91ud2Nj486dO3t7e91ut16v37x5c3d3F7XXsYVmmZIxdk5Ag8VtYJos2cM2FYCYoRjX6hExGRccI0EXyRn6kBxC6YmtPvRc+BMAJrASkAXshMGqoGqEODqXy6GuERF5rksBKVBWLSmDojzUpECTSCUyiSwKbKIkkUYUEAVjRuwj5ZvIJ+qT15K8jir5RC5Rl4IekUOG4+mbRmaQtlQyfE2SiNXNoDkiaeI7ZQWBIsBTSZLksckG7/NF5w2WoELoyngIqf2SJDUaDdBe27YrlcrVq1fPnj1bKpVgvowvLRaLqVTq7NmzjuPs7e3Nz88vLi6++OKLOzs7OGEYVgCmwMYUFA+GzhgPDPFFGRoJZqkspiPBFHv2aBfrgHEsROR3OLJYsJH7VmSviJRwnjX7mYKtw5cZowhVsxKJRC6XO336dDKZlCSp2+1++OGHL7/88tbWFhFBY8tTD8fh1HiUVpubm0PHGoYhls7DD0yXcEosJE+lUij4lslkQJbBeoCoFKGRYOXMDq0MOhn6IKUAql5MpUQigS8aDAZg4pg4HLFIpVKg2yhPR5NWBnxHEL9Bb4uLEkYLXIa5pKRpmtCHwvUV4uhMJoMKkww9YdJarVYR6IJltqIoo9GoVqvJsgxAnEwmUWEPNS2Pjo4ODw9935+bm8O/Qoy5urrquu7e3h4k4YhOif2PyRJCY2IEgokwdzKjefZGFw0oaNL/hD5vlwlJltmsGYOcz0G0JMZFsTE9bnE6nf7qV7/61FNPPfzww8vLy51O56233vr5z39er9fn5+dL5dL58xcuXXkoVyybVsKyrISp60qQ2SmreYNIoiSRTqQSKUQGUYV8Rfqklfzf/k4eUvX3vnGgKD3XdeFhgsHQaDSQ2aDrei6X4wwSLE3NZjOVSsH/BMQ2kUgMBgNEaxgThyryecOhnstBKA2nnYRtD2WZReX1en1zc7PRaLD3dK/Xw78eHh6iK9hxheMEiJfgl2yfHQXEYrSJoz6oWYc1EMOYAzAIrWEONpvNer3ebrfhAnTr1q27d+/CIGV1dXVxcRFe5HicmaaJ/BtVVUulUjKZRErH3bt3Dw4O4DuRSCS+/vWvf/e7333ooYey2ex/+k//CeX+NE1j/xYiGgwGJFjGi7kdHOHjHhad4uMWt7jFLW5xi1vc4ha3uMWAOG5faEDMgAabW1ZCQYfLG1d8nrNcIfcDkw2CoFgsnjp16tFHH33mmWfW1tagLDZNEwC31+vt7e2heNHOzg7KRu3v7w+HQ5Qe4rpe+LzpuqJxwXFeraaxISaYBZStjINBCljyDGFsMpmE5ylfKUMQrhsGETR/I7a+OCCNBWvAf9BBMztAIjwAMdx48YeqqqiS7pNkmIpSJtKlQCFSiEwig8gi0onA3AIij8gbK4jxnwpRQKRS4BM5RAqRTJJD8igwEmomm5VsayDpkjRRjq/ZbHKBKcBBwLuc4yiqSpJEk8WmmJCypTLTUsjoYGULyoZLBhHrdrvr6+v4cLlc3tjYeOyxx65evXrhwgWoxRE5SCQSiUQCRhMowdRut1H1rtvtArgwDcF9wd0HXgGYYH8DBo5TKyB9BnAWLXwn0mdm5ScJNkV4J4Ie8W/5ByKChQID0H6/DwqJGoCixpCz4HlWwsgFzAjjkA1hufqf6JoiDmNd18FkQ8ydxlkC7NJLk0a68mRQQbT7CBUYFA0WeCbi96wOFr2PWbouxpzEyc7/JGpsIWYX1YiMudnFNZfLlUqlbDbL34Lad8PhECpIgHt8O1fPw6IHMSxU81hDqtVqtVoFOCOiRCKxsLAASXK32+WYSshMYGrFOe5D8cOiSjRkci2OMfEW/Do0mLz0AUSKjttYW1gDC0CM+oTD4TCXyz311FO/8zu/Y1nW5ubm22+//cILL9y8eTOTyayurpZLxVNrq925i7eTSx3flNqSWpW0gK437balUYbIIFLGNjsaUZYCi3pN+WbPfH3d/Gednp1QZEXr9XoY9ijMaBhGrVbjoB0CSzAdUlUVng/sfDIujqeyKwIrdjn84w+HlEzK49kHqXLP84Ce4e0AFIuewXzRdb1YLC4tLcFTCEXhYH/BQn7YldDYrCN6i/F7GttWiFJ6uIcjOoIhioNjqcQI7HQ6rVbr8PCw0WjU6/XDw0Oog+Gkj5glxNcsrMYosixrbW2tVCrt7+8jxLK/v3/79u3//t//+9ra2pNPPnnlypVGo7GxsXH79u2tra1Op8NeRiHjfhIKLXKoAwt1KKXjQTzi4xa3uMUtbnGLW9ziFre4xYA4bv/IdJihAEMuhjgs0uRfclo6aCnSfkulUrlcPn369MrKSrlcFksbQU7YaDQODg4ODw+Pjo6648bKJlAbOAsHQaBMqwnGkkYcExwHak2RGbH2DVtiCNCg0MQ5A2rj6wB5SXAYwB+GzEM56R4/ixXqIIBFXTumz4qiqBKpJMmBIoH/4kgukTbGwdJYPuwRuYLFhDv+34goIHKIRkRDohFJLskkG4ah6aquWbJgqQmbDthrsDksutdSVXGvfszHx36aNFa0iUpYZPpzSTpFUYbDYb/fB8BFkj4+X61WQRxKpdKZM2eiDAtWvPPz84PBYHl5eW9vDx0I1oweTiQSsixDrI3D4p90XcftYJPNkIxXhMIPSB9Ew9AokovOiOhhGbiIqBodxXidma+maeVyeTgcXrly5ezZs+BHIEobGxsHBwdIEodNsEivSDCB5TJ0PPjB6/EnQM9cj45T6bmEnWma8OFlmTAuE9AZAkPR6CCk+BMNRmksw8fXAdKNRiOk/7PfN419YDAIYZSMMAzGJ9fQg8qSvWX4FofKAzLI5n/CgITbQz6fr1QqhUIhn88vLS0lk0nG1jBIkWUZylNZljF02Yi23W7jKmzbLpVK8KDA0jEcDre2tm7dutXtdtPpdLFY/NrXvra6uppIJJrN5t7eHsfA2CU5SgBZYiyuKkz/RbeTkwZwqHDi5/wMmKR7PABE7wtMYdgUwE/Gsqx+vw9CmsvlOp3OjRs3fvzjH7/22muWZS0sLFQqc9l0KpNOvKNnX3TKu10zOCKpTtIgGBwqPZKDBJE8/p80FhHrRBr5ntRRpdHIsU0p8H3o37HGgsYiXoXHECeR4ImA0QW9LaKYWM2gHMcyArw7EeSYjIC22+2+63KkhyE+egblIpPJ5KlTp86fP4/yhlATJ5NJXh9Q4A7m16IoW5xNookE26rgmcXWw5zlwHb//OTCg6xer+/u7jabTVSlM00TmRzoFhyTTbrZkYPrPRYKBfzt9vb2xx9/fOvWLciHL1269M//+T9/5ZVXjo6OarUagkz4arEqqbiW8thm6wya9GeP37jiFre4xS1ucYtb3OIWtxgQx+0L3TjZVkxan5rXDGbHlYu4bB1SvHO5HLt/0lgVhWx0SIbb7TY0vxDo8aaX1UmgY1FAfHwmRDhP0B8uHCQaAoQkkEjITaVSSK5nCbCmaWCUqOTOJafEwjsUKZLGncP4iYleSCqoyIoskRJIsicdI2BwAH9MhwPhf57wMwmOE/5YXOyNkbFHmqIZpqGTr6imIsvsXElErVaLN+pAeMBeifGWXmSg7I0Q4oB8Uxi4Q1GO+y4ieHzpcDhsNptHR0fgCNAYZrNZAA5uEBTn8/lCoQDwwRn6iAoA0rG+MvRFIV4fcgeezdeirI0EORsrWEWBZxRnhEYje/UybAXcZMcSFkSnUqmLFy9ms9lHH330ySefNAxje3u70Wi89dZbH330UaPRgC0Js1cuS4UhjQGcSCTYYrVWq8E+GApHfCmkhfghk8lkMhnLsiCizGQy+KRlWThbDFeMHBwcQ0jUAouW0CFGSeNMfJhswHJkb2+vWq2CEXMJR/ApWEzAnhveDtBXAhzjrNBXoG8io2RWjrOFMh2nCvlkp9MxDCOfz585c2ZhYQE1uDCpuUCW4zipVAqKy729PdjdjEYjXdcbjQYMoG3bzufz5XK50+mgKhfq1P3iF78YDocrKyuPPPLIpUuXnn322YceeiiTydTr9f39fejfwezYqZxjNlxDT1xgRfwt2rzweBMHuciFpxpnfy6LP2ZfNAwgxkt4ZYCPs+/7i4uLTzzxxNLSkuM429vb77777o0bN/r9/unTpxcWFnL5XCqR0I10T0rUZK0mqz6R5EnkEPkUqMe16QjO7MG9HySVZC3QLFhUuySP5H4f/aaPWyKRQOIIe0+zm3yoYBosGrh7MZx4ueZ1xvN9eXJJYWMHBDnwjEMNVV3XK5VKLpdbXl5eWFjA7zudDp5omKQchoTBRWgB4UJzGMyYDrz48ArMXjH4PEPtwWDQarUajQZskXFWWEsNw8hkMtls1rZtdgdiT2SxUisL8IHaYRjd7XavX78Ob6h8Pn/t2rV+v//OO+8cHByECoTyeOYrokkvFI6CcDBPnBQnNZmoTHSOaG6cRRO3uP0TaD2iO0QfEw3jvojbP/Umj7c7cYvbbwAAGSu14ha3uMWAOG736ADv4pgHsRMlOKNowIrKY9jWQrqVy+VOnTqVTCbPnz//+OOPnz17FkaH+MDe3h5q0DWbzc3NzZs3bx4cHDSbTRQXQjIs4BdzKOwktcmsc7ZuABEGe2KrB95gM+MDarRte25u7tKlSwsLC8lkkkkHyq9BDNXr9ZBUTkSwS4ZDa5RIYrPNBYu4wFcikQDrZKmjpmmqrque4/mk4E1JOa5Qd/yDPBYUS2Mywk8naVJZzGh4SDQimeRcJr+QXFADd6SY6hhHyrLcaDSCIOh0OlBVg9frul4qlRYcx7QsSehMwzQbtRpLUKHOA+qCXhWAmBHtcDhMJpMHBweNRgN4Xdf14bj2HeoNIvEZRrfXrl1bWFiAHS1/aSaTuXr1aiKRqNfrGxsb/X5/a2sLaKPdboMhSpLU6/X4NrEml011mbWxFo/v/oMo1KI5/lNvNAkmuVG4TEL2NEMoPiWotn3fb7Vag8FgcXHxa1/72iOPPLK6ujo/P7+5ufnTn/705s2be3t7jUYjn8+z6hC0C6JaLtOHZHNJkpi9An3yubHAEP8PV2jP8/L5PJAxFPqom8dmsuLcx5dy6S3MBeZoHDVhZCaWAkO4ZX9/f319HdWxcPsgEsdXAFtDp4xpi6/gC8R6wlhc/C7WPIa+EZplsC1YGy8vL8/Pz+MgEGXzXdM0rVQqFYvF4XAIa9pmszkcDqvVKoxrG41Gt9slonQ6jeyHVqtVq9UODw97vV673V5eXpYkqVKpVCqVUqn09NNPd7vd3d3dzc1NnANUpdyx7NVAk44ccAwnoX5XqLqdiICjYmT6NeTp42xFIgyZNpde5KwLkErHcarVqmma3/zmN//lv/yXy8vL29vbL7zwwssvv9ztdldXV8+dO7ewsFgspvPZZLO5urOZ7y5rQV6iEQUjIo3IIWDi44WO/yeNN5cSkexS0B0NVceXZPl4HMK13DTNTCbDFiVQDeNaEGskwfKF4w1Y6LBUcqDruP7eaESOo066eXDEAiEfLPKIdFYqleXl5UqlsrS0lM/ngyDA+onllJGrLMudTgeRG/bB5yGB3wAos+ge4wEjFoCYoTa7J3ue12q1tra2dnd3MThh1IPJXigUisVisVhEpBZWNqKNDJ8AP/5qtVqr1VIUpVgsSpL04osvvvbaa1//+tf/4A/+4OzZs4qi7OzstNvtra0tjsKK2Ta8fjL5xQmLpW75BUOsdHfSm+i3iP7PROeEwMGvb1s4/RnxWf9c+kd8kfvVriVuv9ZbIxF1iH5C9O+Idk4eOfHNittvHFabuoYvEq0RZeIIX9x+E1qdaJ1oN2bEcYtbDIjjFuJljAbYmpbFwgwKsUeF7QBALfLi19bWzp49WygUzp49++ijj87Pz8OY2HXdVqt18+bNDz/8sNlstlqtnZ2dO3fugN2A4SL5HcRH3NVLkiRPKojBfaGXRGotC3gZZ4B04LCQlcH04PLly5VKxbIsVjCNRiMgZt/3ocZi2SOquqNx6XYamxH7vt/pdGq1GjipYRi2badSKfQJhGMy74k9N6AgAA5Wx3RYJdLGtpsTQGT8MsUXzXSYLSYGJKtyKpcum2WN3D4ZqiJDBIqrBvhGmb5kMpnL5QzDKJfL845jGgYJrNbQde5AXdcLhUK5XGaRNaIConTR9/1ms5nP54+OjobDYbvdRnEkmId0Op3bt2/3+/1qtWrbdqFQADuYn5+H7QZIQTKZvHz58tzcHMoVdjodTdPq9TrEsIB3sA1lWCk6ezB34JTtENV9QHAWkkaK5elCB4naLJCQGy4iNkwWkB1kebOBRiaTuXz58pe+9CXLsobD4Y0bN372s5/dvHmTiEzTxD2CwzJoKUYv20SA+ziOU6/XMezBg9ixgd1jOY2dU9HBmJgIY+5g+jDUNgwD/4kjI8CAMYBhAJqG47BmmYuV0VjPCDEjMzVRUB8yzWAVISuFuR4dIzC2CxAtnkW4j5R5WZZ5DgJAA59h5PBpeJ6Hy0kkEpVKxXVd1DqDmQCMWfD/+Awckx3H6XQ6WASazeb6+vqdO3cKhYJhGMVi8dFHH718+fLGxka9Xgd5tG2bnWfYtEFUAfNdIMHQJsR/xWEm/j4U0qPPVUoccpPgkIx48piS0IzDtGd5eXlxcXE4HL7//vvvvPNOs9ksFApLS0vJREKXpaShJY3EO3fzH3t2tyIHRSKTyCQKiHQinQg40R//IGCSQA4cL2i3gyDh2KqvKLJobot4RjKZhF8Elg70qmjSzd0IqwceP5xownfKdxzF9wOhi3H5CD3ikvGoAmDlqqSJRILnHSgwgjc4LOYUCXrbUCyKJr3LOT1FLN6IbxQXHDyzsAKjVl4QBHgASZIEt3fbtgGm8aRDp9m2jRgGoqqIzOEakUmDCFy9Xr9z504mk/nyl7+8srJSqVSeeOKJDz74AG7FrEoWR2k0n4OvFBOfifx9DVJUomtEDxPpRDWi0adxVJE+DTmdMX+OnwiTgI/GV4qgxtQ/n3hjeTBoG0w7segRg8m/DR78WsZnHv39p1o+pHE//EqLzkmn+eltc6TZN/fTX9pn65b7dhdJkk+UCYKVIHiUKDHtK2QiiygzXh3jFrcvfvOIOkRN4enNLUn0O0S/S1SKuyluX/gWEO0S/Wei/y/RKO6OuMUtBsRxYzTA1eEg8GEPUNYcsbEpEEyn02H/0LW1tWvXrl26dKlQKCwuLi4tLem63mw24SNxeHj44YcffvTRRyCw1Wq12WwahpFKpbCNB9tCQre4H/Z9XxHcZnmjBEjBWFOSJNu22XcSxpSqquZyuVQqZVnW0tLSuXPnlpaWIFLmem7YtGMf63mebdu9Xg8be8gVO50O/yskXUyWW60Wduae56E0FuAUu7uCFASuO3Ldket5skcakTpNQSwJWwQ/snFEeTpvDIgHRH2SDEmXVdu2ddlXAk0WYKVhGLlczrIs9INpmuhny7JgFssqFVlRdF2HBQHMYZEVDpE1+kEswIX7MhwOi8VivV4fDAaNRgOVkSD+hb3A7u5ut9sFPIIQ+Nq1a6urq4gBAECUy+V8Pu+6bqVS6XQ6qVSqVqvt7u5+/PHHOG2APOhDWW7GZIHhjghcROOLB9ulBqHk/RB6C32ShLJ4rKETrTCARPF76H+RiY+ug7FGJpMholartb+/v729vb+/D46MkcNqO5506rjhyGC7iGoMBgOO02D+YtAye2VzXsxlqFmPxZKuyzcX/4q5I5p6AxCzuJhV5PgAu5AzAuYjTDUD4f8UvRQ4XV0k8pg7wGqhHPYQyufLYfMTdALiW7wO8C8BmkE2YcGBjgJJh8MGoz3YPTuOA9UzmizLzWazWq2i0zRNy+fzxWIRuA2cGn8lFnkTQyxs2EKRenQnSYZF/+tQj32OdFhUg4pyZlEsL6aY2La9uLh49uzZixcvqqq6sbHxxhtv3Lp1y/f9bDabSCR8z9PVwNKtw3r2RiN9UNHclETamAvDhF0TSAln90lERIFGbiDvHqX+7menLp5pP3SFJMlzXS8Ihp1Oh4hwv7C+wUUX+SiKogCP4jnFYSTRQZiLp/GQ9jwvcF1Z6M+A7lX+hGsEk1lMHIwi6Pp5NrERBEZdFNyFbhx7DUNWf69i3iQjDllUw3+51+shEiOak+ABjVUFSwpmJRAwQkEsBh8Oh1hgUUE0m83i2WfbNn4+ODj4xS9+kc1mK5VKuVyem5vzfR/rM2YoL3r8wsDROx48IfD9IONWIrKJVKIbkvT/keX1ySkhRYbu8QGFyRamkJIkje/pxAnwz+POPf444l7C+iVLEh+EgsAPAt/zAo4oBMEx38Qn7+sGMxn3njDQD53J+PEW5aH3Ug3wg/Dsm1hbBOukiRNgAi5JuCKKeDTdW7uEE/CFLIcoog3D6NDgnwmIpRMSJqZ/eHxy3AMP8ocT8ffQE+qESTr9rj1Y/BlPLJKkgST9L47zr0ejBJEy7S9MoieJfpfoTAyI4/ab0CSiJtE/EP1vRNXIv6aIvkP0NSEKHLe4fZGG78RDSiU6S3SD6M9iQBy3uMWAOG78KivuS8U6NtjrHrs9aBrnvAMIep6XTCbn5uauXbv22GOPnT9/Pp1OJ5NJXdd7vd7GxgbK0B0dHd26dWtnZwcb2uFwCDoDoip6noo6NeAnddIhVxm7kbK2ERDNNE1w29Fo1Gw2m82mpmlIs00mk6urq8vLy8iv7/f77LooGgKwGJNNM8CsmSxARwkMgeNAcakoim3bmUwGLhngCCAXiqJ0223XGY1cz9PcQBEsJuRJ+TCNf5YigNg7Nh0+BsR9oi5JPqmkWpZlKIHvysG4nhsuB8yCNdTwIJYkyRtrSHHXFVlOJpMrKyuFQiGTySQSiaWlpWw2C6rCPgPoLtBhZO7j9o1Go0ajkUgk0ul0v9/vdru4F81ms91uE1Gj0XBdt1qtHh0dPfTQQ/l8PpVKzc3NQaGMqICmaU8//fTc3Fy/3//kk09UVf3ggw86nQ7qULGAEUiU/RPEulIsvuO86Qenw+wAK5KvkCqZAQT/P026TNCkUbIou8bQTaVS+Xx+bW0tlUrh84PBoFqtIsTCQwtjngcP8BbPPtbA4qbgyKBjyWQSNr4AVUxvoTjudDqgSND2AqKJFhNMtRgzsbk2rgJKTLESIN8Ikfhg4KXTacwgdl+BezVkiVyuSkw8j4o9SRBo48IxDvnWiOgNQBnqXa6iKVrHcngDnYNL0HUdnh4wZQZnB+dFLw0GA7hCgx3Lsoykh62trZs3b168eDGfz4NRlkolGLNgkcRd4NskRhFYREmCaliK4JtoNCKYpEW/jqcAdy+HYRik8t3hNALHcSqVynPPPffVr3714YcfPjo6+tnPfvaLX/yi2WwWC4VKpaLr+nalUn344U/KC/u1wttKrj8vBwtERGQRWWMioo+XO0ewmBiL8l1P3m0k//bGmU82OiPv4MlHu8nkKCAFulesurAnwn03TRNkH6sxgL4YMWJeyXVWjx8rigKlsOx5JKBD13F8VeWwFm4El2xFYg3WMZp0SkHUAQJbXde5sJtof8R/BfG7YRhQAeMrRPcYnADfJjx9Wq1Ws9nE9YoH1HU9lUrh8arrOiIlCBTxEwFDdDAYdDodNnqCeTdWicPDw263GwRBq9V6/fXXC4XCtWvXlpeXH3/88fX19Y2NjUajgcgTjQ0xxOiFeNqslw/FhO4/IIl8ogOin8nyW/dFc5O1HxHQkCI4MSBiV/VjGAqUHAKXsownijQJiO89JrBOiiQa/zS+u5IsH7POSVQ9pXwlY1ORtAq4WUJUbJJPBuPP4Pl3j4ZizARBIDBQVqeHI3ZCF4lhUfElQZq8dr78ewhVuHw+1sQ1Ct9y3PMzgO+Ywp/Iecc9I41fWwOR8osP9xkketxpvJ6KX42/DaKRZnzyZNYgTbsc7vO+JJ33vBnjHkDt/0iUJHKnUoz/IcjvRBTO+F4IllAkPED3i16eWGJ1Unc/0YeTfxINBUz/feQzwYzP8wcmz1yadn+l0FidFg55UOcZYULO+tinGgyTYc77nMOvMsAcZzga5Yl+Og0Qa0TzRD7Rz4n+nmj0j+KdMh6rU4ZWZDmNVtUODdXj0KDvUxD4FI7hhYfBZAoIEU2stxwL5JdqIZ4XDnBi0cN6Nflco/EzKAgNcvFKT5YecEQwiAySaDRRmrYmh5ZZcToEJx989lQIIi++knDkcC0HYV2iycwMfkLdO0khgQxiqSAIvCCwguB3R6Mlz0vFrtlxi1sMiOMWXZ2x8wdDAZwSE7SRnYraRJAGY08+Pz9//vz506dPr6yssJNAv9/f3d3d2NjodruNRuPg4KDVasGTUZKkdDqdzWahbGWJFu+dsFdnyjNxkrKsKQonC0P9CoIDuIMsY0ickslkPp9Pp9OlUimfz8MLEvtexm1cGA1J/XAfZv9KzqfmtPcQOsHmPJlMptNp27aBJMCJTNMkSep1Or7n+57va8GxcFhkxKFnkRyxIWbbfPxvbDQhaaRIqmmahhqMhsTkV5SgssElzj8IAndSjq0oip1MzmUyq6urpVLJMIxsNgsIDo8OMA4eEmwRAF6GfGRQj263q2kaoDlyn3FPP/7440ajAfOB+fn55eXlZDLJnJSIDMMAmJBleXFxcWNj49atW7VaDcSTC9yhmCHXOuO6XqJBrWised/RLhYKC/0eVxSqszR168cO3cx0uOdRAA1/WKlUvvrVr37nO99ZWFggItd179y5c+vWrcFggN4wDAMeHTCzLpVKpVIpkUiwXJ0HNrAj4C+g8/z8PIA7ICmTr3a7DdDZarWgFqzX661WC7WqUMCK8wbgpcCW00yjsCCI+JhrW7HfKKwqcOaVSiWVSgFI3b17d3t7u9PpsC8NEt7ZJwQnjPgKBI9cOk+MAUCo2O12mWiDCGOIcg4BFOucIsD3EcyOXTJQek6WZcuySqVSNpvVNO3w8PDg4AAngxWg0WhgDYGaEjr3ZrM5GAzgwZrL5U6fPn369OlMJvPII4987Wtfu337NnIjgN4wifhldIawXUTh+A0veqLcmMFi6Jefo4iYJwVWDAQJuAPhA45QnKqqly5d+s53vvOlL33JcZz/9t/+25/8yZ9sb28vLy+vrKzYptlqtT9ZXt5+/Ek/VxgM5KEj+5JEAVF7DIgDIpNIE+pz0rho53gx9Enq+drmIF19K1FM904vH2m66zjGYDDsdDqIr5TLZQT24POA+ErIG2eqIlI0AMEDxXVdaewCfEzWxgAXAwkF8bhqIvcYbh+gMJxJMPxE7b/v+7C3xohFSUY8W1G80bbtfr/PURN2lWH0jBkByyYY+8AXBW4PUNDj0cOrChI+QJMHg0GxWMzlcul02vM8xO3g6qMoSjKZLJVKmqY1m83Dw0NJkgaDgWEYe3t7BwcHb775pm3bZ8+e/da3vnXmzJm///u//4u/+IubN2/iiSBqh9kmXrSXEcfqg/hLRMEKqspO7PoiSEpi3oeZEnKm4op5RIHvewCLTKJF1kmEoaNORm+x55eI/CAgz5N8nzCpBR4qjZ/hihhHPOl6gyDgSSfA2XtPMUmShDoFx9fIrgXjfe8EdIiYmEuSpIxPSVHVUErHvS/1fX8yRBd92EFlHBBJEQYYtssQbpAIl/0gEKd4+ME6+eHpoE3gudy9E6bt6NUxZZg62DhjIfB9aQxuZMHHg++BCPSlKA08AXBMXDiryH1fmlkdwSJaI8oT/YUkvSvLgSTJwEZRUjXZz5/qERA+zGR2iyRJiiwrqqqpKrQY0jhQAakBUs3SqZRlWaqmyZLkCbHYwPdHrjvo9TrdbqfdZs8fIVggq5qmj7UdJKSncPYVug7PHdu2TcsyDUPTdUVRpGkvb/we6I2jPuHoSxB4ruuN343c8c++EAv0fN91XWc0Go5G/V5v5Die51EQqOMcx+OMMUnSdD1hWXYymbRtwzQ1TVNk+ZjcjSud+uPzCcYhMdGEncMb6Gpl3GQRXUWGmYxveTDpgy9oFsLvrhFftc+2XSQi+uUvjb/5m7LrJk4O8g2JfkH0/yRq/OOpn0iWaRya4vFMkkToZwaIIaQrzneOI45Z7cQqNxUQh/oq+q8cLRM+cHyc8deJX3G8msny8WnjrxgKI7YtxjbEa+QdTQQNT2XZU65I/M8QvJ45Fim06EV7Y/J23TulyQCkJMvHN4W7KPSUwnrCJB3bYX62CseRsYUZbyE9z8u57kVJWogxUNziFgPiuE1dzDmtVdQUs8qSk44BDbn4j2VZyWQSYjrWF3e73Var1Wq1QJM5uRsACAn4LI0kodiXCE1Edec9ijH+AAgmADFAM2f033sZHTcuzMVZsXwtyGTnumf8isZp4FHRomi+IWqZud+OFWdEErZyNIYgwWRRJnqAqDrTYU/8nyRLsqwosuxDIXRSYmboVoY6WdM027LgVgk1HHN5EbbyPp8tmH3xZWvc2xgMQI1c36ndbtdqtaOjI1VVE4lEq9XKZrPgI8eLjqomk0lJkrLZbD6ft22biLjkFCNXFjKfsNGmqWn7DxKs9ic35yLCYNLBBI0HgzgvmMwylMf5e56n63qxWHzkkUceeughGNrevn37zTff3NnZAUtKJBIIqHS7XVVVy+Xy4uJipVIxDKPf7zebzX6/D47D0kUoXhcWFs6fP18uly3LEm80Xnra7TYMdvGHvV4P3giO40BRDmEvhj02Y7hxmN0Q2h/vuwT/YgbEYl45egycq1gsAnYPBgNgLJb98kaIj8OydDgzqIJaky1NMK9Fmxd8GHEIGEEAuuEIvPPBEfBhwGjYKyPMgKp9hmH0ej1c9WAw4JqWKEE5GAxQ+9EwDFSxw453Z2fn3Xff7fV62MGeO3fuu9/97u7u7muvvfbyyy9Xq1WRkYnFu7AE8Vg9adpOQCJBwC66moSqLH5+mylZrFbK5RYxTpBmgQjfpUuXVldXwRDffffdTz75pFAoIM7U6XQbjWpHCtq67upaoFIQEI2IRoIJuxgeY0bsCwsjVjyZgqTk1OVmR+31fQoGQRCMRprvBxDPws4iVHgtSri4e/lxI4Y9xASCQGQZisJOEVxHjpGHOJz4pvAB4Y8METoE9VCgQ62MxxZ/EdYBy7LEaAoU8eICiwdWp9NptVqIJ3FMC94RCLQcuxtNusoA7uNJjVgRBirCM4j54WNs0g2N/K1bt27fvj0/P//MM8+cP3/etu39/f2/+7u/w0qCSCFzcxqL+vEz5zqErMM/FR0+Hpkz7Bp4rIogb5Lb8v9kSYoiaklQHgEZSJNy0dAsvbd3DT1ShaNRJB0oHK7AF9GEeE2c+1NzikjweaDJy5wu3BS4uRzx/GFuizML/X7Cmh9gevyljMvpfm8x0SwpOuGvpl7s1GUq1IJJ7Et8nvc7WjDm3XTyV0+c/APT4SkL0QOP+T+X5b+R5QGEcsBbIq8RMQ3Wq2kOGyeCqih8BHYZf5GiaaZh4B0DMSfMXMggsMgvLCxkslnLNIloOBoNBwM81/CmUavXDw8Odnd3253OaDjktQuPEsuyECrWdJ3NWPD45hwj7BHS6XS5Uslls6l0OmFZqqoSTN7Gr/HHdBi/8TxYvpCA03lTc5z5h7S44XDkOK7nea4bjOe74ziDfr/b67Xb7Wq12u50hoOBHwSmYeAFgIN5tm3nstlypVKZm8uk09j48NME1l0u9BEoIxwE8vgZesy4xy8nmqYZpon9i67rqiyrsqwSqRGfHIlIkSQ5OpCmDUg/CDwiPwhcIl8wgTn+ahaoSJJy8pCeqvoM65H/y3+hv/s7ct37ruEe0fAfY1crjwM/PlvoiItbEIiPlfBsFVZF8c0Mk2VGvD/Up9I4y8EX1Kxi+oWIYu9t1sYrfEj2LqOczZgOB7yLidjrIc6gIJ1FqAXC6949b6LoyY8zV0Li46muOxOvr2I2zOR/iquoxKvQ5Od9fraO1yWWVwfjCI2oUJb4kSpJCi5WkPZ7410ZS7B5W4HZ6riuNxqNXHeIpSNucYtbDIjjNuWtYowFeQEVnzTYcOI1C0Jg4KRMJgMXTtu28Sej0ahWq21ubm5vbx8cHAwGA/gDsOoQ74hAP9xEkRHOAaBNH+e5857cdRxfUXRdt20bdhZoKEjFTsHsioAXO/ZXZfwNFILtOkMlsagOszaAMDZvBfgDAsC+Gu+IJKQwHx8/CEii4yeeGxy/IqljMiILhemYIHuCgjgQVMMu0ZCoT9QmahNJpASKosiSHEgRCMIcXBQnTpUkJCwLWjPcHSgfWfeB12ts8pmNAosACkBIDkpCRGC7+CLISA8PDyF5Q2kjqDKHw+GZM2d4wDBhtG371KlTZ8+erVarCDBg24A3aXyFKKbh24SBIWZkPwgLw60XM81FECPGM9i6NIikstJkFSlEGmBUgjFjmubc3Nzq6mo6nYb5xiuvvPLaa691u918Pg+9arfbhULWMIy5ubn5+XnIe8ETu91up9NBSMayrGw2C8J+5syZtbU1ADsoeVnlzQQ2kUiwRn5vbw8DA7SUoxpsvAAZJu41oiaYvBhRzN+PvV/GKBaEF12BBHYisiyrWCxms1ku/AjTBphd8HoiDlfsEpkac/cCzGEBASiHlwXOPJvN2rYNU1qRcrI3DgAxb1DBzrDv5Wp+uAWQWicSCbis+L7faDQY+uO2wjdGUZS7d++yVc7Kysqzzz7LN7fb7SIdAV/BjIw3kCFxupiXEFJciqGIkIzsniLygU237x8hHHN8UZvPASH2+jAMI5/Pr6ysQE18dHR0eHioqmo6nVYUpdfrtpv1fq9DrkMB+SRkRYh6yFB6BP/MdFga/6dMviUdNJI7e4n5SkeSh46DS/ZHoyGb0YeiPickMUvRmB97LkPDJX4YzyDRfZurO3J+CVZC7jSMT/yt4zicT4BPnpR+DSabTCb5yQJALEanSPCXgFmTOIBprE1GEy0seBEDgsFqidPmZBc2FMY6A+9+PNpqtRoY8d27d1dWVnButm0rAj1nKCwGmENOxPfZZ35+ce4HDA3++r5i9ld/vqr/k0b4gzDW6dg6cqX/A077U13g7DP/NZ3tp5VbRiN/D342HlFTknp4f8OSGRHFH6vFWT190liNhApkMZldNHSSpACBXs8j35exEVBVBVpmVZVNU08mzUwmkc1amYyeTMqqihWv53kjeJF5Xt9xeq7b87wRkSNJLhZVLEeS5CuKqyiuLDuSROzYrihqImFYFl5E4X5mGIaVSlnptJ5MKpYV6LorSYHve0HgBIEHloQhKkmBqpKiyEEgMUUSUhY8z5McR3Zd2XGU0UhxXd11Od7MLyH6YKB0u5JhjCQp0HW513MdR1FVSdd9TeOV1FWUkSwPiUZBMJIklYhk2ZdlBc93RfHHSnlvDGrRgZ6i0Hg9DxQlkGVFVT1F8VX1+H/4WVE8wVWMsVowDg+LgQo5ovqXiCCMpCBQkOjAAwZAUJZJlgPEA0Sb9ZNDC9NXlSAg06QxzbxvkO8fbbkQ8j+CSU0uBYEveMZNWEZEO2FyvoSN44WPyYLjkzgOwYilSev2kIeKNEaoWHl9roYqHlzYMvJxoBmf4LlBcBxXEAq0cAghEEVKk2ScX0mjCRPBzIdOEEofGUdtowF7ZVJ/xgf3sM2cdJAQX3cn3AXHP2HMK7hYYberSJKHuu/j4D3r87HtDFzXcxwfvnNBbPwet7jFgDhukW2AqK5l1S1WYGSWIcW40+nAoTiVSi0vL6dSqZWVlatXr164cCGXy2GTWavVPvzww3feeef999+v1+usOcWGE1pFCAARZY/KUZlTSJKkRJJJgZ9gHJHNZo/fKYna7Xar1cImGZteGFnAoRWZtkDbLFHEbplxEr+QMZHknlEUBa4XIhGAzyPUXuxKIYYofdcdOaPhcDgYuaPACYY+GXRcqs4aQxNlDFD8sdewN37yO0RDoi5Rk8gl6hAdEG0T1UkqSrqr66ahkqM6vqLcq7bEJemlcVYgeAHoWyC8VWiaViwWy5mMbduAWd1uFzSfBZ6MisRB0u12gepqtRry7iGVhRkoXKcHg0G73f7oo48ajcbe3l6/34dG9aOPPnr88cd/53d+5/Tp08jdZrhTKpWeffZZJE2//vrrGDwM4tmIlkcIgw+WuIpGE7Mba9x4nyC+f7DolRMDRadd8XUn5BMK+Ij5Ar1wNptdWFgolUq+729sbGxtbb377rsbGxuobQgFKwg7NK1wasZUGg6HEODzuNV1PZPJFItFy7IqlUo6nUZIZjQa9Xo9qAhBbUCTIX3FjYPlN0YF02FcLKICDMWQRoqZzvRffMVUhBby1YX9BXS4sIjFkSGihG8p8yOODCEmwfn+4us18t8xKogIYwDjGYpIy7LYWJzHashfhQRNOvtfY/HBZSLpAagR9TMh3HaFxhNKkiTEMCzLWlxcXFtby2QyGP84LFScsiwzT8TyIuZDhEVwAZuj3nMtEAGxuACKTtCfzyNg/BTgcAjrygElAegBOrPZ7OnTp7/0pS+12+333nvv5z//+f7+/kMPPbSyskwkNZuNoeN15NNd+ZxPxr1tBzL2dbpXq5MELgyDdUfQAUrjVVEmLyXf3M39//769PrtxPxCfW153zBcTTMVRU0mUywexwIo+ubPYF6M1zmoYJomjUVtoUgD+mQ4HKK25GAwyGQynuc1Gg2MtEKhgNQZmNdjNUCIC2eCWAsRQSkc2l8ZhlEul2H+gCGK4S1uh1CYDtkYEP+yhF8ZR0wRquTUFpwPgk/ZbBZVWx3HQU4PYh6pVArGLBjkOEOWFUMm32q1tre3/+Zv/qZQKFy9evXs2bPf+MY3EBhAXJbnFC4/JF5mKx5Rav3gI5NgCHu/0S5FkuWj3xI19Y4SvQlThfsRQ/GvQrvlk759MiITzMbWJx0tFDGSJs0Qoh0y4xxI8NA/qU+iYdHopT3IPb3vozkk5QumlZ6LXk4w6bQQWjDvK/udeh+jnfxZg273cMkDMggVKJADakEgj5Xm904Gbie+L/KmkxZ2MSTGutHwRQFgwRhBVSXf1yTJGNtJqaqatKxMMplPpwvZbD6TMQyDgqDnON5wOOr1kB5xbC/W73vDYeC6su+rY/Xr8aoIoup55HmS5ymyrMmyrmm2YaQgKx6/vSADIzF+v0cNXLzpIebNr16yUJhEmZREIFrlSxL4kSZJ7uSLB890vDknLcs2TU2Wk6bZ6XTw3iU+tVVZVoJA8jx/NBr1+yNdV4nkICBVDcYvSEhslzwP4TLJ9+EDHgi2J4Hvk6IEkhQgBxAJM4pCnueP9SWhKSCqT0LhcL58XpLksWqSn+bM76QgkIJAvp9gf/qYn6SrX3ymJu4XZizlv47vlU7wRLrvmva5B0qlE1j2/7Cg7H3X+c89fBvt/NAzQswylGRZ+rxkFkREBpH+qx3BJ+rFlUrjFgPiuH1RnqN4Z+KyUSytNU3Ttm0W2QVBkE6nFxYWLl26lM1mV1dXL1y4APtCvGNVq9XNzc3Nzc1GowHXRXYTA0HDTp5tasVaYSK/OwY9Y/0d0yLTsoxstlgsQmjJRYFQkgsyTNu20+l0LpfLZDKAYsPhEFpIdjrDWy94Ir8us0wV/8p6KCSpsQaZiCBLhPaK61/BZIPVx67r9nu9TqfTGblDfxgoAVlEGpF2DD6O6/vKEQeJYJyXhap0LSKXqE1UI9onOiLJJ2Wk6JqqSIE+wou9DxwA1gbWwzgeyJu9ZWkMiLPZrGWajMAQABBd/EU9I2vEBoMB0u2bzWav1+NaTIVCAQAil8vBd3g0Gu3s7DQajd3dXXgFtFoty7K+/OUvz8/Pc/FD3HrDMFZXV5999tnRaFSv1z/88EN3vCWADwNgJS6QAW7ozcB/sEQh0WU4iBQRiqalz948+4LTHMO1ZDIJBD83N4cCidVqdWdnp1qtsr8t71VY/QfMBJrJvJ7GKn64l4IxgVSOhCYObxwTnCgIAsjtMQc5ZsB6Vdz9EBYXnT1IqODHGBFYir1ZsIZwn4SqzzGGBqUVq9VxSTcIOaOvy8CyAGQi+OMTYFImCirZCoOTFSC6ZMdYTjXAcXRdh5MyejiTyfR6vcFggE7m3H8cDasBUvVFs2PYAojOJGKOf8iPWBLKXomvs7Ox0cwKQL9CE2Y9Fj0EMFARDppxEPm1tbXLly9XKpUPPvjgL//yL9999918Pv/UU08tLc0fHbV++Vb/sG7tWmcaqaueah6/7krjSJg2dplgQMz+OWDEwVhcLI3/VaXAop6jvn+3vLuXOH9pK53aSJgtRTFlWU6lkpC9g7qGsgFmbN645yEEJiJFVRVBe+t5XrfXG43vrOM4zWZze3t7d3dXluV0Oj0cDuv1OiT5iBHCm4U9THjOqqoK5S8eNwh4iCsJzK9RslXcvYjnDM+WWq3GURYOWGK1QTxG3HBiDYE0vlQqQZXMeUKmaUIvj9UViz9PWwQ5EonEo48+2u/3P/roo+vXr//sZz+rVCqVSuWZZ5755S9/effuXVBvPAF5ARGDvhw9Cll5PPirCfl+IKT0TvUgFkmfaD8dJa0n0WHxiRDd+p6UOBL685Pw9Ax9bvQ8Q7Yn4i+j5xyCyLy2TO2TKDblDhFx20lgOoi00GnP3t5P3ahHb9Bs+nCSJ0+I/gcnlJyKopOptywkQ56KiacOial0+F6tpAcb9oosS4oiseV0JDIdOvJUa52pjwxxakTffPByy2kuWL7weEXYOJVKIYEJUgDHcQbDIVYhvJuxmQM/jumEQg5inJ6fuXCTx3DFL+8VWB4XYGDzLrHErmiFIdYw4PqZbOYuzi9xCuMpwI5VeJQjUUO0POYAKqePcGxMfFsO5QCJL4r8ViBW08UjgwNpIX+/0CtBCBBjxeaQv2ixJU3ac4sOaZ/1HUH6tXLVX9PeVrzX0YfC1Bjhp+0N8R6J5dbF1Tvk2hcNaoq6k5PeA2c8wkKPWrFQtvjD7Ifa1J9PegaddLQZXRrK4gqZvIvFTsQjizm+dEI251QhheiXyJBBLNKjKIriOIbnqYMBPcDb430Xb6L/C9H/+mB4VzrhY3tE/1eiWgym4hYD4rh9IR6i4rZHDFZDZ4TXsuFwiNeRXC5XLpfx//l8XtM0LMRQJ3W7XU54xyrMBd/xBgNSc6+0hbA/Ect/ITXMF1ZtWZZ1TVMSCVT1Yedc13Xb7TZoFN4XGaIBYDHYZe4ZzVgJyQpCr1l8woxKRRsK3h6Lj0B0yHA0HA1d13ePyQiaIxhKiHnWnG0tTVpMgJ4MiHpEXQp6JHkoc6GoKgXBMSDjM+FbyWqyY1Xd5Ns5fDCZfYOhsxkI1/sSdaP8sj4YDLArYFsS9iiAoFiSpEKhAA1ss9nEt6C6FJBT9JVC07T5+fmzZ89WKpXNzU0o3bhiHt8g1s195uAzeN8M0bEoLeG3E1ZVi+9MLLjG+aBPUqnUwsLCmTNnlpeXr169mkqlarXa+vr6zZs3q9UqsDhGFAS2UEmrqtpsNnHJcPCArBWDHFUEc7lcNpsFvoFwmIWuPP5JEJli95JMJovFImSM0ORygUFW5bB3CoI64ERMsTlMgp+BX5lu89seu3aIjsy41yyIBvBFCAqfR/wGhq3ypIKG8RkgVL/fZ5kwfo9dJRYcMYTDAmeGZcghgDoJOl9MGcuy5ubmLMvyPC+dTpfLZQSWUqkU/F6r1Sp2yLjXiFLIsozym/CUIKJisXj69OlqtcpOtbzm3HfVDb3ghvYYoc22uGX9vEgxuz/zrhLrNu9aQYeXlpauXLmytramaVqj0bhz5061Wj179uzFi5dWV+Y2t2vvf2QcNecP1LmRZQeSzCpgkomCsQGxKF4KhPyJkJlhIMDlBA162mE/WeonRq4v9XoBOYZh9nr90WjE7h/sfDJ7Uyd2LMY/3tZRCIhxSb/X88eSfFjlNBqNTqcDzMohGa7TOBgMoDsTdfoIXkKQjsSCqUvfbD04Do7Kk7BYEYNDzFMwht1xAjWm1XA4FOvN0mS6AyxBcXzR9x9Xl0gkCoXCww8/PBqNfvazn33wwQdPPPFENpstl8vZbBaLD1xuEJ3lBQc/Y46H2NZnezs5qSpj1G0/hG5DG8ho559kBT6bYoeo4gzu8KkMH6Jhyxl/Lp6AuOUO6aSmEjoxJ0Z8+4pC4VAdgujmnO4ngjvplk197E5Fz1HKEL2zJ4UQTjKdmEpnTlIQRwfwSRrzqSfGCeYPMt5lRSFFkX2fBLgTDWlHqxHOpsPSNGeJEEnh10jRfZ6NaCAWgY85oxZGnGJGjviECk2T0PjkRB8uRcDVTTj9gjcXWGn5K/gNJ/RWH5LVi7dPdPAXy8FxSQZWxmCF5FdQrgDBp8S6Cq5UHLojNFO/z7MJQWscM/r5kPEURSp/IJgXDY9Fl5HQVJqR6zBbVPEbxIjFYABz/KkRr6lq1k/7tBK/LopEZzx0xIDNSTR56nuj+KofigeI+9BoUDb04Ji64p0kfI4KGqJPnJMwMW+ZQ09tMfjBb/jRc4su5tFOExfMECPGd3GSNLacquPYrqu47ucBiCWieaLHx2IHbbzJhybCGRuAO+N8OnxMH+MA/HAnZnFxiwFx3L5Az1F+4eM3D95GYr/H2FHXdRSsAKXFKx0rBDmrWkQYYkI6TStDzGs6/+cxkPU88dkICqnoOgfM0fh5IL5c8ouj+G4tRSyNRJlkNLR7EkOfEb2cfL1D9YCAvOBYFOyNWYlovik6QjEcET06maH0iDrkdCTPQZ06mSjAaYo+IVHiL001CxOgHrNvll6KXcrkTtRF8nszv4EhJx37B66ABJrJJBEVwGDwypYI/LqgaVoymUTBOkVRms0m08ZQ4a+TXkEe5K2OqTdTjKkvT6wwZfDEOIknC/ZFHDBA8ahEIjE/P//cc89dvny5XC77vn/z5s1333339u3b7XYbPIv9QGAHAVPmnZ0d1q0zNIe60DTNcrlcLpcLhQJuEMyLgfVB59kOm0kuTjuVSs3Pz8PGFzpBMB0uPMikDJ/HhtCyLAR7+JN8wtiZiCUfxbJ18CFBvjkDa2zwxNAR7yRZGcTGLxOPJVXFxMd1IS8Bv2cjclwvbI4ZToW2YSiZCCX7YDBAhzuOk06nL1y4APSMooL5fH5ubq7b7TYaja2tLaZFcFKGB7ckSbBn/fjjj8+dO5dIJJaWlp566qlGo3Hjxo1+v09jLTnbSUcLP5708i3u0kOiwtC+8XMBxFKkmiXTdn4WQDYL+fD8/LzjOCiBmEwmy+VyPp8zTMtO2JWydfpU0tO17YHktMZfoJ+QdceZExwGCyZr4vj3bNkDnWSTTJtURfZc3/WGuN0YwBg5s7d80Q0b7suxb4nvK75Pwh7D9bxgPN8hJ4fwlgVreNBgZEa/OroHE8HHp7pBTHsxtgHuOXuDV2xxwLBjMsYqP+ZEsMJ+FDxtGYLwhEVqSLlcRkHCDz/8sFKpwFAFoBzhYX6LwNE4xhzy56FPaecqkrDQBngqLRUfUiFUJ57GVIAoEpMo6wmJu2cA4k+FwqMPsqlfHe20kAvNSQqvk6w2RE8b/qtoYjtNU+Y+uCA6hJhnv4LS/XTEU0VtJ9UGoEjFgtnYPUofpvLo2fg7ypFPsu+YBYglSUIsf5I5ipc/ldF/qjB56E1JrMcgPnr4hZDT0RjjYi2iyQLXYhRhNloiwSGdK05zpWtWNoiAGCJiNqbDgsOFc2cs/qF7xOVJ+C1XjPHj+FyhVxx44iOSQ3G8qEYX/xm5aGLEhQPw03YQfigwIy5TnO6JxkVNxWVh9ibl00aRxZP7Ddrhin5xogqV792DLJv3XcSiwYBoROS+O/H7PiNOWr6mbktDhQrED08Np4nr6ozQV3SInpSHcdJDIZolg/GMn8VizqHne2gxn7rUiBK3aABVvOnHdtKf93AT36wnfxmydYl9JOIWA+K4feEfnxxfxXrK+1ion2AuAXfCxcVFFBODHSqcN5vNZrVabbfb29vbOzs7h4eHYDHs9ovka3ZCEGvshGQpofdg8dGSSCTy+bycy6GKDtdZPi5SPPbKBJfEFTEmw7MHzww2CRVBp6hKCG1FxARM/ivkhYnZxPyae8/A1z9+ffRGQdCngFGvPi49xzpi8X/BGCKzy4RD1CapQVqbzKGf6AUGqbphKBIFwQgCULAADpaKFIBdX0NvdZ7nuYKfKcwo+dWc4b4YLQD4A62AJBMvqag6nc/nUdpIzLbGQfr9Pjjj5ubmyy+/fHR0lMlkFhYWHnvssXQ6ze8riqKUSqXHHnssm81ub29fv379zp077XYb2xLAXBzn3kWNNXF8UQ8YFBEpBk1qbcRIBks8xN3UsUe2ouBfIcfjVzRN0wqFwunTp8+ePdvv969fv/7aa6/hQiB6JSJGqBjGQOf1ej0IAmvckAaeTqfB2UulUgb2f+MygKzag7IYaj7f96HUFmV9qVRKkiSI/rgaIcZGKpVCrUJcNWwouAdkWW6328NxOXJ+hwNC6vf7nBmARHgcf2dnB+pajAFVVdnbFGsLv+pxKTn0w1T3WHzMtm3Acb4joNggdJ7noX4X285gBWBBMeSczLtZc23bdjabZb8LKDRzuZyu691uN5PJ8FsvCB2CZLIsDwaDTz755Oc//7nneXNzc4VC4dlnnz08PNza2up2u/iYaZq+7wMvMi5nmXOoEl0IH0ffj8UX5WjO4K8aJAwCnrCwHuZXcN/32+326dOnL1++/OSTT+bz+a2trRs3brRarcXFxQsXLiSTyXq9NRx2Hn+498ilwU8/Hv2/P1x0bJUWiXSiHFF+rB1WxukRWNyGRC5Rn6hHNJwGiP17mFiWJU1VTdP0R5rbd3nR40qAuO8cYpmxsxLtTeCi7o9GbqdjeJ4y/oCmaY4kQUTW7XZN01xdXYX7MMwZ8vl8NpstFouY0ag1F+IUeIbCdt8wDBRvhPHRg98cFABAPgEHomA7jtGLE8AY46uD6LjdbuORB6EZj3DLspLJJJ7LoOQ4IGxbENLDHMnn82tra8vLy5988slPfvKTXC739NNPP/roo0899dTe3l673UYYj4U5onlUaEMYzfO9/05r/OnZdO8kNBnSDj+IAbH4h1FtL8dLZuTOh15gZszQkxS7It85qcasuFuezc1FpyCa1FOHEs/FRHh+2IkfDknCZ1CMqZMuWl+LHsBZYurvxZfGqQK90JopXnuo7gWdIBifQT3u6/gR/idJkh44ZnBsi3mCX/YMNn2SWPt+C/+UGEAokY5fcUVThana6qlHjsY/xIOzaZX4tikmEvFbOqdH8HlyotvUmGsoqiG+9fHLjCiR8X2fw378Jh8NM/iRNnXyznAzP0liEvowo+pQsRbxckTF5UlTMpqlJP2GeER8Tq82J/ZwFJKKSbQU0eyfNCWnFgOPyvwf0Bl/RpXdqZcQMqcmISn2pNBs6HtP2vOeBM1Pyt3hz4ghjRkjM1Q0WBQhRdcK8RUilAETUiJz4ixeb1jHgz/nl8bRaDQYjch1Hdf9/EbccEx+R7zVJvImfwjouGy9+LFRDKPiFgPiuH3hALGYPg+NEqeOttvtTqeTyWTy+Xwmkzl//vzFixfPnz+fTqeh4BsOh7u7u3fu3Gk0Gpubm7dv397f3+d6dyjjBlUpduPgU6K/BKeB4FGB9zNFUSzfFxWFqVRqfm5OmptDmhscytgEDeiH/xz7as5GZ8shwDLYNWLzL3IQTh+LvreBLuH1FH/FjBhoFbtunPC911nf9TzP6ZLfkWgUkCORTiQTGUTWOOnEG1dqCsaPDxoDlC5Rm2hItENmg04veBeuOnpaOr0gK4rqHIu2ByAdQGa4dig+RC3w1NeaEOZm5TVvFPlNmiWiUFYCWMiynEwmU6kUAGUymYSDGzqHpW22bSPMsLu7u7Gx8cILL3z00UeZTObcuXPZbPbChQsAHLhHc3NzX/3qVx966KH19XVFUWq1WrVaJcH3GSEBceiSoFZ7EEAsCYV9oym0LF3B9eJ2M3DkvmL1OgS8nINJRMvLy4uLi7lcTpblo6Oj69evf/zxx91uV9M0jL1erydqQDBWuUhUoVAAuwHEwURD8TR2bMApsX8uSjLCNoEHg2h/gfHAjqvsSoHpkMlkgG5ZLc4j4bgisKLghmLkh0AbK/H7/X6z2ex0OgcHB0dHR8DKiB/AwTCTyeBb2O8bER2kI4hy8inPJ1WFfytk2ux0fFwT0vfhYoEzx//zH8IjAm45uHzMZXwyk8ngVsJfu9/vYx6hvmWj0WC7YVHl5Lru4eHh3bt3V1dXYdyxsrLy0EMPvf322+he9juGPhqaU/G1OOT0TScYE4vbD6bDD6LL+1SbKLaL4dMGjsRrNKTfiA6ORqP19fWNjQ3f9+fm5ubn53Vdr9frruukUrKdGJTWh+rHgVSgQCZKEhlE2Yi5hOifMyQaEg3GpTtFdcU4l0LySFJIUWTL0n3F8n1H1zX2l4fRxFQBaXS3FsrNx8Leb7f9Tifjefr4Rpim6UoS3CE8z6tUKolEotFoNBqNwWCQTCYLhQIqv6GgHI867jE2WoEDBqJoeBR+qv05l4vkhA9UCjVNM5PJ5HK5ZDIJyItbxhfV7Xbb7TZyC2Asg7EEt81kMoloChvIYHbgA2wpgxp6a2trd+7cuXXr1sbGxle+8pWHH374W9/61o0bN957771Op4N5EZLniMq40DL7oONWkghlZGYaqpy0dw2R0Kn+EsxZeOk7aR/OH+PH4oxidLPBGU0zhQyR7qgsa7ZzwozEGvwsJnVNteI96WxDjPikW3Bf83TxJKP9PNUwYcYsPgn3iO4BodQisc+jyeBTaS8/2kKxjWgmeJTH0djTQJblkSyjJuwDjflp135S5avPpcjVjJkVGm8hHd9UBvfg3xIC6zOUmzMiPZ/tIXjSDIqGBE4ahLO9Vh5ESjlVChNlxyfJ5EML2myp+6/k8/Mb3kIEnyKu9OJd4I1PKH4/I39l6poT0vCeRO2nnjALdGbcwZO8d6LnGaW3JGioaVq2xAwt80khzNBzhOttRFM6pl5dqIKIeHzxHTjUzyEhhWggw2qnkPwLuwacnqZpiqbZrqt2OvTgpRG+kO3atWvf+973vv71rxPR22+//eKLL/7Zn/3ZZzjO2toajpPNZu/cuYPjNBqN2Z9/5JFH1tbWGo3GO++882d/9mdvv/22+JlsNnvt2rUHPIEXXnghhnIxII7bF6jxhgc8hc2AkMauadry8vLq6mo6nT5z5szS0lI+nwdRchzn8PAQW8dGo7G3t3d0dIQMboh8UR2LwRYv1qGoLMc/ueSOruuW5wEdoiUSiUKxSPk8WxNweXfoFpEAzhUtsKPmpyObnSWTScuyuLaGWGCdd+Mh/1BI6rrdLg4LTMYyZGBBsQof58H5QRBQYLhOojXs9xW3rZA55sI6kTUGxN5YUIyHlDKmww2iA6IBaYf+quX+3jPON786IllaXpFd12u1B+12i88WjJL7E/Lqe5KQyefxsQfxmNPxuxE6hMbiBX4q45kN+AgWDy45Pz+fyWRA9+DNSmPxciaTmZubcxzHMIxer4cKS91ud2trq9lsWpbVbDbX1tZSqVSlUuGaY4lEYm1tzXGcfD6PAndvvPEG1LLMu9mJVfTWpE9jHDb1NShaQIwF4zSW00ZdShj1osMVRclkMoC5cMdGwUZoEsVqgaIFCoNm0FI4J3DxFsw1Lm3H751idiGT/VAV7KnqVPGFWExUFDsHYNc0TXw1neBcSYI3Lg8PdnvgchCsEWZrYx5XmJXROopTsT6nwEc356wz4uEhqhi4r0TjRVFtykEyTHBMBGQ/IF7FWiccEGomttZBNcVMJpPNZlOpFBd2Fy3LRSefqBY4unGduv37tWh/JkcyjRONxU0FBiR06FBJ27adz+fNcaFLWVZUTVdVc6HoLu70u21lVJcpIBqNl7WQ+7AnLH1IlQi9okv3ytkFRCSRJJOm6apmS7IL9et9k/2jqIuHCp4XyD4ZDgbGOFh4vOAPh44kIeAECTzXTWo0GmCs7K2PEc4eL5yVgknKsTq4aX/aO8jnzObvKHkHaxpEzsR85NFohBwCBIq42BTuL0guplto8YHDDxZzFJJFeEPX9Uqlks/n6/X63t5etVqtVCpXrlzpdDrvv/8+286gJ9lNiAQbbl7oPlWmsyRJ+GNp5v481EsnpXLPLnBHgkUpTXOFFgHxDHngfW+uKFKe/Uo2Q6Qcci+J+mhRRGx4UqW76OWE8qOjZhT3ZcRTsWAIvIa6Yoar70m18sTngthvovu8eG4hS+UZdFV8uPO5TZ25M+7jRKazqiqeR5J039x8XiODE44fNWyZURoxatb5IJNOJEoheeCMuoVTXVxCNqNTPVUoomeMIrmQhDAqc/60VSj4uR+1T+H3AfGdIeSVd5J7w9QOjzrYRC/2vo+AaEIGI0g2xBDfUT9VJOCfsPhJZMShgqJT4fvsSXFSJCxaWpaLRYs3nUP7U/3NZ8Qv7/t6wDu4qauEGDufuhrMMCCmmVbmU5+SU1fm6KyPPq1CfutRci3mNITWdlb88C5J/DC/idm2jVxMpEmNXNfq94tvvCHt7we/mYw4m83+8Ic//MEPfsC/ee65537wgx+88MIL3//+9+/cufPgh/rBD37wwx/+MJvN8m+ef/75H/7wh9///venctsf/ehH4vcS0fe+970f/vCHL7zwwu///u8zVr527dpPf/rTTztn4xYD4rh9UegwSwXxPoSdM5LEi8XiqVOnoBpeXl5GTSfICZvN5s2bN2/fvr2xsQEWBtsBFJFDrSeYFXItLFY5iaoWJkSGYRQKhWKxaBiG5XkJy+LzhGDKT6XYYJRzaSGV6vf77XYbleKxE2akSGO5ItMolglj/8+F5rC7dhyHoRvOFupIbJuRf42dued5qVRKdMzg/5cVVdI0zZOWrMZ5b+u9/aXWKOknJVok8olUogQdexO7AiAOiFSiNlGdaJvoJsm9oGQNnn6k+y++7T75pOa50nAUHBwM6/U20v+h2wWw5tdELiFyzON8XywroShKwrLEfL1omT5+WvP7tCzLlmUhqdmyrEKhUCqV0NtE1Ov17hXEkyRN09LpdKlUkmUZuf+QbB8eHtZqNVmWh8Phq6++alnW0tJSLpdDBIIFbktLS4899tj29vYnn3yyu7s7GAzwdBdDx/i64AHwwVQGF4JKvCFkMi4CaDGSEVIkwWwBHYIKdel02nGcarV6eHiIwmWs6Y6eJ+uRkbeey+UAv8CLEc9gyMj3KLRhYzyK8cnerJw7GYqi8xFEf/DQWeGc0ecoY4gATMiOg09MlNtjprPDDAS8orQKoIrTBR7ktYDTQtmXEEsHZiJLhkWL1ZDDNV4KxY0iAkLseoFZg2p+0E2jE0Km53wLPM9DtKNUKqVSqUKhsLa25rru7u7u4eFhr9fjuBdyHQCgxS1EtP7MVBvNkP/gScWXPvM+CmdIghgf2RhYAz3Pw9iGKP6jjz4aDAalUqlcLquqChquaZphJHTDPHfaubTf2ziyRpJMQ6LSeFlj4EsCF3aIRiT1SeqS5FMgTcASX7vHlB1XqlfN3d386dVRzhzJso5xhaEVLU0W3eHw7OCGyCKbsPOHXdft9nojWWbHFTw1uBAT5nJo38WrCnvOiLBPLG36qV6CcRw8jhGklGUZJStt28YoZZNrLDtHR0eHh4dElM/ni8UiID6XWmLvID550zQLhQJWddu2EfaAKr/VaqmqOj8/v7i4eOfOnU8++eStt976xje+cerUqbt37xIRzGpYLI+QD4/2k6q9P+i4FNa4GRhxRiW02U8H0ZowlBs+9R6JStKpXo1T973Rc7vvzJ3tyDFVJkbT9Muz1Z3RegxTJ85svWooaDpbFhcN50T9KGmmiDhk2BpKr54KiMXXxdnGCFHsO/X0Zg/pqOOnJMvSzEKU0XvPQRHR4pZOEIBH1YsiE78viJzqUsovBhyB5gg3h8w5VY6te8VyzVFb8GiSR9QrXIxM8EuFaAohBpj5dovSwhAHnCp2PimzQSxkAjsvJDyxxzrH28RKFVOfyzNkzqIHrihPOcliQlTV0GQWAk4J1UpDVoH/kyOYk0qxhao7hJadqSlcUxM1oktBaHkJIVfxUFEje1HSe5IbD53ssCQWfwvF86Y+0aYOuSjmpkiyy0mC+ui6fVIB2Kih/9TgXyjd5KSOFSuaHFs7jhclGpvLYV6ASywtLT388MNnzpzJ5XKKonhBoLVaS3t70uHhb6iI+Ec/+tHzzz9PRI1G4+233240GteuXVtbW3vuued+/OMf/7N/9s9m6H/F9vzzz//oRz/Czy+88EKj0VhbW8OhcJyQLviP/uiPxO998cUXv/71r1+7di2bzT733HM//elPH/yr4xYD4rh9QR+i/IbN8kMuSAXam8lkKpUKapcvLCwUCgXYCHS7XSRZb29vHx0dweGUiGC2AHET7IDZOwxPUM4lB0UCXLBtG9YW5XK5VCqZpqmPRrph8KkahpG0bTeRYIkuP1kHgwHUqZ1OB6+PYNNs+skp7eJbHSvmRM8BuGpA9wo+gqcLwDGsY8EUkFmMQva4NPZeZDSmqJZhDM/lDq9p7vZGsrOR8PMKDYk0ohRRlkgdp1ozIwYg7hDViDaJPiB5QKef6Xz9iaMrl7TRqOz7gesEg/4AHQ6WzYiNETwsCIADwsloRLIsG6bpjWHiVDUljT0rRRkm8GUQBLAmAKGAqE20d8BYsiwrlUoBjwITgzjU63XclBs3bliWdevWrXPnzuXzec6DRor36dOnr1y5kkqltre38QYcEjeJFiU0zYprxnaIrbf5FR+MjGXULNoF6eDP8Is70xao17PZ7OXLl8+ePXv69OmFhYVqtbq3t/fee+/duHGj2+3CRQFYHJXlcHds206n02DBFy5cKBQKsCQmIqBVoCixbhi/NbL/NRgrPBaGw2GtVmMbXAxdaOpxwgBq2Onhb0WYJb5BIg5kmib+HEnrPNrFAYNXNMxf4DMae1hblpXP5yuVSjKZxHsbxgZ2WZC9A0CHLP+mIgYu+wbSp2laPp+HY0wmk4HHi2VZ6XSa/RxYyImPof97vR4vRKi6g/fIVCpFRKJrAW5QIpFAJ7DPBsBxu91+5513bt68CY62srLyrW9969KlSz//+c9ffPHFo6MjdCDmI+YIzy/RV0dE+WKcJmrW+WnrET1gE9/OeSLw5RuGcfHixUKh4LrunTt3Pv74Y03TVlZW5ubmiKjf7x87+ciy5weFnPPsSmdzI/nODaVfkckmWiUyJtHwgKhD1CHqkdKgUwV65MuUTdPIDXzPl2VvNAo2NpVfvqEOR0QGkUG+InWO1MND++JZO5U2ZTkB+plIJNiHmmNj0Z0JUkDwmMCNgOD9OM6ECS4WqXMc3DsGUoqipNNp3/fhQ9JoNGC5DvMWfDtGNVZj3Hcszg++P4/eX9EVHbp+27Zx4Tg3tuAfDofVanV7e7vRaGiatrCwsLS0VC6X4Q7PUw9mOPCdwO1mlySsZo7jwLO42WzW63XbtiEZ3tjY2NjY+Ku/+quVlZWrV6+urKwsLS2tr6/jWSPa8UN9jE4L1VL/FApiIrrf9ji0mY/W6glRvxmdH1IfT2WgoR34Sfv5+yqd75uVH3X7nQoiTxJ8iZccSsKN8g5RJXrSt4SKEYUCq2IyzUknIzLok5DlVPPlqRbMIcogzhROLKATzIVnizdnqHFDyGmGZcp9XWjv80YeBNIkCjxJAx56hw+hKH6URGlRaKSJx+QXA8TGOMSLABKcmrj0K7vGsb1VKHVPlGgwuxf/P9RpdEJ9tmgo+vgde7zGTq1jzGtCCD1TxN6BEyzwfouDQCjDhfvYjpm9j/liWWMuWifTZMnZUISDyyCL5xYCjhyS5AC/+M7Axj6iPWD0iRN99Pwas5G+SHtbipgIz3ibmmpAMSP4N3VPMTVgHA3DiOsDz1zxmSKi4annM8NQ+EEydcT0tZMch7jrQju7aNBXfGUVV6TQA2VCPjXpA84DnrMAxaCXmGrJ0mxR7MI0AItSv9/HisQ1cjDLYHN3+fLlJ554AoW7A0mSajX9v/yX4W/mXHj++edBad9++20RyILeXrt27Uc/+tH3v//9+x5nbW3tj/7oj0B7RRb8/PPP/9Ef/VE2m/3xj3986tQp/vxzzz039Xuz2SyA9bVr137wgx/8u3/37/gzD/Ltf/zHfxxDuRgQx+03ABaLZgXgOMgTZxEBdt0oVsYvUqLigNPeQ4XgSHBn4yR3pHKLFav0aKbntDT5UNUI0asIr3EhcUG0HJn4Ys0OFSI7DhX45icZ3onFqxMPiKe/JEm64qW0QV7rt/TBIFC7HT3oSDQUkqxFETHaiKQRaYFnW66qBMX0MJN2VVUbjeTjyw183/dEf0CxCDXvzPlNNJgsUidJkiLLNJl0H+0W3jbzu75lWYCk8MmNsg+xyIMy2TCQwFAwAOBoTETFYhFVkkSjA/iBcCUlURXC5g/33ZBP3XtzcTnmJuKw5NcmHkIMO9gymAExEfV6PbzTLC4uXr58eXV1VVVV+HHfvn374OAA1Z/gh4V3FxwNNh3lchkY7tSpU+l0GtOKxiYPfALi6KKx5QU2cgCjwPQIkwwGA8xTFk7iDHlDNVXUE72V/GoF/KRpWq/Xi8qFcC+4zmEqldJ1fTAYgMJjb4mNJcAchgFvtODYi/6cYTTBeme2l4GDMDTOyI5HNTxoXVHEjF8rsSIBELdaLfbs5qvAKQVBgBARsBfuArsP09i5G7/pdrvVahWXMDc39+STT547dy6dTt+6dQuu6+heoLfQiMUliNYZUde2qXuDz8Da7kuHuXQeeoAdvcGIi8VipVLB3e90OrIswwiFa4DgOK7rBUGgyP5Dy72nSr3NN8z9juwfks8FOYJxPGxI1D920dEbwZe/Evyf/g/S6VUaDgPXcxVl1Gp7L72g3/6l0nJp6Et+n8jwEyv95aW6YfqKotu2ncvl4B+N+AQuYSqTJcExCQMYvxTrK2IWM5oMiNSxfBi5L6wjBh2u1WqDwQASZo584IbifIbDIepMzvZOOWkPH/ol7HfY7B6ROVFJ53leq9UCHZZluVwur66uIpsBizb7h+i6jtuHqnqWZTGJ6HQ6rVbLcRw8kdEtjuMkk8lKpXLmzBm4TKyvr589ezaRSCCjCGplronKDyMxGeUBk3mjQ5Nm1oIXZZIzEPB9gYiY4nqSUCtUCT2qID6pUtkMRjmDIE+VX52EKqZqFUMZ9LOPJj4FRP2pSIej1r1RFjCbuoZKyUezJaI2FNEPzBDHiUTypIjLDEA/NYd6arUlEXacFFRgv/hAqB58/5dwoejug6RGifrZ0NXx6/dsBBYqCSVKaPn9n2vn6rqOlRZ0GK8cLPUQq4ZyuEgExCFGPBXH88ORJiWfIf0+bzT4sFONWUS9rchY0S2h6A4efzROpuSqtqE6Zlz5gJ+bNGmTKs6FqLGGqFNB8Dg6K0OAmL9IfEvnmhBRIXlo6zTDo/y+5dH+CWxsP19vjRnPoE/7VjbDOH7242NGfdSpS/2MTJSpfzu1yGfoaCcFxmasqDMerFM7NvpJZsT8bJqqCuKKC+IOlHMi8fKD8qGk69KnN/76grQf/vCHTHVFue73v/99iIiff/75f//v//19jSZwHCL6/d//fVEp/Md//Mdra2s//OEP19bWnn/+eQa4f/iHf8ifF7+30Wj823/7b7/3ve9ls9nf+73fAyBuNBqznYXfeustIoInRgziYkActy9Ww5uHaL/A8kAuMJXL5dLpNCrbcDI+dLWols5muFiFAZTxEgOIzO+O/J6HN1FVVXO5XC6Xw5soyp1FbUkhlXLGxAffxc4VLFnC+6KIKUF2GEiJ74LiOx+/kzmOg4rwTLHxaOHSPaiTxolmuEBIcXkfLrywyl6gZ1LB1YtH8/N00Levdwu9A91blGlINBqnWo8EBbFG1CK5HhSMwUNPVBOSe+lSL5EIBkNNVgIi8gTHABFYh57KjD593w9Go9CLoKppylisir8NqYR4j8FfBFaL/2QL5tBfiS/o/FQGZQPXgP0CurHb7e7t7UF9eerUqVwuVygUREPqXC63vLy8u7tbr9eZZaPnWcrKty/q6HrSK5ToBRZKK4taX02toiuqY0BnQM3y+Xw2mwWrbTQamBcs0cVwxThBzyQSiXQ6DX0xKCrAK/NKmmaOLNo7oHuZtGIuALni//mA0frgdELhdfHyOT+LxsX0mM9y4SwS6iKibKOu66PxkBMTwdxx400pzpnv4OwEydBGCLMSnQ+LWH3cROMUbCZ5GYHUmkFe6IZaloWabLyMhOiGuJF2HKfRaIxGo93d3aOjI8/zoF9GeoH4mhu1YoyaxE19z55Kxz53M8Gp8hPcWcMwMpkMxLP1eh2u9IhJ8A5Z2PQGQeAnreGVU731y8kPe9JWV+72pWN/YX9cnm5ENCDqkzIKCknn8pnRmTVpZUkLAjkIJEmmbido1fxnnvG7g+DOjrS7IRH5adurVNyEpWp6gt3tmUgynJ36gMMwg8BNLGmNmE3t8JBaLY9Xj/F44HomGBL4LhQzRICnXC7DYkikHmIEkRHJZxZtsTsK+hwBVGAFRgbD4RAWT+12W1XVdDpdLBbxJEUYj+tMsrk5O95wrT/OwuGnv7h/SyQSpVIpm80Csvu+n0wm5+bm0uk0YmCY5kw0KOJ78GltiHm3Ld1vzD8gF57hkMD/JHooT4UpobK6NKktDRU+fcAAwNQt+owg0FQDipMMPU6ywgipGkN2sSHfyag7ZFQsRjNtN8TAGHfgSZxXhFwiv5sq0IvK7aP9ENIaz9bkTl1vp1YPE23uZ/CXQJJCEfoTJ/uYESPNS4SkUy0LQm8m0XsXAj3R30QfMUxS8BTDioHGEWu8JPOKwXWnOS2Dj8NFTULGviGuHZV98LXzUAkZoUQlCKJaOTo2xJD2SdYB/EaHoxmGwe8qNFmzkSsWTA2WhCTM0VJaWGewJs+uUBd1mRBtN0LerFxAgtf2qaXzZiDCf0qMOConD82Rk1bOGbDyJB8eUU8TPdSM2rmhuMjsh0XooTP7ERMSUc247yedw+w3z6k0ecbzbrZdOD8gQou/aILHWwb+E64rjtAOdgTZbBZvTaw2g0qjWCwuLi5CvzJxbr+ZY/65555bW1sDxo2aOfzH//gfn3vuOSJ6/vnnAWpnNJYDR0nuf/gP/wH4+A//8A8ZEON7iSiKnuE48dxzzz1gYbof/ehH165du3Pnzu///u/HLC4GxHH7wjUxu0qSJK7eI8tyLpdbXFxcXl5eWlriqkQ0rpnT6XRqtVqtVqvX6/A6gCgP6atYhfEqiTpjbPXAgkEA6IWFhWKxCCjMNb7U4VATGK7neaPhcDQcMp8iIqS993o9JNdDnCgWwmISx8Q5ZBMpFqAI0QTQOk5Fz2QyoFEw38CH8QbZ6/UGg0EqlWKrMlAqTVODQHO9RCnv5nOHJLfu7GaD95TbrWz90PCaEhlEDpFDNBgbTQREOtEeyZtBifq/9dXNcq6XSaspO90fKJblEwXgdPwWHvLgY5wHb1C8HNjdbqiwmKIowSQC40e+uPsVa8KiZiB/UvS+5HBuqH4adhc4q0wmA5BhmiYQarvdvnXrlqIojUYD6T9If8ZZ6bq+tLT0yCOPHB4eapo2Go1g6moYBjg+7lRIk/KA4RB+Rw/V55lajSGaVMsaeZynruulUqlYLGKCdLvdZrPZaDT6/T4+IHoB858kEglEX8BxAHow9oBacPtE/1CuIUZj+92QHSrfCN6nsUxVVGfzbRWLkom7juhWmS28xa7jO443MBwBPBEnwMBaLKCHSSSGZCBahMfIbECM1z7YyAyHQ1a8grBzDAOSZzFqheGKpAdYcLC1hciGYCzAV9fv9+FIILoQ0qRCh91a2+12Op2WJAnmKhj5kEuLoSacoagbimo3QnVUaLKI1ue+ixOd7HhLj0UGNcqg8d/Z2dnb22NTAvQwRgVvg33fk+XhQxdb5ZL60/dSP27b3bpKS+PCdCOiIVGPqEVSi3LW6ImrjauXWzJp7XbSspKapvm+rmnylSvS/+3/7jue98abwT/8jHo99/JFaa6SzeUlw0hms1kox0V9vciqxKcbKDBSoTEscdP5Eba3tWW224HgLm0nErptw7Qaswl3gWOBGDzdbrder+NWop4kG3ciIAoqgR37bIH8SQ3zAnEmGptOOo7T6/X+/+z96Y5k6XUlCn7H5nn0MeYI5sBZyVJRVYKAEnWBi/7RjVY+wAUkvsAl+QQUn4Ai+gGKfAKRKOA2ULgAqSoUxCq1yEyJTOYQzIzIGHx2m+fh9I/ltmL5/o6ZW2RESpmSHSQSER7mx87wDXuvvfZaoKiPx+OTk5Ojo6NOpxOLxXZ3dyEPTbF4DD+cCox7SD9RxP/09BQmopg1qHwAU2bnJtDw/f39p0+fojhXrVZfeeWVWq3GFgpcGCa76q1rUYdz//lqF2uAayvQjdWatquTZLeE2ecDxIrTLYPClxl2RV7DlQZoJoGPzN4j/7CC2+j7ZKqUkE/19Tm8WrpeRkMzKpl+zdLfdo2Wgosihvt4sb+oKpa9zkLqM6N9kdzVb8pdZfF36dUHQbDoANMSpvF2Xo2t67vQNm2f7h2J1KA/RhnEIHzQhBPBGMw/UAUnEoogX6vXyghRAodBqFUQgzUqM1ZNgVzDGD2tuX1W8YkR+8IgWkWg5YA2GBGuZTymwq8+QKxj3gcNfVq3Xxh2njOwAQeB1KufRGSFw9d7NQNbb+FT0rD6F0GHl/mj+uIwvmPbCm3xFRjxshpkZKejLkHLzCcjB4OL0jKK1PzVhC5yVfTVln1OLtNkQx3QGuEyxWH9Os5Q/XUnPRD4jElUyYDBjbB904kLLigpmLmFQqFarVYqlVKpBOFKIshwRL927RpCqWdX+Pkc4cB/nXM/+9nP/H/96U9/ij/86Z/+6YucB/zfb33rW/yYHpVKxcemAR+v44/35ptvwubu29/+9kaweAMQb47P4j7Kank8Hh8Oh91ut9/vh2FYr9dfeeWVr371q6+++urt27cRKc7nc0SEp6enR0dHx8fHcG8DmoC0EBQz4CDAvMgqAlDLkKVQKOzv79+6dater1MS9EK9MZmMC0A8nUxGkAGNxUBeRtcwrcCQ01KZUaXQsENQYNdYbRBBns/nIEq4hZIy8E32sJMtSyoowFDSpuh6B4QI+EkikUwk+pmUS6fGN+qtncqj/+/v5v/rdKvxNBVmFojJwLmRcxPnQufSzh24+JOwlBhe32rs7/XiyXwinhuNZ4nEGI8UcSHkU7WtktH/bDbjewzDcNbpzC6zGGbT6WgwgOIkZWEJeJGFysdFQQZyGajkizSGrvdE2fAY8/k8ICTUDxKJRKvVwvh5//33j46OxuNxs9nkA3/99deBESeTyevXr//Jn/xJo9EoFosnJycffPDBdDpFKMAuPwPur5mGIcnRrMBkDtrNpDE6Mx9Gn2jA/+M//uOvf/3rN27cmM1mJycn77333gcffNButyGDwLKKcy6TyRQKhWQyWa1Wb9y48corr2BoYTwDlMlms4jeIP6LOQUAlNdvAGIgzjBUROYGeDQWi4H7z2ZMKiQgfgJMBk43ToIn7CMC+DyyLLAOSQcGQIxz3r17F8WJZrM5HA4bjcbp6Sl96nR04R4xMDKZzM7ODteBSEIHFA8wqCDcjGkO5i8FMQaDAZrlSfxMpVKAejudTqvVOj8/B/K+vb2tShdI23Cq0Wh0cnLy4MGDBw8enJ+fY8ZB2ZwWl2Brokr04MGD3/3ud6+//noqlXrllVf+6I/+CNEV0Eni+2qdp7Z+Bmzy1YeZS1AYYb427rDOFuAWHCuoSGNAQidkf3//xo0bjx8//h//43/8/ve/R1wIvenJZIKlHo0Us9ksHk9ks9lycVDNH416vd99uHs8KA2nsTBwbuxc37mucw3nDly8Hb767zv/7//945366OQ42W53t7a2oBqRSKR2d93+fmw+D7/2leH//mfdwWCSywfb2zcKhTQGPtcrPqtIfyqWM0F2A66KQdJsNrvd7mw2y6VSqEriaeSy2bt3705KpWaz2Wq1UH3EptPv98vlcr1eB/EfytpAn09OTsBkr1aroBWPRqNut9tsNjG8y+VyoVCIrW9X5Rx2zHq9ns1m2+02Vk5opJyenoK9DhnQ6XSay+W+8IUv3LhxAx0JyJGATbNJiLRoSFL0+/1Wq/X48eOjoyOoScB2Fd6YFCjHErS9vb2/v390dATjgXv37n3pS1+6ffs2DPSwUXJPzOVyeOxkdkfmpf+ccc4yjPhTuqQXPOEnUeR4gWtb7c637J8if0thphWy0ZFunMuKspEItQ9JRF7JCgrtms/HeEytSYT/BK/vIqyKxQLBTaghY+B1v5Lt/4FYMEMmbh8kXigzlxGyMoiNuBzWUuyk7Xa73W6jEM4zqy6wsevUf4rEldxCe4GxnFHAcJ4vokL/hpLMmJ8qcAoTG1hWx49usvrY1QdYdfNUpE6xeBVIdVES5MvkdyLv0d87KAatTioqZsUnwLrvOhWsf025rXmP7rK1oH/jZrCthtRX4KFODNZ0xvmOeebX/besU16xUQ2MDaBs6is6CDVbXLaOLXNAddJpqsFqZN+GaWLAZzj7tNqnfZDaoMOqEh0yTa0RiPD29jZEt7LZ7N7e3p07d27fvr27u0tXc11/0PoGQ/u5c67VKlzur32BI7ZAmwPn5s7FnJsvfJb51xiao+SH/OrwmSnzGscf/MEf4A/LBBxWALt6kOq77Dx/+7d/i5N861vfwmd+9rOf4Se+xvFf/uVfAiBeLSuBJILSw1d+eHNsAOLN8S9wAMvD+gtEAMBZIpGo1Wr37t27c+fO1tYWMtv5fN7tdg8PD8Eme/z4MRAQlulI6ZpMJs45dvUybwRAjI0hk8lsb29fu3YNjbqUdIimgi62KbCcAKV1Op2zs7NGo9Fut+fzOfyCGAUSMMWWhtAN+43ZPrlZ4grDMAQJmn4+WvZEgIuvANTFTmR8BfYtNGWDbtzpJOezWRiElYr7Wmb420fjf/w4DI5cWHdudNFt7cbOTS42lOx4cnen+XrhyM1H3d48nZlns5d8S4jn6vassYiGpxemrpe3wNl8DiSRArsM2elCprwDgOCAQsjOZmlXDfHwoEATg7ES3zsE7KBuGY8Q7roaAAEAAElEQVTHj46OAND0er1Hjx794z/+4/b29vb2NuBRPMZbt2594xvfqNfrDx480EoA6OcYZiRKK6Fj6R6+eFa4I0LqRv3QCMwRN48vhJuptwBj3H/37/7d1taWc+7k5OT3v//9Rx99dHZ2huI2IHJwM0HSJ+6cTCZh9zcej9vtNvBWZdzwncLyEdULt2Cg0KIBiVyxWIQYMbBRPFvAqQyP8CIo+Q3TLcgWo2CDMcYuRZ1/eJWM8Ohh6JwjbygIglKptL+/32q1gDd1Op2jo6NcLlev15V+zkeKuwOIRt0AIqckyzO5VUycDjAYhxgG/X6/0+kA8MKVT6dTNEaAMgy+NnJXxql4oYxusdB99NFHjx496na7WK9QuwJzNgzDTCaDaT6ZTA4ODt5+++1cLnft2rU7d+78yZ/8SRAE77///tOnT8/Pz5lCU5NdVc59Fomy9iINoF5uIqfpJQs/IOmD3J3NZofD4dOnT8/OzqjmodQSLoaZTCyRiA9GbjgbXduevT4t/DqeH81iYVI0iAfOddy86xLTaTHbn05n4/FsMg1x2kwmk0gkOQOq1Vg6PRuPJi5IJJPpXC7PHUQfxTI1OibJuEKMjcFgAGhjPp+Xy+X9/f1KqxVb1JmSqVSpVOqkUuh4wBDlFlAul2u1WrVaRX0OJpxhGKKRBVUcFBK00QEi3Z8gD0F5AyMHMsoAaNrt9tnZGaqzuVyuUqns7Oxcv369Vquh2MaSiYILfESYmJ1OB8/h/Pz87OwM68Du7i7sB7FE4MNYl6BAdXx8fHR0tLu7C+0prAk0FcDAxtqibpbO6+19QajXEO4iNXnXNArzqbj6h2UCx6uN75735+YDkZZxOltXQ97L8vwVcLnfgn2lfqVhlhlZ3hVPwKgi+FBdJMHT17Pyr0ft2gxJ0O/ViHw4fvt5JEBsCtIvZUG+KEIHQXBZqNddFg6mrvfqWoKZ+HqoUIO+CIQ3KmVD6TnssFQfBoMYB3Y3fEZ1D4ykVSTZMJKWrvelet++65cZcr5YqkLkNJ8wEm0+aGgUpZyQK2kH7ZaoFuBjqn5mVirmIxTdiqz18nWwtOxLrLAlC0wC/RYaPlOP1d8i15TBscvj54R0qW4NBsfn4PdXg9VqCav1f92SNo4VTztSNd4shssAaDPNzaDVtcsv2i2T11POtc/S8GfolbuqKe1E6sBoR6ahW/EeM5kMejRh640fogUZFXQE9tCR2NvbQ8lfFxCQGM7Pz7vdbrfbHQ4Gw8kk3mp94/y89HIA4rRzCefmzqWdGziXdW7oXMy5hHNj5zLODZxLOTdfSEkOnMs4N1kgy2OBmK8+KpUKOCjLPrAmJxfnWfF5/+d//dd//Rd/8RdvvPEG4OCf/OQnDx48gO4w1CoePHjwve99b/X3/vCHPwQB+cpPbo4NQLw5/oVe/KJfmKa9buGHWy6XwemjNdl4PO50Oqenp91u9+jo6OTkBIU4kv7wB7RyMyEn4zW5OLAxZ7PZSqWCFR+QzaU2OlirCZAdTyRwcjAEJ5MJSFVIa+kIvCxjMVquvuCX4pvA8tA1nM/nyfJjzx3OAPxXecTslMlms2SAzmazwWAYhrNE0mVdzPVjsyPndhd+TQSIxxdd2MXY+Iuvnv5B7SCRGPT7DtLDjOxJxGAMqmkA93jA5XgXQRCE3uZNKoRbaAorOk9+LruMoRaC28HbdNKYj4ZE6kORkItLxVfE43GYIIGVBjQQ8GK73X769OmTJ09At2QIUiwW0cicyWR+/etfN5tNwLLY+1XpQlOm1QAxcTrAhdSdNP1oUJpmLAJKIO40CILBYIBvfP3111999dVXX301FoudnZ3dv3//vffeOz4+JjhLyjzpeGjKjsVioO6y8ED5Asbx+rtq0k3cHw8T4VEul0smk91ul8AQ1bc1uyYDF3oyUMOAVgAQbZX/XhGYatCMcQ7c3zlXKBTQe97r9Uaj0fHxcT6fB3+cw1gpCXgIWCtyuRwxerqHIa8jjwlrTjabJUgNnQqcajAYkBfPyY4nDJAOROxsNmtELSCVjpoWcO2TkxM8HKRq1IsAGAppkXg8DqWdd999d3d3N5FI3Lp168tf/jIUAAaDwaNHj8IwBNbGugJeilFXpLSIEbw2MMcy7tWLoMPGP0obeDHTu93u2dlZr9ejHj2GEN4OHXUWkGgsEcxLpXH9fJRqzN2pcxnnzpxrONdwsWZYKfS3t7v7O0e9fncwiMfjydksbLVaGDzFYjGTySxi5cRslp7OwiCIp1KxZaqCK6RmtbrgFkKZmJ6pVApmd5lMJiYUm5m8GtaEsHmhtICaKCqpLDDg0QExwcNh1wU9hT4xEwrlEwK1xA5yuVytVtvd3a3X6xA2QR8AFwHn9Z+y2kc+Ne2/2+02RTnCMIScH2ufWPrOz88fPXp0/fr1SqVSqVTq9fpkMkHNSTV/zCqxjntbRJK5EGZdsfisyFp95GgdWMEwB9XwXaOI1fqeV6LbyxA9t5I+rK1Cqz/v9+aveAWRMrvO61I3OX+kuuUKWV7FZXydBAOAGmarrnsrKMBGAdYtEfr0ZRkiFYeNMK5ZhFeg4aS/BUHg1i6KXNgPX1bkZwFsmRLx6geuA0ZdXgkjckemKAQZxGrTioWOGmuDywc2AgI9/tSI5Dur2hVVsIxUy/yy5YZxYqAmuOppRI4KJ/onpnLAk5hWHjNOWLVdJl9rVCBW4IkkIxsOjf46XwcKdXhxvi80S+kIBTls1KrBH04GkbyyyPTs/0HgwtCF4WccI/ZbABUeXbYIPFcNTwdJJDpsWLSm0Lhmg8WyIp+vR6HZwYq6i1l1TZfG6q3T33GMiE3kKzAXo4mMu6xOTikYdYLl7rOzs/PFL37x1q1bUHJD8AMKFxIlNu8C08C8QMYK9luj0Xjy5AlanxuNRrvbTXY614+PS+v1nq5xgMETOBd3LuZcfEEKTspf3eIzCediziUXP0k59xwSZODwqqecOd5+++0333zTCfM38qAGxbJT8ed6nm984xs//OEPv/vd7/ok5V/84hfGvM4/AC475370ox9txCU2APHm+CweasigHExCfmQhOWnMR2IJ7gAAZZL+lH1JGAWn1cYWfB2tMAB+mdDNlNQppABMEDgOAB2FCFfxMjwppWUAscZn1AzVKrSqSerJNYinzDGeD3a+eRjMwkQ4iccBCuO/4YI+DJ+6kUtn5lv1we5uz02mo2l8Pnfqj6xgh7Fx142ftvIEbSOykcVNIbjno6Y9Gs9mevQoy/AMvr8MKRoSN54nhKrJ46bRH4YKKHi0+3ML1mqlUkkkEicnJxB1peQoHwJj63XSMO14Uqk7Y2JD+jCeIUYyIGMMCWBh+ABEP6fT6cnJyaNHj54+fdrtdlFLAE5E7RGM3m63i67tVqsFC0fcMgcMSaN8sPpGFOTiS2eQRLI2BGGoyu1EbRwkXMBAINuOF/aPPklHEUxq8KnSSLjg9WMkADuDWTC+Ao329XodV6WStRyB9EBX4QX0CozHYyxHqsWmQTap+rw8lhAMQIwnUygU8KDQGKHwB0ij1BSmijEpPwQEibZnMhlorJ+cnBwcHJRKpb29vUqlcu/evWaz+fjxY7Tb4/pZRsLgp0AHPRhVJ1FVBc27eLkMYny7LnF4QalUCloKQPmfPHkC8dm9vb3t7W0aFfIVQOsgnU5nM7lYwo0n81xvVD6bHCdS41jg3nHuNy44dtnz6R99/ck3vvaovtWYTAadTiGbDZ27MPyEygTw9CAIYrFEKpV1Lu5cyJ3IPBZtmIjMVVDwG41GeF+YL9zjsrBUJTwRBOFC245q2pQEJRuFP8HZUKdBj0Wz2QSkC4oxPoMp9smMgDDSarVaNptFyYQALn5eqVSQGuXz+Ww2i1m2DJvAJk5dZkDemBTovuz1epBVwRjAmAdbJ51OHx4evv/++7dv3759+/b169e/9rWvFQoF6Hrj5JRg8nl/z3HvYejWoMxHosPLaFxXiv9Gore6Kvob7oorfK4XvULewcCOkc6ZplE9UiJZ+4KX8YX921dc2LRmG5qbT7aNDDivhKK4IyxjyUUSn53HUV0hzbyO4sRqduqykMPA0GEYujCcrwkQh2E4n7v53Em0rPu+QX/WGVRGI5tNdQSIGf9TbA0HGcQopLFbX5FNNNOAgmACyxVPxlhcqGyXi3Jt1bDcgMsaly6bRLx9DVON/DE7AnkqQzHW0YvQgtemq8Qyk0YzTRQjZhZjbA9p74xXoy2DPuXTLfo80OXGiEJTBgbMy6p3y5RkLw11DMvPCUCs78hny1653q7+V3/1MMOes8xoUl+JyOthWhsNOuw8gXWfL7yas+9DyX75xK+9KfJuJIlXAMRapdAo2jxD4AyY14wwYZ9w48aNL33pS1tbW1TVo/SEizJNnUwm3W4XEEG/3z87Ozs4OHj06NGjR48ODw/Pm810t9tsNsOXNp75juLyf/+v+sPPpajLX/7lXwLhjUSuv//976/mBf/whz90zjWbzb/+67/eAHEbgHhzfEY3UazFrN1R1BWSglD8pOwA8Jr24qA7DVvdjQcIAx3GKPwJvwLnV8mhi73k8g46mUyGg8EgnQak1W63IZc8HA6R3yJLB3/KSPirdQaLk7q9sauFPETtj+Ouyd4x9mohbgO5jPi1alng88lkMplMBEEYi8fSsfRXvhx/PAtGY3f+tgtCFzrnYi6EGNHcuZELk6jQxxOJ5DyIJZIJkq/xLel0mrrPfHrGq41N30YqgZs9TqjDgG8f/8oN3mcf8H1pgsF41OhVadchSbWz2QysUljPURX08PAQIphgESYSCaB4cB5Ip9MIHTRKVuh/zaxpRS5hgjAlaPMeEbsjkYD4QyKRQPd6q9Xq9XrQ4+a8UDqDmX2wcEQOoAIXCPeJ7dLgDr+LTICjGg2hHJPAYRFakXVrPMTVIE5N6tQNPJKlgpliYGJNbAwkwYZKVTmk6LP5FZOHA3dGzuMWDl1qM8jkkG54rEyY9InfiBzYObdQM0joeMAz4RgDbRMEZ9Yz8JT4HPAWoMkAf8J2uw1scWdnZ3t7G/aM+ogUlNEK0zLEyrBUOOtf1i5AiWRV8wDVGlK2/X7/4ODg6OioVCrt7u7eunVra2sLGLq69+AVQJFjnkpOAvfaVufrTzsnv02fnifD+y513yXPpq/unf9vf/r0K19pDIfTXi9E/webf+PxeK/Xo9hIIhHPZjOpVJJ7h/KdFWiIbBPBD+HPhkUGcr2o9ACYyOfzxWKRnqhBLBZf6HED8cR4ILgAZF/7JaGODSGOTqcznU7Pz88pxGHwuE8M4uMrgOTG43H0BmKIAhEuFAqFQgFLwTJlAIxS7uAYvai9gRX+9OlTqE80m81qtaocn2w2m8vlBoPBkydPzs7OptPpnTt3/tN/+k/VavWtt95qtVqoP0HRxci7mzbYtUamPK8rn5tlukVhgiuQXAOYmjNH+na6q9qxI7eYZVb1ekLtHli2SelejK1B0Vtf09wgFAbOUPUGvX71RNJgwwfQncdWW/ZDiu2YZ6LAhAEZFd02WI8PZ/t2du4y6c9AKssAFFV0dWuT0I0wAgBi9zy/66Lo28afTbeAFYC4eTKmS0wxYmUQEyNGfKsN4Kxx8sDOq0RgrRwbMr4T0QM+f5xchYNU+IvfaKYn7gKlespf+OUH4x1nonoG9ti/SKdQ+SyfIU4KhU46RiN+sG28HxW4RBUcQY4RNaYzChZV2rf4CiEaIhIjpnYcL9gAjsu2JDMXLo1k5xye8Hwe+5xkuH6B59PQWdbV6eVqx19pG+jvXOs3zfgi78seoK8y7H8msgkjctdb9i2K86r2I/Xx4OxdKpUoTKecetM3jPQBRjtomcIBKhKE1Cf9/mwJg2pzrECHIR/cbDZ/8IMf/PSnP4XExJtvvvmd73znjTfe+O53v1upVIw8sSLIIB1v6MMbgHhzfKYPNs4759A1XyqVyuVyqVQCRWh7exthyng8brVaT58+/eijj9rt9snJSaPRAF+MPezUgIceFmIUOr8RIkRLb7Va3dnZgZC8aok+ayeU6+y024+fPGmcn8M4vtVqkQaFrDgejxeLxZ2dHeCJJvlBwIfID1el8SsdlnBCfEyFkKixy1iNLu2s8CvBmcJhdAmLxxPT6TSZjGUyuT//f2ZvvR7L/t/z//XOPJ0Op4n5+TDem8fnycBBqTPmwlkikcwWM5nZPJYvlEANgxDHeDyGrRklNciapDgAQA0g+JPJJHu5QIrnnM1mcRI62rmFJjWYYhge+ApthSMCTgs7CDcbWh+enr7ZRCJRr9dBLC2VSo1Go9/v5/N5gKSNRuP+/fu//OUv0b/81a9+9caNG9lsNplMIgl57bXXPv74Y9wU42yVcMUFrxlyucvkKfY9mdI6QV62TkM4uFAoDIdD59zdu3d3d3cnk8nDhw8/+OCD3//+96enp3A1xNig0DMyLhhAQZM0FosBVYE3Gp8e8Hp2d1KZS1EeJBWQBQeXGchRNptFgb3X69F+kEaUHEUQcCBIxISEWLPhBM1ms36/j+8iIIvBAPwUMwLJHtR+MQhJaWH7KmoPqodIjoxi06j5g8aLMYaATz0JORJAhyRoS0iL+afBZPEeoSFDPIKNFMD3q9VqKpW6du0aUEWytjH+IWV7cnIComilUhkMBkdHR7jCZDJ57dq1N954Yzwen56edjqd4+NjrZMZEUPtnzA9rQQ7+KxW9NJ+suTGVEQoS8IOD8jLQFWjXq9Xq9VCoQDKMBNs5pDQs57O0ql4rJoP64NB9h8n+SexSjL4d/8ujLfHt6+3XnllWi7n4nE3n/cRxNPgHiNzMBhQ1BKgsKkgGi6Vn/Bo0o45i8UTKABothgbxWw2n8/HhFyWkOHKfIMTxEmTDWtjeLlAWvGsIKwEtQeUQiP9Z9ZPWTllarUa1Eu452JXggKyaUM2WB72hX6/z/mCQggUvbHXY0jjggkSISUrlUrZbJbSSdVq9ZVXXmm32++88w7IyHhl0FfhW/jEmTNe9jro8AqxYIUOVwC7q23TzB98uME/gw9TRjbtmhQ9kga7DJIwq8EyIrARl9RSZaQDmF7PMvUJIyMQyfCNbKaO9CVzQrjzqcpX0nv157zTyMcYKVcd2a+t9DdfIWEF+5iYGlbGIAyDNcISXI2bz8Plo24FghPZ5x55wSpybTh9icuHKSprgKcubdyFDetCO7TMoHWXVS/wdVzkCYKr/oPhrdO7jzu+AsS+JSZvhE1s6uqGtp5l5nj+OdnRqAAxU55ImmrkGkIVOERKBiCm2wcBazMglSxpwG4t6mjP/oppuKwcdWlc6f8/24c6K6yfFCzDytcpTLooQ0u3RN5h2a9HLpvmz5GlI10/l5VFjfCFv1dG1i+1xGIqK3rBhmtvtgNtCzCAsgrFwFBBraoRvG1vb7/66qtADFB3J7dDVSkohAiLHZAYEOdAIfPk5KTf7yNwymQy2fk8Fo+7z+Hx4MGDO3fuUEHYP8rlMj+5+jz4AxSB/Q/wK/DJSqVC/u+f/dmfUYCi2Wz++Mc//ulPf/rzn/8cChI/+clPIqUtvvOd77gNfXgDEG+Oz/7B3iUU1uLx+M7OzrVr1yqVyt27d69fv761tQWyJKCoo6MjuDbBJo49/giYMpkMpG9BonSL3l42yMdiMUgbFwqFUqlUKpUou2k8TxW5cM4BPTyIxXrdLnqy8CuZTAaNt0jX4SyHfUI5Bf4Op9sq0S7AoAD1cB6oGgE1w7aXSqXy+bwSpSMJJqRzOucgsjybzeLxRCaTKRTS5bJLzkd/fHOSSk6bg/7P/mvxvQf5XibhSs4lXZhzcRfL5rK1SjZ0iXyhAPIsnwwcySClip0PWKF6VgDsns/n8cvsjItH6xwwBeLmMPUCskmeBRE30BzUb9CE2ipmpwEZ3hQeO/Qi8KzK5TKYs61W6/z8/OHDh3A+fPvttx8+fPjaa69tb2/v7+/TC3tnZwdQLCy/nLCBGEa7hTnelcVq35XLB2KorUHuCbsg0+n0/v5+sVhMpVLf+MY3tra2Tk9P/+mf/umdd9558OBBv98vFouVSgWVkn6/z25BNIOT5J5Op1GZgPUZmK1u0S0IWWEUYKj47IR6zFkA5A4AVi6XA5cQCjA0asNMxNDF7/b7fWhcAAAC+EWxYyKwOMDcR7sWkxAmgcSgKVMIBmK73Z7NZsDKcWHU3CAkzceLIa34L6I9dAkA8uZi4i4zzvBJTITxeIw7JbxI1FsHJx4I3bTIqQfG55zb2trCd0EGpNvttlotaI5jJXz69OnJyUkymazVauVyOZ1OHx8fP336tNfrZbNZMG0Hg8EHH3zw29/+9unTp/P5HC0OYDQQL9byho94cjRytXmJ9GEFNfBCOQwgKQDfQkiH5/P53d3dnZ0dLPLonMBoNBNnOpu50Wgej0/n8/1Y+4/z6eH1wpe/lPl//T9iwWweThIuLDo3yWTm83ngXBCGc3Y3Q9EF3ms+8GQyK/ND04bJx0VaXCaTQZGDMyUejyeDIJvNKmik2bvWQljuYo2hVCqhdkj1amwQbMeByD70H1b01z9X3gtXAGP27VvVm3UPizy5w5rOkRCHM5fLZXR4AHEGDo7i1rVr1/b29rBFwtHu9u3bT58+jcViWOhwkBWuLO/nq2rAqmuxHKxw4vJFlgxwHAnqmXR9GRi04icreFIsLvqETf+LeJEmqV7G2Fq2qbnLChiRoI+xtvfR5EhO2TJtLoOXLdM5jUTP/XekLfArND2Vn2u8jHgSooE+DkLgz68lK/Cn661/70bm1ZQBtKVpPp/H5vPEbOYmk3VhNW8LWH/ifDLa4JXOV5EfW6dtKxIvW1YOWe1W50t8GEhaaem+yKzzJI+1tUhLC76sk69uEVkhMCLFy4A8o9ugCsiss6rVhGmLifQZMw9KJZv9yf6CB27gM44Q+7WQFYu570vplpCsfTvT1UvxOpoSfqFu9Vxbpguhn9RtNxLoN+l2ZKGdzBgt5yhj3XiD6wLICpNxvVMRM9UcR/iXz+drtdr169f39/eR8GYyGbSTFgqFvb29vb29arWKAjYuG3JwoLmgO+pMDjR0UjSG+SxdixJeavz5AojfeOONZR/gP60GiB8+fMjPR+K55jzf+ta3kMX/+Mc/9mWLwSn+m7/5G+fcn//5n/snvHPnDpSRf/zjH2/owxuAeHN8pjdR4KpU4EJHf71er1Qq5XIZeCvDX2SYvV4PJTjgVsg81VQBNCXqDlOHAehDLpcD5zebzdJlQiHFi+D78i7eHwxOT04OZjMQXVE8RNdtpVIBaxgQDwVzVdEMexXb5Uynv9nLsX90u10A0GhJBnTFxhYF8lwUD0VvB/DZfD6PxxPpdCoIEuXi7E+/Of2jr4ycGx4cNv/hF8nfn+dcxrm4c1nnps65IJFI5LLZMJ4CvkaeNb4RkAdeSjKZJL2XBVX8BPobyVQqiNoFlVgEUAZgwXA4BHLHU/X7fdrHsblPd1b2jRKuZevrpYVmMWbAg9vd3QUMdHR0BFJbo9EYjUb1eh37unoxQ/MEUDs1QLHxs03ySuzMKO1Gyk3Qgs85NxqNmA2CXof6xM7Ozte//nV46IVh+NFHH92/f//x48fD4RBRTj6f73Q6CETQFbWzs3P9+vXt7W2ys9H9RBlooNt4xdRVgNAEAWKVjebcIaH4oiqezeKB0ESRaCyQaNByB4MBCJUAzoyxFREloK7QHCckrdMWTwZTDIh/o9E4OTk5OzsbDAaYL9AVwQc4UJPJJJiVWDrAWw/EK4xRJi+A+LX+HwMVD42SHSBfYxAS/yXuTHUI4O9Ex1AdQaUklUoBLwPoDIAYBaR+v5/L5QATw1ivWq2CA97r9R49enT//v0vfelLxWKxWCzeunXr5s2bBwcHWEkgoUD1YUUT/MTApKzush70y9kGFqei7iHN67e3t2u1WhAEJycnvV6vUChsb2/X63XQV8EShdoGNSsBxxMZnE5nX7nRf327lc24O/eSr76eCILkdFo5OYn1eqP5fDaZlPFIyRRmodHU89ZUDDRrr7tspJnNZqvVKnaHZ2aM43EQjz9jUjs3XahaUyCSVDVMUpwTxFtQWuiUSFd6kI6hnWfY8S+4a6sI/pV0J4rDIHeCMSZGOFmEqgVULBaxidPsjq3N+Xx+b29va2vr8PAQLUS3bt26fv36zs4OfDsxPTHHjWShaY6++jYvg8psdl5By/JBSR8qXaYn4Jb7+Sx7vMu0VrVY4lv2rSD5GvVVX3LHx1tNO/+Vj9cQPP22aJ9GHYnwqr4T+6Uo/+KfR+vokaiWQZkN4qnIF/mqCA8MfKaOZ9oVxIMFzkhjWwLEvquEefVct31dV8VlwjBMOpe4qm69DOpd57WaMfxcroz+x/xZsKK0sw54vayIsuIKn0uI5srRbp6kr0G0+kleuRqvqV3gF6uu/K1lBRLzoj8NzYRVb/Azjw4vqyCu+ZqMWoL+mfjmstYfH4mO3LNWIMsm8Iuc/kYvyP+D84RN3GX+vi5i5uJNZqRLvbEx50kMlVi7S5XcwEoM8xScEE2r2Wy2VCrt7+/D9JusLzW4ph8MjcTb7fbBwUGr1UL0BXPp4+Pj4+Pj09NTqFAyD2WqcmEyP52mF73Fn0eAmJBrJAR8586dK9Fhc57ID9y+fVs/Sbz4Zz/7WeTnCQpHgtegDzvnfvKTn2wguA1AvDk+69unelZgAUV+TixGYUTt5jChD5ie6AQnfYbd8dw/SObiBqMLNKGKubTaXexni856bYhDEguQ0V0umBv9OIVgmD+QjkdSpIr2aqO6yZrIIDaJRCRNgClEInHRQz2ZjJ0bptLDMBxm0qPdrX6tlOv14tNmzM1dMHPxWCydSmUyGRdPgf9LSygAxJr/4AkbvTBywxOJRPyyXkcYhnN5lWQy4otUbM4IqxkZO9M9FNlapfwaYkC4Koy02WxG5WgUhGOxWLfbRVmYpNp4PF4qlVCxAKgKjMMwfa4c8LgdHZ/mlZHNBPAd4436s5Bk6XQ6+Xz+tddeq1ar1Wq10+l8+OGHBwcH/X4fCirVajUWizWbTfhi7e3t7e7uXr9+/ebNm6VSibJ6gN0ZNpmnTSECQJ/EBFUqmkR1BV4BIaEQoqqysVgMOBGQa5wTMwjqoobACw0KMHPRt2UeMuWqAXnjplqtFtDhTqeDlwsOPimZDCsR/EH5FCGjdpaBvA8dWABz4MWTFIyxoQZrnMIqjkziJxcxnA1vE0ITuJFsNosHgidDTjG99bLZLGJN0L0PDw/BZwd7FKoFkMkGRL67u5tIJG7cuPH666+fnJwMBoNEIoEbwZvlGsiyCtYHyolwCdXP4B3hDC8l/aNkNl4lxlU+n9/a2tre3k4mk2Cao3Ehm81y6NLwkK2seEphGC4M0OY3b8S2t+OVSjybSyQScedi8Xhqb684nc4009R+eRYGVuvGRv6T8jG1BsaylvEpwp/MGSazGYQvkF1oLQo1EizFqBTCTRu1DWM0pITEZfvvJ9641/wkBFg6nU6j0Tg7O4NgKBZAXR8oLYrlBZR/0PBVyhliR+PxGJrUk8mkUCiUy2WsLZiPzN844yLFXq8GiOU+TQ9vpB/9MuJtZJuIW2LKtBojXsaHvZIs5iMUkcCZrwu8DFM2mKlGOz4BU3ENExqtGE7LCNcmetRKngGI9ZkoGOGj9qzis9ZrbpbXbPi5HMPO4zIvQzaNq63xldKrjaReGoUE31RNwZRYLJZacOWuXooX71VvajWKqi0mywbSCtEJXiQfPrF+/iSSBb/O0uSj23xfSozVwNLoCOkF+GTeSEcsf/VTgssK4emYd6y4U+NLwWswVtiRdnAmB8HTNqrH5iINfZ4KKuZpLGuUdJ+Uh24I+89+OJ9/xlUmIsH0K2sbkVNmGQIbWaT06w3+fFzRHaLDxrdxc0usMv0xprGlDz37Fou8ePVccZ7vKLMnjk+qL5oHzoVRLU84MguFwtbWVrVaRQCJ9lAwvcAgvnbtGvhPHP/dbvfg4ACYL6IUoMNnZ2eHh4f8IahdOND5px48JCLgsl0sllx4lnzujrfffht/+Na3vvXjH//YR4cB+EaSgvUgC/hP//RP/fPg/ECHARCT9rtM3YIfiCQIw9ruwYMHPvt4c2wA4s3xmTtUKS+TyZRKpWq1Wi6Xy+UySnzYFYDO9Pt9OiowmaSDTaFQQPaonnWKhqDZFr2r7K3mpnKJ1XK5I+9CPiIWQ4MwA9lSqbS1tUV9SXw19yoAfMh+1cgCAou4PDDCqDEKcjS6pzOZDOqc6OelNxrZu8BScY8qXgZ8h8EBXY9xj8DdOt32ZDSah9N+f/DFLx0ftcPh28H5eWbiYm4US6ez5XJYrpSDWCqZSgGCoW4Gb5/0SaKZdMmDy9MFe240MmHQdCHVhCsHcxyvDGRANrgRXANDkDq8DG2xx/PzhKo5AMhg5caMZ5jP58vlciqVGg6HpVKp3W7D4Wo4HD59+vTDDz985ZVXuAllMplbt27dunXr6dOniUSi0WhQPIHCGn7D6Yrwd1lPMQF9JpNsweYQAj8OIxmcXLRsQ7WAAwYDCbAazL7ISGWxhPE3wVNzSUbyj0x8bcj18zdOJUqsqAMb1e6MNLDSh8FopjoeBSU0QdKeR1weiMmDwYAUbxYetFSjJ8FsYigZCT2YYJdni0y6DLboi9BpWxxrV3wU+AllMZl2snaCBRNIWSqVAmI4mUwAcEPLlfaDAKArlUo+n8fFYMGJBJuMOY9bwiP7lCQmlG6Dah84+5BioKsbvexNVyarBUAe6U2aSudjiXzoskHwrAUYr3XZ3FytvroC1TIsLSc+Qpqf2G8MQxeGweXVABUsktAViNF9yoh4XtnN+sly3U98EhSZ0PeD1R4bnCosGatJw8TUrJVy3hdbWKdD+XKUdvx7jxznz4GCB0Gw3NgtUo8l8ht9I/tIQIF1r9VCrv5SZpi8LsrjPhJrMJiX6VKPpAablcGY7hrMSAsABqRTJGIZouRvKz5M5rOknUfc07Fh1jGDzSmKvQyl4iOibqwCxD4CqJfBgg0LJKyqrrCZ8n9iTEfNskN1owtoeL35q5g31pxl4icGHfb1PU2LybLmdDIDGPgh7qUBFJZ0fTU+LdfPJszFaKmGNSTq7SrXXsui3Gjgk2G+0Z/p2q9mFFdYO3dik6uzjyi5EVaOhKQjKZn4s5bTlsGRjFIQdFGWh0mKUTnwpU4iVQIitZiWSYis2EDdZWsEPcIwhEldsIaq72cEJo7kDkeuDGuC5st+GBm0RNppqri5i5KtMONH17TI0eWiiP+rYXEfIzb2jwbjNt9Llg8DOSOCjNkE6g/DZvqUlMtlipXlcrkbN2588YtfhPgeLW3QWIYsvtPpPH78+IMPPnj8+DHIwqAgtNvtVqvVbDaRxupkwUWCrEABN6IWF7M1Fot/OqaF/wzHT3/6U2gB/8Vf/IUP7AKHdc797d/+7ZUAMdQq3nzzze9973sG1f3Wt75lgGYCu3/+53/+05/+1D8hFCQUwtZ/QkYf+YubYwMQb47PHDqsflyFQmF3d/fGjRtYwQG8AhduNpuNRqPdbqPrlm3+YPMB70MvrQYxdHZCI0mpVKrX64CeaWKmxVJGje5y60exWLx+/fqg33dh2Gq1EHmn0+lKpbKzs1OtVqGK2Ol00Ph8CQydTon04WLUERhuYMz8Aff4PdfgCWJ7m8/naEUnjVfJO+SXEZujmj5A9kaj0Wg0kF1jB/zC3c5wOg3nwZPHxYeDTHwSpINSoZwvlfIulgiCmDbtktfMHR1YHny6+NDQlYOrSg+HpmQ9HI1QX6WWKEBeogBOGEzglev34uEDEcPnaWmN58zgldmjhh04SblcJpfz4OCg2Wy2Wq2zszPc7O9+97vXX3/9C1/4Ap5eKpW6efPmF77whdPT08PDQ8QHtMt7Lt9elSPkz1UKlqwTI1mL54mMBUzhcrk8Go1arVan00HcUygUcrkcLg+aLdVqdXd3d39/v1KpwMBtNBrhSkBN5SjlzCI0r3k+9BMQ4oB1y3FFMWgakkCQAe+CQxREYOgbsF0ALF0coJwjOOt2uxARJmVyKlNSEQfIaAB+ArXw/PycssiQDwPb19B8DO+bqb62g0HjZTwe09FbbXM0scQAxqvBQUAfixVZ4crIHg6HoD8TEyRPny/CcNZQXqpWq/v7+ycnJ1AxxnmwDIJ5enR0VKlUarVaOp2u1+v8OVQ7mLpE8koiNe9U/e2lbwR8F3howLWhFA/aPuED5iEs9mDQKlpxQdBwLpvNQm4llUqH4TNUhQj+Cn7ildnaaoAYXzQcDpvNJoSJIHWChVGJvRcwRBjG8OfpdDqdxrJZKiaR3sWtQakx6GvhOr+aq6XZvs/+e/F82IAjs9kMauAQhmq1WuDgoBiMVd2J+i1mlrssCOsWjRfY6+PxeLfbnc/nZ2dnUCVCFwJBFi10qd/Uc2HEBn8ybzYS+dKHqTqJkQws81fF+5a56in4YtDYZV0skYoKaloQCTEoeuU7HESWjiJxZJ4q0sjO1NV8UFVHppYQzJJl7MuW9cX7F6kPx9e1ZCioNHAF+Iwohy/B4ZeLFI50l7sWnEj8U5DdfLV/XyiQ+DEGvgJTZuZcuN6KHc7njltOLGa2HvPQlIWqel8cijjDMt0tvjjAMahtQ2mKIQFOjjBPy/DcGX3UMhKwdp7GCAqxZhkkz5pLK76R5Xa3RKrV3xAjVbAUutL+esa9ei8KEPsbtLusIqKoX+Su7WslkWgCiT8W4LX7xMCLpkJvjFuWGUUu21iXlZl9xugljzu0rM3nnwtQLXLZX8cydFlcYR7aOpI+a/6Tnl9NOzVj0ppfJMAdKUgd6a7plkh7GzqtkuL9agQCJNqKKESbSCTy+Xy1WoViFRIBWOkkk0noWNZqNXh+7O7u3rx5M5vNIu84PT1F8oLgqtfrnZycPHr06MMPPzw6OgJZmBkTWyHNI1UfdTNPkTGl0+lEKlWZz1OHh59H6ObBgwe/+MUvvvWtb33rW9968803FXK9c+cOlBwePHig2HGlUoHsQ7PZVALvT37yk+9///uVSuX73//+9773Pf0WYNDOuR/84Af4wy9+8Ytms1mpVP7yL//yRz/6kU8EpoiED1v/6Z/+6Zqw9ebYAMSb47Oyg17AiOl0rVa7du0aGuG3t7cB4zabzZOTk2azibZxkAoR09D5iggjGakMoHFgJ9ja2qrVaoVCgUgZNiRiWORNmKAcpnnJ+Tyfzx8cHIAqC2lXdPTj+qHv6cQXlSARtlXQGylYTE3hXC4Hbyt0iM8WLcZoUYEDD9QAoL85mUxwy9R7VZILudWaTAKNajabp6enrVZrPB5hZ4/Hwnxu8sUvdGvl416n/X//pt4JqpVMPpUOEqmEcwHjWqIzakYH1nO73aYYvwkWEeLH43GGCbPZbDgYDAYDbLRIEhQ0R0pvlOCUK6dUWTxePC4iX9o0qrYw1BuFpjAjkmvXrh0fH7fbbW7/jx8//vjjjzudTqVSwV3n8/kbN260220Y3AH3MVSadSoi6oTju8ATdNYsBZgg3jWI8PV6HYP50aNHkLuCfCd8FzudDqDVTCYDcQm4LgBJBCbO8UMNaAWIyfPlpYL9B4FsxFtMC7UPFMPs/Py82+3OZjPAQMgVgQ6zigCQCCreAM7Il+z1esfHx+fn54CkDVbOcJC+ENCswF9PT0/Pzs6m0ynyzHq9Dn1eo9WIxQHCBay7kKxNAD2fz+NXgDg76QYlfwHXA3gXM52VDLcQHQYz3S04lYT8IPuAOc7T6og1XedY31KpVK1We+WVV0aj0fn5+fHxcafTgUkXXN263e577703GAxeffXV7e3t7e3tQqEAyRE8K+WiKj3EiZx3JHxslFhfyhag9pJYronOI5Pv9/uoq0GAwon8DrV3+UYIJbNqyHdk+B0vYg+yWoiWW8/x8fFvf/vb+/fvDwaDUql069atO3fuoOkEU885N53PR8NhZjbD1YzG43a7PQsC5B50qEP20ul08GSwuMHbczAYUK+f1ouRlz2bzbrdLiYyXCgLhQJzmCuTydVQMm1Y+B4nkwnKV4PBoNVqPXny5PDwEAMVHpsoBkAdBdkUu0O4IyhygdLLZDKBiMpgMMA8RRFIndlMv/PzAsSEecKroI1IlQllmK6+ACbGRkhx2UyJNPa5RLLzknNDCl4fIHZLVGhNVm9AZAMfGNDciCnpZm24Ywq4K60yso2aiGQkkLqCN210JLg+c/vTU7ElxdR4nNcNHYnsG/UJAx/jDWIGmXA0UrHBf+Pm0V2YRiwo51dX6cIQRIZZFCPYx300ylKC4QqTNyMwqkAn1iKIPuHAXYAGyBBXfTuNxAcRGV6SWfq4pSL+x0l8yVTclAGIjTCIDk6/dGGarlAY1l9U5TfTLcEwnm8w0sLLX9iNFp8Rb/VlbfEtCPmoHsYly8ikrNAZNwF/JJ1/2YK2rPKhdRofIE585hnEPhHEmFW6JU0tkX0wLqoLZDUEbCI3v06zgn1sfClUn8GvIEZ0REWZ2pkkzl12NDG7ib/Cc/FUVxikjdg4OOYxVECguXbtWr1eR+Vpf3//5s2b5XIZmDJKUMhqESWC1/L06VOkVIi0h8Nhq9U6XhwkrGhVCYEcsyQkxWz9RFhCvTgcyLxS6XRpOk1/9JELAvc5VCL+9re//etf/7pSqfzN3/zND37wA9i+vfnmmz/84Q9B1DVo7xtvvPHzn/8cIO+f/dmf8ed/9Vd/9ed//udvvPHGd7/73Tt37vzgBz9466233nzzze9///sAlP/6r/9atYy/973v/ef//J+dcz//+c9/9KMf/fSnP33rrbcqlcq3vvWt73znO5CkML+CA//k1hC+2BwbgHhz/MsfLMQB0Nnb27t3796dO3dgtBUEAYyYHj9+3G63CeEB4UokEtCjAOBLUidRG43PgA5fu3atUqmgZQzfS7CAoDDpkHqd2Wx2Z3c3ncuVy+VarQY5AlCSgeoSZXbOQTiV6qjAmIBU9no9oGDI8AErF4tFpNOQC2g2m5DBBb4MuQbC2ZB0BO+4UChAOIl7JPA7sJi1NR7n7/f7jUaj2WwCpIvH40HgXBCPxdPX9tNfej2RTrlXvu5aw9grt5LlfMDQE6A8swJ68eHMAP46nY7pdEbQCfhbVfCm02mr3e53u9xiFQ5QQoqJSjW/cgtFTi3kqnYz3yOCBs36AD/RHywWi92+ffvo6Oj09BTQyXQ6PT8//+CDDz766KMvfvGL0JhOJBK3b98ul8tPnjxpNBpPnjwZDAaREeFqgNioYyumQDcqOiuy5R8gCAKOvb29/f19lMcJiTL4wItut9sQ6KzVatCXgLkZsUiKcfOd4uS4gGQyydo440U8wH6/XygUTGMsSbVoyDo7O2u32/P5vFQqoXCCcQKkj02jQGDhpaZvqtPpnJ+fQ8cjMt/AZeCAKQTpTt1udzQaoX7AEg6wdSct/wjmut0uRjg6WxXYdQsXOyL1XC6IAvswgeEDMjlEZz3JRBzJuJHxeIwpoNJpLMyQrY+KkXMOg+HWrVthGJ6fnwdBAMlsPO3hcNjpdN59992TkxMIrsFnEmRblpfY48zsVBuoDaSlUh6fBGu7alKgvIe7I1KPlotWq3V+fj4ej6n7zHSRyClWM7wRLDhYlllDctJ7uEyl8WXRhXCgdPHxxx//3d/93d/93d81Go1sNnv37t1vfvObX/va11599dX9/X1SgIeDQWpRCMEtT8MQeilAFnC2RqNxfHxcqVSArqIeCegcFPJYLAbHQoqnm2MymRwcHHz00UedTqdYLN69e/fWrVtrAsRXPqv5fA7/SVY38ZBRfDo7O4OdC+0icXd4U1yxuY6htkSBKbws1oPb7Xaj0ej1ehgqQJGctJ36KjSfeNAadMxHygyP2LC9fM0WHxNZByB2nqo+T2tUfZVU6OMRVz4EAysve25XYhMkRBsTBR8dZhigq70ufcStjN2CWXJXQKiGjqcEZ249wKQQX6kqq/FKUhhF33WkcRNvExsQZXBUiUi9HGhECYiByJ0/14y4hz9O8FvTWGy+/rBfAHOG1OybrRkwWlugSP270siRNdEgCEqlEjZr/B/C4kEQoHiMoB3WnapOppsIq4NYOrR8q+5S6DBIJBJoYkP2oRIQ2irHzi1t1NMb14q1aZ4gkI20Qn8dYZgTaSmMBxahGQ1GDkJ/SNNyVueLvyiZJ48r0enGFnjVy9JRtwynjsSIVyu/r1hAlgLEfMKfB/KTYRotk9RYh229TLlofY5wJMrs03uN7vkyc8XVO6NZpY10G2eNX6r01c/VSkFrUcwZMT61/INvR4Pv7u4uUox79+596UtfAt3HXAa+DnHX48eP33///UePHiHa7/V65+fnZ2dnsMEgpQmFKxS0aGGHYB6hODMdxjaI2/P5PFUu09lscTJJp9OfS40J5x48eECs9vvf//73v/99/dcf//jH6ys5fPvb3/75z39eqVTefPNNakTgeOutt0gf5pn/4A/+4Lvf/S5Ix+Z7nXM//elPDTZNhBqXHSlPvDk2APHm+MwBxAikptNpLpcD4AuxVNDxBoMB2Kn9fh8t0oRHoQuMFnLwahHqMaBhYZx1QrClGIhT816L9pEAcRAEiXg8m82iqR8kJoARRIgQnsbjcZBqAWhi8wD0iZgPmTw1iHFtmUwG11Cv13HXYETid4kUE6fDQ8AulcvlCBATYmP0icsAIVTlXDXOSybTuVy+UCxlM6n/+EYuHo9n0i6befaOoHJL4AbxrgbTSltWrcyL2ulCi4BhDd6jyhRolzFbiYlJAUgFcICbAtqIPAE7tx+IqFoF/onEE/wcZ4MYcbFYpCwGkPqzs7OTk5O7d+/mcjk8Rqhjx2KxcrmMO2U2tT4bUTFu3yxC/6/6FaxCQ/kawCWln5FS4hXTUe1CAHrBYSfIzmSAhGUnQq64GJooEqPkT1SoMTLkBY6MKjpos+DCMKMz6SVTZbIOOVCXZUeUG+71es1m8/z8HOEXHoJi1mp3Y3q3MVNGo5Gq1hr5MyD14GyyKMJ1w7wgg9foBGGJBVMV/+dds9UAk91kFJRV4ZvCw0mlUuVyeT6fg83NN45kGPeFlgvjprjCs0vbrpehqC8XHXZR+hWmhZDrmyaNHB46QSDxAUYq1wq/hPOC6HBkv6dBpqD9cnh4+OTJEwDcs9ns8ePH2WwWuUcmk6nX6xdjTFbI2WzW7/fnqRTeJtBbTJ9ut4uhXqlUWFvClAEvmDaD/mtl+8hvf/vbd999t9vtbm1tJZPJ7e1t9FKs2KOvBC6Ba8OJDoUlKjuFYQgwt91uJ5PJ3d1dlCswSieTCfZx0HD0jSsig/NPJhOURvL5PESNse7hh7lcDuVhqpqqv6KvqfKCccsymWC3RKR42WhZwc+N/F5f6nEZOOuWNL+vCYj78gKfGFv3ebvOI5OaRcmnY/tyGSu2TndZdsPn7i17j4w3fAldJ3TvdWzflt217qd6yxqFYhbT4GEZ19J4/fn/+nyyKjIiVSjft9RTeH2F0qhR8PCRJqLD7GYAdEJ+HygUiKuxBo4Wh5o5OyEVojZMXwF23rAatwh6k2jLw9kI4lDelFgnW1UM6Vtj3UjzLo4lxdzxf8rKYYWnWQgb9fDqfYDY12N1l/urqIasEm3+XNPthoA+HT4Vuzf2jz5uaDoVIo914MtlqjWXxvlL7V76XCfOz2G4+jKq4CYMeBF1i2X715V7dGT7hdE5cdJJAAYM0m36YC8bjWzbpdcRehmBPCCx8qW91acEk8gYReihviZJiIBjwXkpNIXkCwNpoXMjdW6++vjxj3/81ltv/fCHPyQ5l8Cxjw43m01Qd31diLfeeuvu3bs//OEPKV6Mz//oRz/6q7/6K/97v/e97/3sZz/7zne+46PJP/rRjyLN7t544w18+0ZfYgMQb47PzT7HsBhBG6qCiJ+MTfZMDvabkPumticmPALIwmI4T+iHO882rcthzXw+n4lwKsmG6uoQiZYagwveiLvcO4NAlqJgyJwRzgJIBUmZiB4JdMZxJTKjMzJefvSWSMQTiXQslnFBulRIpVOIBUNscIhx2TWjD58hsh/YaQNdTD27Fjqbho6h70IDUxXa4w8vqDGLg4CdCaa1ocloBfpZinYm0s2PEgdMKsBGN9jT+qiZCXF8GTvfc4aQK5KcUql07do1CCgjmmGyhLIEwCmCoaPRqNvtAvsGBIM7QqZEmInAsWLHzFdRw8jn85Q4YNFeCyr6W0jner0eczNVJEQhB9ejv4vgjGoqyuc1EaTKRGpeZDq+GZBRjVTRIjorQiMY8s1KYWMBg2UDjH/1HFPCBaNM0sCVQM2SDyAwZIYoWuAzZDyxnxoIIOUaKZ6OOlOhUAiCYGtrq1KpQHmZYxtlKpgpx+NxSLB1Op1MJgPOKQP9ZcJwkcS0l5hymLmjiB4mbzabRUmmUqmgBAiJEjwEDEUjSQy9AvjaaR+DIk1ueQukj5KvmXSZxWc+n3e73ePj48PDw0ajAT0iFJ8ePXpECfjXX3+9UqkUFuoxPBVohCzVADI+Pz8/PT0FQEzLQbxNULAhrKH6EqjtQVfk8ePH9+/fPzw8/PDDDx8/fjwajXZ3d+v1+iuvvAKcevWdLlvcsNoMBoNutwsNKJVPdc51Oh0oRIVhCL1+FHTZLaHVQYxwDE7Ub8gbAn+QolKJRAI5G2jFOzs7tVoNXp2kn3OVWOEm/wkKA34abBBhLUT5DKxPfA2RKExk/cN5VK/10eH1YYU1hUciL/VKzN2//kgG65Xf69s2+rCCWfFW22oZ0ZLV8Jb5XeP/ZuIQdeWNVGrWmJkFs3Vm7vMOOV8z2qef62YaSU73pW8jZYuI5oD5i4Mi/nDZ1Q45iomZ+jGrufhdLIP6vRRGQ8yQTCYh+AY+MlYY5gvswDBiC0YF2OgdGwMMd1mMmJVa1MYIEKt0FXMBfbz6XqwmrwwhFWDVnxhs19wIGDMsSyhArLuqdkotGxvmtZrFasUaskyiPbr88PlJb3UJWqHL/FzOB6YYcOWi7ZNXTIHBZ2D4NGFVw4u0toukk7sl2sQatl3ph6xcH6acTux2yCiijlw8Hi+Xyzdv3tzf30f9GwdDLNJQtJuw2WweHBwghqFcIaS6kReo9TdreGh605ZlatNh7UJxC1wxrmypVCoB+5yVC/hzo2jpFzvD3Lnx8wHEwGT/7M/+jPrCDx488LUd9JPLztNsNr/97W9/+9vfBtZsdIr94xe/+AUA3zfeeAOKFm+99dYKavDqb98cG4B4c3wW0WFgfFhkU4tDC/iIC8eLQ62iiIVh0ccirgKaAPWQPwOOwd5gHCo0JIqkggKoBe4DsAynJb2LsKbm52R3ItHFz0F6BSDlFuxm9NKCIZXP5xGo4V/RMk8kGlZ+xKZVb4H5NsUcEXEaTw8lMCI8RRN6NpuNJ5LxWDJwsTCco5sP1C16jrkFscj4k7A0qu2iCDozmUzGDxEWmq1styfAxwgbiC0GBqJYJ5okqPFyPJBWib+y3Vg5nhqdcNRhtJDAks1m3YJzDZUDfAUeMgBiSItQnZY97Oso/ZGootEbwVNlFZHwS+WQXq9XKpX29/e/+tWv7uzswEIXjgr4DNBYwEn0+0LbFDrKIVBL6W0C4nhNgGYwpImwsBcS7PvZbAbBECQ5GGkatzG8w9RGUoQ7Yvc3IRvw+vFU8Qahngx9FaYlzmtDY1A4n8/BpoRqijo00qcbw8x5NnSYuUDYmYsiw9T2z4uCfzKZTqfZZaYgNVlCgGXxXnD9uDu8CJqJUUqCsg8cY0aLk72xvJ1SqYSnCiVojMNer3d6eqq0TbbwA1Ws1+vXr1/HUjOfz1utlko0GK1PH+lQtruqHL6ELUDKZpyqGHVAP0ulUqVSQYAOFBLVDgAEHKhUlsjlcpCOwXAyEDBzdVaVkE6TxaassdWBe6Taphq5gO0Lz2tNFDFnO51Op9P56KOP7t27942vfa2eSMQWEihYkHvJJAo/mMIfffTRo0ePzs7OgJIfHx/D821raws3juYb/IFtE4PB4KOPPnr69OnBwcH777//8OHDXq+H8Ql4HT5vq+lIhgxoSDf9fv/s7KzRaHS7XVjIErwAwttoNFqt1nQ6haEraMsKc3D8I4kCuE85P80VWVvFHOEank6nt7e3a7Wacw6qxGzo9kUeXhwXVqjLiAIrpdHAQ6vh1CsLEqam6Ov8qnJCpCb+mqzSFQKyq3GQSNQj0h0rUqkj0l8u0qRu2T7rT0Yf1DNPwDQucINgDOkXdxG3qKy5LphG88E4KGBYEtRQ6yeVmKCLKZEI57GeyZMwXAdFfC4WsTAM53P3XDzixVcYKlzkJ1fDVVfCHwwdSY9QjgiCBFaRsdWqBrEJpcgcZA+BiqgyLOG2y9Y6OiozRNEZR9M/v1TgF/vZPKcepG7BYiZrxC2cad2iYYvSWxwqptmfDoIojDGa5TjRAr8peJh5wdPSOIHRrLHqxdtZtvIYZkZkKWtFTcj/g2/N97lOctkH6W+ykbPDJ80oK+JKGehI0NnIoCnpyi8zRD5zNXhcscJH1vmM/jWp9Jpuc63T8hgbc1n1wVJgLg+5W61Wo5xdoVDY29u7efMmjO7xu9VqFYEHQvTT01NI2DF1gn7X4eHh8fFxs9lUYhAoQUCNqU0PTQkEOdwOsF5BLQfdbIj/6ciNHBNgcSKdzi5Ya593SjzZwS9+PO95VuPIm2MDEG+Oz+sBwt1oNKK8IJdUbopkSsKIiUIQQAGA27qFuCd6V4m4ofqXSqVKpRJQBizxBBM1TFdcMrHYxnCMx+NurzfKZmMLRzUCkQzX8IsQGMJXANRDuAbUKZPJuIWHKQHBXC5HwiAogcViEZs3FDbgxoNkOJvNXr9+Xc9ADB0H7prmYAAEiYkgIuReC6+2Wq2Wz+cXcrSxeXihzQ8gie38TNcpr2HQYYby+Csur1KpFHs900cTLLSJcZH4MPmPdKLHqfAZCDwBXgdOhOKtYoudTgddxtC0ZZKgOTZRcjwWBMTZbLZer+/v7+OBQxvh448/vn///htvvIGeaDxV51y5XL5169a1a9cgQ6wXvw7WgMozXweiFtIhNRcisRdsUHi+bW9vv/baa8Vi8dGjR/1+H/9HvRpSBohjEDlNJpPj4+PxeAxbs3q9zkAHgRQ1dkFfhXcWphKqL7T1y2az2Wx2Pp/n83kAOoxlifVjKCoXG5AlRgLtGogX00NMoX+UJZDm6Tpg9A0xSGaz2d7eHgVJB4MBsDMzII0chEF4DbZSqVTUL1GR4lQqRT47Kii6noCwCQwOAHEYhrhHLD7ovh8Oh3i20+k0nU7jLpD3YkDqAkjPImB/hUIBWtI4FSgJ29vbd+/ehRwz9IXhuTGdTtvt9scff5xKpV577bXbt2/v7e3F4/Hf/OY3iIBZRVByijFSNyoNfIZrDvh18AhqyBCmUa03BYawCGAtms/nCiKAQgIqLp4tahtYCfHQut0uXhbOgLfPAgB+nc6NK0RjlN+t9R41GsI1QCkeCkIAdAA0NBqNt9566+HDh6+88koxk8mPRlR5yGYyOzs7vXQa2kq9Xu/JkycffPDBycnJbDZjaQpMunQ6Db/Kvb095CREh8fj8ePHj//rf/2v77333vn5OSwKsVhpEegTIKR8ccPh8OTk5ODgoNlsYjow4US9s9/vdzodVDLq9TqukOi8u9y4SnYw1aVMXRMkHSxumpLRjQDPnCuDUgI/obOiB4776boCfJEopwLHy7i0q7v1Iz2jXFRPrvlwZEn+SrTah279f/JFhCNxKC10ucuCyxwDy8jFK7hsPuLvC62q56EK1GDp8IUv+frYzhWptEvdKraw8CRYx/xOZD0DtyRWoQySyMdCbwYjZ6F9dRzn/qh79jyn09l6pl58eWY78Ad2JDi+DLFaR/NaZTeIniNyNuxdhbf8L1Xigqmg6K+TIqCVQjx2QlR+2c8M7xVaCuavXAEQktEBj9em0lJGGtsIavNXnEf0NrK/GtL4U4x7K0WWFe3VerAqaXwCuHZ9nuxqrfbP46FNpZEzxRByV6u9r+BrrxANc5fbFp0IoGlpx+DXy+pqJi6K/F4SfXz9a04EjnAGutpawSGqquJgZWkVHzlCPp/f2tq6cePG/v4+godarXbr1q3t7W1WfXBOhI7NZvPp06conKM6zuQRghIkH+gmopwqLj6mJZftxWDbIDhn1YcpCY9YMplbML02x+bYHBuAeHPYTBvLMTFNrNfcJECYQuM51m61/aXYKJdy5JCEStPpNDhlwCLdZad1J1JihCZBQItH6qvO57PFdovvYqrAYiaSVUBjzWYTAqmAcpLJJIFLYG0AIwD14pIAGLGGD2N6yOcPBgO24RuFUye+WIpnMammKARAOhQzse2BPkywAJh7s9kEKUxxGWTmsVisWCyaqJqZDPvjwLIB/J1aYGqMKpKpVDIIlOihaBEQNOChdH0F5gJNVQwJRQ3ALuz1eniGcFGjHK1JYpUYi29E1bder8PyC/h4p9N59OjR+++/D/rbjRs3wC/O5XLXrl27cePGe++91+12WbGAaMOaoBjelypa4K94IBiixArZElWpVPDKptPpkydPOp3O0dHReDwGZgQUDLg5Yd9ms4kqRavVajQamUwGswMoGAA1JfIruE/kjmOJXYcK8TBWw5RU7RHDPWFZRcEgRUkwMgnmKrXKCV8ev85pArp3q9WCyzAxXLKYwc13C+0/+itqeo+XjnANs1KTc/YiMCvDKGVsrcK4bIjjq4Q3BYZuq9WC8sNkMsELBWBHboJaHgEHpAgGVie8O9waMOVKpVKr1RDjhmEIczbg10dHR1tbW2+88QZu6qOPPhoOhxi3FGzRqN2nq/gck0+D2uMLhkJsHbUclChwU2DKqyg51m1E5NwCmO7ir9hKUEEhxEwhoEQigV5jKPxArs7XXjQXTKlQpTqizuGcy2QyMGCE3iVJ9Gwf7nQ6BwcH9+/fv9npZObzOPajRKJQKKQKBQD9qDcMBoN6vY56G7j8KOfcunULtk6gz+ACAMs2Go3f/e5377777pMnTwDdcjzjGur1erFYxHNmXWrN5QsrEtX68BCwfTsRxqF2p74a3aC5zWEHwfAmMkJqOYqR6XSaqzp3bSxZqHUB1FOohUxwSm8/B/N9JeFL54X2d/tmcaZ1d5kQhIFmDLCoeGLk3DTQMNXnzYhlih6pr2K6mCMBYl/6gIin8XDzBZTcosdf69kKvCp6pZpgvP5IzFFtaXlh2EpUrACDVuVr2U/Ai3FRlHk+WI2p1NGBJG7FX3wyBH7R4DW+BrFb+HZSUFs/zEWSALH/jc8M7GYzN5+H6wHEz1XVc54e0QtKuES2pUdOujX57yua3CNvx7+7FezXZd++pp/nsucZCa0ak4NIHDBSpeHKN7LiPD70/BmCXT/ztGIVUogkSjtxRon8jMK7vmBRZPEpciXX/cLfWcw3mumsA8BYMvIDvl7EMll8sy8od1hLdNy5EODRcBIrITvGCoVCvV7f3t7e2dnZ2dnZ39/f2dlBmg85tWQyifo6MgK6lYAp/PTpU1BnSEFj+kbPZN4I1nk6uzDLRtaTy+WIBiD3hC0edh8tw+uLiMVigXPB50oyZXNsjg1AvDn++Q6E13Cow8IKpi2xlcFgAGCr2WzCIZ3kREVFuTmBoEflAaTEoDdS11g3LfI0eRKyGHSfu8hOk0k6C2MDw58BSEHZE5xcKCQC2G2323CUQv6MTAaMQudceiFAicS13W4DCkTei3/CdgIOKXYg7cJTTgEpMOqRTXNkYhNAzAE+Yg+jWAe8hvC0sX2CQUx0HnA2d3QAN8ViEWAWWcDPuNhC9WJsYqrKThgNbC6eTqf9fh/PDZqbYzmAEJHRDMCX7FcA62T54VEY4pLhxeAV53I53ALUTg8PD//pn/7p/Pz8xo0btVoNAHEymdzZ2bl9+/b29vb5+Xmv1yOuun6OpIGCOp6ZkBGvhpKdxHCn02m32221WpD+wKPG61NeElsp+bTx+sjycwsxQQ09/ctg1srwyM+fMWsIzlIiw0dGtA/U2NZjVFMsQp8VsDxGlkA2cSqyBYHtkpKsdpQsJzAJVys5DA8gp0SoVe1BI3VGjarBrRoviBdpY8gGAlAjgWLjA1grjIGeUuSIdUL2hMUenIqcCywjBNf49nFHo9Eon89DpziVSpFjjmugraWJ2pX/uD56+ImzKZOuUHgXcCeLGaCHYxHjmqa6k6T34tWQUw/pEtocqR4o7h1NKqjegaytfkcmyVmxo4GqjL6E7e3t/f394+NjQMYsHvA2m83m/+8f/mF3Oq30esXFbMokk6lCAbWcyWRSKpXu3bsHlJy3iTFQKpW4F2AFPj09/eCDDz7++OPj4+NHjx4dHByg/kr3QjQBbG9v7+3t7e7uxuNxMJG1VKOvxk872VNCq242wXAP5XZcKBRYSlEVTlLjkQGSpIMrpNgoxnYmk8HZQIVG8QxQOIYuvWohHK+DCheD+aUy5esjN8t6aZ3nKa9onX6LVtcixTqULWh4iGYtipQycJdZrpEMYv2WZQ3FOuWXcXX1plgsN35rZsFXxJz7Hdco7fYwje0EiLnYGuqo+gOzuoDnjAIkKnMYLZj7LA5xg9DGYSMaYPAULTCzfUQR2+FwiP3I57fqiqpbWySYgnvHQrHCEZFj2wB8vLXZbOam02AhaP4JsLh1kF/fHnD9KbZsEGpVIJLovQxiXoEv+69DDU40ElD/asM39/nsV+rzOI9Qbzj1K8RVVmBtK37olmvHazlK5YD8EbtsF/hUI4ErwfeLv35O+E/LCmxcMVbPO1M78f0J/Q9EVlPM10XuNW5JC4tKqZj13ARvZu6bPhVj1UNNM2XMsC6IzyAYAw83l8uRUIJOytu3b9+5c+fWrVuVSgUe49iJwLdoNBpPnz49OjoCRnx2dgb5CLCLQBZWE0hmH+T8cp1nWZH4NUPuQqFQLBYZkuE6cam6HzGS53kmk4mLxYLhcPayq3ebY3NsAOLN8bk/CK0C3SNGTBMw0DQ6nc7Z2RkYnWigBg6LCBiRPeE/EGDJaYIVMvkpYD4yjmQ6p1yYi59cXrWBHk4WoAyZTRq4ELgBGIRknhnvaDSiM1UqlaJvMgVVcZJ8Pk8HVeROaCLOZrM4TywWw1NCUqQosLbSa92SV0JUhdkU92mUWJE+QcoDIDu75nu9Hl6TGlkgDcM2Px6Pu90uhUGhpHyxO3ovXqNSJQ0p0Ib3iCcP0E1bKRnucBQR8qYqhSl0U8kaP2cpQh3/8LvQpEOQcf/+/WazOZ1O//2///fENyuVyt7eXrVaTafT4Fkro22dpMggsIYkoqRONftGFo2Hg5fCrurI3EBzG7o8YXKxakLbOj9MV4BA9Vv1Fpa1VSpwrD6BpPODFWgCR4xqWreZ8FcDU23zx/DIZDKTySSfzwNZQ887HhRGqcZqiudS0wOwLxV+MfAi8z2j+mcwfdQnVApctQWNrKTKdvsGhuRrc5YRduf3KvZkag94kgDmCKMAv3ZiDqZ8wGXWkYqwv9xtwCeY4LJB+kin01AWwlQFmslwHDNdjYwo90GAGAotUGygbDR7tI0sNdIP+BcBVY+c2niePl0LIFG/38esrFar169ff/LkCQXvWNvABbTb7Xd++9s70+nXBSBOBoFLp9nyUi6Xb9y4YQozfq6FdoF33nnnl7/85QcffADRFWyCWD2o3Vmr1fb29m7cuLG9vY3ljkXEK2taTljSUIMBuIy9mBVWvo5cLtdqtfAGdf1hG4c2bJJWDAwasCAKpc6509PTk5OT09NTAMSj0ajZbHa7XWxDmK2gAlFYk9WaNb3X7ciUzNbP89exMVQNU5WYdytZY2YJ1XVGfRf1SgzL2MCyV6Jyfia/uhbiC1+Y7SAS9OGiRCY7+40UIKb0JDu0VHnWNONjvYW0F1n/GPbg7yNYwuKJqga7B9QAljLo/tsJL0cs3ExVUAI/xGJLhVxTPMAHSPudLqx6/RfE1Qn7e2RRwWyOzhN2wF2nZ7PkdOrWx4gvd3QtA3wju0z8J7bGV9lWdI0M+YLQJ2RY21ql4ORi+45+ke6txJrx3lmI4q9j0WBF3FR9DLlyNVqtEaYRyjA1G6VcGIhwzR4Io5Xsi1MvA8dXvCm/XvJpI8XL5EouvvqTKl388+e2V2plLNsFDDrsux2QBOCjw/6az53LDJsrxejdZQUkLU/6waH6x6zuOfNngX4FW3iNDF2hUNje3q7X69DEy2QyW1tbd+7cgWxaOp1GjIeAZDab9Xq9g4ODjz766OjoCMns+fn50dERnJzV3571SNYplSvtRGiClXj8LnhRYBIwxiDAbYQHtekKPA/n3DwIJsPh5JNW7zbH5tgAxJvjX/Oh0lcI9JHp0YENWSW1gdgRTEwHBCInNiOII0G10/xf/WS1iVVXdvbUu8sxUywWSyYSyURiujinMiu5hVOTSOFahvtArJD3qoAdrwdUKWwtKkWHx8LHpRi0ERRzl0UzdP/Dr2Mnwz5n2qKBa1DKw+RC2HqVgqRtR4D8CGARb73IEzwTlfkCpmFOayhICsSjhMCPYQy4hVocwXq0lBKYMCocKtvHYJ2kVxUF5s/R235+fh6G4f7+vuKV6XSa+rlXclUM/kWRBA4eQ4lSr2qkK7ivZDK5u7ubzWaHwyGa06EEAhiFN6hYlSa9wEzRfpXJZNCiBTkU/a1IN3ZeEmiAgJNI3mShQimoWphR4ZFKpVKtVhFsZbNZ7cUjtAqESCFXakar7zDpujhg0oUI7PDwsNPpQLkbeqa5XI64A8cPJ6BeMyAzvGWdJj4+SDY9A0rclxrOaMcDzg8ZGdRpNJvVdU+J0iyNzGazbrcLxRXeBR67/lBpVhCH6Xa7mNHpdBpS1J1OZz6fU0bcXdaDcyKKyhuM7El/WdmUosNc22m5iSWRzF8OHtJpkc9j6QaCgF+kxj2N73XF5qzXwgzrDfh1fJE+GeeRSf1bIHU9Ho8ji0ilUsAjcHfqkjp3rt/vTxcr52Q8no3HielU+emrj9ls1ul0Wq3W06dP33vvvcePH0MFm9YueHpAx/Ar5FxrXWFFcyhnHCtt3J64lNHgSxcBwnz4LXyvWQBxZizFGJAE4NyCQDoajRqNBjw5uVkTRMZkJGGfHUhKw3wugDgMQ8UqDOk1spHcWEsZ+WDtTFrm57OsT9wHpHzd4RWwnWEZR2r+6jfqzXKRWYZ/6Q7ra026KIs/4sJaRaPzG9ciRinE8gxAzOUUU6xcLkPOBZdNgBgFEgMQ8yQMCbjR0NGBq6iaJJsOJJ04DFrweZ5W1S0gH6+9UP42pJZN0BdahpppMUZrfirCVnAuMx67Xu9qn7ogwO8Hl7nkyyBsPcyiYZDHSLRLZw27zVTGHR+gaj+cJ9DapR4V+F2GAVhhzKwHXM6BSqPXXq/X6XRQR8RQZ1gCQqKWop1nlqv1VL1THZ+4EkStirIxZWBwZTICU3o0AsSRsSVnq6mA+uRuHavmNUV2MPg6BkY+e9kodWuwuV2UyIbfWYib/FwAxD4KHKkL4RtsmKmk4jPLKita89CBaroSDbdG/+r7iJrvWt10olLy6zhV+gKJBGGRAnOXhI5WvV6/du3a66+/fufOnVqthvkOY7pyuYzIqtFoPHr0CHa43W738PDwyZMnx8fHnU4HizmkuobDIerNjOt45ZgLWG+VGQaQGlISUB7DPoUOFShYMjBgCRC7jCkfktB2MdmdG41G48nEheFGaGJzbI4NQLw5lpYoDa11WS60QqrfidEHwAWyCMEuBJLCZFUxQVOGjV32fUagFMh2a/iSCq8o28VJtyCwJzpQmSegREjskZG+tyqpoZGiBvTM60w4siI4A/OFGApTMkpP8LLR42MEQxVhB2qgKYTJTBARqDMVkzpS4SiJS+Yg2ZQm1mfwquQsVUNmiKnwk1EA9J1PNNp2IpBqAhq6qTwXfVg1eRms+2E3fwJdrUKhsLW1lcvl0GrdaDSgTE12AGEpxWvU9wM86+3tbfRAVatVuJkRjF6GXxgGMeEA5Oea2+t4o7EDyfXFYnFra4usTAxyInQm5SMCRewPmaEKL2C6IZ3D5Nra2mo2m2dnZ81mk6vBaDTKZDJ8khSR0KIOpipwBBD/V8NJAL/wZCilQhI0/dPwFQACqDPOya6/hdXPXe4WV+MjYpokiHEk80uTySRVNZBag4oLM08YYNbr9bOzM1gXavKwbHV1axjWv+AuoBaCrCtkMplyuVyv14+Pj4MgaLfbpVKJgrZ4XArHs2TIuiBqA+T08Y1zfdZ1jDgCQUlIFqDbg/OUhGV/7aV3CpwnUVRDpSGVSqHVEexXXCEs7Pa3t2vHx/FkEqdqtlqnjx5VUqlqtYpBeyWU2Wq13nnnnd///vetVuvo6AgtJngazWYTEsYEVsiy1LaJyOVLYR0qv6vIkvrRsT+UGtBuIYYDaAzPUy3p6PKnF8MyJGFoNLW0Wq0nT56APoz5C9Iokr1CoVCr1QqFAuuIuqq7ywKv62LE83ko7S+R27EGA1Sj5m0qsOJ7Pa02LPLRVb8f3LfOe1Z1uDyqtTyp+9oKPVYu3ZEgr8JGQZSVn3HwM8x3LvLsqUKtgs+TkB8nLLNrVYbBKlEqlSqVSqVSgRI3zs/+31wuh4UUADENKnVZUxVjwsGMB6B1hpYmri0aYOgmS6YwdxCVTEHZEqsK/q+1IoUSlHTsa1aw20MdVrUDmpFqKpGIJ9bKsGIenLPCqNAEBpEFZreG4K9xgtLyEtF5+kzg0VHWg54N3DI4qAjL8pFqsY0gPlgR2Pfx3NjVx99yXrO8i3o+kVRQ5fWvIKerekZkDZIDaRnYyvCJ36tyOnwOvlq6WRIjXSKv3IP8iuk6itLLMGKzergFZxarkvv0WcwvN7ZZRjBnzGM01iNRck1MVOpat5vIWo6vGxZZ/TUvboUyhl9WXKGg7Q9jbkymfY02Eguz9Gdy2+l0ulwuX79+/Qtf+MLOzg6nPGvP8Pt5+vTp6ekpxMQePXr09OlTtrTSmxRLBL4IZGTGMKjbUYAIjxpMGhhEU8gCaxRSdZSlNc4nU1jJwmbSXexiYRgbDmez2b8GQ8bNsTk2APHmeLkHmY+ZTKZWq+3s7MDGTfNShuYMj1RJVkkTBpxFp8n5+TlW6lQqtbW1VSwWaS2KrMPAixetf4tNgteZTCZTyeRsgZ/6VVxSnyCDSJ3cQqFAEA0lR4rVGjpPPB4vlUoADhAHY6/S4BJKx+TNIX/TFkhCtNqBTktopQfyIff7fWBqQBDIrUBHtnMunU5XKhX0+XJL1mvDdlsqlfiaSAKd+ibaQQBiiAbujBXwBpUkgh+SHoIWIWiJ6K8zn4z0t8HDJK8EdQIkjbhZ+IZRtYDmzigwgL2Cy8BDYPKJd7FmzBrZ1meiKCKDxMczmUy9Xt/Z2dnb2yuVSpPJBEZnKFMTSyWYSCFgAo4YbPl8HudB3ZvwEwFK5lfgTnKAaQKjTCVKPVLAlN0AeFPauQlIGjxfTYadJ9UHHzaEYmTxACQCZgRuIG9Z31q5XK7VarlczjmH9BtVInwp7N0UgNBKjNLYr4STMOTw+VKpxCTT6G7TzgjBIgiPuDyi5BiuhULBEGeArxFcZhUB0ADpqIDpyajFIwLGAbGa09PTw8NDPMZisbi3t3dyctJqtXjXMIHEesgCg6ldaZ/sp4QRc8yrgyhQeKCEIICwy4TsZuK/2DK0DVl9nMhFYgMBRU4IwRCxIokYIs54PqCWA5oE8ORX6aCZXi6X4/H4aDQqFAqvvPJKpVJpt9uo6FAiGQj4zf39e++8k3nnHdx7o9F46+23bzr3xS9+ERT1drvdaDRgy4mlDALHW1tbtVotFoudnZ39/d///d///d9Pp9NisXjjxg2oEsVisZOTk6dPn0LkAZrXtPxGd6RRHfHXK2Ao3W4XHgCmVElEnpgv1kzaJ7oFBxB6OJlMBrpP/tcp7RqTF8IUjUaj0WgcHBwcHh42Gg2wiohEY7kAn4henUbuk9Sq51JHvfj1y4l6JCZiYBSzsPtCLutAJP5PmFr7xEyKLGuNx+c2amP7Mn0J7XvQupdB9HxJHL+Er3uxFlYpDqOiW1o4V9CQIRmTfNVfQmGsUCgYgJj1A5QQMJGpPz65HN3xOnGz4JGxGImJryUWVqDZbqyAiJLFCNxQ/pgAMWFirbg4aecCgsxgkv1AjPT0VyI1bYMgYPPOOtFJEItdMDRXKkj4NWNf29QPGCLPwzdIi1EaaSpAjCWFDGLKbnBw0mgEp6IYPa/KmF5o4AdJq+FwSNlTtMHRJNnX1/YL50YJWlcA3o6RZNFJF0n29wFinyliHiYBR7aO6SDRFUA5y5GS2WZSrwCFl2HEy7DCNRdeA1JfXHksFqz0APhs8p/cEkl6hfVXaBat1m2ItE5dBlL7nGXn6ZmY/UJLC35ZYoU+idYOzZX4FUSlkmjwjLURxI5arQZyiZk76BuDKQvA4pOTk5OTk9FopNxepqt0xOXcZMqJVVc9SxBHoWcUvhSU+6PLOstOKoyD8Jt9JO6yB+x8Pp+iEPiyAmmeZu5cbPH/cMHJMn8NF/9X3tb88k82x+bYAMSb419w+yRCgQRva2uL9DqW9brdLnpDgAyaUqQasjH5V2ALETmoT7AXA88IqznRK6WvOufi47GCQ8lkMpPNTtNp43atAR9OxUwAtUS2GJPvxkCW0aduqACw4vE4MHHaSemNo6oJ7kwkkQ0Piv16GqRG8pKws0LiGUwNPPNerwckAntzoVBQ2i/zVUA21WpVmT4aN/tAW0wayfH5brerrbjYgMmIwVcglEePeTabBQbhp9+8X3MlBPHxBNB9P5/Pe73e4eEh8HGqKtP+BRRdsPB4I+CsQXyKFKR16GkMxymawbRE0xiyXWiiSHQVlwcUDCmoduFFkggIt4FshTI4BVvpKMgs3TB6DMvSUMaA2hMSZa8ugV1+DNgQS+4sivhEBrwFOig6UetD9Mb6EHJpOvjhymkfTDQNYCJuTSUslTFNVEKp6JFhulpOESAmIM4kjbgkKWm4TsN2J/8XiiWm/kQZSu0/Ja2MQ4WrinJpyZNqt9unp6f8TLlczmazUBUnsK6qmn6Xq7a4vnSA2CxH1PGErtz5+fnJyUmz2USjsdYtsNhSLV3VxvneI5s0kSFgWJIshi/l4KfaT7vdJncbjz2ZTFYqle3tbSxKFEWhbE4ul9va2oKgfLFYvHnzJjwGUYfr9XpUI0kmk5lEon50lFgwiIfD4cHBQfH2bexE4/H4/fff/4d/+IfT01PMC7TJb21tffOb3/zmN78JROPw8PDdd9+Nx+P37t1Lp9OlUgma/js7O9euXQPGnU6nt7a29vf34fGNs60ucU2n006ng3ICdiKuCSQ5Km8RP8eGy1omXiUqcMDy+PooB09HTc5T1IaHw2Gr1Xr8+PHjx4/Pzs4mkwlkdoIg6Pf7LGFiR0gunqFBoPhFzztowzCcL1FWUUVFg/j4vOBIyrDvF+c8xSH95AorUef5zhv2rrtsJRrzOrVVsgC4LdcTbXjSWiyriX6ZhMspz6NK9EZWQu3pzaVyWzFIllawWJ9GyZYi7xC7ZwswO+65lrrLKpNsS6IuDYsKDOpot0jBSgWItTGILGAnEhMsk2DVwv+18kctMjopsTBjzqZiZXQG5pzlWpRKJifOzdcjqcUWGq+xywLWywBiF9VZYsiMBhPRB84/YPLmcjk4gmo3kgL0AIgRWiPwo4OCAsQcAAaedpe7wbAzDgYDdHtgO8A5UQXEV1OlJ9J9UR+OWlPqT7RrTSVBdOCZKaliR4ThZpcPAyhrDKxyauqzYq5Zuy3NaXVyRQbwWlmJrH6tQxw2wKV5hga7vFhhYjF8a/h5IBGvb+4XqVn0yc4ZqQESSWR+Lu/BZR/WVsgV5QQfwjbi4ypuxv0UhA9oB2F/1zmCDAjxbaPRwOJAQzlDHSMRhGancP1VQTBEMkgz6QCEjl5uVapjroUxt9C3pMo8yTraYLFil3/RY+Rc0rnAuZFzWedGzqWdmzs3dS7l3NC5nHNj52LOxZwbO5dzbuhcwjm8OnxmAxBvjg1AvDk+OxgxSFuU+CFghDUaGAGac4F7al82lYuZfpD4qUEtJIFOTk6cc6enp6VSCSehz7Xy0S6S/PE4vMwgzqTTk3SaknDsJzVInFbmnXPIUki/dQvFAOQzpgJJsAbEMcSOIK89myoL7qo2VmsIZdpLTdnW7OKIEZGouEUnFx4XvODRqgl9g3Q6zZZk0w8IBBNPnqRvBu6+3kU8kUjlcqy1NhoNwHwoFdTrdWhL4QrTi4OwJkAuzT1UMITRA3d9lR4m87TT6TQaDVjwnZycdLvdRCIBTV5w/fB+kSiCPcTzA1tBbXkymeDRLTMPWca7UasEymhEtusiaiFx0oTskbpgpp+Xs0wBRMUH1QrJJ9iqKLaWKzQI89MG5kWqshLJOjGXTRhCAWIEaorEAeUnSqUifZT+4LPSUpBKhGs6GsmJi3yDpjkOIxPPk3mXQoq+DqBeLfXXwOTlo1Z3EfawA1kjrKDIjkbPilaMRqNOp9PpdDC8udyRec23bLJ6n/x1pW/7c28BIhGu3C4QV0F9PTg4gLqcW3D3WBFB2cYYTKv9oM8hJbaOUwE/ogOnE+KnW5gW6psFOgMUWGtOXHNwHmwrGLGgMTrnBoPB2dlZu91mRjQajXrNpnZ7AMatVCqxWGwwGJycnPzqV7/6+c9/fnJykk6nC4XCcDhst9vb29vJZPL1118HJb9Wq6FER1wbj2t/f39/fx95C3S6t7a2SDPHqFvRAIHBw24SFXBwi85Njjp2VkLFHtsf1xnMRFwJcQeckwNbyyp4TcSGsAKTGg8O5vHx8dnZGV6f85qUCcFob81zjMzFuVZk4OoLF/kMfSX3yH9SbpdJHXWbU2au2cf9a6PCjw9R6VqhAx6gbVoOlSnnYk6NF7A1VR2C6waNfRDXAbvX3YGas2br0XhGFTYjtZVJv1VtLoUdtYjuL3HGSJAfy2azvvucakoaqF1vjV/k84K12hepHUG/Bwx4NM3ANJisZ1o3dzodVPHxrzwDt49EIpFKJrvJ5HhB/L96KV7w91YQ3v2gV0EoXyjAXfYaMYVwLEHQvILEJ/ty6BGHRaDf71PlgzrjGiDREtZMJQ269PLI8kMdjsMSeDFfLhBkPzAwSKue3ExeUh9YVDD+AYSftDPDXXY3IZdCYV8bV0tB1Be9WaYPYDrfNXhQRSASMPXXnWek6VeeVmPEBiFVHQwf6HQiE/e5OFYIrZg0bYVKvo+2R85KZjcRz81Tx15d47/yYsz3uiiSuzFNVf6K8aPTu2OaA4/fO3fuXL9+/fr167VaTdljo9Ho7OwMAUCj0Xjy5MnBwQFID4hVGOpzB2SHE5hnoP6YgBzUKyIMEJcgQk3yBzcFtjiYUiIyaOrhaCr3zBTHuXkYupcFE6cgEuRc2rnQubRzgXNx5zAiMs6FCwTZLbDj1OIzbvGZ3gYj3hwbgHhzfGYO3R781Eg3KuwlIImojBEWdCBoSGhpQsIYHQlDGIbNZhPipLFYrFAo7O7u3rhxo1wuwwmK5I74aKT5ZFxMPxRrcAurCqz45CfinxD5QboI0A96XkABBk6t3F4VxyRypyE4yDKlUgkUKjWHMYq62q1ptjQE04Zbx8IpjObRtoloG0IK6DXGhxHQwzmNG6RzDlc1n8/z+Tw+DDQ83euZqCKRSGQWSQJCcxUWZCSND5PEROKJBoggrKElEwQ04sWaHpjG+el02m63z8/PsYU754C5U4eu2Wx2Oh3CSb1eD+3hfPKZTKZSqUDHyic+XBkyKsLI4rYfzIEFyWIGIifVHiHByp8+LEUAvkRNwjmHV6NoL7opNVrFNxYKBQ5IIEpGn8HvTEfYRxUUoPlIAkkBWF0xwqByC4/7S2Mmk+FQ4QvVRNFwqDER0J5WqVRYXKEGsfJ3ruRM8XExmtQ3iMnCsYdxheeGgU02HHWEuXApWc8t3BeVsKxdt+5yTzQVb3UB4Y2nUimsac1mE+gJtD4osULBFu1bN3SkFaZYL4oOyxZABpPSu9BY0G63ATji8WJQ4TLwMa4SeJt6tXgRgBSJOVJFFMw1/i4eC0YUPsYPOxEYRVkIog2YkszhwUFmWo4qFycpjONKpRKgIkoSK95XrVb/43/8j/mbN8/Pz995550PP/zwV7/6VbvdxlLZaDTw1s7Pz99+++07d+689tprmUzmP/yH/1Aul6GnRM0ZRf2wknAb4iKAjoQV85FFPhWOUAAF3zKZTM7Ozg4ODnCpmcUBNAciRXjXvV6P2xBZ3pzFhLoA+bEXBC8LazJAom63+7vf/e6//bf/du/evUKhoBA2y29KbvoEgza8nL/5MuuqMWpwE/2zVo5NocigA2o05O8aWrH2bRJ9pNJ3MFN1CB/pRhCVzWbRhEHylHZDJ5NJFDxw4POm+Keakvl8nt5xhtes9ZjIJxwpdqmVs9HiIDmAULjp5TdA8ArKHp+GryTg098i4TAXxRY3+tGRlQCsb6gAgTvcarWazSZps27RNHN2dnZ2dsZyPlmieCbYHPFCe4nEaDxek66BpT8mKKr6EpvHGNnbHgkQu8u+c9qxznFCujfLBlw5ieRGakBr16BGAsaoQDc4FW81SvROPDBYF1S0S5FxY+G7rGxPIz6i2ASIlVDPSaRYrWpbKycxst9fUwC/gUBjGL8qY9RCFCBGXsMwKXJORVKJV/CIV9BR8UL1YT7DnSEx8XkQIY7U5DWTPbKm4paIMzhPzshkzZHLnf9sIzta/HjPRekUm7qdEhe09c1dlrD3S6SgKWCX4YIM8ajd3V3k+JlM5tatW1/72teuXbtWLBar1SpNoWezGaKjd99996OPPkKdjNkfxKlQesFigkUGRXqU31B10zAJBUX6mrINRZUlnFj8+YuSkwY4iggRIOY74lWFQRC513/CI+tc4cXOMHVu4NzMbY7NsQGIN8e//KFVTbWTNgkq29WxbaRSKSXQuYXHXT6fR/7JPnR2miDbTKVSAB3QRNbpdNLp9P7+PiAthl+j0Sh+mbfrZEc0NuVuoQOg7V2KutJIB2iRWygaE1kwD0EBYgbKBC6RlRnsTPNGRL0+P0iJCX4cg/gV0Azyf1KzaQLObmJst+Q7kEcGjIy8vGeMg0QiMFGgOIbT40v9rI3ilbHKUYCYUgko25ITzfqBpmd81ICVwb5RNI2sYQQE7F4HDkXKLd4FsFda861zqEUDgzyqo5oGW3IVs9nszs7OrVu3SqVSKpXqdruNRoOsScBkGLqEI/Hi9vb29vf3WXvH8Oh0OjTsJkcYQVU6nWYZv1AogJmFmgEeCx5poVDAkKZErHks6C7HlVDkFBHYatcXpaoZfAeyHkA/Fe9zoq/H7lEQbXD9lUrl+vXr165dg/oEqO50JCOrmtRgYt+GqKLzSBsI+GDxGGEK1+l02D5MMBcjjVA77qhcLoM2BSCGsDKlXU2NR9t11ZaduuHgb+LJ53I5CF/+/ve/h1TCrVu3YHUIyjPeqeE66YpEToqvfPoSdwFljpNOlc1mq9VqNpuFreLZ2Rl7q4mMExEm8uWEiDoajdrtNpoAuCOAm4z3kslktra2kABQbAHZDuY7SnqAt6i3i8/0ej2s6k66yBVfptPmZDKBmzaGDVBjbFLxeDxbKiXT6dhltOXp06dvv/32O++88+jRo6OjIwxLDAxI7s5ms4cPH/6X//Jfbt++fe/evTt37vzxH//x2dnZBx98AEYh2j6gp6TKNmgN4coGRIarMRNXJeIBZwRvEfxKNJRg4cUbHA6Hp6enDx48ODk5icVi9XodHphcZ5AKcvxjO3aXCadYbfhqgC9D4hzt5x9//DHeJi74yZMnv/zlL5vN5r1798bjcTabLZVKeNRqS6Uc+WWuQdFJvnNOdHsjG7oVGYkUkeAIMbUrg5oZJZ/VF2bcBSOjJjxtsrMNVcpd1q0y0uesl2jhShNpUD4R22DiaEyCxQfYMQpypotoBXTyXBAM930VpeX2sYIav77vFiMQXwP0ua7cHxuRn8GqhUdHFTIs6RgquGWs9rgqCtzjX9XRdDabhbHYZDZbh6eGBxc4FyzetS+KrRh6pK2iAS611K3KHtzZVWICU54GEioZREVmtb7gtqtUQZZYyC43DF8tk2j5xPi8RaKfCqea5+N3A6h7M6WWqbOsA5W1Xq4hyi7XJhhVrPZjSFNNUZjYYL7KSlGVElMCoaSV9r2pDaYB3A2J+Lls7txlOqoJ8i9Ost7ZPoPp7bIakq89vaweGfk8FXyMlMLXLUbfvvHHU7a4u6xKHCkuZ+BpXw7baIao6DDmAqMIKgrCHuPWrVsgbGWz2Vu3bn3lK1+pVqvIPk5PTxmVPXny5O233/7tb3/78OFDCIhjq3KLljvKH5HDQS4Ik1lykhAqw4muVCrBzED7YLCTkpqjwvTYfbTdhNpuCONVhwe1lgt7vVhs/rIA4sC52AZI2xwbgHhz/CuFiZdF1SayVNTPed1bDP6UYgy8EgRMt7CuYtyJNJ6sq2exiC7cUbr+voe4KclqlqLFYTV40U1Ue8d8O5q4HJF+OJGJDSNsNkebHm2G18ZwzznHTh+G3c4TEOBXaGBNUPtZmh2FAyq9AvxlMjE1j+X1axDM21ftVKWNL2NyOVGP4pgBfgGsE4iG6fjjUDEsDGVVrC83ppmVnpNnhm4mckWM3q2trZs3b0KB9OTkpNFosEkcSB+6q3A23FehUNjf33/11Vf39/ez2Sx4Se12u9/vu4WWKJMxaLmgSEDFZ+DR7CLv9/t4/qix46uB8vAJoOpeKpVASSa1R9Ub/KnkLpuz8f+qH82mab4+pRLTpgkoHmr7k8kEF7O3t3fz5k0FxJXGyx+6hWMbuz4jW/kMGGR66NCSD9VXDicaLuMhgBEJX0e0F2CCY5ip/jiHqErrYi4oowE2Yv3FMZlMENTiXtrt9sHBwXA4rNfrd+7cKZfLysXQ8gkzc22/YB/DlcZ9zw3xOOcWTpUsEQEZgTLP9evXq9Xqxx9/DM1xEPlPT09hLsTWda5IEJ1vNpugqeJJ+tpz0O3BsER2gUeKsofKZxPEhNRdp9MBuAnhaU3d8UZwGeAXQ4+I8wsTFsAZqxepVCqfTgf5PDe1RqPxt3/7t0eTyUcffQQnbnwjNwtddh4+fHhycvLkyZOjo6Pd3V3UsYCtI9uBNDbV4WmdyiQfP8TFkAfEEY5Flbx+aJUMh8NcLodRxPqQcw7Ky3A9RRcn2kVJ2OdAUmkXMtfYcM1FCd0SFJ7mHCcVaDabNRqN8/Pz3d1dgN0o/wBI4raum8InkCFeraniU7p8H6FIlNAXTFh/fi3TfnWXre39W15mPuZL0/gakSbcIsRG7VcDEGOoA+X8lDAdnXQ+Xe7lYkmfABRegTiveLMIvbCFUcVbV2k408ZEnIeECQ2VL0bIfL6mD9KFxIRzsSW7sw8QR4LdvuGVhnOkPmizOX3qKCKsTiRo3GaXGPkTqp1i7ElUU8Lvj8FXYKlhVEBBCf05YSYNYIjJEqpmaOpr+BL8VfEWla7WwJ4Ak0pJ6C6jDgoGN1Rur2r1mNFrnMFU3dhvStB938h/+1q3ZsX4BNPQmLZFrLEvNgf/+RPbZUwI8xmD3ftPzKjGGTNSMx381T5SbkIJGStwaue1p+gH1DXUsIz9PRfVIPqR0JIEjbY3b978whe+cPfuXRj8wlV+e3sb2dDp6emHH354cHCAatnZ2dlHH330+PFjmC2jsEQLcUPVYmKIqBhqNhr0UuWGpB+lFmHNYU6hrR7QvSFA7LzGAh3VLFZd5Dh44y9RZWJzbI4NQLw5/lVixJT+0W2JEoQsuyGndVF9W/gAjW7Qx4of5vP5Wq1WLpfb7TZQNnIMwcdEpy0t14LLWOQcHIQFhKRodWTpG2wvIq3UDKWhCtiCDH+x6zAuJNaJPYYUA2bODN2McoJvlExyKKAB+LCBlkWkTMFQYmTkzTEUJoDuJ6U+lGZiHd0AE/F4NpdLLNoe8UxIgqDtG+NdUDJB1AVQopg1ennwQlkV8L37tA2QvdW1Wg0vBWkJcBznHKCNZDIJIAnGfUBGlDrKVNmJ78pzHcqCV9wcB64W6UQ+n4e1FN231UwMkCgbwPEEALEhxsrn8zAhbLVadFdng7ySdEBYBkcPmBHSM8wmt5BoJI2doA9vX83ljAyZH4wadQiT/BsxB802aWVGtqCWlCj+C8Aaii5km2o6xLdJkWKsJ5xr/kHw2hQqFJvGtTEudJcdXciQZVOtE0FwZMKgiZGt75wDlqcSN+QnwtQIr0nrTIRN+/0+gDPnHEe7PlJjq831R0e7jyi9BIxY4nhm7+SbF4vFcrkMGiyWr1ardXh4iM/AwAQvi024x8fHBwcHkBcHUE6RE8KFhABAfqR+znQ6pd0ZUx089m63e3R0dH5+DhWIYrFouF3IUjgZ8UYwFwgQc76zeHnR+ZjJxBbc51ar9d//+38/WYiTqPCIWzAZgRAB5e/1eh9++OHp6SnMJ6vV6u3bt7e2tmq1GoBUjklURFCcUMIddkzDHOeAZEM3rmQymZycnIDVWKvVSqUSECsUsfL5/M7OzvHxcbfbxcPBQ6ZDgBk2PD9mtEL53BBRcUFxazgcIpcDiAbRQBCRtAyjcIau+c+BDoOtFoV/RGK1umoZeMXXP438RR9TWFZHNw6Z5lewElLqR1vvVRPDOMuRKsWDbEfquvJjWlz0hVmXAeKf0mFEDBRY1KLy5wVUUrqr2TieRVCJBFWb0BMDYhonOzeIIAgmQRCfTt0aTU7ALOYLBrGvyOEjRKuZCj5GrKK6DFxVgl9Jfzwzu7lpNWFgSl/n1ADEJhzlAFZrOzXd5Vzwy9vGUEv7bHxAUKnKihEbgNiQRVi3U18NXcq0s5D/qg+Bg99f9IwGCxE0tlz4gZnudCb+j5Qp8BfMdWafEcFYUV/5jM/l9W/c15Hwm7Qia3i63fgSE/6kM1fl68P4KLAOgEglQy3u+oLU3NyNHwDmF2YcJ3sqlarVanfv3v3qV79679499LeR34Bl7fDw8De/+c27774LlS00hyEeANxsPNsBHTCVHgwGiNAQUkKnkY25LGSyBY34Ay0xwNigoQJmKH7O1mfTY6QtPgxInv3/098cN8fm2ADEm+PzemjXiZoFc/NDW2uj0XDOoVeRXSGoQ7IRD03x6BEG5wIADdDYUqm0v7+/tbXVbrdBQBsMBlBLbLVaELWkOmcikYhdTmUvSIsLPVDtw2WIRgCFrAF6OxDLQwLPln8AE51Op9frGTKR7vpot0GtFVsgtl5KIOm2hN2OTZ2z2Qxiu2iEASMVkqw8IUmUtAE00ooKEBvUjMiCmmPY/E2zC+eSqVSlUhk3m6TdgUTJdI5aHITXuRNDzRCqFwABiR0ozMFoGwC6MiVJPwFoyMcbi8WAyuEyyuVyNpsFD3E8HjebTchrAjl1C5IUYh0TrK8ZPkaW942JBEcaRjgiKlKqtUqBPIq0RIRNyLiIZjJuY1GdxQxVOAG4yTo8MV/eAtq9VQ/aJOeaO0VGycb7W50VNfAlfqTU4+nlwwC1GrD6epEaEPMKjWArm+6vzEP4LazrELM2hntaAzBkeSfNepPLB8+mci6aEiCpA/4LQqXv5mSczalFm81mgSmztuE/Ls4jw5h+uemUImv0FQQc3Ov10uk01i7KvzSbTRROCEFyCZrNZs1mExxq/AqTByyJmDusBAAL5noLvirOSYItG7rhLwd9diYJap1HDVCDBZteDZql4AOz2SwhgzMWBLOFjxV/xegvKVoHSLrb7U4mk3K5vLu7W6vVgNVSscR4JBo0CpxiwMfGA41sZar8a+0HS3EsFhuPxxhUOHBt4BH3+30jU2AyW20XQP1D74u0cdiUT6dTONli7yuVSru7u/v7+zs7O3Dhw0Ojhoy7SlJ86ah0zsVicedisr8bZpyRaPCFZQ3BnDRPd1mz1S+Y+SCCdg5RPsLH9An+YlPjk4+kK3LDYgcuZgSVhXUHcSJIzQnFvFrLaYpfK2L+KWExCq5pnxafs64PPvbhXqqo+ktBhwmAUs4LQ1orppVKBR+DJDSCQMVSqVTWDMNsp+M6nSt5agSrYp5z7LLFfxm/WAUK3GV7QCqW6stKyGE62RkJmAa7SFTaqDwvU0+mbI7y38kgpiiWzx022J9u35GXxN9VHQkVy9aZ4rMZuB+5y50WfG6GHeKj5Cv8GCn1y8DDAMSRb/zK+taLY8Sm4mV/8aV65H5Ks9jA2Vdaz71I+qwQsJmtkQBxpG2dW6JTEfk6zBJqInAn7QuUV3KXtYnJ7+EH4FKwu7u7s7Ojjqa8nV6vd3h4+NFHHx0fH7PIFI/HS6VSoVCgPpgG9lDxovME1hASbqrVKrY2EgWQe5KwRVNQJIYQgje5Eh1H/Q3FODoyC3tWawnDcD6/6K/dIMWbY3NsAOLNEYkTMUbUfyUGCklNVVlFDKdpCQJlILxo0APsC4nPQqEABjHCQQCOrVYLneDn5+cAbsbjMQTyE1i4L297yLvoX8Sed7KWKObFDllV0Y3H42B0gnVFN+rT01Po5avzxsXESCRo4kE5f2AWQHuBdBMGpYtdEATU00B2jXQdXbe4cqBLuVxOwSwVeTB7vwJqqoMGXQLVo9RcejqdzieTVBgy4ojH49lMZrYgYuMBqm4sHji5S5T8x9sHtg4SGaIHNHRrLznLzqAAq2cgpA+UfK1RO9AiKHiCWohR1+v1Tk5O4IPEV0Oq6ZVtyPoMVZ+LOsLkkD7zH0+lmEclEglAPzTsgsQt9bMomYJwp1Qq1ev13d1d4EQcjRi9mFCZTAZPjNgN0HZA8yBOUhQPWIPOAoWw+aLdZY0It6RXzqelOLHEUWFrgJ6sxHCY9ft9PAG8HWXNE1dV1Qvj5kFNUs5ZTAQ05qP8YGyXIoEJ/nqn0wGHHasKtAWwOFCkBb8FBA0XplqEuC+IFwO37ff7OJX6R2l9iItnv9+HPxhenzpiMePFWooYN5PJ7O3tNZtNAGqgqSpKy6UAZ9Du4EgDkxeCeC5vBNpFwc5iyvXqgo8BNhgMms0me0qwzIIhgrGNnkEsoVTjVZdF5t5oGAQQjPWH8tzgdGOcsGlAcwksAkAzuRaR7cvWYNOEizV8MhgUFs5ssVisUCzevnPHdTpHR0cQdcG2BZAaCyD6XaBnQikM7HG3bt26fft2rVbDVxNi4HzU9klCw8xwjIoRRh0mFLZRbDpBENRqtXq9Xq/XgyCATyDGdrlczuVyhUIB7wUvUXUAtNzINhqsYJjRXABJBWq322dnZ6PRKJvNYkPHTNnb2/viF7/45S9/eW9vLwzDDz74gE6ATCxND++aevFBLBYkEslYLH4ZVdEFzWjcR6JXpjzp59KR8Ir+hOrMVOc3klCagdPRFNI6wLnIyFagSsMt/RYiv4TJdBmkCAydSPExhZs5zEjG/BQzh0QCYRtGjo52EudpCmSCK0NtM7fwL4su4dExNmCZh7O+UChUq9Xt7e1Op4PiEBtKWE0fDAbD0ehoNCo9eBB0Os+LvLvLUqTPi2T5irfGq8r4v+kRSdf1wd9l2YSylX2DQb+MwZCGjYyRyhKRALG21WuN3CdjMjBWgJipgRMvE9MdbypqKgZlRNX1fpe1TWi5nd+unnUrHDIjEfll5YHnRYfXhU0/V1CaaTWLvNnnWhkiT7JM0PwTTPnVvxtJ9fDLRYaE7sPHKizjFj1tbElR/jimANi7DKKcyBj6+kI6/U1lyJ/RZhNXf0jjFWlcBMzkisTQIz0DPy+9LJtjc2wA4s3xLxwNowxodgX9V+3ZpL6E8RxjVJ3JZMiSA4wImyN0cyN3wknIsYX6KknEyEtj87nz1nHNb+kfpcQolfNXWIqdLNA5AqJKeppapZm2TdPXyW8HYkJEA3snAGJyhEm/BSAIxBzhJtmXxIBMi5C2sSusaSyzlJWgPena+orbTHL7RB/fotjLnwEjoO0YJDgIvwKgIUo4Ho/BIyPSh7yIAp04J+6dICywbAKvwH0AjoA9QVUN0qaIvAP7wzPUpDrSm+hKjNj8Ck9FRRE6yPf7fepLVKtVoDC4YOYJsINLp9OAe6AsUa/XWYqApS8VPHDv0LdF8qmQOlB+9GThIRhdFMULlJG9TK53deoYSXXBK6a8l6Yu1BUhYZasTHU8JzwHgK/b7TabTcIEWoIiTxMwh7Lvr1y7gEahBtNqtUDnJ1gGhJHQmGp34sLAu2RqqkIfFBKBBG0sFgMh1PjY4Ll1u92zszMUgTja3YL5i3eHt4zL293dvXfvHiAkiLuxvRQLgoHRI8VMX3qNUIEAbSvRQiCbMLCWAq/sdrtQzsEzRzsCniqZ4MTF6MxGvgllNDC8O53O+fn5cDiEdgFl8nAeoMx4s35DLl4fjSL5To2OJIY0i0+z0Si9WFiCIMjn83fu3BkeHzcaDQzaYrFYq9XgAtdsNtH/EYZhq9WCbgzazLe3t0HAgSIHQCKj2676xZgsxD3BwDXWXrhZrgMYrpB+BnMnm81yElGUplgsQm0Z+xSRRA4nxSnYTK1lCUxtSA9xyQqCgL0vWKySyWS1Wq1UKqgNE1PW/deo8a5pUhc4F0sknnWeXyZFGlBGxdANidhAxpEeRCqlyqVMNUyxHaBKpxGCwW5UeQDulyDIa4HKVEOVKo6f8IuozWpIZ5TtMjiau9wEzWV5RZntpawnahnEBVAvwKgG+QVLPuQXhLNfSubPJjAqYxaLReWe6w6I/2MrpJ8Yey+azWa73X7Y6Wz3eu7p0/WRNYMLm/X5eTHi1S86WHkYAZN1QLH1WwcMEditlNONrN84z0nMp+v6gZBP5PQ/Fnkj/l65YmYtY/iaG78Sxl3tELP+GPg3eEQSopfBhavr7uZNmXzNXRY5NL+onWTLUN01oWGT+jmvUzDS39gkegjAdnZ29vb2yuUyKo7Xr1/f3d0tFApawEPMc35+fnx8/PHHHw+Hw2w2i+CHqTF2KyryqQAd9QOdcwjkyuUyMil4FbClEl1ipO1TR4KOoEyimRezj1MzZWMzbpSXWFK6iCfj8fhnng6/OTbHBiDeHP/yW+kyif1IKMFdVvcjF1V7eLE3UPDILZh3TGYAHCOPpd08iJnheBxeLvxq1EiFXFOfN3C2ptnqekHSFvA4JpZGdsBdttTgtwBI1UZCipMiMdaeYlMUZRSiribucpc9gTalnmlSaphQTszi2D/IpnjcYHo+j0cJNWqCzUcR6ZareTieG96yAvdA7YlwsQNIESIj3cj3qNA2P6wXCTxOB4Mxxl0zfeINGmUDEPEA2WBYAugpl8sgv2ezWaC3dFcj7cs5VywWgZ6D/0W/BeccBIvxHpH/T6fT4XDYaDSm0ylUube2tngXvV4PiBtvs1gsVqtVXA9AByIanHpKS1nhmxHZv8aOM7wOKodQWwBQhXL02HrP0JDJM7FFfHW/3z89PSW2ou3numJgNq3pN8jwEdk4AGhYY41GI2A0FDE0jupgfdKSniqHfKcqocNRDamEcrmM1UPZ8ePxGOOHo1enLUUAEJui5HDz5s1qtZrJZKCrOxgMKCzDNggn7jcqBfDSkWKi89qZgW53DGM0AEICaG9v7+7du9Scxe10Oh3wgnO5XL1eZ/TPGg+RFwUNCUqSo83CTCwWK5VKsBBkJwGrcbgY8DQx+1gX1KKRqXHSw5AGg1yWZ9NpuFgNstns7du324nE06dPG41GMpms1WrXr1+n7R5owrFY7PDw8OzsbDAYYP6+8sortVoNvef4MO1QFOxgmRAXbIBO3YZ0lVPZUCppYuhyHcZNIbkChxdtCnwX2oNCq1gjRcrpiQGAUi7NZ7AQYZoAXje8nmVYjF9+vgKnw40nk8nlwpdK1iOo7RMVMR+NY4Gm9xiZWARYWOICi+eA0jL1HPzCJOVx8EkCxDybMohJSVZkiviykYJdjYitXi2xSC5DCX2dDYNTRDrpaUhAewAYSKKtxFD1qWWp9Q/zjmBviKUGg+3KLSCSK+o85YFlJYFl56SiC31EzUPwta1NFAr4GFXD09PT3Xb72uPHwT/+4ycIyCPhyBdZ/P1eK8XFDFOPa47PHdb+g8go3VgB63RbIYNgVgwjQr56APhT23yjwZrNSP4EhRODF1/5WytQYBJ0PkEZ4NMumXx+89nI52no5351waSQpiPTV5xX/4Bl8LS5BhPlGt6PPwA4NoyOHK/N/Ar7vVhi5MRPpVKI4r7+9a9/6UtfgoE2kp16vV6pVJgZzWazg4ODX/7yl/fv3z85OYHrL9SN3GVSMP0nsEqAXYGAIZ/PYzmFpkS9Xi8UCip4xUar8eIgSwkhIilWqttjbOi0zqpEEF/OSOv0QTyeh5TfBgDaHJtjAxBvjmUbz7L4hus+E3sqhLqF+ZsJLom2GDczJJMKyALtyufzlJJE8/5wOMyIOwRjMUK99KnTeI5ewEbOX1tESYAF0EAFYWxy6miBnQYdvuoSA1VH/HrkpqVYqmIQbFgjzQTPB1dLYQHSgdmnDyiErnoq7EvSCnjQg8FAxd1wJePxOGy1MtNpcvGwKJHBXda8FDwoFJDdwt9JEyQ0y+MtA0AEZAOEGpAoYyDkWvl8HkLDZKADdzONjaQuEv0B6xBvjfZubtHcinQanO51AmtfrdLgF3xfgInB1IP9FK2c2OqujbFgFuOmmF+pZjE7KBkzAYQFBENcDHMEpCROUlRQACNWq1VoNytK4idaLMasFt/Qe+egpf8DJKE5O/gBhJ5aaCEkSiockFmyxbvdrjGpA9RFFiQDQXzjle+RtQoVRMZfCTEAtcFFEnXlTMS7A+DohN9HtDcejxcKBcxZUCcAEAOVVsV28F6Bk7pFsyrXH0JsQIpRRYBuCcYVCg/UW1AWnmmk9QUQXyiPci4WjwMKpyADCd1Y6jlukULcunXr5s2buM5EIgEea6PRAO2XstRayzFVHzra0faNfN7ZbAYyCxzwtLiIOd7tdilEjimDhRFDHcs1XjQ1vilmwnmBxINIUBiGTmw8E4lEvVbbnU63t7e73S7FMbhLZjKZer2OF/fgwYN+v5/L5XZ3d+/cuQP2NNSEVCxILTQNXKJ+ZYo3sUUGY5g5FW4cQwV3CpIj7lHdX1X1BfcLsBLzEVLRYRjm83mOQ9JadQ9lxgUtFPqVz+dzyBP3+/1KpaI1GHeZlvvc8tlwqEPOvJyoqI+LS65BotUUTvVVtfpLVi/GDzoYuOhBTZgFP2XChhKWsO8ktziwa2jw4PN/Tf87N9/VeLqBJg2IaZSXTWXaRTlfKbyu2wcGEuW8DZWbwQM6LVRswbwCPl4DtfADiBAKhQKrqisAF5a1fGyRVVtlK6sxlC9luwxaepEDixUUYPK93v7/+B/P28xuiPCRMPfzopnm1fOlzy4frCiQsYHQS/1XlxUVjAwoVxInfnFU3GI7hSp6+2IXPrHXX0jVjcpQXgw1wbTPu8t+DEpI9FnAJsKP3H9XdPxcqQ0VadXgPH/aNeHRSJb0v5FDDX61zLDiGZoV0l0WBVYQeZmmhz8pIlUjtI3GZ2/4JRxTOdChpd2ikZOCgTo+AA7v9evXX3nllT/8wz/86le/euPGDTAYWD5vtVoI4Uaj0TvvvPM//+f/fO+999rtdj6fLxaL7BPiRVKZisQL5K3pdBquRYheyuUyAGjoqiFxxpfCghgNi+oMSeoJY3uzSWn5nPOdk13ruMYk9gIgTiQKo1EqlXIbEvHm2BwbgHhz+ACxb4NmglSAldilKD3Mll5KJbDRlTAHWuPp1UshY6z+yApISwRW2+l0+v1+IpHIzeezBaDjnJsDBYvFkIMBDdRYzYlrtnahYp+AvCkuHgxNsPZIA2TubUT9YAjDnncAKACDsMOpar4+T+C/oCsSfqVAB1hd7Ctn6oIfIqXvdrsAfMEFIw5CJIWczcFggD4gdAFDxoFvYTweh+fn1ek0dC5wLnQOmq3heMyrog8sdlzcPuBvvH3oS0BsFzIajDwA1mSzWd7peDxuNBrwtwXpNZlMIlbAW+Zg4+0jhiDmBdIWPA+BMzrn+v2+4tSQtwY+RWDruRKwyLjZsHUILmjup8GZn8Eq3cYwB53oLfKHmp9rdKud0cA3SdD+tGNrg79EohVKrFAATqFMwyFSlTEqS+gvmqx4/eu88lcMRMgawLK8S3NLuqsTdKAsDzmeJpv1B5Wx/SGBwtj7+CmKoUe99DSPzxAzWlFUfB2W5fl8ns/nIZySy+W4YsDbBKsQhJsPDw+73S4QcJR5NDHDso8KBw2d6M0I0Q8A8dVqFUqmQM+1m34ymVDamKIfGKhYOigWT5jY+FJSk+ECWbg8BuKJRLFY3NvbwwZxfHwM+BsyJo1G49GjR3gI0JDZ2dmp1+ulUgkKSyg6gkHPEW6sCHUN4TBTRI/q3kiuuACCAYQcDAlVuVyGpgRELdhNgkeH2iHKEtjgWOFwzoHXUy6Xud/hvQwGA9gD4KGVSqXt7W0AyugzxWVj62m1Wjs7OwoQa/YLWJZi0M81NGcLhrJhUPoS6opA6XRTIyxVezClLFQaUHLQ7leSSYH5UvmBoivkbmPgUW4bTQyGM8s1k9tKJAtynaVM0ToVUXHifMjimdlcDPNaQUAuQdTSZZBA+WwDsdGpgpJEPpanHG2/uZu+vqgiY+JEykcq8Ge0PgivZxYHwhj9AN/4pw2WobqM60mHYXF7+xN/owIckYPBV1ld4Unrd2drbRXvUbvBsIBAPAS93kRwFJCNFGFg+Y0CdDSxpJcvJyBWHjWp82VJDMBqvsjcu6LS+BajD2Pa4wgQa4iigJQvpmyEbrgg0MzWL96Yy4t5hylx+RrHkcGPKTqatpVlOiH/ig+dEb5SiuGf+jBxJLd3mWDLspXKLJKm0hCpK+JLaZsg0CcL88NGmIVjiflLMpnc3t5+9dVXX3/99VdfffVrX/vazZs3oZyGbzk/P79///677757dnYGcarj4+MPPvjg7OyMrB1slNzNsT6o+ANGNaSoKpUK+cJorAGLiEYR+BVmu6QPm+2eGxD9J7TuiHWed21EvXXnNfpOQSKRHQxy2axz7kVJ+6FzI+dmzsVf4AzDF7+OzbE5NgDx5nhJh1rH0PndBOJIANjN6hbcMbIjkXyCQgKlIYJ67CMmk5F5CNJRVQsirS8IglgQaFnvwissHk8mEoVCASRBUhcVWGGfPnd0CJsWCgUkh2jtbzQa0CqlIQn2D6peMrUzHscQB6AuEnJmZIaIdCG1TMFcxNMGQcad4lKVak1tU5xfybbI53kGAgpQiTo4OGg2mwhS6XLuFkyWYDjUN4sO6GDhrYebIsGH7wVwAzZsOGvhnEy8Af0gwQPoA8M9stjcZXIH8CCyjLX1j7eDQTgajdxCfxM1BiVNE8iGREk6nR4Oh6vNKHxUUfVJ8CL0LUNAA2BBrVbb2toCMxGZEozLaL2NLIukS7TGAx3gg3ILuh+AM9Tb0ZDLPApFBed5H6Pe0Ol0ANNjYACNcpflPnXy+hDksoPcbcJSENdGxEYsVVFvfZ54a5xryMQw3zE2gPWTKtvr9Ugwh6EWvxpgFhgN6qll7kLZgsz38BjJesON4FGPx+NWq9Xr9TBBEOOS4IllhDhFrVbL5XKsOSFtBpjI2pjSM2Fitr+/j0QaNoaEWrhmYh0IguD4+Bj6EoCQlL8f2Q9rSGQvV484FDgJE5CPmqoOAEZhkoaRTCASQuSYO4Bm8OF2uw2YDGJzShPDagkePWQKms0mJwKlDJjSpNNpQM8YZlSAITlFE2DTfkjIkqORzBTiXNPpNJxM0t7SwZIVHAgh6ZtKpUql0nQ6ffz4MVpJINQLOzKu0oQknGgHKTztPB6xmcWsv5LNXSwWS6US1s9kMok9iIouNFmikSzmLwxgQRYOggA2esVisVgs7uzs6GqP0ZjNZrFzERxEeXV3dzcMw+Pj40ajcXp6WiwW8U+TyaTRaHS7Xe3doeoFZgFZisv6Z5ct07PZbByGoVinRq7kBmdX50n2APFQVQdq4uPegVGC+asfI7pEdFixZnbJAN8kZZigv19du1IXYvWBgcdyrGpDcXnE/oKGDG0PMgpXgAUhmIvRwpCDpQVSvYi2KzPXLBdqcmvQsUjFVcUECa8borH/0ChbQXluYtAgeheLRSiYK33bMPo/bbwMRf1KpZJPJmO1WrDmajyfh0EQegjXsqv1XRm51im+7BvTuYVUGgsJrCexuwL7dbPZbDQaENkHgQPrsII1PniqKl5acaTLCBvLwMAgux8jgT1V2HOX1Y9VEoTVCwWO9V8JDPka4mQ+studxRVTp9e+PY1MTC8IFz2zX7Pcbtyz+bv6+vgA1ZFYYUFf5MQERYzu/m2mt2q8bN54ZBzl6yM5j/kbWaHxNUyMcpSmqJHrv+8N4P8rAWLDo1fSCVdCzAWYACH5zWQy9+7d+8M//MMvf/nLN27cQJEeCex0Oj09PX333Xf/4R/+4Ve/+tXTp097vR5nKLSJEewhlKWOBHYNJp5cmUulEurWQG9xXxAjgg8HtxXGnz7Pgw8EK4Bpu9Fdgz/0ay2cbhflunSaG0c8mUx3u4Vi8eUwiOPOvcg8C14AXN4cm2MDEG+OT28fpZREZDKjIrPD4RDrNXvMKTLQ6XRKpRJ1DAk+EsOl/RqLhGQQuwW5DMhCflGQZ3w5nc0SCzAXYJPa5WmybaJJ7TJDyMuY2C1s4oFWQE9Ao1V1AzP2xEiAoayP3ZcxIgjRhL0oeUk+pipDqWEryLnIymKxGBwDsBGqFiriZvZlY8cdDAa4fYoaE9yPzWbh5aRiPB4HC6AWD4GXRNYbN1rGwWacaM0WwQRb+0ulEl4KRRiJlfAFEY0irxyAO4BCYsQmC9U0GGfQLHGdtE2jc+KASHjUiByj4vr162BNJhKJfr+PBAmN8HgFIIlDMhXgI12bMpkMHgIiJ5L4stksvhQeX6o6yhqAAQrxWvGKoUYyn8+RAJN6E4knrqPkaHzAoR+Cni8MOXdZiQJ4PV8clWTZ3qs6EtSXzOVyik3M53MV/8UD0W5W7YyLvGzyhoBVsShF10e8VsBYKF8R5uOI1eYGzuJ8Ps9pjjiYTQ8+swNROOzsDw8PIYNAjhUCUzTjA3CpVCrwqUNirPaSXA+XSSIS33y5QIYLgnkYThfubSBaxBOJMAjmYRg4l0qnc/n8bD5PplJBLAb4MwzDIBbDepFMpQqlUjyZHI1GqW53Mp3GY7F4IjF3bjqfh84FYZgIgjiwjzAMYrF4MpmIx3G2WDyOk7hF2wfUiNPpdCwen4fhDCeJxWL4p3S6UCxmc7lkKhWLx4NYDE9kHoZMlN3iu7gFuCBAfo8166KtUiioz5Kxy1gbMFmgh3hldHFE/wRzchKZuYMYgFgnnc9XUngFGg7sMgFQWywWUddUtWLVu6fKCmAOQPkouyJtw7qEzArXnEwmaTGH4YfMDZOLn2FbCdw1aUSJO00mk4DkNFsztS5ic+uKxYch1P2X6csrXKJMbaaF6tWOFZtKTexcQcgB7iqWKQDEXO6IK7FGTnojF2cMD/5ipCjqS4/WiGH5ADEiE3r7mPRb4TAM43a7DcI4ozXsxe12G2VCTCL1zXOXNVLMAI7kUZq2Eu0fIu2a9UVfDMTYQvDzqhbtRDbax1i5Sf3zsCkvJC+cC5LJtTCIMHSQu1mpRWCiF1NOVhjL7FaG/aqDh1qf2C6p3D2dTrF1djodWCMoxc/AasropwQ/O/ncQpmKXR0sSrHyqjUblmSoEYRA1Hw1mePqXKrjRMuTPufDiU2Ijw6baUV+MUMyNbL2xYKWCU0QuHRRJGJ+o0EDI/UuDBNWhTVclNbEvx3m0zLtBRclrX6lbIvZuXxBCd+30PS4+DRwH0pedj2RAQPfLJtadERh46vVardv34bQcDqdvnnz5te+9rU7d+6g2Hx0dHR8fIwV/ujo6L333vvtb3/78OHDZrOJmKdWqxUKha2tLWhYqa84oABQK1BbpSIZdahow+B3JTLyxw9TqZTRIPYlg+m7wF2DIRnzRCMiofQRzVIvFpZkMpnNplOplzA3AufSzqVexnk2x+bYAMSb4zMCDWvoE7kvMt0lOsxFn+AayoMsJ/ohLKJDs2ETGWECCVQum83m5vOE9vXPZvPpNFywSgGYErM2Pa1uibmKf1XYOZBOYENFG+kKPxzds+kLR3Ukxpqk0iCIVNRMw1ZV9gDQBhQJDFa05GDzI2uDO6XGzfxe9YgjrSyYzdzl8Ag/ZBRF1Ey3ZMhxgOVHOVQSn1WKjqwxaozk83lu/FSeZSkYz4doF0MHILAYZoBBiQs7UaRy0mZL7/g1Zdo01QSmQLKhwYuDIKjVanfu3KnX67VabTKZHB8fN5vNXq+XTqer1SouA9zGSqVy48YNSF6USiU0YUH9Fmx3tXQjRA4StCpo6xjTSjgRTwy58/NzDAkI45LK7S67HT4HRHi5eACVbdIhkUwa3w9OQCDgbN0FyqA1GMSLAIihVICXBUE040pk5DXcSicctyBMoek+mUxi2PCycTugpROkUCYRFdLJxISOihE0J/aHO6LGq/KmiQ1RhY0dElAD6HQ6sVis2WyCaIxJp8AHLowFHjYKuMvM95eFOsWcKzh307mxc8n5PJhMgCRW5/P6fH59NKqenaWfPEkmEnu93t0wbM/nW+126tGjdLebmM3mYZgG9BYE2fG4CEpjGI6TyRlS9DBM9HrBonCVTCbTqVQimSyMx6nZLJ7N4tFker15r5cCyDWbhWjQnkyK02k8kXBh6AYDtDukxuPpbBYEQS6bLTuXGg5jsZjDf3gg02lsPE6Mx24ymQ0GwQIaQ3owm83is1k4nyONCDjYJpPk+XkwmXCvmSzwfWwNcBvDvNa5OZ1OwYUnKKwGdFr14V9Nxm6wKs4ssh25IoH/C8oPnye+F3MNQ5eDkMxW4LbAl9F2gAUZwsr4OTtOQBinIjalIcBH7vf73W4XJR+2AVFeFqsf9ZrpuLiCNrUWRizyCCvCmMjoReESVXXQn6tFAVNH3Q0JjFLZEH9W9jogTupl/zOEbb6YvrIUuaYxmTcAsSpLkDBO3RgUa6EsTGUnTAeV6dDE22fPqT0vF1InnUPM/DUSwG+ZE+pvcUVV7Qh+gE0DTnjlTpSd/tnQ4Wcj0Dm39l4cRsk1RJLQfaa283SiFWdUogbHAGFQbT7QXZ7WoP1+n9xh7QAzrHAORaNsgHeq7IpA2B6cbgSIVUhUhYwjTbqMywgBYiW8R8pPM1o208EILhvevWmAUwI7uyFNt4TW/lk5NrCvsgGcSE6ZAMDg2r6EhV+D+TcIEGvJ1kXpZUdmBL4AsVui8RJZwjEYtC/+bhbwSMLyihDdDCfydrVUpqxbmNF98YtffO2118DcqtVqN2/eBHe41+t9/PHHv/nNb05PT9Fp9OjRo6OjozAMK5UKZmKlUtnZ2SmXy7AjRq8Jcl4E+aBTwKaFThuqW6gBAJN39Xrl7AMfud/vI6TRwIkVQVVtonksQw61nOU2rXITXBAu8PRkMjGbvbQtO+Vc4cXOMHYu5tzMbY7NsQGIN8dnBSNe4SGjBjts2lUhJMUlGTwZeS/DXNAiuYbCasiTmM8DleJybg56RVQGaO7FLfGujYyhlWhg8geTdJmQ3eBZBh3WNEljPu6UegHKsqEkBYBgBJ3qt6AdZKbmrA07UPO8gHSX+CpofstyLjvosY/yCjVsNYrVfAsER/C7KtXqV/UZ6xMfhwQeGRwq/WbiPN4mpTPWbF7Wx66ADu3XeIOwogLsm8lkOp1Oo9EAoyqXy9Xr9X6/D+WHMAyLxeLdu3d3d3fhrAXKKt4CUxeKUWjjoXZCqTKgltD53IAeohIDq67pdOqXNFa70q1eCshNQwuYApSKcyFLpMYou6rpsGcySaSCPE+xWAQXHnos+HaiM35z8TJE+8JhzDlqsEJC0YlMAW4HRQvnnJLO/M536mmSgGkyPXrQuYW4KsndCKBR21CDQaJsKPDgCdNxkfx3glCg8WqqY9LFl8UJSjr3Zee+N5/PR6P4YsmKBUFmPs/2+6V2e/voqPJ3fxcLgv9wfPyFs7PRaFQ8Odl+/32waC/6hZPJuLRHwFIMs52MEbyzOBaueBzoGiDawLnCbJZVwkgYxoIgtlg35mGYmEzy0+k8DOcLU7vk4ktx5nChRxSfz1PzeTIM5/N5bjGVInHDix8uijOJg4Nks3nxiufzQb8/cS6dTtdqNQ5d2rKBMw7qSrfbBfah3GFWHdzl5lCdm6oURAibfyXFhmUwiBeB5Yqxh9WP8xEJIXZnNlbPZjP46VGCnx6zQIpRCEReNxwOsb5R4h9rLLAhFfkhx4fFUbcQ5dAqo8FinksXBcuNu8pgU1fIS/4zgj/6HD3nKXuYTxrRW38hWlZ++8Rr75VVfFOonnkHd8lZ1OEL3Jsj9A4TWvj7bCQ7z0RfPiRn/myCN9SoNIyMHE5+PVVvnBVKhpqMbeg9uH6Z7Z8NXDOYr5H194N2n9sRRB3qyeGfxFgo60OjohrlSuhUoSa9avNrGqGMd5zvGWU46T69l2dWANq8GlWX5qlYyzFehb7ILEu/Pn1YJw5jez/udYvWH+VFmlvWGiHb+5ZxWUjNMSizgQgjp/CnQRm263YYfpbxZl3PwyUlxkg8nYJmRozF+ANHRhTmHfnE4ciZvnqXMXuNGQAk0lI9iTwGYsewUvjCF75QrVZRFUanIzLN09PTDz/88PHjx8PhsNPpHB8fj8djOEAgPCgUCtVqFd0YbPEEQIyVFk0AEJQA1YOmc9CpQwMTvW0gOsGGHtau0LvgFtosZpqzAsSWAnYbG26TMoXxT6o+wel5oUiTTCbQ27Exqdscm2MDEG+OyK3ULXRX1QSMS7OxUdIMCqQAJoqQxiPsZRBb86VK7tBuRLecM8jOR6qjMv8Pow532ROMHN7QayvWvlQndsZ4JgSD3KKbFTeOHQicC4MOm5xKGT3YEanN5BbtfqBeUogAWz6NL8j5gkQyyTIIWMk44zdCHxPPId/vm+02nUq5RfMyLpWqqQpAK0HDkFL5TxSoJSlYMxzCr+bB4o4YeGHwoNGVqsdES01yi3uhIjAlSg1ovg7LwLe0ZtwGbh20t6DIDEYV0MZcLkd93jAMoSyxs7NTKBSCIEBgRN4WeaZMwzQDZF0ErwZjgLmuJj+k0uAzZG2bmzIsm+fNBCKF7SKTea4GfJVsyY9UMweKBNI05UFpu4fb8Y3Lr8zbEQ6m02nVtNH0wC3okCDLM4xGRmfuCAobTIlVRNtfLhB9Uo6Ng9ZXptOkBQsL3BpJcVKIimR8XUgjff9ecNe/69ydMHTTqRNHUDcaBa2WOzx0H3yAH2wtnhFu/mVuQM4lVsYf8edRZgteRAVO8rp+vz9OJLLZ7NbWVjabnUwmsGKDRickYrLZLNTJR6MRRKthy4mlEhuiW6KXzeQTbxnbAdT0yO7ElVDuGT0uWCVKpRI46RzbtGJj4zY9TplAImNUuXytxHAtQgOBqlVgqalWq5hN3W6X94gkkMLx3Pt8DOW5MYsoTpw5g8YhkO6haCk73FGFItVIOfsqbpBbHJSP0N3Zpx77+PInmJIrsANjjcUFCnEC0m+CWbrssJBPmwQjMcEVXmVnQRtnzwdhRx+ZdVFOWZFYqoqusJLnY75cpTlfcJumSGaGASttDHuwtuttTiYTYBBO+GuolNA/YJlVlF/SXoHgvHSQ2DDi2a9jUM5Im1Y+Ui41RiXMj4KMv5NKpnKoEDBVTp/yc80uqbrAHA/GV9Bdlqdwly06GP7xChHo+mZfkaUL9Y+NrGSYvEbrCn6dnp/RqWFGu2+SaW6QQvnkvLvL3tqmrd5XlIqsFRn+xEsxJ4hEM5+hw+HnwEvLr2ytU/shRryCNbXOkq5vZIVOml+xWFZpc1EaI85rNDQoNn07ocMALFVzdhrqIHylnwTyU9V4MRoRmh1QwhF5MRljXDdwVdgFTHmJRU3DJfIFNyL7AHxRe60Ta27iP6h/m+orm2NzbADizbHWDoqsEukohMYUOaVkD5Z7BE8KVaRSKfpot9tttI2D4kTRMROH6Y5CPTIGSYQjE5f9PGE0D83HTqeD3NjQZonHabCFuiUVmogpE9yhCiETbDQOQ5IPhlrxeFzl9qEMgGwEplvqsEemlZZ/md2hZ9M5h2QVUKNzrtfrtdttgNEo/BYKBTDXDApQr9crlQrkC1RJuVAoILIBn7HRaCDPD4Kg1umY0DOTzboFTRipFE5Fp3ItD9B0iJRJ3YPx4kj+daK/priwH8Kqtkan04F6A7JExgf0tVPBZQAWqo4HKGRNUQUN2vgrDCBUBgRN2WjQ7nQ6p6enQEO0YODEhB1Vd+PXRNRPtXqJpSpYjPoHMnYMP6ZVgDDUBFwzN5J5DePgedMAhnSU3I0MPU2Aq9QeOiYxZeK4VcSWE5CtCX5qt2ZoThU2YM2UVWGsT/tjZowkDTmRn0YNwDnH+hPfFzlrXADdQukS/9Tv9xuNRrPZRFXAfAsuJp1OQ68WWsnUboZ/5mAwgHyBkfqJFIV/QXQ4WPlXHzNd64f/mrZF54JYDEpH0+m01Wo9ffoUPm9cOvr9PtRdKpWKW2jwEVnTyhPVSzD4lcDIXVJFwDkGKJ2kGC4GM0Y7q3o6toGIURSYHD3gaNjjVIZV0zz8SjabhcsodYF4QiCtrVaLN2UAGq26aQPNJ0jGABNS5lgRbSP6yX5SeqzrA8HKCXFh/VcnFnZw0SS+TFd0P03FlodGV/0iBg9r3iBJiz7iw0IykV8V0ULFmgAxDuwaiuspQMx/NQRVFphR38LGyoIuKlhoKCZvFKPCQOe4dyMo7y7L/qpDo5L6OYYhr2/qZCqS4DyfOu0g5k/y+XyhUED4hB2TW4m2Y2MkIOpTUQInwhQqbsu7cyIm8KmixMvwKd/8yoA1WlbRlvPI+gqjCzw3aJohsNTGPoboqtRkmsyM0xrnLK+EkbbqrTHe0ILohXOGDAAqFBtlBtVhJ/2CaDJtV42uiL97GjkUpQ/zRSg/3YdiVcTGtCn4nQe6cjJfMGa8SnhftngaKsbLNbD11yuWh2Ofba1UI9cb+fSW1UuMsoHBkf0+mMjCkhZ1fEg3MoI1lRJf8phRqJIztJ9S50UikahWq9evX799+zYs5tD1hUwTUlG///3vHz58COtmGP/WarUgCCqVSqFQoFMoJePABeYgR/SLYjMWcHQcgtwDr0uqEjF+gA4V9CjwFZgCFNTiLFvRf6zTWUXwuQqpsoSLYmdj+8N3z8Pw5Szlc+fCjYjw5tgAxJvjX8tBXirUVIHAMnYBXxXIC7IOsiYNmyAMQ4AjSJ+GwyHCd+g2qoKnaZRWsoCKHpj9fD6fj8bjUbernlFuISLG7Mi4dnC3UGot4nskgVA9JoIMGLTf75+enjYaDTyQ4XAImjASQkS30OcFXmnkMhjVmTYlXAPEnsA1w1GtVmGAhgeYTqfhkwNGJBEHuHnARo+vjAbrVKFlTAy8HtcWATNhL5Nkm4AXJYMV12DbPm+fn6EfDlF7xPcEGdW4g5iIW7ixI55ot9vAX3CP4MF1u12FFBl5QORBkdZnPlRrp154etTFIwWGLy6ZTJbL5f39/VwuB32JBw8eYDAgKtKqtbZXq3se5xe/mgOSACX+gIiKVmaNRmM4HFJ5oFwu4+GoIZVmMqaP8pNF1XiVZAIaLrnGuEahhT311KZgUmeEwFhsUDFxRclXp0PuspwfFwGM/3Q6jXmKW+AjMtQD90xa4BmTl13zRIfJicY7GgwGrVar0+ngaaOxDvdydnb2+PHjw8PDTqcD0jG5bOjYdc5BTANDhSteJpPZ3t7e39/HStjr9XDZKr1i+hxfMAkMnWs5d9+5sa4GsVhM85xYLLFg26FGRZJ+MplMZzLJRIKSEc8SrcULY5qyAtN3Kg4QBHCZi37pyyBp+Sg4d84n7yx+Pp/PQ0HDzTkvgbCJxHhvL1solOp1yPIeHh7+0z/9E149ROonk0mz2ZxOp5lM5saNG/V6HdgitUTYBck2YfP6tFBK6zMnekTcRzhgVM8X25aqDzsR+ieISRRVcQqsomTWEwxCIpfP5/f39zOZDGYxi38ggVar1d3dXdQy0V6KWibGNhm4uBfTRWsyvXXWIzefB4sMU7toVfibqrjE/hQCZmkNLnz4gCaTpA/DXk+11DkHFSfCb/kAMQurV0pMGK6iaY7hzwH7oiVLTXsQgyFaYJcDrcMISUAZwGcQKxGMqy47pVTinzu7RnqG/kmWKHdMragp4Msx4Iu6sgZMuNwY0LvLJDItRej14GJoNogpqduiAYhZ0zUqBInLh3LPCVPiDJ+23vQK2TcX1TPnPNGVFeR9DlpOEIiVw4iSNEOiq6xGq8a6EmZNwcYHiPHAaWbF+BmlDjI3GUDqpbIlyBjimYGktWGFVp2o8ZrT+vBcJPIe+XMNSMhuVl01Mrh9V2QFiBV2NyocClZGxkWRWjGfRq3iSqDzM4gR61wwpRF/O/bVin1VHDPXjDOkj++bURoJSS87v5asNNDyiwGs32h4cPPmza9+9atf+cpX7t69C5kI5LYHBwcPHjx4+PDh/fv3Dw8PW60WTLbBVADBi9AtaBMUl6AlL5YO7sugbTHZJPsBAAI+jIC5Xq8Xi0XsxdwxoXcBrTwa87C5ykeHyVsiVE0dCQ2oqBtpGMTPnlgYzsfjcD5/OaSHkXPz5+l32xybYwMQb47PPkaMqIJtJkBbAO5gNUeOOpvN1MOUMAq4b/hrs9l8+vQpulDT6fTW1hZgFLpOq6YYgWbmNs+CksuluOls1h8O+/3+DPZQCwlLQMIzmNGH4VQVJxHrp1KxRMLFYnPsxPF4IpXK5HLhwncrk81mcrlkOh2Lx8Mg6Pf7p+fnhycnzUZjOp3O5vNwPg+DwPX7seGQXYoXaFcymcpkkpPJZDxGGjedz4N4PBOPx5PJGMPK2ezi8ubz0WTS7fd7vV6s10MA3RsMiMwm0+lcsVgoldLZbOjchQlsPJ7J5UqVSj6Xi8Vi6Ww2DIIwFkukUvFEIpZIzJwLgwB2SRchSDye7/UmCwDxmYmTADRaekXGS9cdANnITulaQ9UnZON44yC9Aj8i1wkYhFu4k2mnIVNohrNAxLDHU5qKhW4AwYbdw9wGiQ3IdHibV1d5RZaEgbsxdgNcGARBuVy+du0aYMdms/nw4cPRaFQul7e2tpAMK+2LpQuy/PCgMOY15tO0lr5nyMZBVOx2u61WC1gntbQAvrjLTYtadHnxkJokWWUQayTtx7X8DLXDSAVS6zljVukW9D3oNbPAow4wkRdpvOY4NhAUZjIZwHYg/mN8anbH5ncOFbbGIzEGS06fJ5Vzms3mwcHB6enpbDYDLra9vQ03wtPT08ePHx8dHfV6Pfbo4RlSpKJQKNDaDgB6PB4vl8s3btw4OTmBZwgETDhNDK+KA/hFKEJT537j3P9H7DSCRXmDKXo2my0Wi/v7+198/fVbt28HQfC7d9754P79Vqu1tbX16quvbm9tJZPJVDqdz+Uy2SycCYFSAaaPx2JUkgvE3icAIz6ZjMdi80XQj1Ulk05ns9kkXOAI9RJUms3Cy3tWPB4PRJ35mToke7Sx6s7nk8lkPBpNF8ABq5KUIZ4v5PzAAulVKqlyuVQuF4vFWCwGGXGUpvDrMG7CUpDNZvf39/FyIUpuyEekyftsMoxhlioJQbIfn050lMXkLSCVUolPPG91TvMFPVkBwqgGQIOOFlQlAQGXy2UGA2iRocwFptjZ2dnx8THkYqrVKsrAgFlJpMWCTO8+01hz9REEDgBuIoHcFYRQ3hogWoLC+LPifYZBDAgYDGvuINhxACmqNoWaYgG05cKuPUnKpeXa4uN3CrVEMnadGMfhn/D8US9URX6qQhuAWCUm6DJn5OC1L0Gr6eYnTuSAVTGf9XWf2LsMsVVOpRMBdy2cY+vs9XoMNpznABaJWBnoE99FFjlb30wdlwAxRgXxSiUmU4MCcIkiGqw6QKZzhVz1swe1ds0WgVng3ZpPTnQr9QRMNdQtaaVn+znuEeQ+QELsDMPeytenys4GuFQKLdFh1tGJzhNtRy2N3etkNjjPfo3iVLqWKrTHeap9e8hrmMhotBD5shRB1jqKj5MakWiDIFMKQ7F1I2XGp+dr62mRKVJdyqNCX1yLf4XPpbe2LkYciwXu89FF5FN9jRAB0xDn8XZXT1kzhCI/bwDoSHg98hd9jFjnGqpxLDyQdav9Dfl8/tq1a1/72tf+6I/+6JVXXoElHTaRs7Ozd95559e//vVvf/vbJ0+eBEGAXRVILmq9KijBvQaxNAIPLh1YY8ktIy2Dl4HGHawDxWIRklysIuv2gQ0LJydPH9kl3xH5JSyc0y2WUQede7gTafeJclnm83kYBLPxeD57Sa5wWefizs2cGzmXc67vXMa5uXNT51LODZ3LOTd0Lu5cbPGZgXPJhStd2rmec3O3OTbHBiDeHJ+tffQikR6PtQGQHujpdFqJHlQapXk69ifsIo1Go9frIbzGxxCRO+fIpqQal5JWFBPBTv5s7X3//fr/9X+Vcjnn3IWFURC4hc7RDBZG6NlcuNthC8lmMsVyOZvJwB8pCILUfJ6aTvOTCcCLC7XfVOpiJ+71ku12tdPJjUbErBH5Mg7mblSYTivjsdpSPWOppFJBLIa7AqCO8LrS6ewupCQuIpV4PBGLpTIZXCTlombzOdBwIqFAT+KxWJBIBIsnEA/D+HicHg4L/T6zzel0WoQQx3Q6mU4zvV6m0XAL/6ggCFLJZDCbEbpl/kwO7HA4bDQanU4HOzRCENwadl/u4mzGp3kRPk/hBWRfVF9l6I+gRPd+bvkgrJXLZVSzcZHshcTzQSgAgg9ilHUSMY2eI7sOiTUDbQHkAYQITyORSBSLRVa2cf1UKGboQ+Ibcy3DCyC8i1Ohn7fT6cASClreRlRL5Uo+DSskP8EwYHRk1mroXcYeR5lHqr6q4BHzTwIZy9Q5VeNbCVwUl8D/0aCqixvTXZMlKnSlnoFuoeYMv8Fer3d2dnZ0dHR0dASAGJxuLGtwL0R5QJsqOEfYlUzWHkZIPB6v1WrVahVt+5xo6mBjKmcvSBGaOffIuUeXM5lUPJ5atIEnEolSsVir1V6/cyfzx39c+8M/jMdiH+Ryv+h2D8Lw3o0b8T/6o/DuXczrYaGQz+eDIOj1eqhtBEEAGhpN4dnwS2c/oHgcCezxr1WrxXz+EnMQyf+C5XoB7sdiF854HIphGM5m80WZQQsnJL9QHJ8vfTqbBQtwgenEbDYbDYcxjyKnjwv9+xjVcH3J5XLdbteJdQwnkTawm14Kd1nflmPPTBPzQyfaL5g+qjeqf+ZUIuBCK0XA2dTODoIARb5YLFapVLBqJRIJbPFYnPEAMYvZpM+eEi7gyltUyMOt7SN6UQOIxVLZbDGfz6VSGB6RADHwJqB+bLJRPhEwPhxsTyEHijRSRQl1lmEgQdFIs3SV0VCMlRscu2UVeFW7djB8uXXS3hMtMhB3pj2g6guPFyEH5SNM2KYKEhSPUmje97NaRjL1QXAjyoQiKLRHKMVAkMXobnNj1eu8NCWlw8xFtWxro0lkwZJaEEYFghcDUAN9WhhURrSaXo6IdgqFQqlUMgAx2HAIjA2z1bQ5x+PxIJ2Oz+fPQSxbYutnGIsGRfItba9UdGEvHR4FdDmM0I0CxNgN0Uiu25CK7JNUzkPBaBZyUOpGvkCGuw5OzB23kJbmCmOKx1xb2Aem66ryjn3g1S9ym/EWaRBnlH/9z/BjXJwjlWTV9taYPfh3p8MAf4855wIXi4VBMA+CeSyYBcE8CGaxIAxcKB08wQuKThiPbheGbnENn4us1kVRsHVXMrBvZF5g3s6aauyGk76OtZ3WGvlD7BFYT5QVy3IjMimUaVOp1Pb29muvvfaHf/iHX/7yl+v1erPZPDw8REHx6dOnv/rVr95+++2HDx9OJpNarQZhGS6J2Ohpzoy6OFgLmL8qM4jUhkqMoAggAsH1oOSMlbNSqWxtbUEd0exBJPziZrGvMWXQmF9bUogIKxzMRcaXezK1n9lsNg3D+Hg8f7nVjphz6QXgGyzg4GDxw9QiruVfY+KbkdkoVGyODUC8OT5L+6hJZjSKAoqhQvXqPUX7EU3pQbdB3D+ZTJBGIrlSkVCSRwwypdoRep3VX/+6+tZb4RI2RmQbMmNAt86qu5DWKoVh6fJO/qwrGacKQwUmXBD4DVem1Z+E6JCXin/U35PPB0Fw4Zi0uPhLcLlegHOBcxnnMmFYWfFMwjCYzwOJO1OpVLAwyELCA1EL5iFQ1cB+r5ZoqhsLOFidNCjQhoCG1mqKcTC8pgqtKlUhvIAolYlIKKZB7VeNLdbRl/CDeF85QT/GbIcPAc/EkKogkXF6euqcIwxBsqFqSirJizKRFGKm5xsZ5eA3URsUwgXs3sLjVVzDSfvt8y4FqgyOg/4wLBdpkG1a11VBAu8C9wtlhlarlc/nSatRKQ9maBgVKoftB3kM+lfcICNsA4741jEqaHihSiZaNMhd2+02oM92u40gmBIiiKqdc2D+kj1N5w19LyDdT6dTqpqgKRsARC6XQwcfrkGFPleQYl5WQAsjuDiIWokE/bATQZBLpdLpdD6TScZibjaLO5dNpXLpdAaKyeNxbzZDeSOcThNBMJ/PO80my4dgniqLkKophPnAYh10u5PhcFKrAfLTFGg2mcwX5OsgCOJBENclPQyDMEwEQSyRAMI0m8+D+TzuHHQzgsVfL9pB8Azn88QiA5+G4XwywQieT6fDBREYuxteLnsqwTGH6DleK3X3KMVAQr2RAdWHoNUItq4rbGesZjRpVE4NdlWehyszHczIzeRFasmEBSrqyLfbbcJe+IpisZjJZAhc8smgANxqtUCc5/mVGMj1yrd1Wr0WpdLper0+LJfz6bQqvOvNplIpigmABYw2VQMQ04NOTeooFkGqqRPlGa1U+Qqh/IAhMPL2+fxJquKZqZIEgJg7ArFjgMIqEKF+cax5aLVewV+jrWna5M3HmGNzhvq0SnfZ8ksXXvrF47GTp+l3nKijKbAzFmY0bFCY25cDUnlKn42uzdcr9gUq4wPXZgXaiQwFig34A9i1GCdKUgOwQss7lpHIrWO5Il6r5fr94vOs25EuZ84zrVpBb4wUKzAfU/9bam7wdXDcalmLe5+P0Zs+boO6qjAxHixlvnwZK1VgRzSoPV6+1JLhzzrp+odXB3syVqDxvgKViRV9LNgIuJlhb+TX/U3ckPdXGDw8iyV04w7CRHyeTITJpEsmg0ximorPErFZLLiI/cMwjMpOnvu4BIXjpXzmNSZIzea8Nu9CqSom5+Xw9t+pUavwB6EpSkW+38hShBP9QyfEYSYL2Iux2GJhgUbfcDgsFou3b9++ceMGVqpbt2596Utf+upXv1osFtvt9ttvv/3WW2+dn5+Px+OTk5P79++fn5/HYrEbN27s7u5CfYKlx3a73W63Uf9W6R6qhyttGTsUBPHZQoqKDrQQt7a2dnZ2QCYol8v1eh16FCxwsmUK6wA29GKxyDwLGDTkB3F+utRoeqXWDkxkOHSVguZENmo+n7vZLJy/PNbuxLnEQmUifhlBiLOwI3+NK1ThXHwDEG+ODUC8OT5LB8m8WLLVOEUBYuJ0xIC4rGt7FD9PLBjbgHMuk8kAZyTNhBq+TFNBspvNZtPLgX6AnX7ZLbzEp7HkhMEav7XiX4NPdJ3BC3x49e/G4vFUOq3kXKXzsDkXpiWgTCJKYO49u9yYozYmCo2RWE1eJN67dtiBPMUNnj7aKuNlzswvRRJO2dz1AWJfGJQZr+9OA5yl0+lMJpN8Pm/srUej0dHR0f37909PT4vFImS2KDGBi2QmjzGv5nKcWXjCrIQjZ6NSNoJCTk9GilT0U8jVTzCWPQ3NQECpY2AKoEeHhHHo5sG3jAsDkI0oEOAayg/kKSB6w7vjV+MpobEaUHskSGrcBZflvVzQgMJoHqgHGcRmPCOKBToM90gIBBP7xmCggSfAQdbY+KyQbPOugbmD0zoYDCqVyvb29t7eHjBoXgbXT3+WfRrkcQ2peeW4Ech6QkgOzxPKA6xMEAvGY4QiAWBuUE1JcnSe9DyYJtVqVU1XQFml8D0nPvcdrRwYVj4mF4acQbsIRfEFsROCCClBDagMDwaDWCx2dnaGSieWQcxiKt/1+/2zszN0zzixJHWXPR65lJELozQczl+UGVhUYyFNpSQwMknVUYcWwmSj0ajVanW7XYxbkIBURlbzZ04WUFOHwyEoRQR5lePsFjK4yM2GwyGaHqhWQVYs0ZNP1uycSiZrtdp0ayuXSlExQMU6mE8CiUOHrCoGUIsDGDHWJZbu1EHUXe6jYkuQgVn5i6z5qWUQygZYcLAlAZpnQVGjLDrIsUZuyMWcU4YaTAUnNutw/fQd/IwujZZCDUTIXiK/C1sPc1qCoaScm94RNR0yXdJOGrpZLVtBwaNwc6QOLCeLft0yLzKchwg+AWLeEfyUSHdtNps6cnALGHIksKtdIRubSqVSOp0OJpO9brew9lK8un//yqkUiSyvDv5V9FlLtj7l9nlbAQy+GUQduruZnc4vA0T+lsGLsTCqYfWa1xnJ6FwfkfSj0ytPsia999J7DC8yiiBwsSCMxeaxWBCLzWOxeSwIY5D3D8LQhYGzmPILQq4AiF96+PHPkN76b8r3CI1kJvnv1x+lZoVZ//2awo+/3momTuoGgkmsllh/rl279sorrwAgxl/v3LlTKpU6nc7vf//7X/3qV//rf/2vk5MT7NeQf9za2rp16xZIx0hwUBvGbk6OF9ZAlse03EuVfH7eXVbyYVMCAGJKDKvIPnsU1Pk5l8uxpA3pS67VTBwQtEABDPEetVwU9DdSMNq88owZ9hLH8/QFQN7Zy5urm2NzbADizfGyoAEE351O5/z8fDAYkNkRi8VIcEPOA24pFnr6tLAzGogAuaiADDqdDtBhACVbW1tI1bDn4Zy0ygGgHI/HnQfZbI6XdaAQXS2V2DVJWIFdpUEQQJZRO/6YlVFmRKWE2etKDizxX5JHaIGC4aGwKUlhvu8cisbEVjS6AiCFduk1Y3rtbFJNZFw2HgU0BAqFAggs7Xa70Wi0Wi18kmOePbOdTufjjz8+Pj4uFAq1Wq1Wq9HIDo+F/Y90+AUGCotCTBCko/h2mkMqCYJwEmQuYFcIwQ0lT6mcn7L7oyN+yY4QxuE5ZLNZGrW5KI8XMhDpSkfUhq1nmN2kxeHlaqzZ7/fVCR0ece12GyGgdqwrDuJEP3pZCk3nJagckKRJyhI5qgB36KxIKKff78OaDP+aTqfr9TrUZoHjUJDRLQhubIsDforiAQYz3hRi9FardXx8DDC9VCrt7u6enZ01m0268VDozRflMPyjl7ULEBEgSkvvMoT4GOTNZrPZbMI9EnE/GSXseYdSAXv9MEIopowXB4VoPHDMFM5loMMqKqergXIYTR8AVjDi+HjRBHPxgjBQfQSNsAiwISxN2AphuJrP53EZeKFQlshms3A0TS9YrmZjpTe3EtU5eo0ULAaPaiDgh8aPW6ExIsiq8aqS6JS7xYJDa3I+UnwRhYn56xjAOjyccOJYFQCDntsHFjpuDVqEWzFhI0dkKp2u12rBzk5Wepj46ulOA4AYUB3SYwWI3aIzlwr7ZuRgiaMKPB4XdhPjT6VrCzY7uku5BWu7f/nodDq0jyN8wNyYlHMCoPwngr+qMKO1UuKkXNMorUCAWLmZkXIEnFCs2euMMGUYPkxFgbWthwuIFow5ooxnr0LMQFSxL2gzuCnf4mwahBgUWOMQMstCz7hSxUOALCB2deLblkwmIaSAgWcejmGmcwvmIwKCcwEQZzJBs5k6P9/9THIuV2O1kTXmFURXHwV2nk7IsmZ8v+tfyxt6qIBPpNL3CkLA+rvhmp/0MfT10cbVYLr5dWj/SpuhC10wncXDIJiHiXmYiMXiQSKWmMUS8yAMgzgjt5eBfz17iWtUHT5TmY7fK2ZWpBWwfmSFKRI15jK7YuAtk/HxL1VL2lx1WcDjXg+c97XXXvvyl7989+7der2OMmqpVCqXy5PJ5ODg4He/+90777zz3nvvnZ2dQc4rl8vBGLlSqUBaikJqrVZrMBhwWQZfBOk8EnNUQLn8ciNjEELpPzrWqn03yUDcOgnpMiChkCAl17SlBifBvoZVFy4mBIghboYchBuHsryNzIgREHvRI/uJyy/ODYRfvDk2xwYg3hyfhR2UJDjobNKN1AmpEE0fSJw0KdLwDhtYqVSCiCEYZ6QXYVcgO5JO0FAoxu+S+gRgqZ/JjKtVByXfhUSDW1h5PNuHFw71F5txEDC9QPobi8exD1N1wTY/hmEoTShQ6dVvvBQohKG7HPuG8/mMPXHzOSSN4onERYiG6OFyLPwsgFj8KZDY61KcLTuIQRlMc5wTK7BnemEahiDqjcXmpVI2nWb1mBAe4V0EB5SYxE+If83n8263CyIhd3G2VBPKJAjCyICVcGK72oZMjVreFAAmYiL0HGNuyW5iZRquXxdRvADRCYlm2WwWdgookp+cnDQajeFwSI1L4i+AJ9BqCji40WjAX45ypSTRq5wWeqKh8Y3QjTeOqQFsmiKVRGmBYVWrVegjE9QmFq+x7JWpjsHIsBoA/zLBrnol4V2TrgWcVE8FBjpw9r29vb29vVKpROiTAwCt+ogjyS/odrsgC7Cp3H9rmiWa2/RllE2AzhHrFp3deM6KdOO0wEBpTkVQCegPsEiEzs1mUxncgAlUCZfXNhgMGo0GJFzK5fKtW7d2d3cbjUaj0YC9Hg12WMBQoOcFTeoitwCKxhgBZaA2HGNgR/Z6vVarRe1IrB4kRSJYJ6OQKBUZ+gSkEonEYDBQKQas/+CSa1rFV7CsV9e8Vu3H54pk9HkNkEE+L4zX6AuHs+3s7HQ6nXa7TbpxPB4vlUo7Ozt4MgSGLlSMF84qmFA6PjVLMY3VLDj5WWtk3ksYjnmOSjDrcsHWEHV54pPB9xJHHo/HIBlREIZS8mQQg85DP0bUQnR98Fuzn3fEppPJSrUabG3lUilqDSmwSIAYuSjWUtrHmafH987KGYEnVBZx4xT/BQJr7KeIyE8Xh0Ebkcp2u91Op4P/EyAmkMRYiOacvBj+kwZgBqJVUEPVEujMowAx6zdGSdNddpAzALGCKUZhg0ZhRk4Bu4ZP+VQddq6Exg2P1Tt1I/C7sBUajhQjZqmPak6RvnyE17VAohejtrHQslfxDT499UWEJIs+E0wZQCRhpbJ1fPyltavXLqpTxDAK/c+viUL6SKgKjLBGyDHDhcvI0GlZUZWjVH+ZO8syAQeFaRR/VyYg+8oVIFPKsE8fxtXS8YIjUIeueQhGaEXp81c+z0iWtP8ufEMzHw33sOkLUDgWc7GYi8fCWMwFsTAMg9ksmExi3UFiOks4l0jEk9lCJj9JV1zSJePpzLMBy+ETOULM4F9xgwSI11Xt+5eufKhvh0F+tcJqWpH8DxtaifknFeA2xXsNCFcXYLRCb9RUaObMNiNs1vP5HML6r7/++je/+c1r164hgyAHAvyGg4ODg4ODo6OjVqsVj8fr9frOzs729vb29nY2mwW3BptUt9sFM4OqO+geKxaLyHcQ8SKdd5d7RjmLEWNQCVCF4LE4I6nhMuKHB+ykxMxlewfWbcpbsbGStUBVDmFUabTCGWpePHPNzV/W8QlM6hLOBc7lnZtsEKnNsQGIN8dn5kAJDrzOyWQCnU0N35E+UWeNTf2mVRCnQukPdmcAiLmsQ6xwPp/DcAZLPPI6kIAANKCeORqNBsnk3/8f/8fD//P/zKTTijAmEom4yOCOR6P+YIDMFuS1VDJZrVbzhUIymYTsUbVYTCx2qfFsNl5YxmGH63S7Jycn5+fn2GZiQZCWnsHZdDoaj4eDwWg0ms3nzrlkIpEvFIrFIgHKTrv94YcfPnz4sNlstlqt09PTyXR6/dq1er2ezmQKhcKdO3dq1WoqncaWhju6yGRmMwUQyWzNZbOwlI3F47PZbDwa9Ra0JnS+g9KI/KReq1Wq1UQ83u31kGKOhsPBcKi9ioHE7tlisRIEeO8MU6AVSx5uOp2GRxzyTwpFYaMFAqIixcrJ9XXiyNZRr/D04s0y4GA/NXrbyVVnfKAQMBQkgQ6Ae7gmQKxNuMpCAjKLgKxQKFQqlVQqNRgMut0uXMgmkwl6u4BhASDO5/P1eh3VeHYZdzodnBzOdXi/GOHOORrfZbPZer0Omy+laPkFcKMYCI4ABSg0h3fCEVvdZOobo/PVEK7lv04mE5SOKNfgRJRQYRcEZ/C3TCaT169fv3v37u7uLkR4FWzFMyQWTKYqAlYI/gIoj7xmt1ySWPF0gK3usj2FJp80jqOGGoYHKGCKSXEo9vt9SI5gIsDOUYEbei2C0YAHiGEDHi7mVKfTAQ1kd3f35OQkm81qt68TUhu/+qXLELNpQHVpwzDs9XpQoyOqAs5Io9G4f/8+pGm3traA89KlE9x2dvoDeMJrJTCK112pVJDDoHkFshUY4VqHIPV4GQFH0wCcGe+Usn26rtL2xDinMa3C1ULgj+O5XC7fu3ePzi1uYbVXLBbL5TJ+kUUdnJAUaaN7S0SVDB3nHJ4e1l5KNmk5TW8c+w4Zx7gXVvVwKqrx8Os4VZUMxaIIkkNo4+Lu+KX0H0c7BQbA6enpwcHBYDBA1QfDG8NA8TgtJj2XuWLgXCKZrFQqyXo9t7ALI7eagxZSsIwiaMhumKeKTnKlMnsTCEpUB2bxkg+KUyDSS1O5Tp1OB50H7XZbNYhVA4QX43NgdXsytGteMBu8sFBjuqkSLmFNdiEYuFybUdT4SCcUSh26QlIf00h2KgTAaaWtxKwlG2svpRWrma3KqpgdyjgZGIlJI0DBX+EwUO62E33SyxX8gCMncs3htKIOlfHuw7PFP01LpXtPn64z+OdS1FdqoYKn7nKvdCS25csQ+5gX9ymGkUC6EddRSF0NA0gRYI2WK7xaPnI0YkC6y3rWpjCJp4RzaneaSjaRnQBuoBb5tHRqSoZaEWTR2i303M3bxFeY6aCVDF00KJVmwL5lagYGe1VjRh11UbV8LAVBIuGSyTCRmKeSYSIRzmZBb5Doj1JPT/PnrdxwkAqCRLqcqG2nblxL34kni8VYMh4EcRfOAxfEVgPWenfLdthntXa8+s8JiXgZLL66fLIixPJJwf7X+UWLdTiquvYa9g/JOoxXsRNhfpXL5Z2dnWq16sfAEJiCQy+rYvQUxcbN9ZkNf1wZtDsE30hbVLOHOk+C3OxfpshqfstFCR+ZzkWDR5OeYrB7bcnSglP0u/g06PCxhRNdyrnAuZhzSeeCxQ+TC8VJfiamc31zbI4NQLw5PmObqHq4G5cPhkRmmXZeu43PyVLTVXaXcDdClqt7ieoJxGKxcSIxzmQSuRyX+CAI5vF4EI+7Rcw6jsXGYTgOgslkMnJuEovF0mlXLgeFQpBMBuVyUC7PS6XZIk2ajcfzyWQ+m01pvzadDlOpYSrFYDSRzc4ymQAh8nQ6G41GYThYyEemUql0LjcvFOLJZJhMToNgPJkMUqleItGNx7vxeCcWmwRBOwiSQZAJglgiMcvnXbkcg2JAMjlJJt3Cwms+mwWpVGwh6XgRuyQS01xums9PslnwIEZBMJ7Px5BMXezWLpUK0ukgnR5ns9NcziUS8yAIZ7NwMglTqXCh6/Rs+4zHw3g8SCbnmUzgBT10POejRp6Af2UKpAZlmptxL+doMfElwn3E1pqmGlMmn09hiAAmDjM+6euPecWVTD5GtMUtBDcpkawKnpgF0FRBfAaoBVA1HqAKXCI7pdwYQCUq9vq2Zmo8pZOUxGplQJgUZR0B4mWEo2W+9oRWtTvehLMcEkgXCaIBXSL4SDQczbxOPEN4DUZ/c0W8Hpn/mLTNmNHRxY5Qmi8Li+DYCRebg5+ZHhLLwWDAFngalRgDE6a42gGNXJF604ZzYShO/u28nIB2sQITLIMwNPSXm81mtVrFE8NnUEFEtQPJBmXg+NBUsB5lDCdk7clkkmUBLBY7Ojrq9XqpVAo/obUXvSj9tMFn9BCeNhxDGi1SMOHZVrJgg6okMV4iaL8cM7lcrlarofYDhRxCIfgkgFQKSqg+gxFPZ4sA29IptYGTaCZj8qtn4VoiwWWTkA3GHmiwtBRX9W1eDDZieMtwR55K0RTPhGfGJwuFgnNuOByenZ2dnZ0dHx9DgxuFRpW40RqMZry+cfzSeY3SdTI5A2qVTsOJTgFQAMRQOUSZUDv9OUiwgLtFw4oGLax8QJkk0juOzpnjxYHHYupV1IZGRRDoMAquRIH1RUSq6Kryg/YU+9ZYLLNhuqHiqARJU6x1S6SH+Vv8pArmUGeG00TJlU4ET+izqtA5njzjPaX9GpjGMBmNy5mBS/TdmWcYiZmqryBJ4lDz9zmbCnYTFo+EVhWrNRu9XnAykRi1Wq1mM1xv2IdhOFd/I+/G/dKvf/uGsRsZBtBogfZ02IAACnOPIxVDteZNfQLjB/MxJQcGsFIHdFtUpwfKdlGHHWaY7KBiYYYdSBeP97Igjz4KLf+zO4rrp58BqT1vKpViJOxjxAxHfYBMo4hl8h06Pg130t/6nQvi8SCRCBLxMJmYJ5OzRDwMgsCFqf4w9/Sk8vFBodXKhGE8UYvvDWOzZLxUCu6EsWTKBTE3nwVhGAti0aRmfwL60ZRV/0BvZfA5Q7OW7Tvrmzn7j8V/VsbVMHIyLrse3SM0rsaMgEwwln0s+LFYDPRexgy6rw2Hw4ODg8PDw3a7HYYhxM3QcIOYFnvicDgcjcbj8WQ6nbF2whoJ9ZRoOUPVLD8jMD0Wiufid7Fvculg62ek1AML7ZyVmM5kqJiUwUw0f8XWKRZo//FLJFsknEvLXzOXNYWDlX/dHJtjAxBvjs/ageWVESFzeCaWkF/M5/NQC0UVEakFMxndMk3rHz7JVBltmO12Gz+BaKNmlfQXIiOY3vFsAdN+Q/qGs78+tfC0wQ6Ehll/CyfLDPfrw5HcyShtiWSJ7fCgBAJJ6Xa79OfhFg6OZ6VSQf6mHEAndklMC7lf0v1pOByqoRMiaSh10ACaL855hrnKrGETt0Hi+GooB8zfRYwOKB92Ulri5ttntmzQTG1HpYSlQmaEyRiokauioTmFiYmdUSVWqV6RTtArCvXkqjC+0aAE+RJo761Wazgc4gkAg0DegqilWq1ev359f38fDGJw8RB+jUYjODN0u935fA4Mghq1yMoArzAvIi8Gn0Ewpygec3vmpRTwVT74au7wCgZEJIhDJIWQEyYOOVbk9bCBF4y/fD6/vb1dr9dLpZIqSBL7xtPGkOYwJnqrLdjrA8R+Z5+yM7CCqX4rJdI0RMbDR8IMaqc6uXHqUXQVEtXAjzC06LfJ7JpooA48LFmghNf+/+z9WZMm2ZUdiu1z3P2b55hyrCxUoaowFoZu9CWbpCg+yIxmNNJkkpnMqGt60F/SP7gvehEfpCszXpPxNtXsZrNx0UA3gAJQqDErM7IyM8ZvHt39HD2s8JU7jn8RlQVk3y60wg1dHRnxDT6cYe+1115rMBiNRhyHRCJ0PabMuXhVGRQRVYpv0BWKeC7uFRa0fr/f7XahVc1ZrJVzsYZTDQD81tlsBjkO9mjneT6dTmmHgnUP4i3MmcsS2LoZk9LJeinTJQHsCGRzE/0hA5esXu0uSOleeNadnJycnp6enp5C4GUwGBwcHOzs7OgCFcX0MXj01kYgG9tHq9UCJgLRbSlUyL/QBl17hemaBL4dSoKwpyNwrOFyKu2en5/DKRGpI3i4FM+BtA6NB2ezGWY6lKZAFob55GAwaLfbeHbE9LXFIncfKdjELzV0jWH3O7NEUpsJSAHeAn24rCyhiUWapRiMIi5uOpzQSx/tLrHjaGs4nQ/j7VTiJkavk9ggu5bL9keBYxhlbcoWSVpigkfgMsfNV2MWjHDKADE3Yq5s+u5pfm6woWtEgPpjRAc0cOyu8JYIhGjLS3cAGWvxysC9NpD11DCuhhU0Il/GbvTqEYwZ7ZJKQrfmHXMtxZ1cZ1nQznVNOC7OeWP8FfoDOswObt1VGPE1wgiYVpAlRShCPRxdUiW2TuY1SIVa24SMflpBBgrvZQtBUZ1kNC7GzQSZV4uTcuHSADGDzLKSAF+gy8wM6XWVV98uKOaTpEmysKj+Nj79Mku9TGsIOuqkxNjVc1lKosPFG633JneSrWSzySuxyzIzntROz9uHzwYfH7bOzmp5buOJTKxp9fyD2y4Xn0ReInHG5M4WYntmaxFdL5VXhYUBMip/UACxrkjpHPAafrFOaa+qx1wVdm7lKAS1urLScRnkDdSH8FHYcF977TX0292+fXswGCAF4Hvn8/lnn33205/+9Je//OUnn3yy2Wx2d3fxsl6v1+l0rLXYxJG6Ir7FvKZqE007EC1j8aTSha6/arhALqs50Z2YUmmYv7TA1cuptkJBZxVij1arBR60TkAQh9frdb0dB12MQTmtPPVeMUJbEWmJeBH7wkny6kFZvMCr84hueMQ3xw1AfHN8ZcqqWhteRBaLBdqlAfEA6IRHaqPRGI1Gx8fHp6eni8Wi0+m0220NpErB+4PSEIXkqcSa5/loNHr69OlyuWw2m4PBYLPZtFotcDrAe5pMJiBY4S3L5ZI+Idg2rLVsAoUYKC2/QOzqdru9Xg/cNBGZTqenp6fMxBDCAinAqQL55a5G0zbuNMvl8uzs7OnTp/P5HJ/Q6/UGgwGSee/9eDwGCQ6Z9t7eXrPZfPDgAez4wKBESK2pVRoN1P8kFIjNdWscQ8wFCR7AXDBYGVhoxETjKWVWJrZ/iuqyOxuRN+5qv9/f3d3F/WeyjXSCmnG6JqwZeVI0nOowgu2Ker/XaSdjhWazCXgRBm7A1wBM0wh+q+H1FwLE4PNK0aiIOAxMxjt37uzv72dZ9vDhw/F4fH5+bq3t9/sYV2h1vHPnThRFb7311ttvv93v92lDjzoBAGLwyEC6HI1Gh4eH5+fn2jeJNDHqlmI+VgvenK6OBJoPCM6AtelW4uv5HUxiA4oWxT3KCuN4XtCZJQBKLjASRYIswJVg4QUHtm63i559zC/dFN/tdiH0rHln+NjlcomgkMOsfF1XKQ9oHETfN1wFtIM5upAnS0HMDNAoosk032CtC5xKEYFeM7AhNOnreQq0EYAarx2nMRqN0jRtt9u3b9+ezWZvvvkmtW4RT1N1gQ9OJ6KvBCPW0DDHD4ciecHUPIHmACBj1EuYMJM2iMmO/Bw4KfwPURHE/WcjM9uZtcAl/6txK70yBEq7ulGdJHeuLUCi8csAZdO6lrojgaMRE3k8Hj9//vzJkyeff/55r9cDAt7pdKi2pGUcWMgkwh40UnDd42pZxrPkcjd9kOposJj3hzK44MDqT9OFCs1hJy1I8/7YP4GvQykLCxGFicbjMW4sCLzs4tcFP+0C+jJLU3mx9pcXbR1plMsGV/VHXz/yA71ILfggl5UoAnkEbnyiXI8CiYMAQi0LYgYwQWDtpZu7y35HZSuwQOggUGDfemfKnxPU+6+R4yyff1l4unyH5QqjM31/rgJutp62xpQDRFXfuqBzWfeOSMmoqtyrEWhcbGULlgW49br6xUgWRpr3RqH5vDNXaRoEQtVbGaxX0Scpo4zqFMJOljrAjWBpBAUzygQhRNHaL1ptQxMgODLJT6Q6FviPeBzcZxGbIcbAekU9HO2RqFkIxOj1+CfvkrpAWsq/jPiThCFKxVjXirCeI5jZGnAG0iuBgElQDbrIvUteoCJiDJQlrDE2z6PFIh6Oo+nMblY+Nj7NzHBafXzc+vRJ5/Nnjekw8c4Y7+OenE/9MnXG5iZyxnoRiBabq1Y/KbWObYWGwz/9IQDELKhf42Sod5OyUHv5gV6lpx98hV6NtU63XlIChlBQRNTrBkrmiDdu3br13e9+9/vf//7u7i5Slddff73VarEfbrVaffzxx3/913/9Z3/2Zw8fPtxsNv1+/8GDByi3VyqVarXmvRsOh6PRcLVapOnaO2cjGyfVeq3VarXbnU61WolspGW+IB3W7XaDVQUl/2Uh88hdD+kk8ncEvQx9URPSMQbXSSS8dEoI2v6g3Yd1CSVMJEq9Xk/rJVKAIsCI9ZL4ovHlFdIsliIbkbVIS2QlkogkV794JWJFaiK5yAqiWiLzG1rxzXEDEN8cX5mDjGAs06vVCv4q9OxKkmR/f/+NN95IkuTRo0feexAk4US/Wq0YddGDBTVDQmCNRgO92JvNBj3L8/k8SZLxeJznea/Xm0wmJycnKBLOZjPw1NiDVg52tZ0LhSaRx7bbbTbdYEehriI2CVpOa1FCgK1aahOfLyK4IcPh8NmzZwBugHRAe1H7L6EwC8ip2+3u7e2BI6b9W3BLGXcGWqj4HO3GoyWWNIKGsJj8UxC7gtfrkE5TpLfqnWmZufV6PZvNwI/GVl2r1ShMjG2Y3ceI5kkl5q4MCDVRMhdyuUEpiKUC5UEmFeRy4itwbuC76cCC4sUvg5pptx98LH7DxvadnZ3XX3/93r171tqnT59CgJgUP3xCr9fb39+v1Wr379/vdDrA6IFcQ5YUSU6r1UKHvrV2Mpl0Op3Dw0PIrSK6Wi6XtVoNKRDhP95MiqWyxx8YDUOrwPDqZYilWzkOmvlCbj5jOB3AcYIQxKSGDCkD4Gy2Wq1msxlFEXvYOQZ0yoEhodE0fDK5eGQRbs1etqLGQHLxCACmB2qhmPXIVHk/Cc1TPFHTujVeg99QqdlaO51Onz9/fnJyAoWBTqeDJWI+nw+HQ3jxYRlst9u4vaenp4eHh0dHR71eDzz0119//ZNPPjk9PQXsCPCduHDAV3q1FBsuCLpngoYkWLIAO9brdVRKcJdIxeIAWC6XIJUDSiYYSrlYYwwsH7EOgwHKtBza3ICVdSqCciC2Hm1YxIHBqZEkCdX02I+CXktsCppDpEsvZMRr3XMpxLKn0+nx8fHDhw9B20Emg21IGypCvRo97JPJZLFYkKiuDWfYfQ/EgSi8XpmJ0fMmlzsomeJS3hoK9RiWFPQsKwhRhZBfjQvH71l+k4Ivj8mO2QGN9dPTU619fHZ2dn5+zqobnzubx7+Uv6IViaMoUbTuQJg7UL/VOr96raOuC5amYCkgn5qv0RZnmkGpv2IrhlsmJGKF0UBS0JyuG2JEidvqApVss1fCso+hrinAgbKTXPYg5X+DCorumtcSE8HzKsMo3Be0f2YAo2t8JPiTbNM12srnvYqUJ2WN1CsqBIHumdapvIpZyT6tYKPUIlRBkTXYW/lA7WW+6pVbs3M+z50xctkF6xqGY9nY6iqAuDxENQOdchDY5S/ZgSyXAICwerC8jaWMvGNGd7RmJR2BmJcoXSnePTblkFMPegr7Aqmrrr1wufjHl5eI4K9YtbAIsCQpl5WIeRsJWHOzZpyj8w6K8GwV95CQCHypQhZIJF8hRGCMkSSWatUYEy1X8WpdPTqqff40OT+3JvO5M7N1cjytHZ3UZ7NKtjbixaRms5E0884bEwHDxQpjvLdXsWXLtZ+ryi36RV99gDio3+iSQFDpCebvVh9FfZQ/qlyzLxexAjNAzXUNohESj7gCI6Ku1Wp37tx59913f/SjH7377ruDwQBFGrATnj9/jhR1sVh89NFHP/7xj3/1q1+tViuQme7cuQNmA/SUZrP5eDxZLmdRlLVaNo4ia+Mkqdfq7Waz22i0K5U42JuksOFlnwqta05PT8/OzmDNDdDWGAOpvdVqBUoN4zTyn7B0aNgdoR0xfXw+QHB653Itwi1Ck+JyuUTQwi8iLSOw9mFGc1GRKhzsX82Yq4tURSqF15wVmYtURDIRJxKL5IXicC5SF7EiC5FEpFF8QuuGQXxz3ADEN8dX5gCwxW0JABwMl9DeDqmj3d3dxWLR7/drtdpoNMLGALISIkVNTgSpE2EZsT/uLvB3Ih7Xbrfn8/nZ2Rn1Ger1OjqXaZKmQxnSoPAt5IgBx4RtNC4KKS5IiKQYID/Um4fWVEXTDf3fcEMAakNEgqXL6XSK3Q6c5YODg36/D1wDuBhs30UZXjMcl8IgmxksHI1wD6kqQOEnrXiL39eLg2E9/bsDu3OgA8jzCTRco6lHx540TdH6RwL4cDhkcKDTAN2KiCyC10WgTS7LTgUilVo/hB9OlxsCkbheKoeC2EKqCzONlw8fMUrxjYQGUJG+devWwcEBOrAmkwn8qTTRqdPp7O/vNxqNbreLqgl0JMCsJI5MVD2O48FgAOLM8fExSuVgzeNBB3Q/XCBzb96EOI57vR54r/RRCUxXyplkgJ9qpCDotdSKrgE9k2gLAWIkUcDCNLCimZiYVhq6JQ8dz06PAfaTUmICYDqp/Vux/vIFYilAHsgGZz47AnlsiQX+BUAW6iKIIOm0yY5mwIv4QLTLsQWeggmNRuPg4GB/f79SqUwmk1qtdnJyQgJ1q9UCdDiZTA4PD58/f/61r30NJaWDg4MkSRAEY8FkqUDTTOSV6ksEnEdNAGFDPa4Rtw4jvNlsanCWaBeGRMChY70NRFQsg1AtwDrT6XQg9Yv2RmKXGkRDt8d0OmX7AunVNIwiGRmlFyx96ABYrVbo58CewjMk2AFUlB2LGgJAZbHT6fR6vV6vB91byvmVm9BRFsWwwRpFPyjy2vCUobYBh0a4YgZ6fOTUc70lDs5aDpduXLU2msPmQoa+LsVBt5cJFa+UvuG4BCl6XPAz9uXBYDCdTj/66CPg+Dg9dPZQ9DlwKv9S6DDOs16r2WazXqmQqBhoEGtISOOwGhcAwgXAS7uTacVtxAn4AVuYztu1AAUp0gHEw11JW9Lp6lrAwtta1qLsg27SL7u9a4ELDCpOK+7vZcwiwGTZtkwBKw3OakeygFIXCN1wyuhibaCjzX1frmivDvBcXezUmEuAppX1N7ZCyVIYlOmVCutqGfvmQAUWqeH4wDVOs1YD7I/xpDHGGhNH0UuaennvITHhSpccgIxl/Y2yFqcG0K/CiANPVJZMOJcxfVjK0trB+tDFDzoSc+3iGgKXS5o9skdNlNA/BiRmASMKTsngPrNTjUKlvGpCSFrqBI+Vm3uAqvMDkURwnGgGMYqCSZJsFTQLhAjK4/wlCh6o00ilYmp1sSbKsmS9qR6fNj/+tHZ4WHFr751Zezt38Xid5JmR+IKBGFmJrLFGrLEAiPHZW2GnqwDu36XV4ysMEwf5TvBz0DDBYIMPPbB8vGb/CkpNelDp+CqYmMGzII1dKxfhe+/cufPd7373n/yTf/L973//tddeo7W1Mebs7Oy99977xS9+8fTp081mc3R09PDhwyzLBoPB3bt3b926hZQE0xkeqsvlMoriZqPVatWTSmxtFEeVaq1Rr7fq9XocJ8a8cIJFZIVomfRerDkgeyGdJw0CKSSNELQwlGZSaxEkalIFEk9IGdrtNnSuqPpF02/yl/EbhFisNmmXY1HyMhe32nujJJV/3yMVyUTSwnouFUlEIpFUJCoAYidSFYlErMiqeCNS/0hkfcMgvjluAOKb46u0g2I5ZuKKNRcQGNdo5CEQIwaESpSWVX0WA5FHAXRDwgnoh/AolTrzPD87O1sul+PxGFTBnZ0duLJC1gAoj96ACTcg08MX0eOOvD9ElkjO2YyGT6AGKNIG0KwQDY9Go2fPnjnnWq1Wp9OJ43i1WoFAii9CSsaiLhGTg4OD27dvgzjGBBtHFEW4b7TIIO7J2BfqtMgoWHHFqWp0GOdPlSgyH7Hx0/oZt4KfDyhfF2+vkqtjiovxQIgKt2g+n2tNYZ2s4rsgT0nKoWYm6jZ5nYnpvEWTXxBOQQcTDxHIO3AZwHAQMwXZmU/nJYd9kG3yJgPCAxW90+lAUUHrSDLbAUcVgC9LEaJssjQBkHnUYDAYDAbz+ZxZCvMu7V9E1T/8CS/D7QJ2QD1otsq+JHiqWS1ah/cqn7dyjx4ZuJxEwHCZy5VV23ScjfBXU6RZv5HL+mUUrwSO/6UcCCGtiLcAMtOUMRKOmFKyIx4dBlyyqI1IDi+DTrAbNDaE3zjn2u32zs7OwcEBcGqggSCh83sx61F8whKKNQfLJp47Pl+n2a9Wd1gjPmye0CgbQ3lMCkw9YlIEsHD+WN/o7Kfd4cnTBIcLjo6oqWCPAEwP2SIkMwExU/daYlYyj8JkBGxdq9VQvZtOp9DYPTk5+eCDDz755JPlcrmzs/PWW2+9+eabvV6PqxZWbHRjQBOG6r1MWrAb3r17F5xoSNB0u11t0ISxRGl1PL5ut4skCoUitHluNpvxeAwpp6Ojo/V6nSTJ3t7egwcPiNhyStI6HMs4FOH39va63S4XbcLBusjEwX96egrImOY2uKXaEVEnbHigBMXoAcDrwqVB+QfCHUzkUAyjkDdVjwJ9xpcKSSuVdqdT7/VqScLUVDNktQIpx6H2TMOXggsPOjxuIM+EZEkMKs0y1iin7isK7Fh1cZT6xcTxy00PAVtWC4+yUIF+f14sNyYteaEBYpY3AryS4LKe1MEvWSW9BiAW1fyulS40OK4HnpbOJFXzKoavXKFHIVcIhjCWCLSDykTpAAlCPQ8H48PAG1bLvyAY5ufo79KcaFGSTWVKIIEJ8/IAsffOe3stzTMApK7nTV+zS/JyguI0l2tMHz0pdDmf1GNtjShKm4XbJbWVtEerptVr+FsXXAHFklqoHxkXAQ3X6gWNsa5mJADhxfbB4aS7MVioxuaC15fjVX3+1+yq5XXvqjKGBvYBEMeJ1Kpird1sIpdXxpPqk6fNTz+tZksRLy42eWKyqnX2AocyFYkjqVifWLkMCl83+q4aWv+YktyyA/ZVV13WyQnkvzVrJwhuAxGDcqFr6zfqhhJtH6oLhPV6vdVqff/73/+n//Sf/vCHP3zjjTdQnkf5czgcfvDBBz/+8Y9//OMfHx4eMnje29sDOowWXmxw4Lssl3NjpFbbTaq3xO54X/dioiRvNFy3YxuNmo3A9o1QF2ebnW4Xxq2Aeh4CM0TyTBm4bpDjxUZA1pC4j2ML4/qscyJ05YoIy8+Qc8RKC04bAkhg2TpZ1pXpS9AwClHe28uuD79fJC3iCxQ4EdkUQHBUCBPHIlkhPZyL5CKJiCsEi+UGHb45bgDim+MrBhAH0pPaVESzzCjmGASUxJjwX406AQwlKUAKUUIC0yD1IHPbbDao/tXrdQKgdCKWywbTlFAsm95oDmZgp8bsiDQxbFq05lssFqPRCH8CEkdWEalV2O1wDvhYYBOdTgfbNqkTjABwRYhiAfxppIlQO64F4BHNkcoSCoTYtIqTNl/SxEAa7IAEpzNDX2pj1O5eumJMzjUJOEHsqxE9bPzASfUD4ruC/lNiHEG3KfvBkXjT1Q0QFdBwDJuX1/jjYBClz6ADZYBNTNEB7YHbjlPVtDXeYZb9QR7kIOfLdD282WyCiY/HxzZ2zQ/FU+NzwX3AkABSD8cw3RT8OwTN5WFQbvgl+kn2nHabCTygiOdqFxqEfUEEjFsEG8AAdNBsKe1T/6UujeIMIrJYLMD60WObrYUMx7UgI1tlpWCSah4TgQ9WMjBIRATPBW19ABAhxTOdTqllrKkNAKe4NkK3IcBBuHiydvL3hBEHKqtaL1X3s7NvGss1YF+90hLXFiVnTDCO+DIukIQRUFN7vR7uv06xAostXcpinyMqSRCvxw1/9uzZcDh8+vTpxx9//PjxY0yidrvd7/cxNtAFiZs8GAxwSpBXokSDppajZNhqtchE1k3r3Pu4e9JAkqUU3FLIGUNIBIJOaJ+E/Ajgcin0LiBtMS+O1WpFljGqp5oxxxyJLBsNA2H75rwI5A419oHJQtA/8FVDgyfVlrhTM43kQC1XE19+IlcqlcHOjuzvV4uBVxbVpWkkJSCIz7LjAVQmSHuDbaR9YlfFgf2XnRAa5dSwlHZc1K68uoWC6uFXYZf8HLKxuOHW63Uw6HFdOpLhEqpB6rL+hiiOMEIdVrk4JDjTdX1dOylp8zd6ourmJFFWsVdxVDVfbKtWmFyWeNa2BGUxCpa3uRBphYetMhEBRswQJb98BM8aQ0izxQMDgIAbGHSoiHJi1CDpy6/FGigoY4tXaRpc9cP1G2U5eNAoOX/W8V5A/WNAJSX+bBAB6lKHHo1kIzLk0ENaD8hgIvDFgY5NWZgluMCtItpl7mfQPsVB+DKdEMyJrvqWMvNdTQqoQ0iSSJL41UpsZNabeDaNp8PIu+ImJyJGpCYSXWDEkZXIiLVymbH+BeDTPybKcDkO1OWHgLuw1ThOj8+ySaYGc/WMCPw/RTWO6JEjSnJXx8O65Q5vZ1CaJMnOzs7bb7/9z//5P3/33XcfPHjQarWo/3t8fPyzn/3sxz/+8U9+8pMPPvjg/Pwchfbd3d179+6Bo4A+RQRpq9Vqs1klia/X61Fye7b8zrPjr6frTlJxt26Nur3TwWDZ78fGVkVipK6dTgdxKRcHDmbogw0GA1xpvV5fLBaIEKA1gQQKRH5YyDDBgbuPZtvQ0kA73OIGkpiFUwLYjYgI7Zu4Y7C4oI08PkTrwgU24JHIBUD8SgZ/TSQuqMGRSFVkJRKLVEQWIplIIpKLbETyYs4mIguRZjE7azcSEzfHDUB8c3wlt1KmTJCWJ8QJyVdoGpC1qttItaOOtjTVwDHICKSXskOW9BwpesPZ9E1KLEms+HAyO+SyW7eObpn/AJcJ3OrRbiOqeRZECSSTeZ5Xq1VkkhD87ff74F7RYArnA98A9Bqz4VHbxBFJwffynNHZiniX7FdtR4MbRTaK1rwjXajsMKaZ1EBORXX84QbizANQlQAQ7gwuh5AHEZMyxycI/SnJygZwnclTbVYTUalZHKsDoDBp4IB+AN7xGnlLtRLFF690cVytVvVAJYWEMNDu7u7Ozk61Wp1Op9AgXiwWaMomQ1zXOXBKuHaqFvAbKYOL1xwcHMB7lwoGLG4zGMW45ajW+qGokAObgwbI71MAD7y5+bBIXsMopfkVEVJNmkCr10Id0A0g9wp3g3OcXwE8CwsOs3feChIovixATLAVA0ZLlmMqEYTF02y1WsDrSQknP4LAMZAmrEiId/EIEKqenJyMRqNarfb6669DomR3dxccTyCeQFjAtsDABr1iMpmA6IrPPDg42N3dhWsfbg4JjCxQaV2XV7X4k36I9YFue+hGRBSu1eLwTIF+YhoC/+UaywYCLhGQY4YwNMN3rBK9Xo/Sw4DGAmMffPhsNjs7OxuPx4FsLmgsJycnGEUY1ev1+vz8HAzl27dv93o9Pr6TkxOsgc+ePXv27Bn08iAcAR0bjZ7QHxw/o7oTNFkHUAKTqCzLRqPRe++99/nnn0NAo9vt5nl+fHz87Nmz6XTKnYgCCIvF4s6dO2+++Waj0VgsFoA1uYAABMfVrVar3d1d+ARK4XiD5NB7j8oZhOD39va40AUytaKscvCzlsHlOoZvF9XEQw1uihKyc0hfPt5FCt6XqOQZU0mSfq9nBoNEIZhbVzBql4NqzZIhAWLcxvF4PJ1O0eOiCemocDBOCFwBdb0EewcM1nVKj3tCsR2sqIwxtnadY5sjTYwkfQDulFjRylFb1Rh0T33wRdyUdeVYSzyx95bAaxmDpgY6wwCu5AFAqWMScqI1pKtRvzJAHEhFayhQz0fu/mWx3eB8yqicZpKymK1jITpM0kVD17005zQAiEk40Hov/CLGvb9/Ge8lRVperYupXKHjcRUIG9R6t/73ZS4q0Agu2wZu/ZytFN2r/nl9QhQojF+v6Vz+hECO9hpMFh+Jpn5jjPfG2gLW9cY5yXPjnHFevDcXZ20KUMkrHNhcQ278/8eUtrxr6Ipp2fhRp2/BqhKYYZbVxnXwHJAbmHiS8MHdlp1z1PImKwhbQKPRuH379ve+970f/ehH9+/fR8sO9+vz8/P33nvvxz/+8Ycffnh+fo5kpFKpDAYDRJJpmk4mk+FwSBGGKJJGI26365t0dzT+2uHht2ajfqWee/v8a69HzdZZfxBZ2/A+McaimRISRliZ9Z6CC6lWq91uF5kyeMSoyEohe8VtWiMDbEqgyQ3yaCYO5FIELkFRFGHLRigIm3rcQzRjQQEMYQnXcF390kuKvaLL53daJUXmIg2RhshSJBFpFroTNZFlIUbcvPwu9Egvb0zqbo4bgPjm+IodRIjwM5bd4+PjLMt2d3eR2EODOMuyvb29fr9/fHyMXFQKtQQd9+v2MWbRlKxFOZHEGZLvkEkC1oGAL1mimsuAbYa7FDvuyTgDwKQ5a0iwiTt3Oh20kFMkDok3JPbPz8/H4zHavdHXBohnZ2cHzS8o27IxPI7jTqezt7fXaDTILNAEZFwRSGf0wSD2TVZjRfW54Hax8snUFKcNDJ2GSOUkVgpPIe7fVKgg0qQ98RgAIdsnfYMhCNMnAgG6HqDTbBGhPgat+QK/aYZiKCAjdyLoT3JWlmXj8RhxwGw2G4/HjUYDzd24cFSk8RyBSAbO1F9YCyH1Dzkw4qdarQb6J8y1Tk9Pnzx5MhqNoijqdrsEiDWfiJgCP1B3+1JPgJEi4EhcMtQPmI6yT1xrfWiEHcAWkDIC1lqwVa7WdnhJAhHjYBD8KftFDIVFI2AcONvxeHxycgKx5vF4DPlpYNyYCMRkKYeCP0EzBF8BlJl1FHSWcWr/bumBtbbb7ZIUFmDxiCaheE6vGwamFArnZbLogsEMbRwoycJv8+DggN0PeEu1WsVCihfj9VzusiyDByZqcvCbvnv3rhRaDQzrt7qdvPKECgOJetyLxWI8HgNmZVWAWkNYSRDfYxpCSwGBPhn69DzkCyjigTUHgg9l7y9e5mq1Go1G5+fnT58+XSwWmKT8BKzbNGmBSg+GXLvd3tvbQ3/ifD6Hm8rx8fF6vUYJECPcObe3twd1b8hPa84vxXzJDGXTg/ZO5OPgOrlYLA4PD3/6058+fPgwz3P4VVprx+MxNPfxxHu9HlzIR6MRSEDwlknTdDweLxYL6Dlwh12tVsfHx3hG0KPnYgtRiyRJAIlihwV/Xy5rlWiGI3clov9YVbBSAXjVjfM6ctAbBP3cWIYkSaqsBfnFIWmSNJtNaTZj1QWvc3JShjm7wbDGYkLYEXUO2PeBc0SVfLbX0IBLVE9V0GGDe4IcHsg+u0no1YkZRH+tQDVVlIAvPpBFDlYuwSBmtIB8WItmlGHQsq6xxnnLzOKgxUoz7PQcJCSnQVXW8hkDaOiWpdNAiACxU+AkFnSh6W4hBABBiMIHwTdimJVRUfaFBPIOWqua7q9lxWS62HGaa0RYw0BlwIhix1rYfbNep5vNS2pvX3DZSqqpW4U4gqVSrlUc/kIwtPx1ZYz+qheLEtTSNEmtzaV1e8ufoBVU+BpGaDqIDb6o/CGitKrKQsA6gpXCrkqPEE09CeaOlrrSH1LOqnQP1lbzTLnUL4Vw1ESRsdaIGGvFWlmvzXIRD4fxZGI3KxEvJvY+NRcd64mILWyvpOhwF/Een/xSXevXm9f9odOKr6ooBLLCL1M2COKT8qDaOpUCLgVZRMGQY8mZ0ReVGxFDDgYDcFaCpG+z2QyHw+PjY0TdutYIrgM2RLa4FQW7OKnEaVZbb9rTWW8xb6Z5tpi3cleL47hajYxJnKtQHI+BsVzuNtOdUujvpKgUGuN0tbXc5kv6F03jGVNhC9DSLiSUoEALcgZpDSAsQ3BG503lxepSecYY++WTi+uORGQtkhQFG/5MPWIvshGxhbIEfrAXGuJSuWEQ3xw3APHN8VUCiAm8GmMWi8X5+fmzZ882m829e/ewEDcajb29Pe/97du3b926dXJyAl0hugNrwDfPcyj9aYsSrf1PXyxsb0jPqPlIhxa2WHIjYW8gjeZZd6XlPf2juAPN5/PxeFwtjsB+GnDVaDRCyn1+fp7nOYg8gDmAMqAmSTjy+Pi40+ngwsELw580P5o+dUj5dBceQW1mFJrVRboKjbmwNQJlxtvxV20yQ2udcliMzJPR7VbnYrwRETzODXxqNo/jc/RGSwQTr4RUFszTGBkTrUb2qOsHQYgMOBJtywB9hsPhaDSi6mie55AoBRqiAVNokvIbXz521KLSeBzQB+j1etVqFePh6OhoMpm0Wq1ut6vzW8Yx1NvSPkVsfufg1IoZml+J9wZywGCbgu8GHmun04ELIk5+Op2C6IQoEDGThoPLUh5SEqPQ/AUpWfTgBKCNEHj1kOwGltxkMjk9PX348OFwOETSXq1WUWpCYLper2GsJ0XjPEYjABcgqqgV4bbz0eAr9AJyfWJTPtCSNhgMQIxlDIrnCNCHwg40Z0vVQQ1NnjY+ebVanZ+fg5qRpmmz2dzb20OtCGUkDEvEzXt7e7PZrNlsRlE0Ho8RFoOnP5/Pnz17tru7i+H9zjvvfPbZZxC3mc/n/FItSPpqGcRSUAJJr9B6mtQOxmlArhetJNozja5EeL70PdMynaTsadMn7gVy2WeMT9k5B72I8/Pz8/NzwKDURqBSx2QygSI5DVV6vR5uaavVAkBcq9XW6/XZ2dn5+TnmeLvdXq1WMHXpdDrGmIODA6yWmJUaLCD9nF8tlz2pCLDi2heLxenp6eHh4ePHj7337XYbnq4kuuLCW63WYDCAqPpisTg7O4uiqN/vo5GCeDrVHpxzqJlhbxoMBpgjWD1YO9RMycDSnWjO1jnFsi457CICzrJ+oMjKSPbU4J1WvP2ds6/I2mq16pLEqE1NU4EwnGhAt1gscAMxH0kXhacCEHMoEWvGKHUStUpAoPbLvSZIU6kmRCwMk0K3OgVYs+4uomAXl2IEPwEmtVVC4Ro24vUEOn0aOm/XSikas+Cyg7utxab4LdqiU0Pe+EAWCImnUxdLxxJQkQIFrAwQB4XwsiSOvgNaIZdt3eXiEz9BFz9063dAHZWSqxUrrPqRBQ6T6WaTKYfhL4hJgBGXSK9laDgAbYMAMvjNF1Jl9fmXG7w0yBUEqJqczvup1T8pMYEnQrw4GNKBRSrruLrbTxvGaqUUjk/N9qX6ir4EXRoJ2u8CgC8QBCCnAUMLYeo15S53+biKJa2IHRJFEsemUrFJItaKd5JlZjGPRqPk8PPq50+S8SjKUpHYSC7ii/70qECU3CVdksvQMK3qtoOnQQUlsEP8g4aJX22YdA3PPQCFpSTIfv2nBdIWtFUAPYs1YGbN4Dqw3klFNbYwktMQeFdyN7HGiHhTDB0j3lqse5ERy1UkKAbrIa2LMewU0QG2pgBr9Tk93cqpStmANFCM0UtcWbkoWCrLEtJ/n+UIEVvQhPHPTCQWiUQ2ItXiBcuiqAPBYl+8BmrFN8fNcQMQ3xxfnQOpEcDBSqUyGo3ghYqaJCBOxHZ37tx58ODB+fk5W8KRXKHthTvEfD6HQz1dv9gYqIUsCTuCckUs4Pz8HDBor9eDxRMFBNi8ie2QFU72YxKGA3CJHRQ6j8CDFovFZDLpdDpAZ9I0pQpklmWNRmN3d3d3d/fg4ABkVezQoKQhNIyiCGmM1mUGREtJYvi8k06rgTl84P7+fqfT4UZL+hLBRw068FvIC6bZjmZlkohNbWL8rLunkacBNKEocJZlk8kEUCCRYg0xsL5NsAxlAFB3ceaA1NvtNpVDUPpmIo1HRg8oIF+oOQMc9N6D5GWtnU6nYKTiVoO0iL4hZneArgC1gMn4kuGgjh7I/MIDBW+u2WxWKhXgDmClMfNnFAJsEVgS7YmYmmpDNggXQAYXRDaUTzAgMcIxaHX0g4cCpiE6sCCBSn0u3LE8z1HJ0GwmIjgvvNSLkCugXJWJLRSUQFM2iABa9gHjGXURCEScnZ09ffr0008/HQ6Hxpjd3d1qtZrn+XQ6BboNj0TCWCQ/ggKQJAl0xziV+FwC8UfZponxxXtbHGMu665qTG2tqI55NJvNwOclPMFaDoXC8cr5fH52djabzVBSGgwGkJZGHos1EF+HWH8wGAABQdwPkF1Elsvl8+fP2+32wcHBa6+99sYbb7z99ttQQqC8AGoMFId9tWkPmSCkfOrPB3aDqdrtdmEEJ4UuNpITlChAv9USn1pEGKkLudWU+0CVjv9koZE5z3Q6/e1vf/v+++9vNptGo7G/v9/r9aIowvrDM2k2mw8ePEBlDt8C7TwwgiEKxBok1hmcXq1Wm81mh4eHeHbYGgJfUJ1j8PfctkQZXQIux3Y5nU5PT08xf6vV6s7ODrjSWZbt7+8DZ9/Z2dnb22u320j8AF8SkMVtpxA81hPUI+HFd3x8DMqwZm6iUQZVJaw50+kUE1mDYhqIIXADtjK+lIlcIMCKjRVyHwcHB2yJQLMnwdmgafd3GLTA11xh1Km5eFimUBjAXIP9DlQ49DmAP0WVarZB6LpFWbeKMDcbYmDSSB9FBEUBUsZ8WOvYBorGZdyZNxZbId4VFPyu2chkG2+0rLYZ5PP8ZCyDqIXrIa1xQEJjWEWJDrDCCm8AjHMipDrkoxKL9rvT0AP2UOyzVJcK2JrcOyhDoesTGg7AVoIxTAyXJ4DHTeZ44EDLSVGuShI71o9M1/5xryg+A5fjOE1fnswbPFktBi2XCbZB7SqQ9eCz2wqLaK60FnRmkZsu0Np7QPP7cNW6Fq4lTeQyzZ+rJfZ37YMaWBpIwRGmEhSqCzST1FObxAiMAVZzGXpJIUiKBZkgcoBSsb8NKy37wPRs1ZdT5lZryC+A0q4CiIsP9CLeGB9FUkmkXpdqTeJY0lTOTuOjo+TDD6vvf1D75GH1yePKdBK/yNSjQvDUKHes3IsTcRy0RhlgbR9vHL1l88myjeEf1qE7Hct1jq3cUs1wDyRltDiPlrFmykZjcF0pZ/jNiaBV+7jssA6Hcdvv91977bXbt2+3Wq1Go3H//v39/X0mUJ999tlnn302nU6Xy+XR0dHR0VGj0UDwg3Wv0+l0Oh2cDOxn2Ptira1UbLVirY28yU2yjqobEzlTk0pLGs24Xq/V6pFI1ftE5MIEEusPfbM1QKzriJBiAyCAU4XABaIssgHq9TrZPLxXpDexNxH3B1kYle7ImjLGNJtNsG20eyQanpbLJTYjKeSGRbWuMv20cSyvcGCDHdwoPOi8SFVkLpKIQHFwrazqmiJGZC5SLVjGTmRxIzFxc9wAxDfHV6zKShoFUnf0AgMlYfIJD/ROpwNCFtItCg1TPZYN6cy7dAciAEFdmScWieV7Npudnp7Cs6jRaBAUA3zGyE9jRnojp5AFjMXgSwNZYbx4MplMJpPd3d1+vw9FhSzLkL2D1jcYDMB23ErECCqfmuZDyEmDjOXoHFtgt9vFbZSS8H+QPmnkDnvbfD6nwAWl/RB5Y/PmPoqtFP8FB5mcTbghS9Ex4QABAABJREFUEeUHkk7QGRs5VbGChlCCj7xwALjwGdB3IwCIAWvqLA4nj5PEg0PEv1wuQQkEQAxlRgKvzBWp7vfyxWFjjAWTWsQD67HWiNgoSgpuWKVajZNE1usXsaMxnlRra3PnjLVxksQYvc6ZwujAFeJceJfzPk6SWq1mrI3iOKlUoigSjCURfIix1qCrnSmutVEcW4Bl3ufO4X/wNzcY8MbgrIL0Er+5eD1ZybiQ6xEHY3Ln0izbpOkmTdebTZplF19aXL4oJUdALcviQIZPF2Nmj0C+SE3VkTFxAaR2Ulj8BUylV1L5Z9OAlt3Un8wRRds0zkeSKNm9zh46KQnpMMWVbZZNWmBX3wR6QAOeo2ozhZuDJOfVsmM05yUgPGIlh/YuYEfdbw4tEcxlwLIUzwGZDkxz4Gsw7uON4oXgDmgPem09ul6vT09Pnz59SnUdriSAUKXg2EJcAp0WwN8Be4Frg9GFRc9aC/wdtZD5fP706VN8DlSkWZ/TCKDuYiaOoEXYCbdhlT49PR2NRshkwOvBqOv3+9hlsGwCc6c6IVY/GNNh4rDax3+i9IivwEYD0JzLNbYhPCaQZ7G0Ek9huqVtAGFkii1ec2MxSdnlM5/Pj46OoNTR6XRu3brVbreHwyGo2aga6nrMVgjsZcbkZrNZLJd5Ue4NDK9wo0aj0bQ4ABZriQl6qWNMlqXqcQcw9vh7XWtkn0Gr1cK2jv8SINaBgRa3RY8wJrVe/XSHewDpEl8IanhlNcwyEKzfomFBrcMYkIUZuZHkG1TjAmF6jCtNMyR0Dt1kClIHWr2a5yXb5AVYhCbEkF9m3RJ8R5WOSjgcDMFSRhRAK/vTrCIgtW1tXCAFIYCQGHBqEWTNxySEiluaVCrz9ToZDl8yOsHd8Zcngpb22spF5dajm/a085soKrrm52ohde5KHMBE5LUnrR4kbJvD2qVJx6IcSvEDyof6VgeQDV/JIi6VWCCnDqSYkwg/67ZCotU4Q3RZYVBREj1Y9OjBSGNSjXltVRK4hhTM8DigW16tvOzxpgvGYSY29cZLupHpJHnytPrhR9Vfv189fFKZjKLF2npbgE1G0YfJRnQizqvRE9Y2tpID/DbGuij1g+3M2a98VhuENMF16aRma/nkBdlW1a0Dd25EPrrypL+OL6N4rj43hjp6MNdqtW63+8Ybb3z3u999++23d3d34zjudru3bt0CG+PJkyc///nPf/KTnzx//hyTdDKZwGmg1+sBe6WgPBuVaCdgjEkSW62aJI6j2BpglxWxNZM0k0ar0WqlzbpxvprlMed10DMaLIZsqWm321gxms0mY4/lcqkVJ0SE56m5+bgWrJ8IlnBzcCG6zoTAhpVISL1xYUEWuVgsqBrHMaylk7WO4qs8GsXEqBW/aampUi9+SIqpWVfT1BSo8c1xc9wAxDfHV+fQuYSojkLNoqJ3DZddpEBy2bxVb6IMH5lgoLSo8Qi6IWMDAIsK6SUttslx44a01cBK+4aBygQUmy052KhAl9Zi/1RxrdVq9KPTTnckNUhJaZFZAWFQKu5d5R5G/kUQzVxz0MgIiAkgb2KmbKYj/KqL20x4IAEB7AAsOSa0m+LQsTVZP7yrpG+QTkIaLGvU/DrcZAwYylZow3RtQw+aJPU9gT9i49e9t7o/lPhjWXQP3s7JtjvZj6JmkjjvU+9X3teda3pvrW1UKlG9fq/dvttq7VUqtfV6MhqZ2ayRZdb7njFdkWae+yxzy2VurZlOK8tlFR3lWZZmWZymIlKNIiOSzeccwNJuJ/2+aTSstfU8bxWnTta89z7zHrwm3JMqqtFRlMVxIpI4V12tovkclrtJrRbHccWYxLkoz029Ls4JUeCCk54WigpJkvg49lEkULbbqjon4vI8Wy4Xk8lytULDdrZaiXMGSLe1BpGuSFapgEIIBOTk5ATQMH0hdNlJCplm2eYSA41p2r7RIy7wJqJuyVVqcV/oGINAU1tBaolATPPxeAxDQop+0EWQVET+E6BGo9EALon1JKD8Y33DR+E36MImiAzuPHjlnU4H6CGZyFi7SKwmWIw7jJN8JanUVtIcm8GttZ1OB/0cqNURJcf01LsA6CpUkW61WsgH8HCBvQY5kiaxEm7g4gkZ916vh0ECkCjI5/n0UVMEvqlZfpTlQSoFEZujoyMwfMFwT5Lk+Ph4NptBKZgDgOZjbH0IymBlBhbEJc7PzzebDXRFoKTsvd/Z2bl169bBwQFWS+wX7O3AOFwsFsiRIDJDJj6Xa1r5TafTzz//HJLQ2ICAmvHEsKmBSrxer6nAAPqt9ivD8+p0Ojs7O3iCeMt6vZ7NZjQch6TMycnJcDi01g4Gg8FggN1kOBwOh0M0D2HXpimNxi5fclhiO5vP59lqRZCXUCCR9AAghjufxqGIPWkGmUbWpLDR02uF3qxRbCB3GBgxihCBqsaLNV8Ec19zFfVcIyV2G6nQ6R28bC0YeHaVoWQtJ80lKGiCpvAxe7AYiWlAVsvIohKsO8CwNaN5iHu9XkPKIrmBmZtWLtKiMYHWjdYppnwNZZ14u4KmZgao2tAvKOMFlTwtOxBoJQdFBb28lP3TCJpAbal+evqScbix1jgnVyjDBpBlIBAcCEFoZrEuFbBEiqdP8riudZH5rmFf/fk6EiaDQUNIHEv60VyqZCvNBy09FMiesNiMIJAtawgR+TlaQ5yhKVR6MGbIe9BQHU4GSzrlUAk8lderL/znVnWObdMcMZc3xqEpZbH087nMznxkTWxlvZHHh/EnD6sfPax++qh6emzT1PrI+3rBGjZFW/pF9Kb+5/0Fp1ghwFtZ5Hqd2SrbEribGGO8iHnhlPcHmecGEHlQCQjmkX5qAejP/IXZaECd0WIItAoXJa5dtkWt1WoPHjx49913//iP//jtt9/e2dnBUERrxbNnzz744IOf//znP/vZz54+feq9r9fr7XZ7d3d3f39/Z2cHWm3Y3LHXo2SiC3tRJHEkcZTEldjWrKkbqYk0TNyMa61arbFJEpem1ojx4nXqzUvW0Q4LKsypsfuzZYdNRbixBHzxYm43WNthzMDevoCtz20Ib2G6gVAZWy0YxIvFAnQobN86zqEtvLU2ttY7J69wMIP0tRGpi+TFD1cdS5FIpCKyKQo8DSUpfnPcHDcA8c3x1dk1GeNSf5PpOptoNO65Vd2/7JTFLhudn/DFuvmd2BZIIqh/AlPQvEKtmxaYt7AUSe9vZHdI1WiDRqRbW4ugGZz0ZH1pZChwvywbdzDm1iTB8p25hlFV7hgtF/l1AMroXJSO8NbaeNDsyT2eVBFiT+WASeN0fCO5yXRvpwQBc2ydP2urAeIgtLxn/qaNZcj0IeMjIGERMijHvk2R/73In5T6dbxIfbWq5LnHM03TOM+T9RoM2SiO777//oP5vPdf/2u1WrXT6f/ut7/9+vl55lzTudZyWf38c+9clueVJDn4+OOd3d04SSJrnXMH63VedC1F1hpwePNcRCpJUms0KrjtxlTTtAelAnKFist58RSMyYtKOLqoLqQq6nUDMmwUJUhm4rharxvVKmW8N87FeW7z3EH2qsiM5VoqrnEu3mwaq1WSZc0s66KVrMSQmXY6v/pn/+w0TWfzOUaCMabVasGfDbAdKg10PkQlQye01JzBhUNLGr9k5SawG9apu5SUy4IZVz40aUhUQwASSMCO4/EYKqWkTbG+Bf4mW1xZF2HnLOJaXf8Aeg4bTOoDAGFh2UkKLWMUb6BIC0op3pjnOVu/8RZOQ879V3Vw6l1Ez0UhkCoZ2jiUCyMFGXHh1FbGLYJILipwwRagC5P8IgpTMCFJkmQwGBwcHAArx381RRFLNxMtLviac0p+Lo0oW60WkFzkUbVajc2Meg1kR4WGzHQFVGNDdB6nLQxAbeCbaLgBCNtsNim0AvEfClOA6wrxX70dEyjkXUL1YjweQ7cHt0U/ROZRdJRFzoZlH8OeHnTgGdEBnJeJU8Kloc8D+jMoRqLggbW67PZWNlV7eQYxaqKL+TxdragmpGX3cTlQC4FOFM4qAIh1BKIDiWB308uIblVBwFCr1cgghpwCrXt0C3NAaA1WmwAi1+gklzJGF4HZWrAAEuvUzNAAptSTq9w4QsauRnV1lELSJbdgkoWx1oky1mu32xS+1IGfXJbXDFjSOtrhIiCXhTj4m0A6Ns/zNN1ooUlRDmaEHXX0omHfawYeLi0QONLfoq8rKMOXzf0q1eoqTWv1eiAufGUoDhLxF/WI6ELCVrCyrE0c6JAEbAYMZs0A0FIJZcRQLjdrBwCxnmi61BG4euLz2dOgpSe0EhSWX5wqZw3cKTTKqSNzPQaw/IJNjFA/ENHmNgEGg64PlReKl2Gtcr/YChCrke/j2EWRWy7ddO5Pz+SzQ5PNxYqsN+bpcfThx5XHTyvD82i9NN6IJOaFrIQUP9iin92/QIov52UXQhNlEvGW+oSS1JeCvX5p1lhrRCLnzB9OblsWsS0riWtFF12+4kTm2qVnnM5ogpmIBVPX2zD82LSBtiF8ICBdxAZf//rXv/e9733rW9+6ffs2TUe89/D5+PWvf/3JJ5+cnp7OZjN2aEFFEHEXZiIAYtZ9lZFG7l0uXmxkk0oS1WJTM1Izpia2FsXVJIqi3GWb1G3SSx5xQTOfBsq5QTCRR7dxu91GFxRnGdzgyaaC7gQXE3Sy6hYHrMNglQUaX+yrQJzA9ibtjqArVbqV4UVzSRTZPEdf5is4kkJQOC4mYySSF8LEicjm8p806lYRWd2gwzfHDUB8c3yVjrL/LwliR0dH5+fnkK9l88tgMGi328jN6CGurZywUrNOyD2VMseMQbXPNfJhLOLn5+ez2Yy2PIPBAPmYXBY8ChItbAzz+ZzaqSIC3UB2kGGzhJgmTOd0UiEl5SmG0SxRUisWHCsWTvFFkHHodrtoAdZMKLDeGEbr76KnEPmw7E9kME35BR3LQt1JlHIW0G2eMzFxEKBA5SPKAPu+xWKBeIJCUUzkKLnLyJ6F6AC5xikB/yL/gpHKBSu2WsV/AxkQ0i3b7TbQB4BiACPm8zk4UNSlAhQym81OTk6ePXs2m83K+GBN5F+L/Pfby7ZLWS5f/HOzufTX01P55S8v2Igit0T+Jf4xn8vJyaVXvv/+7zbj6n+vATFS3C/vdmAK2nXti155enDw53fu/HY2Oz458d43m83XXnvtzp07/X4fYqAnJycQhwXPrtVqgZOoMRdCkBgVctmgTKvQBBLeAYWcfKjrMeKAIKZRm9VqNRqNOLtFyVtDU5UzVJPpwA6DSoAoJiCnLVc5rBgcwyQxaTXV2Wx2fn6+s7NDZRhNS2TnNbLcQMTz9z+4XLCuw5VztVodHh7u7+//4Ac/gGz6kydPPv744wcPHuzt7VWrVXD8wYFFGwF+JlTEZnYmXRrVJcecmo/sZ+SDbjQaX//613d3d2ez2dnZGR+KrimSLQgqKxWNieyTxpKm6Wg0gp1ds9m8c+fOYrE4OTlZrVbD4RBbD7cwjf8Sa2NLPh+fVszgcGUND0kRzeh2d3dBxKa/H1QmyCAGbRw8XGtts9mk96koxiJFVPEWUG/oR6qHKzNVPOhOpxPYfAFG0VkZff8gTA8dQ+BH5+fnT548efLkyenpqeb702SvbLu6tU//Cw/n/UVJZrXCE8R+gU/AdAC+j6IOBgb1CgMZB6blumwpJYorRXX5SzKIG8VBNJ9kQ7nspru1slvWjNLasqIkJohBsDLBb9Fwhlbg2Yr4BDBxYOFF4Bv3RMdRejVm2xDvHlw3EY8hmsIAxsALAksijFqXPBgJ+mKD2rZ+MVsHWB6O4ySOswCOv8rMM6Bja9grAIzkstJuQN8WpQtc9ltjsMQpUE3TdZ7XqtWXWayNMdoxlmOSh8amNVarH1wAhPF8LkEZRb8O1m0E2Fo4IlgfNPgbFMmC5n1tAEt3EASHVE8id1KKVgDyOXR5g22LLEGBIEk4eL1eAzWuVquz2QwTX8NVeBdtgXEDtZ6GXBZxxuJApsIXVp2vgiN1S/tV6x4UwiLrxLj5Qk7P5f2P5K/+FzM+FreW3JvJ2p6MouPTaOXEV0TiQq7UqqAtKkgQgIZzESfeeXFSAFEoX4kx/hq9mi3L72WZ3Rd3LIoia+VVYWp/n9CwPu2rVD70IqA9DIMatihp6WDj2FpDosoT93Q6fmOCwCMBGTFegI2j3W6/+eab3/72t+/fv4/8lN8+m80eP3784YcfHh0dxXHc7/ehVnz79m0EYzRcRcUUvgu608U5Jz5LszTLrPEmTuK4GpuqkapIVWxio9gakXS9mc+z9eZFRszQQjuQB42nwa3AfEdOB0oEzw3VVji366UAcTIrTCx4U5tLc7QxxVDXx7XTD0MjD7pYzjjtBQshigx221dCIo5F8mKGpgVYnBYAsRFBvdIVUxNixGlR7Lk5bo4bgPjm+ApupQAc2boLTPP09PTk5ARlTNBqer3erVu39vb28Hoo4ZKoxRhLr/uac8qoqxxTIiUDrWk6nZLSu9ls7t69i6QaKQ03csKvbE9DTot+YSChCH+JVkthOUWmMPMBTWpgVEQ5JGit4ovYSoMD/wS9iDE3ECKc1WazGY1GwD01EYbaVWTAaYAYyRszVSCtxDiw4bFfGJlzs9k8ODgA4Zp+IET2IZ1BMG65XJ6dnQ2HQyCwGmhjbsD8s5yraGtBwkz8JYwKKWON2448BFu7RhBY+wVJtl6vY1ABZMelacIpbgIwlOFwCP8ljq4XEdXNxP77OZwxWdHAS7++drvNyU4TSwqbYEYEQTkpWqTzM7YLEvKXqW/9btfCQgXIHZg4mGugby+XSwqt6KZdbRXNJVQ7IwXdsmWZP4JxYJGAczqfz1EX4XTb2kwQcMdeSSql4RWy+Y6PjzH73nnnnVu3br3xxhsnJyePHj168uTJnTt3kO2DsMnFVkSwUmHxYeMwvyuKImjZsyioU3Eu71hvQQMBiRg9/pAUoD4vVx7NZCTVmqYlYM7StgWupBAsBsANRV3IFIBQrIVNREnucC+jjB0Wdg5jrlF4AdD/Wq1269at119/nbQgal+AcSyX9dwxuVC3o7cShTWI8vR6PaztVDPQCS1TVo1fcw8CuMwsl4q0gGUnk8lwOMTdwHSuVquLxeLJkyfPnz+HK+C9e/cODg6wvUKYGKoaOp0OsJLfrXp9/aHhqkAVQdsklotMUrJ3C3DDMrAYcFG5JhAgKFM1ZZu2RrnLp8zQvGp9I6srgJ+Ir21FpvRrNACnVaT0WZVbvrQWhL4Jus86MADc5pN2kY9fPttLwBnqlWDT8k9s1EIZ9HrpEu2rIVfojQZU661RsWYMyGUifLkDPcAcuZZG6mb+bsG5PpmAZltWO9WyG3K594vvwlalDwbqgUCzloQObOhYMONGRtIfFkN+LDZHoEJs0dM9GWW5DD2/qBehX0NxdkLS2Md1dVCRzVNgzdyp9ZDAs8PLuLDzoq5BUa9pB7y+MIa/uFzWqV+t3dGxPD6Ujz417/3Wnn8u2dJ7K1lk1s6sUnEVEQDE0WXdYVP8TOJwLj73LvfO41fivTgnqKHoOful4qvwAr235d6yr3aGe/1T08s1AdBgXgdJa9BCGoxeXZjRoWBg70mhf13AI7Jcvgrs2pRW5yyjwyS3PxKJeDq4RI8h4b3zItYYYy5GkRFzMZy89857l+cuqCwGm6PmWQfkdN22hR+4bugypNaW1LQkp9xTmC8Em3J5tw1O4Pp44+J5Ff99NeNsJQJxwFQkEkkKG0lY0q1EOiIrkYqIFVkXf12KxCKbG/Xhm+MGIL45vnoHVmHUA5lJghA0Go00WtFsNrvdbqfTATxXrVbBaeVajLiTQSFiMlJKebCJiRsJd0r2cXOVZ6Kuvdq5AehGSBCIsiwDpRdmPlQ91mbKuuWEpDzuOqQG053GGENxQ8AWuqUaCCw6cwn4gvQEsOns7AyMMBZLNUGYsSkBYnajs4bMyiphdzTyw4JvOBxmWbazszMYDPAWQg9o/0dLtcbBQZwcDofogy7HT8Rk+TQ1DZA0Z322fIi45PPzc2glI+hh4ZfMqaBVVkNsWZYB2edtYc7DsUGLWwpX/c5p2M3xpaLtWq3WNibLc2ttu93e2dnZ3d11zgExPDk5GY/HQLW08rUOCllGQk0FsxUxcaB7fg0pmC1muhWOi9UXZj5pmkJ0GDYa+MbVaoVf0rOx3W6TPccJizMnsAL2PapEaINldzOjW0o6ogef/AhjDARej46OPvvss06nA2NG4K3AXrUo51bQ+fc5iC+wugNNxs1mgwJMq9U6Ozvb399//fXXP/7440ePHh0fHw+HQ6DkGkeAOgcqQwBw2Y+iHz0KjTAgJXdYawdtNhvoMuNzOp0O+kggd4s7jNoYXs+NKYoibGRS2BKiRIetAReLAiHz/0ajsbe3t1gsxuPxer3GfwFkaJ6yZtfqHlJuUqw4YpsQESxKgKdRRLlz587u7q6IoO8Sl48+CbwFuxU2lGq1OplMNNlcEzBx1Y1G4+Dg4ODgAEXcgE3JrIlaFiICehGkjQEVkTyIRhPS3lHkg6BEmqZJkgAFnk6nEMv+9re/DfN00IjG4zH419rQRufbzBVfclw6/K90lKmpgc9YOeG/hi5aRv0CSO6qFJSMJA3MBecZyAqXj2uQi60vKDdHBxIH3Kz10NU0yfK7pCR/HAgLaLxDO85pgt616Ixewy/8XLla6wz9AhQWMV6AXaA/3nnvvVgrkZUoEhuZKBIuGMa4oKKm+bZXPesykFf+5zW+xNcguVsA6JcjonrvBRH41Tg1ZpBW7pLLDOJAoEOL+LOYgfgTC7iWGSFGA66G7hHU/lRaoQJtBBoVonIFQmieA7nnOggsi4MHcm1aF1g/GobBTApYreRj4sqAnYKchnJoAfQNewdRaYbB1z2vEhC5xRJjG8TsvaSZjCb+2ZH57LG8/4F8/Kl5/NTMj8RvRIz4mviKuEikqqDhSzNJxCgGMejDuXfOuzwX78RcoMNQAbmqAKZLTWWQVAdXEDOW36Mk/7/m8aVOsgyFbzWvK28WV63ngeVvWbybRB/GDyiisC9H7zWgGU2nU8Y2mMWMmbVkfJ7n3ktkTRJLHOUIAbwX7534tZFNbOJq4jJjokgMJa2ti6yz1lkjhYj1C+pPsPIzsg0qlDpD5BKhoyYtdM4aXlldnRt6UIncujgzlwyKkYH0U/mBvuJhXBNZiyQiRqQqshTJRVKRpshSpCKyFnFKTSIVyUQqIknxghuM+Oa4AYhvjq/UJkoAgmwvmiBRnZD4HVvSQKDT5IWgLqotyKRoIg6c37XGMTdRbhtITWFNrmNZoi1SdKgheKVoMkhYZArrxk/dTMR0i8imxrUZ/oKMjPgS30J7H1wvEC6qK2BHx8twD5Fma3nBgAOoDdaZRWsJVL2VspeHbT6gTrRaLQ3Wc2cFBqel33h66PoJttvAA13rcxGlIg1clI8t8wRAPGj+ZR0Ybi24h2Qoa+VH/qwbPHWyym1et/GihZCc8a2D/EOR90UWxThkMeCiOm0MjLD6g8He7m6327XWLpbLk5OTk+Pj9XodJ0mr1arXanhSi+VyvVrFcVyr1yNr641Gs9GoIqpD8xCa+ooIi+lZHEVJURXAazIw3XDDrXV5niINcy5TLB4jYqxlOHhBvMVEi6IqSjJFtg2ul2dEW4gaf+FCgEsD0VLX2MW53sOHjZMTW5DB9/f28ija29sDvnbnzp3BYCAi7Xa70WgcHR2NRiPy65vNZqfTAcGHqrLAzihqCY1aglkUMeQY2KqXV+781a4jVx1ELUGiPzs7Y389bJdPT0+BEgIyazQa3W4XK0+57QBHpVLpdDrdbpfmcpiJXP1Qb1uv12hxwHSgDsxoNDo/P8/z/KOPPnrttdfiON7d3R2Px/v7+yzdUZpmq0T473NgGdE6noCw8UVpmp6enj59+hTw9+7ubqvVgiADFDbI659Op7CwQ5s/kYUA8cfrYfuGJkTiBXzcSIeOjo6wAeF8oN5Tr9chRAONI8xc3vzVagX0E8K+KEtoSBEjFkJG+Hy0XNRqNTR50BhzK4Snl1CuV3pJF+XloiUItCy7bn6n1TjwdKiIYGoAR47jGEMxgL1YmNzb20MNI6D4sVFawyUo3UHBEM8LOx1GdbPZxGDW2w2w+Pl8HkURbjtOstVqQWkEYxgQPKErnozeXHQJ9ovRYecy9MxuNigEglTOp4mCxHw+ZwOvdsQNBLVZ8S3LMgQYnFbPZzAQ+NFRi4ZbCZU6oMjBvVUjVhpt0epbnIbc9AM6f6APoA0hdB03ALwwVHSXkgaIKQQpyo2AX01kkNERF2rW83hz9IpUFo7AOu090nux1ieJLRjEonBz0IYvwC5/8X8XH+acz603It6JeOO9cXm02UR5XhHxWWYDRYuyclqZ9x348gXjQb83qChodYVrigoX34t/vjykhZNX7e0BLKWDn7K5RYBVsT9ACodJKfrfNUCsbZ8ZUnLtxQJFTIerGcJsCgphNWbUjR1TL4C6dU+PfI3D6s68soNiYC+p+cW4KIqwUZMEMLc2LdSIOZ8gdkC6V+kXlMOJrb1B5TEg11J0nZfFUj5/Zn7+K/PhR/LbD+WThzKfSyoiVv0vEUmUH92WQVP814lk3uXeZc7luXMuMj7PTZZJlsEQzwQYsVZX2Eob0u5kF69hPeerjRGXQdtyGKn5vIE7YlAc0sNAP1wt5aS58IyjtKQPxzCoLbRNxvgfDAY7OztvvfUW2kB1vDoajQ4PD3/yk5/89re/PT8/FxGwkZCPiwh23qKXFyQkX6lG1YpNYpfnmyzLnXPOuzzNrLhqUm/WIhMntXocVQy4rib2JsqtyYzkBj6HxlCJiNx/XTxAzKZ7iHUQXq/Xe70eIj3EbMgHobsFDWXuI4xVNIsCA5V2QdhS6VvD3YrdXcy2sMIg3yQ8jTPUZjlcaV8Rd6YQF/ZKYkJEoGIIA8maSCqSFEITleKvViQWmZRsc26Om+MGIL45/gH5gNoSmoklWmWxpkOGWArB+MFgAEUk0MeIz3Khx+8pxKkbgbVdMiVuqQqkleNoIQXpSTQaz2YzNP+K6h4ljobcHlEvICft2qxdL+SyD0ZFw3aKPqyJsThtUv/4sYh6dc8akismtMxd2TvDbFDviKxz6u42JjA6gsGt49YINSsR6ff7yNx0xyj3Sx0VkS1OgCPQ4RLFK2cMzbSWoAPpjXqHDjoftR25RngDiSh9A3Ugi9Ojc7p2SuSnbWV46eO/iPzfRJ6jyltoWzvvXZbFSWKtrTcaX3/zzT/90z/90Y9+9ODBA+fcw4cP/+qv/uoXv/jFYrFoNpv379/v9fsuzyfT6enJyXA4bDabu7u7cRzfuXPn/v37t2/fhrRommWb9XqTpi7P8XTa7TYa6pNKpVarrbxfFXIlmzQVEZBpkzhG8/u6gIpm0+l4PJ4vFuJ9kiStdrvZaNgoajWbzVar2WhUq9VKtdrv9Sxdlbx33ucF6IwkQF7GWUVkMZs9f/785OTkIqdyTqDl59w3/4f/of5f/6sUAPG9e/fanQ64DAgE8dSoODwej9GtWe7FJrOAXa4BzqudCYlebSXysAolL9dThpctFovT01NQU6GaChkTEDnZggAoBMrdWAADSFprTQIEhxQaNIXBCcUZgqr89OlTyN1OJhMpbO4BHIPIb4yZTqeVSuX27du4VzhP/DXQkw0U8V5JNkVbD9wo4AIQo3///fcBIrRarf39fREBnwWXj+GKD4E0B+FFzRbXCjagr0KxBxixKMsgdEUMh0PSxCA6ISKdTqder/f7fWRZSZKgc9l7j5aI4XAICjYKmRROxTqMahas2IwxeFLWWsjs0m9Tq+7ghmMvKw8zVODIaNY7iG6dyfN8PB4/f/5cRJrNJsAaoDCEbFDJw6KB08aGyzIe1z0K34M4jK8WJdAhhba+3juWy+XR0dHz589B8Mf+S615Eo1rtRr5Tbi0Wq1GySAcuDRA8CKyXq9BKofuIe4nlUCDPPwlxyTSyOl0ulkslsslcH82OWHILZfL8XhMlRjEMFwTdGaOJ0tZpzKWqo0ZgzoQLQE0iMbNi9MHtGuCawCnyLu8tNgWUCYVt7kvsxyClTbQGibexw4kXlHQC69x0nJXr74tLLJqZRhtloDpgz6kwWBAd3gu5roXSj/BYmX23ruCvmqsNegBE/EvyIiXKjGYZaJqrMY5k+eSZSaJo0olqlSSJK4aA63wKE2d98Z7xyU38JiSkmrBVonhcuVMrnaBCxBYXVHQghtGJPY+gPivXIed88bgYrQDHk++bGJclhkpkzYY8fL1pPdSGIdSMBiB9G6lsCkTBKIwWH9AxSALBLE3ve/0heuRvBVeF6UBTYA4oLoHmYvuPsTMJRiEFYxTDAsdBfFZASXxGfORN1wDxBpK1vRSPbX1w2K6dO2eK8uVPH0qf/N38t5v5MljGU0kj0R6BdhkCycre5ksfBU67C8EiN0FPpxHVryTPBPcEl0mKYsb6FHNP0lJRf0P69BdZdvlMrZRhjXXXr/lmpW23MVCk0xtfMo1GSwB7KHYc/f39995550f/OAHb7zxBvyK8eL5fP7w4cO//uu//rM/+7NPPvlktVqxJZRngiopYldrTRwn1Wo1SeoX4r8p/pI750VMJamIbSXVXlLtRo26acSmIb4qmZHlxi9X3ibeGIkiFHXiarXWbDbRBcj6NKpB3LbK5jpxHEPvi0aUCHQReyDoIicAgsWYcXQX4NaGKI4eFfg00hoQO/FZcwKCCEIRf11YfbF4iuTeuy9v2bL9yApecFRIDzuRRGStjCUBE0M9PCuKQFAodjdKxDfHDUB8c3z1AGIkmSzNARXNsuz8/Pzk5KTf71OGeHd395133jk4OEiS5Pnz548ePQKriCkxhBGBESNdxCcjoMQ2Q3N2Go4jT2blUHOXwEYEGMG8CBsGI0I2wQFugOADNhts0symSHzmlk+Sgk5s8DIixYTRsRHW63Utf6G7dHHO0+kUfke4xtlsBheCQKWB4Tjgb16UNkHmGVLFlRskwQvkbN1ul8G65kFjf9VEYMpKkt9RZkixNY/7biANgd0X34KtGhxe5s98LtiViWfhSQHUYIbGbZu3lKEDiEsgDzLxQOiPHCawhSkfK5GxyKmIiNS9rxRDPy9Q8EaW3apUor295ODA7u6ul8tJHJ86NzQmrVSkWp1VKnGS5NbOkmSaJKtGo97ryWBgkiTa24v3983Ojq/VxBjJMr9eS5qKcxJFUaNR7fdbOztsrpxOp5M0Xed5Zq0rcNI4jl0UreM4NSYHNOP9ptmUKErR+BlFcb0eQXaj3XadjrTbplYzlYr0elKtEgWOvDdqjJmX4A5fZMJJ4larfLPJCjjSGAMbB1epeLKorK3X63mrRRFYPFNCqKDcQsiVtHrt+qWVKxkU4jnqLlciJhzSW3nEnMhfTM4SQSP88fExORfL5RLcXkAkxhisHkDrwJtgKEzUADgjphufICa+VrzFRB6Px8+ePXv8+DHxLF47TgCEZRR49vf3wX7dbDYff/wxKMlBZn59OeT35BFzNSOMNRwOf/7znzvn9vf3cZ6VSgVaHI1GA0kIAFySnak/w3VSA3OYquCmIY1HiM8FFg6BsDokzxoqB8BMW60WxBkwNubz+enpKdIkUnGXyyWqFwCgmclgpe33+zs7O0Aej4+PIYbT7Xa5ApNXrn3ngj4PLjtYzCniT+wGCymHweeff05ZFVw+aPVafwnn3Ol0MLoGg0G9Xkc9gxqFWPDxscPhEKs0aOwYuqJ8xkgJxDgcj8caQ8G3Q+8evgK84dhi8HWwfp3NZqh6wk4HI0FEoE0MJQrdH0qfKJrzoF7yMgMSnPRRkqzm89lshkYiQK5SdN1i8oJ/TWhY72UsAAc8xLJQA6ekplSLsq3jUoYNNJACx/RZFwfdewKrNM1c4yrHQytNYcTqzJY7Nfd0boVlfUaNEgbIiOZdslqMSjYRbQKs+C48a1gsQkWnDPxdR5Z03pjc+9z7SAQCmt4YdW7+EgHWGOedEyFC7O1Fq5uNE+ONFbHORVkWiVTjOM0yB3A1TdMougTfsPSusQMGq8SIg1KZpglfpaFBcE1LMOtl4SLAM6YiEr8kQFwwiGWbnIiUPBWD927dH3VXDRdkfe1aYI3jEIOT/+XdkMsSEFhLCRCzJYgujhp/DKC6MqFV0y31LdVwf/nSWG3VahsMNZHI+MtKNVtryZyVLBByHdMnoKmmgQsip+rLVWUlz2U2l8efy8OHcvZcMieuJ1Iv8CpfUAuJBZtt6LAJagzeOy/OiXfk+xZqq56wb7BWlAfP30eM8Q/IJr4eIA6kCa4qvQSiQ7rUp4ugzASxG+oyDD4N+z4alTTL5/79+2+88cbOzk6e5ycnJ9japtPp+++//4tf/OI3v/nN+fk5UiE6N5Lyj30ny7LIGmu8SCXLOut0d7Wuz5eb5XqR5Zn33kSmWkvssuPmB5v87th10mrsWyav+uEs+uhxvRs33ryTNuqbRtOJGGNttRpF0QuJCd0nGrCJeROYu7H7FqAwIhPECVCjwkxHqMMaFaJi9mAhOMEPsKhB9ocbSHKSbq1Atk6jFO18o41DhAziVzLOM5FIZCMSFxWdrFCciIv5C1A4L4BjUwgQ+0J94kZl4ua4AYhvjq/OQaITOE1E9MA5gk0NSIJRFHW73TfffBP1vadPn3700UdI5NA1nOc5Xlmr1dBUQudxpmoU4KfQIZhBOmUNeFIkOBDCYC5NKQMATGwGR5CHABdtyEDo2B2p47nAx5w6xQyp+TJKWAYOvwwWARKhUgqQiPs30VVykMkYwsVCdZdBG/Z7qgnT+k/jLIgSwNwEmCXKeRY7q7aNxpeiJ5ccJU2XIPVMV8L1DySdkfsGgBj4CP1q2XUF1h7gM2ztlHKmP7vu0qXPIb60Vqv1+/1ut3vr1i1gxGgJpwAxBh4f90vGi5qAQy4z8zo22GqsR5MKqarBJk0SJNlEr0EHdlxykGvJaZ45CSk4DXJwNBKxVdSsXPL53WLoID3Y6tCCaWMvS7DpeBF5I2aKbh19QapSc43QGxk3+lYzBNSCMFcVul6GPkw7OIwcGjGTgUivs1pxaHw2yJDZYYAFjZAfPgpvQSM83M90Gz7vDGpImBRQ5IAqTrPZJCZV7jV+tXLbrAxx7AGm7Ha7cAddLBaHh4cAE9vtNtb82WwGwVxUATmqsYTi1mmdHA4D3bFBtjh1dcjH0aMLH4vbi1yr2WziNTD3G41GWNPIaiFegDWK2C6eHa4ODwX02EDDV8tEaGoeX4PL1JCKFtrTgsVkRiOLY5lEZ6FYFkjmBYiMNRyrB0SKsCQiocLeAeQ0z3PccKyQFNnHrcAIHA6HkMJnzob1GWsX9ohAZ4CaMLoCCqQeSBD25cVi8fz5c7DmdWu/BlO+1KD1Ips0PT8/P87z1Ww2m83G4zEKAJQuxXRDWQJbCcq69G3XBeBgTw8WOs1YDBjEmhOqXXR0xz0fH4nD3OOCVnoNRbEQq2nF3IwA09OulkELLhPseM2J1pejxUPLaJpO7Nn+RWUMWgXgqrEY9vv93d3dwWCAcgUB9EBB8gqAEh7FNs9tlkVpGq/XPr+wSTJisDh7Kf7/hUGSA+xyAYM5Ly7PcwfdJRSeN15Wlco6ijYiF7pKaZpCyYzXmKYp9JaMEa11wPK/JhFrhFQLkW3VrwzEOgKK94u1WiRCPPMSGAS7ea6Red2mZuvLWhMBaiklE0Up2XMFaJpGSHXvfBCBaAkUTZjQALTWUdH3uaxvsBUCvmbr162BlNnRLhpls7ir0OHA9DKAkst+huU/BZj+S2FKuUzmMp1KOhMPlWFokkJTmKuhV4jwpVCsPD6uGlkvHus1BXVdDvlHgA5vdacsL8XlSVGeEVud7oL+jMAakWJEuh6DIaqlTrBngdjUbDazLJtMJk+ePHn27Bn6Zh4/fgx6Aei0cD6AsB4HKvaFJEki62s1m8TRYt0fTt8aTe8uN2YtGye5iJjYJD4eT6rPbDuv751suqso9h3JvDkaVv721203d/Uof+PBolnPvLO5R9DusiyPorycGmhBFUSzvC1M+UEPwhaGTB+hwnK5ZO6JbYWJKq6Ook+4cKRdNIFHURwUsbIfqe6mYmlEi14Kelhe4VETqYhEIiuRpshCpCaSifjCjK5ZqA/HIstiRq9EGiIrES8yv3FXvzluAOKb46u0g0qhHbFarebz+WQyAdSIGh3bV6Xwp6pUKr1ez3v//Pnzjz766PHjx2DIJknS7/c7nQ5EHgGRQHmW2wDN7kEnxA4BgIYgEXaUKIp6vd7u7u7Ozg7yYTbHNZtNpEx5nqMaiYgciRM2DDB2ceZgnOFLsYnqXFEnVNrOhdoIgeYUrkUu+9viG1EmPT8/H41G7LMm6KlxWymItNzk2LlJDSbN87qYpQX3Gbss0xtglMQ3ESuQZUYqH6EoAPeAe5hIM0Hl7xncYyQQxyHugxeTN5emKb2SCAMRViBYH/gPSNHiijRVS3mi2f/WrVv7+/t37txpt9usM6N0AU0rjYC/TA6mAz6SZQBvgVE4Ho+BRwDR1kAJxpiINBoNMGUgw6dFmYEb4kGg6K0rHPrQcBIYkTrW1DwaHcvyfMrSk68kntZRtXPOXGbcOOfWq9VKuVOWWRWaWRaw28pmR+S2i+rXI7Lmf1dHFA2OYJSiNIIpgOoLACbMJiwOjUYDHEzNSuBlEqYBQEblE9ZdSMGjpAyUjk9PT0ejEQtFpF9F6mDdCwRSlEM4o/XJBM2Mr+S5X9DYncNaBD7Lt7/97Tt37mw2m9/85jdYnHd3d7Ms++STT05OTpIkuXv37u7uLtIeTF4uEcy7aOSNNYFkTNxzXaHRmCxaB7TkOr8FtTR8AtSQUY2jGSCBNvCU4REXAByUjZ5MJpS6o6RyIE1ITd6gmhXw7JjP4KLQ8cBxtbu7e3BwADkgcotarZaU2PEkuWjYBf51+JnyFBClAat3s9kgzyT+TnloGNNhzSd6Rd4fyiTYJoA7U+1aW/mhLUBEILlz9+5dYPTL5fLZs2dPnjxB1hfQ7nRp50vMZe836/Xp6emzxWI1mwHgBqOKWJV2HeDjQyVYI7ycaGWkgMEPW4UIE5cJZVyUMNkpbMWFixITWGoIJW+1niN2r1/ASY2yLtYiCLtzJ8XmjjISrVkDWE1Xs0SpKwRQHU5VuxFoeR8sRN1ud2dnBzak4KfzZrIxX0vTinKlAyZ78bXistRuUpnN5PjETGfW5QWpCid1oT7svfMuz5137kJJH3NWnHcOuHGG5SKtVOa12qJWW1YrmTGSO7/ZpHF8yVIpy7JCkP+Fe4Gu3W4FiFlfuYp2WlbqCEJE7p7oPPevNFy/Zse/ykBPK4AHH3UVH/kqWFy2eT8GtQe5uuNnq2ivXOEA9pIwZXn8/25BUaDjfNULtqoWlDWgr4FZoaCS5ZJm4nPxXi58CY1yojMvLUjqLxiI4A17j/9cfNE111LmR2/V3JdXbuf1vxY0HJQHgnESjParvCt1bB/UYLQ/iubC6xWY5W0uEShhNpvN27dv9/t97Np37tzpdDrOuaOjo88///yDDz54+PAhrCkmk8lwOERFFroNiDaZjZKo671ENk+S1Ln69GzndPLG0dlba19ziZP4YjW11p5NbJRGvpakcbyxkW+afCXno2TxrJ1Oo17Vi6vsDDZeTJzYTscbs7bWi+RRlJR7PXWdkqqSDMMYByKwhFsJOAfMgFBbRdyiuTJaVAcxG8hS2Hy1F1FAKShLM2nJ8hcvo0D8KxneK5FUZFNgxJXivyKyFolFQGBwIqlIrXDFEZGNiBFJRSo3KhM3xw1AfHN8ZQ6tyIbeyeFwCBYSS3OBGTRi4v39/W9+85uffvrpfD7/5JNPNptNpVJBEyIAYqDJ+BnEKDrh7O3tNZtNaE3C04nt6tg48e2vvfbaa6+91u/3L0RjnQP6xu0QKgdRFLXbbf4J5GUCmmTXglcVeFAEFAZCn9x4tP134NytYw60AgFePD09nU6nOnWESilduUBnA6AsSoCSwAr78YlcA+Yg7Uj3BWsVPEQe0NnY2dnR9CKKJKIMAPST94RQKcVAoKhL7x2IRgU1eWJVCFYAfwNTACgP+jBQJ/JqKYus5eFoh4Kcn9rWUDUBDoXoAX+dTCbn5+fz+VwK/ZCXjGK10hyZj5Dxms1m5+fn6/X67Ozs4cOH8LACIx6gHuZFo9HI8xyxDnrVO50OesZxgWBd4VloMb7NZgOkBi5ebOZlmEV+ImVbKaKi27gQhGnbpVeFEZP/i0dzUSNBGFfc2yzLTs/ONgXYF/hS6vjYXj6I19A1kcw+TRQlVPF78mR1ZIkBA0wNSBPYiNB2wOIAdfVut4tJgfOBHxcplrxkQP8Y1YApUVcAQRh66PiK8/Pzw8PDJ0+enJ2dUdMTzFw0IqDAAGwOSxZQodlstrOzgxYB8li1CM8rxIhxOVhzqtXqvXv33nzzzR/84Af/5J/8kzt37hwdHaHn4K233nr99dcXi8Wnn3762WefLZfLg4OD/f39RqOB4grDcYxt3f1H5QSSMaktjodOvREMQjS2E0rDxQIPpR89bu/z58+n06mIoIGRuKFGKjUwSoouxMGx3aDk0+v1sO5xXcIKJpd71fW44ivZTAoSer1eh2ZFp9Px3vf7/ddff/3NN9+EvCBqElhSNP9Om65gwURFAUIrqFukaXp+fn56egoJDtwW6C1EUQSNZs4+bLKj0Qiy4HrbQu0KQxfnU6/X2USCXQmLknOu0WhkWXZ6euq9f+utt/71v/7X77zzTq/XOzk5+eSTT372s589fvyYp0qNgjIq+vKDdrVenxwfP6/VoEFMfXDWEpiZU70K4jC009ERjmyTZyU6zNIFscWATKczXr098XK4UZJHH3jQlcEjzdDUwRXCGGABvV4PhSINQeIFevEvr/8alw+APIpCkoKNAIy4MNYoeD/u7e3t7e3t7OxwyZLLOgz6KooSMkEWKDBIFBlrZeVNmtrj0/i9XydPn8XZyl6oP1rsFgS7fO6cOOdF/AvyZOH+uvE+dS731frm4GBy+9a42Zy0O6vISpr59bpiTRTZiBDwxbQVcZcJ2kGFMsAo9dPhShJIaQetbGXH1IsWsSzbOJcXbswvtQtfjYpehf9eD8sGr9TsPylR+wMKrWa4ixL11hVN7URdLhVrgnlZsZc4TiDqolH+ay4/oHiX8euXlEoInOXCGvnlgF+XaYMyjJ7g1toossXqbpSgtqSpmc/N2akZj0ScxImYqnirxCX8ZeKw/uel66c9nfiNuFSyVLJMUJcQL96J8x43SS6brJah0gCR3y7Fyyf1lecX6zxFo8PXsIm1HUswp3QLkbusA1MWSxHl8ofFlhRapGl7e3tvvPHGN7/5zdu3b6Pa1+/3e71emqaPHj367W9/+5vf/Obhw4fQV8TnQLENuxsSVZRFUUdko621mZHFah2fznsbv7NIB6lUL4QOjJI+WIo4kbpITSQWH8vG283cfrps/mUuTx81es00qvjbd9ff+86iWllXKtl67aLIack4BCTsoYQJB4IWVHPJh2DLXbfbZcsOSFSYdOv1mnucFoFk3MVeDRbgme2iLZWtRSQHBCXAYB+8AIij6JWNY5hJVkVswRquFj0BvvilFALEVqQmYkQSBcLdONTdHDcA8c3xVdtHSX0Cnw54H1vgr8IUIJaPhmg612tsSEMqTCGQe7RaLaAGw+GQfSLYG/BPWLTv7Oz0+31sAGwWpsIDXoy8hdgW9g+2S7PJhYE709etPTJB5ZPZ+9ZGUR1v4b4BhOJ9kELOHxAwtnNiyixpQhoC+BFJc5SsQoSxWCzA0QMsDmIRBZ1F9U7i7qHjeKtvLxnKDK91u7cUWnLAcLH1aht0UY23Ot3VMDo4UOChEyAuCxdod77go6jmSQoYgSTUz3EJUhLau/5gPzJuXRAxw2EMeAruM3BAKdzYeF06jKZWBscw1VFwG3EhsF0i0gHSH0MZjGGNsWoVVI1DEZi4xmBHP9aXSRqlIO8DAsDZXoxDYyLldJfn+XA49PV6r99n7EVvLp45mgMgShP459CYWGtQgEeg2/BRFtJahL9DesBPhiAJnay0VzLM6Fqt1u7ubr1eZ986soVmswmlXdwcJMOaVIi5TDl1znoqTnBt5IrKTgJjTL/fX61WwD1PT0/H4/HOzg54ggDssPSxBEIntFdF6qHKKqpNnU7nnXfe+Wf/7J+98847rVbr8ePHH374YRRF77777h/90R91u93j4+P79+8/f/58Npu999571Wr1wYMHbERg2QN4N6N2lsfoi1VWD2fHOscG1igAoEB1MTDAmUUPAY2tIXnP3gWCtpi2lHzF/CWaibUUA2B/f7/b7WLOQkYD7Sl4UrrnQ8tnl3NvDO/VatXv91utFhzw0PSA7S+OY1wRb5Fu1qYERACqYmosl8uTkxNICWM31Mat1CyiQSJ2Ja2Hq6HzJEk6nQ5eMxqNnHPtdhv1LSrXwy/x6Ojo8PAwy7Lvfe97//Jf/stWq3V0dPSf/tN/+su//MvRaCQi3W4XglFsspFCPabsKf+F5Z0sTSfT6Wi5zNZrXkKAqJI43Gw28RAhDqM193kaul9eY8ca8yI6LJcN5ejWFaDDut9F08mvB4i1ywK/hafBy+l2uwFAzNiAGq+6Olj+Lrns+IpX4uSx2CJyY60a9QBi0O12ezAYQOIJ3GFdSMbXOOfgf2WsGCORtcaKkQt1BWPFGkkinyQuz0y2Meen8Qcf1D/8uLKZWe/ExEVnvYIBnXgx4oEPi2JWenEbL2sR51q9TZaZdnNza3/VqGZR7DapGLE+d+Kd97kRZ63P0sx5Z8Q459EmtEkhrm0CXY4AGdSOEWURXi08UhZi0mMmy7IUc/ylR/7vYAv2MiLFVGMoF251WZcDmMO4LLzO3RARDhXkUaphRfwqzwBGa4wENBGe+5GWcg5Unq5iumh/Zm1hp2t7wXIUkEaZC2j1gK3yAmwrCeQFrLXG4KtNHJskljgRY4DvmjyX2Sw6Po6PjuNPHkaPPpPFTLwVUy8AYlNgwQGDOMCITfHLXGQjshLJZT2T9dxvVi7NXJ5nWe6z3OQ5TOq8vvNccMrdk2VB8/BG/4FoE5elh8sKIVsFW+RyV5zm0DDG2yrYEiTICIewcTAsRBS0t7f3zW9+80//9E+/9rWvoYSMSO/09BTWPk+ePDk9PZ3NZtqU5fIYu4BZURlFjGqttSb1rjJfmkajUql7W/cX4rZxAU3GIolIUughSGGPVhdpyWwU/eo3zU9/XasYX2/lP/zB5PX789u3U2OyLIucM3keGWOjyOpsHZsmUjPUpBFpUwWYexZ4xNoggZQCxG/Yhrg4Y6Ai8kGmTxFk7olIpbXvK6lIZbgfecrFkMAvX1W1Azc5EsnV9IyLf8KGDn+Ff11cONTxNf5Gg/jmuAGIb46v2D6qCVZaX+8a6U/2WZPWxPfq+I9eKDTYoWwrCE1aGIhSvLRoR05CNQMmwKJ0jmjgxvPXWhDsAdfd4jqk0/BTIDVb7hsKOBG8Oq3RJpdFMAOPJiJ9+pTKKF5wtuwsxh0OCqGiZApIWZVtslllZ3PeRmzhEBWl1C+DbO67W4HyILwuZ1NyRX9xmbVBkQENlAd9TIS5tSjwS0IPNGnRGYW1ttPp3L1799atW5vNZjQagQQKMAgjFlUN0Ax7vR6IxtD3PD8/BzWeLGB2W+OuMkwBwEeWNIBFRJNQ9tSiHABEWLHnhxRxan4N4BKou8q1pCTdAkb3J1Rl4jiuiMRJYhTUMp/PzWrVUqGYHoSApRAjguaPmcgWZirVBvUJ7d3EC9cNvL8bQMxubtx56p8QeQfpslKpgAuPGg/7FQIQk2Mb+bAWdaG3MtIA+DI751jaobAAZVK5hMKW7YMPPvj6178OaR02SWAcIv7mAvvKdUWY/dVqtZ2dHWgIJEkCkn69Xu/3+/1+v9FozGYzYIiQ03n+/DmKVVLQ8wFcclVnpY3jUHth6+UxgLSI1CA9kKI9k/AWS3EUHGAXBR8udwdtEBpYJyFvabfbYOJwhcFQDBxpQAUKgAa+AK/Hl4JHTJkL+LxhGcGjJCLDKcBPxgTR7Bu28wPq1RksiwfaWhCXqSmQgaQmbhe2DI785XKJJh76EOCL0jQdj8eTyQQCU0Dqh8Phr3/967/7u78LcjA2cgYbwZcalliBF3GcrVbkImloW6sMY8+C7I8GiLXXK8szumymMeLyrspHrGWIKE8fbPrlwEmvb8EWHLxAY2e0amg0GqhOASDmiCWRStfnAoA4gNGDS8P3EvVmnVKPqOAcEA/g+rILkQdvjIjPrbgoEhvZODZJ7G3RI29EjJEokmrFVSrepcY4s5hGTw8rn35YyzbmgldlFOClMTHjX2TL5iKp9umFd117Whl0Vun9JBbTqPok8WtjrBPJrHFWXGRdZH2cxd55a0Ty3K3TxBhx3mS5MxcEZ6vBHV1mptQM+7q40+merTJHNbB6y7MsfeluD92pUyY1l4m05Qa4q2BiDZ5iKyFFV1s+kI5AFSYsOIxmWUXm2GDlQAr9E9Z9A2xuq1MidV00+MUiHwezVjLx3nHQGCPeixgTRTaK4iSBnofPc1dsQ3BxyCFlounRwQ7I9UCv9uU7iQ/xHl+B6gjmL+NYJA5RFEkcmyyRSu6SxNvIey+rpT0+ST74sPbRx/bjT+0nn5jRUDInHuhSXAz1q0jErpgOvoD2sqKx3Ylb+nTt0k2WpptNmhvr09SkqaDRRS47AQTekrpCyRaKLXEX5shXHiHeKpmth6JeM6/KcMv8IU0nl23kfU2gYUbDKjL+BBdfGKvcu3cPyhJwiD07O0MfKngkIKkEEbI2whWls1+pVCJrjRjnNvFGbCRR7EzkL0aULQBi/DMqfikFLhmLJJJ7mQ2j2TISJ5Wqe+3ewnlXqaRxYjep87kX8STK6ytFFMFERsce5NAwlWOWqi+Nfpi68StICfUQxZ2kkuGXEs6+mOOvkmdXAMQVkbS4yXmhLxwVIhJ1kaVIUiDC0J2oi6wKKvENQHxz3ADEN8dX5KD+AyNFYF5Iy0mWKb8Rzm87xQEQDfq2KGZSZxPhI7aQbrcLJX7o8GJvA8sY59BqtaA2izacWq3Gzk1REhAEtnSxMdhFAHZQ2JewsgYgGIzSiYgmLQyhWLFEWkVeJ7miwNSIV+Ik0Wyu+4ixpeGVtCrils8sjsCEZpYhacfdQKqsZTc07Ygqn1tr4wHpSbN0gWOCAwIZVootapXhgDOlObyaeUEKti4F615UjiL9aRRGpPI1eExgh7FODlochEdpYpB9qS7Oy1IhURRB+WR/f386nZIwSLCDMQ1kGXd3dyGLCWBFRJAsURgEZFWMefY7M2tiGMTYkScfGFwQJddweiXZ1JJNZNw1hLyAJ/iF9m4Ap9AXj6FFNLOGmEwlwJvNxhYMdO3iqA0boSoOKXBMczwsJJwEpwKn+IBkJyWB498HACVozvwTqwdD1eVyKQXHXFT7ucb3aVGlMXECxJzX/GRI6CwWC5BeKSCjoTTM+vl8fnh4+Pjx429/+9s7OztMLQhqaznsQHj098eI8TQx99EXMplMptPp48ePoX/HlsA8z3u93r179zabzWw2+/zzz8ETpxI3xTcuYovC0pqTVPdGaKcv3flBjYUArdOCv2WZOQ0686EvFgvuYtrvnvgItIBBloTxGk6SflwkyPCcsQgTZGGmrQt1+EyIKW02m/PzcyDpEBXhEAoa9qUQPeTEAeQNjRoyjnWGryWGthJLdSMCvoKGeMB68C0UpQULmDY4i8Xi9PT0+Pg4yzLIJkLf48MPP/zwww/Pzs52dnZu374tIqenp48ePYJONGKJL1x/rsnw8zzPFGVVIztMCLU7OfsSOHiC3JKVCXP5KPOM9NQoW1dt1aUtu96X1UgDBrf+a5nwq5XKNUCsg5PA6vB6ciWZg5onq2vV+s4E9WbVIqOL6BIZZ61LYh9FEscuiZ01toDMjDEmjqSW+KTiN7GLxOdrs5hE65XZbL5wSJhr/mKnsprHLotia2uJjxMnzrhUXOx94vPUu0RcLqkV57wRk1lxXvI8iqIL9YpgDGjen5R0Boj16ABSl5l1FCqXNVWcMe7lqtf+ihpnAHuV7Qc1/XYrpswoQjMnAnCWAXBg/8i2G0a8WDSaxUEGMTEg3V+/Fb/GraNsjj4HPezZ2ZZlKfFRDHZ8lr0ITIyLo0olimzsvAAg9j7PsqRajfPcem+9dyK59/wfKQXGGLE2jiKrt3suHTqCLSITzGK0CLhguNKdEI8CA6pS8ZWKd06Gw/jRZ/69Xye//LX/9KGcPJfzhaS28KaLC+SO0HCu0OG8xClORdYXdnbW+krsKsZZn+XpZrPJRfxmYzabKwHisj8EmSXcRMJB+HtIPP+DHGUS9JdCEq+n85c1joMqCO9zMBHYXEvWC1ttqHBYZkBrHF9XNy++KIoia404I5GNvMVAtpR6V6U4/U+5XITD/IJfqJNNZjabKM2sd8Yar9chJe6yZS3SW2qwSwZnvhXWL++q1yD4vMPl9fz6p2z+PrjwUTFtk6J4g3mK38OkblOg82uRSGRZ8ItvTOpujhuA+Ob4SgHE6NZnCzD6XJBIHx8fP3/+fDwe7+3tIXTggh7Hca/Xe+ONN771rW9574fD4XK5nM1mjx8/ds5BaxLaheDBAa4F+QgoDHIVtjaLSLVavX379je+8Y39/X36Bc1ms/V6rZ3uWY9lIzYyagKvzBVJcGCSCSEINs1pXWBcneY467QKcDlpRLgb1IdFAyy5WmRBkqLFgirejjNnyK4xAg3wcffC5SBoABTFYAKXQDkOrYiHmINbNbqtUeMFKY/V12azCSFd1gnI9GR/JTF0EcHFAnkBykC3AbJE2Wau8yudiFK6gbjwfD6HkCt0Hjabze7uLiyzoOYJeU3v/dnZ2eeffz4cDp1zrVYLiDxohi8Z8wX8GmiSAs2BEwL0Z0mZodIWTY1w1ev1GmAxCIMEejBIUKLAlZL5FaT0ZTe2ACzz3kSRVCs+qchyFX/2rDVet96pJ422KVC468Dfl0fMccKYZZgmzIr1K+M49oXAAt8Y4A6sH7DcwkmKkgM+B8yCwNa8TMiSa63MX/LqONeYCFHCm/wFHeNSLRdQmij6sF49SGcgKKY/IcsyEBubzSbZ4lSG0Sk0MGJIVGt2YdAP+8qD2qCiA67oxx9/LCLPnz9/+vRpnudvvvkmwGL0M37jG9/o9/vNZvPnP//5559/vlqtdnd3d3d3oecLn1KCcboJEUUC3ciPia8JbkEfN2Ul8HSCO6N5TxRwx7YCgglWEthdAssgvxhbT71ev3379oMHDx48eHDnzp3bt2/jmeKpseGaj5vCF7w6fqDW5sMlv/baa2+99dZisTg7O1ssFoeHh3jXYDCgcSJeT+UNXBQWHy6SurcAc5O2cpwgIK1jDdfwH5Fo+ovi5CeTCZwDoLwM9Q+4qKOkgZet1+vj4+PDw8PZbHbr1q133333zp07q9Xq8PDwV7/61WKxeP3117/+9a//8R//cb/fPzo6+tu//duf//znR0dHBJUCP/GXHZaXwZCtuZ8+roJly5NoK9zGJXcrg/iq+bhV1SHAJgIJiMDVqoxHB31L5XS3vEKWoZAtveGliwreqxHkcv3p0s0U76XQ3/CSO3HORpGNnc1zECiNvGDaijeSGbNMzSazmRef+EvYBH6222Dh8jrnLuAwE4mLJBPZ5LJKo0TMJjXr3K9zt8miTR5t8miTRYTG8tzlLss9HqITL94bf/HfcOfVmldb1XgDUazyJ4Rg7peUAyrvgLrbLNiRNcgS4Hpa+wsLL54vwCnEMAxEuRGghQjlQM1+YMiNNgho5bdaLaxRfIG+ObqSqisfrOWw+hX0zhcRhcVgiyWKrPOx8S9wdG+MscZ7kTyXOJZKYrIswvPJXR7HkTFRlkVGrDU+z501qTXeWh9ZsTa31ogYayJrq3EscRxROwiwnigecXHnMR4ykdz71PtMvFOwmXjvDIBsL7kz6000myXLVcXlUWTFOzkfuU8f+Z/8zL/3vn/+VNYL8XVxLZGKSLWQMTUFGG6U4kReKA7jDgB7WolkYp1vtHx/333t9fTB3XW/s3JuvVhkaerXa7NJTZZ7r5bfoClK14RIr+FvtkYMYr/qXlocaVftO1dV2fXE102fujhNTo8oFr9mCvMOc5wzMazVagcHB3fv3j04OIANL/6EzHQ2m00mE7i+cylmlgoOULvdRh5nra3WaoN+H+X5JKlYK9ZkVpKkZjrDXrVRNbG9aNSwSv3WXF2Sq4g0L8abrfvJLP71r1vVirz5Rtrv+zhO89znOYpsAp88ti5xw4KHDU1l+CfdXsMgjRmT9gQuWwjyEegVhgwzxFEs57AMVjZB0U8fGsT2lYTTvnCiWxZcYIC/xIIpIgHg+MVIVcWeyg2D+Oa4AYhvjq/SgRxys9lA2AHt4ev1ejQaPX/+/PDw8Pj4eG9vD6V+kCuJWu7s7Hzta19Dt+nTp08//fTT8/NzqBIj2IK+J/Fc5xyEHQmmAC0C3xZ0UVCSoyhCkAquVtAarIFU7BNSiJdhC9HELn1kWcaP1eRZUG6TJOn3+8ixGT/hKyhBCEFMKlcwhiYcBiiBzuNUWMZrAOmC8Eu5fYgAal6bvs86TtX8OynaimHo1Ol0wAKWy/Re8o/wBIkpA7XHSaLPHeHgutB8JOeRZk0MuQAcgGOCT6Onk+7HBNSi+XHaq4GeVIi6oNE5mUzwAwnCZVJMmqaz2QwvYNkAD+jlAQgt7gEGMeRH5/M5u9rRXYtcCFR03thqtYrXbzab8Xh8dnYGAqaGgKlm0G63eZ+BxWDw6x5kgvUB6BPHMRKryIrL5fi88f/6Lw/aO83/Q6Ny925Uq1pjLmX+mt8UUIq+eBuIY8DZIHte1DM2G+ccU1yUE9JCNVtDYzoIw9txG1HPwN3DJ0M2ATdEs4fIm6Naxe8JDTNtpryy1tDUBEMegfwIBa8xMcsSKIQOAQvqlvMLCnat1mq1dnZ2EMViUmBZYxkJvHguL/x9IITHNe0VMogxUKlocXh42Gg01ut1r9dDOQolkPF4DAY9dFEbjcbZ2dmjR4+wMkALHuIJSPhZHKJmN+8bzCeRVKAbgGA9YFPqoqJ+QKEG3VlJKjqGFjXNaTjG055Op7AqRZGJ5TrqBd+/f//73//+m2++2ev1arUa2cHBAKDrqW49YY1BA8RcmTudzhtvvLHZbD7//PMnT57ABhO0YmvtYrGABH+v14NADRdD3fKPRItzCoW01WoFpIYvQyVSyyLj9lKgiXkRukFBmafTHdYuEuHhCzebzabT6fPnzxeLRb/fv3///oMHD5IkGY1Gx8fHaZq+/vrrg8Hgtddee+edd27fvu29/9a3vrWzs/Mf/sN/mEwm/C7stl9OKMZ7QFZSspDS+b82s2KWrp8vrcmoqapFKrSYuC4CcRZrVRw2VFHrKUBdNYwYdM8ElWCtacDoKOjAZVVAM4W3Wm8FoHOAVmvN5eCeMGqixSLlhvhPvoU7uzhnvPPis8ykqV2nUZZakShO4jiJrLWFxIQx1kSRVGq+UnGzuXk2jyZiXUOkVegwBs3OUqK56UTai2xENmKcmLbLambqKyfLWm3qotilG7Na+9UyXa+i5SpaLSurVSXP8gv2rkvzbJXl8yxzLtt47zO5JC0iRSMF901t2KDZ65qzpvEOvZy+MHj4UrhwMSaCh8uvCFTCytWCAA0JBNPYrq5luwKJiUCDmG1k7BNiPzsHCcWpCZ2TJKEl2kkx0fRJ7U16uepzwRQWCBpERiKoWxsvhYqJEdgPOifWSGYljw3wWufEiPG53dRsnhnnZLPBaPfWGGNiaxBUGGvjKIqjyCQXlOpKHEeYYSWIis8i9z4zJotM5q17sVw554o/efGbjZ1OKk+eRccndjap+sw676fz6POj5NPH0fGpWcwKFDgu/kf8jkCwxogDgHgpshDxUm3Kwb77+tvZW2+lb72R7u9m1mbrdZrlJkslzUzuXhA+pVBVwt6q7zkiGb2CbY8xjPFfbQYx8UFcDiPtoPasFa6lpFasy3uUKQvovUGDKSNJ0gWQkbXbbb6s0Wi89dZb3/72t99++20QofgV8/n89PT02bNnx8fHs9lMt/bWalWo0vf7/UG/3+m04ySxxlYqSafTabXb1WoljhJrJYpcJcrmK/t0utN42rA1c6GEGxeLrR5mAbMYHmvNC0JrZu3zk+qPf9LbpIkxs+821kmcOydZ5kQM5jcWOiQvDPM4iphos36PhYKBAe4Ytbx0VysXhMAyRKvPocCPaAqrLo0o8AiYjmnW/AtxFWttHJtXVe2wl7n/TiQpJjikh+OL6uYLTNmqMnh0Y1J3c9wAxDfHV6/QylI/u/XzPB+NRkdHRwcHB0+fPgUisLOzo3uHoyjq9/t37tzJsqzT6Rhj4K4+m81ArWLBk/s0cGfyMbGFsJcNWADpVNpLjdoLbCYNGv3IRWV8rzkRPCi6B7gWofNqtcJ1wbk7sMUgGAGoC+Cp7tQDZKlZybDv0FKYCCyIwQGGY2pKLVoyqcHFI9YGLyZmpOzFA7SEPZLosBTKIVq4IDDkQSVAZxdAhPGMUMHmLSKCyaEyn89RRdDuOgFNTJufBIGXbmrjZg8cAZ+M9vY0TTkYyJiGNi7OkHiTzvxfJnZE1IX7iYcChN1aC/7ydDpdr9fQXYUoCrQCQEUERjYYDFj2H4/H8/kcxQaKYNbrddw3yphAZQUoDz4K6JgGmC5n+CaKonpNVpvaBx80fv2r2smk9tc/u7N3N/7T/857m0exeG9FDCIrDUxwnl6PJOqng8dBGPeCNZ/nLs+9Alvb7fay0SBArBmUjMNQ9oAL5Wg0wq0g4EVQstVqUZAB2BaiQCauWw1Avmy2AGokdJAxopj64usogsZDw8EQxNAkCAqDgG9ujIFjJJgdnNecOEAeMbUrlcpqtTo/P5/NZsBl8EZaYOE50l2N3XNc316tvgSeBVf+0Wj09OnTVqvlvYdkDQcGsnqMKyDFvV5vOBxKYeGIpV5XsAgHgHhLs+nAAYwINWszuBt6lcMyq0e4Rti1wiYeDWR/p9NpnufNZhN+cTgTgmJYT3Z3d1977bX79+9DGR+q2RptoYcMnxfJKUGfo950sBHs7OwcHBwAZcYWQ3lN5ITz+RzjhCUoqihQyRfnyQYUALgYTgSziJvT4py3iEORtw6APque5CPjzuD8ca9wl+I4HgwG+/v7/X4fYhdZltXr9bt37965c6fX62Hi7+zs3Llz5+jo6D/+x/+opTBQOPxS5PeL+RXH/rKsiqaNs7eDwxJnjq0toH1RHEavk4H+g1Yp0VZUVGUlUhxoEAcU5q0AsRQ9PQFLlLKwKCax4QBSJKzYaR6xXnJFiZMESHGZsxysctQNQOWDcvkYHlx/NESS55nzmUjunaw30Xhiz8eV80klT6MoiaKqNVEBEBuRyNhY4qpPqn61lqdn0WEaL7vW3xFZFqY99jJALNcCxOipdyItWTSSo7xenXZnp1VrfZaZzcZv1vlmnW5W681qs1mt88yB7BzJMvHDyGcmm/psneW590ZMFFApA5EBopwBQMxX4sD0DNRILoZcnjtjXr5qvZUsz6GoPz+gnHN31noROiTjgKFlKCVEyni0hncJdkshXkymrV4hWRQnoKNNvQilBebVut2B1rhKufvFpRSi1FbEU+Tai0Hgk2Ymy22eeWgNO2ddbp2zzkdeYuejPLfOO++9sd5Yl1+AUDaKvBHxiRhr4hhFmshaU4qOgEV7kQJrdd6LN0XlXLUW5damLnfzmT09ix5+Zj99VD05amwWkfeyyuxwFj0/jdcbK0lhDqbFJQKAOFfosFM/Z2JSkVyiqvT6/vXX3Q/ezd5+O717O+12sjjKN6mLnMkyyXMSn502O9HosM4EX6H/7T8sRqwLh1d5EvL1ev3UVjp6I6D6fKAKFUx8fAs2ayyqSBYQgjYajTfeeOPdd999/fXXu90ueyuXy+XR0dFnn3322WefHR8fQ6YJ+1q9Xu92ezs7O4PBYHdnsL+7s9PrVqsVaww+sN6oxwkaXiWJfb3iluvo0Vm32anamr2QO0iK0YWRpjFiLrBJARDHIk5cJmfzyvrDOPNJrWZabX/n9iaOMzReiPKyJhqLu02hEvjec+fVVUkSCBBZ8REELGBkGSQt6QYpUeKKCC8RqND9gjeQCZE2s7kAiJPEGvMKdB1MQf8PcDWr9CWSQjSctz0RWRZNAxWR8Q1GfHPcAMQ3x1dpH0X3LvN53cc6m82A1h0fHwMj7vf7+r2NRgO0LAhT9nq9yWSCZJikJHCj8jxfLBZIhvl2ijOU1Ri0z5vOgjT3QccBJEuK0mcg9KABYu0/rhkWAZdQ97nQixa5NABiYMHaPohVZUoKcIfTaBFAcAYi2Px0tz5iAmBnIgJBW6pPsuedSAejbR3UkhUVmNqxuK2HAShyQEUBEAe8M7oF4gYCHQ5a8jVOwQq8htoDzUR2FSFdodbEujgAx2h/MPK1CccjvODtfZkBrxFtnj+CCdyE0Wg0n8/RDtZqtRDY4Utxt9EADiAY5OLpdEq8D+k9xgCgHPrdWWvRt45PAyJAfAFXoegMEkU2jqNe3w/H9Q8+3P8f/8debqNpWu0fSOZhs3Nhd63FSTWh6SWxmICbRqKQtTZoz7PWNup1V62ymB/IpeHespg/Go2Gw2G322XBg6dKIVT2mmFe4ykH5ua/DyQK+BL+ZsC/MHo15xoDiX9CdAuiDTkITIA1m5VUEfyXCDioE5h9+HbM60qlAgcSqjwHbEHSMShfEIBKr1yDmE+E4gPHx8eonOGvUCHo9XpRFJ2dneGE79y5c+/evcePHx8fH1er1bt37+LqsEgCdGZ1JxhpgcUKbg7eyGJb0CZCcIGkkoAKiulDxjpuMmi8EMQg4o/xCVCsUqns7Ox0u13yX/joOYlIViXBXJPuA5K+djdC5WkwGABq2dnZ6XQ6+/v7zWYzTVMYPaG8JIVVpmyz6WPKSmSHy6Cuhq7Xa1JQMX8p9kLXbynUQlutVhRF4CaTyod9gULGWZZNJhPnXLPZvHfv3r179/r9PoDsu3fvrtfryWSCigsYx71er9PpHBwc3Lt3D9ztAMZ6eegBsyzzXoo6rh7weByoxtEpl7VYnbQHAHHA8NXYgW6+2QoQ05md5Z8ATNFFPg5vrU1JOECULCwZZ9DLggg4wiqoHrEcHnxRoIYRUP8CarOG8DjRGHeBjc7OZe5iWvyEEIl3qTWZy81yLSej5LNnlc+eNxerOIqNrVmTXACdYsVEYhKxVYmqPvVmNLNHuZ3sWB+ZC3HGQBlTLvOIA36WiGQXflxZYkbtymNpL+bJE59a611ustRnmzzf5NkmzzZZts5cBlDNVO2kbW1T5jXnZLNMsyxzRiSy0YWggCgBca07RNWs4PYSHda1ogA5umCaG+NfzqQOmIUpEcw5PsuKQ3okB8hyILSiu3yI82Kt0AtaQKrQ8Zu2lWOlrbz0kbDP+8Z1jGt44PtaVsEurgs/mzyXLPNZbrPMYFyDQey9d844J+nG57nk+Yv4P81kuXSTabqY+8XCrFZx7vLI2iROKtVqHNEWO242Y2dsnGDCCunDWlWmAKmd9y7L/Hotm41N05g0EsCDeY7ekcg5mc2iJ8/iTx9VfvtR7fPPG6tpLE4yK6mYVWYza6VpJCkAYrqH2YJcLwX9UC5rEDvg4pJEEjel3ZMHD/w77/jvvZu/+Ube7+cibrX0aSZ57rwX5zxAewbJAawv24Ru+EC3ijDIVx5B1po5QW4ilxX8AvUYUeaueiXXdq96a9Aht65Sp2mK8KNer+/t7X3jG9+4f/8+NKAODg6+9rWvoaoqRaPPcDj87LPPfvvb3z5+/Hg+n6PvEB1C4Gbt7e0PBv29ncHBzmC336lXK8YYa2ylWqlUkyiOjbXWSBL7RtVXkrjZqiT1yFbMhXZBouzpygAxWK4AiPMLKNNnJs3NeGE+eVKr/8JVmvn3Un/nYN2oO+98ll8YM6JBNlh/oJ6Bm0OvS4TEJBWBIsYQRbZZp1BxC2kU9iM9jBF1S9Hrw/VNA8Q670OccPGkjLFx/Gr0UvyF3ssF7Eu5iQoSbJFEZKX2tYrI4vIEn4tUSoXSm+PmuAGIb45/2EKrlPofSVxCdrRcLrENBG+nk4lO1XSAyKCQsSaAAyQbdPvR7aJBSoPdVzMpytStoB1MM0l1lkjEWatTBYJHGovk2wEKAyCmY552w9N3T5fiRVnnSaFCi02Op4ScUycA+AQyKIEt0iqalwAICSi8vglb5UqD4nngW02cGmmwRoeDWi4zZFFGSZrbpTF65lfadD7gxWhtAZ1ZEWonBEPtWlpObW1K+kKskKfN8cz3wqAJ4B3RKCAvYDXCz0q7EoMpDzoejsVi4b0HWIanDLCbGhRgEQJuxlgi1w+fDLU7Y3ylYppNG1lzclz/5NPmkydNqYnsiq1IHImVi25UnQd+6VZuNUQ5mwiyxHHskkRPMC+SKWVhHRYHbXd4XoDIcesCfcYArNGcLIJWrwQJvdBNLpjREI/Gwwr471QbZ1FELzVcElGwIfEfA1JTcnSqzHWSdQge4GkSYmCbOb4do6UMENtXqgCIz8QQxcqwWCwg8E0r0SiKvvOd7+zu7p6env7t3/7t3t7eu++++/Wvf321Wv3617/+xS9+kWXZ1772NQh5oxAIsLLRaHCpDzYFwjFazIG6dXS/5O2FWgVIjmhdhBoMa40oXEFal+nB7u4umgAwqvGlWO6iKNrd3W2329/85jd7vR5ULOCLTbSRkkHMNHTHPZF90sk1+xU7497eXpIkg8Gg1+vNZjPgbpB3wP05PT09Ozs7Pz8/OzuDDsbBwQFaFsjFo5IPxky9XkcRK45j4LzAxwHIomQFzBRcWpRsgQNycg0GAxFB6oXPwdIK7DiOY8hGzefzLMt2d3e/853vvPHGG7du3bLWzmazTqfz/e9//9NPP/31r3/97NmzyWTy5ptvvvPOO2+++WaSJD/84Q+jKPrkk0+wGHJRKocQ1y9KubVxISao+wkwlSDLWK/X6SJAFlIwB8ucX4YlLLWSNKqFm/khRIcZSOgtUpSMe2BuKZdVazXcRjsv6DbCCWBQHOhcgb5KueFdxzbl1pkgGNA0Z91ERX0b9E4RjEafE4WVREkGZVlqZSM2yzO7WNnn0+j9k9rPn7SHi8RGYhrmgqomRTtzRUxFTFVcLJmVdcMu3jS5U7DXy1O0Cu6kzyT10bnU51Hl88zFM4dP8867VHzm/QYKsd47Ee/FmJY52c+zfTmzuYvSVbZerzKT+wjLf+CQxoelm9j0TQ4etMaUJdBr9j5/aZM6a61EkfHeXI3ZbX3QV1XHA3SYV6rFTPQWU1Zl4ZyiGhtsFViSCaqMXK+0saS+OZdavFWLQ3llMMZHkUTWZi5ezOPRND4fJdOpzTZGvBgrYqEvgYgR31iAtd7neZ5uqotFZblsrterzSbN89waG9koiRMrF9hfvWF2d83BgbUma9TXceytrYhE3mvo8IVPXJbly6U/P5fz8+QURGCqT4hzLveS2mjjnJsvo+cntfc/bX182Bg+q2bz6KLOUROpi9QK0eGKInUGsJ1V+BHUtzORXIxINZbuQG7tyb378o1vyPe+I9/7rty6JXEsi4WkG7PeAEm/oA/Tu4WxkG7gC3rwr0ocOGXNHwLFWMeWWuKW+8tVyhJyWaMvcICgMIWubVDRm69HPoX7ef/+/T/6oz/6zne+MxgMKL3tnBuNRtAaHo1Gv/zlL3/605/+6le/Oj8/R9yyt7cH8YR6vb6zMzg4OOh1e+1ez3b680Z3lVQucnCJbGptZqGlG0e+vpFVGp+sKnOJ8lqhexsXI4r/04PNFgBxXSQSyQq6ekPczJwv45993FxWvEnSenVZr6ycN3kegT2ilwvGwCBDID/CmgDCWcCX4mPSjWUB3YfrD+jYLN6zk1hL3GBlA7iP2CzQUdH1J0yGV8Mg1jMEMHFeaBDXRVYiUXFLXfF7vr4ishZJbkzqbo4bgPjm+CodBOakMI5D3kvDIhhwjcdjLLvlPRgcYYgLdzqdVqs1Ho8B+0ZRNJ1O0a0MtEi3GCNRQZJPrJM6BjTTIEAc2J1pPEun5YQjNeoH0EHzsHRrm1yWPgA5S0sPo3pJIpKmrGpMR3cHMxelvhIiM4TXkDLQDAUGK2x718xKgBSAR3EaFA5GqRnURd0nxWSg7BWradHY2sfjMbwRGNxr+nBAIALED/tBZrnky5DGBQQHZkcEvNjEGhCKNVUcnwNd4F6vhzQVqMRyuTTGYICxdi3bDIKuGfBM7TRsDZwOpw1qJ5ujF4sFHz2K+ThhCmtClqRer8PcablcUmh7tVrhPkAzFBpkcNUjJYHT4YKfdXEhzvtcxFtjPvss+c//c/f9D2vSEKmJWOQJ5HG8AA21CicDoy8EYgh/c3aQJJskSdJsxkkixeekm83z589NksBwMiB16juMR8nrYolIUzDK9nfEkUlhDvTgfmcYVJTHjrWWJGJWC4AwzmYzYPfosNbRKqcMYH1OAY5bLBd4iIFlHycj3UtAoCAWiRPggyOFBMOSjnnyKkSZy3eGkxfVO4xYqkaenZ1BeH25XH766adpmn7zm99stVoHBweDwQANklzzIVushTuD/k1WX4hsajtEjXnpe6j5fZynooTpAftizYHwHymZkCTGXcVtxKPHdN7f36/X61yFtChnoO8pl3tRA8wusBhFugKIDQs+XTSJ0RAIPjo6Oj09HY/HaZr2+33I3fAe6lIrTw+jkSONGCiHkNbaZlGNBQlA3rj/6GvBB5JcfHp6OhwOx+MxNDqQsna73bOzs88++6xSqdy6dSvLsqdPn7733nvoioXW83q9brfbKCdgQ9GCgy8/LgULgmJrarFywFVsMdGFSb24ccHRK4/OPPUzZUVcc8p0xz1+YCwRgAsMBtjoGnQxa9F5bp0sNAJ9QwkB9l+NRgM7u86ldSO/Lm+XLfLKV6rzeb5dA3/g0bM/piS2kLs8F3HWO+986txc5DSKnibJNElMXPQym4KSxt8kIhXxVfFVkZp4gshuG0bs1X/LAHEukopLzWYTpZtIcm8KuNnTvCspPH+KseDNpulam6zicyPOe5e7XDLnRXLdE6B3Ul2y1YOK9QmW/dgxsNWlML886r6gVmet8d5eUcYrh9+69hDQxoNuei1PHAiOBUNF25ZqWgZSA8ScwbwLTikoS1y+iksrpDJDzgoqLhnTvpL4KLKrTfX8vHr4LHr4xB49q6wXVryYGCiu+OJ0nXuBwwM4zvI8Xdc3aZpuNnmWO+eNiBUbSWS88SLGmHYnvzvbiGzqtazbXSQJsLHEexMAxFHkUBxfLOzpafLocfXTT+uzKU5C3IXrofM2M1Hmxa82djxNPj9tjpfVzNkLjdGoaPNPCl6nbvmPlOiwu0yrL6ojkoqxUqnLzq58+9vyzjvyztvmja+Zg1um0bB5foH56aevVz9NqtWLqq7QlytS5an5FTfTCkZgoEClLcEDXlQw0dhQErgxM2jnEqoXTBRr4cTTbrdv3bp19+7dW7duIVPAe4fD4SeffPL06dPlcjkajT744IMPPvjg9PQUtdu9vb2dnR1EqtVqtdPu9lrNTqth6q2TuHfidlZZVcRciI1kxjhjnBEvkfGJlXRtPzquH62TtGLEFWNMFEtd/yAFdpwUhT0Wa5oiDclGZrKKni2Ss7lZrrM03YhY54y1EaMLIN0UDMQBPDcwBqB6mG50wBLKxVZL6HD9YYGWXCKStPTAlqIFio1QAXvsBdYfx5CYeGUoWkG+viARm2LDMgVqrE3quCBkxf2/Mam7OW4A4pvjq4YR00eVfFWS6WDAhSwFAKJecI0xzWZzb2+v1Wo5505OTobD4XQ6BQcziiKIVCCb1TArIE6gLSgMwmkNoAld42u1muYXaID4onyqolstYMq9BzsKXYbYSUoyIH/JyjAAZfwVTkf67Uy22RmK26Wl+oLWYCCq2LGgMAgFDx23aVkMwtzsW8fNwbaKv+Lm8GM1f4pqcYEGYtBjBRwTVzoajSaTyWq10piOJmgzRUTaQO9p/JUN8tyAETHAk5f+Tni+qIrTRELjLyQr4Y71er179+7t7+/3er04jiHE7L0/OzubzWYYQgEI9aXqIszhK5VKp9Op1Wqj0QijlMReygVwROHkUTbAMOh0OlAZg7bs0dHRdDpdrVbz+RwGWQiPMLbBFAvYRqRoEUOJYzed5b/9rX//1/LrDyv/85/XD58l0rlIIXwmPitk8LwEj4nEWDr5XhNGbzab6XS6WCxoKKGnj7U2vvz2zXp9+Phxp93e3d3FhZAbiMchBVMeUJSWBw34bixd8Dd0yQO4RrXWV0Iixj3Hx1Kvht0AmJLQhMUIr9VqelJrbhSRUFQvgBSjPEAkDlOSvyTJkUxhKABorzZNEE6SBCAR/CrxdubtZTDidz60JTfBVta0EHzjKhDZz2azZ8+effbZZ9AT+MY3vvH2229nWTYejw8PD7Msa7fbANa5+pF7K6p9QYv/BLxyror0MOGgYimOiz/pw4vFAjUkFDaAtdG3je2HFKPACyAPTStOknaDvDpoxdWqDnjcAeeFIAvAFMrOYDPiis0NFB+IHXY6naIpgWeLzZRPB9I3WFL4V3611tFm+opOz8ViAQKylptgTkslCgzms7Ozk5OT5XLZarVu3bq1s7MD4Pjs7Oxv/uZvKpXKu+++C2mds7Ozs7Oz6XQ6mUwQA5yenqI0GADoLz9oLWqK1WrlshMdHwRbjgLF1etbSYITCHRd2SGkT5UDkqORAzuQHdCbEQVJuP4EmsWB0hFVZbDy0KchIHhqm7Lt3d/bHPCCfiaeOcYA+aQ0ptOaCXrdxmywwGKd8Vayuqz7dp1Ztyk6lGMFEEciFfW/hkhdpClSVe7trgQK+yvIxVRiTUXW4pfiVyKpeZF7+wv4+EKJInvxIXkWu3XsF1GU2dja3FhrxXhaIV6q+gQ6CQFEqw1UNX6hkVmWMfAreblxb63lY9NfGuBW+qv1mA8w4mDvK9s/BI52wUAKZB+22kKW5SwCuE1D6sWIEj2Gs3STppssS1/sAoVgbmxd5L2Jo/XCj4bmyWHlN++bTz6Ol5NYvEjiL0BVz28viOTFSHLOZXnTuzx3zjuHwWPEmNxeyDVY6Q3Wzk/brXx3Z5Vu1nmeGuNEqt4jmr3QlzDGee+szcS79To+H1YOH1d+9avGcJgUXys+Em+8WGdi563PnNlk0WSZ5C6WmrlA36yChm3pf0ZpEGsbMTrUYWAnUqlIf0/e+Yb88Pvy1htmZ8e2WpH4KE1tmlm5kB8zF/fk8gMKHuhVAPFVMYb/A0GxNKOoDBDrIEprmwREY20GzoiUqz17brS1DNrUkGHB+3owGCAo0iv5bDb76KOP/vZv//b4+Hi1Wh0fHx8eHi6Xy06ns7Oz0+/32+02Yr+kUqlUknoc15N4HlUfS+dvs53zvO69mExkJbIUWRuTinfGiI9zn6/M+DQ+XSZpZC4W24CWbrZpEIsCLnkkIl6kZnzL54nLfZ6lmTHW+Ri4kYYO2PwKsWCGGazKk2SmGcRoDgtqn7rrJXAELSs7UemRCsgEiJkZ6VLxpfLYK2nIMxfCzVIRSdW0tYXocK5uuys2x6zAjs3lR3Bz3Bw3APHN8VXYRDWZMdCQRdp/dnYGIhuMlZByM/IDyQU4CxLF4XAIBq5mxlFpniqlAOa63S7VEoCcAoxjYZANnuScBrQdVh11Txx2C2AuWtGS8AcxX3rdYGNL0xRNtVTAAATAFIIcIl4IS6B663qhQFfomWqLp6vkC5mfENFgXKLL3eTTESLRBL2ANVymcgDjnkwmw+EQ9Fjgg7wEmixpDhTOBLtvQCEh2ZNZNMlW8L4DarZYLFASp72sZt7RiooY9P7+/oMHD27fvg2KOmQuIYsJkzqS5jTM9IVwmNZPQAWi1WoBIM7zfLlcoiRABzYk6mhkRhewiAD1A5CN0LDX6+V53u12a7XayckJFHihJoaoBZAN5kvZfk2riIjIJnVPnvr/6c/8/+c/yuk8Oh1HaV2kXhSlU++y3DvQui/1bPIaAyWWrXeDXfkgPlMLm8PGWps4110uewXWk+X5ZDqtpynuCZFTPgVMjVqt1u/3a7Xa3t4efmAGi0cPEzbMOy0mW6vVtNDKq6LK6uoOJjX5CBRERoEE6xvIpzg9Di0OWhGBtNz+/j5wZOjwcBIxzVgsFicnJ6vVqtvtQuJTu3NwvkOLQ38XZwSIzI1GA3AzodtX6yRDNXDipyDFc1JgkODFv/3tbwFl/vCHP/yTP/mT2Wz2wQcfjMfjX/ziF6enp2+99RZmASYyBpW2o8SaCRgOjQKiZCJYhcKiCtCWeutcHom+cfk6Pz+fTCZ5nqNfHmVLKgsHvQ5gFqORP45jMOhx1ZqYzGKkriBqbh1Iwexn5OtZJ8OZVyqVwWCQ5/lkMkEZBsMAP0AiGeRcDKTxeMy2BgxaPdHq9frOzk69Xgf9nw6iURShrZVfioUFr4T0B7U70A/LDk0A6/iK8Xg8Go0+//zz0WiUJMmbb775rW99686dO7VabblcfvTRRz/96U/b7fbBwQHrefioNE1PT0+fPHkCpx0UHbVh48tPZ2tttVKpNxrVApPipqZBK00c1uo6hM/KRwCn6toP1oQAIA4QFq3xoqdhWQUiAO80Wkegje3e/Ccxmq34HTU0An50AB1SdlPXKsoZOAMMjF4C7lo4SH+XiDcixhvjrfHGJMZ2TBSJ7coFT62icIeoaFuuFIhYVaQm0pAXMhReWW9paPgagDgvrOqWImuRtOC76b+mBUzsi0R9JXYqkTHxJq5sKpL43IrJTQ67pRL+XtbDCcZVAFUQnNXta3gE9jJF93qQ4UJz93IlowwNB+t/4EN41Xs1QCxXCBZtnSwBnqg511dNq+BbSipwvqg+ZOI24gHzX4g1iHOS5SZyJvfWWL8yq3F8fuQef2I//m20mtsL5MW+ALP8NfWgC0EEzxZvkxtx4kWM8atV0u1spndls9qI31ipgFHoJfbixV7UEIx1SZRHUZrFzjuzmPvTk+jwsHZ6Wnnx3Rc47wVy7SNx1uTWeGOkXpyiLTDiQFDCbJPhDkaNK+zpIoljaXfk3gN58025d8/UqsZau1rZTWrTzDoPewpPKvFlc4sQI9Yc860R44vna8wfUG67lSJAbLfce6GnrcaXdUlPdz7R6AU5GuIlRHFIEKAmAbQ0QEU3m83x8fGHH374+PFj1N0nkwm06dg78mI1NiYyPhLJJDrx1Q+z1qnUvDMmFVmIzEQWIusLlWqTil9IPjXZRnJjLip2clntvWwKSoDSFmOVZolNMVWftF1Uy73kLndixJsX5q5MvbVUIOM9ZsrB1saVE3cVOYtuNBQlAL21I6G8rGmP7mAD1Y1EZFBd/PWVj+pNQcSuiqTF5pgrvHjrNF/dmNTdHDcA8c3xlTm0UCwLa+REAOAYDoetVktEnj17du/ePWTU/ARkoSAlAXyZzWZIawGo0WKF7qJMX0GDIt6apuloNGo0GmipBpiI+iQAYu3SE6iCatgUv5RCvJJ7FV4PQWG8BTxcMPWwt0FSgPBx0B8NyHg2mwG2wPYPNzNN1dSZG1nGQFQDLD4weSNlDLgq1CGDFlrdOKylYEX1UgV27YHoMMIRCF+SyIznotXKtCQZm2fL0SRpR/Txk5LWJBvAp9Mp26sRA7GKwHMDeNdoNG7fvv31r3/9/v37SZJkWXZ8fAwTOdgfgdLIIsFL0tOYYIPkhefe7XYxqlerFUzVgH8BpEa41uv1NMCHjntqhpBtCvf5wWAwmUzG4zFo2gCRMZug1gLAVBTlnK3fOM8PP7b/9/+H/D//3/JoJC4RaRe5hBPZiEt9tsrydOOybDaDWHNCjDhwsynXCRhjwWYKaDsrMQB5AZltNhu/XveHw33n4oLkO+j3iflSYZbEakgNAPBqt9u3b98eDAY0sgC1k1rMQD81Tdj8PWQg7GuDZs75+TmqPjhbCq1471EAoHMar5EgDgohOPnd3d1Op8NFQ1twADqE29ujR4+Wy+XBwUG73ca0IvoQKNkVKp8Xaxc4mJTfwYpEWYxXbjVOvFIK4jy+Ok3T8/Pz8/PzzWbT7/cPDg7+4i/+4i/+4i+Ojo663e4Pf/jDVqv1l3/5l//5P//nDz/88OjoyDn39ttv7+7uVioVrGNQy8X9xBoCniZKJiRmUqAj0IXXDxELlFaEp6skmLm7u7tQFoayxAUnpkCl8V3VarXX6x0cHECbmKoglMdh0qIpqzQ/0QsO13AyU9i2Qu0OrJatVqvVas3n86Ojo+FwuFwuNe2l2Wz2+/3XXnsNJNzVajUej6Exou37uBR3u90kSaCnsdlsILaAxg7KCuOm1ev1TqeDDNYYA80oTFJSVoHjY20cjUbT6fT09PT8/LzZbO7v7//xH//xN7/5zXa7nef5Z5999t/+238bDoe3bt3qdrvL5RL3vNVq3blzp9free/Pz8+fPHlydnYGPWjtMfDygxZbc6PRqKhG+AApI47PO6+ptbrYqXUVAjBL17BZNNIs3SD5ZKEiaAEJoDTNztMNGdxqKUZBrSq+MeCi6jGmTTWDRJoSNNqgScOd1NUlpk8pZ2xhGA8c6lRmf3F11lrvIx/FXryxUSWKE1PtSUX8Ao3z8WXXo0h100dKbiJSALG/zCMmTVgkRP7YZb8pMOKNSK7eW/Tgy0YxiK2Ik3iRJ9ZX8qi6rNbzRhIl1kniTO5eQNEcLajr6ErVVrBVw0aBoaWuJ2VJEsXxy+xqgCrKAPFLrt562F/3FVcQk78QaNtKZC6XW+Qyk71094yI8RdeZ85Ibk0W28yZDOhwLs44ZySLfJ54SbyNsopb5suRGx3L9Nxm2UtHCFsvzV/6+2KezGdxtvbeZbHZJJFP4lgk8k68KAaxdZUkj6IsS72VzGVusbCziV0t7RVIf1EvqReDP1J/tQqhC6Bhc90Js5pirFRq0u9Jtyu1mkTWiBjnTJ4blxvnZSvoL6XCg0aEX35I/KGgw1eJcQXXqPv5OEECVZngjmElD0os/CcL0mykK58GfeBHoxHCRZJytP2GWmq8tSLWpMYuXbT0kXfFUglx6qxYDLn65ZehYbl6jOk/+cujEQu7lSjx1ooXcc4bK15VYIm98taV2WbBSLsK5N26ggV78dYHGvjulL9I14zDZfyVjDkj0ipEJF4SXQte2bghEd8cNwDxzfEV20o1i5OACCkkUApOkgSoXNDLzyW4Xq/fu3fv+Pj44cOHwJvAwiPtFOqftAtAZhJFEaQDgEZFUUQAmgwXTWbBJkrEk9LGuumY2xXQFsBSyHZowsadm2Ys2C1oqwWcQopGeNKBQe/CBQL1QEe/jgOQzDNuIK5KeJeXRu4V8VZCtACyNUCMi8IloOsciID24NbucNoZL2Aoo2ccIKCIaCFULa2ot1jAmsCC9WmzfxmfyVxdA/pgzoJLu1gs8MY0TUHxI06K0wamACnMfr8PDDfPc8DEPHM6xZHf/aUGfEAKIPuPLcZSuORhhACskcvGFGQOFsGlBa5Rr9cB8C0Wizx3WjuSGgVah8TaKAiJxlM5PJThmbieSKwS6QIm9s5777xg5nrnogDM2t4eeFlmRD9xndGRabtarbLFIk1TUbRWUmu1WKFmBGC0UK9Qx8ccEnSQCExR/v5WORoG4mBtiTx0KcTLIkVa1CLguCKcP6BtQgNaJZZTCfcQ1OzA4SpIP7b6zusazyskU19VONG0GhJgsRBBMgUFlX6/v9lszs/PHz16dHR0lCTJ3t7e7du3q9UqWKhAP4mVkCwcwGpU1IGBoShzEt24DUdBznR+AjWLhsMhmKqg4qIgAdx5Pp9ba1GzgfnearWCNkin04HiDS6Q9TANtxGU5JKoiZlYAymto7mZnBGs1WGjwXI9m82GwyFEyWH2vVqtpLC7hO457iGbLVBGJXKNXbVer1OVnqxkAsEUyeFkRMmWourYsmGSLkVbPXj0EIkiuNzpdEA3hlbyBx98MJvNsH1jl4cE0GuvvXZwcIAzIXJNQaQvO4aNtVA9iJWJXBmW0lCsKLGaAO8LmOnl4IdLgQaIdYTD8cDsfau4/1ZBAKamXGzZjqMru/oaA/Imy9tb9YLKmTBjCbZMUSOLVXP0tRAghvgV+6B12EAIGx8fexN748TGJoqNtZGxcYEFx5d7lqNCZbWiXhApkCLAf32JU1z+k70MZGTqxe4y7szXODGxRIlJkrhardTyeh4nkbcVeQGlabBDCeNekiEOWGxadSGwuaPAt/c+LwLgl8U0X9pQ4ZWAaL8vKrKNlXz914p4Ix46GrmXzNk8M3mOHdA4Jy4X56wxknovPkqNzSLjE2OqYijZ+YVQl5SIk9uY6caKGHFecmfTPErTyBsrYgOJCaitxj5KM5fmNnfWX/XtRrGbo20IXaAs7L/obpnLU6CohXgneS7OiXcaVwLgdamtsLyqlNO3f8SJ7cuMc12EE9UQEKzhJOUELn+0vaWyUxRFiEZQNwW5hMHVYrE4OzuDSR1rdaigkz4MvwRjTBwnlUqlVqs0m/G6ZVtGKhtncu+NuRCxjRVBFRtgJrIuvObKo+6q30hpNF5u6SjkVkRJf18wgbTROm4IM30d+Qei50HdQpc2RblrBlbYW/uBNGQfWJ1rA/lyIfZVHtVCAd8V7nNOqGbzYi47kapyrsOJ5CK1Gw3im+MGIL45vpK7abmOJ8rCqJw4BQeQo2azCSoKQNjAKg05RlBL1KicVvnUTnTYdMveVjrpCpqDdEAfUGlI2KH0XtChjzMJbGoC6Jadv8iTt94WLUV31X0LqtwapCMgws0MeArtcZkHaq1DUdYK+CWFDjUeFKjBymUrG52X6s1VC9QGji7a90ZnqsygqCeA9xJGZzyhG2b5dJho6aHCJ17uBfvCQ3fSAfWjdADa1RG0QQQWTejgumqmQLVaBep0oZnrXJbn3jsgOFSQjOOYsRSTbRYPCnabs9ZuNutKJa7VTKXiHj2q/eTH1c8eR+u4MC7IC3aAF9lIPvKLSbZarjebbL2+IKbhJrNJWQt2B1wePmVi64FSGx4E0KJ0ucyzjO+Mk2R/f7/d7QLJwnTQIR1Z82AKo/ldB3/aJLB8SnrleYX6Enr+AvjmPznZcdosuuh2QlLtQBUHeoJAX0RYUsKZA1E9OTk5Pz+nXjam7Ww2w1QFYUS3F2h9FW2izcISpVE0lPlqD2ZBODeSmtM0hbzvYDB4++23f/CDH8B5DBz5Wq22v79///79p0+fQgh4MpnM53O0gKAsREiXNtNYh/H52mZNi4EEzQrcQcgdhuYGZVu73S6qfbjDepeh+Vij0QC3Xd9w7Tell0TNCdJbg15dmfXpLn5WgPSEksIPkwU5pjRYefAyWr2JyGKxwIt57VhAMDJZiNKEHdRB0RrCmwZMmeszmjnQCoOyB0hMEJyZzWaz2Wy9Xrdard3d3Z2dHbCMT09P33///efPn6PtptPpQFZlOp0mSTKZTKrV6nw+Pzs7Wy6XoHvrBk+s2y9Px4nUSl1GtQLdTOaBgb8ci45sk9KfwO2D60OQfwYwAW47ljVdHypXeuRyY2x58ASiGV8o51qm+JVFALaSp/TqETCIsf0BIMbBkVnuz+WmH3mJvXFiIhNZiaw1Rouomsswmdn2vzLA519iQAQCFE75wov6jSv2SiKJTkwuVmxkoySpVKs1l+SRsXEB4AWABacwRg6q0Tr61TNXI+laS5qrdGptrHw7vgCxxUQuxZBXFX2DakeAelwP2m6NCoL7IKXeo61itYjPdWC/7VSpxuyiKDdissynqZkt4uXCpJvY5V6M9+KdOGfyOHE16xMTjaPaqFFZDmK5a+1MzKyARCOFiLnLYtaiagaanJ4X/yvAVlMVF9tlXh0takcju3JJEtdEqt7F3otzDprG1rgkiSObLVfubFSZLisbb01SIgLbgjus6fOxcgMzamrY0hwp49r0cswK1RQR7yVLZb2S1UpU7f7iORdOhyZAzQKvQr34BD/844CGCbyWp0lZq/2qKFRUt1bZkwCFH2xtMKZm7RAGKt/4xje+/e1vP3jwAE08+JDFYnF4ePj+++9/8sknJycn0+kU4SW6iPb393d2djqdDi3vkqTSbjfb7Wa71Vg3azUfJ6LAX7ZlOOX5id/k29wO5fIqHSy/um5nLr3eF2rq3jkxkstFfoqlgDpgqM1rI1xmc4g0NJgQWLtrzRPNMSJdQ7aJpQSKT5rOHFRB2P1zEUW/2vIIiqPJZQUPkntiJUMsxSphLi8g/6BT5nd415//+Z//q3/1r27QsxuA+Ob4x3kEevB6/WVOq81bNC9pK/TW7Xb7/f5oNAIvjMp6onqE8RsCNLQFI58LLCQKkgJx06AtfwgS9YC5Qzkk3cQdSP7x3DQ/F8iXlplDtIFCMSulUij0z+dzquMTdCiDbkzJwG7WasVEeLGHETLQkg5EB0AcQ7KHT9O+Q7h2dpUCsQKAgixap4iBcgXuJ73vKOUBrjRAT+YDDJuYRBG9wk2jjy0JU7xFeAHt4IBAYXjg9pKtqf0GAXysVivga/QuCKQhrzkCqyucG9nNkAWYTCZZltVqtcFgcOvWrXa7jdPA/cStaLVaAIhxgXmeumwp1on4JDGRTZK4nmWVzVpytzFmYa2P4xa6eJ1zm00KY0jn1t5nIrJZu+Emms2qm7TyX/7K/sf/KfnkcbSuFx4R2YsMwYxl9+28U1+uVrPRKJ3NhLw2KLricsoTPKCVES3SlYBgNUAhXscO1Url/muv2X5fCklcDEKdY+O2AFUHSq6HN0NqRNjgwmuuge5meFXRj67xsJih5TjJzWy326hkEBLCIwaXHFRKAL5QxOYKwLaDxWLx9OnTw8NDqLiMRiP0GWw2m8lkQrFXrG/gjDSbzXq9TuUEUURsiAbg7WCJauO1VxgdkgrN6gvrMdANePr0ab/ff/vtt//dv/t3t2/fhqrD2dnZ3bt39/b2vvvd7242m8PDw81mc3R0VK1W+/3+YDCATAduFFYJTSVGTwZNroEXcx0AqIc1kzR/ahNjEUB3PJpRMPLZocKsg1RuY0yr1drZ2YHwMbsxUIuSQr8+qCtojrAWMSDoGYBxBCIJEuGVoGc2Go12uw3aMiYgveZQOgIVmuNqNptJ0X9DUFsKriK2SBS04jjG/eQiLwUxGbcFV12pVMBgojp8vV7HfgF4F1WNdrv99ttvv/POOwcHB2manp2d/epXv3r06NHBwcH9+/ffeuutnZ2dp0+fDofD58+fL5fLPM/b7fZisXj48KEW46aPeZn1c32twl6GQYMap/aZYf+HNqJhmYEbepkarCvNersP0DGuDxey7EmCURfsuRq6DVxwtVc7jXfKtZkyPBd8eGBAV5YTDbA/3aei9fp5H5i36/09gBf1iRnvrRcrJhITSWS9Md6IMy+M2jVhk2AEjdpzBXttI6ldkpgIRopTAF92uauaADEFiNFnXXyFyQwx4jiJxFtr4sjGxtit/m9SdKfBphiLkjZpYCQZOH2h1MewJ8/zijFRHL+MzOVWZpyG9gJV66148TUjp0xEuGqv1GXCAKkhqUJLV2vy9VaM+AJa8s57Z42LbWat5JmZL6Pnp9HZucwn3mVerPjY+8T5motavmJ8LHYWV59166d3K5u1lZbIrND0jIraOaOj/BLH9uKXFKROLzfjI1avm6WNT5f1x2e5OUxbjSSyFe+rkkde0KPlvYgxLo5cFLn1xh2dxM/OqrNN4ipG6sXwMwVgTXFhWwDEVgHEoqBtq7jGAV6s28XkhTEjvss72axltZT1StJU3AWZ2WIZQOGJI4ErAxMQ3SPFCF+r3Hxh3PXVpzlyplw14K/CiMuSQbrEopM17u/YuBHbQICuWq2+/vrr3/rWt370ox+98847kO/HBoTo6P333//FL37x8OHD8XgMtTqo2B0cHBwcHAwGg1arhUdjralUKp1Ws1LppXlnvmyvTC23kVTNBfk0LYzR9MqZiSQFiOy2PTCzDRc2ajCLGq5WxIg34r3H/uGNz/yF348GiJkbMh9hBsd2TO5BmuxFL3emANpgsNzPpxUt9NNhZlq2s9Pa+lrg/5WNuahwn8vVrheXIHj8kBbFLaPUyd2NBvHNcQMQ3xxfmYM971w9uXBjvUbehSh5Op2iTKqziEvDKI6/9rWvnZ+fJ0mCtBbgEVyA0EsLwhcIpPP5fL1ej8fj2WyG7AUIHTiJSMO0OSxTTaS1mrelle+18TSuiOwhNpLDdg/ZEfZ4AF7QnyVCQVIzdyz6vHMbW6/X0OgkVQcFZO7x2tUauopM44mJEM4gvwzytdzhtNCw7sVOkqTVavV6PRhDcQsElQ/XLiLtdhuNTs652WzGLmPEOoQnEFCCUkQ4Bls7uOFUkWanKoBsPF8tDI2OZmh3BIQFAkOA2GDpMJ1Oj4+PMSSSJIGZL4FOShhDIxjjkIqfuA+Aqq8HIJi84TNxRSAeYnyOx2NYXfV6vd3d3cFg0Gg0KBQAHjT603liaEXcbGLnvPMuTX26qWZOnO9kbraYz/M8ny+ynR0zGNRrtbq1wMvyxWK9WCzTNBfJN5vZ50+T/+9f3PnVe52Pn9SGM5s3RNoitSLdzUSWEqXSb8r/5b9f/umfTMVNj0+y9TpDSAoBEEyuIKLVRlvaR5Hax+ytlkKYkiM/KXzbeAMP9vfnzeZ8PufdZu7KRrPAOVrPzfl8Pp/P8YJGowF4FGcOZPbLOrBtNa/YmjbjeiFsAgCOAsRghcNyGsKvrFVA4BWzEmsatKpHoxEmF34DLA9C6oeHh4eHh5A+EBHMHfA0oaBNHDBJkm63i/eyOoXL4amSwiYiYC8aYyDj8KroNnxGWtUUtwhFEeCDnU7nX/yLf/Fv/s2/+ZM/+ZP33nsP696tW7d6vd73v//9Xq/3q1/96m/+5m8ePXo0Ho8PDg6+/e1v7+/vY/0HaxvznascVirmFQBiMKOhq3B2dgaWK4YKioggqILTDbwVMDRWKl03YgUL7nAQTOj3+zwlsH5Yk6PLts4VdRWBoCSXbl120sIg2rmOXHuINhDxh9Az5PtRKMXdxoDZbDbPnz8/PT0dDodxHGNPwaIqheAGHVbZikG3PSLpkHTHnUHVDVvqdDp9/vz53/3d34kIPP2MMWdnZ48eParX6z/60Y/+7b/9t3t7e1EUffTRR3/+53/++PHjWq327//9v3/99dfv3r27s7ODZzEajR4/fvzw4UP02OLxMYVjXZAT7YtnN3xjrDXF/deGgXKZ361TR+0QyBpYfvnYKil7zcLCC+F7tb4kwQI+AmLBGMBaalwKTeqySGvAigpAiuu1QTU3UN8fTaDj3QgGM7ldPDS6JOr+W2u9F+MdXLhyMcYbI1aceaH2q+lpUYlZaUoEyesZwcGdyBVGnKn/aoBYY8fZC4mJC6zEizFijTVWxMbWJuaytrVucUPRhYsJbgIeExXGpaSwSbz4AuzwPnrpOifGAe+7jhuDLZVVXr2G6xJvmXuuI2Q9fcp7Abd+hLIUGEGtFAE5tjMMGITlXCd1/0QwmNEbI5LGkfNe1ll0dJb85tPqp48rZ8dW1iKJSMP7lvhdZ3d85MRas2klk734tJWM78ZubC5w/6i4Zeimn4mslPC0/v1cZC6yVC/IX7Tep1U7NPVPx2b8qPlomFUia03ss1hyI17Eee8uFiRrnViXO5kv7Nl55WScbJLItMWHJnXFgI9e6LdeqohQnjtSROOtAHGkAGKOZ1x3LnkqLhPvXpA8NQ9DlxC0pBW2SDYtafJ7gMRthUohgfKHYlV3fWRYbsjQi7yefZpGg1Udv8Ttwo6PfIRz//bt2+++++6PfvSj27dvW2sRLiKPePjw4U9+8pNf/vKXJycnyD4qlUq/379169atW7egqsdmjjg2zWa1We8ul7ufHQ5+s+x91Gsvvhb7noiILC9Ryy+WUDihVRSDOMB8r3EBNQqyZCUvEuPEW8l9lmbZJt2I2EwM+AqBw03ZNlxXIPRyRNMO5hG630sDxNrFZ2vFixg0AX1ER2Wx479HUbu1SCyyKTg9efHPuHgiUfEsomKf0hITqfJuvTlujhuA+Ob4B98+gQwS09FWJ3qhR3I7n8/H4zForVi1yyyYarV67949KAsDbgOGgrwXcB4/nF2ogNsQaxJtRIsx1PEA5FEmj1rDOgti+Ku5dfgWttIzF9KBFGUoZ7PZ6enpdDolzZkSutztECVr9A2SvsDLFovFZDLB6VGnFRED8QKi8MzotJke0Wc0+GvDce6CuvSKTn/AuNitCdoOh0MABHymaEaGnT0/CsAoMXfdtMshAQY38As8GoBWAWkLoRJSC7Tikj+IG8htXgp7Q5B0oGp6fHwMc6Rut1uv1wGf4TM1r1CTyPA5jCpeHg7T/CmCd4jzcPIwlbroEi1M23CHrbXr9WY+n+d5LpJHkT0bNv7qfxk8fVrJvMegyLJ8uerNZgfpch35yEnyT/+7+f/2f7NsNCLvkzzLoig9PDR//de9Dz6ox5U8t6vTafyb9wdHj1qualxfpCNSUz4Ga7EruXtX/q//Z/k//R+lWpGzM5tmHq30ZLlyVgYSBMwqNVJPbW72IGOUAgi+oMrmeRxF2up9vdksl0uEd5wguD8A3WggBl6hiKB6ISJoYw9KEUCvut1ur9eDLoH83up45eQZl9Zut1EmwaACC5XFG6DVnOCaqkDx4s1mMxqNYNpGBGG1Wk0mE3ROYJYBxcMisLOzAwAuiqLZbOa9R4UDZRgAwdAwITGW95ZOawTuvyyA/oVUTZ3/aE4N0iE0P6Zp+vz586Ojo/V63ev1bt++jQvhotRut+/duzefzz/88MOzs7PpdDqfzweDQa/XI4ucADHuNtYB7gK6nMDmzfF4fHR0BD1cqAbjUYLFT+M7QDaaGs+6GqpZeMqYIFpllVsJ0XlNCZSigYYJDOVi+DJ+OG8ddjqaWOIhAvdnvY3FPDrL4cLpR4dFCYg2xttkMqnVav1+/969e7gPRKK5l5GYzN0Q3Pb1et1sNgHloPYAn0ls04DOsdxh39nb23v99dd3d3er/z/2/qxJritLDwXX3uccn2f3mBAYCJBMgmQOzKsasiRddUoylV3r+wva7LZJZnrsJ/2jer0v1/qp23qwriqz7pZKKqUqK7PIJEESCCAQk0f4PJ5h73744iws38fdEQCRKlR1HNJggYAPZ9jDWt/61vfl83Ec9/v93/3ud1EU/fEf//G/+Bf/YmdnB+eM547+WSkyyHsBJ9XbdZZuPp1vMoy3lIg2ffhNrLo2HVm62ZYzX0tS/uHL3dqMV2bdWy5/O7109V12G7qpNuhabjvv1Y90iGxbXrxW2pXWaWhuOHdLdkt54MaKunQTUvwNB701hjzPZpzE1povSZau80+bagzc3SUFIhwSvVNQ4eIHo8MFcbA8l5RFWjsTlbIK1nTGJoldLpJl5HWv1Ivz4NvnxS+/K3TPA1qQzRHViFpE2lLOqgqpSJlAhUW92PHmpJNYWbOq5rkkmhENiSZEcyEfgd/3iUbpv06IlkTRK6KlVRRpPaJ8OPV7yyR/aT1LyniUKAL2Kjl9ypKyRBQaWi69RahDT9nC6giUADGTiLPzws/Qhz0BMTtAHhC6IpElmpE1pBUVi1StUC5HWvMHe6hdspWuU0jACix7AaUpJRMIHLU9p+D0D+twinYOV8Dxl5Pc+Wz5h9LGUO52kh0bTO5B+Aqrhna7jS0V2c3JyQlknY6Ojp49e9bv9xH0IgBgBg/Sq1wuFwQ5z9OBr8tFr1gIjk/Kv/qbxn86b5w+yk12td1P6fOB0CBmAXdWe/dTsrwje23oNSu5HNWKSJNVxlBiTGyS2CqVGE2kWFaCvVgYqHW2OYbUkUs6Wj0ybHMsOmSrEC9cW3juXOpwFvBN5nXv7CgSxakMsUrvfD6tTfopFqxStWj00zBqnCMab30uv89j7Q355S9/+ed//ufbi+i3xy1AfHv8Yz4k/sg731pAjWEyuDw7Anx8VCqVnZ2darU6nU7hV4P0m0TrJaJJ7BaAh7g/hbEqUOoYF0bPMvZgZiSx8wyXMdlgxGkGZISFKVckes+RV0MkdDQaUUo1RUDMltZIraEtAEQS7x0MBmiqBSyrtd7d3ZVFe1Y1ZRs6GaPwJaBHOCtBKLGbbEIrZVUlLA54ju3dGGMFHMx8Us4KpOQisnpW1MIdYNMhICkSxgKzDyg5wEFoHTAED9hLYu4YbPB28DwPyq0g8AI9YayTu2KBpyCikrpXN4cenPhDNikzRkaC/UeCpQ4POq29xFiKZ4HX9yi0y8ib28G3nf/r/9r55ttiYq49ug2RtSYxO5aMIrVY+p3aN//8j04q+UVCJTJJPr+YT8t//V86f/mXnVzOkJdEWi20H1cVFYgKq1mEIopJJ3Rwl/6X/wPt7Xm9np8YpUgxGMRq2kwBk1u7Y9TAaJQTNEt0jPnvtIoXxFEURxF/L9c8GOuXijSAApm1zTohWHPwGlBEQSh25CbeOrghQQCUCiTA7LgxAjA3LhZQtSQp8FTCqjKfz6HNChYwL5tMJmVwHFfNWCGgZ+jKBUEwGAzQJyFLO2z/yICjg1RKodV362LkwAQOawZTZjqdnp2dvXz5stfr1Wo13E8uovCUAaUXBUJ0nODhSgVh3FX4xUkLOMZPKVVvmM1mg8Hg5ORkPp9j5QcBtlQqtdttZjxBH0au807JEOs2OhyZDs9d2yQU1XnFUxnpW37Wko3CQK3TvsAPS1byspx6HjxOeQbDCZ/farWiKMrn89hDMW65MsGqFLhAttiilAPOXppoduFvQbEBKA+G7mQywVtKpdLBwcHBwQGv3thKUBjAMOaHCPSZZZecNnNebN9ixCoi+QwcdwQHb5XE2Ncea2HcLTPL6a/HLJbFTlpVAZaXLOcRj3ZePKXf0SYbdweteC1MKa/FUfbfBKlLcrHzgSvfqBSRTZmESgE8gFfSe0R8yOBrNiVYYkU1GgrXRmu16lYkaW7APaVgK68VkoorD17luHUg0dpXyrsZvpZlEDu1DcfdIVvkcOTImCfudHFtAogdzSVZVMYSioIcomJmoSJqZQ23zZLH5HlEisKlms+94dh7fp779kX++9PC88vCVc9XS0X5FN6aE4WWYqtI24BshUydrK+MBLDUtSUDzYkuiUYpoRL414Jomoqx6pSNG6RCE2k5wVq9NCoMPT2zKiJKSCXqWpXCCL9EoaBtNRlNVpPx1bXkqFRTUQIjVgIgzuLIEiB2NIiZBB2RJioUqVqisqa8ITKkPWrv0Qd3qVGnfI7koHAAYmbkcPYhJWXYQFhSZdeOupuU0N7Dg4fuWrc6eb2vLaHJ9IGZ9bKwzQVR1iPirBYUoslkgoiIwz/gwvCvA0WAe2QTYyy46ZoKRVspkgm9s5e5p9/mJ55nlkLBVjoiJhmRa7WulpatzN0EbVfW9+J8blkszI3xFrEi0tYG1mJzXFGTkEGUJHxIkBfrBgPKm9aNNwp35ddJ1+Wb5As/9AiJvFQ7wqYocJQ+jmRVOgazWwkBkHjV4vX2uD1uAeLb430JqkU0ycurRNN4awSugQRp0xrN/f6yAROhCVNxHUgiW7bFe6MoAuUQjd4SkqBUjFh+oNMaKXkQWWh1rTgppeQybsVyjNoYlGTICSEXVCbZUyiLynGXvWScORkdi1RkBRM5KHEyZAbKOUznBh/HaVC+WJoakWBhSwaBU0Vg9AqgHn9F1qRbsvkkwivPHPcN/4pYSlJZ8QgoNaTKXhr+utbrbHs5RPaAOzwCZjgyyw8nlsqB4UnFWoWTKf3dV+X5oqgqkWrQs1Ll+Y/8i7y+boBdEkVkw1eNjZboqFf9L79r9paBTQrWmHwu/9++LD6/yE+X3iz2bBBQnixDwznBAkiILKmIVESLOdXrpJRnra+173kxBiQPVynw6gRMEpZyRo58NPzIGMyNhQyxtTaMomUYMh7HjHV08c9mMywRDN8zR1i6EfJ8ZDyL7QcdJc0fuKDxlJF9lJzzcNrPWsNSghZVMRRUsBABDoMQNmBxVhRlvRqkXlAmgZYLJIbBuoJWwHQ6xVucGc10dVS5pPGjQ4d5VxixBBH4u9iaj5fZXq+3XC7r9frTp09brRZwgU6n02g0GD6oVqv3799//PjxZDJ58eJFkiTPnj0rlUq7u7vAdpkgs1wuAUcC4ZXKDFg/F4tFr9c7Pz+/urrC+g+AnksXV1dXrVZrd3f34cOHoGaj6iBtElEIjON4MpkMBgOgwwDuOUVkuV58OzoJ+K/4Ol5kGASRHobycWDWyNfL4gQKqzixUqlERNBfRlkU9xDoLYYZmEQQxCgUCicnJ71er9vtfvXVV5Tqd1PKWa5WqwcHB61Wiz9NigDK88eZ4IdGo3Hv3r3nz593u92Li4sgCA4PD//gD/7g8ePHjx49Ys36crn8+eefHx4ePn78GK0AIHc/ffoUTjvoCeA7yfs+ZUxlb44Oa62v7ZYyzFwHTuUli2eNtDrEL3GsxdqymEiWhgZZqlKpVKvVoPWB4ZQFiKU5HouWcKTBarYk9B9Y6gegv/QDkM25MlLapA/giCDLgzdxWjX/4bo1S7tkBTpfGWAZ0lZpShRpbbVG1KYyfnSUwbzW2nDZVXzNIQhn6WwS+bUCv6OMWkWyomWsSee8oJAvlKhUjmOyJlZBogMtKnBcy8e2hZInlmgSbct8o4wxqDmhrQ23iEUYsPgkcUxKYcrcsHxtrTWreAevRYxASVELGcUxF4FW1YRl7CoBYhmjcvuUhLpk7OroS7DFCKNgTmVXAouepwKf8jmypKcz/+wi//wk+Ppl4ZsXxWeXhX7kx4EmRZQTjEhfvWJB5snmN+SpOaJcqjcdCDFWQLcLomUqLsHaFMmrQWUTspGihEyiKBRqxVmAmLHdgCggq1fd5+Q416s4ndrwGskXdqYARIcXpBYUKGrX6aM9ur9LO3XSmpSiSo3u3KV7d6hcIq4UsGWiVBpBWQsLPqvtS/a3jLVkt8EmuXYiUtb+A0pss2PS2Yy2o8OvBRal+DiWcbQNyWkIFTLo1HFLK9OGPM9TWhNOI0koSVSSeNYGSvmkbKzDpZ4vvHmoY6OS7KKq1g0/+y4FbS2RMRTHerH0prOAlI7J832lNfEGmCXiOGLBjvGv/MHxRHUqYfI18i3boeRNtPffV7XDAeLVun+lzDpg1yl73B63xy1AfHu8PwejNtwiKvMZZpcAJYHdzaaoFzGKzBIBQJTL5VarBQqe7NAB8ZDlPoGhoKbqeR4UJ8AgYwIvO2NwvE7CX4gb54E3saykY3EuMVnET8irEf6i0xy7Pse+jOkgH+YAGmclU1aWLGB2cJYX6WjMsVYj46Gcyzl+4hI7Zr08Ri7APpOgElILlmjIkpRZgwLACudIDq7N7naOozffWGAWKIPjTzxZFq9gAjV/F4IzUEe545srAbgbzFufz+ej0Wg8HkPMWgYBb8NQS5NkyQLg0A2t02gZAx372vHcJtNp8rfflP/P/8/OaKzVZ4n6KY0/yI//lzwNySREM6Ie0YSoR/SS6IJoTBTTs7j5f/nrQv3X2ix9ZYz2zeXAP18WbZtsQJRPcWHQAYI0U/KIFGlFlSpVStSq0HxOzToMHwpaK2MSiJYiTeV5wTeHydrZMJelQnhIMP4OcHM2my3n80RYZSfGTCeTWUp1R+6xWCy63S4EFhABsy4bVGLm83m1WmVJa+Qw0u5G+o857hNvEcw5I9MBPXlIM8OXUTZaFR6FdyJQPBBasRxBxRuETV4BoDmOdQ/lMZDiZ7MZWFdYVcrlMqDM6XQKsFLqd2PJxbdgkZHFMyl9/s6rg3KBkpY1uFfIbc7Pz7vd7mQyKZfLzPhmMXSA7A8fPjw5OUErRrfbffr0aRzHu7u7nU6HldbZi495puwXh0UeUs6DwWA6nfKA4RIX83HiOG632+12G+A+S2HifJCt4ZWXl5fNZpOHgVM+YY8UqFVw0UKuD1yXksivt6phSoI9ymiso32EzLxQKMD6XOqf8LkxXg9ZnnK5DJR8MBhcXFwcHR1NJhMp2w2oF+pPgOxRrpBmhriNuFJmqZdKpU6n0+12X758OZ1OK5XKH/3RH/3Jn/zJvXv38DmMIz9+/Pju3bv7+/vs5jccDk9OTk5PT+HqKTUcsyZssj3l5lQg0LApo97g0HVl/XItQMxY7Vp51k0kMgZn0caEHaFWq3U6nWq1yjYGzm4uq2uymQlniK4FxwKXmX2ySipXQt4616LD2Ro5E8nZo0/u/rLphFmEDGRI4QKnpwRgvWcTbckjBYe6VJxUECe34xdZJWKVSZLlD2vT7LWOdlLF2KYYsSUi0uQFQVDSpWquWkuIrAnJS1SgRU89e71yfxK6H1h5nKM+CNHw3KxUKqzlihYKLIye5yVx7GldLpXUWy3L/MSzVU8HI+ZLcApCVtRXOOR2HJ+c6niWlJAtQjsmVE7TtwO9wWsrCCgIVBJ780Xw4mXhyyeFvzsqvBzkrmI/DLRtptzhMlGVqERUJMqnlXK1HbsSSK6jr2ozjF2dGVeGyCebpHkwj9LEkZhI8WVPFO/XAsQqgxRnGcRKnJ5dBxNDQzkkP0etKn30iL74lD68d83CzuWpWqP9XSqtAsRMImbJbJkCSPF0foJZ4MwBiGVfqdpctXn/yU/Zn7fAiw5ASau9aM6MQ8W33W63Wi2sCc1mk7dmbi29vLycTqeDwQARoMPrT5LERJFSyg+CgrUVT5UCTeQthrnLZfFFNz/VHu2R2iVbzCiZyGKDzshh0+qiasWYtOuAS+eXHllDy8i/uCo/Nc1JIe8FVKzQTttWA+v7hgjlzGvXAGmHKEdgyrPRWSEUJ+WUt1p27XByKuV0sh1Fa9FhqfX/exGa8FPd4Viwhv10GfEEWZi1JowwbvWEx+btcXvcAsS3x9/7waLD3KyKhZgTDJbdhMjAcrns9/vI7WGJvqain9LokAwjvIDckud5APiQrrCA72KxAAhbLBbb7Tb2AFAVrLXwW4MvE2zr8a+8HzAaxXsJ9wIzW0fi4AzisBQyEFVQgIH1sPM7EnsWn8W2J539iAgnA3oaWHK4OUi3pOKw/BBn45QAsQxfsu43LPVAqY5wsVhknB2PSfb6sRDzWot2IuJNlzERBu/498D+cKMcEm7Wj4hzA26LlmEQXs8ld8/z2AEP31utVnd3d9vtNhEtFgvQMCFpDZ1i/EZGCY5w1caVzvcRHDMyzrq9OFvc/GKx2Gq14BeBEZjqHZMx6vtnuf/t/17/v/1tMwwVNYk+Izog8z8oi1xlSHSSosNfEeWvtaVezqunX1bUiGh6HRnYPJmCoj2ReHiiZSzlp6iQSgH9/Gf0x5/Q3j2qlklrL58vVirXst3w9ENBhYQFsET9HF4YpaIxjGIwoMB8h9lsdv1PIgRL4ng4Gk3T6YOJBrLnYDBg8rUDOjAvG/Af/4AaDGYEBgBrBbCk6duFcQ5/ATCfk8pmme8kyPIwRUQzIMY8rOTm8/lwOJxOp7VajecLAEqcNi4KUwaeisYYkIhZsqZQKMznc8/zxuMxq6wAzoPUOwAmPiWH5Gh/DxQevueSYcFhOpM04S3JBDrn6UCUtt1uA0kEmjwcDsGqjuOY+y24E1OOTF6yMAJZDAfFSK5OQegZIhXtdrter0tQ26FnQj1/NBpBTpdvqQTgHLI5voXXFkclwJHPk5fPFURaFetYq3iIihfSS/aD5eWdhDAi/x6zEmrXSqlqtQopYSJC3QKZJ3AciP3hNuLbAevLScFaK0DnISKxv79fKpUkF7tarSZJAhc73lj7/T6Md7hHh80G5ciRxaqbz+VXU1U0imaVYWW9E4sVsG9ZPHbaaxyG0VqNVx7wmN2FQqFarWJHaDabnU4HtUNGWLjAQ6IrYgtAzPaYjtiRHAZOo48DQzsZslwWuJaPXgf+Rtm8xYIwsm1C6kvIZuFXzwLz1FhFFhITSqfwcLapWWeanWmDTrFaxYg3canUqrVdFhY0wsWOvewskSKtdc7Pl/PlGtXqVhmTRNaLMwAxY6DMMECTE+Y1AGJEU5jmqPlJbfRisQjIGDZTcRwHnleqVG7i6+UgHc66JAsAtNrcQKJDaC0jfpPvlgMQO9VZGX9mZUDlsubsUFlQXyvyfR0E2hi9XPrnl4WnL0rfP88PF96yrGyDqJQGP3miGlGJqLCKDpt1wKQliojm11jqNQUYIyFctaSzG8BlSpWC8TObH/rpcDIZeqYWcdpadFhnkOKbUDRplQufXoKXo0qZ7h3Sp4/psx+R75O1pDV5PuXzFPivRpZSK6xMyoiJ8yIjzeg2BU5yEL4aLRvYkO9nbuuA3U7Wswkg5n3BIelzaOQUbFiI/4MPPrh37x5ymQ8++KBWq+Eti8Xi8vLy6dOnx8fHUM2CPQxKvIVikVCJMSaKokQpZUze8yr5oFbJL5b+2VX1dy9b/+15/SSXi/eIHhLVUtFqWa5IUmp8kvklrdbVSBDV1z7U7Kg2ajLPffeiNT3KlZOoVInvPZgXCuN2Mw58Yy3ISYZHHDOcuKEWF4ucmqtu2KpYDkUWRDkzRe8OGDDc0yn7dbJrjhMtUMam9Xo701q9w8G8WDWpizeb1PFz8dLfE1FIlLuVmLg9bgHi2+N9QocLhQIDiMvlkrMFrKGgBy4WCxSlIUYJBG0THsf2uDBPn0wmlPrXsYQZMpbJZIKcFn5fwFKBHQRBgFCblbOAXl1eXoKrC74ewGJGHgFAcAldNr1mdxTOxNhQXimFrA9Kl3g761dKeUrpwIPPx76FlkPZbcesTJwD2vTg8IO8GvcEcYYEsJwAXTY4OxYiyDZxcJrHeR1Dfo4JrEMTyPJQWO2XueQAZYDtMq4q38WKZs7ny+5Xbs/kIrN0uQXPdH9/f3d3t16vA7xA/QAAcbfb7ff7oKZK3WS2W9w+5vGAWFxY+jsx0xmIAJrimYuBtxcLZEzw1dfV/8dfNOYfaaoS7RNV0jTGS5sTw9SagNJYzZDNU1JW1+bUSZqWpBxhkh2LaiUpUhOqF+l//6f0f/p3FEZUq5FSWpJwMRFYC5hbAbJsuLXECsmjB9zDzGLP8/K5nAdiAN5lzHw+XxaLVohLALXHygA1CQ7jgK2A3YxhzDyCQqGAMgym8CvWlYBFJMPlrVc5R8x3C0rFswzc4X6/P5vNSNg5YjTO53MAahg8GCcAhXHJiINRskKRA9Ew0KJisdjpdFhwYDQaYTYxZI+nwBqXJHQ/3jk0zDQxR1KTJ68jjDsajVilvVqtgkEs4TCt9f3798vl8sXFhTFmNBqdnZ3N5/PxeAxu3e7ubrVaRQWReZ3IH7BxLBaL8Xjc7/f7/f5wOCTR2QDC9Xg8vri4WCwWZ2dnKF5+9NFHrVYrn89zURADKUmS8Xh8dXV1dXWVy+WwfHGZjXcBKVUvu/tlziwNoGRpDZOOObmSqM4FG+wISJBgJTcYDLrdbrfbBSkVOBQW2Pl87qyxuBa2QuUqoO/7h4eHBwcHuVwO8PFwOASfEc9rPp9fXFzgHjabzb29PaDGvO9A4vn09NQY0+l0fvKTnzx+/LjVavGow52v1Wq43slkgovq9Xq/+93vXrx4wUaUEml1ukolLP52ef6mfgLmjDN9WJJzJejJ0Em2Tib1W7lwK11MwQjrdDrgiHU6HZaMdBTwpU4Ua+bINRZkXrb0dKzeWbqaE2xcEd9VjiWcpcABiLGAz+dzND1wV4cMMLBwSYF4WVl0+FnXC5G11pjrO2etopQ7rKwLBNM6gpveAJnZDMv4tRxFiQg7DGIAfHGqFWCJFKmcCrRfyOVLQamirDXJMvFi5UuJCanlzasxFyxBC2BKAQIDkAkcgBjNT9jaEJGW3opB7IzPTSrSTufHdqHqTSqftE75WoZ22UZv2estZ9C6R4XbS56nFOkk9iZjv9/zB1fe0mibI/KIiqkoRE60T3F0ZFM6nsP8ZTkIftzxqsbIWloxrfKCAfjalOKnVoeTXWVcrlWNWIv2vg1pfJXmmRAZ0kSFPDVqtLdDnQ45kuDO/V5rOCm7+29i80VvKPz63h6y48dJV7OC747EogMvZm8X1gGUYyuVyuHh4Y9//OPHjx83Gg3f93d3d5vNJhaNy8vLo6Oj3/3ud8+ePcOaP5/PET7VarVyuWzTLGypFBWLutHIt1r5TlPViuOp/22v+dfTzm9VfXzHjz7S9kdEjbSkEYj5YgQEGaUzKNlgT2dvzAOHQ52h8ST3tNd82a95U1OpR/3lqFbR1eLY00bpiJRBfYLXGWzHnDUjr+f6BAPuoA/zt7FhuxQKAxSAaJNNhmVs5vRHOsJ68qFzwGCtVUToT3o3Ax0mdbmUQbzFpC5OlWoS8YxgUnfLIL49bgHi2+M9ORzlBOx5kmiAbJzlAjjz4XQ6eyCBVEohrQLpiVdtrPVIYPr9PnZQ/sAoiqBkCiyg2WyWSqU7d+7s7u7O5/NerzccDlGGxeccHh5i28B7Jc+CdQPBy+N8j1IHNvZwYKqOVLXnrAw7HMOISNdRAsV3sf8bkjcpO8gd0wyag2WM5qNisRjHMRISYKAyGZPYK3fRAmIGHMBN6EBv+fKZjgQCC5AFJjYy8YTfJclf2SZEJmcxpMtCZsywlvUG55yZvi29UyT5ixUzAEc2m81Go7G/vw++OQYGHhmasy4vL8FAlwImjsHO9gHPwA2lDGJmDPH958cteWdae76noQ43VR7ViWpEFaL8qnhcnNaH7aoOHRQk8mn2olNM2eFbZfhTNiYbUaloyxVbssjbiY31aJUALkEThw26Nu10DG1kX+E1FxK+YYJCYq3lyAsrBksiMG2ZHZxAp8KA535VpgxDxxNTDOOTAbsfaJwtaU2OsIBzHySPj//K8wvKA1yEkPOO0XmHOM9QJmJflMpkgUfOIynpKC3LSIg/ykf2Q1y/tuRRJLRcucsPoJsUYGGgEwxKMFKTJBkMBldXV5it4/G4Wq3euXMHLqP/+T//57OzMxQCUds7OzuDwTdr+GJ1qlarlUplPp+fnp4+efLkyZMn0LXAyAFbNpfLDQaD4XA4n8/7/f5isWg2m5eXl+j6x0CS2s3cyQgWz/Hx8YMHD1CFwiJPqxoFvObLS5a8Oanew89d0mHYipNlASgVIWGCc6/X+/777y8uLkajEVciMY+MMQyUYxIBF766uur1eqPRyBjTbDa11tiXuXyLba7X61lrz8/P5erKODgKq5iGvV4viqLj4+NvvvnG87yf/vSnd+7cefz4se/7vV4PN4f3a2hqj0ajXq+Hy7y4uPj++++HwyGWUCmYKxVLJF78RqCDTfVYZY+8o7gqV/6szD13CfB+J18gP0FKLaE6yMsFZmi1Wt3Z2dnb22MSMev5SEdQSfd2ZCIko5kxYgglOTeHsVp+JbYhySzGduyg0rKMBD2caXqgoMVwP/sWOmKyDm7C0NIrOMkYSzZJjLaJsSoha2Fap9cBxLIhRm9G1qTohNlKInZ6oqXcMCOGSYoMMhXUEHmkjPKVF/hBIV8oamOt9YyOlIfr4y1DLum4pSgVYz/CVEIkjBewMjUAYugpQZUYBWZjjMrlbqpBfOO12gG5tuCD2X91JsgPgQUlcv3a4qsmq8iSUpaUMSoxysSpmK1a7YjXqyIMrwVV7TtSXFWrNGH5+SS0Kd6IGvz2T/r6T0ukFXk++f61APFNimpOpSfLEtiODr/bAOPv65BldRnxOlVwyZKRhBXea7AVOgQjmS/n8/n9/f1PPvnk5z//eavVwrpRLpeNMd1u98svv/zqq6+Ojo5OT0+TJEHc22q1sKEUi8UkDKPZbGntpFg8e/SIPvig0m7X65VS0Z/NvadB5etS42qas02yd4naKSXFpAlFXhDnJUCcS1dU+STZG82sK8WpjfMisXoW6tk0oCkNYxN/5+tYTYbBTz8f7u4uiwVFWlsDxPWViRE3H0gPXunfwAxixF1SBoo3KexTjkcIx13Sv11i+tlfctmbY10Tx74x9E6GepgyhbMmdWoVl781qbs9bgHi2+MfRIlVqtAiXQEowLTc+XyO1RzMJidJ2xKjBEGAxmqpxsiqvsvlklICLNN/QFhGzzV2652dnWaziTxZaz2fzyHhFARBo9FAZz0zcHl3YbIM6pZM15XMVhIudrxncHsyw1i4D/hk/g3DrLhvQHi5NdgB3/PpwY5n+BxwjcFVga6utAdhmz6nSRCd+GgldnhGJBqjpJC/5DtzHyvj2lzFZQiD2waZkgzRPQZSGWN10GHZcs46nvJ+Su4wm65I+BsMboBHTo8thICBGQGoYlDGiYO3D0uO83Aza7UaGEAkGHMggRpjMObDMCRLQeCT0bMlzQuGPiO6S1Qm6hBViILVdEIJUjBMVGRYYNKisVTEkwmSTX9vrjOrvDY2jq01cay19qUnNQvsyor6a5NABnEYzMIthbwM8uTr/DaKCvn8q7xC61wup4pFxtdgAgaNVKAb4EyBEVyr1YCnMLMS9xb8NeAsLDyNONIJ1t8m0RPh4FrqNP+ANn8WTmG4EMxozDL8EqWyXq8H5Y1CoQCaGLoNeCngR8OLHtdLGNzh4YcVstFoAFRFRQSzElT3SqWCWhSDfUyvuEk55C3oNmxlk8WemOoL0BBsDvwTdCS4obJWqx0eHlprj46OfvWrX81mMyySzKA8PT0Fc7bRaKAXWwJ5/X7/+fPnz549Yx0SMJQxYVmOhlKyJFQvsNpII1CsVIBslFLT6RRK2Xfu3GFdY1wUl1j42QELxt3GGu7IDTOxlx90dkmUMhoMoIRh2Ov1Xr58eXl5GcfxwcGBHIe8+LD0BHigo9EIfTbFYrHRaLRaLcg7QAsY4ki1Ws0YMx6PIbschmGpVLp79y42UNb8UUotFovj4+Orq6uXL19OJpOPPvroiy++2Nvbazabw+EQoijYhTudzt27d9FKv1wuIa4SRVG/359Op1grGG1fq/Ivc/U3AohxZ/VmLIO3cucpZL/F2ehZLpmRXN5wAYVzJRV/rdVq7Xa70+k0m030QzCI7HSwyp1a+oBJjBgS20D/pc44txlhIGEDBefdkWjnC3FQDH4Q3OjAbofcR8XjPBAHI93O+skr2ysppySxJlFJEpNKVGJVYpWxah1BeK0Yq94AQFDmLQ5yYTdggkYwLs2qykQkFAZ8Iqs0ac/zAi+wZK29RiKdSc3PgoQWB4IBphHw7UI5ga2MuadE+jfk4Rz75huZbL5+UwnvLODriG5n9Ytfu59myzNMqnAKLauxx7W7IeiuWhnPM0HO+nmri6mbnL9aINfrRtH2YUPrXBDXgr+0oUSh1oG/ah29XW1WSsnWPG6oL7H2ZYYoIZNQFFG4pDC6EetTbTgo03S/5VnLSGkt4vbeHmsFu50uRubBOEX3V5ZxYqjLjiKZwsgVu1ar7e/v3717986dO/V6nSuyV1dX33777a9//etnz56Nx2PWUex0Ojs7O+12G3tNYgwRLYyZFosvHj4cfvqpatRzQeD7KorVuBWMHgYmJsoTFdIEgRMKTJ9A2HIawb73Mzae3tYht6VW4ZHNXWPTkdEXl8Vfj9RyqmqVabk8y+cSsn4cB8y84VSamwyQbhAR80Wk0QIRIfuQBDUuk6+Vm3PU85zFc614FCengAlMknjvqhBiRG+oFfrCXqr7oV/dyeuipk5fRukLbo/b4xYgvj3eqyortzdmmT7MsWU6zFr/0E1InGMCJoXtrLUopSLCppT0x/sxoEDgKcB5wTeEriK4t0BwmJnIcGFW/9EJrx3KpOT+MAAqi8bc8U1C/95hC+JbGF5nEFnq6ztvRHYKBWEpmOhkBfLWAbyTVVNZA3eiOgef4seNe8X6GEhFXjlRrEb8bN8n67eOOy3nw1IU2Dl5R5KS02A55Jw2W7ZZA4tKamvI5sq1eqBbUDDOkKEs2Wg08vm81BoDoE9EMChbLpdxEgeB6fdzX5/kvhzl6Y+J9onyRPtETaK8CAsopQb7RHmiYhq0xSLfMJn8QfJTOKRLSMW2Vg8/ezjdbYXTiYpiL58vFQoFLuFsyhDkM6KMcCeDKbmU38SAiPNeL0lK5bIWPu/1ej1uNFBjGI/HWmuohENzHGyLQqFQr9fL5TKasgG3UapLwP5Okq/h6IT+QB+Jte+VcBLmwmw2G4/HbEPnsBE5+gQMd35+fn5+HoZhPp+v1+v1eh2sVZlBZZXRJIkS38LTBEh6vV4HOx7IETCdQqHQbDZbrRbczJhl73hUvitoeFNmJYs9QGAx9rhixLAjRGyICLd0uVxWKpW9vb16vX56ejqZTFDygQwCEVUqlUajsbOzg9mXz+eHw2GhUBgOh8+ePTs/PwePtVQqNZvNYrEoV13ZXQG5hrOzM1D2qtUq81bwAiDapVIJqBlsA8F9lvKaUj4Ir0SpEpcshTgk5gIgFWOeay2MuMkSI8tQ9Hq909NTKD+g7ApzOchKcJ8Hvmi5XMKYrtfrJUmC0QJx9vF4PBwOgQ7P53MueEDGmvWIcQ8LhQIsE6+urqATdXR0dHFxMRgMOp3O4eHhvXv3oCNxdXU1m81QGEYhZ29vD16d1Wp1NBrhG2VJlaetXOpJGMJskn18bWRijLEZZqIEOOSOnxXflBZDjAXze5miSyldGlXSUqmE8YYEtVKpNJvNdrvN6DBXEyVsl1061gojOkJSqFJICJvJ15jpqAHgXU43NKfHHLfwdeHSMICl5gZHeki8UbTmHg5nycLls1xp+riNihNl4sTqRCeJToxn1xA/aZWMqTKCrVlkzW6G8GidKsVaiQmpLxGnALG9howVKa2153tEZKy2VltaGVeyJ11GLxgY0oARD4irOFJYxim20ZvobuPFVnS0ODLEDgqm1s2OrGSEY4PMj1V2qDhhmDwc9WG5k/LA4Ehy9cSunc0wLz1lfC/2gzgoxkHV6BqphGyJKC9gYu6ad1zg1Gb0Kit6bDfjv1rICm8BiHXmk9W6F9PWF9xkJEsMLqsGEFG8oOWC5nNaLCgx1td29cvWo8MycpbjJOuquolA4BThrt+ltXpfycVr9dmdki1lfOec9IFnsTQE5lBQrpMY/L7vt1qtw8PDDz74YG9vD6KIXDV/8eLFb3/729/85jcnJydJkpTL5SAIms0m0GFY10RRZKIoWSxCa6daX7Val/v7plR6dWHVlYIBLYjCdFmzYpqwGJuXsa1bO2W26K6sfQv0watEBaIFhVf6fFAo5EuXfW+xjI2JLFEcKyLFinQyHnAEuDhx5pZcZodIzR/mGm/HGZwq7KZihtMxSUq9y3FcSFct+c25DTPdz0xfyKn/vR7/7t/9u3/7b/8t/7XRaPDPf/7nfy5f+R/+w3/4m7/5m1v07BYgvj3+MR/SlYjzK6kkyw3UMsuStm/bD4kYIj2TFVoQweQ2AICVd2t014JDJ/lrjCqCYoOETWZNkiLEXZxSjVQWMEnQBlk+2NFY4DiJBeko7eJHukVEbLqFnJM/h/vo8S7H/gggET5Kyr/KC3Fan2T7qsxkOMPk6ivHNM6FMA7O0tLZ1t2s/5vTfyrxa/m4s4mKpOQ4L3OQu2yoys9LCjtyGCE5azc5uCMMB9rkgXkBHpV5MgeIUPNMwunRy8b/66vi/5dq9D8TVYkUUZ2omdoLSGE7ByC2abcRCYA4G+E7coox6dDu35v/7/7Hlw/vL4+Pi9rzK5Ww0WjgVGnVrpcZTzxs8KxplVrOIx9oiDGmWCyyYibfVfzsJQkAMnxF4HmddjvudDAOC4VCr9dD2QYSNMAKJREYCwh+I/NSwIWONAqvNm/Kctp+MPOONV7xSyhr85mzeRTLn4FFvlgsrq6uut3uaDQCzx3SkyCWcnosJ4WErmTLgoS/8RY8BTTygxILKfZKpdJut4MgAKfYBc7eUZLGU1KuabTafc/CGli0wzA8OzsLgmBvbw8ujnyXptPpb3/723K5nCTJgwcPdnd379+//+zZs263O51Oy+VyGIbD4dAYUyqVut3u8fExk5FZrqTX63W7XTwL0GDRyl2tVovF4mw2QzMBa+K/ePECNnSLxQLmMKwiit6Rcrl8586d6XQaBMF4PO52u9iJMFZRz2ACOMtPD4dDFAOKxSIWdq6xkejBR8ESyhLlchnfznePJYMZN+92uy9fvgQV11r78uVLaK/X63UQxpnaPBwOz87OvvzyyydPnuCcAed1Oh3E7r1e79mzZxcXF9CznkwmGJ+oR+JUh8MhONSj0ej09BRs7jAMLy4u+v2+tbbT6dy5c6dWq/m+Px6PB4MBbAO4/0bKzoAhjnmKC4d+FGaTzL0ZMJVVk7cYnZThPGbREE78pCm8lAHh+hNLKiF4kOkiXgyuNPJ8rKXVarXRaDQajXq9jqEoybxyp+BLliNkbTjEGa/00+NYhd/IwvoMEGcxIC7r8slgDeH1HC/gbRRjA+rDLDGB0SLjDVap4tU4SRIsCjZJksQkZA0lRhkis55Z6YgGbO/Kf60Gsc2gGyYDEEtvOhalvd5JlTJKkfa15/me1spazybaZCQos+iYJDpInJ2bpp1Kp4T7lVL2xq0eSmulNYlISZLEs0LDUgNkrcGA/ASWBUOkypQFxsKcuqCz/0qmOY9/Bn04L8h6WlhSisjTpBVpMlolnh/rUuJVE69hKVHXOl3lFNgKiApEeQET6w3VhU1OhjYjFiH/9zK4jBQdJkG3VCm/z94M/11LQN6CI2dPwAoZ4oQoJhtRsqRwQdGSwqWJIuP7loisUdaS0ms4lY6SG3faZTOgTegwZTTN5djWb7eS//4zWdk0KUkSPH22KmWvZzXJ0BRcCl6KsVyjR+dHP/rRj370o93dXV5I0Sf07Nmzr7766ttvv51MJmh+QlwHhS4UgOM4tvN5OJvNiBZhGFlrN8W6WuC/PGKlko/N8E4owyBeu3i+FiA2KUasX32jJYpJJdYamxiTWBsniSJS1upsMwH7u7CMj4QgsEDJlYf5KDeqq60TlaYNujevrAi0Jt/X74oXr4hKqSudTXncUbrgGFGa8lJ8X6dPkIhiouLfM4n4gw8++OUvf7n2n5zfS+z49rgFiG+Pf7SHZGYxUsBaoiwVxC7qjvv2loNlRoHLoEkWDZuonZZKJSJaLpes74bMH2lSGIaQXIR4Jdb0crkMv6MoiqbT6cuXL621sAVAzgNaLqVd4ejQ5C4V3plkMCEZW8zvkzETOykxvoMssVgsskcBl0CRmEkJYzTUcBoJvhiLVxIRnAqQCuIOTKdT3OospwN96AxmkRBWBvqJ7wIHClE7bimDPmArA61jDzrH9p2fiGMvy1rVDmrsEFIcDo5UL2VuHaWOBLArHI1G8/kcaBGeo9O4DfBiOByiERsPGin0zdvt2ZmKgUtZsQDqyoInaAeLolgpPZsN54uTy9GyWzmc3yf6J6kjBBQkvEzK4aWpDgPEstSfrMt7TRo3mFd8ARWTpyPP689m49m8qLVfrc6Wy2W9Xke0yqNXmhM6yLsDWPBYklrYYKuBsLbSdhfHUjlEe165XE4qFZ47Ozs71WqV7RCBEgKoQid1tVoF4IKRhhZ13Gd4KOGhoLkeYJznebPZDH/lmfvWGDEmHfh0EOXkcoUk/bEdIhAZfCNY0tPpdDgcAgtjD0NeVTBa2K0LeTgXvaTSLu6qNIKXGLrkULA6h9SZxfi8odz2m1JvnFqLrDZhTcPSwSt5v98/Pj7+6KOP6vV6kiTdbvfp06fff//9V1991W63oTryk5/85Gc/+9loNPrtb3/7zTffvHjxAitYqVTCR52eni6XS9wH9kiUNDRAz6PRCDaGs9ns6upqNBqhOAE19pOTE2hHYLk4ODjAOsNLU6fTgSsghhmAfkijwA0Pcx9AKp44YGUYvsnbjoHBvp0oWEI6fz6fVyoV3EN8MmwbiQiXAFZ1pVLpdDpxHHe73aOjo7/7u7/7/vvvDw4OfvSjHz18+BDL2nA4PD09hUDHl19+2e/34ffi+361Wp1MJj/72c/u3r0bBEG/37+6uppMJqgijMdj1HswZ+v1erPZPDg44AIYltOLi4uLi4vlctnpdP7gD/7gF7/4BVT+oSU9GAyazeajR4/u3r2LPBayTuPxeDQawa7t5cuXSinIrQA8chDMrCn8m2LEbjlXwFVOew2PFtmXgMHAkrvY2ljSAVut3K3wYqTxrGedy+VqtRqkhwH9Y6Fj4wSHJe2st7yrSjVGh0XFaxSKFgws0qrWgYzQGPVmqEJq2kgFZPm9eC/WLhzcvyUBaE7akckzffh6j7KWkoSSJCGVUGLwJpjUbdKXWAsEvzbZ3vLLLMZhX2Fqr6DhMKXaaVI5UlZ72vODIJe3ntZktY2VMSvM3LVUdwmrObVzh9wg4Tk8ArYxuOE6TNegqkvmlcUGZ4uXeIqjeSLLJIC3ILaDVYsfvQwVstEmrppF0jAv2BaSxx4zG+Tqrb1rhRilKYloQWoW2mlkloGJ62QA39eI6kSlNDryiUr0CjXOC6u6LVzItRixFh50fuoHRRkGcZIZtzrtCrfravk3V6ugrYiPWoWGnbFNpLUljwKPcsoqY0xsoigpFIwiSowyidYeOW0TsqM/WwbOVheyI1+Wn52ey+tbq95LhHhV1Yc2UOk3ocOOQbcUxOPeFCSY3DWFHaRWq+3t7d2/f//evXv1ep2/HVEENvGTkxOE2UhteOoh4Fwul3a+CGfzuaJoPtfLpRfH8doKmUkV6hwlOto6O7JZht1AIt7OIHYqKAF5JVssx6VyXMglnk7CyEsSgNtWKSvJ10yGyOfzvDFJCOIHOo6sfZSvRSdIa0JN7p1gxEGq+MEJIP+V1wFG9vlyPfF28/dsUvfs2bO/+Iu/kCjwF198gZ/l74kIwfbtcQsQ3x7/mA8Z78pAU+6pIPqhGZYT+JtQ2LAf1Gq1IAgmkwmYevgl97Y3Go35fA4sCeARc2mZCzOZTCBviuQZiC1ePxgMYEDETB8IVmITAhiEpnjOzcDPkgV2QANMnQNUwUITAImAajGuWiwWgeYABIfEKpJkbIG8Lzpiu4DhpIgEu10hGQOgXCwWp9MpPIukuIc0SZexi+QISwlRpmyzOCwJ1wV8I6VNqSyxxwxo2XHpaG6Q6CDmeJTtrZx2SCc+w4cArcOf5+fn3W53Pp+jjRce8ZBoxEhYLBaTyWQ+n+MpMJ8dKDkTxm845injU+yQL3h4p9AeRZENx2YemqRoqGmpnJaFvQw67ERdHMx5ogJP6xIDWk1ILJElaymJ7XKeLBah0p7WSRAE8/kc90e2va+dj/Ki1hbSgfizrAdz5NnkTRHp7BtFDyNDMIx0IHUE7dQhFPPqAYAY0CfGG36J/JM1prmc8AMl8FiXE4eEXXiEy1Eqh7oUm+NlRMJVlHYz8FCUTcdrGV5ZuxgnruXinJPw//52AU4OpWEjZ1wYD2EYAvSsVCrQFbm4uEiS5Orq6rvvvvuv//W/fv/99+PxuFgsTiaTwWAQRdHOzs7HH388Go2ePn0KEYnd3d1GowFBeayr0qwS95z5JtAagiou1kaAldzyDPQf6uqwcSuXy9wXD6kTKCTI5wWOcL/fv7y8fPbsGbYJJG8YpTs7O59++im874CqkJAGwo0Cb7dQKFSr1X6/Px6PoVKN0ma32+31etgR8HpkmOgwRZY4HA6Pjo4Gg0GSJNCOwBfB9Pzbb7/96quvrq6usKRDjOL8/BwQ8LXv+XLJexbUh3n/4oYYlFfhbod9fDgcAivvdDoffvjh4eFhoVBIkmQymUAPBBAzSrla6263++zZs8FgkM/nP/nkk06nA52Q6yYDz8OTStaRH7OiKzctXWP3TCdRVvPXyS0ZOeVByx6kWEAcyjBuFHYZ3iVZfh1rGqIULlzxo0ddU270MnCS+6bUp+IbxYuDVEV87Z4lRa74hrAQk3MCEh+UTbvSKZejDsYB5T7OBo9sBKSUIrKWrLXGkoJH3euFWdWbQMPb0TS1obBKGXKcZBN7YDkrrTSegNbaNyohlSRGxicOQOyUVB16tSPiT6uyV0yfT5LE3hwg1ppEdSGLxTmdXrROX0vulVwLR38bmqUwwhnt3WJ2JwXEnOoLdyaxHIqULLu+b0RaEykyCU2namz0YOaf9f1BpBcFZZpEPlEl7VtnL98iUZmoSFQgygmAeEvZQGUGm2QQeylGvBYgdmSvJbZrBKt37detPRPnNG7is8dQtSaypAxpzwQlm/dso2raTVMpJZ62UZQksSVFcaQSo31SbP+1Nopw0GE5hLasM1te+T77163VElwzxTbUgTZVMR1SBTfdyv5R3mXkjZKO7lJOQS7IKTshMUlsPU1kyZrrdTU73O3vAUC0b7gIiymjNCnNv7NKWaWYcg9/61dmJwwavFt5tB8+aOhdOcMpQQpW6TqTI4rT7C8RJGItHOrMjReK3/PxZ3/2Z3/2Z3/Gf/3lL3/JyhL/8l/+y1u47BYgvj3+/w4glvp9sqGDQ0NsckSE/BOQHLa916I2vu+jmwbtq+ClIqc1xlQqlXq9DhBzuVwCgCah5okiLYAJBoiBKAFrRl0X8S6QWeDFaIgGQMz5Hji/UrOPPwGJH4AqAEl8E8AUm06n4Oeij5i7RIFZgImJVI1TBZn7yQ53sCYZJoZyKzrWEWcAO2CkDE3xzCpCosuiwOzuRUJpjg3x4HbFObN0ZuAk0BkMHNwwTdipwDvt81nRSRJWafJfOQnHIxiPx+fn50B/vvvuO5TZK5XKzs4O6LEQLUXKMZvNAAwxTscICNu73wQgliBCFneT6X0K4pOiRJM5v2o8+XXtJGxd3G3FOc/NUWWXIieoZvX/ZFUYkdYxR2IhWHzNhFI2VItFPB5PErvQysPIB32YFVGcltK1YXG2Ss9ENrYDzjoCK9/3hMeOsXa5XNow9NNRJzEgDgFBhCcizEHAIoyi8hOU7kkYNgBwcbaYzpzivvUqx9RXNjmUvdhYx3hsYC5LM0kAfGBIYcozTMPACi8ReATAVpTAtqRDlFOW40OCpNkM7YdgbTe8S5L5KClFfAJwJwN+WigUFouFUuri4uL58+dHR0cvXry4urrie4J1uFgs7uzsQIwYDE3Y07EHJo9M2dXBcBjuLbc55/N5FBHzqXEig8tYWsfjMeBglljFfHf8dphPulwuR6MRFH7xSqzAzWYT/oGQWUCFUradyjUHJ+Z53ng8Pjs7G41GAKBHoxGcBjGKJDYHePHw8HA0GoHMy8Ia0J14+vTp8+fPB4MBdhy+pYvF4vLy8ujoCB/FN4f9XRn3zOVy5XIZbTrYNLGiMrW5VCpBgR2LyXK5hDgy9tDLy8t8Pt9ut3d3d5MkOT8/v7y8xHPH4iz13NeuLRJ5lEq4b5aKCohTQgA8gxjZ5PHDULIUyJJDmq3GGN2TB8PE3JiPqoAUQ+TkX4pXOvujFJ3gEgufAGNzzEWVPgqvxUHkbr4W43OqgA77mA9e6ByA2Gmvud5W1n6LIlJqjeql2gzv/t7j2ixFTilSWilPa0A0ntIeKQxG54Y7e+jan7OyJ47KPw9RA7rcDYY92rNpXX909hFff/gqQU9W6x1sl1WnGSCWaG+2lpClk0sonMse0iORqQyv6ouaUFKIIjWa5EbT4GxYeD4unE6Csa9NM8WCS0SBAIgLRBWiUtqeFWwWVLWraK9EZiU0/EYAMQmL4DcCiGmDXZ69ASRnxTcSkaXAt41G3PSjg1b8wd2k0zK5gOLILpakFCWxMsazVgkSg9qOir6+OJGR613zCVgE3le3OoebckOvZlkfkhLkTp0GvAcZg8FkGMIRTp0JAQm4CNILlPWOUv5EFC5DikJjQlKetrEmo26+O9JbrasOi+WGDGLnGzUZRWHo9XvFy24x59tc3gRBSFZb61njWfKsJWMs0RorS4eQcRNCz7utJbz7wRcRaaKQKLdqOePcwIioQBSn60ySEoZCouC/4xZ5e9wetwDx7XGThZJBN2lmzUkXt58j/QbkOp/PuVt/y+d7aEhPEhjssLsL8m2oebIlne/7g8EA3BxgOiyhwDkbfo+DNQFk+xuJ5miJJGJr5/2JKYEyGwSZCN3iEK9kiVJ2OQdfmKFJKITOZjN0nkr5Komo4vVJkgBkBxkWyFQcx8ALoFaBaANJOJAyRo74YzkvRcguAWLGOPB7qDc49q8ykXaKBDLBZlxboip4WdbFi9Nm7nJl3C2bZgCAgMLmZDK5vLx8+vTpxcUFxAo6nQ4EMRnyRmSG+gHzTPkOwDLrhnVpiZ5zHy53PEnNgdTkZ0F2aWx4ct75f/+nw66qTorFOPBX8hNJawIKHBJFqYs6KyFy3+si7WrMpjrsuo5Xzohm1s7NYro4P7sYjGae55fLZbR8EhHGP8oe0k1R2vtmE9fsSOCfWWj1VYYZhlLewRozn89psSikS4d0d2RIETaS8/kcDwvgFBCu6XTK/FC2SEKSg3mH2gnEK5h5get967QB3zubzUBaZ0wNlmVYjkDtrFQqTIdkHxLQSIMggHMaq4pzuA9VDQaIJW+R2dkMEDNVHzeWpW9Yad1BxOQMeucUHsams2kSpzoM9k2n07/7u7/b399//Phxs9kslUovX778+uuvv/nmm2+//RYlQLg5wc1ssVg0m83d3d3Dw8PDw8Nut8vLOE89KZvOf6JowS5wGJMw8QMfB9rZvEChI2E4HAKhzufzjUYDlmL4OmZGM6mnUCi0Wi0i6vV6jO+HYVgoFNrt9p07d3Z3d2u1Gh4uM+VlP4fneWguAUt3b2/P87zz83OsZmEYFovF/f39TqcD0LlarUIzBKVKSBb6vv/9999Pp1NICdfrdc/zjo6O0Jo6nU5RYcV4K5VKKBa+fPlyOp1WKpV8Ps/iD71eD/IphULh4ODgzp07h4eHvu/3+30Me1zL5eVlv98vlUq7u7sff/xxq9VCue758+dffvnl0dFRtVo1xpycnOTz+YcPH/7Tf/pPq9Xq4eEhAGWoIWEXQ7HHkXpwEDQs4PTmLHiVaYjOmpI7xEnK8PEdlE3CZw70zEsi/0avO4wwEMs6ajr69TxEnQ5uWUXOnvBrSXDZAtJ2Yc3s2x00MNtMQxkV2m1QhVoL7f93x4W3jyUBH6aX9PpmZGfgbVe3zBba32jMM+ub40a9qq8iBzljYQ7Jw3Ev5KCLSx1YoiX6vxYg3jJheZxLQoBsQTPGWEvWGq2VVtZYtVh6Fz318qLw7Kr0YlZ6qfPjsm9qiupE5ZQmrFKAOEdUEkrEvrDw3VIGUBlAVgmJCcaIKaO7qjIMvkQU+7Nszi2M+Owv9TofMCtO1YHq8KXa5vKmVVo+aC4e7S9/9CDe3aFczosiNZuDxq/I+o7F4ruCvaRmcfbZ0/sypzfOOxIuKSRaGKVEuLOAS4icezKcBRnZ6CstZq1rtdrBwcHh4WG73XaEBNFCdHV1tVgsYHZSqVSQ3CHGns1mk8m1l6yOlv5ibou+UpFWdtvNdVwW9SpTPsmoD2dpKDyq5Z/qBgCxFWoJmiggk+jxNP/k22agkzhWdw9H1VpojQ5jP4mDxPhYBKx9xY1AZyFHcZy2OOTrLED8+0B11TucM0SUJwpXH41PtEyXLyYL+ylMXEz/mqRrzu1xe9wCxLfH+3M4cSe3QHImI7mB4FsxP/eGhE1KO3NxrCiUaQ01NHD60CbMNk0QJ0WXKL+eGzxZ5Jf11IrFIp88owxsGiA9NKQLLXNpuX0YCS2uEQqVURShw1RG3oyTcm8dpRoOjONwdCIVPMEgZrVT3EbgYihKM+HIwZdldZrNf6S/ufRYgEAqMyIlBJy122Zgl5EgymjSUaZ/Nrt588NlArIM10g4EgANHI1GwDUAbXQ6HRDuCoUCPoTZl4DFJR7kGHMDYX/tgATtzvd9EO6A1wNzARQFVYTFYtHv96Fw7XvRbDrrzRvHi51RrmiRvfir0ofsKwL8d0m0JArTP6GEGBEtiOZE87S87MTakji8JFoQTUjNlJqoaB52L7tHz098Pwdd0VarBWYrBr8jfcijNKtX6ITRDOUzUikLAMaYa7bIKnqYJAktFkQ0mUzQ1w+oiIV0gQJDRgDOY8C1QdhE5SMIgnq9XqvVMESxvFy7dliLkYBo8o0kd7NAleTLY4mQ3D0Ax9BKLpVKOzs7ACJRGYJMAfDHZrN5eXkJB7lmswnMmq0yIRqulAJVGdxJJvvjrwAHESXjPCFpxysPoH9MAVn7oVUtl3e+C8j75lSMGGVQSvX7/b/8y7+8vLz86KOPoGz7/Pnzr7/+Gh501lpMrm63iwv/yU9+cnBw0Ol07t2795Of/ASJE0B5yVjENXKbBa+KcntilWe2GuMaJJIu4NdnZ2fWWhiL7+3t1Wo1DEjY3CmlBoPBeDwGyg/t+MvLy8vLS+j5AFr9/PPPHz9+vLu7m8vlptMpCPvQEcK6zZzZ+XwOVYdisXjv3r12u50kyTfffPPy5cvlcgne9IMHDyCtzr0mRISksdFoBEFQqVRevnz5/Pnz4+Pjs7OzxWLx4sWLo6Oj0WgEvWaUNCDfH4bh5eUl/P1KpVKz2QQir7W+e/cuijFJkuzu7t69e7der5+enrIsz2AwODk5GQ6H9Xr9F7/4xaeffvrpp58eHh72+/3f/OY3v/rVr/7qr/7q6dOnKDjNZrM4ju/cufPkyZN/9a/+1aNHj+7du6e1Pj4+Pjo6+vLLL7///nuYDYKYzI5VlHqvSW4sD7ObdpgKnpockGtxK4n/SlhT/nVT97SD5W1vss4KONA6hqnjLZY11rt58d7ZQLMLnbOe06qGknMOzv15o7X0+tJoK0hnMyCd3SAU+w4AoXU8OLvOi+m66Rk77TUcCAGnLbc9OzCyyMUPFD7KXhCtlm+zwg5SDgg/8/BmkofsJ2P6MB9sVOgY60lPQufyZdi8Hazh5ozEGEXGJsb6NknUeJJ7cVH63VH+q271ZVyetIOoreJdZTup+jCHQzBvKBEViYqpwYN3A/smtdrB7eDCQWoepVaxGCtavEkAylrAxHYzWXj7b2iDPrL0wXPAu4goIRWofCHZOVh8dH/8+f3Jh3fivbbKBcF8HiyW1yRnz/NySZyLc6imO8YGWxax7asKV7XXYnNWKbJWv5cMYmcZlJmmowbGbAZOIXkGIf1kc2y+dqSEoJXgvYVCodPpfPbZZ1988cWjR4/K5TKCQCR6X3/99W9/+1sobjWbTZTJ0UuklE4SM59PJ5PhfDaKooWOTByr2FRjaiWqaGmDKi4r2HKdwwjlOpXaouiMFM8mh89kne6tXTew7ar2sU9UImPVYJT/b7/eO78o9obBz+fJ4UFiScWJ1XrpeXM5JcDpkSZ1Ur6Me1zWLraOHNMPHCFbxFh+cCRNlEvzQSC/+ZQzJOWJiShItY+idPEpEE0zzQ23x+1xCxDfHn9fh0MPyYqXcZQpFWklNHlzDILBI2SSrN/HftkcDedyOUlJQH4L+ABhEKAZUCFYJo8JPtKShbNTRpYZaZU6ULhYRtZwAogGgP6wW4uMxRljYhUOWtUHJKEIkbW1kY3/eAGwaWYeSasZGX+ToHtITSsZAzE+C8VkVg/gLIJpofg9YAVnS2bONU5bthKzUGlWYtWpzNM6IhiHXAiqIDPClin4RnRhQ3eYMVw8X5kjydO4SdECUaC0LENUx7xXnNhoNDo7O0sSE/ixSZaR7uj9mHKW6opyom4vwyyTwsHRKoOYecRRihonGYBYp2+PUw7ygmhCdk52rpUBqr4iD+J0dksK23bikgTd2JkNYqls08eOlHa5bC6X3PyktQ5yOasUbuB4PL66uoI1FtPDAbXDAwp99wDXKFVHlfORieGAhj3PA1e3VCqxZ/TN15kVez2BE8Elb7lcFgoFaF+gNwJXSkLMlHWZc7kcCjbAy1CmgsoNFM9lPzgTYym1x8TnsAqBg1WxD6d0McLFFovFer2OcpfUtnsLm6832gIkv4b1JZ3TjqJoMBg8efKk3+9Xq1VrLeQUMIOYK93v9yeTSaVSgSwM2CKg5RJRv9+31mJIANksFAowdoMevRSKZfkg9gPEwENex8+L8Q6U39rtdrVarVaraArBXS0UClhSWC8CYxUjEC8rlUqdTgfIMrD+OI5zuRw4vAxno3mFhNovdqJWq/Xxxx/fv3//u+++u7q6woaCzm5oUDARiZsuiQi6OsYYUH0vLy97vd5sNkPFBdLAKFLiRrEYAq94hUJhZ2fn888/73Q6i8Xi7OzMGAMy8mAwgKZwEARXV1c4q7t37/785z//4osvOp2O53nD4fD58+cvXrzo9/uDwWAwGHD3ehzH//E//keodkBr4re//e2vf/3r58+fgw/OsrxS68ChN0oRlTcbmQKikvGJYweHAcN99GzgxgZiToOFA+3JfcQ5Ybn4cHPMWuUlqY6yFgte6w312niMQcAsQu1AeLJqKwvGuDN8howl3WRdXUPcdgAE9lbVAvOS8ITK2CK9dVa+1svLCBAkyagPx2lynpAySpHSWqkUfrGvOLtqbSPz2uLBWvxi24N+k82LjLFpP99agJi3GBIqEw7/XQaoHCrIY60yPtd35Sx24klH2zrbl8ad+EmSWJvYKE58kyRqNjfDWXIxV+eLoKeCOO/ZGtk20Q5RcXVUeanKRJ4oTxRsFSCmzSgtkyslTGwzSK4DEFMKDdOqBjGtE4tQNxuxdjP6lqV2JkQJKW09ZYvFqFaft5rTei3M53Vi8uEiSAxHKV5iTBJfpwkMuq0V/NkytrN48TaRYq7evd/JrLw6rJ9OmVCmsTK9lUR43kSQGyKo4zo9umPv3Llz7949tCKdn5+fnJyA2ISeqqurK601PHJbrRbknqIoXobLJIk9FRcLJh+YJMotVXviPxrpz5bUMWsBGVnAkNUUj1YMQrNNG1l+uhHrZ7I6KV6rMqFeObDZgCLlDcb56KTu52OTmOPjsufZQnHZaQ8ajYXnkbUK2ynuJ7f/LpdLXtZYkV929/I6I/Xx3xTS3RQt/17Q4VTs/pUAsVpdSZynaVb96+xmK87b4/a4BYhvj7+XI+twImFQwIhYpoFogOXHRis33LnheFOtVgeDAXQS0Z9LRIBgQKwDqws5Jz4f/D4IREJREegMUBv8IN02gDXjuvAuRKus4cBQggSI2UELZDEiAqhaLpfhF8eICXeLMwrM3GogRyz7wKAzGtuBTQB0k0K6lJqtAQMFosFkbZANOa1lhh0TEiWRVlbI2TAkl8t1Oh2QMSUCjhsICAAoz3w+l/2JzAXDyYDbCAyXY1CcCa5ayi8y3Ow0MErQfDgc9no9YBZA7lqtFjh9IGwOBgMQ9KIourq6AlKMj5XSw5Ii+lqAWN5GNlIDZZUxSjxQiAYEQS7wQkXLyEyplKgc2bxYL9VqpMUaEUlGfdiRIU4ywZwVyS2TiJdExsYLT5Ofz+dKpZLn+Sxu4LSIyum8hekj0QeWjoE6CoYN+IBwxFosFmaxKAt29rUNo9bwK8MB/RYehLiH4PhzSz4PKiS9mOAMyuNZKKVqtRqmOXoCsorer32+XAvhpQyhfC6XQ0cCRg6Lz2DY48WYeryASDAF8jKMWoJWzPZTQAC5FITDobSsZbJwQsLudlgD0a/AM+v3FdRmwui1/cUOGQfrmLTcfBUkp8A3603jcXieV6lUms3mZDKBKoKUOJdFI2kNiu8tl8twOoUWOevtQB0YwwxPhBU/8OzQW4DSBQ82UNpRHoiiCFIYUGDg0hfnJBi6GAYSJZGinxgtzMIrlUrYlYDtQvaa5Y/YBJK1enAtpVKp3W5LIJ6VPWR/K24shjHKJzgNCD1/9tlnd+7cmU6n9Xp9sVhAvgmSzSzTHEVRPp+v1+s7OztQWMbWA5SfczPWSlJKDYfDb7/9FpIUWuvvvvvu+Pj48vISCtQ8KmRNNFt1fuPCRqoBQKtkSYnoOX0zUmmKM3meQbwmMM6VZWVK4zuJo0nusyz0OuVJqY+8VnDDqb6vRRUdHQxZEubJyIVSByBma1+WQOHtnmMeKcydhQi3FHSzAJflPStKU2KZ4noC2vME+0xthdK2MI7tum00SfUc7WoVNky7cGIij1SklFFaeVp72jPpxruyGmeh+awngfzXLbIncsCbG6tMWGMs3riKXnEDB6XWcFkmu7NWO8pRzuiSz12CyzzmnXjJkdWWBAKuuHOfOMu7myROdBToODF6saBpHE2UmRdUnFOmRdQh6hC1iQqCqMvDBtLDQepQp7cisEbEY47CiRb/++vowFkGMRfvk3XIzs2LGZSRSKZVWYns4E95BgA2lUoCf+l5C60WxnhhnIRRLko8sqS18n0vSUwcxChPogrL3PAsdcDhcDhQ6SYcObsq21VHxPeZ7ZSdd5LfI/n12EmxqjsShU7mInd/dPCgmWw6nb548eJv//ZvYSRwfn5+fHy8WCxqtdrdu3c5tUGWoaYqiSNlk3zeV7RcLOtz/aNx8MUg+GSp960KNhY/9OrgYaa82vA/bVhLswzi7QCxXQWI6fp7bZ6Sgp4muWenzckwX/SjQjHcP7j68WfTcjlUyiSJNuaVZyx4Pzi4HIXFjUMsTl05qHht3eLmGPHvL4qmmEgTLYkC0ceQCP10K6a/vI1ytbkFiG+PW4D49niv9lSOLBnvkCEm/wBlyW63C3YSMs+1xerstwRB0Gg0ms3mbDYDEgr+JrJc7NPora7X68j88U+cLTOYgvQG+0ehUOBsB7ERE4GBNSCpZjIjzGFAJ5R+LIgA+PKhgIlssFarsd4i915t0uZj1hJb4S0WCzQ1I7dndQgp5eEQt/nmoE+fW+wln4jRK+mzByneLMTg+369XpdAFd7OnBTep/FdTJRjyBWnLTNnjkHBc2Q0hMFB2e3I6QcwGmPMcDjsdrvgyqGT+vDw8OOPP97d3UUNAF86Ho8vLi5ms9nFxcVwOOQLZPsySildN83BrGU1Z76fnPOz7gc7rYXhNDR6NG53e+3IC2wxtUyhVVcTyoRim8gmhtSCVEjWS7Fms9p4SEQxqQnppa01wr3W9N69UbVqCsVSvV73PJ+BsE18tJuXbVCZQOWAM088SkDnAIiTJKFV/w1YSsL5iohAdAW4TKmcC+6zQy3kkcCKMfguDBuAF2Bcyh7Yd1IGY14wwnRcPoBFrmeAN82GeAzP8SImpXhkwsCee4BEcQlScEbqWsjsnWFWFCe4kUKyhn+v0a2DjknihoNPSTwUUCOmDM9KcLSx/LLcXrFYLJfLWKIbjcaDBw+azebf/M3foOTDCs5Y/3nhxSIZRRE0Hz766CM8ptPT09PTU0hYSPJ1EATNZrNarUK6gasdvIih2tTr9QaDAVYhMN8vLy/Pz88nk8lsNsOagzORvl4MFks1IbDdgQhjpeXKBLQjxuNxHMdnZ2fVanWxWOzs7BSLRUwr6IZj2UQxADehUCiwMjWPkHw+XywWrbW8dQIdZuouhi7DvhCdgD3pbDbDJaNRYzAYNJvNjz/++Gc/+1mn00HlNQzDbrd7cXHR7/cxAnm0YyMeDoe/+tWvvv32W6S4ECBG4wUX6qTLmUPGzEKcN1qd0mQ+EXaOUh5dLibY/UulEu4qA/q8S/KqxWAWfiPFlPhxS1d6CTfjbrNDr5RRYtxB4oPZJTqLJ8rL4V0JT1bS37jaym6ijs4VH4whsloUO5LhKuBwwNdF64SMs9K3KhUaun6+xhilrbHWGmvMNdbgYHneNdHsVWKsMhRjWsXRpGqTg0qQ+CdGpbkdhy1eWcRpSjQhWhBFRD5RmXSsPQtCriGy2lhFrhw/rfpYSgGuteaBWcg12011cxnibJVCYsRMDV6rteIA3K8H+tdhZ05bvTwrKdHGmyPvaFw7Scv2cRQukySK7TJRUWL1MlSJXqpyRDlDZaIDol2iNlEz9XRK0rEBlCRY7Z1/s6xmqwxxNmbLahCTIL+rTAhHG2I8yjDcKYPovXYgpMiyNRTHyWKRzOfRdBYqq6LEhpGNDRIQShItuSBYtfAg8IMcotJ+3BkD22W114vzvK8AMc8+WbHIlm1kOwXbx3FmwaVfnhTM+0Em1Wg0lFKVSmVvb6/dbsO0HMHJl19++eLFC/Q5TafTfD6/t7f30UcfdTqd64JuEs/n0+Fw1L2qXVx6s6lnQruwjYH/o37ts3F9L84VLHmvYFwSWDCJEcWFNy2miX7dQJVclmSDxMSmYSlnqEknaZlIk1nq0bww6+fUwuYr0ZLsvQencRx7OgwjHcdaKc2kELaBYQaxU6xduzTRBkWU9/QIiYpEMVGQ3mdPPLUkFdLBD9jsglUJ49vj9rgFiG+Pv9/D8U5B7sG6vTLYBZAxnU57vR5EHtFXfhOAGNEkIwWU8lLBUkQWyqAnOnmxfwMqBbVwLcHBiYFkGzjHtfP5nFlR+XweSqNSeQ0pJYIDqZaIF4ALxshmlo7hWJ/j0xhQADlrMpmwaDKlQo0So+SkFPdHYkZOds1xPKcleK/neSz/D6VjpJHlchmMNuZjMqzAKU2lUgHqwaRa0O5kyAWeAmcFfAJQ9YU6Jx4WrghEYOmBznAYrPMAyuAa0SJ9cHBQr9cRjSGxhxQ1EHagz5RSL9kkKtvwu+UA11UKkmAc9no9tGAztzFJkuls6gfhYlp+8t2HTxYHi1rO1tW1ALEsxTNxKUlZS4v0hyXRnGicZrMT0jMqBqZUtLOFmo+VidV1/R/9jyFRSIGX+DZp1hc//9nFP/+T01I5bjQo8O82m3v8vHB/pGjg2ih/k4kTpgbuLQjyoPnjEeO2oFvfLBZhGL6yb0mS3tVVdzoF/hXHMZy4crkclMS5JINbDfCLVq0ROTPBgAE/HZTher2OEhEmJpPW37To5ejxydoGkEfWOm80GoVCAUzqfr9PRPP5HN8rjUcQ11arVZ4OQOsY/wIddT6fY/1ksJuZEZSSrRhoDoIAEF6v14OML1Yb1ktxmvcdPPpdyU0w+EVp27Js65NmREzLZeIzOiTYzQ+IFdYxoMPQmC6VSvl8fmdnJ47jZrN5dnZ2dnYGsjZSKUjxFotF1MZQjcPFViqV3d3darUKbBTr23g8ZrEOfC+EGjDe4jhGSwQG1Wg0ury8BFkYX4rbfnl5iZdJHXamrjNeI7tTpTgjd3KA1csLr1KqWq1WKhWY5gFBxqgAoRiYryxVJkkCIjPr6ReLRZRY4FyK4Qq6PSYdNjLUBReLxcXFxdOnTzHqRqPRdDolIWQxGAwuLi7G4/HDhw//5E/+5PHjx7lc7vz8HOnxbDabTCbj8Rgyi7LxExc1nU4HgwHvdKwYzsU2OVDl7pbVGrppZMKfmartO5USqbYP0LNSqWCYcfsOCrFsdch1bgwtSWKS4Qd/oFQv4Q2dK2q86Ug4mCe7JAJLqwMJRPK7JGzhxAbyB7XKp8aizXULxykUl8MbNH5m3F+W3xwHJwf0dEQGkjgxcayTOCYdqzgBQdaz5NP1/2q1td+KCiilOoy0QRbT8VByAdT0n5J0z0WTTZz+a0Q0J5oRTYjGRGOi2bU7vKooL9Q++b7v+UFgjVE60dpqu6LLLy03JC9bLsXSxUH67sphuR3v2EZ2W+2k5iHB64x8Uln5aQfv227q6ExJKdtNGS1m2fDh4NepNYgl0koBtYwTEybJgswyUWFitTGezodBJQoo1jVrOkQtohpRORXrlCxgvSorcXNQSGXK9krIs+p0QDpQMpcfvHVIrt5MsXwtQGwz5X9mC9I6uQnxG2sojmi5MLOZmc0SjyixXmyUscZaUoqM8YhCxxREJkoc+WwZgQ5GzO/axinG17+XVCdH58eRQ5ELrxzwPL+Q9cgcEFEfOlyTJCkWi3t7e3fu3IFh7P3799vtNprJ0N7U6/XOz8+R66FMvru7+8EHH+zt7WFDMSZaLEa9Xj8y9PSk/fy0OesXokJ+0tkZldtRu0AltdKY6AxUOSPUKjSs1yn82HXKPKt6JivU4C1rleQa63S+5IgUWU0J6STUZMkqWurAKM8YG0fRcmGX4fVGjIosNiAUKXmjlFJR8hllXWTfYmC8BXvm7Q9M7RzRkihHNCXKp7c6IJoTaaIC0Tw1qQuJ8kSLWxDu9rgFiG+P9xIgljDxlnBT0CpDhgLfaKV2GhtZDtLZy5ml60iwOe4ZtE51PsuYAIggw1wnqpDmNjI+5r4Y2c7PCaG8bzKhwg/I2dhSifsTs2blTvc9J7EOK3at17m8Ck59WZ6CTd4KhQKgVVwC84yYNsWPhlFj3Cju/WGwWLb88yVLOEmeNqP5jGoxAI3xw51cIHKCOyzRdtl2xPxuKcbnuK69fvtOEoQpPAIBSA2HwyAIgKpwQ3q4DOczM5+ZMDw15oLUHdI+aXVdqDepKx2SUljPDYkuiC6JZkRDojOiC9Ijq2NLkbI9apfML/5J9MnH0ZMn/l/9f3Ldc08Vrk2BLREtrZ3R4QeDBx92D3eHn302+uKLvtaB0qVcUOe7USwWAYVwRcHJKm8y8QHtjcdjNpST5DuM2ziODUoU6R2OwvDlyUm/XGbR4U6ng5hvMBiAXYjhh7pOLpeDNkiWyoHFBFRQqEA0m03giXgEjNQwnfO1h8yiKe2KYCcfXGOpVML3Asqs1+vlchn0TNBap9NptVqt1WpMgWfmHTsiMlrHo4j9J9EJgSeCRAJoL9MYGbsxxkwmk/Pz8/Pz84uLC8Bz8G+EnAXfOuYsU0rdkhIWPzCzckAoKaGe1WzhTkzJ35cyyngNtgmQytkEBmDucrnc2dlh4jYvLyzUDgAOAwAEW7wXc7NQKEBI2lGa9n0f+iS4jQCRARoS0WQy6ff74/GY9X9YZ6BSqWCgxnEMeRNWHGbxGcd2TALrTMOX+B0/MpRhhsMh7A2lYrUcUSC3Avyl1F6VxxXYrJKTXiqVyuVyo9EolUr48Ol0enx83Gq1qtXqaDSCtypKd0TU7/e73W6tVnv48OFnn312eHgIZSGA1AyHoXCC2h7qN7gDrC7Nj4Z3KK6RyFCBUeO1eMSNIhOs+XGs1/XyM56Lewg8HYg5wFBZi8XQQuYvwT4WkMGQ4E+DnSDSfh6cuDmsjO/YtzpIHItUOhx8p8gtdRUdxl82AKNVNQmuXkgus4xJEGhhEkm6loxk+EuzHVHyhktn4DiO4ijScRiRjslPbGJwhkFqBeaJ5tkgRSV0+hstmmaygIVd1ceUQB6tqjBlGcQm3YslRjxNAeKm0qHWRnva83xjjfViDYA4C8GT0P/hpoFs6MiqSlsA4usPv3FRhDY3RMuKwqZdPnshN5+Am7jGW3YNKcCitVaKkR2jVKJVrFWoKbRKay/0/MjLJ542VDRU8K71hbmokAhAVr05cdjBzqzgDmdVWVUG7VXi9fx2L9PaRRl9bdqKF1MGsJYwsV61y1s9T2vJJBTHFEU2im2SQDKbn6By1D+yFO+b04McOaB/MDzNzIB0FO3W2nVSRlMry/jhjQPrJ6s5VavVTqdzeHiIDWJnZ6dcLnOeyC1xXC/P5/MIa9vtNqq51kbLRS7wveOz3Hh27+XZ/qSbp6pOSrk451NNUSEzWigzekksp2qDX6JaN3qzwLEVZHnaXI9Z61zH9b8cE8HIq9igZLRP6lo7MQ6XRGnWyYE36yDJ6jLvRJIRsqlb94eDxe/4yF23qlzf+ZyoS/Gs99MHV04LqHlRTC3cSkzcHrcA8e3xPgHEUuLA2T4lfMkpB8MEbxSL4MNB82H7HU6wpVgexDdZw9TBUnn3lY4rnMbIf2J+B7Z2Ttiydmrs3ia5uo4xDptQsTiy00Ire0IZMgDYITsHGUaRMpdSa4Jds9jOy8kYaVUCj1NxAEksLsEAOqigrMshqYiyHpD9fMlgyibnzL1i40HGwfGvSNSdwbZYLAAgjsdj0Ich/VkoFCD3DHITE7Gl9B7GA3t2mdXjhkNRlqNZSIGBKoxPeBKmwWKpUok+evT1fLI7GH2STAo2SscPZBDnRAOiAdGYKCQaEp0QXRDNiK6IXlJ+nOxWZrX6UkUqoeDTe/r/+D9Hv/hF/F//Ol8L/a9+p4IykSbrmTiJw0kcjs1PP3/xsx9/vbc7KpaKcVzK5YJKuVKp1MA8BYIDgJhT/Zt4OGRdShis5znIfXk8H4nIE6SMKI673e7S2lq9XqlUgM6Uy2XEfyBIAtgCZAYlCtZdlQgjRgvThBuNBkRRMZhZ9hfMizfyw6S0JZZbECTVSwq24Bq5NxPUSz550Dy5uxCjAsMGjEvcc5biZfhSin7KpYP1ExAiL5fLq6urs7Oz8/PzXq+HlWGxWFxeXuJUR6MRtAJk0Mzk1ndbI6RVMVlJ/JdQBdYlbrqXI0dKbUwmk+FwOB6PAVOyEx3YtY1Go1arQfdAKkvwUMRyXSqVdnZ2arUasHKWriuVSoDO8Wiw1ADqvXPnDvo94b3meR5rBA0Gg+FwWC6XMW6bzSZD8KVSqVKpLJdLmLlh8eHthjFQBox4GeQ1hIiggYt3YXEDqktEi8Wi2+0uFgssdGyJHgQBLnk6nUJyZzgc4jcSqcfShxJarVZrt9v4JXJXxv6gnI7BzIIDuLfj8ThJkkePHv34xz++f/9+uVwejUbAQFFQ5F1JMuKxp2AK8DiR7rL8LdIhLbvsvDHbPf2iKIo8sV0y7obfYBmEsgSUuxkglmaquEa+IjluWVsJCT/KAyBxIw5hsI8BYqlFu0ksglchp3vAkbPcMovZNGntGs4lGQcgdrBL6RAgpcyl1KOEMrOEUxkjXav2R1EchjoJI6sjCmIbGZNYZSkhyq067XirzmPMDDUZjpvjYpdkWMbOixMhNByuAsQLgRFDZeKayaUoVNpqTVprbZXVntKe9ciNeOXN4fmeXSQ5BHIUgRyA+O0GP61jPNwc4NjUo/2mKNtNvuLVD44cgYUJIFlSxGIeEH7WGdxWbVVyuAk6vOk3NqNtksXa1vKUN1nS2dedxloFbbvuY7N8z8xwT30UrRWvYwZv1pH4jSRN/pEdWea7VH1Ze082qU9IcjFHgAhWsQujhMwlW6dlTX4CelwKhUKxWAoCz1rf08tSae75xUVUn8yay4UmrWyoruFCP50d9nUzIjt3blKDcmjFb2Qcunaecs0vT8qSKpCXs56nrCJKrDE2MZalkLLtnls20+yu9H4hws4BPnWyKqxk0qdpVlchZ12i6xtImm6P2+MWIL493osDQb+Ma0lIobHuBHY+ThTBowHuw1K2NwFuGo0GUjVILoCFhywaSE21WsXvAfUul0uARzIdiuMY0BgkI5gZBLMdXAJCdt7COcmXHqkMJHFCLlM4mdSh/ZmTf+SW/EqnDg/cDQAocm8umUpmGffyAztjsBjyDlDGYPpe2sS3srlyTzeLyQK7kVa8/Ijx12q1ypwXmerLDJ8yHvHS9Ea2VTLfGZcJIiquBYm6lPQCmgAi23Q6vbq66vV6sO+D/dHdu3cBBmEospok2IjgdQJdgoUdkHfk7Y7K7bZNPNUhgWYIeqvDMKxUKvfu3Ts8PNzZ2WE3v1wuaDSaed+Qii/Oqr+70vN56opOKY9pQTQm6hH1iBZEA6ITonOiKdEZ0Qtbzy3+9BdPf/7zc025nFe5f9j+/Mf1dqv4T//Ef/QBjcex1YbIRlE8mY6vulfj8VTZc2t7lhLfrwRBOZfLFwpFJguDbc1/xZN1sPg3ip+kARTzyrm4ApicmwqRPReKRXAVMcWIqFKpzOdzhi95zDA50TH84UoPsLlCoVCv17lZD1eEaSL5gDdMj1EUAaCDCejY+mGO4GYyrxNiI6w6Vy6XwzDkTnPJOofSDoQRwIsHat9sNvED7kwWBsKkAzBqrZ1MJhcXF5Dhhq0zbDmvrq5w4ZPJxBjDpEhHDvhdpVUO14bputKGSJ6/bOZAzYaNN5FHYTWA9SWqL6yTa60FAMcVIHYLxCKMW4qVBN5rBwcHtVoNKwARwROmUChcXFzgLfhAIiqXyx9++GGn0xmPx0+fPr28vOx2u5BWHwwGvV4Pt71Wq+Fp8rez5gCI5Lxk8WKI8+eCH7+XX4DNqFAoYFMbDAaTyYQ1RrAjJEkC9jrkGkqlEtzPca8gFjwcDqFyEwRBvV7f399vtVpAeLHbNhqNe/fueZ43nU6Rslar1Xq9Dp2W09PTfr+PrRlNnUznbzQaX3zxxeeff16v1zHSgB2fnp4Oh0MovOPmYwHEg3Mo+Q5NWDJMeZzLkqcDE78RRBzHcRhFgeACcxKOGcplRaC6+BP1Bh63TAdjgW8pNyzrRvITEHVI1Qipxc+1JSezlcVUSROm1b7mtUVZp6NfwsRZyI/PhzdxiQ6T0LCSzebc/CQ14hnFXnstDkUxiqIoDKMoVHEYWRVSLrGJMeaaG8Xt8wwQUwoKs99XkqbKzKsym2ELuwHdMEJlIkp3ZCsg42Uq7jQnWlxLP6mQyFw/GLJWe9bTK9CINKPjbgYHIHYoilIgWA4qF5O6+cjPFHGzjz47p16rU3/Dqfc2cPark3yFYRqjoyiIQqNipSlKrJ4lxcUyF0W+8dUrtrhNART5rE1G1eEmsNdaCIwyP5t1isBmHafSCFb72u/apC+R/Wq7+QztxjNU/CfYxCYV3bEK0T9WWu7Qd3oIfsja+w8aI5Z6tVv8Ue3Ww1kGaVXshZszpJIMMlPJhHX0Z5IkUYrSSMd6OikXo3IpMuO8KZEtWENkI3UtVcfDj1ZXy3cS9KnXzaCbIMtrR774CvwngXvZ/rJG2HrDWF1rbPBeDj6iHFGUbnysLwyCcCwI10Eqi6QFoGzShpv35viLv/iLf4jNBLfHLUB8e7yDg3FVNFCzPCggY2nYSsJ+jduBHf/6mxzgbXmeN5vN0AaLT2COHth2SE0ZBfZ9HzKX3BWOrJvZVbPZTGsNdipbsvAmTURIkpHDVyoVcP0YJMUh2bhOwI0zYR4ZKxHLCIDzBOTkoCLik2VTqqMgLDUKmVkJDiYwGindy6kg869J9EKyexKlkhEMqYP1DM4p774AzvivrInBYCvHnQDOWMGQCwaM9C0WC/D7uBmZKw38gcBfLi8vX7x4Ae1p/qJqtXrv3r0PPvig1WoBzcHpxXE8HA5Ho9FoNAJ0AoQFWLMMyLYYcWwBRiWSzm5aXFGw1iqlc7l8MW+VUvlcUVutEmVlJmNTDeJQiA4viKZEM8rNTS401UJ82Jp+fG+gdb5Uov2DSrWmyPq1mq5WyVhLiAzDZDiMzs5mw+Hw6mp+dZWEobJWA9XU2pP9yzI2lfz0Nz2kovfaT/A8T63OcZu280srOXk4Hu4bkskVMzRZb5Arj8RZ3nRZY4SLCfWMU7N1HtctGB0AaCKZDiRY5/whAAqjKJIudqAPw2OKQW2pIsr5G09nlu2WbRysc8oZDpZleVffYdwmBSJolYYjVVZ5mXKEUGWxCo8S6wBTpCE8Aus2Xn8Y48ZNkCxL/Axe8O7u7sOHDx8+fJjP54F7Qkcin8+fnZ3hwxmOxM0ETI8Px6IEfBb6EgzQR1E0Ho8HgwEGCVYY7DLz+RwPhUFGFJPwyPB8ednnkhirkbBRobxADDncwNlsBsQ2CAJU7NioEGq/8/m82Ww+fvz40aNHd+/ejaLo8vKy3+9zyfDi4gJcV+yDqGqgYsQaL6z4PxgMlsslwGhg69wCUiwW2UUAkxr0KGzuzOJnGJ2nD8vaSN1baVfAWyTPIymiesNhGcdxHEU65TXTqvKplOkApMsKwlKDmJE7rFSMp0iHekQC+fRg5yI2hWPUWxrcZ0Wf5H1YW8XZwvVbKw4rPy2rP0uijSaLDHIN2wErnYWOF0Nax4OWTVEprzZJ4ljFcWJVQnFi8WZ7ne5K+1YSPkgmA8/ZrXDeJiSCVtWK2W2JhPoEOnv4h4hIX/9GGVKpOoKnrNJWk3VQVC6KcxUz63Dg9KTL2EOqjRlj1JtszSqzAm9BirNwsIwtZefHWiBm09a5Zdd2NEwyJ2+1Mp5nrFXLMDea6NG4FM+sSpKE9JSKl6Yx0aW4FFjS1xjK2lZ3ErS7m0DDEsw1GbfDLLxltqqyZv+3N0Clt+PUW77OrqKBPJ412URZQ8awi7JJjIlMYoyyVml93UCJIcrOoigKSvtNx6ht7UKUZQy872Dcm4DF8jIdmgI7zUrlcecu4ZeIeGu1WrPZhLIT9K/YWuDq6mo4HKIhCbtJpVLBi9NOnTCKyJgoCqMoMpVS9PjDcTl3NR8VF4G+rAbnfm40DOIrRbVVr06depp5QgXFXTUy88UZw1b8MtmgQbx9ojmflv389Fu00r7n+b6XRFop6BJfS0wgsuKuF+kHI2uZzsrDbJIfqEe8dq17RzwLojxRTJQjmqXGm4aoQDQhKqVIMXYinygkKqX7lE+0ICoThTczDLw9bo9bgPj2+O9wMH4HSg7nQhxtUMoPZYSUc+zpdAoxhDfas7GzxnFcqVQ8zxuPx0yDZZcY7AdgmeVyuWKxOJvN2LeNTw8ABNAExs4gKgpXAVzLYrEYjUbQtYCXUavVYgiVMx8S4olSVIHTabljSb0FhgZYeROIKqAH7lLkpJT73HnnI9GLym9BUCLzcJYCdAQWabXnlPNnSm2U8KeERIGnMIoB0h8HN3xzQKJZLpdA3pGQc2cx8FlmRAIjk7iwVBUARnN2doZWa2D04LIdHh5+9NFH9+7dq1QqTEXEPTw/Pz89Pe12u1dXV9KrUIZ0NxfO43OjVDuVPRMw0trt9v7+/mw263a7uM/1eq1WDnL5XHPS9ExwXd6XPKYwRYRHRDOiAakrq0+tn5hHd0ef/nRytxV/+JEqFMtKecVSvlAsBEFOKZ/IGhNbSrQirbRXyIVhvljMh1GhMCvm8qUkMVp7xlhjEuZXMt4hO7YYlpU06uzdyBpBOC3PchasGN9JyFjrSrWaq1QcgQvZcssFDNZ7BeTE1F3+IhKWiUDWuGzwdoEg6lvj8RjBOk8lR2+ULx/YXxiGWM1QQ5IUV8aVsNqAzD4ej7H0SeCG5W7wFZJxzDcZH7VcLvv9PqYVuMOYTYAIIe7Mp+G4pkhV3HdVJmRMxFGTcDg1cq5x7uR0U6K8x3A2m4MBjpQfiGUEmiQkFCpwabArPDw8fPToEUj9vMzm8/l6vQ5KLEQVUHzCKoQ9Aj/zcGJ9AB6Kxhj4XmISQYx7sVg0Gg2nr5w3RJ6DDh1GYpc8yxhBZpUGrrdxAUMip7IZNp/P12q1Tz755PHjxzs7O91uFxIQYB+j7wFU4nK5DN0eLKdYP0GCxleDDux5Xr1e39nZqVarGPyYJoPBAPeH4WYu1bAAPU9qyaTGw+LCJAkeOg8nhszeroJlieMvy7AAAQAASURBVFin0LnJTguw7GuRxVeOYdgCV7Ke5ec45V6JsjFe4GBkWXRYTqisPYCDy3B9ZVPx0qFTSckXZ+ZuImRldwQHmHZqPDJtdgjRK6+3xhijjDFWAb+yaH93XLnUKgqchc/UOmal/FezAQ3MYsq0DmI2LqjBmgeWSGkipbRSVll5e7KjdNO4dcahLN/K3rK328U21RicJ5XtoJdMhez+vr0gsfbCeeWXXHIHLLbWWhYd1okxNJvnuv3y+UVhdJk3SzJWLXO5y1KtV6kucoHVivxUnVOtPr4s3qpuhg7LUkQWHTMbSMFroeFEALU2o81qt54PbQaCs79PUhCQzzxO/yeixFJiTWySKA7D5VzFUeQtI50YhafH6jEIVLhXT3pdOu1BjgGmU63/RwMN0zqxRAcglo0UvMSxNB/zojgdg1bV3t7e3bt3Hzx4gO1yZ2cnl8uB+PL06dPT01OwgqAHtbOzc3h4eOfOnXq9jip1GIZJEkdRFEZUryc//8no558nHuV6s+BvupX/MmrMzrzkhWfLRJFYA32iHFE+Vbl1dB7WCnZbUXtIhCliknZdcLNFvKr5sy13Woc1O3PKkrLkac/3/cAPlPGVirUyqHMg9GKMmAvJjl6ifHByg+NmoHcS9FprEZd47yaMTltVcimclksJQ/lU5mhBlCfyUmO6GVEB5CyigGiW6hHfHrfHLUB8e7wPB4d6XNBj1Jh5cAyyACtEsgoJTvz+jeIJCEqg/xoZrNSuBcLLewZvIYVCAbsLNAGQ2AMXkJk5pAlw2tzsjLegPTmfzwMJWptWZX+zqbApM0CmkjHFWAolyxQLKBJeL6UtGb3iuEQmGxzbSbsYBC74KO7RBiACkAv4HYPIsFngVm48Sga+GalBcMMkceARzL+WELbErJlILgmS7GtHqZ5Dr9cDDZA1HGAqdXBwcHBwAHYb5DsAzIEh2O12u93uaDSSsh6USmc4/fs3AYiZFk1EqTrYdWPywcHBxx9/HMfxfD7v9/vGmFq9vtOqlKvl1kXbD32FAIsjpCjVIO4SnRCNSQ9s4Sps2PleY/LPfnb1yz8YtVuBp5VSNa29XL4WBGVrVWrWFxoDbkJQKpWCXLVYCi3lksS3VgPlwVj1PJ+VWJgbwtwxlnCVpmoONOAoStNqkzi3HnMZ4xX8F0WJMKnzPK9WrepSSVYvJIkbIh78S1BaJpMJTt5p5cPEAYcUQ4U7xN8uuwbYB2FfBOsYUXAIYYBYVn0gOjybzYgI3nT1eh1t+9C+wMmwIAl+wMfiMsGIh7gEf4XUuQZEyMg7BjZUaMD3xHzEK8vlcqfTaTQaQRCUSiV0x7NkquMu9Q43grV6fIxnOR6hjuYmZ1PZWgWINng9uK5xHMNSDJVCgJtZKflGo3Hnzp12u50kydXV1Wg0wrKDfhGl1N7eXhAEkKwByI5UjYgA/jK4D6ULVl1gzjKXzTBogf/ic9irDYuMpLrgNXj0ji4ta8pLsQ7p5gfBEPjCSTkXnECr1arVauAlgcmLnQt9M7K2wcrdwMFxaRjP+BMrmO/70+k0n893Op39/f29vT3UZZMk6fV6x8fHeBCtVgsTRLah4O7xE+edQm5tUn2IqfeO3L+sP71dYWOLf9omvtgWKtl2SI7WkTe3YLiv/cy1sIUz0X4IB+rt0BwHKHQkFBzkaA3Z0FqyCs3uPwzI2WB/9EM+OAsIGnTp0LUQgoBX1t68Gwq5bhpXa5jjN0e1lKLNEbUz4LNRolMjkZBu9nhtUuD8KekUOOQGYYxRlGgVJ0bNF0FvUHlx3jg/rsYTzyoVl/R8Jz9T+bARGE9RjigQwJbKPPSb6KJuYv6uRa+yr5GjxeFUJgK3tTcGiJ3n7ZzeWoDYrKJ4UjIlIhtbk6C5JLTJYrGk+fK6oYv5NKDUcGuOQ2lnUJgF3DfVG+TIlxyCf3D5rLNYZaFwGViy1JisYnIQwrkw7A2KxSKk8O7fv4/tEva2/X7/xYsX33333fn5OWgQWutKpbKzs3Pnzp29vb1SqcRNQkmSRFGcJFQumU5rUauaSsE7ucoNf+N9c1HxhkQtoiaRERruAVEhnRE6Awer1f8dPDcRNGG72lcBgDi6sXiFXQGC1zuL2uuhCYRYWS/w/ShOlLJOdiwjDS6Wy7FHooeGeQM3sVp5g6GSPvJ3RtsNiEIij2iZPqwg7YfQKbjvp2zifLosADLOEY1vGcS3xy1AfHu8f4ck6ZDwOWGklVl+4IoCT3y7ZA8/5HI5qHyyTqWEbyglYXEzKaOWQGfAU2PCLDZ1vN1p5Q7TA9m+1FJw2jYlV8KBz7ZcDqPqHENLCgnD7s5dZREJ7iJn9EfyUCRMwxE/4gzWvkTqDuADcDO7qDN3En/ic6QwKwssSulnduOV8IdMHR3HZM5G8E8S3WPQB/qeTADHx6IJulqtQtsB1wJhzVwuhxcDj0M7P4tXyFCDv+KGo9GhuYE3h1HUarUePnw4mUyOj4+73S50TqqVcrVWLQRFNdOWFEWiGs8mdWdEL4h65A3NncLwj3/87WcfdR8+yn1wP1cq0HwRLJa6UMhXKmXf98AuB8kxNe8qVirlYrHQ6bSWy2s2HzSaIbXBStPsWMUhLMQxeBAyDPpGyAsDxPzgMF+IiFI0//otaGxMqzvyu1hiG6rE/Dhms1mv12PHJAZPJXFAamGDvSgFsm9+oIw0Go263S4EBKBj3m63USPJ5k6ADqMoyuVye3t78E8rl8swzQNGDz47XNdw27nEBSGUfr/veR5M9jCc+JZKUJXBd6xLeLtEh2u1GuRWyuXyfD7n4lNWIvzdrv+Och8/C8nE4QBd+u9h7qPgwdfL1SmAubVaLUmS4XAIC7UkSdrt9t27d0ej0fHxsTEGWCeeDvoY6vX63t7ezs6O1vr8/Pz58+e4P/xdxWLxww8/rNfrQFFRMhyNRl9//fWTJ0+staVSqdls5nI5qP2MRiPMDhTDsCJhxQP8CmFiGBUOh8OdnR2UNHA+uCjuHOdCHVdPeVVhzV8UL7FzoSIFYBqi277vQ5kHRc1ardbpdOr1+ng8fv78ea/X01qPx2MAxFrrarVKRMx25xLdfD6HPka5XC6Xy5Q2tYBHj1pXsVhst9sPHz7c29uDkv5yuez1er1eb3d3FxURzFkUgDEfGfNld1Apz0IZvV1HrID/yaGs3hw5ZKRDcoRZg1gCYVtUaCRj10G7eKvN7rbZchoXjF+LRMtrl4muAz5uZ+1lGXBbgEheP6Uo9lp8hDLsVIcG65z8pvjHqlfghKLXNe/bN+nTvzkKvOX/ROg+hUSKTEgmVspopZTGHdCARNbb8zpyro66ghzVa33knJv/RhrEal1RJDsMJHVAWjJKHFCePx8OcLwJHOeZIsXEpHcf92ckSUJkkzgyNrI2NoaWUTCcVrr95svz1nLokVK2RklOm6o2pMlXFAgzrrVOcfZ1Jl0SZnXgXcowgs1WgDjJfI7ZDBDfBBqWGHGSYRCbdV8qkTtgdjHZmGxskzhZLsNoOZ3NzXRuosjKhks0wEF4jX1isONc5/ZCbc8haa5VYHD2/S0dae8hNOzwRdbWQuTM4ohFmtBQShxmawpjTK1W832/2Wzu7e3t7+9zMDmfzy8vL4+Ojp4+fdrv94kIXV/wksWeHgQBJKrwUcicfN8W8qZajqsVM5p7BZN4I6v6ltpE+6njmU2VbQ1d11T8VOL21Ta5avmoMithIlTaJUs9Sn+wb7jkypFsVoHj9A6DRKxszs+ZnPGMsUw7Q2TIADHiSfQ5se6/4/UqI403Godrnz69rSLfaw7vetpSQBSkYsRJ+lCSVIk42OCcqW7pw7fHLUB8e7zHW6x06JZhBKtAyBUW7b0ABN9y2Pl+Pp8HR5V1MFlaAS8oFotM1oPQMFNoOceTYQHyZ05loU3BPF9m72K3JtHaLLFymTHSaqOljKWYgMaHxFJJ0Kbk5iQhY/zS8X3i+4DYBb931D/4DDmNZ4SakxnegJmqiW8ELIUvxU3g1irnuTNiC3yEsdRse5qEtkmYH+KS8VAAd8obxWoY3I8vaXpsG8XN4LhXXPCXeSyLMt8cEnV8lvCvIBQzXY6sNZZMYpU1JRXVVILYSEUKzVkqJoqUDa1ZWjs3/jxu14YfPTz9/JPzfPFgNquEkW/Nq0oGpYrYLJCKA4OcrQun0+l4PObqOu6S5PbybefWdR4tm+bjFu8afpQ8Vl894jBMkkTm0AyNSaqvZDTjbHk0gp8LMqwcJMxLxSDkFm9cqeN8dcMVjFNZaEEAhY/juFwus9YKh/4Mu+OvoJNXKhW4VMMmURbGGCsEbQerEBuysQALCN0OLYXdrjmNl2UbTt1LpRI4pL7vowInsUg2AHyHAa5MiqQrl6yTMSVc6vfx2OPOQfBYwcKGk+TXX3/9zTff5HI5PH0WzXjw4AHgy/F4fH5+zqWFYrF4cHBQLpchiaCUOjs7Ozs7Ozk5Mcbg5oAtBegfdUoQfpfL5dHR0fPnz5fLZb1e/8M//MODg4MgCMbjMQR8cWKws0MVAR6A5XK5Vqu1Wq3hcDibzQaDwdXV1d27dzEecIEYEshkMNHQFYF+Gt/3y+VypVLBKfX7/X6/D+ouPgGLOWSOptPpwcFBp9NhGYogCJrN5uHhITJJuBSitgd2GMYVRghUnrvdLtz2YHl3enrKyDukjTE4AcpDgLhcLp+dncVxDAmmw8PDu3fvQoYY9SoUF1FhxS95YQdH3lFokTL6Uhmfd5Ospr/cDV97aKVQGYbcCvo8GOZg9WHWHfbFkZUGlnu01O3FqotCnTS427R4SucAWiVycv1J/lMWqHUwRxl1vHahlpUbp+xEq66AEjFxzO6y8hqO/oYE/eWFWFCHyRJTPI21iX0FHHgCrbCpP4+fwen0BllY5wcGQbI6Eg7SQelvolT0aUzUJxoQLYkCitoqnCqbaE97fs4QkRdbpY015KgzY7VnVgGCJQdrcOTppQaxo/SKVq+3s32Teg5rLbNIODfy4JQhDaIsVsxnQRiOWteKYku+sOzPY74FtkJuhtNaExmbLJJkYZLQWB0bbxnnx8vycF40M0UKiIkim7LqgtWhot68eCBJi/E6iYlkM33YbAaaEyFgnWQ0iNWGn50TVplPdhjEDi7Mf5WkzpAoJpvYJEqWy2USTUfjxXgSL0PDDxohB6dIyKcgeiA18WjVO/G15bS1IjmvFiVrlTHvIZblTBO5ADqYo9M2wQwMFsrHOOflFDQmKAujngooM45jWOmcnJycn59Pp1PuYS2Xy9VqFd7mMmg3xlhrrDVxrBYLNZlqS3oy0pO+P7vQUU/bA6IRUTWl/aqUTRymPGKnjpqFF1VmbJtVUfgsTZ5uRpDfriAvz0grrTRpL/D8yEu0Jm4QRI5DQtZfKYUWVUngkJwqtrF50yrFpvLAq/v0rsoewPHj1I61nO6Gs/SpxSlqzJxiQ6+k2INUm/gWI749bgHi2+M9OSR/EJsi0A0neUBOjjUa+RXMcE5PT0ulUrValX4vN2EvYjOGpxO+F3snIBgGc5GTMxYDdQjpes+0Mv52xMGsU4EoH/Y7iKiAGk8mE2iDMkDJFAzHgsaJp51AhGVGGbOWAC7DdlLWkGEjRoQZrca1MO7GVyeb1qXMK14prckBJnKqw7gPA/18w1lBmIQyryzS4kwoVTAol8sAdxwUWzKg+fmCmsevnE6nFxcX5+fnQIWA5gRBUKlUQNWsVqugsDGID+/Bfr+PN3Kiixsl76qkUd+8aRdYMBAHfBcqE6VSCUOF5TXmi9APwv3m8E/+KO6TUvtKz5V34dOUVExKKd3W5gOzyC2Wu7EZzvdKV/lgMl94yjP5OCZSSLgAaaHIwTRDluUFLombD6uocrkM+AkXBcAdj4NHIPcPyurCljvgRMa426w3zX9KGRMVhsvlUqaRYRRFYQhACkMRM5Elwh0rNowifBFgHTk1pOWXTIBfyw3MQsNS/BpzCpQNRO3lchmlFLat4xII83FKpVK9Xi+Xy4xGsSUdTxlKOxOZ+cuysBAHwAVK50kpoYPVCQoSQJZleo+T4boXo9Kyvff3QR+WwiNOdC6ZlXI9ZKxBNhkwZxaP4Orq6vz8/PDwkCFUjPB6vb67u9vv95vNJuSY2ZOzVqvduXOn2WziEbDQreT8pgotS/jzgBWLLQm/JyII5rDMDoQdyuUyshEGl4moVCrhQ7icwM9abgQMO8q0E5/PvqlIGllNW85crnmAdgQ6M3SZebWfTqfdbhdwNtPwpX8p703oF8H9wS2SK6GDBmJMep4H9LlYLAJqx/oJEHk2m7F4NOP+JGTu2Y7PsRTnlcRhDW9SgbjhEo0bns/lCrkc1kOszAwQ46JYLlxixI4qlHSX5RkkNXDw7ADES/p/Ns9cy7HlkSB1kPnmOJUVbnbJSjNnK8dZdHgLlXitCZUkUGf/Neu05gDE8mzTEMgYa5Ux1pK11iZkI0FS02nSq9Kswkt7571VjJgytF+TgTPsOnhC8i6jVEYTv1+m6PCCaEZqRrS41pdQC6Vj7VnP83zPt2SNp60iQ6uRDM8mxz1CVs2d2y5L2vL3K6zdG8cka2u32WMtvk+r7Eisk3hxlB68zDouETxTHKoB3xzWHMcCu1gspDCaJUNmSWYZx5ExviVrfbKBIvyvUlA4l0LD3jrhVAlsqYwmdRZ+le3zZhWK3eI4t4kIaTKCD0aIt9I6AE5tgLNVBp4z4iqyxGH+IUr/V4piRQmRtYbgJb6cLxbTabgMX/EAWBYJPzhUcZm5OHXlLf6Z2xsOXmHE/0A4T2tFM2TTIV81l2Cz2KLUYJQG0by/IzKRYLTT3ZLh3xCRTQzFCSWJimMVhZQs1XV5wBkz5mYlk+3ALmXo7bRuLrz2c+yNCjnpXWYKi2WcV+p7OAL32xtl3qGu2krE+05QWWgQ51I4bZxKD3spLp9PXwCaliZaEMVEBaJFCiLPbyUmbo9bgPj2eP/2Uay/QN9kZygDlPgrokzP89DBenR0FIZhqVRColWpVPb29mq12k1gHcQ3rF8JnGU0GqHv3vM8wDSgcSHr1lojv+XAiDl9zONA6648AZYsYGv7fr+vtQZRFJmntLIhQQ7i7EgSluWuz+rMDkoipXIlpYg/k8FNCCUzuYPhKvk4pNYHE/pYYVOmu5yd8i8l8Cd1JDkj4k2aMVYJuPPPxWJROtHLXAX3FgiOpENyN+JwOLy4uICUMBcYyuXy7u5uu90+PDxst9vAQ4GJozMa0PDl5eVgMPA8r1qtSh433xBJnLnJUGf4u1wugzu2WCwgR1AsFqEw4HkevMgms0lpWlA6OOwM/qdfDkJjVFnrhfaOPTKkrApU4O/6cTUe741mk8V8PE3CcTEfzpe+n7NJEmutYNHAaiqIJoFGoSiC8QkyI+ox9XodWBjgYDwy9nmTfuWgGUri2yZhRIlEsPh1oVDAxwJ14sR4mR4AKS3nG9Yul8toseA5RUSz2QyN+bPZDJZZPGswrqrVKvr9C4UC6g1szwiOJEog+EwgPpjmNwSIJaLNADdmJUZOq9VCkz6eAts54usA64BJWq/XcZJMhwRKy+5n0CMG1swzV0LSmFOshYJTYj4m9Okg4tHv96+urrg3nwt1OO0wDEej0Wg0Qp6PhVdWp95tHkXCm4WnNiNZDKnLtYXXEKkfwlI5URR1u92vv/66UCh8+OGHjx49giRuGIa1Wu2zzz7zff/09PTq6gqmfwDp2u32hx9+2G63QTyHiR9qhBCzhowvA77QY3n58iVgX2bOnp+fHx8fN5vNIAju3r3b6XTAIu/1eoPBoN/vYzLCCJ4F4vFFeMFyucRbeKHGD9IoFeMEzFMUxiAtjckF7RcW7cX4nE6ng8EAFQuo62DuHx8fj0aji4uL4XBIRLhAVKpmsxm3bnCFgGtOmL+wTQf3nGs2WLfBSQcACi0LVDIwvE9OTp48efL8+fPz83PUTUl0kEhirPQn5CIB34qsZBNjFhIXvmF5Q3seWqdL+TxEOSAIzog/Rgu0iXLpwQI7UmzBKSDJXiUOG7CEyvfyaTvejLJw4tCH5QlwDUwiEY5SU/ZWSKPITS3SDEM46hmOK2xWCYTfJUu5Eh2W0LaUyXKJz6/0OqyJyCyVjdIGW8aFlRBYhMlSkqF50uvow5sAYrPqthSncCHcYqek5qQTCgLSRauIjKJa0VbzqpBTge9hGimd0GrjC1c0OUAi0aUkB8zaQ7otrdyxH1bPc7iQPBgYcJFlVEkX4JZ27HrcNyahcC7yyemcxRkZIMZqg36ClYoCGaJI08IkYRQZS7HyE7+Q6LI1iSJFVCEqCYDYkVLdokHMfg8kOrIpQ4FMVinDa63n5OChDECcrPtMkzGp204iXgsQJwLso3VfEa8KEMdEmlRCyhAZRZYw1eI4XobRchnJ7g2p/L7WbTI7eLaL5vFcyELJ1l4LeOv3Mo3dEvfe0M1iSxIhcysn7MTM4rCc/Yqlh7OzPmvNC6xH5GmtS0XbqEcVE5kgiI22GAYqXUjN67R6NoG5dgPb1/5gdHjz+ShFnmcD3xpS2E6VIoc7lTUVuEni9q64EanhqiVr1btSbLNpZwyowVEqN0yprESQrnJBujOCRwzl4uAWiLo9bgHi2+P9K7Ey3wGpLGAILplK/gjgLYAX8/kcKSUWbti2Yq0HcsTtqFt2dMA3+XweLE4IL0qrdCBfyMPRKl6tVheLRS6XA24CEQmmDbJABO9GDJ/hMsfjMUAcIFCVSgUwHNJOpr8xiyo1n73mAIICyeAR8zKkqLGkmDHmK7c3pi7KIEPC9KwbwP5IEo1lYFQqhTE0A8CCX8Pnw9mCNBdyzKZolf8irQt5MHD6wXoCIF5B1xjPDv1ZwEDDMBwOh71ebzKZQE0Y3dOdTufRo0d37tzZ2dlpt9v5fB6fgPsJYa+TkxNITktzP2YTS4Nm8GVuWDqm1OgJcM9oNLq6uprNZvV6vdPpAFQCajwajPK5gvZyOy1/p2EUWS/RFCozMdZapVW+kM+VAlu200q4DKPJLBqN7WwRaB2gcg6mFUbLZDJhP0PMIFD/cHU4Qzy7crmMd0FvFHeGhDoBH4BTmYErnc3XxsqSywZFBdwEQJ+cMeJ+JkkShWEiS/cYS3GM8wfuCSPBq6srQPw8F4BPdTqde/fu3b9/ny9TutyAwcc0eXQkFAqFWq0GSvUN1zFHKZLR82Kx2Gq1AIoREdBG5uYDngbxsFKpoPuewTjcFlwU8MrhcIjxCTkIvBefjEKUxOa4ugOOCd9zYIK4vbw4cBEOGTiKcACImR8qWWMyt39XADGtNgcwwkWChOhMOkrFdnj9kfj45eXlX/3VX11cXFxeXubz+Waz+fLly+Fw+OGHH37wwQe+7z9//rzf7wMgBrcaD6ter3e73eFwiBUABFtGh9vt9gcffPDw4cNWq4VS03Q6PTo6Yqp1kiRHR0dBENy7d6/T6XzyySeYEXAvvLy8HI1Gkm8Laj/MDJMkOT8/Pzs7A05dKBTw7Bjsw/NlwUelFLpKrbXT6RR9Egw3Q6uaEXMMJ8C+1Wr14cOHd+7cqVar5+fnz549Q4MFCyJhKOJd3MfDbQTov5EudihvYOBh0cB4q9VqzWazXq83Go3d3d1Op4P9zhgzGo2+/PLLX//61xA+xm2R3aAkjHpks7nTrID9RWbj2V3mDbSzlfI9D0tBuVC4/qFcZoCYAVmUB7CwOAxip1leKqhKBZgsNir7abJOnrSqg8STlx83f7sMYxiAkPxlGQ9k1X624MjObJWKW45JgCR083IkJZi5EsxtHDJ2cg3KksQaY6xRZAxCl5DiuU6WmnwiS+QRGYH3aSEEwVoTWwBis4HXpjKgW7zKuCSiiGhKNCAakRdSOW9be6ZM1tfWeOruPXu4YxsVHQRaKc8Ya2zCghI8kmX9QPZzyJvPrhhy2GQZ3LQKfr4p0HVzPCvrPIYBIKuVLHbPFyt7vDgF4FDWob1zAINNHx14LEZPpJQ2miKPQmuiMCzGJiIv1oXYq5iEtAVAXCQq0Ct7On0DoNGuGw+bYFYJ/m5RH84qZSfr/OIcxNkx01MbAGKVUURJVknxlPmKeFUsBf9ropiUUZrAwlSWLNTOZO3W0ZKWdaBsP1BWwHp7hOy8/vqv77ESsdTjdu6SIzHhNH/w2zHlmTfjzHqOFfmXiEkQpMHlGC8Av4EbLuW847YV3/dzubzn55TSxaI+3A8ffzwNL+m7ankQ5uOpul5OUUeJhNEcbRh1WwDibK+GyZRA1JsYMNKGAt51cdfkcrZYVEnkL0KFUct+2rKoJsXWpNLgFh7b24W1crvkFRIK0/pdEZM9IejswO7quurzSlYCG6JKpSfi9FnfHrfHLUB8e7w/e6qjTyeLbOCsQWSTKVHIshaLxWQyWS6XSOYBmxaLxbOzs263C9yq1WodHh5uV5xAIs0iBqVSaTAYYDdl1jBzc2BrBkgXAW6tVptMJiAtAkRDRzlHBrwJ8VYNuAed7+gKH4/HfJJIvAG6gW4MqUp8DghuAJsgd4CbgxRdpo5OF79MGiUjiSMP2dyH2876boAGkAnjeQGhYIiWX8MfiPgDJwAKqpNP4u5JtQrW2WBZWLQ8M+oKGhogAwlPS+4M7hIbhfX7ffAf5/N5r9cD1olXVqvVjz766Kc//en9+/cRSy0WC5gygaF5enr65MmTk5OTOI7xRCC+CRyTr46DV5n5by8dcwaYJMl4PEZTOUod7XYbKGEul1ssFoPB8OrqyveDYqGQNOpGVRQp41NM8TyZJ0lsrc1HSW7uB0Gg/GbgUzUXB4VFNVzGccJcHiaT4qmBgcid7IyNYnxKdmQQBFBtZnBfOoPJeNdp8b7JrEc4W61WgUUCOYUmKQCmMAzH43E4HlfKZSW+Lp/PL5VCWzr0Q46Pj4GLMTKLAe/7/s7Ozscff/zJJ5/s7+8DF2PWv4POoLCBChBuApvv3TA3YLofOgPq9boxhhmUmLNEtLOzI+8DW2JCcoSRoOVyOR6PuZ4URRHwSpx/Pp+/f/8+XOlarRZ3GmKAsSEbtIyLxSJWJyyMUDnAYMYAAPbneR5gcSDmqKwAFeUWeAySd7sL8BYgxwZnntJbj1b9x1j9XNYRMYaRCcxmsy+//PLly5fz+Xx3d/eDDz54+vTp2dkZFl5jTKfTefz4MfD3wWAwm81QKOr1esfHx0dHR91ut1qtttttZFmXl5eLxaLT6dy/f/+P/uiParXa+fn57373O4bAUMVMkmQwGJyfn5dKpXa7vbOzUy6XoS/Mfnp44thWsNDhDidJcnZ21mq1ut1uq9XitZQ7P1ilF5rLoA+jwHl6enp0dDSZTJBMYiBBvwK3F2sgjF7DMGw2m1gErq6unj9/7vt+o9EoFouw3VssFthwWSZFKTUajebzOZZQ3HYssCDvA2RHIWQ6nS6XS3RFtNvter3OmwhG0XQ6ffLkyV//9V8/efIEGD1vT4DAwKfGgEdFBKg0Xgmeu1Q7pVSSwqnTAGqM30SMNZfLNZtN1ekwg5jnhYPJSlxYOnSRkG9yJGUdFNVBkHGxLGrPlZus2ayUoEV0hEAl209Dq23aWfhGnrCTEm8CiCUUKIWVeXAyqU0K9PMvuZAjfYAd/UfZQYWblQAgtsYYMgmZ0CYzFc+9a2jYS+E/SilRKjVwx59xatdjBZCXZbeZ1exaosncjL8kWqaNupZoSTQg6hKNqRzQoz3zkwfRnVZcKpJVVK2re/fpzgHlcl6c2CiiKEyiMORokG8pRjLw37WNz/y4uRiwFri/HjNK+UGgb+wZi+Y1vaomLNnfa3d5yUzHo+cQDnX9UBwYz7hqKViEyESKKbHHMrt1QaNmPB6DriHKCVar2Fch2WQ6M4uoFFFog0SVLFEqylkSALGfCk1kScQ2w1h0hoda1ZeIMwivXXWBizewiR2AOFmnRGyEo5SEp9eqTDhQnaOIwsdaaJjlswEFKksRqUQpq7XWnu/5vu8HfuAnJiCi682X6zqOY6fEQLf7amYh42w+uGmxet8yWQcgliskrVp68pLuKMZgN+fiNxuhc50V+mP8FePx+MWLF0+ePPnuu+8uLi4gl4csaWdnp9lsorkWVWEuybBadKFQCAJfebpRNz/9dNnshDsn8+WpnlwE8dyjJlGJSBEViLQosZgM+15nlIidscfApWSpL4nmRGE6OF/7eNWqqyStTgF7/QJLKoq82Ty/WJbyvi6VTBBYY4mDScRLssaWT48tAPENOeBrseBNjUSRMTSZaLHh/oDxl3bJYJubEZWuBY6uHeoSwSbGPS+nk90Te+XtcXvcAsS3x3u1rWbbPaRIEPA+mSBxWqKUajabDx48qNVqQDm//vpreLmi1/Xg4MC7cXAM4iSSW9AtgQYy3sQtnDJ5A7gD4hWJJk3puMWgD5Pv8BWIcfE52E6gCwl1C/A3gXJyWbharQJZYNJckiSLxUJSUx3fM9kRxjZrJJpYHVEIEmZWlPKaEU+w5SsTMGnVq82Jk+R+KX1jkSez3RAjmHIYcMKAs0oDmoDPWcqcMSmVcXCWHQCys1gs2PYaMFmj0Wi1WqDrAlfCa8CxRQViPp8DHMHl4DUOqcHxnb9h3IDTZtgOYAoJDWhjTBgulstZGM7iOCQiT/tKEVONoms5Pw2IIAgC7b0CRjkBo1UVLQkQ44Zw9gXqKJ4C6Hu44Q5UJx8uYxxryWjbIy3pc4IBgOnA0mBowA9zOWCar8LoNMPEn8PhECRQMBa5jIGfK5VKs9lst9u1Ws0xS3Ram1GbAaKKy7+5+yVPAb5FQOhA0eXZgaWDMTKn7Vp+IwYk15wA3MgxySKATEAG4oY/WQwEIAKqU1i7wB0GqAdEj6tExWKxXq+jlR7AJSaglPl+5y7McguQzEpateFyjKRlYU9CWtK/DmsFGzMOBoPJZAJIot/vHx8fQx1+Z2cHbnWwowQG4XkeykWlUumLL774/PPPrbUXFxcvX74Mw/Dg4OCjjz7a3d1dLBYnJycvXrwYDAbwGbPWgtndbDbluGWfTIazeQLiQQOBLRaLAO6/++67TqfD1nbI+pDVBEHAnCBubcG5PXv2DGcI7yCUXgA/ofxQKpVQ8cKwAUkcOjOc8GPBl1OM63nYm6Io6vV6URSBmF8oFJ4/f54kCcD0arUKXz4o86CCi9nNz2ixWJyfn5+env7mN795+vTpYDBgOj+PbWYgYoVExaVUKrEhu1RdlA3vDCzKFP1NnRWDIKjWatRslnI5PBcoQckqpoQ1ueGdVi03WTeAe1MYIOa/4s7wz1nzLtk9wyC49H3igSGlqDc1LG/SYpa87LXe69mNjC0ipVouNww5MuuM+XLfhiPQtFbzfSXHdk7MWt+YXJLkojiKA1JkPHWNBVOqt8i6E8icgxSw8DKCEmZVQFbeAJ2m2bFAhxdEc6JZqtoZkpqSWtrAUqtiHt6N/4cvokf343rVWqu0r6tV3WyR76kosstlsljGQEPZIVkudLxoZ8lo/MQdOS9HPOR6amjtZ4KxLWvxNX04E5k7AyA7eGQsJF0EsG4wd54r9HKGyi0Pk9phEPMOCNAZmkscoOJrPRX5KlSUhEsdJUtjI6MTm7PX1LkgxYV9QR9Wm/HWtRxzidWazR50lNGzXksidmDc7bLFNwGIHXKxcwIkLs1BqyV3OMWpbaRsrMlqrbTneX7gB36Qy3GUreV+4cDEsn6QTfG2Y8TSdtjRLL6JQsXf1+FAgfIMHWF3RyufViW2eItBnIAFNpfLVavVer0O7gJ/+HQ6PTs7e/78+fHx8XA4RCETWmrVahXeBrzRyOQOy6/v+1p7Snn5fFzeiYJC0ku84pGx50QjooSonvJS86mWjtnsU7dyOzLaKdKkjgHiabp+3kRf2xf0f5X5dkukyPoUJ6p/lf/2m0aFwoO9cbU2L5UTYyiObZIY5kvxoOV9PKvg8cPHQ3Yd400/DMPEWjWZVOJYv6twupreq5z4M3vkOcohKonfl24x4tvjFiC+Pd4ngJhVgB2oJRsZS31MbJ+OECRSXyQejMu80ckAc0GqGQQBMmRWD0ASC0gLkS6jh1mfkLWXIJMxvAyUCinIwGZQrLQgY2jWJGWqLEOoEg7Ohu9r7WKygQsJwQeZiGIHpXV6u9n+MgfWoXVGN845yJ5T9oOSbkvZFGWtzYUkKcucHAczv8AP5aDWuc9SwVYSGDnvkjbubxo38McyaA5lPQZQ2GvI2iSOZ1E0i6KlMWwqvNL5a69P2xLZ6zApvS3cvirnlCPwx+p+ThM0I8KS0yGLDQ6g7+AvWX7EWrhBNiQiUGNDZ2Y+6jj2fF9lslMGj3gKZD/c4abJighl5DIAtjIl8Carx9oB4DhP4vbK/r61lj6O4CazDlnJQUaZJKjc/K9YsuQDxT0Easn3hz3WmKvFA7Jer+/s7LDnp/NYnRN4h5mVA1rxl2ZPg+tPUsgbVHcUOUajEUi+XFJi7na/3z87OwMju9frcaljd3fXGJPP5/v9/uXl5Xw+v7y8xG5SqVQePHjwz/7ZP/v000/h7QYEGQzx0WjU7XafPXt2cXGBuhFUpME2BZoJuWd0J/R6Pfi/OcAZ20XOZrNiscj64FEUff/99zs7O59++umHH36IuhG7dPJSbIwZDAa/+c1vvvzyy/Pz85OTkyiKMJgLhQK4vaiwep6H88G+g/vQ7/eRLtZqNTbIYqwWMwssm1arBSr02dkZUK1qtfrTn/50PB5Xq9WzszMUMIgIUv6+77fb7YcPH1ar1el0qpTqdDqe50Ep5be//e2zZ8++/vrrk5MTtpzCCiALJFCu393dvXPnTrvdzuVyp6enuGOyFdepdMo99+20UHzfr9VqfqNRzOWAtqOOxfVmOc3ljCbhIssQarR64PRCgQ+uTeOddTJrVceoNGe5uI1rm5RlkCPTV2fL48BGzsHsyXB10LHQfFW/TDduaQHKQRQobE4FPWtzt3qeFtdMyiPtKVK+tiUvbOhpy45VVAxNECae0foaMsgTFVNQA5gCSKM5wRV14L+sT50DEEepDd2caEo0IhoTLYkMqZiChSl6Sb1mHh4knzyKf/x5/NFDU6uRtRTHVmnyfW2tCcNkPo8Xi3C5DDGSWUqL1zepHUFC6NnxhXNG+zqxUe3dHCBmdDFzOBvrFlFvpzqSPXBW2YKN5NRnmXdOXMdhswSIrV5qFRsTWLu0KrbaXOuK6FVc2FuHaqkN/ld2gzL12vHjkNDXCq1u+Y3dYJxIq5rIm0AcBx3Ofgita/M3qWRK9MpkzyYqDnWSKDJKkdJa+941j9jzXvVLrRU5cVjDat2xHSPeVISA6dh7m8wiP+Vrz6axsoTJcbUzibiwTakdtDEGfUiIKLhuBH2nbrcLHwVQW4rFImrJbKHBzRwy3pYPyFqrPMr5VCpSKaD8gvweRQsyuVS0J0wtzqTQBI80nZlNdh3FHr8UdHUVkUpIJ6sq2+rVDHMx54RMTFZ+l8NcVkQ+xYm+PC98uWyqhbE/th+Wk1J5mSSKSGlteD/iYirrS2xCh9emqzeJabkyTaKXCHHddfHbWm86TZLknUk7FFLpYUeJWKXkYtxZL30iLDqxJCoSDW8RqdvjFiC+Pd6bAymWdELn4ENuseyUNZvN+v0+mmfz+fz+/v7u7m6tVgPlDXZA7XYbcpw3dKtzQhBsz8xjAmUPAk9gQ7RaLbatGw6HCPGRUkrSh4PMOjAxi5AiDQZSIOq6Wuq0MpoA9u7x8fHl5SWbDrG5HO92TB/m8rVkYSDhd9JaQAAshcxnwgZx+CutKm1JzhEDcIw3yRejYYobUZmAwFgP68YymXc0GkE6A4xpFpB13LQlxMxaH4PBAF32AF6BXCwWC8A3hUJhf39/b2+vXC6zQASTbXEys9kMwibcRseKlkQEHBPjQYI1rx1gnP+gERuDJ4oiaBBzN1m9XqtUykmiLi8TraNqdblYLMvlWGtvLUlB3hMgztz0DTCLm6MZLuELp7QvHlELxmEYhmCpy445R+JT8jS5G47Tvy2NgRyY8gCWBs0khDggocqUWx5RoHwCIwajVjZcS3EVAL5MWWKOBtPu+E/AQCypvD2T4THDoLMEavFRXJ/g7nIGi3mhY7xJusmxvgrkHWhVVhWTHe32uFhef4AhXqtXj0ZENJvN5vN5uVyGTAF7+vV6PSgejEYjgJ7FYvHRo0c/+9nPDg4OeHbzvJCDhLUj31VaJa2x+Lt4PPCKwUkpHhAmUafTefjw4eHhYb1eT5Lk+++//8u//Mvz83NQzMAHLxQKURS9ePECHmiYzqyt0W63i8ViHMetVgtoHYjblUrl3r17H3/8se/73377rVKq0Wjs7OyUSqUwDM/Ozr755pvBYADDt0aj0ev1rLX1ev3hw4e1Wg1fYYzp9XpY+mAJOJ1OwTIGLxVUbilejOXOWntycnJ5eVmv1/HVWKyA9kZRBOgf6hAvXrz46quvvvrqK2iSYExC3qRSqQyHQ5gcBkEAkevhcNjtdvE0d3Z2Wq0WLgHbGbtHArUkokKhgE6dBw8eJEnS6XS+/fbb2Wy2u7u7t7cH3eF2u316ejocDiGjUavVoDi8v78PcWQIJS+Xy8vLy4uLi6dPn56cnAwGA6DzLA7OY4ylEur1+o9//OMvvvii2WyC6QzWM6YVb3M8aHnXYxPXN2UGKaX8IKhWKn69XgwCLh1JrM3h8K5FyiTNloFUgPXMHGfLQU4m2W6Rl1lnHZaXLE+Da9Wb6peyl0gWjUh0ZXF7EIkei6yGpgTscBWOli7zu7Eu8XbAVXb283RKUE6td5VFqLXWSntEgVKU920jNz/I94aBykfV/rQyGJWt0Ra4RpGoTLRMecTsWScBYpMxFrPCT4xWQZCYaEE0S6HhPlGPaEA0I7KklC3q5KC2uNsOP/3QPP7IPrhHu3uqUCCyKjE2SUwc02KRhGG8XIaLRShbv+WK57RkSX8kGfOstZ+SJp8rpfQbjv9UgHgTRuxYDq6llku5iSyNzhmZssa5iU4hyQ2O0+P1+ZJVOjEq0ioiWpKKSMVKGRc/Uqtivm8BNtrVJvq1kHH2La/9zE1IsfxSuxnIpnWImvPtWemMV6Gz0Li4vuEUhzqJtDHqWvf3egypLcjv2iHxpoTftTra7//BY9shZDjjn4exXEWzttsoRvI/1ev1vb29RqOBZBDZB2JgZDpIIdHzh32Wjbul+I98UnJ6KmuUpTDRea0Py8lZMTqP1eRKR1OigKhG5BO1iKpEFaIkY2imRFHErCpLQFAiTF+A3osZqQXlFdWaVNunQL9anOz16OOfUBckpWi2UMOpmszVNZFGZ1oBFJEim9AiUn0T9Pq52dy3RnlaWXvtyOf7177QLBuIIFCKS2xiuryFxAQXXJnzARec62Iwkb9cJsa8M3+4WEiWoyyaSyXFfaKIyAq/VsbeorSxxtDtcXvcAsS3x3txMGOXc3IudXIwikQFjF3IGrJjmOd5e3t7e3t7zWaT9+PDw0NOEbm/ePuBDIf7QJmGA1jN933YzWOVB/TDuc1oNOr1evD2AaQofTaQEDIHhEk3wO+AzTGcBHoXzO4hfgoCYLFYZNwNYNDLly+hvspaxq1WC7A1pbxI5GCM1iEJwQVSakTmNGvLLJeplyQkIBgYkkL7vIMyBCytkHB1CFZkfxOrCuCXbHjN6DA6vpH/gwbIeIH0LZHg2ng8Pj8/xx787Nmzq6srEAlZs7JcLj948GBvb69ard6/f//x48eANiD1gDGAAdbtdo+Pj09PT1mAGDqhACL5wvmB3jyA4MQbYxiCelpreGfhM4vF4u5up9msPzsq/qf//D+1O+3EjPb3F+XyVOtrqBRohcR5mTeKz8RoDMOQ0VV+4ogycdp4DWBWwFVaa7YpY0kQjjIdWIR5rKyq5pCMsmmefGTz+ZyFoSltspYwCgBiLfJb9A1QaieI23VwcIC5EMcxCgMY0gz+4rswDZk5DoYy4kVWdXSQyk0H3CYx3xHQszAIRmy9Xg+CABriEFOGsAkmNT8O3G223+G2ejwC6NLihFnfBrUcwIuA1fBKtFNAo8bzvMViAapmr9cDx5Z1KjA9rbW9Xu/8/PzFixez2ezg4GBvb+/Ro0e1Wg0TDZ0KqP3wCvAOvemcqolkpnP5gRtOuc0Cd7tQKECxQWt9//79L7744u7du9baZrP5m9/8ptvt4rlwQ8lkMgEcqbVutVq1Wo3b/Wq1Ghsz7u7usvR5rVa7d+/ezs7O1dXV0dGRMebg4OCTTz45PDwEUAvOrO/7rVYLWkD8IKBTD8bxcDiESj7E4iGYAK0GVlRgM1WY4DWbTXaHm06nl5eXg8Gg0+ngoTC0ncvlxuMxmkzPz88HgwFT6TGhoCnBa7JSChr6uHU4eTg9sqkd5jIqgoCV0ayTz+drtVqr1YJu+P7+PlhLIIru7u5iNTs6OoLZZrvdvnPnTqPRyOVyEDzBQjGbzc7Pz6+uruI4BsOaRyYvKbKlwPO83d3dTz/99Be/+EWlUrlID9jDzufzTcuvtFGSiNtNQ1LPK5fLfrWa9zxuLHD0NB0ggDKNFLIMxt3x/IzYZhN3mDV54TWHKjhDxuyPmuURZ7m3DvAq0T0HyJOwBVYhUJykWmXWO46xeNayd9xBORjglh0mzeGX+XxeRkqSXipvprSm1NpDO3viBVYpbW1J2V07UXaholl53ng225328/Hcp0SRT1QlqhHNiZYpeAGtiUKaP9tML78R6rFSc1alJCwmDg+IroguUozYkFe21Xb04YPp5x/NfvyJ+eQj3WwWAj+nlLbXD4slnsLlMkTI4fRwyCIrZdi4ktPNa7Kjm+n4PTig25tiXpuEs9ayhuW8k2XgN2Xera0lb3qZMaTSHnNrKUnIGG2NslZdt1SprbDsm/6Tuhks+85wx3X+eG+WZW34jYNuK77h6Q/aKmXlW5RSpOiG/N+b/9M/mkPWP5zODEkTlkQTZ5Zhp8Zew+6yQRDs7u4eHh6igQbxCRqP4E2Hgi7MM9BNywkdVlfpFuPIzV3jitoslyZOVLsW/YsfT5oV9aun5d+d5PtDbfOKOkSWqEFUTTFixynOCKZwvCrRDqHhSDCIZ0QDUgtq79l/8jn95FPqNMnz8JHKGtyu6xuTmMSYJAisVurpUfBffuV9+aUeT5SltB3ES93V9HWpQ3tJozp/dL/3yY+u9vemuby1BDqIh9wB4Rm0sJBUSvE0PCwZ5cpY9I2QYu6CYmsfRPXc3kdozXyHhRBZ6aRUX9ikeLoRG58sSpkUJla3EhO3xy1AfHu8Twe3sfOqinwplWENGVJBljWbzUBE4vTDscx605aQxWLR6/WgyDmdTtGznM/nO50OoJZyuYwNI4oiCFNyt2+73W42m/1+H+A1fPOYFSLbeyX9Aek6EkUkgcB2YZ0EQrT0/ua4H5Zc/X6/3++ziijwvlwux1u+bJnhMjWTGTn35vgDCTA2S05XpAoeIFSZrjDtRXKEke7O53OUtfFcUNOW/fugp4ENDVyYfVq4E8fRl8QNd0oL8gcAo71eDw/x5cuX/X6fawmAERuNxv379w8ODqrVKqAfjqK44346nWI8XF5eQmcTdQI8U0CWnM0yvZFuoL27ptybiksopYbDIRjEAH8bjVqzUX3yfWNw+Ucz03jY+5vB4LhSTpQueJ6P4cHG30QEpInlrZGcSyQRMLGEXdgLjocWAxBQtcYF4nHzk2KCP6t3VSoV6GWzAokj5rXWyRdfMRgMxuMxU+DlOH/FtLU2MeZVFKVUEAQlzwPGh7EETz9MN7C/HX8k3Go8JlBKg5QYiAGJsSoFQFliby1JKoqiyWSC8QZEmI3RcJMxo8GdXCwWw+EQrYJaa9BL8cowDPv9Pqjus9mMFTa4v17eGZSL2FVD9hez1CmC3XK5XK/X0ZwBKA23dDqdDodDiDsHQQA7eIy9Uqkk8xYAeaPRCGsLtytKxfB3xfGRDROOVgDOX0pP4DGBDwt1aaBUmODz+fyzzz7r9/vD4RDDnkSnP6pWMBeFVaDWutFogM+Iiojv+/v7+9gFYBdZq9VQgcAd6/f7SM/wxEHjRQ1gPp9DmAhOboPBYD6fw16mXC6j2oQKUz6fR20A46darULUAiUBvB5jbDabXVxcfPfdd0QE8jLGMPaRly9ffv/992DjDodDjHAMD7523ECW2OaBinmKLRUDFUQkyB0WCgW0EcD7cTQaHR0dJUmCcUWp6SVKqsC7YZIDHBlVW6xCUE7M5XKoWJyfnwNE7nQ6vu9//fXX0CDmNY1T6EKh0G63v/jiiz/8wz/85JNPQIj++uuvAeizdCBj4g7RXvbVvulY1Vr7QWCCIFiVqXHqXo7wq/NPDnLHRWicDDfLc/cACQchpoA5E8SRCc4W4RzCZrYkLynVEiCWgC+CK75pzoXL9zL8Lf332AFV6kpLTgDiB0ef0QGIHU3P1Hhea88zRIpsTic1WqpksswvZh51F1XqWztKndnDtK82RzQnyhMtUxsub1Wk1QGI44xJnUoZxJCYAOoxFjxiIhVTrpHsNpcP7s4f3E12d3I5P58k2hIUPyhJbJJgX4vjOIrjkCFy2dYjhcVkkcMBiOVt2YTtvvGwt9YaY5UyGZ7ydjw3KyBGGeUx59z4iYPigFnM1QJ5/mvl2rJjOzaUxDkyuemiOptVl8tibHyr1TV+5GV0h7eDqm+3s6l171WbcVsJzqoNdoh8lTols+s3wYvtOsTZkR42pD2rCzYwRiuriJSmemNZLkf5fHId0Sjf8/wgsElyzWtZq7HzDhHhTev2e45iST3AtVWWtb/ht/Dex/1ScDmu1WqgDXFPDMq34KwU04MDWmnW6sjKyy0y/eU1UbdVi774ZJ7PB92r3Pdf5uwzRXmiiKhONCNapnrrWVzSZOjDcoCFwqRuSTQhmlH1Dn36If3r/1Hd2Sffv36BsWSNtdYQkSWTJDHZ0A+Mtd6v/1adHetvf0tqQZaEXEwu1RY3RBH5ZdtqzR8/vvzx593dnTif18Z41hKrMLGhPZLQLJdFLrayXHdzdJiHLju+MEAs5T6wpb0z1RTYCYZEPtGcqEi0IAqJckSaaJnKN0NNIlnVoMCaULgFiG+PW4D49nifDlmd48DR+VmiTqAasSqF9EF+u9AEvFEgv6PRqFarRVEENUnsIvl8Hl8BOI9SUi3rEgIvQA7JBD12nmEslZEvFiVkjQLW+UVmyARbR5cT8TSz+YDGWmvxjQCzQJ3jj5X9RPLeMpUVKBj7v3GvqMSmke9JaUXZ4ge0i4FvuMPBKhDyFKVSqVQqMXoItALe1rJn0El7ZFN5NvqUiS6DvIAIp9PpaDQajUacOyGEajQa7Xa71WoB+pGkadZ9xvmD64fwy2lezp4M34c30mZlSxZcMpM68RXoP1d+ITGl0C/OE5pMp4NBqHQhny/AcgrjB0guC2ez3Adb9IJTgCydnxcgHtQYpIU6/wDoh5+1JL6xgC+Aezw4AJfyEWfDXxIKHhhRmHEYVzzsJfFBKUWrNXZF5Pl+2fdNqwWgDdJsk8kEz/3q6qrX6/GZMDuA6xm4G45kJ7PX+cIBe+FDsjkAKMnA79AjDzgSV8GPAJUtcD0wyEFbYLwVgCM0W8FxBjec5V95EcC8Rv8gDjwaOR3YAqhUKkE3gK8IfHx8XRiGGBVArHBiGIE8hqfT6cXFxWg0QlGENTfwg0Oy+IHrvwOrSQUbBkTw+LBuzGYzpdTnn3/+z//5P9/Z2QEt1/d9tF/86Z/+aaFQODo6wt0A3FatVpvNJnDVSqWC34B0g/4ApVS328Vasbu7C+VcqJc0m81Op8NWcqgCTiYTtnrDC3Z3d6+urnhUsyUdRkKn0ymVSnBvwwDjNZy5tKjDMY0XJx9F0dHRkVJqNBoBZcbJt9vtSqXy3XffffPNN0dHRy9fvpxMJvl8HpxcrK6QYcGeBTYxsGO4ES6Xy0qlAjN0jJDFYgGUHFMbYsr99Pjmm2+63S5UI/hJYTGH5sm9e/fa7TZGI1Zj8GHL5TIwx7Ozs8vLy7OzsyRJGo0GlJrRHrRYLPDQMSA9z2u3248ePfrRj370r//1v/7FL36xs7ODWYCeHih1cLnOSYAlMn5Dl9rsuPQEAsKHg8fJIo2zhUnFWFonqiub5SXZk5EXKYzjCPFvEn7NQqtrp5sz6bJAreP+J9E6hxwnkWUMbK7yYgGXZ85FuKxm/WsBYi4eKeWRIkWJ1jagSAXzhp9UqOSFkRkrGiiKiHIpdlBJ7ZVi0Ufv+NElGQFis0rbVCkhK7XwukY6pkRjItjWeqQiKhfidiPstJJqRWlt45goUcZgkJAxZMwacV7G6NfqLTgv47BnrZ2gHJZrh8r2mISUMhmB1LXos6zKODBu1qDMeZczZlAzk9QKR4aYJcv4Q/Bez1NEILoqE3vxsrhcFC9nu5eLndGiHsYF6+vrhmt2qPNeBxMzXGs24K3b30gZszjKuOGpjMxq9ockLWaw94Qnzp/eEMqxq9BznNY5QqKYtEdBYCuFqFla5IJEK1La1hrL3Z1FtRLn89bzAuPnczkqFHytE2lGjZjH6a5w/swOgxvmaOsFyojovecj82XepL5Cq8IsThLE5Um5I6ArjsFibpjjTSorSbQdwjZkA08VCkmnFI2mUTVv1YyoR1RI+zCitFxhtg6zrHSP1PBJ0oG9pIBUu0mPHtDBPmmWmLAkGLBAihOlEmOpd2mqRasS8ZmyamKIElIRedaWyuHe/uTOwbhS0lFciBLIo7zaWOW9WjvGHOGjt0AVZGrJ2SXXAq8Le1qrdwgQF1I9JUo1owtEM7p26SwSTYkKRB7RIpWeiImKRDMiIioTDW9VJm6PW4D49nif0GGnHweRH2W61CWOzJAlcNgfSGSTJuAsOAv4DPQuSVNlPBQJvOS68t6DJmJgTPhMuRPjAp10CJ8MqVzAUiAQSRcaSgm/oGtxVzJr/EljHCnF4DiS8WVKmh7gJxJ2KDLvZQkIpwVYQrQM/PHBbEqm8TIyCKqdNORh6jfv4hL6x7sc7WOOqwCszMUB4JXNAwHJMfgONNxJTRngBsoM8JpP2ykpywKGhLHeaNg7fUyMv2utAj8I/ED7ljxLRbI6BqNUKWUtISJ/ZYYrOpQZuGG9XVw1e+LJ8cyox9p0ndM5Jr5J4yPcWLAyHdXpLOTnCOlKsWnAoIzD4hHnhFu2F8eUKQ/4QQDifD6fhyQLI7y4OdyFwIdDneB7xcRVljfh6QnYfVMuzWmq5NXyJTg8AvBP+cU8WgARshglVyCYXcUvZthayihL1q2EGPDcgdNxBYtzBtnWnX3oPONAUQHY7TgU0btrGnVIcHKx5R4RvjQA+vP53Pf9n/70p//+3//7IAi+/fZbIkLbR61W+zf/5t88fPjw2bNnp6en3377bRRFQIcPDg5arVaSJMPhEMD3vXv37t27Vy6Xwd1GLwhucq1W293dvby8vLy8hH0fBhVUIyBMDxki+LYBYX/y5MmvfvWr7777DhuHVPsBtXYwGBwfH19cXEj6FfBuFLGA2KJgANgUXwdLUsgNASAeDoeVSuXo6Oj4+Pj8/HwymbAsAAYVuOFg96O0gCGhta5WqwcHB3EcY7Kg/IOVE7Ux9Fg8ePBgd3cXmsVhGIIFj1oOsOZSqeR5HtbeYrH4+eefo9ni6dOnR0dHo9GIRcDn8/lwOIRm4ng8BngN4XU060wmE4xnXEihUHj06NEvf/nLzz///A//8A/39/c9z4MJ4enpKejSGB68S/JKRastJm8nanmtxLo64F/rsJQthq0FDrLSsRIj2OQP5lDqNl2OAzTcFHZZXZklWLn9Mh2GmvMhvJTdhJF6o6tjgMgqpcjTxteJr2KPEmWtYs6aFkQ2k1F0vcnjN+uwP/l2pmHaa0RPGdKeDXwTBMb3LClrrLJGhrj8BF+PGa0dM9vR/y2P6UYAsbUwWCRBo8uO0iw53dFK5hWbMu6jkifBZgnopUC1lRVO5BCScSkrX6f0u0RrY41eLoqTcWE07JyP711F7T7V50HB+Np6qWNhTmDEaoP2giP7a9YJBGexMAcFo8wPm7zsKPOvZpXeG6YDDGRJEn5T2Uuw6S+1KH5kv5pBuvm1v6LO20o12t+bPTgY1qph4BtSlM/H7fak1QqLRRUEOaXKpXJO6ThJVgo2iDRQKJV8TNkMJE285SL2WkmKm0PJ708++05eQ6tOpI76FsOO2ZpfdpndJNsilghFRCrV/DWWlKZ8zhSLNiiQLZLNk9Vkstadb1SZIEFdV6R9mytQLrBakadJ62sx8ZWpiIqaJa2VtuT5lCtSrkieR15a5rGaEk3WvKr/2eSaT6I0KX19cRJAcDwVN+0+P3DsvXbFhriEtfadFTzAEbZEPtGSKEcUCgmOMBXfT9JmmjxRkr6S0qXm9rg9bgHi2+P9KbRKXAB4E0iy4GcxkoJABEQDdJH3ej1kmDC0eetzyOVykP8HZAm6q+d5oMHiw5mP6ft+o9FgxQn4/wCNAoUQVGLEuOy9AwACOCYoXYy3ghON7mA0Ju/v7+/v76PxGbEXFzwBXqBLHTk2Unfw4PBdnCGzqh1YsQipQTHDBXLAjX91ZIiZNcxdsaxgy4Z12G6BZUPZAAoP3G2NRn40LIOpjX+FLir37zu+22if932fDXwgRMBma06Fdj6f93q958+ff/fdd6wRAcFNvKVYLHY6nZ2dnTt37gASgtAq0FVQV6bT6dXVFYRKz87Out0uBgMGG9SQURLg1AXFCUDh0nDstWEfBpLsoMfgB2STz+fvHN55+PDhf/1mPowUleJED2ez834vH5uC1t5gMKhWq0iZgADiiTCPGJ8GZBzPiyUs19KcORhiqr4EECWey2US1hVBUgdabta+mdFkJ3LiGg8ozOz4x+ooYDJaa3UcwzmbkdnpdGpyOYxhFk7F+lAul5vNJjQTWBEYQxQ4OPiJ7G3F/FkuM3DNCVJuxWJx7XPkJw4qB96FR4Af2GiOEee1LkPx6oGWfwwMiE4wxxyPFZZl0E2m1OuShxCeEf4KQJAJ4FBOL5VKSql+v48zlzQTqQxORMvlEkAeFC0oFciTXo7vcAtgTEH6HJLggTIIyEIT9Xr94ODg/8fenyzJkWVZguB9j5llFlFRUdERCsBgsMHN3NwjIyLDM6OqI6upKqkpuz+hVr3oz6j/qG1vmmrfva2BMiNj8Mj02dwsbIBhUEDnQeaJh9eLo3zs6mNRNYU53B0epUwgkEIgKsLDG+4999xzWq3WgwcPqFIShuHu7u7GxsbHH3/84sWLTqfT6/UqlUqz2dzc3Lx3716apl9++eXnn39+dHQURdG7776LAYBFtdPpYD2nvyU0gqy1WEm00gU0WNrt9s7ODvamNE1//vOfQwEZdnAsD+CJNBoNIKpQnMewxDdiJIMjTJQE2wS+C6CzrlPiPOHMSWVSfiNeJ8OLmjB4oFgAUSfDHUBPDJ471lvtL4o7AHoyZVXQ1oryQ7lchnpPv9+HEjElUzACIYgEJR9QgFkTarVanI+Q3cCnffDBB48ePWq327iu+Xx+eHh4dHTEZgtOXtbAsKRjdfV0S15v0C7Lt5eKNhQB36UQ6tIsXVNr9XkuRQC1+spST1SvoL60qHMdNFNEZpeCxVgndXuT5qxpg1DPvlVfplzDjS0CQ8senNJ9yEya2cSFqQTG2nI5qzbiJClnsZGSuKpkoblExEgf9vA7KfiMiRIsdlf9wdwVxrENRWrONEVi5zIJ61m1noaBy5yNYxcnNgiNOIfrUApJZulT80iyXqWB77kBjNBGdrcEkZd8Tpo6Y1zeinQzQLxUVoWVfh1UaNlT1jsx01EZQt0OGDGaKpYKTZCcjhXAGGdtbG2cpeFoGJ6dhifHqy97mwPXmdWri3aU1cxlK3pJpJJjxEEOthbRYaPGhmZBkjkuik6+yKsR+k+migdxTtNLlDZroooKIt+Oz1i9PxZxYqxIJBIo5NeJS/LBWQSIzVWA2F023V8Z+dnltVxiZ07ESLmSrq9NHj+8+PEPT9fXJ5VyBmAuKiWVclwqBdbW07RUKmV51Hn5zLUVMPYyxhXsJ+Om45l5fn902Lm3k0F8g96LXDXf0wR8/b+aboKbRvNkhKPIOhHtQNAPGxwegdb+YoAtSkdObzfUoPiWNOCy6UySNHZZ/PDe4m/+enHxSGbWnYb2Zd2eTmw2vKwo+LDvUrfP5OofjPOxmJGUomxjc/7RR4uNdUnTYDYzGDI5/UtgjeicSxKbpjaKjIiplOWjD9zo/5qdnxlrXBC5JHPHZ+brr4P+mcliESPOSRKa6Siaz8tpVhZjgiDMNYhDcIPImNFPRy9r1D7yqGmvV2xTXbb8EHa7Xu5uiGa1gN7vcrAVxuWUapvTh/FEIpEk1+Lg9A+UfeudvsTdcQcQ3x1vz0HUCSs4+apYTAkgkqOHLBpBynQ6vbi4gDE9Ff2/H0AMgBWJLk5DcjNxtvAgnQbhCwwy7AHA4KhygK0de0yj0QCOA/wUmb+25sMJA8DFnoTMGe+Emn6r1QKVldxD2NkjgQe8y1vHG0X4cj6f93o9eK+Vy+XV1VXgzvgEosBUYmWUQ1yY1FGGgyDT8RvZ4oRmbYgejMdjXGa73YYkK8Q3iKoD5MKXAgSnoASxToozArkbjUaIPnVFPUmS0Wh0fHz87NmzZ8+eoWCQZdnKysrKykqn0wE+AmHNjY2NnZ2der0OUBscSWpT9Pv9k5OTs7MzOD6hhRlEdVwmQy6gUTg3ntJtJCZwMqh/4HcJ7gwGg+FwWKvVoqi0u7v70Ucfbf/zwauhXZRK+4N737x4/mDrNM0Gw+E0SZJut9tut8mMpusatRpwbtSawMkDr8GLuHs0fsSZcPBQdBgIEY3vEFlCS5dhqLa8x6TQsfJ1sxLgMjzcoDM+Ho8Jw5GVHGXZIgdJMSzPz8+lVltdXQVGjFoFZcG3trZoIAaZ4PPz83a7DUNCLCaIrTFrgFiRR0/SrnMOU29pJoAn2Gg0wH6CpABGBZAv3AeMFhQkarUaVXG9pIKCKmxGw42FIgQWBxQ5NjY2SIGnlR8lxT0BZSJNMM1zzsHKcm9vD6oCmI+4exsbG/fv3weCLCK9Xu/Fixdg1EKZAWIahHsgXPCmSDf0S8EJs9iACU5StraE/vzzz//rf/2v/+7f/Tv6EOJ/sUfA563ZbI5GIzzlyWRycnJycnLyD//wDwcHB+AUD4dDYLsAlwlEYkhUq9WNjQ0s3f1+HysYpgZxfI3rvfPOO//df/fflcvlk5MTiP9gds/n836/3263G43G6uoq+j+oE31ycoJvHI/HYRhitEAD+uLiIkkS1NLQ5IGTjPODV83knBgKNyw8tUqlAlWH8Xh8dHQ0nU47nc79+/fTND09PcUJVCqV995779/8m38DN0U+EayiKysrrVaL0sZk/2HK4LZT4w8/IK2FlI21ttvtomjBJhKssZBgBggO5v729vb9+/c3NjYg2I25+c///M+/+tWvms3mf/gP/2E0Gj19+vSbb74ZDAY4Ja+PQed+3t+3OWxOAGdep5s8vOTfg8y0anZRTKCYfBJRLQLEfKenuaQxWa3ZTQkpogCeCAARcw/v04gtl3Qvs5WCpIDGiLVjgeR2rHJVv1h/DkWZ2YTrAY5FayANF8OALHNh6kIJwkrFdVYW97cG42acpTazZhKEI1uaziM3MFIRKYs0r6pMiAL+3FUNzUxhH05hgrn5UpC6aimprybVUhKuZMZJaSXd3p41G0lgJc2CJAnS1BprbM529hQhlkKu1DvS2tBe7aEIDXsN0Z40x+vV6gq1DV1oEdU6Uyw26+6iIgtPM4jxxMknQFkUrRJazEp/QlH2mgBxYJM0TWfz+XQ6H43mo+F8HMRxVMqy4FJcAuaERvHpltJv5SpoyyGRqL81f5yC1NBqWOQAMf24+Poif+csf1EXKtJc82GW47lGKmWptbJqyZUiZ0TSTOYzM56a6cQkI/MtDGQLALFV6E+mrMPylnwTSDmKK+UkqqR24cS5xkq8szm4v9N/8KC3vj6tVNIsM0lsM4dJFxhTU2K1xit6MWLX1X1dx9L6PK/VZnfdMH1r0eGlHN7ibNX7iCf1wyQONxObY6fTwd6NnAWuAPgBvB8Ua3WBHzsmKtN6zdfn6fXWZKmbztJFbMrR7KN3S492AomT/kx+fRD87X75/NxmKyLj3HHOmzvXSQ8v1IBPRCYSJG5tbfFnnwz++l+PH923VkrjcWAt9BVLYRhdvSVGJEiSTIzpdOQnP0nfeSTzqQmCLIyyydR99rn9/83MlwM7jU1eAjGRBOWwVClVymWTplGQhkhRa7Vas9mkKYvGiLUFi27tZf+u3oluA2uQ88GlklE90yUjYpPkjY1mwMEmR4Ghs5RebYVJRSLlVpfleLHkCsV3x91xBxDfHW/DQbdrzalEdEjJHiJZBJGRYaKCShdX+R3akRC7IFkF/4hwMIuNTMyATaCQC4FX6idABZht6QAakGlDmxjUQkBLJCrGcTwejwlRAVAASwvuRvP5HLsaVV91exfScgJSuBYwr/EKYHTwNKG5qQMI3H8vrdU7IhsGSeKjKIFugce5AZcE65kEIsLiaHlG03Sv1zPGQAw0DMNOpwOWMeNLSkRhQ0WzPAARTb1EgWEwGBwdHZ2cnIDzCLJbs9lst9sgYiOEwiuQlgaxGkA/HgF4zUdHR5Bexc2U3EpIF/k14VELbtwSIIY3AnATGvjg/ozHY2SJK62Vna3ttc15ULGLpPLy4MPmpNdt/b3I2dHRycVFH1UBYJTAu6ktQHdHDDAtcQisjWR8cKiBoIH6Si4zTdLwCEajEcoMaIQHMqsjfp3505vo5qo7phugeYSwg8GAdQLJmb8Va0kYxHDq93qVblfLsOA8cQALBuY1n8/Pzs5OT083NjaazSalSzCQwE9HRkpBc4bmuomvmAzwPuAEUKbC4PQM+mgzAoDY63XQgiqeGDQeIiZLlmWtVgtCB7VaDYghkH2iSx4IpTEyuts1m02ONKql4+6tra3t7OzgimBZhgkFyFVzT/DP16VUfDc2oTYFj1GocWRe7FdfffX3f//3P/jBD7a3tzV1nYTo1dXVlZUVLDgvX7786quvvvnmm729vX/6p38yxrz77ruUOID5W6/XQ7WgXq+jMmeM6XQ6o9FoNBpBPrjX61lrUfmj6A1Pstvt/tt/+2+3trZevnz5q1/96uXLl6ze9Xo9rGkoXOG2R1G0srKytbV1dHREZGRtbe3hw4dHR0fPnz8/ODgA9ThJEnxCs9mkcCdhcZSaMHc48Yl30+0NChtAydEo0+12UWbAhRtjdnZ2/tv/9r8FLD4YDI6Pj/G9WGeAU8N8D7WolZWVer0uIljWOIyxmK+urjYajdFoBHR4e3sb0vDYHLkO08LFObe2tlatVh89evSDH/xgd3cXZbDJZHJ6evqb3/zmq6++evjw4V/+5V+enZ39r//r/3p4eNjv93VjB0WoJNdR9UDJ26b7QRCGYRZFgXJl1H6kHu5cRPG4ofPQosOievC5gXLP1fPCk9Ggf6xegblmesxTDgD9ondPPPKUJx/M09DS87zPDAnQfaUxaN5qrUqvQUZUW2nG4OEmmjzroefwzBJnnAsyCTOJwlCa9XR7bVwqnyZxWTKzyOzRpL4/bKRTO09CCUWqIs3cuS7Nk2FPhiIt2NZJDrqZHMIbi4wknGftymKzMu7aWcMtrJGgJp1u0u0syhURCZI0zJwN5Fo89wavKlaebqYDa0B/KeL/uqu03sq9qoAHEHuqZZrgfF13tu5JYl8aSMSoeLHDgMVCD9XSFNQ0TfFV1iapTdLEJfE0S3tGjqytBzZJgo7YFZFInPkW/9VCwLIMIHbLAK/0KhFSA8RT9QeWUCwtACCeiExEpvkPkxwjTgoA8fxb9M1WpN3K7m0mW+vZSjOz1s3n5uzcvtoP9kd22Au+1Z3wPOtMLkZhFNJNarMRE7qwmXTak7XmpBHNoixxmas2kp3tyebGaHV13GotyqU0y0ycBGkSOolEQmMiawPcfj0k+KxJYmWdlRO2qC/xL/XQVFPeHx+Ezce/1j3jmk9gEQEMeh9brdba2lq320XuhsAMcweZHZTWQK3QEwQpqrYG0QCx7mnLF3/UqJJyef5wa9pqmnp9cXpuFj8r//JZZE5FaiLjq7NAruqWJGqy0MwTAz4V46QSZO31+OP3R//6z/uf/GDU7QSZq4xGUZ60miAINQ86DENjUCST9oq0mvLB+5nLjLUuCLLpNOt20v09l87DXk+slSw1jZX40QO3sVZuNhu1uk3TME0vZevQAgUbD29L8ipt2useZIXXqm1wdyPPxoOML3dhkeCquN/vdJRFIpEo1xQ2IrFITWQoUsu7H8q5Sd1EpCYiIrFIWcTdSUzcHXcA8d3x9mHEBK2QzOim+6WSfFRTBZOXEsDfO/ighEW9XqclepqmQA9hv6MTMOTDrVYLuxoAUMgmgjlFU6zxeIzECRQ8fCb801D7BUmQkAcR1fPzc/wuGHDr6+urq6sAAYle0edd9/EBP4LfEbmufDO1VrFvISEHPISmP+bAAMeBziN8Z98NMBr9jJAxcv+DR1a32yU7eDAY7O/vHxwcwCALmCAZbaAeACDG1UEVgdu21iLAXjsej3EnkWBcXFycn5/PZrN2u41bUavVQHbD9QIgRtM3eGqLxQJPAecMKuvp6enLly9fvXoFEB+cVnwv4zmGWdTc4Cue8/vyKm/eO4YnTqUOFDxQRcBpl8rlcrViZ8ZlMp83Z1E7CMoikibJeDyBbimr4hhmhM8o0UDXMtxGKvOS5A4aIIk5GIQoG5CdCvYlYDL2EnKcU3tOs3uWervJsm47gibgROioGrBmLQw1QHx5IcuAHk4BlprSNB0MBufn54PBoNvt8pMJQfLbGbqxE5+iLtdVldjNgJISZyXmHacGdAPQo0BtFg2d4HO0xRwvhJQcfW9xnvgvAv38QN0zyISEaBHmNWVq6YINpj8AaEwxlN8wNjzI6Xu6fn0HHBdos0fOONwuzaPEMghK7+eff/78+fP19XXvxhIimc1me3t7L168+PLLL3/+859/9dVXFxcXL1++RKfh1tbWdDqt1+sQwDk+PmZ6BhovK2RcNEajUS0/hsOhd3rGmNXV1Vartbu7i5kFJq8xBmRwWghOp9Ner4cS49bWFsQToIxsrW2326PRCEVHVnGAR4NgS4EgcO6AF7N+iXoPZXmx9K2urpbL5ePj47OzM+ccSmWsKsGxEAJKm5ubcIQTkZOTkydPnvAugTk+GAywFAD/JWUY7TVovwjDcGVlZX19vdlsokDY6XTeffddmMuJyGQyAb+41WpB0GM4HIJhDfrwxx9/vLm5iWaFs7Oz3/zmN5999tl8Pv/ggw9+8pOfHBwcfPHFF6i/si0Ug5N9LUTHPErjbVIya0y5XJZSKcix0aJQu55fRQCaCykOovAkSHqWNZ5nTlFkgCU3hgEk2mvesW4iLiKP/OqikrgWeMUs8Khn3PU4ujzDW5bqkyRBBdTz1uNVYJ2czWY09mSni75krgw0h1Drj80ycSYy1lVK6dpKUq8NH7oktNaITObh06PV0sssOwvOh9U4sK5iXF2kIdLMu27lqvpEdpUx6hT3CrTTmUhf5FTMiYTDrBPMHq8P3l3vbTQngXUusOVqsN41jVpkTJRlQZoaa6+IgZJBpl0NpKAxrQHZpe8RpexfJPxyEF5uzWn6GqTLq+hwkXWu6xxLy3jeeXrMdHYHaq9m1glY1+HKjyGhWQvqY4HFWOfCLJMgmNeqp6vtSRyNyubeqPpgHMksrYorXSKn6TUuW9rzyil1iERBXYky6SJADBnfscgo9yr0AOKZyFBhxGORmZh5XqVwCsPlmxcigdRL7nEn/tH7yQcfJPe20yjMBsPg2dPgt6VQ+tGTV0E6VcLEwVWAOFBGdlrpAtqv4lql2f3184f3zroro0o4zzIXRNJqJWvdJAySNM0WC+ecyZwREwQ2CoJSGJbCMGKZxgOIWZHVPi5cynS7gx4V/yLBYo32esLcesugShVGuw68QWtAoA7tuFartb6+vrGx0Wg0QBd49eoVxMeOjo4gBoX2TSyheuvRLrJ8IhQiKyxBJhfDSUrhrFbN6vVgOg0qqQS9ihyVZNXISCT+LnQ4Vugwhv1ETCqlUra7PfnLH/b//Ee9jz8cra6kzoWzqSTJwgYB8tAw/HYXyGc9UuPMWokijnIxxtRr8tGH6f/jP8Qfvu/GY2eMy5yUy1l3PX7vcbnd7pQrViTIssDaS1k2cIeXRrDat4Bv0NWy70F9Q35K7jDx4svPzDKTJC57Q8Zw05wgLCIzkVq+pFSUzozkr0d5UUpEJiJWpHaHw90ddwDx3fG27qx6RfYcwxkdAiJk+wz1duVNyGICI8bP4B5Op1MRQSGXZ1KtViEcgb12OByC+AkwFPVJybWikPxw2wCQQQoVScQ6jBYRXBoSfgBMEK+UvBebIhhs+BXlkqe93dn/JSLURPa66ZFn8t7q2IXEPRJACJxp3hN+nRKuQAfAKTPGoOj94sWLs7Mz3JY0TSERQF0LhjiAvXSNF8kkZRNwXYPBAD3yk8kE6gfGmGazCYI5vQHBT8HZVioVDCH8IqoLWq4LH3VxcdFqtZrNZpqm5+fnsdI30JZZDPI8Cu1tQgcmeEzykyQBPxHUGCOmVCrVKjU7CYN5stJ6utH5ulrL0qReKlfC8JJLDtXder2OUUQGq2YX6v4pzc1nBAOtAKpI428NE6D5HbIMRB80Eo18DzcK8RDHvCxrtdOGwhxOfApk2F0ShHOPR2I95XK5nCt16OjN5sqJKH4A/eQI6ff7VBLXHbhsjqbaJmYQvblvwIg50arVKvgapOQzy4WlJEy9qJisLweRq+4EJPjSbrcpTAwAGtx2zW7QI5O6Hxo7ILgMqBHisPRyrFQq6+vr8GSr1WrOObzh9PQUVmn4dgwGjwH3phZ/0mqKTeUeOKKb2ZMkOTs7Ozg4GAwGqJEQyEMetVgsLi4ufvazn3322WcvXrw4PDyEKm65XMbUPjo6Oj09XSwW8AWt1+vr6+vQwHn16tWDBw8wjMfj8atXr1i0w/qP54hci+OTy0K1Wn348CH06I+Pj6kvhP+FLR4qWxDDASKMBXk0GuGioihaXV2lChCqF9Tcx3M5Pz/v9XpxHAP3Z05OzQEg3WCOTyYTCKFgbKOIQoX6RqMB+XssknQxnc/nuPZOp9NoNMgUQy0BwhQoLQRBcH5+/urVK4hcgysdhiFGHQon5XIZpQhUTfCL2JKw8qytra2trbVaLZQYMWj39/c//fTTi4uLbre7s7ODeaTV+fWk0IoQmkr5WhQ2a20pilwUSV4Z9URRr6t4eaUsrkU88DQ1rl2005SCJoYG7DzMRWe2WhCDy4jumdVJr6ca7JFGixiQR+fU5Sgsm1x2GGCw4McLoacuaeNac1YUaVo/ylAdZJiKiLXOBq5UMmHk2nYelZJyZAIj41kQiE2mUbIomaHtJ9FiGiQj60YikzyLFgVqpFf9wdIcPhbF05yJjEQuRE5FRqaymnRrk4fbw93tfhi4NA2NLVWqlXIpMEbS1CSJBIETyTyElH3H+kr1zqibIZauhBwk3Mo1Bk0SHOLPS5LaLZZrzxVrqdQJYwld2/D8ab3p4PHocVH8WYO/KGHyYHTBrcGrrebgvbPGGUlsY1SOhmEzLqfO2loarC2SLKWAb6I0Om8DEPPPXLXMZ8q/biEyUQDxNAdiNEA8uATIZCp2KiZ2QeasZDZU4tSpGCvGiVuIWGNLZr2dvXcv/eS95McfJ/d30yjK+n3XqYrM7PDY9Y/ddGxcJhKIhDkWfKmb4cggds65TCRxshBZOJeKWIkqyebqeHej9/De2Wa3Vy3PstQ5CaKSrdWsc8FsFuI2GwMj68u1NopKQQAS8ZVuDI4QtqYxyvL4PR4o/C8MI/ZWRUSS2hyiiBHjpumuFKyZWA+5NcAwYGVlpVQqQaebPY5nZ2doI6MFt25p0orGfCLcd9i3IcqnPS+/2eks7fXn85n0LsJsHrTDSrtUGkgQz202zwe5XJ0yWmgbzRaznEE8EUnEmmyjM/vxDy9+/HG/24njOIjjwMnCOUMgG+dwNaw1xljnMqxGqhQqTqTZTP/8z5P33o/jRZplmRNnrZRKUquWqtVqGIXWBkw3bgjpPUaaRpC/H/Nde1BrgJjZAVaxbDpN3xRAXBKp5lCvqCoRqqHlq8VOm9vZGfV65U5l4u64A4jvjrfs8LTzljqoLFU084gYbxCnRsKDQi7bZrUesY5TtUCw3m+QzyBxwq9jI8dBTFYDxIAbGH5Ra1KzgL3IbHmUr3Y13dnnpaOeVS5zOR7F3XSpPOJ17YfYF4FGIa8jAwgd+lDOIm6uIxjN/PL4I1rgzAtAtauV/nXimMApWKJn8obNm4rA3mncUITQMNwtxxhJ3Cw2TKfTL7744unTpx9++GG1WrVh0O60Nzpx+KswmI7X67/cXvtNrVqbzxuVShW4Fa4aOiQAdiGFQQSHgSCGGQsAQIXwXGAbiNgUHGGqFQNGhwgDyKTghVFvjoMf5F+8AQq8rVZLC6JpbIIFCY1u00ZDE6ysssrRsOzq6mqp1WK1gw+IgiQsVLC60O/3j4+P6VPBmgHFZPhdgHThJ8Z3Ln2IkJFFYcM5Vy6XMYSAA7LzGkBYu91G+I6/OZDAoKxUKtA5AUrIK2o0GtDRBul+NpsdHh5CSRyIHoc9i0Oietv1D9Ta7vV6FxcX/X4ftM1OpwPzxk8++aTdbsdxfHBw8PLlyy+++OLg4GA8HkNLgbODUyx7Q3Gt11e+1N1LT2ca3CdJ8vz58//j//g/nHOffPLJ7u5uo9EQkV6v91/+y3/5p3/6J0j3fPbZZ0+ePEHpBUxtzIg4jr/66qtf/vKXf/VXf9VsNqGB8MknnwRB8Nlnn33++eePHz+GZu7x8fEvfvGLwWBQq9W2trbW19dRR8QswCrNChnQ4TAM33//fVBxf/aznyGRAx24VCrt7u6GYfjNN98cHR1lWbazs7O5uQkxwfl8DoAVn9ZsNqESzrZTwNmlUglD5eTkBGTeTqeD2phW8C+Xy5ubm1DyjaLo4uLi9PR0MplQcx9dFOPxuF6vv/feex9//DGu9/z8vNPptFotQHhsc4F0PvB0jGR8GvRb+v3+N99885vf/GY8Hr/zzjtbW1udTgfVVsqnYI+bTqf9fh+VvJ2dnW63C5dL9kNo6ZWjo6PPP//8iy++2Nra+pu/+ZsPP/wQawv6J1i7ZcmKPEet5CC5GO7tAWIbBMZaUUU1D2mVgv+b7iwmIMhWepDQsT5wi8FjlYI+r0ZLvbjIXH8s1ZfUpDZdhqEMFL6RCCyXEU88VLe/kM7M17UorUeV1WsF389WsBvoqBoJpcipWpNNlrkgzCLnAuuiyNUqaaXkjJVaJYtn03g+EolKFXk5r59npfE0SkZGpnkiLQrUSBV9OFYqtCbPscMcIO6JO5NsIrbiKiZp1mar7WkYZEkSpZmzYYSdJE0zjYFSvoPoajGqYWlHQ8BaKULTw+Uq47toKIeqibFW0jR7HQaxF+PRonCpr6A3/JZWaNj44jGIOfjxWDGXK/kBmIyi6sWYMwjCHK80IplE81p54ZJZFI8lnszj+ThOzVxMLM7kAp1JgT4sylZLrtIhqR08VT9rG644J0gORQZXAeJMAcQ5fGySrBokjUrcrC8qlSQInIjJMpHMmNSY2JqJtZkNy3Z9U37wKP3gYfZo162vSxDISl1MItO+TPrOpG46EZeKBJkLRGwuJ3EpMeGcFScuy7IsydJFks6zbJ65VMS6qJxsbgzubQw2OoPOar9SmbpMsqxkbCmKKsaUsizIMskD5ihvcCqVSiWuLl4KwKqVJhEXOw/0bi5K6+ZfHkbMnU5rXmkgmJNIs6CwUDO84SqBbQ7aX2maDofDk5MTWKRAYpEcJgQGSyUR9CPTy5GuDqrszCziLBtl02k2nabthv3k3WDUsE9alVdJaTGxLlGOjulVXDhR6sMaI07ElF05iFebk3ZzXIqyyaySpInNB4NuU6BWBhUejDHOSZZh6TPOiXPWOVMqpRubstbNsNs4l4lYcYFzgQ2+7UrRm9fSIecpBGrL9O+HDutHoPsUmeDjdEvDoWYg/U5HWaSUY8Eu1xcORRYi4VW3VTQZJOp1LFmB3B13xx1AfHe8XdAwlSV0nuDZJWN915tZHMegwpHD9QZ7n0GAgrgEkDIs7iBAaTknNAF5AqAkD8Ibir3zaG0G0RiAC9C32WyGOJj8PlQa0VwMihzpwEC1vGC9aH1O3BMO8lqtFSLFSOrwsZq3QgComBLwYUnuQqPbwPFFOIBngZAITEpEAMQgmllbW2u32yBcr62tAbCguLBHT+bTZ77kxaOANdGchdepH22tBYszCAK0zOMT6NQHSPHs7Ozk5AQd2agN4KEbpUEpSn1YCnqp+uebcIf8VEFmxHUNBgNopE4mk7W1jrW23V7d6kbRKJoOFiY4N9l5mgZOSuVyBaBqv99PkmQwGMCPiz6NmkNEKQmNOLC1E6AhYGUQEtlij0GCR0wZBKh/AJ0hjM5BS0wZ/MpWq7W0CM/ICWOA3PA0TZvNJiYFKiJww6tYWymXNaLa7XZdq0XaoHZOIzpMkBrdedVqFQA6ef0EKbQ1oohUKhWE4/V6vay+txgC4v2AzHCqaGuYzWbIe3FgsjcaDcBeHiJAuYA0TWu1WqVSGY1GQBIhXowzmU6np6en+/v70MDFtcD+EeNZWz56MIGIYBkBfH98fNzv97HIOOe2trZ+/OMfv//++9vb29AZODw8/OKLL54/fw6WipaWJnj9BhnEnp+YpkDqMN2Tf8WqNRgMfvrTn47HY7CtG42Gc+7Fixf/8T/+x//tf/vfRqNRlmUXFxfoNrDWQusAi0aWZf1+/+nTpycnJzs7OyhX3L9/v9/vAxx/8uSJMWZzc7NcLjcajSRJmINh/K+urgKdPDw8RHEF3Hl0KmAJ6na7jx49wmxFNygwUAweKn2DmFyv1+M4vri4ODk5IVmGMgW4A7PZDDp6VHtAxQsK+Jg7hNLq9Xqn08HqipE5n89BTO50Otba8/Nz+IU+fPjwX/2rf7W7u3t6evrZZ58NBoOtra3d3d1yuQzoWZ82xhuufTgcUpP66Ojo5cuXR0dHWC6we2ZZVqlUut0uFC1Go9GrV6+ePHny85//3Dm3srLy7rvv3r9/Hz516+vrP/zhD+kniYoRzvnx48effPLJX/7lX7bbbQ4ASrt4NB9udlpiRXNpb5vmiaTKYaYoSu6l4lpolQkh0GFNItZFEa3MoMe8Vn29bsbpfb9Y9+XrnMUeoqcBYkLDpVIJBQ/cYWoK4Ve4ERCoZYtSUW1DN6x4cZ1nQXydD5vW22FXB0WurHUixolYI4HJoshEoQSBM0ZKJbvWTp2blsphpWGyUztP7WwWpiPjJiJ1EE+vEt9SxR5NFWho8nR6fsmGM2MxEzEzJ3FmXGZMZmxmTOYky33pr0A8niOfrmF77n8MNvQe4SH+vI0kpmkyoBeoJHFsbxGW+HjpVdVjHTzo6/IqE95GzwGA4hnLcizh4GKxUIhIo9FoNptY3ODSwcItPkEPHiyw3/IlXRaICWxqnJi4NJ9F/XEQpdYAroJVXXpVWloUm9ipP9nVTnna0M1z7WCX4ynxVYmJqZKYAEA8FRnkf6YSWFdvxJu18c7WaLU9L5UyJ5Im1mXWiA2yIEyC0ERhJVxbDz54bHa2pN2ypcgYG9RqZqMbvPuuSRNpr7j5TFwmzmSXxGGB0rITI06cE5e5LEnTeBEvZvPFLE7miUucsy4Mk2ZrsLE+bNTHUTg1Zm6sCQJjbBgEYoPAmFDEWAusMArDbyUjltoOa34JYx69JBbR4aWE4n8ZALGWmNDqOnxdB+FsWeNupWn7micBXhFegacClPeR/FKXjy01esXwfCaLGui6QYTE/CzL5ot07jJJs611CcsmPQ0XM3viosV0GYM4uSoxkeSejYucgJ+JzCWdSbxI4yRJU5cmWe7y4Zvf0ACGf+dD5bIGgisTccYGVgLnAmMyYxw+zIkx9rKMGeWjUSv1Lw1BPWqULoG8rt8G+/m8X9Q148ViEacpAOI3hqKFImm+tQEOhpQE/rb5w7L5ehheXQnv6MN3xx1AfHe8PQfLhtgpPLG8YiMe4kLJHa56vd7x8fHp6SnIubAVeiMnZq1ttVoUO2b3PaQ5sb5XKpXNzU3wp7TAHMEm2oixzQRNvp1OB1Am/dyR/8NvrdfrnZ2dwW8NQdVkMkGTLwq8QIK0Khz3JDQyB0EA2tdsNgM4C2QERELAUlRsAGcW95PwIlWJqcYwn8+ZfFJbAIAdsMXRaITTRuv02dkZAiDArOVyeXt7GygA8DIoAiP0BOZIbi+7qxBr4leoA0BgWvOIabwABLxer7OcDq8kIBTctgEr4JmOx+Ojo6OnT5++fPkySRKg2GDXssivqxQaJde9ltd5mhUrIojzCLrBBW4+nz9//vz8/Lzb7VqbrXa6OxutcFjKTsaz0IzG8WAwNLYGw6jZbLa/v1/KlRY2NzcRIJI6pAsVupeTETxDdjxrErrJyANWjgFAdWwaCTLkRVWAFoK0U4NGylKfHAzdarW6ubmJHzjUScEAu8FaG2VZvdGw+bwOgqC9ujopl7W5IhMYNLM751ZXVzc2Ntrt9r1797a3t6MoYme3loTTgirAmxqNBvy4QGm8YT3ByCTOCwwRh5bhwxUtbW0jWImTAZRMTBA4CBjK1lrYnbEXG2OGExZINCsizJ9RfsDcxPIF5RwKLm9vb//4xz/+0Y9+BPxlMBicnZ09f/4cgrzEg4AZcbS/WYCYxBmPMqlHi+ay4SYAfDw8PHTOffTRRz/60Y/W1tbSNH327Nlvf/vb58+fQzmBTwoLLKjr1G4eDAYQRifhHY/+6Ohob28PcgcbGxt/9md/dnp6CtrOfD4HYArZkDiOX758+fz58+FwCIgfcDwI4Kurq+vr62mafvPNNyDwRlHUbrfBbtbrBsaM5F0jujmGt4jy06RSooaBKiYAcQwkFAwwW7lN4G7UajUoPIDGWy6X79279+GHHz58+BAD7OjoaH9//+LiYj6fP3z4sNvtbm5u4iu0nR0OjCjA06enp5SwoAwI1isUbIwx2JKOjo4+++yzfr9fqVS++eabra0tXMjOzo6I/MVf/AXI+zj5Wq323nvvPXjw4J133ul2u9jmyO4hE4rZtSgxbg9pfa1+I+echw57TFivvEGmJIupFNzHvo8fCBCT6A25D88sTttCFkm4HtFJc6jZK6M5WcX3k0QsyhGIADFuIFcVLmXAgtlILgUw0bszDIqKGgUIHjwJe6+ZjPEGRUXAtyL3LQiDILBxbMVl1komZpGD4a2W1OvzVttUG6aXlk/Pyr2Rk0BkTaS+jEEcK4DYKf93k7t+TcTOXZC5MExXSvNGOAslieduPDFhaJJUskxKToIgc+7yjy4kazK1xmK8Z6Q3zaUsXQ62IhlQVNcFbiNK3beUufz2EVzl9OkFWaPeXtnbg/941VjTaK2po1awKBBxoTZGjJjThGEqoWo1JKIgCIwNjGShRGEQWFNzi+bIrlTiejSNbGokFrHKh3ApIp4q9YlMAV5EuGbKXE4ziGk9N1YAMd4Q5wBxT+RCZCpBxTWbi532+ON3zre3R7VqLGLiJMiy0JogtEE5LJfCUrlabrZKu/cqa2thGFkRC3JwvWEfPAhWWuaDDyVNLkcYGdE50H2J4SdZGsfxfDYbDcezySxeLNI0cyJiEmsngR1bG8/mzsyNtTYIbSkKwjAIg9AGkTEQpreYnYj3ilRKbSCp/auXvpkiVxpF/ZeHEROL1IVJKUi9s9DiSfd47HusnKKsQbGlIm3BtMIcCdTh9TsW0WHve+Wqss23DOjUpWlWCsxaZ7G6bvrt6heHSZC4b+WzCdjqqSR5gcRdqbc5kSyxs4kdj+1sZkplh7HqnIhzxhpeF9hLV9UkPJ0oFh5MltnFIlgsAmTYzlncyFIkJhJ7VQDnO8F9Kbgvfg90WK6aahaXRKAH0+l0tliU8uawN3DMcyB4JiIi9bx8VcmXsivIi0gkssgN6wAoV+8w4rvjDiC+O96mouvSYEK7Xel1ltgrQs9+v49Mfjqdwub1TQUcuvYLdBLfOBwOX758eXBwMBwOm80mtlsAc2zC1f4wyGqI6YBvxeSNMnzY6QFG9/v9s7MzOLBRNwCoAWIFbqKeJQJJoKPRCNIB8/m83+9DSBf7HPh0UOsH1olTpRqvBq0mk0mWZXDVAzEN8DQaiimrByLbwcHBwcEBTJMAhSC4QUf8vXv3YEmPDwd6y43Ty6u1PhfVqZAqADgjLZpsa0SfACYAACGVBVK8tra2vr7e6XTg1ASI4ejo6OTkBDf8+fPn+/v7w+EQVFBAabDQ8aABXbogZOapVt1cEdFKfBojDoIAPMTJZFwul6rVWrNesTPrRi5bSByns9nMhoGIw4ODR9bZ2dn5+TkUn7Vllhbl1NQbKv9qogHJqiDvkKAHwMhai+FEBFwzFBDucAyDH818+GafN8gvwEwDtxGQAZEFEbFJEoahqFg2sFaco3GixhBpk4hP7na7kFUVEZy/NrDSagnkx4EB6glBXJcM8GdqemAYk8dxG/KsBoslb6+jpjPWE40h4vYCtddCKIT+STmh1OxoNDo/Pwe6h18kZQOzY2NjAxAbUK3xeIy36TKMxsLerCO5ll32BE/5YvGmEUa/uLj453/+55/97GfANH/xi18cHx9TTppMSTwanXKwYbPf7wMdAwQG5RMObNjZYd0G8R/9+I1Go1QqLRaLRqOBZgj0gYKWe3h4GMfx1tbWBx98cP/+/Xa7vb6+DhzZGIP6H6jiq6urGHgiAvNSlDpQ0qDQPL6XkBkGGJ4vu/Wp3EKrbmSM2FkGg8F4PAbPGptLuVx++PDhJ598cu/evSzLUE3kJnJ8fAwOPs6NCir8RsorTadTIMhgW/PbiXpzVa/VavBcZSMF8GU8l7Ozs83NzclkAulksNobjcY777yTpiltA2kFjonAbUIvdHpoFWWRblXJu6o7XBzz2sKLKyHXpSzLUKbF4okNBbddE365Cnn04WIr1dJXPIUWTtWi4mfx76IBGkcX/ouwLNuWMRrZrCBXbfr0OXiSl/wuLauFLdt7dhxdnvQ/TgadRlpnZh7MrTVZloEylTgxTsJAKuWsFEq5kkyTuP0yLSdixyJGZCQyFYlyoVj9J8uBv1Su4CBQZZ1JmGX1atxanW+ko83OsF6dOZdMphIEgueQ3zmMFjFGtEKIp+jFRU8/Bd3LVQSeZFmzhVczkKtU3yzLXsOkTo2NoiWjN0G8YVM0Y+A5aG0NPcDwWFENQviBPQsHFY2WTr0wDHIScSDiQjFhINa6SJrRoh4EVWMiycy32hG3vAfuKlKcXm2i9wBi7482qVvk6qtDkZHIXJyTIM1WKrPtteGje/1GI3bOLBZBloVBEIalUrUcl8vlSiWr1aTViqrVUCRI08AYcU6CyK6smkbLbGcizsll/cFdeXD5k0/TdD6PJ9PFsD8ZTyaL+QIN+GmWLhbzyWQxm6azmcnSIAiDcjkMbOAksEEYhgFGE2HfIhGyCIQtBSg9xs8NEoL/Zzhea+uRZeItcpUOrLeJ6/SFvDVhqYFkcWvQT1iMWCtB6MIgMyIuMVd0WlxhvmS+mLs1zkbOiAujxJrUZVmSZFmK78VaeQU097xbuaFfs/9CegJgMRz2xFrj5Ns17zZ1iGKE+Xsaq95O9wblMS8xYhEpi8AJM8rp21FOEHb5dpbk/OI4V5ZAi4yTu+PuuAOI74634iDhxZPw04mBxg50sAi89eTkZH9/f7FYlEol8I/eeE0YUAv+GUURyJ5InKDNirOqVCq03yleIxAcsHK0ICCATiSNzrlGo9FqtVZXV4F7zufzUX4wpwIEpl3LvU0Uwg7oPxqPx8j5keGDrwFYgQwg9rywoSkMQ3x1HMcQqYTJG3N+QgxxHIMRtre39+LFC7D20OMPKHZ9fX13d/fBgwdwwQIEg5yTSCIojZ7Ksy78IqukSgBQ3dPTU+AsANOBeiONxMeCrNdqtdbW1tBVDU8kSDpg5Eyn0/Pz8+fPn5+engLrB+gDuBNZCm44rhqve+49ecYSghV4w6G1LHUKzfhsNptNp7MwDIwx9UqytTVyyUm53Ivj+WxuoyzSkiCSt2ADetDEtKWib5pJ57W7lpTtm3ddmtEAbF1PUq+PWMsjfmcARKiLYtAUIya9N8ArWjuF7CzFdtdxHom3lLfGBWpkX67aNzFZ1aS2140OOWi/n3KZXi54n6m9gwWEYA01QBFDY17wujyAWNdRmKjjaTIJ1JQNTdGVq9TLNx4x0wNdz69iYUOXWLhq4eZMJpO//du/PTo62traWiwWX3755cuXL0EwJ5WbzkhYRnAD0zQ9PT398ssv79+/LyKdTge1gdXV1dlshkJRr9eDVEKr1drc3KRGDRWuwdjtdrtgZGMjcM7t7e09ffr06OjIGPOTn/zkww8/fPToETzlxuPx06dPsyw7Pj5eW1vb3d3tdruTyWR1dXWxWECYGNjiYrHAgobFHI+Mk1TyBg5Rnf7tdnttbQ1U9Fqttra2BoFj9HZABAPd3MBqHz9+fP/+/TRNv/zyy/39fbCA0c9xcHCABgtoPlAuFgRSSqbg6QA+huchGNZaupR52srKysOHD58/f95oNFCz6ff7g8EAN/P09HQ+n//X//pfAUx/9NFHjx49+uijj9bX13FvgXT3ej2cJ2F0rF2cKRphLKIVtxyWUArwGph0xcJrGaYHHbmiIArxwP5FoJ8zfSnyezNAzOZ9/Z7bABMeKOB9pif1gM2azxrLNeuvvMl6wupVnbiSLq9i2pIcx7KWKJqhRskJm2L187TpUU2hffHluRgxRqJIKiVxxlYjE2UmmIgZORGRschMpJRnxbEiEaeKPeppEWQisStJ2mnOdkqD+0H/ndXeanschHEcuySBTMflMqmhYA1zsCqgvVKLDfue7oRXkdUPHYsYpoYnCvHts37Npdip+6/FtW6GPK7bFzSkxUGr+wIpab2UgurdjSKHI7/LYsRaG1rrrI2MjYwJDPiNFJF4jcl/jfSEU6MiK7yeqV8kQDbPMRqRNBGXuMiktUrcqs+bjXnmzCKOsiwNgiwqSbVmKxVbqUSVSlqtujAUJyZOjRFrjAsCUyobQ8bmt7fD5206l2VJNpunlXISmCSM4sV8kQAgTtPpNF4sEicuSSRNxYkEocmcFWe9YXYd4HgDUuxRzr3i7lIKzr8wFLjY/MSk1bM2lYKEvVdg0+IepBPRWRpBCNsEqSulHd6W3navhkQ6CDZ37S5orTEiSSbJTEZ9mZ5KMjOuKTIVSUSMyExk/K0N4yXFHmN+IjIWE7t6Y9aszEpBWqnGa90LG4yms1l5ap1AzMTqDYgNi3SnZJ/N0nUm35cv71jehniFOp3rEdmbn5onCeKxsH/HsepVBy8fbpaFr+OL8F2ZQ4754mdoCkfLVNf1QpfkCvuZ3B13xx1AfHe8RQcVbNm2plFgrbfr4RT4eTKZwLC+VCqh6eb3dHARr9VqDx8+3NraAsVvb2/vm2++OT8/BxHswYMHsKW67mLhySaKJc3Em0AJ2GQgIqELGDufpm5R5ZC/6Jkb0Bycba3Iymq12vn5ebvdBhRCohO+TkSQ/CMHo0YtmIbQoKzValEUkcA7Ho8PDg5evHgBYjWeAoRiwbDb2tq6f//+xsYGfp2SEbhGWqwgOCDSofuFqR3BAzpcFxcXAIhh1IAzBwFzsVhgaEE6E6IB9Xqd9MzZbHZ+ft7v9yFUAriBDFbd4MkgA+ejW781BqHLGDcMJGDNmt5IABqn/eLFi3q9/uDBg5WV9s7m9P/+f/vy5YsXL1486/dPjas2mkm9Xq9UKuxLcs4Nh8Pj42PwAakJIMsoS1oyBZZoQLSDIGg2m7Bc8+RfNayM1nKw4chWprap7oaTvOGayON1YGilUoE89Gw2ozCuvrc2jpM4diqY05bo1DHU4DtmEKoCzWYTohnAHzmW8Dn0FEYdqNlstlotjPDbUICXhoBFkQRPTlcK3GGvHFWv1/HIcDfISl5ZWaEZlO46hwsfmf4UD+VVoIoA3isWrvF43O/30dtLUWk8TfwXoEmN/RHV+n3kdUU7Ss41UXoyHipHcPzVq1e9Xq9SqYDNSqq7Zt2SIg3ZPqx+k8nk2bNn33zzzcrKCqzbRKRer29tba2srARBcHFxkaZpo9EAwY3SRtQ1Bog8Ho/jOA6CoNPpdDqdUqkEvZ3j4+Nf//rXaZq+99574LN/+OGHkOt9/Pjx8+fPIby7urq6uroqIrgKrNvQpkfuhxIdWjoILWFD0fl5pVLpdDobGxsAqev1+r1797a2tkB8hlD4w4cPP/744+3tbRHBQvqLX/zi9PR0b2/v4uICDR+dTgfzGvxcdCdgO0D5AcR27BoYZigoWmvX19dbrVaz2QQNGWAxGP2a3k4lBF1+G41GX3/99atXr0SkVCr97Gc/e/z48X//3//3P/nJT9AHAMbx4eEhpKWAmLNzU3L3UZ0Gf09I4mqr6dI+J93ygt4FbrvcWFm9wyTSZbniflGkdBUBYg8KvI4ZXfz1Gz5TByRaHFPyvihKWlGGAguLxqm1LoRnZKdPj46prEIR39SaBkt1ZoARa2CaHSpY5dJULpUojYi1zhonocvCbG6zicmGRowCMtxVgDhRADH1auXbXmmTSsmk7ZXZ/dLgcfX8frNXr85thN3JGZPhvNReYD24jXeGSLFnzrzUrvM6oIf6URqsB1b+7Z6r//7OLSx/52vNFI+f+Lpo4FIE3NzuNPhLwE3zn/O/xPhoyO2h4ev+t/hPd72oMW6nEROIc2KsBFaMdVacOmeedv6i+bZdCh/lDKmWV56WufExWiNGnDVijBPjMC94i9RFGAh5v24JbWkAc/M48Qzu/oVJTOhqmS63F9dADT56/hx6ycU+i6gein+TyQSeNIPBQC/I6LNB5xCWRJJwl8q7a16/V4X6tv/1cqy4zLlFnM76yeLYuYEzFZFTcRCiG4kcixyLnIj0ROYiqchIpC/SEztwJRfvbl289+ik1ZoFYbqyMgqC89F4IRKUSjaKjM4XyF2AIiL6GnU/ShEdpuifKFUcuWrjqe/D0lJTMT4vju2bV+MbVicS8O3Vgw4Kb2wKhLn7HMqf6GmoXC1/cpkqiRiRhYjJ3eogTPx/RnL/3XEHEN8db+WhMwGPalSsXXtEFVF6TIA433C/xjWQFlRKkaweHx9j20ZvL0A3AKNLRfG5W2gXKV38lJxCCBsl1HWRZFKFClu7l6ZqYiAyVWTvoBaC1hRFkWYzcdvDeyhESK0rMnxJ9MDJg902HA4Zr/T7fbhg4ZyBkrdaLWizAnET1baDT9Pla3rQMbf0BLM0+YgSELPZDCev9V7Ju+QerJUZJfeGomwuxg+QBVHmKtqSnkrZHkD8PYJIdoIDooKnGcK7wWDwn/7Tfzo7O/sf/v3/sLOz8+B++f/1/2w/f97/X/6X7D/+x5PTE7exMbl3797GxgYQFqg0RFE0GAyGw6Hk5nJI4AGOI2Sk9QTkR8i+h1hqGIZAx0AM9zAL4ObVahWoQRzH8MfDM6VkKkJhngApD2AlaGBUAxNAh4FeAYwDjEKKmU2SOEk0g9hlmSivQtjKAX/hYGi1Wt1ut91ug8kIrQbcdgSdODcgsDg9yIWjy7UI417Hn9UW1aLkYjXTHIBI0baetDj9Cm4IRjg4kphWcLzU/pxYdpA5wN0Ow4DmigAO6MUH8YQwDKEbe3p6SswFP0wmE1S8Dg4OJpMJ7gPWWMwOLQH/ZlM79hV6wb1nMuaF8jgZjJazszOOVc1Jx3QjuYkVCywUs9ns4OBgb2/vwYMHu7u7XIFbrVan08EgRGsI5TuwaLx69erVq1dYpZGwjcdj3MlOp4OHtbKycnp6enh4CF7wxsbGD3/4wx//+MdbW1udTmdnZwfudmAHo8QFLQuYT0ZRBNEbyr8Mh0O8jgnOZQ1DjqWRlZUVCOhjaoBFDle6Wq32wQcfvPfeewBwX7169etf//pnP/sZdDaq1eru7u677767uro6HA5Ho1Gr1bp///6DBw+CIDg/P4deM75au+cZY0DsBYN4fX0dSPpisWi32ygW4gZCj6jf72P1xmpDZZvZbIb6E3D/p0+fPn36FDvLn//5n8Nl9PDw8PT0FCcjIvCzooNicVhqw7rX6PPNOxXMMv4m9wVKcmv/GUxYVNToXsDthvCxrld5LSk3nGfR7e0GzO7mzyla2xMm1jCHZrHRy86zBFh6z3Viz8mL1Z4BgG550TZWRV8+TUzmeYpSbcrRaieXkJpNxcZpOJ+Hs1Ew6du4b5wRmV+lf6bKnu46gDi5FCYOy1mzNdvqDB+2etuVgXPpZGFmsXEi1rogWK4oKoWG8SId+LqnXHyxqFWqRTxoeXSJtr9Wym+MENW+plF96VmRpieKvO/1Amq7CM021XsfWZOatK6NUrXeFweYDQIrLjASBiYIJXKXNX5rzJXmd3droQmnCgNL/0hBgCLONSXSS0FPk7kwcqWVNAwyWxFZmHotWeumtYaYMIzT0jw2zpk4DjIXplnoTBQsQmsja8PAhlFkg8CqZiS00kuO8+IOq7DIibvsIXdZ5pLEzhfBfBHNF+FiES7iNE0MvBOTJHMuMAYhmQsu79SS5UWXopeuq9chpDd0NpjXr0D8qRzYAjwpfN3Xohd5XTdibsJkkDpRaPRhMfv8/Pz4+BjFUQQG4ECsr69vbm6ur69D5Apbj6fap9sKaW6pxZoYbmmv48y5RZrGsauk841kuj2tnp+URt8E8cyIiAxEjkT2RU5EBnmxbSTmxEXDrBEtdtYH//ovX/3Fn7/qdCdp6mazOI7n45GLF1GjEVQqwmAbJwDiEV5BCiNXtfWLuwzDVHYfSkH3xktnriugFinzbKEjI2HpLCgizl54z5vMRNsYE6RpKU3J+P5dj3m+CoFEjG15jLVVpJaThU0uQFFHGVVkmssWT+94xHfHHUB8d7xNRVftO1HU1POWb0aWBBDBgSqXy8AoIVP4hzl5a2232/3www/v3buHbTVJkr29vfPzc+TzSIxvEPBizyZLzYwHifYiRKjVasB9wP5DMgzsBgfzNFIj0VAMqzrk4UBCB4PB+fk5vhf7K1Um+ANkZ8E4Y/oN+zvUrvEh+PCLi4vRaBSGYbfbxcYMSAW8M/YuEauS3LQEF+iZYpM/yEybENJoNAL79eTkBF9KYFd76RDppu85KdhAxpMkAUcSN4SQBBqrAX/jPvAZUftS1yE07bHo3HLdmKGSI929gc/WarWzs7Pj4+PBYHD//v33Hr9Xq1Ue3H83DCv37z+oVn9xdnZ5wwFawfoJ5ntpmkJnYzgcnp2dAWzqdrt4GycLwP1erzedTkej0XA4hH8gpb1xdYDeWCqA/WMQBCsrK3rUSS6swceKQUUxQXCiidDhcWgOL+5trVYjgAtsFA/lkt1sbXB1BgVBEJVKNpeoBsMCkKheUvgzYmVR0hPgXRKs0f5LnoieKM4y1Ri8dAhYM7NWEaEos1dRkKvqE5AjgBq4/nCEvOwk0BMBjAMsAsPhkDFruVwGuFYqlVC5YbegRl60KCQHHmQ9RQTSBy9evOj1eiggaR0PNv15V/SmaoSeYYsoNjqfglzflQmwmC0pVBzGM6V4hbYKwXMH/5qXjBGC9gjIR+DwNJEnk8np6SmgW1QdMFzR8wF4FNXEKIparRbkwv/hH/7hm2++2d7evnfvXrfbhaYqyopYaTGpKfyNTgjAwVh/ZrMZphgROkJ44BJCeL3VamFGQOXAWttut6Gxs729DZLyxcXFs2fP9vf3wYYG+7jT6aCkZ4xZW1vb3t6Gdjz0mmkwxW5QDDM8mlKptLKy0u1219bWYEaH/6V/JgQl9vb2jo+P8V+UA8IOpVvjOSafPHnyj//4j+fn5xBHGo/Hp6enx8fHL168GAwGWAFEaQEXRQ84x0mteq3xKQVWI6Hh20Bp7qquqwbUlmpKvPEa/PcLzIpktyLu6dX4r6NQyVVBScxHLWuzNIdf+mneV39nF3zmJE0kXpjFXNJ5bkBncjeeVMTmJmbXGS7l/zROrJEwcOVyWqkkcPk1sXVigdwVRXtvCQTfst7mrZBF8RN2S1z5xlsPAGutwf28OnKK0tV6e/VgQU5hryRDBQntqeXVHmAAgHJRrVZj7AeHZM+2mluktdYaCWxaDpMwDJKgVl1Uy1HJ2sA4canCc5f61GUFBDlTFQKN/y7y8SP564u8oX6aa1svRJxIKEHkGqV4bX3a6CSVRWaSoFZ121vz9Q2pVEMxpcxZ56wTKyYQE4iEzkXORSIlMZFIREQ9fxAuJ8g7PIc0zQrERovRlDnJXJq5MHP42Mw56xzenxkTBkEYRWmSSBDYoEBb0bUH3U+wdFW8wQlTi6oX6yXaSrS4WC01HnibM1nuOzxn2l1wfi19m6cgjG2xWq3CLxdpFFK54XCIXjEYkIAB02w219bWut3u6uoqu0LDMAR7RoOYerZ6ZirsYsRps3ssTd1cJM2ybmP243tDU7P/HDS+OqoPRoFzImORE5FjkTORUc5aHYoduNVo9s724KP3T3/0Se/+g3mjmaapGw5lMLBJ4rLMxXFqbcwIljbg+hWkA+ij0q2leskqDif2UmgFy6UDVa7qSxRLF2RlaefPoj2G19DDmBmPA0KFKKXTK9taGxlTutGm5fWOikgkEuUCIECEo7zeuRAJcyDYilREJmqnq4ikIrU7k7q74w4gvjvevs2VKks6/NU7Gdf3MFd6Q+AyGAyOj48Xi0Wr1To+PqaGwx/ggMDuysoKcsUkSUBGOzw8BFfr/v37Ozs7nU6nuAfgAgkUorUZ6IbneZokCVykgGwi8UZrfJIkoBnCVIqZNiIDbPnaFFtEJpPJ4eFhmqa9Xg9KgqhUs5OdezPCEaKBxEmBooIFBu4bkJFarYYWeFwUhDvZnco7hksDdsYSt26KxCZKJinfAN1hqCLAcQvQAH4RihmkPAPogdQmsNcwDEF97ff7oI72+31QaI+Pj0ejEb4Id5JfDRCNkJMHKeoaNU3VvjNdJ00G8RlhaBG5uLg4Pz+31j579uzi4qJe37U2qtXa3e7W6urqYDDArYCWNFg2Kysrm5ubQFv6/T70AebzObIs9p9qaIzIOEaRBuVxdXyIBD3BU8aHzGaz09NTlCswzsFL9TrjMJJB9AZ7nZ+sy0KM+diHBRwfv+ucC1BjvypwSUFhHQKSu6FlLvED/b5Q/AAC60ktX2d2zHvOmoqGLPHccY2MLykgSyqxR2egngzmKcYDihmE2tlBTH0Ykp0xeIDms0mt2+1eXFwAcxwMBjhhQroe/QHXC6IKZyh0VwCVUvuYoq5AYKE5UHSm+t3ZNwSPeK90oM/5pU3qyMEUJUOhM1tNNtQkZTwXjIQ4jgeDwcXFBUZdtVptNBq4FRCXoAMkl69arba1tUXMGqBGs9lEYens7Ay3GpkbXOwajcbx8fGnn346HA7r9fqf/dmf/Tf/zX/zzjvvYDGEoajkAjuYmNwmdKWKyiG4J2zv0B2pnFP4X1wRehTK5XKSJM+fPz85OTk5Ofnqq68ODg6cc61Wa2VlZXd3F9Wmi4sLY8z6+vrDhw9hKEflBEDVZMXqWV+pVFqtFhQzoMKBPYsJ6mAwePr06Weffba3twfsnoxsiCpqDJe64a9evZpOp7/5zW+gXCEi0JU6Pj7u9/t63mmYAyfGDhjcMZzMbaFYBd4VsT+Pe+s1nSzlBReRU82jfN2+/pt1il8LCC4KEN+Ay3gZddHjyEub9Tu/h1XgDXh3ES/W74NPkRFjAxOFUi5JWJIsFOfyhNlcFZdIrwKF5qoEbT4i3KVDmMmccc6IsWjZ957ezaIKN6PGcruOZq9/XK7RsH4NxoMxKGBatSFeBxB7VNMixd4ri2pGOdFhILxY89FthpgNDRDcaBDTcmenlzIqc0EQWHFhkFVKUioHbtZqxPVKpRrZUDLzLT28SCJ2hT/aYou+c3ORWf5noVSGY5GpyPRSblVGIhORmUgmUpbSSrpWnT5e723U563QRSaMSsFKK+5202bLhlHJmECMsZc04SAIojAs5X9Agg70ppZvZBlBV/2Q8ej45sCZwGZBkARBFARRYDMJrLW4pQ4+HUy7uOd6TZw3Y8TX8dk9oJnroajGAlEOEEW5bSnIwv5JiFEUkV/drqRrq9iSlq5duvKBZJYMWTAAoMOGCA1AcL1eR7sSuCCcd5oUvBS+L548aTFM1kQkzcSKbHbiRn3YHBp3Huz3K8PTwMGJ8TwHiIf5fOmLXbiVnfmHH5z9xZ+f3H8wqddDY0JjXClKq9VwsUgxKNI00YInS2XHtfXrUiyV9A6CubpR9QbjvqWb8nXLLMtvclU/pKj4pPWjEDPTbxPpJCN5EwTlJAmCQN7I2I7zMmeUc4S5pkX5aob7F4gkIiWRTMTkrOFULW53x91xBxDfHW/Dnsp1nAU6rfeqde48nUqsxei7ieN4ZWXl6Ohoe3sbkOsf4OQ9/zoAFkmSjMfjs7Oz8/Pz4XA4nU6BoC3deLB5aBElSgHQfwBkCjDCAJ4CxARUh75yUGuRaUNBAo3k8O7Di7iHi8Xi7OwMPeb46kaj0el0EKZzS55Op/hYQmyMJtEvA988QHhACdnOTGcbT3SPD1Q3NHl5NW4grX7oDj+bzU5OTgB74UJWVlZqtRolNfBOnDDwDk+AGDzN2WyGD4E33eHhIRAxuOQBQIcYMZ4FmmGJErLELUoVEdAnbv73SOx5E4BC4gwvLi7G4zHHCYJFAHl0cqO5HPqwcAkQmqBEg5bd0ACrFjZh8qahOs2bpscXHxMCVkBsTNg0A0JLqZAAS9WUpROBMBMukK5lRe0xo5Rw+Z86/2RlhYQjrcTCx1ek9heNrQgEA+flZNf/hf/Vom8Uu+Av6hPW3pKcUBw82heI95MuIjqJ0l29oF/VajW2sQMRw7pEDjU/Gfk5/aaY1WutHt2cqN20Xrdb/ztLJl5OyEvTAhF4UfdJUMNdE+hEyX3oZoWlkBaHBBjrgGg5oWDRGcdxvV6nci6GaKfTQWJ2cnICwn6r1UKZBMR83FKQgMidByn4+fPnqJfs7OxAjEjf8DiO8QnYO1gIpLQoNwh2LbDCinPDO/EcsUPBOhUS8IvF4uTk5J//+Z+//vpraK9jDa/X65ubm/fv37fW9nq90WgURdHa2hrrSWdnZ2AEo1qGBJWYNWBr8J7QQDAej9mzwudyfn4O1Qio9nuQIrc/TFsMUSp47O3tYRmkaj+lgXRttchx87DL16WESUHogOtkevXAAq4lJrT8jsZHPL8yqoUsoX8ui5c8C1DPbmgpp6mIPHqdFhrpdssumavl0gavpaD5DTClhsU9e6ul0KfH6vLwI13e+5ZK6UScDQJbqdjOmmxvyqTkLsoyTSXr57m0lh7mmaYqZ74KIzonLpM0sUlis9BmDt5oRpyDUZJG/HloHqUWINb7cvEpezBc8REsffo3lCVuE9Aa6Bqo71qKPl8Xz+inr3uq9FCXnE1MNQn8E60PQIfb7TZDC+ccaBCY7NxqCaKFYWiMREFWK5tqLXSlVmPeqJQroY1MaiQWMSJxwWXO5A83W4YRJ1ehYaDAk6uwSywyERmKjJ2ZiVk4sxBZOMlMELpWsNhsjN7fGeyuT9eaWTkMTVgplVy1nNbqQRRG1oYuf7A0yM2X0kh7POa31BUbkvSzsxZckACgW5ZlpVKC+F+USQnoovRJRqGaAZtn4cveKc9Mghu0XjqKOGmR4qNJMEsVAzTo9j2EX/+4yaxXFdM0f05kLZly3dqo5VZY643zgzLuet9HLEcxpSLZ9oYmD920qjXo8wch1kqzlq6uLLLm9Mu0UTpzMsyLaqiRDEX6OZt+IFkmkYnX1iY7u6PVTpwk4WIROuecpGFosixmSKBjWo/qwbuknb2vy6O5lXDk6LzmtYSDvzNx00/z5gKq7opmt8S3kUAYhhD3fyPjL1GCwkEO/kJWgotbKd/4MgUQm/zF9A4gvjvuAOK74206tPtQsX6oS4LFbRiAKSTt+/3+xcXFbUC6N3joKAeKE41GA2qM/X4f1Ob333//Ots6/rpGzQAwoUkc+wpajfQ9AX4KUi3s4EGtBbY7nU5hfI/PybJsOBwisIaVEByQsGNVKpXZbNZutyF+CpenXq93fn4OyqqWlwUiyS0ZBdIwDMFX1YqK1L3lI6YNnSdCp0vrEIIA9MzeatCHT05OptMpEoN2u00OKbjAuGp0aoNQjFOtVCpArnF1Gn8fjUZoVUbigQwf9GEE6VpikjCoNufBtcMai5jpbVgG7PTXtgySCwiOx+NXr14dHx+/9957hGjxvWw0azQaDEQgRpamKb3a8HCBWOmQC5rFWZYBMDo/P59Op3T2IzpMPS/UP6iuQKpmo9EA/KR55chqoJiGa8HZgmaOWwqYmzCuh3p4XdiXwEqSZFfnv5cD46axdUty0zakRs65drvNYI7+jaQeF9cWD8Je6iCkHyU77nnaTGLlqq5ZscrFbA3FGz+CzGndHhuLiDx5vpRTqFQqSCEoJEfMlxcL4rmIbG1tbWxsYG1Bweni4gL1kuKd4Vj9ffTC6yhfq6Dyn0whikr0cpWl6DG1mS0gZdKekOxvQFUGmhIYpeBu43dRqiF7t9lsttvtZrPZ7Xan0+nBwQF6OLDkTiYTvJPlgclkglXi3r174MkeHh5eXFx89tlni8VifX0dksQo40EOCH9TE0OXS0lkZvqhs0qw18EBD8Ow3W5DVjtN0+fPn+/v7wPnRY8qq4Yews6KyP7+Pr4RmDVWj1arhdUVd5XyF8aYRqMBZSHefEDGhH2Pjo729vZOT0+xUGu8Q0sMafIadhlKDLNeJVclLz3ITFdfUMDTg+qWI9I5l2aZ5NUFKQgXEhqGqD2GAZY7AsR4hXg6DdlY1KlWq9g9UX7QwNB15StdHijq42upjesAXG3UyfJnrA42HDDx9nDPIt1PR2UaP/IiOg0E8J9e+7D+WH6a3nx1GQkwCjXx801KxFgxNoqibjf8+CNbatn1E/PNUL5eyOhZrrVIlDBUf2zBf4wOP5m4zKapzbIwdZExWRCYIDP2qjVflB/YWGntwOKfB+leJ22v6xy6r0Iz5VldZn2dk0WvD7ddhK01zlkFaV1XePCWWY9/qouIerHFU8bN8bSG0c6ysrKyurq6WCwgSo7rQryKvZLdXah+VavVKCoFVqLQ1au2Viu7qNWcNKqlSmhCkxiZixiRcl4JID3cw4gzhSAnuaDENNeOGIiMRMa5gLWIZCILkZGYidiJqyZxKVqU6mlQyqxIVMs2O5P3t/ofPuy9szPrdlylEjmTZpnNMskyk6Yl5y5N6qg5hjY4dl/pJUvHFfkWbILgWwQwb+GyLFTgt6CmBQ4jcwcsPmg01CVYvTzqkUNaAEMjOnZo4rBXHJKrHfdcSfTO7vXse26036ew98c7irW9G7xDZZm4xHV65XJVicuznqY6mcfiv/mmeZN66ZaRyxCLEzGBCYIstC4Q5+buUq82FZmJicUasREWTufKEqauUs7KlaxUctYaMYEIWCbOGBvYoOhIf7XUYYsurDoG9kaFByDcEvP93pn+dxYJinVQ3UTIAJ7veEPjT6SUdzmURTKRQCQWCUXmIiJSynHkWLnYcRms5fziu+PuuAOI7463p+5arCQvXaBv6I5ZymX4o4DddLsiQvSdoOF1NWSdDCzV3SNXl516iCwBVrKVHkxbwEaawaRpKXSb8YzIvdZvnZl4DWUqcr2EGBBNet1nXmMOw1Z9D5E5k65LFipFM4iZIg8plUoA1wD3ELAmr41gmecbxnP28tXlXasFWpaW8bolcMavBgecqT54dsARIAX7xRdfwC1qMpnApxgKCQB/u92utkcrlUowZEOCARVUSHYSVKKsQavVEpHJZFKv18G+h3sh7hVLFMi+AH8Do8HdK5fLEAzFJZC7Ct3hTqeD8QZYBGgjRJMhN4wflnI5NRMZ8EqSJDaOU2VSlzk3n80Ws5muRuAGojoCTj1QsFarBXQP4icigsIATpuMbJ3KaqhCAxbEtZcuPoT70RDHcJA1CS+m97px2RygxQRIAeZQ1BxJPT3pfUHdbWif6fReB7i1Wm1nZ6fb7X700UcPHjyAa1+apoeHh0+ePNnf3x+NRtTIxqIhOXFY217/PvYCzUviZMT95PV6yLuXaRSzBdxzPla+E8smSLXPnz8/Pj4GzETVP3wpClQY8JPJpFwu7+7uPnjwoNPpzGazV69eQQyXyzWmAxZk5xwM2dbW1nZ2dtbW1qy1w+Hw+PgY5wO1iiiKAMJSEp2cMqblAMIgoKTLDJ5zN+p/URStr6/v7u5CF/7g4OAf/uEf/u7v/g76+A8ePIAScbVahao7qin9fp9d2wDN+/0+S5hYT1COBSQKljT2OPoocs1pNBqtVmtrawvnfHp6+qtf/eqXv/zl06dP4VCnsW+CDhyrhBdBjKJIsde2zIeLMayFlTzwlNPh9YZijgJ7lFhtCYseFwDE0JYhQAwzScQA0KjhdWGkYeWsVCpYYTza13UpfZHHhBHr+RFdR+/VO6Devgkv6nBLg8I3YBlL5SA0AqKRREwNLXB0nfi7KAkyrxGe65KSFwd6Dj5vYGxQCkvdKApK4dqmdA+l9kLOv5LJiWQTEZOTraxISf0JC3rEABYDkdRIZqyxxpogCKyYVILIGOe+LSBR7AVIH8EOLGIcNnqVW1oGKDq8FeXXtTsiXtHNQ98u+7dbro3q9/aKtcXg5wZlz6LdtKaK81kXxxJmBHjENKIYjUaYHZJ7mZIAi4kfhmEQSBi6MApLpVIpK0VRKTCBzaxJzSWy70mIfHu6Ii7/X/0zMWIyiMdXAeJEZC4yFDOVKM1WS+PV0rgZTSsmtuLCquusJbvdaXd13l5Jm01TLouTJE6CODaLhYG/HAB5ckXzawm4xOmaEKMLQroMSJgj6ICBSgVYHGhwjfUZ9x/ycXpNW2repauzxRFIsFiuitV441n3eLH7pAjzSUFG5k8lk/V6YXXB2yvn6Hmh7dc8zdwiNKk1OqjgR8kpHRF5lrxLBZH0EuTtC1oLWEQyY+NEUifDUTY8k9mRdac51DiSKJO1jtt4x9XL4uYu6aUyWzy4t2g0JctKSRpYG0VR4JxLkjxac5leVXTdt7iwUPsCMbw35uV6vYibdX6Wvv/mlFwKbgRLIQjdhanjNERcSK+yLJM365bkRKYFfWGga5FImL9YzVc2EankODLWt0TujrvjDiC+O946jFhU53Ix5Sim/dwL0QNrrQWH9PeKX9xqKIfh7u5uo9Ho9XpPnz4dDofffPMNnOVv6Z5HYyUW3j2fU+TMaCMql8vNZhOsH41SwagKDOLNzU3IQeL1fr8PJIKRAQiDwFiR0oD5pYUgPI1gcOWAZ7EHjZEigCq9E2sWJIFszWMing6OHvh0iF9Ho9HR0dHh4SFChEqlsrKy0m632+12EARwizo9PQWvFjfnwYMH77777r1799bX15vNJoirgA4h0AF9idPT04uLC4ZluIcE5ohQexEVByeBXSZpt8Qd2LgnOV8VxG2yUEEifvr0KcApoO1AkEGy5uOgIgfyAWh01ut1iAxocI2wCy4QVGIolqD5HQgF3erIIwMjW6e19Xo9TVMMQhGBtwzszlqtVrlcnk6noChCxhr3Vo+BYhsjqbKc6ehtl8UiUb5SuFHzyYSdd5RmA2gF+jlZ/EEQgO+JkgPuLdIkZEr6SulTR/0Q5mxFgJgVGk3pYm7gAR+6qKOhEOo/UOiAVB18tdZe1+Am/ldzGIn10ECMgi2ge7ONHVwtY8zu7u7q6ioJnsfHxy9fvjw9PcVHQW0cY48xLoXY3tQa68nkeVoQGlrijfWgdhZpqJeiEwate64zELImh8MhXFD29/fxgwanoC5NIXLQ2Y6Ojsrl8tbWVrVa3draGgwGoKlSnB184fX1ddSuzs7OXr16BVZvqVR67733arXa+++//+jRo06nA6bt1tZWt9utVqvEQGkyg7GqTTKx2OrHCiNTnPDFxQVU4zE3p9Pp/v7+kydPDg4OSqXS+vr6vXv3NjY20FkCYAty2Pv7+2EYwsuuVqsBFgfHudFooKyFJQigLTYCoOqwssRGjGkITLlcLg8Gg7Ozs1/96lc//elPv/jii5OTEzLjNDOIRHgtTU5S5CVSp7BaClxobEI/X86Ioo7wLcOSLMvSJKEMoh6rdHrE35i8aJggQIzVCY8MzTpaWZuGmfV6HQxiz5XR+0GbgOkz0aUyvVNfBzvq1gfNPCV9mKodukNCS1sUk3C9AGoXsqIB/VKcUQvFXLn5uSYVP1ZPbcx0jD3NKRYRYwS7WblcqpRL3Y1wd2E7a+Kse/ZKBonMx+JMjggHLnOSJZLNTBqIC43YHDg2CkYsiVQv5QmsDaIwCGzoslDSS4AYDTdUXAFwoxc6ya2MdZ1Al5aL6hwea1vfRv0Q9XPUHeLGGPu9SGoe2HGdYkkRZ7muTrC0wKDBFAK+qJog4IHdAnXVNW3/6v0Ra5yFoa2x1lgrgTjjgGGZq0IibhlGnBUkJqhBrFUmZvk70Vw/EJlLFKarrfH97vlGa9AsT0KbmiioN+zGmqtXnLVB5myS2kxMlgnJtR7kp6cM4jqtIYsHTTFWXcnmsKdBC4vT9P4tAsS6ZYeFIr0Re6LDLH9qti99IHTZplhO4JIuV51yi+KzZKK8Fm3zLUGH+Rz1Eym66VBAiQEnQztsHAhB9XjQQQ4JH2h1orsAchxN6Fm68PIcvJIn56Pu1FGPO4hTI2k2G8eL0yR94eTwWw2Wxqb7ix+k/+Yv3L0tF8/ScW8xG40r0Wi9m1WqpSAQa8MwDEQuaUP4WN3z52nT6VUC0SxiJww52up4vOnionQzOlzckm54uDcULbzOCS5NLF1j3rGGjWp3HMcZTKffFExcEWnh/K4iajbvmQjzf5by5Yf/FYmIyOxqWfTuuDvuAOK7421Ah68Tkmd45O152iEKeTK8rXQ9/I9yBEGwtrYG4me1Wn316hU0E3S//w2/rgV/db+5zkuRcGq2WrEtiEzGxWLx7rvvQk9zsVj0ej046R0dHU0mE0Si4/EYQRtViYMggFYGIgncW51JMi0hjkPug/YsQhSL8yFJGRsnvktbTjHJAViGbmgwsI6Pj3u9HuAAABNBEKysrNTr9cViAcEEMkPL5fL29vb29naj0SAICBXjV69enZ2dzefzw8PDFy9enJ+fj8djdJQzuUJgrRWHE9Vl7I1PTQV6Le8dLTLAtIqMGBGhSaA2ghPF9dY0Kx2UAHfQigdCG5QoQtyPhAGpLIQ7wOmj0jFHmu5AxGjRH4VrJxUOMAdVUBEGISTS/NOlECHTWs3hzbJM0tRlmVPXi0+mYgD6uFHzAIkYsjM4N7bSUw6MnnUUdqCFHemZLD5pQn3RyFt7x3s+PPwnUWbmcppEzKfDiFyrK2gCbLF4pnMP0tiphUr5Wu2SRxY51G9XVla0ushwOMRCgRNjWqJTRGaJbzBz07LyxbHBpjzd6OoRsa8jsmnAQudXxBpwsfP5/OLiot/va3c4fBorKLVard1ur66uYmb1+30IBzWbze3t7VqtZq0djUZPnz49OTlZLBbb29v1er1er0P/BxUs8OM+/vjjBw8evPfeeysrKyhvtNvt9fV1VIBOT0+xXp2dneHhAh/RCDiaCeI4ZuM2JAi58g+Hw/F4jCoRSYVRFK2urt67d29ra2tlZQXTBCsGiNKQBs6yDKJGmBTb29uPHz9uNpvD4RAVtTiO0awwGAxOTk6wJqAIKiKj0QgINZjIzrler/fll1/++te/fvbsWa/Xw9zU9SE8Vl0Q5XyhircnlchCI76CD1ejFR6N8bWqGgYDPsuwlE0mE6gPabdPJK7EVbGEAsTRpRr2K7AyKnlDAEprZBBzhfdcvzybdSk01S69uusmhYZ9CRMkVw/cXqLGBD4ohk68zxNL1XsNqW03A8Q3wIvaanJpos6NTHIVew+krlSiRr1crkRtZ4PQTWZub89FMzeviRORcuZKmbPZNHHDqR1MwuE8mGVWInPJuiJGjEtMRJyxxgQ2iKJSFNlASlEWOCcMxtBJQw8Gb4lj1xfXoqKctKe7olc8KShL8NBxiO5BCa4XLbk9OlxUGfakk+Rqc9h1IIumkxfRGV04YW2b0isaUy66b4EnjRPJnMkykyQmXZhLN8JYYcTfzvD8Bw0WZzmDOFYk4qkCiNMcIB6JDMTFYmpupTzbXu0/3D5ZbQ6jMM1MFEaVZr1ULlUyF83mYZIGzlnn5CpGfHkSGiDW8TC50oxbaMIBSrXWgSnK9bCpTvsHMDIkOcMrL3nhjSh1YNbO9TAgzb/oV+mVBzwdXl0b8Mzo/oSg4SLyWCyo8NFw3DLQpe4KKBcigiiangdA8EF6gB84/gu+uIhJGo0G6ot6DDDO1z00XFeX1vnkat+G7g+ZL8SJkXjelumj0rhRTsUaCUylbh89Mv/+L9y/+7+47W2XxG4+S6ejdDJ2SRKJcXyectVbQmuUe5UwTUFgIZxRAfOy4rJWtDC9/VO7QVD4uvcUS2jeCqzDdfIMarXapbqLc5ihb2bwlUWivNMlVj/P8yWunJfKIlXl0sBxeAcQ3x13APHd8fYBxNwhPDdtTYdhrMzyNd2oQHYDY7Hb7S51O/2DhQi0Ln333Xfb7fZwOARk5skXLL0VQLto0sXsl+kcZYUl91OC+5BHVNRCkGtrawgr4zju9/uvXr0C2tjv95MkgfjmYrFASoMzB7SBUBLWZ8PhkJATnYtof4EXmfzU63VoXyLk1eIV+AQmvXhS8/kcQB4+B93NJycnFxcXYPDNZjN8LLq/ETMBfISgKhATtNSFYbi2tgbRYdBy0ah4cHDw7NkzdHwfHBxAIZowRNEJwaNXeEYxclX2hJqw37HS5cRPgM64XQBe4zjG1eEVPBcYEz9+/PiDDz54+fLl0dERNS69RJp4hOaDALZA/sz5xbGE8wGnCe3zeGS4w/hdjGeKMuOGEAJAlEYbZbwNmQykVDFmgOmDfkixSC8X5ezAgKnX6zANS/E6r9S5OI7jxYLCjmRugkQ8Ho/pEQcBWcwXfDhuO06D1GZCqBgDzEVxJnxSxYiTHHAKVjDg4ydojzIptKqB0I35jvfjjnmkPJ1oLQXWWSrzhEQ9C0G83mw2NzY21tbWNjc3MTbAV4UmtahWR+8Z/T4EiK/zqxGlXahLHRoW98aPFJQ3rvs6j7PMBIzQnuS8XaB+WOi63W6r1QJXFGMMxkrdbheLMDTN2RwNJU3Un4bDYZqmnU7n8ePH29vbYOmCVQpgF2Is/X4fMC505PVDJ4Wfu5v2iEOJiwOYWi5hGK6srDx48OCHP/whxS6BbFIVl0k71kOuDCRC4kXMaHw+Mlj0DaDegLIiphsUmfG7SZLAFu/LL7+E4LtcdbcvaiZoLptXLBHVSe3ZtTEr1tVljWy+ngKVwqOxqkD6QyOquCGUPyIQ73FCadyKhF+vAyScapNYLbqt24SLQo2eP49GEovajvq2aIy4CAJ6F8gmCXYw4Gy9Oo2H21Jk1nuPnrbFPPy6xeE62TH6m3lgK7u3y+UwKkVBEIrYdkse7bh//WGyXs0WQ+eMM1EqYRxnyXnf7R2FL+bleFyZTayEIjWRci7LaEUCcYFIKiYT40wQ2KgUVUpRZiuJhACIEY+RDK7XGc9qiaVuAkY6OvK8yDyatkccpsiJvoFaCjkMAmOtfC8S8VIMV0PecgvB0xu0R4q/paWctZuFRtsLyI4YEaGQhjHOmSQ1SWyzWGQuYkUWIvFVDWKbw7PmKlishYk9HvE8ZxDjvyYiY5FMXGTLQdKqz9bao/XVYRTFqSuLyaLIBEHFuSCOwyyzV4FTKVYONDqmcTQODNKKsSDrZXCpo6OnU8/NlMmFZoku/RCveO8JE+t129Md9voDZJm+rZYX5324buF6+9NYXU0nCqxx4aVtAZp3TElALiMIz1BS7ff7CGWBDtdqNYg4tVqtWq1GjgsCSOYsJFtov3cPtfdEfgpLussyN49FREph/Gh9bD6+GO2WJLOhhM1K5Z33yv/6L+3779hG4zJ0SpJyv1fr9e1kEs3ncZalcrX9F7Mb5yxK221pmF3EkZfiv99JHPZWJE/Q+ZY48nUfpVcwrYnEVYvEqVqtdln7EZFyuVIuyxsZ7eh6SXKAOBBJlaxwUCh2uvwNNn/DHTp8d9wBxHfH23MA19DIqUf/0SxavcOBaIBXqIg6HA7Pz893dnZIi/sjHvDygsijVsC8+bcgKQANSgA6YEeOx2M6vBH3gTQtasjNZlOnmnqzRF6KMAU/ALk7Pz+HjiSyCw2OJEkCjJiAIOyPJJebJENZE5GAKZTL5UajUavVyEUlN5nN7Enet4tvxIMjzXmYH0AxAPt2Oh04IKGfGpxxUY7YtVoNGGWpVOp2uzA5AVI5HA4PDw8PDg6Ojo4gvnFycgI7KbwNKg24dtaraSCmEUzPfkcHB9+JDhN2oUogyDLU1gQpwBgznU6fPXt2dHREPQ0A6F9//fVXX30FIE/n8wCwmEKQtkAoGQRD8q/psAee4HQ6HQwG7JQHTo25hspBq9Vitg8tLXwdzrndbnc6nUajgXGCQBad+4Q7UT8YjUYgOxTRT5yPDgHBHopHo6hUYghlRDLnkjQ1OVcXgOBkMoFHJRQbaA8FHvp8PqcZDhB2ycUHeJdouoUWP6L5YRiirR69rsX+R/a5a1FUnfthUiyNX9EEmqYpsgIw4nXpiw9LO4lrOJhTCRA/kSyQTSgWgfEML/hWq/X+++9/+OGHGxsb4Gqladrv958/fw7NWdqaAyLXWuG378u7PRDHugVzFS/p1aoCxa5nDZkx1ypyJ7XQCtdP+vhBfwaen1jKyMpBSQli3KI0o6HDg4oU5gKWeuTkkL6BmCaI+VtbWz/5yU9+9KMf1et1eIpaa+H59tVXXz158gTaFLu7u2tra5AIL5fLWACJHHlugSQiUYE3y7J2u10ul3d2dqrVKhosHj9+3G6333///ePjY7CAR6MRfgtyMRhL9Xod9TaU4gDypml6enqKVXo0GokI1Gnw887OTqPRqFQqaE/BvYKP6NraWq1WGwwGr169+uKLL548eXJ2doYKhCidKK8l06NZEfjji7rrFsWbosqtzvqK/kuvNTKxM9I6lXsWXkRRQZOhPA0EQnXl/NDMd2bF3LLZta2nhlwVWPAUSImTFsWCvQXH85LymG6efAF2EywsGr5Btfs6Or8HELOdwgOhtIr0UiTx9kk7ZZHYR5/ffBTnQmvhPWdKkVtbST95P7nXTdO5c87ZMJZgMZvPXx2kpaw8PjUn85L0zKXDu1PsqoguZ06MGGPDMCiVSi4ohVJyIlzntfSwXrJYRyfVvYi4aRxQOzoUmW4aINbLI8cGxtUlP/F3DoaXgrxuKeR568l1M5pzgxKrh66KGAeMWIwx4sQ5Mc6ZzInTqhFaXEJrTOuf3dW/vV/Pcn6xU6+kIs4Z4wKbhUEWRUkYpSbLnGTWOjHinOBkqGvhnHEukxtlppfK+N5wt703F7WwtGD9dSzd4q56g+mLLNPLLq6BtzRM89aHP0Wek+6Q026iHqeeGhFeDZ70ArTv4CBADENyAMQIPNCNhFQL4SXqvszLdO+g5wRDPV9NNvc47FdRfokTMcbUKvLuw8XDe4MsC62xpai00pLuerixEdSqQU7hD8MwrNfDLJsYMzNmGscLXdTHHUAS4RUzeALccVjoonSPbsW7PShcRB48rv0b4TfoJX1pQIJk4fLbjTEiUam0eCNDcJ5vUqAMzwAo5OtbWWSav3OmMGW8jlPO5O64O+4A4rvjLdpWPR8SLygE74bkPuThFG+SXKsUCNFoNOr3+/P5HFq0f/Sro1fPLeMkhv4ApNI07fV6e3t7e3t7/X4fSAG0d8l5hPLj9vb21tZWs9kEpuCFbppS6pyDbHGn0wGigZsG/rUxBiLF7XZ7Z2eHxneVSoVeVbA/Boim83mWrCk3IaoNDYJZeGSgqvV6PRLxzs7Ozs7OJpMJWEtaFgCRQaPRwIWDF4zACJkqcXOkZ2jzhL7EdDoFFJKmKa6L8Bm4YMBnKYbAViBm2p6pEUNtbZIjipZ1m7IBYSzdT8peQogeDAaDxWLx7NkzDPgwDN95551//+///b179+bz+dHRUa/XWywWpAbzERSt7YGHIu6kbR25q6AeVKtVgLmDwQBCEwhSgYOQAYdAE4EdzBaMMY1Go9ls4nMInxFB0AwpCEbPZjNMT60zW+T9VSqV1dXVarWaNhq1Wo0prg2CVqsVNBq8k+VyeX19HUD2bDbDYCZQCJ8oYhxIm8mu1d8LMmAQBOwRxsnM53PQS1ut1urqKhBVjzWD/nE9/j26n8fG1asfoRZ8L2+X11dIShoe9HQ6pSAsAOLpdAo1A5oHaiMv/BOTKwiCnZ0dKOECAoaiy8nJCQUNgHEg8aBCtOeK9kYOrUVYxNc8kxxiiOyCZ/alGUyaeux5hui+RewaaPeGUvCLFy9Q8Oh2u3g0GP8YDNCawEoIrj0+Ey5/UNpF5SkMw/F4fHJyEsfxysrKn/3Zn33yySc7Ozs/+MEP1tfXQT3G2BsOhz/96U//9//9f//888+NMR999BFmEyknnnc5nj6lSFjNAgaNNQ2M/k6nIyJPnjyBNPnGxsZf//VfLxaLvb29Tz/99Ouvv8aCj0UV96parVar1W63i+mMrwMtWvLOVmStGJlgMOGfqDChPEMtUTCIyb3VYD2mjFbQ9mBEDXdSDESj/7Rl02aGXm++5Aow12mY3Jz5cWixAAOAGHeerHOqghbluRmrQE2iWL7VxkQevW6p46LeRDS52JN59WSIPDOimzEm3WvMHZZZNIaZ5xDoKYdS+aRoreYx6W7Gg24DE+vGsqscPVSOA2svWVKBdc26PNzNttczl2VinDWpyGIymVWD9PzIPA0qZiEyFCnn3j5MpG2ODOaYojHWBtZGoZXI5eJO+qr1+WhvOj5EKTgdMfZAV5zHstd9FdxnSTfmRJCrbqv2+2pcaoBjKZx3m0fjdb1ogOYG1ambyXqee5tzmWSSZS7L0ixzkjlrsihMq6W0XMlc1YjN+eBRTqPLlCRxqn7OrmpQBPkwKIuURRb5GzKRQFwiUhGTulIptkGWiSSZiePAiUudFWPFmiwzOfQSiOH4cR4q6jUDfSc+u+wmOE8j4jrMdylAf90DvW5rvlnl/IbneN14+BeTz+pRqlNa7cama/D6zjDZQQwAFJha/6C2kDHjyRMxqtHEHe5KXDqwZUC03SPwahKP11mSZVmaOmtNpWKaTWnU0yg0QSCVimu0pFKxWPPIUDXGRqWgVg+NLcGGwSv26/1RrspA6ZFPZQmQpqlFLldbOb/f4nYb+rBnpn1dI4vOI/Qe5Om0cKv6Voa8VPp+7R3Lj0luUpfl2uuVvK45ESnnZOGFSCjiRBYiE5FS/mLtjkR8d9wBxHfHW7anyjXtbF5vnec5U4TnSCl6q0rQS3eyGyItZk1AiMDbgntVkiSQl8VlkrcLXyCwVzTs5d0cDdciZU3TlHxJ6kUgH2beu5TLwOeiW5a8xiU+Ka/7jFoZOG1AeAC86KnFTIlevSwgkzGnbYjwin5zuVwmqK379Ujk0dSzpbSL64LgpebjtzyQbBMLxn2gZQekHoA7GGOAAuOmdTod+L89efLkF7/4xdHREWzlyHpmikgUnr52QAARF+LO8G4As6jVammagsSNhyI5f5biWbTOoD4pbgKF0jQpDGOMGSAlKUBzAOLp9VRK3s3NjBdUcQmCUk5FF5EoDNfW1irt9iKO8R7iL91udzKZ7O3tgdxHgyN07g+HQxIQIK8pV6X9QFoXEfT3wfoDV4GPgkgc3UV0sOupixZlFuH25hlDadaJbpcmIQ7nTwsmlo44TXCHMYNGoxEWCi2kK4Um/TAMm80mXMjCMISb3+np6VdffQXDxmq1KldtQ7Rr/FXrkjdWI/SQNa0BrelO+Hbg+7oBX+NNmt6ouckkM+pcBfMCjwb2bpPJBPobaZqOx+Ner0cdTLyfiZyIYCQDn0WrB+jqVBVMkmR1dfXx48cUfa5UKhhdgKSfPXv2t3/7tz/72c8ODg4qlcra2hpUkjgjMPt0z7V259PPl5knZiiKDVhD8Ew7nU6n02k2m865k5OT09PTw8PDnZ2dBw8esKrBLgGOeUxJkpuQss7nc6qpoP8DcsbYUyiBrYUUaK3jOR3huorS23oAY8qQXsSymUbZ+HDJrdYzcSnr/KYEUi5lTTX9k3I0rMpQcZgOS0UuUtGHylPN8sDEG8QWNJSjAeKlUg83oxg3w0Z6bmrs3osldCSgp7B2qPM+XCvV3uAcWGSP3nx1WqcYr6CcZIzN02IxxkQl0wpEGvw1J1laryQXZ1mtnIVO3NzIXEREEoUVXqF/inPOibtUKhBjrXFiipq8S2E+Df17Ar64z17FFPNdQypFn7oie/3KQ3n9hn3u5kvDVG8E3kAB1lxmLV+rt3vsjLzepVL+WlbIOy7vp5g0dUkicZw5l0U2blVn622zvZ5OIiNGpCnSFqnnBk0LY3PenJsbmTtJRJwYACuZESsmMqYsUjWu4VzmnMtc4LJyhjqBS8SVXGadTdKV+qRaHlsTp4mZzoMolUwCmANmGQrezl31f9OQk8bKGbR4BtHetXNV1KMOOzVKC7xpugvBQ6n4XBDMFFkOel0qKj94ZrAsbGtMzROmuI68XOSJs6r3p5LG3oyte9xwxAy62EmpB+qY46CyMOWMaCLCuJcZnNat5iaovfL4yJA4sIhI7Sm9+5O7kG/NlzFquVyq1srlKAyCoFwpVaqlUqTF2nHtNgiiSsWEYQS38xu2nqU5plrGA6Z12rT5d39Ytzdb1vvUdePWY7xdt4tdWUJvqIZ9v6OSy+BIXtCa5NFMVS73NcmhYckR5HkupjS96t55d9wddwDx3fHHRYevixXoA0O2lFaWZCzlIYAET9/mq0ZTP3AEiupezoQwrNfrgDlgIm+M2djY2N3d5dvI7wP1dbFYXFxcgPzbbDZnsxm84xkjcrNH/g9VCrCAIW6FTvzRaESCNlqkz87OUO2EUxNwQ8DWrGPT9wyNxghWwBrjNgzQkyQviHienJyA7Jmm6WQyAfKFm6MBBUQGzWYTRXUw73AOpC9BmWF1dRW91VRIAOcLfcGInID4QFfUuzkaPWe8JarPV7NddO/YazUvE3bnfdYlDVwXFQ90RyooA+vr62tra1EUoZUbcDOng4gwisK1UIWAvatEkIFuEGShXxaY1HguHK54M2UxioIJWjMU78HAwKexU0wHskCOiqK6RPAv88Mo0j6/1tpmoyH1uplOsTig4Q7I9Xg8hno1omfcZ4xekC88bAUDADokkMXAtwMH1O7SUN5gOzkb9EgeJO5TLB5obWh8l6518emDKKGzYi3rodc3nKRc9fHAUoChrtmCmu2ODATAt+SOf6enpy9fvjw4OJhOp0TrPOsYr6P8exdIrkOCioItRTMrnolXALsORCNZw5Mt1uZahLGAbJ6fn19cXOzs7ECvhiacnoc48iu0Jjjn0LeBpRWLD1YtrEUYn5AAglwJVuy9vb3nz58/f/78yZMnGHjz+bzX652fn29sbLBChnWMBuU6y8J01prXukJDfBnv7Pf7+/v7rVar2Wzeu3fvz//8z1ut1ueff46yDR3S0FbinEOair8xHsBwp0cZWlUgK3F+fg7XUJwtslmeMDskqAZAVRzdTuGNAe71ugZDzROtrO2Jn3gom2aRv250YpZx6zzW51KDmuIIL2KCcqMA91JUl8uLd8k3/66X5d7AFvQuZOlJXvelRdcgDxEuftR1jfPfA9DUJSLR6rRG38PMuUzEOcnEOLT65xmzWOuC0IVhZqw4k4PCSa5X676tHOAKjMkXJcMfjXfVS+/ndYDFEgSh0J/+PcB0c3taWH6/XJbpun5x5OhN6jo0nOGZlt3QMBnK4XAJZn2LjHv2byFsYPEPmDKFvy+7pjIjThaLLAydy5JKNOuuuHe351EazsciIlIVWRdZFamIEWPGxlgxUyNiTGIu5YlFJBOTisQozBpbN2JNZrO0kqbVNG0k6Sx1qRORLJFsliat2MVpNZqtts7LpUnm0jixzokTYwMJQpckWRhm1mZSUGZg7kNcj01sCM9oMKvdoRlA4sIJMuqaKPFH3diuZ6jHluDDRVTmPWu9Dus1xyNIesuFjjq4AhDsu87n9nekX7xVeLE3ETz7meIdwD+j/NCKCrQ0wDZalDAuFo2KD4ubLEuVWoXJA4ipaa4k47EaGOcC58qpCyULkqTk0pK72jCXX6CxNvJkf5bSpIpLpVf5W2pu+UbCztd6lNdhxMXuQM+B/Ds2tTcIVmSqlpnk0Noi96bDTE1z+rBTjRR4850M8d1xBxDfHW/VPqrrqJQsIOzF9ka5KskH1Fizb4DjaALd2wyLX1xcDAYDCFDAMk5ygdqVlRWwX4E4dDqd1dXV7e3tSqUCOcizszOw/y4uLo6OjgaDwXg8Pj8/p2NSt9tdW1ujiTy3LkgKAGatVCq4V2tra0EQPHv27PDwkKq+wEpoag/IjIRi0kKpMwBcm1KYYDLKVUYAEEaitMfHx9CUkJyCB2wFV1Gv16ligfuwtrYGAWIg2lDRQvoBu6319fVut8sXIZgAVux4PEYqcnJycnh4CNIubg696RFhk+MmOdGDI5OVCR3ceFDF0sddE1nL2UhWxDD+dk7SFOIJ8PoNsszGcZqmq0HQiKLmdDr65pvhZFIpl0thaI0p9fudNN2y9mw2K/V6kbXlfr/SaolzcZIAIC5FkQ0C55xdLNxkYqfTNE1dlpWzrBwEkTERtFkWi9JkIosFJmB9MmnNZvFiUVosoiyrj8fVKKrkpINoNrNpKouFCUNJEhtFFsmkc04kRQ5DKeH5vNLv10ajYD63sxn9lEtJUs6yIMtMHAtiyqvdVcY5m6Ymjk2SSJJkgELiWCYTuSo1QPND5id46Jg1un2Pxh0QLcFw0o7eqCJAR4K8Y9Q/QN0lCry0hdPDfYorD6WEkeyhV93LvZkBEv1kRqcXSSZpjOkxGjE9mT8UoWeNjWLuM12Bf+P5+flgMMBkFNUgKdfIlb7BBdZj1ngVF6+JngAxsXs9Sfkh3FO8PJaUK6KNlOmsVqvT6XRvb291dXVraws8X92pAGQf6uciAt0SgJVUcdna2nr33XcJ37NLo9/vwyxusVicnJzs7e399re//c1vfnNwcIAxvLGx0Wg0AK1ihccCVS6XoYpDF0StnOCJ1XIkgODP60UjqjHm8PDw+PgYG8rHH3/88OHD99577+DgANLJuFJMBEDPEKXBtMJHsbkE+zIQbSgCVatV1LdwsUQooMUMvXs6JWJGaGUAFjC0ni+rIASPvD1F12A4RzR3mO6pGvB6jZGZ5/aUI2eVWiMdRGeKH0J0gA28HlLgwbUeCVSutt3oe+VJNyx1pddKFF7WunSJ0GRGzUCkmgr7JzTKo1vdPaJxETOVazzKbng018FGN+DdnskSaL8AxOJFkqYxzteaVFw6nbj5wpkgqTXilc7ibBjFYlOxslA+7/Yy/c5vSBhGWRRGJgwyE4ixHqNWs/vlKoH9uoKBfl581kXZAb13cGQyMPbQt9eSdL38LVVQ0b5SuvDG6unSZ8dFGMMeaylxXqKiLMqiYEndmHK5zEIsNiy2vaMkjKWY/H00t6epEWOszcTGtZJstRehmI2Gi+ciRkwkUhNXE6mLccaOrUmMjYwYYzJj0m91h00GyD+wZbFhYKqS1bJ4msSteDGZJ3MgtuJSl8yT+Wgez+PALFZbs3oltjZJM+PEGmNMcFmQ0GHDUhSMjRosn3twMKtlbOzD2qhbKLBEsxiGZnyWPz3pHq+uowG46/RMdDncGwke16cYCWuMj5YhHrJWLLkVecdvfzLrLdp8vQgHX5cveKWXmxfJYr1t6bEUifbULbSpmv6VqxAnapMmy2yWBc7ZIAsyZ2+T4N8+NZZlKiV/cgUDb2H/Q3wlrDhdXs6Mc3mcOMeFo3wXC3O5pDSHhlMluH933B13APHd8ZYso+TiLd0tSCTUakqemgGBGICA8/mcQMDbKXeFgvB8Ph8MBgcHB0jFgyBYW1vb2tpCJA0PJRHZ3t5eWVmBS1gcx2gWBteAQg3OucFgAJ5pr9dD0o7PpAgA4AY0CONDICzQaDTQO99sNsFrhtUVOtZpXkfRZwSjjODJxQNNmBeo3aIQ2aMpHiDCYDAYDodk5MGKDb521Wp1ZWUFKDlJbVAb4J0hplwqldrt9jvvvLOzs7OysgJMHHEtmKRHR0eAcvr9/tnZ2dHR0cnJCTzBYKxEqqzHyeLWzhfJ1CPvWF8+kjpSevXxb0TKIiNQkdheetm2mIlzYkwQhtaYLI4v70kU1dK08/Ofp//T/3RRq612OlGzKUGwEsd/8/Jl9+Li5PR0/R/+oVKpbH/22erqqhOJ49ip7jO5KnFLSDGKIhsEAnp+kqQ5BOOcezdJ5rNZkiSSeylEUWSNcfk8vYQ3KhUXhhIElwBxlkmWkW0XWFvLslKSrMYxJBW8EDkMw6hUulQs0wCxc8a5UpZFzqVZliRJmiSZc5Ik9pe/lPllfxTwaOC8xH85JMjZ1ElRHMfogkeJBZrgJGz2ej24I0KZGhgZZFugsoplBzxKyqB72IQ2ntLTHHz50Wg0HA5xnoCkiXJSwoIpYhzHFLLAYPaAWsnVaUHzh6zw6ekpqPFsthCl4wYsD1+0srKC6hGuYjab7e/vf/nll/BvpOudVuwt8jveIEbMFEIjSkuRFM/eyvMl01rDJKWS9qsvRHfEoyEXa+np6emXX35Zr9cfP368tbVFPKJWq1HOm+J9OFtMCAwkmIV++OGHSZJAzZmFKIDycRwfHBx8+umnX3zxxTfffPP06dOLi4tyufzo0aOHDx9GUXR2dgakHq/T3XE6nWodcMxu1DA4eVl+wEoLDi87NrD24jMxsFdXV621nU4Hs0Ny9XPck1qttrq6CkEMYhAkFtHSE7MPGBB6VgDpQssCY/vi4uLVq1eDwYCFNJ6/KK1DKbCuPGsX6i/r4e3JobJmIMrelvDZ60lMFNBhSlFj2Wf3NNnQXk5IDEVLRlKDuEg91qMU94qoK9FhuWq3KFcbXHS2L7lpm75X7LvS1Sb+F2mMcb4N4RoJ6HBz4aGVELxr1005XqrMMpgWJio+Gs537dRXfINcFSv3hpBc9dybz+ez2TRnTTojsXPxYp4ukrRakc2N4TsDmS/kbFwZLqJ0ZCEeK2UREVmIERMENorCcrlUKUulUpKgkpmyU3KZmtWuSfS6mqWpf5r5rhc3PjgPI9YjnDuInkReVQDo+K3GvIioseEtwnKVO6x3h+vqplocTKtUaxVvFO8ZrOL9cATFZyJ81RU+jQ4vFovL77LGiVgblcpJKXKdptTK6cZKkqXuEj0JjFgxoTHWBHNjEmMCa4wRZy4DCwO2tTHGBsbaUhCYQESyShbX4nl9Pp/NFvOFc5k4yVy2mMezyXQ+W6RpUopcuSSBNZkTl1lrTX7jHTWUigxitvPjurC6YufiZNQzNM4PCkrwllI2TWPEWLK84IRNJ15RR09bvSh5Ov5eic4DPT2d96LgSZH0el1B6E8IGv7OdE9PEB3PePo8TFppt8A5rvXNdW57HSjsAayeO+gN5cnrHICNMUEQajfUN/twlp68FNrC/iiP73XrynrG/eFOGzIRIpcOq0n+pyLiRIJchjhQbnVWpJq/HotM73zq7o47gPjueJsA4uI25u1YGl3ScYZXclwsFvBbu7i4QGYL5ulbGGEAETbGoLn77OxsZWUFkpHdbpchHdxp2TiGHzqdzmQyOTg4AA4uub8WAKAoiqb5AQeqKIrW1tbQ4GyMgXYkTgN4a6vVun//fqlU6nQ64H+dn58DqoAoMMXOmNTRzYw+clAxQziLeIKQAfWjyXGw1rZarXa7TR0JYCugRcOlgegwM0BAuoTMGo0GEOF6vb6xsYFP4ygajUZHR0f7+/vHx8dQtNjf39/b27u4uEBGoWlZzFe1iITmJzJP5uNjDk/RSUqCFo9PRD7hP5a+xzlZXHWyTRKZTuXsTL7+Wr9cEnkk8gj/2NsTEfnqqz/uYA7ysES/EolUv1cJnPtB+Zr3ZGk6GY+zdhv5JJ3c5WqjHNcKFkVAWpzP55RCHg6HR0dHGOckwkvO6AFqPBqNKKmB3AxCK3Dq8waD58UEbK7f78MdkfmbBrDwHnwy6itQjPUoh6JEdQh4TadTOD0eHR3Bt5D5pFZwQ24JQRIAxLu7u61WC2D0+fn5b3/725/+9KfoQsAnEPDyxBw0dPWmAGKdiMo1qqzEI6jjDJSWRmceHKOnZ9GajJsIIWnc0vF4/OrVq62trX6/D+gBzQdY5XTiBFAedoudTgd3cjAYYFF699136/X66ekp8QtIw5+fn798+XI6na6trZVKpdXV1bOzsyRJSqXSeDxOkuT09HQ8Hm9sbNBgisAW+XdA8LkdQH4ady+KIvwvBKnxCYBgqJGyubn53nvv1ev12WyGEhpdKMEdzrJsdXWVUjYkk7KVhGkPZg0aPlBxnEwmmBqbm5vtdhu3pdfrHR0dQU1I89f0wsspTBzQM5DhMMAd0GAoH6smvbIFmyjM6wLEImKNCZTFHLpSdOGNchnaeMfDPlCXrdVqaIvhFlaUxZdl9lMaYCpOFmLNnJIavGMBQ88I76OINhKQAvTmCcqzNo91SaMVUlCNpAwxMXRPddozMNDVrKIdkCYwLs232T1dxKS0Ag+WbpSxkyTJMgDEiXPJIo7TLGk2Fw/uLTJJ4sSZfTc/CWYT42ZGIpGaSCASi8lsaMNSqVQtp7W6qdWrEtQzU8IXsi9BV5GlIHLCZ+RhxNqxGY+JVhO60EtgjiLgOvbwFkyoM7nXXI7l+k5/TQXlydwAlLCZwFvV2ZMBUgI8ZrEUIxLmLODSR+8KfXxb4TPGiY2jNIrSMHRR1VXLcVaPnQMAbMSJccY4Y0RsZk1mTZJrhUh+kwz6mmwYhja0QWCNtVk5i5N4XlnMZot4sciyTIykWbZYLKbV2Ww2j+MkE2tNaEwgxooxYiDJ6jtWFQ1XtDgeSzKcj1xYiCMTCAYjQRd79CDxyiRF2XdOKFae2CfH39X+h0XEU8scewIymqSsQU9PYuKm4tybkJr9w8OIxZqfrrXoC8TWqRcNya22USCBvhMEwWq1WhzHyIDoBVJMhD2/GW/39GTNvKV4qRwTVm+dMEIuhooxukb4Pe7YDYDADa/8UR7rbYvKVwtpf9CTp/TwTCTLwd+pkh6WXG6iJjIVqYokIhORKNeakDuJibvjDiC+O96mbVVbdnhVTa19qfFi778o1Njv909OTl69egUAsdVqMR97qw5rLfhZIvL8+fN+v2+MAaG1GIjre4WLXV1dPT4+pnEQMvPBYAAiMCEz+NrD0Z4fhTRJwzFw9wKNdzqdtlqter3eaDSq1Sq6+YbDIT6c2ctoNIJEhmcWROEqYL7AuRBSaJftSqUCyWAyJVutFtyTGHYAhUGmCmZop9NpNBrAMqrVaqfTabfbwP4obosjjuPT09ODg4OTkxN4NJ2fn+/t7e3t7Y3HYwQ3ABo0gqA5X8W0nwGWtoTSr3tOMnfH7+lIkuTs7CxsNuuNBkY16TDktgPnAi6zs7Pz8OHDzc3NRqNBczmyydDnjlJKpVKhKx2d69joSmottE102Ya+WFq3gbIV5+fnw+EQU9uTh0NCCIECMPchaAtqPM6f6TGxzizLIJby7NkzoNuDwQDoMAN9ro04c4hIxHG8ubn56NGjDz74oNlsish0Ov3ss8/+8R//8Wc/+xnuLYRlyX2misUtm8F/x0B8KUCsbceKdk/FKNzrO9Fwthas99hwWEXH4/Hx8fFoNCJ0BXiXNTAsUHjWmtSGKh3001dXVwFej8fjWq2WJMnBwQGkdRaLxerq6u7u7mKxIKx/enp6enqKklu73d7Z2dna2kqS5Pj4OFZOjNzpNJGcd0CXJZiQVyqVJElAYIet5fb2tuRce9QRqfyA+mKz2VxbW8PiDNiCJQGNgZK6SF842huKSLvdBn11Pp+fnZ0dHx/3ej2KXXpyJR6U4LkeLZU69cihsqxtX5PNPcr/7Qu54G5hZcD8wh4HWreI4KHTRk8PQpP3YVSrVVQOsKtqQVWyIFHf1cIyXoKqy0teaz/HoSc+wJvDnQubuGa56oPy69TA4UURjMBzpz6mLLOt48ikUA+xbCkYBBEG9czrPPBRj3OvXfq6PFzzLrEao5eIyjAkzGVZ6rJkpZVUyqbZHIkkQZSlqTmJq0lmJZQ0kNRZWYhbGMlK5VKt3ggbraBRr7ig5vJqpu7T1xCnh2V7doW6XE3wl7gwbdyKRHsq7bCtSpdYLuMiTJ/bjXfMFs049mbNUh3tpXfe43NoKVvJ23rQ/QZlJ5RFab2lV3gyiPFbNOwCKwLRbL4aSFSKsiwyxkSBM4ERY5044B4mMyazJhPJjHFGMmdcPtdynWYwiK2TUDJrTGCdDVxmTGRsaILQhEkkzmUikmRZXDJRlJVLMl8EaWJSF2QuAAXZLhuWntq+57bChgxPJlhTGbT/mAZ2Mf1ho8pRpIVftB6I7mzgeCNZld/IueMVJ/T5a/RZP2sNELP9gqWC1/K5/ROCiZdqcBU5uVzl6DjH/AV7KKqJjUYDRBkEhLPZDJwbLLxYWrmSFxFq3XSr65GaDK6fHXclPjX+Ip1vSqVSLT+KCHUxlnvdx3cDU/iPMgZe15OcrSoUCudoF2Xa+ftqa6Zofqb0hSVXnMhyiWHISuCdaf5fcmdPd3fcAcR3x9u3p+LwhPlEcYr5T68T0/PVpZXWdDodjUYw1Xk7rxpNXkATQJW9Tb1RB3ZMMyj7iz0JER62KN3JqzuStHLrt13/UVQqlUBnq1ari8UChWvoWiCCZyGaXwHeE0gc/C4tqKpzDMaOIJ1B3RKvkGAFFgmoZ+RVAQdH5IT6ea1Wa7VakN1YOqho3wcocLFYwK2OaAub6YqeG7qW7g1Fxt9e4FVUzrJ3c/v3c2RJMp1Oo/m8kkMtBO90iz0Sy0ajsba2du/ePbAy8Qn0iAP2hwmFAYYRSABoNBpBdILDbCkXlaOCgxyMXQw5eiRiROH0yIQFiMxsOcsyxN/ApBaLBckaOMkgCFDwePHixVdffUVXPWibYE0gxKAxaNR4tre3IVCOKxqNRq9evTo8PARPFpR/Vjs4hXXt5PfR8beUhaTBRJ1ieSxU3b271PyKYI0nmOjhYsYYoKVnZ2e4Vxqj55LCzJxmdCC1sXrBklitVkN9a7FYPH/+/Pz8PMuyVqu1vb2NdRWlO6xFuNVgH3/00Ufb29vg9kImAsAitgyNvFDlExUFig9UKhUgkp1OB5rXp6en0D5++fIl+mwePXpUKpVQJ0AVzVqLkluj0cCn6QZ5GiRixgH6xDAGxINi5MbGRq1WazabaZr2er2zs7Pnz5/3ej3QNvXj0My4oraPl10XC8akoDIqIOJWxCtpb/B6vaI5ooenye0VU4P+8thAwafWGTsRVTDCsMcBBSNAEEUR7ry2u/TUIa/TrtF6LFiFSDAk8qibvrXDrSci7H0yr9ETq/FQP10i1WxHXDsL1VhY9FbLW4TFSnON5ZquZ9quFksFUtBr1rgbVeZZDsFqrBYBEeesTUqluFTKbBDf24mG03A2C6tBmk6MMzIyQc9FsyRMpiZdRIGpVCtRpWKDUllsWSQsOtJrHrd3qkSHiyCsJorG6vAUgUW11slVBrHnw4nD3A6SyHK1qOtmynUC2d+J7nGZ5aynjjDWVbpvUUKHRRSWSFmN0BrEmD7fGkUkCdYLJ4EY48Q4UcivNSLGWRFnJMtc5lzmLvFjcU7EXvr0mVQkcCZw1mbWGElNkJnIBGIkNJk4I4HLMhOXnHUuEhMngUsyg3svYqz9djnywsiifrqGljTtVDe0MfjUft36Yz0lMR1vS0EBRsOCNFpgtKBjeKx4GqeWAvO0WAzQiznXQNY4l6KK3pj5UxSXKLbDFoMNXdXTN5Y3ULN0CQHrNgJdriui7XiF9AW6HHMxL1KM9RK6NMCjiy+FkhA2F2uxSwFi7Yb3R8d8f5cn+53DElMYPVsI+/U0RFW+2WwyBnjTZwl6lHJVTXJ9pFQkFimJGJF5/jqN6bL8h7us9e64A4jvjrdq5fVYBp6VuVY682xAig4qhGbG4zFgRzo/vJ0HhB22t7dprXabO1Yul8HwQpszG+q5RSGAxt0Iw3A0GkHTjSEaPSK0LiFLxOw5RfM7Yjtwb+k9jYQfyAhpAjqkIH2bwouMaYhBEA4u5QdzA4AyiF3A4WLLFYIV3VXqhdo4QxygDmHDBkWOeKK25NIBkw6FvU/WT0E3w3oR4ULkn0Qay4qyCBZM7hXON5DwRbCDXdJhFG1sbLz76FGn00FYeXZ29sUXXwwGAxFZXV2FhEgYhqSuBEHgRLKrAagvgiZCI3ZRLZ+Xrd/GgCcWWAsDPbssHf2WXxkE5mozo4b2eNXfxo7GmAK/gBF0lmVxksS5sRsb7cW58fr6AsBMzqBBbYP97xzPCLVRioDUDCEDbbCOYQ80ED/wtEmfYRTuVXGWopmSNzXTUkZjkeDz4rrwHjDaQHNjPQNyyeR1ai8viBrDQxL4NYeQ702Us25JBYVNJYBgEDyxhnCxJZtermnv8Cxu3uBBCE+Lb2pIoogCe5NUqyjqBnMSir1iFRt7ySAGkj6ZTMDQwbKD5UJE8ECZoQH2ormltvDCEm2MGY1Ge3t7wGdxMrrqZoxpNpv1er1cLmPB/MEPfvDOO+/UarWTkxMsv6iHlctlDBi9/vC70O1BhLFarTabzXa73W63p9Pp2dkZjPKOj4/R/4Fq37179x4+fGiM4UAClLlYLFgq0MAToBxeIxEcHLjhu7u7cD09Ozs7ODhA3wZGOASL9K4tqouZ3jjaDku3YGu5W45VrbfAs9Ld2SRDkQ++1EnyOizMiBAgRpcPqbXz+bxSqWA7xpjBnqvpQvSjR17N4YRz0Cgt4SFPeaAYIMlVQUnJJXESdXgKxXKVCKYxYmJY+nvlasOyhxB5xmV4j8YxPWAI18WnwLWXspuU3C169xX7tZci5ku1iYGxIgYYjUYgnFJAI/9845wYAxpVZm1aLmVrq7MHO+PQmHvdqZmbRWaPxtHTXvUormWzKFtEVly57KKyNUEpN7DzgzRdMvfiB+3QxXurHyLVMHBXiat6qKuolgjvB4ZkYRSFURTcDiB2WeYuLdhckQ5frL15LxZRMLnK42a5gq4VWHLZK8ZZw2tEEYU9+BxsRJbJIMaHQzzEOZtJIC4QFzhxUFY2YsRY6GG5zGWSpZJlkgNb7lKF+JJBnJkgNYERm4mxxrkgcyYzVmzmrBgR47LARWEUZS4WG9s4DS7rXldURIo0F1lGqywKsBaVx3UFSI+rYqVEL6Gc3brKy0QAYac2FdSbry78LN1qtfjMUis2Pd+vK0pdh8TJnxR9+AZc2wsRKb6vb6+m7mLA87cw/eFVC+qDvp9cw7VqDfdHThxZRiL2YjmNOGveK4vQNLPxBrZXv9f1S+bmtyTh/mEYaV4oe5sS13VBr+byQ92r1+tBpBGWHowPq9Vqq9Xa3NxEs+ylUYpz5k3JtVVFVpZecw4f44fK9Z8wuZOYuDvuAOK74605vKYkzVj51lPLWkoZkHmBd2o1N7w+m83Oz8+NMcCId3Z2QFN9O0OKRqPx+PHjdrs9Ho8B9i2lxCIgZhpcqVR2d3ezLOv3+9bai4uLo6MjZJh0ooclURiGk8mkWq0650CFQ7Rx6T+m0k5sYIgD0GW8tra2vr6Ozujz8/Ner4etDurGtVqt1+uBUodfR3mZDtf1el0zH0FMRuWZxgu0Wl5ZWQGhWPutwx8Mb65UKq1WC9VX8uY86J806uFweHJycnx8fHh4eHx8PB6PLy4uzs/P0zQlWo13YmsnhMRs2RMj9kBkuersofmM+GEk8v8R+f8uA4iR6yDsSAAdZpmxthRFYgziRZCsgyAA0l2rVv/qBz/4H//H//Gv//qvq9VqPJ+/+PTT//f//D///Oc/j+P4h48e/eVf/uUHH3wACQXobteqVTFmMZ9PZzNiN5qKCZbLJeZrDMCvQb9/cXExnc2QlTWbTVgFMlFh2q8jP1C/Se7GHb6coc4t8oiWESdj00uukAaIsyxL08y5xWIxHo/7vd5wOEROP5lMJpNJlmVSKiX1epSmsJIjEQYZ42g0mkwmqGrg/Fmx11rSeLIAbgCbUvIViCEeNKFnLbvpya5p0h8GP8AjOoNpeygIH5+engKT1VxIKswOBoPpdArBU5wzzp8gGgoeSBU8eyKdq2uxYCg5isjKygra/3E+MKLkHWDPadEyS4ufvlkN4usCbs+Ub6lbt4YnigoDXmbumbazYABEhhIxYKhhncRopxIon6ZXD8NvMXFCmzDQQEr4gWC7trZWqVRms9lwOIR2MOYLZj2WRIzkfr+PmpYnoeO1PeoMUHJDNhRQtDoEbik6Q4MgGA6Hh4eH9Xr9nXfegQACaC+9Xk9EMN5qtRrBRyKAi8UCNwR4MT6WFD+9up6enj558mRvbw/wdNGHUPcMeU/2Ogy3qEztoW+eQPZSW/nbjlv1ITBEpdwKBwNuFB405Kp1NQglBGy1PFgWJSZLxWT2pXo+jRpq0fuOBogJN+ABaXBKIxSsZPBkOLtBmecZMqAieZzKKoAsib+zesc+CVEKG1hgsdgSuUD1l85jXuPOdSl9scPAi+s8Rz6gw7BkBHxPpqr63UvuaOZMnFhrnMukWU/vbc3aTUkX08CZyTx4dlpJ9mRxVgqCUlnCkjXlktgATK1roS6vmlhcpjQnFOdPaBiHhw4X70ARWOTkYuEzLJVuSZK4VB/OMlcgqHr/LK5F12HEWmPXwyvB6QZGrO0rNIDOvhnWUVh89QBiKiTkELcx1hij5TUMSgHOOWeyVCR1LgOYhUHAe+uMM1kmaSZirRiH52jFGGNhxiuSiYSpmMDYKEjiJEhS5SVY1LrRSk3XAe768ABi/lNDip4+u1zlgerESteciNHzn4zotNS+FqVZKp7mOc5dB4/qspBWQ1raGFG8dW8JsHh78FEvgNR5kKvq6to1QQdXGnAnqRyRHmuQjDQ0fdhb6ouLqn6UWqdIvxkfiDCecQW2PxShdRziERFuWLqLJhNvA0B8m9P4zvfQbBMTZLFYoAy/v7+/v79/enoKzgcCbLiv7+7ubm1tdbvddrtdrdfD0aiWE5XeBJ4iUhGZikQiiYgRKYuMFUwsuR9dkDvXxfkmFotU7kjEd8cdQHx3vDUHYyCaM1CQix5EKM1hvQZ8o/UWuQdjKx0MBqenp0mSAKAcDAaX5Mq3EiAul8vr6+urq6tQ/UN27d2f6XT64sULuBtZa1dWVt55552NjQ1AriICFyBcNWqYMFxCnoB2dXDWmKShGgyYo1qtMvIGGMHyJltNJ5MJdFRhtYS0fzQaYfNj6zEow1CQgAsWzAOpUAkIGIEIum5xbqBiEURDsrq6utpqtXDOyFppAe/FlCizAygHKfKLL7748ssvnzx5cnBwAOnP6XSKEcUgm6Z5ZInifxkQe+iSfjR8DwMpbeaQiZyJnC176CVjQmvxuc5aYJYiEqRpGIZBuWw1p6NcttXqJIo+n05/1e/vGLPRapXL5bVS6f7f/M1/fP787OzMTiZBr5fNZu1KxVpbCYK1cnltdbVcqWRpatLUJsklTTjLFvN5fzAYDodJkliwyay14DoZE7fbs0oliWNIik4rFalWozBM0nQwGPQuLsaTCZ7F1ubmartdrVatMSNjQmOqIhVroyhq1eutVqtcKhlrxTlJEpemcZbFeZRymZAEgbNWokgDxFn+9JMkySaTbGUl7vUW02mcJOl0KosFLP5KxmRZBnwNn5Zl2cXFRb/f7/V6L1++TJJkfX39wYMH6+vrW1tbWAG4dACgYYuf9uCazWairJ8wOwAQUwUFKNt16RDny3g8BqKNR0mc4vT09NWrV7PZDNj65uYmDSoHg8H5+flgMMDvEgIGtRN5HUVLK5UKtMWBKSD9JszNrAODPAxD9P7/6Ec/+vDDD40x+/v7g8Hgl7/85VdffTWfz1utlsZ6mFh6Da1shH/jALHW7vR4iFqd1i2jtnmpDjUZtRKxXG2z1ZgL7hKmP87h7Ozs8PAQDQ31ej1JEqx+8CckxCbLFDDwUVjT4JXa6/UODw+dc++8886HH35YqVQuLi7w+VjDwQ/CYg7F6tlsdnh42Ov10AJC1hhXSGx8cLkBoo1Hj3MeDAaDwQBiynA9RYEty7K1tbVWqyUiz58/n06nlUoFAiwoBPb7fdQpCUOwzsHGfKq3Q7y41Wqtra1BBKPZbAZBMBgMvvnmm7//+7//9a9/fXJy8vTpU7ChsQWwLMccVTvhEOf1emA115XqByx9ab9KzYdi8vw9TOqcAhyRhwNO1VIAjUYDehq44cPhEBAkNxQ6+OG5oMKEkaNzeLJoKUSjXSKZ0nsyvp6OCuIfzhTWMDzEmcJWWEP4+XSzxEqC9lgsrahU4Z9Yi0ajEdZPnDMGCRjiGs8CmozwgLEHKdWiuLRcxvVFeeaTfNDaI54+XbwJnJVQ7xmPx6gasupzNfN3WOqcs1kWZRIaMc16sNJyURCXojgKZTwNNg6l1K6s7GeJMe9s2vWVoF4VY6+FDIpa21LgRRYBOI1+EiDWUrPFTmfPaVCrf6AboFyphLnf760AYtztqw/iugsUpXYiyyQ7OeQwSFh0J0ZZr9chDI0oEXNNlIgBVjbP+k+7KWJNZr2ZHm7GmMAuka1zOSKcOUd4/ttrxGjEHHcuQxUnb9g3YozhoiTOoYU/S5IoiXymradipOvBN+NNeonTlnF4UdP5vd/ViKRnBamXAhbIWV8kvM5eGX0muhBVLIHotoPrhEeWQnJLSw6yrKtM/hTkCHTnE0MaJghaCLHYcFaUJidNHgssiAWgPnDZJLNeFwg9NF/vmBogZpHGU6vgJkWnFraWlpbVmfQOrht6it6MS+WD/oSO64YrXabBnTo9Pd3b23vy5MmzZ8+Ojo7YLIhqcb1eR0py7969nZ2dtfX1+nz+cDotvalYOhOZiziROEeE5yJRjh3DrS7ORYrxfv6sf+vuuDvuAOK7420AiLVyFrLc5GpJTWdlGryQnO2F3Q65NA3cgRldXFx0Oh30h76F/Uo4JWzGxfARW87R0dHXX38NvdEgCNbX15l5Iu/a2NjY2dkB/wvIFIlO+AoIQTCSY1ri8Qs05l4qlcBI1akXfvH8/HxlZQXVUQq/QnEJn1OpVFZXV7vdLiJRJADIS+kpB33Yer1OEViE+9Q7rlQqaJFGJsloRkO0mtk3HA739/dfvHgBJO6rr776+uuvX7x4cXFxAWSQ8qwkZjKiYrMV43veDU/FUvM1tCTF7WkODNm/VRNTUqqQ9yI7LyqX8RTms9neixdfffnldDLZ2dlZXV39wYcfdtfW4sUiTdPexcXx0dF8NkPUCGARHevlctnkHC7wkcej0enJCaAEvEHzRxr1umhtAfycpvPZ7OzsDG3yeL1arVYrFQOlgiTBh0dRlKWpy7Jms8lqAcllCE9BxLVLbYWyLE0StmXlzjES5JRqTW/hKjGZTPr9/uHh4fn5+Wg06vV6tD1st9u4n2S3FSNUfibxBS0QKapbnDIUN6R5Rd9qTArQfuH3iI77MAwbjcbm5ma3261UKuj9bzabp6eno9FIC4lqBATPpdlsgn93cnIym816vR5kc6kGzvwEQwvllna7/c4770CX9tmzZy9fvvz8889RWML6QxBQ8weLvnBvfBX1OqapYaIzT0+OVq4qohZb77VVi1xVjNGYC0FhLHog8x4eHu7v729vb4MCjMeBxIycWagNIHnj0o1VDvIO2HcqlcrOzk6v1wOY2+v10BgB/XReJiRusfTh78ViAQImwB0ssPQco5oKLgGYI4nDUNTBGcKsdWNjY3NzM0kSGISinLa/v//pp58GQYAiSqfTGY1GaAXA1kODLF617mMlxa/Vaq2vr2Omv3jx4uuvv/7Vr37161//+tmzZ6jXws9N95kuBcs8gnCRqyjKUkljIt5D12NmKYvztdJCoxYBbzISzGJqjZuGpQagJ/RD2F7tde3w3DQ0TJST2AEcBXj/iy5PxBY1AU0K1HvtRoVdGDivp0UjufkelgV6z2K8IcQCIs8tlbRivVJp+V2KhFBtVt8N3RSv8SmCbrqcoGMn0vEIHXKcLNSB0+PiVlh7GFqYIDDlUlithLVaUK1IFMlsbl05iq1ttSV1cm/TbHekUl4+Woq4nhfseSWrYsVLX4tW7SAfsEixLFpg0VWiXCoFpZINAnP7EV+oo2jAtygrUcRDi6/znhCcQsmWj0avz9q7z1ttPCIt/7bWOidFUdelvib6vmVXw7zL9yzb3/NP0x8ciLJP5FRaetV6AF+3gRapuwS7Ncx33QrJUgp/F2PeGzY6XWLdxRNYW0pOL94Njzu8tHJ8Hcf8NhrWf4owYpHv7zVzsGBQjGR0AZt4LjI4zBQ+L7IBvFKT9hLn2qsljD3J4+ITJFrNBec7VUG8lpelC9pSdPWPknF/jyFXLPV5az4eDXxQB4PBxcUF0qXxeIwiH3Wch8MhNb5SkXaa7sRx6Q0CaUluuelErEgiEuX+dZIThyV3q5NcsDgRCRVYfHfcHXcA8d3xloCkuhytm1+Y43lZgRehcksGjQXZy2w2A4CyubnJlpm3Vo94qRzSYrE4PT199uzZxcUFKpC4P8CCGVu32+33338/iqKzs7OjoyOApB7HRPuPA4UkAATM3Sv2arcQb6cEmFWpVNCcjrwRPkXILaG/CcgADwVKFKAMs18JsDiTAZa4oUxnjKnX65VKhXwr70iSZDQa4YmDenlwcHBwcLBYLIbD4ZMnT7755pvz83O2smqdR/xM+IPSq/gZcTMVYJmBL31emu21tBHvutHuBVj6tutvAYCVpilg0JWVlcVi0Wg0gMCCeQ0eDVQLoigC/xREAKC0TO3YxAqAWHciUxtkKTiOp0yTLihQi3J/IujGYalFw3Ho3Oa6YNFDFjzokOemg2AwdkHiA8kCw4ZaEMyaihPNS+G0tF9RrtTjy9wQSuo1TasSU0IEZSHY4tVqNQCRfJQigqqG7q7VvEiM0larha4CzJelhsuc/qA6ok8QlNizs7Ner4dho9MMjxD0B4jpuVKRPkOkXlu6e927XtnGC+IpfahrCR4cSd4iwWKAcVDUgXQA5HTZaElRHYwugLaA0gj1on8Qa51zrlwur62tAVnb399H7Q3wHAAgXhoWQEi0U0Eeo2I2m/X7/TRN6RKD/B8d1rhpVOtGmRC9FCICwzqQRvv9PpQEATrv7+9vbW3Bm25zcxMFOYhL4MM5kbXFEJ1whsPhxcXFysrK5uYmmMuffvrp3/3d3/3yl798+fJlr9fDh2AEEgnyvAS0CIYGHTxaovZMKyrzUv2Dv+h9yPdLUBFhLP1Fqudr0lYURbxMjC4U4ajC4RmsceRjVuIqNBFMc0KpcqNVszQ3DZ/gCaYXtSY0RkzNbi0owQvh2uVZVEF9G4Ulcrc95iwhLU4TPhHWIzWDWC+2+nuJEV/Xvc6ljy1B/GqeWFFENb8h/AF6SyaKwmo1qtWiWjWsVGwYmiCyW1IKovLOZuiMWW3KzrpUSsvpDmyBKtokEnzxQHzuEcV4QEcsmshZVIv2lr5vyYBRFFzVRPpOLMQrpWjA9zr156Ug9VLgTMv0E+29jt2/xKLgqgiDgh2FFgbeDb85+nLXAOL6W3Q5amnDiraE1aUsTy3HY1Z+F0R/rXzHzZ0QRSlY3TpT7MW5TpqpyIJfqi/sIZs3FDyW+o3/LovzW4gOF0eaNw6LCjnFgeqphBU7YIofu3Rs3Abll6sqRkWo+vac36U2s9xfrlsZ/rSe71INYr0ceQI4SIq55cHZAmpU4B0nWeZukTbe9oCyhM21I0oiU5GYDyNHgTORKPemMyKRSCpSutOXuDvuAOK74y1Dh736Ntmsevtk9uK1GxcZdshIQfWCrj99rl4jSn47dqMsy4DjxHGMHl6oUoDrB1qiiJRKpW63O5vN4KUOyKNo8sCcgTKIRFq9ntwbAgKcAFAtaiYSgAZ3lVKGlUpFo5yNRoPICFNcfhH1T6Ejwba46+4PKEKAQs7Ozk5PT0GgBoGu1+tdXFxMJhOQlHE/2ezDAUPAjtkdNWqJG3qGXV6QpzGLW5amdWZYtDERxZ8igDWZTA4PD7/55htrbbfbhcvBvXv3jDFQJOj3+6QegOGF1m/A9NRtALVQS9+SmAZQlaIu2nPcWluv11dWVhDT9Hq94XDY7/er1SpAf8BqfCLk2+pvWRo+Fh8oLGuY3mv7HS2jiQnO6v1gMOj1eqiaUDKYyDhGuO79JJSGDmg+ZW13yaICXseg1QLENKDTUAVTejLWdWRvrYVuKRRpNzY22u02QFuOq3K5TOUyyLYApiT3H1AmPaDG4zHuBmBiDwYFXl+v1x8+fLi9vb2xsQEg78WLF7/97W+fPHnS7/dpEqWTSe2CxQny+0OHNfYhV7mEXuK0NI2RAqPNqzgW6YdyVSeUeB/Ytefn51h1WTLRpjEkduEriAmCLopVDnQS8Ey73W6pVDo/P+/3+6yQ4eng9CjR3u/3MXcgaaIfIhuxodWgRQalQO7DUMEvYv5ubm5CWwZjqVarAbxDG36r1VpdXSX2zWeNK2UDsvbwRKEI34JfnE6nT548+fWvf/3VV18NBgNsT54sww3lASlohnjwrrfpM2CgzoCXistVwtr3YQ9d1ZT0YBSNEeOguj1zQjxNsr2KOIL2UWANj2xcXhSln4Em67ngPXQ8YizC17lj6QKwdrNkqxA8xNijw2GAxXA0GuHNbH7ymtB12YZFOF3ypyvvUuTRk1CnjWEReuDXFeUa9NqrH+I1UaihsVsUlcOwHIQlY0NnJAhsqxnV62VnAmulVJJaRaLw2rCEGLEHimmgv4jaS268oWe0ltfQBnR6SMsygtu3dcQgMLenD78hdOz20Kf3X7f5/GUC9E5x5L4bwCruKUWMcilavfTnpf/7uwsjFEX2i8vgd5IPln7UDZjv0jX5Orx+qe6td/c83f/rxGr/T3VcJ9rrbWqaO8/m2qUg/g0TTStafOfs0Al4MRn8XQbzdwb/f2DM4bXO5DtLMqxyaZ9YBgCiFPkRt2OLn06nk/G4hK6XN3VtU6T0Ion6JzG2SL2SitRFYpFF/uIk/6274+64A4jvjrcEIPbwiGKblbcjeiw/KXgoo4InItPpdDQaDQYDEHlA6fqTCCBIhR6Px1EUdbtdLZmK3QXbjNY2AhQIjz46DABvJZSGw5ObQMZC82ivg5UVYH4mkl6AKVf69XIyHVBgAMRArwCN0bGnCNYToQMYR/bc0vsD+nCv14O84HA4RP8+IMJ+vw+dDdLGmfd6Q0XrcGk/kGL6fXMuRLue24dKhM7Zzk/HA+rASi7F2Ov1vvrqK8g47OzsPHz4cGdn56//+q+Pjo7+8R//cX9//+DgAA8Oli8iAkrg1tYWdD85VMDvxlMDLAVWWr1eJ+sWpDDYvgPhQjLf7Xan0+nz589ns9nx8XGSJM1mc3NzEwRYvBmO5LztkALHGNAid0VGGCBOoPyaC7bU2ISQJWTHAVgD/4JQACoQ7NX17LnZmorePQwAjGovTMff8JeANje/GjKRuluw6LTJGL1SqUDWE6cHm8dOpwNBWFwaaiqdTodAM6A3TwEGcwqt/d1ud7FYrK2tRVH06tUrkPoxf4HcDYdD59zm5ubf/M3fPHz4EKvE8fHxr371q7/7u7+DhSMunOuD5PQuT7KTvfy/p5SpCOSR+Vvs7v+2y1e5n+lf12C9Z+MjywRqKcY6m83Qh3F8fIw+aK1ljHuCqSE5MRzQLZ7LdDo9Pz+HSgPFdrFGzWYzLMigABNopsBFtVrF9CE1GLCglr+gUxzKA6wceJsmhU3Oz88x6XZ3d1dXVwExs604juNarYZhxtLjYrHQBHzcZEKB5HXiDqyurq6urkJd4euvv/7000+fPn06HA71Nq3t0TyUn3NcNy7oWS+5arnXPSAF+0RuT1657mZw8DtGpohTK1XxYzVbE4AszccoTVNUhCgCSXp4E2HUqLRXMly6oZCSWezVWEp7ZBGLNVqsnxicFHr2nJTgCKpRTk3llmUsQu2phfvj8cGLGftSnPQ6sFtfu5ax9vTTZZk6an7boSuAYCC0NhJTzqQkmRhjqpWgUomiKDDGiBEjcsNQIkxPvQu5SvvVZIXrKJlyVd9clKqVXHUk0/e8qL9xqah7u5HvnJPXnCNFde8bHKuK0P9txMHVrdO4lRNJnSQiSZYFgTWSOecS51LmEH+YWF0HjV41IrtqW3cD0nqdPu9S97+lgeh1BFKvtuo9i++8S560yHVehbpucV2Wt/TuLWXOvoVigK8LPnqVm6JmNzsUi6Ud7OyoIjM0pZa9KAEKLDJLBW10VFP8IrlGUZoUIq04zAzld8nxbyiu/FGe0dKlqXjCOreVZfowiAaRs4zHY1BVoCOHDEvvtgjb4jiGJt48jlfS9OPxeOVNLVZWpCwyE8lEKiKLnDUMDzpoEFdEYpFUZHrVue4OHb477gDiu+NtO7SgsI4wAJbpxZrcEFHqvaKobUiuKJ8nIoeHhy9evBgMBu12e3NzE5DlW34kSXJycrK3twejuW63u7KyMpvNQP/s9/snJyfoNQbcANXL3d3dzc3NVqsVRdHLly8hEAzMAiAUWn3h1QY4AOk6Agjmt/Tp4o0FbxSGXUhC0CUNahviQqbBoAA3m01o4OrWSG2qcEPADYBYSzR6xYMsy3q93qtXr2BABwHifr8PDWIgpIPBACA1uJna2UkLDtCvTBQLiQOJ96FYjcBH6ZCrGIHdJqHSynSUykXwR1oosNrRaHR4eLi5uQn21tra2l/91V+dn5+/fPkSI3xjY4NuhL1eL8uy8/Pzw8ND1EXA4N7Z2dnZ2Wm321p6EgForVbTah7k0pKx2Gw2NzY2ZrNZrVbb29sDRgzp25WVFVoMAdqG5AiJyZqWq22FKGhA6hz4jMBeKc/t6VSST4HzpHccKG/4IlZTSD3TfDQqtSFoIwLOScFxjkFbq9XgxMUKE64UQCGgWH4acBb9LeVyGZ6N8G2XXDxBC4ITJQTnnWRV7VOkgQ+MkJWVFXwvaOMYLbxMtLk1m80HDx788Ic/3N3dDcNwOBw+ffp0b28PEml4XlQfxmTB5XBIXwdIvakcW3++/qeXO/HmcxJpZEpDjbqaqD+NRDz2+/P+Y6HLsgyKw4eHh6enp61Wi3oggFNxVyFszdYEoF2wuDw7OxsOhxAPKZfLs9ns5OQEfnHQdWk0GsPhEEI9AJf7/T7MTKge4CkMgJWMEQJWslbs5SVoDRMM5kqlMp/Pz87OJFcHarVa+C+cLcSIsFDj10mox2CGwSPUjYBNa+e0arW6sbGBQXhycvJP//RPn376KZTK2YqhQXm9HWgZGf3IpKAgoZ3ctLaMLirgf/XvFttyfx/AkE4ptWj4UpL7DQVyr9RdxHd0w8pSMZmbT7LII1uKUhV7xrkOENfT7lXX4UE8YV2wuY7G+J28geuu7oYegu/8isJq5kScMWIApxprxIiIE2uMBNYEgQlsLop/u4qXXENWXfrslnrQFXE03UlzHZ54hV/8e3CFuk734OZr12oDiHJjdSwFubjds4PB2tDaJPeQW7hslrmJc2nmTOYil0VZuoD5HIbnDZPiOiLnDVe9FCQtql4wtiGKx41Ja4gvhag8lsx1+hLXAYJF2N2TZ2Hg6i0j3BmLiiIeXd2bocUR6012negVndyWFhKW4qpvP2Rc7GLhyXvJgi4eFMXrsOGCQ4DRAtN1hPecO9yRaRJeLInpllxvxfM4EHS2ZHjA3GepAsbto8G36sFdx+6/rpPg5rUCsR/yzTiOR6MRfI96vR5Ca9xSbbwJVx7AFKfn5ytJMhyNaHXwOy/NInEuMZHk+C9UiTP1TxGJROJcXCLL31y+7QZ3d9wddwDx3fGHWK+91EinvrSkW7onkXfJFR+cu9FohG11sVi8evUKeGW32zXGwBrobQ41wOE6Ojr6zW9+E8fxu+++++jRoyiKDg4O9vf3UZ+cTCZAAwE8IcMHN7DVarXb7aOjo7OzM5J0KPKAWxTHMTYtOokjLGB8Q8wLsQu4b/CXIxZcq9X4gCQ3QEPVFCzIdrutW5Lleh5BcTzwGRHpI26IgBtescfHx9CUgBXSwcHB3t4eup7jOIYgADl3oEZ6BWGAgzqyLwrgLqXGaE6iDtBfa+RrkiYfvf5kSlICOsTlAOhvNBofffTRdDr96U9/+l/+y38BeRaBXZZlCFnOz8+Hw2G73e52u9VqtVqtdrvd7e1tAMQApxBoAv0HHEz6G+BRDQdgpAG+PDw8xMCYzWYwQAPfQc9KnVoQ1tQZBWE+Dz5YLBbj8TjLMugssy1XF/CJnbXb7a2trfF4DGAadl6e4CkuTXKlTgpHQG6Vxs2YESR1IkYHtXNlZQUXzicIMROMQLAp0akAZQBRllAA4ygADbdJ6MySTQ+4EDOUllaA3TWUj3524O94HLiK1dXVRqMhuWIMWt3xc7fbffz4cafTQXms1+t9+eWXJycnlOfmwKO4irYJLUJstwRfXgtu8AjCunZY1MjT8J/2CCqqHBaRC5YEiFZoA6soimazGaB81BuwzNZqNVBFMAHTNK3X61tbW4B9J5MJngJIu1iCABCDCwxVFky3KIogM0KSOBRyptNpq9V6/Pjx5uYmVmNSOHEa7IGgCAyTf/aI4MVqtYohcf/+/U6nA1LzxcWFc251dbXVaiFLCcNwc3Nze3sbtnVIcjARcGdarRaKjtbaS85LzmvGnaep7Hg8fvny5W9+8xvUNXV6qVMpUUIThH6Ip7AGwGWBmw7uKqctoNji8qJXKo/DxarAdVDUbZBWjwxYEEK9FvUrzqalO0JxwN+cbN8Ar1yH392QM0tBxYUov6ccrenqdMEq4lyirNWWwhM3F42KDrFFfczXkshcimdd59eEDzUiRkyWGZfJzfxa3pAimfQqtq4sAAEAAElEQVQ6VGgp4XfpvZKCtI7Xby4FEzyjXNXeIP7lPV+PuL0UP6JCtKZPQsME+zXFTJYOeM1qjKIwSQJjxLk0TeZpMokXoTULa6wLS3Ecxck8SWIshNY6zUb4TqR1qfPbdRNt6dPXzUNsUWLRjkg3/S2l0D3ARayojqKljZfOaJbbtbyVrsHz67T3I4nn2oT5uqu+uaoh13BmSYDQXVzFSygqzNyk+PG2sp2uU81eqkrMSaTfRhEqtN8RIKYJDfveaMKJRdgbgUvbOOSqBA2FLLQCIXKN75QaX3rJv4+M+M2izNftqjfP8aUbDUJ62MMgZ+n3++hlhE2LNnrBQYXiyWQSnJ+3kmQ6mcgbZBDHIoGIycWI7VVqsFXSw5Lb2dnbKPTcHXfHHUB8d/wxiq5eERv/RZDCE5FkquAV4fEGAF7EkgaDwdnZGQLQRqOxu7sLGOVtPpBvn52dQTuy3W6/ePHiP//n//z5558DBwRZEsRJwEkQKoVKwL1799bX1/v9PuEM/JbkMsSoatZqNRDHtLCA5F5kDDtAqQP9FgAZg0u25AMjIOIMnpqHpt0+GqDqBfdUmPW9evUKEAZs+i4uLgaDAVRrj4+P9/b29vf3T09P0STbaDQAqYDjyZiVCKwHRvCidNwjy/rm9EXR0U5T12855j1JCk+rkYw5Ep8RMoLiSkwTxF5EiiIC3H82myGUxBMEboUnDne7er2Ou0qAicGiXFWDpUqDRq6bzebKysrFxcVwOARHFV/ttaUvzbJwLbppYCnVjlIb5G9qh0l8DgUxK5UKLgqN7XgKnpt5MYvDfQZCCjyLYTH5uYCGqQmgL017zTNeF2XopEcIb46ILP7/7P3rk1xnmSWOvnvvvN8zK6tKVbpbtoWwDRJgYGgYi46hpzuipxv+goa/oM1fYPj+i4D+fuLAt4mZEzGYMz0TMx09jWgYGgaMZWP5IltSqXSpS1be77e9z4dVufzU8+4slWSZlufkGw5HKStrX9/bs571rDUatVotjCNAdQzMZOWgDNgk5oUrpOAMnwlOIQE4BofJZBKFBfgmNFjAZsUlSclUXkaon49kgH5My4HiHipDGwVYh15MqMGOOSjdqMBEzn4yUYShB3I9lXnk12y/KUnaklEE8y5MVmEA4rBIfQ2HQ5Qo5vN5jFnM1ZyaWOAvNaaR95LjDt8BqA1bQiwEyGSg/AJK36VS6dixY5lMJpVK0XGUhKPJZBKNRguFAlZMXDMGOzjymFdxbaDPYNGR/Ue+OAlAyIAZvY6pFA4i6phjSaLZi8S/ZNG9tMG0xYgfIY4N5gCs8jhS95bFDbRis/UcTRhNSX3THnH09SL+GGqr4FstFA6TE77Cm2QxLAjyfKR8R+ge6A9UgrJhEbnIqtuX9ztPGVbpTcuz2y6a80rybQEHE+ZyKT0AOVdTdNsxxnFd33cD33FcDbio8jWy+JXEhDnoWWpmNToS0uVqKNFqKkvIrW+oGAUfuDdr+PnRwJVQeNpGi2ShjAIE5Ze5y6IADp4AbEIwHSnJZv4A5aVkMplMJmDsaYwznQbDkd/rT2MxpCi8aHTquONEcjwa4RVMZjxdLZJwdMqwCXP6UqC8RL2Ze2Zn4MSFWRo5fiUOzlldDVuVfJLEgnlLMGWXpqIpbSV8AYGDkvQ5PPk0D6cLtVy2JwRFCzhcisROSPAEJgicJ1LFOJT7rwTrOI+ZgyU1MgDBXhR9nqIE2ANTQRH7t5FoAB+5GEll+dDr5IxHLgJLPEMZ7qFqMA9cW+2EpYywVEJ0XjzoPL4yiEPoz/NM9g7JROJ19Pv9Xq+H/Vu/35cmpVJORM7q4Gn5/X4wU3V7PC1mjG/M1JjpDA5OGNMRX4A3HaSHzUyDIjr7ebSAiRdtARAv2hOZejWW8YiM51WspfyFuPoSXpFGPdBm7XQ6khn3JDfcBZCpeDzeaDQ++OCDa9eudTqdaDQKsynsJKB/hH02i5Gz2SytrkC8QvU0sDCZKKZMh0qKmplpGIJzoK74XO5QJURCqgKu+dGWc1nEytgYGEqlUkGeFmgFaHpg2PX7/UajAdiLTl9AMdBkOT/95WWpna1yKMGp0Mojql5y24Ft9wNvkJs2aQsm9xzcOVFPFo/UGNNqtba2tmq1GpjjYLnGYjEUqhcKBfwznU53u12cJZ1OLy0tlUql5eXlbDZrjIHKAYktTAyQrkhJEMD0rANlGgAOWr1eD0eTcpmKj0CEi6xe7HQpRixnAFAnRqMRycuIsmTkIyMQYsTgRycSCXKuGZwrUym5L8cfEteeFbG63FsjiULVbBmxTCaTdrtNlBxIIr7MyQpPDyjDYDBot9udTqfT6fT7feDasige+3VwP3EZRMlJ7+U3Ad8A+JMCc7LHSoZ1sVikGk+1Wr1//z6ESiQirDAjM5+78ShmX4eOCGoRqJp0iS1KpVGZUbADsNBqQZl74AJB6WfZu0Ba7/f777zzTjQafeGFF0DAhxtksVjE26nX64lEghE4MiUUCkT2DjzuIAgKhcLx48eDIGi1Wtvb25VKBVMrXVVx9uFwuLW1ZYwplUpQHzYzxQ/IHMs8H6ZB9A3qyCPnsbS0tLq6urS0lEwm9/b2dnZ22u22MQZlH5hI+bXV1VWkDTD6gBpQY4TPnBQ/EthHoxEo9qPR6P79+zdv3tzb2zMzgWxmgzh20LtwzUxIYH6Lx+McNQTd2BWRCAGJm9CzhOMlZEwgRuZIpEveQ3VdFb3b1TCSoQw4W44gzgMquWW7wmJFHg6HKjiXXF3OElzRzMEqFsmVRgjKSUNCBjT5VCZ10j+A55IAMXdlWA7gRyqRSjWo0aOoTSFTKTJgDsUR5AOXOgPcb8jbl4kZu9BePSUpcsWeGZs1rG74+cOH7HmO6waOS7QRCxOwP8qekNzHooTQNQ7lTUjiYjKRSxI/UXtddgxZGG4DxPQHRlIzGo36nmeO6M9M3vTBagxVuGMOSqlKdweFQPGaWS0B9ASUAgidwUIAa5kN1uDVgP2QyaRTqfhw2A8CZzTyOp1Eo56djPORSNSLeLF4ZDJJxGJePj9JpUbTadT3XawVZj67X9Fm59mf2vtA2VEVWZg7BPAEqWLPVLHKkEkughG1aPY8ECq5JhO33IhyG0YTF2kkgPkB2zlKt6sUTqinXCjn93BxW4Uacyq2u66dFftk6RHLHmVLfMjXzZyoDFop3CTzVdySSSdtikFhtmHtJnfpMqaWEhPsV3RPBeOE+hIs+lQLpVLDULOB0gRTjkGqqEKK6cuiQLs6RFX/hBLCHgEgtre1h1eiyEBPHQqjHoQqNcwZL9P0lVRixD7Uj/YfY7YDdnO4iaQxA2M6xiSMCYzxjOnPZIhhWDcwxjEmMRMjdoxJGeOaRVu0BUC8aE/Qsio3GcoeLTQ3q+hacu1UnmlAEhGAwdYMlMAnds+BK4/H46VSCcsM9GcBAWA553KFu0O4PhgMmGRW6LlNNpHPXJaIMqA1M/V90JkBc8gwxpbilaU0HxEZh6cTN0PgU4NmQpOoTqfTbrfBIAb0D7wPgTrIwqClyM03txpkQs3TDj6KU7Cykjsis1JuUBAmKU9z1fmBPPq+X6/XO51OIpFYX18/c+YMvryysrK6unr79u3t7W3P82AZB7Iw7rdcLp88eXJ5eblUKgE4xjPkjhDnarVaDG+MMfgV41U6cWEHCYc0iloAGAW4kEgkMrOG1zEcDjudDhGubDZL6WeJARljoAZDoLbdbqPjYe8F4JhdFK8P/4RPYzabxVOyd6Uy4OReEx0GFy9rMzkccEfoUXxHmFWazebW1tbGxkatVkNaIpvNZrNZMDskQIbuChmBVqsFVIWgs/Sdy+VyEIIAxQAdHj0cMxuQNaZhjCibwOPlw+TZITy9urqKQV2tVt95553r16+DxQw4G7iGAiZkMYdiTs0TGfwoYZXNYZRDjwkeJSBwSIBqM+A4rJStExMhuAwUZHS73bfeeisajZ4+fRp6Po7jNJtNGrJ1u929vT08VQpWJJPJ5eXlXC4HwRZECJ7nnThx4plnnolEIpVK5be//e39+/ehw0BBGFZpACIEmMtbpqQ1IyvGGPJz5saWl5fPnj2bz+cBc9+5cycIgnw+D1WTXq9HFAnJA0y5rCqlpyWEHcBUgtthMpkEWRigdjabLRQKe3t777zzzttvv723txeJRChPb2YEf6VTT0EJEpe4iEjKG4XjMQem02l0dc7qnCRlX2X0a/sWPqwKEEItbiQUZKlqwwkEq68xMuQuRXVLfCEimhyDEvQETQzztsRZVN/mVCahZCXQjAlKesxS8ggiNoQMFKrOlIb0EbUXL8wtkFjBmJLWkYpEbCzqvZzEJELKJhFeLh+2+qp8C3xfcpdCHBPDASl5pOg4J9hgIsWCwA9lb8TuhTAN1yA5hQJzx9DA7MFLku9OMcq5EKvv2JMnVUSxNEcjkcmRN2Su4+CBGsvhMFRJwFZCkNtIWcPO4gkmh9D3EolEr9fj4hW6OuxX3CcSyVQiHo9Eo+5o7I5GyVaz6Djrvd5yxI07ESeRdKdTJ5GIDAZmMh7504jvu77vOo7HnTWXFfYoYzGCZRY5lBcvd9H0vMXd0TGM4JFEjowodJAnIqoruwoxRJUoChU+VvIR3P9I4R01DRLXtqVmbbGIeWzfUFEUVdwpP1QlIKH04QeqpX9SgllltK7UFNXrCBU84YtTaRiJs3POka9e8qtULs0cNFalKwyWHvzMid3Wc1dSPLwG/t8I2RmVQFJLsGIrcz+gpOSY7pWot3lUWWqb9GMsHaSjh+pyi8Lrh8ocJOBkT+BUT+6Icd2YMZ77mEDZmDGojg5mwhGewIsdY7zZr8zMvM7MvobP2ws4atEWAPGiPXl5V5VXxM/IhSoKg1TjIhFJYgqMH6jV4Hles9mEm1YQBGtraxJeeaIaFtRsNvvss88mEol8Pl+tVjc2NhqNBm4N2yySN8FJxGJcLBaXlpYAeGHpBfcqGo2CaCbT+NjXytCRfMx0Og3EsFarDQaDer3e6/WSyWSpVPI8b2lpCY5b3N8wxKLfnXQtt7HRQ24cjnPVahVK/9CTnUwmnU4Hhdhg3vV6PXwHn4DcRwYcHhHqfST8bYTIBlnPagOkkhAyNlY4O4KBB3rp2E+AG3rG3kBPGIETppEJD1RwQ1x4fX39L//yL3Gn58+f/8xnPvPWW2/t7u7ida+trWUyGY6dXC4H6WGIUTQaDbBHkSkBw6vf729tbRG7BMgLq0BueqjjDPggk8mAwJ7JZKLRaD6fz2az4E4uLS2Vy2XofU8mk0ajsbe31+v1EATC4wv8JgxD5tiRF8E4zWQytVoNResAQCFvTcIvoQSAULlcDqgW5FzlnlsKJshOAg8uuPNJVrLUHpFkKL6UwWBQq9Xu3Llz48aNSqUCp698Pg+4bTweQyKA22jMQriXSCQCnik1ajGUQPVdXl6ORqO4XwBhBH/x8BH2p1IpQNtU6G42m7AvA+ObBpVra2tPP/10uVzGs9re3v7DH/5w48aNfr+P/sDwA9+XyAslR6T06sfkDh/K7GBMogRDOQ2GjtlQEoqajpRRj6Rx4Yder7e7u7u9vd1oNMC1ZCpCwkASB4HkSy6XwySM1QfZhaWlpRMnTmAqzufz+CuMsuFwWK/XAcWiG3D4y/yBpAKpIEdNX8BSi8ViNpsFsNtoNIDbovOvrKygj0EGlEp5nO74ujG1YsxCpwg5Szy3SCRSLBYB8WxtbVUqFVTCGmMAH0vJBQqCqzJVKWUjo2XCLmRUkRbHqMwmZwGfNUIYwcyXvDxS3uJgnG8L49piBSrIl2kn+WwlIdd2kOfML0Nu8r+QHqC8gxHa/RwvkUgEWR/JEJRQNU4nrxMMYmKjYBnL4U8eKF4Nf7bp1dREQj+hMPohDGIloKkE6+UoU5CWcjaWFdaSgMwRJAEICruzWovEW5s2y3UfEHm32yVALK3J+HAkpsN5BpVA3C+ZsMp02Qn5NiWSwjlQiWzwXvh/z/OCIwu2OjOA2DFGLpqhV6hIrGrgKDc2xbk2M5YrLIVZThF6VZg2E8lEKhlPJb121B2NvNEw1TbHxpNzsegJ10mYiJvMTIw7yOV6g+F0Mhn5vhfsA8QH4CQbxJTObLaShkLrzMGaJApwUS+IYwGfsxtwwbJ9ruS2kBCqwkZVJQH3zLZC8TyRGXUjZK1KkXF54/MEag5kFCwRbQWsy6yMEkhRi3Iovzv8dcysF5/kZldChIpQ2do4ynsWf8tJRua3uAvCyJJqVPLt2JVYTLPJLJT0DyfQrF49RqLSo0NHkjMhKxFlVaLML/JGZLaPTukkNUtFNdlt1PL6aC9IbWsPSULMY7JLf2NsPOjyl0qlsBtXRSR8jPuHct34wUKBjwCjGJMwJmZMYExkpiCheM/woLMFLbyZW93CoW7RFgDxoj1peKjawCkYjuKDMpgkbSdU5M7M5IGgVGuMicVitVptNBrVarVTp06hNhYw1n42L2yb8sffVXQ6HfhHPfPMM6Br3bp16/bt2/CdQ6IYgBEwCITQy8vL8CM6duzYM888c+zYMVCE8AARyQCKAqg0GAzw6Jg6ZtwFwheM8jY2NkC77vV6iUSiWCx6nre3t7e6ugqhTMABjGlp2AXVC2wmaLMguTZSBwBviiRTPIFKpdJoNKBoSdcyEDDBd2s0GtAgZmgNbg6wCUq/EZ5AjCpFZkO7nKpeDy33M5YyLHcMR+nwRvCeFD8ItDtu/REMQEkZvlKDwWBnZ+e99967ffv2mTNnPM87e/bsSy+99N577/3Lv/zL9vY2NEZWVlaWlpbwJ51OB8y+6XQKTzaW0qOTDIfDVqu1sbHR7XZBgyUYisJPyErAhm4ymUDogx5ukC/IZrPAlIvFYj6fh3oaLqBWq1WrVYSCQJqm02kmk0mn08Cq2B+wAQVsjTx8LpcDO77ZbHY6HRXd0Q8dysiYEAqFAohUpB7IlwV9ap4UHYZEeNZ/ES+WEAYeCLp3q9WaTqcAxGGO1+12KZYqLR+xCQYwh00wBg4q0fB/cJnBOUXAPBgMut0u+gPeHd4jDO7y+fzKykqpVAJVc2tr6+7du81mEz0Qe9NMJnPs2LFLly698MILhUIBKmkbGxu3b98GgE45DgYb7HW2vKkELGxG1WOJptSmn7GQRIolt5QUYBsaVhemtIZVpgePQqYVGSDlcrnr16+j5/d6vSAIAOsg3yaNlaD/PhqN4AUHaKzb7bbbbUxTuNqdnZ179+4Bw8X0mM/nL168CBk7gLb5fD6XyxljYIGILCBmQprCoZshd0LvNURu8DpHBjEej1+8eHF9fR2HajQaSOrUajV8As57sVjEKCDOiBmg1+ttbGyAr4ornE6nS0tLFy5cAI06nU6jtGV9ff3UqVM3b97c3t6mXrlUfML7QuaSwjV4p0w7qRywBHwxB5J9g8+ZoiMMLUEZvmtKbD8cE+3gPkSVdcuiaWVuNq+SXeLgthAzvoOVlGkzPBaZmiJOTR0eAp2YSXguoMPkcRMaMMKaFQUZUq0SXYsZMloIEiDG6ybGzYIeKX9JFWz0SWxUIF1ia8KoJVUCxLInSBRDMoiNEGUiS1FpnqqtjgR/+dyADkdnLbSr4PaHwyHc1TCjclfDl0thK5Z0yOs0M4lY6SHGbJDsZjYyrsRkpSgzn6fUl9hPSxw5q4fzOUHgzJwwFVongXiFmar0gNKYZr6HyUs8NBbAASMO5ajOPLsS6XQylYrEYo7pRYfj7HB8vDM87zrnTJA0ESczHMQSe8X21mBQHY4Go9HUcQNvSlcmrXwdWqoSCthJLVeFDjNCkbRxpqXluoM3yJ22XVmvIFelpMfRQcYDifP2vlSlsuyVkbieUu6yAXGpwKb2t2rGs4nt5mCFhLprE2YXqfIi2jdydnGfuDg31DX08FGpRIQDi9Sv0mChB5ynnDAvHcVJTGrry25sBA1WZhaZtZWpIALEHBSSE6O6BGVnuOgc4k36EZ3rZH+WOu8fZeOqUneKBx26kfYcx/V947pQ1n4MGPH+3CE+cY2ZzmzoXOFKN50Rh0k39s2iLdoCIF60J2vh5PaaE7faPCkr2Hlq8XJ7hEhbCvaD1rq5uTmdTvf29kDOPXXq1IkTJwqFAvTgJCTxr/U0BoNBq9UC4JVMJoGTQmC32WzCZZ4FrYCTBoMBEKJMJlMqld599921tbXl5WXQGOUeIhaLFQoFLLo4FMvzpRYenkC3293d3W21Ws1mE/zcTqdjjNnd3a1Wq+VyGRqXAAcRBAI6xEukyh7iSYRV1OMHKIMtdRAEIMZC4B9PgD6weKf9fh+PAiAFSG2gWLIsFx/iT2TMxkwv8+2MwRQCFVpWae8AjCXZZh6SWRmqrmhmFE55QLl/isVigD/a7fbu7u7JkyeRsl5fXz99+vRvf/tb+OeCphqPx9vtdrfb7XQ69XodkCviRlxDIpGgARQQ2H6/D9Yw90x4mCDtAvQEIEUSEL6Jslz02EKhAMyU0Ntg1nq9HrDLVCqFIy8tLUmlBensROwVGgvEI1SpL6MpENZGoxGZU9JATM4elHUD93Y8HiuchQAKi+LZSXAx6MmxWAwsaUBvuDaw3UlhBmUsm80Wi0Uwl6GoyEdH/QroogBDB0aMoUQlUNhF7u7uIq4m92c0GiFZQtom/7BYLJ44cQLpolqtBogZnFAqjJO7YYR1mzlIdZeMIe6k7ej0MdAgLAqSqug3QttORtEKtrML+TnupGO7mUlvS1MRum6ORqNMJgPrS7BxkRKAVxunGp4C7xFvB1/G/yeTyf3797e3twGzNptN4n3AcNfW1vBXSAlks1nQ4bGKKawcLw5Dqd/vUzGWQiXwcarX6yCJnzhxYmVlpV6v3717t1KpMN+Dbnz//v1jx46l02kuKKxmwMwAJ7pkMomxjykXSUocLZVKra+vQ0D56tWrtVqN7wVIMWYMMqyRlIKCLdVpJVKjKFehSqCcf4ywbpPdYJ5w/ENFWxj5BJWYRrLzgkSRlOuORIclgiNzTpRsonwEXyiTiMSh2G2wycHkSW4Xo1M0lh5zT4WwnBOdzNcCksbsBxBKwbhkQEsBTXZIIwpipM6pRI1txOdw8pQiGEoESnUMiabZMgKUgKTCMkcThe+BDkscNnSnihEBgJhFHrJeSpGIFejJ7ZDdmW0DVeLaNlf9AMogiLpYTSQKaYzxjXGPCBC77r4G8RHQrnnyXDbpldOsYppLEQZJxLZXhGg0mkjEk8k4cG/X8/wgPpnmjF92nGXjx4Ooa4aD7nDSH9WHw+loOBgOJ8a4rhcx5kNJVilUYpckKh66rRJjL0PEv6Traah2qtS5lmzN0C2lmfmOKg0WUgow1mT+RkHbh6CQ6lBSyMImQKj10VaCUhkLpXzCRye7pS2eriZqeZwH+pg9afGsElN+YDo8NHBQCKbSl1D4IwMcVeai9G3Uc5Y6MIoJYZNmZCSiepetL2z/bNPYjVXkoTjyXGTlYsS++hFVR+y7M0fjIyvDbQkxq+lFocP2i+bpH1vnGxnjGxMYM5h94s1M6hLGDGe0YjjX9YxJGDM2ZmJM/KB48aIt2gIgXrQnoclpFGubrB/EFpkBGHeQoBWoJY10Qu5+EBtwJRgOh81mE9qmKPWlxwiUJZWt9r9KA4WHJBdIkQIOAIlMusyzNRqNdruN8OC9995bWVk5c+ZMoVDAcSAmAJ8f2tEgbgeBC2WPcvcAnAvANA6OSnk86p2dneXl5ZWVFejM5nK5VCoFYVYKrgGO5BoPwpo0HJNJZrCDUe8s1dywBuPId+/ehSgt+aGwLcIpWPcqTWmwfZeIg4zZpHeH3Jqo/ZPqqORcIE6WAfBH36mofQ83HORkgRc2nU673S7PCxovYETpZEUAkXQn3/cBRBphN4QgDQOHUbSUEFHWE/ZuCdeGN46sAPesrDXDgwLGNBgMqFBphD6dNIPCxVBtE6RawFWSUyMDPxkYyw9Vdack47AWmK+V8sFGaMvKDBZuCjgaMitIPkEhVFLUWVgK/BrSlmB4ydJLCsLgZQFMp9kI74JfwHjpdDpQZQWjWbHVEonE0tLSsWPHlpaWoCLSbrch2QEcmeg/97K2ZaICiBV94/GSa5QusG1Jp9hqqlZ9npK4osZImFgqNnCuYNk+Rg3UdZgLIcccnQSZGOpoIzuSz+cB4GKEYtZtNpv1eh2dGUgr5tIgCCDVgvkZx4f8CEtniHABbkbGpd1uI4UGbFcqFUA4YjqdgkoM+WmMNQyoZDKJ5B8o0tArB8KLxANmGMwJnBAmkwmr7/f29nZ3d2u1GgRtgDmiu6bT6UQiAeAMIwuWjCDOg4uNvgchY8AcWPSx9jE+lEKuLDNCTot049BKXsLNj6AsoWdmMY3Y+hhGUCnNrILEpsXZsLVcSpgUJ16ZSCQoSIokAXKfZlZxxbpdAi6Uk5IADZd4KnHJiyT+KIlgOCYBcVtwWYoe8OyUAcH6S7NEe0JWKJKyQ5ALtxQtNYKfOI+mLWulbTCL4Cx9mSS5GLCdbein0GFMzv1ZwyytZh618EmvVMV7UAkDZanHZYWPVy3BEsGXchMSAAWn3j+6NT1fdxg/zmZjhI4ahUJKC1xFQaW3m1TvtY+5LzGRSCQTiUQ8FotGPdczbiTwY8ZNBE7MmKjjmIkbG5no2HeG48lgOBwMxkHgOm6E0aVMEshOrnqLcrrmHkzmIWSvUMidLD8CJ4OLOLqZFH6dl8GSPEQp9irNluliamuqPJCjyv2P0qyQ744AsRQcMActNNT2dR5AjNQjMvfcW5qDjs22adiTEI497E5GvQgzR9DZzq+oykW6n+ET7Jm5sae7OFZeTE3MYCHIQiJKRhByJqQGMbPashZBvVlpdkdyD1dYSZ9nn6GyimQiy2VaJfKNEMQwgtKOyRxkJmkWzYnu0WSIVUnEEdPJapvBzQlWEFw/gyDmbimeaS9JzozU+9haypi+MZ4xnjEDYybGdIwxxvTk4Dema4yZ/d8IdHhhUrdoC4B40Z4ogJgaWMqSTq4TlIslJCQJO1J+SzrXsa6QcRqKxAn9VKvVTCYD5iO/+YQ06daCVZ8kI+y0ZCiFuAU7A6idGmNQ+4+aZTiDTSaTdDoNVEuyjWyIE7E6uZ8AO1jc2ul0gFbg0fX7/VQqNZ1OAeAC1Ein04DMwNNst9sAiBkpEQEh4AXKsC1ECF0CqKxi6wPWKl4i91KEd2njrhhM3O9KxEdur6XdhyxxsoNkm9t+dIxYZarZ+VnZTchA1lNjXwjdWLDgCSCmUqnV1dVcLre1tUXfQkbpQLuQY0Dugf0c2GKn0+n1ekSmUqkUZay5D8NzxiZV8s6Ak0IOAqK66E7A1yAMQtSejBtUMcOAEUZ2eM5kLEo3ITwEZCCwX+QMoMgsJCqyUdNTlr+R5I7QVL5NZB0k8EFDP/W6CRCDPQ2NZkby3B9DOwKSwWAQ45IUtRBPBvcOHJzIAh23JPQ8HA4bjQZLAdrtNqYIvJ10On3y5MkXX3zx05/+9NraGtQA3n///bt370JIBHASSbjMyUnRTxOmoxIqn/dYAGJ7gKj3y8cuGZ120KWcf+xkpBzpisPIIyD2pl4NureZiWUzWGKMjXMlEolSqZTL5fb29jBnsuumUqnhcAjOPl5Wr9djxk56l6O7oqtAYgjj3RiDjiGxVzUYuXCQ3hiPx7vdbiKRAFaYz+eRNhgOh/fu3cPog6Y8k6wkn2KYkDE9mUwge51MJlutVqVSQVrFcZxWq3Xr1q1bt241m00MWxn9EgOKRqO04MPQ4AJNMVxKBqkibvl+1Xs3B3Ub7X9+lOwd9yd46Xa2TOW0FIqkuLehxyd0y7kOUK/MdI5GI0xBkrHo+z4DZqwRzJrjQWHClBkgY9ULk4RI1SPKCrPjhUKxkieFhUZmGWlSh6SClIaQ5FYbElKDkdiEBD1D0WFO/lIVipgg5nbm5zjjsWRE6oxxn2Bb8yFPzwoPKTHJEYSBSUVaZeEbKmigKBF4dMwQ8EpkF5JQsvRb0+Z16JxH9GZ0HIPOY11e6JUfgiBLFWkCxPbXJMthXpLPdd1oFOtmPBqJe17E9VzHM44TBNHAuIEJjPGME/ONN/XNDHQeOIEfMW4U0SXUlSnuIbO/sqRM5oA5LVOuTRED5zFqZbYDey3icWihBENzsIJNuRTKdVC6Ncq9kGKyz5v3ZF+S1Qx2ylZSUzkJ28M2FNWVeSPseeTxlVFk6Kz4CYKGbc7EvBS4ck4OLZTBJIw9OT5E+R0Fx1iLht6Fchz0bRJEQPqRG2burCQ6zINwgpI0ZMXp5pZYIryIE2GnzAFFlo/yOLXtB1TnwR/Kukkq/wB4ZWqH4mwP209kIseuLZsnvkFknCEq89nI6WL9nUwmuVwOzkB4ZXLq4xvnw3Q9zzGPTzVlaExgzGQmKxE1ZmhMzJjpDGZDttCf/So++zJ+GCyEJhZtARAv2pPUVKJSmUqpBHUopUVO9NySSpohlz0GV5R2BfKYTCaBnSHOl/prf/ynQeRXMpLkQkUNDVTnYW1jqT5CQVQfcx/AMAkis8xwhia9uWQiCkJEhPWPyepUKgVNWFxAv9+HBjHeHZV/EdxCixO8NiarGeviD6kazPeIPQe2+7gAWb/DnYqM5dhJJP4leSLmoJ+GYpUq95t5xgihu41QCOAo2xQV0KKvEqhi0TreHfwDm83mP//zP585c6ZcLi8vLy8vL1+8ePGZZ57Z29vzfX9vby+TyZTL5SAIcrkcnmS1WsUZ19bWIIwwnU6bzWalUoF5muM4xWIR4sWZTIYgJrmr2KQi9JXqh1C+LpVKqVQKWFK32wXrHJ0H9lYS6wRGNhqN8vk8YFYAHK1WCxZz2NpmMhlcCTzx4vE4EWra1smSAnoN7ZvzzIzaEokEpJaxnSWGhc0o+w/p1eS5mJndFonMMv5JJpOgXlIYF12aooo00Mtms7hTiiyzOl6JtXEDSnIxhjZGH4IB4BSNRmN7extdqN/v44EDWnr22Wf/7M/+7E//9E+Xl5ehOXv9+vX//J//87vvvouCAKAPpGOzm9G1Bq9DymsSHZN8kMc4/9uhiEyfSJNADhZa+kjqjRRmsaUG5AqiXOClcYpkbSNDhj6QTCZZ25tOpyH5grEDeixMIO/fv1+v133fh6ICGb6YADGIGKdBNBwgPk6NE8ERDq8e8DT6D7JxxphUKoV6AnQnpnOQEEK/ZTBTr9d3d3fH4/GJEydwQMRauVwOsQ1zSAjG8EwwjUPYB4IwOFcymXzqqaegdT4ajXZ3d3d2diByUq/X2as5AJnUxD/xWLDOSnp4v9/f29vb2dkhvVr2EESGnDDZZ2RWwxZONcLc7xHYxK7rOrMEM6V1lK8UU9c2EUnp28jUr4SBjCiKQpJABtVSRskI7j8rpTihEe2l3jqPKfUWjKU6SsjGhrxVYQ2vmR0bE282m5XTxQzXiyLpiDmZwLHUs7LzNyZM3lQu/fMWU6mTQ0SYnZm5Q8IKsgReZcexs5LILMYUJICoc82VWqLDpNTxSfLy2A+56IQyJdnhoV+E9Axfusw68IXaD21f49j3p4dWVygoy8zZEB5RR0s5cXE3btOHJUZsa+bqBQIdwPVc13XwrLzAeBMTH5mIjwjSSfhudBS442kwmYwno5EJzMi4I7gvASCmwYCcTNSiRv4mAeJQtMgGiG2ASUrnE9FTFejqidkAsdr8S+BYSkzQb/mQdTYUApbrrKKnSDp86Ds6hMvPfwK4JLwuxbXm4XHzCgU+0XixFEGynx6nERpgQrUPHyLfzPoMLBDIaSGMZSUTy2vY1Tnvqa2yrPCQa5MEiNVuyv4CggvMilJenCNIle7JDGVoF5K9gtMgYthkMgmahTRBleUgR+ktyq/vEFg/dLwTFMY9oogEdCWpzaU29jINwzoAx3GM40SgQfzYaGUzNWH/IDnZmVWRODPR4QPjbfbD1Czaoi0A4kV7gtBh5i1lPp9bakb1zMarwmelCkR7EEBgskoLgT3+FocCoAbECjp0q6ur5XKZiKraqfwR9itYvBGl0MNdVhEin4ytA8IYLKIgQZN82mg0UC+M4uJOpwN2pIQgU6mU9KKVTxILf6fTQXF0rVYjsQLQM6AHWGYpagwgOVwPZDchhksSNN3DGGUBX2Z/gLlZvV6HKCfALMi5Eh0GPijr4ORCzgp97qJwIsW1UXJysvxWgshycyPjZGkhMq9A8vDOz506LNoUPRkgHc1w0TEA97z++uurq6vLy8tf+9rXQBT98pe/HI/HNzc3a7XanTt3er1eLpeDzAieAOyz8ASgAtxut/f29vByPc8Dmx4Ec1yhdH/iNfP9YotZLpfz+bzneWCIN5vNWq0GwRAK2AEXwJjCvYD1UK/X0QmBUsF+EIAy8DX43QFoYHEorpYHJ0DDIuIgCNrtNjRSCYuQ/845R8JMUmhPSrxxVgE8B7kGXJvkYjD4R2em5Q7pM/SPItBDMr7U2pY0JZKRSeRnKS7TJ/gyYMperwc98QsXLly6dGltbQ1U0J2dnddee+13v/vd7du3MSIAmkiBSCOkPG1nGPvno2ysH3YshKIMqlTZhEkuhh7EWGqYctAxGCaKQeiKMwxmuUqlsre3B6gd0r1YRyAkLQtvR6MRhNQBlYLwAvY6iaiIHMj9x/ttt9sQmG40GpjuEPxAzrvf71erVSwHGAjofqS54V7IZJcFodPp9P79+5jGm80mcwnLy8vFYhEJoXQ6jZQD+qHM0crMENZTOOZ5nre+vn7s2DHf999///3XX3/9xo0btVoNX8BURmgSBqorKyv5fL5cLq+urhaLRZCyJSgJ2Y07d+5cu3Zte3sbT6NWq2HmJ4IpIVrl/Ka6gS1i8AgAMXo8T60qhaX3jjlIzZunb2h3RSOqhRQPkbOB2odICVGmRlzXHQ6H/LJ0QpNlCrbigU2SIj1W0QZVrhpQBd61LCVWX6AyiSwNDj0736/6lSpdn5dk4hCTqDendClDJFVZQu3piRETKWNBlRKtMgcr2PD0pDoKcy1S6UgBi3Lpl//kAVmsIN84+6T0FLV1P4OjA8RHg7oe+E1bePQQrvGRdGACEwQmMEEw+8GYwLi+8fz92NEzjhc4nm+MbwI/CAI/wLDyYcyENxxqszZv3ZGcYiVDIe/UznRKYXqZ3rBVetXcZTNg1Byi+A0qsfqwb1nNZhIsliuv1I82B7nJtkSMvCNpVyBlmo++E/gkUp2kzIh8mEphRintcCfGgkikpfFbJqXUmGJQxmoemW7EZkZpAdnyjDKglubh8l3zpNzA4G2y0lQWvanp0R7vtraGionUIiJ9OBDwQs4It49UN8O6h2Ln2CPr8PEiOfWc6rmOIDLK5XJIt2NvT98dm2tvjHFcd1+J+LHspakvDJowxIhHYfgvfh7OdIp7Cyxq0RYA8aI9qQAxtXG5xWcKVGLEEkEG300K1UnagqwNl9EC1higJMQuK5UKuIf1en1tbQ3qjchPyqIw1t0/rk2MKi8CSIGKYBTasKCMwpfGGEIM1DllJMnDQmcAi9Z4PAbqB+oZ4KTxeJzP54FE2BJsSAt3u12QfxuNBuBC1LMDNYCJE0UejDEAcFkNhAMCXwBdcR5ATJibn8McD3AMV1/pFUYmuExKc/+B5K3acJO8YEQFK/nFqjT4EEcFY9UAKo7YI7x3M6vvZoeXzFYgqoTLp9MpUL+lpaWnnnrqmWeeWVpa+rM/+7MLFy788pe//Kd/+qfbt2+3Wq3jx4+n0+lMJoPwEsIggGZwWKCxjUbDcRxQXNHDCVjLccpCKnB+c7kcQFvQG1utFnCxWq0GgjDDCTJHoMMrmcitViufzwMqYhIIhWZQHRkOhxiGlEaRjB7ujyXrEx0ePof1eh0dDxIoeIzsSzIJBDyFJoGcOmSfASmPBlx0haKOMC4pFotxr8yrUvESnjCo1ngaTA4RbsZJ4dkIynCn0yGvTZZdA2sOgqBQKBw7duzMmTMrKys4V6/Xu3HjxtWrV5vNprwX2uIRGZeYEQdUKKdeFv4/ljlQSbuooSELAlQUIQep7SBETiWBPKm2rNh2TBxyGUJy6969e9vb22fOnIHaL+Uppewv0mbQ5KWsRDqdRuIEky0WHfRz0G1isRiqASC/A4gWMN94PF5dXQWoigIOM7NazeVyPKYEiAHVYeqD0gUIznfu3EFmaHV1NZ1Ow9G00WicPXsWYyoWiyG1Q8gJgBSfNpQlsOBWKpXxeAxJCtd1a7Xa22+//fvf//7OnTvNZrPVaiERGI1GS6US4OCvfe1rFy9eXF5exvAHn5SmahzIuPJ2u/21r32t1Wo1Go0//OEPv/zlL7e2tnZ3d5Hx5awop1CpBa+6qOwPD5vPCPD9g0UkqspeCZ7YHVJBP3ZNugq/VXqGxw/t2yz15Teh9Ylo2SaC2UuYzVoFMU1KVahQn7kTqY9B2V/1lMhWk7l2CXnbwJA0zpKP94GCpFR7lxOL3ADIsoAHbuFYz0GAmHAAJxMbyGY2UQLEnPaJVtsAsUpIU0oIm0AjiHsKYLLrOezs2iPLcD+u9lHOLjOVHAPOh4y4DzM5GBwcuxjAJgjMQQUFewjbWPYRH9o8OX57WKl7UcP/0Z5SqHLxw01xlreErfUUCiXLZdpG2eTRHkqZ5BMNENvFrMYSQVL4vu2izNkDU40UOrO1jPZLBERajnJwCCTRSFqXUyW3VSSmGCHopJSFGGPKEJuhutQgVuNLivByWjPCndXW67e7B3c44ENw6yuV6B5BrjqU6HB0kUBJR5MzOVL4pNokEgkUv6rO8OFU9ni7+9SYjjFRY2LGjATymzJmOAOFk8agrCJtzNiYkTG9mQDxAodbtAVAvGhP2ppq7zAkiVKq4zPaxyolK61kZRPTm0jDMpZjYQiApEQigeC8VquB6Fer1SqVCoLtTCYDfI1IMfx8ILRqDoooPfRMPgszuOARoUC5CpAsVkqy7pvkEQLKZsaZlcr9PD4hReBWxhggv71er1gsooS/VCrJPRx0bIkasGCZFZQ4JtArkmt830fkT04lNShl9G4Eu41ZceBxwMVIXgbozFeMC5P7JLWiK/Fi5sOlJa5tDiNDAtvY2g6w7c2fLWh1xHhJ/YnCqaVxDXkEeIN4qtVqFbIMQOovXLiwurq6u7v761//GtBqLpdD+poaCFQchkIZ5UHlLSjuDD/nCwUoDHsrbEBhyVWv1weDAaWipQuEclrjqJSGhIDz0NshXYIBjn0Y+WjSLYpaYLKfoPN3Oh1gVTBRlMKmSDlItiw3wVIDWuYPiCngC6DFMQSS21M6fnCLzJEr6++kXx8LAsxMX1uOYoCPtEWiPKh0xuCckM1mS6USsH5cwHA43Nvb297exm8JqTMDJ+WSQ5mGak42gj75uOADW4ZPBjOKnq8wIPlzqNmOsXzq1QBU3Csp5oiEB7w3pSaM5E8hbQZUl5WPIMVjJmcFACuCMehQQwrSPdTbjTFwtEMHwPiSzwf5A7JXMMsx24GZE+zm48ePJ5PJer1+586dyWSSSqVWVlbK5fLe3t7e3l6j0UA6x57ZpKQAbjCbzSK/UqvVkMxIpVK9Xq9are7s7FQqFfqLxuPxXC6HTOHp06fPnTt39uzZf//v//2nP/1p5CZlUof4JpRh8FpLpdLp06eNMd1ud3l5udvtZrPZyWQCSz0ucJLsZrNNzUG/uEeHyQ76jNu96xCJT2mlaGNSh6wFdsxsVy8pjQvuKJSRva3N/cDNmM1tlCsg5xk1GFWdjbxHVcUcCgqHZobUvR8x/peLjvrZhtofOClJZh8LVmyrDLnBkNiN8p2ztbNDcUMpMqtk07kqyTTeIRYIHx82fMiBDym5mycxPG8bJuZYd6YXEolEIq5nHMc1jtn/z8x+cALj+IHxAzMNAhMEvgmCIPDVtcGgQsmRyZoS+eLmvSkbFrQZxPbSqf7qcED2cND2oV7KUQaOpAOruWjeeHmg5LGdmrJFKh6I332yQtqjZEfsqV7NG5zJpVyM/RjVDC+LZiRjXZ7Ftj8xc1RTDr8LxT1XvGB1myaMcj7vy7YNLEMhJScotcIf71s7yhBTdQayXECi80rL4sDK/ngd6owx8RkQDK1hEIRdY4Yz3WHHmNFMaHgoFIcDgSAv2qItAOJFe0Iap36mQCX8Km2yZOhFhIi4FcNCft/3fQhEygJGBRB3Op12u40690gkUqlUNjc3cQ2pVApF+tlsFpziXC63tLS0vLxMJytGtg+7vabqLmpkisUiGYsQhcCeFag0CFzKbw3YMcVD6ZFFWQDuG1D5C9nWbrdbq9VqtdrOzg6ws3a7jXvkCge7uVarRYYasXjQkAHtQQqANi+DwaDRaJCKKHUGZZEd3zgk/KUZF9UMkI6mvCZfJTERqTEammmgOYMCW1U4quBmu0xPbb/sV0mY44jdQJlc2xixctkiO4y5ffo29Ho93/dv3769tbX19NNPQwlrbW3t+PHjb731FoDgbrc7HA4pfgeMGDqhcJeCHgKL5Sk2IgFiI0zk8aaADkMODNxJyErgxckvSwhDxfmSiUD6MIj8IL9DhgIhHPZbQDZBZqRoNRnBvH7IXuPN5nK5brcL2WVzkExqF0iSVQGCMOUpyDylSGgmk0FhtdyOK5k2yfOVWodQMcN4BPJLXw6wSvlYhsMhJDu63S6koiXXmFXkKC1fW1u7dOnSuXPnTp06BUWL8Xi8vb2N8n/0AcDNwCIVdhYqRyhHhIxAHkpu+/AmS6pJiJaSJhIUloGQCatsVcggO4wEmuVBpOYMnqSZmQtB8Hd3d3dvbw90HhQzkpsM0W1wNmOxWKFQKBaL7H5MfbVarel0ihWEQD87KlBdSOwhtAiCoNPpbG1tDQYDTMucaZn5o1ehmUm6U6AQ2hQnTpwAwZ/SEKgCaTabSEtsbW3FYrGlpaXjx4+jY0BoAhR4MItxnblc7vjx46RUp9PpYrHYbrc3Nzc7nU65XP7GN75hjCHqDeJMNpvN5XLZbHZtbQ2rQ7fbbbVatVqtXq9jfcG5gFwnk0ljTCKRKJfL6XQ6mUw+99xzxWJxd3f36tWr//Iv/3Lr1i2kNucplqpVgPk2tXN4uJV6tgYoJOUooaat02JrL4amNFQR8Tzmr5xmQ/0YHgo8svlN87RxQ0PlQ8CjB66GhyAR86ycjvLwjVWVb46moiuzj6Hka/VhqF0tnyEpDkqmdl76ah6EOi+FYN+7Rl5EkuPBqes5lxTKDw1FGGVxlXykoVXnkvwhNZ0PBIeRSDKZymXzhUIhl8un0+lEYhodRUbGNZFZ7BgxQSQIvEngDAO/50+6k4kTBG7gRAMToQYnNpnYpciiH7k5ZPqKWwu5pkjBVq4jTCjaMJmkrkt5k1BtHCNcuO0BMm8IH0Uq+hAvDbXTkxi3ylTZBmuhWS4KN0suPF4u+KrcUymVjHnqN5/QdnTnanvqVtrorO2TzF+GhHLcSXvt0GnHTgQaS6dRvmLue6WaH/e3KmE2LzGg1FrkVjM02aAovfY2lWPtkHSOeVQ2+gMxfRvBsJOj9tNgbPUhEQdvcDbrPo4+hwuagWrTmb6wLS7h7RdamIgxE+Fft2iLtgCIF+1JA4iNJcdG7MA2M1Fbf5b5y/000AFuROSH/DIBR1SXg3YHLAClviwGBzeWgvQA6R45y40SdUr7+75fLBaVC5b0UJZVtPK3KtHKrQP4gPhEivCyINrMCnbAIwaaJveCBC+4AJMrBK8wbLLH4zFAE6iaEhbBZVPQkxAM13vSJwnZECDmFlnar0MWQ3LGVVWvgo0Ucie3EdJAQ4Yuiu1l759CbQ2UBcFRNh8y3rB9AglqKLsP5gyADBpjKpWK4zi/+93vTp8+vba2Bqr72bNnL126dOvWrZs3bwIfjMViqO8G4tPpdO7evZtMJl3XxT/BOpT0cFyhTL2QjwBqJMSs0alqtdru7i6drMzMlkpi3DL3I1MFdMfG443FYqlUisXmQJQ6nQ7oh2QBK0FGILnD4RAIF5jvCrSVb5ykaRoHKbUBaXTOhyDthgC/ep6HZwVgV+Y/cAp2DDxY7Kqh4opPIKMB2VYpn4LrHI/HnU6nWq1WKhXqvRjBSgZRGjaAiUTiM5/5zOXLl0+fPp3L5YD+V6vVN9988+rVq7u7uxQ3V/WhkpSh7lTKuoWy3h7XEjAP0pJgtJKDsKdEyarjiqAIMjJ656iXnHS6KeKY0CoBKX4ymUB4Go8LLHK+L+Q20G8hnh6Px1EDgdeNlECz2cQ/ZbyHfgh5ayQngE2D6QZYudfrMdmJvoQpFMkwvqNkMplKpcrlcrlcjkQi0AUGox/9EGqGdInELSwvLyNz0Gw2fd+nEDmeCfz3jDFbW1swS8xms41G4+7du8aY8+fPQ38DDxasZ1U1j8fy3nvv/f73v9/e3kaeA4M0mUxms1mIZhhjTp069Y1vfOOpp56CZ2Y+n3/66aefeuqps2fP/uEPf7h69eqbb76Jp8fSASqM20CVFJo4erguZ+ogCJywLqpicuJE9gBRykXmIG3WhoqkmIAcnlJ22QhTO56dCBTrDx5thBLPYkLuEMlIO8f2QBAkFOIMrc6xcdiHxVkebS9K5SsuBDYvOxSb4BptDlojUohD+UGFahnb+KlyJLNVaMklnwtVPyQ+4hxcMUMzAYopb8LEVaXyWyhqyX0Ci+tRmiO/A5JEvpAvFUvFYjGXy6Uaw+gw5vreNOLs0+K8IIgEgev7wWgy7Y/H/dHAcTzXN5HARGe96EOvQmbNFcQjK/eN0P5SNsL2JnAejzIUIFb7DVUKYA7lV9qyOaEs3QcSnxUgGPpylVOlnIhCkweyN5qZxgsDCmRSmVa3seBQg8pPbrNZ2HZyUQ5k+U8oFSADjW3AYDBA4DmdThl/ZTIZ6WjNnYCUelfZGg46bnKUxoWSkpc7JSXOLuNNW9VXZrLl+GIeaF5G0NYg5hTB4j8cED0KATvLiG3odt6KM2//GTrLKeBe7k5Z1qkKy1QyCTE1V5NIJBI4zn4x7mPRIHaMmQjHucSMI+wb4wngGD/HjAmMmRiTMGZgTNyYyexXi7ZoC4B40Z6opTSUOWJnxWUdtIolpO6V1Cy24QbSygjfMKCi8BwBIGwlzUy1E3r8QIqJhSlsWu3hVLIdSwXIg4jSYTNFlWRusnlecwQGUKhJsfon97sEi1m3HrohU0EI9xC2FkFoMZEdW+6nMGcmsNyIy62kTHfL8MwcVP41Vo1taPaecZrqNmaO8tQ8Jy67ZjC02usRaAXqUHJzJo0ZlQQhit+n0+mbb7756U9/+qWXXspkMtFo9NixYy+88MIHH3wwGo2q1er29nY8Hs9ms5AjcF0X6iJ0PabNAlF7KY8gpSSJPoA+T9u0vb090BIlbMFdlN2RAD3YppT0WsSHnU4HQNtwOAQejf/TgZBXlUwmgaU2m01IZgdBABpjJpOhjgpTJvxzGbxRJTm0JJnhHz8BREXtFNjQyfJ2UqLA9ATCCBgOECHd56AcQmljyj5Ar6PRaDQaDSSrlHLuYDCo1+so8D979uz58+fPnz9fLBaNMe12e2tra2Nj4w9/+MOtW7fa7XYul5NkE4lNyM/lP81MvkCqk/PPH2PtspydZC22/JUTVukvIWD2WwUoK8BFaafM81FheEOp6GKxCNVmjkcqDmN6AdDfbrcpj4MLgJ57v98HJRypF+gqoAAFIG80GmW+EAowTLNhkAJC5TWoAJ4q4fl8ntRmRFBIutC1vFwuA5AdjUaNRqPdbheLRQ5GKdSjoAEEh0g1QXbJGFMsFldXV6kgYfPUut0uRE6uXbv2+uuvt9ttEIRRtROPx4fD4e7u7r1798bj8c7Ozrlz51CgQAY02NDr6+vxeLxer0OYHii5EURaqdqklrBH0SDmonlwzlfAipSh54xnC7OEMlgVSxePnegk52TJrGSSjCR3zkixWVM4lDkamZfXg1QHK2NklY+Zw/kKRXsllCnnf1X7HBqZhzKpjZDuOQQanidBc4jHHUcTtiVU/kGO3AjbW5kyV0LDZiZVjElSCWvgwWIMKrMjSXWXIBHNJ5iAV9ROJUAhy7OUMMhRxa9mj945CHYcDuIocobKAR+i7iI5klS7ohMD3ywkrYqFQnm5vFxe3i5Us7V2YpToTiJ+3A1ijnGMcU0QNRPHGfum1zddz/fHgRcZBm7fOBMuxwwiUINFxSpj1dPIVPc8OE8JrYSqn8k9hrQwkXChcocLRUvlo7ZplXL2llzmUIBSDSv1TUV9oLKK6urGIksqEW17Hw5teqT3lMvo/5UhrbGsSpREj1QilrtNRJrJZBLmHHhco9EIrA4IAA4GA9SxsXKISk3ckSqOjsSOaeZhKwuTeyEbzkISCXWKScNSBCAjJCCoAqHMwFV0b4dRkiLDs6sAH0E6QWTbLUD2tFDGup0yUUPSCKsk5ZkkB77cbFACDm9BekVIKz/jupPJJPD9x8MgjhuTm7GAcTdRObPPPpdfMOJrMWMyj13zYtEWbQEQL9pHW0ql0BJ1l+ycOXAZAj3YUwLrUeRQtTdVPq38W+wRiUqAHiWrjyFGAb4Y5UehsYDVlxoIjOexKhDVNQcV+hh77O7ughQGzx84fdMvDn4+QL5A1SQ2NG9HJVU4FKVOGRFIlUmAUFBrVdEvnjaRL4DacvvLx0iWLrYdyh0IwTx3Qoyj5D4Du2dCbNzvUvsYcIw04mNwJVFUiWQpEi5Y1XbKwVicdCWDoHZ7inxhjlAi+kC8WEHV0nRCbb4ZJCO1AGHQWq0GOp4xJh6Pl8vlU6dObW5uNhqNarUKkWLu2rFjkxtWc9DCXsrzyXBUkoh93wenFY5zeL92caKK9OQOmPQ0FXrhVxCawHfAf0TfkzGwNOIAAgtsDvIUmUwGFe7FYhH4OMcFU0SK20WPRHs3GSqvJs3TVPGp7MaoFaC/HOBC/EzwBX8IVBHABP4Kxl9QGJAkEeohdDodKHu4rlsoFEDnx1Dd2dm5c+fO7u4uLM4o6CynO8VfU8bWqij+EOD1ozeSRGQAoAAOeYWE+LlxV5caKkZh564Y56iIXd5ss9m8ffu2dC/ED3SswmsF2xeTLeZzKd0wGAzgXlIsFjEeqVIHyDUajQ4GAwpz40Uj6sNETY6MdJLB/zH3wkEbJto7OzuAtoHeIoYEt3d9fR2DNxqNwgcPgCCuBJkYOsT6vl+v13ENw+EQ9+W6bj6fX19fhwwRhc5lX8IVjkajmzdvvvPOOzs7O91u99SpU9CgQNYK1zMYDGq12unTp3u93nQ6ffvtt5vN5unTp5955hkoGkcikWKxiDUik8n8z//5Pzc2NuAcALAYtqiYD7m0KewyVCTx8JlZft8GvhU70gamQ7lLtmKyJBHLCFy6ADEIp88kjTFZ2YNpE8iXoi+FbrdCP6d3JdOTyB/bOJQNP8nxJen5VNTlKbiUhOLCcraxschDREvtHLCxnC3mKUHJLQcI+1D+ITNdvgim/SigL5dyuYopjJgFKzZAbA7q50hr4lgsxnlGznKKfk6xTh5ZWjk91IbEHNTvPiT/rQ4uzQZUYZ+t9s6OgbkUWTSAYhKWjUQiiWQin8+XS+XyUrlUKuaqTmqYao2jk5gXxIxxjHEd33PGJtIbJZvdTGQ6GCeGsVjgRoeOCz9n5ML3X5ZM0clEiyyZUmCuXZivfuaqqp6nRMxtFWwVmCgJNQmhqkCGuK00/uJuRCp32frIsnJOpn9siR5sF5VXROjQk0VjqrTRhphD4e95BA7ziXWusznRtjKMWgXMrJYOe2Asyo7jdLtdWsVSpQrxI4uQsDRzb6wmHzJv2LfZ3yQdWOK5qmdyYpHKv3ItkHtjaSEuUwv2TkwuuNJoVPZeiRTzy7haRKBS24R9W44CzqhSxNKmoz0Q7le6H8wwKT0rMFcymQzdJobDIdbTD2UzHceds0w/EpKCWgpj4jNvug+nWmOSxnSNMcakPxa54cuXL1++fNkYc/Xq1StXrkDQ7CMebWNj48c//vHh3zxz5szly5fPnDnTaDSuXLly9erVw79fKBQuX7588eJFY8yVK1euXLmygOAWAPGiPblN6g8ogBhrADER0hgpOwAdW2ZlSb+1dxgSBZMu7dFoFPEAViAQo7CEJBKJRqPBdRpEhnw+v7m5iVpjyeKRS0I6naZFO9YkKt5CSxTIHciDjuMsLy+jgGhpaQnGYqB9RSIRSAa3Wi2A1Fwy6YVF0EfeuCT94Rlys47AJggC7DZGo9G77777xhtvLC0tAZU2xuCp0iyFLDaQ4LiJIemD9rLmoFApYRQJcEsWA94pYE0AgsSdsSsdDof8QwZXtrW6DCYlvTG01E4ayismDnAWQu2SsStxQwVGO3NcjA5Ph0g1Cfnn0rpQCW9xIGCbHo/HUanUbDbv3LmzurqKR1QqlZ577rnhcNhut7e3t4GZAmpHh5cXzG0TOpIMLFn1yZ6As4PPCMUDDCWZtiH7npxlRQKFSoYK6VUpLur3Me6AsQJiKxQK2JbxqkCpgLZppVJB100kEsVicWlpKZvNLi0tYTxik4qQW9W+yc0lgDZUyqsHpfaR0msLwQ+q8jFSgJsDpJOK3oyUMNHhNql9gW8SI+52u0CT8ZABOtDjkYTTTCZz/PjxlZUV5qWGwyHk1Gu1GmAOgtEkJ0pxFdsPyo5OzaGO5x8RHZYO1ypStXVCGJPIDsa0gULrZAWGgickD9QmM2J6h8z3//7f/3tjY+PChQsQoMdbAKAJRGk4HKKzpVIpdFcIQ0PgJRaLjUYjALWYS/G3/X4f6OfJkydLpVK/379x48bOzs50Ok2n06VSqVwuQwUCsPJ0Om02m9vb28PhMJ1Op9Np4FZIojBhubu7u7W1hXk+Go0Wi0VWxgC8hm1jKpVaX1/P5/NIOBljSqUSQJPJZNLpdBB2bm5uvvfee/l8/ty5c1/5yld834cuM/JD29vbEPju9/s7OzvGmHQ63Ww233777Vu3bhljsKidPHkyHo+Dy4/xwqyh4zjr6+t4Be12+/333//tb3/71ltvPfPMM88///zS0tLS0hKcVEul0vnz5//8z/+8UqncuHHjZz/72e9+9zssjoCJwbunMr5yOHxYDWK7mEBFswqRPETIwvbsUlk3uVhzXMsFlCgA4S2ZLmIBhFSZUNjQPJqtHIZ0GsAkjM4gHeppkCjp2xJKswFiXC2hbTLZ5XYlFGSXshtc6OdhxIfU0R/xXePJ9/t9GBdzbyn3opRSheYVbSTMQf41nCrlPlBl7omzcMFVHYmLlJQaI0DMJyxlSdmjpCDG/rs++qNA97CwfhNmIip1nNjDlcgJ9+SyoogpDdw4lZc6nQ7E/VVqORqJpjPpUqlYXlpeXlouVd3dYbY+SIxibhA1gYerigz8bK2z5g7Gw3i6kK5nMr1UehyNTIwJRmO/1xuyYI5V/HDgxMAhuQG3QHqEuiMboGcFg+1pLM2ZlXqv+pypF6USwFcsayIpYc8uKrmfmPZVfkv62Sqwz66AJI0Ggx36XdztKFxYMlLnDUPbM2CejoQa8vMMD59ALFgWQinWiMxV0/pYTndq00XAXZlV4sXhpQAsZvEQ9ocmTD9EJcmU669Mj5EwriBdOT9LDYpDnCrtii57d2eT2VU8xWHI/8tKRNa3IRyA1oSsvJFANp4kkvFIo1Jhxu6uan3kF3h8/sBqEjkMue9yHKdQKOAyQKahiYLv+9MgyI7H0Vjs8UhM7D9uY0YCF44aM5h50KGNhDedbIlHlJj45je/+aMf/QgqZGzf//73v/e97z3yTfzN3/zNt7/97StXrhwCEBcKhR/96Eff/OY35YdXr179zne+Mw8m/t73vvfKK6/wn6+88kqj0fjOd77z6quvLoC4BUC8aE8ifVgCxLbXM6dj1m5whUAwjD26lENSawxjGGxiEOrwmyhOR1oPAruApQAWgzBFSk4ikahWq9gy4mK4g0RskEgk8FdkImM14krZ6/VA+kNV/mQywRdQdY4/x7as0Wg4jnP//v27d+8yVueOE/AxrYrs7VQo7iYVinHAfr9///79t956a319Hew2yLlyxcVFcj1Wbh6IjoC7KeKe4uFK7B7PSl4qS/kYIQPPknQMkGQld4OpAqnDJSFUSXeicgjjFnv3KbcFar+inqoMwBj6SinMQ7AwCWnJ48vP5WVwP4cTMaSE1GwkErl+/fp//+//PZfLnTlzJh6PLy8vf/GLX1xfXx8Oh/fu3Ws2myjfzswa3ikjfPQNMFhBVESfR9gGRiQK3KC9iygao4YXRowD/Qpwv5QPIyEFmyeMcUTaoNVD5hv4EQCyfD6fy+XQGxuNBmwVs9kst8von51O59atW7du3apWq3ADW1lZOX36NLiTqVQKDCxma8DrJFOPu3MkeOBLCbk3JdxmDqrZSrQXEwiO3Gq1YMNFgLjVagEgZukfpyMAxMC2arVau90GRkwSMRkiqChkCqfZbEKbOBqNPv/885cvXz5//jycviaTyc7OztWrV1977TV8h1fIwE+ygSQJV/5T4fvmo/mkH54yUTwUScdTkaEyOeGIIwbBFKOakWSILke6csHinECpOGgHAzJrtVrLy8vr6+u5XI6JAbwaENUhCQ2CD6IacOKQ9ut2u1hlMF1gKCEdcuzYMZwRM3CpVDp+/Pjq6iqOCeV3vDIUfJDShUOhn4Bxj2iEjkC4pEajgdENXPjUqVP5fL5QKARBAJFlY0wikcCqisPCMhFLZKFQKJfLx44d29vba7VaiUTi6aefDoLg3r17v/71r2u1mkQ20bHT6XQulztx4gQ0LgaDAdKiTDhhzmm326PRKBaLZbPZ5eXlZ599dmVlpVqtbmxs3Lt37+TJky+++OLp06cxR6XT6bNnz548efLZZ5997rnnfvnLX/7ud7/b2Nj44IMP2u224vZK0cxHcKgzM6txGx5iN5PlOEqGOJRKbCsJKIagJJbKPJaU1CdTWEJpklPMwxJjUljD4Ql7teRR1wJ3LfW71C0oXQLqKpBpBehTosOhhEE7F6XokPOYX4/sSsRs6HDWKL4kEWRUPmHNAsUYc6kRzpZYxTCxAxmXqIpk3qnUqbK2A9bMZ07Iz1bhl7lqCeV8iMc9VLrOcdw5zoTqmcuMgoQ1mfiRGiyyAIKPi86x3AYMh0OsYtZVedF4PJ1KplOpVHqQTCejbtSNuibiGM8EgfHHXn+UdfrHfD/ix5NmGvMilVSq4XrANP3pdMxkHiZn5qgkqZBO0Rhi0h9MdVTJ+Fb9X5bSS+aK4lra2BzjHZn4CRUSIUBsF/sTrQ6F8KTOssJ85b1gew9pI4wIZqrkDpysDiZI7OWVO+SjkNmVrRmrOZ98ErG8cjunoiYrzu3MEsmtslRcwYedTgd0AfmhmnY4Jys1bS5V8/JnqkBE2tCZMNc4tXeahxTL9KEsklBUIXvIyOCdCUWZaDTC1IQ5VGUTbXPeGeAnk0mEM9LET+72571Zme9BmIPXjTwNQhLcF5zt4VqMv0V4BdMXvNyJ7yf6/eS77z6enu0Z4xjjz9SEfTH1Q24YbSJQNxjTucZMH1Fc4uWXX/7BD37AfzYaDSDFr7zyymc/+9lvfetbj3DMixcvfvvb334gEfj1118/c+aMOu/Fixdff/31S5cu2RjxT37yE6LJ/H6hUPjJT37y3e9+94c//OECjlsAxIv2xAHEtmac3FdJKqUMGNTCIwMquRAqqX6yxoi1yUJjfIL/yxp86hsAjZVevVhskNjEhr7b7ZI7CUyZDMEgCJBFxGIPhhcvQzaUEfm+jxpzmm7J4vpYLMbtWmj9u22orVSZsDuHRiSUZIFcMK6muZbcCssVXXIwkdAmxkTM145/iI6pa+MxsTFV1y+Vo7krUltndifJZpVP+Ch7zZD46qBmnNzKHGIsfkhGRMrXcrtjV4Mq3S5FiMNDmEwmt2/f/sUvfnHixIlGo3HixInl5WWQZ//kT/7kgw8++PWvf12pVAaDwerqKrIXUoiDdzEYDLrdLvBHGc9AlRiBBIUayCzmEyApjPl5vB1yo1hGim5P0wYMB3wfETU6HorQS6WSMQbcolqtlkgkUBrPiGgymTSbzfv37wO3Ahsd7MtSqQSc18wEFsgrlPxfjgiwFIEOY2jYmQAZnsnICugYtvWgMyMDBFwM23pGd3g+GMXQYyWE3Ww28XgZLQO2xsPhN4GYD4fDQqFQLBa/+MUvfulLX8KOZzKZVCqVt99++80334RRIe5dKrRK/yU5IpR9YmgR/RH1TB8tslJIbih4pIQC5mmgS2EBaRdmw0mqFEC54eGvgLC3Wi3AxPBKIosEkUA6ne73+41GA+Lg6KUM3pimIvZK0iIwU8Qb5XIZCFShUFhdXV1ZWYlGo71eDwlRBELQOJZq+Ky1hHYEsQOcvdPpoGYF6iupVCqTyTBXAckjsG8k0IBZmmxcMvqxCGaz2XK5HI1Gkbl5++23UdMA9noulzt37tyZM2eWlpby+TzjIsptI//K9069mkgkcuzYsWw2G4/H33///Xv37k0mk+PHjy8vL0NuQhY9oI4HqTLf9zc3NyGwLmsgzEcTRXEdx5ul0BRALPGvecqGikM3T3JHDjTlfqZUTSlfgGlWAsTKtt4uqj0iQMyVBSAa5g0u0Jw8pZqQXbrES2JgTy6t8mqzsQabViyHsy1y+limIwLEFL9S0x03ZvTXJX2YZol4HWSech3EZSsJV5vWrUB5M/OJlQCxvFSe+vAapofI6uFrB7UgpLC+zSBWLHipNsCXqHjrKq+gzK8oRKD0ph3H9fBs4/F4PBaNxzzfcyOuie6jIf7UHU9S3Z43HiXcuJeIjrOjXhC0XMcPTOA4/nTqkyQOJVykxJC+UrRoKv+oUWOr7soKMwnT2zRJI8olZdGAGvISqlYqIir7xUSvZBDbXOZ5EupSX56fh8rdYEmScuQS9uVNccsnzyhnJFXTEJoiUpOeTed8kgFiaVitpqlQ402+RM7YskABfQ+PHW4TqEySM4mqZJUaxxKDVjOASmTa9BfJvTUHlXwPMRS1nwZzQioBI2M3c1DFQt2aTaxW9AXbPlFu7yXMzfJHJeKHJfWQBxIq7E46C3BhbvCwRaSuBacOvFbEMvsG9dNprNNJp9PGcR4D7SIucOGYMRNjxsb0ZtITgQCL+f2JMZOZJEXvoXUnLl++DHS40Wh861vfglzDmTNnfvKTn1y8ePGb3/zm9773vYflEV++fPknP/nJA7/2k5/8BOjwj3/84+9+97tQtCBa/bOf/ezs2bNS5uJ73/se0OGrV69+61vf2tjY4LkKhcIPfvADKGMsELkFQLxoT1zS1YR5MtiLq+2oYG+1bdQgFJIOTY0ycy6FDpQqAj6RCVKsynJtJqUI+3vp/kRmCvfB0jKbNV9QI8X35XqmLnVe6HuIepftxUE3LT5b28fWPrhN61PKU5ILo9hGUqvBTqrLlfjw2N429Jj3HTulH5pCPyRkfVzQmO1ZJMNvGy6Xl620DkElwN59c3PzN7/5TavVunTpUjqdBsH8U5/61Je//OXNzc3bt28jb1Eul9PpNHWEpX4ouivIO5QwozQKXvFgMFAwBHMqgLeA2pBUImELdAycjkWLIFTi2hBRkweHQxUKBSJB0NVtNBoEebGhBCqE4n3lziHxRMnt4q/ky41Go7lcDiWuFLEhQ4dicEZw581B+i0HLwEvHBnqNHgaiUSC6qs0sgC8ns/nAagBAcRhIQjAIga8Muh7pNPpCxcuHD9+/LOf/eza2hrKKQaDwc2bN998882NjQ0AmtJJQzqwKbdlu78xdJcd77FrEEvl9HlEQnOoW12ojbs9lIxwwJP3oo5sW0VJzXSIGCC9J/3BUKeM+A36PKzwMMK3kMxflbbkZJhMJsvlchAEENFGSoCq3xg1SBVIaQLkz4AIg0GMs6DbSFIk3jj6J66WGBOOhuUGGCtF3gEUtlotZEDRz6FtDUpyOp0OggAPAfSZlZWVQqFA7jCmjnK5TDYQ8qbQjWk0Gp1OByh8p9MB6z+XyyE5ur29DZ86EhVx3kQisbq6euHCBTyrGzduwJixWq1K+t6jE0vFhkGGprLAX2lE2IredirioVA82RtxAeTksnTJXlmYDKOOrZ2XPUrmnrCyOVggjwMq2Sg1Khl4s0k88RApZHXjoVDL40WHJZIikZFQAShp0ySTxHhcfDWcsRXAF5oeUOlnTkdEKiXqR9EwJIeUq60toP9oZR8SwTTzCfhKIVTJdKq5VL41221YFbZbZzKu43qeF/EikUjEi3huxHM8YyL7sEjgOBM/Nh1Fpr1YZzrup+vjyY4xruMExvFxEu6XMMvFYjGu46rnU85Ozs+yw9jRh9zqK39sFcVwO6Q+t3d9SgDNtoym7nDocQ7f8UpC+uHRgWxyYLKwwISVRISm0A6ZfJQVtoTaPymRrFLFUTGprYzHiE/pw0gfAsCa8KKAcJkM1iQKqbZGMg0gh5XE3yVuy+tUDOLQeFyGfqHRYqhPppQwUrMTa3Hk7nTerswc9DyXyIB6tkooQ5rIydIBmi7Yr5WPIlQBA1VWtB5Foh3bJ8Qa2OozhdPpdOCVMhwOR5OJ12gkEwnzWHr4QCC8w4NmdAljhsZEjHGNGYjv+7MfzKMwiCnX8PWvf52M3Y2Nja9//eug9/7t3/7tD3/4w6PoEf/gBz+4ePEiVIyPAiLjm6+++up3vvMdfg4W8A9+8INCofDyyy8Tmy4UCn/7t3/La+P1XLlyBZeKe1kAxAuAeNGeuIwroRBlEqoQQymeJedxye/DXKyKjo3gk2JZIqWL64fc00gnEBAZZDAv93ye58laFbrScwcJ3znQtViKgmgZKz1uH6QzBMB03MKNABED5YFcHmIWBCDk3osrLmv66GuES0IIBCInuMlyteYVKr6thG7NHAd2yk2gRk/GDHhrkk2gNqbSaiPUY0qqUmCtlVsHFlgp1xdCM5IBqrIRdvCmbJ25g7GDLmWCdMQ+z7/l5ck4UzKUJXONn+DNoqQa79T3/evXrzebzWg0evLkyaWlJSh7vvjii9euXbt3797Ozk42m221WplMhoQyaJ6gD4ApDCgWdEUw1BicDAYDMxMZpAwLrZMSiQQERpE8B7RKaywQcqnkC1ItKJnGmE6nA3QYyr+ETUEixueRSGRnZ6fZbHJ4yo4EbBfoNv4PDJrxiaR3AcaSlbCkthHIQMIf7GZE42BeQ2SD9WucZPiHLBXkvh/oIf6QKDwfLJ02wSZeWVlZWlqq1+sYg5FIJJPJlEolDNter9dqtfr9PpSFz58//41vfOPMmTNPPfUUpGmq1Wq9Xn/jjTfefPPN7e1tW13B1sVjWSgpcjKmZQAjg3/uyx/LKsBpn9t6ZixUabkMDOxBZ2sTESBWbH1ZuxoqiidpcY7j9Hq9er3uOA5kvoMggERpLpcDoVt6nGazWdBsWXKIqQ8hBDBQUPWh5xAEQTqdRtICfTufz8PGLR6P47DAUgHOYoyDGo/QUVZdDAaDer0OsiEUqzG0O50OKO341fb2tuu61Wq11+tBg5i0FwwcYE9Y1zCZNxqN1157Dag36jSpJrG+vo7xEo/HMQyJaiFNMh6PQc+H6ost5I0lr9Pp7O3tVavVarUKCb9YLNbpdOAQ2G63V1ZW8CH7QKFQeOGFF5555pkXX3yxWq3euXPntdde+/Wvf33r1i2SrR5KI/5AwC+iaOKkklCpJHGVbalEi0wYs5i7GjPHzN1Gh/FSKH4lzehtbVDq4XLyUeK/85LKyqBPmUaiDyjE0K5houYjLkBi03IrZQ66xaqTSjRt3uuTtMqjZMpttXFF5FTMTR6HtGK5Osv/Y1xgXBMXUO9U2rRSbUPOb4qiy4PzpLQdpruDhHt4WGkadvS5WD6dUFBYzZkK6pXA9zyybSj0Y8Iqt8KSFvjPdT3XdR3jBsY1Bo/NdQLfCSbuZOiMnMxonJ76sSAwjhM4QeCI98ylWREjbEsxWz5lXr5f9TRblEkaThwlsRHKLleBjx0c2QPzcHaFmmfmqejaA8Q25Qu1YgulyT/wxm3ax2MXtvr44ln7DYZSVVReSspYS4B4H8obDJjQpTy9YmDIWMk+hQ3FyvSeXcgiay7NwUrfeSUyob1LfoGpF6kyJOM+IyjMtqK9rXQhg0E7t6R2vNzcGmOi0ShUrRggHJK4tUlL5mCJDKIJjnEMc2z7lZeJ7/tIe8NoZDiZuNFoLBZ7PAkQ3xhnhgWrSHRiTGCMP/vcNSYipIofaWwRz/3xj3+s9Bwajcb3v/99CBN/+9vfPop6w9HRYWMM0F5jzHe/+131qx/+8Id/+7d/C2yaAPG3v/1tlFd+//vfV2j11atXf/zjH3/729+Gc90DPe4WbQEQL9ofrwFqkd7WCr8gkxe7ZKwEdp0m/890H5c0KdgkFydbENCIWnjaxYbyTClaxEJCAMQEiWgdAClGhUICn6WxFUhYyWQS6xDwCOwSdnZ27t69i9geQTtqYUCZlHxAiZgAs+AyxgJnxJaoEYYRFkJ31LBDAQAZzmq12mq1QDrjLgH0T/6TIJd8LKQ4kXbEoEVlZbnRkfiOBKQIRdnsWu5yJAuS75pEZgkw8TtSvM8cNI+WBnfGqkBXta7Sb8TWDn4g0SCUPiZ352qvL0F2EPqADYGvlEgkOp2OMWZnZ6fdbtONanl5+fjx4+TxgflIi0Uz00bAfaGPsZbQzIQjOAaxkcXuRwY8uCQOBByBMqw2DYElpSTUo0lZZAK4GETZbBb6vBBXRQ+nmQyAMPRPnJEuWIrJxavl38qkhewS4IpCBZgi4zSIkyx7KcYHU00JhXCnyCcATqiZqdwy1YH3CDCFW3bWukrMut/ve563trZ2/vz5U6dOZbNZdN12u723t7ezs1OtVokGKrhnXgCjeqMUbwl1OX+MTVnkSXBNjl+GwSpzo0iUinKozK+N0B2a5+EuGVvGGIwavFwItadSKXQeQLTVanV3d7dUKp04ceLkyZNBENTr9Y2NjWazCYxMwiKcn6EoDfVt1JACJ4U0CsAmjClkGYfDYSwWq9friUQC5HRMzqQ9YuXq9XqAaNPp9OrqKkX6cDvZbBZVq9vb2+12ezgcPvXUU8vLy+hjzFhAQAYpCswwzWbz1q1b7XY7m81+8YtfPHnyZLFYbLfb6Iqrq6vkBcM8E5owuLvTp08fP368WCxmMpkgCDqdTqVSee+997rdLnjH+Xwejnxra2vovQC/MPz39vbefffd69evnzx58jOf+cz58+cTiYSZEa6pWBoEQb/ff/HFFz/3uc/95je/uXbt2ltvvYV4QO4ojpTYoIDSdBoc9F9lZ7PFJSRUpyLJUIhHSR+qMFhZGEl7OqS4uJNRQSyZp1waAPRLulloqB+qRGlXWTFLNE99kmknSmFIFVdbqUOOXHkQKSthhNHWPEakuh6Vi7W1Ym0IgFM6ZZf5auQb53QkVw0suEj8YFmRFSo8Pv42NmvS5Vhif7LTqi9IbXTyBuSXyS73PM+fTh+CnhYEZj7oH7pMHALZHx2pVO2Q786obvK/2W+Aj5jA8QLXnbrO1DiBcYzjOMH+I3COgsbOgztVblUxgh+4tB19N3jIww8V5lZOYnblfqi4gX32UJs1mfGyhf4eaol/qJ7wfzEp6vDOL+cKWcwqB/sRswsqhJHri42lykVBeS3Ow38PmQdCB3VormheRiSUgB+aFAzVL1ZD1YQJmBy9s9n6lmrlYrUlzbq5BNuRL9bE6XQaOI47W5of32ZagGrT2ZQ5nsHE6muOMd5Ms/ghxxzx3J/+9Kf2b1999dUf/ehHxpiXXnrpKADxd7/7XWlz97Of/eyBp7569SqUIuxTv/zyy4VCgYDvSy+9xF/Z3//pT38KyePLly8vAOIFQLxoT9x6aav7mzASjRHmMCqKMIK0QlIt439+QqEuezVSwYk5SAiS+UOFVgBNZkQkubGsIued0vICi/1oNHJdt9lsNptN+IChThn4DmrqAflRCxhLkfTXlgleW9lQxbR0JGMpNE46Ho9rtRq4Zu12u16vV6vVWq3W7/dRSqzgYMYtkqBHUwIkvSVSr1SGiQLLhVMGaao2XJnnKhRV6RLKN6h2FVKQK5QYoozjQtlGasurruro22WZlqfgtTQqoVyjzPmr/RYhS9Sgvf322xcuXDh58mS5XHZdt1gsPvfcc5/+9KfxzHd3d5PJJJyvEKYC6gLQTOFOYKMApGzXEaoi4t6BYDIkBssVJVSgPWYyGRq1k8XG+6LyI9BYXBiBXQ7eVCpVLpeRGgH6jMQS2RPAQdhzUFNP7VSZKFIS0kT6GH4DFO52uzDik71RalsTbJJzQkQ03EsymUT6R84MMh1icyWM0KoGCxUDChRLzAZra2vPPffc8vJyOp0GtNfv9zc2Nm7dunXv3j2MWUyA9lSmiEjE/W1LRnPQVkhJMT6uJUAObVsjVTle8hZY/KEGkU3ksfOO0kPJhFUYSIoNuxPIvLlcLp/PA/FHn6/Vapgq19fXC4UCkm1IyQDn5bqDzA2BM2JtnU4H3/d9P5PJYL6FdAM4mEgPQEGYVi1MkvFd4/oxrnO5HPi2yNMsLS3hkyAIqtXq3t6eXCKlhxLLC6T+vsSz0LchEFGv1/v9Pjo5zoURjVzFeDw+ffr02tra2toaMjftdnt7e/vGjRu/+MUv6vU6xDTgKgnruWeffXY4HNZqtfv37zcaDSDam5ubm5ubjUYjmUyeOHEiFhZWAS+GUWe5XE4mkziCpLzJrN4D6Dh4ZQdTQaHJldAgXwaxpMGagzxWm3U4TyyFuCSyuZDxkTbuuEjqBcnoFD2NvV3p/9o5zg891g8aZ9lFvqEKXbwAaT1PvlgojTf0mdjpHzNHgmweRizTeNK04BBkSqrKKDCC7DC5XkhaA2vI1EshOsMOwBIZvCA1uUnSnwmr3GcCFXliVcotBUld1zWY4o62MwmCAJ1VqRMQELHhLSmWLb+m8B21R1XYKwsgWD4/d4Q64A+7Hu7Kd5yxCQJAIYHrjr34JGYG6Xg1lWjGo8NIxHGciGN81w3cD4W4PaXWLTVk5NhRdHtbQs0e1HbaQw2xw0HeUHzN1l6Q2xi5LVSf2zoSKh2imA3yIFJWQtlmyh1RKMIeqvWvRNjtrYiafx4Bhn5C4lk7E8YsglJY5tOW1BYqlZGXino7GncrKWrJgierRkaC6nWHWvKGbpMk78de77gDUXlEidiqNY62DfKBqEfHXZzyvZSMY2lrrISG5WKqkG6VO8TOh9LPdgLSDgwPkb+X2VO5sVRiMnIV8I3xIhH3MVIufGP6s59jxgws6WFn9rWh+NrUmOhB+PgI7bOf/Sx+CFVmaDQaV69ePTov+OjI7JkzZwAlz1OE+PnPf/7yyy9LwPfixYs4RajYBY9zRCx70RYA8aL9kZqq8lb7LWWnJvdkEiBTUAKzeeRqye9wYZA7bx6T9ftGyDMplwmlK6cWRRXksPiFhcYIDLgPAJoANA37AGizdjqdXq+3t7dXq9W63S6jXCA+lJuQZuVcVrHHlexaLtWwGovFYhBXBYI2Ho8rlQqMg8DQpK9Rt9vFcwacQYRX1XWS6EfCGmloAPvkl1V9k8rQSl6V1L+TT5vaZ2r/wc9t5RAWIj2QDind7WwZjXkFrcTKj97zZTghd3L4hPkGI8oJiYtJ9SvAskAzu91uPp9fXl6+ePFiLpcrl8svvfTSZDJ57rnnfvWrX7311lvgjEPbN5vNZrNZOikDLMYp8N4nkwk+pDYLUVSOKfo0okvv7u7eu3evXq8DwM3n86urqyjGZ10tuhxSCOjt6CH4DuAMKdrgeV46nYb1HOjJjUYDjEtg2UCQwYwG1QLyu8aYTCYD1nyn08GDHQwGvBdE9XjaeIP9fr9SqaCgD3t0wK8czmojOM8/CrIYsVgsm83m83lgfBwa6IcSX8adAuIBGQ2I4XQ6bbfbjuN0u9379+9vbGz0er1jx4698MILf/qnf3rq1CkwFDqdzrvvvvtP//RP169fv3fvXrfbVRLMqsxZyqIpCEChPxKY+DjqPZXUjB1Rm7By19BBJA9i+8UrPUc7y8iFhjGbUoPBW4vFYhCFUFLyrVZra2sLY2Fvbw8kX1ngiTcLyFhSTtA58a4jkQgyAcgmIgnBihZoT9PQHOoNTFdwJSVpHWMT9m6TyQTQtuM46XS6UChAtwflliz7QJmOnADRqwFboydPp9ONjQ0AzTs7O5hJgBH3ej0sYZ7nFQqFeDxOhjI8Vzc3N+/evbu7uxuPx3ENrusOBoP79+8DH3/66afz+TzyW6VSKQiCbrc7Go0wpdy9e/f27duserGRiEgksrKyEo/H2+329evXt7e3MRVIS9sj9svpZDIdj6czrHyek3sopmOHlwoAVVk3W/1TzS2YEmnCrvYhUpFWytdK/V/2N4Vn2e5VEnRQaXsTVnmgBLgoS6Lk4EPtmw5hGjoH3dLm5XRD07e8C6kUf0gpsTnof2urZ0jTP+xAJBRL+SDcr1QOUXsbZdzHnZuCXBW0LcE1PBM5vdtd5cMXFATukRPXvu8b3w+mU1/YqSlpCHNQEMzu8Momy8yvT2dSHF61mNyQnZ2jd+xGPC8Wj8bj8Xg0FnEj7sRzpsaMjQmM609ikU4i1czFq+XkTjG3lU51oxHX8+JBELjeZF+82NJHZkKFHgaYXlAebkRdmtzdUR6XG4lQPQF7OVNaE4eQfG1QWGZuJHrL/S2mAoXtSt8U9YdKdFtuRLE3k/r1JKlwQHGzKkU51LQsdfZtpT7SfXiDUulYyrx8smBimX6QS4AN60tdL9w79sbwEsDCDYUosC4ksYb9gWWRqnyNmSruVYyoK5XKNnako1Id0hFOZgu4oZViX9LoQmo4cKBRAliB1Cz0VKsAw1ulJCZz5PZiKvNnLODAn2Bvz7tGynleSDhPjpKPTu6QZUguJw2+a/BmXNeNBYE7HkeiUfNxqGz3Z6AwzegAB/szQjFQY3xt+NAMYnjEAQsO/QI+l7zgx9J43mazech55anxJ4df58dxqYu2AIgX7dGb9A+1wwAuoqRscAPBnRNz/vMYJWq94Z9zXyJlKKRXmJnV18ukd2iFpiwGxxaTiyXDCZAj6FOHRQInZfiktoDYIqDhb3GzWG+AHfD40juYwheKoIEjQ09AeZgA2hiPxxC7BPKIL8NLl7zO0CQ/F2lQ2Lgj4VOVNEmVa5W7Q4Imcp8RGlLaQbgSmgDQJmVGpIgz+5KdMbYT2k6YqbfcP/GxHxF9kIeSz0SyoWXCnJ2Wlimky0nnQ5BVJ5PJtWvX/tN/+k+vv/76F77whc9//vPlcvnP//zPX3rppRMnTkyn0xs3bty6dQtQ0alTp44dOwaEqN/vowIdcdFkMtnb27t7924QBDCDWl1dzWaz3CRxqwcklJXpkEnd2tqCRHKpVNqvdfV9Xj8QWyDIg8EAACh4jui9Ui+Yu1KwIDEVtNvtnZ2dWq0GZG0wGORyOZi5gdUIgRRQOFOplNR3AwrMKDeZTGazWRCQgWE1Gg0MOllKrGqBJdcMo5L1gEDTwPyl5LFdBk48i1gPsG+ID6B7ABOE8nKv12u329FodHV19dKlS1/96lePHz+Op9HpdN54441XX3315z//OWibkMVQsjbzoCvFF+O4kKCAQsE+jrVAEUPUeLG5aRLmZrhF2b5QVyjOTpLiIQc1shGEePBPsuNrtdrW1lapVIJsC+o84L2WSqVGo9Ht27e3t7eJx6GfI/9Bqn6n00HXGouGvB0yCt1u9969e3RrlNfT6/VwCkSPlGSJx+P5fB5i94lZI9SLz3Hx29vbUskE4hVAb4FKS1BbEvkdx0GqIxKJ9Pv9t956q9VqYVTmcjmACMViMZvNAu6JxWLwjsvn86yhabfbd+7cuX37tuu6n/nMZyC+RLB7NBq99957Ozs74E2Xy+XV1VVcORDtVqt1586dX/3qV51OZ3V1tVAo4DbJaN7nxMRi5XL53/ybf1Ov17e2tq5duyZD9KNzcaaW7H4oO+woALHde22w1c43h7KTGF0zuFXmOTatT1bwhMbAh8jyHmJNNo8/KLFUm7c77+d5l/RQdTk2iG97IIfei/2h1B+T+WxJPmUSV+0YzUEyprw8xVq190USj+Am1n5uUhHbfumhHLcH9/kZnuEKXfh5SkRKxUsZhygSn3xuyhcUqjjNZnNvb29paalYLBYKhfCh6rqxRDyVSmXSk1QiFW/HvWnETByIS7j+JO7Wc6nNlcjtcqpSynUy6Uk0GvG8aGCCSHQUiQy42sp+zpHFGiDsGVgSAeamFCzmhl9KLUvZOsUPVRCh3NDafF7ZAWyJYbKt6fRLgJieolgRKBcmq2QkQEzbVZUKZaCE48McVQpec0SEWk9L70EjyPtK6YtpSDlYeD0kScje/kmJas1Bjxa70MQcFCyax/62uef2MJcaUzIS5ALBA/I7Eg6WBRAEYUMDaklthr0HDkuNOAnFMuCynwkBYqhRMcSm/KO0olUTsgwJmSZhrG0znSV8LJ8qKFnyrlkdZVPaOViUeLrt3Sfzc5gHMAblTpvxeyQSMa7rjscRz/MfV+eTAsRct0fi57Edjs7+D7mJI8tdgJZ7iLHbz3/+c9CHH6+2L857yKn5OTjO/P7Pf/7zece8cuUKNIgXoNwCIF60J7rZPDXpjKSKoULrs2yAz8bmFMdB0TdU3Y1Chey6knkmDLbQkirP4RnBEYNwhFyqQ+kzZLqpBLvar9vpd1W9KPkpUiOPUgx8GrKMSF62XHpVVWZouGIs+T/7YSrKlU3HMGH2KaHaXjbCZVv9zjPnPUrYbw41pj+c5WRvNeRmURGH8V64l6IjliQYQuchCIK9vb1f/OIX77777mg0OnbsWDabLRaLpVLppZdeAkK0ubkZj8dXV1fL5XI8HgfnEf08m80CMOr1eo1G4+7du41GI51Oj8fjXC5XKpWokCAd6o0xLH8DLgAOMix9AbYiRU98GRtBYwxUTfAJVCZGoxEIVtDmdl0X0tgSRONgASALkzfsOAEft1qtXq83nU7T6TTEXokAAo1ikIPLHgwGeHq4bILgElhRip+Swo/sCAZXNBpFXTxFkHEWDihZQ2fblMPuj4ID/X4fXGbkb86dO3fixInLly+/+OKL1DWu1+vXrl174403tra2wKdWJHrb4tkIk/HQrm672x1O3/uIaUIFjihpGoa+h8gpMhkmg0nJ0ZbVD2rCV+sOhgO85phlnEwmOzs70EP41Kc+lU6noZCAvMXKykq326WhKBUkkL1ApQi94wCMstiCKUDoVyCdMBwOqSwE2DcejzM2Q9LOCEkcmoLyoQ2Hw1arhWNGo9Fmswk6red5mUwGzPoTJ04cP368XC53u92dnZ29vT3kbzA2MWZBJYO4Nkz5gIXlcjkEgUhQ9fv9RCJx/vz5XC6HCgNZgI+3kE6n6ewnERAI0fAhf/DBB9PptFQqnTx5MhqNtlqt27dvQwFpOp3euXPH9/1CoZDP55eWlgqFwtLS0rFjx9QkXy6XL1y48Mwzz9y/fx9DXlWQPHiuPsiqsWXij3ioeejtw4p4hrYj/uE8sDXUaO6QVc+WDpiH/B5+kQ+LXR4RHVbk0EOu9uhYj12dIMWdFH0yVD3ThryPCH8/8LIPP47jOA/FTQuwuDsOs/VKSeDwNIZaX5QigVT5kMjpeDzudDrRaDSfz1er1XK5jFoKfS/GeK4bT8TT6XQmM02nUvFIwptGnIFjJsZxA8edRr1WKr5dSNwspGvp1DQRS0QiWdeLBUHgeSYajQCAUgimOajZSgkd2oQSkJKcRFnoplSYzEGXV+4ZVK2MrQxrS9CyAlIy4olYUZRDFvvjFgAN4wskm8uvyelXckLZ54lB05SC1BylP6A4wnL95SIumfJE91RX531JtQSb0f8kh67SotyODtSczy20AjdRQIaaOTOTcWu1WuAx9Ho9pc6ndHWNoDDjyAz65PKnFmi1EbVXPfQHlAdx7y1rZBVFmnkIlWSlawguBna7xIhVSbE5WHci02akRdPvh7mfw9WfsBkDmYlFvaHLHANhUKTlFcrom9GxEfVwUlHERqjlYHEeowYxRYejxkxnP0BNwjXGmwHE+Hk005dwxN8eeZwdnW/7eJm5D3vef63rXLQFQLxoH6lxvuaaSsoJIVRsVUMlveS+jVsWxQ5QsZmNpRphFc15XAkTS6xEURvkVokXw2VAEpbxg9wmcqlrtVq7u7vYBsGhKJ1Ow7KWJc82N8fMLP7IepMai+BBELriKg4sj7WoVLqEEjFWa2NMv98HPCFpC1Kg09bXk3l+7kvUAq8Iwnz7oZGwxIOkSCh+S46b3F/y+bPaTlnJG4sarBgfSt7XzNjHockGCeY+BO4gkG5ZsmQOKrvZl8SBoPo8j4nnDwXPfr9///79ZrMJuMoYc+zYsdOnTyeTSaiXJBIJiFDL/SKQWTAfjTGAiRHCAYZW1Co+QF4qSVVUIw1VFeR7wePl12QNIw6FvSmPpiBmQMaSUse+h+0s+C/s2DJBItkEHJVSktVOI7FXSza64gehvJobUIX1G6HFZixWo3R5Jj2EoWA6nV5eXj59+vS5c+eWlpbY8Xq9Xq1WazQaUnFY0TcUbqK0FAmnzsuRGOFk8tiRHfmoVXKOYriS8h86D/O+OBPKMm0Vh9uKqOqmqB/Cq4KIRLVaRT4D3FX8CjMnwA4GZtLxEsgmvsA8BwBoLhDoOVBKoUcieLWu64LRRt49/g9wGbOxrMUBaEteTCaTAVmYf8gEDGDfdDqN64QyCTnLjMo49JgZwtE6nU6n08EVQl5mfX09m80CrbbTpVhrotEoDFFZYE69dXqCQ38f19Pv9/f29lAJGIvFhsPh1tbW1taW53kw4YQsnSyaAUknn88Xi0XqJqGs5NF2KSoVEeqcY6c/1YpGxM1YtmmHgK32KJZ12bb+kk1es4FUY2lnKXH20LsLlU89XPDhkO/ME2t64KM45FySpMkFhZMbXV5DtyU2ov1AfHmeDnIoRvzAHYLafpgjm4LaNAIFrT7yjG2bWdm92lgOtOagq4T08ZO1gJj0oFdujMlms8vLy61WCzlO+1l7rhOPx1PpVDozTSeTcS/m+Z4ZOWZojGec2NRz+tFoPRGtJGL1RMyLRhzXzTkO0Jyp50U8b1/9mca8aocpV2TCZyjFkLJy0k4DU5/C+KTSi02pluiSrZRqDiq9cPEiNKxkItDDJUCMuY4AMSdzVjfKLZky75K8VHnGeTrstoJEKCFDTV/2SGGUQdEMpmk/EejwPI81m9oigWApNcO9H9KlKMfBNwHLwjmg1Wopyxa8bsg6MQTDkTn6KDkoxRLVEJbkXxmockfBhIHqD3KeV8rLspbUHPSJZZ6Y3UDqg0v2AH6QdauhZaxqtlSigjJKha4XOQf2LCf7JI/AoEOSCSROLc+i6A5cgBjaeJ4XCYJgOvUfV/f2BJYGWQlnpimB30bEN+GclzBmPGMNj82iLdoCIF60J6jJghqpVXR4kKPQYalwJNOPShVesTy4WHLGl1/GhK7AZVsuU4UBNsZhm89ILw4sltiAAgpZX18HeSGdTkMaUsqfsYKMADQBYgkiSzSZ6V9ipnL1JR+ZjAnXdVHxB8aWZA0Q1bLXVBNWAqnegow8TVg5uZK6U0Atl1U7cpOUBPWaJIgs4VfbojqUry33zbbDhtyaPFQRnG26GEq2Us4SsiKPzBR+mRZV+JPBYLC7u7uzszMYDMCfBWHw9OnTN2/exI6z0Wjs7u7SRA6gD92Q0BmoiQbBU8JtDJlYP85NHlQyQYRUrE+bc6H2WLLYUNYwSl9H4rAolkcFPQvTWJsP8Y1ut9tut3E9irukWAC4O2XYZSwTwlBZW3VkEocVJyh0aEjfJwwKbPexHSeRxxiTTqeffvppoMNSx3x3d3drawtyB4AdmUJQ1zaP0W9LRs6zmTYfg2+M4q2o0REaa8myWSXnqvSFFdCvBhqXDKUwLglB5IZDhwGqJhz1zCugx1IgBa+GKDCIPxi2CN7wV5FIpFgs5vP5QqEAaQVKcALwxRhh2gDqJXgsg8EAeAqssZlNwZVQtERqWQAgZiYVajAYXFiDZPk8GX+Enskjg1UaCkXxKCDtAm3ilZUVSGpogst0imtgJoMBJPBuzDxLS0upVAoPmWBHt9sF4QjLEK6k2+3CEjMajZ48eTKZTAL4Ri9KJBL5fD6dTkPE5uH6pDGu4/gWUUslG2yAwMzh0qqxZgfn5qB+hSSj2auDHM6qkF/qPEqXLRsRDtVzVBCSLTQhLZXsmdBYrpIPxNwf+Goe+AU7C865kepMvB1Z564MS23+Wmg2C7syZXdm5wbsTnL0mVNZuh0RVrafp2OMe3SA2HHMwSVDAih2UkTuqG3mLDPrdM60TR1khiydTkMzig7MGuZ23Xg8lkwm0yk/lYjHvJgbeGZkzMAYzwQmcJyxExk4pueanuNEHSc9q50OjPlwaHCqlEL8SIBhcibwKoEhbHh4m3bljZ0TUvXmamsXqjljrAmH0lUKGra1KSRArEQkbDxaqtZISOuQQkwmTaUZrxwF8zy+5KlxhZKOLYcwtfgwzbKI5xMRzMp6U4lj2rO3BIgliZjaC5lMplAooBAtEolg+bt79y6IDnhQUKnC5hD2zuSSU7AeZYUyV22D9YpuRclpCXpiR4qVWtGQVURpLCM+FcrJP2EcQcYS9/aMJiQtwF44lGMQLxi0X9yFHJuIGmTWwY4llZU0gQU2mUQBDYW0dxlBKHIxFyM6uPrG+KNRcGTfmge0mDFpMV1GZz9krA/xc2T2fzPDlKMzNvERWqPROCLldp7476O1ox8N33zY7y/aAiBetCexsRxYEmyN0KKVNRpSTVL5CHEPKgtSWOBmhJ6RTH1TRU4yp7BY2g6qMopQ9r5Sm0xCqyomAbDLrTMWnna7XavVsKKDpZXNZsvlMvZJam8hYUoJssNDCW5CWF9brVatVuv1evgtKo5RdYtC+Hg8vrS0tLq6mkgkBoMB0OF6vS6XPbmtl29BAl5yW2krdRwuIjyPs0O8Uqr7cdU3B+1lQ+2klf/sITLHoRiuTPibg3phiqR8lI2squSSaW32T7vqkCi/vCqlow3Ml1vMIAg++OCDn/3sZ4VC4cUXX4QS6PPPP/8f/sN/GI1GGxsbk8nk7t273W63UChEo9G1tTV0BogtsKodMFOz2axWq0tLS5FIpFAoYGMEpVEgWdwJwbGqXC6D3ogeCJSKuihAu4Ajg1yJgUauAXbApIJiU4VRgBJ+jBcqObRaLSgGYkOczWZbrRbsbhqNxtbWFoRi+ZoQuIKuiGFiZtxhyS9WajBSIVpB9nISYGgNngJFZtnTSFjGGSkOADeSvb29nZ0dPPBGo9HtdgEjLi8vf+lLX/qLv/iL1dXVUqnked7Ozs7m5matVvuXf/mX1157rdVqyeyRErlT6hbzlHm4fVcamuy3h1nMP1LDM6cCAydwmfWRRHUjHHI4e1PiQ/kCSfdOEyZZo+BjWQUSemQYJG5tbZXLZeRUhsMhNEDQLbPZLMIPlvfi1ijSjbkdUR+Q1qeeeurs2bOFQqHZbF6/fn1rawuCv+l0mvUcCNJQOyx5MVCrMDN71clk0m63MUYwGOG42O/379y5A/6RtO1uNBoYUwgvMc2CHC0t7yhnbIxBRIRRf/z48VKpBHvVTqfT7/chUjwPkMIwYYCEyYFWnFTPgNAN86n1er1erwNk7/V6xphSqZTL5dLptO/77Xb72rVrlUrl05/+9JkzZ06ePAlTPmNMJpNZX19fWVmBBRZyS0dUIlYkIC7WsrZJRd2yp4Uyy2w93FBLRpnVkF0XT4zwisKbuNOgxVYikeCfyMwreWd2VlVVQSkxXDs5akTpiZSzDFUfVpwAKR0eCgTbRIF5DkJUxqT/pzJCoC8cE5/2boQAIiYiZS/JKwG2GMp3U7OrLWAdiqCFKpCoEv6H5RF/OJ97XtQY52jZa2cGEBvhJzxPjdqmjhrhTyUfviqnUCOLAjXxeLxarTabTSx5dhbT89x4IpHOZHJZL5OOJb1kdBpxho7pG+MaE5hp4EwcZzzyR2N/PPHH02lkOnHcSRAYFsyhAyQSCSw6mGH6/b70WI5EIu12G9sVljMSrLSd2UxYnYHsM/Nc6cx8WX9pVyilIZQiRChwL/eWMulum2txSwDYUTmqYXKWgg+8tahocrGw+7NkW3OLJfuJHMUUrsUBpYHeYxeleezosF1Rx3I0Y2knSvI1nS1pcQxvgFwuhxkJCm9w+yBci40BTGtBK8ZunPxrbG4x6UliDQ2WZaBN1WlY4Ha7XRriMdNAooyckKVEhux+ZEFhRuUty26D0cdMGDME7Gz0zpXCPrIQR9ILpOoFeCEIAWT+D+W5CFjmTaFy1WMuRKnH8C1QvUo+W26VGRZJavaHWhzG+FCVfCw7aucgvOtYP4T+/KhD6urVq5cvX4bKcGh76aWX+M3HONB4tMuXL4fKEPOS3njjDfl9Xs+8P3m817loC4B40R4DOiDpCdRMsMkmJqzeTe6wGbnJ1Uu5lyqcVwl0EtuVTr52IpRbRnWFPAhz/moN426ACgkEpABsRaNRVIsDtEomkydPnlxaWmLoju3CYDCo1Woo7CUuAOYF6p0RYHNfXqvVMpkM6vii0ejy8nIikQDxyhgD4cgLFy6srKx4nnfv3r07d+4AX5OurEpxifGwhJOUklooG3EeBzlUSVluCCj4YGbVOnY5pyJI2qKK6re275A5SBSVGqZ28C9DIyY2jhSGzfbEUixCUhdt6zBZGi8hZioqUH4BAAHUPH/xi1/k8/nTp0/n83nXddfW1v7kT/6kXq+//fbbGxsbN2/erFarx44dS6fTxWIRcRqBBhwcP3S73Xq9XqvVEolENpuFrAGUhZHJwFaPAgv5fB7CDqDlInqH1Bdj7MlkkslkAH4pITPSeRgnmINsX8qBAQaCPi81iAeDAcYLzB7r9ToGlLSYJ+gMvIAmHkrNTQU50gqSfArCiNwLylAZe2u+1tFo1G63SZLChfEhVyqV7e3t3d1dCNrCai8Wi2Wz2eeff/7y5cuXLl3CPcIS7Z/+6Z/u3Lnz7rvv3rx5E/LHtpmSuinliyhHpdzdKtb/x8Qd5qyOXbisVzBhBao2YoILltajckgaS1JGzvZyLZCj0iaVyHIBpNBgGBiJRAAQd7vdVCpVLBaBTgIwZelxMpnEqoFEiMxPxGKx1dXV5eXlVCqFrEC1WkXuhKAqKCo4GvIoZLvD5kVG1EjMgFYMpAN6QXt7e1gjINqA4UD/RgLK1DbhrCvFCnEB/X6/0WhgPkHSqN/vl0olxKIY4JJhJ0W9cWtSf0maQJJZhqQg/DO73a45WPUMEHl9fd3zvEqlsrW1hYwXNJoIEMfj8VKpVCqV9vb24vE4KMkPFfNLOqSEOxX3Slkz2XRgGdzKnqwcdSQxytY7ktkOtUeSmdREIgFBElgRSoUu6bqDdIUkWIU2O4Gq8iuM+WWVvTKkUrUvmOoJBs0DiLnxkN3PWDoe2DRCTYipEYIUGGssN8FJFbGa0wWWDGZQZGU0fcmkZKcyXpO6SRKzUN5lh6gzy36iNgaHAGSHe/1BYcEcUa7adY0ljysXRKnVq4AhuaVXLlUye6qcrDAlOo7TarWw5EFd7QA677quYxzHjcWgQRxJJyPxSDzie87QMQPQpI3vOBPXGQ7dYdwMx0F0PI2Mx4EZBYFh/RwxYjoqI62OfzJzRk9R0iyoRKdqcZRrse3dp96+illC+RChxpXmYMW6GjWyGyvCo5QGtrfBvHFOv6TUqKBGXrksUJAUcjsFK/dCagOvAGJ+QklZKSPwhAPEalzLyJFWFvaMzflNUmvJLMbsjcWUe1dWSyDuI4kYghJSKk2KTbNMVqLVCtLlRArEGeiqBIglkUXmFeQ/jfB2k4s71wXmhglSS0sMPjE16cmZ37YB5KImbx8271z0WdWHXLjtUaQKXsm/IblbDkDeI5ZRPGRFBQtNk0hNdjOZONOpHwTuJxC6Id+2UCiEcm/BL37stFweMJ/Ph36BvGZ+E2TneXxn+/uLtgCIF+1JAYhVNTRToERpbcjGhFVCEdcgroRfsZqVYaqsdlFSlcSAJGnUdmBT2XglM2rv7CXAhNUR21Bao6I2FryGfr9vjEkmk4lEYmVlBVSpUqmUyWSAgjWbzT/84Q+tVgv5W8Bwe3t7vV4PQX4mk4G/Ae4aKdN2u41HsbS0BNFhlOsWi8VLly698MILpVKJOToaK0n+kQSSZGgk75o7Qrn3lR6DoZprZk4tLX/LaIEKsIeUzNsqE2aOnYstwypXd3UXihNtt4eCz+Y5EJqwQnh7W0k82gbEAdFGIpFer7e9vX39+nXwBHFrS0tLzzzzDOrTb968CT1i7n6Qz8cnIPRRsmA4HMLbjWJ2QDnhKScxC/IXeIWMEAj7Ik4Dxw20SnNQ/AsfkjEn5cMkEiHTNsCn+BJpKOH7fq/XQx06BpqSF8c9KoxY6YrIiF0CrxIUkKQYpazC2QmSi9i2EtzHn0PaBRSqXq9HbgKsvU6fPn327NlEIsFJcm9v75133rl9+/b29jYU6GxvcYXzKnakSsaoviQVM+yo7zGGVeagrLDiJ9qXrdA0c7Csz7bltDXNQ21kbARHKRTh2oAIQ0KXKBIwhVKptLS0BFn5wWAgxyOyF9PptNFoQC0aXvORSKTT6dy9e9fzvN3d3fF4jPLSUqmUSqUYthF1xWLBKJTsFVqKUxyZ5iqAgFlxmUgkisUi0oS5XA4FBCzRILImM1U8NfvDeDyu1Wq3b9+GxRwWMohOuK6L8liwpGu1WqvVikQi5XIZi040GoW2MiMxmQVkpDcajXBkZlNwcIJ0vu8nk8lCoQBqcKfT2d7erlQqhUIB8DrXR0ClnGqOOlFbEknz/AzmrVxKR0J9R8XnysRG9UZJKw7FGhQ6DFEdxeZWZFvkKuz43F505iFZtpyF1K2S8JAEpKS0+jwGJTdgODJ2TdykyXmAdb7I01ChRWpQotCE4b26VO5z1MZGsZtl/kyCLKH571Ci6OF7APU2D3EKfWDK7cB6ejQCsroIW6PWFrlWi6PNXSX5VPLTJbeO2BNSzu12GwRGYMQfFoJEIhHPdR0nEk2k0tNsLpZJeYlIwptGoEEcOCZwTeAFfiSYTMxkEozH0/F44o3HfuAZc2ALQZ9bPCvMrpjxALphjmVZDw0MqC6i8qzyHUlSvBJmlYn/UPqwXYZv6zYcMl6UOhAgRdnUJRnhXUH2NHk2MvZRWmHKDuSBzpkyZcJdEAmV8jtSM1DK7B4IGYxxgsD55ES4h3wS+twOWSkUp0pmoaRctb2zVXOCza3h/lzKmEgHHQqVSLtgM5M9nDdXmIOKSRIED524lIavCg/nPTc70JYUdUK9ShnpEANVtde1K07sffK8e7eJJh/+8+OhXPxx2htvvPHNb34T9NtXX33VRl0vXrxojAkl+X6UJhnEoV8gU5inBtn54sWLoVg2j/Pzn/98gcgtAOJFe7KWT6URbK8HhxRE203uWihspIBmFWjJog+laKkCgNCwQcJYocuYQrdp6CytZqSfrAIdVlZWSqXS6upqPp9HrNtqtaACgQA4lUqBy9ntdrFa42tcI8GsQezt+z74xTgX4vbV1dWVlRUwQ6FOgG9iMy0VPJRHmVqYDzFJl8CxBINCX2hoXartEKKOPG9zNs9E+JAz2o52NrFxXtj/UFtG291FScWZMG1BeXYpooLPkTzH2weO8/7778MBplAoJBKJY8eOTafTVqv17rvvQvUPHEASEwgfSNO/wWBAKh9CLGwZ8Vt5/ZJ+KF3LKZ0mhXopn6JqlmVdswq0zKzUgEZeiPkBEFPhFNRgUomBUmGAIFgywrNO+X6o7iTxX4luSBBZCUYrnh3xu06nA70XjDVQRfDkG41Gs9kE+Ij/Ax0+derUiRMn1tbWqCcwmUxqtdrNmzd3dnbgIkiWiizcVkXial6SDlf2/tgWUflYeTcUopVZPZquyHIEmdKTUQRlhSgQwfVF5gJV6kiuPvI4crYhFAKYqdlsViqVZrMJlW0z0wgiPMpeh5fCmkqgllBxYVKEEtLoHpFIZH19fWlpCRpBvu/ncrlisShJNOAd06QOCEt31kjqpHI3fzsYDDDhnzhxAvwLJIowz6fT6Ww2C51l8I6hM0PNYgxeACiO43S73Vu3bu3s7ACABjFzaWmpVCqBOO/7fqVSefPNN9vt9srKyvPPP//UU08B/kbJC/OFmLUkzQ2vGBMRUpvIQlEBYzqd4vMgCDKZDAHia9euxePxp556Ck+A2vqo0Xk4BvGs/jIU75sHlim6pZJHUAkPY7HUFfYkm+zSagHCnAZlCdKHQZgyB33DpHWnBIjtZT00Uyv3MBIgJsFNAgHmoG61EV6yNNEKTf/zLJSGQLX7PgPAccwMocChwGpHUwAxMUppPiYr66XxvUo5G1H7ReaBjS/MK/Ofp7CsCqJtmI85dQmFS864FLWwd0rqYqaxGI511P2J6I22AEgoLqPk4CTR1b5rmUmlnC6YvL1Zw2TFDXzU99141PVcLxJPpkw2E08n3bgX93zPGRpnYALHGC8IoiYYG3/iT6f+ZBqMxxNvNPZ91xiHl8ROy0vFVIyuiAnTGAPyBGF6EuRtNWHZ2xW2pWYJJX9k5xJkHkJpdyhHXJv/yJ4ADgq1BZAYk6UhKjVFyE+OESk/zZ4gQV6l+x9KlZDzm+wV0nZYdVd0cor4y02XhDifZHRYZuiVfq4NL0oVEYx6mcPD0swpjjtbllNIFSyqBlNigm+KiL+Up2O8aYQZAHTq9t/LQXiXRFp0KulWIvNtctspyeaKQcxPbChZSbfxlkMdYoxQtCCcDfk7JKG5S5fCFLKzyc7Jq5JjTdaWyapiyVIyB2XHjbVtUIlejnHvYbN3T0x79dVXX3nlFWPMX//1X9sAMbDjjwl1ffXVV7/5zW9evHjxzJkzGxsboaduNBqEkn/6058CBf7mN7/54x//WH3/r//6rxWgvGgLgHjRnhSAWBH0bNRPOpmGBhKyDprrpQT11G5GAge20IGiAMuNnTwdDe7kuiupdkaoO/FKFE8WS/V4PAbzBZWzWNrB1oQCMiBdRLwIktfW1mBxiwhqOp3mcjlQPkH2pI5bPB5fW1tDLT9QjGKxmEgkEFPhjKurq77v7+7u9no9EBIBBXKLLDEmrv0S4FYCEVLxkIihEoye54htp2EpLCWZ3fKF0sHPWHZbij81L3WswDKlumgOqkzMU5o7CvqgwHFJbMT7Uvb0akRIsEDCf5KxBXgRB4nFYpubm//xP/7H//W//tfXv/71r3/96+Vy+cKFC2fOnFlfXwcSVK1WjTGbm5s4I22gOp0OehQApt3dXQgQnzhxYmVlhbVaoDHKsEcOW4xcsiAlEgECINIbwAtAFQSzEqOAZaoy7gIuRq1VyBdCuM3zPHiIgRqfTqdTqRQwuM3NTWNMqVQ6c+ZMsVjEyAW5mIkZquCRJmOEaDgGKTA+UJyMUKKUmL5SWQmCABFvq9W6e/fu9evXAcoXCgUoYHieNxgMtre37927t729Denh4XCYzWY///nPv/TSS8ePHz916lQul8M4unfv3j//8z//1//6X9977z1MEXxc6gJYaTiP8G4XtyoOtQKnzMfAepBMUkVtlrTNeZODvE4jyhRsepfKQzBYUiuFrB6QziTInezt7d27d6/ZbJ46dQqRCfnyd+/evX37NpMcAPRxayigxqiBmA9Sd+12u9lsQh0oGo0WCgXoVGQyGWgOImyjgRKwP4xQuhf2+/2NjY16vY5uCeooLhsJCegw9Pv98+fPf+lLXyqVStvb2zs7OxAWX19fhw4GCqvRl7rdLtBYlrUyrPJ9H5xcZjdRsg1gBfLB9+7dq1Qqt2/ffvfdd/FwisVisVjMZDJPPfVUKpW6fv16v9+Hzob0bmVICaY/maHIA8Xj8VQqlcvlQPGD9R8Yf9FoFLU1rusuLS1hjOMx0qjn6ADxfnfCnGMFe/tdCzOI77ue5xzUYP1wAXJdl7CpxCJnfXEfj8N/6HWz8WlDL/vYjee5IhbFE8OTSafT6XQ6EY9HY7H9ac33TRCYIPCDAH0JGBwA4v2V3XHc2f26csjPznoAJVRcxYM+S8bSaCKTXXr1jGaNcqShKre4r/1sN+bkSMRzXQ+gBoQgR6PBrO2jGxjp5ATM1tPxeOxFItHxODDGFcuoUsriS/9wSyP2lvvML0wyQcBH48zQ1f2fD24y9tUbiArN3nggTqQyVR9CDLPT7XcqY3w8f2GiiDNK7Bn/N0EwjcXiR/NBYj/3DybUcS65Ewql7Blj/DBJCkX3xnObTqeTmQwF9eUAigHoHw6HXiQyGY/R2aLRSOB5nhdPJLxUapKMOxE3aiae6TtmYIxjAs+bxtwgZvwg8IOp7zuT6WQymfiBGxgn8APfnx5QUvI83/envm+gUuo4ge+7njeZTo3jUId9f2claObz2A/4CS/rw7WJMwZXooNfwK/MQYzpgECE57kHk+6KWyqhYeosy0bJV5tIEcyGyb6eAzveDCBGLlxaLOhISvxnsyX2Hyy6hDFmNstNxuMp9q4HTdK4lM9mVl9qLeNo+J5ztP78x8SF5TSyr0NojHPQryKYAdyc8ImB4s85Rbc7nf0Deh6cDyCjHwSBh4ScEExDIdF0Oh2Nx1OY5cbjqWQylU6nZnayDmlPFicGcylsDTEGJ4LtxMuIzBSisANxMD/PdKU+TGUh/TOZ+EHguS40KRzXdWZSP9Fo1ItEHOUIFwT+jBo1EXZEU9+PCPqU2jGSq8Feus/D6Ha7nQ5d1h3XjUWjjjCYxfyD1zEaj4ejEdL80rI+VMuIWY3RaDQW9Tf7S6frUqXnQ0qaQAAwq0BAxItGo7GYOxv+H7VNJqbf/0hHGI0eism7sbFx5syZb3/723/3d38nBXwLhQKw40ajYQOyH7399Kc/BQr8gx/84Fvf+pb81csvv3zmzBljzN/93d9JQPkHP/iBMeaVV1559dVXJYn44sWL3/72t4EOLzSIFwDxoj1xALHNPJWViVLcSsGvilvKnZNEM6UslyySVQUsckOjMBG7hsUGIBTpRkWSRFtYP4u9Gv8EvEJwdQEQ48PRaIQq41wul81muTuMx+MnTpwgIQI7Eorxw5hre3sbVkJwusNSmkgkCoUCVdUYjcfj8d3d3Rs3buzt7b3xxhu3bt3qdDrEHO0EPuv1JBtUAuXKuU5CV6G8XVlJpxQ8JC9G0bWkjwoxR1tWWLGoQiMxc1BL2i74UgyLUOrEPBPnUPqwTZZXcBgp2+agwYXMOpgw3Qm6SaAjNRqN3//+947j1Ot1x3G+8Y1vLC8vQ7ek0WgMh8OrV69Op9OtrS1sgHK5HOIKIC9AgeFTB4BsZ2cHlndkN/DlUtiBL1SZCEtJShaAt1otCC9AfTubzYL/wpCSWC2AhuFwCEFkimAgfYLTgUQWi8UymUw+n0+lUr1eb2trq1Kp4Gig5GOfioEmUx2hxC6cVPIawFOjKpysl5REAwCI/X6/UqkACgSGCH8/KD4TCNvd3d3b26vVau12ezweF4vFL37xi3/1V3/1wgsv5HK5RCKBLVej0fjtb3/7D//wD2+99RZ1ZsCvVL1CaUTMo7rIMUgGhz2uVRLo41gL5PiVc6l6O7boJ+d/WQlrrNpAe7yEimnI86poAekQCGcDFZUHgYgwVH1WV1cxaYP+g9Jpz/NWV1eLxWI8Hu92u3TnQ1QP/Bev0tYJwTfz+Twkv3Fq0uEnk0mz2YSsfCqVIkGv2+02m816vQ7bpaWlpaeffjqTydTrddwLzZqQVQI5l3xe0n9IwGHNPjDZTCaztLQEnQoOapB/IaUSj8cBlDcajb29vbW1tVwu1+l0qIhCTzCsYkAPk8kkRBJwrsFg0G63kTqKxWIgyQI9Rx7LGAOMEjfb7Xbh8INv4hTSc/XBvdF1g3jcj8d91w1isSAW82MxNxIJGM4FgRMETjTqjEbODIqdGDM2Znqwm4HuBclzB6EyYA4MUgTGjjM1Zoq+ZOkgfYgp49o8z/E8JxJhUboTiXipVDSbjWezsVgs6roenLmY1DFmaszE80aeN3CcvuMMg2BojG+Mj2PM4tv9/YzrujNYU45313FczwuiURONOvG4E4+78biHOT8IXPF4HRw8CCaeN/Y8LgMT1x277shxho4zMmYaBFNgCr4fSIzYcVzfjznO1Pf38VzPi8xu2fF93hFuauS6Q9fFifYBYpn+9zwnGo1Eo9NodBqNOtEo3qPneW4kEsRiQTQ6dRx/OvUdxwcE4DiB6xLJ830/mEwCIGUHw/4PF3GxeH8I3+MAjhM4jh+J+LHYNBbzYzE/GvUjEexgDNWZxP/x1vZBZMfhm3KMceHKFgRmhpQFchZFX4JKiTH+eBwczaRujOJ9MDQF6HkAv3CcwJip4/gzRztMo/gTPwh8XEwQeOL7E8cZOo5vTNQYzxg/CEbGDHx/EgTe7Jt+EPR8vx8EeI/TWMyNRHCiaTQaGMdMfWOMayJewguSZuQ6fX9qxtOIb4xjzCg6mib7QXzkREaeN/aCiOc63n5H9p3AOMZ33YkxE98fRyLj6XQ8nfpB4M26kwkC15jJdGqm05Tvx4Mg4TgJxxnDtzAeD6JR4Fwf7tzEw1fDljlJVfS+n6bCMDfGD4LpZDJ1Xd/zTBDAxiuIRoN43EQiJhJxPM+4rvH9YDwOjPEnk2ksNo1G8f8JSqBmJ4apqB+L+fF4kEiYZNIkk0487kSjBmJxM2aoJLI6vu/4vjOdujPA2vd9ZzT6MOUQBL4x05kAl+M4xvOmkcgkGp1Go3406sdiQTzuR6Ou5wWz6RFAM/PV+wkw3/cdZ+z7U2OmxvgHu+7+mh6JYJximASxmO95+8A6Lulo/dk3xjUm+kcLZh1n7HlTZApnaYD9wSJ6hUEKMAim+DkIpsZ4QeAaMzWmb8zAmH4Q9H0/EgSYVIfTaWc67UynvSAYOM7YdSeRiOt5eP5jzxu67sj3x9PpcDyeTibGmKTnBb7vBoFjTOD7jrBHA0y//zCNcUQiCrPNNBp1PC+CAqkg8Gb7q+isSCWRTEbAYo5EkCp2xaJGYYfAGA/uAigucZyI50Wi0QioTrM8Fs4yDYLJjCfCpBE20MFodCD0Y7ZpJmI+hp7+dBpwyz0c9iaTie9Psa8zJnBdz3Un0Sim32k0Oo1EjOcFWEFcd+R5EcfxfN91HHemZMJJeGrMyJih644xFRszdZyJ501jsf2Ri7nO83zPQ4HL1JgJOvksQbsvnxKJmFjMjcXcWMwZj03kccBfvm/+038yb75pPsrOvNMxzebRv/6d73znZz/7mTHmJz/5yXe+8x0wcM+cOfOjH/2IKK1EYy9fvozvX7ly5etf//ojX+aPf/zjv/mbv7l8+fI3v/nNH/zgB9///vdxlpdffpnA9A9/+EN+f2Nj4/vf//4rr7xy5swZXCp4x5cvX/7Rj36E73z/+99fwHELgHjRnqwmwTUS8cg0ka5QRmgTS7KwYoBKcwzqFao/mWezK5nFzkGnDolHS8YZi+tllZmSwJc2vihnox0Tv8A6X/C2EPFCLKLX64GhJp8YfHjUjRDcAQENbMd4PA5BCUhJUk9N3tTW1tY777zz29/+dnt7+/bt28AKpUybLExTEhw2wmsOenYrT1gTVn1pa04pAIucPpUzQD9R4gy2RGCoJYhtrGHru81TkLABaFv1eF6HV1WK82SXQ2Flc9AIRdlkyzclFaLBs3vttddisVg+n//qV78KgPjzn/98LBZ7/vnnd3Z2/st/+S93797t9/uFQiGfzxcKBdSOocMAnwWvfGNjA4IV4BEgJ0ETGA5k9HYgmMlkEghXKpWiGjiwJ1iuEdgdjUbwE8jn857noUZsP3wdj2Gd0ev1Go0GTRehmwG6PViZ6L0AsECvgO0Gxmm73R4OhxhTElelDKVkEEtLYhCcbScNAG3QDTAHS96Q+6nX69vb251Op9/v1+t1EEIhOry3t4dXCbXWer2OsV8ulz/3uc/95V/+5Ve+8pVcLof3u7W1de3atdu3b//mN7/53e9+B8CRBE85ZUnatSqLttMkdkqMXVTm1Y6u8/PImcIQCufBISD9KqWDlhFFuFJKSN11qOeeqoSVtfZ8xRhxODIIrXB7wycQQACnNQiCdruNZ46OBO9HyDvkcjkkYJAzqNVq+BwQvyRdYvggKQLqOjpzPB4HcR6HhewDPPFwkez2KNmORCJwz8PkXy6XIUBULBYxmjCKoSxBjjMVM1j6Kqd9epqD1Axn8Gw2i2RMp9NBpvP48eNg+yKpOZlMbt26ValUPM+DRjP1KNljUYeBhZ5SCbgSqN8YoYjN7CbBZVzqcDisVqsou4EwNASRQ8uPQqZoY5wgiFcq5X/+58l773lgNHuet6+DKvCyGVuKlNjxZDKdTAIpkH1we/PhEWbBJ8Cj6SyhJAeAJIc6B5dLZm4cocC+b0wXiYBtBQTKneEUJgiiQZAcDNzBIDYcjsfjqVVKvM8VtXQEAvFw3FnMz34bmfG7HOtJur4f9X0zHkdmoBh2A/vSszPYQmoufAgQG+NFIrFoNAqdkFgsEothP2ccxw0CLwiivh+MRsFgEB0MUsPheDz2p9NATikACDzP87xoJIJp3/U8Zwbj4nN3ViwSnU694TA5Hk9AbxQbPyWHioP7Myxs/x3NXhx0MBxr6d+3n4pGY7FYbEbEMwdx4QM0akB4xjhB4M4YxPtvyoQIWDgzxNOlzGUk4r32mjnC5uRPgiAWBGNeyQz1cFS3dBzj+86sJ8tcOl5lAKQGVxsEznTqjscRx4lMJnLBGo/H0/GYEKE3neZaradv3HjW85a3tlLlsud50enUGBMD5RAPyjGpXnB6w3z1bae8axpj4wfGBI4ZT7zuvUxwoxjcyHZaiUQQi9Uj0T3HiZjABGLvNBmPR+PxZDIBydERw5mkyMz2Npw8UslkOpPBVmF/NSQozP1k2BxipMzoDB7yBfHciNwDsiPYSUc8LwImo9h+BIDDxuPhaFTqdrudTq/f7/V6k/HYn/UKrlnxRCKZTKZTqeQsPbav235wBlTU3UAqLyFaGY2gNTYajVCIhBvAJODNTFbZIHlgJEA8R5V7OplMDwLlfFzIqOHgIKvu10OQxu44zq9/jZyKM38OjxnzvDHfMqb/x4lkg8CdTh3UyeF1I/EzGyxy1cCL9qbT2HQaH41A73UcJxqJFMfjlV7v2O7u0tJSIpnEXDeZTIKdncjm5rF792rNZm84nE4mEd8v1GpLxuRarVg8bmYsYKyesWg0Ho/HEwls4/mKg5nC+D5OPas84IqjkxyciGZTZSwWi8Zi3iwfv68XgRtEV5/Nko7gZn24Drqu63kg7CN/8GEKYTodzxjr+JXUIdkvmgFATDY6yv7gsjsrFsHeaTwa+ZyFZluFNIoK0+lkIhGLxfYfezSaTCbjiUSEGVwxpvbxZd+PTKfBZOLi2oLA9/34dDqdAdz7a5bI5vrTqUTAg9kMs5939zw3EnH7/cj9+9OHUb6aCxD/7nfmd7/7Y6I3V65c+eEPfwjS7s9+9rONjY1GowHpYVCMv/e9731Mp/7Od77z+uuvFwqFl19++eWXX75y5QokhvlbpTX8ve9976//+q8vXrx4+fLlW7duXb16tVAoAMU2xvzwhz9c6EssAOJFe3IBYsY8tgG0QhVtxq4C+CSDWAGRqkpF4SnzSG22whqBSKKf5E7Koyl+MamIUnuLoAYCb1TdkmIMUhjhnlDoRDXP82BnpziASsVMsiOr1eoHH3zw9ttvVyqVvb09CBZLfwNj1bIpaFWB++ZQBUO7VE0VvKsSeIl12qewdaWV8iMfrw1I2QCxsdhbUl1LXa0ys3oogNjWP5GmWOoZKqRMXgn1vICzyE6Fo6FbRqPRRqPx2muvnTt37lOf+lQ2m/U8r1Qqvfjii+fPn9/Y2PjVr361tbXV6/Vardby8rLjOFApxf4SZD0IBe7s7CwtLaHAHFETb5+sQzpoNZtNdGyInPJSsYulR7PE3fB/YwyEUJBTcV232+1Wq9V2u00zIpAuYc0EKA1IjRGKtNBwgPOb7/uxWAx/7nkeDJ3YQ5TErVIRtXFVDCtgwXDXwakxA+DKB4NBrVbb3d3d3d1FGSAKCPDcHMcBidjMpGm73S44xSdOnHjxxRdffPHFQqFABYxqtfqLX/zi/ffff++997a2tvB2ZBJLMW2V/qmZo3CtviMTSDLxYw/Ax0gctqn99gRiq0CY+WIsxnIFIfuJsicq06O0OyUSzawMZu9Go4FpmSIe4NIuLy8Xi8W9vT3kAGA3iopRY0wmkymVSpFIpFqtQncYhSPZbNbMbMchnAfFVdd1IRZUqVRgBZlKpZrNJsV5OTogyAtgFyxgYLIYuZlMZmVlBfoMq6urlGUAAksZcVQJGGOy2Sw0HJC5kelPCkqwT/Z6vUql0ul0gBFPJhNkNHO5XKlUWl9fP3XqFB5UtVq9ceNGrVZDrogWajIRy6UE945cDjjOKHzBPSJbw3UW8DEmKFCz33nnHdd1z507l0qljh07BlUlCI8+oDcaMzJmEgSpe/fW/8t/CWIxR8hNHOJpI52DDsgOkEYaNpnzm/KvQgDime7BvAwKapk91yUFOBBg9/6qDUQ1CDLTacilquEzO6MTtoSZsMSSERznD3cjQeD6flTAYYTMDkg0zJlTHO73ZgUCB2aqIIgEQSwIUgjFQYsLg+2cGWi7z4kWaIh8NbiKNHCr2YXJo+1fprWhke/rAEpo5ZUlEO/MALXg0HSFOyPBmTBNA+dg793/8uw699nT1Sp2J8EcoqVvzNSYv/L9lw52v0MAOEO07uAFmNk75bNywFGdTJxZ5/mwA8iZfzKJ1GrJXi/5wQcYrSjP3+fVuq5xTGAcY4LU1DzbN+td59/1zGQ8u6mp73RGXr8fbQw8b+K6gGs8e4DvA0kzcqsENHE7UgV4X+SBK+mDZg8jxUaUmST3kPJza4fME33ISQc3E3IQNEtQ4JToD84MhsP/8YljXad9eQf+ORuhAUOegyEVxyZHqGP1meDg6FDiy/yOI4/MRVnI7H5Yho9fNRrBZDKvPwfGDI2JGvNvjHnmjyY04fvOeOxMJh/OJNYqEDKBDwaunMZdN7KzE/vgg2gsFp15saLbrI9Gn56pxkM1yHEcbzCI7u0xHJO+Zx/CqYp8MwPuVTLDXndCrlbUlDjK4nsOrGxPVo5SEGZXJAuBA1OM1g/hbF6hzLDKTSlp++I4rAOFb7XM1DpCQ4P3EqgVJAg8Y1zfj4kzqbEsxz4HrB7ps7v4cLD4vre7OyFQ/klr3/3ud2/fvv3KK69IvBWQ68fKyd3Y2Lh06dKPfvQjiAvTaG5jY4NcZtW+/vWvv/LKKy+//LIxhih2o9H4/ve/L+nGi7YAiBftSQSIbUHb0J9tbSAbYZyHptmeG6Gon0IlQg+oLlgCFuoi54lUKFcuYLIArYD7IIanTdzRG7VfDwFleJ3QtwIlE9gcb+QQKxWJXUp89pBzqSMcbskdao1iwlxiTZgZ3TzPWfss9pWHYrIhQfJBJeVHAM7UY1RddF48InHwUBscm9QMjBgA0L1796rV6vLyMroWqMTT6XR9ff3dd98F0JlKpbrdLlmNcKIAWgRMs9VqAZCaTqdg7yodGOmGBNCH+sJAkI2w2qAyzGg0arVagIGSySSdlHHMbrfbbrdBe4SiMalzRJqI8/IyQB/u9XqQb6OjEcYatSmkJw8TPzIdJaVpZWIJIwjESUBUgIwhiDkcDmE9B/gY/Q24thQ+NjNpzul0mkqlstns2tra2tpasViUtM1arba5uQkB3MmMjWWPBdlsz6XQnsx+rmZjNRY+DnEJeYXsDArvnpe5URO1csu0FTOkaAPrPICiKm4gL0Naj6KLOo4DQWGQFIBUIhOTy+Xi8TiYvxgjeKfgzkciEXQGqY6CehGAtshwJJPJQqEAnWvf9xuNxs7ODgYa2L4AQ6nBx+eDo8l/plKpTCYDaJVFBpVKBdrHwLhBAcYoQJ0KTgFJB2jaEpMFYRmwMjigvV4PGsoY7FDCLRaLJ06cWF9fh2Q5nt7m5ubdu3cxflnXgpoGFBZgyOBXnud1u93Nzc1Go7G7u9tut0ElzufzmUwGMw9WK2S/oEIIHLler9+/f384HEKYBag92LV4X4eF+ca8b8z7QXCy33f7/UBBKocCef+67aGGpfNHPNdjuYDH+/z/1d/mHxkLcIwZGXPDmEHYbwfGvGfMTWOKxiwp1PvQTeTRc4AmCB5MYQ4CMxqZ0WjSanUe9IgcYyLG5NQzhWzB43tHj/V4H8trnddRceXjj7kDT/+Vhgk4pNvG9MJ+2zfmTWNWjSkYU/qjTsHB3EEx7/M5zKSJMRPrQ9eYpP7e5CjPMHgcc9EnC76cNzRCR3Twkc8VeijnCA8T3+kas22Mbz6R7Yc//OGPf/zjy5cvA3Xd2Ni4cuWK7R1njLly5coRHfmO8rWNjY2vf/3rIAWDO3zlypVDiMCNRuO73/3u3/3d312+fBlY9tWrV69cuaK4xou2AIgX7YnDiGUwz9BdgXeSHGoseq8M/iWcQYFRCUoqdFKKJ9DsSwkNEzhQKMaHsaVgtCkkmgeUBfho0FUsFArwl//sZz976tSpfD6P28zlcidOnICgxMNsVIJD/gk0Cjavw+GwUqm89dZb9+/fB+vNzCRWIWEsEROp7CzFSU2YfyBBGel9bM/+SgzU1g+VJsgKneeLUB7xBI/AjFN3oXwRJT1cvS8JFBphVyXRpXmqtYdhEJZKhiRpKoNyRQqWDwoXTClS+iZL5jg6M78znU5v3rz5j//4jx988MFTTz31qU99ChDk0tLSX/zFX0CGotFoQOggl8vBVCoSiaDWD8zfbrd7794913UBJQN84egDVLS7u3v//v16vb6zs4MPHccBWJPNZtPpNPBN2usBiQYEDBS41WqB5oxHBHh0d3cX9fWJRAJirMlkMp1Ow56OOB3tHMHtrVQqlUqFcr2VSgV05n6/D1FXqABLmRql10ElVpb/w8qDmsh7e3sEiOE52ZlZZFCyFs8nFosBRgQiBk408D7A1p/61KcuXbr09NNPP/XUU6wNHI/HH3zwwa9+9aubN282Gg1QoYEh8l3b8uihqQgpUWIsmRpV8SDHsoJfH+P87wrzEJvJqxz/FDQsRSc4uGR6jEdWIstqWpC0YtkTKD/CR4eehtdK+Q5mBeCwhL4Bzjgpt1Aortfr4/E4m83m83mMKWiPjGf+MHiz8B3FGAHQSS1dOIyhmyHzgcFFyRfoHUM1G4rbAHl7vV6tVgNyjVMkk8mVlZUTJ04YY2q1GmpHoPpC8z2IzNANhl4u+6WssRg0kSuVyp07d8bjMQxR+R6hFWNm1aZw4YO/HGTNQWSOxWJIouAC4vE4HmCz2QT7fr8ONB5HfQweAtjKzK/gjXe73Z2dnXv37tXr9fX1dcwPuOwHdt2RMf8fY/7ZmPgTgPku2qI9ruYb054DQ9SN+X8Z8//9I6q1LtqifXTsuG3MnbBfVY35f4z5fy9ghUX7hLSpMdvGDD+x199oNF599dVXX331j3/qq1evPpS53MbGxsfhm7doC4B40T4WdFjqPIbWPs9DPyW9i/gUAngJRCoCmlI2INQoL0bKehJWIBAjFW/xszLvltAhgVEKVgLDAuhASKtcLieTyXPnzn3ta197+umns9ksLgPYHKp9H7DGzOQgFEkZqqzkBeM4IIHCzXxjY+Pq1au3b99uNBqAjFG8TFhEQcxgbNksXanOrIBXBfHP049WoI8ScFAvUZJPjVX+z+Mr4VR5TGNR1OXtKMzadrSTPz+UNqtMh9h/aEts25xi9HM+GYBQyrtvXynS85Tm7/b29j/+4z+m0+kLFy781V/91Ze//GX0sa997WuxWGxlZeX27dt3797d3Nzc2dkpFovlcjmdTgPYBTsSog1AlJLJ5OrqaqlUomLpeDyu1+ubm5t37tyB7xyQKfSoVCp1/PhxQE6olAc0hq6Lbuk4zt7eXqVSyefzOKnv++12e2dnp9PpQO8VyhL8AfgXyu0B4uNmgefS3R5Qdb1eB8AKpHVtbQ1ItCwslb1OWuThRlD83mq1UP8OmjBIoIB9G41Gq9UCVzEWi8XjcegI46WA0QmAb2dnp16vAxdbXl5+/vnnv/GNb1y6dGlpaSmdTkNe9saNG9vb27///e+vXLly9+5dco3xWhVjWmYIZC5NeR6G1mGYMFnejz3SO1h2KlnMEo8mFBsq9h3qdGpLJ8tzMQFD0Vu16NizmRQhQTeg2ALfCDBiMG2prw2JFajAw3c0k8lgVsckjw9hmRiPx/P5PFSDoToCeJTWkZQMosAR2cG4sF6vhwtA5gOCvygCgAkkxL5xYbjacrm8trYGLePd3d1Wq+W6LmQiUqkUoGGg0r7vI12Uy+Vw12hQ+8WJYCtXrVaBpGOw7+zsDAaDRCIBnjKO1mw2cQvlchnzA36FMdVqtSAmw/yKNKGFsx/KEfDw+QWAy5hzjNBZeuAy6huzY8zuAh1etP8bMbVQktrYmHvGbC0e0KL939KfN4zZXDygRfvkNP+TKTGxaIu2AIgX7WMEiFm7TXQjVHeYsT2DeTPji9lRn9IalkCeNC/a73zw4J6dQjLOzIy5ycMq9qgMO3nNil4qcWewnKTnTyQSWV1dfeGFF7LZ7IULFy5durSysqIwbnXBNiwLqUqgYCgEHs70qnq9HgyygHfj1DQ46vf729vbt27d2tvbA60MADEesqrd5m0SlVBAPAAyCfSYMFlhcgYJZknEh2h7aDeQ3UY9CvlmJRNQAdNSV1TCYaRIS36l7ADS/0qR2c2RJSYk81pi6FIhwdiKkNYpJMan/lAqGkNCFB2SDlrvvfee7/ubm5vGmMFgAC+p48eP/9t/+2+PHz++u7v7/vvv/+Y3v3nrrbcajcb9+/cTiUS32y0UCqAKorq8Xq+3Wq1IJNJsNln3HQQBfNiAe6IvAfHp9/vdbhe/XVpaQhl7t9ut1+uQvW632wDXWMiPSvZ4PA4sCc5y8J4ql8uFQgG3jL9CmTlQIeC/mUyGHn2DwQAXD3AWj6Varfq+X6vVcrkcCu1Rh47vyEkGOBeEBZBugRQyhjNzMHjOQN/MjHKeTCZzuVwqlUJCqN/vgxEJdmSv14NAai6X++xnP/u1r33t0qVL5XIZeGK9Xn/jjTf+/u//HtaR9+7dg6wtHLGQDFMmcrJzSjM3Su6y56i5xR65ofq8R0HZHgEjVli26vYq36OSiHIylANTDUkOEzlS5CSjqMfUmFaYO4YVqO7IwUCKF3ix4ziNRgMdABaIMCCFsO90Ot3e3t7e3obWNsDNWCyGF4ROWCgUVlZW8vk88hC9Xg9qD1DNRrIE6QfkJ6TsPq6HWDB4uN1uF4ox2WwWMgugt7uue/r06U9/+tOnT58ul8vlcnkymWxubtZqtUgkUiqVyuVyPp/H8ZGMwfoCLzs4v3FFA1MYgC9MJiORyO7u7rvvvgtJZTw3CiVnMhljTL1er1Qq29vbUMMoFouRSGQwGLTb7WazyXIBKK3DKgo9H2sNAHr+U6LGeCkgcauJ94Gh2qIt2v+/wROLbr9oi/68aIu2aIu2aAuAeNH+9RtjeLCQlD6D9BdSVcb8cxuhCxUXlr8NLcEmtiu9jJTwqEItqRdhDnJOCfmZgwZHUroUMKsxJpvNfupTn7p8+XI2mz1x4sTy8jIEiI+0DfL94XDY6XTq9ToKhIH8AoZDzXuj0djc3KTHPSAJAExgXcGXDH9FzyUJjPKBKCBYqT0YY0BpNJZ+rq1nKu3+8PZt78FQeV9bIVoqPCgUySahK/kI+/JUVwHGx4thDsOdNdn3/KN50UrtCNWZbT1rSUtXfHkllkrCO3EQwKD8PoYYrRTv3r175cqVVqv19NNPnz17dm1trVwu53K50Wh08eLFp5566n/8j//xi1/84t69e91ut9VqZTKZbDYbi8WWlpYymQwM62DABSoxiIEgIbbbbeA4gJAAZvX7faBd6OTIXkALdThrRHnS6fTS0tKxY8cymQxYhP1+P5VK5fN5wE+O43Q6HUDe1WoVBwTjEtxJqK+ywPzOnTvo2FS0mEwm1Wq12WwmEgl8P5fLZbNZGn9TTqTX61Wr1b29PYwypGQwitmf8bTxsnAo/Bal8bFYzHVdeNbdunWrWq3iZldXV5977rmTJ08eP378C1/4wvnz50FnxiC9e/fuP/zDP/z93/89lDpw5SS9Sj0cZkTMQSlhc1BMXOYPJBlfphOUfaKtlvPYMWL2WzXV8I5UFYIs3ZCqL/iQyipSJEQCxLwpWb/CK6GmBEVFJIMVasXoEt1uV+rhDodDkHxTqRR7Mi7Mdd1SqXTy5EmgyXfv3m2321BHQcfAWTA80RtBxkeSD2MNYwrdHqRgcGZxwTCUT6VSSITgk2g02mw2cRycAm6TEMHI5/Of/exn/+RP/mRlZQUPAcsEdJDX1taQgwHAnU6n8egwunE03A56ODj7yHxQR7jZbG5sbEwmk1wul8lkQIrnGMHVNhqNjY2NVquVTqdPnjyZzWb7/X6tVhsMBul0GmkbFAdA7yIIAuZmaHHJt4kxwpdCRz4M58WOa9EWbdEWbdEWbdEWbdEWbQEQL9qT25S3mw3bKdTV1j1Q8b/ilMmfVS0/wAXJY5Uoj0KNlc0RwT6J/MrDktCKI0jBCmAxCO8LhcKnP/3pr371q8lkEiyth3p0/X6/UqlsbW2BsAnAF/X4zWZzOBw2m83t7W0CHKiyhwwlUAxC8wpzJ1lboqVKJBpNouQK6g3FiKWkaeirJJ2Wj93mI5uDxenSloreTTaepYBj/JMXjBuUhPHIzEqYQg2hGQ4pVfxALExmLJREhtSyIBKtdDZkL5K3RmCLWit4s57nAUaBqZQxBszcwWCws7Pz5ptvwvEM/EfATOl0ejQa3b59+5133tnd3YVMKnoXTKhAzgWwBcY6juA4DlBjmWJBb0efabfbIP1Fo1HQaXu9HniC5K2DApnJZAqFAuRTo9EojOay2ezS0lKhUMAVAvYCnxeQED4EBTgejxO2hgEjLe8wyvCHSKsAeOXQBgkRkwPoorVabW9vD3IQ1LamG6TUk4GMAGQ08CoJfY5Go06nU61Wd3d3AcNls9mzZ88+++yzp06dOn/+PJQo8EInk0mtVrtx48be3l632wVuCMBd0uHR4dVQsln/chY1B8V8mQazXeDsgSxZ848XI7YzQEr7WIHUKmslpWBUmsee9hWkroazPJGduMIBQVdHz8GLgGYIcMnBYICZUI5ZyqHgLcdisUQigYwd3gtottLmEQCxEcUruEimeZgnSKVSyIWk02mmi0Bmx9cAE0O0pNVqQe+CA6Hf71er1fv3729ubvZ6PYw7EJaBXGN0xONxHArZR0wXeDKg8OPUnU4HWDnENCBAkUqlIL0tZ+BEIrG0tARd5ul0WqlUILcCxz/w7gGLQxA5Go2iAkB2EqnqLjcJUMYwM/u+j6nrLtqiLdqiLdqiLdqiLdqiLdoCIF60x9bmmarZKpmhMX+ob5JtImcOSlIQSiAyAkBN/rmC/yRhU5UnK2RBkvWkIRLQBCN4xLFYLJvNwqTuER4dyIy0RQIiAF4nSG0oswWFCveCLwDyM0KRU2llyMeu5BQOf0cPfNdHUWNQDoShHeaQaN+mkz/wOlVlvbFUsNXn5siyEvNgYileYSzdDCWfaoSshFTJMGGF9op/LXnEwLbww3A4rNfrrusmEonr168/++yzwI7hjnju3LnPf/7z2Wy21WrdunWrXq83m02Q+JLJJL5phGAIMCl5hQTZgS5RaLjRaOBDQGBgaBLdRj1+sVgslUooip9OpyASAgJLJBKoT49EIsC2KO9AQJyqNej5uGYARjyRMSaZTJLsSUgOvEg+K6C69XodORXkkJCBoGaxEeIMwKYTiQRIyhiMKHXv9/t7e3twlkulUqdPn/7yl7/83HPPra+vs3QAj2I0Gt2/f//GjRvdbhc+YMTFyJPFNUsuvFTRUUaIocK+5mAeSOm9hHZIebTHuAQoJQdbEzkUqlZ/K/u8vFM+IiUoLwUrFOeaVRSy1oHPEyhwvV7P5XIgz3qe1+127969OxwOd3Z2wCbGWwNyWqlU4Ai3urr62c9+Fj5ySKUgZTKZTCC5m8/nST/HqXEQ0Ip934cZHe3j0uk0xBnAz4XSC7Iae3t7GxsbAHPlQIvFYoVCIZVK7e7u/va3v41Go9VqdXNzc3d31xiztLQUi8VQZYKT9nq9TqfD0ZRMJpFiBKg9HA6BOKOiZTKZVCqVRqMRj8cjkcjy8rJkZOOOuAh6nreyshKLxdbX1+v1+vb29t7eXiaTgcBFMpnsdDpbW1vT6TSdTiPxIyuBgFwj8YMJDfMAHimSVWZWNIALCN0YLNqiLdqiLdqiLdqiLdqiLdoCIF60J6IpYy4FydkWXvOUJSVWQgRBKbdKoNMmaUpsQgK7EnxhfEsQkww+WSgdquZJzjJwJYAIwJIeCk/H6SBjCugKNEwwiIEO01BLotuI4SHSquRHJVNVcRIppiGrtvkwJY06FFy2Peik6mgohdame6uoPlQi2aYZPhBTlkCStCjkX5GtJruW0kI9oriExONkP1SIlTwFpWNJVuU1y76qjq8APsAoYOYaY6gQEgRBtVpttVrVajWbzf7bf/tvP/OZzxSLRXCEP/e5z62srACyef31169evbq1teU4Tr/f39nZAbGXdfdoBIiR7cAFoJMj+0LepQQo8SjAggRJsFwur6+vLy0twaGOWhkgHSOnAoIhHOFAn+cZp9NprVaD7iqGGwzlKFIsxWGQODHGgAHq+z5q6jFSer0eMGhIJFOChgCiEr/mEEO3AQQPuy1wJI0xzzzzTDKZLJVKly5d+nf/7t/BtQ+ee6PRaG9vr9PpbG9vX7169Ze//OXW1hbQLoDXuHjQUYGLcVozB9nBivdqy7Lbo8wclHSQSLqEX+dJon+UyV8pYMi8lFRVNge1hs1BKzk5TtVKYQ8WmaSRmDiPLAFrWW2AabDX60FNu1Ao4DKof21m+T9jDJQZarXau+++22q1nn32War97u7uwsIRRnCguMIWEpoPyWQyk8lAbhhqDGZm4EbVC+g2wMgUPRkKDMBGMbSB5PJ5JpNJagTv7e1tbW3hy4CDoYAcBMG9e/fAwYfoMOHgbDabTqcjkUi/38dYM7M8JXMtdIojVouch4TaKZsTjUZXV1ePHTvW6XRyudzm5iauB0Rp2QP5fjkMOS2gRoHLE7jYwLVDl/5FW7RFW7RFW7RFW7RFW7RFWwDEi/ZkNYXest5foi0qpA+lFZPGqDiVIByFms6RYCipYZJkR5REmolJ9IShKWAagFxSLpYXZmva4jgo2Afn6+gPDeX8QRDUarXt7e2tra1qtQoFYVTN1+t1eIhJ4hhPin+ivliqc/AaSFSU1ky8bKJR8l6UT5qKw223KPttKg1f+72HKhHbmQObEK30rBWUzNMp0QYpOhwKMStpFHMoo1ndl9ROnQfSSeiZD1zeo/ynZNZLJEsSscFDNMaAb0vUZjAY1Ov1//bf/luj0RgMBk8//fTx48dXV1ePHz++vr7e7/ebzebZs2eXl5evXr06Go02NjYajUan0wH8CiYjiuUpY0L9biniDAot0CtmHYgBASDOZDKoOs/n87DYgmMVGhBbWNIBTTbGgM9IgBhEwlqtxupyCF+0Wi0Uv/d6PcDlAOA4CoCbA+kD+RcAE4UspDKvmZXVU4SE0wJkWIFYDQYDiBfDJTIej588efKrX/3qmTNnyuXyhQsXLly4QM1x+I+9++67N2/evHXr1tWrV69duzadTlGtT79BVPoDm1Ny6sp+TUJj9ijgSdnDpSAvx6PM2eC5hVZsfESMWKVY5Myj9Ftszm8old4+FMFfmbdDD1QztvxbOYHLpAu44egbxD3posazIMMxHo93dnZ83y8UCui0lUrlzp070L+mskQkEsnn88vLy6VSyfM8KG5DHQUCCxAgxjh1XTeVSuGAHEe4sEaj0Ww2oVnMAQiPu3g8DptHiEWglKTX63met7S0BAngaDTaaDRqtRq4xkDD4Y6INEY+n4cgEhIhpC0DHwdhH1MNjCgx0pV+lFwoMRIBpsNVFcrm8FPlK5CKQ+z8fDsUqOFeArU1KAg44vy8aIu2aIu2aIu2aIu2aIu2aAuAeNH+1QBi8n9tppjikNrmRaGlwRLBkexgJUmsPIskamwDhUrTUxby09VNisPK0ykXMoKtkiEVysC1YQ6E3PV6vVqtwmLr9u3bm5ub9Xod9MbxeNxqtZrNJiBj0DZZgM8j8MYlbq4eqY1s8iJJ+ZTYn+JRHqJHQaLuvHuUREVb4cH+WVIL5YeKcmifSIFTUuqaP0ug3IQxl4+ODsuOp2iYR1GrUMRGKcYt+20osC5L7EniY5IAesRXr15dXl5GDXuxWER1OQzWUqmUMQZawMPh8L333ut2u7gGaqoS+OaJ8E/KqjB9QiwevGNcA4UggLIFQdDtdvv9frfbRX+u1WoA0VBKD6AKtwmGMhBhKkKgKJ6DCwOk2+0Cq0Vt/vLycj6fx52amQo5rg3iEvinmdlhyecJRjYL5zEPwAEM/H0U6bdarUajQa3YY8eOfeUrX3nhhRdgZCc1xwEQX79+/f/8n/+zubl57969ZrNJpj9J7gr8NXMUGCgIHto5lZ0jBwJrAlT3VnIljyyuMq/JMxorqaMAa3sFOcoADH1KEnyk0i76sFwd1HXKLBFHFu3REokE6N4U8EVX8TxvOBzu7u4OBoO7d+/WajXomSC3YYyBpyJ1tDlAmHpRaiHGGNLS+TUYk9br9V6v5zhOPp+nOjDc5AAo45qBVgP2LZVKUMwgHA/uPApTkFNkV1esaowCfBNzAiDjTqcDhBcnlVMWEx5g649GI4yybDYLU0rA1mZWZCAnMSkcZCdFOHUPh0PQoo+oa7Roi7Zoi7Zoi7Zoi7Zoi7ZoC4B40f7VmqyGlpgF6UUSGlMFyEaQWwmISIyPzmME4wCYKqIxCY+UMSWMKyEAiQOSLat4r4qtBnRJ8t1wAQCbQKrqdrvVarVer4N1RTRNgSAAeYFw3bx58/79+8PhsNFo3L9///79+/V6HR5clJjo9XrAy1gRT7yDlbk25CoBI6lvIAFN6ZOmysNt8l0opZc/SBZYaHW5vCpb9Jl9gHqsNhCgeMTG4hqrr1Eik3KZkpzL6ycmpXzAjggQh0JgKpegDquwuVDgT16Pwr/MwWQMmfUAOoH1DwaD3d3djY2NfD5fKpXgQAWUKh6PF4vF9fX1Xq+3s7NTqVT29vaAOqHLGWMojSo7sBrglLkg3ElxUlId0UVRY97pdKB22mq1Op0OoKjpdAqGI4AqgL8Q4MZIAfMXlGEqhwCQgiIwVJiNMUCyjEU5pwcax6OdJQIgiN9ieILa3+122+12r9fDeARklsvlEolEqVQ6ceLE0tJSNpsFB1NmtprN5v3793d2djCcgZ3hSvjSMSQlW38eNiqZ8iqlEZqWOBxB+/jYl1Ip2E4QKjtHKQ1v9/DQLmcrY0hUlykBKVBgLOUiZraMoIojHzCZTJDbgPEjXjrScmhBECQSiZWVlWQy2W63oc/bbDZ930+n05BrwGUgIdHv9+v1OgUl0JMhFI5BCugZSRQJ4OLioWUMmjzMHqHGK70No9FoIpHAYMHfgly/u7uL4QDCfrfbRT/kJIAsiOM46XQaiybNGFF3AsUkfIgngwNSgoZyEFTJwOcY747jQLIDI6jT6dCDEQ+TckkqXyt7OBjNvu93Op12u53P5znX2eUai7Zoi7Zoi7Zoi7Zoi7Zoi7YAiBftyXjxkQioUogwgWkqUGAeSCGRSnOwwtQI3igiRgKaig7GLxMgwBEkZq1QGBIwpX86gWZCloDDaHwnvelZEgslyg8++OCdd97JZrNLS0vHjh2zAWLf92ERBlD4gw8+2N7eBlOyUqlsb2/XarV2u43AG48RPysus7wLoioSElWiwLxTQvDmIJfQhFV8S3VIM6vjtv36jMXkJf6CVynxowdyG+2+YUsGExs1B03wFCxLKU95XhtEU2isLYF9CCJmDpb2m4MyxOYgw53nkuCIEkqWwIckxUvRAFSUg5FKBVt0ePjCjUajN9544/3337927drm5uZXvvKVs2fPwowuEomcOnUqn8+PRqNnn3322LFj77//frPZRD17o9GoVCrGmGg0WigUAIbiOYNBTPotCueTyaSUa+C9Q7l4Op3C1Q36DM1mE4XwQHXxtWazubW1RUia1lUEyHZ3d+v1+mQykXZehJnA2QRkNp1Os9mslFHm9QBHw6OGWgt0VEkIxZNnUf9gMIAF33g8xq1FIpHV1dVyuXz+/Plyuby8vPzss89+6lOfyuVyeD4o8B+Px/V6/c0333zttdeuXbu2s7MD+zIY9AH45lQjcyGyQkLlvRT4K23c5qG9dpJDifOYj2DMeJRmQ8OqSysIWMnCyNEhCyOY+eN0ynNJGXE5cck6D6xKcobEYfv9fqfT6ff7hUIhk8n4vg+qOHRRoPkTi8XAiAcnHa8bAhGFQgEAMZwSqaaCBEOxWGS3BMGWEhY8Bfi5WLmkw2o0Gs1kMtBngBWeMYaMdSk5QrkSCKo0Gg25NkGiAR0eT4aAdXzWIAWDBAyFgIfDId9IJpORY5NrE4tOmI3Dh8jZpNNpIOnAnaGyglQQFTPwrjGJcc0Fax53BJgbhpaHu54u2qIt2qIt2qIt2qIt2qIt2gIgXrR/zYYwD+ElY3gJdTFEt/UBQhFkc1B0mAE/JV8Vt1GiwwQOpFMZKbQSOqFeLb7A7xNdUoX2EkuVDGUUILdare3t7Tt37hQKBXi+y6pzNmDBcEYCIgx5x06nA0ABADHPxQhcCdRSndbMCHTkF+P5MFxX5Dt82Rw061MQrY0vU4kCEIOCMhVALEvpTRjtUaKliu7HxIDCiG2KLu6FggzqyHxllBqQ5GKJZNns3aP3eSPkUBTGLdnuCrZT9EYiLKGKzDJvgZeLLmGMASRE7Gw6neIdTSaTnZ2dyWSysbFx+/btDz744Etf+tKZM2fy+fyJEycKhUKpVDLGPP3006urq3fv3u10OoPB4Pr162+++eYHH3wAp7herwfGIp8/6u6BFEMFVSoUy5EFJBR/C3s3eM1R5AE9Ezja5uYmbj+RSORyOciqYvj3+30ayoHnC8HiIAgAT4ODiW4D5FfpX+OywW4G2ATYC7gtLONwJfhzANk0hMzlcuVyGZDc6dOnn3/++QsXLgDyQ8k/oOqdnZ2NjY07d+6AWPqHP/zhxo0bnU4HfRtQmvKds0elBL/YkRTFWP3VPOHvUHKx+sPHDrFJAz3OukrQ/IF3MU/0nHOOHKRy4FOERD4BUFApm4Axwh7LbzJnAAQTVHpAxhjaxD2BbPb7ffRwJjag7RCLxfB9IL9QhPB9P5lMwhFuPB5XKpVutwvBBLDgQQrGvWAtACxL4RRjTKPRAIqdTCaXlpZOnz4NczmMDpwUlwHti0qlMh6PoUSBqzIiq8czRiIRfAEXg6EHFJtcZtwX8HGuekxKmZngDCW8jUgNwnAP6Dbo2IlEAj5+8Jlk3ovoMNTAcQF48mBkS8mphcrEoi3aoi3aoi3aoi3aoi3aAiBetCe9Kb6YYhcqdqSSKQhlmUnsUjbCKA8UHFCwnX06eT3S+0jei5SnUKXc8krABfY8D3XB6uH4vo8gH8KmaBCUwM+0oQt9UPZdKPQQAKKCSOx7JNQo70LC9xKGVn877xWHokWqY5g5agx2/zkcolXV4qFs9MPhA4Um23DDUdAHmmLZdDZ1hWa+DLfsPxJhUYiehMYk85rguGS1A4WBa+JgMHjvvfd2dnauX79+7ty5Y8eOfeELX3j22Wdh6VYoFIB4ouveunXr/Pnzb7zxxubmJnpmv98HSxckRBaSQ54VUipIogCcsmv/AY/CYgvF7LFYLJlM4smMRiO45JHeCFs5cv8h6ZDNZmHkBZSN+DJkH/ADCtup8QrUDygYBFj5JyB+4tHhEwlD47IBY504ceLcuXNnzpwpFArZbPbUqVNPP/10oVAgq3FjYwNE43feeefq1at37txptVoY46A2A0oD+kwhC6U0TUXX0PJ5e550DjZbeoKvIDTLIoXdHy9GrMoC5FVJ1V05jds1FuZg9siEablIPF2lnZS0NJuZWXHKDA2LJEjdpUkp/gSjCR2e/YfOkEzCgRtOEWGKLaRSqXQ6nclkUqlUIpHA3QFfBqI6HA4xuMDHZ+HFcDik5gOUWDAA8c1sNru8vOx5HkYo0O12uw0SMZ82xhoGi1wpsNz0+33XdaE57jgOhkCv18tkMoDUAdoCt5UPx1gOirIihIlh2dmSyWQ6nZ5Op8h9mlnulqL/MiNC70T8ipRnIxSfMLQX261FW7RFW7RFW7RFW7RFW7QFQLxoTyg0jAJeSiLwV7LIV36IKNoIuQaKRbK2VAX/sgRbydfyUEr+knBeqCKw/HMpPYEzMtxVkscSZ5T4YLfbvXPnTq1W8zzvxIkTCvLDb99///1GowFa5d27dyuVCgCsVqvVarWgfSkFE1TkzAug3itPoXiIki1LFztJbpVh/DzzHz5MycVWuJJUdlb+QvOUUm2B3VCAScIQkmkuLQTtzkB8gRdmI7bmoJOebWb4wA5PdjkwSluwwsa55GuSVfZ8GmTKK6SebHG8OFmUbYTuM8jFoMQCb0KVd7/ff/31169du1YoFN5///0vfvGL586dy+fzX/jCFwgGRaPR8+fPr66uPvfcc/fu3atWq2+//fatW7cqlQpgHdSkj0YjnAhwJxDPaDSay+VwLnC6Cd2C25tIJAqFAs4FDjLeDjA15EiAB4EjnM1mwYMmLzKRSGSz2VwuR2VkKYGCayMvcjqdgiPM0QREDKoUmKZAKx6NRtBIxeiIx+MnT55cWVnJZrOrq6uf+9znXnjhhbW1tXg8DgkdqugAef+Hf/iH7e3tVqt1586du3fv4skThoOqrMS2iLVxMiEF24bVjEUo5pM3Bz3ZQtUkzEFKr32cj2MJUERmOQmzk8vhLPu5moSllISSHlbDX84hqqyBY4SrgDkouYOugr6BNAOfTzqdNsaw2xhj0HVBuUUHA02YoCrJvDgRFI1jsRiyLI1GY3t7u9PpIJOBvsHMIhBtdIlkMonCgl6vF41GpfMbzoLPJa4NyWz8s9frYXWALD7SMxA+ikQi7XYbyR5mCgEx4/bBIy4Wi7lczhhDMRYMRnqxmllpi9IgkksMLgbPAZZ9zWaz0+ngMcJVD4ORgua4GJyOSTi8IIwmoPbwjVyQiBdt0RZt0RZt0RZt0RZt0RYA8aI9iegwAkhzkARqm9f//9j7kyfLziu7F9ynu33v7teb8AiPFogAQAokkqTIVEpKS6vGyqQapFUNXtkzmdUfoOn7A2qkP0DzGr3ZGzyzejJJxadiSsnsCIJggkQTfYSH993t++bUYMXd2P4dj2AQRCYh+vpZGtPD/d5zT/Od7+Ksvb61rfSpgpcjy1qhUM5HFqj/y1mPr6uA1Ttm9QIV1y60m1kvre6JY1iWhXMtqcLoDoxGo52dnb/5m79JpVLPnj2bTCY3btxAZyE8aZ+cnDx58gRrz7GY/dmzZ+12G4IaHs6Tgqx1V8n5FIgLe0Bd2K4KotKF/eUk0ZvOUZ30MiUFcUd2EeMQfJVGbAeDVXacA7RYY+CFdYLkFXTijC+0jV/YJe83epyTe/UasUwuat5oVWznDCRldDVa2tsq2VZRI1zVPAslVwMZ0B2u3++XSqVarRaG4dLS0s2bNyuVCkRPyE+1Wg0Sba1Wg6VdRNLpNPqzWbsfFCWMDYitmoABuQrirOd50MggliGeQkzsBgpFGJ8qCWnSq9NV8vWJJdCVoKbBpwlRCSpwp9NB67DpdArFWVMpdCcLhcLm5ubVq1dLpdLa2tqdO3du375dLBZ1ehkMBuhZ1263t7e379+/v7u7Cxmu2Wxqmz7UJyCuqawmJichWTVxDkdzdZ05Su9EO+PJq735dpjZ7oi2WeXX+0Vw4b124UyuY0ASARpO+IaddnQS03gZneFtEhH0R7xGm7OJCalXd602oAuCYDQaoY8cAnnRX04l1NlsBmO+/gZR4AggVt+uhpngbAwGAwijrVbr7OwMkzx8tXo7YKio8Iqj6Pf7CCDK5XK5XK5areLOOjg4QCCSGpbH43Gj0VBjMhJaer1es9k8PT0djUb1ev3GjRv37t3LZrP7+/uff/456hk4e6jB9Hq9Vqt1eHiYzWavX79++/btarU6Go1arRa2DHnaVgqxq7iFsT+a2Y3qC3RtxGVAp26320jnQEyNWraxZY3c0VKx3kdocQmnM0pB/O8uQgghhBBCKBCTb6hG7HTisn/SBd1WRlSPpzqOkwkDjjSJl+lDeLK1vXXsJqVJG78riaxYZ0W/tQxrqq+KcdYbqL85OzuDlNZut1Op1P7+frVahQQwHA7b7fbJycnh4SHW1B8eHu7v7+OkqRHM9tZTzcuqxlZPUQuYk9RsNXcIH6qYO0JMMrLTEYitppzsyWZ7QNlzaF9wYa7uq6zEkuiglVxK7wT4Xqic2o3rIVzY+N5KVypFvUkM8YWNwi5UjW1Eb1I1k/PxrFakdvzOjh5qBUd7fdVHjBGFllCIg4iiqNvtPnr0qNPplEqlwWDw7W9/e2trK5fLqZs1k8ksLS1BGltaWkJk6mw2a7fbOzs7ULhgV0Rygt4CqvUgaAXN6LB2HuqSpmOjwxV2D3msdiqA+xjKWrvdhnCWTqcLhQKsmvYqqycXdk5sFvo4dCX8Ez5QjWrNZDLZbBb64NraGprOIVb45s2by8vLMCxfvXo1k8noRyBT4unTp1Dbnz59ur29jT3UBHOdOlTdtnOgxm4keyo6A97eX85oUewEdeHEm5RcHZv8bwxj+W2/Apwo7WSNzfnB+cpIZiXb+ccKyvLqypMtniVfryVDlCVsy00RmUwmvV5PRNRZr8Z8DFfteykiYRjmcjnEj6RSKZs1ZAMZkP8AjRi/1I+zZRWtvswWaJxFFEX5fB5GWtwdvV7P932132pGDay4SPhFHgXqN0gQhuSNvItUKqU6LAo8Gq+M+1cjZXSBArZvD9O5UtpeT9M8NOkYUjja9OG48Cc7k8v5UqUOCUwXkOMh09M7TAghhBBCCAVi8t8ByegAK+QlBeWkI9VJGFAFwb5MH62T2sqrUoatOvmqHbbSqq6QtUmLjgNXJUi1VeJROQzDnZ0dz/O63S4snDAII/9U7Y3D4RAPzzZE2BGV7DpruzDcSWR2hF0ruCTTFV51Tn6jMOq4g62MZdM/L1QzL1RmXz9+5DdlGV+ofP3GbSZV6deEGr/mVFgZ3Yp0qqG8akA63f/s0LLu+wurLDa1FnqoKsu6sF1EoKqgF5bKQyLS6/WePHmyvb2dSqUePnz4+PHj9957r16vR1FUrVZXVlZKpVK5XC4UCuVy+caNG7qaezgc7u/vNxoN5GU3m81ms4l0CFh00VxLe1ROF2gjx0wmg5OjSq72B1NTIfQguHp7vV6j0Wi1WpC6YPuFqvuqIeToVjhRURQVi0XoUzgbURThhOTz+Y2Nja2trbW1tWKxiMX1SLGAkXk4HJ6enrbb7V6vt729/fd///e//vWvW60W1rljUb+25MLdqi5IWWStWmfoq7pNYv9tPcyWPWxlS0XVC234F9Z+kksEXjP1/e4asbwi19tRD51vATv+ndKdnhx9l8qpjplaj0i7kiazwuFXBVqHwxoOz/PQmxFNEXFDaZw0LrRmEC8tLeVyueXl5Vwuh6RpVClgM1cjsPYgxfaRpaCOZjGRx3Y2xkDK5/PLy8vLy8vI78Y6FRFBPPFwOEStERkO+E7UWAaUZzC39Pv9p0+fDgaDdDrd6XRQ6RmNRioNQ0ReWVmpVquw+na7XdywOF6tiVoRPNkVQAc5hGm1GKPylM/nu92unhlV51XztWuDHLVdvz3pHSaEEEIIIYQCMfnvgAu13aROcWG7uaSs/Ko0W1VGHKHEyqO63N55iyOgXGjic1zJ9jUX+kB1g7bTPZbEwoEoIlCEoaMNBgNdJGsXfdtcUUeGlvNRuXrg+pQuxpiWFCWtK9YJAE2m5SZlUEcLdnbPuRZOPeBVMvGFbkd7Qi5Uk60Y7diHX6MvO5f1QnVY3jh9WBUou5+Qb+yOQexIngfb0MkelGbRyqvDmvF79QtfmE4gC0OfenJtVDGycfGn/f393d3djz76qFar5XK569ev371798aNG6VSCboqsoMRNDybzW7dugXXMFQwtFvEBnd2dl68eHF6eopubzDwqgvSjm10/dIjzWQyhUIBilImk1lZWYHiJouU7TAMoVDj1CG2wloa8ZpsNmub5mlEMuRIuIPRWA9yIVbil8vl9fX1paUlBCgjdAL2xtFodHZ29vz5808//XR3d7fRaDx//vz58+dHR0ej0UhdqLbpnF0JofpXMivGGfzJa6f3cvItjoP+Dasjyf6cv9VQ/63m/2QqiDYcc/ZHc1Eu/L6Qi3IznPtUZ54LBXGMBPyvvhIfahc9YPfQbBDRwIhhWVtbExF0HUQ2MWobeGMYhsVisVqtVqtVNFdEkQP1Es3tRbg2foM6B/IfHB+3ThR4AZy2URRtbW1tbm4Wi0UkLdTrdc0C9jwP4eDz+bxQKKyvr2MdAEoX+LppNpuNRgPm94ODAw2CwBcQ3PSNRgMm4pWVlStXrqyuruJIoyjS1AtZtBZQz7XanHEhcFp03oMEjFQZ7DBuzOXlZeSxwAuM48VJ0/UHemVxPnUGUzWcDmJCCCGEEEIoEJNvNHZNqD70Oq2W9LldEu3sJRFJnFQE7Mr6yWSiDi/rtFUB0bZ0c5Ro2/bNNlVLannW2mnDQO2LrXNNTcTT6XR/fx/2q2w263necDjsdDqNRqPZbGL972AwwPO8bt8GleoJcURGdY8mBWLVE1WASLZyepVk6QhM1qxn0z+1SZojlUItdZxfTnBqUrFNokrihS+218Kqw45F+lURqMkl/K86/DfUwtTLZgsJzthwNmuvqfU/JsU7Z0DafVaXbnKXxOSKqH6K8Fz8UqNX0dtte3v78PAQjtq1tbVPP/10c3NzeXk5nU4vLS1tbm5ev369Xq9DGCqVSsVi0ckzgXxzeHi4s7NzcHDQ6/UymUwul4MOOxwOm83myckJnIO2fiDG4IlzkkqlSqVSoVBQ071q0JDbtPcdnJh4pXbJQ26sCsTQiHGPIyVWtTlcF2jEiILVqkOr1drf32+3291ud2dn58GDB5999hk60TUaDWh80O8g/FnbuFPGuDA63Cl4JOsfF9Za7CvtvZbc2oUFEpVinWrT1y4T23KRnVpV08fUYbOD7azunJ+k495OjCpHyvm2e8lpH4ZfbYNm3cr6KchVQDL12tra7du3V1ZWOp3OfD5Pp9Moe8AgjKoGhvdgMIA9H/qpNmi1X3yotagyO51OMQ61woExibEdhmGhUMhmsxCg19fXa7XafD5HZdHzPKSKI0RiPB5Dy15eXr5+/TruzZOTkwcPHhwdHe3u7u7v73c6HZQ9tBOjzku4R1DF8X0fX0yz2Wx1dfXq1auIsFCntoZdIEwDe6tFMlu00EKUzkVRFKGzH3rr4VT3er1qtYoAHJsuLSJYVYBTrd/j9iv+a3e+E0IIIYQQQigQk68NPKI72pYN2FVLnT4Y65Oq/t7G76r6mZQb5LyJOLl9R6PRpb5WmYIpUv2qjqLtyJH60XjutTq4038Ja+rxCN3tdg8ODpBBPB6PsdAYwZFW14afEefENsTTNch4MNZf4mV2xbqjw9rgTmvQtiJ+UtlxxH3HDKuyjnpdrXzs+BwdS7IqMlbSshnHclFmhZwPJ3FEcH3NhQvnVT+yx+iMrqTorELVm6hmjln+wvANOZ+y6nyWdbg7A9sqg5qWoHuog9AR3610qyIpqhSaSapxpeqjVAfls2fPdnZ2sgtu3Ljx/vvvo4FbsVi0gbC2CIHPxVr4k5OTXq9XqVSWlpa0GR3Ci9EsKxmljQZZqptDv9bJQRVhyEbadw57Va1WIe+mUqlqtZrL5XTjyVOdTNN2Ck44dQcHB59//vne3t7x8fH9+/f39vagbo9Go9FohPxidDPTBnfaaszqsJoykZSJkyNZznfItGZMJ63YuWdt8M6rmky+ak4Qs+bg6/0iEFNMujBV1lYK5XzOeFI6d0KN7ae8poennkxcBY1YwXDSWU6/jzBjIEsaqms6nT4+Ph4MBmj2iCIf6n/IQsGmNKcC1T4drsgzSafTURSNRqN+v9/tdtvt9nA4LBaLSMHGXqGgiO+CMAxLpdLS0hK64WWzWU1XmM1m2GAmk0H5ZD6fl8vltbW1jY2NK1euQIFF9svOzs7e3l6324Xi3Ov1IHYjwtuOK3yPzGazo6MjfGdNJpN6vY5lBPgULSlp/z3I086FVnczvihxRLg7HBEZgR7j8Vi/4zSJQhaWYcxXjv9di178Ly5CCCGEEEIoEJNvIslVzE54rhPm61hErVZiVQz7wH/hsnr1N0miTZNmsya1PCve6QtsWqgj+SUFOKsvXCgyQhFuNpvtdluVZdUOVKy5sGWZyhZWuVatRM47su2H2qBS+2Kr29p4UxuB6jheVUu1VmIryr8qXdp6XW0XwQtzUSXRg84ejuMEtAqamODOV10pZ3zKq/2bTsjGm3sqbT89ZxA6GQIXtu1yUo9f4+i0pQtrgXfuI718Vj1P3mh6Y2q9QdMtYJOE1nNycvLixYtKpTIej4vFIhJ7YX7E4nGIs9gU+mhNJhN0k8vn8yoQx3G8vLwcRRFKI/aQsfYc8hP2WUMhxCxj192GSgsdKp1OY6/wrmKxCKu+c9FfdcW1qjQajRqNRrfbRQ7Ao0ePnjx5cnp6enp6Cr0bupheYkjt2joyWVpIasHJ3onOwLNjw1mK4YQwWEe5M6pfH94t57Md5Lf0y3+F7wJn8rEfp6VEW8ywjdrsadRcWsWuEbExzcnlBXaiwDeCbfuprUcxekulEpy8GBJnZ2cvXrzABI6hrqEHGMmw0yI7Asop/ld98SKCLpEQW2HXFRHcIAhFgR04juNsNjsajYIgKBQKaCIHMRdKayqVKpfL+I3WGqfTaa1W29jYqFarnuft7Ow8fPjwiy+++Pjjj7e3txuNRq/Xy2azuixDkxwgZKP3o+rF8/m80WiMx2PkaVy/fr1QKOAEYmdQocFSAJxDHZ/49tQWdjir6tbHnYV9QIs8qN6j0Qj3LCRjnCu9KLY/HjalS1X4X1yEEEIIIYRQICbfUGCe0hX3ThqDo4nYDu/2T9B9xKRwXphonPRpWhnlVQ+QSfUt6eZzTH9JTdmx5lkLsy6qtR/h2I1VsEi6Am3jKXu8yeRlVfeS/ams4frCM5BUSJ3wYsfGmBRqZdFry9nb1wiyzmlP/jKZw2C3f2EOqd29C3fgVdLVa/bWbupNnJWOaGvjUJOf4vjQbT6GI/o7ibTWAKsDAC9IpVJwL1qrqRhTthjvtqpp2mxKU7PF9FLDb1DJ2N/f73a7T548gTJVKBTgK4RSvLy8fOXKlZWVFazcx1FA2LJSGtzKS0tL5XL5QjOsdbZKoqGiNbA71QiVjVQThJ9X32gt2Db0YzQaoY0YpMDj4+OHDx/u7OzA3Xl6egoTJTJhkJSKU4TV8TBOAm04lrx2yaqJMwVZJ74zTTmDM5m0IKadlw2NuVAstm/XTB47XfxDfB04rcbkfIKQ/knVf5tBJOdrNnbn9TTqG21JBqUFa75Wz6mG+Vxor8a3BuTXyWTSbDZ3d3d934cIqxHGaJOIUh/ESvzc6XTg1kfI9Xw+hz3W8zwYkNPpdKVSyWQysAYjCwXDD9PpdDpFxQXB3+ponkwmuMSFQgHKKTKOe71eu92Gyzifz/d6vU8//fTDDz9EHMr+/n6z2UQpRQ9WG+5paUSrhva7D3ruYDDY29urVqtLS0srKyvlclnTjRFMjJ3RIe18b6rurzcm4imCIMjn84VCAcnO3W4Xrn9b71RxWc+ALcbQQUwIIYQQQggFYvJNx1qGX/OaN9nUVwiE/WoqxleQBV8j5fxDv/Gbw2/c/9e8IJnA8LV/+j8Oqs2pY1HDYR0zu01fFePhtQ3rHFe4/au+3ZYH9JdISnGUMhXgVHCBmuxkhuBnSGCyyCSF83E+nzebzdPT06dPn0J6g7CVy+VSqVQ2m63Vapubm2tra4hcKJfLtVqtWCwiL0IjUxAEjOX2msagTkPrhIWsNhgMRERdhFp5siqtSuqDwQDdwDQOFcDq2Ov1VIBT67G6L2EZhiJ8cHDQbDZhaUQXLC3PQGKz3lU579GWhRhtR7KTwS0Xpeg6md1yXtXFzyp3On7kCz3pF94g+tdkvLsTbP213BHOUhI9D5o0jfNpj0JDeDWYWIsiNmoDZwNSr70RVDHUF7+qTaXm+WhvNAiOyHlQH73neciCgDwKrysSeBVsE6MFtRAEU1y/fn1pacn3/U6nc3x8rGosCiee5y0vLy8vL5dKpTiO9/f3j46OWq0WNoj0bdxNGsKA0RsEAfIo8OkYbOPxWN36u7u7f/mXf/nf/tt/Ozk5QWBxt9vFRZ/NZv1+X29t1H4Q5AJwdyApGKcCxaGjo6NMJrO5uXnnzp2NjQ1MCzBNoy4Fa7OeWyi5eI1GTKisrwMDM4nv+8PhEHcoYoj1xOol1owpXTGAdQm4WPwvLkIIIYQQQr75UCAm/+D6IyG/d5JeV+dP9p8X2o3VA+sEC8j5qAp9rxWUnRZbTiKzo05CsVVlzf5JV4sj7QG9pJAOoX3YINz0er1WqyULK2g2my2Xy6VSCZLN1atXt7a21tbWcrkcfpPJZCAnQduCqBSGIbps2c+FMDeZTFqtFj4CIjKW5Pf7faReIAoAm4V4pC3soO1i+yIyGAygbrfbbWjHkPxGoxEa3+GH8XiMH1R1wqlToQoexsFggE/HsagJ19GFdWW9LmWwo8KGI9vrZVt3WtHZDiTrLr/wQidzJ5IzqmOjdtT5r+uOsLHaThaKnlunjqInTasmNofdNqOzORJiGnIiosSOKD1jUEg1tN02OsOnRFGEqF80HnTiDorF4mw2Q4M4qJ8wGuMGQT1jNBphO/D/lstl+IiRU4Gtich4PEZYtrZbbDabEIhFpFAorK6ulsvlIAhQwMDIQa829KbL5/MQ2WVROUBgMdIq9PbMZDLD4RAfigQJlcIR84LEcL2PNBk8DENsCtp0q9VCzSaO416vVywWV1ZWsIAA50q1fpx5NQLb3oAYCbiddU8gMePuQ18+bQlgVwnYWwNJyoi7yeVyFIgJIYQQQgj57wIKxISQS8SFzeKSzccuNGza96pnVv96YVs/Ob+U23lL8pXJiA+bWqC51Sprwq/nhAKLCcXGGyeTSa/XQ1stRJRGUTSbzaC1wZwIURWKMBSiMAyhF1uBCRvHBuF8hFcUOhTEXxwp/J7qce52u+hZpyv6cTYgbyGDFZ+CNl/orIUXo/2dmq+1xyY+VM4ruUnR08aR25PvnF7H7etcJsdy64wKuchT/Ppg5WRa8RuO3q/rRnDUaitJaxtAOZ/hY23RybQZO0q1LaecD8PRPFwxfmEbNKEvsAZVBPLCbA4lFw3o0IoQ7doQwosqArrMjcdjOOIx/DqdDrRRDOmdnZ3ZbJbP58fjcafTQU1CTDHp+Pj46Ogol8vN5/OTk5OTk5PhcIhSBAKvZ7NZo9Fot9u4C+AUjuNYCy2pVGo2m7VaraOjo9Fo9OTJk/l8fnx8jBxkjGoNQlHTLm5qHe1692H7EMShOMuitoET1ev19vb2+v1+sVjs9Xq1Wg0eZxtjrVEbsDzbS6CXT3cG9yziNdrt9tnZGWKIcTm0lKX5G5hq0ul0s9k8ODiYTqc4S/zeIYQQQggh5JuPR/vna/if/+f/+X/8H/9HngdC/nsHOpGuoFf91ImjVR3QqiT6V5gKtYmWxil4CWRh6bXvVUdhMuJWjCyl4nVSYrZCtm4Wh6P967Tvlr53bsCfisVitVpFuKrKPdPpFM5KCMTqU8Zye+hKmuGAHdBGjs5iczUSWi82TheWtyNrAq/E2n/IVdakrPuvS+DtwnbNS9Xk1mR2hD2TDrJIxsAL1NBqr8WrEtVtq8ZkzIjze9uu0yrUSa3ZpvpqIIkdSLIIhf9avrXfxI984Qe9Khz89X9yXpD8FHsfXSg6a9wt7mVYWdWrrr5XjTvQ4aRuaFxijC5kECM/QUSg1ToROvg43EqarismO0XzUuR8krWuJMDGEZaC3oyZTGYymZyeniKtAluGQKw3r0Zw2MxxZ5DYxQqqxeO4MBVoOHLyQjsx6K+53GqghrMbiTT2SG3kjvWSI/4ijuN2uw1dnt9BhBBCCCHk90i9Xj88POR5eD10EBNC/vBx3JrJVmDA6sVJT7HV70REsx3kvGMUypQV8iD3QMdR67HTLk/dwWIyDVQbstG3ugBcHZciog2ybNKFVZNtvi2siM1mE6I5BCxor7abnBO2ayVv3WEnBMNJZtBTpykQdlPYf01EVachxHTrFNbr4qj5Tl87229NRLDNC4NunSaEF/bYtL7L5Bsl0cBQf6m/Sep6Tqe7ZESJzTCRRNzE1+sg/sqx7F/hT2/ygtfs0pukn7/Gr/1bTREX7vOr2g9+jTvzqsYAv5W6OpvN4INut9uc9gkhhBBCCCFvDgViQsgfPnZFvNWhrGsvGcMq50VAjShVRc/6Q+1HJNMMZNGGTs6v6LdKtMrKcALqjtkeULAu4gVqrbVJoKok2kZeTmbudDrFynHrUbWHKSZGwEkDEJO/4bikxaT36mnXn3UfrH3bRi3rxiFYWy+23Q2be+t4vZ2ddIRjey1s0q4j/CV73Dkh0Um/ue1z6JwxXHRrNHa2Y+Vge2j29f84jUD/AO7xf7i3v6qv4D/QzhBCCCGEEELIPzIUiAkhf/hYc64kmtThB1X3rHooC/cufm/XrWuYgyMi28XXcr79lyRskklFVaOKbSasCsS6rtx5TfJYrMioJkTsOXKH4dKVhQKLF1tJWt/iJBqrrurotta27JhttYFe0h6rVmv7dn0XkgH0XEEfl/PJznYnrUYviSQHq8vDniwLf7eTECJG/01K+Xac2CwI60R2LMDJS283mxwGGlwgv7M3lhBCCCGEEEIIeT0UiAkhf/ioWnphHKeKrfilXeyfFPjsdlSulfNSoMqs+icn1kB34MIgCLt79gerbkNXtVmiVjl14lwhOKpmCt8xsko1sBXnAXKn1S5tzIXTdkw/XV9m1WHbHQu7iphXZ82+atPYH5tEIedbwGkKrZiOW3JeaRUj6EuiWZ9F00WsOmzdzXYfnF6CThhIUsZ9zTiURF6tJGRfJ9zjDTdOCCGEEEIIIYR8NSgQE0L+8LGJAcm42ORyfiiAyaQIfbuKoZql62i1CNKV8w7ipJnUiTIQozla4Rj6qYhoizy0zErGZWh4sRVzNbNCj9HKoNbsjAwNG78wnU6Tib0qpzrZuLaFnY3ctXKtc2nsbtjdE+N31r9ad/NrLpmTCyyJKGGVhp1PdFql6T+hpNsGd861c8aGmAQMJ3oCaJC0nFe0JZF0YT3dtA8TQgghhBBCCPmHgAIxIeQPH20N56TBqoPYapeOlpdsViZGUnSCBVQhFdNiTrMU9O1qvLX7ozqpjUW2H62yJpRcR9e2iiT2WQOCNZLYkXTxFt1/zQK2nfTkvBKqOrht7icJ2/V0OkXfPJwEbM1RTq0ybo3PziE759BmRyT93U4Ohpw37VrJFTvpSLfWHaxvT/bK071K2pPVOe7kPusOiJG29bTYz7KDU4wyLvQRE0IIIYQQQgj5h4ECMSHkDx8NunUiDqwyeGFGsCPJafisVXVtOoQTg2tF5wu75NlP0R2zpl0xJmIVfG3ag24BH21b2znK9Ww2c+RXJ93Cpi07ocNJMdeJ7JjNZhr+oLEVstBJrQKuMqjTG/DCc/6qwOILG745G3EyHKwzV7MpnP91RoJeO5XLnTDr5D7ouzQDxEY2Oz5lfWNyXOmFcNKWaSImhBBCCCGEEPK1Q4GYEPKHj81/AFZoc/70Gzcl59vBJTfrdFe78JWvQZVc+97XdyrTz02+UX9+vf/0qymPr9qm1UkvPFdfzQz7dcmjv23bN8cp/IYDxnrG3+SzLvxrciOEEEIIIYQQQsjXCwViQgj5rXkTVfF3UTNfJQH/Lh/6D2E+/crn4ffrhP1tP52+XUIIIYQQQgghf8D4PAWEEEIIIYQQQgghhBByOaFATAghhBBCCCGEEEIIIZcUCsSEEEIIIYQQQgghhBBySaFATAghhBBCCCGEEEIIIZcUCsSEEEIIIYQQQgghhBBySaFATAghhBBCCCGEEEIIIZcUCsSEEEIIIYQQQgghhBBySaFATAghhBBCCCGEEEIIIZcUCsSEEEIIIYQQQgghhBBySaFATAghhBBCCCGEEEIIIZcUCsSEEEIIIYQQQgghhBBySaFATAghhBBCCCGEEEIIIZcUCsSEEEIIIYQQQgghhBBySaFATAghhBBCCCGEEEIIIZcUCsSEEEIIIYQQQgghhBBySaFATAghhBBCCCGEEEIIIZcUCsSEEEIIIYQQQgghhBBySaFATAghhBBCCCGEEEIIIZcUCsSEEEIIIYQQQgghhBBySaFATAghhBBCCCGEEEIIIZcUCsSEEEIIIYQQQgghhBBySaFATAghhBBCCCGEEEIIIZcUCsSEEEIIIYQQQgghhBBySaFATAghhBBCCCGEEEIIIZcUCsSEEEIIIYQQQgghhBBySaFATAghhBBCCCGEEEIIIZcUCsSEEEIIIYQQQgghhBBySaFATAghhBBCCCGEEEIIIZcUCsSEEEIIIYQQQgghhBBySaFATAghhBBCCCGEEEIIIZcUCsSEEEIIIYQQQgghhBBySaFATAghhBBCCCGEEEIIIZcUCsSEEEIIIYQQQgghhBBySaFATAghhBBCCCGEEEIIIZcUCsSEEEIIIYQQQgghhBBySaFATAghhBBCCCGEEEIIIZcUCsSEEEIIIYQQQgghhBBySaFATAghhBBCCCGEEEIIIZcUCsSEEEIIIYQQQgghhBBySaFATAghhBBCCCGEEEIIIZcUCsSEEEIIIYQQQgghhBBySaFATAghhBBCCCGEEEIIIZcUCsSEEEIIIYQQQgghhBBySaFATAghhBBCCCGEEEIIIZcUCsSEEEIIIYQQQgghhBBySaFATAghhBBCCCGEEEIIIZcUCsSEEEIIIYQQQgghhBBySaFATAghhBBCCCGEEEIIIZcUCsSEEEIIIYQQQgghhBBySaFATAghhBBCCCGEEEIIIZcUCsSEEEIIIYQQQgghhBBySaFATAghhBBCCCGEEEIIIZcUCsSEEEIIIYQQQgghhBBySaFATAghhBBCCCGEEEIIIZcUCsSEEEIIIYQQQgghhBBySaFATAghhBBCCCGEEEIIIZcUCsSEEEIIIYQQQgghhBBySaFATAghhBBCCCGEEEIIIZcUCsSEEEIIIYQQQgghhBBySaFATAghhBBCCCGEEEIIIZcUCsSEEEIIIYQQQgghhBBySaFATAghhBBCCCGEEEIIIZcUCsSEEEIIIYQQQgghhBBySaFATAghhBBCCCGEEEIIIZcUCsSEEEIIIYQQQgghhBBySaFATAghhBBCCCGEEEIIIZcUCsSEEEIIIYQQQgghhBBySaFATAghhBBCCCGEEEIIIZcUCsSEEEIIIYQQQgghhBBySaFATAghhBBCCCGEEEIIIZcUCsSEEEIIIYQQQgghhBBySaFATAghhBBCCCGEEEIIIZcUCsSEEEIIIYQQQgghhBBySaFATAghhBBCCCGEEEIIIZcUCsSEEEIIIYQQQgghhBBySaFATAghhBBCCCGEEEIIIZcUCsSEEEIIIYQQQgghhBBySaFATAghhBBCCCGEEEIIIZcUCsSEEEIIIYQQQgghhBBySaFATAghhBBCCCGEEEIIIZcUCsSEEEIIIYQQQgghhBBySaFATAghhBBCCCGEEEIIIZcUCsSEEEIIIYQQQgghhBBySaFATAghhBBCCCGEEEIIIZcUCsSEEEIIIYQQQgghhBBySaFATAghhBBCCCGEEEIIIZcUCsSEEEIIIYQQQgghhBBySaFATAghhBBCCCGEEEIIIZcUCsSEEEIIIYQQQgghhBBySaFATAghhBBCCCGEEEIIIZcUCsSEEEIIIYQQQgghhBBySaFATAghhBBCCCGEEEIIIZcUCsSEEEIIIYQQQgghhBBySaFATAghhBBCCCGEEEIIIZcUCsSEEEIIIYQQQgghhBBySaFATAghhBBCCCGEEEIIIZcUCsSEEEIIIYQQQgghhBBySaFATAghhBBCCCGEEEIIIZcUCsSEEEIIIYQQQgghhBBySaFATAghhBBCCCGEEEIIIZcUCsSEEEIIIYQQQgghhBBySaFATAghhBBCCCGEEEIIIZcUCsSEEEIIIYQQQgghhBBySaFATAghhBBCCCGEEEIIIZcUCsSEEEIIIYQQQgghhBBySQl5CgghhBDyteN5XhzHzs+e54mI/l7/6rzXvtH+xnml/tLZ4IXbTG78Na+88ONeg93mhcf4G/fqwqP+HT/0wjPjbP81p+7C9xJCCCGEEEL+8KBATAghhPzh43me7/u+/1VWDr2hcOkowva9X00gTsrB9jf24752gdj5uFcpqvZwnGP/rXbp9Qf+5pcmuW9vsievOiHO73/bfXvVGdPTNZ/PqUETQgghhBDyTYACMSGEEPKHj+d5uVwuiqI4jiF9qt6nPwdBICKz2SyOY5WS4wUiYiVm/Y0stFSrUervHVURL5vP5/jnfD73PC8IAkfoxD4EQeD7vt2IfjpeNp1O7bEkP8vunn6E6pL2ldgH7I/uoWfApubzOf6EU6Tbn06n9i2yEEDtb+z+2N9jszjS6XRqD1POS8A4ClWu8bOewwsv1nyBnocgCOxFx6fre3HO8U9cBd0TvEyPGlvQY7SXyVGr7afrD/P5vN/vT6dT3puEEEIIIYT83qFATAghhFwKfN8Pw9CxuzoKr/7Vypp4JX7p+z7UPftPFZShRaqoKudFW/0IVR4dX7NqiFBLfd9X3Ra/VBkUn4V/qp6Lf9p9hhiKvQVJD7V+0Hw+n81mVk7F/kRRpGfJbhBHKkY5xSdi5+fzeRiG+FnOa82ONK9quErDdrNWR7YCsdVkk1dQX59U1SXhAsa7JpMJdGo7JGazmZyX+/ECR6SW86q31alxaGIkdbx3Mpl8BTMyIYQQQggh5B8CCsSEEELIpcBqdhf6fNWRitdbmVUWxlurcjrSp/5mNpvBqZpUfrF9SKLQLqGQ6k46IiZer6Kz7uRsNoP5VLdgP84xLPu+j08EURSp9KkGW7xA3biQa3E4qVQqiiIclyz0aP0Zm4KyjM+az+fj8Rh6KN5od16PWo9uOp1OJhPdMd1PfEQYhnI+pSGpOOMTUQDQc4Lj0k+011p/LwuNXl+PA9HhoXq0FYWtBduRyLVOoCI+xo8OKltgYL4EIYQQQggh3xAoEBNCCCGXCJXq5KKQWasbJu2usgiFsMZVm1lhbcUXmkn1s/AyKz3rBvWDoNLq6+W8hA3ZER8Bddhanp09lIsyi9VdCyUX/5vP5zOZTBAE2Ww2DEPIpvjrYDAYj8f5fB5JHbJQ2KfTab/fb7fb0+k0CILhcNjtdieTiSTU8ws9szgPetL0bKjx1rqA9TD1WsjCnIv3arKEc/nkFcqy6sX2HNrLJBfVAJxddTzjTuSINUHb8UAIIYQQQgj5hkCBmBBCCPnD50KBTxL6o5wXT60IaH2muk113ervncgIzSXAdrBNJF1o5IVG5aocGRtUtXSiDCAQW0VbzgcySCKTV4xhFltIp9OFQqFQKFSr1UwmUyqVqtVqOp2OoqhWq6XT6fF43Gq1RCQMw06n026319fXy+Wy7gP29ujoaHt7ezQaZTKZ6XR6dnY2Go1Go1G73R4Oh2oTns/nk8kEDms9+alUKpVKWSUX5mjEa6hYrMKrytY2NBlbUC+2WqdVT7duYhiNAfZNRCCCq5naGTzqJtZPtFdNsyNs+cGeajVNq3fYvpIQQgghhBDy+4UCMTln/Pm9fLqcb8JzYbvz5J8u3I5VN+S1PdyTO/D6Pbnws17T0j1p2nrz3baffuEZ+I2b/RpJnswLX+OklL7q/Dhb+7oOgX40Qt58yrVOVftLOe/PTdqEZSGJoiEbREZNk3Aydm2EscYKy/lGc7LwwKrgCM1X1WS7M9hCKpWCxor2dDakGPKoE9drG6mFYajyKA4nnU4vLS29/fbb9+7du3btGmTfk5OT3d3d0Wh0dnY2HA7H4/FwOOx0OppoEYbhwcHBcDj0PC+TyWSzWd/32+32fD7P5XL1en1zc1OP7tGjR48ePcLb+/1+v9/vdrsq76pOjQN3JHJ9DSIycJbG47HGHGs7QYQdO2+E8qvJvyoQW7uxGEuyvtGOimSrPZuSbAOX5Xw7Pv1orQFgtOBAkknQhBBCCCGEkN8jFIiJhGGYyWT8BfF55Lx1KKk1qK3JJgxKQha8sDWQPpoi9NDugJz3u+nTrPWyyXmnm2NQsr9UU5VddessRtY90Z/tIc9mM9tdR51TsrDLOauYdSd1t5MLcp3/tVYsfXR3BGLdVUmoovpKG9Zp11/rnujR2Uf6ZCrlhSfTihqOocwqMqoFOJf7QoE4aVVLalLOYdpWWmA8HtOPRsib44i/evtcWIWy05qdYZyp+MK7FVOWnR6tyzXZWs2phNmp2yqY1iErC4Otk7qr053tupbNZovFYiaTKZfLtVqtWCzWarUgCE5PTxuNxmAwODg4OD4+juNYjbqj0ajf7wdBUKlU8vl8s9nc398fDoflcrlarY5Go/l83mq1xuNxOp1WDRpz5mQyQWZFFEVBEEwmk2az+ezZs5OTE3uKbC6zc/h64NqRT0+4/S54Vee65OzqfMNKwrKtg8FOqo52LOcLq85u6/lnsgQhhBBCCCH/fWiDPAUESYvaP11NSU70pLVx6fOeGr6cHvFOcKTz7Jrsbu880ktC/3X8TfrAb91nSXXDcclZoVZ9W/rp1gZlNV+bhqmdjpJSqZhuPDaRU87Hek6nU/VP6b5ZgcNuzQorCk6vs0LZ6V/knB8oHY787ai3tmVQUtyHzmKdenqNdD+TMoQ2cXLUKH2vnjRHdHbUhGSSZjLYFHGfhJDX86pYWOc1Vnl0NEdZlAade1POr0dxphFb8XLKcvZehswoSAABAABJREFUthZgm1ORnKl0RrIZFPZDYVZNpVJhGAZBEEVRLpcrlUqVSiWdTodhWKlUlpaWRKTdbkMankwm4/EYQRCInoiiCG8vlUqlUqler6fT6cePH8NNnM/nc7kcZF/sG2aw/f195Ej4vg8Psu/7uVxueXk5m8222+3RaKQhxTii6XSqZ9Uer40htqdFU4P1Z3ycM1ti5rdbsGU857I63/t2tteJ2hF8nS96+ycbZ+xsjfkShBBCCCGEfNOgQEzEmkPh5FWh03bCkYS108q7GnHoCLhJdRgPsSo1qlrqmL/wKdqYXt94ocxh3ysiMGpBNHQURmxEBVnrSnYstI7koU3tp9MppAGnpZIKzWheZBVSNKaX80t0rcSsu+0coGNzhtoLY5quGobma4/C0Xd03+wDPKQTayV2tGy7DFmvcvLqO2uiHTXHSktW95fzxjT7LitGSMJLqKPFhm++yt5OCEnO9smeb2rF1SlLQ4TtnfWqMKLkL531AY6+bBVku4LE2bdXzU7Wx2o3aPN5wzBMp9NoNKdfBKlUql6vX79+fWVlxff98XiM7cAdPJ1Ofd+HKAxF2NYXwzBETnE2m/U8r1qtrq+vR1HU7XaHwyFa29VqNaQAQ/wdjUbT6RSq9HA4nM1m2Gwqlcpms+VyeWVlBfswHo8Hg8FoNIqiqFQqhWE4nU6Hw+FgMEDLO63nOQs7ZLFIxX4LW4nZmqydLUhiiYZTAJCEv9uWYx27t71wyVUvyVU7r2rWRwghhBBCCPl9QYGYiLOqVJ/nbTtyZ+2qdW7aFcQqKySfAK0MYa212kE+aVByzGUqrdpYA8eppL9UE7QjbdgIRaghqn2r3iomGiL5FH2hyctuXKVkbRyUz+eR2gnlAi+YzWaTyUSl52gBUiNVdXXSHrFX0Duwz5PJpNFo4Dfj8bjX6+Fnx377qtwPPdVOoqUsBPqkH9AxoMlFa9IvlGudHvdi3MSOqdxeaOctYozhNhGFNzIhvxE7uzrREFq0k4XB03mNU6xy7lZ7M0LQdGYPTJv2fk9Ws3SW00oYtqMGW2cNipb0tEIWRVGlUqlWq9euXXv//fdXVlaePn368ccf7+zsDAaD09PTSqWysrKyurqKjnP9fj+VSt2+ffvu3bv1ej2VSk2n05OTk8PDw8PDw8ePHzcaDW00B1NwLpdbW1tD87qTk5PBYFAsFnO5HOImMNXXarXNzc3l5eVKpQJXsud5rVbr8PCw3+/3er0gCK5du1apVDzPOz4+3tnZOTk5KRQKN27cWFpaiqKo3W4/fvz48PBQzwwkbLtkR79rZNHUDifKmQ9RZHUKePYKagaRmrj16qNsafVl+9UsiaASvTT6JaVzdbKYxxhiQgghhBBCvjlQICYi51vTWNew1WedJ0zn+dA+N8p5f5PKAUmfqQ2mVI046UVyUhR835f5HM+4vgj+T0SgPcdx7MWxxLEn4onExsIUz+cRWrfb/m9x7IkEup9xHIuEQeB7HnRW7E3g+2EQQPB9GW0ZBKlUKp1K4XPDKAqCIAyCbC6XSafxOJ3OZHK5HPIue92ueF4ul8vlclEUTSaTfq/n+X7g+2EUZbPZTDqdSqUm0+lwMBiORkEQaC6EJxIEQSab9T1vOBqNRiNIzBLHnu83m83ZdDqfz9vdbrPRaDQas+l0Np+/1Fbmc6gbMygC8zneCM1APA8bCcIwXnjQkoayZIKEYw1Levoc+cA6miXR8s42u7+wT6ATuAm9SVM7KRAT8oZTvd5c9gcn5yGZI5x812v8pxduSuMg7Gt0cnDy7pPbTwYTOZ+FFKBSqbS+vl6r1dbX1+v1erVaPTs7W1pagsiLshziI/L5fD6fx9fcysrKxsZGKpWazWbj8RiJEycnJ8fHx41GYzgcnpycdDqd4XA4n8/L5TKWkvR6vVarNZ1Oi8ViPp8/Ozs7OztDQ7Z6vV4oFDKZDLIslpaWCoVCp9PJZDLdbrdQKEyn0263m81moyhKpVJwEGcyGQjNqVQqiqJer+d5HgRlm7xxIa+aip3rmMwVScbx2xOrbQaSGVNyUQPSC2d4W+p7k86xhBBCCCGEkH98KBCTlzj9ymTRlk0fv+2SW2vqtE5SZ4O2671jL7V91bVzGiQ/OS9HOs7l+Xx+PY7fm0zkvLXZeUx1AjRfytazmW9ECif+wskRhgSgi2oh/nq+nxXxPW82n0dhmA2CrOeFvi+eF/l+4PtREBTT6VQqNR6PJY5TnpeazbKjUVqkOxxOJ5NwMMj0eqlUaj6fDwYDCPMikk6n06lUGEXT6XQ0Gg0GA9iK4Rf2PS8Iw3Q67Xvey2jLIIBTLJ1OeyKxyHw260+nXd9vBsFMZD6fzzxv5nnT6fRwNOr1+9Cs4/l85hQD8LPv9z3vp77fF1GzntN/L+nqdWQC5+Tb1Au7YNwaya2WpANAjDdQEi2VdEAmRQpCyG8kWcaT8zHBdkGGnSfxdl2OYMVlmxGhCzicvprJJqjJ8AF1DdtUHPR8s+ZlOS89p9NpaL43bty4evVqKpXyPO/x48eTyWQymayvr1+5cqXb7XY6neXl5Y2NDQQB5XK5dDo9m80ajcZf/MVfnJ2ddTqdRqNxenra7XYHg0G73R6Px9PptN/vI6QiiqJCoQApGZEU8/kcLxYRLR8+fvz4s88+y+Vy2Wx2eXn57t27q6urOAmZTGZjY2NjY+Px48e7u7u+71+5csX3/Xq9Hscx8pFhv93a2rp58+bu7u7z58/7/b7v+9gTe7HUpu0EgNhamn7V6kqUZO9B+7VuMyVQhJNXrDgREzSvIUtJNdkmY3DGJoQQQggh5JsJBWIiNlXwVcYxOS+2Op3EXrpZL8Jpc5fMnUi+WHUEff05N5nInw4G/69Gg4+YXy+xyIHv/+tarX/ezQc1AWL0hfERr1pr7Ig4yT/JRQa05Csd67ENJ3nVpxBCXo8NbU/ah50Gm4451MaO20xw26wyGUxs25Dq9K5ipV25cqFfVUtKtpmn53mFQqFWq9Xr9UqlkslkYL+FvXd/f388Hl+7du3OnTvpdPrk5KTf79dqtVwu12w2u92uiMxmM7xye3v76OhoNBpBm8axaBgxAoir1Wo+n0dOMVrPDYfDdrvd6XTG47Hu+Xw+bzabJycnEMorlcqLFy9qtRqSkbGm5N69e9lsFlnDYRjeuHGjUqmkUqlWq3V2dnZ8fDwcDqvV6urqqoh0Op1KpVKv14fD4fb2dq/XG41Gk8kEJUwrr9tAD80J0S/fCyfepLPbXkENl3Bmb/1Bz5UmLyVN6HJR09ELl5IQQgghhBBCfl9QICYvn72t5quP/XByyaLvDVIONU1Sn+31EdE+OmrmoBirmpzvwC6mXZs+herzqrU12cdaNJ7jY+XXzkRkPJnMFy31nH5xNp/USQu1NnDbVwrZl3I+yVovt5UJHLuxmGRSKyjYgaQDRrszEULeBGcVBcJt7XfBy7s4jiHTxvN5bJvaxTFWLXieF/h+7Hmx788xV8znQRCI5+kqBM/zJI6nIvFsFk+nvu+HQRB73szz/CCQIED0TeD7sch8Pp8uum5qOJHthKkzSRiGmVQqCILv/+hH3/nOd8IwPD05OWs0XuztxSLZbDaTyaysrV3b2vrWe++tra8/ffr02c5Ou9s9PD1tNpsHBwetVqvVarXb7dFw6Pl+oVAoFotX1tbq9Xo+n09FURCGo9EIE1E2k1mp19fW1jzPazab4/EYycKDwWA6mfhBEAVBPJuNx2MRSaVSWAyBuIlWq4VQ4+Fw2Ol0BoMBMiiKxSL05XK5/K/+1b/6kz/5k3q9/rOf/ey//tf/ivP27NmzZ8+e9Xq9g4ODa9eu/fEf/7Hneffv3z85ORkOh0dHRy9evGi1WkgK1tB8/bLWdGanLIcsDsdHrEKzxkpcuDRHTD61kynvrBRJLipKhlcwHYgQQgghhJBvDhSIiegjoo0RcNrNyXljkV3gLwu113nS0y3oP8VoeXbNabIxenLfvlysSs/RP9gICKNobW1tMJuh0x3kXfvYby+3XY+MweC4y61o6wwP1B5sNzzVgKxCIeeXvTvj4UKfGiHkNTilmgt7PL68AT3v3fH4n4/HebN6Q6ALi3i+j215ZpK3AUFOWoXeyzZexk4XTu87J6Hiy50XkcX8EA4Gnue9/cUXV9rt4XB4dHzc7XTG43E+n89ms0EQpFKpyhdfrPziF/l8PnV6WtzbQ8pEp9MZjUbT6VTNwkEQZKfT7GiU7fXyzWY2k0FztvF4jD1JpVIwEU+n006nM5lOEfEOHTzM5Vq3bh3dvduZzyeTSRRFmUwGGUEi0mq18vl8s9mEXxh0Op2dnR1sIZPJIM44juNHjx49fPgQscXZbHY8Hmez2dlsVi6XkVZcq9WGwyEyLhBbPJ/PR6MRPMXYVRV8dd6+YC2OyZFIdg215d4LlwHZKdppGGgzSdQw7gSJ6JzPW5IQQgghhJBvCBSIiSsf2IRHjcGFHUkVQ9g/VQjQ50Cnd5luxyoCMB/ZrAnnoVEWHig5v2YWHxf4fuD7aK0mIiPPOwrDSRzLRS2M5uhB53mpVAqurjAMoU7CDa2H5vk+PHGB54VR5AeBJzJfNKnDn2y3PT2ceD6fzGaC9chBEIShPpP7vi/aB09PAh65YZRb2OLm+BS1y8XxdDLxfD8IAt8oKfinwNw9n4+Gw/F4HIvkcrlUKoVH+dlshi1LHMvilH65RlhkNp2+/KfneZ5X6nbTk4kXxyKSyWS+//3v+0dHjx8/brVaOFdq5XYiQZ3WVfDKyXn/uLOoOdnVSqVk61N2WtVZ7UnMVbDasdWvX4OOogsXvzsO+je5Wb6CPO3UQpItmy4sk7ymfOK87DUbecPd+43vdaR5HbeSiKV+w91ObvO3PfCvgA3XTl5TO9QdpewrT63Jg/qN4+dVC/adufq3ur6SiBGwH6RnwBe5N5v9P/v9+jdMxXvZWlNE4ngu4v/1X+OosPfiedp7M16sNfE874rIhq10xjE2gosdx7E0my/PiYjYctRCE9evGHuv4iRO0un7g8HpjRtBJjMajXq9HmRffMvEcVwulzOZDOZn9ME7OztrNBpwGReLxWaz+Xd/93e+73/88cd7e3u5XG51dfXOnTvFYnE6ncJ0HEXRdDoNgmAymQyHw2w2e/v2bd/3R6PR3t7e/v6+urb1O1RXAmF/bcq/nYj0S9nOQvreZPST7UbglOus4mzvHSci+c2nWUIIIYQQQsg/DhSIyQWigxURrKCm61KtnOcIDXJ+vap1MCUlCTnfof43NmGHZm2Nycdh+P8ul3d9P1ik5b4UDRcatO95USq1ubl5ZWOjUCzWqtV0On12dtZsNmORdquFpMgwiuAIy+Vy6xsbxULB8/3xeBz4fjqd9n1/HseZTCYKw1Q6nc/lfN+fzmapKBqPx8fHJ8PRoJDPVmu1crmWyaR9zxeRKJXyRIbDYa/XC8Mwl8v5QTCbTpFc2Wg2J+NxGEWe542GQ7SbC8JwMh4PBoNGsxmFYalUSqVSo9EolU7n8/lSqRSFYRiGuXy+2+k8fvJkd3c3juMf/OAHVzY3Pc+T+Xw+Hvd7vfF4PJ1M5nE8m806nU7j7Gw8HvtBEM/nh4eH7U5nPp/7nudnMn/68cc3Dg9T06mIhGG4tbW1GwQHBwfYZyxGvrBfnKN86UVJdjt8lS5m+yNZOew1jemsRu8MjDfUBPP5vKPyixGIoYZgnDtrpbX7lud5UGrQpSopeTg5m46QjS3rb7CUGyK+qvlWW5HzMSw2HtoeNW5bW8JxjJnOudWPsBtBHzCbTqt3sZ0frMaEIwqCYLpA9xlbs1G2tvhkT69uUxuRWUVJ90frLnZo2Z0Rk1WSjKZxpqAwDMW0U9PTi9hZVc20TKJu0wsl2uQOy/lub86x28vhCGdy3mKZlNLw18lkAt3wK6vVjqlTnCqF54WeF4qkvmkhAF/X/nx9xzULAplOO53OQavV7XQ8z1tfX4cBWUSiKFpZWUFSP5zLcRzn8/l8Ph/HcTabzWazw+Hw008/HY1G7Xa7UChEUdTr9U5PT0ejUaVSef/994vF4snJyWAwyOfzURSdnJx0u904jkulkud5xWKxUCg0Gg1kVvT7fUws9v7S7GZnynLuEWfGc+pAznjTOfBCA7jjT9f1Is4kwP/uIoQQQgghhAIx+UYAF61j/lWdRf/XJgXjZ40khrJjsyP0QRFbQy8dVcecNEM8u6rehExMMZEFTiTu3Dyjtjzvv2Wzj6JIVRg/CNLptCeSz+dv3rq1Wq/PfX8vkxnWalEqFfh+t9drZLPjMMzlcp7nzabTMAz9IJjPZuJ5QbXq37gxSafx6JspFND1qN/rQVMu5PPjdHo6nc5n8yAM+/3e9rPP2q1WKl0plYq5/Hw2S/X6s+FgIJNJHMfNVuv05CQWCcNwPBo1Go1evy8i4/F4Np0GYSgi08nkZebmQi4cj0ae7+dyuSiKhsOh53npdDqKosD3fd8PoyiKosFg0B+P/SB4Mh5fm05z+XyhUFhaWlqt16MoSkG88/3CaDR+/nzWbnsi48mk9fhxr9udzWadbrc5HH7n6dP4+Fif9mez2fXr18Mw3N/f7/f7x8fH/X5fNT6Vq6A+qBEbL4DiZodQUmBVX1sURSq6Oa2okpqvdf6qoiqLuOo3b3bk+34ul7Oqq5Uz9HCgeDobtH75MAwhhlpN1kp+eoye500mEx3wsOTb1+tJ0zNpz7bTAEplXysHW53U3i9WzXQkfmv9s7+BGGodgqqfOi/WE478UwjE6Jqlt61eKZ0N9HJr7y+nVVpSq7KalLbEtEoxtikmPFeT08XULewG8UonV30+n2OFPg7HlqN05KtGrGcYH4RrhCuLX9oF/vpGeUWatpgUeGcAyEU9IfWghsPhVzY160W/UIO2F4L8Rjzfj1KpZrP56Oho0O+vrq7WarVCodDr9YIgSKfTqVQqDMPRaHR2djYajWxi78vaoe/P5/N0Or20tOR5Xr/f39nZ+dnPftZut+/cufNv/s2/+bM/+7OrV68iR6LRaDx58uSv/uqv7t+/32q1lpaWVldXq9Vqp9M5PDy8f/9+o9EIwxABF3o7xAYbBpJcOeEovM5iILtSxAkDSZYx7I2AWqO9NznACCGEEEIIoUBMvnEasWMVdCIF7FOlVTf0AU8fNR1XmsoxNm3WWW1tLUhW8lNNzaokL6UWdSGJ+CKZMIwXvXeKxWK1Wk2n09Vq9fr165VKpdls7u3ttc7OVKrOZDLZbDYUKeTz+Xw+lUqh6VAQBLVarVoqTafTwXjsi3SbzX67LSKtVuv09FRE+v1+u90ej6forTSdjs/O2u1+cRbXctm4WvhwPh1MppPZbIJEC3j9IEVNJpNWq4VYyVQqNZ1Ou61Wt9sdDoeqvENVxON0N5WCpzKdTk+HQ2RQplIpmc1kOs2EYbZSmc/nD7/44otPP4XaWCqVNjY2MplMuVyuVqv5fL5YLOaz2crGBixsKd8/Pj7udruh50XZbDaT8cxF73a7fja7trZWq9Xm83mv13vx4kWz2Tw5Oen1erZblJzPFrDZwTpaHO0gqT4kNYJXiYOOcOwEmzqD6pU6zvn0gGS4tg4/awJV2VH3xIqeGrGi68eTWokeC8oqNt3bNutT2VdlHetRtRqimB59Vv20tn11IjtCj+6wSp/W36qOYGi+tj6Em1FDRfWNk8lElWs1X1tR9WVO68KerBHn1mqNH6zxWc+t/VBZmLidS2mbXtp6UtK96ESm2skKurAqa9ZZbKtl+hbrKcZOOuE5VnrT0ohcFCdiB7Dju9SBIYlslq+mC9sbQWfXZN+wWCRejIqxyCdR9L9lMgN7t0Km9zw/COI4ni3M495i3hecMQ1tSATUiubwmNstCAL0qZM4DoIARa9KpZLNZj3fHw4GZ2dns9ksn8+vra1hiouiaDafD4fDdqu1vb19fHIyGY/z+fzyykq5XEbZ42U1JY493w98f4bCpO8j8ycKw0w2m0mn4zju9nqNs7N2pyMi2UwmnU6L58H82+t2x5NJJp2u1mqFfP7K/fsbn36a6vfjOIZ1N/D9SqVSKpWg3evgR5YxRj5qVHEcYynJdDodjUapVGplZSWTyWQyGc/zer0ebod+v18sFj/77DPP827cuJHP58vlMkTkRqPR7XaPjo4ODw/Pzs6KxSJOCOKSDw4O8I0z0erj+SlUV0skI4Od2ckKvrIImrC3lf1SSDYadQa2HSRsUkcIIYQQQggFYvINQp2DKpBNFzG11qnnqF121bldq27NkngIVOnTSswqFal32D43Omu6rTjidLaJ43g6mUzCMEqlisXi+vr69evXYchKpVJRFLXb7dPT0+PjY3i1xuNxqVTSLkaVSmVzczOVSh0eHmI97/Hx8cHBQbvdRv96qLd4hofvcG9v7/T0OAznYTiP59P5LDod/LPO9J/MvHciya6kdsulXxVLB9lMOory2Wwml8sVi0XVp65cuQKXIlyo3W630Wi02+3JZALVGAmVaiubTqeQSKBbQSOOokhPThzHJycnzWYT/Zfa7TaUuGKxiCNdWVm5ffv2+vo6pPNbt26trq622+2Tk5OdkxPoEaq293q9dhSNRqP5fF6pVK5fv3716tXT09PPPvtse3t7OBz2+301XTrKl11fLOfDQ5ySgFzU0QjDwF5c29LKkdUuzCl+E3XMjl6rxNlMCTm/Vtq+WPUUp7+W3ik2gQG6jJ4iKyvrcdnEasesp3WC5Cpvp6mUc3viU/S+c1RF32Atfs75sSLyhZUeuz+w28MNDbMkhjH2BNdRKx/IXU16e+V8ULWKevaVF1YRrGNdCw+OY9c6Hx191l+k0+BU4xZDXUc1ehWIdWQ6JS4n2cNp7eWUzWztTc73Z7NvUZXcltAubCv3W832TrC7dXrKRTEvIjLxvOdh+L9ls43FK/So9ZWzMHz5e9xKkJjj2Etc5eTwRilCRMIwDMMQmmaUSpWKxa2trTt37hyFIcTWfr8/3NgoFAo3b95M372bXVo6PDl5+vTpzosXR/1+o9sdZLPFd94pFovFYnFcr59lMqlUKp1OQ5BFEREmcTGrUqBEYx1Mv99vtlqddhtrONKpVBzHg8Gg1+uhu10UReVyOZ/LxY3Gyv37KZF4Pu92u+PxeKVer1YqmUxmPB7PZjMcHWIlxuNxFEW5XC6dTuOaDgYDvXEymQwGHr6YsIcrKytw5Xc6nQ8//PDx48f5fH5paWl5eblYLG5sbLz//vuffvppq9UaDoc4aaVS6d13363X6w8fPjw7Ozs6Our1emLCW2y514b22CJZspZgB7ydN5xim202oANMh5Yz57NJHSGEEEIIIRSIyTcOeF3xgKcrUm1HGvxVJRI0fFOHkeZLWE3NSSFwJAksvVdRQC7qYyOJhfMvF6hacQSSUxzDgfXuu+++8847eJJHhmOv1xsMBrlcLp/Ph2HYaDQymQwEoNFoFIZhvV5PpVKNRqPX652cnLRarS+++AJmYVhusZ/pdLper6dS0dHR0WDQzeei0A+9eDabZrqz/0PL/9M4lfO7/qwRZDLxZqlXq+aCsJZKhegg53leNpv1fT+bzeZyufF4DE1kNBpB1Z1MJmhb32w2W61WLpcrFArT6bTX60HFhqCMSwN353CRXFwsFsfj8WAwODo6evjw4dHR0Xg8Pjw8hPpQLBY//vjjK1eurK+vv/XWW3/2Z39248aN6XR6fHx8/Hd/Z62L8I4OBoP9/f1Op7O6uhqG4Xvvvbe2tjYcDtFYaTabwUqcbNn3Uq+fTjVh4FVqr6Ny2sFj/WuSWPhsF907H/3mGrGcz3hVzc5aX61y96rtJE1zydFrDxmj1xE37S6pyOiIyHLe5mx1eXtQYnzWtsBjFVVb2knqhtYWrXKnU/6xaQm6KXuYWFCPsYfDhIM+lUr5vg91zGrlyfOgkj1unAuXHdjmWipCfWlKNWKWLVRYnVd32GrQ9mWYuxw7pDMCsUQAb8dE55xeO04czdpp7ZX0UzuzolNZ+VpmfqfzpD0J+ElfORHpeV7/fMQ2Dh9Tmed5+K3veb7e44vSC4aNG1Aex6GI73lTz4P5XNJpL4ry2Vw2m81mM8VicXljI7+21mg0Wt2u53m1tbXrKyupVKpUKg2jqDmbffLkyYcffnh0dIRvLjiLl1ZWisVirlgUkTgIJJPxPS+YTLz5XETGcaxxB5qxjnLEXGSayWSiKCiXcRPNUFoIw1QmU6vVZOHuPx0OO+PxTOe9ySSbzZZWVyvlsohgPQoGcLiQznXs4TslDENU+5BihPMzGAww+BErPBwOB4NBOp1ut9tPnz6FEFwoFK5du7a1tZVOp7HaAw3xms1mHMe1Wg1fdqenp+VyeTQaBUEwHo/b7Ta+aOyt4SzvsMb8Czt5OkK/jaoQY5Z3oieslHyh15gQQgghhBBCgZj8/lEPoApkMKhaZxzWxTuxrVaFwSMoHg6hq6q/1RFNbHIrfqNiVtIvrDZk63jygwALlkUkk07funUrVy7n8vlKpRJF0cHBQafTgV2rVCoVi0UEnkLuaTab7XYbuwQ/bKPR8H3/6OgIb8QTOB7sEdSQy+Vgv8rn80EQbGwsN87mhwf105MNSU+nufRo+Z04vSIpb96W/ourvcl3spnB+toolSkGQWQX+8MjpuIpHqSz2SwUBxic8QA/mUza7XYcx5lMplKpYH/0hNgMgSiKIMm9bKY3n0NZViEDaniz2RyPx91ut9fr1Wq1MAwHg8Hn9++/02zOF2EFqXT6zp07/mSC7km5XC6bze7t7Q0GA8/zVlZWqtXqbDZrNpsHBwfdbldFH8dR67g+nbX/8op81WTjLPv7C9Mzf6OM+6rR7oTwWqnRruiX8zGd1jDr5GiLaaJo9WUtlthsX1nE19pETngG1bLqxP5ardC6euW8pVTLObiFrSKjpmDVeSURNWBDdVWL1FXkssgrxy2cTqdhBMb9pZUhDHLbwU/Hv3a5xB2K2WA6ndowFuvqxcmESqvn2VqqbbCDI05pWoju/4WqVtLeq6UXZ9ioCqwlEEe3tcMgubLeEbiTI9wJzXiNpo9/Xij0v3mNRIyT1FYyvjxdF+WAB4vjsskqOrz1l3Y8aNi01cR9T8STeRzP5zNvcVEgldbr9bfeeuvq1auNxtne3v5kMun3+nfu3CmXy5lMxvf9ZrP57Nmzv/3bv202m5Ce8/n822+/nc/nkcmQyWQwJjG0cBSYSFEXRJIv9lBrAKPRSIujGJDwMmsMN1Z4wE2MBnF6guA1rlQqsecNh0OMSSz4wK2dSqVQF0TONYZ6KpWq1WqpVCqfz2MOR6rPYrWKP5lMNPCkUqm8/fbbyCbe3t7++c9//tOf/tTzvFqtdvPmzR/96Ef1ev3FixeNRqPVat2/f//p06fpdPoHP/jB22+/nU6nnz59+vOf//zTTz/FnicHp1annPh1XDjsm5335KKVQDiZqrk7U3dSI2YGMSGEEEIIIRSIyTcI6wrU9k22axy0M+tztFEAKh9bDUulLs0bVZefXcZul95b5+CFfsyXu3feO5nNZu/cuZMrFj3fD4Kg2+2q/XZpaQmdguI4fvz48YMHD7rdLlquQQsYDAZPnz795S9/OZ/Px+MxegcVi8WbN29CiUilUteuXVteXsYy4f6gH/hzz5NffH7r87O7B9llKcXxmj/drEnRE1+kLZNC5ajxvedH9du3n9+61Z3OvNHw5Za1JRT+abuuQYlAxgVOTr/f7/f7YRhubm7mcjmcNDVuw32WTqdlEWWQyWQg6ZZKpbW1NViVITT7vt/r9Xq9HgTi//Af/kOn04H1+Gww+GeHh6oVhkHwve9972oqdXR0dHp6Op1O8/l8t9sdDAa+7yO4OZPJzGazGzduNBqN3d3do6MjqGlOMcAKEFpdkItCqB0lLqkOO+KajigrSP1WS5WTfslkzcNRhO3K6Av33HF6Oh3hVMG0IcL2BxxCFEVOdoE9jc5K8KRHz6o2Kt4lMyiczcp5T6sVOp20DXvPIooBjRMhbesBYrG8Xh27Tahm6tzE2MAQ1RKOnI9BsIZuK5QnL5Ak8kwced3iGCed8Wbjmy/UfO0bk8kMelc6H/16USy5JxdWUH732d6ZUZ24ktcXV5z+kxoSfaH9+dXbiL147McjX2Zz8eaz9GweTafTTCa9tFS9e/fter0ehuPRqD0c9uNZWiTe2Fi/fv3GbDZ7+PDBr3/96+fPn29vb/f7/SiK1tbW6vV6vV7H1NTpdCDConShtzmaxSEyG3uOiVdHoxOtqwel30oY8NigTnp6VNlsNpvNdmazwWCgSRFaXlXVVd3WEFK1NGKXMrzstrpIpwmCAH7kYrGYzWax6GQ8Hvd6PYjRx8fH9+/f933/9u3b4/H40aNH+/v7+ArDZxWLxc3NzZOTk+fPn7fbbS20OIUNHfy2EpNcKuFMPk6UsDPDOz84BeCvXOQghBBCCCGEUCAm/1AaMZ5dVRPBgyukQxigxuMxOu04Nkl9wtTQCVnYIcW4g23Yq5z3ENnHSzzVqy/VuiZffpxpm6OvH4/Hw4UIWywW6/X6yspKqVRaXl6uVqtnZ2e7u7sfffRRt9vd3NysVCpIhByNRsgXRicfPMZXq9WNjY1qtYpTsbm5WavVptNpt9uROA7D8Xjon3TuHMXvja/6UhJZ9+JrnpRERKQpMgi7k6XHO9nvt6RUej4aTyR+2Z4L9jErXthn6X6/32w2p9NpsVhMpVKwuakRGxIGziqWJ6cW/etgRoMYEUURdAdEGOPFOF3IoGg0GgcHB/D/RlE0FBkMBvroPp/N1lZXlzY2fN/f2dnp9/sbGxsbGxt7e3sI60AWc7lcvn37No7l9PTUWT2dzJa1flVHJlMDmuNoS4qbF/b1gu3aZqH+RhxdT82Yep5fo+LpW+y1U5nMDmarhuAiOr5v3aYehQ1AQL9BWbRBc3rKOR32nIDgpF7sHJrt+abvxQ7ox+H1ar1XaTifzyMaW0QymUytVisWi3A46pqApC9VFtZjnSVg4cSth+CU4XDY6XQ6nY6N/dXQBhVtnTaYksiV1uZ+r9FhbYVJD816w+350aFou6jZeo8We2ThQ08WGJwChm7c6REnJsXVjiInMOQN9dzfOOfbNO0LFGQnAQAXZVFEdHR5azMXE6Yhppui53mezCWeeWFukr81Czfn4ygejtLx06XKfj5XWl5euXFjdbmW6rYOvvg0NZt7K7V8uZxfX833OgcPHzQ6nfavf33/b/72l7PZHFESUZSq11dWV1fz+byI4MZEfLxW0bSVojpzMU/i5+l0CpcuMnxwyTAmcTvo3YGNqGse5To9tFQ6ncvl+ot0F/v1h3vcJq7gBEJuxsepbx3KNWZ77CduTGRE4IRXKhXoxePxGN7ezz//vNFo3LlzZ3l5eXV19U//9E/v3LlzeHi4vb394YcflsvldDodBMHa2tpsNjs7O0NbVDv9WsXWVovt3ZcsxTmVsOTVP1cWSNTGmEFMCCGEEEIIBWLyjcPpWq6PhbqEXM2DGvugC4fxLI3HWpsU4ZhJHdNQUvKzuqEk2p3BApbLZivdrnd8rO8djcetyWQ4HEZRhL5qt2/frlQq2LGzs7O9vb3nz5/v7u4OBoNKpZLJZCaTCZ7GkdUIB/F0Oo2iaHV1dXl5uVQq4UCgIEyn0+l0Fst0Pp9u7y0/a1aGS1F8SyQnsiyyKlJY3E8tmZ/5zcNMoyOjfmc8nc7nQRSlff/LCFrtIaYP5+PxGOkW2Wy2Uqlks1m4g1WLV5FIvZZ6tlXUwGvQQwnihV6vIAgymQzUvZs3byJNeDKZzPr9wOR1jCaTx/fvZ0XG43E6nYb1LIqibDZbKpVyuVy/38cK5ZWVFSQjdzqdk5OTwWDQ7/d19bQjBFvzuNULLpRik7rehZuyMbJvLpY5ep8OSJX8VB69cPdssoEephV8nfaJqu5ZH/2rwotVZNGNOJZVXcGdvGt046pkOZngVvm1W9Ydww6o2o4toHcWRiOqDoVCoVKpaBPIer1eKpWwHbxmMBhoYUPnCrgmrZaK/4Vmh1X8/X7/7Ozs4OAANRtkXuvJccJnnP6HjkqVTKpx/N2OLzjZAs5+qCPpOvvjrNC38SA2e/rCEogTweEMHieY23FV/45r85Md8Ky9+uWOJT5iPp/PzHhzOhw6r3R0wy+TrOM4DqJp/vYo84N4kPPiUTR9lMkdLa0uVZeWp2Hh0e7o+KT58PH1+lqxfKU3yaSO+7lP//bo6GCn3+sN+o3ZbLa8VLl6datcrfmen8tlS6USyoSz2SybzWo0xHQ6RTgPsn2n0yliIvCNhmPHJBkuwA6jEoapFTHBmKWHwyEqN/i90/nN9/1MOg2FF59uezM6S3NkYajXkgZuHITU40NV5kY5U/315XI5n8+vr6/jVh2NRv1+/+Dg4PDwsF6vv/POOzdv3tza2jo9Pf3rv/7rBw8ePH/+HF8BV69eXV5e3t3d3d/fb7VaNk/mVT0A9Dra4WpLAjalJzltOm1p7ST55lU9QgghhBBCCAVi8o+Eo2Xg4R8SqpW0sKJcDVaSWMQNiUpMmCkera3OApHL0TvsEn74vFQNxGNnJpMpFApbW1t33377nc8+kwcPXm4wjn3Pu3H9erFUKpVK1Wq1UqlMJpP9/f3T09Pd3d3T01OYc1dXVweDwWAw2Nvbw7N6JpNZXl7WhN8oihA6vLKyAgUQJtlutwu1p1zMjIf5X+/94FntevwdkXWRtEhZZEkkKzIXaYgEIqHMgvjXjVzw3yq3rjY312epVIRDg9cSje9wmNlsdjqd9vv96XS6vLy8sbFRr9fDMBwOh61WazKZIAEZKsZ4PIZIF0XR9DxQGZDrms/ncdohLkRRNBgM4P+NoujatWu+75+dnfV6vdNer9Tv+8OhzOci0u92/92/+3fhzZvvvvvunTt36vX61atXHz16FMfx1tbW8vIyuv91u93j4+N2u725ubm2ttbpdJ4+ffro0aNGo6Hro501yNZcliwYqO8SgrjabK1uZV20GjJrR9QbasTYgjZIVMkY9nn1/dll107UrNpa1U9nu9vZtepO+C82axs82gPHzzbqF65GfSVitW0bPZVX1EmtGcR4vW4NG8fb9XJYEQfJ19CC7WLzbDb7zjvvrK+vwwI/nU7T6XS5XIY3M5vNQnrDgY9Go+PjY/R+hOiGYkyj0cCmUPbAEEUgAE5ULper1+ubm5vpdPr4+BiZ16o/wmWM48JptxdIZXpr07ZKq6qxGlhstVEdDE7xQF2fenWcNA/ng9Qni4Gk107M0gqr0ascqRvUhm86wOyEbIVIp7HebysNW41Pzw8mEE2Hf9lrzjqLUUoxJnGrpDsmeidXRLfjB0HsezIdRc1PgmDbj71MWB2O/6+Pnv2fXhxk/Jw/SY27k16ciifR8k4n/ejjiTebzwaz5mFzcNoLZvP37u793/7V360sR6l0fjydz6bT2VyCwEc0MMYnqhqj0ajdbvf7/Xw+n0qlJpNJr9dDJUOTJTA96vhHMjvSeCDIooKI82NzVMIwHI9GVkjt93qdTidTLudyOXw0jMxIclczPjrX4QbHHYrlAtjD2WyWyWTQRhXfSjoe0uk0qp5YXzIej7PZLBL2x+MxvuNQDf3ss89WV1f//M///ObNm3/+53/+8OHDzz///MmTJ6enp/V6fWtr66233nr48OEnn3yCXqz41sDw1m9t/RLXECStZGhRzZYH9MbR4arTuL0H7XSkNU7+BxghhBBCCCEUiMk3AifDwTG1AZXtrDSmzZrU16n5CWpfVflGjEfJijt2N/AEjqdTEclkMshbgKOqUCisr68jU/jLERwEKysry7duYSnxYDBAu7nDw8Ojo6Nms4mURmhVkIDxzI/H4KWlpc3NzWw2i8+Fv0w1Miw6Hg4Hs9k0CjPHJxunx5n9wfL8eijXRdZFUiIFkYpIVmQmkhYZiUxk0gx//fmN3b3lfzl5Ui49S6fH8ziFx2wo7Mga1jiITCazsrKysrJSr9chWORyuSiKtOO8yn9oW5fL5YbDISRmmN0gouGv+AhEbeJywPKJ9dFwB2N18+rW1tLeXnB6KtMpLtDZ2VlXpNvt7u7u3rp1S1M4sIflcrnRaLx48eLs7Ax/ymQyq6ursNetrKx4ntfr9c7OzjqdDoaHrQ1caOFU2cv+RqVSmyrrLMOXRHDwG6pjSWzegn1l8vUXGpYdRTKZHWw9quoKtyfEBnE4m1JhOpnHbTV0PRB5hTXPsQfacADtzaXKvqo5YRjm8/lisSgiGHLqTxcRSGmDwQDC6GQyOTk5QV9EvHcymYzH42az6axkV21I+/gh4LVYLPZ6PUw1KHtgFOkh2zPpnPykazh54MkRKAuX95cW1wSOy9teF6dCJufNv44zN/l2Zz8vzI6we55srvjVBGI78OxwOneKknuSiLmwm3X6RtrLoaI8Pkrms/TkKB818vmoUJzvnKQOW8vtoYiIBLl5oSRZT/JeV7z+KCVTkYnMs1lZkXgc9/zs3llzOJmXipNSsZXJxtNpEEWRiIf+n5puhNnbtlZD1WQymWCqT96AYsz4qKZga7Ydny0sfZlSLQJPfRhF+LrRT7cSOcaz1vOgU+NkRlGUy+XwVavtHyEi60yuZQz7Rh0YqVRqfX09m8222+2Tk5MHDx6MRiMI5bVaLY5jNC9FCn8mk7l27Vq5XNa4eXsqrNxv7wInPv5Vs2sy1drZmtPgkRBCCCGEEEKBmHxTsD15nGc8+/APDQhWPlk0qsK6cvsQq5qyfXTUdkaySOq0gggiF1UchFxVqVTu3r175cqVfD4/GAw6nQ6yca+3WrrlQrH47rvvPgyCX/3qVzs7O/P5fDgcNptNeMcgsCI7NZvN5vP5crlcLBY9z4NLMZ/PLy0tFQoF7B5EATy9q0wwGo3ieDyf5//u43e++FVtr1qJvy+yIrIkEonkRUoiGZGZyFykKtKVeNkblDLDs8xHD+PlQueffufJdJYSL4QcrAuT8SlIclheXsbCYSgR6h/s9XqDwQB5lCq7qAKCazGbzdCwKAiC5eVlyAc2XwKCCI6r2+3C/lkqla699Vb5ww+tv29ra6tdqQwGg8ePHx8cHHz44Yej0aharf7oRz/67ne/u7Gx8fTp09FolMvlJpPJ7u5uo9GA3l2tVt999918Pt9sNj/77LMvvvhC40psH6SkmmCDIxwR1prRXtWzy1FIX4+GqCRzV+2AtCqkTZC4UNfTGFmVoqyxV+3DTr8y+0s9SxiuuKZWytSgUjhMrbBrsw7U1++cN2sLFZPDoCfBWrNhckTHrSAISqUSXMDQtlS9ms/nzWaz2WxqLjlqD6enpwhXxWbT6TR+KecNy9aeCTV5Pp9ns9mNjY18Pj8ajZrN5snJCW7hbreLeoOeXqfCpAfohDvLIkvdGs+TI1Cd43aM2SgMR8233ttXxQFr/cwZLXbQqg9axb6k0GZrDFo4+V1kNbspOR/BYUt6IjJPHNf8Fep2ssRojaV6dbQOEQRBqVS4d+/O+tqS+JXBZ7VHcTwv+S/n0kIgOZGCxCKzkScTkYHIIJCRxD3Zn6z9p1/9qOBPtuqn797aXyqNsplJIT9Ppf10Om2DrUUErTs15EREUNYqFov5fB4TFwLcU6mUZmQHQQCzvM2XQCoRUiBwaOcyiH0/l88vLS0NoghfhZlMBnUONKzD4atD3N7F2OF0Ol2v13WhCfqUornobDZD1RB58erq1WUHqNlgNFYqlZs3b7bb7QcPHjx+/BitL6vVarlcxu87nc7e3t5gMLh69er169f39vaePn2Krnc4G85dYNs2WqO9VoudbnXqGrZjyc4w1pX/tfRdJIQQQgghhFAgJl8PSZuPrr92XJz2QVGXq0NeUXnXMXtKIgZU13qL07/ovFkpDMNSqbSxsbG1tZXJZE5PT4fDYa/X63W7npH2wiDIZrOt4+OnT58+f/4cT+D9fh/LZhETGUVRoVCANIx17nhER+v5XC6XyWRUA3JaY71sYCW+F4T7J8tPt1emeZGCSF4kLxKIZEXSIpFIIJIWyYrgBVUvPpH9ZvH5XuU773iZzGA0Sc3nURB82XxMH7Phko4W7jPtca/BlHAcq3/NkR1hIu73+9r1yFGUINVBYoDqkcvlcrlcsVSKosgzdYKVlZVMtdpoNBqNRqvVOjo6ajQaGxsbN2/e7Pf7o9EolUqVy2Xf98fjcalU6nQ6WEwdhmG5XK5Wq8Vi8eTk5NmzZ0geeI1K5QivVmxKagevyiZ+laXxNQKxFROtg9L+U1NKNX3iQvEOv8HV1H1OZhHYm0KzCzQsQvVBG6RgFTet32gZRi+xylU6oiA4qoVfjPFW91xjXlTbhZ6F1Ihisbi2tlar1eCm932/2+0icAbKL/TiRqNxeno6n88zmYyahTWvQGeS8XgMUzAKGNDBp9Npo9Eol8u49WQRn7K2tra+vj6bzU5OTg4ODtrtNgzIBwcHrVYLS/KTecGOkiumE50NnUh2VLO+UbtGXm9AFbOsUq+3lV1B7wijdjDo7Ofksep7NWlEztvGHUVbJ+TfsUmdnRxsiLMtmczn89i54zBWz9vh7XeEnA+NsW91TlQQRSur69/93g+vrNcfPjwaxsP55kw2fSlCIBbJiRRFPJGxyESkJ9IVGUjcld5x+unhejCYHTyr7uzVC/Pp9z7YrX1wWMjHcZyfTGcIc8fCkUwmo6oxxrnGW6P+AdMxjh0jUESQEYFEYyw6gVyLVoo4QHyDfGkVF0mlUplMpj2ZDPp9uImz2Sw+VLNNkIls+9chFygMQ+S8Yw8RNoKbHVUZ3CYqLmuhEXeuXtbpdJrL5QqFwsnJyfHxMbo+4thrtdqdO3fu3LmD74sHDx7s7u6urKzcvHmzUqmcnp6ieak20Eu2BrWLITQmwt7seo/YVUdA5WyncSUFYkIIIYQQQigQk2+cRmx9c1bMxZ9UUdI8TccOXCgUIBvZBblQadWgh0dTEdEoVWtpRBIo/FOpVGptbe3GjRulUklTI5rNZhiGt27dulcsen/xF+ir1mq3f/rTn/682+12u1ifDldjGIbFYnFra6ter+dyuXK5nMvlEJM6mUz6/T5CHqvVKp7Y8aCuEa5QCqBTFwqFwEuNZ7mgOgvW59M1X+oiqyKrIp5IKBJijbFIXqQuMhVpiHRFUtJ7lvn7/Ru1X0zfu7Wfilq57CyeT6dTUUsmxEeNgIAe4fs+BA7t/gdtF3IAdi+dTqMTPQS4s7Oz6XRaKBTy+TyUC5xeGN8gQKhEtba2Zh/1dRgEQVAoFKbZbDqdXl5e7vf7cC5Pp9P/8l/+y0cffbS1tfWd73znxo0btVptNpshdGJvb6/ZbCKJ+PDwsFarra6uvvPOO0+fPm00GhAWL+xYdaEypfUJMUuzkzqCY958c6HButjsb9TVLgl3s0qNYsIobIyAjV22h5lM2NTEZNvRUUUTe1r05rJrsTV9RUsXmhYK6Qri8pca3/mACxXp0uk0xj92A2USjKtSqbS6urqxsVEqlRBEfnh4CH86tgwfJY6uWq2m0+lCoRAEQafT8TxvZWUFoxfVl3Q63Wq1KpXKbDaDOx66GzZyfHysDne4ifP5fKFQgCmyUCggVbbb7Var1Z2dnV6vp+dZ9TLV/XEFcefqycQLxDiCbfNMVfbPCaPnJXinqaaj9TtVgQvbDzrNCa34m2xRqPkedq+cm8JpZvjbqsNJ/frCMp4n4raPPL8CQNeFaFnifJSEWA0aGjHqGaVS6fr166v11VQq6HY67UYv3hTZEKksBOL8QiAeiYxFeiJtkQEmVU8yMusGx4fF42dF7yT2U/HNW/2ta+1UZtbtSq8ns9l8NptDpS2VSlhNotMs5lWUK/BNpCZcjYGG8300GsEyj7egPOZEin9ZKDKnCvc4No5/YqkN5nZ80+ngUcEX96Mu07HTI+YKSMZIk8Ce4IsAXxAY6thOuVwWkdFolMlkTk5Ojo6Ojo6Ooij60Y9+dOPGjTAMG43G3/zN33Q6nT/6oz+6cePG6upqtVoNguD58+coRjoj2UkmwXHh5rXRE8kmda9J6UkmhhNCCCGEEEIoEJPfJ06OsBVK5PwSfus6VC+bNm1XyVgWMRFWBHE0QbUu6mdhNW6xWKxWq4VC4cqVK0tLS41G4/j4GA/Mq6urhULh6tWrqUZDd77f73/++efPZjMsz8cjfa1Wy+Vyy8vLN2/eXFtbQ7IwNGjopP1+v9/v4+kaKjYey9EjCK+BOvyyyd4sHk5mM28SZ2LJyJf/JyK+0QYikcKibd2qSCSzqb//rPJfP35791ntex98cfetXj6fHk9ehlHCiJ3JZHAClTAM4WtGBiVUFTjLVHTAPuOvWBCNdyG5WOOhNXlAAx9UjAjDME6nffN87gdBNpvtp1LQI+DorFar0Og/++yzZ8+eHR0dffe737137976+jrMa+VyudlsqhzcbDaz2eydO3cKhcL29vbu7m6321V3tk3UdQySKoHZnIfXR146vrbfSiBzpK6k4d3G5tp/Jj9abx+77FrM0nt1Vup7cY1spzLcR/qzpoJaedFqlI7pXlNHklESzkEFQQCjbrFY1MXyMFQOBgPUG549e6b35nw+L5VKKysryAiGgDubzTqdzmQygUkTwrHneYgIVwUZJYf19XXVPVXVmk6n7Xa71+uJCJzLOIfdbheOSwxmdLfLZDLr6+uj0Wg+n/f7fXQSa7VaWHQ/mUyQcmN90/a06EnTqcbKu0ndE+PfTnpWUL5wRFmJWc7HX9hoV1v50DlWu59duPDCGaU2uPl3EYjlfOCJU0TRvf/yja9IcJbzmeDOmVQdGXfHysrK2tra2tra0tLyo0ePw2CWzWTef2/9bBA0jiX2RAoioUhapCCSEpmIjEWyIhmR4eKvGZGeSFokECl4D1pLf/vpSLyzWnmSyUwKhfFkkg3D0Pc9NKybTqe9Xg8dR9H/TbsIYq8g3UK9RU6xqsa6kuPlfzCFL/+TKYqidCajFaB4cf8uVSrTUqnX63W7XRT/MJzQsA4TOG5t+Jd1plUVWL3JGOeDwQAzNnZMh+54PIZ4LYusJ2S8qEycz+dRB8rn8ysrK91uV0R+9atftVqtbDb7L/7Fv9jc3EQA8dHRUS6Xu3LlSjqd7vf7jx8/1vqTU1DR8WkXKzg6sjMsbaix85avNoAJIYQQQgghFIjJP6BAbE09ct7+Zl9mszjFtCMXETxm45FSlRcVQewqVMcoh01B6yyXy2+99dbNmzfz+Xwulzs7O7t///5kMrl69eq77757/fp1SMAnJydxHGPPxuPx0dHRyXw+XWhzlUplZWUF4cKVSgVPznA1jkajYrGIEFWImxpDCdUAYhlCUVU6HwwGw0G/1wsm/YmM4pernvF/AYQTezZFApGUSE5kJLIk45PwxfPKYD/81j/ZLRUlmw3GkzFOApSyXC6H3cCpgBpeKpXK5TLUOqhgECw02cOR/+ARTqVSNgISr4TvTAViaHnj8TiXyxXLZd8IasHCIQ4hYzKZlMvlVCo1mUyg1rVarU8++eTs7Gw+n1er1fX1dSgRWJSNxIlGoyEiS0tLaAN1fHyM5AGEkDg+XHyuJufqz3YZspw3XaoeYd3uv61AduG7HPErKV7bndExrHqiqodWUrEdupxYWzgHU6mUzUhV6VlVJCvGOU493UlISFaE1RECu6KePayaX1paun37NjyDuIWRYXp8fLy3t3dwcADxF8beer1er9dXV1dzuRyaOpbL5cFg8PDhw+PjY4hcGp2B/81kMrPZDBWXSqWiHwS7cSaTQVJ2o9E4OTmBYTOKosFg8OzZs2az6ft+Npu1XuBcLre+vo6T3Gw2kW6h7f4wnrE6Hu+y/cFs4G+ya5zj/NUiijWG20um49NJ7LVamMZTXLhU31mc4cyKr4lSsTuZVOK+Wl3QzvnJj/NecfvoHaG74ejpVhxHvg3O2K1bt27evFmr1URkb3/Pk9n66ua370327x98tpvud7KTWXo+DUREKiIZkbTIVCQrUhSZiPRFCiItkb5IWSQvcUNOjvN/8/jKwUG5Fo03Nwff/15YKYe53Hg6fRmSgWkWRTLcWZiRkN6u40Sj4TGoMNniiDSZ11YOZiZ5Rmekcrkc+H6329UaKrovYohizoewq0tVMNrT6TRG6WQyQawQIn3wvaAJTvgg/BKpQdgZzNhIesGeIHQ+l8thtUe/3282m59++umTJ0/ee+893MWPHz/+/PPPW61WEATlcjmKomvXro1GIwjT2A1dlKDf/vaQnZUcTvNDp6blrPZIxoITQgghhBBCKBCT3yd2iajqBbZxU3IVv+os1kAEwQtCgFoprTJluxXhE3VVMp5Cl5eXt7a2rl27FgQB1CU8oK6srNy+ffvGjRvNZvP+F18cHh3FC1V2Pp/3+v2BCLQ2rK6FrFkqlaIogtMKuirELHwo+hfhoXc6ncJBhtX3qvpBrh0MBv1+bzBIzXoyb3vSEemLDESGC7ObqgQzkYnIbKEU+yKhxJFMIr8v0WSW9byJyGQ6nYjEGiIppquYen71T5qAYeMsNd5RRXnExaK9khWAVC60rm30/oKJ+JzMtLismUwmn8/jGuGEQC45Ojo6PDw8Pj7+7LPPlpeXl5aWVDWo1WrFYrFYLM5mMyQDYCNod2YlYKepkY6iZBKxKghJN7HqUxemtb6hTJz8p1VhXtMZ78Kb6DVSdTK54vVbk0SUwatWattr7ZhbkyIyhkomk0H5AV5gaKmqhyJKWA3OURSVSqWlpaWVlRW8EWIuDPuQvXBPQb2FHg3JG4ZHFcJwsfBxuqgfUjJ8ndBVbd853X87mDGuELqtodJaoMJHXHh1XtWE80Kl+FXXIlk5e/21dgpvr3lNcpcuHKv27V9heb7K0JqwbG9A5/Y8dxLMjulIs0tArHitr4E6vLy8XCwWa7Ua2oGKCOKnh8Nhr9uazv/yTvTUm62+eHHr8Oz68CwnN0XyIplFek9GJCcSiwxEUiJ5kYFIViQlUpJp3t/Zz50+TEfNeb02zUThP/1hsLTU6/dnk8kYacLQWFE5QLgEOn9qDzod/9qeToODMaPiNyjDYP2He/N63jyOUczAaMc9AnkaWe1QbzFRI7NiPB6n0+lKpZLL5XDLIEBZs2h06tNyEf6q7mN8RepqGC3H6r2jNT/f9w8PDzudzsOHD/f39+Epvnv3bj6fj6Lo9PT09PT0xo0bN2/ePDw8/OKLL7a3t3HqrF1dv6TsfzO8Kk3YFmOcOV8SRThCCCGEEEIIBWLy+xeItWuWdp55jdhkn/TUnYe/YnEuHqRVeEIHdl0y77jzRCSbzV67dm19fR2S7uPHjzudTjqdvn79+g9/+EM8OZ+dnT158qTX6z1/9uzt3V0xekQul7taq61vbFSr1Xa73Wq1er0eHomLxSKEJxGBHAbpGY/u0C80xVUl5kKhICJ4gJ9MJvN5HIR+EATeQILufNb245Yn7cV655lIbqERT0VGIhOR+cJKHIhEInkZdqO/+/trt6/t3r5+GARxKpWZTKbQ4+I4zmaz+XweewVFFYvr0ZU+l8tp+y/kUUBExoHg5KPHEWzRWLCvTcMgIuCEIOm1VCp5npfJZObn1+PHIr7v12q1paUlONpgf8N7gyCo1+tvv/12s9ns9/s/+clPPvroo+Xl5c3NzbW1NThhEQNyfHwMjTgIgm9961vf/e53j4+PHzx4cHR0pOMH8p9mW2MHbE3Cccs6NQyrG77Kevkq/U4dr/obrODWwNlkwKvj27VpxVCCcAc5gQZWfcNmIZjaLaigb1uWWYUagwQ1FQ3vxgW1uwfpSl3Yqung6LDSHIOnXC7fuHFjaWkJWupsNkPUw3g87na7k8mkVCqtra3B2766unr79u2trS2kmrbb7efPnw8Gg36///Tp06dPnyJNQgU1jVdG8gmaIsIOnM1mq9UqRmm9Xs9kMhDjoiiCWo32YhCm4bLU1I5Op4Oeh9pSD0MUJsfhcNjv96fT6WAwaDab7XYbt7MWrhxDsR1UelE0v0XzWLRRofXpq+vWkbc0QQU3gtbAkiv0bWyIE2+dVM00rkTXauh864yBNxeIbXFOEgWbc9WLi+zMzr1m53+tReEc6shcWVmp1+ubm5vb29uPHz8Ow/DevXu1Wm1/f//HP/7xs2dP3rq18u2Nm/4Tr7m7OvRykhfZEpmI+C/LbBItfsbUGonMRV7O4jIe+eOeLx3pb4ef/Kry/vvN1dXRfB6m06lWq6UzIb4LsG/D4RDJKhCIcSpQDkTfRV1HojEUGkmhJc+ZaVIXBEE8n2OkoQsobg2MfCTy472pVAovw/cUpmKEIEEg7vf7qu3CF+xk3eCe0kwMnHwU/DSpBiMfajLelcvl3nrrrdlsdnBw8NOf/vQXv/jF22+//W//7b/94IMP4jj+i7/4i0ePHq2trd27d297e7vX6x0eHsL1rIdv22Y68dnJGThZYHPKb0wfJoQQQgghhAIx+SZiTZrxedQ0JIm1//axEBKJLpy3m7INuPCQrFbBcrn8zjvv3Lt3r1qtNpvN3d3dVquVy+Xq9fq3v/3te/funZ2dffjhh7/+9a9PTk56vd7x0dFqsymeB404m8ncffvtGzdurK2v5/P509PTnZ0dtCSCxoQ9wRM7GgTpIcCxpX5GWQRlFAoF1c4mk8l0OplOJAxm//wHz+9tdT7sXXt2WI1PRNIioUhBZCKSEvFExiIDkbFILBKKpETSIlmRvIzH4ZO9pZNm6y3/JJ0K4XeEvKVKDYQ8pA/D3YbHfg3x0BZ/6mLT3GRI28lHbmuz1SQKyMciMnSMt3Gcz+ezlQpOGiRFvABKMXxqUHsPDg4ePnzo+/7Kysq9e/feeuutzc3NpaWlXC53dHS0u7vbbrdRMKhWq7h2kPnExCy8auDZkF9rJbbBpo6J703EMkfbTQp81jjsyHZ2l1QuUXkR8igEGic9Q23ymh+qN44KoCoaWqu1I447fc/0jaqtqycUVYdMJqM2xnK5jFBvBFWvrKzEcdxqteDDhXlwPB4jBHx9ff3WrVv1eh0B2blcDtElk8nk+Pj40aNHp6envV5vd3d3Z2cHki5GC5KFMVSQ/NDtdhFqgVZ4pVIJ/krbJS+TyaDbYaPR2N7eHgwGqVSqXq8vLS1B88pkMogYxs2r+hdMqVosgfR5cnLy5MmTnZ0dx2CO06X3miySW1XNdNIk9JqqOq9vQScx69O0o0jXBFgVzEYZOBOsXOTAtR5eXeiQjJP+CvO8jaewe2VzhF/qvCJy/gbxfT84n0qhpQh7XBqygdLXlStXbt26lclkut1uGIY3b968detWrVZrNpuHh4ci3spKfWllvZjPBblW7/7xr/ZLk5Uw7nsyF8FSEST2IH0YJbeRSCgyXxThEPszFUl5ko/SuWy5NPSD+XAYo4oAtTeKIvTM1AahmFGx/6PRCJ0ekf8Awy9CG8bjMQIfcN0x4CeTycxMQdhst9udTibwCGN0adiIGpBV4cUbcZ/afpj4btJeoyhU2HxzzBuw9+I3CIjodDrad1G/EXAhNGoGJdVarbaxsTEajf7qr/7K9/1r167dvn17OBw+ffr07//+74vF4rvvvhvH8c7ODkzHttmjrXjp5OOYgp1R6rRnTN4ChBBCCCGEEArE5PePXTRqlV+nsYy1/9jGWVZf1sRhOLYcuc1uM47jpaWl9fX1jY2Nd999N5VK9ft9dDm7e/fuvXv34HL9+c9/vr+//8knnzx9+hTy4mSR1atP17du3RpsbeULBdj9JpNJt9uN4xhSFJRf6FxRFMEjaXUZKGiqr2lXJWgBUJA9Lx2F8s6958PrB8//qvhsvyJH3kuBeCgyXgRNTEW6IoNFyoT/ZR5xPJJeI/r408q11cKVjaEM8LjuaY4qnvbVyQhRADsJUQ+OM8hVeFxXUxtSjDWzFc416JU4KIjCeD1Ew/l8PhqNuguJREXWKIq8TAaHDzUZncHwXqjYhUJheXl5Op32+/2zs7Nms9nr9Xzff++991ZXVyuVShiGp6enzWazVqt1Op3j4+P5fH7lypVms3lwcIBPVIO5Ok+Tvl1JdJCT8926bNe7NxztjtLqhGNah6/18zptuFTNgbxoWzlZ0dDeU9ig1R/t/tiAESdC2t44GqTrtBqzGrGqz7j6+Xy+WCyura1tbGyUy2W8eDgcnp2dnZ2dISMCdu8wDJeWlq5du3b9+vWbN2/W63V0ytrb2zs5OVGB+MWLF2dnZ+PxuN1uQ03DTYRBpUULCMSj0Uh3fjqdjkYj1WQh2KEogr6UjUbj8PAQEvPR0dHKykqhUEBnPBFBHgXCxNvt9nA4RNYEzNE4alR3cAIRQDGZTGCitI3p9PJhZ6y+qXZyMV3p7DCwMt+Fo8424Uzacq2y5vgurbXcRlfjTyrm2hjcrzzhX/izK+HJuSZ1cj5ewxmoTggMzmcURXCgLy0t9Xq9fr+PAba6unpwcPCLX/yi0WgEgb+1db2+eiWXi3KlSZh7Vn86/jS+cnhSHp+FcUUkLZIXSS/yiP3FDxCL0b8uFqjJk7z3YpD+5GGxXBoV8j0UzxCZYmtRWIqBYOLBYOD7fqlUwghBAQBfRphIbfSE3uNfqpz4p0g8n4vIoN/v93roC4dhqUE9pVIpCAJY9THvoTEjcnj0psZtov0ksQV42zEAEJ2sXwEowuFnzWuCAK0B9LgWsNjjbJRKpXfeeafdbn/88cfb29tbW1v/7J/9s62trb29vYcPH66vry8tLX3wwQdbW1t/9Vd/pY1SndBhnf3EpE5Z/VfOu4aThmL6iAkhhBBCCKFATL5xGrGIQB2zDjv1KiLo0L7YJkVY1QMPiurMcgRiq7nU6/Xvf//7Gxsb1Wr1wYMHL168aLVa+Xz+j//4j//oj/6o0Wj85V/+5U9+8pN2u312dnZ6egrFJ5fNptNpfabE+vR5Oq0d8+DMggQAF5UKkXBUOYv0sdvj8RhaFbQkNOqB5uX7fhSlZrNJFDUDP0jN+l5L4qZIeeFig3c4EJmJDERGImOR2SK2U166iYex/9HHtXevl65vHc9n08lkIhKrjAsxS+MvIQ3gzGvusCzWlWvPOvygyiMuU7/fV1sxXpbP5/P5PLYAhQJrmTuwfxoJSJ/k4QTXrke44jgznuetrKzAjocTdXp6+uTJE+w8VL/hcNjpdIrF4nA4fPz4calUqtVqq6urzWYTnlO48ODDVU+o1SCcZNgL5QmnqvHm6nAyMlVMsoQGC1gJTzNwZbHqXM57P3VPHEO03jLJJGU53yJSjMM0qcSpaxhnzBnGqhmpIgnj5Nra2u3bt9fX1yFXoe3h8fHx2dkZLN5xHBcKhXq9XiwWkUC6vLycz+cxBtrt9v3797/44otutwuZDHUauPKvXr2azWb7/X6/34fWjFsSHlsNfrUnWY232BReg8Z0vV4PnxIEQbvdPj4+hpW+Vqutra3V6/VqtRqGIfa82WzOZrNUKrW0tLS6ugqP82w2QzQNFhOMRiMUJyaTCUavvaC2uGVXSGhuie0cqC/QS+xkm+gPdijqNjHOVTpPtnGzazXkIoOw6uwXBlL/LqVBMRZ1O2h97OFF++CgLTdV0MRozOfzGxsbuOtbrRauVBiG29vbn3322ZMnT7LZ7NWrV6vVWjabi1JhKhV/O3d4Z7PZ+zBz+jg/zgey4b1Uh0sinsl8h3c4FglE/EXLUE+mae/xTvS//aRyuh//k3v+xma7kPfH4/RgMJxMxjj/+CLI5XLoojkcDjU4GIot1OF2u41cCFvURFFBv2uCIPDstfa8eRxPJ5PpdAozvoig0Rz0aEyMSJaAGI0iRy6X0+55EHBV54U4i6GuXwHwQaMuaKcCLJrBvJ3P5z3P6/V6vV4P5R+9RzD9QkE+Ojr667/+6w8//HA4HP7zf/7P33rrLRE5PDycTCbXr1+v1+tPnz49ODiAwu6UFmzx2LHMOyuHbK9apw5BCCGEEEIIoUBMvul6sYYRW/lA18vbpbX2sVAduBo3rHmX+kb8tVqtrq+vFwqF09PT4+PjdrsdRdH6+vrq6mo2m4WmcHJy0u12e70e1v+mUqlMOh0Z02scx7PpdDabzeMYD8bpdHoymaglEw21dI22ruuH7mlNrM4iX4B/+n4wnU6GQ5mN50vFVn467HSy0l3cQIHIZCEWDxb960ZGKZ6KzGU+9dqtoNsNPZH5fAYzVzab1bXAKp3L+YZmmuAMhQv7qU/sVq9PtnGTxbp4bWHX6/VarRb80Un71nw+j00Aq1qwVXzEZ8HRXCwWC4UCDJWNRuOTTz7p9Xpvv/32fD4vFAqZTAYWvEwmk81mC4UC/J7wx/nn16rbMeYcgrp3rYR9oc71hhqxTR/Wi65bVi+8NolyZGLdW+sDlfPhyLb2oCPfqZckBWInzsWeGXsGcE6gH9nD0dwDjOder1coFIrF4q1bt9bW1tQU2e12Dw8PG40GpKggCFZWVra2tlZXV2/evHn16lXf98/OzuAaPj093d7efvjwYbPZ1KRj1CGq1eqNGzcqlUq/30dcQKPR0FAXjX1wThG0qlwu1+/3T05OcGj9fh8OTb1D2+12t9vFGUPkCyIy0um0iJyenk6nU4i/s9msWCyi2163242iqF6v1+v1nZ2dXq83GAy63W6y/6EGeljVz4l0UD0RaH3LushVHbMFMMc1qZE72qDPGbrq+3Yuui0q2L9a6e0rzO1W2nPyguynv1TAnclhMVzRtdImIWhXN/WSZzKZarXqed6LFy/m8/k//af/1Pf9X/7yl7/4xS92d3fffvttOFVTqWg8HnmeFwReNuuVSvNcU7xtTzKeTETKIpFIQQQT8/SlWVh8kcjE+OREChJPpJf1f/ZJ8ZO/yP/gj8r/0/+0nc21R+NUFEWDQR9B1ZiFINfOZjMUFDX2YT6fHx8fNxoNiLxijPkigg6NWoyxExECiaJSKb2INrbt3XCVNSYYIUj5fL5QKBQKBSTjQyDGdK1Z3qhZYoDlcrnhcHhycnJycoL2erJInMdFwSoZ1PaQR9/v9weDgXbkQ8/AVCqFNQQw75+enh4cHPyn//SfgiD4H/6H/+GDDz74X/6X/+WXv/xlJpPZ2tqqVqupVOr09BSf6MRMa+3Q/reBnF+WpI0K1KGvxRVGTBBCCCGEEEKBmHyzUB1EBTIRgRjk6LwqW0zPq7RijHiqX2iggQoxmUymUqmk0+l0Or25uSkih4eHx8fHxWKxUqlgZe7BwcHJycnu7u7z58/x5Dwej/P5fL1ez2azpWKxtrd3Tu+L4yAIkLwIo1YQBPBY4ZEbvkJNaEVwBOQ/rGe3vewhicIL6fv+wlM8nUwm/cE0n43/+QePDr7Y+LvHN+JYJCVSFKks8ohjkaHIQKQj0hEZirREGiI9kb4E8/nSUquYb02ns3kcD4fDVqs1Ho9xWtSYZuMOoERAPsPDuZqgu92uZmLaqEpEQGhLQAX2z1artb+/f3Z2NplMUqlUVCrFcfxlx78gCIJgMJmk02ms7keqrPV/qU8wjuPl5WW0VJpMJu12+9//+39/9erVP/uzP3v//fc3NjaiKLp///7a2tr169fjOG42m9Vq9fbt2xA4YNCThd9QVTknfleTdpON7x297yvYKp2sBuvf1J+diAB9JYbThe45Z/vOSmrvFY2/rDdZvdWO09maWFVw0WgXSD8YTplMBsM+n8/3+/3Dw0N4uvG/URStrKzgI5AsAQ8jVOPxeNxsNmEuRm1G81IhDGHQIqcV69Z7vR4cxKjNYPds/rLVx7X9o/4epmPVZJPSeafT2d3dnc/niAXI5XIbGxtBEAwGA21VNx6PsauoQGDCWVpagpoJk7KqWtqW80JjeHIH7Kiwfep0iOph2iuiI8dp4+aMBMcvL+c913Zk6u+/mjosr2gUZpsrqrR34Ufo14FzUDoscUfU63VNm5nP59/97ncxJp8/f95sNiuVSrlchviYz+cxA4dh4PueH6Qy6fy33hk9+mL8vBVNmr4EIgORyWJNBq4P7gN/kUFs/y8lkhYvlGxuXizF+Wx6NPIKhels9rJcUSgUYB9GBQs3MqTb4XAIORVXBOkryPOFIXducMtOs9kMlZtFk0Z44bX2gGZ0KysrlUpFG6VqdrnWI7W8qqsZsH14mVFyy+Vy+srRaITlMlEUoW6Hmwg3BSpA6E45m82azeZgMED4OO44Ebl69ery8vJoNHr27Nl//s//eWNjY2lp6Yc//OFsNut0OqVS6Xvf+16n0zk8PNzf30dh1Sm32BqGU1HTO9GW35zZm/8BRgghhBBCCAVi8o0Abi8IH7rwH0qK+m3xIKceMUe2QF4BpEPrPpZFF3voSpPJJJ/Pf//73793714qlTo+Pv7ss8+iKLp79+53vvOdcrn8/Pnzn/3sZz/+8Y+n0yncf3i4hZpw7dq1yWTS63TKvZ7uvO/7mWx2nErBKIWluDBwoQtcv9+HT6pYLIZhCBMlHqFhp4KehfZEuqvwL0M1xi9FZDIZxxnJZCZhM5YjkaJISmS0CMSEQIyIia5IW2Qi0hbpvfQUp8PJt957tL7+rN2ZiXgrKyulUgnqAIRgnGdY80ajEUQ3bTKWyWSKxSI0u8lkAnVYFVX43UqlUrFYbDabSJnAomlYqvf29vTAwzAcjUYnJyeTZrPX73+ZHLowDkNrQFu/TqejAjQMg6qNoidSuVyGbXB7e7vb7bZare3t7T/5kz9ZXV3d2tpCbuzOzk6j0cjlcj/4wQ+63e5HH310//59pBvjtGMUqXCgNQmnWaJjJZZEr7k3FIVtm8Sk1AUhQ1Ubq8PagZdMWUn2stMXJ3fA6cVnWxFiB/B2velUc1QlXUVJEUmlUisrK7VaLZvNlstlpDHgT2dnZ8+ePcOwQV1nbW3tzp079Xodst1oNGq32/1+//Hjx4eHh6enp+12GxISVKQwDCuVCg4WBRvs+d7enqZ19/t9qMn2uuAuw4nSipHneUg91lZmqMqkUin4jlG5wXBFmvDjx4+Pjo5gS0eXs6tXrx4fH8ODPBwO9/f3UXKoVCq437PZLNrx9fv93d3dFy9eqD6OsBqb1KxZOnry5Xwau15Q7VznRIvolYWv03mBDjANCre6mG2EqAUJdbLrPWKFOdtW7rfCaT0qxqTs9GP0nGKG54ULZJF+Y0egLnRAfO3NmzdRY9jY2HjrrbdGo9GvfvWr58+fZzKZ9957b2VlRX2vyAVCKXE6jf0g+OPvn8xKqf/Pg80nD3KzuidZkWWRcPEfLL6JdzeNQGUkMntZsZsNvYNO9Mtflf+P/3K8tDxNpdK5XLZc7qN+hlQHnFXMcohubzQag8EAFa9ut2sd3/l83tbGcOPYOSRG07/xeOb7cRxjTQwWiNj6H2ZXzKUIVIHtV+9utSfrsgP1s0PzjaKoUqnot5WmaWOmRVRRu93GNx2+QfRGRt9IhM/gkOM4rtVquVwOEvB/+A//AZfvu9/9bhiGR0dHp6end+/eXVpaevHixYcffvjkyZN+v28rFvq/KGE6dQiVg3GnYzfsXUYIIYQQQgihQEy+KST7YsWJ5vVyPkdVzi+ItjGp9qlPQ43VkgwP6e3bt6HatFqtzc3Nb3/722+99dZ0On369OmDBw9+9rOfQU8pl8tra2vlcrler9+6dWt9fX08HrdbrcKTJ1a2CIx3T9U9yDSwg+HJGWEIsuj5g+gJ1VzgoUZChfbX0odqCKOpKPJ8L50K12rjcmfSPI4kJwJ1KL24mUYLgbgrMhLpLeImxhLIbGmpmc91J5OM50XoGAYvs12mDWELS+N7vR4kwumim9xCqp6odxjnCpcD2ZpQBHCY6E13enp6enoK17BqDaPRKE6MBEgYsFTrsnpnMMzn88Fg0G63J5NJLpeDzN3tdmFDOzo6evDgQb1eD8OwVCotLS35vt9oNCAnFYvFUql0dHS0vb2tdlEn6dWay6yt+EJZTX/+rWRiJ/BE/aTWKawimvVX2ihYG1wriTxZKxqqEKxZK1ZVtJI3VFSNgXYsrjb6Vk8aLtmVK1fu3LmzvLyMJeeZTAZS0dnZGUz6CFqFhf/999+/e/cuDJ6j0Wh7exuZEs+ePdvb28OYhF6PVFPVmlXuRHkAd5DuLQSsarVaKpU0dRdlGzh8B4OB4xnUdfT4CBQbfN9HE7xut4tppNvtNhoN3KHj8bhUKm1sbFy5cgVlp52dHeRmaK1rPp9D0cvlcigClcvlwWCANonNZhMytxrAcTdpJobNcpGFMVbX0esNq4cgJvpDJ0A7xi7MD5HzCqztFGpV15mJfElmE3+F2d7eSpqCknQxi72hFgVCu5pE34szhqzzpaWle/fu3bhxA97bK1euVCqVX/ziF3t7ey9evNjY2Lh582apVILvGxcLATiLCI44FllfHf9fiqe7z0ov/io7W/UkEqmJxCKZRaxESiQSiUQyIhORvEhpEQffFqnJZOQ9Psj+p/+99k+/21q/MgmCMJvNYpLXhm+YRTFVNpvNZrPZaDQ04eT09BQCN8bnaDQqlUoIKcb8ifE/x0lbnIfpdBr7/mQy6XQ60ExzuVytVltaWoImqy3jtFsjFoXgjkPNzHrtbYYDwLnSioXe77g0UIcRzQQ5GHHD+Xze9/1KpZLL5bCCRE8+tra8vOx53pMnTx4/fowZ4IMPPtjY2MCCHs/zVldXv/e9743H4+fPn6MznibzOC5yJ+lIjEfejt7fsdciIYQQQgghhAIx+ZrRWED1PKrUax1M+rxnJS3tuQSJxxo/1eQoi3TCWq22tbUVhuHOzs7h4eFsNnvnnXdu3LiBpvaHh4c///nPnz9/7nkeoh5LpVI+ny+Xy8vLy5lMZjgcep6HJclfPn/O55B1kOSrT+mqnOrqdRwpPG5qHJ5MJlCNIQ0XCoVsNgtRAPvQ7/cRBBGGYaFYDEKvWom+fa/3rNv9+ZOq1EQmInMjEI8XAnFfZCQyEOmL9EW6Env+bJz1vLQf+OL51lElxqaKbkJwcyOwFTrCdDodDofQaLS3G8Ri7L+earXF4YrMZi/zjqHj9Hq9s7MzmMgKS0vpdNqqVDghWIKNRmd6NaGiIr8S6kOtVsN5m06ny8vLkOOHw+FsNtve3s7n8++++26xWCwWi7B/NpvNo6MjJJOiuZmNyJDz7lrnN459+HdRFnRY2mRMp1OcpgQ4Dc1Uk9WOZ+oxt/tso4r1s6y6p43O9EA0PhiSjTrKNdxDFRlrI9Wl69euXbt27RrWmKM5FeJHG41Gs9lEQ7mNjY1cLlepVBA0jJrBwcHB/fv3X7x4gc5vo9GoWCzC0gjRCm5KiGWOam9TZdC2LpfLXb9+fXV1FaEuMKrDvIxd0p6QUJNxEnCw4/EYW0B9Qvt04Qx3Oh0c9f7+/ueff47OdWtra0EQLC8v9/v9KIoGg0Gn0+l2u8fHx1ADEUCcSqU2NjaQrQyBbDgcohEZdsMeEa4FFGF73XW6s/ERTos5K5A5gRIav5BsYKihHHabcj5G3Knk/S4L83XHtDxjneznVLyLMsF1Izb3HNNOrVa7cePG3bt3Z7PZkydPyuXy7du3R6PRj3/84+3t7eXl5e985ztXrlzBiIIRFZKr3pVBEPh+MJ2nauW4KjNvV2QkckukKVJerNWQhYNYIyY0jDgjkhHJSZyWfivYOUoPhhLHceD7mFR19MKrrnb1RqNxdHSEmHvP89BKrt/vwxGvcnapVELI7+npaavZRJCRCujxoiqg0UaYeOE4xhcNRhE8+MnYa1wRBG3rt5iuIVBNGXul2jFuE2wN+TAoyE0mE7ihMW/n83nty4faJLaJL4VMJrO6uoqFO/v7+3/3d39XrVbff//9SqVy//79Z8+e3bt3b21tbWlpaX9/H8WV5HRqRWFnyOlkq2FWr3oxIYQQQgghhAIx+f2Ap0R9fH1NIKY6m/Sx1rrb5PxiamuAgni0ubl59+7dXq/3/Pnzs7Oz999//4//+I+r1epwOPzJT37y8OHD+/fv7+zswGhcKpVgNEM8MfTKL5fee56YtldBGBZzOc2U0ANJp9OwEMJ4iBfDiqt92yAWwP5WrVZzuVyv19OEAV3Ym8vl8vn8fB5Xq7lvZ2c7z/u7vyi2hv6w7c+bIlmRUMQTGYtMRPqL3MyB+P15bjzOBJNcOKnko3Qm7ftz3w+j6MuIZ/ygsciaIwldOJPJIEG41+tBO9B4SigL0JThPNU/QZKATIBD8H1/MBicnZ2hl1exWCyVy2EYiopNcTyfzdLpdLlczufzcFxC6dA8WfhSp9NpOp1eXV3FvsFKHARBo9E4Pj7udrv379+fzWZXrlyB0L+0tFSpVCBBwiKNbFzN1rC6lTPMrMDqCHDO/76hOmxrGDoYsOhbJQxVY9UZqkqHDZmVRQ9ACPHQTSCcaSsnpwCgkpyKhrbznga52MZuGnmhVnc1jGPHcrnc2tpatVpVEyIKG2hIOB6Pr1279sEHH9y7dw+O8larhXuw1+s9fPjw888/bzabGEhwGqq8qyZ3ddeq0ImIau2diPeurKy89dZbGBhhGPb7/Xw+32q14NhVNzEMy4PBQBYG+dFohGIDbgEszNdIB0hjEOlOT08fPXq0sbHxrW99C6ETURS99957CFfZ3t7e399vtVp6wrPZ7MrKCkJaED6Tz+dxj2upQycWm+BhdXlouOr0t53ltJCAa6ramZq7bQqzNVzjvOHodN09jtQZbNa3K79bcutrArudpGzf88S+DGfmfKy21bjT6fTy8vLGxkapVDo5OUHUyWw2Ozk5QVPBUqmEaOzRaGTrDXp+4Kv1fS8IU7GXKZfiKxv90yDV7kaznicDEz0MaThe9KwTEU/EMz/44qfjbGHuh6rse2H4Uv3XtqU6deiotpIlolf0doO0iikLdQgchT1j3qJ6ZwfGaDTCQhbcs5httDCGW1ijJ2wzTAwJ3RTGhh1Imqdvaxj6xaGTG7bsXHetKUITV9EZt/ZwOHz27Fm5XC6Xy1euXNnZ2dHvGqc9ZjLV2imrOP+0//3A//oihBBCCCGEAjH5BqEP+Y6LzVlKrP9Uo7GGHgBVT1TkUgUhCAKstC0UCk+ePNnf36/X67dv397a2kL/9L/4i784Ozsbj8eFQmFpaQlpqrlcDu3p8GT+MqjxfIMg7BI0TbSiQrAj9gR5xCo2QfGBPIHfp1KpXq+HA4eD2DYFQrgENDV4ryaTyTRObdRz/+c/nS6Xm//fnxY+fZgenHlSEQlFfJGJyGQRKzEVaUjGn3zrWy/u3t6RuXf75jCVikRmUHz0wd6u+MbiZWQiQxeG/g6dAjovTgjsb9CqtAWfarg4LdqYC7IIlu0j56FYLKbR7GihqwRhWFta8tNpbAoGNEhpUAzR4Gg4HCKCE3Ib9ge+10KhMJ/P9/b2ms3m559/ns1m0YdqeXn5zp07o9Fof38fJrV6vR4Ewe7uLlRI1WjkopTepATs/NMxe/7G0W7DfG2OqhO3otKMI3MkZTVNjXCa7FkpWRK9xZzEACeb4sIPsuuy9U5EAikWwuPSDxfg9CKNd2NjAwpdq9XCInokM5ycnHQ6HcSwWEnaRnDoUVhXo41pRp5JcQEEYt/38/k8Wixqz0P0XbSJClpMQos8bVuHA0QOBpybUMSQvqIRMfCkY6Cenp6iENLr9fTtGCGYDVD5QENLlX21x6NNEUle92QTReeS6aByPOmacex0vbNj5lXZEUk19nexDzumb0fa052Joig8P1Jf/v9EtIue5Gq1eu3atfX1dWiO77zzTi6XOzk5+fzzz/P5/Orq6u3bt6Mo6na7OA9ahkFhQFMU5vNYJMhksn/2Z521tfYvHpf/f3vLB3vpWcqTgkhepCCSEymI+ItVGsNFF7u5yHyhI3ue73tRFMbzwXA4FAnS6ZQmimA1BtajDAYD7fCJbxnNPEmlUrVaDRkRaJCIYomeRrECse9P4hiLVLRKhDz94+PjwWCAQB672kDHABrNIVkFxRKIyNB/1Zgsi6UGmNJTqZQsQpxns9nR0VGv18NgRvkNqTLqX8aNUCwWl5eXUYM8OzvD9vFll8vl8KfpdPrzn//8yZMn//pf/2tkECP+PpvNbm5uptNpLENx1nw4Cdq6zCJpihezAIL/DUYIIYQQQggFYvIN0ojt86oNXVXNV7UPu7LYygq267oaY+M4zmaz0GUgYM3nczxkQj744osv/uZv/ubZs2eIDV1eXl5dXa1UKkghwKpzRCvqXiW1QihK+lSvDZTsrkIMctI2VcjWTAl99taE3HQ6DSl5OBzO5/PpNCiXw6ubs62r3cOD8OhZcNAKx2PvZQ+licj0ZdCEF0t6Ml+u9r9158Uf/+iLySQsliphmJrPPe2LpXKSRs1CJlNTLXbGdiRTayoe7KEOO4KjOmERqaxtjnAI+Xy+VCqlUqlUFAUqWXqe7/ulUmkURWpA02QJqCdYG44t5HI5DRaAAQ2Ob7hW+/3+6enpL3/5yzt37qyurq6url69evXs7Azyx2AwWFtbS6fTUCo1asA6FO2AtMY05+pfaFt7DTDBOSkNehV09KoQkxSpnZRhdSLj9bKI3naa7Fnrn5zvlafD2KYbW2UQnwLVRgVrmOuLxWIqlapUKplMBso7rtHp6elwOEQhpF6v37t3b2NjA47j4XC4s7Pz+eefHx0dwXG8vLxcq9Vk0UsKg1/t9tq2SxZWazjWq9Xq8vKyJiZDeNrY2EBpB6MChwNha2VlJZPJQF+D3zydTmOtvX6iDmDtWQeJTSPCRQTRyfv7+x999FG3211fX69Wq2i9CON8Pp8fDofNZhOnfTweQyPDQgG074NMeXZ2Bnezds9LDhgdBo7z0SZBy6vD2e3bdUWF9QXrkLAx01bPtYK1LFb0/y4eTGedR7LooqHXzglB6pC99TDJj8fjdDpdq9XG4/HOzs76+nq5XB6Px7u7u48ePTo7O3vvvffW1tZKpRK87fl8Hh5VRB+gMpdKpRZTWTyZTEej0db16OYNeXe7Hf/vwX88WDqdpGRFpCRSFimITEQikanIcCEQT0Vmqg6L+OL5nud7k+l0OBwFQQqjSL26qBEiRAUzAIqCGI3pdHp9fb1SqdTrdUz++qU2n8+LxWK306k8ffrl3Dufw1k8m07xMmx2MBjg5+FwiNAkrGjRagdkaDSUg+Fdrfq4p3Anjsdj5BqjdAefb6FQWF1dRXF0MBicnJygASM8+AgLwkQNszOuez6fv3LlCkzQw+EQGjH2wfM81X8/+eST+/fvT6fTt99+e3V1Fckzb7311jvvvPP06dOf//zn+/v72rFQ/dfOEhDt/Wg1Yvvly//6IoQQQgghhAIx+aaQTF/VgAhnHa6j2dlsXxU3bRBnJpMplUpXr16tVCpw7bXb7Q8++KBUKpXL5e3t7Z/85CcvXrx4/vx5EASlUqlWq62vryNxGO5UrGHXVd6+74vR1PQ5U+IYy8/ht8KacaQfQJIeDoedTgcCDX6v+wmloFarQXiCvdE+0GqDeDy9Z7PZMAxT6WBlJf6Xf9KplMY//uvyk93US6UI/rVY5vM4m5m++97p3Vs7164dR+EsisJ0yg+jCKt+tWMe+ghBUIPnF8oLXoOTDOEP/e7x2F8qlXCBBoOBvh1CAOQDaF7I3NBYZxw4PvqlMHpe0MILcMjT6bRQKEBTRpgmTHDwiupzPn7AriJ3Am85Pj5ut9sfffTRcDj84IMPbty4cevWLegX/X5/dXW1Xq93Op1Wq4XeUNZ6ZsUv2z7OBjvYTk1fTSmzPcTUx2ejIWwehcq1yRX6GC1WRH5NXGyyf52Y2GKrejtqI7ILIA0XCoVKpbK8vFwul+HbjeMYoQ1I+w3DcGVlJQzDQqGwvr6+ubnZ6/Xu37+P8fbpp58+ffr07OwMt0OlUoEBHBIzolf1tCPPWqsUuNBQWldWViAb4RBQ4CkUCqoKYXDC0oi7Xg2YEKowVtHLDkZOXAuIayjSoKEiik9qtDw8PPzoo48ODg42NjbgWtWOlLdu3VpdXT05OcGNj356BwcHvV6vUqmoqg5D/Ww2azabEN3gypfzqSYXSqhaObOznxM8YisEGm2s8q7t/GkFYmeoaE9CnXt/R8elXSbiSMx2nOPzfN8/l72dsIvqRrLZbKVSgTn96tWrmUxmf3//2bNnp6en6XR6ZWWlUqmk02mopRg/uDT2vtMqXa/Xm05n85mUyuHm2nSjPEk/jl82qfNFIhFfJC0Si8wW3mGVhlUg9iSWeBFiMxUJMBQhyGKKk0WGO44CwwyDHBXNer2utRPY5PHiTCaTiiIEH8niY+P5HB+nNyxygVB0ge6MIe3McvhG0xRyW7LCjYn91DID1tPgy6hYLEIC1u1rAUn71+kiEi1KZTKZwWDgL6KZ8blaEC0UCpPJpFAoNBqNp0+fYtjk8/larQZ79XQ6ff78+cnJCd7lrGywYrFc1IzOEYsJIYQQQgghFIjJNwVr6lHtA9qNFTuS4ppdTw0pUwURLM69du3a22+/nclk9vb24Gf87ne/u7GxcXJy8pd/+Zf/8T/+RyyJhYKwvr5+7dq1SqWi9jp9MNaH2MD3bZO6l69cxJhCINO+QOpdQh8eNGqDNqS7iqfler0OgXg4HKKVFrr3QBRAkEKpVIKly/OCfj+I5/H77/duXO/PJKx87M088dISz2KZSzyLx91xNjP4l3/y/K23nne73U4vnc3mYvlyITMyAbADsOBZO7CadnFFEB2guclQb2FAg+VND0c94DhL0Puw0h9ygyqtX7YfNCrkYDgM5vMwDDOZTBzHg8Gg2+1Ceut0Op7nVSqVQqHwMvp50VFN8zF9319aWlK9r9frffbZZ8+fPx8OhxsbG1tbWzjzh4eHsBufnp7u7u62Wi1nEb3tgKTWURW2bEyE2lTfXBTWkeOEAyTTM+3H4SN0pbYVzeyna6tA5zUqnTgbT5ZqrDJo05lVsM7n85ubm+vr66VSCdbLMAzb7Xaj0cDQ9X1/dXX1+vXrhUIBIy2O44cPH+7v70Ns3dnZQcHGhiCrMo7F5gimKJfL9XpdjcAowGBYQmXL5/MIZkH5pFAooCwBYRd3N+4gG2ITRVEZ+dcLZQrpJZpW3G63tbqjS+x1rQD+dHJyEsdxo9F4/vw5lOVMJnP16tWrV69GUXR6ejqfz8/OznZ3d9G2C5bq+XxeKBRQFlpbWwvD8PDwsNfrQR1GIodVQuV8LIO6vHWi0zCBpP5lG9Odi/ddBJLYweZswVbsNMk6WWP4ylO9JDqO2k9MVhFFJJ7P40S1AwERq6urKysr2MLS0tJ8Pj86Omq1WigMYAazSfe60AG+eIw3lOsga47H4+k07vWn46mkfD81Ea8ncVckEsmIRCJjEV9kZozD8UId1r2TeD6fzWe4CjO1outaE1l41TX/F7MrKhwoSGCiQzp2vEiQCMPQxzeUtV0HAWp6YRjqUIdfWD9Ol3HYeUPrdrocwWluqUoxRgL21t5W+t2h38U2SARfx5DCoVxjnGMCR4ZSKpVSiRlfGfV6HRuZzWbtdnsymaysrJyenjabzSAIVldXt7e3ofi/KqLHetKT86GtfBBCCCGEEEIoEJNvhDqsuaKqGvi+j1QHFWpVSLJijW4BT9Gy6L2eTqc3Njb+yT/5J9euXQuCABLh7du3f/CDH4Rh+Pnnn3/22Weffvppu932fb9Wq2GdLFyl2twJOaTwrsJ4FQRBIZ9Pp9OqUsQifhBkc7kgDJEmbHuI4XG6VCrB3QZvFx7RgwXomYY+eLA34ljUbDWfz+E9XF1dRdYE1HPf98NgUqvF/4//e/vP//XI833xvNls6nmexPHZaaPbaYTRyWzW8/0J9guL2TV8A9m+IoKQVpWldNWzNkDD+msodMjNhPgLdRgSGySYUqmkBmFsBx8EIL6o4hYvEjZ0KAz6fb/fHw6HiH4WEUiKKqzAmIZrDcO17qrm4RYKBWRQiEiz2dzf369UKj/84Q9v3Ljxve99L5vN/vjHPz44OFhdXd3c3Lx161az2dTuTzrSkkET+Ku67VRZ0BSO3zjUcT5tbyg1uzmKc/IeUX9fUly277X2dud+gRCm2g1SEaxEolZoPXacW9jDNYKjVCrduHFja2tLR+lwOIQRGx0aV1ZW3n777R/96Eflcrndbh8cHDx48OBv//Zv79+/PxgMPM9bXl6uVqvFYhH3Qq/XQ2KvrmRHgClCJLa2tlASGAwGcIVrEEqn0ykUChCIAfz7GHiDwUAjZXzfh1scEi0mnEKhgGX+kOFOT08fP36MEBKEiWtFJ5/Pw+9pO2Vhtf7JyQkWwvu+v7W1devWrbt3725sbGDk7+3t/exnP/vFL34BgRjm6JWVFaQhIxU9CIKDgwPP85rNpr3K2p9QjfwQB2WR/CBmQb3TsU0Tw20Gq1a5bCyPE/6rt5Lt0Kha86v6y/1Ws73dWz0QJwgFk5jYeyqOp7PZdBHWrMWbSqVy8+bNO3fubG5uzmazKIo2NjY++eSTx48f93q9lZUV6MWj0QjXS62suuJEA3MwPRaLxUXw9HA4mgRe8O6N+Obn88Pn8aDvyabIWGQoEosUROKXeT4vu4NqEvHCR4xmeyLefB7rd5MusBCRTCaTy+Wgt2Jyg8EcF1Hdvig3YtqHiDweDtVh7Ym83EImEwYBiouYITF0NdYGhUzcLAjpxsmESD0YDNrttrXfokwLhRdh3LPZLJ/Po1SZy+WwWc3sloXRHt+YGE4oRuLGRAUISUG6QGeyAN9HIpLL5d57773JZPLZZ5+NRqODg4Pl5eXvfOc7R0dHz549W15efvfdd4+Pjx88eOCsMXKyquzaCFsVcxLbCSGEEEIIIRSIye8fVQScHvWwzapopXKGqhjaRV1TEVSc9Tzv+vXrP/zhD0Xk5z//eafTeeutt77//e/fuHHjf/1f/9ef/vSnUJoQGLq6urq0tFStVmu1Wj6f7/V63W4Xz7RWiUCvOdvOCPhQKmczrGfHc75GRkIzLZVK3W4Xfa6gs2j3tnw+v7S0hMwEWMzgfMTzM34PkU7l0W63OxwOUqnUeDz1falWB5n0LJWKJJbxZBJGoSfSWp212/7Rsb+/Nx30h2EYad+8Uqmkug+8upBuU6nUfD5vNptowIVHfe2ehMd4SG+Qw2Th4FMVEr8pl8siAi0MCriu34fQoOp5ZPSmeNGBajQYaJqBXdeM8wnFpFarISsTFwuuUpxbVcDhTYPye3Z29uDBg29/+9tra2tra2u1Wu3zzz+fz+ebm5vvvPNOq9Xa3d1FwqbaZjX/QWVQ6+RVhdcO4DcZ6k5ErJz3UTpqnZWAX+X2tRqfGIemky+RlEJsuoXeNfb3VixWHQc/a2AIlLV+vw/lF7dMrVZbXl5GIWE6nTabTfSjU6OiCjeawY3LDQlb/eaVSgWZDLjWsOgiOlb91LoFHYGYE4BGAzsZGnix/kmtwfl8HqIYwmpxadS8rCcHo3E4HIZh2Ov11PLf6XROT09HoxEyaqBir62tLS8vdzod5L32ej3cxWjhhZ/Rvy6bzaoF20madjTWpDos5825eph2XNkuXnbMqOUzaYR3AkkkYfv9rb/yw9BmAdmLYuO/X87z5z9Ax6cWaQqFwttvv/3DH/6wXC53Op16vV4sFh89evTxxx8jaxhq72g0skUOOGRhy11aWqrVaojGRg4vAoJ838/l8uJJPBu+d7dz96P8r/8mPZh4MhUZiHRFJiJlERGZikwX6nBfpL/oETr2gjjM5/O53GA4nHj+y9BhaP3D4RBfKJBlcWagFGv3PDtu0Sy0XC6jzjccDmfzOYqCspg5Pc9LRZHevxrYDdUV9wI+FN8m9grCDowaBk6Fuqpx6vDdBJ8+1gTA+6x7q6sBtDKKCaFSqaRSKfR1xFek3pv4RsMrcePncjl0qtSKb7FYPD09PTw8HI/H6DS7uroK0fl73/teEATb29tnZ2f4XpCLFkzgaibXTLz5vE0IIYQQQgihQEz+8TRiRyNT26k+6dk+abb71oUiGlJ9c7nc6enp6enp0tLSO++8s76+3ul0Pv300y+++ALP52ihgxZ2pVIJTkNrrMNTsW3xZPdK0ItoEdqIp2KVFx2Llu4/hG9ZZE3ikVhbwyH5VFfj4jUQcLUvHJTl8RgL7qfzuSfiiwTieZNpLC/PZRiGmcBPxXEQx8jumMNhB3OuRjfaGF885ONTbG9AlTIhwkLmg0To+z58mrJwPuIAIdxD7wiCQBVnnFWBZ+0i5UvPpJqprcaH0wtlH2o17Mz4LBW/4JiDbAeZeG9v7/j4eHl5OZ1Ol0ol6CBra2tLS0vXrl2D4RTakJxv1eUEQdglzK/K+X0VOrSc5dvOAE4qs6+S/Kyv0+p3zv7YrFXnNTqqMcJVZMFF17wRFWFV4VV/7mg0ajQag8EAjkIN4Z1OpycnJ0+ePPn1r3/94sULEYGyg40gR0LHklo44ziuVCqw1pZKJfTpgmgLJ68eBUJXkGKBQaLi4yL4dYYbRwPENZ5VjwgvVldprVarVquTySSTyUDM1ckHwrTqxcjFbjabSF/BQv6zs7Nf//rXN2/e3NzchM6Vz+dv3rz5/2fvz35lvc4zT3B9X8zztMczH86iJJO000q77CxTmU50JQqZSd1VFdAQCRS6bhqwBNRtg2Jf9GXR6n9ANNDIq2yYqspMI+0qi7Izbaflko4oifMhz3zOnmPHvGP6+uK34znvXl/EPoPoSqo6FgThMHbEN6x5Pe/zPk+r1ep0Ojs7O0EQYLiXSCQgtAJTFotFpMnH43G329WzKZSioRF3HbRUdA9jZeh5uiIevuyF6GRQZp0Sbbwkjh0/aizQzXwUPTF3Tyhg7m/Dk2L0+Xz+zJkz8LXhCzvnPvroo1u3bok86+HRdAP6BtG7er0ueVzERgikweQdDMbpcSsXHKX706ATun0XZZwLnMs5FzoXzCQmxjPDOlGJh86Nw0wqA4oahAlmHsjsJJGA2Np4idXfF9+fl2XqDoKg1WohE2HRTZtFQX9WfgAJIszYmku5u9Q2QI1Zj7DOU9OrJ0jVx80ydQRkWztZRW2JPgJqEyCBgExDSA3ZLppUexAEnU4HLX4yTtDp/vGPf/z7v//7zz77LIreON01m83d3V1Cs+qZkkaBdG+Tk+Jy88uyLMuyLMuyLMuyLMuyLMuyBIiX5QtR4iibBUGE4Ajv0Hf4kFOum7FZoTVdvnw5n8/v7Ox0Op2NjY0vf/nLFy5caDabV65cuXXrFqKHKD9ks1mgKJAmKKjkngN9ctqE9JRMJouFQmAAO1KSg2RyMp1mMhlxbK3Jm8Bf3hGoF+wSjmQ+n+d0DcjFK+gWUAtBoBDTDIIgnT6+V6fTOTo6Go3GmcwQKCGXCxOJZBimM5kwm81ls5nJZAzgJdlHyxuFtgka6yGYnN5RhEylUtaJHg5XMpkU2xfAHUVjDudCUYXf6Y7Hp3fEi01PEHADfZiUaunYqlbBg3hywBFB6lRjsVhEwYDHHg6HV69evXLlCoTNlZWVlZWVTqfT6XTAmEaj0b1791CetZis5Q4v4vY6o3/ykDCZDYpY/EL1YL3v4uRNz7lOEJ6Qmrg+BhodUhfxHiPOXObikjwGbwJeX1lZIWG82WziHNhsNkul0vnz5zc2NgqFwpkzZ4rFYq/X29/fv3r16s9+9rPDw0OMDRlKYt1yX3oy3Q9QGClwTCZTqRR8Rmi5sMV5KjoDcQvl7Ot9CYcoD4DeIiayLMLoQmBkXERKDpCIIaojmkwXRfZEue1ERACRP/roox/96EcbGxtPPvkkSscXLlxA1DiTybTb7d3d3f39/SAIGo1GaVZoHdRyUWr2QHwhmDYwoBCU2lRp/vHARhzYtQCZpGOdUS62PxQM/cv41Nlo09yZ/8SIA8KbfdWBac4CAESYNjY28vl8s9nkJ7du3RoMBjdv3iwWi1QvUjPQZkUbl2YCEgf2MZjuCDmQfDAZu+k0e/Hc9B/+w+5PP83eHKSPDgKXcK7sXNq5YKYpMXVudFJrYuSi0fTo6Gg0HoWJMJXK0E+soyDNyszZ7/e5L/R8sYDpqL1ej9aRCygrwn0N4iBIp9PZYpFJG8I76wUAMVpGsImZ8C3XWItUNput1WqZTIZIBguiDUgwh+AKKANJeghBDl6K0VoqlbLZrCwf5ZIn6QzBxGSWCCvXr6rV6vnz51k0Dw8PnXNra2tRFH366ae9Xo9UEutG4Iy+RDz2HHdiXJZlWZZlWZZlWZZlWZZlWZYlQLwsX5Rij+hCymwCvrAei6lZ1FjiDIVCYWVl5ezZs88++2wqldre3q7X6//oH/2jCxcuTKfTn/3sZ//m3/ybzz77DI3ay5cvX758mdNvPp8nHX4wGCDsgGQBoKRIu0dHR/3BYDqjVjnnUun0SqPRy+enUZTJZMBGreinWLSc1WfwbhpEtdFoNBoNgGlh39VqVQZZQRCgUCwJCEFa/AMbt8PDQ3KEwZoLhQIJ/oNBH/FKju6yQuJALpFZYaxQrsRL5cG2t7f7/X4+nx+NRoVCoVarAQpzRx3pgQPCMOx0OjwbzEf+AS6MACWPEYbh0Yyxe4wCORcEQTKVQsrj4OCAG4GGUEX1er1UKvV6ve3tbZQ6SbimscA+oigqlUrr6+thGO7t7UVR1Ov10JS4ffv2Sy+9dOnSpX/yT/7Jxx9/vL29jUj0+vp6sVjEWMyDxqyLWhwFFuX8IXu7MFw1tzLfLfrmcUjdSatGCxBDv5WRlAwD3TzxirjDXhxGEXhn2anQdZ9//vlyuVwqlVKpVKvV2tvba7fb8ArPnj37xBNPIJMdBMHdu3d7vd7e3t61a9e2trbAgGisdrvd6XSEZsooDALvuXPnLl++jEov8QDFGNLpNFEccRhhMWukSF6ZKqWPKfhBKEVIFl3Xylwo6kB/q1QqYHPw37vdLjcCE+90OgCIIkRTY4PB4IMPPsjn87du3SoWi1/+8pdrtVqtVvu1X/u1tbW169evw1VHl4P4BDEqGK/tdhsRZDG+rY+fJT67GCPSI7Z7PNy54Q31Xo8uuija4Zl9PR5GPFcpe24vPXEL4kyJhKblarX69NNPZzKZra2tSqUShuGVK1euX79eLBafe+65c+fOEUiAxyrGKP0TdBjR6sPDQ0ivwJfD4ZBuhnBBLpetVGr/9J9Ev/aV5g//U+7/+2fV926lJuMgyjg3dS7h3HQ2eY2c6x+rTIRHrpIfn9vsjoatQX+QSCTz+RxiFyLwIjRBm1arVUW/LBdeAhEHBwcQhwmW5HK5dCqVzWZDM8AzmUy50UB7nYgLho2dTqdUKpXLZUnJ03UtlZ5uOZlMkO+fTCboxiB/wTyTz+fBkRGaKBQKuKpyqXQ6XavVcrkc/2k7NnxnQh3oeKBEhLklNH86IbMZwRJyRPr9/traWq/X++yzz+7evXvt2rVyubyyslIqlT766KNEIkHkyVOB90TbvQlt7gBZlmVZlmVZlmVZlmVZlmVZliVAvCxfiGLNkTjLgSe6mZKgM0ITYgtaLQjnXD6fP3fu3DPPPLO5ubmzs5PNZp977rmvfvWr165d+7u/+7v/+B//4wcffIA6QaVSOXfu3KVLl0iWhyHonAOE4pQr9Ec+7M65o8EActZxD04kiqXSNJPBog2rH87MeiMxghExQJaXz+WbBImM82qlUgHMwowIzUeoZACLyLmClEFLlOQxNGcO52DKIhVKbhgFCVA2AGKOzUAPOskLXuQ8T/o/1dVut2VMBHTIvdLp9Hg8xo9LrQaFDegZgKNcLvMuXW4nqqNzcqKTFRWgnsQrVlZWstns9evXd3d3SczH5UzwGU+eyWTW1tagDwOxbW9v//SnPyUZ+amnnvov/ov/olqt/vmf//n29jYcVZ6q3+97Wc/uZP6+JRt6gicPCZB5dGN9og4vVFRYsOAtdcv4z/mr9zCgtySPC4oVAM1buBmLmWfQWOPfoGkbGxtf/epXn3/++UKhMBgMDg4O9vf3Ue3IZDLPPvvs008/Xa/Xp9MpYqOffvrp9evXm83mzs7O4eEh2tbSkaAHgt9BDQYP2tzcfOKJJy5cuCCkGwq5ktNJyQf5YtTzORAtg8JS+Lkvo6nVajnnZDengJMM7vhEBGEJAYdhiGREv98niNLr9Q4ODg4PD5ELPzw8xFUP+v/h4eHf/d3f/af/9J+KxeI//af/9B/8g38AofjcuXMrKyvc4vDwkGeGnk9VS5uVd4/nxVsddushZkF/60pnr8CXeUirLiI0zYNu7dUYEZZNnPDsJR8lHKgx5WlfyFjvOHEkhlMrEpPJZKrVaqPRkCTCdDrd2trqdDrVavW55567dOkSQLCNf9D/gTKFwIL1K6wC4Dgej5FEmEwmR0f5RCJZrWRXGuHZs/3zZ6J//b8Uru6nb95J9lqhQ24CrYmpcwPnDpzbd6lW9Pw/OPq//ret9Y3J0VFqGk3l9gaSi4wDcxdg98rKiuJtytJQfLRQKNBGkk3gFVQ1TN2IWbMuMJxJrSAHZTgcHh4eElZhKGUyGbofQ8zNePQwjt2MsKw1ZTKZEP+jYnkpVr1kMok8i/JFEjPxJa6sT/gr7OPRaARVmbvQLTHuczNFeLpHpVKZTqfvvPPOX/zFX/zX//V//dJLL925c+eDDz7Y3NxMJBIffvjh/v6+O+m1SH0q6ullXdjQy7Isy7Isy7Isy7Isy7Isy7IsAeJl+UIU0dakGGhNpaz5jGiVILZiCXHgPHv27MWLF0k6LpfLL7zwwlNPPTUcDn/0ox/95V/+5WeffZbJZJ588smNjQ0O0hC4AHxBrEi2BQGBqiaepm49MQxi8qCdkXQEkeT8DDbHh5zSC4WCpFdBVJVl3+12yVIPggD+bxiGjUajUqlAsALIgOPG61PITAd+VVIwp3cO/ErA562VvUuGNUd0eFs8OXD2aDQCfavVajwM6NJoNOp0OoAsHMJRluA/B4MBODi4hvWX83QSxOayPUE6s2T0WzsysHsaXfK4R0dHgt2hBOpNaalGowEN7RiS7nZv375948YNrOrW19dbrRaWgKurq3fu3IEfJ8jVI7M7o8wgB6RHSrr3uMY2zqHKWaTB6gVFLCxo4TM9qkYQtQcv1epU6F4eL9XDnROJBIzsWq1GxQLdQgYk8IDkLsrOnU5nf3//1q1bcB6tkZ0FGUFFwYPIfweEorOBZroZtx1GJOCyFbaWBLPQZKGrqVSKh+x2u0CxPOp9D7STbSEmo9pXcsNiRwJ1FQoF4GNiJ+12WxA/F+/1evfu3SsUCrdu3bp8+XKj0SgWi7JEKxaLjCzpfdOlAabFtvYUHmx/s6/gucbpE2kCyNJzOisCH/Vvt4A17PV/r/M8XiDQ66VzLe+QmAiC4FhCIQgiRELCcDqdFovFzc3NSqXSbDZJKbhz5869e/dWVlYuXbp09uzZRCIB8k6D4qDIfQXC8jpMm6pb4GbQYXcsyz7pdDtRNCkUspl04nd+s7uxMvlfflD4/l8Uer3QlYlrOQeuPnCu51zXJcauVgzPn8/W61G7Pep0BuPxJJE47s8ECIMg6Pf7vV4P4d1isUi/pR7oHsQMqHa8T5VqQ6jyuNKCIJVKJROJ4WjEzIlOheQaAJ01LhQaYYpQv2VZIXao3yK0IrBYajDM34o/EZYDdGYFAXdmkGqeEahNKgnzAHLDrCOI8jMo9P0wDIkeXb169datW5999tlv//Zvv/TSS+12e2VlJZFI3Lx58+DgwPZqfquMDY0Ct2QQL8uyLMuyLMuyLMuyLMuyLAHiZfnCFguQ6UQnaFhUqTgaInxhPB4/8cQTv/7rv37p0qXd3V2UBJ566qlsNvuTn/zkz/7szz766KMoitbX17/yla+srq5yxAUgBlvkUA2Oxmmc3F4AX86rHNcBXo+fYTodjUbRdKqjrDVVA5VAXBIp4SiKdnd3j46OOFQDt7mZWCSgqhSQUzOxBciSg8EA4EDsS+BXCFkAc+Jacv5Hi1OUSajTMCtBUZPJJDAfUDLvy8+Rg5hMJvV6Hf7aeDyGccZNheWBzPKQ6NLyZVFQheIJoUMdOGU0NPkm+cI8obXOSyaTuVwOgBIKWxRFAH9AurQXuCEVQqr4mTNn4KOFYbi/v394ePjxxx+/++67X/7yl+v1+tmzZ+/duzccDkulUi6Xu337NmoVItJacNYCdh7Q4B464174mpKdbU9WLCT+E8HHlihtMReLWdvvq5/YMWWp0HGLSLqZtFYAm5B0QKuh1+vVarVisYjZ49mzZ4fD4b1795rNJo2ytbXV6/XAkjxcUsR5YZfFYhEyOBnx3W5XfonCoRTCsbZdoojaGJLowAoYSCMb0j1gFuRHd1K3QSOXyA33RYWAiNFkMqFOsAsbj8eKWDDuGKd0uUwm02q1PvvsM64GRX19ff3ixYuFQoGwxPFASKW4ablcPnPmDA/c6XQODg74jkVybQjBqk94PofW1856TlrXO9WkRwf2KOo2lmCB48eb6mWP6flAxkHnuOwJ38zlchsbG7VajYDEzs7O9evXDw8PG43G+vp6tVoVkCqUUKuMTQrhsgTGlDkBLR3d3tkjBcPRJOiN02lXqYTPPTP52x9PU13nxjMZ4uQMID5yQcvlEtG5C+OnnpjkMqlUKkwmgzAc8fhS0FZfFZ1ZwS2FDfQ8tgkkDTGcReDcLPciTCT6/f5oOMRxDgkIN5O14R+MMgUprYI5d1cwT1kFEgG3bNzpbMmzMwxDj7srvMqo0fwj8WWWCYveqjk8y0Tmc+ccQZrhcLizszMcDp955pmDg4PRaNRsNlkyFBWzvo42IhLvS8uyLMuyLMuyLMuyLMuyLMuyBIiX5QtUhFLphGwTpa3OpoXqhHEg2gDssre3t7u7u7KycubMmV6v98EHH/zJn/zJBx98MJlM1tfXn3vuuc3NTUESSrMl25cHkFIwoBVwmFQjBdZQhqPR/v6+W1vjOWUxxH+CGYFVlUqlRCKB5CI4KbnAwkoAPVOpVLFYFL8YXUhMlngAZdbjZOVmVlpI8Trnut1us9kEbEIuFqIZDC9wLh6SAz/YMURgGd+JwgnKXK/X3cwoCeQL9yewNnnESQ7YwlJuJnQgSVmZ3Q3HY8sghqnKQzpDYZMQc71eT6VS6N5K5hhYX4i5MHqoqSCS0DwPDg7a7fYnn3zyi1/8AoOjzc3NWq22vb09mUwqlcrm5ma73W42mxJyFejv0Z+Vdy+BjocpnpKs5YRaVE693YPqPCwPoM3N1BLi9HZhggBeHqwjJr4gVyvqPZlMZA/V6/Wcc3t7e0BOrVZrPB4///zzFy5cKBQK8LKvXbt29epVpIcHg0G73WakCCMWn7FYLJ47dw7au9XxoD673e7BwQG9XYOU/wfkpSPx/PRhwbiWNitkUEiTUgTo9sPhUH1SjHvgLeccaDLBGEIRUjpuNBoEWiqVSiKR6Ha7KJgreR/5iEKhkE6nt7a22u323bt3Dw4OLl68WC6Xn3zySaiv29vbn3zyyc7OThiGcCczmQwSzKVSKYqiTz755OOPP6arK8TiyU14U6gz1GCrR+FOMt+JqdiuZZE+L1dDvdS71MPrbnsd2BI8FflzRhPZC8PopjQo/ef8+fOrq6v9fn97e/vTTz+9e/fu2tparVZDO97NmMLiCzvnpFQuQQP6QxAErVYLSJFcCqm4HM9jQTCdTLrdztFRIgxyzqUrhaien97Zika7gUu64/9NXdh31en0H/7D4cv/aPAPf3Oczwf9fjQejxOJMJ3OKkXDzXS9CY3wpvDrSTeRxVyn0xFALGyd60wMF1sLZb/XY70gNYToBWEMBc8kw6KwCnoUjAvuIpUbO+FQ/1xTcDbPyTMzzK0KtroWHYk4H/8W1qx5TCs+9W//xFsXCoX19XVUa372s5+dPXv2mWeeuXbtGnEX1JaVeuJmIioKDHi5F6q05QZsWZZlWZZlWZZlWZZlWZZlCRAvyxcFHZZvj3zYhCpaky7p0nqlUCig77m1tXX79u1CofDyyy+fO3fu6tWrf/qnf/rDH/5wNBo1Go0LFy48+eSToDZCcIA7YUhxSAZPBBbM5/OQ0cRI8s6To9FoZ2cnf/58oVi0kEQYhjBzQTQoHLxhs/KJlCvASsCqrAIpTwUgi8QwKAYPzIkdSE5w2HA4PDg4gJVWLBaRPUWhggdWLjBAM6Q2DN8AztBTtjoYIINUS7lcBhqzEpPkCFtNANUVhFzBMcKD8GiaRpEzEECxWJwYxArULJlMViqVlZUVUEV6BYAg1ZhKpUDJLT+RCkSOA8AI7O/g4OD27dtkna+vr6+urr7//vvNZrNQKKytrd25cwcQ3wIcNNMiIy/RMx8SILN8ScVCVANxXMzFSMFxXMNztLMIiLUitKgcTcCgkw2jvN3wezx37lwikbh169bBwUEulwOIT6VS58+ff+mll1ZXV2EIHhwc/If/8B+uXLmyv78PqgVrHvSNPk8d0pTowIBSMUwk8wKOI61kocOSA9brC932UHK0LLhsv99vtVrUTLvdJiqD6kswk4WREitaJWT94wMGTVhRjV6vJyiTn/AAvEg+n0dbo9frHR4e6gUnk8nNmzc/+uijs2fPvvjii1/72teeeeYZ51yz2XTO3blzZ2trq16vJ5PJUqm0urq6traGTSUUflk72taXzyH1I7lzIbBWXNWyRCVVIZ6mF5+wctsahlateL6D3CPGAjVOrda2RodwbQmUB84di+okEpubm88991y1Wi0Wi0899dSf/MmfvPfee6lU6nd+53eeeeYZBCIILGUyGYRlpCjd7XZx2uRefAHsGIUfXrBQKIBj0j+ZkwnIDQaFzQ336y8GH3+S2vqfE3c+STjnXMK5vHNJlxhETz8//OZ/2/2v/qtRLp84bE729/vORZDx6TOqW2Gs4/G42+22Wq27d++StDEYDGSByAQoTSFEwDudTqfbHY5GauXjnjDTgrh79+69e/f4ebVarVQqDHP5lAIHY8pKgghvKkEkOraayc1UL4IgIHdEPrFu5pgqjSPmEy6Sy+XG4zH3ZSgR+CTGyWgljOScQ45crq3Seur1erlcrlqtvvDCC41G47333vuTP/mTZDL5u7/7uzTor//6r//ar/3aT3/60/fff5/4rg08K+XCGf9PGxdZlmVZlmVZlmVZlmVZlmVZliVAvCz/+YulKQnGEkLqIQsecJZOpxuNxvnz51dWVgAxs9ns6urqysrK3bt3f/SjH3300Uej0WhlZWV9fR1eHsRSwSvKE+e3MAeRm0ARFaAH2DSRSABYRM4p7X8ymfT7/WwuB/yEZZxVAwBlQAu4WCyS2w5e4HFI7VEfBqUQWBkBASVwmJdxnGQowKRAfjudjk7CoLTWXQqysDhoqBvz4qVSSfqqwpUAsJxzpNhbhh0nf5HCKKAbvIUFuwEIjoGhXC6dTtsDejabnWSzfJ8qks0aQJUAR1kqwd+EOSg1A6AQqeUiUV0oFMrlMtj9z3/+82QyWa/Xz50799xzz7VaLVA/+3ZWb8HLUJ6L+T58b/d+YtnKHihs1Vc8yEM8a2c4mCLe2ktZ7qfF40TTkykWDc1YgPCOwAKYEdTylZWV1dXVZDJ59+7d/f394XDYbrdv3ryJdSHDCmnRKIrA6UqlEmR2KLqAyFbNg+5NG+GOJUzTpt5LSFQ8UD22Da7QDzudzuHhIYIPYRg2m02GHlEcEYfl2QgKPJqpuObzeZRegBFHo1Gr1SLeAIg2mhXQcLTCmWGQtUXdIpvNHh0dffLJJzdu3Oh0Oslk8oUXXgDfvHDhwsbGxv7+vuoBi7B2u83rr66uUksMeSUNiKFvPc0Y11S7O6mLYtvX5mp44KyCB56etaej4smSPCpAbCmlcRHk+5LH7oRAeTATIGo0GtVqtdVq9fv9Uqk0Go3K5fLa2trm5maxWGSuBksFxzw6OoItK6EeOLCSgVb8T7RrTcvQt0nj4Mu9XmIaDTc2B7/21f57P0+H4yCZcVE4bQ2DdjMspd1Xvjp54qlREEwPm4nxeDocHjEcFAKkf9rYhmwPd3Z2ADeZvemEVvmE7sG0P51MppNJZOYQpspkOk3CBDEw5OwJioD/imStpmQeoOm1UlhzOf5TFqaMVirWMnyZ9hlZWhrE3Ne6BvhOQ/O+CkJgIcvnNBk1plnizJkz5Am9++67f/3Xfw31nrSbdDp969YtBTLnUtTt+9pY2rIsy7Isy7Isy7Isy7Isy7IsAeJl+UIAxErpJXcVdMlTFbSmTDr4NRqNr33ta08//TT55k888cSlS5dqtdre3t6f/dmfff/739/b21tfX//Sl7507tw5TKum02mtVoMkyy1Go1EulyuVSpxgYbmCaknGdH9/Hz+u1Oz8qTIZj3utVqFYhFDZarV2d3f7/X6lUqlWq8CRe3t7IAKo6IqBCA1WEC2vCT7LqTiTyXS73X6/D2OX69+5cwdJU6QDJNHY7/cPDg5EfHbOgQKDOKDSC/CHJx7nf6leglwUCoVsNitPMEn6UiFSz7CUVY7oQMyypFfCvqyQANeoVZibyVKJlxUaWCwWJ8Ui/wn6Q6I0bXd4eAjuc+7cuVqtBjAHQIwTnf5fhEFgIJSXAZrRDPlX/+pfffjhh9/4xjeeffbZCxcu3L1796/+6q+KxeLGxkan0yEYwEWA3T3irQA1D0F7YCEyYRmakoUVdibxCv5kdVdEGnXzzBsF9HgCx3pUz+aOOAFYDHcBIqeSh8PhjRs3iCJAG6dxC4XCcDhsNpv9fh/hjo8//vizzz4jHd7NhIbpgQylQqFQrVbz+TwgHUEUul+pVMJnTAR8T4IDUIlRKedDhi0gGl8ozij8hH8ULGGkIKAMf5kezvsyQAi3cGs3Sx2QXjZwM8CWAhUQivktFYiw8tHREcLBjFZIx0REBoPB1atXy+VyPp+/cOECcaxnnnmGSQldjv39/X6/zzM0Go0zZ87QA8MwBCMG/xXgZTMbBPdbtQ13krTOU0kxVmRkT8xHM60nB+/JHP/yALHlEVvBhPj1adNctXr+/PmNjY0bN26gJrS7u/vkk09evHiRqRJEnolOpHUQSdmg0RwAoNKxyWQyYMH0W1Ug06Bq2Dl3dBROo+EzT3f++/8+0eunk+nJeDr+j3+d/NN/X3zqUvjP/i9RvTra3x84l85k0oj5sNBIMF0ZKkwFrVbr9u3bBwcHYRgSHcH1Eal365eIYjVdcTQcJhKJYLaGwnyf5vOZdFrcW2Js/X6f2BghSXjBCJvQn3kq0neYMCVAQcCMT/hVNpuV6510hN3MX1S8bPqhfigIm6HBF0DAiaGi0U91wUQWNg1KTjeA1L++vl4ulz/99NMgCP7xP/7HlUplf3+f9AWJmzujva4eblvWsuyXZVmWZVmWZVmWZVmWZVmWZQkQL8t//mKBDJvOLAjDzRQbLXBWq9Vqtdpzzz33m7/5m81m82c/+9mLL7549uzZzc3NZrP553/+5//b//a/HR4elkolMuU3Nzc5G4ueLOadwCZYw8qLB9OEn8vRdzQaTQyky9OHiUTqJL+VQyygWyaTgVFIEjpKprlcjkOvIBvxjjlpA5cIsAanuHPnDsnIkApB7uAvcxQnvd06wiElgZJGt9uVTGQmk8EpHoBM5DKAY1J6b9++3e12V1ZW6vU6cskCm1D+BW5otVrNZpP34jQOnsu9wB2wOAPv4N35MF0uWzcwL83c5oD3+30eDKrm2tpaIpEAkYRSd3h4SJK4ZcDxaul0OpfLVSoVqa/2er0rV65sb2+vr6/XarXV1VWQZefc+fPnnXPwEy3jzFO+Vr9d5K91Sjgk3vO94RD/poevxTnCLuY7Zy/iOezZK8gRy1IaKXQ2Qik2BiDch/ZFOJgOAEAslVWrdCGQl68R21AeAB1MdGkriWtVcQX66DqAofQ9hY4YU3pNPrEGhlaFWZnyMumy3xcl2UaqhLyLBsuX3UyuWncXO5tLYcEnnBfvSqFpDEB+yNXA6yULoHtZSRNLwnVGB8BmYNg6tKomtoadEb+OezDaFvlcpn0LCnsc+eNbO8f/jvcKqdTm5ub6c889++yzGxsbqVSq2Wz+7d/+bTqdfv755zc3NyWzrvoEYaRp+M9isUiUwpqwEbVyznmZH4jwMPNoEpCJ6Nmzk8uXe8nEIEwEk+nk6cvhP3xxuLqa/NrXolwuPR4nwzDhDAXeKm4rwkGnPTw8bLfbaAc7o4+vVAxI+syizNvOOfUifjIajyfT6Xg0Gg2HUIZZPiCzkxwjN1H+wdcYvzB/uRoTO2A0WLAifOpyrErcmvmBRQQQWSMIQrdU6TXQ3Ey6h5uKYqxuxic8niSbmMyDIGCh//GPf9zv9//L//K/JDDT6XTOnDlzcHDQbDaxDfDmRs1XGgJLgHhZlmVZlmVZlmVZlmVZlmUJEC/LFwsg5rQpSJSDnIRHdcDjLAovb21t7dd//de/9KUv5XK59957r9Vq1Wq1crk8GAzefffd//V//V+3trZQRSgWi+CkUlnlbAxKBYoKQFypVHK5XLfbdc6VSiVgWWGU6XS62Wy2ZrxIQS9BGJLDDhxZKBTq9XqxWOz1eq1WC2iAUiwWDw8PYRpazWX4iUDGpJNzvAcih2Pb6XT29vaQbiRxOAxDxFJ7vR7eSsPh0F4Z2ib6khQIX8lkstFowNnsdDogSiIaw5V2zkEOBckF8gaJlokQby0tC4H7gFl8jXbkVM+bqgkymUy+UPCERCQQAaAmHWGyvKkoBDrQIuh0Ot1uFy4nIAWQd3JWeHJI02QiA4IPh8Pd3d0PPvjgpZdeWllZcc6R6b+ysiKk3nL9LIF9Lgj7SCoTuo5Yk1ac1POs0/cFnVs8VMqz9lHtI3kPLABd2d+iG6O+gloLYwFMk3bvdruQB2u1GoDa1tYW9mv7+/sAvvD+CBLgGMalisViIpGg6/LKmUwGNn2xWERvQfnv9Hx5c1lo0iNW5/N5cQPpYwK/MNYjY73RaAhxUy+lK4qBS6RBbQG8Ja6r0D36GLWBoC0wn52gstlsu90GoiIGk8/na7UaaN329vbPfvazg4ODp59+emVlhfAV0hNEiRi5gOmoo9TrdVq81WqJMe3pVttJ0p2UGLY9Ku61aGFi28eEj3sGoaqNxyZgChcWDu6FOo4JsFEUDAaKV2QzmSeeeGLjySeRfb98+fKTTz75s5/9LJfLNRoN4nASD4GuS+1xtXw+TyyN9qLzwJSPoujg4IBRjxOaxFtg12LOSSWk0+lut5fNZovFTDabnE4nyWSYSGS+9Oz4/NmjTHZSKCSjKJnNJlOpJECqm2WHaLhJ94OJ6FgaIpmUleJoNGq324wXG2Zguo6i6NatW4N+//xopLpLJhLZTGaYTk9mQRrGET/nh8oFWV1d5fV5mFwuJ91/BUj4KzR/Og9ronSKmM/1XowgmPLD4TCXyzEXAbKTUMKypRGnqAwZGyi60HAyyuOZReVWDtC5c+c++OADJIxLpdL6+jrT+61bt7TQK9isMJUz+R/uEdWBlmVZlmVZlmVZlmVZlmVZlmUJEC/L3ztALIhKGIeXJi9+Lj8ZjUaVSuXpp5+uVqsfffTRrVu3QFX29/d3dnb+6q/+6pNPPgECgO2lzNnxeAyXSlikTbRHVBF4lOMlv4JyC+o0nUzcSf5m0lAFOeUqr7bT6aCQIE1M+JjgmJzhJdUKEsqJF/VMsuN1bIY1fHR0BDwKLY6nFd8WKJyDN1gJKI84wrzj0dERXkBAKvC8ADLAzfVN0buCIICMxluDp8A+g5cNmMKR3oJBVlpaCBrEyWQyGcxgUL5txVX5FbiAaGgkIDebTZRGj46O4A6D4IMgDAYDMpdpNYsRUEVc/+jo6O7du7u7u0QmgDhRtS6VSru7u1bO1cNt7yulmjT8h4TGrJCuvayH33naI87w4KzUsqdBrO9Y8NqTwtBAE5sPnLFcLkPNKxQK0gIm777f76fT6Xq9Dhv96Ojo+vXrn3766e3btzudDvK+JMgTOSgWi6CcjEG0pAeDATfi+vV6nYxyNYqbCZ5YkzpBpVYflifHbUy6HG4mRsF4CYIgn8+vrKyg9ALNkEEqxF/KNh7n1NaqHLcYBfRGlEyExIkLWalUqAoQai7CTZPJ5GAw2NnZmUwmt2/f3tnZeeGFFzY3N7/85S8fHh42m81MJrO7u8uNNOSDINjY2MAWstvt7u3tadYSnOoZKtqOYfuenbXsCyrGwGtqpo27Lyrw88uk53vEYTv5u5lySzKZDAHy+Ilz6Uxmc3OzUq2ibfLss88im0DOB0NYYCIAMXMCTUMPRF1aUDIEbWZdKLogmLyjNV5TSkcURePxaDKZTKfBeJygXziXSmeCSnIaBgFqColEICIt87YCD3KoYwriT8lkkviKwqLD4RBRI4Yq41Tz887Ojpu1l3MucI44nEunJyfnBH5FgE1mdyWj7cOwRcNHJF9lDDCOaBHWTZ7WkuipT+ugaFc3a22nPBWaRnk84Lm5XI4wpJ1adV9Uj7ka4aV6vY4yeDKZ3NzcpImlKO1mbHpF0YRNe3PvsizLsizLsizLsizLsizLsiwB4mX5QhSrQWzPbxYXEzoGYrKyslIsFsfj8e7u7vb2NlTZo6OjH/3oRx988MFHH32Uz+dLpRJ6o3D3Op2OxZ05oALLyuoN9i5fQ4gWTCGbzZZKJb6fzeWSqdR9xCQMXRAcHR2l0mkOwLAaAYmQQ81ms+vr64hUgHaB84IoiVHb6/UODw97vR6EXE7yIM6y98HmCOiZYzNfEMSDhoNc4JQ0DRMZqhpMZzQBlM6cyWT4nFN6q9UCMaxWq2QZw57jaSHh7u/vC0OHmwyGYqm1QhzAhVOpVLVaRQ0zmUwOp9PIg1YNggl2IBEA4VYI4PZ6PcRwAVZAQ8CRdSVpHfBDiHKA2tvb271e786dO9euXTs4OBiNRvV6nTcql8vnzp3b3t7GdU1groA5D1Z4PKzBptjbHH8PIJYxVBArXpDDfuKJd4v7KZTT081IJBKVSuW55547e/YsyBF9DNmNUql09uzZ9fV1lD3u3r374Ycf3rhxo9frHR0dDQYDIgfAvqDD1WoVhAigeTgcHh4eAt9kMpn19fWNjQ3QZOt7xgCnQcVdhas4GAw0UhjC4ubLREuvKdwN/rvekZEinqkzRmSggSLeupl+N7eAUAllXjRe0G0Gl7o9UqqlUgmxl06ng7Xd7u6uWJaDwWB3d7fVauH498wzzwwGg06ns76+fvPmzVu3bm1vb6OmgvhGrVZbW1tzzhELabfbqhnhtkIe0Qew3Ubf4RNxri0HWWxQS9a2I9H2/1/SpE5ovjOa8vYL92cCu1dIJLABZEa9e/fuYDCANAqmj44wzUpehXq4pEKYVJnuQEVFnOdr4PLMG6RrQAYngCH6+WAwaLXa5XIwE21wziWDIJi6IIqmQeCi6FiWhMXFjjWeRBR1FgubJMGszoojKj1fZgqNoqjRaJD+4mbDh1HACiHRFcYCz8+i4Jw7OjpqtVpc32qqqKsrDKARQXNYLWamdIIuXpSXgUlWCusg/rEypRTTn1mdx9DSJpEigjHMKnYyBF8ulUqbm5u9Xm97e3tvb+/8+fPpdPrGjRvOuWq1igemO5nqQWeL9+flHmxZlmVZlmVZlmVZlmVZlmUJEC/LF6sI47AnOs7SZMsK6HzppZfW1tY++uij9fX13//93wfeevfdd3/4wx9+/PHHpVLpd37nd9bX17GoAvGE08TpGhwTEitYp5uJhLZaLXAZDuqccvFVI088cK5ULOpMOZ1Mer1er9tNpdPoUUDO4hwLCdc5B4lSea/wqjjtw8AFiUBmt9VqoYeQz+cB0RDBkLVUu92+c+cOYG4+ny+Xy84km4PK5fN5MA70gkHHwI+UrSyuLl+AFAmSC8I+nU7r9TowOroWo9Go2WyCz6I8IBYqFZtKpdC7EGgVhmGtVkM6EzMxQIogCCay5hM4NNOvoMXhrsoKCWgGNQwryiGvMABQwX98BzgArByCZ6FQQNP51q1b//bf/tter3fx4sWXXnrp008/PTg4SKVSq6ur1WqVK9MTLGPOQl02YfmRurp4qRZljqPPcXxNvD/lj1s9AetaNvfn0pSwgDzDBOc0mOCdTufevXu7u7thGD7xxBPPP//8888/32g0JpNJs9m8efPmxx9/jHZEEARAltlsViGZUqlEMwEZg+yolMvllZUVaRbLrEyKFryg1ZwhWiMRVRmIqUVEm4XyDEDMd8Cv8Wksl8tgYZD64WPaZ1BkAsyOymGoKlIiqBHI2Kt/OI902q2tLUjuRH1Ks+Kc293dReYbkjVjJJlMNpvNq1evDofDYrEIng7ls1arVSoV6QZY+QhxJGlfgYOeF6J+aLuZ3O28buxx0i33PE5PfiSAWLISTJISsVXgxCFAr2lhxpAtFArJbHZ1dTWVSv3oRz96//33n3vuuXK5DLbIlMVUeXBwALgvZFbBkmNxm3weNR5c6ZjxUCenMwPu81cEE8R2r9VquCOCSrOmJBKpRCIxHI6OjgYWVEWegq/J9BJFhUwmIywbCjlLD+A1IU/0c6Io4oG5F8IprWYzn8+HsxUzm81mstkolcJbkz7PYyC/Y4fDzs4O4kuMBZBTzQzMLawdTP50DCWUULH8idAIWDaPSnOoExJexZpyZ2eHEB2NTm3kcjmmEaXvsFILCF5ZWRHxH6B5OByura09//zzzrlr16794he/OH/+/IULF27evFmv11988cWbN29+9NFHUq+aCwf/Mt34+ArOpZ3LORcud2/L8itSps4dOdc38u7LsizLsizLsizLsixLgHhZvljFIxIq2dyDJPhHPp9/+umnU6nUxx9/vLm5+bWvfY0v/+3f/u3e3t5kMtnY2PjKV75Sr9e3t7exRyfdGxscDq4kIwsqEtcVzpTQENm4AR5ls9lSscjBXhjHcDgcj0ZSRwVE4OQPvxXFBi4u0q50TpE/brfb6FEAZXI7sAMhy2J4jcdj8qyh1AG5cq4WbJHJZKzbmyilwOUwFjm9C7JRjjk86HK5PBqNgMDknjedTvv9/uHhoV6HvwpcEHEMph5YSbFYLJVKSh5HktI5F+bz0+k0MjCQSOLg9aJ28gXInqBgMpjiAfgOsJ0wJhodcjTvIu/B3d3dwWBwcHDw8ccfA3z/83/+z3u93tbWlgQreF+uY0UhbGq8QIeHN6kTYGGJ0h4qZ5OgPYs2j9qpD5W6rj7m+elZMVl9DkpLL5KmBLA4eA29FA4g/VkioUBIBELQeCmVSiBZkN9BwbBiA81HHtpTYbZJ3/Q9PR5j1hnis00b51LCFkXPFDxK64NeSR07blQl9qi6MZiXWhbIDPRKCrYQUfUYqlt0bKhD9MTpq9TVYDBgOoIW3Ww2EXcmcb5cLqfT6cFgIGM0qQrA1yZcZPFfHlIhGWF8thd5PdB+6Iml2O7hWeF5/f/xwDUrEhKPUtiOetxvZ7DyZDq9ceNGOQjAZ3/605/eunXr2WefRfwdIqryPBqNRqfTQfGGGYNxMZqJ9mpKp0sLf7Ty9/Q6xIv5BHS11WoxK/b7/V6vJxkfXYdeAT2W+ZZpikXHuixKEqfVao3HY4S/C4UCPZblAKZztVrN5XL0BAT0M+k04Pjx5BmGqWRylEhEs77Ni0ikhTAA6LNVQ+ZGihOIRAyN1/NalGiGmM5E/qIo6na7h4eHzPYkiDBFMEAAfAXTK/DjdTkxtQG4uQ6V5smqZLPZtbW18Xj8v//v//v777//5JNPNhqNer3+pS996cKFC1EUffrpp8pCsER19UBL/H+8UnfuZef+G+cqS7htWX4VSuTcgXN/7tz/x7nesjqW5f/c50rncs4VnUst62JZfkXm55FznWUAb1mWZQkQL4tQA7k/eRmgYueB1+Tz+dXV1Xq93mg0NjY2nnrqqWw22+12P/300xs3bmSz2SeffPKZZ55BkVCsUkRO3UnBUHAicl25tXRvOQ+DDkDiE9MqTCRSMylGjuWZTCZRKAADwf8SOgkxjdRaUAm5PE2n03a7vbe3h8EXBEnok4PBQKKQ+/v7PAbJ5oPBAIi8UCig7SB7LhGTQWOhbbqZnilndR4SkFcUMz0S2ES32wXvQ8YXnJSDukAWapV3FK4H/Edmt/QlwR2sMjLKGAIIwjDUAX0ynTabze6sGvv9frfbtVg5zDsIwgJxoKRRP+o2Eh/gscVlBkwsFosbGxtRFDWbzVardfv2bRQPcDNrt9tiMYtLLgjDyv56Hl8P09X1W8G1urgYrB66RwsK0xRgbe3pPCFj8YjdSZGBeGCGjpdOp9fX10ulEoT6wWDQ7/ehFedyudXV1ZWVlSiKUBy+d+8e+iQoQUPjrdfra2tra2trdBU6MI0lIBWtCV7QdiHVISMIKQZR/sF5y+UyLGBuzYSQz+dtOIchcBx7CMNkMonaNREgIgcCvASZ0RvpkDKHBIYT81QDk/6GcSUImrRWrfUfsDtgOioc0O1hE1O3iURid3f3F7/4Ra1WW11dRfwaHjGjFSamXCi3traazWYymazVapoxnNGB1Vh2hqLuIWtznRWlKWzFH6zchDWvk+Lz46Xn28qPY80nYiFmgDEctra3h4XC6urq3bt379y5g14HWOrR0RFpAUzX5XK5WCwye9AllDgCBEkUxIrSWjY6FONKpUIMTJIjZHuQe4GgfL/fh1wsr05Y3kDPhF400lVpGt3MpVyWIA1BLKIRTESYmrJmKewRBEEiDPmH1tDj4McsqUJoNaE+OPUIN5NWormCZQXklywQbqcZxs1kkWwoUeEfutBoNJKWBeETbkqVMj8resd1tOZKhhiZJppMgtr0c56T6JQySFZXVxG9uXv37mg0qtVqqVSq3W6jsK+0G8WiPEHtX0ZiInBuw7lXnPsXzk2DYBKb6NXjH/Ch99dF68ii53yYdSf+W+9Xv/wX5r7drHKjh3lmpoLHOxjPe9r7l/q8lKbnveDCTx61jeZ2gIfsnPzEfnnBHZFVajj39mKAOHAudC7lXHIJUizLr1QZOzdyLpr125xzv+Xc7zq3sezJy/KrUCbO3XXuh879J+fGy+pYliVAvCz/f14suAZGZuVZlatLAvuZM2eeeOKJMAxXV1efeeaZ1dXVfr//k5/85N/+2397586d9fX1M2fOnD171jlH4rBzrtPpcPLkNIi9G5CQaLz8G54p7EjBuHK6gxQmCJiSTqc3NzdHGxtoEOOYBCrEaRwFYc60/D9wD/dqtVpolSr5F3YhwBZEQhQbAD6y2Sxn+0KhwHuJfwpDKp1OA44ALfF2vAh3R/UChq8QJR6gVCrJhp63Fv7FsV/ZwdwOBARkjf8fDAZ7e3ubm5swInls1TbQBkAhVxuezPOdTCbb29tHs4x+lGR5fnh23E4xAzh9YBDIcUj1kr+C4oEyAPzxprlcbm1tLZlMHhwc8MxbW1vj8bher+fzeeRika7mC4JTlbS+iOH7QHTYctb0D+G/AnntT2hEwWqWNWwHiMWdpRjA7QSEuZOiAVwTqGVtbS2fz+/t7YGE9nq9XC6Hw9vFixcByz755JO9vT3kXwG2CDOk0+lKpbK+vt5oNIS0gvXw8ICn+DfyfdjHFsSXXCzfV6+GhongCeor0tawdGx6uISw+Sv9TTIRajs305Tg1vw/MSGLK1lnMIUiqDEGo8RV5M0o1rO4mQL7eCmql69NJpMrV64EQXD27NlGo/H888+jHtBoNBTygbA/Go329vYA4JDSbrVaqBt7gQeGuTA4L7ZhoTGRgoUOu5P61/avzngkuofQQjlltrdPZWMY3pXtukAYD/nywWBw9+7dVqsFOVfsVDDZXq+nyJ+GDxOIZJ2FiXNxyS/wTcISsOlpd8IbzJmHh4eiqHv1YEM7mtDo+V5USZxi8kXAkVmt5KdKJ1RHFd2YGCq6RqVez8aoUOGYTiYyXCXyagWF6e2kmNj5R3XihROs+K9cQ+3nVoEnn89ns1mWWj2DlnWCNNlsVman8gO0uszMHjyeKMwU8b6lwc0/xK8nZqMrIHnhpVnY+fCX8Vp0zpWcW3Uu4dxPksk7iYQXiwsEVRj0MKTbU2P6nFGgTIjp1AP46FguDH389KTj3qJ4pADTIAhcENALve8Rrjn+6+zKxw8Whjy585TBT14kDAI3eztngqn3R3oUOaNX48Us78dOnHOnmL4GQfxNpx4qrafVkNMFH7RSRzOwNTD/aRf4yExi91/Z/CrgCWeV6ZybPhyIfx9MP5k/oS+cMBrVA8+6BF2O+pnaGg4CnjgRRU9MJl8ejQqncioD51ace865M1TssizLF74Ezo2du+3cR84dzEZE3bn/1rn/xrm8GS/Lsixf5LLnXM65nywB4mVZAsTLKlgWq+cgPqBn6QOR6qmnnvra175Wr9e3trbQdgzD8N69e//u3/27f/2v//VXv/rV559//uzZs6lUqtlsgqhyrkY/tFAoSAtYp2I4aNidwedqNpuiNx4cHNRqtXK5jEJlLpfLZbPI+1Iy6fTZs2dHZ8+OJxPyXoXYirhqjZKGw+HBwQGGXW5GvNJhXlqTEDD5wnA43N/fBxqWqRGwAoZ4nU4HEG1tba1erys1GGxUREJQEuBUeGTkBQNXUZn5fD6fz4/H41KpREYzEC1QrE7UwCVQIwHjgDNarVaz2bxw4QL1ieyvOL9Sn5ASaGSPiFE0nU573e6g2wWIh64IjpZKpSqVithzQgO5tWieAnSy2ayAP/oYNFIOv9lsFhe1lZWVa9eubW1t3bp16/DwsFar1ev1e/fuJRKJZ555Znd39+c///nBwYEwHcu15ME8fvEDz4DSxIxLwVrsUj3H4wILPuZzDRmBfRa64q8W7LPDjSswIhqNRjabhbJNs45GozNnznz1q19dX18n5rGzs/Ozn/1sd3cXiBPMCBwnk8lUKhV4684IfahfWfImgYRer0fVES2gt4OO0SeBPqGfS3pYb8Qr93o9qOvyZHMzMjskRIaPM6kDYpK6mcGj2OgAc1SgmPKqUmA1+rBtMnnZ0S0hC8MqDYKgWq2ORqN2u43ro0YK3ZWuG4bhZ599trm56ZwjuPLiiy+22+2bN282m02kEiCukkJRrVbpIdxL3YCuDiRnu4qNPcRF3r1IgzOsXouEqiOp/z88a94bAnpUoEYvwnEfbD2pSl8ul3/9xRcrly/v7++jgY6AO/aS/Krf70vXGB6rm+nSyOiSeA/zUhw3V34D1QK862bK5qLwM7WyptDVUbQX+Mj8JnKu/AyZRZmd3MxEsVgsSlcEcXYK4UY9pKjQR0dHN27c2NvdLe7tXZxMMrPay2az2UYjmUgMh8N0Ot3pdOxwYBzxc/qnphpyL3hZMHTPmVNfozkYMjDiWT4gCG9sbPDkkiFieUWLmcUin88rs0esf/HfGVzodHMXJCwYm1Iulv/esVOfc/fu3fvwww8vX74MJRmfTNZZzZDOuIDq7r8MQDx1burcOAj+38Xi/5zNuiBImLAEWOd0MplOJhGjD5zXOSjTnrspUSVNONOZ5lJIFCSdToShhUcjBQ8mk+mCwRgGQUj8A5Q5DMMgmJplwo5KxZuPr6lgxsxREWw0QhWKAWuSV+wUMZ050yaTySAMo+l0PJmw9kyjCEkuZwKr3P3+3M5dTi6OcT6BcNLpbAl0URQy1ScSbjaDEcaYTqfSKROC7GKA+3QGZFsQPAzDxCxjif2ogoLH8+R4fCx4NYs2HS/o0ynfn0ZRCPYt8F3ord6RAMAMzj6+48kspampEzfrIdPpNDApHVEUTWYL4n0NrijKT6f/t17v/zkaRacSKtPOvezc/+jcP1geTpblV6cMnfsL5/5fzv2Vc0fOOefKzv26cxnnthOJwzAMFmVFMA+fhJvdydje/XPK6Vkgc69/MqI2P5gX+/Lnj2gveN8gFqM68cjx549VYzA3xqY/zssjmft2878wLyLoFmSH2Nu5U71hooer5yjWN7zamHuX+9vsIAjsRbw4oiZ256IoSkXRShRVougp5xLL8bwsS4B4WQXLYgEsJZxaPU3296VS6ZlnnnnqqafwEeJ8PplMfvGLX/y7f/fvdnd3U6lUoVCAecrhhLTufD7faDQQ1YUIORqNEFRVunqpVOIE3u/3OfpOp9Nut9tut0G1uKbkfe8fwMIwncmMw9BNJlJ0BTLjeO9m/FDAoF6vt7+/3263JQ0BDkViL7zd4XDYarUmkwms2PF4DG0NBIRjQDabXV9fBw4GckV588yZMyRcw6RDOhaEAo1j9GQhP3KAh/MF4zgIglqtBq5Bc0DCxfVLLOxkMilyFsgC2CLCqTr/U4AVBNCAlXAUnMwWTi3So/EYpz6SlKl5ngTPLjcjbMpeTJb3yr/OZrP4fYnCKckIcQmB/CqVSqVS2d7e3t/ff/fdd1988cXNzc2Dg4P9/f319fVMJvPRRx/J7er4mWcauJ7ll/QKTu/qHovTSkx4BG0NCtEG3YyL504qAIgDTkHfwxkRDPsPi8qNx+Nz586dPXu2UqlEUXTnzh0YxPSTarV66dKllZWVvb29mzdvvv/++++9997+/r7SyYGNMpnM2tra+vo61HWrCk0euoBdqbV2u114xHQ/WhAUqd1ui1NPa6ZSqVar1e12pQOgxHM6ueqQQUdkgg6JHAQQkjqSm0lJiPJPxSYSiU6nQ6eiSzMKgKUYJlEUMY7CWZEqBa1P8IaH5JVx7VtfX89ms9B+Ze1YrVbz+fzt27fff//98+fPMzBXVlY2NjYA0Hd2dtrtNqEIrNJWVlbq9Tr1eXBw0Gq1rDq5+JhSIlbri25p6brK1VD3lrCPghBWWUWSII+dmG+1L1AUUbPaoZFIJEKjgByG4Uqj8Tu/+7uDXO5P//RPt7a2Go1GpVKBMszsjcEmLYUmSTKZPDo62traun37Nk/e6/W63a4kpDVjJBIJsM4oigqFAnVCRkW32+10OoQiyBchrgaUiUEo/YGxSX8DC1ZDS6TI6lxPJhM40a1WizBVu92eTqe5XK5cLhM4qVarxWJxOp3evXv36OioWCzm8/mdnZ2rV6/2e71+vy9q5GQ8jpzL5/O5bNY5hyaMADJLW5a+sJYedIR4BZHurXQvw5wvIIQtMQo5T0LgZYAT6ZQqDsLExWKx1WpBf6ZNmdkSs8KtWaEwuuTL5A0wIsg8oL329/cPDw/RGPnrv/7rGzdu/A//w/+wsrLSbrcrlcrly5d3dnYODw8V3mAeYF6ywim//B4mFUU5Oqq4pXDYqUOm6+nUzTp5FEVTA1DyDInZOjgBep6x4MMgCIMgNZ2GQeCMZL/w1qkBauMoQyA2/XSaUODnJEk5cC6cTiERc7WJoaYmoiiMotBwiiOLDkeRC4IwiuQqySNFUZSaTpPTKaGGhJGpSc6oqYFzoDaJKApmAK6bycvcR2csYda+KZDrDE0+nqmiKDGdJsLQRRFAfGI6TTkXiUYNODsPIIhiwNBxDThHDQQAxBAaoigxS9mhuoIoCligZxBA5NzEU283LxBaBMq54D51O3LOJabTwEDVkal/55GFnXPTaaDUkCiazKDkMIqC6TRwLhlF6Sh6GNwh5dzvOPescwdh+EE6HXoQjKkiC3ncfwtQb0vBXjzGAvdwMhpxDY1HZaDM8rcyJBek04lkUnT+43jPZDIajyfj8WQ6JQyWTqUSySSBGebPJAHvKNI2YzwaTaMoYLVlCYuiqZbO2eYnnAWHjoMUs5DI8ecnMSP1vcDsFOPewsfPPmuI6cmcG5+eb4IQHo5m70j4J864t31PrX+/Y7v7AilTJj1mKtC9kx0gML3FBXMK69QsLBXyBFEcudNVwzA4Osp++ulXu92zJ8G1yLluGL5ZKv2rQiF1cn/ueXjcz5Qy7xKZnKpwlhChcedDokYRa25OIdPacVTe0j5OHgYeMF4eYiDEcg9mSRV0eKJWRExn6SnaGyhqpenaxuG03HuHGpspQjxMUcNUMhkmEo6oZBRxR79yTNeKZt9JhCHd9USP0usrAU5r7qzPJBKJ48gZDzyZRCczVKJZk9vn93Bny6aZu+ONK7CxFB6fd8IwOUsldDPVSuv8fDzqlfk3nW4Oh/9js/n7/f40WgqiLMuyLAHiZTm549HJ7QSVLAyTyeTKykoQBLdu3UokEjjSjEajnZ2dX/ziF1EUra2tFQoFjNSlSwDMYflH4EocvSQ0jGmPkAKBaIAXqD3AIOY8PBqNkt46MXtyWFqB2RRycgblkZ4vGJNeHKDE+nEVCgU9JPANCLUlP4LeAnNwO1AkrfRW5IFHAgWQZZYzZlZiZcpPyVqfySLMWvnpQzFAdVkgKuoTRBg2N1CF+J798bgwHtvNAWnUYPTCudxMUlZvJGlRKk1mZdxU0pz6mkAB4V+AesVisdFo7O3tJZPJGzduPPPMMxsbG6PR6JNPPuG9oBiL72azyK1+7i/jdOTmKbEuOOM4K1s858A823zE5YldjKQsViAEebLdJeAgTy2grm6322q1+v0+NG3Iv8JAaWJt64UAupP+Y+6kbx7iAHZjGrfvkxiCms/KZXhp4zzzaOYYOZnR9KwqiK7M3SUuYblm6jl0VzdTUGE46x3VMyXXoIHmJbBLnVwkQU1r9EOOmgCR9XoddReIpcqsB3SWALecAIXqxnl2c5ve63hR7JzjEY3jlnS/TG+3DWHlEeYeaG05btzxGBFnOLC02v1j5IyezGRLdXW7XYzm0F5X9/ACGMztbmbFOYMR0oCS7qQgDCAvM5I39DyBcmsHF3fnoy8h/g6FnxWHRUchQ2udyqPm8/loOk0kEvasGE2ndFr6m1WH0ONpQbHPbD3crECNp55hMxX0dqo3u3CrW3qyFclZEc/detLqglS+2NOROZeKzh9FUb/fR1g/k8m0Wq3t7e2DgwM8CWBMS/LYmzwXHfkev1c7lwiCIJGQHAZgYhRFoRGaEAgYOpeYTUr3fVCFCM/6xv35HFiTr51cGEJzl/nLipQipLoQReFJuaHjr9F2mopn5rSBwRnd7ACvWUYAbuiBrVHkptMIpSDAU1Dv6TSIIr4sGm/Iz2eVFsShQ7WdM2IL9mQ+e6rjS9EnJxM3nQZRlDCoRzBri7kTWjB7a4sQJYIgYeRBeAweGF6wbWI9KtflcvprZG4dxIA8vQsIyAlBDO+ZZ68f2nFqusRxo2tpmNXMw3TmpHPTIPgolfp/1GppG0uwSiMyej05+yUSCRbjY1DJ+sHGQPlF4lyBoH+D2gTzHjVagMeph0yiCH53IpEoVyqrjcbaxsb62lqpVGK3P51OXRRNplMcAjqdztFgEIZhpVolfRBxKmgW+Xw+k04fjUZ7u7t37ty5du0aEd8wkcim0wk0qabTo8HAWluTepjE1SAIkqlUNpPJ5fPH6VMsEMzJRofarmhkwx3PZtPpeLZlcQLCZmQIuYAmZqI3x3Db/cskwhn65iwVncjQbMMczeRlGDsWQhUKbM1Lj7fc0+l4ODya7ViOv6x4jzZqsh6hQpLJVDKZmK2qTOksi8oeE8ofOAfEqVsEuVzm7t2N/+l/iq5eDWLqK5FzvSA4CMP0SeRdM0zk3DQIpkHg9yVpAZ2EQT1k8H7CQRieBubO8NkpC+5s60CXoAPc54vYQODJLh3MYl1uwaBw7gTr9hiApsKpxiDgfZmpAmMroflI426K8NGMysNvI3rOTDznPm4eBNF0Ok0kCDAEYZhMJJIzysjUgL/BSUWdyBu2JxNueOZI0+9sdo1OggVhGCbDMDHrXcdTVBBMycOYAfHHvSIMp7N8kcAcIlT/0yiir6ZSqVQ6nTR7fuotmUpp52mfXlh2OpVKa06YTCbj8XSGcrALDcMwmU6zjR87V+l20+OxGwyiJUC8LMuyBIiXxdLKdFIS8c0Zs6mNjY3JZPLxxx+fO3fu61//unPuww8/fPfdd//u7/5uZWUF4U5ovxhh5fN5ierKYwp/IdGInHOcw7l7LpeDAjkcDmGZAX3qc2CF5HhsV2JChe7oiP2ZcFIpP+7v7+/u7qJHjLgBHGFyzEnOFabJ2R6LOdJyhbeS/mzN1vR9wR/dbpf85UwmwyIkcEFKr+KlWv0BoQnH1Il0WmC6hGLHsyKPI1KeOczDEYPHJ/8oAA60KZW2j8zFaDTa7XSKg0HRSjHOXLMGgwHwfXAyuG1FNngMqgWTPSEL8tODJ24pY+pv0KXPnTsH4frq1au/9Vu/9cQTT6ytrQVB8Omnn2az2UuXLl29enV/f197F5HcycheBL2dUjxGpzvp1eYW6Bp70sMeYuXF8z34T/seK3acTCbr9frGxkatVgvDELQFpjaqxOl0ml568+bN69evt9ttHox3LxaLlUqFzkY8g8b1upnY1m7mSehmwhFywaLXkafPn6ywqYgkIlkLnrZCulIVZ/RZYVPB0OpIkj3RZXu9HughP5etHA9AVENMTCkGiNCNGAsX50jjTA47rn08Oeoc1MxgMAAfXFlZyefz+/v7H3zwQSKRWFtby2azTz311GAwuHr16vb2dq/XI3eBcYej3cbGBhRaC6DPBb9s7M2KXNuAh4cy254jYD3OvnnUMjXnOmrec3pUB7bPGUXR4Ohof3v77mBw8+bNTqdTKpUAiIF0mQREc1ajI58isfLDw0NY57oFaKxVRKFTIVPDJ8rSUOwQiZ5isUgLKranQB3dBso5T2JXNHu8hIkM4RckAp0f+cvRnQqFAh2SSe+pp57a3dnJf/BBaFoBeZbJeCzteNWJBX8pfK6oG8E2EZ917FFihMBlJUy4mWaO17IStdCEY9dEfC9FXrYq3uLpM/kw00rZw83yJ6jt0WiESSa5QYjFX79+fTweo7mUTqeLxWK73ZZ0uJdOYbWhf1mAeHbCD0UQmydRfT9ANZuL3Iynb7NA4lO6J5ERjx36Wb0LYvDxHBcP97fjLr7Q2AP8XNXy+O28ecPLSDjxJ7cwade7hX2GqSGCxW89nm3V4su0Z8JpJ8P7stczLMDuPebWfHBSW9mdjlpaWp+Z4ryojJdL5L3IXIPcRR+GFnx8mFnaualzB4nEX+Vy6ckkODlknHFGjWI4lNZrN2NOHK/Flv5s6nQRQOwhdAtpkjM6nlVbvs9zj6LJdDqeGQw0CoWzjcbFM2eGFy/W63VSc0bjcTSZDEejXr+/u7NzeHiIGM7a6mp3fX1lZaWQzycSiZBNdamUyWS63e7dO3c+TSR+0W7vOYe6PfmLgXPj8bjT7UJVYbEolkrlYjGdyVBF6XS6VCqVy+UiJiXGa/REpDYIgkQC8JT/D2YzhvbhwqTEhGDpORbOmkF+SuFSlsYxqdlsimjT4XA46PcHw+F0dhYLyZybydCLrTydqQM5iaSzERqNBv3+aDyOZhGv+3kG5n7CTC1AnEgmWQXyuVyxWJyWy5N8Xjs9sEU3e1/uHgRBoliMrl2bFgpugRpAMooy02l6FqGZO4WKKhvOkNPj7qSmMRsku7+N5imGxyfk+xt4msywZcNZ/Inu4WZ/8vJCopOa9fEJPzgZOdMMT+veT19gWAkQn4X3nAkletPOiddhaEOInoUN7u8xZjgyHTgRRaRfRLM4me4Yn+VOvNQMt73fRsq2OflUU+2snEsEASbRNj5tA+QeuD+ZLbvH7GMRPmbTZiaTKRWLhWIxm80iWwT2HSYS7FXu5yI4R34JR06sv2X2oOPDdDo9Ggzanc7w6ChMJNDCyuVyURhWDw7qe3vB3t6jbD1C5/6Bc1/+5fYvHef+jXP9JRK1LEuAeFm+WEVSbiI3CSqVuxRwAKSwM2fOnDt37t133/3hD3/44x//+N69excvXsQgS/xfUNFisSgQh6O4zvkctjFkQ25iMplUKhVuAb7DCR+MSVm049EoaeE8A2pAtAQAAicaDof9fr/VarXbbTJw6/V6JpOp1WqJRAKFRHQklJkLM07SoiIFcCSeTCZgx6zKIHqieXY6HfQcQKLBNdhNWulPQWzOqCXyvhLVpR5QwFBC/XSWeSc+tRgEPIYkNahbGg6VWwBEAQ3Ydu21WueHQ8t/Sc9oXzqyirAp0iVNiQipXPgSiQRM2ON47HjMBh0c2Z69tfADea+urnY6nd1ZAVHa39+/ffv2eDxeW1sDhmPJ9zQrudQjpSpb+MCdFOC2r+xps8bPD1ZawcP4BLna7wj5EjxUq9Wef/75Z599FsPD/f39breLDEsul6tUKslk8vr164PB4MaNGzdu3BDUzohYXV09c+aMcE+JjYiETh+YzKRX7FsQ0gA4QyoEZLlarRI+AdOR55hI4pLutcLWoskjjY0QNiR9wDWxKfX/hEAUGULhF58rboHyr0g3oG+IjZRKJYQpeE6rHEp0BE9LYc08G2Oci0uJuNPpTKfTer1eqVRSqdTdu3f39vYKhcJLL71UqVS+8pWv1Gq1tbW1jz/+GGF0tGU5c66trfEM6CcQdPFAGRt4UO+yWIYVFFbDeSxLz03OM2l8PDRNOKNNcbBYG8+hhouiqNvpfPDBBzc7nRs3bgwGA1JGbIhLIrboAgkeJW7E07bbbXSKNWulZwwOCUEwTWnOOT4zDwYMf+q5XC4zkytVQukUWn2s9aJl7uucIHwwCIJ6vU6cQEoLkr2WCDLTGnGI1dXVMAjy+XwggMm5wdGR63SmkwkYq1wT7WQiRrMGjjRhJL1N9EXhEwW0pEOiHAVL8OeansespdiIRGzxYqKJWq8rlQrRRBYgYRZUu/pGr9dDDIddAS/b6/U+/vhj5i5aqlKp7O/vCyB2sXyLz5FBfIxSmeHmzcBxhpQaxc6QHmZt5cLdvNxh74DthVW8s/cJyzVzL5vzYUFSLzY5NwVh0Qu6mUpGHNu1OIt3C7eAN+dZU3gAsafXZDFizQzxZ5gbkfVyWeJr90lfwMj+1gvfeq/p/SleXVEMD/IAGvurOHwfxWAjG9ijWwSPeDwrRlE6igLp1DuXMDjX1JgWJmbk96Thg0+m0wl011k2jycjYDGguZjXIvzIrubHV4sB9xJCGU2nk+k0NZ0WptP8ZFLgf9NpejodT6fD0Wg0HrvhcNTvpwaD9NFROJmkgqAQRcUoKkwmhShKRFE4maQnk8xwmIqiRK8X9nphr5caDDJHR8npNBOGxek0FUXOudF0Oh6NpsNhNBgEziWDIJVIJJPJ9IzSkXEuOxrlJ5PCdJqdTsPR6LhBY1qliUSCLK1EMhlKE2MyCUajYDwORKGdTsPJJByPk5OJC4JkIpGeTpOzDLz7APF0mpwl3PD/Qp8hzk8nk8RoFI1G08GAheD+nD/D2mBHJli5JpPEZOLsGjcaRePxpN93M4A4mM0niTBMzDReAlHgZ+IqickkQWLieJyKolQQYB8cRlGQSARBkIgiZ8SvJsOhG43ceMzaljw6Ck5VePOkTuaGVebEdazm+4LZKS7rER/IXsqO13tPjAiuwB7JIuzzoOe5hBJv4opiySLxNz19uMXntOOty4yIHZ2ci+5npQjv9pTTH4JeYKOPXiXHr3bKzBCf3p1JnE2cTPLzUo5giXEq0YZK9JpCoVAoFDhyWqN1iGiQzDiJs6vUxq/b7eI4nUgk6vX65uZmqVQKksn89nb55z9/xHh16Nw3nPu/G9Emm6cRLf6HM+KO15z7i8cAiF988cVXXnnl937v95xzV65c+eEPf/j2228/xvbp0qVLr7766gsvvFCtVq9du/bTn/707bffvnbt2kPe+oc//OGVK1dOvzVffvHFF/n+22+/feXKlSX4tgSIl+VXoAA5SZyRIlXcXC5Xq9UODg4uX778W7/1W5cuXUqn03fu3PnpT3/62WefVSqVRqOxtrYG/VC6BKPRCLgWnAhMk/M5uC3xPaQYSUqFRIlPFGCQbLX4TrfbHR4dZQcDPeRkOu12Oke9HovK9vZ2p9MBfgrDsNVq9Xo9TrDc+vDwEGsjcGHElKkBwCYZFoGMo0oJoAaRsFargXQ458CwarUagssgI/xQdGNtzfUuVo9Sn8N0A7Tq9/sgVkBaoNW0Tj6fX19fb7fb7XZbRLNms4mqMqw3RDOTyWStVqvVajz84eHhcDgsFAq2Pn0tqiCAdyx5CnAE8QHBkmSOJJ4mC/nKyop+NRwOcXxSBroYB+Ia87QAfIQK7t271+l0Go0GiBKapGtra5giipp6Asaaifk+ZD+HbKJ20TlcmzCL0MXZQ5Z7ZYEAe4C0FLn45wy0RqPx/PPP/8Zv/Ea9Xgd8GQwG6XR6HcpMoVCtVre2tn7yk5/s7OwAH0dRtL+/jxLu5ubmhQsX0H7l7rh1SUzZZqzL0w8AToiPvgAfHCyvWq1WKhWOIlhdQaKfGraC6txWGnBSq9W6ffv2vXv3MKqq1+tgdpaPTOhCMJksjIAXpS2oYSKsQYBa6mRyGdEgcCtCMjpWoSCBv5xzLpvN1ut1phf0iLvdLtZhRINyudzBwcGtW7e63S6uX41G46WXXmq1Wj//+c9/+tOfIjWTTCZXV1cTicSNGzc+++wz6sE6KAqsZCR63VVQfjx90qJ78aOOFTV+bKIlt4iffOwOnsdLJBLhLAm01W6/94tf3D06arVamUyGyBMgLEEs2bt1Oh0066F40OWYl9bW1ixzmdYhmAQzFzEKnpAQAsED8H0CEt1ul87MtGOpx9bSUIpAwk9Z0dBzJ0ZF+oibeaVWKpU40VLs4OFwCAM9CALGC1p7VF02k0mnUoPBIJpOhY9bpqRCIxLdtv1ZRD9mWmYJKYlrCAt09mYnJlg+JyZHLJZ7SY9IkTwI2ug7M0WDhhOdkvYLNOF79+5JMoL16Pr16zdu3Mhms6urq8hwJxKJ4XB4586d3/3d3/36179+eHj4d3/3dyD4yuYR39/ifZ/LBuZ4ijAhuOikgvbciTqOgYZhuOic7OYR+d089SEvgSPOafVOyzZ64TGXF2GXi87hnjLYKb+aS0z2sNQ4TuHFvWx9eoHSRdJGdoX1Rkd8sNg/2eQwryHi4rD6k3JfeCPPLNSL53lrutc/PXRYo9IG/u38byH+MAyDRCJ58lEfKuyxmJB+DDmZ+jpGuOLccBOPfAzO/kPa/7oFsPucPjYT/6WOgpMKVMff1Ip5kmkr4q0lNh633SwJ/bgfzpp7MpN8Zf6xGlPhbBchLPvEo5rrH7e7oHmY0WYgTGdKDsGpDoTx5XhGnkw458ZBgM7DKf0k8oJDMd1kUV+P5VkUuEokEslkPJATn+IW3Tcx61qaH3hfZ/QZ5m+8qZyZps0iaNibJL2xfHokY24KhZsnBm33P/qhlcmy3/RGkIvxkT3/6siksHgLigeznv4K3gzpYcTe3t6KbzxkPcSrcW7WSHyZnrtj9OpBbjHWYENKX9IYVNIh6DBgrpfSRH4SKLDccS1AnMvl9BMBxPl8Xua91lZX+W1SR2w0Gqurq6VSKQrD9NFRKp1+dKX1yLm0c33nps5lnRs7N3Yu6VzSuYFzSedSzvWdC53LOtdzLnIu59zIucnsH9FDzxnHpVqtvv7669/61rf0ycsvv/ytb33rnXfeee21107Hdr3rfO9733vllVe8z99888033njjO9/5zsP85OWXX3bOXbt27Rvf+EYc9r106dL3vvc9vqPvv/7663/4h3/4xhtvNJvNJf62BIiX5QuNDttgtSgh+ivE23w+D2+OjHglfcPOAwni2M90D+SHXgTJ4xxiB4MBh+3jzI4ZViJ12qOjI5s2qxUdGKLX7SJJefyFyaTb6/VbLRcEZPjCFHbOAQSwbPBgcmm3yYyEFqVxBohmoT2O9LgDwXQWsRHEAWs41tFOpyNinVSYncmi8min8bMizWF386IWktsOO9JmEysZX3guYB8rqPWF49/9fh/1jEQuF+8MCufSGcSKCk1yGV9IztSdABdYieNBbO1mxH6V8Kjon7z14eHh4eGhtd0DRJYAqHcidY8uZynSsVTe4nudOAvGsr3i1E7xhX1JrFn+sg0SoHa6ubl58eLFcrnc6XTa7TbmUWtra2fPnl1bW4MDu7Ozs7e3t7W1hbQ3oPxkMqnVaqurq6urq8rr1x7I0p/tk/DKEgdH+oP8caAiRde1kWJcg/cNBgN1XXVpqXwo2u8F/xGCsMrX0uYTp55BfSwHNlMEJlLCWFPfAzEUTCbipNBwtoNUNTOPQiZymUsmk+VyuVAo8CtuQd0ep7OVSq1W62c/+1m5XD537lytVuND8E2mi8Fg0Gq1uAX4Y7yrWHhCcQXeXfxZSy6zEhNxco1HAv2luJYGvLAgjuU6HfeE0SjM5ZwUEqfTvf397W4XGD2fz6OiQ9yOSwHTA+lqvlLPlMyO3FDF7FAqovItLLxlFa49HWqpUXuQrid9q14tGaL7biqxacTDtrQKEEgQ0nQM3Rp4IgiC8WgUGD71KdgKryOCPz3ZzXJHvMNnPJveAlsSrqHzSzLbvqPHtczlcqVSSbO3m+Xr2GQR/kriAkkD6XSaxm2321j81Wo1SP2oeeAxW6/XuawENy0uc4Lf9DnJEONFhuCsVRCK3yKOgVq7SG9ZcbFkkThFd66yAZ3cw6l9klpMjsACrKcQ5eKwgoVsbCDzdL629ydv5Vr027na5fGqtoMxjhd74kv2J3bL5wcAYiHbOMQ/F2laNHNaFNjOG4u4ct5ezgJAXr6R52l235TsMTr85xFE+dxVvx94owfCyqdAe97cO1fcP94TTvcoPgVBW8SjP2UCmTtSHnjx0+v/dJrqw6/vcYzPGxGnQISLhvOiNpWA8gP6BD6WM1GFU2JXD3xIb7zH0yDibxr/3JsuFs178S/PBUa9eotr/mh3t2hGjce64m/qyTTF8e65WSBzKyoe5jy9y3mvGR+negb51NnEsmOm/MwaXU7maHkhS5ifFUXW+Qm0YpsjKNFFnWUEIMjlSOF2NvZ2uVH6ssjRABTjKEp3OuPR6LHm28GMQTycQb0T5yazf/CnqXP92V+PYv94tPLmm2+++uqrzrlms3nlypVms/niiy9eunTp5Zdf/uM//uOvf/3rDwO8VqvVH/zgB7B6r80KF3HOvf766xcvXnzttdcW/YRbX7ly5eWXX+buP/jBD77+9a9bjLharf7xH/+xbnHlypVqtfriiy9Wq9Vvfetb1WrVu/6yLAHiZfliFWWbOsOO1FLHee/pp5+uVqvnz58vl8vpdBpDJwSFq9XqysrKysrKYDBg+hZwLOoWPGLZbSkGCHyDGCIUWuccSamWQgXaCzFtPJkMjo708OPJpNlstvL5aRTBTeYu5JJzzclkwk2RXxRAQwY9Kc+lUqlUKpFg65zjqYbDYSaT0TLM6oVvA7oNYRgij6BMamHN8WPDsYDyLPHZW+yVMgxqIMokGwsO227GdMN2Qyj8ZDLhvRR3dc6hlUFtoAjJCg0tFDHQVCIRPyV6QmlyLwR0oHG5O9fUTe3eXS/l5UeDCqmNRB0FKrp9+/a7774LwVPmGNR2p9NBZUIApbZNjydkOZdG4e3n7JctF8nLIJNqhIBv7YABpIRBEA8vl8urq6skYh8cHMDSJd1pfX397NmzaLOgQ80VBoMBWrfANIVCoVarQZ+kR+3v7yP6QaPItFBvJ4EXdTDS9onb077SD5FkHv3fuooJ3ROgaaP6+Xy+UqmwLSsUChKmsDC6m+X1M150Wc0A4IAQ1a0CsmYMm/wu5QcYjlQaQSard8x9ZeeIEgKC6VwHHDOfz+/t7X300UdMBalUqtVqUQOobdAW4OaqfFkmWrkG8Te9DjOX+iF3Pm1b40e7uae+x8aI3ckMdI8dz3/n8vnjdSGRSKfT+/v71+/dm06n6Etks9lOp7O1tQW9FORdsT10pZ1zQMlUL/MzbWejPjQW2STkCiSTSVqf55SoHFRiIY8Wj7BKPmp6VdpgMJBsOtGs5IxOJas9PZtmXZ1V6vV6MplkDaIDd9rt+1nJUTQaDgeDQVAscnHhYqcTAPXkRDcJq9gggUxN9ZreGUkxRZY/pDA1K8r6VWRkxibBIeTp1fqsLJK/0CoGZk0spNVq7e7uDodD9ChKpVIqlTo6Orp79+6dO3cIGBwcHHA+qVarq6urkL41hbqY/sPnsodh1XEGrLGtP3fOt3GaRVSvePqwmycmEAclrVS0FZBVt190el90gH8YPCiebX2KHE0cTn0gNOzmmbKeAo1pKjshFXrym6p5O08ugjnmCi4LOrHR6EWiGRa9tZiLggpzEdW5tEEX40J6PcG+4/TRUT8pfj7MD+OB7bl42ecVaDxlGD481jkXCD6dC8mYZVNkmezaoriZwYkF0RRNtLOQNah084RH7ALtzdjxgWxXbasv7GIZQlZ32Is3WEdBrzXjvrJeW8eRO88+xJtb4lOcJiirkuyBqnFAPDS2fg+Yn82TucXSBKdMaPHZbC7cvMiw4ZRpyi1wop6baDX3xBHvJy6mLDE34DQ3sOQlhXj/GVfMOAXqjU/Xc+fwRdIZ7mSmRZysIHV4b/Babocow/yJM12lUqlWq8VisVAocADPzwSv2Q1yELCUJtsiHB77/T7Bdcv4YSqAIualekiyjAeG7dHv948mk+zOzmAweKzIzDT2j8jO4ou/Nn2Mm7366qugw1euXLFY8Pe+971XX331xRdffPPNNx8GeP3Wt74FdPvWW2/Z77/44os/+MEPqtXqq6+++kd/9EfvvPOO/vT666/rJ9/+9rd161dfffV73/tetVp98803cagSkB2/hVDmV1999Yc//OFbb721ROGWAPGyfEGLlcHVAqyNwsrKynPPPffCCy+cOXPm7NmzpVJpPB5/9tlnP//5z2/fvu2cW11d3dzcJBcYUA8MBbBGxFslvyPvwF04wkleFhlfDpyQUkkhiaLo8PAQgVpYWhLvGY/HzWazX62CKLGQCFxDCBXhCHR4ta1UZj185Gq1Ku3dQqFw9uzZlZWV/f39nZ0duM/OuXK5PBqNMEcSeRDKMwfyXC63vr6ez+el9stqBzDB2RskiEO73eCKmGw1lSaTSb/fF1QhUh45wsBeR0dH1CfQgA3SAo6ztPN9ZDdghAVBcDQcetBVoVAIZugJgCbsb2VYs9bCXQUQlGSHQEmgChZmfqtjEu/IdchfHgwGBJNv37798ccft9vtmzdv/rN/9s9+93d/d2tr6/bt271eb21tbTwe7+zskMZuN7WSPnj43n4KFeuB9JPTd7EulpLs/T80PVUXI4X+T/8hio58tni1iofbFEtCBQKJvJOAfSquA4pkcRBrSqltmTuZhyuyvPzxLEDsZiIqdibhBZ1zxAy4u4UJ4rYVlkBBL6V/OkO7czPWpz3qyAqP2UP2Wfxcyt227XhTgkBkAEgknX7b6/UODg5AhOnGPLDSEXQ72gKYe24iXlxgznqRz5UHPYUKtyjP8TEYXra94igPD5lPparlMl8IwzCVTg+Hw8NWq1Qsytx8OBw2m01mLepWWs/9fh/OexRFONEDbuqQDyGXWUu9i70+sRDLPbHcduY9xczs4dyTxZQHnURvGEToCJ1yXorjO0RGCY7CxI9PO7lcLr+6WioWs9ksckm8JkFHF3PJ00OSWEP2yVzipAa+zUqxQ55uT7xEvYXKFCCiOURa9hQWJjHxFdZianIz2WIGCytmJpOpVCosqfV6PYqimzdv3rp1i4AlglEotDCCOp2Om2kvqP9/vnrEwcnpWniQvF7jSIdtX08UwuNue4523lCyZ2Y7CcdzmefSh+PSvS5m6bMovdrDo+eGH+aiBnPhJN/06aT+slsgsrEI64k/jzsp77DoOecCXqc7xy5Ciyx3by5qFkOuFlLd4/dys5QvBfjVkebM/DNHpkejbkyn1lwu/tZxgyxPLFuU9rlAkn3aubjt6TGGRTEVby3zqtHDTz0PZK94KtIs7syuVvdfrpscCvia0unERpQ1qOKCTIlzgWkrnGL13+0XFGPQDkdrk5Xsszn1XpaGJYdqs+FtFeIVK7Kk4u5WPMoahwgc1woSl00XJAcngKJTgOVgWgiVqx2P6NO3IvMiB6cLksQR1bmb20WRrUVcVy9wdUo3XrReeCIPkrxz85jap+RkzIVl47Lpc8nIi9DqU2JX8UY8HVZ2JxX2H6iAf4o1q/cw0pRASa9iCrb2siZm49dut9mQc37RpYQLK8lJow86Qq/XA1ZmjFsyh4hcGKSHYdgfDo9areFw6P4ePBI+3/L6668755rNpscUfu211+D/vvrqq2+88cYDhSb+4A/+AJTZQ5OvXLnyjW984wc/+IFz7pvf/KYA4kuXLiFqgZCF/clbb731zW9+8+WXX3755Zer1SpPhbRx/Ps8+WeffYZQxhIgXgLEy/KFBogFmuhgqVhfrVbb2Nio1Wqbm5v4Mg0Gg1u3bl27du3w8LBarRYKhWKxaKmgYu1x3JXRnACCSqUCOCvfIc7bbPtWVlZkTAcl7WhWiFdbwdloBtzIIqnZbJIEHYZhs9nsdrvEJyEYipImMqzdWrGtJA+dtxDizK+ARKXkO5lMyuUyW9Kjo6NSqbS6uqqUajZkQEs8klKqrWimPRkqcArPi8VPpkna3WqzS969oOfRaAQor820iGDasGqPPp1O+0dH0cndRiaTmc7EIoAsJUzBemx1VK1sJXWrJG6raMEKzcXBGvjO0dFRs9lEjTqXywEB7+3tJRKJf/Ev/sUzzzyzvr4+mUw+/fTTWq3W6XQODg7slkunizg89zA8l7kBf2dIlBYvUDVKA9Hbe7mTqd+WmyYrNtCi1dXVjY2NtbW1UqnUbDZxPwOBWl9fx5vu6Ojo5s2bd+/eReAFaV2JNgDPiefIOQekni6ByZs6tgjFVplR5lRIJei0AxtUu0leHK0JxB+YHIjliDdNl2ZglkolPmE0QfxkbHJ9hUnovWCLfF9nFRjBBDZ4ayAqEVG11aP/2zgBnRC6gXzP6L3ooaONu76+Dpg1nU4hrZPfcO/evTt37uRyuWKx6JxrNBrVapV6I9tA6gpcbWNjYzAY7O3tsUNVirTV6hEA7Z0QPOE2dT8PQxcV0fOAfgx8zcuL9IBL+i3jt1YsliuVBPfF2yeTKRYK5XIZLq1ieFTIeDze29ujfzJDAjImk8m1tTVJnwtukwGdZgNF+MA6RTyBb8Jc1Ol0ZJdqZekUDGCkCPiWvD49Ci9E7EMlX2MPYx7kp/ohCYZZlDBno9HIZrP22Fkul6uNBh6nOzs77XYbcPzs2bMoHevLsrwXexrpBi3E9rTpYSUWGddBnYDoYKbOr9gJLGxCNZJnsVoWOjhJD1p63ByurJHdYDCoVqssjnKdzWQy1Wq1Xq9Xq1XagkXBOYee/tbWlo0H24nr8wKIj6VawzA0AKunBXxK6rSgZHvaj3/Hck49UFLD00MY5yYde480F+DT6uYx/hZheXOzquOaD4sioxYgVpaP4oVxn6L4lecm2ttJzFaR9Yb1UJtFqGU8+dq+lGZdO/fGXemsZ6w1BnRGR8vD9D14xX7fo7UKQ3RGuFNJNhPgP2uw/DAA8Xg8cS5cAI7HmdRe8oE7mfzkwYt20lvUrxaZifkMOhP1iTeN1fGwiC3bCeHF1n5TWKr+wTODBB0eHuIvwixqPQzEq2BBF9iUyWQ4FKitpZZmCbNxjWM7xu2mXT1Nr6nQnbVIVRMoy95+bnuLGM0UGQ6rjeyEKXSYVxYE7Pmg6rG1JirU6snR8HjkJpIeJKvSRfGzE9D5Azvzo5A25vJY4x8uyu04PYI1Nwshrltyim+np5MT//yB8bPTd2inQNhet1ykfTR32o87zp2yRsylNSRMyunDcBTi/Hc7yStJkV4HOYbwvwBi9u0K7biTtrEME7aLSpwShUXYMZOM/qo1jp8zSwxHo4Rx0/3ClpdffvnSpUtgsnEdie9+97sIRLz66qtzFYTtdTjX/NEf/VH8r++8846Vm7CAsnPujTfeiP9EH166dAmVCdBhnsr7crPZfOutt771rW9xC0tSXpYlQLwsXyyAOD7RM/mmUqlSqTSZTG7cuFEsFldXV2EK37x5c29vD84UuCf0PS1CzPWkrjujpcApFOc3bTKy2ayb5YWJrAoUm8/nE4lEt9vlIDoajdrtdrHXs49Ktm8qnWbqZy/IMtNoNHCQY2cmMpo4y3yZHfzR0ZE0GYBlC4XCysoKEJKOE1DJ2LShdyw2GTkydv3Wsqr9hOy84o40VjBBig3gI6JwApN5wWRwFoVJtXAKv1NFsb1ms9jpdHrD4eTkipjJZIIZ1MiiK5EE7Z55HtQ2ECgQ8usdzu1pE4xGzOher9dut5vNJvFbfsLOuN1u7+3tsbWFil6pVACO5+aR2T30A7u6Tkqn+xrbd/EOVN4xzOYyezRPWxXcLpPJ1Go1HB273S66ELDLCacPBoMbN250Op1PP/30008/pX7IokJWIpPJrK2tAU6J0SYzNN5O7SWhZ9kJCp7Tr2hikCOGBsNEpwKu4GYEXikdY/zonCM/QIclOU9KulShI2dkeSVEA1qnDAP5iaFQIZcJQe0KCDG9CHlkn6fse+9MxXVGoxEMeuYHpi/LIGaXiZTqz3/+8+Fw+OUvf3ltbQ0rzlKpRG4+UaswDBuNBvonn3zyya1bt0CQ44QOdXtPVdketDyjJA8j1k8+r2nfOwV5Wf9QhpPJpIsx0Zh/IP6TJCgtEWZOnep5BeZzUVnVo7SDF5Q5GAza7TYTwn2XvDBkJRLQ72baNVSLME16oIdQ6MAPhI29NbrJWJRoeHKKcPME+/ghHUw2m9PJJJvNBkYBGbI9/Ye8RV5BEU2LwcFV51L0ZBANy9b05hYhU1pPLe4JTMwKKxV7e5IUAsLz0Exugeu6hV3EtRkMBsViERNUNDGoRoI06XQaxnEqlapUKoeHh9KmiEdE3Oeb5y6PrJPvq/yGU47Ei9SK4wjR3PiKZyew6LQ/lzR3iivRA4GG08U6T+epLfqaPdJbtNRT4z3lpnON6ebWwGMAKItSLuI2nnZaW5R9fwrk+pDTrGXYaTvnpeLdv37M9e5hpujpdEqK8iInq7lRB29XoxnDmzfU0HF0eFG7LBJX8SwZF6FOFq9km8HOEJTT7pfSsyJclV0NIjbtdpvgk+gI1iBB4TebfsFWX3tIu8hqptUjeck0LmZNrF5np2tNdJZubAFigd0eImkZxCIRx+UmLAov2Xomcy9AJWsETfvcWsEML75oJcVA69jVW93Y+CMpryt4CJG34FSy6sPvWB7vhx6s+ZCaLYuyJQR0zu3qDz/ZnjKFziVcxwXxvZp5VIL23JUiLtBhMwu92cnGh6w+id1Jyt1HxCOdGa3ElrTFtM9kr9JqtbBhxw1FkhE6xUihzjupea7ROgtrXHAgPd7zDwbhYDD5VQCI+cf3v//9+F/ffvtt/vF7v/d7p18H5QfnXNxWjgJADBhNwZjuypUrc/Hcd955x/tcz6CnsuX73/8+fOQlQLwEiJfli1vmpoAxcaMoGkXR3bt319fX2Yt0Op0PP/wQCA/9IJ3DtT0iCg3ziMwvjsT8ldxbwU/SdgAhAn0AhgCK7fV6YEm9Xq/b6UwMCyNybjQeN5vN9Mxfrl6vkz4MPxFGrfLBOTGyrYQBZ02uLV4MBLaxsaG7SxJXWausYTyqlj0XMwHnJ7yvYPR4JqAH4RH55JosbCBZEva1aD4oidBhC+mCrIkChvqSMGVv+57P59PFIlQLOBp8X00MXAsjWw8myE8bR1EYhEQIpmd57na7CIBoC0uqvnNuZ2fn008//Y3f+A1w5GQyWavVSD7y9mSWlvKQvT1uE69+aIXhvIOW589uqVVWZVKXtcnv1q4B5zeQlFar1Wq1tIMBV93d3SX6sr29ffv27d3dXXK6GYyNRiOfz6+tra2urhaLRRBYMWuEELHFn3tQVM8h8EA3Bn0GgFOYRAmSNnQhDS86v/V4tCdPYcHciEGtPZ9iJDrX6eABCEX2GROIaPhuZmQvOkyxWMxms9AHFFPhXmxGhflSvTCP9vf3+TK7w3w+L/NJQYqQl2/dunV0dFSpVF544YVGo3HmzJm1tTXenbpKp9OQvlut1nA4PDg4gMLpyc9Z83R7KrPSHFa2Ow7aek5fj0299E5Kc221hQrRDewkQ1sjKAGlt9FoIDWgjT4dwEKiVnHIagcrLwR0mPQRzTaqJfohXZ1JW9LbltmkitXMo9bkLRgXiMvDU+YLcPbt+jUXpkG3DvSB3sK5QgmJ05m15nQy6Xa7LILEID2yodY4yVtbzRMP8VGqin0XyXF4qiNWw8FzYFeYx1LM1O5KamatRPGftlAw1a4CjCDpivAKmUxGWD9RHMI8rCa2t5+OyT72PmYueBcPKD4GQPlAWGHuuf2B9lafS2j/Ic/8D4O9LtoWfu6P+njTV1xKda6X4EPWzFwhBfcg2nX8LaJTO97xNc1+9ZHKdDqNZvn7czUuFk3yi7RK44j5AztVnMwYz9aP3zdejRamEVpqpyBtHticCCNWhFib2G63y9bUEyO2GTBa0C1hmcnKGV0LzUhW/8GqAC2Sn7bC5XG2u9dRLdnWJlJ4sK+4w4KJVb360K539t3lhGE545Yi4BEstLvwIPuMKVpkLeJm973Hr7Zg6TwBMiYSwTwFtoefOuYKPsy19IxP2p7OzKJbx7WMTwdw46N17p/iHidx8R9vJ+PmCTvMdTV3i3M44o6RczPP4lG3ePhn7qptkwMUYLDIr6RLyDNTmingLPQv+jbZAN6QZD+PKS4BoeFMFFF+186w6UXCEOXLEqfs3YVWj8fjdrvd7/c7/f7w4ODI+Bt9McsLL7wgQHbuF9555x2kHk6/TrPZ5AqLlCjkLMd/VqtVwGILTHOXRU/CFU55zofEspdlCRAvyxcCKRYEyX8WCoVyucw8rmPe7u7uZ599BoYLqoVJFBxG9nMAxF4iPFxI7b0wibLhRxAEgCE2iMg78GDAZPV6Hft1u6RPZ4FxEsOFk2rBY6OprFhehwQW0OpcLletVlEizmazbIyEbMqTXYdzkCwYiFzZ2w66k5oDynyxSgV41tlwqN0ug/2R7x8/72nPIfljPRuHc5H44PTpqTj8QxQt5fNJQatBEIZhoVgc5nJidggHgdOBFdXKykqlUgEjk1gHAIoUQr3MaMtmJWYLZnfmzBnwI9AEGujevXvXrl0DGgZ7KhaLAMTeadBmLT3SCXPu0de2zil6jovyvxbJLNr/F6QFPCTXBfEfO53OvXv3dnd32Q+hoqXuB/KrXsfux80EtfUYtJR9EdF+hSsJVbfBf/FxPOMmfiUxYsRepN5gu6KtOsVOpGQqZzBPBFA/JJ4kURTvypqdxIXMZDIoBfO5CJgSfpW8CVNTFEXUp5B6do0EsbzUtn6/j4UgDOtSqVQsFuEO6zCA1EAymaxUKlbWVgdFj1Tlbe7nyhYvgnW8Hvh4kzx1bueceFen/qGou9n5qt/vj3I5xGcvXLiwtrbGbCBtd8UP0A6yIQEJRMI1ZgYQHAytG8NAurpStrWzl5Eg8zarg065UpZQnECnZQ1GcO1ardZqtdrt9uHhYafT2d/fz2aztVrt3LlzOENaaNWdtGdRMiM+n71uN99q3aecRFG/3+9sbY2GQ+ecZJfli+hmZGSmzf39/WazyVvweKurq5LmsPM87w7h3QYPJGSkVlNEVmrjIpqJ2uOMjIl8KQUN83YQdhgOYDEEBmg+Lk6IJZ/PDwYDEh34pNfrbW1t0fMrlcp0Or19+zYDygvLfc4AcQwX8MK0c2mSD3yGUwQuPVzsYfKCT1GGiQu/PIzT16L0f4+Z+DDTgoeQLkJeFl0trrobd9r0rrCIIu3tc7yAlkevmytOasGvucw7WzNeGMwt1tw8pR4WWfydCOGEYfgYHT6K3MntxCIcXFluVlvDQpZzdZy99eWUnPq5d9S208O25uJ6Vh5XwhFSe1DWCFr22CyLWCAFUmWOk3Kh2JXHZ/ScIa2OhCUEyGXB6vZ6OmZ2IbAQbXw28/qS90hxaE+oqz0UWCVi/Xw4HMoFZG44xEK3HpndM6iIu4pZV2pWbWtVbYeMt8d7yFAf2oDByQGySH43rs/uThX29SacuXt7L0dq7rYnHpeNy2ovGvtz5XpPUWafCyJ7HFgXk2Be1NO8m9oIx1wyQRxKXuRb6FmCW5jYDgc2acob1p6EExzJkVAKRGOXn4RzTumGUhXXpo5EJQwtdN4UjcOC0d5rWpM69vk615P6BmVkb29va2trb2+v0++POp3B0dEXXIMYXYi4uIRFfh/mOm+99dYp4r+vvvoqNxKMK8YxzOLXX39dChLOuStXrnz3u9/1Lvgwjyr5vmVZAsTL8kUs1oBFOyQyuc6cOcP5uVwur66ukueFc71VVEBgF1wAnFfJ4MlkcmVlpVgsAiDC2yoUCsPhcHt7mxT7VqtFEooIjNlslouzkPBb7rLSaBSLxcCsuPlcbqXROJqZeknndzweHx4edrvdbDa7srLCLrDb7Ypp2+12Odkmk8mnnnpqdXV1dXVV2ETcW8bG0jmHQ0IU4RrlU4sIuJl+pSUse5FtNr6eJ7KyqpX7bHmyYj2zoeSO2luAFSpA2ul0WJj5Led/flUqFhPJpO0JyUQiXSxSh6ymctVDHmFlZQXsQ5idUrb7/T7wjZdI6Fk5S6CgVCohVUkyslVd5JyQSCRAoqvVKuoK3k5OW/BHlY6KM38XaWKKdqGjl55z7t7Rezy7HYRzRyMClXY6nVKphHZBuVwmnWpvb6/ZbNoznnBV/pN4OzUpZQ+OWyR68y48oSi0VkEPOF4QKpgvoB7QqiIEgKd2X0hYSFR6NmqKx1imIfEeYVV0Bh5PXAPOe+wjB4MBv7JiuOLOSNhEHBkGCNiZqpoP+TKdkz2iDPRyuVy73SZqwqa2VCohX8iZU0dHWNUHBwfXr18vlUrD4RDTrVarBa/BOcf1qU/RP21kSDm8YGr2AODBGRrdguztccKewH+ZDH3NGwQSPL9BBQOO7zjrhJPJpNvt5s6evbyy8sQTTzz99NPr6+uCg/v9/ng8LpfLIJhMDjpyF4tFOL92RlWIjkMvkQmeTbq3kkoga8HiBdyI07Ik19GmQPJIw9Y7R1UqFUWwksnklStXrly5srm5+d/9d//dU089ZXPq9ai8SL1eD8OQRj88PPzoo48Om83SvXtPz/xIyYrY7ffHo9H6+vra2hoEW4s4czhJJpO7u7u7u7tAqARastksoU1WFh3aGewsi0QBVYFqR53lstks5yiinhqGCAoHQVCtVuFQK4goUIlIJBR7GPESJgYvXltb29jY4NwFFsz8sL29/cEHH3z22We9Xo8sn62tLbJM1tfX2T/YlUvj4uEDew+ez+cBvnQPQTN2uvYSwL11wa4m2h1ZUSyPsSVxQ3uReKqKB7LE4WwPWYjTvk7xPoqLLNlMl7lfmAvFamX05JjjhnVzeW12BnNGpdRLobC57dbIK46VxHuIZYZqLfAUnK1yiDvpOmATO+IJSV4DLRIbnXtNi6NpR3F/DxCGoYm5PvxGJd4ZPDDd4+eqBuw6sohecAq4+cCIpv4UF/j2UHvrZubBsjbCJ2Ne5jrAJmKBIlhopy1A2WbdaVMn/RztGTz3SMuZ1U47LhFm31crVHwJ9jqzMt+V+SEYXTeib0gFVZtMvZTXqZAkUsBbMK54kXZG8uY3ywNVzdh2tNldaiAlmijz0kZebc0rkLyoE4c2HL3Y7ixeq/Ep1J1UTYnzMOL8XG+HE1fFtROU+r9dCOKY79wo11yHz7lHg0URpgcSoucabNpQhOXlWGtoT8veW1xsCpE20l5qplhHVnKEsQYhjGwhK0sCOlypVOr1OgAxGo8kASAdyZEBVa52u61Vm9O0Te+ztSo3IDhqi0KedGyYAYS3E4lEqVRaW1vLZrMImmHZgtxi8IWHayDtLtKFcM799Kc/RQvisaUbXn755TfffJN/S1lYSG61Wv3JT37iAbsvvvji9773vX/5L//lN77xDfucPM+iG125cuVhyM7LsgSIl+U/W7EaPVrekslkqVSqVqsAKJubm7Va7ejoaGdn59q1a2EYrq6ugnYhkCrSMeApdDDWiaOjI5h3OqWAPnsGo6xtwEaa+knG16FOdKdolrUXkD6WTmeyWQ7DEAPZn+VyOQyFarUaS0utVtPuZzKZFItFqNCNRoMndCf9XnX80HIrcy27XmrPqv/Ugg3qzYcezqtEbMVU7U7XftNylOy+X2c5bWg8EoFzDnRYcsClUonK1xHadoZUOu1mTYmUZDab5TkhUcKgbLfbg8FAliAoV0jmIp/Pi+4qyja4jOLGKJPQ5fjP9fX1vb29drvtnLt58+Zf/MVf1Gq1wWCQz+fRyY2Tf+PWMQ/s6os+9A7t8bO6RXutA6H2Lvqrjd4LOwC6Ip+d9gIJeuKJJy5fvsze5fbt21evXr19+3a/3ydfW+mQwLLQ+eneEmyRMrUY/fEQglXklMiv1L4EGNFkSDe4megw447YD7+CnuycwwJLrB96ux4Y4iegs04m1JvuzjgVmsxpUCwhhlW/3+cxgAvjLhYAlIoPAQ5as0QdGhHXw16P90Vng7fj++DUdOMoim7fvv2Xf/mXW1tbly5dunDhQqlU2tnZuXXrFq50nU6nUCgw1ZRKJRiUHOFczOJGo5W39npgvNt4dBthxI8klPnAAIndeau70kmyuVxg4ii5XC5VKBAmZBQruKUDBlUnQQYmZI/lpJxfeywRH5aOqo7BjZSSQoBBpxSF69wsA0CNDlQdP4DpXtlsdnNzE7hzb2/v/PnzVsXbMuiJehYKBR6G4Un3u69B7FwqlaqWStF0KkA8zvQhwtpsNmE0SxFY0S+lWRC8QciY0eRmWtsaUJ6sBJ2KNRS0RauGxUcYztagVd2PSUnLk/JRgGyUzsL4FUaTzWbz+Tx3ZNbiVHbnzp2tra39/X2bzWOVuD9Hn7rjY7mZwC3XL56K66WBe4dwS0E9iWw8wIbexfSj4uSyRfyy0/MDLLs/jg4vWtQWUfZsDVgw0QYRtevwPLsWPVt8gbbB9ThN2NNVjy+dc1/KVq99C0+8WxtaO50uwmjiEsxz3Q48ONVDZuMX9O4eJhLBowDEAXCPc2Es+BEPh8TZwQJ55VcWJ2XHM8dP1zM9Xc3Z6qFb3N8D0+OotJzZaFDliEgbwS6gngOhZn4rEyRPKm054rrY2i1YUuQiUI9VxqqazjUU1diRWISN+JKHIbB4PCvsmixCZ21plaUnoqUS9ZiH2fJZ6Yz4K1s1NqWSuJO2jdZYL5pXPJ7H/b40mUym0+iBgQ7TpU432zz9SnMpxqcM3tMvYkeBm+n4zc3fWjTnn+JWNzfYYKeOeBqEm5cO4i0ZXujLE8R3Cyz75n7oaVUpfVD7f+seKad3u1dh68vBRDJW9tgiQ2nZhMALxkNeu+5Op9PtdgUQs/cQYUtTgfYwkIJ15PE6uQYOp8t6vc6xFOZHo9HgRQCvOdFdmEzK7bY7OPiCk4j//kq1Wn399deRBnbOvfbaa5KYEIP49WgnvgsAAQAASURBVNdfr1ar77zzzne/+90rV65Uq9UXX3zx9ddfv3Tp0iuvvPLmm29++9vfXqJqS4B4Wf7PU+TAa8VGYQDVarVqtbq2tlYul69fv/43f/M37777LmRSAFxwXjAa4GC2O+SIRVG0u7tLLjarCCnh7XYbHl8YhqVSCV4SALH2gmwThR8BH3BeDczWsFQshpVKsVRCBIN0EqsarOuIM6W1eWNjg/dlJfPcIeSPYY+ywryskZfIXBYgjqKo1Wrt7++TW434srwyIN4CnsKVsLCvza/3tEqlTaEgP1Q7oecWPeEVLBywuro6nU5hQSYLhXQ6ff/QEgTJRGIahvQH0DRr785if3h4uLW1RQ6yM8okwr+UOlSr1Zxz3W6XFhSsqQZVcnq5XH7iiSd2dnYAK69evfrv//2/f+qpp5555plGo3Hz5s1ms6mtm8dGfCSpRFurOkPqZGI3Xtpwx30bPM7CXFseXYE9UyqVqlar9XqdCkE+olgsnj9//sKFC0BU77///scff3xwcCAYURsjwOVKpUKUXiZdc49qdAzhwvQQoTmQ0yHMiimgnqO8LUaBXOMYOAwlCc4yNuUSpgR2OaKQFEYvEpdZGIROXNZEm8wDZgn9m/GLZC1Xk1QF6KGVlJHXpeRlELMWiEyLwG5Ag7jb7UIittAtp7vd3d12u3337t10Ov3000/XajXS6u/cudPtdlutljjR9Xq9UqmwqZV8h3c+EmPFKs8s8ouzOI530jiFafJAEM2eHq1UpRV3E3X9+DGcC4Mgn89PCgX45kIkiXyIGi+tGIJ/AjHlDgqY7om/iwnI9EjnROCeuAhaFkRB7ASug7207OVQtIhXohNRoVB4/vnnn376afS+wzB89tlnkbKJH/k4CCkJ4Ctf+Uqn3T5382Y6leJhMplMo14PNzeDmASnymg0ajab+/v77XYbX0qZ9VkBd15KY5aUGl6HUaBh64E+LJEK4zEDQIQXemJtEm0aKZEYGkhedlRstVpFX0Jkf/Rter0esxCnLDS+Dw8P7927d+nSpc3NTZY8tKHU3HF7t88JGw5IZLakqkXmpTYXZO7ZXjhOPPvYktQsHLZI2sLT/TxlKfEm8zhCN1dOwWP+eo/qoRiL4GnPVdVzyPRWurlmbh5RcS5qfIooxFzYca5uxlx41DalB+XoXWy43UNe4nDM6YrVnieYRxifzwJ+9I4OhBlEkZvXPbyWjaNOi0LgcdORUyRNrRqvW2CRNxcdVoUIm/bcq+JzskjrkjhQwpBdQC1Qy8pi5zSdCyyu5OV7zcW7Pe3XOEBsI7s27OHZ9Fm825I3BRnrP4UO2zC23RhYh+SJKd4LSrBLiXfehG9Dy4qsx5nFqnNtX3VqcEZw1tJsjyfYZDJx0s7kgbP1w6DDD5wB5g5bz5oyTijRtsqSaay+v6ci4j2kF8xbNHvHe8XcGpgb6Xn46ciTzrA2FW4eBdvO4ZoWrKRJHLNWDE8ZeNp7s4fhYCLzHgmhqAVREiMSD70AvvDh4WG73ZaMuBzRdXd2dF64SAs0YWmlFygUp54sT3W8lKSprSRIaHBnzpxpNBrZYvH8eNy4eTO4ceMR5+mMc6FzkXMp546cyzp35FzoXMK5kXMZ5wbOpZyLnJvOvpNxbuwck9LIucTs3/85y6uvvgrO65xrNpuvvfbaXHO5arX61ltvvfbaa5YI/Pbbb//kJz+5dOnSt771re9+97uLdI2XZQkQL8uvHjosbEX7mFKpVK/X19bW1tbWGo1GrVZLp9O3b9/+m7/5m2vXrkVRVCqVoOWOx+P9/f3BYMA5ViwnzfUcO7vdLpnCzWZzZ2dHWxYOuuxFROjjcMvkToxR+1QxSSnpdPrs2bOTJ58EILYEMWXK24REe07ztvXaEGuFE/fTLrGySlOUEmKj9mTaDQyHwzt37ty7dy+dTtfrdSQFYK5xZTQ3nHNA51hmkbuhMyc1Y/lW+n9tEBX41bFWeyAQE/EuJRHA2T5ZLJbL5fsvyBZqJkPmjGKpeG2dTgcLtcFgAKgtWzBl84HysEIDJfA1QgKenRQIZqFQeOqpp7a2tgaDARcfjUb5fP78+fN37tz58MMP0QYBZrKorjtVO29umctcE14cB+MscGwFSS14pBQ88bjVEJlMplgsotx6/vx5RCR4nSeeeOLixYvVarXb7W5tbb333nu7u7tUI7VaLpcJVKBBQdAbVNQ7nKg2NI4k4EA0AgVwqj2ZTBLUmUwmSuSUwKucqcDppF/Bq0kyws3yN5UCxtgUvEXSqNjW/BXkDv8uN0u653wCFR3Kuej5biagoZsynygFXtKoHLe63S6dx81kZ0lZAFnrdDrD4bBUKtHD0VinvbiswCx+BW1ze3u70+n8xm/8Bpx6lGru3bt369atZrOJkE46nd7Y2KBKGVyy4LNqg0xlHrQR96v08BELLv8yifmiTdnDp2UaKjqVzWZHM/oGfxpPJul02uVydD+25tPplI27lasD9EQFolAokD4igjlsEc0AtCBzNT0wm83SuOjW6UBrQRmlXGiKFstMEi5xPEinZSBsMF8mruvXr/+H//Afrl+/fubMmUuXLq2vr0sdWM3E6hZFUblcXltbm4zH6ffe42thGJaKxeLaWmJtzc3TNqVjo2rd7XaVZuFOSp/bs6JUOKynnAARNIsYrR6gCbPGHtL4MqNPGTk6rXEFhJXpzDIypR2BmNGMLpVK5OjQwxXgpOHa7fatW7fgAW1ubl6+fDmVSl2/ft1OnjrjuV9OTftE67ByhWFg8JS4EqungRCXRY7D1nH6VdyoSn3P0yiw9Ni5h3kPqbRaTHPRBItEe/CTzXOai0R72IeLCVxa7IAuZwnIHqXaJjMtwrgXcXVtYMNSQU93CLAToKcpYTFED5extWRDApaqbD/xIk+nAL5x/7e55FzNq1EQRI+e9pFMJILpNDyZibIIKvLgKo9D+kDHQg9o9sDlU2I5nux+/Dk9FYi5NEy7LbTMDK81CRJL5p7oLP+2T64hadcOL7yqFVk83zj8Z0nr1qItrohtY1FzIzEKXQtEZv60ALEN0ti39nQnRAQWki5YUBZ/UluWKbcldQKr2RQZa1LHwsTjzW0mSziIoihIJMLhMDo9Yh1FUUyOfG5kaC7593RvxkU4stctvaFq51urxOJhxF5EYREp2MUo+S6mWhOPoj2QzhIPBLp5Ijx2VoyrkFt8fO4cEm8XCXNrmFinR0ZWuVyu1+uNRqNer7Mt0di05jQc/50xPyAazY6ChoAHIG6TZ1bpyWF7y7RM4wUQqyeTesW5SYsmW1CULpxza2tr6XS6XK9vDgaVSsWFoTPpfQ+3+8g6FzmXdC50LsVJ2rnQuaRzSecC5xLORc5FziWcC5xLzT53s189bEEC+BTpXmQb3WL3uXh58cUX33zzTUk9vP3226+99toi7eBmsxnnCDebzTfeeON73/uec+6VV175wz/8Q91dzzMXa36k51yWJUC8LP8ZinbP4IkcsBuNBp9I2FSypFAgq9UqxNh2u310dFStVjnQMhEjN6yMVE3uLBhCV8F60uk0vCfYK3bRAsnCzuuYDmk2IslksrGy4tbXlYQulhOnX72O5wI3VyKKD5UpY9dRT0WRVVN3lHcWuzG9mlbKXq+XTqeBrvC4B1lg6d3b2zs4OAA1owK1KAo7E0HAc39mpRQ+aLeJoGZg0FQI4hgrKyvHX04k0tns/UU3DDOZzHCWcYzwGW9Hqjh+RK1WC+M4JC8t2isWm1Q+yE2Ooujw8NALZdMu2prn8/m1tbXt7e1ms9loNF566aXf+I3fWF1dvX79ujAImR1ZHydPNfJhADJ7lrYcYUulFOZid9LKQ/SUEO27u5l2B9h9KpUql8vr6+tnzpxZWVlpNpuHh4cQJJFtDcPw6Ohof38fdFJ7fe3+M5kM8gWCa7XXtJZczoiWSKcVSqCGm/ZVOufgwKa9FMxBBqkY37mZbyHMXDfziLBe5EBgEoS1ER07QDz+ILEES5BptVqMAvmYQx8GUwuCAOEwWPlKGuCUyIbP7sVVPwzMfr8/Go1QQ5NVHZUD2R88XYrYyl0VCgNbmbyKra2tTqcDjgyaWa/Xm81mGIZo7NAH6BICvhd5WKsfetNOXEd1brL5o872EmRwJ+XtOHYmk8nRTOWD34wRiJ+pVMPttdIljHQCbLiJEntgLYA4DAuVdEK+TBEHmcAGoTLIvBZVtMPK6rdY9SH+Hc+z1uqjcCOzMV/e3Nw8ODj4m7/5m1Kp9Nu//dvZbHZ1dfUUCnYul3OTSZDJ4B/lwMeTSTdvcZlOp3t7e3t7e0zs6KozNiXvPnc9Om6I2aKmppEBCyNdkV0MHu1ZV7FDqWeAEVvNCuk+sXIxzxBrmUwmqPUpHim/U6ZuaP6ac9Lp9OHh4WeffZZOp3/7t3/7N3/zN8vl8o9//OM4L4kVbfIovLPTujTjKJZi7J3DPQjVgw/iabxxuGERa3IuA26uX5kHUMaBDyv7uAiJi6MDHoPM44TGO6Rlenqq0N6MdApFznsemw1gQwKn8PgWQcDqJPHX9/AXvU6c/RpXNohjdnHHLWdkpk/fSMSx1HifuZ9k5pw7yQV+8HbFudC4e3lUR88Rbm7oIh4FfAyCZ1xeYBEkPdcHz1I1hdvGK18bMJvY7rWmbEK1L03NEjhsQMhCZlZiwnMIUJIWzW031Xah1FoTxWD6uUNAlWA3jdYyVM0hnWJrPWdHpf7qsTRsbNXK3IlSbYnAHm5ulYst4ZpTD/+vu8sbwOtRAoiP/3p0lIxByYt61SKE1xsycRrv6Soobo6OhR/RiecdzsWm4+H5uWM8jq7G+4YNvcelwOde/5TBOFeb3s3L1XDzdJPs7s7mqmZmxRL84QLDmaAbWI6IYhj29cUsFv2LoLiSUK2mokSEiViwmWdLKXdimzFmSTAMn6NZUT/UUNURhpe1M4AiHNpsc8o47u3T6WPpS4hMkDD/L4QtcSrslpohxY8AEEvwYS7a+0gA8be+9S0pDr/zzjtvvPHGXOXid9555/XXX+cfc7Hjt99+G4D4937v9yxA/MBHXQLES4B4Wb7QJX7CEflOexFLihHqJDjY7kRtArtC086k+9lVkMkd0hNHI2tuZp0cjifgMJyaYwOPFxkpXklD6IChrGoPLPBykexx0WMceAKa8Y2I1ZqQ0iJcS4icQFdxXTxuxJbXrqxeshuroKyE7EJuUT/vme2SKaqdmsM5N5mhP3P3Ot6eHuweCRF7fW2J4vQQbV49fw/BhdbEyVIFIffRJST6LHEDT1Xtsd26HvJrc3N1T0EB7M+liy3WhmikaLAIulUsQRZhwmLk9231T5wR93AzPrs2/bbR40fluTmhtkVsgqQETDx4d64dn3ZvziRr285syX3xjML4bphnE5wUP7p71iL2XGEZ95aV4HE2GaTajMYJYlQL+LIUVCCfEgZTuAjXOxR4F/mxzKV9nd4/Py+d1lMsYtzJzINcLpfPZoW0RlE0NfUpSQSvlpTuh/4vhmwe74kuYfuAImHarENhnksBPoXKJ22EOIQRZwDZ/g++X6vVkA25d+/e3bt3ZW9i4eZFGMopFU7mBHJ71lMoPsnrPH/6vTTMNanOPRbaBFKP9yQNSkEqVmFTgAtBDlRxNGNrOdC8IcNJGo6wogJ49vDmDJv+FBeyxwOIp1EUzE538VXMS62N274tGnde6zhjT2rP5JqH47kpc+EML+s/Dn26kxJG8bVmUeqxV9Xe/3sruxLVrWSzQK65rz/Xxcv7sqIRcYjWQ43jAsdxbCWuWTEXIT2lEtwClc94fbpTdSfiELld/uJrov3mcfU+6rY8DIOZopoNb9vFzjaNrVW72/S6ytzAyenInefEqGC5N7fMDR7EmZXxESGgdtF4lHUV6DC39sToPTa6FS/2snmEcnrmz97OP04c9vR54nEXT3zGE/u2MhSeop3XcM7YS1rHLTqAGCR6HuU1KmyvD3V9yzvWLogdJhe0aSVAhEQQbYqkh7CD3J8e6gtmAvGnSMfMVeO1M+QiXv9c+NW74CLOrG3o+AzpxVTm7n7ju5E4W/kU4fhTbDDjezMvIWCRb96iz3UYUX5VKpUqFotsfojHi3je6/UODg729/dhrqgrwr3l5G7TQUgp4yAvV0PIE3Kwl1+LxYjxKi+VSoDFonWLwsx22uYNSPuu3W6TMmiz6yTbomNRPFTpZmx6qAmZTCZ5cNBpt88dHja+2ALEglMvXbo0F1pFI+IhUdfvfe97r776Kt9/44033nrrrQf+ZJHpnFBjsZvBsnmeRc+5BIiXAPGy/Aqgw5q15SJVrVaRHOKcf3h4iPd6s9nENgp7euh+khkFKFEOO6Qw7VOVdg0lkM+VUc66wmkTRyAc5IrFIojzZDI5iqLJyVywyWQyNTJbFh1WGrLeVLqKIk3rvjb8aDUotCsCFpHAK9bwLIHgmDwhixyhVyoWb1aYd8gyHB0dQezlgQlgOmO9KmUJ+Hd7e3s43WEIADhlAVZIlHaPy8YOwqkAHQ7wIuEOgyA7HgeKYBo1YV5ZAhHY0LVaLV6ZC/Z6PcGXHAuRGUFPQH50Wq2lFsdOxRl5E2HEbG37/f7169c3NzeRvyQUXKlUYGHHd5MPj9fYtNO4Q70HASjarJ2iB2pL1cFGsHWFMAwrlcrGxsbZs2cbjQZ6KcPhMAiClZWVZ5555sKFC4pds/vhH9qMateFTIT1UiOcQDI+SJbagq5I9+bLEL3B7wQEi0JbKpUQOQWCZ6wxKqfTabfb5T95Elk9JJNJ6P/oBevARnPLbQbNsiiKkCmXGIWUOiytACswEWo0Hnkd7OPoltIwYbAo+dQagtNvuRF86kwmo8AVd+x0OjxnsVhcW1tDGZz+wBAjyz4Mw9u3b//iF79wzhWLxWKxeOnSJRjf2CpC3kRK++DgYDwet1ottZelBWn7Kz1BTwI4jlZ4oSDbFR91tveUKG2SqbL/SqXSxsbGuY2NtdnQ1kw1mUzQCNrY2JBqMwNfia5aDoh7kW0gIWzB8bw+mrn0EAVOaFnmEGlGe9gcP9Ffdcz20vD1Kz0b+rxMQcLI6J9BEBwcHOzs7PzlX/5lpVJhkK6urrICeqIuwamRJ/ptv9/f3t7+5JNPeE3rnUKzyrrTAgHeedK6FXlsHQVBWZVYBcSqVsalJeAIZZAyks5Umqjpzzs7O+12u1QqFYtFtS+DReL+xWIxiqJGo9HpdJxzsn+sVCr5fP7g4GBvb6/ZbMa1gB9p3n7Y0MfMhdwe773cYTtvW9DHu5KHUHjAgXdni4DHAYi5PFkha1a6wc1zH7JXs+izp4Y8l1YWr2prbGj7hr1gPNfexdQ5PPDCZrHE7eAs91ARC0/C1cXsBLRj9OrHOtR5cLyXW+2RVd086YA4ifUUJ9u4gqfVNBPB0zOluL+RmE6jRxSOR7zYnVT/WMRt93qvl0nwMPc6HXJ6mED7A4HmB55BTh/i1s5O06C2kXOvGefXO6NRroC9RcBtb7dGxGJmLDKonCueY9/LDnwPIHYxKYD4yGIDb73mrLEkm3BFwcUqkItsnA0g3FmhWatgI6lApeno1GYf3s2zlJwPcy6QL58bm/FqZq44gxcU8cjpdvJZ9FBzLfgsnSje0HOTt+Ksi/iQ9AJvXoTsgeStRcQU9ZO5Q9g72rAn56bZbLZarZ49e1YnFO2o9/f379y5A1LMvl02iaQucShgA49uG14RCNZJZRtLCeziNY7odfl8fmVWQBvi8lNRFGFnd3h4yEmEdxkMBigWdjqdfr+vqCQ6db1ej4Oq3YxJyEW8aRy5j72Co2iv1Xqh2Yy+2ACx8NmXX345jucKkJ3LAvbKq6++Cjr8zjvvfOMb31ikKUHRBV944YW5X7C4MP+4cuXKpVmJo8BStPjhD3+4ROGWAPGyfHGLt0VOJpPFYpE1o9Fo5PN559z29vYHH3zw6aef7u3tIRnJxoIZlkRXBbQJBjJxw52EYZTJZMrlMtii1n6WHy0b5XJZmrz9fj+bza6vr6dSKRQSe53OaDiMbxylh4icKP/PSobELTksoG9SnACwZjFrt9utVgtpJC3boLHsn4B9WZZAYAHBkdpAOyKRSKyvr5fL5cFggBSjDLJAUvL5PIvu9vY2add8XxH7Xq/HVozXGQ6Hu7u7qDpMp9NOp3N4eIh2qoAVQbTUp83ZlwqbVsrBYKCt51EQJCeT5AK7aioWPYRut4t+K2idVuVqtSpsGt6fnO7B7KSMwdPyUtQAeLrOgcA36XS6WCzu7e39+Z//ea/X29jY2NzcRMY0lUrduXMHFmfcQufhAWJPPNECCt5pdm6c327irfF03F5jOp2ur68/++yzly9fzmaz/X5/b28PDdOLFy9+9atfRZK73+/fu3dvd3cXv0fx72q12ubmZrlcluuaFfaSjxxNTM+X0iiaX/cjKNMp+K9k6SQyUKvVUBCjNthydTodTuYMVTaODBxamWGO9gvIr/bN8tHS6cWayNG3dQLh/6WqjJqEIjTSbBF0heKNxqNgTbEMxLymURjL6XR6bW1NMsdCtHu9HqLPvODZs2czmcytW7e2t7dBq5kMSQL48MMPeZgvf/nL5XL5137t13K5HDwLWhwi6qVLl/b39w8PD3d2dmxns5Cu+PjW3XGuoLblHy3ybnqMiGD8bGa7d6lUeu65537t+efP3Lx5DHA4FziXzWaPnKNyLl68KNtJwkJ6SABi/oRFYbFYRInIykkr3nas2OAcsSh6F1A1CgxyqY6n9AqasUA237Tq8MIRlEVLyyqEVqlUzp07V61WDw4OPvjgg6tXr7bb7XK5fPXq1TNnztTr9YsXL66uriKrspD07RyZt0dHR7dv3753797e3t6dO3f29vaefvppVGI4m6mTKyJo55+4kilvip6DDv/WMdyKk1j6vJsppOteyiChdXQRaoYRpFTufr9/8+ZNZgkNBPXbfD4vCG88HuP3ePv2bSaEw8PDYrGISnU6nSYv1R7FiVx+LhhxRDDgJOxoD96n2JrFO5XdEXnSnx5fzyZbWLj5IYUy56bYx0lw3poyF3GLf98b8p6VgqWj2o63yNbPQ83iWEmczO4RANXDNZNbt0yPGcfXdKoXFmaBFU+ixFuLBZO5BaLGHud0LpvPI35qqtHqadMpJCkuWYD7rhXsx05KzT7MTO3mhVUsI34RpOseUeA7LkXyfwBQ8ti5X3EfrVNInYvQZ4u9LooKnMJSn8vWPP0dPbp3XEnWxeJbc1vfvrKnnhEHKG3Ko/cT+w8hzl63t3B8/GkFEEcPJCGFYTgvjcOrnFPiCnGmsIsJqavqvM183EQ6zvdftGrE+chusUShxyM+BQK26TsPzIM8ZWAuss7zwtWa5y0FHkJGvV4/c+bM5uYmgXBczQuFwnA4PDg4UOIj22xQWuQjREJSHAK7AvHQLZ/dAsTg1JVKZXNz89y5c2tra4hVzh1fcmtws3xEbaelekxVQ45BwQwyk3juwNnaAoEOl8tlDg7Oue7RUbfZxCXoi4zVvP322yhCfPOb34wDxAC+D4O6VqtVrnPlypUHosO69SuvvPLyyy9Xq9X491955RUPwv7+97/Ph6+++up3vvMd7/vf/OY3Peh5WZYA8bJ8EdFhu66A42Crtb6+3mg0MOdptVrb29uHh4ej0YhYH7aksFnBf7Uiss84OjoCnAWj5GReKBQAX5iynXPQKoEO3cyfFKiI9QyeMsqe/V7P20slk8npjJ4G6HNwcGDpiuDdlUqlXC67mWijqIs8NoSpe/fuARBrq1Sv1/E/FU14e3u73W6L+wyoAXux1WrpNTkziIoIqgUJi5qBZojRHzUMIRHSNIRH9mdwjSHPsp7xTdAKi2NS+el0mvWbNVtcUUWDJbHqwtA7f6RSqYlRAOx0OltbW/h3kVsUhuFgMDg8POz1erChRW0DCBAdkpR8ACOgSdjEmNiCeEqdli+z0mez2Wazube3V6vVtre3n3zyyXPnzrVarXQ6XavVdnd36S3yg374k0bchsKyBqxD9Fz61VybF4vuuZncCiWTyaytrW1sbNTrdSIQg8GgVqsVCoUzZ84UCoVer/fRRx+RxrW9vQ06o/1luVw+e/ZsuVzmC0QXLASvIA0tLslgbcWE9SiFUOR3IGMYwTJ56/f7RALoJ/K4I8Zj/SSl4soXlD0g9ToLFotPXS6XCddLzIERIRDQpq47oy/BLWA66xb2dMeejzbi7USfkW0XgwXzQ1EhCPnwBVLt9vf3Gdd0ZkbZZDI5PDy8fv36xx9/nM1mn3zyyYsXL66vrxeLRV4QXR2keNE4RrmV39rhKR6czUGOM19sz/TOt6ecaR9mCMzNWNdxBXWXjY2NCxcuZHZ29NUgDHO53CSVwoGaeZI2Ut9gNla8UBrcak05g6lilXtoGZTMXXzHHibtSU+8eJs26x23bG1rtGKuIukeaM5Kmsnn81jJ8fkvfvGLTz/9tF6vHxwcPP/882fPnj0NII6io+Gw025vb2//9V//9Y0bN8gUIbKI4hCnHeIudBjwdGrJ+q5YDiCBDaZHFiOPZaZkAnmWamq1HUyGOYrJ6awFc7/dbjPbh2HIsW1vb+/69evY09Xrdc0eQPnMmbgRBkFQr9dLpdLe3h7R2XK5vLKyQnx3LmT5uTGI/w8JnD/wm55Q+OeCtX2ePOvFj32KusJc1CaOeXkXeUj9kIdB1hZhfKewEef+JK5vEI+3nUK5jV/KSiLMJaueFh94uOZxpwKXi/RGH7LTPjxQ+3idMB7riit0zyUgexii1jsvrn9KhcTh3dPlldxJCezTX8qqQMQpw/G2iPcKD+v0xIXi+i2n9wFr+XBKif9w7odz28Kd6iwX/T2EEx5P1umxp8ov7Er08KP4gaGU8GTxVAStXIkn2z1XdNuD1+3YtDFIBdU8rrdEtHXWfuCLeMXLu7KZwYra6v9VlKuqyIcEZyacKL/YcM21a9feeeedl19++eWXX37llVfefvtt/enSpUt/8Ad/wHcsdlytVlH7bTabV65cEZQM5/ch0WHn3B/90R+98sorIMuvvfaaBzejUNxsNnVrsOxqtfoHf/AHb731liURAzQ757zPl2UJEC/LF7EINeMAzzEYgR4Z0NvcQLHAZJUDN0ppy61Wq9vtSoRey4B4x2DE3AuyEjgpNFVn7N35Dt9PJhKh3ak7x35NrFtyTzqdDgQxeLtaZsrlMmsV2BAndm7abrfhuIl6lk6ngUH5BwA0OKYWUdAQPSR4NzFY4SACsuFQc2WLnrBBpM7FT6HSAKAB2sQt5R/2/G/Tk6UcLVAG8in8RytASVvaynTGdU2sagEoQCrk7wyHQ2QNbExYaT40ohBM7QAgt3Y6HVFl+RVSBmT3i/gD5fa55547f/783bt3obKKd7aIDnB6iROprG9bPA4fFy4UCmxBTLtVEvS5urp68eLFarXK21GTFy5c2NzcLJVKBDzef//9zz77jE4lUQ4S7cvlMgAZFNpcLtdoNABzBYrRkaTUPBgMgFP1iWfSbbWhgaUYDnQkiOHIMoBsAhei0iW6GXEdKPMIiIdhyACR6rQYjiBKdEjYCiC8XFkCFNLNsAQQoVfpdBpEmzFuBbsFmdHrGPuCqhFmETRMnUgel7EpFw4koWXT1+l0rGUHYaRPPvmEfri5uWm90bhCOp0GGlOkQT1fMLF2sRqkIke4mWtl/Nhvz8widDzGqczXxIxhPfdN2JzrtNvl6ZTOnQjDbCYzMPY1GG9aGSK5i4g6x7SgHFVweRpUHjhadGw+oHOO/mlZft7xwGp0xG2UrDGjCOkAxHQeOonUkKQunZ2VMAz39/dBiuXuQs5EoVBInDzAjIbD7uHhQbe7v79/7dq19957r9lssqLBapHTC+o6biboBMPa+rF4oLYzybayBpLSn+0qyg8VK5nO7E76sIn2qHWHJmOwsFgQjcvlcs1ms9PpMPHqSKZNAnFiNgCEryRwUavVVlZWwjAsFovx9Nhf8ug7/4S/IK07fmA+xcsuLoEaz6qx8rha/uJ+Bh7pzHbjReBLXCkiDk7pCnPT6uOmcO6k9sJcllncHCKOT8Vb0EuWt7LX8ZrXF6w/kiURW36ZJeeqY4tB7E0IcxmCur5X+acAlF4yx1x012Nx2ofUusyLWPWk6XSaCsPsdJocjR4ZwT8JHXoaBdaa2M3TKp2LHZ+i8xvvfvGh8ZCAsnX8s4rAXpaDV7fWJECez5IzsgufVy126bQ9ynMmiHvNeW/tIf5eu1uy7VwdW4uCWZcOz804DqVZsNgSMxeB6VaGy/rRea/sub1ZVxJPrcWzebBREGdUbuzLHr8jD3M6wDdjGS+Sy/cmnLlc+7lRotP75KLnmjutzU2uig+cuN6xF2yzFev1Ou9FHv7wYkMLc7Um4tbH+pzjeaFQQB5Nprhs2yAhHRwcsAORxATMLXaD7Ijo9hCDOH2IH4YIlfVLdEZqz5ot6xNoBOTaxq2blVp6eHi4v79/cHDQbrdBDEiExa0athCvIykMSwhgZlaHl1uG/OuO03Ank2QqFYThF5o/7Jxz7rXXXvvJT35SrVb/+I//GOHgZrP5yiuvgMY657797W/b77/44os/+MEPnHPvvPPO17/+dT78vd/7Pf6Bs9wpRT95++23waZfffXVS5cuffe733377ber1eorr7zy+uuvI23x7W9/W3Bzs9l87bXX/viP/7harf7kJz/59re/zfdfffVVoclvvPHGEnxbAsTL8isDE7Pkg3HYM4M12+WYLXxHf5LTOrqxURSBc3FE5PQIQgoEw57PSl8xy0uXAIDA7szSmUwqnb6/Os52EtI5BaiyabxuxmWG02el95R7cnh4CC7mbSCUwwjv1SoXS4pR6DlXPjo62tvb02PbtFxtqorF4urq6ng8LhaLQoEBU8BzITAKmbKyuSJoA7153AFPr1MQCeiYJJKpnABGs92dzLI7AcharZYsNViYkUEAGYcN6mb59QIEpeysrR6UwG632+v1YKhpoyksDwCx0WhEUbS9vT0ejzudzt7eXiqVOnv27GQy2d3dtaYr4mZ6WfkPSYSJ00C85E27LbMqAe6kL42gKJuiyxakXq+vra1ls9nRaNTpdIBTq9Xq5uamQKKdnZ3PPvsMdFJwM2gLhGs2Q8PhsFgslkollEx5JCBOm0soa0SOqXpxRcvdTOrXYr4WZWPIgBnxK7jzdm/K8CTEAm4rODiTyYDzSgLPnjTgkgMU8o68DvEh0QokL2AFVd3MWBmA2Np2y9AMfFzpCKI3CmS3LE4x+uXQxVOpxpigGJJSa93a2up0Ol/+8pdByeXmTFXkcjl+JTDanvq8fXMcOdKR0mLEFlXxLvjL0FLmjgtek865v7+f2tpaG41Ss2+4mXAH5w0CA9LI1hoxmoEg/JWaVABMjFckQTSR0hZMyBpTuqBkFi1AIwDaO5bEj3AedYs4n/QrRCdnPiGJEiCbxiVUdvPmTedcuVyuVCqXL18u5XKhAXAPDw8/+/jj26PRwf7+3t4ekgsMItTnPblMifkSgNQrePEAvQi13e/3UfsV+GVRALqxM3E+6X1TvbaW1BxaxYCq6cnUSRRFKysrSuHUisMMQM0rOErIB0ha6ZzEb/L5/P7+voLHFtT4fPYtzgVmTM0VfPTyheNqEnMP6nNlSb3D+ekGXDZz1oowejq8Vmfco/bbYKQH6MzV4o9jxB6mZkMFzsgQeSolp7ML3UlRCIuuKrnHY1k6ozvEwJdnoxYprQKKvQkgVnhSuWUWq7ULun6iYLO3Ai7CmOJmvx4+6E4qTliZAsuc4I5seEgMcmGYD4L8dOparUeaqYMgcPPa4r4C7AJwcxEIPnfadwtsUR/Gyy7+c9WDtXYUImM1pi2UKdgI+Ib5X3tFktjkUOf1Q886VW1hFWA8ORGRPOyMdIoLmTPqpdaxTSNIPdPrMPq3ZkvvSeIMYsuCjEdu7E0JQniQtNK87NCO9x838yNV8UBPK6fj+Yt6Im/TycSdKlQ9jaKpc8E8h2Fvtpm7pY9Tyz2Y1ebfLOqccQL73N4+V+x47iiwoLxVRffsAe1hYW7fiIe43IMEUk4h2NoOpvy5RqOxurparVYhcvFIbMKjKGq1WmzbFFBvt9tEx0GWoWh0Oh1QWsn+sOgXi0VUHGVTbM9BspvzzF34z16vR+CcM4WO22wFcb7BjA4mBz8fDoekmQo1lnMvWbYCK/QYFp7WXKQ93nFcaqb5/gUnEX/7298G2H399dcBW1XeeustSyteVOAUO6MF/DDlG9/4xg9+8IMXX3wRCrP31z/8wz/0VC/efvvtt956C7by9773PQ+M/va3v72kDy8B4mX5FShKU9K2zHKLnHPtdhs5Wk6G5XIZXXkJRAKwMvPm83kCSmiGlkoloZxABp1OB2oSk7ty5KVQqYWED1kjy+VyuVRaXV+3jz0aDpPTaeTccDhstVoHBwdwn1utlnMOGUQoh+PxGMFQaJj5fH4wGJBRjpACMg7ygoBdyHWkrMrPwe/ksiXBBNBA1jkJPiKRgcKAbPQuXrwoRIZdr9T9h8MhK5+1JtMuVscnwYJWbRPXV3sg5CdiOOqa0+k0H4aJkyoTkXOgmZTd3V3qgQM/KgSJRKJer+fzecIDtCn0MSVKUzkIR/DiUI/hm2tzYPf0+NGdO3dud3f37t279+7dOzg4AJS5dOlSJpM5ODhAecOeD62LyGPwKG3n90L6bJfj8X8vt9R+4mWtMjSg5dLbBZLSTGBSVjxRmydJHPKJVHfnpowJ2LV4hHUvsVZ77O0I8CjSIG0Ka/NlM7bsh55vuB7SZqLRJ/m+7Ho8jUuFW6ygp/LlgaKsjqTeXWCBgkDyzYPIIHlrEEAOb7I+F/teVGIJN8MpBua2QK2baamPRqNms7m1tYXmSaVSWV1dRZSATs6tLXPWY/F4Bvf2aBEnqtg0Ou+kcbq3yelTvRrLIlY8W6FQWFtbo5cyIRz/KooG/X5vOs1msxsbG8j1SA4IPeJWqyX1angrSpUgVFar1Zj/1SWkkK7AmxRIwVYo6i2ZTKZarXJE5zrArEzybiYZNPcsrclTo8M5pzAAggnoJpXLZcIJuil0WnjTzrl79+4FGxvFGb0a9Z6tra3d6bTf64VheP78eR6SC166dOnixYuJRAI1eWKrpNdYcQz7wKC9Ol9RSwrGSIBPUhU8vNTGeSOUH0TDZBWQ3IqVmGTO2djYaDQadAzyPDY3N1kcM5kMun7QhbQMSRlZBoPg72jWc3psNBq3bt1axGD9nPjDLs7488h04hB5wLFWEy/0Yi3RLBQVX0o0GO1I964Z5yTGh7AFHF0sl8VGItkVaM63SqNaDixjkanMTuCe5V38Ig9DspsLqoouqjixriA1GBHQ6OEStRSLn/CzQrBcilma/ZVI/ffZA+m0PId5BomGa7X1+I8Wtogj2pbvpnQQNnvKqIuj8JrHms0msmyTySSZyZSTyUYYunv3HgEfjs1jAgStyFKcixpnFy5iXHqujHNhtUVAVVyqO47W6RwBD5H5mSWeTQI1SSsTTCJ6rYA38z9OGBAU9BOLDmvGViKLzAy8kSuahTZISlthTCm27WUy0cdY7yzTmR2Ux5FMGotXdVHtW9R5vB2pnZZVOSfouiaKI6F/oXUKQNrkJ+18hL7pOyLlUF3upMxrfHKzDqv3hcWn09F4PD19Bx4jcSxShZ7LYbd6Ss74i8ZlZNw8iWFv+l0kb+LNupbWuki7Jh4/iycjxkMvc40lvJilTklxPHoueXmuLjOx/JWVlSeeeOLcuXONRoOIuGylacG9vT1wVelHifXVaDRqtRo2EnCGYEppqcLCoVqtoiCnfb7oxmx1ZCut8DMbZrYZ3W6X5D/pX7GFIKNRbniqWLlSa6tvc6DZO1m9vrRhldmdp/afSeNm/8Uvb7311pUrV958802L0gIcx9HhZrOJzq/0JfjyY4CzzWbzpZde+s53vvPNb34ThIdy5cqVN954Yy4w/dprr33/+99/88037fffeeedb3/72/Z5lmUJEC/LF7R4mj5MpiI3sfBg7iRjUGuDyzzLpMzBNZvNrqysFAoFpnv2+lJ7JI/VzXJd4ZHxGCwnYrlq98NilsvlSqVSqVKxjz6NojAMj4ZDZDFJxgegBE0A0+GBOZ/rKItyKJtOYq3SeZT+vTiM0k/g4K0kd4FcvFSxWCQHR6w0/NkgpokjA8TMnkzXEarYarVarZaknHlaqTbzMBZQtqIHfM3u7YAqAA7Id6aVU4mEi+3SgAbQQ7D7Y7F9Obyx3msvK+qHjmTK+kHZlrVcNWkT6BRI4KloaL6jfOdKpVKpVPirSIhzRYEfZo8qXNVD3LQRFzfZ5vV78h32h4rJK52K006v1zs8PCQGfnR0VK/XgdGPjo52d3fv3LmDore2ayJFip6P5WM6nS6VSjofWnIuH8LLtn+i81jqmTJeqe1yuZxKpbRLgx5u7XcsMUonELFu5UCoAIYz2evq5wx8HdgIMFCljDV51inWwv6V7DZehD0lkKVCI8rcHw6HVBGaGPgB4hhZqVRyuRyyDyKiMtywQ0RWVbwDgOD19XUazpnk/Xw+n06nwUA//PDDJ5988qmnnjpz5syXv/zl/f399957j07ebredcwi2EnzyaL9WAcCGKKhGi+9b6FyECKnueimujwQQK0XD8zvCEqTRaCSTSaiy90kf0+lwNJo6VywWa7VaIpGgupCvzefze3t7mE2D2iiUKO4q3aZarQIWA8iKwaQhxhP2+/39/X26JQ1NL8pmswcHB6VSqVKpgHhyaPeq10IVOtZ62sRSYGC40T/T6XSj0XDOXb58eTwe7+7u9vv9fD7/1FNP5XI5jSBCfffRFudy+fyTTz11sVabjMcw4jW9FIvF8+fPNxqNwWCwt7cHN5kAm4fmuJhLoUeJtYxLtOCbzeZw5toKdsYgJS7LwqFX5rf6jkjBCmixwvJUtVptPB7fu3cPAB2JJ06SqHUz4kQllt53JpMZjUZ8U3mp3kHadvXPi0TsYpqn3r/nWhVZJNfy2jwGsXs4nc04FuxpL3qJ23EioUVsF2EfHmgSj9tZ6ac4h9fiYoKeNSPFk7utJKV9Ka0L9kNrTKRkF91I0QslykhliJVImTGET6TXBLgwGo1EYdOHekhhEJbsKUtGubzagLqn62KrxabmaO3jUhLI0uKoiI7N7KnVaqVSqdlsTiaTdDZbCMPGo9CH4zReyxD0WLEefznOVF3UVxf17bjQ1ilyKJ45pJeqBRxjFaWIbDH9Qq1QYiJRW2Ua6R1ZJpivJN+hrZpS9Cx2qYUyzi31kks8MrhFve1PEqbQwy1X1K6n8t21TWO3Sd4onssgtrJgcUa2Fb+y4Xw7BbmZtpVFFfU1yzthwxYnd9u2np+1wH0X6GXH9x6Wjr2oURZx2G3UfO5f5+LaYh7YSrCTkkcW8SL3c2klXkKJl/CxSDbaA3znhty8aI2XAeOtFDaFRYIJdughh7WxsbG2trayslKpVIIg4FSrrCOO9kJjSd1TgHllZWV1dRWOV6fTgValPkOEvlarsdMOw1BxGiZYTblSupOndKvVajab7Xa72WwiItFqteiuOjZyore16gWl4gdA8WDcSTkj1YyWIcKT9yUmCC7+ioA2V65c+frXvy594VMAX77pfRj/5OHLd77zne985zuXLl0C871y5crpKsZvv/3222+//fDfX5YlQLwsXyB02IZnbXTaix7Dz8rlcpcvX15fX1dSvM6Z/GQ8HrNUkDwSRRHeoATDRfFD28g7dSizG74kZw/WOb6fy2YTJzfB49Go2Wz2+v1ut8vSBfcQkLfZbGqll8kbuIP8pqVXICKDTMBEqcbAZzqdAo9y3tAxQ9tBQvpsYuBb5fN5mblrf8BapV0LH7JUWw6O2I7Uibzp2Fh3u13WTil1iERj9w1sBZQOrH0nlc7tgxldRXFXMfIsscLNhEFBZLgs2wj8nbgdxGH2/Yh+yPGWKqL1re27THXZ0ACpo40FJg62DgmFf9PKIoU9ZFfn/OY5X+k6NkfPS9i0pFpBLR67k4tzvCHligNts9kkbnHmzBl2WgcHB++///7HH3+M4SHgFD5pqHqtr6+vra0xxLgXHG0lRvHAQLr0xrgMq5tpg3ILG1GXSgC9i86sCIR2vUiRYjHMmLLdz2I9avdWq3V4eAjCiLYMnQrREmBfib0I0VZ2vCB4qVHTDRDo4ODN68ikGNUI9F4ZjCQ3JBIJaOlo3fAPAGWAxUwms7q6ChlW08JkMqnVaoPB4Pr16zs7O2hfyI+LX928efOv/uqvRqPRxsbGE088Ua1We70e4w7f51qtRk22Wi3ARBkhepqAHgnFSxT1iJBugVPioxLn7fnK3lTRvmN7T4NBR85NoihIJlNhmEynXRhGzrEHT2ez2Xw+2t8fDIdHo1EilUqkUpPBYDQeR0EQzfbc4/G41ekgWpxNJALoVJPJEMYx/0lOgHOTKOoNBp1+PwzDaDrtHx0NBoNkKjWeTg/b7eF4nMpkMun0aDQaT6cRzMQgmCB06J2+gsCRTRwEQBdT58YIEyUSqUwmmU5nMpnpdDodDJKZTKlSSWUy2VwumUhsb2+3Wq1cLvfUs89OxuPd3d1jr06YyObMlk6lzp45k7twAS4kmkWj0SidTq+srCAlxEIj/qMl+MdPyMI1LFKjsIH8SxkXFupSpjMvJdtSBhQaGgRBhQYqZcEmCkgfA8yX7x8dHbG5hyvEKGbREX2P2Uxccp3Pnckg/nxJxCdWsVhusmJmi3C3OMrg1bnlzc21uffMHu2Gyou0eWzTuWPTAzhcLBc7zkf2BFXlBuHJU3gq4RJwUPtaKqVqTxa7noKql8ykzsZsrP2VrQGZrPJ4xJbon2wVmDZZRmXGyDaDfpXP522Os5upHtOlhSmzEEj5SvLcDBAhekopENoouqX2YJI+sF6LfNmTRZLOOK8JdW5tbS2KokQymXWuPuPRP1rk4yQb0aakeJJZcR2VRd0+bsc3N6feIy3ONfHzom5eJxGRkF6hthajn/CtEpvsbOMhcWLgsmOhgTx1FIlZibqoQPspxE9LO9AEZfeBNngpANfD6ZxRGxN8bFvHhmM91HiRvZ4zEq527fbAXE9i2DalBc3joskeOC5wTWF+T+PCI4mjkR05F50einAuCMNgJl/gFgv7LspXsDFmd1LuzMNqPSq919BeLdnDb5w4v8gO0QOCH6gI7OZpB8cDii6WFmZb8xTDQAYOdtNQJUSt4MAOvRdoWBtg6aLA1SVhS4kRjKB6vb6yskIwmClOChV6KRjK5XIZOwc7Dco+hz2DKgFWVqvV2t/fJ8hNabfbIkuJ0WzT+Gw/lFrRKUog6gkyXBFubs0zxuNxejrlaPOrhd6IHfx/fHlUDvLjcZaXZQkQL8t/zhK32xImC/nLxj/z+fza2tqXvvSlM2fOCIpFJhWAiZ0Thm9avVAb4DAJ9xYUrFqtDgaD4wjeDL7EXy6VSrG3U2T+eJ8UEwE8Ojra39npdLuSktQJHOn9TCZTLpcnk8nh4WEQBOBKmMs7Y74nRzstJDwkFTIajXZ2dobD4blz5xBjYv8kqyskdGErE4bt9XrAcyyK8KlF7ZT8scX7xLHVAR58qtlskj4MrSaTyQyHw/39faFv6J+qYklvtxXF2UYE5OO9dRQF02lCu5YZTscD83hyGNMxUhzSMAzL5TJ4LmRDNhzdbhdLActQU+rrYDAYDAaFQkFOaxzq6AOcuMBTBoOBMjRB/yFmSqDK4/Y+PCvHkpfjSbIesyDuN83uR0EFm6/HGbhSqRSLxVwuZx386vX62bNn0Rs5ODi4evXq1atXAWt4gFwuV6/Xq9VqoVBYX18vl8vci02MeI46mRP2Jzxg4SQdnCCPK4fXyz10RgdA+DJ1q6uhpFwqlRjX4okTPJBQuMT++v0+nhLlcnl9fb1SqbAXBJnF9g1iryj5IgqJQK2DPS8LcNBut4kbMeKy2SwxFZhcnCqDICgUCrVarV6v601hnsJ550bqP4gJAJSPRiNo+3R4tqf7+/vk1DvniHNAg2q1Wh988AEIeLVaDYLg8uXLqVRqe3v74OBgOp3WarXV1dVOp6OUPVW4xSDcSX8hS+o5hmiNa5/HipXG8aMWDy+LM+tR1N3f3y8NBhz80lH0ZLOZ+Ou/HiUSQRA0PvqoWquNx+MEEE+5nEilaq3W080mbNNkMnk0HE4nk4TSbKMoiqLsbEeekVZdFKUnExcEiTAMwjAQKWY4TMzQoiiKRuPxZDwOZo+XzWTyhUIikYim02w2G2azQRCEkJiiKAhDFwRCDIMoSkRRaLp9YjLJjkaBc4lkEsgnEYbTKArG4/RkkhsOJVpSHwyGR0fJZLJULk8mk2y3OxqPXRTl8/lMuRz85CcoiuLSE8zo7TwkEUqWACqBmU0qlt4h2TIZPTggTimiA7DYOeMEZYVNGHqMUMs2UgTUdgPxfBn+mgmJ9Ajs4KDFqQ8QUGIdAhcWiX56L3I6vfExMGJngAA711km/lx4Oi7qbdEZK8gwl5Nrl1pPJlsejJZ+6NlP2atp+J8iQBGH8zzto3iatmLSWowsesJei40KOyhrKYalMDCuleCnP2s/oPWFtAxSksnNsrrYTLYsB0Q9MU2KogiXWsTBLQdTXGMCV9ALhOGy5RCJ3ksn9/jONoVfQskW9GR/gn2x1IcUIZBCkcej5MpcUB2MLLFyuXzcHGGYHI0IRj5itz6BEXus4UWKJXGJ7VNYmafzi+PxkkXwlhcCEYmPfmI9S5S0py2i5RqLG668BHbF/X5felCEXZlF6TBCUal58DI2qCRSaMrVE8o4xEp1uXl6VmIHs3OQFbAn4aIPpYwfh6sWAcRzQ0dWKMzDBxeBht7Ea1t8Lh5t1xRN3aJp6xPPtMOnwZ6aDhKGITW1aMficXgXucN5IO9cBNYqUMcppZ7L5SL8dxFsbQdFXIrngZD3XCNTr3Ht9syKlsyVpFB4r1AooPNQq9XY6ypQofMsm1tpMhzvrGbpeiJk6GS3srKysbGxsrKSzWbp9jKKVCSYwzUaFMoC6Xa75MPpqAthiIM5N4WQgbgwBi3MCR4X2EP54xixwoReHEtDDIicvF7FDmWsp/OUSyRys1TmRyuhmaAfu0yWQNSyLAHiZflCAsT2OCTyEUKTmjGZfCE5kimPGqN2JAJrgK6gCgodBighrZXPOSSzBZSjgpvp0gI9wwrU/mw8Hk9OwiLgmJ1ut9PpWLMFFgYBsihg8HhAP8BPMBmtDho7VBshtyCgHlj6qkJdwzAslUq9Xu/u3bs3btwAX97c3MSGi/eVSiaLKJrOWHV53CIgZiXQkZGnxEwO/BxIeHiWbXYJ2lNqLdfOmLdTa46jKHGyMpXTJ9wZvEDWVeL7oByi7QgwH1fodrsoVcl72iLUymiWIK+gcJv+z293dnZu37795JNP0pT5fL5SqZD+74mRPTLjzAhQzh0O8eO3p1+2yN4dpq1gWQE3HFp0vJFtnXVoYasHuIwCCfs2HZVtLEetLwDCwyK14+SIO1epOU478mwhJSATr2SPf6SeIxYYWJI4j4pPSDDBmYRKCXc442WkucUqcfM5r6ORq8OhlNCdUdXQAc/T2ZRHMxcB+RLDWg8gJRlAc+dcp9M5ODhAHgf6hk6/yjKmG9Cx4z0qDirNTbFcdD5/DHTYWllaJpozGXloyO7s7ORSqXq7jbBgMorOtdubP//5sdhrGIa8i3mxWhRV5j2SPeS5mRRAcJLnGy/pKCpSDydf4P5FdEED8CS8+1JjPJXNso+irPdszoWz/VDBfFg8+VQFhjN8KOfceOyGQ11nNBoNR6PELNijxcvmHYtWr4V1Ue622sWGryz1SYkaskm0acLMw81mUziFsi4sd9ijKXFZ0UKJO66trUl8GfkRxJcI0oiYyQgSgKKcAEvzEdjxeB34YYJ/zjjt2Ptaxlx8+po7TMQHnOsvZOGMOHEsvl5oRlVdxSVi43DJIvzC6ypzeeheTslcTFkbJMJgWvGl7UuGEDAunVaThuX5inpcrVZxQwqCgCQqCxAT4WZLM5lMisViuVwGIBYyKIKw6MBSHtAmTXAPS8ncaJnHqrbVIncvtQh1Lj8Ju9TGZazj66zNwVc2khSWnXNT5xJHR/lc7hH6s3NTM3d5uU2n6ALH1474GLFgiodAxbuWdeJahDx6NmKC0elIHq/cKofaAIalbEs4iArE35i5C4AJdSABuIpVwNUol7EsKUFJsdxABdiEc9nHtpJH9EDJDbPzl1y+nZn12Apyx1kL8XFqia5xlQPPRmLuRBGaMhc89YwcT6FTqHdJ/tgKv6opfVg8CELe4pQF/SQsHlfRjfPTT9nSe0xwD2x1xkrai50IKZ7rcec1kNe4XtDllFVskVT3IhJx3FvS6rZ7WYxWJkvoZ6VSgaNTqVTq9TqCv7Yyj46ODg8PDw8P2+22MoNtgguEJE1WYRjW6/UzZ85sbm5Wq1UYAyhREMCThp6eEKAZE6DDw0OdF9ilQBjq9/uWIIzqoBeKsAot9yfP2W4/HjvR/3sBdWVBkbtQKpXkZW3tMXQySk4mRUyqHzWxKe1c9pfbuEyda3s73WVZliVAvCxfgGJ3nEJwOAoCbvI1iHj1en19fb1er0PH43BIanatViuXy+wnkOME5MIjFUHPer1+7tw5eMHgOLlcbjKZkGmC0Oqx0HCphL+qoBnpRabTaU3ik8mk2+m0k8mjGR6N5ChhSR0R2Y+SAsMBAwEEJYIJCdJGgR0kJxaeFs1WSThBqwGsBB2uVCrOuXa7fePGjZWVFTwBwKmBR6FeggzevHnzxo0bg8Hg4sWL3BSe5tbWFrk2uVwOfs3GxsbFixcHgwE2evLH4JgEFDsajXg2WJaC5jnRIY1Koh/vfrwDTqVSlo49U6dFEkT0DTYi6BdD4alUKtiJEJWVPDEJ1DwqtSpGEn8VK1xoNa/JjkFbc23IOp3OrVu3Op0Op1Oh1VYjWBlPDxMLseq6lgxls0dBwK0LiupTGCtHBY+UAVgpmeZUKtVutyHxVSoVfK7YaW1vb3e7XUkDU9scxWEf0+s4jegETiNyWgZiFhQrzy4uKAE+QbGERrQ1JIMsk8kQ7beuDpKJZHiyw1OLgA1xui4UCuIUKLWWUZDP5+HkJhIJOrYEzngSmpIjtFLJiJoAsKozoK0stppHA5E1oraGbD1dzEOJV0MugyFJ0Ai5bQ6ZzDkMkHw+v7q6KiCe9D26dCaTOTw8vH37dq/X29jY2Nvb29vbu3nzJqx5boSebzabhSQuo7w4QGyxDI+wsyhFXbjGoxZB7XG0WgmDhUJhf3+/2WyOZqbSgXPJKErO0Pb5g8u5z1FT9u9bCS54rK8FiyeWdCbTd67b7YZBwNwoTFbS6nSMh5mmPEppPKVU8QwKJzcwNZh6oGxyT2Klo3dxUpKdEf9gfbe8Zk0gctVjDl9dXb179+7e3l6n05E9oCWo0s04EMqUVXJJVvjy7y/mHdcUXgSWLUJjHzLo6DkInYLwPvCCD7SqP/2ac3mF1h3Lhv08PQor52UTtqydl1A2wHflFdmrWYV0Z7LjLeYS1z1f1DrC6URIj7sLemq8WottTFSRSwvo61cyM5DEhP2VnSHneo16Seueoej9dnk8TZUgcCcpdR6BzqNePjB84gFbnjb3XI/HRQ0U31lpdMtsVu3OjqhQKLiZmhMpcdqKxFFOORkyeWYymX6/zzfhJLLXVVqbBOvkoc1WivCDhfW9kLOdk7U5oSez8bD6EtYRy06VvAXP7OHRFmeXZLCHlloUXrJpimp7DeHpPHjz9lzvNYHX3ph1J+XgRQoZzYoF+vmtfL1US8lEIp1Khad075PA6+kecR5DNj77WdWguRC8J7Lh9cw4Hm1XJU1u8bndhkm8GEx8BMWHlSeIEVeot/rdVkBDTaxWphflcrlGo7GxsbG5uVksFmkX6bArWQ2LEXBbzr/y9hQaiyEH+1VGUK1WO3v27JkzZ3K5HNxeocBqd2mC9/t9xvXOzs7Ozg5nCupzOBwSqGbI2/OI/FQEBysmh9IgtF9nlA+tTauXo+Dpp8l0h1NVqVSSgoR2Zarw6XR6NJmUptP0Q2zP/l62qsESIF6WJUC8LF/UEnf48dR/FGYkbOiMqh1Wb1bL0hKKUV3odDrC3eSmZUE3uwu3pxQdccUOCMymeRpFw9FoMmNZSswU/jL/KaaANA0EfYpHoFwYMnN1nJAvMIgSr4DIsrBOoVG8LAnviDeBDtv8RC2NCD8hi8whHJx3d3e32WzKgpxQMLxdu0e0xxvPnTmecCr8zgqluVlarre9ckZV1m7UdJQSQVK5pZa8yY6Bp5IzDDi13L2VE2otYuKqcO5kwjLUY6SjPD7Iwx+97Dba666emop3HrMUIbvziyeypdNpeIJoDkRRtLq6euHChbNnz5ZKpffee+/GjRvsotDR4wAThiHc/FqtxinIswTRfkjmbLCuFEFxRiqaP/FgUjmw7j0AqWitIPoh1x0al4OZKPbKU2O7yXis1+vtdvvg4AB0iZ/QRhq8IvgoOZSIEQoz4npor0n0BWSq1+vRwURVk+OZgjfMSKItI/8KkU0Zc8pIlRKrm3nfuVkGgKy92NFOJpNyuXzmzJlkMtlut0meIMCD9RZhnsPDQxL5Gbb8lf5JRwUBR9bGQ37dSbq0EA0dDr3jh44KImY+BuKgjm1N8PQktHgqldrY2KgWCpPx2EXLfetDlCgKp1PHSDRndakTTE/1yPYUqD1MRzCZuoREVNGskN8j1CEtYUoytf0EZrGADOS5CeuqX+loZxUJiM8xS1gHPOZ81miolwA6TDvOOQnCWJFQgXGfU/XPuF3zAOK5k/8iEdVFmh5eQNFrI096dZEOgDvJOPZQBk8aYm4+wVzcRyRHwVVSSFBDi4zJ9K7tyv+PvT9pkizNrgSx+31v0nm0wYdw90REAJkAMlGogdIUoQjJFbe16P/QK4r0ivwH/Yd6x0WtWFJoKXZVA4mqrKzMCGRM7jar6Ty86ePi2Dt+7Xtq5uYeQXQWqE88QtzV1FTf8A33nnvuOWgXg50aVLmgCMRUHNxPKuDT80DLUOgBz/4YqEYQFJCqdwTIAoqFi8ViPp9jFO12O6gJaS9fljOhnUXlK+19RElNfT4EtdnmxZ0RYYmWF+CAwQaE7YxFd943PmVNMuWuh48F7YAQG9pKjDF5WQa73bDquvu0QV6vTHgNJXWCqo52HmITPwTD7QWR65oVe83udCAKBAoFaQwGPGtAtFxGdMiHFQmLD9YTtEpQhhiBvScqytECyRSttyZKZEDbsuFBU2DHm571PhsNS+n7oyFLbWhc5/jXRTm8p+bp2/CekETJdgQ9R0zNolOfT1A7NEDs+dcV9w9NvOXMulexqEqAD5KQnCsfgFZ5pZ5H696KUb3RSvap/eq81TthHQjpKlqdqFvHavfuHd7s8xJqD2Leuyno3d/rO9HVO7ZTMAdpNpvHx8c/+9nP/uRP/qTRaACoxUFBP/Se0p6H1RQCxBSO73a76FzEoEJ9pd/vQyBruVzOZjNdh2AaO5lMqC8HD2esrnwP8wuMW8+omWoPNOBFsN3tdnu9HgFickS0EDkVEbky6JoNwu9WdeDzoYcJ4g6TemPMJsuaq1UQHjCxw3E4DgDx4agV//X+jfZAFPkZCnCjJTsYEd54PM6yDMAxVm2Ebgg12AaLrtvNZrNYLDqdDmr7YNUBz8ISTyMLhOkwZ2Og6dl/Y7lnHzqFFCi8iJPBR3FjJi9YFycR6AMeAqwJQQAWOcldjeN4MBgMBgOcdqvVQjgLpf9Op/Pzn//8s88+Gw6HiHEJ7yK7vpt7YYgCKc8T2REyKzQK0SkIv4VMHpxc6m8gXQejmTm/DrZwW9gfqrvsiyCw95HWLMuy3Q7XhV5L6L5p7zuyh3QoxjrBarWCzzio1gCmCVVQ9wOPG5kq4E42GQFxo6MdxUPQ+9ztdkEo/gQGJbFUwqkEED1DsHrHrueD7GEQmikzGAxOTk7a7TaEREaj0evXr3/xi19gmnz11Ve//vWvMSa32y0SG3zOcDiEADH1OuDnQyYL7fWQ7rINHGg7f8q4h7QRfUUYsbAkRqqGeE472rOkD0xWtyiyjZ1uMzotBzqMyUW5CY/OhhIRCMWQAmeXGeNgfiP+3+12CV5jRnDAUCmbJRAUbAgfU7LG44Vpm0SSMnSgiUeJrnysUev1Gp8GV8ZGozGZTH73u99h1r98+XIymZyfnwNZg1oIiOQafSON3WO46FxUt2EyK/Byj09b7YkLe7gVXgSRZDwe/+xnP7Mi/+V3v/tfP/tsEUVBEEBBezAYoLdDKkXRIs/TLMuLYrNeo4UQRGxNIeTUo+Y4dWlYxgNiBX46n3VgbV6WRQUj6imZJEm312tW/HHK/nCVo3NO3cnkcQ90/qgoihxak9Zi18OGCDactu9LnUvfvAkGg7DyUOU0gXsbdyvd9/BQkqnPih5fXhqPM2TOgxoJV1RmaBj5XBnwlKHyDzcbLFkoFLF/iFkcRTlRH4Kgqu6JAfgCWA19Kph9TA61CIzmsT4EUf1Y+GwfUFLHVXXhU6MDj3OK5QERWB1BcZuglD+LPVyc692ydYzvIeMjfSFcpRGccJUgCkxbMLq9sU8FEC321larNR6PR6NRFEVovcKGwuAHCTbqXti2uMbqwIA9EBhLrD7qMqd2CgUrTQ9svE6vVIJftC9jwMa/cGH3hEcfRzbroDx3AWwrtF7Ue6IuA7Dmil0GyLgGLKIoWi6XmGXGmKwo7G53XDlzfMLY9ihyj+hcyX1/RQ9fq5fJ6+oo9enzuJCXZjvKfRo7RimqROTqEtbHT72OLm7ZSDG4wtfZ2cTO8PlsOeek8Bi4muXNWiy2eIDU3q3Wc7aOmO/19NNzoc5+YBBSx/qlpjqlszOSsjUdxBN8qJ98HSDm33UkoCMQb1xxufPkF+6JinwIIMZz9aIO7b7w0PSsxzx7b369AqfDPE+cQfb1luknpQuZnoDMR81Z7wy1Jp5XBvY6FfSSpaM1/ZiwQA2Hw88+++zzzz8PgmA6nV5dXd3e3tL6ArkzqLuI1pB3c2XjVyPw6/V6iNzCMISiMVpFRQRWvcwFpOqhpIIw4nmQnHSXBldFzcjhh2A/ApKLAqROozRAjIAcyylZMijIccvTWDyEyDudDjr/SKyGQxJFVGDbgzJRlCRB5ah8OA7H4TgAxIdDdAci8xnn3O3tLZh0HhkKPlTYOch8vDMm2u1QvUQXNoLmsiyPjo6QsUCBLggCas8ZY9CLCsALyAvSb7xIdyxAxulu18gyCrm5PM/nc9fpLJfLzXrd6XSGw2EjCBAeikjuXFkUslw6Y8owdGmarlatsky6XSo55rudcy6Bml6e77bbMk3LsmwmSZJlNghaQbCzNs8yUxSRMeNG46jRiIFjrtd2uw2qJNntdp8NBsmzZ+1WC9l5K4oGYWhFQJzI1mubZUmen3Y6vZcvS+eajUbLuawo3HbbyPNGux0GwcnpaaPRKPK8LMtgu83T1Im04rhwbj6fA1g0zWYQBGFZ9iqCT7MoLLiKVQDlnCt3uxA8sqIonXNZJtQlKMvgftCz2+1WiwWAMGB55FOTxaY7mDwlOzrv8RQQOCJkZ5M+e66hRjKdTpFwap0B8EazLHv79u3l5WW/3282m71eb7vdggGnI8u6KfxDB3VFmD9opWacG7JTL3aktrUO0TxhPmiMnp6evn79Oo7jb7/9Nsuy8Xj853/+53/xF38RRdHXX3/99u3br776ChgZPhPAKFTzUDNAag1hCkwr4jI6+vSIKkQi6KJOUoxujQS/Bm6N1GFE8kbtRVpbwKGIeSbAAqRSUJBAcqUpVBwhUFPB+kDSLoyGsDLAs456KYzqeKvRkap5Wzh/fDKICWQbSeXIB/2NxWLBdJT8XCq3AlPDgyPJiK0GwOVZhoEAK1gYVAmADvt8Pv9P/+k/9Xq9v/zLvzTG/O3f/u3FxQXgFaht4BopXKiNyPgc2fgGCNVLuT2YQ+dUn7zge9OWaztW4OFw+POf/3y9Xv+/guD/Hcc3zWYcxz978eL/+N/9d29+9rN0MFgmSVGWcWVXmGZZWRS3t7dofQDxhN9CFJg0ECiJ3+kXAZfJ86Isd9stPgSZANUqsyzDeMZsxSjtdDrB0VHQ6dhGwwRBlqab7RbPLggCa4wrim1V67L309f3pk86S6/u+/s00jmLbM3awrl0vd5CjyWOd3Fsq0sryzLLc8gB2mrG5XlOLXuto8dajm6e0ECAftAUJNGiipzRADUw+FFNxFKGHA93CXVH3DqeDCsr1H8ge50zHVAd6q9oFwBKiN0ZEw2CKliXkHHRlAyPCYqENzc3UFmp+7M93rf+Edl4reataV97zbuk1t77CDfZEzTQj8wLnzQFz5MH4fnohNmjmGlJ3Do6rPNzlrSRt7OhmIq9nU4HwosU4eHi3+l0siyDKiXaoUajEQBirJyr1UqjulTi0so2HKJsS8fVoU6glUz5UYy4yPxFtZsrA1YhNhhpAyKtOKnt6XgnNReY8B8BNc2XhC4BFxPWb0Q1D+2F2DyjCFFylvrR8Fc2mw3qYc65wrkwTV/PZj8JpUPuG1g9xN6tE1111OQxMeseUJ5zpo40PAxRqq4UT2ubax0P9lJ4ihyi3AhATeAtxcPFUNEyTRodJkCsGaNkjXCgem5sOEMscZyw2qybY0lUx6S3VtfdZVkc9eTjec+pauLVfetv1gGebo3nQNUOEyRmajalJ0BMoQnNCqpbsdUFH7zy2Pulr6o8PVY/uO8e+Uh54yl6Jo/MC28gaX/Rh+bR3rFdLxI8Meh6RAjoIfl4TiLPnJaAMntEvLsH0tVgMBiPx1jNJpMJd2HKOywWi+12iy2blHytYIb9XdtIIh8BaIuIHX/RYtxS+Q1AvwIYMQ1mSOXWQj0U1GbBmzQO7FM0ZiD5t9lsstyOBJAq5JDVwjeyRCpKoAZoOAgNdL3GOsA7wAapAlZ15oAPH47DcQCID0ctZeKKCbgHRnO6W4ddJLPZLMuybreLcN85B/oqNYzYk57nORJLkCKNMVAHo6cTgCT0FUZRBAal7q8n5gW93fVq9Wy9JkAcLxbP/5f/pd/rLebz9WYD+huQBZ0l3ulIhOF2s8mLot1qtdrtIAgiNAOm6S7LkiSJoyjLsgFSmrKkCFoQBOiRMcZEcdzr9eIoStM0StNWlsVFIc4VFYWtWd0BYCjtdrvRbLqyNNYm22270v99yX20LAV9Q2irjKLA2uirr8IgKMoyLwpXlkVZurJMksSJNNfr3XabJEkYRdYYGwSdTifhll/5RxljENFEeW6DANumFQmLQrLMgZ6TJPL116ISpCzL0PWJrIn9/gx8UYWmnCUpn5raTI1pChQAWATtGnUFDDxgfOTsYIyhMgySoDHmu++++81vfvPP/tk/Oz4+nkwm6/Uaw4ldrh9V28eFaJ04nUpRUYQRfH2aaGMH7WWEj2o2m8PhEIPw22+/dc71+/0XL16MRiN8MjV8iVoCwYG+Ac+Kkr70fAeAy8ZY3frHIJjMAlb7ST9h/oCAjNfCkJFtmDoZxtMkGRxcA+iGz2YzsAZwB5Dwr1YrMpfBqQczmqIuDHattfCKBNMNpwR0g/en2WyS9QyiMZ1SttvtbDYDxk3HyEaj0ev1EFNSR5gmexzGZKPjekl+YRMlKPmLxYJ0DxS9cHX4nKiCR29ubjqdzhdffNFuty8uLkhMRkWEAS7ukgZKMIrIAGIWSscnqmFo8daPElTZmxTVlfU4L5DPs5SyStNFUaxECms31rpWK+z1pN0uo6jI8ywMXRi6IIhaLedcw9peswn/aywI+D4XBCaKosrb0xlTNBpZHOdJYqLojk7iXJmmWVnmSWI6ndZwGMXxdDqdz+d3jyCKGp1OFMcmzwskP1G0MSYOw6TVKoMgt7YQKY3JRSJrARaEu11RFCaKJI5lH2OXmB2gau+2WhFbzff1apUnCRRIZrPZ7dUVFjRbyRkdtdsiAg41vUCJr2kBU90OX6c68twAXWEie+cM4gxuHUnN1trVaoUBhn4R/B2nh6GFadXtdoGs6V2S0x8TB30/xByxTWNCYVVHMXi328E6TCskYsTO5/PLy8tms3lzcwO0WjO8PNrUjy1yY2DX6D97FSF05/UjAJxHoPM+oc7m9qhtnoKtxhf0nRclXgQCOGt73imRd8/TprkcjXPZuwDylBZFJYOYEtXA2rIsA8S/Wq1QkSXgS6QGUj8YsVqkVT9urYAEII9UuDqhjAAiCm84bSoIacKmp5yA/QJYCRdMDUoS+MB+QdopNlbu19hwMcI58hnPYA0k+iyVdIbmiRN10sLffHA4E6AYd73VYdhwDs1wP3L1fog1rMN4jylfJ6F/UFP4EapsHVPWRruiegWI8nvKBnWVAI1Y6bY/xjCQb2LHIW0t9EG6KPkK7L/REg38p1S8dd16GNzXCGKhjos2v8irIoiSRJN9nSv8QC21LPsaWXTuozWmWYbxWAI6FPSEXzx0mAyAvWPJ1A7vDHWT03vWrbXmcZO6fZe5d0Tt3Q09AP3p6vAf9dOHpsOnlTAfaU6SfaJGcl/gQmflbGDVdQuNg2Oca+dnr81R1wZ0mY2VWj1HOCnY1cflTld06ji+BtmZUnnFVA9kf6jFR4dnehHzMi+v2FxflPb+qJ4SejIvh+NwHI4DQHw4xAsOGCIjdq/XA9HZQVsnpMF4D8JxBN9JklAkiBAM8ReE+BQcQM87aGLWWkTthJthYQekcrFYLObz4XbLM09ubz//n/9nZ4wrS/dA1veQlNXdbqR+/F4pXplH79nFRcSYZk126u6TFaGJuzT+2cKbP7QRPRS76KSUzifyaNhka85RgXOx/qLtVpQQJIRf6TYLIo9W8cPzJYpEiJbifQhWUKplexGq0/AehK7IbDbTjCcGJewPwiegIfrt27dffvllkiSdTmcwGKxWK4AU7Ch/RN/zEfaN1t1+JGti0FNngO4t6SOHRwwNCVrybS8uLkD34/eSqMu2L7apkiTFiJw0DWTpOm7T4COzYqbKSOzJj2CfI5Iovl+r8VLRAifATmEg1ICQtJQtg1GcGzvQperbpfc37zC1LIiGUIuQViEa+/bE4DRTDyeMkWlVjz8RXqIDHDMkrIlqW8a16B5MrE4AUBigo3ePHRJossO3Az1nHsgnSwGceitofRl5ZB14RKTvY9Fhj1DGe8U+a0/03PtqwtZ4akBJUH7w1Gz5TLluMJUlrZvUMOwL0Ekg85QypvxqqhZo0SGiVHi4XoK9d+PTNO29N19PGWrQgyMJPChNU/yFlMa6wT3zJRYvP2F31kiBx4riSOMN563WjdVUYhElX+sVvfA2aBdqOWzgjyja8esIdrAVQPP9UQzTJ1OfAj9JAPOealdbxj10rN4yX8dB6p71exUeNBasJ6au5XgQmDaCk/sy4iwpoY+E/Q1Eh9F1S/EWLXEALJJkWKDGHAzalwk7MkI77NeoUKLrlnGFpluSxa9dferSqKLs7EHsQqTHhZcjsCxLisPihuC0STLVYJamgiKSRBnVW8pY16RhKcYzUEVWVbEbgrLAjjcoXfB+sqGEupleAKZ50ywvIThBPRJ9DGEYzufzq6srNNU12u2g5l3244P2x0Fevbb/+ILiXpyr7sjn2SFodSnd1/9QuMuGJ/ZXYevUveoe7ln/ux6fLJB7msKcnqzWkwnrxZOa81hJNIRBYPcLHVRi6N7FVsFY8NAdeJxF62272rd273ioI7weXOjJStSf+F6M2PNIBO0Gz9s8ZSQ9gJw+Rb6j3k31yEbJ21I3U/nggv9QIeQp8LFW3vDqglKTJPLiOpp/IEimUg3DGDptcKVdLBYXFxeg7ED/l3QKxvMiAj7WaDQaDAadTkc3YbDkgAh/sVhgQUO3HIwN1us1jNOxJGJVZOEEMhHYv1hU08mI3JdDYS3TK7kxLmKATRoQ1m2sAMwp2FJA8UlvM9VMeURlWv6epU2cc5plpgoyD8fhOBwHgPhw3NvYAN8gr7i6uvoP/+E/DAaDzz77rN/vMxZEHjKdTm9vbwEEow+FVm8kmS4WC6JCXrOehn6QvWCHgzI9PhaLO74RbME7DYeiKHRbVlkGCi/+xzzMP8qv/GOe9h19rLKhx8bJDlbKqtJ5D7GLZmQAQ0FXPsYDghUAu8x7Af1geCBKQEpGaJgsWowWiBRrRSod0z9kSbT3YIyCb/cQIi9c1sV83S+sg07tGtFoNF69ejUej/H5URS9evWq1WpdXV3N5/Ovv/763/27f5em6WeffYa2LIRfaKgfj8dJkiDiIUwG4AwwPbEYBE9oBAbVGtgBcDoGPYRivVsE4jYY31TyQroLVQe0/wOkE5HpdAp1BanopZjspCR7rbvgEQM/gmgpHh8GBqBSCFtjVJDJGwQBZLtxjfhSnSzpe46rQ92o1Wqh9Qw3jVKVyCrJCKY3EY3vuKbhizAOiZohXoeZHhx1IO6GOzabzSCYAzGczz///Be/+EWv13vz5g1gTZC++/0+mO9QTUGo6sk1krXhGdRof3OtlSwf4n89vUYi91ked2FB5SmEB4roH4vDcrmEQBDyEyjDsOOEcbzWW2T1guxvr2dzuVzixgIjDsMQ/1yv18QIsNGQvYjTxtPBUxYRNC4AgQIdkkz5h5Y7blvaIknrfuh8AyA4ANYwDEGrBFWZYBYKV8zQdGGJnY91sdQ6f0qUQjpqsdoECd+CVA2SLPwp3cMhHUhgCJR/6tHjyRIr4TqDSYSeHugMMEHFLEZ7JgZht9uF3gtuPoirNFFEIoczGQ6HyM0YSPyE6DDvGu6pJ/vj2UN5fd9SI2575lE6a5X7Esb1lnCCudoqh5MXuyHlILz2W4znTnVQmJ7bKNW3sPRRZgRzKqsO7nFYRT17Bg4GDepBShJ6YhpZZvGMWhAsepHDq7Wn2POONguEgqGy/eGZwFYengoYVwSIcYv4FVZFI9j0WUmlLrAuberGINon4qe6kkFUHZ/MOciCJXEE7nGeO5Oun2FOYQrgBFiqZHdLp9frx3H/u+8+Fgb+8TPDazr5xwdBPmGm1yume2uie2HQvb+1116v/gZPBuH++50I1WDfY318i4iR6jvx5rsX750t3+ye/oT3gqp12NHzGPTkETzsdW/bijxA3X1ozHAx/QBdl7jtA3Cz3G+N0ipYe09vL6TrCbzUzULqKLmn6K1Pw6sce9X0h+6G93W6mOFpsBC4ZBgGvQikwAResREgZp7P51ilSdmZTCbffPMNCBm0iuXewagbnbsnJyfs4KSMOwLa9XoN/wCslvCcmM/ni8Wi3+/jiyaTCU4AyZ2uN8PdDjuFbrzgtbP4h6V1s9lgx6GLtW4cQfCMKwVMzOc1n8+1louWNtZPFiuwLhRxQUY+wlCEniW7PLfg4hzAoMNxOA4A8eEgHADBR8To3MnW6zUE7ylKiAw/DMPVavX27Vs0wHa73ZOTE8BhpAQCu0GPGEmIwICwY8HwhKyN4XCIfBK0rG63q9Xo0NU7n8+RcrhPZUMcjg+E5LDhqh4EwBogIEj+YXRL5FFrvZG5A6FhuIrRYQa/GwQBlKqm0+lkMsEwo5e6xl5JkSOcB0wZ6Za2weVvPTFRoTkDzdOoEaF5ecwzPSM+LevmSQHGcXxycvKzn/2s2WxOp1OgLcAW//2///fT6fT777///e9/TzVVTDfwxQBxgsyFG9vr9ejGgEhoPp8DMpOqxg5TCFyC7m9FpZ2uktoyjuEX3OrB9mIlH7JfCFJxo9I0nc/n19fXoEFpNzAEfJSiJjkLTQAahGU3KOilOBksHVAbxyeAHcaGg9VqNZ/Pce3I1XF1AKQo+whUBYi2FiUkTEPtTnbYYbyxb1Q3mZKXSrI2/g4CAjBiAGdJkoBoD6+nv/qrv/r5z39+fHz8xRdf3NzcYFQnSQKLQgTfeFgcdRy0GvPV1nx7Cxv1nvePmuJkanhSkry3m80G6GGe57D4wM3H72J8YspwBOKnOCs8RE0PpEoGpzOSGVQ48jxn2kNvqMViQe4eHx9NPlElIpAELomIIBGCcSLRN8K1e5cIkt0+WD2lBAomNdYxgObIjnAP2+025l2do6S1y/eeD1sZSMNn2QaXiZEPyB6TCyeA6UYoE7xdJI1aEwCyyEmSQBcCyzuST64DWFSRMUL6nPMRNZvpdIr3UAkB/ftYZOj5iceBYdDtdofDYRzHKJz8xNBwBUBYa00FEHsGU3XcxHM8Z4O2rguK+ijNr/dgBQ/mwAAG0EkNR/wWhQgw/rEgcF1l/kyuq4eCYZxryjZdCqGug82atRnuqnURc3ZdECflPUFs5qkt01KVGLFGmtg3w0Yx3kOazusnjnCCRDmCsFTY4EXxJuAEWBzSdSy63mH03qd5BsSINW0fAx5ruKadevaMfMo0PZN9yiG44TxDzmK0xH322Wdv3rxpNBrNTqdj7fOPBIjZKPYQJvX4VPqEXpMn6gD4Z1jDJWUfG/SDrnceblv/Fu+36r049VqOKLqr7l6S+2vFwzwDfg5Q3cKJdU6cC8z7nkM6ZDqRwJjSijPGGXHGlERInYg1zlr+EeBRdUOzvQ1q9e4Wr1Vir+pFXcrGG8MPyQE/LjDyno5d/fvxUWX3waZ7nfG0a+XHDvXHh5wHH9e16evaQVLr4Hnk3OoDqe4DTJFofQ6IK4bD4bNnz8bjMWzTqBePgvdkMqHYNO8bGjFh24Cj3+/Dkw1xPhbtMAwHg8FoNEJmzWofYir0wE2n05ubm+l0CuPo0Wg0mUxubm5GoxEMSxCwIbjiQMIiD1lIBJD4cI5GKvBQZRhR9GQyAfWEYvok/JLmstlsIJBFEwstseK1DvBFHY3QxJvZAcvhRO1xtlll0/LxUfW9CtH7kpD+p6sWEu89frXocByOA0B8OP7IAGIwwna7HUTojDHPnz//8ssv+/0+kRRkoc1mEw3yt7e32APQVQc7KSQJpFnRzAq/S74kypjagRTsmPl8PplMNPCH30L5lMjFrtHYfv65qH4roYdYEISVEP7dJn0/OtD6cdhLmCLi9TAModjLOJJUMs0qgiiw3qh0Duk1EvIb9du0qav2t2WjrudNcbcTVaetmW42CFwV8PnBnIir9VDrqr02e9kNBpsqd8LPkUFB7388HqOQUK/PE33zCux4KOyTWiwWCEHQDIViACmHdJEGBKm11YBco6MKUDVx3g/6zj+e6ug8UH8ac0XtTSf39Um80LbVakFreLvdXl1dFUVxenraarW+/vrr3//+9wDEwZeEsir4j4DOIZK7WCyAqmhWslSCpLPZ7PLyEkzqo6MjxGSYjJ57OEUeGHvpUYSRBigQryB6YxlA27Xr5JwxLk5Mt22KkjPGGMZPEZmxmM8EgBKZoszZwEzkYEArHAYDbTewnhCzQ7MwWO1M9Sl47YlRSMV1BdRCQWdRYgigJCOKJUkBaA5wN2gLYFkAxLNYLJrN5na7jaJoPB6/efMmiqKzszO80mq1nj17dn19fX5+vlqtpNZ4Xs+OvMRGCxrKw12KTx/5WlNF7tt2gzpKgRHtO2+MARIKjXKgSOCZAjXGsg91IHiQot6AmgHgKsBhqBVhB8nznO5/opRqUCAByILFp9FowIwb2vdcJ4FsEqkkYyUMQwCd5I94t0uv7U8pLLHdAcx3CI+wNkOp03qer++89hj0ulDrWpY4gIIRB6f2C0qtUumVY7DBGg5jEge+lx2dkF6VisuM97MAgwyKYkH4cAwD7MIofaE5oNfrYWS22+2iKLBEs+0UYB/aiUDwx9PXuMDHrtuPPCAAxOZ++7nU5DiYteo3aDVGz3ROqmZ5r3S0t1ed8xR2OsPhEOk6WaXdbhfzAjabt7e3s9kMwwYdG6g2QVpdY1t46OhC4IuYX4ipUB3B+syyul6TtTIysnFsQCgh9Pt9vI69gNJGukKGGq1+ygj2QHyDmBJmCqt3cl9bg5JKmPhEe3Fu+CjEkDgrLXOBpQmKEHidmkJYN3BWWnkDiwBlCqg2ANVj0OvA/KWIB+srtGNl/IMiENYx7Kq6dX06nZ6dnaGSirmQpik68F6+fNntduNGI9ztuv/xP37UqMaQNvvw2b2A5l6g86MA4oeYmw9hxHUskpCNNg/UFn+PiNty3fM0K/RBOWPZp7KqN0cdnepaDsXNtKCZF3gT0XFOnBMAoRiM4grnAnGBiBVniAAZa4yEgTGBDYIgD60NArHGiBFzBx4bI0VZFkVYhmEJ02hUh8s78TnxnCr3hpre7WKcXA8PvFI0+wkeiZm9+KQ+ojxBAHiofKDCWo3kh6oRXE73lmz3Fjn2jmruKfU4qj62mYgxyqoHZk/Bqc2+Y2/GwaWJBBQEJyDWHB8fn5ycILbXevF4xNvtttVqoZOPXWjAjvM8RwYNk/bRaETTWnrnYC8WEV39xTqMRXWxWAAjZgMcys/z+RyhHZd9zYPGXo/FnwwD1hFpeQI3DhZH5/M59iAsubpxxGsZIU+IGxBWYLaS6J4/bta67I3gR7/HK3/ebeIi5pMiatmJRCJGZCfSFNmKJCKlSC4SVy+mldpjKtIS2YqEIvj+WGRzAIgPxwEgPhx/rMxRr20ZspvAggFX0Z8BYQHSEojJMjHWrdOe9S1TU5rnUMOIKZYoHUPt0kDbHMTueZ4HX3yx+R//R3JqkCEsFov1atVstYaDQRCGOE+WagmtZlm2XC53ux0835rtdl7tQxDa6/V6vW63RFQo0mq32+12YG1RlkkcA8Nardeb9XpXOfiBDY2g844t2+lIxYvMsmy9Wu3SVPcBsUyaJIk4l+U5UdFer4e6Mfri0Rp8dXVVVgFZs9Ua9Pu7NHVlGYZhq92mpAP2Sy+GSrMsQjxdNV2WRYG/l0URRtFqtbq8uJjO52Ucp+22rngzbkZ4QYlYj2PlFeTrHCuWqQEG6TrwXmKCTuPzPIcdGRyidDjyUAz3waFeT6XonMO0Viv56mYl/VP94QBNGo3GYrG4vLwUkVevXpVlSRQAafzV1RX0ahEXQoUALACIEtyZYq3XaPUioAkgjMrFCKp4n0lVwwUyNsKNwvt3ux0+/L3jYhSB8a1dfWF1BTIaCjM0+cGncdYz92CTL+0KmRxS1wxgBAJHDYsDkwVpAmk8Q0xqXmOyg1gK6ArwB54XdX6pFYCuCObz1EIF73W5XOIrGOxygRLVQcxFDPcWrASiw+R4YkHDXUInhLX23bt3KGZguHa7XY2GewKCTIbrenlcCZkza3XpHwOo7U2ueHXMsigrYa0dj8fj8fji4uL8/Hw0GgHAbTab/X4fkDpJwRjMmA6QJAbuj7QE8Ar1jtM0xb0CBPz1118/e/bs1atXYRheX1+HYTgcDo+Pj2F3NplMsAjQjBuPgGUVsCnJ4qTkwlPM/Vid0nCG/inGdlEUvV6PJH0SbOulwb3pq5YgeAhNBvEWjZYcjZQ51v0NmEHAsAAlg5iDgUe/RJR+OT2jKBqNRo1G4+LiAo+YHgCQCtEYLutG2oGKlWOwQQEdYhYA6YNaLpXZqQCIRUPr9vwkALGXl3scbU8O1dvC9sPN92UxtTWTV9bViyELz0mS9Pv9o6Ojfr8PRAD0ruFw2Ol00jS9vb0F8o4ZgRoD9Xy04jmnJIFOpMe9Xq/b7RJpZQMvqix43JgjBLW5etAaVPcAIepDlEI4gHUIzNPZbAZpIwaK3V7vaDzmJgI1DHZGE6QmXoAejs1mg5HG1Qb7Iz3icF2MFQEQo7SMZYTLPkNBhHCol2CHZRcO1Sqx4LBBCk+KIh5S8fcxAVERj+MY4AsKKgj5KMGEo9PpbDYbGLdiO1iv1yjl/umf/ukdw246db3eR4xqEQvq5T52p1en9wpOj/N/H4GMH1ok67GWR3TVJS4t9EFqvGee9tDyyyVub6+MB0Br1Jg9K7pFgH/X8BBNNSlYr1FsnmRZwtmELliFc+KcKcvMmtA564x9TwU0Yo01LrJGAhOEJgusDa0Ya+4QUmPFiDGFc2VZFFFYVrGAKQpHTiHVjXRwJUqaWbt1UZSZS5CH0cv9NgiyBLwisQeq7hUy9pzBGCCVZemCwDxhMHtLrdZqr49ST7p3ryLzQyHNQ0xzfTzShvWQD2R95O+9S49UUDQYyoo1lsderzcajVA+ZHYDNi42aJThsT7rkicCnm63OxqNTk5OwEHudrsEiNHmtdlsUL5aLBYMsDkqaK6LahnoF5R6IG6LFN4jLoRh2Gq1wL1AMI8zJG0Iew1CQSy5LEAi5KCUGfcjNKywZ4XiFVLriuD+yKq/h79zI9NcIl0KuvMDMCaOouCDUtr1I658fpLq/0YkgHNu9WJUTe9ExInE1XvAHW6IrA4Y8eE4AMSH44/vSNMULSpRFIFVMRwO8zz/9a9//fLlSxA6RARbzmKxaLfbr169Oj09xf4Bhlej0cAeBg4IYn30qsRxjKC51Wohz18sFiQG0ufKGAPMCMAZRWwheYycZDKZLJfL8+GwNxxGwAiSJEmSLE2Xq1WR5+1Ox47HzUajKIpdmpqqKmiNcSJlUeRFke52xpg4SXbGXM5m33zzzTLLjk9Pe91uEIam34/H4zuenbUujotmMwrDsizXxliiJ1nm1ut0u93tdilFk6MoCsO41QpaLSMSicyXy8urq+VyaY3ZbDZhRbJrJElRFJvtNonjpNFAo3pgbRRFkyCYB8GLFy+iwcAGQVkU26ur+bt36W4HClLU62Vx3ATRBnGJtSGbV+7vcEYkBAPFGCeSFUWqyLnpbmeSxGZZ8fbt/IcfdrtdvtsF1Y4LYAvJ3nA4RLKku8DoSI44g3ZquEWMXFH4Xa1WgCGQyGlKCCMeViAQN2CzXy6Xv/71r1+8ePHmzZuiKLrd7mAwQI1dG2c9cbQzrtUcE+1yQ4clrZxAcpaOIMks1vUM9n2zg4mcI0AAmreC+xDHMXBPxIU6GdAeDrzViH48ni8gGKpGInnQiIwmQWul40ajQeMjPi+CrR4TjT257NLVd4CWysBeCVgQciJiRZ1KRMA4c/05LB3hS5GNA/jAqPPcMBB2w9RCm3QxiaIXnxZGYAUC56D1ELSGCSlmDIi1cDB9lhDvItaXSgqDmae2ltJwsEav7jmDqzxQM1yYG3yaDLH2JdMNlfh2QLc8SdxkqSRZrq+vkQOAh+KcG4/Hx8fHAB+ReGATgWREEATz+Rw4FFmxYKygmwSZEqRImSa9ePHi+PgYKCpqb1xM8H5QaSjnqiVHmQPQ1K7T6RDI+yAcqXHkOqCMygrZhcStgJLjFVrAebUuXTl74pPC7aKcK+4GRv5qtWJXJrTLZ7PZcrnkCgByN8oko9EoTVMA6/gcAHn4KEq7YMqzCIELwRpLGALTln6DmCMA+25vb6fTKfJMKmNQ3Jb+aUSWP5kC/whIvJfStZenXBem9GaTJqBRTVtDz5qJ75l0cTaRx4rwAGRVcOpRrkOwhKeMeUfxfcwIb2BjsOFHoJ6hNowbztZjTjSaHdXrEB4Tk7LjHAkcrnidfRWAnu9UlaI4iWPsIBBkB1oBvi2qJiTN6aegVyHqkpPmz+WRGyJGqVROibhGAsQYzHrG8c7jEzQfk6qXBBewTwFQBguBED+iX+DgQEYof+yBRwSaGVxh+8ZDr+u8P3FI2yAwzlllE/oQWXivpOxDLEv9l4f4lQ9ROHWtpY6LUeKZZTDgPhQdYty117aOQ5cyWR6DRJOINfmXuJs+DRqrEJ4mQAzKOdsCeJCGLHe+a2VZWudKbMV5jt3QlEUe2sAKVCZEjBgjZREYMXkelEVeugKbd3VfrLHOiBEplSqF0mpQT13rq9TbFPh/rLSkEWjqhgcQy31/Rdb2vEqDFxs8DuJrU9+7z3+CBERZY4F4kN8jnr11VPdx+8S91n9e88deCrw8IJFc3xoewqMfKrpoDTSOT5pvg0bATAobKzq0aJ6BJg9d/EiSBDp1g8Hg+PgYXYydTofF4OVyeXl5eXl5+cMPP5yfn08mEzKuuE7i0UPzDTeZ3RU4T+2kzdWPcnxoQGT2wXCLvS96+LFC2ev10F4GijG9Q8lEhg4egi7I66HqSQaxRtupgK9PlaGjNlPVuwNPz1nbWK+D8OMxsVik+eNCl0JkfQCID8cBID4cf5QMYmw8URSBt1KW5fX19cXFBXrhqdoDHOr09PTLL79sNpu73e5OFNi5+XyOXPH29na32x0dHX3++edHR0fYFdBxD/cVGmRRPl/TiuGQI1WrCMiM7XYb7w+CANjB3eZUFC7Ltll2eXk5m82SJGnGseT5ZrkUkSxN74T24hi6iqvlstvt9kcjFCQ3m81yNnN5HgdBbG0rSVqtVjNJpChQ3G+3261GQ5zbrddkXAINb4RhK47xIhnEd0icMdl2u1wukYFnm02ZpmEcS1HsqIUXho0oAg0V1Jf1atVut+NGQ0TKLCuzTIrCBIEUhRRFEgQhPLiCILa2EYZxEERVAg+myd3TLEujcBAjEmKPRE6bZWWaSmVts8vzXVE457rN5mfPn4MiRC4tFFSR9jANI99Wc1E1rxZ3CUEMGmbhfksndADEULnVrAdkubjDyDaRHoD+eXNzc3p6Sp1ToNVAMcgzeiLXrB4OMgTXnXr0AvKELL2gljk2SuiUDEaq2el0wCPD2AA0puURWSfHbEL6GlYUeIqESiUEgQ532tkxX0KTPs8W4ZrXW80X2RYAMi8SYw07UpmLphOkgIGrRRSYkRmeJkv97FbGcyeQyrHELmN2/moirc7hKXYmSv1D02p0xkKmM4cx1iWdUJFYpw/SYYg+r1arxWIBlA3pbl3ShPdkNpuBPgYhaQx4jEz2XOtG14cILF5m4oG5uhPzE9BhfjiZfaKcuwjusHcBnFC8Yb1e//a3v22321Amub6+7nQ6v/rVr2BmUhTFYDAYDofwM3n79i3aIAAqYTyLCLQIsiybzWa8LUdHR71eD5oz7Xb7s88+o9oy6kDOOeg+g2uJ1/v9PrYPMr7JTycahc3lo6QMdJJMlIcAE3IhsOxR/mSTY3g/teCKoZmn8jQxHLbX8Fqk0lQB+xI0RgxjdKTmeQ4ImED29fU1bvJoNLq9vf3qq6/Ksjw5OQFGCQZrGIbT6RSfhsmO66XMi4i8e/fuhx9+oJgAJw5x3izLkHwuFgs4FgDKR4662+0WiwVKwqTBanr+TxjH7IW0HtoaPMClLgaip5uGQjSXH08WCCCbo9F6hXVVU3excrJKis4S3DFCrkQVtfALFygsa0QKQPil1jPfhlFKzXc6p4kS3NBGcNpAj3sTP1CzQdW+aUXEGedcVuSr7bZhjERRTOc38N3Ya0xkEN8IPWtMauJTdDHlaGSZh3AJxhj2Jq1lgVWFMQYuh4ghuz3w9/l8Pp1OsfOCPUfBIhHBV0RRtNlsUDqNomgymZBSJ5WWmrbRu7m5efv27fX1NQI/xDzQ1Lq+vu73+0EYmrK0eR581Ir9ofX8HkJ3H+3dy7V8yozbq1DxSMe9foVaN9SVwnTgQMV2QCQd441FAqJIlE1nsURLT2BYorkHn8/tRi+5GipiAEOAmENCo8n3i4jOGLHWlaWUpaSpLUvjnBFjg8BC202jhEEQRFGYJFFzG3XSKI5sWFGIjTXWWDFSlibPZLcrt+s8y61zubhSTGmMOLFGnDXixGjOrzygnMB5oVVZH+HYslNKC3lriwi9SWmtDx2raDCUK4OAu/3BFfq+hLeGsFnsf0gQmQtXqcT0PCM+ecDutR5uUVFQz6N694/3yXs1jlkuemR+eXEjqxFY9Nrt9nA4PDo6om0sBj+Eei8uLrB7oiUFXVk01Wg0Gr1ebzwe93q9fr8/Go2ePXs2HA6xJWHdm81m2IL/8Ic//Nf/+l8vLi7YRgnyL9jH4/EYMRUjGS1XgsUWfcPUmtcTjVqF/Kcm3NDRjqMaVXYSkOEjAttbbBzr9Rr2xegakaqnBHoXlBHDBAc4wNtLeXrSTXSuocufXB+ctc1GA422H7dARz8aIM7+OPzrD8fhOADEh8MfBGGo6YdoCQerBfsQNIPQJt/r9Z4/f356egqcF50jaCgeDAZICPM87/f7Jycno9EIW+N4PNa5K8zKwjDs9/vca0HcEBFoDePvAAchW5ymKfBKuOcRANpsNsvl8uzsDNjZeDzGdoI0FZ9DdTkQPcBmBbHx5cuX5M4ga0KRk5RJ0g+R+bBoSW4IQlVt8w3EfLlcQpKCOrbU/wIUgpZqRCppmrLdBhRaHXYgUSGsgzib2+QHmXE6VKLWJPZIRGYgaZZlCRVLhN1s3PYUlkktRNc/XaqIZcDaHqLDt7e3QM0I5dD7iGGKjoABTCPBBlRHtiY7T4H7ACB+KBp+PKeqh5WegoRuMSYVWu4rhBIKAYBIZW0MdUAhnU7n5OQEQBteYbkbz46qCMzPUdMmX48Pl7qHGCHrqmiBLIjZDt2H6PEIOjM+gexaPlDd0SZKrhcDDJeDgU3BMiwF+CLOMgx1eFms12s4U2kGqKZO6EGrBaxxyQRHeD5aQZWoDakNtJ7AFSHGBbOGrG02tbEBmeOH04FMbQxv2EYHQQDNXKKHrqZzmmXZ2dnZ2dnZy5cvQaFF/Wk+n6MrAkks7r8GnphvsGndYwdrJW5RXZk/hnpZz5c0w4VWIXow4A7Dao9qwrjV2C+yLBuNRtCsh8Eg5FaJ0XDhwqWBh4jpgOeFkQbpAyhuc90muEaclEglPg1LCr0E9ZciY+EVPX54lCut5sG+S+wIk8lkvV7TcBVLU916juW0vXSnRx4iVVZ1Y692TdT5Gy6Z/gEYxtjdoAlwc3NzdXUFbShyNlFSgmwLkC/UgUg7xR1YLBYwBmi1WnjEVLahDCKQO+B9egkigkDtQj3wHimTfMqoVhixZyP2IJ1NkfG9XVIbATFM0tsBm0uQt7MJgzk/9B+wj/OhgHcPBSGUlObzOZZQNnyg/AkulWfBSryGKjqwjSW/lWU/qlRT+REzggxNvQ9i9eY7CWFoOSOajoZhaG1gbeBcGaArKV9t1lFRlNYmxtgwfL+v0WeCF4KhywGj7YzAWcNtBBys20QQOaD5g7ODY0wzT7E38acst3CDAy8POgYgcVODGNT79XoNYwygnNgvcAMZ6nAfx6awXC6vrq6ur6+xFmFJbDQa33//PdRFk1Yr2G47i0X/Y0Y1IDH3sOLqI0zPhzzl9to2PEQfforNnefEhTuJVZHipxQP0YK/HFF1FWCpurigu4U0hFszF9tGo9GuDoxeUSgktzPSJHGSREj1R2mhXnVppTFijCvLYLMJNptwu4uKMjChDeLARsYEXPCNNTYOQ7TLNxvNOI7CIDBiRcRYMRIYEVeUeVakuzBNrbW7ONo1krTRKC0wYidO9gsjcO7oGJUIcl1DQwv46EaKutguC35cweS+ooWukHnNT3eF/ycwiFnD24vhPjGeeaik9/iYfGji1N0m9wpEPGXwP0WYRXfI1WsqCFq06CLIMQBJ8U9q4LC4ws6PpjqI4WKBAvWEAe10OqX3BiJSRA5StUFgf9cAukd/1rOM3ZCP7+b6p3oUURECqQHEwRhwYvoD6mUfgDZB1WpRGiD2xMR1K95eJpC1VirI/lODj8NxOA4A8eH4J3ewbxTBOrgbYRi+fPlyNBqB0juZTJDJ0KQemQwSZkrR0xKHFiL4Cpg4kT6joRl6qmInwNcx+mGVD7ALQyJNsGLnLDMEEEOYPONUAZmxNg4eK4BaVGW17xYzOkKTSOHw4dinCVHp5ITcN4jG4tOYnIhqTuQtQlbPnUznHozmGU9zh+a51XdiTUL0+B26CVq75GlWJgggMM/10gP9NqBg6ADCySC7w/gBKAlglJg4ULM8z5GJMUwpKxs9qojqWB9wUlEUgIxJgMKZaO/mp6DD2qyAd8mjDbKDWGoeR0wwtIlcv99HRWQwGOCSAebCmHgymSDt7FQH59FoNDo9PR0OhxiH6DVDbKcFoPG8kKwSumLC4Gk+ED8C6x9TA1wzCr/qoSXKeemO817R2fI8x/MFxE+UcDqdWmsHgwH7bSkrBh0YtBGA7wBMEJAE9SJYt0dRBGkeThUzHRLMTCBBRcc/KWiLN6MxDUsKm+M8+0rAmqxq8NEDd8ac8lJcLl8QSMF8bLfb8MpjxoVxuNvtQLT85S9/iTY9ENAuLy9xo6DbAz417pjunNVgnw675b7mtY7FP02/9YOpPgoAadXogMCd8A3Ixdgd4jhGeQ84C247+gYwF/BM2cGH/y+XSwjmDodD8HCRooDNh2GJXkIsegSAtJQKbi+WfVJIOBE0ysBdgPf2EWce6qV4SZFnpMMDgwoTWUte1lNHrlTe4vM4VI0T1sRPjgFdmcDGiqmBPSgIAugL46xub29pPEhCPW47bjJBXk/dGJOl1WrpVlbMFM6ssizn8znqKL1ej16jXBa0X5mmj2ng+ydCiJ33jPYKEHn1Ti/RJUKkE0uSkhg88CooijIcDmlUiIIr0FstE491FZVp8GdR5KOgFpZKCjWyOug1m3PxB2uSlH9PhxSrK+E5yrxgd+ZiSBkfqtgzA9fao9Bjdc6VZVEWeVHsnHNZHsguKErJskUQ7owJIJlblaKL7XaXZal+7lj6ABCjOKFZnBztiBURFurLJwRMQSeNVXl3gAm/RpTYuUJqM0U2MLYBQ1O5u3YfSl2/pAI+fhG929hx8DaEOldXV41WK8qyV5eX/Y9Zros8L5wT1bTkIV/czrzzfKQQtdeDThc+9USoY80P2X9pHxHtdku1a68Ejl2D6C0Z3x6bgaYd1JimygpI9ECH2Z+uJ+leyQW9U3g6pFrbSkSMkTB0aAxwZbjZtG9u2rfz5jaNJTK2ZU3DmqjyqHPGOhvYIAqiOIzjKA7DMDDvIScr1pTiclfsyjwtSmk0m+tBbzUeujjJIuuwQTknpRO5E2N4HwCQNOAtmHq2coQjp5B9Fn8e7qkVXRiol+rw4DwW8u/dTFSbnhB/PwT4/pRaQ7VayAex3b284EdmZX2XfxxQ1ooQHPAY6pR3qJs06jGMvIzpALVQdFmFA5hhP1d7LrOIdT11+5o3o3hLgdaB2duR4K0PbKbx+vO8koD3LTrj1u0CepTqk6m3AMrD8tOeSI43yI0x8lN2Mx2Ow3EAiA/HP5WDWxcichhn/fN//s8/++wzkCKhNdHtduFHBMgVibpUvurcvbCaL5dLIIBk19LGCp3CNPYBs0YDl2S5glwGpgnbzUQE0AOCeOfccDjErtDr9cqyhPErvkUTPWACi/gSOyUbzZDWUhEV2RR+iitC8gaOG7ZYkltxIMEGz5cmv4SGyZQBcRgcIpIa0EBEky7YiLMdhmaAwBx1YMEUV8cHDCJ14MuSKcN0ykoSJURkiTtMcyfuspRHJDQMbSx6nUtFO2UIxXZCPGIwd3SUqe0FyNRG6E/6MOiKq9UKt+7q6irPc8KOJBI+PcTUSSM7pO7FCvel33QE4xnx4dOGw+GzZ89OTk663e5sNttutwQIoNyNfLjVagFKBtrb7/cHg8HLly+Jo/Gq2djuiTPi9uK5k2NOFhjCQQ9/YUcz7ipuPomZtEYEuA+CG6Ef/oXVFIxkkhYxPTXOwjhvt9vBK5nMO33f2LPGLBodDOTjo5ZAWTF0CWDo4nJg3qW5AySaESinxSVmPZUHGSZqgQtOGd2ttt1u0QmOG9vv92kAhUAW8xGUscvLS4iwQxIO/oS44ej+azabs9mMJR9Gw0T9ND9R8330XzgSni6bsBcOkJqKJaY/PLIw31H/w8oAp6bBYIBixsnJCVp6wzA8OjriCoaReXR0RFK8ZqRC9+Do6Gg4HKL/Gg8dK3Cv1zPGwDUb5UaAVuC9YkUC1AXTFUqlkylM5zpSKVmk1BDGI3fGQ4I4EpiNY42C3gL55miW1NmjBmsojS0P6BV6rQxaDUZ/L3m47IeF8wz2HagzF0WBlQf3BIgV+hvQy0mlVCwyjUYDVYH5fL5er9EGxOnvnMO4JUGVRGMRgTbO1dUVlKYHgwEeHEFSFKWw/9IcTGom9T8hOuyt8Htz9YeyXC3nolFmTXHVayMg2uPj45cvXx4dHWHXRmEYn8ZKmx6BsMlFGYY/wsPlveLUo1WXJmdhygCvB4MY95yaNqwiE3oD/ksFXt3Cr2XfWYDXqk1VVdilabZazae318vF7Xa7LMvSBl0nR8a2kjiNokkYbowpiyIoCskyl6Zlmt6FW5SlxriFCx/iOk3mwpfiNqI5iZ71/F3d2qyh4bpIq1ek0SIwnuwMA2AWVkVR9TUDrl4E4h3m1sYwdbFYvHv3brfbnZ+fR0kS5XlwdvanH7NW53lewF7iPtdyr+aDt5h7FIGHYGJv1uyth+1duLwWft3Tg9gAcTJuDtvAqSnh5Q7EiPl0aFiHB41OJqLwmsoAUTJGRBpc28sJIDGCjfC6XoXhKiJBYIJArLVGrHPRZt2Z3IzeXQ1m64aLreka0zUmqSiEpTGlsc4ELghMGNnA2ICsWiPGOCO5k1TKrStSF8S74TB6+czFUToaShCAQWzKwhSlE+fwnzgn4oLAOhdqDi9BNF6prtvpt+l77q1ydaCZzACuDBog5lZODTQGEvbxUOS+IoQ3pzx590cCmzrj+HGt5PobdPuXJlY//r3ysMSEjta8Sp5eWDjIMWKp7YtNBIszYkuaeNMnA314yCbQL4IckAUSbNDIs5B3M51Eu+319TXUGhGdsqqEMAafwLjXK7B5ciLaFUObeFNBiGxiLXPvmaAQ8+WPsAkyneSuQayc4vKkR+hFg6n03gWQeStzapwbMtm7NlzxVaoOx+E4AMSH4//fD4TjQEWRKy6Xy88///xf/+t//ebNm1ardXV1BQOcL7/88s2bN8fHx2QeQWRgPp+DDkbyC6AQdJ0zddcYYqvVAmiIzyELI89z8HNxYlqtCeQ1kJWQ1gLIaDQaoGGSMQT+FNQzyVxDkAryDrJohLDsT2Q4Be4bOVxSSTGQJUe7KhFBAy978BnDYf/GxgYIAxS54+Pj0WgEZSXAcyAVYkevB+VhGJKGSbCbHlyi2sBJM0RgQdRPqoZNQI13htqVBIeXDyPU0MpfpCOhAQqwDuRW0bsEwBFqoUSNPQMHNqsiuAH0g9gI5wCWunbboIYJHvRmsxmPx1EUffvtt1mWsVBB55knFoBJytMhMtU/GP5qSI7VeO32xvEfBMFwOHz+/DkgGKCiUolRsmMXcQyiMedcr9d79uwZByFEVDA+ceG4KI0QUd6LRBstzotYEGMbQA+EEQiYAmvDaRMOpk6LdnRpNBowhaBEA+8MZKmhrELiMKs7QKCOj48pi4mvZsUeISAmBQYAyVZ4HckkwmKKI9Moj5HidrudzWYIednTwDSGnQ2cwmzNBnxD5WjcE7wHtGX8OqUnMfYuLi7yPG82m6PRKM/z29tbRK6I3UGxhKjodDrF3MRjBWQD2QQsj1qvgK2gXpeoB59pYMLzJf8kJM2xbqSRYi934uKjnX+wTEHtDuREgFO4KKD2SHJYr8LTAfOLkhRRFM3n87Ozs/Pz8+l0GscxulXYV4GVFmsF8lXaZzvnbm9vsboSBUZ9Tuux6MZYbY31SAJL8VPdkKh/neou2+222WyOx2OAgIQY9iob4Elp96S93850i3AGtVOIWTD1oieMp79M4zJgcPhq5JA4VWSnhLFQUrq8vLy9vb26uoJ/I6YVIR487jiO8SPOLyKSURRBxPD58+fYCFDLhMAC+5cp2qDvw6c3dXqrOvnC9znCde4wJ472ndMprlQNIt4eAc0BXBHLWr1e7/j4+Pnz57hFWnwWJaU6ZgFwFuNcazpjLaL1Fv+pe72VfZZttVrD4RDG91hqYAYoVcMT20pQbMP0gfgvSOWAQbm5AHrDtWseZXUf0HKxXa1ud5vbLJ2VpcmKL7bZs8K97HTe9Tpn7cY31u6yLE6zIE1NluFzCk3s1fJHlE/FRSGBJzKF0YgrwpDTWkCcpAQNdQyg2cTcNBk7aVRIr3WayufRzFmS145nfBa096S2Bi8NPHHnXF6WQZqOvvnm//IxoxpFoUAt/t7w9kZ4XeXmIWhYL5UPwWFeL/ZeY0lPqoWlX7rSaSMp3kACSRrl4V7DL8V4YN8DBjPpkJhBHkamAWKtcO1xCfXt0rxj9gI658LQRJGxJjBBKC7erns3Nyc//HB0s+i42JiRuIExTREjUogUIrmYQqQwphBbWHEGghFOREonpUhmJBXZiMskaaXPntvYpsfDZWDLJM6tcamxZSmudKUrqnjGiJgggCmoOGegV1qWBWonGotkmKr1AQjHewxiL0TXNQmuAzoZIaRO75C778UUeHQlv7vV9xv8PdPFOhu0Pra95Ej2edCJ6vyQB7Tm9Vd4ALFXZNpbR8GSoiuInnSSLiIinoQhG8V2KdJNFBWiw9PpdD6fI7FlYt5oNLDDHh0d9ft9lnghRgTSCdJndNqxeS5NUwgZv3379t27d1mWoaiv/eVgRT4cDrvdLvcjJn1am4vjh7QGFid0JwciDcaZ/IS96tKc+NjpUHLWlXivFIcqLPN0rjMU09fUYF1KQUaDKBSSGgicsKo0Go2k1XKwcz8ch+NwHADiw4EDlBZkktj7QYF59eoVio3g/iCxB6K3Wq2wXsNHbjqdimr+RTsYAFnAzaIaZLD6w10HoBhWeWMMkE3wyMD7w+dgDyC/DNxba+18Pr+4uACMhQvxKuQkY8IRFbsjNY9wVoDV8jzHBgkdXmC7HgoGPAigMPfLxWJxfX2NvmktCMBUwVqLFA6Ut8FgAMQEORJpoeSQ4sR05ozcRpQFPN5f5wLozQ8BhChPKi8pwuMjNVtUux84kuhZlsqILM/z1WoF5cTpdKqVQIIg6HQ6OAfSiqkdzKCKQTzgFa1sQFU4ajUCN8RJ4gKRSFBGlknaXhWIR9Cx+j8f6XSut0RpJiwzEKI5dUKH3Je2YE7CkonH0NGmWJ5xnG6tqnN5NBdMd+bqmEl7wXkqbB5dWu4L2/Hc0DHKbEGzzyiITPaQ/mpdzGCOwV/XVk64UjJWdGtY3ZVO2xN7SfLeVFYDVZoj5iUMohQMKRHOJn2wDxgBk5JJHWQNRWkr54eoo7Kvg7g+UD84XJ9SINFaCh7PDnMWiD+1XIAGaq2JIAhQBAKMC8wLEDlWOSDsrGpQbhgnAFbL73//+/Pz8yzLgLTiY4GUgV+JEgULVxAhwRIE9j1FV1AdwSmx0kbdm4+CIAllar6VN36wfxH9JA+ds6D+oM2HHN6pUKSxeyLg1NjBhkuJGxGBavx8PoehIrImrkt0S8dWPhgM4BPL9pfJZPLu3Tv0Z4xGI2SVpGajHtDr9TALcIe1ngYKJ0mSHB0dnZ6eZlmGvRjfjlVIlzMfsfr5cQRi55wz7s7eSR5u9dXzzrOC1FiSlgRhzbjf79OvEvcHPVW4ZEZKiIgQzHikTqpv0SMexTZMNC4UxNRYueRqybWLyyCCHMD3iNMY3iDsIR6NGGm9XsPInuXzLMsgHASDNS2Kha910Ea1UjpJd8Uu3RbFypXBNi+Xu17uXvS723E37LV2gV3nRV4UZVlmzvkSn8TW6UGvkVaEIlw/UczDedIlQotd4m4j8wc47qlM8ruIdGiiKOVoOJ65vOsNWhfItR6ClqUiGsIXCc2DErhcLlfbbbDbrVerjxvWZemMcfuiF28joDTWQ5tInX35wV6KetRU70OXfVR9bVGl/68PbBCeW129G0wDfLoBX8dRnhiXR5re+2n1ypD2YKgCZivu7oKds3kWbTfN1aKzmTUlFglFQrC779BhSUVykVwku0OK78RJQQQuRDIjW5FMXCm7nWu3kt06dLkJbZFEhTVOXFnkRsqycLkxToxYa6wNRGxZhmVpnbMiAOkMyQH1QILbNyMZ3YVQZ4JrbJR3wGPle7jw+xtrjFWB4v4o+oExtrdE94h/6UPRUf2ndSzSe1s9svXi7b1/l308fQ3He5En4pl+v398fKwxYnBHdN8nIigsZdvtll8ECcSjo6Pj42N8CDFc7CNAdYGuAmIGEoqodblc3tzc3NzcADhGks5rIUCMpjdWKKWi9nMNrLfC1EX8uVqirs8lkWmCbtTD/6k8g4VdF/m01jDOBDsyO1YReNCgVSsIsQtk74talvD9Mw3DPM/LA4n4cByOA0B8ODRkQDyXG56IIAFG4srGLjR6ExMkKEbKJDBW6odSQQJIATYDWgmBWsusmMgmkVDCtZ7sLI25GGLSZA9ZK7Zb2rhJ1WMCvIDtUegNRxIF7BvAKLImYwxtVUF/a7VasOFiOkHai/aL4/aJK8UWjtQC9C6A8kjvcT7kudQFoUQpFxMO0/2VWuJqb+slpWkJ2pLYJVV/K4UpKDRBZi4ZZ0BhCE+wI0kqWVUquwE+9vociXKCdAZCE/tPNZuJnrM6fNcEIg1f1u0UPnjoajPDCM+9V1t26OBP0x+YqWLIgV0INwlMn8lkcnV1tV6vUXchgRdjD8OYCtoc2PrOMMxC8Zy6CgCD6CICbjjSbIwugm4IKDm6MLbRKwA9aKDwjP4B1lOzGwMSMxphFhVgmNoxtaCHIccVRjsuDTQ3Shbo2+5lL2TbcSJwsiPOQ7EK0CErKMQgIP8N0h/OB9wEXjKDbKZDKHHhPqAahFf6/f50OqXIDKAimoC12+3xeKyF1HnTcJn8Jy4Bob++ZD1/PbHLvcSZn+qoY9PEsj0VVxSKqI3OWcyCh04hmAxQxxmC9aQgYfWgCqqmo7IMxjqlN8ehNcHcgzoJmDKQdnnoLlFRRLNaHmc81V8k2IHTYzbodfUSYfQ4yB9ckerpMW8ajcXYecMUDmuFqLYeomyAzqXSCCKujSeCLn48BRB+sb+A9KS3b/yFcxZvC8MQmuno00QFEWsd3oMPJ+LM/JDj6icbzTWLpL1VQw5dvZ57c1Bj9Ni7kdhTSlU3hVAOG+ENWGDoAgGmz9nBbUJX0ZDi8mzp2YhQhI+bStPgTmKVw/RBaxdGI2UrWImHjANl0zEeACVjLcUyuNvtptPp9fU13ImNscB2iZCUZWmkNFacNHf50SZ/URSmdHHqPt8WL0tzssw3q9WbTrgLzEZsHkWTJJqE4ToMwzBMgiD0FHsJDROT9VAtIuMc2JpoxrgFSzr87umfqdl/xDg8HEcqOU5CD7qPHjR8FLMJeWgEn3UXLk3aEILhKzqf0CtWilhjQtWN8aRVulqpHwdzP6jo/Qgo/EGp1r2f5nld1BG0vRWgva97f3/KyegqrAcs1hHP+pbnaW54Z6XuZAk0VoyIGOdsWQRFHpSZEVthwbkCiCt0+O4PPuAOIzZSiKQiO5ECrEZb5LYsRZwLrARBGRiXW2OtWFs6V4qUxogNrLFG7qiNhgxirFh30KvbUy3TscdeERIPLH5Elqf+iP1ff9So7Q50LsugFqXXcXzvqemyvVfPe0o888h82bv5amhy7wYt98UrGBKzCczjCSGAPDk5ef78ebfb1U5rVHzGQoG9mMsyt5jBYHB0dPTs2bPT09Pj42NUKLnyIDeHZS6KfFdXV+hfQSYFl1rU2iHGontVWeYEO0pL3rMShm1a65lITX+GbH2qPmpCkuyzxKSSO6tHHkDMiAvFVCAADLSQEAG10NwLvb/zoXAj4LbOTee9zl6a7na7sigOQhOH43AcAOLDcW8VRr0RiywpvR7rR9u4AUZBUoSFG2kMfoXwFrUXiMIg9EcGBQwXLR7sOKPrETZO5vM0XmDBUAeIwKYJ1XFvwH6D1mbktGANsw/aExwghSSOYwo4SmViTvldQGDIqJEwaDUlesEBU2ZbJT6KQJJULkOz2Qy/jnwb6QeAMLp5MDaiqCtvrMcjoP4A7iEBFMYlVGilexgzfz4jze+AdgRCEOT8WhCQ5XcCEMhIPccYIgKAMrWtmR4nRKjxBEn51DcBjDlc10e12/tF4/ud3QS59GfWmWjaj5h1eEJUaHUfj8fj8ThJkh9++OH7779frVYigkANBQ8kyRQXRozCTJUoOeMnhEHsuqJkB1vFgelwAFOPGGJn5KwRqeSN1a9oti8EFkgZZgGfOqRsjsa5cUzqnByfoBmRWD3ADgP3HwAHgW8NEJMqjumDzgacMzRqcBq6UAE8C8+CgjAcbMB5gfJoUVfi3Vg90EoPZz9Y7YE0ysoW0QHyOIIgmE6nFxcXgOZbrRZkcJbLJcU06bcj92WF9VV7zBeNYst9sdRPXu05fnTTOh89+9Px6DFm2GRAhJc3AVkElgjMazRIQm8EiQdkQ/I873Q6OPlGo/HmzZvxeAwJHbqfaQdCLJKI5rnWxXE8Go3wgViEKffhpQoeG1RTwx7Xmtire0DuMEYjmD6oGjLjCpQRtm47fQpG7H0pHjrzJa7hUjmPM4/FPzH3sYDzbcAuMeMwX87Pz9++fYt2VNb/hsMhskd2nGDiUNkJay9d79j+j2UHNKX1ev327du3b99i/GNpQhUKzFZPVkV+HBHeO+5ckqw1NZGQvbl9nQhJ5jgWNIzSZrN5cnLy8uVL5PZ6hyLygoopuxmA0krV76J5kWyeZeGEAu74HKm0FPr9PmrnmAXgxmLNpIGktfb6+pogKQpgZF1pt1jurXpQYXajWrDb7Waz2e3t7Wq1cq4MQ9Qs5Y466ZyT0krmiqJwjU3+2aL46ywfl5IU4YmL/0SC7ip7mc/dIn1t3S5u3Qz6/7kRbxuNbRLHYdSKosSj4mrNAbmvFKzJd5wU9R5wqVi6aDVD6Ro3h7gY0HasTgDQ9YLP+gpDO+DLzWYTmrZ4QJyePDf+LnEWShOwP4MRKTaCdru92e3CNB3O5x+3XMsea6+98O4HFVQ11vYQsvYJxcU6ZPw42VOrf3gqFhr+83qGdMnHUxjQpaC9IOZD4KMmJnPzfe9I4dzdiLsrP5XGljYsbFRKLO//wKTOVixZ/AWvAB0mibio7OxSkUJMICaUwti0CDa7MNnGVtwuNZutZFmZF/md9PRdUHQ3GY0pKkJ5Adlja50TVwM8rUj5ON/Weyj1Gufjj093gLma2ol3FGWZZ5mt6TaYfbZ1Hpwt93vp6rW9p+DCD00HeUIjSx3cJE5KSjvrdtRMwCLQarUA7z579qzRaKCBAz1AvOGa3IqEkYFlq9Uaj8cnJyfPnj07Pj4eDoeI57G8r1ary8vL6+vrb775ZjKZwPYTzSuoFGL/RYUYinOAg8kN4isoSTKaEmURzCSLxTBvY2X+ohsC9K6qy29eLZC37qFnh7iOyADfzLyD6hbe7sAAEu/EBZJxwi2AnY67NN1st+xkPRyH43AcAOLD8b7PGsRA7A3aAgvim4PBYDabsW8XNU/kioCuJpPJdDpld7kWnwXXRr/CpAigD/y+kbEA2UFp9ObmBmgsAB1k4yT6oX8HiCHOmYwnvpkBH/ZgKEDRN1z36QC5BqMHcBUbzLXZGtBMsEJ6vR4tZbDb0aaDJsvApqlIuFqt4FHDTBvIEVMU5PagW+pyqNxXKmB8Bkt6YmrEasnBRM7Jzkdg9wyFYXBEgULqEuLpYw/ebDaz2ez6+prONkAnyQHUHZetVgsZKcFB8liZdAHvQ0LFJlltyU1xYVwmNA12ux0Cr+VyeXFxgVtKwtETaXra5QADgy2l2tx8rw2Fhnt0TAONsDAM5/N5nuf9fv/09HQ8Hjebzaurq8vLyzRNm83mYrHY7XYnJydQVkGjGa8auS4qECgbAKnRba3dbleqxmGv4Us3zEIPWvfPavdkYA0Y6kCd8KWaGqBDLrAL8U/Esiiu8M6zMo8xDMMNLT+Cb6GCihb61M+OwxsHoRxyVzHr2VKHm0DCMtFnDB6sEihIYJUg3ZgRLdr2qcqN80GjHz6BxDHqxOHy6ai5Wq0mkwlg3+l0+u7du+Vyia5AEI1ns9nl5eVwOESv9EOKeASCEaESuNek9ToX8pPxNa+1U3tD4VowO7rd7ng83m63l5eXLOlhayC+gxnNlQTQIWBfmMtTXx4NHEiNNpvNYDBgtyAmOBbA5XK5XC5Z/KBVKTaL8Xh8fHysRdWBgkGDiCwYrbNMw08ylJ9SQ/KQRCz7UqnmoUxIvJjTYa88yxMLV55aDh6HV4DEAksiP96ZJAluJjZT6n7S9wbK/tvt9m//9m/fvn2LwYzKRxzH/X4fuvAkTvIb8eHa9ZQp8Xq9xnKHZQFWBCjosgbDetJ6veZ2QJTnEzo/HgSIUZp9j2jeU5Guc+s0x9CDlrRTPMwYv/jii9FoBHkr5N6YpMAEta0QJXEJ0HNn5NNB+MTgRJSrJ9eo4XDY6XQwaFGvKooCODsKtHgKy+USck/Q3fLuhn5YnvARToACF3CEW6/X2+3OWhsENopMGJr3TdjOGpdLmW2KwLlXufs/ZfaNM5GLQ+kmEsbFdLyZdXbzXFzZdt/1e7M4+aHdniZJHIadOG7EccSpwY0Ae4H2bEAcgtNm97QoPQ2NTeC6sHntqoNdAoTa0aAAaSyt0cxthfKXdKcYDoe9Xg/xpNzXriVRTk9edoTwPtOcDcoYvV4vK4owy4bv3n1sQe/xBctjgO5F3OprvkfMrKs6PL5xaCDG+1jtTIWFkWUA4kFa6pfrs9Y+YqcgqQMior1h62xfz2G4roTgLc4a7NOvVKcdOOeiSOK4jEIjUoZBESRZ2EjDTm5K5xpGeiIdkZZiEGcihUgmkgO/rQHEmchOZC2SiWmJi82mjCbr1rub3mKXGnFZbnY7ybKyzApXipRixNpQ4qhottIkzqK4sAE+sTSSBzYtbVZaE1hrbamu7v240AGD1p14iBvr3WGvSooMgpUtzCaTZWGlabZ30NxZ0Rhj7w/XvXVrua+ppYNtzz/NKww8ghHXh3d9eHiSfR5n2eNZ65YIdq8ikqFforUWHWZInyFICCUuNK2y6I5Qv9vtwjsEix7S28FgMBwOB4MBIE7md4hgJ5PJH/7wh7//+7+HQzIjee6wiBOwHSN3Rm8QqS2ApIE76zYIzcGi1BXBX/1PPbXJZ9K7D8FohmRev4inDOMttnRl95pN98rdMHVllsHV2KsqeVeEKCXL848LqVHvqToNPvHY+U0Ah+NwHADiw/HHwiD2uGmeplK73X727Fm/37++voZfeaPRAD+FPERoNQB18vSVWAtFJZDcT0AG+BDE4thWgb+g+LlYLFgGDIJgPB4T3gW7tt1ugz5zpzSfJMi1WI9tNpvg8SG9T9OUgBehLuzNSE6gMoF0C1cK0AS+asg9tD+YVyNFIwyb+pEEIj3udrt5ns/nc+DsRGmjKEIaQ/93RsmPxDpAT/aaESOM1kYrjOfYjooKMzjXxIMQT0jVm0PDOuSiMC9CwEEGJaAEItR0EgBaxIZNYOVIuuhnReELjQt73YI4+WazCZ4ajdfAWUNE8kHQ54PIAkleOpGuk0009EOCM33SGDiyMAC8jNLYGNIY8NRypUs7wymMbd5kbQQMpAw6pJpio1No5xwt2kgR1YAvxxUy2LohSd3ZCU8QUAI5pFoKkEkdFVq4nrADQEtse9CwzsN1W4C2yyDeBIQOkR+vmvRkxtwaHCfXAEtTXh00Q8cHskeBOsUaaWLFhTMXaPJisSDXD53OIGMSiwf7nt3ldZpVvfmOhDsNlH+QCvT0Ab9XoY9aHKRRNBoNAMQoDnFdpSuIKDE7OqFBrADNjPhMPDUYcGNsQzAXm0hRFFB3nc1m0GP57rvvkiSBrDnaUxDfc74gTQWsySGK276XncQUBXSYpwDomEraXI6JB/ZEDBivXZS46uMeUI9gPaxR6Z531lw9UjkBDrwHlVTke7xk1DJZtoEANJYIFJx0zyZSWa3HquEDCunQaYBGl6BqjkYjCP2zeIAnCGspXXvbu9r8BJHMPuHIvaqpVEj3ymwaswbNFhKNGKtajonVTcwLLKEY3sQNvZ5iiu1QuLzON6f6BIVZuBdoo07USObz+WQyub29ZUeUBoi5fDGio36L3lm4GN4tnuKCoIxCY60B59GIs65wRZE7Z21L5NjJyImVwEhoJBYxoSuDonDipCz6YlphaOLIhaGEUYDFUAeZHm7IKBHzlxVobmRcnPViqLXmedB2ArswViFsTKi5AothEw8BYqzVrGhyy5P7imGejIyHNur+GwoN3fHgRKIsS+L4Y4e0eWDBf0hJ9iEB3/o75UOSDo+I5u9l6XJQ6WfHAIB9hBoR1oeWZsKYRIKAk0QlRhMVPThY9/4/VIHzrkv3YxljnJNqPDgRF1iXxHkc5a50YVAEUW6bpe0WxopriPRF+iLo3CgfBoilekNZAcRNkVQkljQJZnlyNu+GZ67ZzEVckZsslSIry9RJ5iQV46yNyk57c3w86/W3QbANg1xEjBMjhTF5EBaBC4wtjQEabUVcVVYw3sVqza69z9SDYj0BaAaKGpwNgqDc7cxuVz5aV8AHuRok/fTo3cMldXuQ92lPwYg9KvpDBrP14V3vcqBgDvUQqHhO7NWrWWo7Yvxiq9UaDAbj8RgOwHwE7PDIsgydpuyom0wmP/zwww8//HB2dnZ7e8smPJ1901y90+mAvMVllrGx15JblxzhmynzKEo2mhlBvU6jDa519sFdCUG77i32AjDuWUxR9V6ppfm9uhdXEtwQbnas7PLE7tgqoAcpiPzJa/SPD1wOKNThOADEh+OP9dAsG/w9y7Krq6ujoyNudZTNhZIRMw2mW+Qtas14rshEDAmRgBqDXS3Pc4CM5DMyJciyDB36QJm5a7KFEO3kotQAtHIldhT2mIMEh19kcz1DWJ34AQTUfYs8MWyrGpiTqgkRP2J/KC2tAWcgT2ZMQGCUndFkLBJL8ghQoiRKGZ9pvwVPyE/rFHuamJR80oG1xjWo2smb4LVm8xHQ0AnZF9jiWm+RYRMuinhKXSmSmS2hOgCmq9VqsVg8f/4cNXCgq9oE7ylRJumlHqmETbsY0nUIT4P1uvrNx8c7wORft7XC3An0JbCKAHWhVV+PZx2qAmGhxzcTJ60FRlSC/HG2humuN+3xrZ8ykQItyUJqD54mii5EOqIo6nQ6nnKu/kUCr/SmJzCk/YU0+0MnJBQB0PE0qcpaMhgVHeDOXqct+Z5YduI4hogBMT6AxSg/eNRRvQZSDwGrRBzHw+Gw0WhMp9PJZIJTQm0AK8l6vZ7NZqC7cmCw/w5ps9x32dZpvB5U9Y45L9H9NKEJjBCtJSc1syO+CNAQagOitLkJvpM2AkwEiCrI1yCqsHEb45Cu9OTcado+xuFqtbq9vYUdKJBHymEjcaIDNcUlsOOwzPM4Jv5ERFKrzYiSgGBhjECbZv5yjO1NMp9YrNVYnjaF03eMKCTGOW4pEBkajWI2oZgEMnKn0xkOh9PpFFVJwNx8Ipjs7PXRZ+WhMLwnvOF47nqRIcFKi8w+nsN/8sFB/MQ7r8VANCLsqR+wwQLQIap9DCoI4DJs0IiD1qIhjqmlTrhIEsAljokOBjKIoYhFeBrzRdsDoIiiVwZ+KYexVp9AKR0YaNUqhDYLFwRBEkVGkrIMXXknwGpM6Zx1khWm42wkYSlixFgJRAIRKxKIBEaskVKcta4Mi6JZls3ARlFgg+BewVv7wtWjGr2s6eJcHfTfayRV3+41h1rHbFq3x9trPHDEg5M+FtX6MQUP7AF7hYO9LWAvOryXU+kpaD0ODXvOXY+gw6I0psGbBj9dI1bkDhOjIVlYVLcQztATSAFFAMwGHWU9ZJonNWF3jevpcSVKwySOY94Va4okSsPA5E7EOheJa5XSFYlFmiIjkUENIM7Vn1LRh10FEGciqUgmpTGbOJwU7XJmli6Jw8IaKQrJM1Omzu2cbJxsxeQmjMvhcOZka4N1FOdBsBNxeWHyQhgvmPdKJLgcrbD8Xnu9KIq79xvZi60zZasPIS94083+eRTZNHUPt4NQjNab9d6ArKtC18Fc3UbpPfe9rJqHZI49B4h6hqXPjXeGuwMXXrQP0p6da4vW7oN9HMJ7yHCxAYgpA0ImsI8xBZAtoq2Buy2rayKyWCzOz8+vrq6QPqPfQsPTmiqLJEIHgdqaT9ufap89bTjB761zkqh0p2+jXr291uG686SWr9wbCevqJjdcL07zImqiDdp0lMJ39ON5vxR8Qj+TkTu/yh9zJAeM+HAcAOLD8Ud5cMclATAMw8Vi8Td/8zdffvnly5cv8zy/vb29ubkBgxg8Ke1lZK0Fy0ZTV5jEkvKZZVm73QYug9Zs8piAhUFXAVp49Chbr9fT6RRcHkgmgW/LEwiCYDAYXFxc4Ny4i2OLJcETW9R8PofwP3NpNCkDjIa9FbJB1BXRxk7YGuRiZNoMBZBlYV8HFNVoNCCKRyo0I13ebXQKA6KiusVgMACSRZJ1HUXS7BVtuITzByLGkjVFipHZEsFnfkswEadH/WKQxSA0iUvWYRlpMp1OB4KJ2pw6SRI6d2nnOsI00OggH4SpGpBTzdBkxHBzc3N+fv7LX/7yiy++SJLk/Pz8P//n/6yd4p6YrfH+6BSLERhwfy00IZX/Hoe69lKgmCOokSJCSa8oim5vb6+vr5fLJcgv6/Ua1mro7Ma4QrzIj8L9x09pVYzYkYV6gAW4dQQs8E6gzxiQGPyYX0dHR2xb3u12BDXYGc06CoYiHhym22g0ohQsHyVUAhaLBTVP0+rg3aPyJolFWBAYPYP1xgdBUJuBNWYlb4KWeiRTktrBHDb4JyYg6BswaMZ4w//vEpsKpmEsS5oDkEoM+8FgEIYhajz9fj8Mw3fv3uEuoX0Yv7jZbM7Pz3/zm9+cnp5Op1OQainXLiLdbhdaE2iSqEujYrBp1RSG3V5G9HRZlXoar6tH9UCcjxh9FdSwphQPiw1cKDCb2DNO/BeDARUjSLhg6FKYAj+11qKfYD6fX11dvX37FggmiX7oL/EsELHEYQhpedx61ucZTj7lvu3Vo9CsJfKs+ZmYcV777SfsxQQ+RHmX8dpRN+WQQPEJVdt2u40aLXYxuJZTvOh3v/sddlVYWUJddzgcwhgnSZKjoyOIO0vVhkJbSF2awoCh0D+gSZ4VZ5bmh1LVmn0Dj2hAfyJAjB3kflZfJ0MRBcYw1rsA1xkAW5gCGFfw/CmKYrFY4LmzoMiRrFtPWKvgfkdiODoMiMIQOqd2xGQyiaJos9mg8wm/iDaF2Ww2mUzwNq4qWJkxQRgGsNzoMac4xvAj+r/ned7r9bbbTVmsnMvLPJ7NTrbLbpFHTkSs2Egk2LogT+1xFr9wUSjOiRFpirREQpGWSAeN9q4Mo/XuZLn4otuOT4637W4jDBOR2DlcsiVArMlouoTAvU9jUg+htHt1XfgV2B+Bs7CnW5RLBH+dRUcEcoxzPK9dfZN1+YQzxavZv8etRKSSj/3YRUFqvSYP9ek/bsu2FyOuo2x1YvLjpTVdqMC40gImbDhgUkCwnjGqxyTgDQcoTECZAt8c3o/YjdbR4bq+LfwYy7I0xhkjQRBGURCGgbVQZygDJ2VpdqldZfFWwjQJioERJ9IWGYn0RRoi5j5AnD0AEN83siszs5VwIs3VJrrZdaxxYsQVUgJB3jlZiSzFpSaK85NlEDeXQbQyQZjmuTjJcpulpixx2jaKAhPbMHLWOmuciMNDM0asddYCJoYFl6tThtk9QNJlfWjpQF1rfYA1EFZKIHufhLU2VGtQvU1NPy9P6mGvFgQ1nWSfNeLecpFe6rVXap1BXGem83WEnYw3EP5hJ202W8YIiCyI+bEmINkpigIzot/v0zaDca/2gtMaU4vF4vLyEgpC9254ZeoOwhOSDsTDODfd58pqet39WOswaA2i+h3QbR/aAp1Fel3m9CB7qWk7eBZ2Wsbd7Sv08s2M5bS9jfeY9LDR/ZeeIIZnUPHJlAtBM8GPOVKR8zvvysNxOA4A8eH4Y4SJkeBhMV2tVr/97W8J73777beIsG9ubpbLZVmWAEroRDQcDpE0IpVFuyt2Neyp1C7Agg6UCmBWszrSNJ1Opzc3N8hasXBPp1MkMM1mc71eX15eGmPQ8mmtBdSLBACcPpqoasUiAA0U+8Pna3ElEcHr1IhgggGYBqgxux0ZoADyJtZMmQvQjoiaURyZNCtEt9jdkbRDhIEECm+72puoeJEcacg4T1EGFABr8KXE+KCHSEs0vo5tWFOWvLiNeCICenrc8dxwT4ABATbC1wEqvbm5ubi4YCFXlPrYbrcjT4QaXnguNzc3jUbjL//yL3u93t///d9rVuNH8XQ001xjH17Wp8Mg/ToDIIwBOg7hHrbb7dFo1O/3rbWbzWY6naJOQLViHowLeetwmdTMopQKcXDocWP0Qt92Pp8DHkLBg7KJQA3Yeo/ufkh/UAyU4iGgOSPexZTEVwNoGA6HgBL4IhUeMIt1kxf1JRCNsf+dYCK1sAEu08IR5FDN7MPr1D6GLAzpYKL6A2hNibMCvoMcZrlcJknS6/UGgwHwRE5kQLqLxQJAMGNooCrk6AEyExH0MSAEPzo6ur29nUwmFFhotVrL5XI6nf76179+8eIFADtIl+IWsVcdIJFmVTNy1QNMgyZS89KUTzUX0p0HLMCQ/IIVabVaUZq82+1CNECDpPgQcrfxIbgzbCdHYo9BBV0g4Gvr9RrfhduLelWe5zc3N1dXV+fn59vtFkTXZ8+eoaSBcchVCEMdz2uz2UDUyDkHezQ2NHgV0E8omtZBEP4d/Fw2nGJlo4LKjzm87yVQS8gVPCAsWVQ2wPaBSQFfRPx0Pp+j/eLbb789Pz8HiTtNUywIJBzFcXx0dNTr9dDNCi1dSslzRnDisHyLtQLQv6YHosYDEBNVZ0/3gB/1yWD6PRKTc0VZyj5db7mPSmB9QMEMytdS2ZrTclM/xyAIJpMJdnNWjjFlsLSiwsdaNcohWC3hWUptK2xqoANzLWU1HQqS0+n0+vqabgqcs2BTQrmSdw/7Jls6tFAmdqV+v88HrSEDPZcrpVJrbC6yynbbm0lj8Z//YjZ/ud20nDMSiWmLNDNnyzJp7Zov86gnUJ9IRDqVK5cRaYrJTJ53ZpufB7edXvfbTue709NdGEVFkRQFlOj9Pl+PZSY1Fzjd66DxPr5Za0OxwEYVFMAoFHci2Q2Pg2ABwtRer4eqmBar0djBQ0oOHp+O6iI0uihEQhFvafowg9ha45x54Hsf5yx7yJr3hjoeVAfsvF/XlGoPktYexaQPc36RgILgmb1NdVUKjFXuDjRgxCMD6Ia1hbGKNqrSwZuHc5X3jdTYmYFCrYgEgUSBNGIXx2UYGhFTFJJuw+Umvl3E5/Pu9bazihr5MHANkZ7IQKRXAcRFDSDOKlzYKQZx/v6d5dZkuyDfBatNbHcOaLJzIrlIKrIRWYosRDYmiPKNk6S3KIN0k9tWa+ucy7MgT60UYgPTbJSdTtnrF40kj5JSnMsrLqYxYkwI+FvElKWjtocGALUygKf9pVudtH60aHffMIzS9JGAxALWdK58IIDxXCg85K4OF/LEPAVt7Vyy5zTsnZuphoY9+rCOcOpANgc5hhxM5J4/f/78+XPoNd3c3FxeXmrMHSE3dmr4VcKeRAugoYCKcBRBPp7fZrO5urqCggTyCN1RhHUS2hRw+kU2qu8hwgDYllATkjGnVoHwVI/qFGzECcSy6evDx0GXjjpA7BUkvIeuq86esbmGkomM710J621w+rd0+FHnzjMZtD916fpwHI4DQHw4/hs+tIQi29UZPadpulgsbm5uEMPN5/PlchmG4bNnz8CUROmy0WggwwFmBGlIfFoURZCqWK/XwAiwnQAFYFMq5BFvbm5AwgqCAP3a8/mcyRiYyADjAD1A+78eDhKo4gagJRGpJ4jNGyxgINrARHD+ZA3jbbp4C3gLZibgRBPewmXSRowNvDglcOgowbzb7QaDwWg0Qk6IJuuH4AzPalmTXLhZssdZe6kRtUeer4NpQmm4P+Ar1XtjNc+RCQbpnLz/ROTBk9K2GGBcpmk6m81QA8DZahoRjI/g4QAAYjQaffHFF/gVcA8RBpEx+lAfJVa34H7vTmBMK4qQl4DCJM6VIgF6aPGIjUEUGRDLQB9tlc8Uzpkq0nTONayNnLNFIVkmWdaO426SxMaURZFvNibPm2GI0n+cJJ0kiY0JiiIoitC5oCjyylyoBB0S1MUwhDF0sds5kSwItiJlUWzm8zzPXVmGzmV5nq3X28UiiqKk1+vEcRiGzSgKrE2zLDKm3+tFYRiEYbPZjI0pt9t1lmFKF9ttWRRhGDqR1XS6mM9LqDo0m7YoWq1WK4pKJNJF0UiSVhzTxC9N0zKKCudK59D7r2Uf2WTH2I6d2toriRMQcwE1FVYaqPFCU448z6EwS0mN9XqNpgSuM7RPwTdiTcMUAxKNwUw5ApwMcExGycCGqD/DZj0SoMAFBhMcMBwmeKvVGo1GWZadnZ0ZY37xi1+cnJwAygcSBEJxt9ulcoXnjuJRdTxah6cI8UgW9BSYWBNniBdzgYKbE7C/ZrPZ6XSstXheuGmeTARSFxa98PjA12MrAxMbPCa2U1C9BE/KGINNYTweDwaDfr+Px0dEmA3LumCGm7xarYhZ19ObH8tRvf85wBl5DsjBaAX+U+3Lug2TwBMukGpFfKAU1waUicofXqF8J55Uu93u9/vYm6jTigm+XC6hWczVdbPZAG0kIsDRyKnB3hEuBdr7hSBgvcz5k6DDLH0ImHKKRasZTKzl9Hq98Xh8enoKpSxNOGUbBzZo4LbQ38fd5j6OG95sNrU1IhqJUO4FqoVaC0uw7NgARqwLdQAxSRXn1snZSschanoAx8Sz8zAyNH8cHR2Nx2M0rHiiLqSqOedCyGiGpizT+aJY7nqp/eule7MuWiJGnBMrEpXSEtcJyn7iGokLrViRRKSp9tqWuFyKeWt1+5nZDabL4S5t2GDSarkgCJ0LjLEsFmKU0v+QNGGCRBxpdelhPXI4LzzHKo49FP7x4Vr1mLcCCzII+IQdPc61VsZ/iKjLbYJt43jnnS+uMYEx0ccAxLgMo0CxOsPxEXS4Lrnr0es02uutmV69v64HVcfsiB/Ro5LEYS2bTlgft4W9KUl1IBTX2nQUeWO9GcEqnhQVYD0Oqccu9IxVgveHK8pCxIVGgsBZWwa2CAMMSLtJo8mi+e628/10cLEZzk0zbYduIDIUGYh0RKAv5QHE2X0GsYiUIkX1B+/ZiNsYtxYJpFyb9452kYit9ChSkVJKE86K9sVsILFb7JqNZirO5aktd1YyE0bS7aYnR5s4Wg16WRRmxpQmF2ulLJ2IsXfyxEbEYBqVJXKie8/Uo/F6wYmHrDH4v1MoqsDQx0odlUD847vqE9WxfwQR6qF9xz3S5+/BmtzvcAAybjabIg41cgCS2iyOMm5ap5gAMdTSdE8DEV7s2iiTsCWXXFpU5RkYYAZpgJhh8F69DrmvH/LBEpQnAK1puU+hLOx9gxfkaI9EnqFnmyEPe3JKzYp274/2PNmfMhw5HIfjABAfjn8SB4APvWHQLAtBM1BdBNxoXG21WsPhEM0yINEAYwWZFzE34zaQXJrNJrJHQIda12Kz2cDUCJoGoD2ipxviDLohEekuIAPulPh28GhIbgXYQWdVdsHo9mpkzkVRDIdDhpVsakZzELjPzJnH43GSJPP5HO4ZwLDYqL7ZbFar1Ww2wznI/fZVEKsZ7AIsBinM8yV4RBvukcBFB8dMvQjTayMv3AHgBTglSnwAXGDCSRVgPgjcSYbv3L+1xG29kQ054Wq1QhoM0FD7ElB+FNVy3EAkbATayP3ZbrfMMR6KS34u8lcibRWlh2XZ325FZXraefzubIF9BEGAGKuKnGwVWr7vThVxIm1j/urv/u755eVmve5dXcVxfHx52e/38zx/8/33/9fvvkPhBCO2tdsdG9M+OwugX1a5tL83mwoCi9EOzxFgAWEYBEFeFO0KVgCY/mK5zPI8DMPO+TmIAwSPAmu7vV4Sx2FlmQg9P2NMJNKuxoCI2O22vd0WZWlEYlDg4zhpNOgaTNURUxTd6qXtn/xJ+Od/jvmu+xNZJNCULo4H4IZauAMFGBB7B4MBlGfZis5wHHIHQF7YLwxQgAd72zX1m1RHopAaVyVHWxtoBEHQ7XYpHAyAkqsiMlgYXYJrCUAZHiA3Nze3t7fdbrff78PeDVUu4K2dTgdjeD6fo5BGjENLSZDloeUaqIbhGfp9Uo50T3pVZ9GEyTCvoewBTQkoY1B7BPcEBHnCxJvNBoONzHe0MrBqlSQJvOwwbDj9Qd8bjUaY0SAFY6lHIVAnOavVimRPrjnaP4rpLnF2bam3N3N4EptP1cl0DzvgcpiPu32CoZ+GDlM3RpRuOGsGXL4I1nskdDwpwL7OuVar9eLFi16vh/Xh6OiI8h1AD9HNDXo7Bxv5lTTAIVTHyUVhmd1uN5lMiqIAKImnT19NrtV62f/JTOqwXJAhphA9Qro4f/gugkEMRQ5WxyndoGVzMIWxTYMUCQI7pgZaE0Cxx/3HmASsfH5+fnNzg2IntnvMBX0DKQOF6ikRZF0B1XQq8r/w0EEQ1rgAbylUREAMBwBBMjICD+TjzrkwsEkciI0Wq+F807laHc/tn2264ywJxInEIgORbvVnINKqYKyoAsgAELdFcimTQFxzs4yvl9H3b4tW6yKOl4Nh0UjKsrTO3c0aLjhcgjz7hLqFoI6mvJ5lDamQ2UBett4CdGd0Vh3oS9D7jgeeaiaarnxrxiVKCxrj1sqtJghCkeBjAGK9WnkX/ggsIjW2dZ0F/JCZ20NQjte77fX+E9CnuR9ViQiTaSUrShWTsK/RYboW81e4HEnV5o9Nge/nc9mLieuaq346dxR1kbIonSvFFWLKoiizrBRXGCO7XTRdts6nne9uxt/Ox5d5d9lsZq3AjMWNRfoibZHkYYAYrGHZzyCWjchGpCHSEGnKe4C4qIzsEpGGyEZcYbIgvMkG2W082fSisBAnZWrc1rjUBKE7Gq6Mmbba5VG+FsglO1uWUpYg9pNAY4EacyesE649fXBPuJl+m3r2lWVJwu0nxCGyT0bvKf6lj4CADxdcSnEipTPOGSmNlJWAM9/ApKmOZotHSg3DEDyTqi115Vy52azSdKtVHVgO0XGpJuNzI0A2iiULO7iWbGK7IR8QCrdacZihuLZx0854dfkIzc99omrZXhKu7k3xHiuFoT2zGU/MpE6VkH3eGw+J3mjrmr2i7Vqj3zwuQPNxAMoBQzocB4D4cPwTPYhdIhoLw7Db7Xa73aurqyzLANnc3t5Op1OIFa7X63fv3oFtgWZzYEnazhsvgllD6T3nHFvvAdZcX1+D0cOwA/QBfNRisciyDF461lpkNcYYthJzDzbGQD8R5lHaNBzpqzFmMBi0223IFwBwxPYJiCrPczS4iQhQD/CUse1heybYRKAKyrBIRcCVI7GLYq+0U8MGzDyEWAmc30kJREBMYvXjALHOi+S+AR2uHSkrY3SC8vxd5oqwMwLmRekABPRo0sfVAXGgBxfxLKka0PDhCGUQ3xAJAvpMEqhUWmYYgXmeT6fT29tbwEyQooOYLNHA1Wo1Ho87nQ66tDCo2PnrHf83kf+HyHP9Up7LZPITz5+rK/n2270/+QtEmnUOw3/jR97vX/73//3mz/9cHlB807IhdSqKKB8MAseeGrIGUCjsSFaRDnZ1jUFPB88FTiecurWtzsNlCYQ4gp6Y2kJQe5JoaResBshgyZ6mGomH5YkyTeLZ6q43zy3Eo/N8GjpMjEA3IkhFkCSQhNUpCIKXL19Op9OvvvpqsVigIwSrys3NDZYyVJKQNRH2woOGvi1koAkHYC4Do4FkUL/f7/V6o9EIeweSB2riA4Xn+kmQGm/W+raaWkh6oJaf+7Qxz0cGDYfLy8vvvvtus9kcHx+/efNmPB7TGZxve2JL+EPZlyiTdLnf6CNK+ZSSGpCpJcN0s9lwJCdJ8vr163a7PRwOIXGLp4AWHGjF3NzcTKdToJl0pyQxtlAcMRaN6CKFv8zn8++++y4Igl/96ldffPEFLrzZbA4GA7TaYDvwOIk/TSAL/xxrQyXejWkImhVybBRyjo+PES0Qs4Z6A0rFWvIFs4AyDgBb2+02K9aIGdByxKhjNpu9ffv266+//u1vf3t1dQUBH0QsEKAnuZty0ly7aOelf+rpJOIMIX8JOSNKT3LXLooijuN+v892KI3IE79wzom4QvI8z9ab+Nu33f/yh9dfnf/Jlennz61EIkYkFOmKtETaIu1KdxUAcVgBZIBZWiL5HXycnwdXN93/+HefbzedODwb9m/b7e1uF2SZyfN7NFIuQWxg50lqXGavsAPukqjWcoryb7fb1WqFpgR2heO7CBR6dEUqg7GkpCEJkoK5HejGCPKFNRjBYgP0O6OPlJiQfVZrH0LB5CEFT83/8HTJPHT1cUhuL/LCWj52Pa3ZotFhOtAiukNojQoHuk9EtaYhEcDywsWHnXAY8953ebCU1grQ8LQSNLDGSGlNUZgsN7udzJZGXBGY0phytW28u+3/4Xr8D9PTt7vRMkqKVlCMrHsmMhbpibRE0DFCDeLiaRrEuchWZFP9P1UAcS6yq+DjtchGZCdlGs7T3nrXttvCiDNOJDNuI7KVwLrFbilBHDWk2cm7u8jaIt0FWWbKUoyRKAqSxMSxhRyUtc5ag9BMuxHoo67lKjXFknt3tSjKonAfKq8a1kz2oXs6+Hk88eGj1FCjDorufYIxIkaMGClNWYqkIoVIaZwL7kQ9jFrCwtJFImFZGgxbIum4gjiOe73+eDxqNpvWBmEYNJutPM9ub6/mc8nz7XR6O50uZ7PVep0WhYPkepLEdAS11gYBlO5bYRgwAJ7N5ldXl+fn5xCaR7Y1m81msxmiIJZhGPqyhQXFTuxoutlCZ/esEZIEwKevRZD31oSIL4uSptEqHNoLVD9WL3z1fFxF6fVLtTbWxdC1CLLnuy4P2NlxT/FKxdxbGV/R8fgu6v4En7qtSCFykKY4HAeA+HD8U8WItb5Pt9t98eIFjeCCIAD3bTqdxnGcpin+f35+nmUZUiZ8ArIU+khApEmqThk6rZMKSlby9fU1uKUAc4EJWmtfv35NJTJWbsFoRmMsQGpYw6ENlmDlarUCir1arcDlCYLg9PQUOow4Q4gqkOwGOieQTVR0wbHlTsZaKzVkqTjMjRnKmFRrZUAzn8+R18FtttvtIhvUe/PjVcx6BE/41aNLiPJZYvyEA7w8JL1aB5CAFOAA9P7jd9EtSGGH1Wq1XC7Rfg7SHGmhdQY0IwY6jRARpp8sDRDg94XE4PLykrKMgC3m8/kPP/wA+zs+a5J3/vecPx+FdLj/5ivOrppf4DtQHI2JNPEsUreYeOj0g5EZE0KGjwQQaQPFgBIzbr1eExAhzZZJvh4PaZqu12vMMgo6ExTQXlKilBbIVQcWiYlMxhmQr16vB8k5GOihhgQaCCQIer1ep9NBwSnLMshcrFYrkrKZ8NA2kEAtEzAAJZpT7NmOf9Q6r6PqejYIZnSj0dCyG1EUgXk6nU5F5Pz8/Pnz5ycnJ1hACPRQXxK/xXxgt9uBoAoguNPpNJvNZ8+eYfygB5+yhuwdIasDNECsV8iIUFzEfYacETjddc8iovYeIv9jSL74qH/4h3/4m7/5m+Vy+S/+xb94+fKlZ0v1Y75CU348SIgK/rhXYKSC3+2cQ/sFNut2u01th+12G4bhaDSCFBKqs9AlBwQ8n8+hxA2SOBp60IvAznG2nnC/oOsgTcBms9l2u+12u2/evHn27Fkcx2TfI0iAJIsWBvkEo8WHBrYNAmwDGiTlloR5DYFgXDinG1UIqDajSUW4UrrpwupTiw4DFIMSMWnCi8Xi4uLihx9+uLi4QAU6iqLBYMA349Z5Db8YqBixiJcYzGjBGa54INq3221t10n2MVYt3TulucnpnamUEXES5kW+3G2T2cydX7bPrgbZMCw7RtogIIq0RVqVJV1TpCESKoDYiTREEpG8ypM3Usay3QVnk+6os1v+2UxkEccmz22WOd3wodn9XI5YLKzfHL2OeeZaonyT+Ey32y2Whb0Aq8aqqNeJ+8MFWVdr9HD1mrK1ajkDEmLc72uKHzvaKyqjZ8G0N1bcO5Xq4LIW93wIfJf7nSWPfD72d+3AwXVYQzwUNuGswbAEsqxdCqjtBj4BCO+6KkwvO02f1M9FjxatoltXJBdx1oiYMnNulwaLdTibN3apSFka59Z5crEYvFsOLnfduWlm7UD6IkMj4wogTkQihkQV8ksdib0AMeHjjchOZCuyuw8QFwogJka8lnwRFNvAZPdZyU5MXtqtaS2z5iSLWkVn3rJSpDtbZECBJUmk08l7vbzbzZOkMKYwprBW+OQ1O16TKb3yuTbylfseZYgnPrA+W2tUMaxez+CE2utN5xXU9bP2fuRPChExxgIidqVxDnrPVsQZI8bcSbmIc06cK5xY52z1e6I5DXEctdutwaB/cnrS7XSssWXpnLg8L6bTaZ6tN9vlcrlYr7PdrsT66pwNAssdJLgTQAuTJGm1mlEUFkW5uyuvTs/Ozr777rvz83M4i7ByiUlBaxyuMyDuDIdD1DtZINGjXWPK2KF0yKdFkKnSo5ca8op0klWvHHB/8UB/Bv9MB7z13OvY2Cv7rnUn9BCVmmKGud9soX+EQnu9z4CRlSsK92ls4ETEihQiqUhTZFPtiblIVHUDpCIYU5lIQ2QrElUTORLZVH8/HIfjABAfjj+qg+sv0cwoitCG2ev1AAiC/NvpdLCqnpycxHF8eXm5WCySJNlut+B1QpJiu91CHhSLMu3OENWh+L9cLqUyGNntdtPpdLFYYM+AuqhzrtvtDgaDLMtub28RMgIWRMYFcWRSaaD/2Gq10H2WZdnNzQ2VCqbT6XQ6DcNwMBiAK40MqtFokIy2Wq2YD0vlDkTPOuKt3K3pXsW0mWIU+F36nCDrgEhlv98HjQuEOA+v0aXXj82QPcxII/6iyMXIvojo0YVWC//hclqtFoMGEMnBGptOp8jiWq1Wq9ViHkWyjO7lIWSPgAYhIMaGTp+QKpBdhYdVluVisZCqw3qz2dzc3Mznc/widTnlRxADD8enHVBfgZ8GUVfMd4wuSisAPiZyR6DTs0LOsgwAK+VQkeFjtACxIp8RaKAe4TpeRKiK2QdXKMAu4Ptr5ze272m2Rd34ES9CJAd4XFmWw+EQqNz5+TlIglj6kNMaY/r9/meffQZJX3ivvXjxAjrF7969m0wmmsimNVtFCYjrrIzx9I9RH5b78hRetB0EARZSyj4C42OxEPW82WyGXhDAT1geQSIm+5srGw3oAbsQpGu326vVigU/TfWFmg3vCQXx8UXoMkEvAvpI8jyH9p9+dl7ZzMsnfwxAbIyZTCbff//9er3+8ssvSUipgzWf8HX0ciT7RiMa1AUG7Rfe6BAAwbaICgosAQkFosoSRREaaOAZMBgMIIYA43VMUizs3Lg94iQRNNwEsm9Qg8GHDwYDRA5BELBh1us3/+m1/oy5k2qt8es1BKbdwzx9UjIW65mq5yakwWWdA2MZIY8VuT1q3rhRrVaL4iTao0/nt1S31PUAqjaxV5dvC9VBgNijXIkicOl+fwDExogry9LkRRHsdm6zDXe7UMRIWNGEISXBPwEk+UVs9Ren/i4iwd3bylJ222CzibIscM5Us9FxLMu+3uG9PeP6mXoQrdcp4vFVMZg9U7X6N9Z/XZuIekir/nYPs/b+fu9afsygd05qcO3TOQRelFinDz9Up6l7PHgiyCypErRFrc5Dh/XSQQYxGiN0ARibPlY2HpvNBhLSepxTX6JuoFcHxzX3UPcHIF62UrqyKHK72QW388YPl4PFIi52RpykEk+KzmXRX5hm3grcwMhQZCQyEOmLdEWSqiICBYlSaQ3nCvOV6kdahqJxHyB29xnElJ5oiKwBQxsXittVWBKKMaFIFmxMfLPrhrdlLkEj2tm8zLe2yOFu6Nrt/OhoVRTLIMjCMLcW6PB7dWtPPsUDfz3pYa1G/d7aFy8+Sm1BwLfX+c0bZhom3ju2tdeuxzPd/+3ijDFiQmeSwgTuDqt7P1YcRJnLQlwukllbBgE6A97XrpIkGQ27o1F3NOyOBt1ut2OMTdN0u92sVuvZbDGfr1bL7S5N8etRKEYkDG2jEXTaSbfbaLfiZhIEtiyKXZqu050piqAois1mO5/Prq7Ozt5+/9233/zw9u10OoefJ6kzqL7QHA9DvdFoIJ1kVsvMTm8T3KFQWSdniCsnt0Xdu6Zvsr7n2lRGh691wRCWjnSTH4vf9SFXF3pmxkrvdG/9r0sPaRqKbsvjlTLm5+Xc/conaxDbqowaVqCaqfZBU71oq7cF6j1W4XAH8ePDcQCID8cf4YHyvmaxIRWHiwsQgeVyCasTQL3D4bAsSwDEwE0Q5PV6PSCGoANj0wIfjXxASBbAo4x5JkhksP++urpaLBbQndRVR6l0G9hXi7ZWEJYB2kILEgKIzjlUYqFQDHIT9f4QiRpjwCeazWaLxQKhJ1ix2i4ZkASyRIDOcFsGfZIYmUad9LbEXCVJksFgMBgMvPtPYsUn4MIaRwCmQx70XrQCCDgZGWBqUw9EMwd1t44WveINRNRCHByfyfNhGz6vDqY6KBhQDRaoEzuhmATC0hePiVolbDmkZyBjnQ9CZr8XySqU34s671TH9kq7Vt4aXqaHzrQwDBvNpsOjNyaOoiRJojgOg6Aoy8ViMZ/NyMt+f4G4cNVU5ZOgjUG6L9aaKq5y+5xinDKx8clKkCpj/lKWTrXE3mnGefJhxjChRMz0Xt0vTZPzc4Mm98oTDKgfRt3dx5blarUCMjKbzejxSCIb3cmot6CTz91uBy4e3qzdhLS48Htr+Irdzw/hckE5ZvTrAffEh5DYCPgALdj4cExntryxpAHztG63izHPKhFy1+12O5/P0eXA4Jhuiu/evfvhhx/Q9DAajdI0/e67787Ozgi0eaQGMjtYzmEtjaIWP6Yc6FEnNFlSqh6IimAo7EBkgyTQ/5ubG1AXwXbUupYerUMvUBC6lUp1ncyU1WrFDUjuK2/oOU5WLP4P0F9Lf2DMkJNYxwt+kh0TY6bf73M122u2/ml7saeJp31aSAX10nhsLiKCHBKDBERsYlhchAHQg3OK8gnnL1AeEm3I89WlPs5KcoGJh4I8G8cx2l1FmdrR2xATxxskP0EMg4FXlkHl3oMLwcUiWiADSy+SUjPe8QA+hAToZyeyTKCWUsXUlkFIgMdB5S5RdqxU4kJRhGxZTZjVpQg8Sqm4kCymaunV+rzjs/NIuHJf5OduyReb5Y3NrpUVDWetSZxLjIQVTdhUEsPeH2LErvpnoJLhQCSSIC6DuLAmE5eV5c65wJVSbzR+CtCpx7zcd/j0+G4axtI7L5++p19Mm7u9LfZSM3bzpIe9yctl1m/y+NTh7kRK58x9cqUn0KnHTL1/f6+lnod6ew0QdQ+JvYqx2IV5e3Ubhz43zn0CxAwa2eSBqYGmEC1cg04RSAlhy6DYsVfmqV+yJlHqW3cH/ZeuLLJC8rIssixcb+LbRfLD1fD6ppsuQ1dKEQWbJFkmjV03ct0KHQY03BFpi8TV+BeF8BIgdvf/eABxJBKLJJXEBHHkQmQrd7MvVNBSKRJXAglGJBdJ7/Dl1AXzoulmsljFkSvMTsqNuNw4Mca4Xm+TZjYM01Zr2elkQVAisrP2PUDsDXu9s3gkYtaANW/0w+F3NWge10jxdr2HFgQPHf6QfmxpnDMudEGjjIdFfFwEfXGBlMaUBuiwFFKmhSvXxt2E5iKJbptN12jEUdiAynAUx61W62g8Ho8Hg16SRKU1qYgzbuuK+Xo1n1ztLi5lMW/ZsDvoF6NR3unkQeBsEDaSVq/f6vWazUaSJIGV3Wp+tdtOJ2FgjSnKcrvdLZeLd+9+uLj8/vLq7OrqcjZbGGsbSdJsNqERBK35ZrPJYi3aKOHMgdc1S9cj6uq4tC5SrDFWzc7W6mpAlr1yO9dYPDKOFlYodc3P8wbQpPX6/sWfemi1hqe1BbqWZmYSysFJ9hJjVM/anZ6D5tNaUYuqLCrV/4n/RveRtmgf8BYdAOLDcQCID8cf5UEmKaBPFEvpJkxUheViBtOj0QhwLWh0iNiATsKxh+ACdhegA2TiMLgkXmmMQacqVCyw5XBnwntIV8QJA8vA8s4TgEIu3oyErdFo0E0LwhfYQkCnwpmwrxmZG3Nm7VqObZgBMeEnrRuIHQv0W2xyaIJutVqQL/SyHW1+vRfQeby06SGDdTIyP4conm75B9sa91OUOKyGBtjiiheBj2geB5NkqbVAagMEYhBJkgD8BcGNutXvndOspQBFt9sdj8doRYeWyHa73UsIevz4f4p8H4bD0SgIglI37OukCNESLOmk8j7iK3cUKEcC1+np6V/85V8uF4ubm5soil6+fPknf/Inx8fH/cFgvVr923/7b//Nv/k3zVbr+Oio1+t1u93RaFRWyollUaA44cCjIfXG2sDaZqvV63YbzWYQBK4sd2m6XCzSLMPf7yYU6hzWtppNuN8EVZNyr9/vdjphlYblWQaRTdzAVquF7CuvtBrTNHVlmeV5nmVFUYRRhCfV7XTa7XYYx83vvvvsf/qfwttbESmdQ+aG8QCMCXNqt9vd3t4S70PkSs0B/p9t4FQnQH4Iwjj634EUM6/jKMKnefw4VraQWBJJQYOeiNze3pZlCWIjIGx8CNYinBVyUdDbMTsoQQMSPRYrnrCIfP755ycnJ9Pp9Pe///319TXDTYoztNtthPj0sjs5OTk9Pf2Hf/iH9Xqtdfm0iIS3OGsQXJcJPpVqeW9Z4D2khgB4qSBt4bGCooInjoX3u+++E5HXr1+Px2MtZcP4HisGUAPmJMvlcr1eT6fT1Wo1HA7DMGy3251Oh0vBYrFYr9fdbhdjCV6UNALFs1iv16gbYf1BA7LWAsKdJ/dkLz/ukRXj8ZZqoNtv3rz50z/909vbW3TVPGKc/URcmKRFr/PDk/mj/iyRYrRZgKkKOHKxWNAJCpRwFFMhNAHN3Farhc3x9vYWDG5Auhi3+BFuIyuIYPOxSMDlGozmy8vLd+/eYYXBhk7LdQx7nANKMvVU/8dXuWGzKdZS1RS1HLa5MEjAMkuWNEqq2sZQlOJkt9uFZjEqu6gz8RJwr6bTKUUMt9vtxcXFZDLZ7XZaEQUngOURzrcISPaKGGBdYrnUk5RBBAK9i16vh3WJGTWnId0myYDG5EWPs3OudKU1pTWSps3JdPDt+fH301frsGNPXfFcZCTSBNNOKUu0RFoiDUWPSkTKql/eiBRVX21XZChBUIbdjQsXWX6bbme7bbTZ2N3OOBcEYRSGgQ0Cq2jUZAQTB9EjxDO4pzw9fkQ8kWJWWMBbrRa8BHGjRAQYPd6M/QJBr3cn6y55WpGTFHtPd0JPZy1665zLK4eGTysdec5y74HO+wz0OtriVQfrnOg6PugBdg8pUZAkqNHhOu6jdxbcXkwifQIIAKRqU+OBmYJ1CSVbEudZevQ6yer08Jp/qRGR0pWmzK3ZicucC9OssViF764HF2ej7TSWQlzLlANTjK0LjeuKjESGlR53Uylxi2pNJxZc7GMQZ0piwlZ1F6v6zfGLtpp35n6hIK2IyVJh0FuRlbit2e6idBFMN22zc2YjLr3zYzNGev1VEKTdzmw4LPM8jSJnbeTcXfFHI3dKIthpA4Y6mCjKOKEsClcUH1ROcxUPQ0sM7aXn76Wre6UL3VbltSPc28RhRudyMcZF7az7xa7311njS1fEZmcM7lIhLhPnCikmUfnbwP5vjWY6GhT9/qDZGgRBUtWDe8PhKIkTV7rZfDqbOefKPN9st7Obm+3FZevtu5ez2et+rzscrMej29PTeZzk4qIgbDSbLTCKRGS9Xp+d3yIEKorCWOPE5Vk+ny+uJ7PtdmOMiaLYWpskjW63e3R0BB9UtAppyxmWTDyLZm9X5U9RlWFVkn2f6DFiQxhvKeJY2phTud5rEsUKQByZIDU3I899VPfNEMzV9QZRLTK6UcMbfvqL2Oek5WUYILGVRNd9PUZ8VGndfMrqDMq/PYBJh+MAEB+Of3IAMbubSeSEthFQWm03R6dmZJuI5heLxXK5NMa0223GE0hiKQMPuh9op6ADgE6IfQ7v3O12ECMmtQfdskix4JyGtA2kP+SxDC7b7TYsd5CA4YB+ZavVWi6XFxcXSFlhsw6eI3YXkqPptqdxZEBd+CdTTSTAuk+cOqdkR4JGhC0cGzyiBI+m4ak77W2w2s9vrT3HOjTsRVT8RoDdCLgRiIM5TrKSbt7E34nN8VoQoGhtKc/ZVgcBUpm8A6FAtMFewtvbW4i3IiBDYTwIAhhY0XCv3W4jFUHIohtIHz++Fvmv1h4DFKjMHIjFeO7kvHDP2/eOdGltI0kajUY2Hj979er66updljUajeD0tPXsmZyeluPxcrn8bjj8XbM56PeL09PtYLBstVb9vivLPM/TLAMMNxwMoigy1oZB0Gw1Go1GFEbW2DyObL9ne704icvSZZvt4uZ6t01L57abzQ5S3avVYrkMw3A4HOI+3PHmoigeDhuDgYljXFGWZevVarVeR1EUDoeN0UiKIlss0jTdbbfb5RKD/w45FWk2GnGSxHFcdruu14OWt0SRvgnwqkJtAGhIGIaU7daEcYK5pMGynQ1vAGMIc2c+n+P1RqNBziOFULTosNdLTkAEVSvqSyDhBGoGhBeYuHOOLjekQELNQGqaj5QrxYdw8ADiD8Pw4uLi5uaGXFoAFiICUPVOgS4IgFkQqqhPFrnvrsP49ac19ZJax7TWugE9FmkD1mf6XBFYgbAygDMAuDxD6k5oajzcJoHp4AZCR6LdbsNoS0TQTbzb7ZBNETKgORtARmYpdNJjK6J+ZFq67qNw2w++01oL4zWYo6LE+BRk+SkYMa20+FG4XkoeYRQB+Gs2m1i6sRiSMkxfRD4avI7nha12sVgsFovr6+vb21sK8c9mM6ppoz/AOQftiOVyWRTF0dFRu92GMBTd6rbb7fn5+TfffIOTx84bx/F8Pp/P571e79mzZzAqkPtyH56Mxo8/giBotVqj0Qh8f1Cq2YrO/ajeiouVAWdF7K/RaBwdHb169Qoui9jsRAmzQEr46uqK+sVpmk4mk+vra8iAsMTFBoXZbIZlymPCElzThvWaqqzhP9RNR6MRRJnIk2WQxl/Ek2X7hTHGWhMEYRg5cWUYZtZImiW3i9NvLn72w+3zRdh1R0aeiwxFGhVK1VB/WhVxEgBxLFKK7ERykbBSUM1FliILESt5o1zl+WyexuFusyu3O+OcDcM4MmEQBtbeyfLqbmXm8JqSJvdtkTRZjBAAhVY44BuNBpTKBoMBavYEiCmgj7iXKCdupoeN6uZ3qXQV6txhzU3GXkBApPxkE6QHiL0fJA08fb+od5vt/fX6Qlq3OHtopa23lbxvTrovRqHpgfrQeP3jS3oddtQAqDHmvRyCK0UKY1NjRaTMC7Pexutlki1CKYyUIg1xRYXhJiKxSKSAXcba5v5fyPnV5OJc4cVSTZawgpIJEIuiD4eVjgTUXVyl6CIV3Cx3cHO5M2UWFGuRtchWS5q69Sper8Pt1iI2EXHGONx4TKNHHhbFuOo1EvcxbSCuLF01+J3b/6t1Z7y9VGJvVpY1XWNWjwBIG+eMK0VKZ0IX9YrWi7z5hcsbAq+/4u4husiZbOJcJnZq7S4M8zgZNZpHYdQMwqDdand6/Ua7WxTlYrWYzaa77a50pZMiz2S+iG+Wo9v1m8X2L6LOOLNzk5xF7eu4kRZFJC7OTLTJk8yEeZbf3mbff7d7+/b2ZnKTpmkYBGEYBdaKlHmRBGF3MIg6ndRa22g0B4PByckJbEi9wqQGOqlJRSl2vWbqW0T7Zd1yR3UvqdzFdSUMgQT1YXStiEwjWjFre4863E+usccW13LDHo1dVDeGRpB1Td3zr9MAtNyXuBFlBqsdLEW5j3xKONL65AVdZHVAlg/HASA+HH/EB2M7Vg673e7Lly97vR5MVOEeRoUBpBxAgcHIWy6XX3311XK5hLIh2mG4FcGvCSgzG2QgVQxcFaszJCO05TRavNF3xqQOQT8ZVbCVx+7V7XZFZLFYzOdzUhQJSM3nc3zFL37xi1evXiEHXq/XgLzBTQOSi1xCWy3Dfxx7iSY10AQD0A/QLkCo2K3Z7QJWtd4jvYOtvtiVdUuOl4c8xDImfI8bpfddUe49pBhzaySOD7CepHL2j3tdz7DE1YLF9ShfVBsvm9YJlyN/1uQpbUELtjUGTJZlyLePj4/BaAMwgWwc1/sUYg5SXUsuMM4Q498Yi5hGxBrjNI9MxOr7j89xLrA2CkPdTomLAcsxz7Iiz8W5MAjCIMA7rTFSltaYMAhcWcII5e6fTlxZissDyUNjjSlN6YzLrClCU7rAFWEZ2jKVUkoxYu4k9IqizPNSxBUFAmQrgvNBTJRXtm8QnLMiiKldWdrqqkn1oS7d3YvOSVm6orj7lSpP0Pmi3O8/pQgAFQMxI8gK10qg+EWMBy22oNuE9UC61w5WLVbMXjTYRO6q7nQjD0K3JfJkWOmpd2pr9BnxqNdGh3ZXdLLrD2HjG7sQCFkChngoD9dxbZ2Pz/znk5E1Xgg9rwkn4fSAm+O+LRYLKAjhAgG1X1xcXFxcFEXxr/7Vv0KRQK/PuCF0M8P1YlkGI5iKtIDMQPmMogiJCm4OHiL6G6hdA2SHyiRYJynqqrWAdRrwUzmh6e2y1WoNh0MIibDm51mgfBRYT2tHz7pNDycshvDdQm2MGRqqdIC6MA3xd1BoAZnhueB3F4sFPOWgkYIFebvdrtdrPHqsruD8QkT75uam1Wr96le/AtcYM509Q6vVajqdjkYjnhLYUtPpFFsnHjF3Fqm5fv1IXDiOIhsEeC7Pnj07PT3t9XqaZoj7w3okvx33PIoiVClQmsKpNhqN0Wj04sWL4XCIIe01KGw2m8lk8vbtW7Q9YRBCkgtBC+We8PgoyENrNVKGqTXJg1ofHF3UYccI7Pf7YDR7bj8UI8atRn2lqoC6shRrbRwF1rgkFmPL9TZcp/2L+bObzVExDt3YynORvkhcbZDwoMOfpgKIg4r8uKu4wwSI1yIrcSKbMLyaN/7wQ3s2LTMXRGHe62aNRhFGZWCNDQJrLJSNdEUH00H7JpGFynmBO8bhxDcQCCA63O/3oQ7EihcpqIgoCFny0NGOXrqp5qkp5wyrPJUDjXeUYNJ9QpHPOdknyvxjSoP/v/Ns+Kg6XJ0cqv/i6WnV+2Y++F0P3ahKNkwcIFv8z0lZGgdBAmfuwbtS9Yyb+38ejzUp72Xuv1j/50Mvyr4fyQPvBOpd3oehpbocJw+d8VNu448cFaVzRVkGNT6+R3nxPOgeQa4fP2c1tIxBwC5GXCllavONLZZSpK50UjopxTixRoLAmqiwrivlmzSP1zuJtwMJhkHeDMKgME0Xdneuuc3S29vJzaQB4pGxmZPdZmsn6bOFfLkOv1gGw5mbX+2a4WqQ5GleBGUZGLHWBtYGeZrd3ATffb9++8Pu+tqlaRraMA7jOIxazaDdzjvt1WCwDoPUGpskjV5/MB4fcZGvTxPtuqHpw6TseDQdr7+Eixt11UjX1TKJzLCQDJK/RYyYCyZ4YA/5Z2q+kdScIbzykk7wtdKFHh571Sq8TiAWyHU6oEt3XvnrE4d4oQzoYmVSl4o0KpM6W/1zV9V+jEhTJD9AUIfjABAfjj/igy5DZNMcHx+LCBrGj46OqHyHd4JShFZHZIyz2ezi4gK5Vq/XA5pQlmW32/3lL3+JFvtOpwPeLqg3aLRBfyvidRDKkCmB+AOAAJyaoihA/WM6pAmAkMggTwfORbgosPk6nc7V1dXZ2VkURZ1OBwA0NhgmdXCGBYUNiTT2JGpuhGG4Wq3YsQJJZcCURITR1UjXGmxXQIc9/xNKTEhlvgfGE3ZBr+HlcSMR7o4UentfS78fT2iLZ2Rc5EOBjMPPkYoCSUgLn4AUC/xfxBZ4fMjQiDvz6pbL5eXlJbjhgDlIa8L3Yu/HJ2CMzefz5XLZarXOzs5Wq1Wn0/n888+Lori9vdURA3PIJw3yKidngLK3m9u7pZ4WJ64IjxhqmxqyZAOXVHZqsK2HugiKH+C0gnULFAAjYbPZuaKMotSaIIzCpNFs7DIjwDdBPwKoGhiTIFbDL5KJTzQWcg0Ej3RJX6uyAC2iDrgectqlBLUTp5gIYRhGYaj7c4HZkYfLDB8zlwgsM2cChRoo4cSHWATQQ42daZZBmqar1YqyD1gNgC1C7xsQISYUf5FudVhVaL8OMJTqEJrKxBqPrpQQvwaR8+joCIrnWKCwWrZaraOjo+FwiMVwuVyiwMame6B4dQ6aJ9PpoYR7VSM/Ch3WKKS3enCaU9ADUxVNA6CZg2dKo07gwngnBxvGBqWitWcIRAkwMHa73Wq1gigQ3gZNEqq4aj10vI6niTdzwCPJISimqSU/Zlv0BPU0Wtfr9UBR9HzDP3n/9QToCdlrIQJOXr4BqyWuHZOFMt8UFMLno+oJKRXYS4ryMsUN11KtWJbX6zVEtFer1bNnz3g+eJR4CnjWpPZzzhLu16WdJ7IgP+qIk6TVbodRNOh2j4+PX7x4cXJygh4mbWOApXKxWFDegTYD4B2jMIkmFayQnKoQSJnNZiQLY42dTCYXFxd4USrRCQQtZCVzt9WTl/eK7UcUO0aJmsRn7qfaiRHyNXTv1Bs9ojiuY9iSWAcUEWuNERsGJomdMS4MTSHxVlppEEtTZCAyFOmJsNkpuf8nVtrEYSUxkVZm7pFIdgcQl5mdF81vb05Wc9sJNqZhnp/Mut3bZiOLYkBWAMfvwAXusxqi5WaESIMABAskdaM5gOmNRgMOTqjN63UVE0Ev6VppQetT82MpmUKRNG0AiCfOpmbt53H3ooj5EeaiHm/3KQo5n/b5j+gXedPWMy57iBZa/2SvY8ar9NSdOeuCznUic11AvH567z9WnBi8wxZ5kBfxdpvsdkmRB8aIiZwkFTs+VO6Lbt+fvc+BhnVOveI+9Eee/NP6303FNQ5FsnsYsbUuCMUGxloED6XKGow8oEmtN7U6KH+PufKENdyBzfCw75weIXUqcX1APrTh3sOajYizxqHF0EqxtZuLOPwvYbp0RehS5zInpQTiAnFREJkoKYqwKF6s1q+ci7d5O160bRgHgYmTpNFqRK0oLdL58mi+ON2mO3GFsaXYPCuDtRttGp9l4WgVty6ywEzsTd6NorwobFFYKY0RMc4UWT6fda8u2te3p4vVLM/yQIJQoshEva6L4lWjeXM0vm23VtbYMGp2Ov1er580EiumuC+5qzkEWniXQKqebqp9xFLDV5RwDeIKRn00p2UQpdMBVjd1+6ZXm/eel15avVqgDuk9c2Z2kHhlQrYfaWjY81vWEhY6g/N0md93eEAs5ZNrIRQdtvfbCLwXg/v/xCvFAX86HAeA+HD8sULDOkdlCtdqtdCLnWUZvJUYmoPxR5E1pPpJkpyfn9/e3mZZdnt7C/M6ERmNRre3t5A+hAYF1eJAPV6v11BvSJIEjZxYvgFLQaoJICxRABHRzjNAxKiZRbwA2SmyXHB45/M5OkAvLi5arVan00Eapr1ikaRBxEDLJ/FGgUGMFngk1QCImZuFYYhP0Nvz/tJ6WVLfGYm97qMhj/hxgUvtpq1hIKlUiXW/pGdZwP0Y+Y+2ofA0NHQHk9zvptT9rVIzSCmKAmKX8/mc0s8MQRgNkIyG8gMAYhhYQZoWNxY4PrjeHwvNuJpVjEeOln3tlpqmyvuG5q/j42M0MlO2myAp1GxbrdZ4PD45OYFxIiQyAOIA6LHWlmVhjHOl/eb7wSpvm0ZoIxsFYbfT77bbcRib0hZpc7MyL59ftFs7a8W5OzgVgxDzESgGQDo021Lmm8g1BVUwPnHCXrb8XjOxkt8tynJXaS8QIMZVgHWOj6JIGcM4fJcnJczBiTGj/QZxfzC19UT2VBeI3rKnHuk6HoHGCgEBA6MkVRB92YQgtfszo2FGmRRMRE89CQsEkbHInJ6egs16dnZGqXSIDxwfH7fb7fV6PZvNsGRhoYOsTT0krSNoniXLjwHXvPZbLznHbcRSr7VBIMbaaDQwsMuy/PzzzzudDtYNdFqgSgfUGzxKgMjEVkQE6zxaNwCgo54Hz1L6y0EkBK+gQKXHDGFTiHUgHQK1VqpufXCWiReD78N6TB1NeIz9pNZ/3j3oFME6xvvMj30Q9SIfrx23VLeCslSpa438FYxq3AcQnLEOoCUImlFgBENNmJq8UhFU9TBD9ej6+vr6+toY8/nnn7958wby5aJEAOBYCGY35LaJCDcaDTCsIZHM8iHrEz+JcIoRaTWb/X4/TpJhrwd9CehgINKghSwXKBSxsB6i26ndbqOZF/JHYBDzEQBPv7m5ubq6AlkYHzKbzbBP6T4brc/IYgb3L8140gRnvBlnoseVHvkU7dGmCITj6ZErylhCqs4kzdoOw9BJmObGlSJSbnZxJqEkRqRy38KfhAB8hQvHIo375nWhiBNpVm22sOvZiXRE+lKuzWLW/m764nIzCrK80SuK4OLF88DJ1GDQmpLpMjtLvDSe8QnDQnpRslOYIRzCOYDplGkm593T66C4mX52oqzMiFlzR8MTpGknYQsUaTwi5D15BBGX52VRfGxw/pCcwt7ue42i7tWI2FubqYtp7LV986BeLoycWQ9NZ0+pbK8rIzvQNW2cWzN2Xi1l5gH6ct9bUuNB3PpVr72DzkSZmyyPV6vG7bx1O+mulk0n1sRi2uLKSlMlUQNe84Ldh2LN+l/cvh/tff2Rz3e13zXvbSElrmzu3B14G4QuilwUmzAKYLkmYsThoZfezuV51tVdXr1QxFTNc48LTdSJF3WIv/53j0henxSPzIi7HOfOytk4MabYhOsfwmIlwe/E2bIoy8KZ0gXWRVGZBA0JTrfBl6vyF4vNF8t1O5yHQRwZa8VKEAZBEpjElrZMyzTN07IsRJwYJ0FZBja3Sd5qO0m2kVxs48VlP75tW+NKJw5aJaWYUsrMpdvxdvlsl25Tk0pYusLkaZAVNgx2RXnZan5zNA6Gg9CINbbVaHTb7VYQBnlelrs7Y2ljfM412cFSSe4yAPbIuYxXdeGN9U6qurMDj8spFZkYfmuJBvJ1ivsYq66GagibAIIOfnSGS0Ny7aKs3XHpf6udSLzBJqqTjN1yTDxZCMTVFcSjPzb+oD0dtsvIq13vezGq1ZMOx+E4AMSH44/w8FR4gHCBylqWZafTAbEOeC6aUs/Ozl68eHF6egoHGCTnL1++/OUvf3lzczOZTBaLBUJGfOw//MM/nJ2dXV5eTqfTVqu1Xq9B5AHbbjwej0YjQDDkiBGPZoUQQsZHR0dAo8i7wZ6HtR65HJA4yiNeXV39/ve/z/McZ9vv99fr9R/+8Afw/qChGUURPPeSJIGdl4hAEhfUOQaaYAYRSAItCxse8jd8u9Y39LBIvW1T3QKSC2BiEhrzwiPs6wyXH0Il8AnAnnCSzGSwQ+PRMMMk4xW3C0iKVq70Csv4cCCDlFoGm5h+CLSOxbCBYmmpnLgJ8OmueaRwy+VyOp3ycxqNBuCqVqt1enra7XYROrBUwIT5g0MdciU6liLk5wl6eN2j7KXCRaEf+fT0dDweo+wBQQwwlcBzX61W8/m82Ww+f/78xYsXqJeAfI3PAVw1m82320UciZHR//r/+We/vXhejALTFpuZMA1tYQ0Mk1cuitP/+/8wORlNy7JYbyWKXb/fbLXbeVbsdhtEXUDSoRhLrjQAOLj3YGQChKWwOLWzMRJ0UR3TMARbquZvhkcQVwcVzPHrFARg8klEezabkTQKvInqnwAisRCRWs4glasKJguhSeovk4APBjHnC7kVxhhoxQDB3263k8kEaCYxCMx0dAmAXUgGMcpIrHxw8ex2u5999hkswoBi4Lqos4FyF2oJ5OB7tRw9Ozi7PSFvFpCK4lOIB/ycuh0lpxKGAVc8jCh02eMOj0ajP/uzP4OVHCA2j1gETR7KB2FQUVcEAriAPoMgwMjEGzCP8GiwyGAFwAALwxCdH1gcoHqBCqI20iGDGL++Wq2ur6/zPO/3+/1+n8iOVBLkTymgejUkmMZoQ60fA9azOujVzDA+dfqEaUupXwhEcGRSl7/ZbGIzwk6aJMnx8XGv19tsNiC90gYWZRU8d2xe2AIwkTHBO53O69ev//RP//Tk5AR6xFKpE0Jydz6fR1F0enr65s2b4XCIucMWfvpYajEijGStCvJjStzdbvfk5CROkm6r1el0jDHYxDG0tAYiOpnY6IBHORwOoVkMSjssELHUozyJj0JsA9EtKN6uViu4+XFC0fuO9G120rCejU3TQ+hwz1E6gisR5SBZQMUz1XQwXR7gXdVbNkYXztY5F4W20YytbSyWzetJY72weSbztHU2HaSJNV1xY5GeSEekex8g5h/gZeY+QNxWDOK4EppIxW3MNk12i0TWfdlK6MroojnoheLOjwazZpLGcekkMhLUO8e9EjInoGdkxAunUg3uJKjfg8EAuwnGnjYDpHqm7k3hws7mG10l0sQ0LOBUtiGgTHaerr6DUm63W8ydpw9sBHlWQSQPib4+IsLgqSp5RheekOtehaW95GJN7GUJlrdC44yifAs87wf9Ov2cWQKkWjQ7mZhT0FCL4Z/njKeJh1qvyRgnprSmLAvJsmA5b5yddS+uexe3/cvlYJPHZcvcCf4mIp3Kki65rz5sPgQNW5DGlWSw3ffHVH8hKFx/T6Akj12NtMg3hJVacS6SVaiTlSB2UWLjJIwTSGwXRWFExJXOVZC9ZgaIEqES1bmlQUkv+7jTZHt4Jd87dD1Si26m9J6jHn76DfUWKB/ONkackdJKWUq+s8XWppfWlK50ZVkWrhRXBkEZNYo4aTvzZeoGZd7arF8XWdvYSgQATzMwdwtg5FwohtWCQCQWl4jERqxkTrKtXS4bUgA3F3GVo2CBP86Vjg8aqiD5TrJoJ9JoNpaj4fTkaCNinSRxHDeagSvtZlum6V0HoTFWT0/P6VFDq9r5Q1OCSPTRYR7XPY07Yy0lKZgTyqMJ43dZJeJc0+4jrIZqeWL9Ti8GRnRBKS1RasJMZuvRlDdaWHYiiMzMSEPnBNY/xUS0IdL/cQHM5iBDfDgOAPHh+CMfDWEIMpEWz02SBEn7ZDLZbrcwTEeGA2oGaBqLxeKzzz4bj8ciMplMfvOb3/zud7+bzWZYna+uroqiAG/39evX+CKgfl53DIqfILKBD0IZXCB0VI0AbIQsXUTAvhERUJLBhlssFjc3N1999dXf//3f93q9Fy9e4Ftg3Q5HO2TdxHwp44jdYjgcIiEHDZkqEEDB0jQFYQrAE5Q6iX5q49SHSuX4Xdx8Xq/uCaIROfvcAfaxF1iX+im7rPFo0PoAQHQ6HdDKgHLiE3CeAMGR7gKGoP0RyZ6sTosyIkCpGam41ATFwB1GBy7wDsaX1FxmSkDBBBjW4bnjTJABNpvN4+NjnK2uZj+dwUeiqO5591qltJqV19jIgBUkXGIrzFGRNIK5Bu4esC3MLG3jUP3fOBFrnRW3WPWms0EWBSJitiIrkZ0xuchOZCFxM5rNk9U6KgqzXIm1Eie2kbg8cEVRihjnJM8L4PtaSJqapHhAxN088g4wYt22prmle6E0XjInMsewDig1BZvFA4+7qnuuNatO55yehQXpS15CjnMA/kU0mdm+jlwJghOGq1tpa5FQXeAh/s53ApUgHkHJYyx3Hk2b8E2d7VVfMbz6x0P9uU+kpOnhDfSK3Dfg7FCWR5oBiBwkbgytFy9evH79GssFGj5wl7rdLlRci6JA2YzWT9QSubq6WiwWgLrYiK2pHHEct1otiL3y1nW7XQq44w6TKaxVVqlzwoEHZAF4H2arJmA+/XbV120WCcjB+QQSsX4/GKlAvdm8gtVDi/ShJqczeUxttv4AJsOyHwQByp9YObEFT6dTfBRuDrF73EzscZqY+eLFC1C/UeLCo6S4EI4oisbjcRiGdMAj15sog5aY9+jYPwGDuNXq9XpRHLeSBCVG1CaBUzOcwNt6vR72buz12LVhsHl7ezubzdA1xc0I9Gfa+q3Xa1KusJN6zunIXbmaMcHGmaDezBYEihJwrcD5aBYz10A9epn5swDGYEALKaiNzDlXipEodEEQLNbdf/j+6N237d3apmF0E3Q3zVg6TnpG2iItkdZ9gDhSAHFQk5iANjGAMDCI2yIbkY7I0ri2SCYSSRYEF7Peb755VmbFn77KXpxsozDNs6J0oSvFGNG9TR4vTJd/tMgJJwKCQwSBXEko5ewV2zyBHQIcqIjwmepaPluzdasNa3V8fHpF8pRh3HabVivtJ9CH9+4L9RK43sjqaq11G2RyCb0G7b2tLd53sXThQcOeUgFHKVZ1DyCmJAt3cGpeUTsO9xNcAQ/i37tpeh30HnJkpDSmMNYURbRcNi8uRj+cDy9mg1nR2sVxmZg7e8ZQpC3SrKjEcWUWZ+871NXXI7fvp04kUEBwoIDd8r4GRXD/p9qtTipcsqh0ToMH/sD7TpwJxIQ2jAK0GwS2dKW5U11276FATdj38d99pn/vFQMwYMp/bBrkxxdlnXGFkdy4QlxpXGldKc5ZKa3k1oZOMmtKMVYkFGdcUbGz6Td4h8UbKcXZGpfcVFWBO+/DCjAvFUBcijgjzty9v/q/EXEudGUkEloJjLFGrJPAWCtixQhkyI3B5KV/iqtEPswjmhsP9Zx5y4uuHtVXkr16I09/Oo9rwuz9Xa+V4cdYbuxd8X4SZTARkbXIrmqa2VZLxEPHVsQqmj8WmdWBRHw4DgDx4fgjPjz/aE2RQycvjYDYLwyKTRAEz58/73Q6nU4Hgpvr9Xq5XH7zzTdUWQWBBexjEYG5CvgCCBmBUOg+Mt0pDD4vba94GsjB0MhMXzjgp0iWwFO+ubm5vr52zg0GA7wfpxFF0Wq1orUUqD0MjOjAA/iSOSHBaEogASxAoKy184jVysOabhpsYq+ofjMCa016hZgpWKI62q5vpfShAo0UpwT0QWsoy32pJl0q8CwL6PSlf1erpnpGCkioACVIxTLGU2O1mYLL7P9lSkAjcmpTIJ9HB/EHlTceYlDqlNKrITNZ8grp2lRXKjlICBDjiRBVSZIEAPd8PqcUb6nkw+iZVl1+FEW9RpzlmQTDQpyUJ/Yu1FiJ7CoLoKUExv7dD8+v0naZlZupa5vdZ68mz19cB8HOmlykYa2zFhZ6ZZpmQVCI0pyVSlcag4d95cD+IKUKYE6bGmmpL95iWwF/gPkouYDSAomBZLyKkq/BY4WWCx4i4S2QGQGva1ID3o85DhQb4A77xLVGCsohZP3jUeJsSZRerVbenSEkpwNilmQA/xGwxh3D4gAoAd+OosvR0RGAtslkcnJyAtesly9fLhYLYj1YNHSTsqd1641tbQGn8/AfmVPtdZTW2DoQ4UajsVgs2E/Q7XahlwKRd5S4IEnU6XREBIsqPgQwDUDzLMuurq7IoSOH2gNiyJHEuMI4wSfgDVil9WlzUEEAgTQWjBPgm2AUUkXhxySiOsEgxvexOYzXD8tNEDsL6nkYwwRbdTu8VKIExB/xChj6ADRx87vdLj4fgk6LxQKbL+aRlsfldsPHWpblaDTCtAVOCtANs4/yvtD0Bw5L8A67OZ4mJ5cm9TwuvvRRwzppNNqtVhjHkbWa22utBRUXE7bVah0fH3/22WeAy1n7xIT95ptvrq6uvv322+vr68ViwW2XywvuADBETZ/UGC6vSxPncQKYSliaWOTWH8K9GFAyJSbqsgAs6ZEvhrAEqzo/k1WxNE1hzBUEEkViTLhad75/d/Lb344289C1TT4OspeBaxppVXBYQwHEkULH4vsM4kCkrLDjvEJStKldS6QtIiKZSCGzefL198OoWA/bNyfjwsguy8q8KJyjRurd6kfmtdyXayD8yl5j3nPELaTDYxhztWSEo6EBraekNb64/mtJYq/NmUgKJoJu9NbhhFQSxkWaFnn+sSv2E8Obp9u4PdTav7dH26Nn1l34SCRkqGDvH3wnVek14E5SCJ41zbJQX+f/sc+ytl1HkbTMmt5P65VUY8SIs6YsxeS5Wa2Tq0nv3fX4atHbBlE2jsqmdUlFDoXWSkupb0eV4oQ8zCMm7VRDw6LwRKcIv0WFERNqDO//CVQlRqr/mwfeGdznOFuRwNiggnytuUMZnRNnSueM6ljSBE9vFO2V6taR8+NSQaYCNe3DkNxD49wzaXhEj9s7BfVPJ3eIqnUmEhsHxljcApEwcI1W0Wx2nQxyaUWbwNqiCKv1jQ86vD8A7jOI348K/X5XgctFtTYWFUys9aljEedcVOTi1rtwumoESduIda4VRY0kSWzgyiIVsWEgxtzJSYtIWZqytET5mQxyx3lEMMTjIGsvlof4+B6b29P41h+i9zJt0OK1LDxU3fFyUq9uwRf1UlNv/ax/oCa+6Mrr3Xk6Z2Ek/rFHUhWNimrGbSsiv6v2R1PN3EjEiOxEApFGVXVoPNqRcDgOxwEgPhz/O0LDWGoZ9UIWYDKZTCYTZPvj8fjs7AwKoXB5gnRDo9GAct9oNALzt9Pp9Hq9X/7yl+jqXa/XSI2k4ml+/fXXcKI7Pj4GU4YEUgR/y+US/5zNZtPpFLAy5CDQ2ItmbWR3MMqDs1yn04F2LZU9V6tVmqa9Xu/09HS9Xl9eXo7HY0CriFbfvn17dXUFkhpSX3DiEOkCmKC8APZdxsTMfskbJSAl902H2Lzj7bhMzjXZqh6OU9yAmUaWZfRGY6akUU6eMyADYA1SKbLpJ37nxlvtryCs8VtIT5P7bUdEi3QTq+4DFeUzg0wYIT5GAg3WcD7AKXjraDsWxzEMA3EV7XabmTaUfHXA8ZTKtlFwDC/Hi5aYjuogWHe2wu4JXcmoLiBvAZ+93++fnZ1dXFxMp1PgKSSC6UYtxORlWXQ7tpk0irzx7Xl7fRK5V0ZeVPSrpUgqUopkIivJ1/bfnb2Oz3LZSnkt7d36z3/+7c9/nibJNk/Ns9NiOMwbSZ4XEgRxnme73fuOTpwDUCFQOEEhxE1GXyeuAgaMNLmizG6jwqpExFiLGUdsFOPEOQecCHkdHwqluulX1uv1cAOp0y2V4CxOgA5a+EU8dLYP6442lnPwpVCSGY1GoJKReYTZDUgX5wYojcRq7fzmFUVwo6QydUTPPoA8Fj/wOY1G49WrV6AifvPNN8+ePcPC9fnnn0+n0+vra9zPZrOJ9Wo+n9MemqksS0GeK52OyPdKBD4RRNDyc3oWkPLMHnkKjwDRhoAGWKjD4ZAVI6JsfExY0vHsKGaC3ot2u41iIcaDlk0g6AnZIlA1sc6jesfFkFMSzx2VSDxi9nNgF4A9IDiw7cjXAAEAAElEQVStqEVpHOfp4AsLovg7qKnWWvZzaMuspzwLgl+i+q+5IHNMamSKFReu2MwJAc6iCsibhgdK+Q6uk7gKaGp7yTZ41pw4mtQPor1nbk51F0557KGY1+xgXS6X0FDS3LSng18fDmTR8h9FQdWaCvcCnDw2cZYbh8Nhv9/XaWpRFNPpFA00k8nk/Px8Op1CS4o9ItzFWCD3smUP0SOhGzGD5uxrgWwPydJYmzY6k1r7v8bZWTqq1zCIU99x6ESsFXEmy+L5vD2ftrbLQLYiiUghYpXcquZI6les0mO1Sv+ULfD6R0Fl9gUUbCv5ziy30ayTpJkNTG5tVpYmz4wTgxLkXvvNumiAt+Mz5KAnKjtR9BLnDTYuBdSz0mvvXlDVk1/ggqwf8V4A6+lRig9n3v+d+pnUgbyHlq/6QH1krasDzfUbzno5oHkcmreuo1aQ+tmawECaeYeuUUHUBTsF1f8xAblUcgvTlAh5mAGtMVpjSnG2KM0uDReb1mzdXuyaRSOQSFzLSLMa1a1KYqJ5Hx8MHsV0zP2/u/vsYE0TtgpC2ssg9v5IhS2aD73TvJ+JzjhnnHOOoKQTKcW5Upxx2jNTKslyTTfxWMP7CwBFIY+O7TullIers3sljx/SI9a18zrz/QH1bSklCIyxYRQncRxGJrDWmDCUTke63WHpXsWz402WzNaSG+cicyen4wHEWmaEAHGs0GSiwGQQExrOFVhcVuoTgUgsZSRrF14tetH56XTVEmelTEKbJEnUaqSdzqLdTDttF0ZirBhjxUlRlGlmkM9Zi3VMtAaa3FcB9txWNDPskVZXzyhS62LRwVir6tcxaFFiMnrtfajypCug3pZK9oAuB+r8VBQVWq/V2t2OC77uPgyNiRG/fWzwoeXCQ+U4V9x/BbTi4K5QercO8BMOx+E4AMSH44/woMUT+qwRiv3mN7/5u7/7u/l8Hsfx69evX79+/dVXX3U6nT/7sz8bDAavXr1C/tlsNl++fBkEwdHR0fn5+bt372BPF4bhv/yX//L169cQG8XGsF6vv//++1//+tfX19eNRgNSsyB8IclHtAeyGH4liiKgV61W6927d4PB4PPPPw/DcL1eww8HosbgyNCRhlEmGM3Pnz/v9/vT6ZSQEMJTyI8iJb64uFitVlEU/epXv/r888/BZEQvM4AGSG0URbFYLGh+hZ2JBVtvLwSjkC2fIDxyj0RDNIUXsFGhoZXMI3wIBBb5UVTkZNM9GxtJCnsvvV8U0FVk47/2EkHqDriZmOxms4EkCBVssU+DzqaNaAkL4qIAyZHUic8PggDAPS6f2zmkotExjQSeAlioH7TbbaBmQD3wtqIoJpPJzc3N27dv8X5NunzKVs7gw9Pg0wZlfEZab4uMsyRJRqMR1KsxisIwRI1kMBiAFH9zcwN9lePj436/T/wI7y+KIo7jdrtZFJKlebp17yaDf/vNl384Ps3/KpDPRRKRjchKJK0CypUUM3P+Q1c2ImuRSOx5//z77v928SYoSpvK//n/8NWv/uL7RrItiqDVSqLIsW1TY2qgCaPqg7EB9l8UReihxjDgm9n4j2fEOwmrtyiK1us16KV81tRFJcpMAzpg/SD7QxAWU2yz2Ww2myzLZrPZbDYD+oZxjt+l3AGp381mEyZpQECoG05dAgxLjF5KRpKozvARmq2YNRQM9XAK3Emy8xATs0BCRWncgSiKbm9vz87Ovv7669evX8PxEvUnDOZms4kCQ7/fv7m50Z5+ms+ueetattUjbnxsLZCok9Zm0XwKUrQQi69WK7wTwgXz+fzs7Oz58+cQbK37SmNGa448nhGWsvF4PBwOsfKDbg8F2F6vR0ANVN+jo6PJZLJer6k0zVXXS13CMMTthQMe/UIxYIBKbDYb2jbO53Psa/1+HyaTeLIPQcMUDUC9Ewv+2dnZfD7Huo0CJBZAIuOPE4qdc2CUo+gF6Xwwf7El0W4LyR5sOTkvMHMJxFCpWVS3DSB1nDYeKIzpWq0WRNJZu9XyFJjUNzc32+0WtH1dBOIIoQIGtW7xTKHVgO/FjNZK6J4mjDzQWPMJh6t0MEtVyaPrLCShsJ4QnOV6bivSMUXYmb56DUDcDjzdIU8WkzqP2FWx0XMJ8ioTHi9vL+FL/0WfCReBveinB+pVX2OsmNKINWJs1Sht73twef909/VSzX3k614ouU9E1dxXUw1FrClKm2bhLouLIrXWhKFz4oyxmDeuctDSDGKPyurRRffyYevGs3Vm2V4tAi397JWQdYHk8cM7E/qyfdyKXQ1szx/Mi08e4gvrNzw01+p91nWwZq8OO8v5iNKxAmOu1QnXiHLRuocSC71nWVZkNQUdAKgqkbNPQIqSFLpUozF6PQ09wShvvSjF5UbSINzFce5CaYp0RXoizQoEbFS2jYSJY4XtPoWPIMraTn87ecF5pVC8l0EcKGpwqIjJpXpncJ9ozH86EWvEOieO9HsJnHHGiLEizgpZmXxqWN7JEqjX8zzRLUEbzaPRiEXgsU/Ca+8grO+eeunziE06UvJICfUxHEZRq93u9frdbqeRNIIwCEPp94J+f5wXr95dvFxmvaul3YXmrvUhJhG7YpHvBYj5ugaIRf0zV3/JFIJcimTiUsnzcCK94vb1xWYchztTGskDkwaNSMbj5c9eXf7Jq2I4LJtNJyZyLnJOisIFQZllRiQKgrC6G++tPvYWS3Q9ksp47DTV0S+XQW3zqB0REFARq2XXC0NKjCI2nmq/X2+J0GVv+mbT+UP35Wh+MVlQe6uJWrOeQxrbOquzfAX7dRCG8rEV66zS3MfisKypMBVVfRRTcid3EudZ9Yb0gBEfjgNAfDj+WA8KlWKt3O12Z2dnb9++nc/nL1++RIZzcnLy5s0bERmNRn/9138tIovFIkmS09NTcmRQ9p/P5+hE/tWvfoVoo9Vq7Xa7P/zhD5vN5uTkBKgifXLW6/W7d+/Ozs4gOAsrdjSHDgYDQCq73e729vbdu3er1erVq1ck/F5cXGCfANBJM3es/kCgwjBcrVanp6egQV1cXMAiCd+CbRWyGABBSIjARsL+ZXAZAATgnV5jqWcSDVQRwEQYhpvNBuKG/Ez8BR5iSEXm8/nl5eVqtQK/EnHbz372M+Yq2MsJzfBFmryxuZgOY0iAdf+R3piJiOFF/PpyudztdmyDRcJfR5R4FfQfo3EZAa84jgeDAfiA5C/jiwCgk29ICUVAlsg0gKQA9bDWLhaL+Xx+dXU1n881NPzJVEqvqUrzETQ6oG2IWq0WgGDc2O12i7zo/8venzXJkWbZgeD9PlW1fTfzHQgAEZGRWc1IsopF1nT3yLQURWaREZnHmYeZH0m+1CuFyQdShFNSzKrMyliyMoAIwAHf3W030/Wbh+N6cE3V3LFEdFfItKtAIIC7Lbp8y73nnnsOGLUwNRqPxwBhO50OBjmxyxzWF2MyY9zv/7T7+k37zWr4J+9g9X+ouj8TeZI3KK3y4CMWmYtMRXZEQpGVyLVkL+3stD0fN2UtZiXVfzLn424ljT2Tff6L61/+8szznDG3vB5SZfl0wPfXEge489VqlWx34FNUySjcPptTElB7QB1F6zZQC5jO741GA9RvuldRFnm5XGLgAYMDkE3Ou+TKtkxKgRsStCWRn7IzZBtRO1sD1hQFJlOPzHEiyLTBYRKr+VDgJxKRJAqGKT+fzwF2LxYLAnCAFAGjY4QX4KFyEk4Rg4KF3UfzLlkF0ew5/StQpPGNuCI8O61wSsMxvkUnD0SKybhkTI/VmG3vQGnb7TZnGZ4jGN9YydloTzivgM0RTsXL6ISGcUKdWdZ+rq+vX758WalUDg4OKItxF88aA0+UQShWxevr61evXs1msyAIPvnkk93d3TL2dA9ZL8sydLqkaVqtVqfTKbY5Enu1RyjWDYC/WOopH1GwBQfLG2/HJsWtEDMCkh2AboEXo/yjS0FY6iE0QcY9FOGRAVIgiAMD9pjj8Rh54Gq10pOFX1FITcuspY8+bqt6xkheJaXi8HA4RIkOfgmo02AmIg7BUJxMJpeXlxCfAdTOVJYlHCLjehpi7NEVnUAwRXhQL+eA1Oz1gmArRcy5ZhawPw2BYavVhaXC6zXzK9+4xVprrGfF2kCCWupVnVmJa2xKrPpKTQJ4VrDZQ63hY0JgXv4CV/qQSk5PNiItESOR869u2m/OhoFvOu2oUcsykSiSJDUABIxxaeoZkxKRLyxTOnDV3UsMSLgilTFiDkIW+bhu6Aqc7iwh156tEnxjgelWQJ/fypTnsObHBCrbnLg0ZFYGpgsaEXcRogv02zJ9eKttL/9LWe0CQKwtYQnsgsOB9yLXIDqJ1QyLBlcnUAo0bMQNGtrEBeO+groacZ8CPV/oG+ZEjJiK2FbmdTMbu6xmbh0aa/k4rymTuoLCwIceJp8dXv63VQxi9y4GcZBjjk5pF3ibTGRvsxiTiViHeecMMChjJB+9njFO2CpETgkzi4IOQLmadTs27pDyKOOzRtUVdPG7QLQvj/Ayp1UHAHex/gtxAvspO53OaDQcDoeNRiOoBJ51raZpNFrLdfdmVvcqvlSM+CIdkW4us2NzBnG1JDHhbwLHWxnEieIOx/l/+TRjkcgkS28Z1+OochN2jMtMJhIZs7a+yXbCqV9JW52o3rJxJuKCNA1EJIOkskl9X4LAQkiJ6kYaIdW67QXROW2vqs0tGHSVuQi6bYW6+eyp1YEiWUoFh08dfLJYqwnpfE3hBAqNC2Uh8oIKELcD/rA83m5/Yq33cW7DwIWhLOGL1HLx/ZrIPB8eK5EwVwzHnrgQaebLSOPBpO7heACIH46f5QEkkbpvSGwQ1UGiAYvyo0ePnjx5cnx8vFwuQTXCftDtdpGEA+9A/jyfz7MsQwYLfiWoZ77vP3v2rFar/fGPfwzD8OnTp71eD0rBr1+/RgpKe7dGo3F0dATSAdDnOI6Pj493dnaePHnS6/WYsLHdVfLeE+TD4PoheUYTfb/fX61Wr1+/htUeFRuttTs7O7R6h5gGqIu8RYvFYr1e7+7uQtVRNk3MCqEM4KowDCeTCaBnENBwFfP5/PT0FFgYMGJQ9qbT6fPnzyeTyWefffbs2TPwUmnQpHmghdBNx1t8ZFogAlssA0Fu8GA5Md0CT41cY0h5oPcW/DUAo8SjCSYSfWM9n8MJj7JWqwErB0YJeAKIg0ZgtT81co/FYrFYLKB0SSYdcMZ7ekLvoXQgG9RBhsZJqRLLzmJqHeICW60WeH/kqIIlChLucrmcTCYw2cNV404ySKVDURovV1H6t//4F//4h2erei351557JvJIZJjrl2V5WBmJLEQmIhWRSGQp0hDJJKsY6XsSikzljycHz7/alZkEfhRGv3v29PtqzUeLMwzHSNIXJQmiFQA5TcC6BUIBUqRzLsrBlNvxlmVpLgQBKWEgvISGWR4gxAyMBmxl0hJ1YApcj2Ef5gWeDhJLVKrwaOCmSKNzxqBYlACiscUbiwMCRN/3oYNBE066ooEQWlCVBcLOqgwuHwqn4LrifMANx3yheCKlFQGQwRuzXq/v7+9rLzJdjdBKJhrPLetgfCTXcrN1VBN29LxmWq61htmaAEAQ+G+hlsYhgTusRSdxvUDlUB7Q0TxjffxKd5PobL/AEcO44s/xFLhcYG3HQ9SOlJithJ61xg73RIwf8pExtLA9LRaLq6ur6XSKrXA+n0dR1G63tZEj9yMNHerfwr0TW95yuQyCoNfrcS7gvejI5kBlCkSVZzwU0GMJpuDn0EfinSkLBwFFLUsWQBee05ZWopi/pAjhhtDalBsHHgHdDslxLnDECoDmj+MPuyRJ4ijKnMty47h6vb67u3t4eLi/v9/tdnE5OCXEJ+PxGHVZPovj4+OrqyvcFmrcY48D/xHrm0Yqcefb7TYGKvZ9qtmgOQmrFipeJClv7ZhG1MHdZGtff6HDVxeJmSprGVzVkBuIZIFvfd/PnGcD69WMqYuEih0J6WH8u5mDIwR8faUmUQCIA5Fq7tHkiUQi9bw9vyUSiXhvqXOZMbO48eJkz/i2XpVO+7reCMWJyww4Xs5lIB1y2y2XFqj0ogM/3eFUxkE4ffQj0DId2oRAW7cViOEMVLj+SEmnVcMo2KFW63WyWsUfYlJ3+/TvkJgosy8L3o9bl3q546MKKHCB4X5X3QvYUL1ebzabGLqs2mr1J3rkYh0olDlRF8GWwVqUDlf0ndd2gtqwsYCPv8fCYsQY6xmvJn4387PUJE7qRroi7XwwGwUQ13NwMHiXvsR95dkc3rUlBrEryRP7Jau6ZBtAXH7xBlJs8A9rjedZ3/d83xhrnPOsha7LrSpLwXT3HiMvzSnG6WT3CXrcjhsM43sMeO+SPy7gxWUkeqvmTOGNNKJot9uj0Wh/f380GoG9IZJ4dp1lMl0kYRQmaeKqmXhOekaGuVCsybG/2iZATOC4lg8MtwkQu1xfgrjwdoBY3Nwk8yBZ+hJVTfpWudhkLp15jZuoepZFrlEPnCRBmgQi4gVxs7nqtFe9ahgExvPe6oDzzhRMqgvov9Znp/aCfhBabJ0v0J00iJxZqixIRXMn0nqAzI7xW+1truF+LSOjY8UC16FQrtCIMz+hbJupU+n7nTnf61jkO+Yqd7bEg67nrnTZpumrydHh1YNJ3cPxABA/HD/jg0K3dOpAhtlut40x0FVYrVZv3rx58eLF+fl5q9U6PT1lQguKHH1g2Ppaq9VAGo3j+Pz8HPHiZ599hqwSUq3n5+dxHENC4bPPPoOrDLGDfr8PneJKpQJrqXq9vre398UXXzx69AhwaqvVQoIKLgPQGWSq4KAtl0vAstgYQNoCAoikDr29SGgbjQY2RQSsUHXERkiuIqualCUt17eZhKB3HgRY4OCTyQQ/vLm5QYKK7BpgBAJoBDF7e3toviY0QCJnod+KxVKgHvhYttMmSQIImC+WvK9WJ2C4P5R55ZaM6wVAjPbkYovZ5mmw/KvdY5Aea4MR8KoAnGlPM2pl6JgGeRpSEWTFmhgiH9KqfFcb5vtPFp1zkoWtQSVcKVC2ghm0irxdHJvJuDZf1sKsEtrgtrBcMMj28r/LVBHKOzqRQGLx4tiTENitD5Ey2fSv0C4NOo0su5/pGX0b9umbIJI5lyoTcw0vlhNURpNbybCaz8WQjtUXDQroGkmB10Dmix6BBF7pm1eQaChTkAqtAAXKDCsHBdFwzYXhmZNmS+87kpT1Fd1lFl/uEP+pVntNgdQQIS4Ky9FkMgG8haUDKDCn/Hw+h/DuwcHB3t4efgXIHh/SbDYh3UC5D0x2tFCgJXm5XCLJJ7kVewflsFFcKTCs9c1hOYGDB+jtzc0NntR4PIZ0PmWIsMw+fvwYMFySJJeXl9iP/E3+CFVTmG7RMPP4+Pj58+fQ4QGW+ujRI3SocDBwKLLxQg8VgCCoFKLuhfIhml0gw91qtY6Ojrh+QngdaCYKJxyrtVptMBgAW0EfA2pySPuhbgRHgdlstlqtILCL50udImstMBrn3P7+PsvDWKuJDqNPHE8Bbz8+Pj4/Px+PxwDQqeUSRdFwOBwOhxcXF1dXVyj6lrV6f4IhLYKz8tPUxXGSpp7n9Xq9R48effrpp0dHR71ej90tq9Xq8vIS54wyNgRqxuPx6enpbDZDzQOEdDIfEUKwgsUmWfDR9vf32SkCaJ5IGcsnqFVQ6gTbRBAE9GzE6IJwVkEUSDZVqssGYnp68mnqqmT+YlermiDw4tSK51zNOaSyzfxPS6SVd9m3RKqbUqe21CxvVCbRyFmZMFaNRGKRdZ76rvJiZ00yY8bnjdVlMI+bzbqpN20UL5zIOkyzbG0k9rxcM3VT51e3IxAiZ+TD3i9NUcSoK3DWuAaWDdO025IWzWRzw1beN17DfmqeMNYxlI3X63W8Xn8EQJw5Zzd/spX/q+GPMn14q/yI1twvg8VaC4UBnt6/6BqNxqBWq4XSCHFG3D3gRzhoaQu0jqROsI9RQcR9I8EfkxHxOZXcNHiEoprWm+YCLlsFSaG764wV6/nWq1mv66x1JnVSE+mLtEQqOfxXzSdFQ8kQe6WJ8J4MYqc0u/288TzIYUTJ/06VhV2Qw4t+7oXl1OvTTYy4ABNnIp4zvvEqXlANqtVKvd6oVdM0s7HvJZlx7q2+B7c5zbeVe7VH3t7Vd4Frt4q7qqGhzGQvB+RbayHkuetIpmBGUt5ZsDe1Wq3BYLC/v39wcADxt1qtGobLxezs9Ozy9GR1elYZz/cSL3UdkYEUAeK6IgvTjC5QwPFdAHGyCRDH+WKI3SsRCUWq4ioiNSOhuCQHjtdiIrPwK6/mw+UPte/fREHm3NpzoRErzU706NHNZ0+vB/2kWsmscZmIiPW8t2Lc1JgiOsyyIu8nljVNzUHVrTBnNdNI4/IADVBYRTa39f6r7snbDavAr0KQw3CuIG3BiFoPM1IWyB5gEkGyAvkHlCrGlbJYyI01DMN3SmnfWfhJ8qdvRNJ8mqeqpJoqUSYuBZIPrYfj4XgAiB+On/PBDQDiwo8ePcIi++rVq9evX//+97//9ttvQVP64Ycfut3u06dP0zT9/vvv4SlEPiA7TwH4zufzf/qnfxKRg4ODv/qrvxqNRsaYv/zLv/wP/+E//Of//J/Pz88///zzXq/39OlTKI6hbT9N0+Fw+Otf/7rdboNva609Ojp69uzZzs4OWFfL5bLVatE3plargdkHniBkjm9ubsbjcRiGyJlhs9PpdJBUUAUiCAJgsmBdgX5FnxOkGeg8hcfdXepvtDtHkg8936urKxEZj8fj8fj8/BzqtIiDKeOLQHk4HP7Lf/kvh8MhuNXogAZUDUIZSW2FvZMEN7YXaaUntnVjL8d/+W8dJYB3DFoBvwsoNu4qVQV0sxilKsi+xEeRGMhOQyZaqC7gbpNvwpgA/BGk/YwCkZAgzcY4vAf2vQsdJiqnXcg1iMN/bLQlKidu6oEgkKKzNj4TsrzUJyXjlcC3c86YTCQbjxv/7f/76evxbrQTyFBkIFLfXJJNnoqkORYc5AFloP7QRL4mMhdrTbXpV6sV55LUZZVcopppG7NBIpjM+ti3DiweERvFSd6KcyHQjGMCFpz1FANBZYgGYrhdoMxT8w4KAMz3UARCsUSnKFApgTqq7pfH9zIDRAFGcg0QFHsoNKxZovwutBpQjEWTTKkHotkrlGvH7CBRlNLeurEAPp8XFxcasOMdA5F5NBqFYXh5eYmrZsRcQJyl1OkpP0JoQrfccmBw6Sa/lQw71sMI0AM9NMZMJpNWq0WJVVTmkiS5ubkBRtztdlHeI3SCuwHtAsklRDiXuUSAmqpVQcr4CO9GFEVUxcGaD0nZ09PTq6sroHiQ+EjTdG9v7+nTp1hUAdwA0SPQg2+E4ENZoxnfRTkjiEIAS2V6Q75z4cFhd1iv1/P5HKgulrUoir7//nsMFYgRhWG4t7cHKRImMKDBAklhwoOvAJSPc6YnJJ4UjFsh3T6bzZbL5Wq14qPRA7Lb7TabTSR4oDbjcVCPhQaP+Hy8HQ0TaZoCIULPQZqm0+l0f39/d3d3NptdXFxAgEI2DcTvb0x+/yNOktV6HWSZLwLL2dFotLOzMxwOe71er9erVqvw5wzD8Pz8/NWrV5Byoj0AxIuwfBE0xPWG+YH7zLoFitDdbnd3d3cwGGBPpNEf91yOW9RrcXMQZUGSi5NCsy/Zx/NWoyBJCpoSuj1cV3oKpDmsTtZaMa7iO99zYZxlLsu8TKqKO9wo/QlUKnsPImZU073LycJrkUipJNHVvSouMsnCS0N7NrffvtqzYgatlXhZtTrvd6677cT3ne9bbUAEmFULYeti3q18pGov0FacKHLo3ilduQFUwalNLEMLvhdkTzUSwclOprn2gcRTvu0mUbjMx3E4yuXDrehwQSP7fklWOsWVI6UC+syuGi17zcYCqEwQw9UoErWe9A2ncyniXvZDiDK/IjUeDexawpuhJsU9Cp5pRLLobLG5azgoLXie9WrWNq0VMU6kJtIWaeXjGfKyzXyCBHkMZj+WQWxU7R+MYD+HlkxOCjY57Fv44yuMyeX4Y4Ev7JUAYivGM17gV6rVeqPRbCbVapamNg68JL2d0qydaNCQz6JQpS6AgwXu/P0hRyZiNp3TPiKAKdQAygaMd50JMeJut9vr9fr9fq/Xr9Uq87m3XFxMJpOz8/T8sjZbTJNqcksIxaN3eZMEh0GgqmUEiCs5fJ/cDRDHt3zhtwziLB8AfKBV5V8XiVtJHHvXYXO2qHvrzKzELI2sRazr7qytlx7szn3PVYLUickS55wUJoKWztMkDMxinSpyT2GyQ/UebmcFY1UdvVOSWNef+LGaoaypHvqVLFSwo1FzR7Am8KFzyjOb0MwMUWbjmrGkuSb8tDRNY+eiKEqzzH3EpA5EVrkiE3jBjVxHop5P+WU+PLKcU+znDPTKx64nD8fD8QAQPxz/qx6aH6fjS6QW8PWez+dnZ2fWWqRbKPUDRKCngU6nkQaHYYjYDgXGIAh2d3f7/b6I9Pv9f/2v//V4PJ7NZpeXl/gExH+s6QFDWa/XL1++PD4+5sZ2fHzMpnVoAYOngFZf4qFEEkFwoEMXyFPoDYfP1Wq1qtfrT58+3d3dhdQpO6YBhlJsFHsntq5COMJ8gDwXLSwISi+8uegyx6sGGhIEwd7e3meffdbv9wF8g8ENEh/lDjSOo3NsYmeaL8xdk1uyfu54NLg0HSIgsUTIvlwu8fiQylK3UdNFufcT1UK4AGAdN7Df70OyQ2tRFSRNNFFFcj/6arU6HA6Pjo6GwyEhD5yMvg/vP9oL3ZSMNQvdbZqHol+M50h2NtSQ8RNwJG9ubuC0hjoHTliDBUYykXS+Dv50cjiutNMDKzsiuyKdPCdn5MEYtCoSqTbeWv4HOUOYtwb7YjwxgTXWulRs3gQKnRaMXqIJaOGEtSCusdlsQigD12h1CAaP+U2WB9HDQlMqHfkwIxj/4Z7g0ePzdbJHSF1HhPg64vKoAxGiZcs2MAJQ/gGB8b26JZkUZpwYWrnB/gNYg5IJlj6yDKgVSxFwXD6phVw/Je+ojaJoPB4fHx+jxoPRSzsyMD339vZQ5YJtGqnoenIVmme12/tHsy8LZveFvmksAph62iBIe1UjecB0Xq1WlF7R2B/wKfQc6J5uRv9kBepEFJOl1WpBiR4aQYRut05zDAM4GgVBMJ/Pz8/PofA7nU7pFUZWGlTCAbPiGtGiUbhF2o+bh4ZTWSlkqY8dA3c9IEw6rKi42xTtPTs7++GHHzC8oUrvnJvP57gzBX1nMhwLUBFGpvZUZDcGTvuWaev7BMShHo4zx7aI88EiAAkmZF/4oVa9p7IK5iY3MjqvEhXFlGRtkjHGRxgtbmfw5GtOLQja7fZwOByNRvV6HddCgSkwyl+9evXmzZvLy0vCwViXKD7O7BQ/x/3B1QEE561DLYp+m6ypUNBT983oHJjq3iRV6Toi+pY0X1IryGu9eG3bqOUjqdZCKjTWP9/LRKI4jqMkSrPUWee8PE3d2q5OkrZ5F4WKL0jzDasmtwB0lHOsXC5D3BUXm3AVvLzsr2aVusQ2yA4fnf3yybrbWdVrWRAE1qvqHgsswizM6LULA5XCWQXjI0QjbMPS4tcYydCNwdykqDQLV4SJcc8JlFBCQTb1WziEuGLcrgzGSB65vT81HmjcPZFModNlO8HzXeiz3g4Kq4oeWgXhDlFWUXSZ0/0cmvlO5S5tHYkHQV+7gikWixz4OT9f97nrAa8DY/3082XZGvOWtId12g+sXzFe3RhcUDVniVJum9LDlU0Z7o8GdIgRFywc6QaZlXwdrYKAnfKys5uiw1r4RblNGs/6vl+pVmr1Wr2eVKtZkhjr2SAzujFMW4HpDkJdqC6PEzDc32sFzx+Y3rC2htwfVDUp1062sp65bHL41ev1RqNerVaTOLTGhuv1fL5eLOZRtHY1dwvbkZMham2s5MOAwblmcGf5Wpducr2dmtKaLY6/k7z8kOV1AnmLJLrUJLGXzj2ZiixEwjzs92Q+r2SZDXwXBGmSWsVQhTq03DqTKtGbre13BH/vkpQpt3CV1wTOXB1E6SY8rSVY/i7dEKazlUIbRGG9kpKav2yK9RcqXrr/daNyr9wFPnAgiqxFGiJeLhZRFZkp+k6YT8bkVoJfFrleDd6+eDCpezgeAOKH42d5sPuDkrJEV5GpYtFvNBqj0Qhii7u7u/A6JwRJIga2fAAfeGMQBMPhcLlc0lQH6/WXX37Z7Xa//vrrv/mbv4HfHWggSLTYgXtycvLVV19dXFzAw+34+Bj5+Wg0Ojw87Pf74N2gMxcZEU4J2XWr1ep0Op7nXV9fo7UTqSAgqv39fZj2oCO13W4DZUDei5NHisW8AtgTvrQQPCErZqctmnNrtdru7i74v8BMcf4k57KPG+ISnU6HlkRsnRPVok4IGLklpVEpbgAkS3O1GHAT+NAUDxIxkPOQnkZjLii60udd15k191yreeLZoWm62WzCzLDZbNKZGmoMuBUwRptOp4XQAVFIvV4fjUa/+tWvYIeI02NlWz5QPaosOap7/7VtnS6ZSC5iUKvVRqPRaDQC+3W1Ws1mM7LJoL4ymUxwdZg+BFkw0ZDxGRHneatuLWl4t7rD+7knhlW5BAvUkgs7oo+JYpEIIqM8G6+IWLG+8f3ABNa5KrIvUHeJa9BRjQxBDDOCDsS/bqsOm2mAy+85eYXEgqnXTEYbUJKCG57O6+gLR9NCArgAecH9ZJNpv9+HKjd0yYEw4lfUxr25uaEaMm36yJ4AdoNz6HQ6o9EIQD+gW1SeyHrgu3S5hV17GMmadoE5iEf/6tWrer3+7NkzMA2BX89ms8ViASE8+GU9f/68QBbWLZPl5tkPLYpsRQ0KgpWaWaxnGW4IVgYqxwVBQAtNUkGpQM2lCRMEiCQRK03P1zI1nM76h4Xy21YbKEilcyQQSnPOgS7U6XTa7TaKNFCnhYsgShRahP2dqDrHpNYj0rsnGW1bPwTYHyWzMUiSJDk5OUEVVkMqy+Xy9PSU5RBYfVKKR7b5bnEEcnkH0E/1IQA0MEjEF2HDxVbFIiLhZrDCMR64bnMXA7zOCg11eAvIbwHXKyhF/niVCSPSard3dnZq9Xq9Umm32xDuT9P05uZmPp9jcQjDcDqdnp6evnz58uzsDMaAFDUqCATzKihFjftGCQjcHzYr4Csk1yJgvwhvESrNqCPqSKncDYA3Yp3BZCmIMPIrIG9CNXydwHOe4omkaYphkmVpkiVhmMVhnMapJO6te1Kq/mT5nwI6bN71JGQT2woU8OHl4EhdpC2SSObM9bg+O63YtbMVl/rR0d6l5wX1elap1ESqku/CJOSW92jguZgmWHM0qlUgu2mknsgm4DDMTUwB4hq8q/g6YpTl1ZjlLl3L0SpJnuf5lYqv6sTvs1hLlt0PzhfGz3tOKO4vhc6MMjpcXm8LxGrtG6GJgURbCiVk3F5EGuzU0YQ+7rb8cJ6qZjmUpXJ1F7wGiG/tVXxjxBA/86wznlScCypiK2JiEbfp00jfRa+E0v74Bav8Z+tvC+CvVfCiea8/xoqxxvrWD/ygElSqlUols9aIsWkiTjbEsjXcxtp/eRMsDBhITHwE/1c+RBpu6wC+57db8UFWztRvGV04l2bgOTun7rCWjS48F9l8QPxhtvnGrS+zm9U1745fceyJuCwXJs65yVkqaWrT1GbA+s1tj5+1zhhnjFjr0tQZs73MVF465A5Tyq0Z1laE952PqbxAlaFezYRgoUhX39/Lb2bzKHxX+YrMj2HxNvI31/N/tNXHeaq9RjZfJkqP+OF4OB4A4ofjZ3i8RYJyTYA4js/Ozug202w2EeMuFgswdIg6UaWBnebkAyKfbDQa/fwgmgkO3ZdffmmM+Y//8T+en58TmkSuBarXd999d319vVwuEakgtaZjOxCBQuMMQ140yQIjAAAE9y12/qLFGwhmp9OBdRV5qbrNk7mfljEtC3Lp3lt8SL1eb7fbWxlwhbK8lq3gR5EUQ8a07pvTvc+s6DLPATIIgEDTi5AOkYvESytrRAIPAs+OrZrEGkAWYwFWJ280JwFcDg51p9MBZ8TzvPV6jX+gmI9HiW8ntM0nFQTBYDA4ODjodDqSN8KTl/qhtV6tCqorzwWHcZpTUVqXZRIYXIDfh9byTqfT7XaHw2G9Xn/58iVs6/DG1WrVarXwX9x2a61nXcU3ja6t/yo1deeGRnoKIDbb+FleDgoj7qQFkMtNgXKA2Hi20a6PBkPfd3HqW+vRY6ogl0EYCI9AlFav7m6GQ12Saw6IiIPUxnpdyw330OavOadaeli7AOGe0wWLmCDOkLZR4DOC+B/nxlNAQ2h+xbINLgGc92azSZyXpS+IvWApY4+C5H3f8LCqVqsgqZGkj9MAYZD6LXgBMTLNWcDHkgexWCwuLi46nc719bXGvkFl9Tyv0+lgRUIFhZ7vBUFnPAUNpJbznw9Nrljz0FIwkgsQO+dITmTZif3XQRDs7OwcHh6i8scJm8unGM3Rhl4NFi48I1HVBVbdCKxQs5VlJ9Iq2S2o1UizLEMhijLxjUbj6dOn3BqIo3met7OzgyoCxPEhJYSHCyEU1sO23jcqzOBW4Brhe4PiJZqst74dFwh0VfJ2EKhhLBaL4+PjxWLB1QbVxyRJvvnmm+Pj4yzLut3uZ599FkURFlKsJ9qZh7UELZTBfZCVP6xFqNRKbg+FlRnukYAyUT0t4PW48+Bf0wR1Op1C0bjVag2HQ1ICUUvDHoH5CziVnPGC//iPjF6ODg+9f/Evmq2Wby19KSG4DKlrDOPVajWdTqGYTPEibXul2ZHcW7GhNxqNTqfD1QDEVRR0sc/CaVaz7MtQuN6zuKTorm2+mBtugdpPojqWOywpjAf08k5wjTK4zqWeTT0ThqEXhVEWZm7tZC0SiKzzP2H+d6hYbxoaM3fsrNw8U4UsazMu9tWiWTsUt5RUTBb6MhdTdcuomrogCIJGTSrVapwGSZLq0EKDjLIpVaTlVgisFxiRvJ8Y9hSJZrsYdNW3StJrXX6t1F9AT7QKMF98y4StVLx8jfqgiAU8wPeB2z4UJr4HzSljK1vLkwXcrQCdb8Vx9K6N5aIM+4qSP9JWFmVHB/2xhT5IPQA2KxjOGPGseF4WZC7wHMBiU6DumhKiZ340ffgejNiV5FxMiShQ+K95D7hZRKzwCXnW86zJPLGpdb4RV7R/LLAsy0YI+icbz/dezM7ww9+FJL4T+yub5m19YyGRaTQa7XYb5T3Md9StwzBcLOZxHPu+V63WA79hXFUieyuMY0q+glrQw2xT9uBYo8REqiRBMlUq4+Nz27REJC9ReHlDRjOHnpd5T0bNJJmdzGqX103Ps9WqBIF4NjNWjIgYVJeyLHOKd2t0u5vWZ9eCRcwHtROd9okR9Ym6OLRVzbwgA1KoP3H6FyyIt7raktteBqm3bqMFY7rCWWl5DU/Eet5HiZ6INBDk5aXQZLMTtHCEOQk9yYdE7acoOz0cD8cDQPxw/OQH4UJtdRKG4R/+8Adk9eDrNZvNTz/9lLEdXMv59h9++KHX6w2HQ8gpIOcfj8dZlg0Gg08//RTCT4y/r6+vq9Vqr9cbjUa/+MUvXr9+DYFIiP8Cvrm+vv67v/s7+vBQ7RQgy2w2i6JoNBrpnGq9Xp+fn5Nu0O12wRe7ubkB2F2r1fb39yFGPBgMms0mqSUAlYwxyJ81bkvYCE3T5Etq/gVoZVQeYN+oppyUvRfY8w59UrajAiIHVZm9zEjyoRCKL2ILP7dACEdqGgswEbyM8gL4CpCRdUsyAD42xgIa5uaKV+LeAhzh9kzSE3FVxA0oFeCW1ut1jCgduNPKFvrRBNoA6wAYQjIcx/Fyuby4uDg7Ozs7O5PcJUk3e75PFsRIotyXxMxE+78z2wcEA74Y4B7QCVutVq/XQ4s97gOhcK27B3goCALPWM+aat0GPSN1ka5IJ3eNvytQ8FQLm1/yMGFfsBVjTa3R6Pd7nnXrSKIkDddrZMLA1DQNjXkvAGLKiZAafEt1jCIvDHWcF0XRerUKcnVjyZmPBaFMre2gpVcYiWoVY+BTKAL5vt9utzE9KS5BpUiUo0iH5ywDcKwLXcCUQdUUEWCUuDTw4rGOQTu12+2CR8xFBlACZHZF8TE1ZECKE7H1gi0VVirdRV6YI1x4RXlI6tJLobWzgAd90FFoxaUQMGmPuAN8BPV6HZK70FVP03Q0Gn3++ef7+/tUE8LowspAI1AiWdPpFKsNHiilRXWXAAVJ6B+ytT0ftxQqLpCPgAYR+gxQykJzCTnjOGcuI0CKu90uqgVIF5fL5c3NzWw2Gw6HeMFW4JJPYb1eTyYTnDbEN0H4RRK19Y2TyWQ+n9PBFQ0ugC/TNG2321D8x2kDRMbsQF0zjuNut9toNHQ7QkHISCf2W3vAAWhi2US1FXL8w+EQO1eapiDgsySJ5QJ3GGsdxROg2HB1dXV5eRmGIdR+MQxw/vgJVKpg/sZZs5XA/pHVDhFjzMHh4fBf/It2t5tF0Wq9hssi1KsuLi4mkwmrpCgPoA2IzpZYUgpzgV9BILjb7fK2wDMQXGyuUVxwdOLNAEBra2BMaoIki3aaeU3xHMwavAVPh51SfCMzba2qj018uVzO53PnMt+mgR9HSS2LUxe6W1C4kuPChIZDkUjxnlzOqbwLHSb2UZbgdNs6300OfwTiqiKx2Krzq65SNZWqV61YPwiSzGZZBIy4oLyst2YivGW+G+IlVk2wa2CbkJwgr+1M8VG0hdDAmY4TdPlcKxGXVQ42DJRE/CCwH8Qgxv2+V9r1fVh7P3aKvQcNsAwAFdzDttqOlVvFCyD7/Q6u5TMpA5fqt+7t306cM1lmMrGZEyfGiXFmm7qXKQGyPyUxZ/Mb3d1Q7/1E47sXR+duacL6bhFUc9vu7dbHff9FuHtHaQEs/DEDtVC02Do8CjoDYA/A8BzNf0hDFotFGIaeZ6NwuV4vg8Bv1Gu1SsvLqrK2t+6aNpeYcLm4hDapM/kL0MxXyQGVJJcYJkBc0CD2N03q4hwyBhckVmiyvwlD2zzsj8QYyapmsqr+cNLp9mLnZgf7Ya+e1OtZ5gRKulnmwtClaYaiiC43FpZQZFhsH6SEGrYbqj5iJ+ISR2Nz7lB66ywQmMoAse7VEEUf1iaZ3BO5hzLH1Enu1qVJ16504byQjON6s7xl8MND6jz5kjwdEyXfT6s60tLTXNwc/40ecLiH4wEgfjh+rofuvAMWmSTJZDL5p3/6p0ajsbu7C++adrsNN/A4jo+Pj1+9egWfInK4dnd34Rher9dBqwGJGDvKzs4O6FpYoC8vL/Gyer0OGhqQGs/zhsMhclH0hKI7GwAxYnfAcOPxGG71UGloNpvGmPPzc7T8g/KMDWm5XF5eXqLjGCQsQEUUJkZ/ItEfeBZpzJdyqGS3AUejWjHhMNwNZPXWWjQ4azimoG5JHzlyKwCv4ATYtMidjI14miKnEU9a6nHjRI8wkF/SvUlURHrDiIGZGGICQB6aukgaHaidoF6maQp9DySuW2vIwFNw24lZa0ddsj/A5cFHseWfDrnQGD05OUGDMMOU99nay8l/IYEpcGxl05dD+9cVvIALNim8vaCssoPPWiPissyN5/XjVXfuKtI0b82R7b1heKHb0SuRF4xIIi4zxvqVasVKFiVZlkYYUQiSALoxZtI+bCT54unjEWOwheu1F0Vvg/vNEJyuwRxLBSN1PaK0TGeBDcT6B86wAI9qegILDKRFM1EHTIOfF75F12N0FoGuf45PdiHwQthEr9lkpB9q3zxgN2yt5ScTbtAOywXyoLsjd9I38/7s6D1TLK3yrPN5LALr9fri4uL169fD4RCkSAoxJ0nSbDY/++yzX/7yl9ZaMDRBz4HGK1YzALVYZCA1g+Jcq9U6ODgAjIgVCXeVgFcBJiAoBnUIYDeTyeTs7AwystVqFRpBKKdVKhXUYCilUqlU5vM5qMF4HEAwQZEG4Reb1OXl5YsXL379618fHR21Wq0yQAyc9Orq6uzsDC6jkBpAZbFarR4cHHDXKJdgz8/PT09P9/b2Hj9+jJoZGmgwEqbTKRZnzFCsbBB6wpbXbDb7/T4WE8j6w5QPqrhakUPXFfCB2GTxFZgjyAbb7TYEuGmfCDPY+XxeWCepG4NxWKvVuJtgw8IeCllnzJ0wDNGUAx0Y0Hi19l9ZCfFH4Cym2+kEh4fdfj9cLoHdT6dTYMFAsaGUzSqI1kWlqD1rqPraqdXQaDQajQarvxjnFCig4D53MdlUvNUAcXlZI6TLUndZGCoIApptFrRZWM70SvgjTXvCMHQuy/zUSJqmQZY6SUVScwtnUGKCihOZwjjsu0QSNUCcqX+/M7X2bjUoTMUF1bRayaqVLKh4nm9NZLLM6Yclqv+d7S8FPwZNN5ZNAy5sQIXdobB9626hgjcd76d2OhLlUsCXkcGtGcTvNPK6Ew67l55Z0F29qx/8XsjuTg3irXhrIeja2rVd2Mu2nlXhlQU64V1v1z4HBT6jFrEpmCJASCAnZLskNevIpqYyTarzdTVMvUyMeEYX2rcziH9ydLiAQWfvUo2wOT1f7qi7iDJGS8RZk6XQGr7VorXWmFSMETFGHJRqNzRky9TsAgNUT67bm/zOcvXm0N9aGizrAGwN3QsMVh2ca8iPHWCVSqXb7e7t7e3v7w+HQ+x6KHinaSoucy5J01UlqHQ7rX6ve71orGKbOHHQmmCJi80QNCqUHCBGP181B1TSTfw3lbdrLBzq4hJAHOWfX9kEiKNNOghPIBHnJLH2etmQ1yaoWc8P6o1pq7UyJpXMpKl1zmSZc1km4vKA32aZrzn12ssUADGgXoqGIaVlMVXLvOiNiSJ1W70HC8uCNtLQ3AgptQXobRHfzhYfZitb19UC6Mwgs6yeQRaLyzLf981HtDRVcojfz9tufJGViCcSi1Rz/zo80CD3a41EUpGaSPQAQT0cDwDxw/EzPjRBDyEyvOnA/61Wq/1+H82MWMrn8zmIOVhn2WsPT/N+vw8QEOsyOFwAEfiNgA+gwAjuKlgbyPOBS+o9iRRIAitI/2BETo1LBq/4alpLo4MYVuYAHInnsg8dFw66Fqk9JAPKpm6vjlbJBiLBbTweLxYLfDJIavcETvwtUSek8bopRgdkkvdRMlfcWkfVSTgzGWCsuPmgJhGc5a0jxAkAl7KSGjsmX5jMysViQV0LLb2nQT3ybshmJWmanGswhQmX3FoP1WpA6oE+4yazB+r98y4jQsVGUbIbOqXk3SOSyHxPcv9DjBNgCoUwi6xYBFIAoUj0DoLAShon8v1l779ePDkbtdxIpJOHmPZ+plzJh8RuJBie57y6q1eyet36QWAlM2ECqRbeWzLfad5FlrcmjAPgIwA0Wyyqi0Wm7o+1NnMO2BBt2ejfReFIjmSOKAZq7GVjQg5qJ53fMZt007eOOIGUNZtN4DsEEdh/TUtldiLjk9frNRVg6G9GXjwWOkJpUK2FIgG5FQVgQnLzMbAIwVDGyU8mk/F4jHvL0Q5C32KxoCY7exT0tNVZLv9LN7kfAaaZstakBjV4l0CJJVBOndl2u91qtfCA0HlQ6BEmKEPvJirVQptFlC4Q27TLmSGVnVnxYpkNVSKcDJ5RwU0bygBaVZmyrZi5/GQ6Cr558+bg4ABNJ1u5JOv1+vLyEg544JDi05bLJZB0AtmF96Lgen5+DktVDDC2hoiI9n+jOSq1gCCuAtidlN7FYgEbWBFBXrd1VIAvCRdQoLQiAmV8AOtYrjEk1uv1eDwej8fsOeXg1LVSrVZEUQ7W8FhA5R7KxQEXqwWXfhIN4lscMG90Ldi1Y/jhfEi53YpSaZShTGkso/CF3a2g+HEP3bK815S/sfBKc8dxF9Fvi3TsrdCmc4K/xBXA3ExxgfV/35dosO3F74MR53+scZut17cavHcQQre0IRdeU4iapERlLQCjZbjzHlD1fjCrrM75caPcep7N78I7eR53lRvvf5fWNCt82l33TYMvZYBeV3ZlmxFl+WZowShN1uZExrZSKBLcpXqs+9iEyKgTMakRyTITOrsMq6u0cR21LqLmPKnGnueCXKermpfbbe5UVlGo8U+IDusCf6amjC2Z1PHfkjMTs00LO0+doVNYpJE0MVnmifE96wW+73niZWJTYzNx1uDJcCss8B54bzUkx9TjbRfgu2KSW4mJ3DTtrmXw/raSu8BHXSdD2IANjl1l/X7/6OhoNBpBDAqhWr7npoEvtZqr1hs7e4NUBs62ZO5NG2btJFmJczk5g2IRsqlE7OXoLW3Hsk0GMYSD4xwjrubgYAEgxues1XsJEFPJHWTV6m2LRhzbybq6vvG9V7Zet+22VAIvXEdpYqPIOidine+lnh9XKpkxvrWZMc5ao8wCReu9sNkImR12fMRXLLBpjT7qiVPwijU50hq2bos6T2dbVUE3XGeRDCz1f1NlK6fbDu5aXrgg6IH3NnZVfj8fdqxFqvlzNDmR3OSWdCuRrkiYjxaIAfoiy1wb8OF4OB4A4ofj53wQhKUOLDYJyL/u7e0Nh8P5fH52dgbk6OXLlxcXF+v1Ggk5FlyYMh0fH9fr9dVqBTax5EqFl5eXIBdjgW40GuPx+LvvvsMHkrSL7aRWq00mE6CTYLkCMQR6iJQYUrZff/01eGSAvaIoQsMvuDbID6HqiH0L2TKSRiA+2OGazSayaAKgmucLNAoImuRCnLi08XhMbTvUpcG+nM/n6GLG5UCNkdy9rWwUbG/oWSYShA0MCIjuUSUvhng3g+Nms4mNEKADMD4IbtJaHfiObk1lUyRpyFSu5M8LXbH4BwwJ2YZMvh5uO1FpXAJVpIFaalsS2Ex5njebza6urkj22dnZ2d/fb7fbYK4Bn9WGs4X/viOH3dTGZUc/e58JJxXsOABoosweBMF8Pgf2hxoAsKp6vY6hFQQBniMevW4A98w6zczJvPsPl4/m+1UZiNRz3kqcG6SQesAEHjXnsUgoshIZi4xFbkSWImuRK5ET+bS3/Iu/mD/bW33x6Xw2W1YqQZLEy+VyNpsxjCPYAe1RXgsA93q9jpmFx0QZ5dlslikNYnEuS9P1eh2u1zqmJ9jHwA4a09rLeDqdYnBC1hNnhXgULn+I4OEuhR4FTeMlq87zvF6vB8VhCA5gGvJKCUhh8lLollOYoP/V1RVMuvr9fqvVcs7B404LMWMScVUpqMeARgoZWRIiIJlijDk+PgakSExwsVhMJpN6vd7r9fBpxH+pZ6Jzcp6GBpE/znOZN1N/OB3Y9FPjPQQS2ul0dnd3IYxweXmJ0gJ027WEK8ndQOG5VmB5hBkpFCEYrwNSpyQFGLK8NIJ6QJMHgwGUFrDO7+/vV6tVrmYUegYjhiU3TlLI6FM1G0sWNDQeP36cJMnp6alzbjQaQa6EK8B6vT45Ofnmm29ev36NPShN01qthvrBN998c3p6uru7+8UXX0DXnkzVKIrOz8+Pj4/fvHnjnOv1eru7u9iDLi8vqaWDXZJd8LgE1GKxKfBaJBcnCcPw9PR0NpvVarWjo6ODgwP0xGg1QM5EeMxCXAKa19yMeBPgkseqYQEPwgK4Wq0Ar2tfU8iC4zli04FECVtYMOk0bMdk8scjLeLc9fX16sWLdrudhOFiuZxMJjc3N+PxeDqdIkrhlJHN/g/eT9KgyKKimwJ9dzVplG/XYkoY9rrES5VVUUo42jCNAgWF+a7TV4qAyaY1vP52nR5rot/bk/R8Z43vZb4nnvFc5sVrL1sZCUWWIqEiEWeKTWwUYkW5TN2dTgXVrX82ntO2Hnm5RT2cmMW8enrWeTVIqr7rdK0xqTGZMW/XAYZ/2uKSFXqWaTWwyCFKxSesMHy4BWgDSwSfL+85hwdDtQJbWRMwC5jabYzheX4QeB8y4I0xvueZNBX1gQW11q2avwXAV6MzBYRXlDtoQb1XYy66m5tcde31p9toJHcKZQ9codeqzJDAFkM3SPYPkT/ODgaufqQ9MnzV7nYMSPLLdCKZkcyKJJldhpXreft80T8L++dZ57LeXLX8rGOkLdLOkTgCxI0cOKZ53U9y2JIJnsspAlqOdqs0reTzlO3tfkkAN7udws4ZZz3PB0E0qQRWxGUOnQpvSSSoCqMxkYuPHlR4iOwV46QATHg/uIaBYjft7LaanknJqayMDhcIzpyMSBJhjbC3tweyMLpkdnZ24HSChhIUv5MkSdOsXguGw/bhYf/o6PDzT/f/h2nrm1Pv27G8WMrlsSSJiCfSEOkq5i9LCF5uDV3Llzs6kmWbz8JTi2qgGiwY2/s5+FsAiKFrURNZ5S8Ibx+uC01svGTpvRx79gcvTIPjk2XLS9LQxLFxmak10t396JNPlru7c9+X+dzMZn4YAt7doBBRAk4PAPTNILNmSQApGLMkyRXnkDIjGNCQsfYH4mZUYOToYONtUSdfovV79VtIINjqtKwtowu6bXyNFiay2Kw/YiJXlUwEn04s0six40gky3WcbF4nqOT1ABCQH46H4wEgfjh+hge8a7AZwO19uVwiXOt0Op988snh4aHv+zc3N5B/nc/nJycnUJbEws3GWEQP0+kUG3O/3x+NRnEcA01+8uTJp59+CjFWEUEsDkP5dru9v7+PTQjikgg0uUmAPBUEAYrAVEwej8fNZhPfiPwBigdJklARGLgwcgOIYGoqE7ICiDOS6QwMhSkutysmtwA75vP51dUViKKAp1erFRAubKvoY8ILELvwihCQ0Q8KYS6AGIhkaUGJAk2pkD1qwyJKXrDYqy1rEMYBeqCtEzd+BvGMvXAAQKdrXxAEeHbAhmazGfp5SQNHZIZ7wucIZAFYDEQkClzsJEmurq6m0+nr168hYALRq+FwCPg4juPT09Ovvvrqu+++o80dI9f3GerAB3VGQb0FlqyZTDIjIiLPfAOgOduKMdqBQCEcARQIDiPrE845I0nFE2tdvemCemo8cWkeH8R5edmpVkEm7WuRlchUJBJZicxEpiLTHCC+ETmRR3vR/+1/vPn1n03Hk+X4Jmq2mozm6XaI+Y5cl65cq9Xq6uoqjuP9/f1Wq0Wgjbj2LSlABWFJmiZ5vzMnGq4Rap7UawZohWGTJMlsNsP54HaBEq6piHhMbG1jsQqVHp0i4qvRwcB3kdvLygSQBbrSM5PEr8gXRiEH34t4F7OVlTPgXHgxVdu0TISGpDEsgRrPZjP4eaINn7xa1GwwkjUxSoe8rM3oReDHrPY6iy6E5vwKNARgTcCy4Pt+t9vd2dmhzx5WLZwzo3ANEBM1INYAiQbJdd6ZjWj4nn0YWp8OVYr1eg2BGuB3rVZrPB5rXR1KKlfzg8sL5zs+lnxbVKrW63W323306NFqtRqPx3g0EFnmgIf8wvPnz8/PzyGmDBYSrm6xWJyfn4dhCA0N3Bas8NfX1y9evHjz5s3FxQVEkKCzTyMyXjVOCT/BGaKPB20ZNOvjCoaZe3x8vFqtzs/PPc979OiRbn7XWRMmI74U1HUNruGJTyYTbPqo+WGCsAeFiA/3UxrrEa8Bufs2b8oxaOoLiWpVkZ9OLNU5d3Z29uabb2r1uqQpyrSXl5dnZ2eXl5c3Nze4loLcvJ5lXO5gKgvZDTzBxWIB5jUMV7W1puQyJliFtCQR8UqtH1Uo92qYuEBiJTmLexB9AnQnL3clLu98PQtpej6KGN/PPM9ZI5LaNLQuNBKLLHOMOFJN0HGONzlFhfOUUqooQIpEOV3XLJAlXYkdafOO6UycMZNJ/fn3o5pXqXjrZ37Uai3RhEAEn3WmgjcjcQdS3jR/XD9ijAHdvKKHIsJL7VuotbwZC2np5wIIwkWsXCutBEHN8/wPMamjtZfbNubLKFu5j/t+9FmUflHZA1BKkgJlBEfbJ2rSA3cENhJp2wNt9Me7iqCUwbnG38tkQFIdST+UTQ+JoiZVloqIkcyYLJNKGHlXs8arm97rcHjttaZBLQw81zDSEmkppNVuys56Cp917xD/LZZDypx6d8fn3CVAfD9zP59xxhPxnamJSUQ8IxWp1KRaMUFg0I9nPfE8Z614nrFWaCSDvR5RllbFKfPT8XBpZ6KLBB9Rq5a7Wx90+bCseVJQXWew1Gg0BoPB4eHhYDDAagAbCbrCXl1dsWDpnEtSL3PWD2r9fqPX9p+4pDlauO+y2XN/emnSqTEVcS2RlXGZSGwkFGnkpQIvdxjT9G3ZrJBxMHD82E2A2Fc/sbl3mVO/0iq3NnciyW4rGS6QdeKdzOrh9/bV60Y1zrK1ZLFxTrrd9PNfrBvNYDiSVs2lmU2S1FoCxG8N6NhqI7lBNyYvUj+SiDVTmyVPznpMSfaQsSFV15wKUmks4901eHQzUGEp0Ai1ZrUXrIPK6SF1h3XzhKHg+4eSiG1eqrH5c8HDStQwgKyEVdtolrsgeiLLD+nUeTgejgeA+OH435I+DEJWq9Xq9/uwcoaCsOS2TpCDuLy8PD4+huEJ4GCQZMlLBZgCpcjZbLa/v9/tdler1ddffw3E4fDwEHBPlmXD4XAwGLx48WI+n1er1cePH/u+D/YoaFlEVGkj02w2Dw8Pd3Z2EPwhpgQRGJgCYG7wfcDMwm6BFA7QAPhrMJxZLpf4LwALuLEHQYAMGWC0JuMgKAHfChylq6srbKL0pwYASoIksS3uuMDTcYvA7QJfzzkHJWXJu3fBXMNHURwWICwycHB1C41awJ2ZKbFPnxkmHhlCQ6Sy5FwDVWF6iduFEwPGjUCBtlS4D6SeEY4EBY9Qhe/7GD/T6ZT16gJjJUmSly9fvnjx4vXr1+fn5xhOnU6nVqudnp6enp4eHh5+9dVX/+W//JfT09PVasXg9YOa7svcTK1uVjDSLeRd9FJjJzgGFQ7Jm6mJVFLkN8ucSIoSw3RWn6+qi1XNeXm+XdAp83I1ukQpQsbKOyjc/PdKZC51Px101oPOstVYzWbhfBn5ga+FC5jN6vRJy3JxqDMx0DTquzLMsjwu6Vda9UWU6YTmZ2mlSCaQuKsFkUFR2gskzuNBNBoNLC8F7I/oIWGsuzJnsp/oxKUD0ALDRdMuqGZDPlqZKQkpAEoxkGhG5Rw9jMlYLN/qn+TQXDBt+6nvA0zYOFPIEq3X69gd+Ji0xTw/XzatHclZxrIJTUD+kFrDnIP8xsLigB4FvLher+/u7hpjoIOElRCVCTwdWndCJRlzczabkQZI0B+lkZ2dnXq9DjQ/SZKdnZ0CLELaFMtLUPVlVwpWdcw4rI0w07u8vLy6ugLzejqdXl1doQTYarWANpKmSvIpIWBqzmJgs4zHtR0NCtfX18fHx8+ePTs4OGDFQifSWjVSNi3RCJ2v12v0Q6AWCFBV3wQqC6E2gN1Eu1ziDNnrwzIk1VrkXU3EHwkQi5yfn3/zzTd+EPjGoJlpPB6fn5+Px2PYAOp1T9skEmhgB8NgMBgOh3AOWK/XNzc35+fnsLljS5N+I8qlrC/SWZEYliixzoIbwdZdRjPjmMEyA+cJcMOiFjbGBhNjTW4VERD4jDViU2ut72V1L6lVEpsZsZI6SUPPrfOKI/441cuS5J3OmULQMrVbpXlKrD2aREkhebldj7cprFkVMeIyM5k0ns+tyRrD3vhg/2YwyPy1w+3RWxU9eAt6wdqwVO8+FB3CjdLN7KJa1EEeR9DCiIjBFVc5jp+CtL1+9DpoZIwdBEHNmMqHAMSSAxaFWVNuo75Hy7uMzsg2EYz746UCZldWWC5gxNqrVnsPsOCqhzFGNVY/dqrxXdqBmQeDKz2Ry7oub5+yscZlFpoKTqLEm6xqZ7PW6bo9qzaivpd6xsFqrKakJGzOGvZUsSR7lxSYbCK/2R2vyfJSSpJXVpyaPloWPN38iRYuSDeUbU3qAt8FDVcJMq/pTCwmkNEw7bWjRjXxbJZlLsucy8Q4BWYqqSX2jXG5LrTwbw2hfd/37gWI+QazjTssd+jwFP6rgytaaJBGg4YeEEpgGQ2dQ8x97MgENzlycoHBII7TOF5Y77pTT/aGq4OL1o5Xu458fykSm9T5cRokaSVbe7ISaeUuZH4uDRfkwsRVpQFSGAwmXyq9TRw52QSI03zMpPlnerkAMZZTOqElt/zldCGT0F/eWH9dszPnVuISY8R1upmz1W7P9nou8Jw4r1qNPS/DrCInQKv6Ul1N+3wwq9VtN9p6hNLVfI0O+7WZga7caGWY8hJH6k+BPlzohCCJ6n4/zLsUmTaEyz8ypM6fuJ+rTJhbI8G3vTUgC5M57udbpM2f+MPxcDwAxA/Hz/DQsAv6Q8HSurm5OTs7+/777/v9fr/fj6Lo6uoKhNlOp5NlGRzPYVADmyAioaBy9Pv9er0OFBVajUie2SMMYQdgza1Wq91uV6tVEO4A+GLLj6JoNptB1bfVav3iF7/odrvsf8+ybDKZIFdHgodmcy1gjxABmTx86ugdB9VjwtwQhYC7FJJehvjcI5ErMkYBbYppPL4XF0jtzkqlojNVQreszSKqBunYGAMMBUVdavNzQ9WGNtgRcSb0kpJcOZTk6yyXWKKvjoiAAqbbwPEcdVBOdQu49EA+lb9ar9cQ89KNtIjAEJPp5ATxhNYkRR86rgiehLC0AlUTCRugnziOl8vlycnJ69evwRwUJTL4nupROEnejXKyrXsbCwAoftJsNsEQBH/QWovBzLoIpFEwnBqNRr/fD3x/vV5mWVSr2sWq+49ff3Jy3jt2g3AQuIoSLEOrr8mDjCRncuEFochCMYinIhORschcZCbezP3Z55Nffn5hzPX5+Xo2i9frKEli4jWa4oTBya5wPCxoHeCREXjF+Hl7H9RtBCyiWUKccXi+mqhOQdLCIMFDJ3uL1k++77fbbYwuXIKm8APGxfzCgYgTdSZMWHBC4UvGAYxz0AIObE7Elc7nc/p6aUE0THwMGBrooR8TQ4IaxJjyHE7g2I7H48vLy52dHZSsMLxxT2gJoj00Cuie5m1psdSPQI0LGnCkhGhpuSiKYDrabDabzWar1cIay/qf9i3hbNL4O26UhgVns1kYhpzsrHLpVnpCP5S/4N6EJ47xEIYhGhRASgXig5YLFAsxGIB4GmOwubBjI03TZrM5GAxw5rPZ7Pz83Pf9nZ2dq6ur77//PgxDyuVrT6R6vb6zs/P5558Ph0OoS+O2YK+ELnOn02HVCt2sZ2dn0NLBfYZdaqvVQsEPVTRCKhQ6wKXReZVEexYOyZSp1Wq7u7vOOajeY/8qJ0K4IXgiWPQK+T8agLDXsGDGzgk+BaxsKMcCrye02ul0Op0OxjYg+1qthkVyPB5rVaWtBLEfGcDcjMevj4+t73t5SQby34C5dc0PNxALhTYzhGVuASBerVYUnkITAJAFzaDUoK22eKLIewGMI7jGIpxsaq1q1mrhIRawfvYxUNOJgQRTfd2lKyJpKtYaMdJqxIc7MwlrUVRJMjtrBBNXC+e+LESWIiuRmsK20rzDPc31Fgu+WASqZNPgTmut4tMK6HAOrLhE1tMgWvn1hj+eRZlMK5U0CJy1JsuEmAL7SNggot0OtCQIbxEXCurP6MiwAC9qyIkQpyYCS8lhlRCb3jKIbnCEBEHgf/iYzyWjXRkvk5LiRFlEolCBKHTx68rx+9v8FrBa+n/o28JIT0uXaiiZ8ByHMSJnSsMzjuUdI6in31sQ5d9a+FecYvGMWGNS8dZpMI/r07i29nwn5nY0Uj/UbCPzZooa/06MWEvWyiaZlJwAFPgB72qAONr8E6p/a/QQpAH0li1F1uKn0vTTbj3tV6O6yTwnxne9UbY7jBr1tZEwjOI0S7PUpJnJHCQf3obleFK6cUF72JaHwYYYtLX3US9LPPS7+OwFf+PCLOPLsD9iZ9RRBKg/2F7BMUIoghkdBAEyR+23hg+cTudGkii87nSa4apXydqDoHFUD1YdSY23Mo3ZsjeNh25l3dpITykCQwWintPMraJ9uE0auN1WSCDhlGLHmkGc5KU1Px+Z0LFN8jFQvYWq08ykAK9nTtYiiRGRyLnasWm3XbWWSZr1B6ZWD4MgzjLJMuPcW4NN4sKab6vRW3ICdFsYsku2sVKBhDIUVEDSHBRR3qEFFEL/u2CZyPfqWh2r9YU6GX+rqQblotpGK0a+2MqHAsVhjv/W8w0uEmnkTxOPKcwfXF1kISIilVx6IhGp/dQGmA/Hw/EAED8cP8kBYIuMYKYuwIyOj497vR4g2uVyCUIW8mcCHAChAI7QCnw2m52cnHS7XUC3SLHm8/nu7q61ttfr8UOMMbPZDN9brVZHo1GlUrm+vhaRvb29o6Oj1Wr14sWL09NTUHWQqQKvBJ4LPWJ8FBNXEQGw2Gw2h8MhLhDUrSRJLi4uEFsAkCIXDDsTUBvETCQSAhE7OTmZzWZokF+v18PhcLFYLBaLMAwRWvm+TylVBqnYR9HbK6oZCpgLW87R4gqQC1ApUgvgXEhvUNHlzgeiGQxnkQJBLoP7OkEu7LggMxZc2qlNQaEJ4gKkxJK/xtAKoQDJO0yH9MZM+Sp8C6sI9DzUNu5QJADTB0+k0Wg8evTo0aNHX3zxRaPRwAPVBeoPI8tbW6/XEQyR+8AUmr26+IoCQxnc0p2dnaOjIxAPLy4u2u32wcFBq9XyfX8+nx8fH19eXvI+tNvtVqsTR3Mj11myPj47/O9/+OXffv3L61kzPbLJkSetPOI3eUZdzQPBWBlWQGJiIXKWA8Q3Ij+I/CByIYHvfvXp9P/9f//js6PXYbj84VUGnIHDA4DOarUCKqfpckEQrFYrIGvsvSWLHNdOmP5tgGUMX8a8gqndarVaLBasWGgQBFNARPDVFK4l0sFyTqfTMcagUDSbzchuwINg7wJ1PDB4MCupHAJlgMlkslgsyLvXoSFYk8D4qEULlVusHoAUSZUlYQ0AMZQWarUaEDouC1hAcG5BEPzwww//+I//+Jd/+ZePHz9O0/Ts7Oz6+hqv7/f7zJ/Lzbz8Xi0Z/NYZ5sPxNW1ByYeu/4tl5/Lycn9/H8q23W737OwMD6LT6dB8j5+DFUAXmVBgoDYF1iU8VqgroDBAHhkjfmakLFXSkA1VKPwQw2MwGECEGn0YWN4hhQHUGE6qzCIggACoF2JEaB/Z2dlpt9uNRgPqw8Ph8MmTJ6PRiKkj/u50Ol9++eXnn38OBQPoj2MHBA4IwBEXiG/Eh5yfn0dRhM10MBh8/vnn+/v7wNlZvaCML8qo2AtAg4IkC3MzgJtY7eGpuL+/f3Bw8M0337AYWcCtqM0NMJpcVxYOMWH1HMEyS9ANDwgk6FarVavVlsvl9fU1dD9EpNvtQtA8TdObm5soiobDoXPun/7pn16/fv3HP/5RCwFr/eKfikqM8/eCIIuixXKJCgcApgLnl4MHvSkMYwAQo2iNBQE3qtPpoLaBh0WwFUA5+dcct/gKsqopayBK+5hoFwFKqgxrOV1Odjx0LKeU6m40GlyZC3AY5gImINZYasJaK4BZ9nbm9b94Hf4P1y7zJ4van64HX013LyYtdy0yEFnkVkguz2ahBZGoxmfJ1VGNUqWQEoNYm2glm+hwJf/MVMRK5plMTOi8WHxnjO8Z37OBZ0VcocGcY5jikljKCHOw1qLDDDLmiOBTkkJrFmvXJs2tK5h3aUMIfWJcsXHD2W/hVyomST6ofzlzLklTP02lRBkuuD+VKZZlNWFdcdRGUlvpt9yy9Rv1ksjITVPptUEx5Yl0DwGdrzTai2IzVeCwZGG64TmSaIwJhfeyZsB/319VtcZiIbCeZ31PPC/zbOZZ55siR1gU+T3LKx++EiAO8oFtStBwweZx66+y3NIK8C4gYE0rRlvY6i3y+1YEpgAQQ21sLDITE0oQZMNe/Gx/9fnRatiOq75z1vmVrNOKe80wS+PpNEFRzIknxoqTRB0aj9NK8Rp8L5cEtM/YXSM5zbI0SdLNEkVh8efyVfAl1qUOLnSVSqXVarVaLQjZYQ2HOhA21uvr6+VyCQU/qGN1u91+v4/eIP0V63V4dXX56tXxt9/e+DbtdBqN1k6cdvtBvfHYc6mL4urVdPf11afry1YyCWRtZC3SEPHy5asu0swx4kDxRjU0bJXzIX/OJx7kQHCwSRKPle5wJX9NqADiOFecYLnOmduqQyaRmDcXQbRqXl/bxVR+/aV5+sw0my6K0igSUJUwxdg/p2NR/hA7KbvN9IqhHbmxrWOv52PCOEGdtfBYdQKoS6SiPNKpXKGN71gk0IEEP5/LO1WJCqJqmhuhB3yWZR8TjtTzakEoUhdZitRzlN/mwHGYD4B1Pjzw4rWIiCy39Rk8HA/HA0D8cPyzH8zGGbRhuex2u4vF4vnz56vV6s2bN7PZDO23VK0izQoymggQsROkaUr5hVqt9vnnn6/X636/DxoXaKfsvgS+Bv+iRqMBBh+ceZ49e7azs4MMbTQagZIZhiGUHNvtNvi/JBqvVqvJZIIgEigP+JKdTgcQg+/7AGXYQotWX8CRgJuZfQFuxssoyzCbzcbjMfAU1KiBlLHTHPETdlZsfsCScPIQr0BzMV1TyF8GtAROYhRFUEUE67lgkAK8XnsNEWgAK5MppTaj131k5KlhiyVQK8rJTZuVke9JCT98FE4euDz3fnZ506BWSyVSBlc2VfCQnAMgBprTarUODw8fP3785MmTs7MzUMWZC2nTg/fHyDTWqVk/ZC8W+AuaZYwUBc5v8/kcoqidTgduaZCc1gpuaRpOZmY8GUxn9e9ePPm7rz+78NvxI0/2RTq5NJVTCYPNlaqSbQDxeZ48XIl/lnXTqNOLB4Pwf/qLN4/3XkbRfBWmWQLTbqO1/LRLAyYpbwLOls3jUDthRIjxU1FKCAUKKnu39WICgRfqomAc4kkhoGcxqZBaU4+FFii6/FDgHkI9FjqhMNmj+CYyc1xRt9sVEYwcLF+8M/RFRIiM8glWMxR1AKJhhONXFLVk9AywDNopuIGsNhGpPD4+/rM/+7PHjx/D1Q0mWpeXl41G4+bmhtoUGiEqewTdJdX3cRixxsqJ1bLdodPpwLIPdSlKKOB65/M5ePTkt1KuB2AWpj+JHqwWaIcorAB6OoOYD1V6gjUFVshyuZxMJrjbBwcH2ALAUMbrQW4FTFatVnd2drgAAkXq9/uoImAdAxqIy3z06NFwOISJXOEOY1OAflGapjs7OwWeGjU3+ODgqwlzP6zMn3zyyePHj0UEcsBaDxpVjdPT08vLS9ylxWKBHVZyHxjJ/UjxILBxVKvVfr//i1/8YjAYwPpPp0C0TdOKnHQExUMnwxGcWSwFZflmnMx0Oj0/P5/NZphQ+C2VUriktFqtbrcL/V/OTS7UTMx+Ku0UwBvG2iiO1+s1VIMxklnfxYJcq9UGg8Hu7q6+XbiNrOjgAwt1XGydVOpEQYvlDU3D1HxVgim3J5lXerQMKwcYm2m4qGpZCS32TdIW44GC/oBu4KUmg4g4J0lijZFOd93tXFUDY6y5GLcWfzIvZj2ZO5kaWeQSE5niQgaKPpnktEovR83CnNfmVNd8tomSaEKxRo29/FtqIk6cJ/OFPb+ojXr1NF0bL/WNZJnTHTBcGVjMJlivRb0ZfhCD0PxurVSAfYcMOM2Q1WCZRlRJmtNkZA5sqvdg1hhjxFovb/x6X/qwSJamWtKg0OOvARF9blpueysFmOiMbqYp7BFlFqdGXXXnuKbs8Xu1zknBjblABOZkIfsbGyuDRnysxoX15qXx7nIhAUPQWudZ8T1jjQSp+L4EFRdUM89lJhBnFUE43WQQpzkMRxVRq4zI7npsxIhdiTVMqe5QAcRRPrMIEK/v+MOaTZpzCAAiT0VCMU1p2Wy/F/3iyfLR3rpRc5mTKMmMxIGNXBovls73jPV8z8uM8URp0G/1DSubIpJUoe85HoC5lwiPLyhwObdy3gvfe9fwo64RZnG73QYKnKYpdqjz83OYyiASaDabjUaj2+0iRc3N1WU+n89m0+l08sMPL9frVavV2Nuddzr9Wq3e7kvgu+WqkabZ1eWOm2e36gENJQoc50tfqh76lomnlj7t2ElJa08tp5mqUmSqrkCRH1oaurx0V1WaJHklz4USLsz5wk+T2u6g9sknyzSzviepJ85JljmRDa05XXOiUw5yQK1Kx3YZbeNZgGu1lUuhJ0mPJb04a9ccLfhG4XiuV7qMp6WEtRMml/eCdlPBvrXcivHBGsShkuyPcjQfNaQoJxSLko1e5w83zplAwb0dCQ/Hw/EAED8c/1wHA1yQ9eiOAmLver1GqyxASTBh4VgKTlYYhsyNKVcUxzEUKmApC1QXZjLtdpvNd8xgkXgTmQJ8gCQTGxIaP9EixNSahCkatnBjILsQ2TgAX6TEeAuSN2gWowuJ/e/clrhzgDUG5eXLy0vJFU6JLkHuCqAhS6DIVdjnjjNElzR6k+v1OlBgSBhDRQvYCru5sfkxcSU7AwE05DIKiROEI7ChIpkETM8iP2hf2oybMA2t+VjR1Wb0zASAvwBl4NPkxszogckbkiUYoNGBimwRimYAbwUFD81i/X6/1+s9e/as3W7/9re/RQ94gdRQjmvvoeRokzqtXUUCrHZrKctE4l1gNQITbzQaw+Gw3W5fXFwUKt7WmkoQXk97v/v9p8evd8+W/XPbiw89GYj0cjsUkq0iFQu6XFaiABBfiaxFZiLH0pimX34x/td/dj0cLAb909XqcrXOMrGe8TyxZEWRtoZJgdNjsz+JOZqXrYUjbr2ec4hZJ5Ck/L/lieTvwprARJH3TZOA2FZPXFhLRmIAo0gD/BEDieGptRbEUkw0zDXMJi2mTDdF7UqET2NLnZbDxiWjUwEfixPQrhcYMKh1YWrDXBFlKp4tmhWyLDs5OZlMJiCQ1uv1s7MziNJcXV21Wi1gnRuOOvmALHjH3ZW5fRxGzAmuO4XxFEDPoZUZlZ3RPqLVlnmlWEIpQbBarXjreF34CVsLqc+DUcpOC1BTmR4AnmarCsFNKCoQVqOWOlZpoJzdbnc4HEru/EZGPFBsnBsueTabQfEcz2grO1uvBkS670J8eKXYHVBh7Xa7IAWLapnk0FosFiAmt9ttEHtFecdjfWYZA3sE5ovv+3t7e6BOF2AgfBHZu3zuuO3U5KXkAu48acisDkLuCa6w19fXKE+yeKPJX3r8EGzVn1MoLP0EGLFzcNb1fD9Zr3EJGDm6B5kc9tFotLOzQ4CYSCKpuFpmEQOG+BQlbjEpCpZxem3k9WpLtLIArlZhKogaabc0Xf0qN9BQ4qDwb93xwLHhnLHWBUFcrUTNemqthGnSCPp+kpq5uLnIImcQJzmwC9f1NMcg/BJAHG8CxLGSTM220aO09IRVVCwnYWxfH9d+32gHZjkaZI1m6AVZFL0VOSlzXQuEX6KHXBYKdkkaUtSQAQs2XJC3Sk5pNX+taqpRNm0P+BYgFvE33SPfObCzNHXGuDtEWu/B0aSEKesXFAqQWwUEClHWPcoVxIi14EOZ06d5x3qCcFoVuIT0zEAIutUNr9BRnl+s5HRAJ+KMcdY4z7qK7zzjYueqlSyopH4l9bLsLR3eqXYurQyQKsHf7F6un9nUlCgAxNnm5yQ5rhTnSmJbJSb4Avw73dQfiPOWMhR1PFMR16ulj3ajTx+H7VaapGa+yFarOI6iJEnC0MXWQ80CAXuhkX9relhmfRY8AN+5iLs7MN+7vlHjgIWFTn+IrvEg42u1WqikQikLKyF6brBow28Ge2iuupOg/D+ZTGez2XoV1qr1atWr1+JaVarVzLmk4q1MFmehuUX9dNtftvms3d1jo/BvLWMiigJMS09RCifa2FN7hPIFui3D5ecWS+Ykisx86s1nfhh6WAaMccaIc1A4t0zZyiIMrB8UFk/dXVRuWdgQ9lXJlPanLb+xoEFMLwqtTlMQdi8PD32SBbHje9aut1/6EeEHFfa9HOjP8ifiSo/Sy+FgvovuhQ/Hw/EAED8cP7eDIRpdaFBiRQae5rbg2C2owwCKH2ILkOagCoo1drlcgmaLBKnVai2Xy/V6PZ1Oh8Nht9tlFydh1k6nEwQB0EMkwNQzAlEXqhQgFdKaFjoPbCaF4yoCSrb9UqcPGAcoZmEYAoAmvZEpKyUIdOfv+fn5d999B8biaDQi3qE7ZZIkgXMRbina7fEyRLqABgCLOOcAwSBrRdM9IJLpdIpWKQbZ4HWCxITP5PPSLgEgb+JyIIpK3YZut8tuLGBqwOnoUIEdFNod5ABS0QIwLvdaXBpqy2gpIqqie8+JS+J7e71ep9MhtxokUPrjiQgImAj42u12v9/vdrsYV6vV6vnz5y9fvgQIqJk7W7kPd4WelFnQYNzWFsUyOkwwHbAgffy63W632wWDkoqHSHiq1WwZtv74p2c/PN8Je5X4E1+GIm2RRt4y5pRdSax8SJK8ozBVAPFYJBQzFzORdhL/8sn03/2fTpr12cnp9PIydM54vmfsrbENEy0MNiBiopoE6exBbhopbKwWsLE6SRLZDM21ZKp2k8BwAnxGoy1qmBTQeR0aYh3gGGPjMD1G2JeN0wB3mHQDAsQU49a8US5xxHow/ulnTWkdxqNECgqNq0RtMN3CMEQhDTip1lnDUsnCA50nMTcpRqwdtGRTSLFA9f2R0DDXEy3sQPoGnx2KYYvFYjAYYBWlAHez2RyPx6wnYcWAGDflQbG6lvN2NhOQkEL6J7R0sGhgCSURGNhlnsul7I3Ap1E8gYA+C06UwcHHIjnU9BNQR+mOCHEelPpkmxOUvo0aM7on3WXzNQiqxKZxeqhekDEH0jGIThTq4eJMqiP6r+M45nrO9h0iXNqBTcvWc6Fj+w7N97A+cDck+1Kneaw1QrAYA6lWq2Ej4yPT4iEUVdDgWgFU/bH4sEi4Xk8nE+N5Llc9Ql1Byzfjhne73cFgMBgMsLPw5rx1M98U99fsJz4FDGY2y+t1qWyVw8y20NSvm1e0O2hhO6OFoPa10yRNCubqBmH9DzIxjZEsw/emWZbFSRrFkTUuiqJ4laRL55bmVoAYf4iFFaDeVMEWwNcSBRC7HNJKFOHRldquNfaBoyqSyHLpPX9eX0xMIKt/9eWq2VwHvsSxFIzLOMhZSmfJSu/mGAx8/VvOo4pkMD4ZSnH34eu5smn7h4J1G2tdBR0MRlbW9ys5heL9l2sOIw31ahCtwBy/x6quENvcBSiX31IGjrUwhZ44d1mZ3XNWBckLTcvQt1c7CZdpgLKpquycS1OLJyYinnXWusDLKn5mrQtcFgRp4Dvfc551YpRSbBngc3fAf+Y9cEB5D7w42wYyZiVJimxTnsJtIs7JLR/ZRWIyUw2k3Uh73bTbTpNUPJNJlmRpipHunNGOhvoB3Y/hFqIgs/m8f5pS391DpQxSF9SoOZ1Z7+eqq1+mldxZRaMxjOf51vOt51nrGeuJEWPEGut5UqlklUoSuyyzxqXmFtM3pVaJd5z9Nly4/EdyhNdsAsf8b1bqyTCbCDIlgAwo9OJ54lvxPbGeYKLQ//KdkH3hiUtJ2fyeh/jOeLWwlOn/lvnmOoTQcexdn1nWSCkvHfptH6NBXN3E5SV/Cpmih+v/1tQP3eYq8XA8HA8A8cPxc2MQE4NgXyrhAyTSbFRknV/HdtqAmFREQMwgWooIEAfqPGh6EThfZC5DUYHANGJ3pLLI9yiKBKYSyr/aGYbwkI4sgVSC9cmsgFSpwkbC+8C3A6oGnESYAyk0cgCCJnof0nQzfDsJm2DbAS9ANgurJUhtAlolVKdRCTwL4N20d0PihP5rIO+LxWI6nfLBIYFHp5X+KKJd5EwR0i3H61qqgukQYrJWq8XQAfkqCZio4eNjcc5MZWHcp+nGGDnQImi323Ah831/Op1eX1+j91yrA39YYHoH43jrJxSseDk+Qd8GLEWsisZuohwYjBHQhxLrrV0l9v1bsSpRSUKiKCqaJKIlJpKcJHItNpRmNRs8Sh558353Lm6dpLFzYq3vnFhjyTrkReGe61FNmIPBMc6f7diF5k2UWERj5fm40g8d1YuCTnQh+NNawHqR0QwFjeKhmQDgF1EAUsOgVa3NlwsAqG41wIeUvS/0EOLJYFkrCx3o4JXWali1QLHUtQQN/pJ1DuqKbkWnLvk9oba+LT9GuVWDp5r7CdJlmqbL5fLs7OzFixe9Xu/x48e9Xo8ulL1ebz6fn5ycTKfT2WzGtXc2m2EIoacEtG7ISnIR4+3CUk8PItYw8Cin0ynY1lzWmPIRKm2323S9hxIRoP8wDBeLBSpkuC6oeaBOBjaxpvURIcWZdDqd0WjUbDZJHfXuoPvh2WkTqvuxTmPMYDBArQ5lMLifAYzOsgx1jlar1ev1OBiiKIK0vdbB5+hF7wtkczm2J5MJhReBWqImxFnA6Uw1f8DN2EybzSb7QrAxUXSC8BMKmQCvUaf0fX84HAI1xjhBkY+7AOOBAppzV3b3EQdqRcZao+YmzpMVKey8KJcChWcdlKaphNELICC3PFb+qF9BChsLLbpVVjYb9gsw323hLR+K3GgKagb0QsAqTR0w6iGwylLQX2KLDIttWZalaRZFLkmyOHZJ4jyTzWbZYm7DuedWedtKmvfMEobQ0IPLqU9OUYzTTRhrK6olm8ZNovhT6N32JFzZ8+vK5NzuDxtPn/iPnFibiWRYUwsop775+sFpkqnk3VTc9fggMtUZw3VAh22agKb7jTiYNVWNKmHcNzlhrTGe71fyH35Q8eOW6XdvyaoQcH7o8RF7SpkA+P4w312YVBn1Lry4AFGVKdUKtHLOIYYR5yRzJstsCmOu1KSZdU4ABRkjTvOFnSICm83yhmwrdcg2RNjdATdvBYvvQpDLL9gITzffYkSMWC+zNjMmMyb/hQNACHakc84o10NXxojvrxnc9Sjf52VY7st4X7mWUGa7a3gagXer1UILZqPR4DyFLS1CwUql0u12syyj+ygWfG5MWC3hZQeuOuKKVqvV7XQbzU6lWrPWiGTWq9ebfn8Y7obTqzBYBPU4DFwqYnPd4WhTX8Jtqx8UlIj5h1Cvr5oznAIQ002JCT+vz5EmHKg/VHiXXCzeF+NLtekabddsSaNua1U/TY21zvMEitwULNKlNUbmuGO696tQTmB5tVza1I7QooQQ9VxmlU5H5vh2rtvawIbdVIycCxR4quphJGgpjLK+hB6NaZa57APFgI1INRfTj/LtLBFpiqzypxnl2sRsyglEViINkdXtrvcgMfFwPADED8fPFCDWGkM042a8C+wSWTpoUEjOsf4iaalWq9D+A/wB7UXq+hHucc7d3NyAIUUrNrRgd7tdIEGDwWA0Gl1cXEDuEDEBlKTQHHpxcTGZTMD+AxO23W5TJ7FSqaABlsEEADIkvUgUB4MBdqbFYgHskq3KuHBsNsA7Tk9Pr66uQBzmNom8HWg1vK0gptzv97H3oFEX7vb4N4IVmmxAOhNOC2BPc5vU5ifalQ7ZIBBwyY1ucOE4n9VqRewYNw2wGnwIcUOGwyGd6MfjMXJjJtWUBwUXG2xHnWURUC5gjvxeeFiRUIZ/oLead5gGuMQTgQ7jZs7n82q1uru7OxqNQPiq1WqQtKaxUkGR6n3JaLkpEHummLDd5RKO/6KPHqZG0+l0sVhgDEPPlMokIBED9/M8zzlxWeoFmdfJzECkI1LLKVcmR4SdSsiXChSGwFyca9LNxczFP3GNNPv1r9f/5//j5X7jdZZd3NxMPZulqdTrdbKfgOlo/IIe90DNQL0naRRgkygPNERUb0U8fb/W6ejuztV6jSnGA13/l5eXMIUjW5NcS6wn6OUHPiV53zeNMvCl1BygGAWYiZqqj9oDyK1gvCK9xw9RI8EraTvJ4Y1PY0lJa6oAecTowl3CBOHcpFA1EDSo7ohIt9sdjUao8eAFwEnZTHB5ednpdDBVibm3Wi0RabfbUConCY4ziwi1pl3/GJhYy1YUWtoxI7BW3NzcAPaFevv19TXGD6o1FxcXr169gqyBpjazFYBkYQ4A3Hx0P0RRhJtM9UlcFxwFUX1BwYna2Uj/lsslnxcAd9xGVG6gSg+CMwWs8W+KjWCBWi6XOGFsWMD3UY4qsLapYlEQ3MTKz9Xs/jIVxC6wRJyenlJJCQAxNehxXUSswInG3AQKjKfW7Xah4I8kmZgXNhQMSLoO9vt9bDqU+uF5UmEQd4xTXrP4dTaF1RslWKoxhGGIRB1rIBqDBoNBq9Var9fX19cQDCHiVsCVfioNYudc5pxxzpZ6WsuUt4LCrIaD7+eMa+5zAbfa6LYu9fgT7S2302qhZw2L6NnNkEDDo2WGJlP0AkiqMZr80/ArwS/T1OCPScRpMNfcDYcV8LLCv93dtEpzx69yxMQ5SVMTR14Y2TS1bF8vGHjq+mXhcWyFn+RuAqx+xHfpMJTrynd9vh5m+nGjVPyhApfmbry1XHi4Rxin/N+tAc97TbRNMwBKPxV48Tx08XVDuHazIwfojy7V3IVHa2EBXTnDS/BtxgAnlSyTJPXS1F9l2coGRrJVXJnNast1JUl8J2ZDFrYMxd7D+TWbsE6Z2JttTo3sXX+c6ifTihZ3vYy6LiK24nzftTtJsxX5fhLF2WLpPOPSzK3WLoxcmjpgYiKGIYruGCuHB1Jy8SrD92+n1b0D24Kfm1M0thYGCpQCVoCkJKmPPKvX62HL5g5Ib8M4jgEco7211+v1ej30rcJmBkEjIjQkTQgAAD13e/12u1urVaoV63liPH8oxngLqZ7Vx3KyHI4XNok9sSJNkSD3D4w3zTl1McwoFQJPSfQYJXud5aBwqtSHrdLhsfnnWzU2qINMugk64pL8Q0IxTvyWq7ZNvWWbTa9e85PEhhXJs3Jjjc3sLeFJjwf2JxX414WuykIxkjO3sA6IcofWMZW2fqWAG3uYEJCz0QoBJHuIEdpp5Teiw+yvLXfqaDWhAuXlI8vVLm+mwROJ8/sf5RhbmLvY2Vyy3xNZ5e99MKl7OB4A4ofjZ3uwBZv5MBZxIJvYlcFAYSwIuhb4XHgBSrKSW0iDfxQEAbNH0M2+//7709PTL7744pe//CVQLfinF6QhRGS5XL569SpJkk6n8+zZM4gG6rgwDMObmxta2RI6wZcCIYUdEFvmITtI9Ul0eROyXCwWADSTJEEafH19/eLFi5OTk+FweHh4iF0NNWfcB3w+iMnAEMfjMVjS3F9rtVqSJHDPa7Va9P7yfb/b7fZ6vWazyZo24BUq7QLmQBDDzhoNTABkmc/ns9kM6sN4Inw77Pvm8zmf8mg0CoJgsVjMZjNqYqC6DjAaoDlQA34vycVALihDzJ5ilA3gQEgQB5RbjBCoiBZklAv26zDxq1QqBwcHsCUECHJ9fX1xcUHfv3Io+T5YQ0F3D09Hu2zLNl8OgJVgn6FmsF6vUTWBDxvu4fn5+enp6XK57HQ6Ii5N0yiK43DlvNB0MgFA3MgrxpLzgtmcG4lMRZYKFF7dqkzYmZgr8VP3f/mfZk/3ok+fLX75+YXJTs/OxvPZyljr+4HIrbgwhRFJqsKTJdm51WoNBgOgcng60HbQ2gg6xY3jeLVey2ql+xIJ97CmAuRIS9OSvIweAuLOWFjYeY0SFAYPm9OJkhCaBz2E0hC0I4NWAyYI6iJsKNYqaUSBNd8Z+QPCYtZmMN04HkBOhAIAh7EeMyhBYbmAlAFrJ2EYAkqbz+fT6RQCAmEY/vDDD69fvya1v9fr1ev1+XzO85RNDUdN66BG80cv9aKkMxjNE2dhcYuoIlA/LI+A2tfr9dXVFZTT8Rp6HpI6BxAWtwXkYixxqCVAVEdykQcyPrAgw3AGnnVYKFBPQgcGBie1p7V5EWns+F4szpojj2+fTCYE7ilfiAmilxFSm8s3HFvb+9tj4jSAR2OoY6HGlNFcdUpeYCfC+ISTKjOr1WqF6VaQZME/gICjXIoJCHFGVhY5sCF1At6x5MbfzLRZXCReQFYO5hoqrCiKEDseDAZ7e3utVms+n7958+bNmzfT6ZT5HtsO7oJTPxIgRgZYyu4KrU4FQIrU0S3dppuhEYVrClTHMrZSQH7L1KoyaU6DufrFWte4QI8t4+zcywp0S63MqyGe2x86ccZ41tWrUae1nro49r0ss47a93dhW7LZEL0V5Cr/cGub/LYufrQ/ixERk4N3RlQrGy6QDAatTS/bmoR0dY0rqgZVsRTr8EBbBRa6N/jGsujBVjSNb/5gdNgYKelI6FpLeSRsrYuUt4B7AOKtUqGFwc/gE+G6VvlP1cHOgwKwy0IUuYFY+dFkgxLXVh6x/kYKx+V7JSJVsUZ8P/N8Z4ykmb9aVxfL6nrpS+JMJmvnX63b41ljHQepWGfNW9O5Av2zIPKQKs86l/PoCxCwHvxlfZVU/SEtgBrEZvNb0k2RYi1VrLvKlmJSqdWybj0+2l/tjZbN5ipNo8UidqnLnFsss3WYRHGaJCnpw4wPuaQXnAl1P5Yul+pWKs2d9+6NSay1nrVmW2HmftKxFq6VvM2l3+/v7u72ej2wNMAhYO4AxgOqxaAL9Hq9nZ0dvB5ZCZzG0Y+IsQeakYhAeLDT6VQqlcC31hrnpF437c683jmpnkl66q2XleXCCrjnS7lV5lnnkbwmhGab+g9UCtYAMW0obUmWJ85NzCoiYT44/fw1af5RqSpyZLmhYpZ/oCeuIanvJVJJ0ppxme8nlarDAmZvd3bx3nZJQr9byG+gR1yZOlPY43RBSMu1631NG2lK7g2upag4ZnSyj3AFPVWgeUHIDhscGUskMJFurEesbHbimpww9HaD+OBOityJLsxXgzj/r8mhfNm0pzObS0f8LtPLh+PheACIH45/roNMPc2q023UrVZrNBqhh1cL2+m8kSb1TKgoWYg0Fbyw9Xp9c3PjnOt2u5988gmBXe1fDFQRSez5+TlRG2gjIJWt1+uA6mAKB3YYdXKZPEPTlqVLnCfU+ijCCIAMQQZRbEYnq9UK/dSNRgOolrZrR+WZCoz4NIDF4EjStAe927kubTUIgk6n02g0gBGwpEn9BCbS3P+YxyISYlsl7aGgC4lIXdPfEAWCxgVwBz8HX4N+R5ptBIhWS46QV05VDXYoU10E+b8WtSC7GYV9phB659b6sLiKMAzBQEcDNW44WKLE5XUOdo9n91auggaIy/Qu3Q+l80D8HCcDwdl+vw+e4+XlpTHm+Pj44uICv1oulyJusZg+/+Ho5Vlv5tWzXSO1XHqYuo3L3LEafOFrkVnuVR2KzEVWEnjZfic+ehrVq/L//L9efPrJOqis42h6db3OskTeMj7e4ggorZMaD2i71WqBawknQOD+jNsIjTHxI940n88ns1kynztFRgOWhGY99rwDh1osFvgE9o5R95kKjGzWBnwMmWnMC2JJmp4gm5bH1NFGiQIzjmNYryfaAw2rkBY3Jz0fjflU6OZcY90IuB5uILBpgGtYUthfDL9sAhmkwIB1PhwO9/f3jTF//OMfT09PV6sVIFdyMNkwrlvt5A5JtR9Dt9ROSoQbSP4l5MoNAkURXC/S8tVqhVURay8eHNFhrEVsBgQkyhvC0cXMU8sHk82NU8UnX11docTV6/Ww8nDxIZgLYJRdLDgZmJpq3iWllrUGEasO+hYRtL1r39S8zndEWr5PEQZArr7vo8KK6Ym5UGArg9ePIgTN1riQgsLPHh3uX0B4cTOBlYMZTQ1cPn1Y4QGUYUFF832Y8pGmR9VsQDPa7xSTutls7uzsNJvN2WwGlhZuNZH6u6yxfsyRZlmSJAAVsJsg8NASLvw3MfRCRZAbQcF3i8UPRCY6nNAlHO53stldW9a00RoUvNW4P4X1SutO2E2BAq3CibWLXpp688K40m9Ussu3DyTws53h7Onjcxl7V9X2JKq7hYFl3BaA2CnXdU/tZbHqho43jbZC9V5abyXKgjVTFmFvKXjG3KLDJlfVf1uuwwzCNodyPuFCyutzDdGbApc7LnF87gTTsZjop1PgZev9UT+1QptzgUX7weUQY4y1Lk2lJIikx6puoiozqfVbCtxnzS4vI8Vl5QENBlGFqV6vY/9CaITtnof2X2XzAbvouNbhsS6Xy+l0Op/PoXJTEBdmJRKi59h6dE9bHCf5GiiNeuZ54sRLEjue1S8uOzfXzXBhTWJi682kdpZ15qaW1qxjbz4NIQogfZaP1VjhyGmOykmJI0wPugKhvgD+IvALRcLcoFiUttgq5wfgZescf6RJHeLDqchCKpIN2vGjncVnz2bPjubD/kzccrlMojhzTsLQRdFbpSYGQqyzUrJPi5vriaNRY91IoU04tTnEdmYGJCZKBTYp6UgUOjNYwMbm0u/39/b2Dg4Oms2mdkJGHIh8sFKpMHdAzfLw8LDT6RhjJpPJycnJxcXFeDxGPANSi7W23W4DJu71eq1W65YLJSLG+V5qJGq0bqzvx1klWflzVxcnad2EXrCKK/HSzxZGWiLN3J3MlDokvNyjrKLwXJfTTrGWag4ydeeSHCYGiFxRAHGUQ41WKQIRIK7cvj6pmMnaf3NR2z1Jrc0qwbpeS0zNpZmkqYtj55KUqg56xdNKPtzgGDwUfDu1kliBc4C9kr4F2Kq0dqLujdOtCVjSkRgiBMWHoHSNpFtXMvhdpA+XOye26qt8fGiNmx+pxtBA1QninFm81aVQ+9c9HA/HA0D8cPwMAWK9yBaypkqlsrOz8/nnn08mk9PTU+Y2CPWwqtIiVpMuCeMiCimY4YCmR/YiIC1s1dfX18h2uA+BWTAej9kLTzEp1H6vr6+RFYDjKXkvkubUcBNCSziyce4W2GnIodYnGQRBt9uF1gRUI/DJQFrB0sU+CtYVRRh1GASLJ3brNBoNKCcANAdWhRtIcKpAEzbGTKdTpNy4aqKc2BEB6ZLeSz9uUPBAmCJYTL4kMXpG5KBmI9ICX6NgY4Wdm4Q73FWg6gwstLAUm4B4jTp3YswKDB2wAov/MOsD9IYHp/2XdDL2QT2SxKFYIOEncBhQ3wNvQRCJGkYYhru7u5988gkqEJPJZL1eX1xcgLi3Wq3iOEqS1XLZ+dt/ePLbsy9OGv101xOjGMRGWc8h9F+KXIvciKxyuYmJmIU0u+n//BeT/8//66paqezvXVWqURim83m8WIq11VYLMpoJ2+cxE3u9Xr/fx6TwPI8AMWvmDKTo26ZFTjGqSVdcrVaNJHHbYC/t3mOthb4nIAmgikQrWK4ArAzuJGpOwJtQy8F7dXVhuVxSzJqWTfiv1kKFVSbugCj7QVwRZz1KOBSqA0aGT4DSC6AuIMgYZlS/JTgOv83ZbEYvbEbJtBdjnQk3ebFYIP3odrtYxGgpicyZZFLNhtA+cm5Twq+ge/ARMLGGDzCwsTSJyGQygRYw1kb8F6cKSZzz8/OTk5Nms0kKNsm20LrBrCTvG0s9GgIgtovr5eqBYYZ1cjKZRFEE5jj6IaAws7+/D4CYs5jAHORNMJyA0QN8h9i97mfEnRyPx0Cf5/M5zoo4IEYs0A2NYty1e8p7eLxAAxFAMPxa4Vl6fX3dbDYfPXqE5bSA4FDWho+JvbGAOJ1zw+EQmS1GLO4n9ggs15pWL7kSCBfSAtqLd2l+NBEuJF1Ak1GUnc/nVHpBDQ+LT6fToawN8CAGGLIp6fATYsSkKGJN5g3njcUSgcItd2pWRBi9FEzGKvlBEJw7BQu3Gl7k4NTRRaHZ5a6smB/IxiD2YRTkv1jVANaGNVNfAgAgBCGscxS+5XYAGxME8ScHV5WG17iQr8d2sahG1574OSIGxKEqEopUck8eLweIvZwnpQHiJIe9VqoRHr/CTrfKd71I8SKT25cZ44xx1jjm7zlAnKEXigR5rPm4Flo1ktdfwOg1Rkz6amE5paclq/WMcHgDMaEwJLA1aLZaIcx4y4T9cE0VY4xnrckyUQ34ZZe5e7TpC1VV2RQM1TLKBRT4Lgkj7vVY6jHRIKSGSIm0A6A5LAzTbwO1Lr0ssBcNvE5EuZxWup+J3R5QZqtUKs5lcRwnSZwkcRSFuVu1BJ5YsZlUF4vg4rL9/evRm5Pe7LrmYskCE9X8ZbOyaFeTpmdq4qo5E1M2JQJMHqfF6rcg//p5778ormiqUOBMYc0F6QnaDhMjjhTLOMm7xzBHMFmWIvMSQDwTMxcbS7cVP9pZfPF08i++uNkbzlqNlUg0X2TGZM5JlkqSviX/lqVsdByuGyM4ejWIpj05COEVyqv3MOLNpt2iLkIXtlTZFJNBJ1mv1xuNRvv7+zs7O1DJo1EBa8wYZuCXgLWwu7t7cHDged7l5eXLly+/+eabq6srpG+kiYB0jOCk3W7X6zXf943xRMSYLPBj30sq1dDJ1Dm/7UfrWeAyWfrVC6/zRvo3i2Y2MdIUaeWrIkFAX40EmwPBBdK6n78rUaUCp9DGOB+i3h0AMb80yynG2S066QJZO/v6rPLbr2S9ljBMnjyK+/2kGrg4zlZrF4ZpFKdxkjknnodE4DYp1ve/YKCqVxU+VnaeSW4IhCUUSRMKP5SYI1egrCCvF3ME/MvlEsVmruSIMwvFZs1g4x5XEPzRQcjbGr8x3keE1NAg9nNlD+JqhIZjkWrOAeITr4os8+dVF5k9SEw8HA8A8cPxszwKyyuLyWSvtFqto6OjarUK3QPAuNiMGQ6KCHJsRHvYegE+slgNH3nyds/Ozq6vr58/fx4Ewc7Ozu7uLtJyCLkCMXn27Nnx8fHNzc3r16+hIQULcqAYkIyA0ESaps1mEy5D2JngOUAoEGcLvhXCesQ0AHS45YD8C1mD6XQ6Ho+r1er+/v719fXZ2Rnw3MFgQL8yQKW6zwV7Hlu0RAQyWBA+xo0F7QIbJ+jAebzriDphl8WeCgHfKIpmsxk8/aj4CVAJwY21Ft50zJG0Qj9Jl7PZDExqFv+BwTHRAh6E5ne0ZYEwiO4tMjg6nc58Pse2jVuqI0i28cJ1EIgPkxmSl8noubq6+tOf/vTq1avZbDYcDkEL2tnZcc6dnZ2dnJxAFFUT0EhMe3+gYWvSXgDgdOc4URIOD3wdBhhGKZkIPJ8oSgPfZWl8dtG/vOgn+4Fj/d+qirFT/YaJIl7FYleZt3LGmcC5g2H0P/7V1PMbz1/E42nqMsmc8TwrcotFpmnG/BYPEaUUZLAAQTSYrlutISNOiIQysqJUDo0xfhCYQqKYw2fEQDHXNmwfVAguJcts2VSXY71Bd+8CZKShGWY9eQ3UIKPUsuYDalqfbkADn12j5JQu0QFroRuOYwATn3UX4i9UksWX4isIwWOCkNqgRyCujpRADXBr2U3tV/lxvfl6udNykJr5mKbpfD4/Pj5+/PgxMgQsNdPpFPJ/g8Gg2+3+4Q9/eP36NfTiQVmFtA5wK5CyKYSNnAG5AZIxYLIM4nFLMTJRimu325999hnFcOr1+tHR0d7eHgR5AROzmQMyL69evRKR3d1dSPRg3wFCTcYfNouLiwuoKgdBAH2YQnujtk/hXdp6P98X6PE8LKfVanW5XF5eXhJagi/faDQi9QZDlFXYtxBElhEXxoKM+zafz/f29lhIYOEH14XSGtZeXQwALo/1GbMM1oJU2Me3Q92bGxxuHThW+GQ2zUyn006nwyeCTQQfhSlA6SrqjP9UMUyz1doZDr0gCKwFCAVsnT6idKklXqz5dJwLWlgf/6WwTL1e13Z23Clo0yqqC5tzjUzJrWazXJTIg9PULe0kyRWpMKgYbOgP1K0/HFS6fzx/InCNckGQdJvzestfS/vNbGRvnFyK+HmfrIhUlRVPVd5arZJBnL6Fd99KYUYKBcb0Ata2yhmRFO5Mc3JxIp5NK/W411n1u5MgWKdpHMdZmmZ69GpKI7cebayqmbw662f8oIvKBeERVoawamkyI4TyZVPPgQxWTVjT8PSGNNMHVkQ4qfVSo7+6vAoVttcCoEwCe8E8qizfrHeZwvZNkTR0J4BBDIUlBpk4WHyiOgStEXTFAqsEdNIIA5UXZLYk5p8TpGmMR+dc7BwMHJzLbBT6SezHSfVq3Dy9aL8+6x6fDSbXdYnFVSVrGWdN2rSZnzOI7TbFbS0gG+cDWAPEZlNMIFHocLoJEN/DII5yBrHbZBCvFUA8F5nl8yW7/S4bSuBcvZbs9deP9+dPjqaP9ibdzsKacB0mYeiy7FahJMu2eIgVdjE9uTQGV9bG0ZA9DgSQ98gQ4+vd3UP3rvHMbAIpEgDibrdLf1EUKakYhmUfdWvsX+D6oPx5fn7+3XffffPNN0gluDjTJxzv8jzPGIvrM8aIWCcmzayItJrJo73pqL1ysWSZuY4az2fJfFmfzOtSs9IW6W6qDNucIFwp2XUWxpinfOc4orQGsckHmCiA2OZVt3xU3JqLJvlYsuJEwrl9fSmLeXU8cb5deb7v+7FrZFFk5ststUqiKMkyhwjU9z02WGjFnq3y03qH0o07HBh00AFGDCqGVpJklK4/nFQqRCYoiiPtLbfVFnjoukTHyodezMsa9LcRmu+bD1Vvc7mtq+QwMfQlELVBd2KtXgyhCa1Ls1IdOQ/Hw/EAED8cPzeAmMtoWX4eGfX5+TnkhoFpJkkCGhSJKhrQQWwRBEG/369UKmgNTtMUTWGXl5ez2WwwGKxWq7Ozs5cvX06nUzinEYxDjOJ53v7+voj88Y9/ROsZUll8F06jWq1S7gA4wnq97na7AO/waQBzccJAK0itoj4yepNXqxVa3fFDsmiJsgVBAJUrNO3mmk0OLTD4LiBHyE4BYFE3DWcL8OL6+poIcqPRIGtjsViArNdqtbARUheCPh5s1WFbH4MkNPiDo0F8UDMZ6Z2FHwIaAzIISh3ZxGCr4WSWy+V4PF4ulygYjEYjEAlB08M+rc3ukUtT8oJ6l7T5wn5PmjOEWb/77ruLiwuKh6JT7Ozs7MWLF8+fP6fZEdPpgkLZ+0A12gEM11gQGCXju+BfR24FHsFqtcJIADkUqD1pvM5lvufSNKvUU9t20hSp5kwBqyzgU9VsC3R4JnIpnmSjvcnRs0VFgn5Pjh6t5wvfibO2Wq16SZKGUahDItx/IgUc0pQGJvyBKyIYh7uhJciJIGBBwKhO0zQKQw1OWGMkf5koR3j9sci0gVMXXN0l17FBbg9yAZvoGZ7i6lDyoVQFER+kJd1ulx3HxHnheMZEndeFi+p0OlTa1WxxItS4n7qZjgANTpiGnFgf8GJcApXEcb3gV7ITE1eEtkcQLZHV8EO09iJnE+4qXnM/w+t9wMqCk5KWDCJyh9WD+0Ih4qcSN6Y5bgXECiT3XsOvuCNwBBIN5/3ULeEFYQ3ckPV6jcVTr/8Y9tQ0B7KDc+YaS9MVjYtRNRtgND58a9pcVkIo9MAWEPz3gXtqtRrot1iomT5pXImYFxBGwii4pRhdGJPUbqakQKH6hVvBlZYgke4cIqtU8t55bf/NG0gmPp47tjwy6wsarwT9l8slmsc55DjNfyoSsTFmb3f3i88+q9br3ia7jUxP/pB0YL43yA8OEl1xxBjmmWshAjqk6Y0PbyzADboASYLqVm1iTafiD7muFqQDdO8X2hFwJvq9ejCTM5h/oBPxjDFWsnrd+dW4XU2raWqmIoFITTXRhwogrilATTOIk00GcZxDYMkm85EMYq1BQfWJWKq1aLd/83j/6tHRWa06i6LYOYkicS4D9Qxk1dwM1id7kZGnbKo566esSdbYBPV6Sz1Wyb0fSDQG6sFNFrEWq+B6YSkAxG+RiCxLP7Aocmvt5VxWWnYKoN7W4ndhNSh8uEZPyhlBGY8uTFjCtbX8QJhHOicNKijMhdnHp1Bg/GEAF7SJCgsvi76e51nriRgwBcXF1kRBEPleLCIu86N1NQrrk3n3/Kr/5qR/ft29njfjte9iJwK0zjibt/z7+TgvS0xoEWGCvF4JIHZ3AMRONZK7bQDx+j0A4qXIIjeoWOdolJXAd/16vNdfPz2cPz2aHe3O+p15tbqK4ziJszhyaSb8+oJgun7KhHp1oMv1f+u7tPgAo7t7NkHMzGyzUFHWmCYAXagGYQLCsBqcFazM0CRBDRh7K2rY4AZhUwMhxjk3mUy+++67Fy9evHnzJo7jer2OoikBYl1NzIe95H6eNpNAJKsE2ai39PtZ4KVJas+m8fx18/tp5C2cOJGaSDvHAYn8VnKGr5YhJk2kABZjRLmcTVIYhFW1xtIpMck5xWmeREhOW/ZvEedkKeOFnY3NchV0G7XAi8KFa7fSJHFJGlubVipZpZL5vvE863k2yxz1i5S1qSno9mjjaG64ZP4W9LJ0NxJj3UIhUzN8tTEdeEhaCIWBOjdfPbTKPq56u5RNt7rbUZ0rGX04gKIAff43yntuAqU246l/G5EgR/PTbTawD8fD8QAQPxw/h0MX1kjwAd5BLyDsvmhfnc1mgGXxLpiwUaAQv4I2BVSfACSB5QqrMTjIgY9zfX3d7/en0ynagUliQpiuzeWpPQqEgkxbyEuxCQV8HyAIotpJQHwGokcNO+IUqEXrEAGIA9FMYDQIOKDtCBLcer1GXIs8hJKsuBDcYaboiGlo+odtkhrN+AlwWEAJeCiABsjLIHMZQAz2Tsr44i7x0mRTPI7JPwAXSk8wMSbJC9snNKM1VRyMY6RMWjeWUCPVhNEHyjsMQqLWPiZyHYbh9fX1dDrFSMNDB1vw7Ozs+++/Pz8/Z8dT2UD8g4Y682e6LekwSDt48CugFt3tdoMgQBfkaDTCJaBPfLFYgMYOsDvLUmPS9WottcR0M+mItPLiP40p0JM7ybPlschLaYbrVmM17M3+7V+9/Kt/Ox32G5VKo9f3F8vAGNNoNI0x8/l8Op0gMCKFigxciuTCFJE0ZzZkEXvFz5HFaYVWtAjg80mXSzazX5ejEoBC8PmYRIjX4zieTCaYZRB0Y1RH4W8MBrJUwjDs9/tI/qmhDAUDjHnipMhGmL2DZKqFrcMwnE6nVFOhUgqNK7VEDH4OVxOsPMQOMOTosYbmBhGhIWSr1Wo2m1EUYfTiJ8DoIbaA8g9yHqw/vu8fHByAsw83PKZnALh15lZm1hQ4cR96aCY1IUXg+IPBoN1uQ6Wn1WrVajWiitPp9Pz8HNLVmAuHh4dXV1fL5fLNmzdYn4lR4tkBB8cqgeUItTc0CGMNYcQvedM3BhU6EM/Ozq6urgBZQkUBetA0r8Md5lVgzZ/NZiC0wluPXY1Y9vEWfC8gCZiLllGSchM64aSyHVahmHTX08GgBcjFKgLWw+VyCYySHk3Annq9Hn1KsUNBPkKPBw0VASj3fX8wGODmQ7odv9VqxUzwgJIvFgtsiFqnUtdOWFzB1nBxcbFYLOAmj+YVVMi41+CEl8tlt9v98ssv2XJEkYoPbf64Z0l/9OiR/MVfNFutTNVQMTaYr2oSIvlE7FtnLYF/8+FidSUIwqKanrar3MPTKgozBC7YY4GbSY6qtlbnteABaRhaq1RRzErrw7DgipHP9YpTW3fJ6EYBqPpaazJnMrFOgiyuxHMvHlvxRVoKraiKxDl9OCkxiL1NBrFT9c5wk0Gc5Wr7oaIPJ/mGGIokrt4KHz89+/IX33/22WWj4YVhEIZGxDgnbLTSLqy6gkvvxAKVW7PbENchTMUOTkxZCy5htHPH0RsrgihyxlmmKpBeC4aBWZZhf/qgke15nu9cls9WPeu3osMF0Vh9Gpz1+tAbSpkeWNCyKOxHvKUUZCMLW3sDYCOgTDbBI63AhndROb3gD1EudeRLRwZOf5qmRpzviQ1ERKLQn8yblxfDk9P9k8vd1zejq6gVWc81RZwRX6QhUhep5WUPT6F1BYKn2xSI8JThmN0UD72fQazNGz9UYmIpMhOZiSzELEVCcZ4ETek34qf7iy+eTp8dTQ73x8PuVMxiHUZRlMaxxInBWGMYe0+NYfOubniLFQoMGsLT7RfWWnMvhuacy0SMEsovMzPKHWYczNVqtd/v7+zsYANCGjUejyHvhhwQL4ANOBpr8MmwBrm8vDw+Pn79+jWiVqzSCCbRz4TIR3d9KeE13Cvr+1nguXotqVWSNPXCNG1I5k+d3IgsRDyRel5O4wip5M9X23s6hb5oG0/ZRjG2SoYCHnepUizxRSoiSa5uXN1EkK1IJq4maSDpylxcB7/7urm4tn/sN2o1Z/201w8fPQ4+OVrW67Hvi3O334fZjZnLDlTthVOk33oeMWI2bJGuIbmKtOTaxJKL+HM4lW0JEZmgsQBpRaHIVzCJ1QUPLabHc2N8ot9+u48Y8xEdHrebYJbjvF6uLBGpXE+UK12aP32j1EUeBIgfjgeA+OH4eR4kiBHg00xepE9Yl0nyldz0mUAAaSkIuBE4wt9cd1sjjYdSgYYvoekJnSlGrljWkWsho8MqTy4Y9qpqtQpQBnguTpUiDwxGaToHSFfzdvXlUElN0xtpdk/dtEIgpT2puP8BwmBDKwApJK4FC2z8VvtEiWo4DcOQ/u+F50VQjLXZarXKTFK7SDMg0+wS3RurY0RyYbSKn6YmIQfAeNANm2XXAv0IyA2nZa3OeYDlISzr9XqHh4fD4dDzvPF4fHJycnNzw5oEA4Kt5L538uVZAmGAUuij1HkRTqnVah0eHg4Gg2q1Op1OKU6KoTufzxeLBVsjb8/ESZqmqWTOc2/7cFMV/0FBbJ5b1U3Em7v90fTTR+d7u9M/+8X1s0+ift94vrO2niTWWhMEb7FsShOQSU1CIkBqClBSepuFB/qq4S0FwAiYEWYKJ9FG5IRUUKXEiPhR20AVgZnnfD5ncEYQkPK+HBt4F4oikAIgHQDIIHBekgG11icQH5iT5AD9W49ETbcvaIySFctsgSQyjd3gLpHcRKwNgAV67QE+al6h5r9gzQHFD8lMo9FA1wJ1zzXTkBQbnSQX0LSPwIjLBh0Umh+NRs+ePUP/ZpIk0+lU83PH4zGo/fQDPDw8xKIEbWXcPWL6bMIALow2ZPZ+4ilrlU88AnSJYtkEJIpCIyjJLKch8UPtATAEvxdPHzcZizlAB6yxy+USPRyYs0DnkVhSTZujjqzncvO1XjC3PogCBW8rRoxrBGIF/U1so6SXEk/klCFXkfLWhSWU5RYUL3FbsNgCWMdDoTo/pZxw51lf1Cs5voUpfafTaTab19fXeArI2ImgsftktVqdn5+jSDMcDkejEQpOq9Xq+fPnZ2dn+MafRIPYiDSbzUG/3+p00ihCRyprzAgJ9IZLuhM737eqQOiniaVDk+4ZKVHuUIvsa2Mf7TVXEP0s9AroDFlHR2QQa8kI/XYqinBd1YaEBWStXGF1zqbOZqmXxF4Seuna3EK6qZLC1H8Spb5q8r2MlEmNghXc7cp+d5mCxlIxmfh+2mitev1Zu7Xw/FqWGed8EccNjiEoIzdNci9YAuqqcEExU8uwaO9cbT6pP6RA2WZdk3GalLQaisvCB5ZDjBqx5eLTVvu48gpPyh5LMoXhV/AH24oRl79R39JyFY33NssyYMcMXBkGaFRaU1bLPPqtPNMsy0RcmqRJkiWJcVlgLHAaEye1xbJ5fdO9uO6d33Qmy3rkeVI1Ustp70CHK8oQwiiOsJQwYv48y19M7rBWkk1Kw95tMkDfk0GsjenWtwKmNnXGiTFOrDhjKn7WaUajwepgb763M++1l0GwjqI4TdMozpJEXGa2jjW9Z2m0V0pig+9sPyoc7+ZZbkZfW8eeVvjRPHfkhqgxI1lA+IQAAPkOFAibzSZqqEi4EJReXl5eXFxcXV0hTqvnB1ZpcodZRSvoHiiVGCPGiPHFGsk85zwXe25lZSbiROYii1xNwioNay8fbL5i++qaRLZZRSgPP7M58LIcNaYAhaf6OTz1FvwEHSGhZLG5Ggd2JVdvKkHgglr66BO/283cUVqtOs/L4ph1hdvqKUunVHXQDi66lM5pWx4S2u5VmyJoaXXN1NE6J9pKXTcfyKbGBTnI5Q2Un1ywxdvQJkajxocGJEaRtZO8kiq5KI29Vfm4BdvC/OmkuUgxjso/G0b813/91x/xrvF4/Pd///cP0NkDQPxw/O8CIGbYrRdorKcgTkLCqVar7e7ugjV5cnLCUA91V2prAgGB3iLSQnzaYrGArTxEJGez2Q8//HBzc4O+7LOzs1qt1u/36eED74ter9fpdMC7QRBAnILbA7AA3/fb7Xa73Ub2ixQUYBMF0S4uLsgKWSwWULPCOXe7XcAKbFgGBwpCE7gcoMCVSgUAHHkZDI6RnOMF8/mcREg0SsPyDigeWNggpYJuya2r3W6DgkFoD+5GTP7r9TpUmRg/4dlVKpVGowHYDkg0XezofwV6Js6BWsbka5OtjKwYfCgqOFN1ZD6fW2txx/BdvAkYBng0BNRoXUXMjlkZnkWSJFdXV9DuaLfbn3zyyb/5N/9mf38/y7I//elP//2///fvv/8eCiGiunE/FGJwueQITXjL9gial8cAqN1uP3nyZG9vbzKZXF5egnHADlPoPtNdHaSKIAiMmDRNXZY3f8U5Z8opLtX1bQuhnblH/cX//G9P/u1fvhgOl9Vq1ZjaYmmsTaxdGROL3OqugJeN0QgeIk32UEehVmaaprPZDBMEuBI7benxpUMu/JdhWaFRt0Afxsum0ylEUaFRPp1OMTW08SBpejSdwA9xFXTFxBkyf+DpYQQSk2XNg1oreCVrTgRhMcYgcUOWE2Yion98PsNWEsHYV86XFXrf6NuOf0CfNEkSVMU4d+grBYYmSiCYp2EYXl5eQjaH7iiStzkzYmZiz1aDH+lNJ5synZgFrVbr2bNnf/7nf/706VPorf/t3/4tUEs8aHjEff755/V6HSaiz549a7Vax8fH4NdDUV03YmN3aDQa3W53Z2cHOiG4adoj6zZCrlRQlkDuh+tlkwQJmFh8rq6ugDVj5UySBGI+WLrxiNGiQUM2/IOt5fP5/Pz8fLVaHRwcPH78+PHjx0g7CylN+b5xshRs3z/0/pNwR915LMusyALFbjQas9kMazXbtynJjblMohMWotVqhfUKWDwE91GcgJqwtRYi/hhI7XYbwx7bLkx+WOXSF4j1pNPpVCoVMHoajcbh4WG73caL4b8HUvbV1dVXX331+vXr9Xp9dHT0q1/9qt1uj0aj8Xj8m9/8xhhDiPlHDubbQDYIavV6vV5P8sIn/c0LvaWaSqwt4MqPktuTKDkODRCTHqWNT/XL+JoCOFtWliiTNPU5MJsty8voVlnOEa3WUmZXbV7mWwQrzUyWmiy1kpi36DDxsgKem+X0KFf6k23+nd1BjnObhM38H8a6IEir1bhSiZwESSKZczhlLn3EAihzr5FZfYf1/SzobGhrAXKBy5xu2abkW0Bjt3bul/E4PO+PWa/Vil3+eytGrNE3jbiVaXf3fm2xBla+k9o/Ews761i4n2xCouQLw3Xy37G2aC3pMvSsv9e5zLnEZS6OkyhyYRTESdVJ3TOZiCwW9Yub0en18M3V8HzSW0o9rVrXVrzOikhLpCFSKelLmG0AcZYjfUZJB0gJIE5LpZHCaH9PBvE6ZxCvRJZiQvGTrOKnQd35lcwkTqxp9tL90eJob3a0P94ZTurVRZqul8skirMsc1mmlwjZughsXe4KzpnlGFtJfFjNhnlnaRqD1ZXsFgvrWKE4p21dQBWCowlCbjAzwjBEiNhoNIbDIeqX19fXaIODffSLFy/Ozs7QFNvv9xGxQBeF2hQckFjJcXWFxiAnNs1Mktok9ZLUxnEQr/14ZtOxkVRkJrISqeNO5X/D5JMqPUleYLPbGMRuc/gVltbCqDOlP+S2O6VTAV2Lukgs2dxMJ8Fy5XmJGCP1ZpY5/+mT1JioWk2MidPU0WuTvGDN7NFaOnetrnol1CxjNu5oLF7LnZGyzS1MLyksqPPrWMLnOCwXQfWFUOZOn/9tpUrT7D8UI+ajiXL8l0aCml8sm0sH3xX+s5nU/af/9J8+4l2/+c1v/t2/+3cP0NkDQPxw/P//wcZDvRfSxKzT6dRqNcBAR0dHg8GgVqut12vqk6KNtNVqoTYLaObZs2eHh4dAWqnhe3V1dX19/cUXXwwGg4ODg7//+7//7W9/+/r1a7TD40MgOoxGbGAlQKhfv359enoKRJKk2na73el0wEdGCxIQKEhAUJwxiiIoVYHvCVIbgAxgSbhqRK4MiYCyoQoNihwyZ0DJtGXDrdAkI8TBcRwjgUefOy4qiiLgGkDuAJiiswnsKkB4YNiBMgbuIRCuyWSC/J+dkkB4+V/sdrAGIvgFVh2DeE0kQWgFmekwDCHxAZyChI5er4c0mFs1KeEFnT6dJwPUoOQIoAfGW8SUAcaRbtbpdGBCuL+//+TJk2az+e233/72t7+FCLVs89OQO/y77096tPAu6tKaPyuqnZyBMpiP19fX1lpQm8lknEwmZ2dngHiA/TkRa43ve55YI8r8OsqVJdLc5B3Ng1PxQ/e//D/O/93/cr2/7zy/5rJqnGTr2SrLnIiLojgMQ1Qp0KSPubZYLHCSFKAkEgr63nK5nM1mwOaQmOFpomSCAgCmAwIsVCZIwsIrl+u1v15rsx2kp+ADfvvtt9PpFDaM+HaEa5VKpdfrYc4C7GMZiQlJmQ4PDEtjwZh0WkmZhRNWpJAhgGiAMJR8YXwR5h0h2lqtJnmzG9Vy8b34ZKCWhMtRV0DxSevqkiQIC0r0JbCFAl9EMRzIkuK/Nzc3Nzc3mBR7e3uouhljFosFUG+yGrfm/B8tQExcjLMVq32v19vd3X306NGTJ09ardbV1dXNzQ1OBprg9Xr98ePHzWYTCxdsJOHbSSolwRoag4hIq9Xa3d0Fr0dPLkroIgPUEAxwWKyEGIEM7ufz+Zs3b1qt1sHBAdYuDABqv2KMgTMLMaJWq2WMAQjL2g9eo5m27zZhVwntXabt7wN34gJxr0g4pboIRj6KChic2N2wj6xWK3iQYpeBWAoGMwBi4LZslcW8g5kPVfJXqxXk3bFYYQWo1Wpk9ZI5TsgM5T1s8eDp4x+6VwDqN8COJ5PJ6enp6elpGIb1en1/f7/f7x8cHKAV4/r6Gtzzn4pE7NIUln9pjkYhHSV9kuiGxu8KGt9l4EwbV25lkW/lcmp0kpOOsEi5SFOQgSq02bJWoQuZurO74CmqwbUyaEhFhY3KqDHOWWNNtZp1OlGnFy1rfmKsowZxVvpDeCJToklZCSPO7uDHFZiVG90pkqUmTbw09Y01YpBEbyGxagmOAqZ/ly6BBhHKxFjNL9Y/1yofGlbQz1Q/8a3tGjyVD274ELEK1y6c2NZ/bC0zlAHirWTS91/K9FdwuQC1ggCx3g5oaoeOQKzViG8p3EGPXE360zjO7Tg3YlHOyGQdebN5dbGqhWEFMPxyXTu5Gp5PB1dhZ+mqSdVKQ6Qt0lB4WSsnEVMQtly0kBIeJ3erhW4lzheQvq0MYlrPaYB4LbIQmYusxKSuZtN+c92txk0/CVyWeabeSvd353vDSa81qVZmIqs4jtfrLIrFOSnAv1sLmRq/0+hwIe69yxuz0M71Tvqwc05KH1U+JY1QS94Tg4FELSCkFYhU8TcGEjK7RqNB2xvKNwEyjqKo2+3qyF+D3QV6qZZqyU/bOmeyzGbOZU4y5yWpjSMbr6xbmVtJWQqMuM2B4baRhWVbga0AEN/Jxy6NzHt+Qu1jI1looqVnMnFOMjHzmR+Gvojne0aMZe9EqSTjtDuCbArOlDfxwq1jrVR/pvZ61ZtaYWvWDhnlMhU3Mq1iXChvF8p7W/9tPq56Rwqwt7kneorizbJTkL8gyB8KWd4PKhMPxwNA/HD8nAFiElHBUsTfgDD6/X632wWV2Pf9J0+ewGYHzTuguB4cHABEazabu7u7SMudc4D8ms3m1dXV+fk5UlOIXQKxAudxsVi8evUKyTBiR6ClOL2Li4vxeIy+ZjQEAQtrt9sg7mmkD1xOoAkAYYEBAcUwxoDCrNmIkru04dsRkQByBXwGHBMSnGgQxp4CTAokTfzK8zygosjPJfcXwqd1Oh1AvRQd1mK4ADLm8znwaPZZU9IUWHO9XqcUsojg6QCAI7xOuFNrUAA0R/yEwKtarc7n8+vraxj0JUlC1UuE+7i3VOvDz2E6BLbvcDgENIBATetPofX+/Py83W5T8IuGY6AYv3z58k9/+tP5+XmSJF988cVwOKzX66PRCCyz3/3ud7///e+n02m5d7IcjrxPrVfHNNrzRDbVPHVSrSNFAFvQSCXkDTFTICa3QQwCFGuNtSJmo7tWN+pSqHElXuYeHS4OD6NaPYhjLxObZWEU3SI1QGdw64BUigjBxILICQoMCI5ZBSHHlmwpIGs0fCNKqzlHt8MgipI41vGTyXWrx+Pxq1evLi8vd3Z2sizb29ujfyMAvnq9jrMCwZNkc8ZnOjTfyrArKxJqTzPNKSN1neRfwm1avAzgEd/FKaz7CrWmChYNzdnUTd80UYE8jk6csFqSR091NnQnUFUZ9GGwY2jso0PzMgj10bzLAoYCQKparY5Go6dPnz569Mj3/el0CuI5xKN939/f33/+/DlF/UihpQwRPb7YkgIZcSCPBOkonI1kj8oJ7D4OggDcfH6+KFEdmlZD+QdrIySAcBWSS0/E+UEeOjUQsNxBMRyyMJQ0/ehb+hFM2DAMoZzT6XRw97DvAPLmNMEgAQRM9V7MX6y3YKxTCpnUPNxq/htJNaVgtJ84tiTQvcFB5n1G9ZFiNdAU0rrhAINQf2o2m3EcHx8ff/vtty9fvoR+NGquJycn2LAajQYqJdg7oPX044/MuRga97nDGNY0ZrMYBhq0Laz2kksicrXh8qiUKIuk0YLCgChRWlpx8u2a8YrRrtms3GG1iZ9sKnRTu4atFeDTFZLwAvMLH8svwnTL6VfWGPE8I+L7Voa96LNPZqGtvUg7YwmitX2bx77lEOZ5L5udvZJJXZo3zseqJkr8K1HN+OkmlOxEMklTmyQ2zWxgUSR7K/VaACULu4B+HPr5sliO0imdZqmZWyhN8XN0v/NbO6NcIVpLsRUt6fK36M3rQ5dsJ5Kkqa8KAFvlbraCbgVSfJl7fg+Z9K7VrKRMsjELyJkgd7jwIDBiERKwVo27yiidE0fLtWk28e11WfE8Z0wmxkRRZTzrXN50x5OWi604WafB9axzteospZbUPGnJrQlEPR+3fi5ArCUmZBtUV4bk7gLytE+drqNoGvL7A8RLkfktI9UYqTeTg/7qcLActsN6kGae8Sppp7UadKeencfxyqXhcp1EkYsTI2I8z94/4ArUCq5LuvlAg3r6XRpaZbT/bvGUUh3irjBGM0M181TTVvBz9glxOBXs9TQbWivkFtBhXXu4p2SyudFbBPi+L37gbOBuRWY1HGzehf/eX3K4Bxd+32ynBBPnP7yVwcuMy73ZjBUq+eAS75ETKSsX3S85srVFpvxKvaSURX62pnsFJLqgXnJPKeInA1CMSF0kFQnyZ+SppplCu463KUOMH9b/2QDi3/zmN+Uf9nq9P//zP7/nBQ/6Eg8A8cPxvyOAuEC7oPkPwMQ4jiG1CSFOAJSHh4fQTOh2u6AidjodwJSM/Kjv+fnnnw+Hw5ubm9evX4sIMtJWqzUcDieTyc3NDRSjbm5uXr16hZZkJFFojQedCj2wSIkBz+lgHfkwQBactnNuPB6jRRfqCiQJwpCKkQQV8QEi03kcLELwpGjRJqq9RecMOpzCiwGyay4tuuyp+gpeHp1ngOuNx+PlcgmmNh35dK8Nbb6YguKKGo0GXtDv93HH6G6vlX9xq/k5nufRJZZsNW0Lzn58UmwI0ECamSw/EP0og4uADEAGc3ISw0HlhsnVV199NZlM9vf3j46OkPS2Wq3VanVycvLVV1+dnp7yjTpy1Xv/++/3DIL5E92jqrFjwCJgC5IwCJIC/gaID/Ip9aYx2ABPeNa7DRGYAyd5tkyluamYqat58dNPrvr9izheZU7i+BYAAh5EaIM8bgKRzAZ5tiTOFwinuOd0JKMGAkW98fl4rwZJb6dJycEGN6Hdbvf7fedct9sFGRM4IFJBcNJ10EaMiQ8RAJMoVWUgsPoB6SfFDn3ggDqaxEUR/mYWgTumbdlwAhw2HF2i2skJQGgRbRZyCrQ+LFb4Cs2ZAkqFFxC3wiCXvIOSI0e7aWncoUDlID7yoWEu2TFEmnB1/X7/k08++eyzz6y1//W//tf/9t/+2/fff7+zs/P48eP5fD6ZTF68eIEqCNJ73mHJmwBQGMPPa7Ua1nBIQEynU9K6qWWPCh8/hPkbKGb4CfhB2Ckw1/Df0WiET8PIwTYEuQ/C7pzRWHipBrBer09PT09OTkCrZ2HAfCCzr4C8lJMQzetky2phBr158+bFixf7+/tPnz5FOTNNU1w+27HxbxYdRQQkdALEmMvcQShhTPR/uVyC+QtuO9ZqLAjQNkGDbRAE3W735ubm+vqawDo5qrjV2rKVTQn4ahQDkiT5wx/+cHl5iWIwamlxHL98+fL7779/9erV06dPYaCHc5tMJj+JxIQYk2ZZmiRWhPcNI5Omf7prhHsiZzEnOxX8RammsiakcTEujwXRTHbKsybEJhsKyKCkpAMGuupRaVEPLS5l1OymIicXN5YAsZhgeGPHZ7MF0VLeB2PE960xQaXqHx2u6+1xd8eEL/zlVSseGydGqiKNvD8aaG+QYw00qcsUyEULVprUJZtyxmvVWY8PxLsicam41LrUE/HEWGONFZNlVouDk+xPc7mCZ4CuVBH90csOa/+oxNB/mNsHgyWuDLQg1nVEfHXZTYHBJPng5MF+MHUjSVLFCH0n0lFWftiK8BYY03ehOfegwxom1vRhNqEXdE4oM4WoACQPRAKoF7KkTWE0Xe3YlDw21orniWfFGC+M6+NZ9/XZzsnpKF764iS1dmWqK1eJK77UjPREOrmghMllQKu5JqyngLMyyV3uEFHZ+ppsG4NYqxsXAGL+iZTGcXKrLCHzWwdjW3H1VnowWP7i6fTR/rLbSjJxSeacCX07T9PVfL7GcIviW6EBY8TaWw3icuN/GV/bSh/Wq6UorRJtR+Z5nkV7fpbdQ8C0xmAibQUEC24lND/EdEPUDcUwpHVou0TKiTQkCILRaISGmCiKkPehqQ70iH6/j/ik1WoNBgMGq/hGKlnxkrlCMhTcqDZ51rNOfFuve8Nh+ugonNvwWsxKbDo3UslZpdR8SDb/kCliN+V37kGBzSbCqxFGLS6h/5FtWimSrFoRqYisRZzYwFXqWbWWVipZJXBOrO/bILBp6ox5GwNrMwxKgWnzT9xAjgpkQAVyg+664LxmYkU1fyYF3BO5GnB7JT1cNxxwNaPrANWTywWtwtjDLz4yFDG59LCfP034BMa5B12q1KhrImulIi25HsU/E0C8VSnir//6ryk98SAl8QAQPxwPDOKUbAjdKYwVGU06oA8DpQXuA5ij2WyysIwExjlHb1kIXGKxhhcQYFwmljDJAYiAL53NZoAdSYnq9Xqj0QivWa1WrVaL3jsgtdG3J03TRqOBjIhVcQQQiDZqtRpEM3C9YEsxiC/QgrCHMRPAu7CTERyB4gQiXTC8wBlEEo5bSm1TdkCXDUMkF8rEVy8WC3jWAwpcLBbMUigNjHsIywVoreKT4elEOJXmALhLUBBG5zjSSKgew7EBnOUCjZrxPdIqvIx3BjA6RS3JesOvKENB0VjcXkAMFxcXZ2dni8XC9/2dnR2kuwjdbm5uvv/++5cvX+KqC7TKH0U3K7GDEfFo1pXWKEDbGlKaZrMJQh/AfZyw5MKptI83Rur1aqUS2CTPihPlTw2YeCF2nrWzZaMeDndm/+YvX/QHx9OpMcammQM6RhM2NnQD9YiiiEJ+SFCpjiK53R95Z7hvGITQbtvZ2RkOh3o8UygQYBYSaSp/mU0iCQHibrf7ySefYM4C2gNiDi1pEGOBEhJWw7UQGcSvCMEA0UvTFJRJZggYaRhXdBehxAqzcXLEeOuImtGAC9erbb6AwWmshyAyBjzI75ybBDoZj5K4ShC/AA+RegxSc7fb7fV60Oph0oWMqOAnXkjmNfFHFzk+gu7KgNvzvMFg0Gq1Li8vv//++3//7//973//++VyeXh4iLrR+fn5er3G9Nzb22s2mxcXF9C6QXXw8vIyDEMu7+weQAMBcE8UsUajEQizSZJAwoLpGW4U/i0i8JFL05QsZrwA1UFsEISJF4sFylTkoOn+AFjWgHGMU8LDwlejkeWD6MNUMNc8mq0N5qwrFMQNOMWm0ylaajBscFa4Ot/3UXkFMr5cLiWXPUExD5hvv9+HvjM1oDFo2fmB3g7MTWzuKF4itSYEzMorPOuwrFlrUT5kwQ/aI+v1ejgcPnnyZDAYaLu51Wr17bfffv3110mSYGumsyjWk1ar9eWXX37yySfn5+dfffXV8+fPfxIuj2etEcmcsznAiosi3se8lHU1Cvviv1QbJy6gu19lU5WePykIVmIYcB8s6L0SeSx8EadhYRAWAGJ2WGNIYPfhmkNFdW27J3n3EmuNGFqcO7d3z7PWq9TqQbedHR4smh3vdycDO3XuHA6AIl2RukhFpCoS5rxLEfHyf2ebDOIsV9snQJwpgDjMsWNqsOLnK5HMZJFnxPe9IAh869ks3WCblRnZBWEoMnm1zgbXWKwtHJNU1Sxz2Yi5axEPrBsFaWNNK6boPLYPbEm3oLbn2fcUbC0AxJvjsCzbupURrPUB7iIa30+yK/zK3XswcShAwwU6KivoqK+zmUYLlGlAaqvzFSQmfM85J9bYNK0uFs2rm+7p6TCc+eJEApO1xNWta4i0RLp5hcNTAHGQD117LzpTBoWzOxQkZFNiwpVeUG4g03+csqZAlDgXmYpZi9TFy6Tfjg/3Vp89nQ/6SebccpUtVvFquVosojCM4yhJMydyG6k5J87ZrQ+3DBDzzrOXVKu0F7QXNHZPtN68SykIn2VF7KZkQUGgAFFQKz+4NdPpdzweI/1E56J2H8WgguDh2dnZ1dXVZDLBRXmet7OzMxgM0CWD7lXssLxMrqVkh2CF1BXEW4IRfuWLdbbT9p88SqJsHnSC727ccVKbX/m3i2E9H11JXpCAT11VJMqhF7ttFG2FIEUNXZtzVEV506FWF+R/p7nura9+7qsTiEVSsRXxa6lfyYJKFgTGiJ9Ufee8LJM0TcBDx3NhqABeFDXEEAkH6kBmWsATtCYSA2NCyVrgmO0X3LbIZEIOy8QNeZBeLhCxMJ4U5Y6j5a31pvy2+QOE8I/ILqsiiUggkuQQfJSzicuLSZxDxl5eGAhEph/IDX84Ho4HgPjh+N8MINZ/Ey1CKyjyWMRwnudNJhPAMfCaw37QaDQAUCLzhC0AyFzVavXo6Agf3mw2O52O2dSBhZzrbDa7ubkB4nN5eTmZTHq9Xr/fj6Jof3//8PBwNps9f/58uVxeXFwgegCIcHp6CmgASSwwHSgOIx9oNptAi9rtNvhW7XabxnHL5RKCDKgws0BKUzskuuv1ut1u7+zsUL+VqoVBEAAZGY/Hk8kEN41grs5Ofd+v1+tQH8auOZlMqLZMwVOAIIvFAhKN7XYbfGHAWNAWcM6B9oXwBQIduPkQDNUpLjVhcb0Q7fJ9H13thEcBxo3HY8ih+r4PSwdqe+HOULRU6/1Xq9VerwfQLUmS6XSKp4/ygAbO2FYPxtyLFy9evXoFdOnRo0cAGZ89e9ZoNF68ePG73/3u+fPnwPUSJS6pwZcPA47zLKXcGsxrKfRAWWubzWa/3x+NRoPBADWAZrOJ5wi8jyxpqJFUq1U/8JqNSq1Ws6FvnBKUQPMg2FUTCSbJrz77/tPD4+Fgdvh46nvxau1nmWTZrW41QEPeamo+4AmCXAlqIW4ySzuU8yOtjATh9XrdarV0DoYkDbAs4mx6Z0Gn1fp+o143KkfFwGs2m59++uloNMLjBhqIUBJRIwI1FpBYLMFD5DMtiO1CeRwKFXw6rLJILmKgG3vxUYDReb2YKTgBBJpaVlhDBiT9YaLxu+j7pzEIEjyJyOOJ4L1cRnAhmClYE0BvQQlnZ2en1+stl0s8OI1qkU+hqRMFeLHMSH1/cLMQImNVvLq6+pu/+ZuvvvrqT3/6E5wGX716Bdk+OFKC2Qol2Wq1+vXXXzvn9vb2oA4/mUxqtRoWc+wFk8kElwMuD9BwrlpoHYCcLlzOaNoGQB+QLpY+FLSwfmIUSS7pQx2kOI4BoRJWIFkeBcs3b95MJhMYuI1Go/Pzc0gYkX77oURsTVopK5BqJEjXOUTp2wI0r9fr0+k0SZL9/X3sVuPxGALBl5eXq9VqMBiwdwcnjG2r1Wqha4cbB+q1WHixU4zHYyDjWMwpz60bQXB6y+WSFqzA9/EIJpMJeFsga7969Qoa0L/61a+++OKLarV6fHw8Ho+dc5CcGo/H4/GYNF5UZ8E6R9304ODg888/f/PmzcnJifwkzZ5I8nNohBNHlIM5037NidbaxLTrxOsJFpAOWSbyE+NQbNzbLhOyI1kQ1U47BckCOnBiO9Z6Rxqbptg6M3O9bGqtHgrjbD15LJLIzPNqqO/7lXqt2u34vmfGqyxIXXZj5MyIFemCE5vzpJISg9jPAWKiZmn+yij/h5YnjnIUDEBYmGNqKxEnEnm+rVWr9Wq14jIvS7H0WQ1X4QLZ2KS9pDRArFU1WN7jnWF/le5f0bL4sqkuVejeIBitv06j/IWTsZ7nfyBADC82PDnZ7Mguiw7rFV4ziH/KZuqSO1/5zhRoxWVPPC35isWcwWoZxb6rb92iKd6IiM2cTVI/DCvR0ktW3q1KQyW3pAtKTGFNq9T8yndc+Tb1iYKX3Ub5qMQvlm1vd9veyFhxLS4U8cSlJvCyZj3ttNNeL84y53vOZUm0RuNEFidZljlrTY7HSqF4eRfxXD8vImja0lNHIIxCi3Ws9yBZWlBSt+HUmmCE3Xk0GvV6PdBW0IaIiGKxWEAWr9vtQrcQaCCSsvl8fnV1dXFxcXl5iUZM8mNGoxEqaqhMMH7Tkix6iOrOjyIN1vM8r+J5VsS0W6ZaiauNWbVtzUuzOvHChZeKcZm4Rr48VnMcEEslRqafU4CzEgq8FRoWZUDnbQocExpO8tGeKSEgl1OGKzlCzT9GnC+pMVHiwtAkiR8EXuAHUvOyTLLMj+NbFQ7sXIznqZIEkgprYKj9ECDW/p+c+LqPB48AiwDbfXQKgwiERQt2KmiAWNsds4mQZVoE/+Ulq1BaYxnqY9ZEGNPF+XMBNB8q8jg9A/18WbD5y7Cx+g8axA/HA0D8cPwsj4JCP1EPUOdohs5FXyuFsa6o241BywWCBqqRtgXQ8R8S2oODA5R8ka+Ox2NIkiFhGwwGw+FwNBqdnZ3Bwv7o6Ig2XHDHAn0V9UZrLTlTcCRA0A9pS+RFtAkCszKO406nw3oyTgOIDwDr6XR6cHCwt7eHzazghUX4hnROblp03AIzC/IXJHBNp9PFYoEzrOYHQBD8vFaroZDOaAaam/TtBQuMdVSk5QSvifzqXBc2viICDA57P5ngvu9fXl4CLAC8gk9AGyC+iFu75ncAAiDfDeiY53lAQIBNAwBiDjafz2F+SGZTEARHR0f/6l/9K8/zXr9+DeVK7TIkm5YymgX2nhAPjch0iEAz+gIkh/gS/Oh2uw2PMtwQUBFFpNVq8VbTu8/3g8Cv+H5grTXQIM6UVR0SgKUEi/TJ4Zu/+Itvmo11mtXiuO6cy7KU5CPcE3ZUsUuLMCsEXtmbLKobjjCobHZg6SZoQgyItBBtY2Aj/R6Px0EQ+JUKFa6ZuuGpwSgSAqNnZ2eQt2aUppVJgOVh8BOjp1SLtpUnV4v8At38WIA7dc5MoKfA/S+oTmvtCNxbUO/xBHl/SCTf6o9McRtAMFgrtNuh5BYrhKgQ0eL+tFotpDdAugvJEu+eZoHpRr/3NIe5hw4mShQVaryXl5c3Nzd4rFjiMPs4X7B+oj5HxRhQdMnmJleUxphsGyS4T8EcfjUwaGrEE8bi89IGmOxTIdxDyo9WV8Djw9eBgbtcLmlPioeOnwO51ntTAXa5C4V5533empOXd16c4Xw+xx6BO4NHAGxXT16s2HwiWn11qxoJizSUAqd7G1I+3TqjITAqF2uKNNqJuCtRq5flWEhL43uZdeNBo44ymUwuLy8vLi5Qf/ppcKucO2cU8qsnEcswWqeSAxKPnqAAy5/4KCxZW6XANWUJbyG9F4sDDSfp70poHsonolSGIdCswTUN32BZBrZLKX/ugJroSqyTqxyeu+T6G9T05Gj1fS+oVCqVirVe4FWanmn7WRo4ZyQTSdcmy8RREaKiGpbJIE43dSSSHCBOSgBxfPvHxGJNZn1nPHf7Fie1Wtao20ajWqnU4jiT2JBdyBGlKYcFw4DC1KPxKQYz9b4QOJEXzwFfKMoWpC256hZ0TjkTC0GRpsF6nmd93/4I7fiyZuv/GhDw++wgWx0gthoDluuacrfS6wdcSKHLnihaAW81H7KCbMVwzTYMt/xF7l4E2d3xelHqE5s/N/IWDTRGrHG3caRxIvk/bm+CUSdq7t+MyotYASwuPFw9+LdOsfe1Q8Cj31ZLENUhUa/XUYHe29vr9XpgKiDvQC8LQo5mszkYDEajEYjAyGKur68vLi5OT0/fvHnDYiersMPhsNvtwr6V9UJd89BaXlqnmOEHanu3fZlinHhGpFJxzUZcbyy9io3FW6VefGpmsb+eecnaOEC39VyFQAPE9DTLFDt4a61Ca0poBjGfub/5J8hR4yxnKAMOruRfjX/URCJxnqxCc3EZHB9Xe23b79tKxa/VPOckSVLm7Bogxv6OiibCFQqjATLWQvkFxRsNyBb8wAEH48FpErGO6MhPKjvm6WKq7iO5x5hUG2aISOLcRzKINRYv6knJpsKMqGetf24e6MMPxwNA/HD8jBnEGnqg+oGWvXPOLZdLyhpgYSUJBf31OmIGcgQuEvL2cgcloGSQZL/44otGo9HpdHZ2ds7Ozi4uLrBhwKc+y7J+v390dDSbzY6Pj8E4w3bVaDQos4CzZW844gau+EjVoNVLjIAEQ7ix4YRJ1QRuOxgMABHi5zQ1Qr6RZdnNzQ1yYC0CgO8FhZAtzLhkqCsQUidliTAKrq7T6eCe1Ot14HcUbCKQTRfBZrOJX8G/DtgHukpxkkiK8DlsC0JxXuNrjUaj1WoBgwZUwR5MRAYssFO1gzs6m+5RRgY0xnMmTAlC+snJCczN0CsNBPnx48e//OUvv/jii7/7u7/7h3/4h2+//XY2m+kGtwLrwTn3YdmRso4pv9dsa3/T3XYghWFA0nrr/Pw8iiLwKyW34RJxgefiJHZZ5jL3VoA4ue2uNUuppMnuwfzwYNZqpYFvo9g3xjNGoOiAEbJer1ls0Bz/1WoFSItyB8AgqOxBkRYqVLCuo7EPoids1qNZMAHBKIriNDWF9ucsA2dTq+4ixEckR5SZrAEgoczGNURFhF33neneNO1Ep/W1ER3SkYz+h5h3OpvVCpWaGkYpXr6RTEO9amnYnfgmsWYitpqDQ1U1yW3BUNCCWR8e4nK5xMWSeUHos8zPYrD7wcN+25qvvZ7Oz8/7/X6SJJj7RLKI9YMgj4uq1+sg71xfX4PyU61WZ7PZxcUFFhAtpIPKU7vdZm8ErMxAkMfWAIqxFqbEqmuMwcs4AQHV4dPALsEYw9INbQQoD7LSOZlMrq6ulsslllPsSi9fvpxOpyJydXX17bffrtfrZ8+ecQkl5VPL0ZZhQTbkbpX7vAtY0SqlHDmDwWC9Xn/11Vej0ejLL78cDAZYgbGpkdlKrrReWjGW5vP5eDzGXoCXYeW01kJvEXeb3SSYfaRfMe+iOhPvpOQyynh87Xa71WrhNuKVHA9pmkJC5Pz8HHOE6SUx1tPT09/85jee511eXr5584Yg6Y+nNUIEsyDjwFhFI+y6PoHqGu6wpkSxQbXQeS2bzaraK4mmcxTQ1CxUvUpo4JgrG/dTLZPCVJnqNODB6VZfLZJOdhWuDg9It06jpkjJKZbBrDGeF4itixc06pU/e5rZaD17EsepnUT2+9NgMvUSEannWq54aASIXQ4Q3xYEVB00UU33+BOKRGISF/jpqDvvdee1SiKZxAsxzu3sxY8O5t228bxaksZinDHieZYTQRvTsSzKmagranoVRR2d3SSYR7oniWVXzIsCqKGBJK3/Q+SCovacXPQV1Aw180Gj3RiMuQJC9z6Lfxns++i5JYqVXDCL02CNxmUYImL4ac2Te0jHZYj5zoKcwluNcdbL/CA1FScVEafc56jymZUgYLnbQKyA5xY0JbLNP/qU9M/T0m+dmgtsKQNTePVWsNiI+BUXdJzvOVNxbu0qtazTDX0/TrJsuXKzuXOZLFcShpKm1lhrPd/3XZa97ZIvj9tyebjMtxDVuKClJwq+zVxMtGjAO0YR6ujqvbLpFAoyRK/X29/ff/z48Wg0ggULUUJ6+Xa73YODg8FgAMuH2WyGsuXZ2RmU7i8vL5E9cfdstVo7OzvdbpfSgjpUFqW0y5hH25Oyp5bxs+/7zokxEvguCLJWI320J8aaasXVK9mL68abRW068dPMSFWkLWLyrgtoTdRyBjFRRavA34IjKH+ipSRMPjJdjv+mOXE+Vr+C+m2S48IQl4AkgohUJPHkehx8/VXThF68jn75Rfrosek0nIiJIsu+DeSJ9PJhAZg7HduwsBpTU06v1bakU0c/FVSOYZZQljwWJayH0O6uuh2HMU1uWADWGlDM7rWnevzRNsVe/igzBfp7JTiYeDFeYNSjzx4w4ofjASB+OH7eGDGXY+6dWGeRkZ6dnaE9B3RdKDlgj7+5uQGzFRstdAz29vb6/T7ZK2WOJyJ1NA3V6/VHjx59/vnnv/71r5fL5Q8//PD69evxeIwuWoBckJWYTCZff/3169evh8Phs2fP9vb2gC8AESPBFqkymLbYJ4CWUiKZmTbZIvgEQsns0B8OhyBBMzdAco40IwgCwNxAKHDTNHMKDFnoMAAkAvANEARYCdhDlNRMkoQyEYTJiG1Rw5eFdwAr1M9lwo8AHVsv+X1IaNkohL/JbQQlFvZH6PWmMi/yK8QESNWgS0BbACbM9Xq91+shmOA5k2AVx/F4PIb73GKxGAwG/X6/2+0+evToiy++ODg4WCwWv/vd7/7hH/7h1atX5MZq1eACY+79uSfaBq0QJReaUrdiQCgk4IFCb2Q6nb558yaOY3SyKy/ByEiyXq+z2N0qUiEZWInMRJbixelOY/yXf/Hd46OpMbUkNZ7n6xAHEBtIE6LskvBM4QIHsWkRATRGzJTdXrpgDrIk9ATgNIU0mDIyiL0AurFcAfa3iaIgCHTOkTmXpuliscDoBdyAuBz96QT7mE+CboDrAvANQBnRJ2F3AMSoRkBJA1UfpJoYiphxfI4oCGEoFlqqtWK45MIvRMDxYuLjZJmh7ET17YLlEcWaMZYwtgHHk72Ie4jBw0LObDbDmgbIDP/F/Go2m91ud7FYAD7WRM6t9jIfjRFreRbJdben0+n5+TlEG9br9XQ6RcGDmhiI5kHCldxdE8Os1Wrt7u4aY66urpxzo9EIvRokV0IDAbgzbst6vZ7NZgB/RQSCCYvFAral0AIyxkBwEOkHyl0YkBR2R02uWq1CkAewKR43oM/pdHp1dTUej6vV6pMnT9AzcXFxAdYwamlnZ2e1Wu3o6AgPnbcd0xxv2Qq+8FmzF/UuAvJWJhe89bCM7+zsrFarP/3pT6vV6ujoCF6vHKXU2tMlK5hAYtDiKhaLBUB2bIJYrrEaU0OfVGLOHTwX9gbN53NIG7FmQ8Yl+FywH0TDDbaSfr8POcjr62s8Jj0Bdd+AMeb8/BxNBtCj+KnIj2mago4uir9fvu2s1mhGsO4toK0uIFQsZdiU9es13UxbaenpqYvr5FmzHEW0hR1Isml+WxB+JY5cyZs5GBJwSGAZFCUjQ/yXp8GConbY8zwvc5n7/7H3Zz1ybNl1AHxOROQ8zzWyON2hL7tb6pYECTBs2N+D3/TqZ/8TSz/HMCz7yYAH2YKsBmT3cLv7zgOLZLHmynnOjOF8D6ticeeJKl6St/35fnAFLtjsYlZm5Ikz7L322msZZVTKcdLlUvqPPgzudeahr+cL5/lJajp2ZpdOuNZmFZvquJsM4iRALFVWQ2HEFL1CxDIlf7fVf+/heaUyV0YtJ9oYU66one0onw+N8ZQxjnMr8isrx3hAlhaQdJJQsfERW6ksBwj8RApPEd61ZKyIljLWwhrEEyGzW8puYk68+vPN2Wla60Sl8DVqwhIBTGq8vh4Ffg35VM52anZL8VAcnVwmbGXDVswatoSYpQzabaDPjRrE8U3HX9lRrmecVKSBf7Gn3tvE126kAEebKsPqJgM6ifkaAf6aTQjYkhj+TpO6tVJLpWZKzZSaxrheSrk5Vc5F1UpQrIepVhgtI+2G7do0n1sas14sA28aGqNWK7NemyhSjnY811WiZJWE1yXPXcLBydqzDLCZR1iNUxIdvsbdvquB77q4InZmq/Cfy+XK5TJ4weAO04gFexooR7CYw3Ezn8/Rgol13ev1jo6OoByF5tFqtYo4FnVNHH9c9VJiSI5YshWA35owse/7eHkUKqNUNu1k0+Fua5FKaT9y16E7GqWmQzdca5VXKlQqpVQuhoYXsYy7imFELUjBJJ9K9rreVJlwxQsiARynYr0CI6QMooSyBEHkUIVGD0fu4TjrT71cZlkpr1udwHVDrU0QKNfd0JRD8EZwACmJdFdmOZMDa0mKc9skQZiFTPbsUvyN5BK8mAwnKQyFV1qu0RSBRKKarGGw1JdsDVTvEJBQYsKLVz2VJbTgcfNxR5smdXcSE3fXHUB8d/3/BYmYSSl2TDSEjsfjcrm8WCwgnQkGbr/fhwwCWGDoAAIQGYZhrVarVqsffPABmvHhU2d9KDCs8Xjc7/cBN7Tb7SdPnriu+/jxY5SCy+Uy+F+QM0ZUenJy8s0333Q6HWhL0UgNoJKsXlpkQHBpF4vFeDyeTCY4XYCyAWLDKUgAC2AcGDfIe4l6sAOXihOQfQzDEF1O4DAidsG/osuJfU/1ej2XywEkkp5LOCnRqyv5UPTU5vFGpX9wcolrKNF2rbWeTCaj0QgDTmYHxoQGfcjh+WVRA4ArPSr5YJNRKgTDCFweWSvCL9ZsgZexkZPeR9Cnfvr06fHx8Xg8LhaL9+7d293drVarP/vZzx49ehQEwe9///tf/OIXz58/XywW5KFICt6N3b5vhRHLdmNGG8kYQhpWYJQo+IsGt/F4PBqNPv/8c8BV7PMNw2DpaT/wo3Volkq5Si1i45GhcRdRvTr4yftf/PTDr8vlaRh6UeRovdEyTzQHMA0eEJ3QQCUDliG1NQlUWRmstGgD8AcLKWC4mGwgbEJtHNMAfc3lcrlgTL7ff7WERaKoNiXkpHY5CNecpUgUwcRHFQerEvgLQnncCUs1FCBTwseJ7eoS5ZH6mxAll2b3UvMBtRxqPiD3UELik7EpzYtwA4CtZbpFhTvJ+0syJmgwReVlxMGUC1Cxoi4Rf/K4kzP8xvn/ztQwfNPpdDqZTFCnwV0BGjs7OwMsi0FYLBY4DqB1DsQ/iqKtrS3XdY+Pj6fTabFYJL5GXiSlYEkGwX6CfIPMcdxYNpuVBE8Ju2Oo4WnJ58tuCTCgqVuNXbHX643H406n02q19vb2ZrPZxcUFBKmxQUG9/UZFCAupl+jwjXl4ci96TdpMFCmXyzWbTdjAjkaj8/PzVCoFii71PTAgKNeBuot7QNUByr/gVkPFSKZMJMsQ/8IwstyFCY+HAl42BpyqHTxNsIdANYgbTqlUqtfroP9cXV0Nh0O8TCbe3Bgx1HSE+/6OoxzMa2K10LRJki5NooPEAqekliL2T/bZJPtX1GbXvPQ9o60oq0RSoFZqrUiwXoI18sYsoWGuFCtsY6ggdcYt6qXEZUg0jnsdVBQ5Wnulovuj9wKl/JRrJhO3/En2H/9XTi+VmcV5bxTntF6MUJgEChwKdDgUJClfqZlSS6WUcnKmVRl/+Ois3RkpoyZjHUUqm/Uq5UwmnY0ixxhH6wgjJFcln6AsEMrAlQUkAhlkDhLCkGoeSvQmy+YSCRATEbMIrZTLxGplMVuKUyf3kzcjENuKw7JeaD1ZS8BBJfQxXo8Lv0a+yTrLrAMX1AEErizTghCKMYcpIpmGSRoyHyLJiVKSznplvFiUUQZMWe0o7SqdUjZAnBIYsdW/rxO031AYzVl042hTQUXiv7cBxMFNLnYWgxjR4ESpiVIjpVZKKaVyKutF263gXnPVyq9yxg/Wvh/4+fSsXJ46erlarbUOlTF+oHzfRJHRopXE0iGxKiUWDUIljA1lR5Q8OOQkYZRFcNDzPPNdO/n1cBoTbdoV4nNx3nU6HZCKkHHMZrPBYICiI4zK6/V6u92u1Wq5XA6KWOfn571eD6nZZDLpdrvT6RTtnjA2p7IQBfFJJmAxQ2p23zjZLEg9XlmRMcoYbdaO6zjptG5Uwlx21R+vjs78rG+ckVJLMSHzSmWVysWJQEqQT3VMMTabJGKCwoSDOZkJHBMy9mKoMZUAiFOJ/9LX/xSt1HLm+jPHrN2dHfXe+9F6HWhtHAdf3LbHJD4gy5lSKYvSRlJMKXnWY88kKIysihwXxuQUzeOL+QKrnioDQvZXkfWMTErWtKgRJOnJznodRdFbR9VJk7ow5nRLrQ8d6w67sUldGD/3O5O6u+sOIL67frDosHRGorIkTlDAqePxGMgOf2s8Hp+fn6ODFWHxdDp9+fLl1dVVNpv9+c9/Dr2IXC4HCcVkAIruY7Z14xQHoFCtVkFT2tra+t3vfge2V6lUgnBEv98/OTnBn0BdgVOgpxXxAd5fNgOmUqlKpSKxAFbIJWAE2ixArnK5PJ/PmdSRLcsmcaR/FAXOZDLL5fLw8PCXv/yl7/vZbBbfDifW9vb2j370o/39fciPbm1tAVcFGisNgqnuCkv62WwG7zi0lxJWoAgvmH1AEKDmiS8FKB/hOxidatOVwuLmKGGxhSMWgAtOcfIl2fmFUSWEQZckssjJxQZFGnX+b7755quvvoKpINhnQJq2trY8z7u4uPjss8++/fZbcDmTXisk9r7Gmvk1GRehCvm2SW6mDBClmIbs7/Y8r16v/+hHP/r444+Pjo6CIEArdxCEQeBHJozC0PhGrZRylVopPVOpIKiXJ+X67N7eyc9+/GW10vfXWaO0UiYMNxyi2aRMijdMIAm5goIq9UlZLcDIM+/Cs2OUTMYT7QcxMdCojs70arWK54gWcjeVypZKr0zqlMLqkFxOBtZAh9kODJAFWwR+ji8IkJqduZhLIBRL7gbV34iZMmmk/gZlvvE1saAIrFuMP1k0QnLLJkoMEVl+JDqRswleP5A1pCX0tiJZmPUqQnJ4DXYweE6Cds3OdOoUS3zfwiAsWOqdScRSxZh3OBwO0dQJi7NCoeC6br/f73a78EbD0wHH9vz8fDgcXl1dARNBYQyEX0CEYRjCY432MiRUkpWshOsIZG0wCUGJHY1Gg8EAhwsWHQYQXHLMbXZ7YPTwdPDogWJDGYOSLMPhMJ1O93q98/NzaAcBYKXgr+WkRE12VpVkVztmEeVfb5ShuE2GGF+BYiawdwvDEA51FxcXw+GwWq02Gg18ZaIw6BsgaItazmw2A/ef5Qdy7akMiF/HaLCmi9sj1oziEGn4OAGx4tDdEgTB5eUl2l+g14GGmK2trel0CsmIfr8PRXsirRSwxurATaLw84cCiI1SkUD6LFrljZ3sFnfMWh1SszjJc0ySziyQl+cLNmR+R+n0YG1KVu0hyf6TxD1Lh1ee4ISBbqtSWDJKlFCPb0kr46ZSqpCP8rkgmzWjkTk+CVwVd8BopdaxBjGddrTA0SSmliRpmtigNVRKK+PrXGZdr07bjYlSUTbtBKHxvEwup1wvFUWeMdoYrZSxQE85dPwKbITnBOYkl5h48qy35gN/SICYj8AqBnBW4Ejljiqp5a+kGN6ePqxgNybMDJO7TbJY9Zqn/+YM4qQ8heTokW3AMoNUMEMMAJQH8QOCTxnOyZunuTS2OGLEt9CHZUUnUspVjlKe0mmlYaJohOKqhRE7AnfTArkMY66fuQkglqIQSY6w2nyfIMEgNpvwcRD/uVBqofRM6YVRC6WXyijluqrmhfeqqw/3FnvNeTG99Fer2XxtwnkuO3FcUCwjrUwU6choIrayLyHZrcLHpDdL+3ImM/KXSVOyFQN7IzWdrmtgiFteL8qPzSBm1sNtBdsjmikhPVypVFADhun3aDRi9pfP5yuVSrFYDIKg2+0eHR2dnJxcXl6CE4MDDj1GMMYol8vs6iD2bRXyuX9aW711XhDIFrzpaxxXa1dp13OdXE6lUqaYibLGuHOjx0otYq5uRqlirM8zV2qprrVQXIH8chY5N3nTaTGO8k+9aV7H/5yYmyyFKShSnIqfR6gjoyJfz5dqOneWKx1GyihzY4nI2v2seFJ6P8gCg6XvLDdMNBATIGZjB3dRxv94alJiQlZAEWlYsu+IWKBDwgREOpowVr+mLKxW6cUieAdTBDCIaUYXxgxiLZ6CEYoioWAW3zGI7647gPju+oFfzIhYoJMUJGzlEPinUC863CUbDuQv9Erv7u6Wy2UrP0x+KDqUwUi1DgZgoMViEQQ0/KXb7a7XawQKnuf1er0XL148fPiw2WyyuZ7QD4muCEFwM5PJBH8hoZUe4mrTOhy/zroobcE4VgCIl8slW29Q9D45OXn58iWoE2Qe4USsVCqdTgd8CuTJxhik35PJhCwYRCHAkUnKlgctgSQSmXHIgQ3HIj/BKRA6cFgCUCCVjGcqWV34Xip2GULVXR755G8y+wUAQUoUxAGoO4nANIqi0Wh0dHR0dHQ0HA4B8aCDm7NrNBoBPoaymGUUcyPO9T0ZlBZDkHE2mcsAShBeQPl0MpnAXg8yzaCxb21tAdHGU1guF/7a+H4Q+ZFeKeUptVDOLKqlp/+fP/n9o72zfG5WKizS6Xxo0ioysYfHtVkfyxWkMKfT6VwuN5vN8NQwaGAB0xuKMiMA9IlmStMwQM+5XI4gO0Ml+DFeXV0BMgYA94pr5vtK5B6ZTKbRaAD+w3SStSXJHuWNMZNBuQITkhLYkmRHRWOuSqxEKsNS2NHK5/FN4ZlG5U0ZStKFj3Eqe5Cxxqn+jPkpOw0Rg1JMnAOLAgxuEjQH0PlJ0se/slMSrinsGABMyUzGgqIY1EoeB4fo3dBhaXOHRw9NcORpkI9IpVJoECEqUSwW79+/v7W19eWXX37yyScQf+h2u+l0Gjah+Xz+6Ojo6dOnpVLpwYMHe3t71+Juvo/9B+RWaOxQIkZrXS6X2+02ek2A5A4Gg+l0il0a+CmOA1JfsY8xc4O0Mcaw3++/ePGi1+vhcSMx7na7v/zlL8MwhPQwSjucM71e7+nTp9BPkEUIlWjZlj3jSU29JAZnUTg5P/v9/vHxca/Xw5zpdrvIimELOZlM0un0/v7+7u4u4BKkvmiXgVAMjhtUNLEDAHyHJAKKi5i0kBBBp854PObjYAGS3qfYXrDnsy6CE3+1Wh0eHr548WJnZ2dnZwfVzWfPnn399dedTqdUKg0Gg9PT0263i0+XGsdsI2U9iYIAtwG1bzerkSBLslNCfPzGJSCbLaxKDFmlyT6VG5dekm8utVnlO7P0ZbEyb6wuSFROmv5Z95O8JQsc55tYZkEy+ddIUol4a0epSGnleqpYjPLFSClt0ipI6TDSxhcMOFdQLwkQB/Gf4YYeq+MaL2+0b7SJcnk/nQqx24nNbYO8JseKtyrBLGuULJjA4gMm0S5pZKQSMtMyKFW3aDvQGVW6s1rv4zgOgOq3jsy11o6jheSxnB7yaVqSKcnJ8ObosNpUPZYHN+FFaXWI4JbWf9hgAaghKSA6LAmtjCQJFcFcmgryrJhuwnZREERhGJjQ0U7kONr1Qicd6YxRuZjkm1Iqq1RWNNc7wgdMsjLJduf/9QXz14J9feEkEdwOEJM4bzb1K8Jr/4lrp0df6dCkjcl6Jlc2bk5FSmdK4YPm+sPtxZN7s3vbs2Juul4vhqPlbLZcrRZh6C+XoTGRUsrRjuNuTHW1KXNvmcokKyvJugLrTMTorZfhiSD1Qx/JNRXgu0p9zuYCRARYLpfRZ5bL5drt9t7eHrQjcFThtJpOpyhhIp9CTDsajY6Pj58/f358fHx5eYkUDwFnJb5we2w442SjEIqsMHE1yfmmhJAdljbunJIp8ci7XspzU45ytFFO5DvhzAlHTjTWrxjEWaWqMXd4odRSqUyM3qp4I301WGKWaiFDoYStmYUdu5v/eTH+GApo2I3RYS8GfqLYNM9T2lNOyjiOUcaY0ETKGONwE7Y0IqQ+CfZGat/zqJLoMFkgMmlFSgKVLYQEFIZGVsJ3IILMfjsaa5Obwr2CHZ9ILugthEqG5UxI7ePVarUOw9J8HsayWm+zR99kOief140Wl+oHZFL3V3/1V//m3/ybNzkd/sW/+Bd/93d/d4eY3QHEd9f/Q+gwNlDZT0SfDUAns9kM7auwsPc8b29vr91uQ4MVOe3+/v5PfvKTbDZbr9efPHmCLBEENEaHMv/B5l4qlarV6unpKZAmaRRA1zUIp+7s7IRheHl5mUqlOp0OqM3Pnz8HuQycNeDRrBiT5YdaN74LxCUY0SLGhR4ldBshnov/C/ob4DOGXLTdoBoA2rTPzs4uLi6gmMGXAR1eLBbT6fTZs2dwV4C2Bl4DtIhUODp34WWg6RWLRaLYuHOoRiDxVkJumBY0PBQR1hONQpAkqwKyrotXlstlnKCTyYQ2AszTqBrBU5lAGwX+qANApaezs7PPPvvsk08+6Xa7wHTa7TbUNrPZbLvddl3366+//i//5b98/vnngJ8kLcJiU1ps3zcko1m5k9W2L2E4UpWt9ycHAV3qiGNg1YWpfp1SmigKVWQiE2nzqvfQZDL+zlb/4b3zMFJrP6V02tUqUq/E46hcCXid/VlAWhEh4ZlKFjCmitUSK302MG1o2m7lFdT5ArhJMWv6VZoocoJAJscIx8k3ka1kTC/dzYvJIQFKzknraTIhQaApmXRSiVUl2mklY5q/y1ifWYS0zkOdg1Zd6EpjoEmIgb/CgJgintTH4HqU0tuEimg8hUcgix8sRMm5SgrzbRWRdwCIJfhF7Q4My3g8/vzzz6vV6v379+v1ejabRbbPPQHFLfAy9vf3Hz16NB6P//2///fz+Xxra6tarWLP7Pf78/kcZjKYSHgHbKHj8RhdF2xChNEoJA6AUS4WC2DBk8lkMBjQyxTdCaiFYGeGRDU+BV0Uk8kEmzAkLEDqp6Y23qpUKiERhSo3MH0ok/zoRz/CcZPkXSLVfMOthv3sVLjmM53P571eDzcJNd4gCAaDAeZJLpfDDZDkQqNXCDWiboTSLDXHYe+Dd4Y8EahY+MrD4fD09PTq6uri4uLFixfg/N6/f79YLEoGPXZ46uCj0IgzYjAYHB4efvHFF0EQfPjhh1tbW7VaDT88PDx0HGc+n0NYCVA+T2FsOywxMlfkDPxDaRA78aJyblod3MklEGmBp9xh8N3xr6yk8mlaEgTMn6W7Op4+3QWkiiKdP5WQWUxuxYQkKJXDKqA8ofD0qa9iySVJiFNu1xRJ4GZ4HSd4ruu6SiujlB84eqnC0FmtdDqtDg6W/ipczp2ldi8XXn/orOeOCl/hC684kmqzDT/Y5Fp6Kl+N2pVl3lmryM8Xp4XiIoz0cpkySvmBNka7btoYD2gkgBPKKGNesTzGUhkPLJIB8e3og2oFnxZtkCc735msWMlBttSiqYCJxhfS1vC57GR/VedzHNdx9NtixDFYfuOGb3HbLX50ko1+W3X8NtawtYhkeYyhBWu6DPzIEqUuEIu1BOnI0AdINJvNUHeHmpyM/zcbxVRMeg+iSDsqdLRxXN/xQp2OVNqozCaDOH0Lg1gLWh9QXfJ8JbarEoZykbBetEQk5CuD+D0lQLwWEOFaKaNSWVMthq1i2CoEWaUipVP5aGd3da+z2qovG5VFNjNfreZhuDTRKgxWgR/4ARVgXc+4kg6shIGq1RfINSKJ8DfWS/BwJXFElmGoFQb4lbmGegMGZBJrRuAKsBi8IuSMaJqEdBK1/kiMQI8RYoN+vz8cDtFJk8lkUPJkQUKqoFCmSUqTWcUVq2gkpZm4ij1xvfKvdhytncgoP3TWK2c1d9ZzHaFPYqlUSqmVmBVSikSJCcnGC71ZdTCJcqjexB+lfAo5xUbUTvXmEnCEhZp77ZvnZk0qHWnPGBVFJtKRgh6vtD2QMLFlaG+J8ku1JXb2yDOOqnfWxSnKc1lmlJavIPUbZY5GFwGe+7KrxhIdxukJWlVgTNb3o3cISGhSFwoPOi/eRhyBF0dCmPjOpO7uugOI764f/iU3biU6uMHeMsbAUCiTyezt7SEpBSQKgVowkiAo8fjx4+3t7Vqt1mq1wM8FWUmiIQBQkFKuVit4x4/HY6CWPBJAhsJeDwShVqttbW1dXl6iZwTt8PP5/Ntvv/V9//3339/a2iKEx/ZnHCSz2Qz5leu6KFqyOxgfCgwXsUipVCJ2DLUEnEz0oUJPE86zwWBwdnaGeAUZMnqupdUDwVPf958+fYoO4q2trUKhALNdcJ95P8gMwcZC5gnrITYCr1ar4XDIEKdUKqGSD7oWcAS6sbH6jSfCtIcqq/QZoL8WAykOI6J8PCyAL9SaABua/WvS4Q0OEsVicTgc/v73v//0009hcN9sNnd3d9vtdrPZ3N/ff/DgQaPRePny5X/9r//1N7/5DVCkZEO9/FOihG8Flkk6kvWekj2qYr1aCQ7iHYBoY46VSiUgUBTZSKVS6XQmnU55aa20Wa+8cOWqjFKRMktnHaSjMKUdTxultau1Y8wr+JsG9wiCVSzFxYo6ZaOTNH/pvEEODqEKClPIRJdxEtc7WtpRGGA3ei6XQ0uh7HLjyFMX4saqAIZxNpshDSDoj+avTCZD7WaJ4apY0lc+XMag/O5q02uFkBnuDRUdAgcMZ7GlAO/DniPlDq/PxXigLE1nrnpye9n9TTAC26ZUBcUUoo4N3hk3JknWpVIJ+jDSbcYSXFObkoLfhz4vhVYYK8M9DE6DVLCRHoOgZj9+/PjnP//5ixcv1ut1v9/HV7P8oBjuE1mj7ImURERxBXAtZHBRjMxms1CKRz0M85PqLuS8g1qLCTMajaB9MZ1OsW9PJhM43sC9jQucOCDKMEEQjMfjwWAQ3MIfkXmytS9ZnDsL4scNS0YhZP2HwyHqSViVPGUAl+OgAQEK/SUk6+G0zefz0O2h71M6nZ7P5yhDBkFQrVaBSk+nU5CtJpNJv98/Pz8fjUblclnSfCjMisfheR7d8zBow+Hw5ORkMBiwCgum89nZ2Wg0wu/O53OwvSyGGifAbX0bfxCM+Np7LZVyhO85JWhJRJXtL7wN1oF4t3ITJvGZ28uNKAw/jgkwj07uWqgpYieUu3fSwIcaryyk5fN5nDUWExM1D5rQvsIs4tnCVi2pZEWcGi+D1FU6nXZdJ+b6OUGoARZXKtGf/PH84b4OQz2YpT7+Mv/bcdafKANbnmxsWBcmJCaiuOU/fsI6rTrV1R896Xfq4yich2bRbg61DpcrfCOALSnH8Yjecpui2rslGI0uMVmMsTroWRO1lKNl/Z7VcSKtIJfxfASS9YoOLAQQcIc4U8hCmM/n1MVmrILl+i5tHzdVuKX8gixR3EYxtqqwSTb0jXR7ayQ5tvg79aBkrCvRRmlGJzuZVCw4g0YooMPT6XSxWKATS8bPXLxRFAVBFISB7/uBr7UbRaETmTByIpMy12KgJq5bpGLipLPZp6839SXMprmif4uath9jfCACB5vK2hJcXt8EEIdKrZSaKzVVaqbUSumUyaVNpxQ+2ls+3vWLmdBorTxTqfjb7UUht9RqFQS+H/omCiITRFEQXm9OkVLadY1ShjAl2ZoYWyKYjE/wUBilW8IdshDOxyoVt5XQZweTly1Q5s1kTJJQrPx0NpwhdiVdlIUWFroYhlG4luYxjFXkt0s2eXyntXUyrbAQZLkQhLaGjiIVhirwdeDrKNKvygbhJtncIpPqW3imNzbLvOFrbvsz+SaOUq7SntKu0tooZdSmVVtSEybZgpNsfEk2XpjNS0rAW5cEnaVIhZWvyR4dxucycKVlKANOLhCpsxTGhIV37GeChOA6Vn9G3XQdl6YCAcd78WSgDLFSyo8VP/7vXRYp+ODg4F//63+Nv//1X/+1/Kfnz5/fIWZ3APHd9f/QhXRIxtzMHLCxAhAsFotABBzHOTg4ODs7Q37ouu4f//Eft1otNOMDDoaoIorM0t3b932kml9//fXTp0+DIADiSalfNFxDoOD4+PiLL76o1WqQg+h2u5lM5oMPPigWi71eD8HlYDAYDoeXl5fPnz/f3d198ODB9vY2Yn2QwjzPGw6Hx8fHk8mkXq9T5hghCNjHwHkRuULXgrdtjIH2K4BjUn0LhUK1Wh2NRr1e78svvxyNRrBNwEAhegCBC7hhqVRCBHNxcdHtdqG3C3ANnVagVOOLI5I7Pz9HrCwtyNHrzcQGuR+UDZRS0ImmUifyQKQroOYBmANBD7cHeQfAEGwVpCQcvPWUUvh1RG+y3x/AOmI4WsHgMMZtDwaDL7744uTk5Pj4uN/vQ5oZJhKtVuujjz766U9/ur+/PxqN/u2//bf/+I//CA1cqTSiEnJgkvCSFBF+XXgq/FWSzcJWzy/1c4ls4ndBpfQ8bzKZQI6TaCBoDul02nNTjlbGONnUWS51Mg12nUW24C471UEuHSmV0RqBeyQ9oDBiwLwIN5OyzQ53EPNBdcdtA4SVul2UNSACi2Fn27gk0uK2Qb4APbPX641GIxhSbW9v54tFlCjkYPL7gs+IjBod64zegFBAQgGoqLQJgq4IgzbgL/gWBIilCjAxWXJApKwE5i2b0fi2UhyNWBL52jI/IVuzUCgw/5exLzF61s9kNyJldjFLAUGi5oRFh3mC7Be/xc4Gi60j2/HUZhe8EooZ74I1bPZlS4VN3PxwOKQLGc2pyThGuQ6VKkxCdnGm0+larQY6BpRz4MnJ2SIbMzGSHLF+vz8YDKDP0+/3Ly8vK5UK0F481kwm0+v1er1etVpl3Q5qFYCDsSVCAQba3FEU5XK5RqPBiiNKO+l0GjshNSiANRO5uHFsJbisEnKfSRSG7Dm5g81ms5cvXx4eHvb7fdiusg4B0Rg4wYIJZYw5Pz8fj8fQhGHyzL+wQDKdTjF6L168GA6HjuMcHx8/ePAgDMPDw8NvvvkGVVXqQcO7j7sEye+cz2ArA6E+Pj7+7LPPDg8PU6nU/v5+uVxWSnW73ZOTEzCgMeDgerNUpoQ5mKwHSCT0NQzHd6l5YIfcBAjkbVgFtiRrTPooYh9juYvMRx43bM2R7mfsxyK3V+4/GBbA6zJPttRdpdYwe4xAr0MxkrMOWy4L3ti7rG4Dus9j6fG7c2bi6Mnn89KfE0/JGO26ploNfvpkYUzoOro7yKZSzmLonoXKX2onrUzmGiDWseKqUSYmV2oVmCiKTGCiMDLGpPLmvXvDn/34Ym+nF0Xz6WylzNJ1gyDQ16RIz/O8lOO8MoKT2hF8lBIyBuZO81jK30sum7RvtYAekuD4NHn6c/vl4cUaAIIu1OPxE5wdGGeAVizSSwX5d2j6sCaGVZ2y3LTkdvR6BrE1Gm/AY76BVsJuGNLkKQ/Fp0DiJ6Ia7MwIL2FFMIkvNIWwyYDKANxyfd8PgrW/Xq+W6bnjeY6azL35KrUK3dBxTEZfI7auUhmhL+ElvL+0QHXpUBfFPN9AoHWSFEzkdyW0UyyAWELJQoNYG+OEyomMAzjRUel01CkHD7aWP3q0+MkHq2opUI4OIuM4YS6z9Lz1cgWKRjifh6tV5Acw0LoGFC25c4ohyJCG+wC3BW4CVnOShIapLJwskJP2i5D4On4IQ/MG84dAKlkXFB+T+SbxPuyi+I6FQgGcUKQ5yDikvS3xZd6zlAmSCOObnzhJb08uQKlvrrV2lNba0Y52XCeVUvl8VCoFk4IOfG0cHWZV6DhRoK+lRSLRVCF1CaJNuXb5k2iT8/6a/9R3/au69cV4PvGuu1FPutEDw7JRlTQORowySpEVtWSJQm71svwmW20QS1joMH4i3SzlkSeZH5ZjpzUxrm/7HcrVmVjExomrU05cNNXxXwjN05YwJUC44P8yBPR3f/d3EiP+5//8nxMg/qu/+qs7iOwOIL67/t+9yD6gxBiwSyhFEo6Zz+fwqc/n8z/+8Y8nk8nx8fH5+Xm73f5n/+yfffjhh7PZrN/vM6dSSsFPAGAxG8qePn16eHj461//Ooqi7e1tkpXYb46WWIhXfPvtt++//z5M3ufzebVa7XQ6SL0WiwX6ndfr9WAwePny5ddffz0ejxm4hGFYrVbR+3x0dATybKFQgHUeog0wa6BWAewSnDKoa6EVjgA6fYqQP1erVahldbtdRL2IgOfzOU8m6CvRtgswFhq6Ly8vs9ns3t4eJCZIbUb8xGZthGL4UtlsFlrMAAfJkAI7iZbrtPxSscYWmrsXi4XneZVKBYxssCwpN0avWPCjAdKBG06xDrKiiJVQqUPFjWl4Iojqstlsv9//9a9/fXR0xJ5B+JtBuvTJkydPnjxJp9PdbvfXv/41xgTf6LYoJKmMdpsl1I2XJItZxoDS+07SihkxE+uv1+upVAqtbRxDEtMcB+oESuv0Tuc3g3U07Xrr6e52q/cXP/lypzPxUpkoMkpHRBZkumu1axEVNcagdQ75J5NSPF+CMoScKIKBgB4XvhFa9TmMIJUTVEV5AHfl+36j0UCEaFWV/CCIwpAUPDodSTSW6aKKpcz5ApSdyuUyGc3YZHDPqJSQfquE6SJHTDKUh8MhlW3xICQ0KRVRVKyYRsqkzKmgiAe2XZLywJyEBEz6binRE2dxFanAmIQXOffQ6Yb1xcGkjDgFOqRQoPP2ZLRkOUSSMvBx/X4firTGGBQVQFZFz0elUjk/P+/3+1988QXGHBU1iNKA0gsrM+zYAGTJ4IOOkJR0X61WEBMEfezy8vLi4qJUKjWbTaSCGHDaQJFgS88ZMH8rlQplLlAUyWQyu7u777333mQyAUJK4zW8BvVLzP/pdAqhJLJoreGl7YmVJuG74CZlxQWHGiBgfPHZbAaZnZOTE/qy4pxiIQf1Uay+0Wh0fn4uLVYw2ehTKjOf9Xo9Ho/Pzs6gS14qlVqtVhiGp6enp6enkC1m++3Lly8nk0mpVKL5D1a61no6nWIHBgw9m81+//vff/bZZ5PJ5L333tvf3y8UCovF4sWLF8fHx5TWwYJC5wr54xw3izX8VsjUG15hEKzWa8fzTCzIwFVDQhxZopLcJMs/qAXGOFRgKfxK33OLgyk3TxyCBM7YV0HeLnYwym5w88c2aIGhoPeCPgzfBSX0E3Fe06JQqiWQu8pNj86QmJZ0yKQwvVRpxCGPrSifM9udZTq9TqW91sRZL1dO4J7dC/211imt09ed+8Yode0Ab0yklFFaaRMZf+2vF6v1yg/DKJsP339/cG/vstMZRNFqOg1mM7NemyjCJzqx9o6Rci4W9MkiE+4Zg4bzAugVxk0GCVwskviWjCjYSmIZ2EquGQMGKcJLxSFp/YcfyociqfRvBRCrBIP4tj6GJHB8I+yV9G+8GdFLsP8ksZcDC9I0vyCmLsgZdHWm4y45E2jRQ0lvNptBTwChIzZ8RpJxwBZ6nhMEWd9fLZe5KMyEYfpyUr6alMaL/CpKRWmhzZqKhSZSwraLALEjaJuhQOiIBRvBIA5i1eBVDP6uNoWGJUDsi/9i3qjjGM+LsumoUIyyBeOVjRPobCHa3/XfP1i8f3/+3uNFrRJqrVZrtVpFvu+vfX+xCpfLaLEw65VarlQYOkoZipRYMgiSGs/4VloIcGlL6E3qBhC0ZT8BOQTyF5F6MFm7nvZRZL4r6gY0yP8LDeJarUZra3KDkCIhRsXrs9lsrVZDM+tyuby4uBgMBgiWcMIiI8OvkNyDDZDTkpvwa4Bgq9yiNnVX2BlG1oXjOK7rOK7reSnPdVMpp1LROzvrx4+nxbzrr9RauaMoNfTSy0XKjJQqKLWMp4cr5p4n6hbRplK2K4jG0iBRaluHAkp+Q+BY2T/XChC367rGcYyjdbDp5yYBXJ6hEmO1CNpS4Ejq3eGVsgJh1XSJ+yP7pguCjMmxk4CSQtdE6X8ILw1uQZS3UqI5D6HL9Y4dNw+9NUbsKpWOvekk3K+FHrElN2zpFK/uTOrurjuA+O76QV4I4EgmQkwgExhstUB7e73e119/vb+/DzgGqTUEIhzHKZVK5MhMJpOXL1+C4UJh38lk8vz5cyghZrNZateCxAra2mg0evbsGTrOcrkceE8g4kkZqUKh0G630dkK4MB13W63++2335bLZUCW+Xy+0WhUKpV2uw1CGSgMOGmYI4GiBR4Nmp2pz1AoFBDEhGEI6ySwfcEXhm97LperVCpJJX6yPkELxfGJY2y5XJ6dnUVR1Gw2W60WKDBUEoTmxmg0AjRTLBZxe3hMuD08JlZQwWdkvirlBQAcw3ce4CxlFnGaAuukSyyeCEk6uCt8IqIxIOakeYJ2LV3CpLXRaDRar9fk1ziO0+l0oHO6u7tbr9fBQev3++SySQpMUiZPNsUnM5nvJAUk9Sit3qUkoEZ8H4sFdK1arYZ5Dg470D3kM0jpXdf1vGy7edRbVk+7T8xkq/148uMPL1pNo3RWqWuEHckV+o7xEZQMZkRLARCAqhAgpjyCzNaoBxJFEVYNOPKsMdB+rVQqUVCbittkJirRAR2G4WK5VPO51ZSqY6SVVXqS2rAbYNUzk0H9gxUp0r4Q0CMWBKoopSoIXGK08TLZvIbqBVnD7ApnIzYHgbOXADEWPrYmmSbJBjS12dSMGgxppwSjScPEV6DeAnIYbCBAbdAVTudJpnBkwYDLLye25L+QrvVu4BrhcjnD5cqFadtgMAA6XKlUEJoPBoO/+7u/gzXZ8fExdoxCobC1tQU7tX6/P51OoeQzm82+/PJLlA/39/cBQXa73fPzc5BYeUygEHh+fo69CNvscDgcDofYnFHQwk9QseNeRw80gsVYFM1mE+WQdrvdbrdBiie/FdAtNkNqX6Bh5bPPPut0OltbW/V6PYm/S4iEJHQw4HA8geiE6Q16NQ4LALXPnz8/Pz8/OTnBt5ByGcBHlFKgrk8mkzAMp9MpxCgsCXjkZkDBqFyPfQmCD3CzvLi4YOkXRycWCG748vKSsCN6aKChBISUKijT6fTp06dKKYxJOp0G0v38+fPLy0u8slqt1mq16XR6dXV1dHQEMJptwtxMSAeTjfl/EIDYKOVDIMVxTGzNR91nuTuRmZgEeeneqWIvQbUpiGFpL1ryR+SUsRWDytoWqMcaKknHeE9sU/wUpMdShYb6ttwQqKdJ7rAUSZCSC9hasX/ixMdclZKy7JJJTvsoivxAaUdl0ubBQZhJr6ZjPwyV4zmOp7WjI/NqtwRArLV2tDahWS4X08lsMV/4vu+lomp1lknPVqvAmMgYJfVLr63y4k0bd2txqzmF+HDx4LDQGCNZR5XVck6EXSL+Eu60FIfISWS8StSDs4inD881qyoZhSHO9Led25g9yTK5RYizwhsr7LlNUEIKiarNFnJLUYccVRaB6N/FR4YfIqLGBkuAmBEUW3DIIF4sFogZOD7EgBgDKGWiyEunXd9fBsF6uTKLZXo6L50OGueLWt8vLcK0SevrjNbZtORyNyUmVEL1lQivr9R6U4M4FKDwOkaKl0Juwmz+uh+/CUnEWmlXZQtRveTvNP1aISg4xjU6ldXtln+wu2o316XiKpeLtDauqzGWZh2FYeT7xveNH6CC4jjOK5tD6+lYjHvr0bCyIme45WpAJ148rCRALDnjlnQJluVrkDUNhDqucMOcvNFowJwWeDHCWsRyyHry+Tx6JoD/hmHY6/X6/f7R0dHl5eVsNkNVEksesQo6LXAKyy4Q4oBJXwq1KYxg1aVYjJdqG7LtL51Ou67neVnP89JG1+vq4YOl6ywf7EdBYCaL9Mt+/tte+WLuhq6jikpNlZrHcgSOQGKI8JJz6gqpE+CJLEsE8c+lyPuNMLFK0IfVJhz5ilaP5+u4nus6SjvGmJBhg4r17qTsNdssZJcMy2BywmAuUa8crYdW+UEW/6TEEAJ12YxF8zrMFhBHMIUoaY2smUUUxkKSFcc9hzj4u2gQO7FGhBsPtRPjxUm5YRMrEfPph//3JSburrvrDiC+u14HENOvCTp34/EYMXo+n3/w4MHBwcHV1dX5+flisXj69Onu7u7W1hbOYLDJwjC8f/8+sFRsx71e75NPPpnP5+Vy+f79+9ls9vT09He/+91oNIKXGmBQY0y73QYyi/QMWz+O/2azCViZFUISeGu1Wr1eR6ssj/PRaPTNN9+Uy2U4oZVKpVqt5jjO9vY20ml0QKPAyBQd/ZWISwhkg18MlCGfz89ms9PTU4CDiGihwzidTh89etTpdKiGrOJuOFDeSGcGiIDxWS6XUNgsl8s7OzuEFZDILZfLXq8HAm+pVGq32+zXkzJbiALxMkC0OAKJLlFoAjZ3bPcDkoIgDHQ83AzeHDA9DYuGwyG+FJgFQDRAMIfLMBipRLVAysOnX15eHh8fz2YzPDsQwB8+fPjhhx8+fPjw4OCg0WicnJz8/ve///zzz6XMiEVsSVIkGKLd5lF+c5wqkiLZnceZIJVzSYJjfo6RnEwmvV7v/v37lUplNptdXV31ej2wyHEn4DtcJ/YZXchl0lFqvtBu5GZz6WxWK50FAgCOJJ4F+80RCYHKDQYleO5RFKESgxyVan2snxOkkEIfNLij/RTQJSoeIFVjV6xMBiCMi5vRy6VMMoFmYjkAcSCbEtqvoFrjU/CheL7MEukbhvQAdoUgLVLrk+EjMEpCXdI3gyCs1ho8Mmpr0D6xWCyCWkKiPSixZKQSziPFSQJYRCWu9UM8j6g0yickAKKBgNwW1MAw+TE4ANBHo9FoNAJcDoJMuVzGInr27JmUN+VUZ5ueZLS9W78IoUa+G4EzfCgJcYizC4XCcrm8urr6m7/5G7YmYIGsVqu9vb29vb2Dg4MwDC8uLrBnXl1dQZv43r17hUKhXq9HUfT8+fNPP/0UcwPYATZkYM3ID7lb4jmCylQoFPr9PkAEsuYJdjMBQKxfKBTu3bvXbreJ5gMOwydiBbFagIdFHPN//+//vbe39yd/8ifQjUlqCuMJEn/E1gFHHaVUu91GiVTm53jZ5eXlN998MxgM0HZAOjBAaiJQWKdQwEB1cz6fDwYDoK6FQgGLHUIfQIQhVY/9gSwbEpPp+ETivIo17lHvBF6PLQgQMDYWzG0YxO/v78NiPooiGMd/9dVXp6enwDSfPHny85//fDQaffLJJy9evICjIKZHsl2UqaBUzPz+VxSGfhB4QeCJfJ5LhmQ33oblfUrzJW7ykjXJWikFKG4koPFzUU3P5/NcWfxEggtk+HKNy3Iya0WS22s5rUnRxhvrmnwfbj4sqxAGYkIufURxeR42mTAIwsVSGaM9T6czplYLqlUTRkor5biO57racaLIRFEYRtF1Q70G2uBEYThfLEajKXZ1paIgWK1X4WRiwlCHIeRHgFHa5nvJQ5/PRVqVUh0Iz5Ht6rI9SI6/7DKxtHok9ZsomBVyYFdJWt3iPeVGQfb6K7X6t3dlTALEnCQ3skcts9MbP84qdViuvxIjk3CMhIGoTiMxa+kBgA1Keve9kqyNCdd4Lgg8rAOXc0DEfsaYyF+7UbgMw/Vq5SxX2atB7eiqfbmqTpz8IpONss4rFJgYsdSXSEpMGAEQB5saxASIgxgaXgmAeC1EJPg+hIYJJYNBnDbZXNTK+4925/tb61rRpF1HO06+EDQa61JxHYb+ah0ZY8JAh4GKImMiQzomHq+k/UqhA/lMuemROCKnBzYT7HXss7TcCBgr4ui0qJ2kjtqqJlqb10fdjqPj3n8UD2Bji1Y8siIo44OIt1ar1Wo1HJEoo8Lx5eXLl8iPSPFBDlKv1+v1OtzUUb+X9fUkg15Ck9Is1BJAkE0Gsm4hFournZR2UqmUrtXWD+6v6tW1v1qHkemPMtUX0err9PQ0PVtoM9HRWKlxjPY6gkEM8Dcds4mJPAL8TcWwI8npBIgt+7tIzGrL4+42vzvNTQEQsXIco3UYRaHvB8w4pNoPKepW7ZxHG7IMzDc2EHD+IOaxppbcdaUKitSLkN2l0lYEvVD4dZgoFotFyJLgeUn/AJNgRjuOo99NgFgplYpB3iDuTgiVSsdPxI3BYhVDw574uYoffXQHRN1ddwDx3fXDuygjEARBuVyGfTxkHx3H2d3d/eCDDw4ODmBDp5QCubVaraIIPJlMDg8Pu91uNpttNBrpdBp9QHS+6nQ6Dx48yGQyl5eX4/H4/PwcZWFIna7X6/39/Z/+9KcQPRyNRoVCYX9/H72rIBTTzRaHAU4sEIQPDg56vR46lBF0wuIWGe/R0RGc9CAfrIRUKI2qisVirVYbj8fA+JD0gteAUxAe8fl8fr1eTyaTr7/++ptvvgEGFIZhs9ms1+uVSgVgerPZxBk2HA7Z0oLACJxNgMuItqfT6cuXLy8vL7e3t4EVwnbPGMPgCeecJGKTokKqEU9fmKfhI/h86boDLI+aCel0GnLJZAHjMKb4F3AEpsSkGVJ/gIZmvu/XajXEdjiVl8tlt9t9+vTp5eUlcJ9SqfTo0aOHDx9C2vLJkydbW1vL5fI3v/nNf/gP/+HZs2eDwSDpNm7lPzJpt4Sl3jzdsrrGJBPHokXITEma4eIbQZDakk7DJERIpJWJQhVFKRO4xldR4IahZ1TkxIEowFMVC2UyQCfr3ApPaYVHSURW1yV/xHLjkf7UKtGFarXTSqtrTC0V+/VZIITatHRndooYUXL02OJHuIS1DY4qfkIOgvQhZGqKt2V6ydvGgLAcQkTGIoZI63kmP8AXkJOAampl15YchNWkJkXQLHTDYtnwxfyCZEkwhWZbrnxAcja+PvN/oxqJWEcWg5j3KbM1iBIAzJVzgygVnOWAtlerVWyws9kMkFCv1/v222+Xy6XrulAhhwKPlKPB4PM9s9ks4XhA9vC6xFElpVSZupAPgvmzWCzApcUGhaKgiu0l8Ryx6aFSwum3Wq1OT08rlQrqdhIjls6EpCjiI4rFIoZLMkBZcIqiqN/vX11dDQaD8XiMRnhy7niuwTgORnxo78DEgN8pblh+TRwlqK/QbhTfBfiUXHoUjyLdkoUQbjLgII/HY1qwAriv1Wpg6EDFAnXi4XAImny1Wt3e3t7f3wcLm10IlrE4NQGs5PwPRSKWsoME+G7jhWGjoKYH9k9KE9AZiSxdltm4ZVmUPV6SvoRHie2aQJ7UGZAWo5KgSjpz3Ibyqls/2cZLOJI1CUlyxynPThEVC6FwPrDDFz/HDSN2SqXCuJclDEMTBCoMI63D5itnMwABAABJREFUVN7PZALXvU7p055xXS8MoyDwg1f5NrAqE4Rhbh6m01GxqIJAR5Ezn7uDgbtc6dUqEvxQpTa1eglX8Wiz1CRlGMBmZIqQyn4LFGNQB8Iokf1qbe+smMonK4cUy4QQP/YNebxKmjz6eF5x4hInwpsW9MTIWJistF2SRdOkMYN1pvB7WWqhljy9PEZ5rskxlDfGKIizl1JmLGuxk4AteoSTLPxO4nphGGlttIrCwImidRQFa1+PJ/mrfu3kstVbl9e5lF9xo4JWadG+7Ww61DkJny6zCRCHgp5JfC2MATjJDl7fBBCHAkRevdIy1kapUKUCU8v7D7YXH7y/3GpH2YwTBp7SxvV8z/UXi3C1wgRTYaiDwACzxY1qRzmONsaxZhrtHCS+pjZtbC0jOOY+UiNC9idJJE5CpXKRJmFWljFujbqjyEQRimfoXCENRcoXMHiGSgDuE8cl5KfOz8/Pzs4uLy/hKFAulwEHQxkMioJ4Z1oQEzcnq8b6ClK4VoZkJFnLN5GFEG6nSqkgNI5vtNaFvPE6UbPha+UbYwYjnc0v1tEsUN7FND0KvPnYDXv6era4AggGyJsR8rWOUmnBDnbiIoRkCodCDttSn5Az3NyEDptXf9ev/tOOdhwdGQOpojWHUeYIyf2EkaEcUjTlsKtDytAlWQvJi5OZ6kwUWWK7lVKqWq02m014HV+fSvEkV0JU8MavwBKj6/u51cpzXfW2WzSeox8ziIMEX5svS8cbhSMkKYJYtvjuurvuAOK764d2QUkQpK1arQY1TN/3q9VqOp3udDqtViufz+/t7eEwPjo6+uabb6gIDCQL/bAUY51MJvl8fmtrK4qivb29er0ehmGpVCqVSk+fPiWlBUCb67oPHz6s1WqXl5e9Xi+fz9fr9Ww2u1gscDYgNWW6BTwiCIJarXb//v10Oj0cDkENo1U9vIzgfYQ7qVar+JqMOZCBFAqFcrk8Go0AfKdSqUqlgnMFfEYwbT3Pg3jxZ599dnp6Csgjk8nU6/XVajUYDIAvV6tV8CLBKWPQA6gXYAeInyBgonUaDFYoGgNKhqkdzkXf99HYy/5f0OsAFhPSBY8MHfp4gtlsFsxiNPgjFkeIRkAKXE6MGzMNxATgGqMbGiHRcrlENzQSTmgX4GYKhQJ7iiGgeXx8DPowflIsFnd2dprNJnjHqAf0+/2nT59+/PHHZ2dnlifYjVp7FvQg+VNvlHrFkQE5QSRUUk+N6ahM8+CIhZwQLWzyfqAxAosV8tEcxwmCcDydzCazYB2qMIpWJvCDtR8oo7UOo+iaI8ZauhQ3sLqPgRkRqnBdF9IuoFFY9s0So+T7s2BORWDiCJLBgVIEKv8qFury0mm92XEfxvAcZgvpiih+IFFHnQD8X0v0E3UXTF0i14D8qFHIHl429jIpiqJX4ALgxVBceDEWC26DLo74RMSRZFUjIUkC6wxMJb4GiEc2rFkZsmTuAIdifMzbRtdCsViEEi54xxDwlVg8c7YkIvDO7l5WE7cM8UkhpFwM6nwgWUMtmvAZRrVarQI6VEq1Wi00oOTz+W63C5xxuVx+++23JycnKERhw8fI4ENRtyMMh9vDA8LEgKwK9m3HcSCVA1SaWKSKdUigzHB6ejoYDIAIl8tl8P7g8QWRBJQwM5lMrVbDPEE5EBsypDPQosi2FTKwiFzwVqvVKj6FVmDSyXM0Gv32t799+vQpLPWwWPBueO6QS8Y0oK0ZKfAg4m1tbaGlAH0b6LyhwD0mOc5xtIOgtmrZoElMUNa6eNuz2QzHKPnR+HbpdBoHLrWPlssl1jjkp9FyBFdV4P7SW5Jcb24pZMt+n1KHTHU9z8tCaV10S3AyW7kosAPIvOC05aaKKAiXLGVJi8Ibk2H8K4AwLAGWVyXzjrKqUjKY2y+3DiUk16kAJgWRZbWSrbIW31k6tmHesvND6ixJDjU1grDZUnATWhDGqDCM/HWglHYceF5pZZRnVBAaf22CADZZynM9oxwn0kEA7dSU60ZKoQ7npVKB1ssgCFartTERWxks7FsW8lUsFcICoYRELQyItTosWERQFDFgu7HVYE7lk6Q+rxQg5vFKLzU8d8QJeAqyUUYS56VsxdtBxDdZRSWr41YR/baVJbnGyXeziqmyoC5XBMMJeabL8gaCT8xbeexK1SYJUquEbjIr7mEYaR15ropMoEygTBgEerFMD8fF/qAy9gtRqFVOWD+x0dvZpEla3MkNCFOgaUkh10j8RyTOAohhXrdUahmLFJsYI/K18nU+FbUb/sH+8t6+KeSd5SpaLNVyGSyX4WIZhWF0zW92tDLXat7XpmEb9E5XikjI7Z0Ipnw6Vo8d6fbUH5f0cFmGsejz1lrgCpVx9WvmMGKGjOfl8vlGowFe8GKxuLq64sEKTRIUw3Az6/V6OBwicoDNzPn5ea/XWywW6NLDWyEaxztAi48wLtvF8H2lDpV0MeVXljY8cotO9lhIaQ5kRkEQeK7nuVGhoB0n5blaa1UoOplU6LrzTFZ/dZz9ZpxfT7Ohq68Vq6mIkhHFCRLeHSElEQk8MQkQB7egw9afyckfLw2jlbn+ubn+wHiXQ3IqG2ukDgxGRs4HjDPOFPqfs8HLEvSXQLBsKpJS2mRU8Dni0/HcwW+DEBkevXRAYZ2eHQ9yGuNCrLUMglIUpWJR+7dD0TD+XjzOwIt1jOnreDvSSq3jPYqWg8EdOnx33QHEd9cP9UJKgJgDTkGLxYJEAOzIURS1Wq29vT2koxcXFzA9y2QyBwcHxph+v39xcfHZZ5+Vy+XxeNzr9TzPu7y89DyvWq1eXFzM5/N+v+95HtBPgJVKqXq9vrW1BVZpEARoUu52u4wOkSczZMFxBUBTKQWtie3tbWBAsG1B+sozKQgCwJfgqLKfnQAEVC+BRyulQMtiMoCk3fd90KagIIlQplwuO45zenqqtR6NRrPZDG+LrwbhCPDCCoUCw4hsNluv133fh30QdBjwrWGyh5QPJVDIX0ApkkwZtK/ysJRmVngx0hXUbxEqgRZNrjEeN1MmCRFKipOKHW8QVLHLnkkRMGJSqxDVTSaT8/Pzq6srDB0ELur1uud5UBfZ398H0/yLL7549uwZBQSYkFjhZlJx9Z0JaDItxMRWQllMzjTm2I7jLBYLNLVBfbhSqYD8QlCAHXmYGJify9VyPFmqcNiqn9TL2Vatq8x6tQyjyGjtITdmUxXRE6BvFARneM1IGmk/6gTT6RQfDZRTGmdJ23fMEPyQnnJW97fkwxLyQMN4EaV7yWCNIpI3yQPFXwApYjOZzWZ8mpxghAIl6ZKS2XgrGdXJB0QrSDwLyaYhJdAVRlUEoPGwgHWCyUhxNAq/ALwjN4plEvJGyXiSX4RANtoOiJvT9RE4FHIYkmLA4kdCAlhtuVzCCtKS1Za2dUlq8zvADUmysBLqpZLQgQFZr9etVgu7ymKxAKaJVBPwror16TD5kadxyqGlgxAPn7WKlU/p1cYJ73kehg7ALmqHTAsLhQKEEbhVSr45N3AM7Hg8dl23VqvBRg9LFTq8URQBUSW3HcRnY8zLly/r9ToSj0qlQilttdlZSaK95I9Tnxqk2pcvX37++ecXFxdsOyCEStQJ9R6MEmh3kLeGjR5kjtLpNM6p4+Pji4sLSioTikKPLQZEyujLucTCAGUZyS/GsYXBpHIu+NEoFUAChZxNytBDpPjw8HAwGOC74KOTfjU4u6XC7DvXOazrGvhIpVick/qq1qym/xUWJmjX3H65k7ARQQmDJqqRWIRH6SxHdQhL+9UyOuOWKKeW/Cf2BlmFQ6uORYyYaJFkUhPmo4KkRcJlNwbhD26tSXVaY9TaN8CytFaplIoi7aV0GOj1Wvm+MZFxXZVKaS/UWuvQ18uVXq/dIEgBDVBKOQ49AwNO4FeGV5uuWbJ6KrnY8hFIZSoJabFThKgEdTYs7F4lhCysSypUSDxUKshLJI4HqCS5OwnVmj/gZXltff+6iwU6yzn8GtsG+VCIqXGHedtjK8EohJ2WiYwKIycM3GDtmEC/0gLWN3H3+BP92uay7/x5UtQ1SdVMmtcpZYyKIuUok/KiXDYqFKJCXrmeMUoFgVFKRaEJw/ist0dSJfu9kgFw8p+s3rgbmx6SEz75PkmTj7eeWnFkGLkuSrZwn5tMJsPhEMc9FfDomAqfWyxYIMUXFxe9Xm82mzmOg77PRqNRrVahkocjgNbBLGPTk5PqZFY12uJKc95SHEYCxFYfHlWnoJGVSqWzWS/luFq7AF5zmajTioxZBSpaa3P1PHU1zqwmSqWFmgQVaV1hWKfi/+vH2KIX44nRpkldJGSIb7OhU7eQiCVebLjcIsT3YRhJ2XHZ5sI9wSKYMxDCiKH/DNECTxZki2zj4LHI3MeqddF5SMWG2FYVCrV8NigAAcAhzqNQ6gIl4wHf95e+n18uU6nUW2/QIA5TMNqJcWH2JXgxvm9xtylMHN6+/9xdd9cdQHx3/V+85vP52dkZIC2IMwBPVMKUyXXdTqfz3nvvweVsNpv94he/+Prrr99///1/9a/+ldb6q6+++vzzz3/zm9/gMEa2v1wu6/V6oVBYrVZ0KHr48OH9+/ehfphOp+/fv/9nf/ZnhUIBZCtwTr/66ivP82q1GjjLSimQv5A8A2pBRrFYLCqVypMnT7Djn52dffLJJ2dnZ9SDQzaey+V834cOBlTtoajg+/7JyYlSCogDcA0Vt1fjkJvP571ebzQavXjxYjabdbtdnEm1Wm1nZ2c+n7948QICFzzDCoVCLpdD1zA4Stls9vnz54PBIAiCra2tx48fg+m2XC5fvnzJ9hnP82azGYR9K5VKs9l8+PDh7u4upWApgqFE4yHBWYwMZJdldAjaLzELKEviVkmVkpCQbFNVsSEJ4GbJqlutVhhJkGfx6Mfj8bNnzw4PD0HKw9m8v7+/tbUFcPnHP/7xz3/+c631r371q3/37/7dL37xC8R8UlnPgsCSScW7abDK5krCCiqWbLNkQ6nYyEZ1DH69Xm82m5gYYRgCDIU2CFjV8FN2HEdpNRxkquX+ztZvi8XzWs1k0tF6baLI9zxlTIpt17SZwkcASAL+BbAJYJkXWzARSqC+LWFE1ttJMGc+TKlNoE7kVkDzFAAWYCA8tSAIhsNhrVarel5KSB8opXQcn4VhSKY/HWmgDHNxcbFYLMrlMlghZC6jroNSk7RMkbmHhM7JZ+REJReV6t7gHWPpAVskKGApbLCyQssmojbS+wJvS+1pMFgZInMKURIEnMTpdArgTHZ8Qzk3nU7X6/VWqwViPsYNVFCAfZQlfaVZKfQNrGbh1xDEXn8RkZQd9wRNMCYcagoNZ7PZvb29TqczmUyOj4/RnYDNajAY9Pv9ly9fAloFaxh/YQWFjxKPiWcEZT2x9qkfhwWFnon79++///77//iP/9jv9wFJS5o2Bo39jJi31LwjBQmfDqY/Wfb4akgqAOrhHrLZ7HQ6ffbsmed5zWbzvffeazQaVuYjcR+ZLoKoaIyBadvFxcXp6elkMsEIYChIHOYutFwuh8MhpPZBn+fOWSqVisXiw4cPW60WFIdRYeXOQEkNJGOYtDj1+MSJ8VGUBlRZkJdZzmQ5hDMcfFi8oN1uZ7PZwWDQaDTQM4Q5/Ld/+7f/63/9L3wi8mpCz5y3sj+XajPqD6Qvcb2xx0y72wDc5PYuCyQ3AlKWl5HN61S3Yje3fS8pZCSRl6Qpq6Vy8IYImgUG3TYU1hn3GrBvk2RKTJkjo4xRymj8BT5VzrWUk1KALIxSShtz/fo3fOJyTCxV3Bsh0duey41f+bZ7eBO32+ToWRxedZN2k5ZmfG87t18L+N44S9/haEguEOvpW4Rr+Vu3tYfLOSm7Lm4UwXj9dIjxK/yK0lopbbSjtKtUZJSjNySGvz/aYl4LE0u8WKJvWmnXKE9pIMVKK6OUNo5jPM9oB8RMHQQ6CEGuv14y6tWe8BZL401G0iomJYtMryGbv2alvNUEM6zoZ7PX7fyui9wNzYhgnBQKBcjIZjIZdJKBAAH8DrYNiK+ABqIHizYqSjQBMLRAqCPjNIovWfU5ySCWMLFV8uELpEksDrXY7dN1HM9xPKVcrZXrBMXCYqu9Hi2il/10/ixyI3OtT+3H09UVFGDq2OKfQgH+RjeR3G8kvKtbVA5e84TiuRBFJjLGgeuo2ajYJbdQqX2XJLnjUTI8psCa5RHKsxj/lGwYlZ15TN/Q+4voCCQqPCzEHrSAZuyB7OPGbfyap5JKZbPZd5GYILgfCtawFz87k4DcgviJowCQVmp8BxDfXXcA8d31g7yQr0IEgB06OALRbeo4zuXlJZLkbDa7u7v7T//pP/3mm29++ctfQmgiiqL79+8/e/YMCgmNRuMnP/nJX/zFX6C7JJPJfPvtty9evLi6urq6uvrpT3/60UcfMf2+f/8+3hlHbCaTQWqN/7u/vw+HoiiK4NW2WCy63e5kMgFkvFgsYE2AHb/T6VSr1b/92799/vw5EV5AFexeRyY/GAyazWY+n4dNfKFQwHmPnlkeV+CaQXjx008/XSwWqVQKUsvFYrHZbI5Go2fPngHiZDZer9fv3bsHAAWaFWj7xf1AMsJxHDgpNZvNVCo1GAx2dnaq1Sq8ekej0dHRUTqdPj8/dxzn0aNH4IdmMhnYRkFnAwczhw4OcrgTgMLo5YeuBWlTrANnMhlwPIEp0JQWhz3wSkgh4xAFiA92M+hUNPOFcsVoNDo8PDw8PATyZYxpNpsffPABFKW3trb+5b/8lw8ePECB4R/+4R9+9atfnZ+fy5RYupNZHYjSVu71md5rLmmwgGhVKqsmzbslCwkxDb4s2+SBtkDBA8gUcU/P9YxJ53Krne2LRjNIp7OuWzVGK2XYNyiZCyTh8olI+T9jDFA5hLngXgHWYWRmgW5ScUJ6dgGoIkRLKBATjEEwneuShl3AbSlgLeUgMWiQ2EYRCFT6jYNHUEel1KPabHTFmFBwWXb4SmCRtF+2+tK/xaKHsLedApGA1wEyEv8lwQEvsFQFZHxJIJvynRgQxKmc0lJWAj8ERwa9DjJQlli2lftZwqN/EI6YZMXKNIDDRU5uGIatVqvRaHieNxwOQciFyPt0Or24uBgOh1gaSimIqqNbAq1/eBPI1zLcp78igE5+TbIsMVDYvsjIBlKfii9asXHqqtiQDYZyWC9oeYEMUS6XQ4MF+06ADnP2zufz09PTKIpGo5Hv+41Ggwp3sgMDxQbszJRawky4vLw8OzsD7EvpfH41rAg+dAC1uCUo2PBxM1VeLBbA4pfLJYWD8Bff90GFVjEr3NrHboQvycRhawJlOiC7XywW0+l0u93GJg+uFs4CFXeSep4HdSaePjgOJDpsbeYSJ4qiP4w5ix8Ei+VSOY6Jjd3kV6OqBhsXKFPAbVBt9sxiz2HRCHsjJVYlUsDaBr8XCg+U7ZbS57gsQ3auODY4c4tmWksXO9keyx/KNnOpBc/tjhu4LLyRcYwbpmwCK2FkijEcYleZ5GjLgq51WfuYUsZSbab8sbxteqDx8LWQYr7eArzwlVkulbVkKbZulQ2sX5e7q0W9lN3lcpLIPhLelayIgChGcdm325+1VjfVFZLoXpLseSPkdyOYm4TgkyCv2iRcK6G5zIswEMqiDCn5K9iu2VtGDWKSNGXLuVCuMFG8AoDIOK7x0qGbiZQbkzFdITSsY+jN3RSakNxJCyCLboLbSM8MBVvTj4WGqVaslXZMOu2nM6FnQtco7Ts6cPBu6Wy0teVXqr7nmSBw5nMVRXq91qu1gQOFjK8kld6C55IAPTcQhEMcbQ6d1eKg4iYJymfL+SMl4/n+LObJOoGU2ArDEBvr60HtyBgV764ybOMWJJcSFxGWDzmkUjdDCn/diJsnhWjk2pEVkdcUkCRlOClnLw0D0VYX+wqiJKaVdlxXp1Mmk448L3K0uZ4wcprpmyRNdALzTZYlbIT3Xesfr34W/6FvfUurW8v6e3JwZAlWtq1Y29SN3CB52Ml+IGnzwEYZi1ch46vkzml5e2it3Xfu8Fgp5Sm1jineoVJuLEzsxU50VsVPxURjpVQQOxDeXXfXHUB8d/3QLu6zUmyRmykQXqCKBIag5wsoGf4AEF4A8w7Zb6VS6XQ6SJMg4Qojo3K5XCwWkWkA65T8weVyCcIazeLpHJJ03QUxGbRHAGrZbLbT6ezv78PhHbeNLItdt7A7AIsQQqg4Y4DXUNEVv9Xr9U5OTi4uLiC8SPFffDpBWCnsCOEFIM5A3inigbRnuVwC4M7n8+yhhnAE2HNggc1mM1IawbuUqSl5r5RkYiKH4G88HqNnGRCDjBppAmYBpmzMpxojCHEUQERwLx2QQL7DzQyHw16vNxgMaJGXSqUgIQJjve3t7Z2dnWKxeHl5eXh4eHR0hEZvadRjkVPemRFza5wq/M2YYydZPzIKATWPvuTS5QYdysBNlFJAySlrkMlkcrl8Op3WjmsMsqkonc4QBCTiQFYsqazgY0pTYBRvgMlioXFpEOqlfBvzcMk1hroC2LtEuNbrNcjRNG5SoqWaVg/hNdfl+tnQEQXzRKqyKCGeC3HVQqHAPmIaDTOYI2a9ji+8lfTik1LREh8hH4EMEUtcEsobUuYY48mKFInGRHD4Q7JdpHIiVwdFZjExAOFB2JRDIeVxya8EmjydToEiEbqicPONtD7JLP4+S8DC+qm2rGKZCJmRMlcMggAgYK1Wa7Va6IoADXYymVxeXk6nU06VSqXy0Ucf7e3tocLXbrevrq6m0ylaVfr9PnpLwQEHUo/NmZ9FSH29XmOXQC8qFHhRsgK5NZvNDodDVBAB8hJoxpcql8voC5nNZv1+v9frtdvtra0tmL9B2QNLiWhyEASDwQCSMmdnZ8+ePcvn8+12G9MYwggsUVQqFcgHga28WCwwf9APS2UYbh3YilEqIFyyWCyAxkLiHAo28/l8NptB46XX66HXBMVRwMFgakO1qVKpDIfDq6sr/KRQKIDXL2X46N+CvYKDzEkI+r/jOPV6/eDgAKLS6BEBFoz2gtFotFgsoJKPx4evIM0hpY8fJUSoACOxpO+/txulEGNExphMBhRm7AbWicnzER+KYYFKEvtXmHkSGmZ/q5SAoHQPNysVN9hS8AFlFS46qltSf4AQiZQDgiUAjxVLcj0pzsh/ImbNwj/qXhJmxYojQk1xFZ7COO+I9ynhpijNbHFjUiwlSam2/i+RdMsFCxOSKI80OaTo5I3kaFnS42TjeLIhQOIOStiNSoRd+qlK2NoyReCYKyGYg6cvxZ05/lIN1lEKFYa3BYgtaNji4d7mwXBb7ET4VYKDSUkBi21qFRTlNJOETbb248JRznXBthIElmxSQVDNSIAoJxddHGvpMEAYYhxtHNe4KeNmlHaVySiVVioV63tGwqcu6VCnBIJsbmrVD9UrFC/cFB2mT91CqYVS6/iVnvJyQak0qxQWxayf8VTKeDrwlHGNMumMabSCdnudyxuj9GrtGOUEvvEDg8qOLFBxut64pqzyADc0lVCq4aK2ijesnqqEQ6MUIL7NAloqtFyfs1FkvgtWY46JdBIZIgIAVunY1qZixjEjUixqxmPUWMMrZYYohchlwUaCjFb9QwoxJ7nVstlFOvTKMJuWNrJmhh+EKopCFYZOEDjB2gnWTrSO2aZRDATfpg6RBI5vFDa58e/vlh6p2w3jEluBJd/E7d3aiyT5QOaqlqyHbCGV5QqGo5JCwSNVFkqlCTaPPNoa39glI+e/QsHj+7Q0aaVWSmWUipRKxY/VjSnGKjamU0KSgvzxHxKD+Pnz53/91399h4zdXXcA8d2lgJOiuZVZHE5iaEJVKhXq7ZIA2Gg02u02GEyNRgMZO/CRdDr94sWLw8NDSCsMh8Nnz56hMXl7extCxuAXgJn1KtQIw4uLi+l0ur+/r7Wu1Wps5AepCnAM06der3d5eWmMKZfL1WoVCEImk/nJT36ytbV1cXHx9OlTCB8zQwMyBV84kKahYjGfzymZCkAB2cLh4eFvf/vbq6srNMtorSmnkMvlABmDEYZgBQKskLn0fR+YOJBiRm/onAK3Doj5vXv3QMR2XXdra6vT6QAxAYMb9lCIBWFAP5vNIDsg6YqkBuOYBEAMPJrUTln8J6Qu7adx5fN5ABB4H6SUsAIn0kHWUqVSWa1Wx8fHZ2dnk8kESpSYJNvb2wcHBwBWdnd3P/zwQxhMDQaDTz75BOrDjOQk9C8ZCred68mm+zeBEqg5ILNuicGpTRsKkCKhtUpgBXKoCEPBqEKxBMsEuJWkYzhONgzB1dXEHKW1DmBWqWArtT7wlEkQRn6llKJpIbE5VhGAGktQAMUYShgz14XQAeYbdgDmvVjU1wxQa3jj1BeTELE+Hhl+GEURGgBbrRa2DpYlSENDtiBtjpnbKOEcrWKREytxpdQpZTcZLFK7Ezsb4Wx6LUr/N6agFp1B6pdZ1B4J5eORAQClSRGhDdwwdV3wjWDjuVqteNt4XtIDLelCLr3d31m81eKLWfpxVAcGwgXsDFMFeGWlUrl37x4033u93uHh4bfffgsI9U//9E+r1Sr253q9rpTK5/Mffvhho9E4Pz/HtrC1tbWzswMsFb6j4/EYiroYT8pkA99BMQ8bEXip0PHwPK9cLtfrdWzC1ElgzYATuFgsdjqddDp9fHwMmBUqxkopsH2RP+Cww29hI6WcOvjFg8GgXC6zCIF2gXQ63ev1cEiBL48dO5/PY5dgbQNFJrYIYKOAESsOFOAmSHcpVYyVgtNEQjMo2aJFFz0ihUJhOBxeXl5mMhmYuWMDxyTH1EVqjWeKSgzXFPb2MAx3dnY6nc729vbu7i7KtLlcrtVqLRaL09NTbI/wyoMsNU4i9JAS6EkiXJKV6f4fUGINfH+1XCqtXaXS6TT1B7HwJWeW2CgkfXDcY0x4twS+AfVSPFF2JEjLewlocnpI9mgSi5HbkfwhRFRgqIi7wj1wA5SymBIwlW8rK8GEVMiqxnkhc3XcKqnTKJZQL5LeeqhVoC6CXY6ZOes6UqyGmzPvmc4WKaEW/aoGGYZEeAnT4/4tNqUFx/MQJ8LL50Iky6I5W40axDWIS0o0lsVIfBY5BJbeMSVQGSQT27p+w7cHHACra+GeJ/GXpB66taVLNNl686QKcxJoTmo9cx0RocPgUIk12LwkQE/HaVRSaXYHWS2KuVu0QZ7OnquCIAiDIIqMo41ylfaUSivlKJVWKhMDxFp4x+lNq7obhSPCTSzYj/EaI/jCAIVJHIYZ3UKplbq2k0urdHbdKI632+NmfVHKq6yX0SajjKeUcj1VrkTbW2GpFLmuCkPt+yoIoiCA6IqTStmUBbNpS3gbfdjiyVrhK/6V0Safl/X0pZAgllvSLdmaURtUTaWM675GO0YrlfK8bCaTy+eRqZXLZawmTAMEmdVqtVar5fN5EA4gtTedTrERodgAvXjujazGERPktoyAgaU7rl/Zj5ikkcpGAUl7t8R/ZJcAwgZEcUJhX7lupLVWThioKIh0ELj+yl3NnGiiVUqppVJrBl6x1rAvxCXobEb1CR0TVG+0T7xNffhGJjDf/xXd3hgQxq+/eBRF0UZrQAzFWgRzC5qXlGGufYpycDPH2UfxByQdUu9YPk1pascPJS5P7oUE8VFkZcom/R7kE7fg6e8VlkQx/os//RgCNvH/1bF5HQ0JAQ1nxH71gwGI/+qv/uoOGbu77gDiu+sVLiYRHOyqlUoFEGqz2ex0Omx4TKVSDx48+PM///MgCEaj0XvvvQf2K23lTk9Pv/7662azWavVTk5Ojo6Ozs/P2+32Bx980G63kcoiF0WrMm9mPB4PBoP3338f2HEURUA5gbYg74LqkFJqMplQQQI26/BA2Nvb297ehvrk06dPyaJCJgyByNls5vt+sVg8ODhIp9PdbhdOevg5+4WfP39+fHx8eXlZr9c7nY7rusPhEOKYq9VqPB6zAE7gBsK+V1dXsFlA7zBFUXHaIddC2zI4ttVqFYwzKCvBTcv3/cVigWCIcBghOYpmkHxKUhiI0khOcLdSzom5HLqJ8SlkRlOzAuflcDiE3hO+lxKNgbgZQAbPnz+HrAeYsxCHevToEfzoGo3Gn/7pnx4cHAAb+vLLL3/3u98dHx9TKIAZpvSwSqrdJTOZtz3UmdpJAq8k/qjN9kkEzRTZQFBC1iGGQpoa4btjuADuxyA4SEkOo3bIqAEJwrPAk2UYhLyLY4JnxLSBWqsMvPhkAWoDtiZ+jc+SZDq8OSAeRkuIzBhpQRM2m816qZQSceFqvQbAR9hCOlyhqFOpVEqlUqPRQPlE0pOpZw3CNcJr9itImBg/IRwsablYVmwbV5u+c9LRHp376BIgLQUjr4SBMlut5UwAyIiOAWB5/KYkQEHBANIrKCcAMkbNDDOEa4dZjeyGY3Iil+eNQPD3NCCyNCWTb846hBxn3BJGL5fLNZtNYNxAKkEHTqVS7XZbCjoDVg6C4Ntvvz06OnJdd3d3t9VqbW1tbW9vn56eDgYDTD9mCPh1SsxLdWkCf7PZDOR0bNRIMqVQHcGaYrGIQqbruoPBAHoUTO3Ai2QpBUsGfSToBshmsxTlZxMGFs5iscBkm0wm6AjBN0VxwnVdrJrFYgHwF8uQlC7qw2AiwSgV9aHJZDIej8vlMqp0qGhiepfLZUn6xgEESN11Xfwi5nkmk4G0BUF/yZEnj5h7PlZxLpfrdDrvv/9+rVZDVxAmLcZkNBoB8YECcrVahRgxOwlkBcVq2pCdy7fhHd+XRyzEEHAyMjmUHEx8d1ChMaqomVG4WeIs7HiQkApLrclGWqtVXCJxJFpi87fYrwy6stlssVgELZ0tBUQfeD/4pthFsQooLWW5iuGuoDvPW8WXlbwwiWPShp5PkMxQudvzfnhLFueODrqMKwD0sDBG4i3Rebyt5FxbfTDSXIEWplbmT39jHvH0pktug9ziKKoDfArrnRsRASbsIQSLpbMrQQoJHlEtHfxwSwrzDenDOkZhLPqw1adi0fRuq69b2HGy2JBEIaXyCb0ZAI3RiZR6rPJiuwAVPJbLJZ1O8bBwpMruHEJFDFmVUr6v/SAIgxBvp5QxrjEpo1ylJINYJwAXCw5Tm939KsbdCAQnAWKAwgvx39ro0DhGaWOMMq4TlTKLTm14sN3f2Z7XqyqfzTs6r5RnjHZclc2ockWXy9rzdBQpCBBDkhutCLI5EtPVQoctPRC16ZSoNn0Uk0+cvyLHltzeZIuDLFRbPXbylq5Jl573GokJrXUmmy2Vy9VKpdFodDqdUqmEYxHZFrK2ZrMJptHV1dVsNhsOhzBllUc2wkXkpDgZpWea9ELkdyQ+yLDKKlhKsJu9HTe2HUiFFv4QZwfZFWzQjCJHa628yPOMUlqDUb50zEwpV6mSUgUIVceEYjdGh6O4pOHEwLEXG9mZTYa7uUWkOEkrvlGSWIqxaGWUASYchmFkIlGnMAzMLMcFFk0RTkjXWbldU81JTk4c0GRIsDLHuBT0FFqAJEXVMFdZVpGNUPhFqSxHgS+1qSXFHmVPKefdohFXGAxm4udlkYXD2GYwFBrTbvys3XfVp7+77q47gPju+v8BRoztmIxF9A4fHBwgetjd3d3a2mJ06zjOkydPdnd3P/30008//XRvbw8cWNd1F4sF+FPdbvfLL7+s1+vgJ6ZSqe3t7Q8++GA2m/393//9F1980W63q9UqOMgqbj9PpVLdbrdSqezt7bVarePjYybJOJ/K5TIyivF4rLV+7733Wq2WUur4+Hg+nz948KDdbg8Gg/F4XCgU/uiP/ujg4GA+nwNcC8Pw+fPnV1dXOBtms9nTp0/Pz89Balgul2AQg/AIR/uDg4MHDx7gtJvP58xMcLAhLJZ9x8hJFotFr9ebTCZhGOZyOSAgkIxAFgSqda1W297ertfrQBAajcZ4PB4Oh9PptFgsbm1tFYtF6rcSKQD/AsE3O3wxyMzZaE+PfAZwFQYQ1DOEiSjIj0ajyWRCSdnxeAzh4zAM5/P5ycmJ67rVahVubPg5Cvta66urq16v1+/3+/0+vmYYhp1O50/+5E+2t7cBoD948ODDDz8Ec7DX63388cd/8zd/c3JyAjQ5iVJJ6TSGGpJWbEXJ6m00KGS7qyTlSYlJiWWQk0hDM7YkY6XgQQNJodQsSN8gNoJYGhfDldUSiPiVkASjdiwlkAop4YoXExSW3hqySzeXy1WrVYi3pMTFvub5fA4TMILyJI7RFI6SxCDhSntfE0WLxeKq2zWxuxfoeJhyGFtgstCi4Zhj9oLzCK+tXC5HZJC3AfwUOxIdrkl45FoDXinBF7iQYaUwigU+goQWBHysCHYEUyIWCJ3kHmIA6QTIUBVDDZEZQMPj8djzvFarhRwGP8EzIsrJyhP6CVhogdDBcrmE/IIUxpGoh5WrvBtMTDydT0qJFmAm7Xxe3EmiKKrVarVaLQiCbrcbhiGU2Y0x6AxA90ClUsFEQr0QBp6DwWC9Xk+n08vLy1KptLu7W6/XT09Pu93ueDxGliWzXI42bgwcYcmBQmHj+PiY64t62VBpbzabqFFtbW0ZY/BBqF7A6wa6NygKgtLrui7I8qAvYTvlha0YGy91wDEt8UNyr/AXQsOE/7BRK6WQ3E6n0+FwOBqNer0eLP4kngKhYdao6vU6hO9R2MD8yeVyi8UCigrY/3lj3EPIj2buyi6Zer3OLgHcdqPRuH//fqvVwvBirR0fHz9//pynG4qvIFavVqt+v49qK0WobuxFxcjg6xCLJPD3/QOYVCqVz+UyuVw6Fk9H34zkgcpsH8U5NliQdEYpDL4YryTamDyekspI2PmJSiCaYucHZMeBHpIGJW+sUqmgZ4t6KQww5DfCL1JNHqtAAruUSsAj5q5IIRFZKyLZ2bIBkEAkjg84KLAjyjp98BVYwlSx3DzPFzRdEVCwbKCIieOeSbKWTGTZ5U3o1rKOxAsItLHhQwlrX4mRkRWL/RnPyPd9NJNRBRUdV6ipow2FwLHs3eGbs/3ouj7s+xDoeKuCnoxbrCUm2aN86G9SSrxNmtPClKWsHPr2aAYFZRvAN1huKJRarmg8hbEpYdzIIGZHneQ3EAyyNIjDyCG/wQmjUEWRNsozysQaxFJiIkq4yVnoWLj5r0HMDl4KZWEAcGullkrNlBorNVdqqZwwSjl+rrDO6MBzI61NOhM02+P724MHe8O9vXmz4RQKoetGWnvQonVdJ5X20mkg7DoMlVHKcRRL8uxZlCK/FJCRz13SKSwVXaJyNCPhpoG9yJKn5y6hhAoE+QFsMpPaO1b/BzeK1xAwtePU6/X9/f1Otbqzs4O8Bt02qA2Uy+VWq4VUCAWkfr9/cXFxdXUFgBhbHIjDhUIBzXAMrtSmsD4H0wp4GEFZEDCDf56SSXF8Un+4C0k9RnaNcAlgr9Baa2XClNGOm824taKzVVJXedPzjb9UwUhf1zM8QSMN4yKHI1QIMEU9oUcRbeLFQUIp+zYLO3ULm9h5tRiMgprcBofdamtj1K2EngNPgRtrUZTUx5ssl8trp5Y4XUUkw4gUJy/V8GSZmQtEin7wiZMCz9oAQrVktYznYxRFoVLvqEGMbYcgL5+p3nyNin+O/2tihzqjVPYOIL677gDiu+uHDRAjR0Kmhw5ZdhHiYJYsg2q1WqlUzs/PP/vss36/v7+/n8/nfd/vdruu6+7s7CwWC2gO0BoIzMrBYPDy5cterwc6Bk5r7PLg3wFHAOI2m83CMEQuh4BbhlMAcyuVynQ67fV6vV6v0+mAKTOdTl3XrdVqiDmQPsEs/urqCt/RdV0Y4k0mEwq/LpdL5ADg/P7oRz8ql8uQa5hOpzhvKBRIWV7k2GyaI0mQES2GLpvNIioC6azdbpfLZVDhcBwCKoI+Kd6QjkyITlTcU0OqGgAUmR0RK4HYBRlweLekAQuUPZlDoutZxU24UMlAxAn8xff9wWCAFPH09PTly5eTyQQHOeKqSqXy6NGjRqPx2WefpdPpDz/88L333oPj09nZ2e9///uPP/4YCbzVOmqFF5Ltm6TDyBjuzVEGWfxXm0JXbIqUupxgx7AqgDiVkCWp6+zUs7zXpKAbAm5mxYDM8J6cNoQF2Y2OG0AIVSwWOQ2o48YVCrUQUOzr9TpETq/bM4WasO/7IBuCEoh/wrtZHcFkGiZHOIqiIGaRS+IYMHEA5VC0YNoP2BSDLOljbMXFvKXSN7BjPA5SCQg2AXBhcytFw5kAICMFyY5jRdEMWg5yV6H0LaUnyCtkcEwoE1MC4CBsG6GcDmFxIm4WYxdPiukxEENkOODh9no97HjkPkt3PrXp3fFuyJqEzCz/ECnPapkyobA0HA4dx7m4uMAeC/5vrVbb29vL5/P4XoC9UEBCqezk5OTFixeoS4Fwen5+Xq1WKeDOJISUEOrAcGFyZmJKYDLAvA5zANUCPO5ms3lwcJDNZqfTKRpQAJ4C2YE2xdbWFrbQwWAArQnsSOQBofmjUqlA6ahSqUAbB9Ata5bcH6xudIwtei+oee26brPZLJfLREkwh3Fv0lwLSC4Vn3BeQA0JELasSpKhg4cIhjVKI+SrEoshCbRYLGL1sd2hXq+jqgRYk6M9Go2gmwyRqHv37qFIcHZ2hvOi1+sRT7doVpz5UtPgDxy9KAXd/2wu58S8flSYZDOE7L3AbkkirWwokSgkZhqOPIllWw3gksqHwxoILOphjARW8cU9hzOZvw4SMeTmATfgNRTq5TSjmTAerpSwt8AL65LS6rL+ZDlBsdzIxYhQhHrTUvABQ43PxbPGyLPGBntVrBRu/pZTn6x3MhyVtGXp4WmBaCphJyXLXVzUlDLjpsrSBe8Z57LUF2ZNEYcRe7ZYTqAsG2+MRwnFNNxUyvN9NNO8XbfHJv4r9TQsHrFsvboNHU56PVmEd1kC4baMJQP5LPLBaWbA7Zf1dUI/UgYEC4EdPASIpXIxWfYW0KxijQ5wG4MwDKMwNNEr9znnJpDlNY32/L8A0QAQr2MesdQgXsf04YlSU6V8lUoH5fy8WZ5WCvNMxne08lJhrTHfaU9bjVW9FlYrplCIXC/AjeP+tOM4msoX2nGUI0i7zIN4CktxVakczc2KZQlL0VVyDiTfky4aN7oRygUo9wTZ+IWbTNoYvL5D33GcVqv14P79aj5fr9fz+TxqSJVKBcFbpVKp1+tQcFosFpPJpN/vg+XDiixGCW1nrG9xY5dSy2xckLsltcUdweKXAgjsrZFUbmuhYZlj/vP7cg/kjGUkaYxxtPYDrYwu5NRuJ/roURDq4GlX9yI9mmoDGmk6ViQATTgV66K4sYitE4OJziYEzBpGcBOVWG2iw+r21cFt09Ha0Y7jOjri3mAZvcpahVW6uBEXtmYXmV5S5Fqy1/GpaXExi8EZxEACwbM876ySrby3ZIJJpTts6e8uMaGVysbEYRM/siCGjEPB/vZihRBHyBOHSuXuAOK76w4gvrt+kBdOPvATVextwnY51EWT2oLYaiuVCtqNlVI44xGL5HK5IAhOTk6QxiO5BTqJyABMColUgh28u7ubyWTYYTQajeBBR+t5YJ2IcsrlMkG3VCo1m81OT0/39vay2SxoxQgvYFlTqVSUUsCR+/0+olKw+cioRRqAnxP27XQ6xpijo6PT01N6TFGjOZPJ4MU8utB1rmIxRIyhMaZWqxWLRWJDCIPQzgzPIpC/6NqHfvZCodBsNlkDl3AAczCYCKGfEVRlEM2ohkzAgrAX3S2okTqfz4GDwIGKNMPd3V0GoMA7lstlr9cDlgfmGnlhEKfudDphGHa73Ww2+9577+3u7pZKpdVq9e233/7qV7/63e9+h9rDaxzPrfRG0p2SfcqW9MTb4mXqtYZ4VkgkIdQb+++S0q7yfSTYJ23Tk/2D8p0ZsErlRPIdmDaw3MKmaTxZSwdTxVreRCeJ/iet21/xyKLI3AI1SvsI6XaSbMeTZJMbLe+l3plMV2SEeqMxN9MhicYS15AqlsgQpIqxlSnJEaYCGmEmfiKxBjmMslsz+e2sNk/5lOmeZ4li/5/Y7TFVSCyyCGVWWs7fGo1GH3/8MTbAQqGAbQr9HBheaONks1mgmeD+TKdT7JzSWevy8hL0aktdjquD0Cd9ijDgKGYgk8Q/oSABOYVUKlWr1T744IN79+6hcwXM3MePH9+/f79Wq0EJ/b333vvggw8gg1gulyeTydXV1dHR0XA4BCuQOsi1Wu2nP/1pqVQCzD2dToEBIaskJZY1S0i1sL0AGwWEksfj8XK5LJVKDx48aDQaw+Gw2+3imKDN42Kx6Ha7/X6fEp+sE0yn07Ozs/Pzc9RQpZsfziC40l1eXi4WC9ZIoJuBcxCHOOYYIGYULPP5PFQp8G7Y1ZVSxWIR7/DjH/8YNUtUbvBZhUKBnK/z8/PDw0McsvzuMseWnFxLWfsPNauvqUCep2I8RXLBeHxI6BPVL4mXyVRT7lrSKv01oJvV/yH3QMvFi16a8miThwt9ddg5S1ayTH0RYDD2sBheyW1EHlIsgkrPJenxqBKuZTwLWJW0NA0ItUiYj98IwAq0RK0JIHd7KRstvbakgIOEMqUaj0zy5QFtwT3C98yVPRk07sNNYrZjTCgun6wKSJQk2fPxSkk5lfKUcp23sKu/ZvFtUoOtWMVSIUgqcb2mTP6ag8Z6Z1RVYYYJVrVcQVSsZrUAl9QUZgeDLELI7nXpuGgRnK+7EOKHG0VRGEFoIjLSG8HqrI82pVrtkY3/Qg4m9YUD8bsSIF4ovVQmUvnSul2b7m0P2o1xsbjU2jiOzhf8ZmtVKppM2nNcT2uXx/41jGRMZIzW1/ZlWmkZFN0YKiT3FqtIbOGh1lJVwlOOm7CMUuQ6shaLBO6TiyWpW/2aie04TqvdfvDwYUapQj6PU0ZrXSwWcYaScgEGD5yuUWOWHR6sk7H8b/me3TafbyxBWZakjJllT4MMmCluzk4L1oP55lQfeiXgbnQQaEerQt7c3w9db50tuc63OjjzJgMV+kqllMoqFcU6EkqpTIwIezFe7AptYiMkJpT4v+EmRmxE8SNK8I4tNr1RyugYpfVSbqR05Loh5X3kcZYs3kgtcll2smbsbeemlDqRKLycpTwESVjh7so4X855y8NG0j7kbTNioSzSu1zp2JVuHT8y0MCX8ZMF3L9WKqWUr1Q2fkyeUr5S6R+cSd3ddXfdAcR3lyIOgiY4iD9aoQOKbM4tx3+r1frRj36E8Prg4ODx48fPnj1DI161Wh2NRpeXlxcXF/RSA3wJFg83erKcyuXygwcPqtXq5eXlycmJ1rrX66G1FveAX0RnNzhQVN198OABhBc//vjjBw8eAKdAMMTTPZ1O7+/vQ1kSXfa9Xg+nEVlO0P9FAFGtVpvN5uPHj588efLs2bNf//rXYEuBXQUaV7FYpGs5Tiy2ZcFriMQufAXICw6Hw8lk0u12B4MBdTPwJsijUqkUcJbVagWDe4AIBKBBF+WRCXIcgjmKXZIGztiFiRbuGWJwIINQxRUfB2pYGIblcpkuZGzsAtI9HA4huwGsJ5VKVatVyHqAnfrkyZOf//znkLOcTqeffvrp3/7t337xxRfku1nxhNWcaDnMWLa5VhL75lCCRGaZmlq4mNTABR2P5iqgDJNHIB14AalLtpeVy3HCs/FWoo0Ix2UEA0M5JQSaGSrJLio8YqJ+mHX4IrTeAm8dIBG+AoMnkHpoykfmCJMT3/e17zMXw/+48UcQJoMmNYiiWNGYiihREKxRcReY5KoguATXDLdtsQys1+PFsgTC98Eyke3DSgiJSOwbj4m5kNS6IcomuaWW/Qsp3pD1gG6sZWBCeQreA5+7/FJYwuQsW/bZN1LA3tmkjtK0FjKVFPiWi246nY7HY/iFwk+mWq3ev38/CAJsYoALi8Vit9sdDoeAGkETlvrdEsVASYzflGE9df1kNsJ/pRAEpjo693FytVqtx48f7+zsoF44Ho9PTk4ePXp0//59VByLxeL9+/e3t7chKo3PUkpR3AOPGMjpzs7ORx99VKlULi8vz8/PlVKwEp1Op0kqCngooNphziCnLZVKECKHs2Wr1Wq1WjCxxAmF1BSdHN9+++0XX3wB4QgcLhD2OTs76/V6o9EIJTpoAeEFYMJms9nRaHR+fk41GxXzapVSUFKWD5pejmiXwU9AhAfiXCqVMP4PHz7M5/Oj0ejk5OT09BRrvFQq4Vmj4YaPhpPfog5xO323to83LPRprU1iD5foZ/KIYcZ7Y+HQourfdsPJ0uBrFGBvNAS7EdKVyLVcBbfdSZIQKo8nC4FKgoyW7KmFKUuTPSnQlCzuyndIqtlab37b4Fhvcmv3+k3dRdbb3viNbsQpXmPgad2PhQ5bXzzp7fY9PUVvC3UkHCyV5a1C72ugYYsyfFvIhM4MaEYR1yOpQjbxYOum3g4LaSzbEAiWxyhrJ9JyMOGh6jja4cIOwwj06ldU32iT+Stb7KOEDKu5RWh4pZS/+U8rpRZKr5UTGtcxXiZqNuZ7O+MH9wfbW8NKeaG0MZHrebpQNLmcq5Tj+6mlTrnu9f3i87Q2jhMqZbQGku5YMi9KOC6yrEIk/ca1KaeWPFXlmrUkO9Sm+gc/C0URFQvp4DiQfQl88xu4oq8FuBzHadTr+3t74XweBAHo+ZxRFB8Yj8dQtDs/Px8OhzidKVODLjcEbPxGcmdLTnK5qCVATL4q4zRaRzBslvse4hOEgjeWN1jBotWtFEcOI6UcncmGO/l1taZTeae3dI57rp4pNRf4oKcUSA6hAIjDGDiWXNRoEyCOxPwPN8sbkSAXBwkcedPjztHaczzPi7xUpJ0o5YWe5zqO6zgRGwKSIaiUiUfsIR+HJQqUZB/LzE62+1D/TZ7g1rYgBU/4d8rUUN2LoX6S+yLVVMIwdIxR7xCTRPFjup7uSgUxKBzEbGL8axD71LmiahXc0v1wd91ddwDx3fVDAIiBStD7G/lqqVTa29sDIUtKp7F2BwpSNpsF5ru3t/eXf/mX9+/fv7i4AC5Ac6fT01O8JpvNjsfjFy9eQKIU4UIYhqVSCZ+LLtcoinq9HmFHpMRQqwSziXgQ0JbpdIpbffr06ccff3x+fh5F0b179z744INarQaaMO52Z2en1WohOBiPx0dHR5Ch5AkURRECEa319vb2gwcP6vU6Go0zmcz5+fnvfve7wWBAfBZ9oHC8oUIuQmp833K5rLWGRO96vW42m9VqdbFY9Pt9YBau6+Zyufl8DjFHWDGgixOk4G63CzQEXxzvs1qtAEjx8WEo4IyklBoMBmdnZ+PxGP1cFEDAmNNgGgoS8HEi0kG7GDQPwq0F3YVAMAuFwmq1ury8xAuAcd+7d29vb+/HP/5xLpdDF/k/+Sf/ZH9/fzqdnpycfPbZZ//tv/233/72t7PZjIIGFtSb/LuVepHERIDm9bmNnU9uCl/K97RM6iltRgmI+XyOEBb619lsFkEMlNHQIQ5shYaNiCNZJKCZIUasWCyCDIhpQ40I5Fr4UBKX8FlUopR2MXy40IGhHJgsoc/n8/l8DvyLjc/kktONCl+KPwF0FYbhdD5PjUavwB3EbTHrk6UFcDkh54IPguoCOImMFzFjgZwy1MY9kwtv0caxXQCKgmLMYrGAPjLGE6osYExjuiJHxahCNpoxLpAvisehNxafomK9HUScUjqWOi14B353tBqgTRLIHb4jRHUgaIs6DR4N3hxPFugeZhE+/fnz5ygOkRmRpNh/H+plEu2iagfnUnLFMYzGt4ZgLuTmPc+D5SY05VutVjqdBppMpiHrHHQiAkFPgnecXVh9GEPMB8LrmBKz2QxqReC0Qox+a2ur1Wrdu3fv0aNHuIdsNnt5eQkEk/yXbrf76aefXl1dVSoVrTXl6be3txuNBnpWIPzSarV2dnZg7Vgulzudzmq1gmIS0mYuRkC9GB/MNKq+ovJ3cXExGo341VBsWy6XFxcXWut8Pr+9vY02i+3t7VKpdHp6ihvDEQwE/PLyEuRicqshxYhBQ9VHCkqA2I5aFKUMOHOAp/MsUEqh5prP5+EtWavVIKwEHXmUTqGgghrnZDL55ptvPvvss7OzM3wjKkdLfJbNDZKdalH1/7DseMJS0r7G6kFhPq9i1V2pEYHhYt6IzZAa6LIqhklLrAF1O/oUSQM67v+UOLfQXlYWLf4yPXa4NknjJYLDDgZJvURAlc/nMYexvbDJV644/BZ7SijpwGIeEBy8THqKStN5q7GDjfNUgSSB1AKqCNaoTecoHr7EpNguRgUkvpgmwFKNQUqWy5vkIBAOIw0WS6NQKKC6TwEK9gRIi1cJcCS9rdh0xXF4B3UVAyOzm5B9Sd+T8H3SZeE2CN6Ce25D94j8FgqFcrlcLpfpSYs9h/sMpYqlp4IswLCqSmM6qeKFWSctp+QXdx3X0ddQijHKSDRHQl0q0W4fbnInrV+RAsRrpRZCYoLA8VK5flRIB8WCX66uHz0cPbw/PjgYtzuTUmmltIlCL4o8x0m7Xsoob732ACpqHQpAKnKcgFCQ5MtbLo6YTsjCECow9rBKXCz00gaQWJsMlTl7WcmTbAN2M6CXhaiZxelWQuFEQn5RFEHC/LbZ7WhdLpUazeas3+/3ejivQcSp1+sorC6XyxcvXlxdXZ2cnKBZh200nH6IVxGzsalLJdzzvrPaxKY0BqXwLQDbQML0eD03CgwFxgR7BYkFDM4pjxMPjvH9IIqClBcUi2G5HE2WTqPkZUxKT5QaK5WJ5ycd6tYCIPaF11lKAIuR8FeUVRAJ/uLd/Fg7JVDKVyoQ/5lXf9eRcpT2IBaUMo4TpdKh56U8z42iV4sR+6Flb8gZKP05OP7SkVVWLpMC9/IhStvGJEXA6qqUYSpp3RSMwuGFh8IwQDrGX2tARRF20rcOO/x4qD2hGU2CcDZ+gRczi9dxJcDEuP8dOnx33QHEd9cP86L6JNNy7KqtVmt3d/fevXvNZhPZhcWSAKYMdhKoWD/5yU8ePnz48uXL//gf/+PLly/v3btXq9VmsxmIuuw4Wy6X5XIZpFccukx0Je+JXUj4OMBq2OjRWUxPLRwGxWJxf3//5OTkt7/9bb/fr9fr5A4jbwecBCApl8ttbW1Vq9XT01Pa6CFPZsc6nI7AiMxms81mE+QyvCeUTOFkAvEsvDPCO0hGwAsIGNZkMpFet4gw4OZMXvB6vQYpbDgcUjIYyp6U7qK4J5DHIAgIo5BQDKCKYDHhMM/zAJdDg4JEPMReDDFZJF+tVoBLYE6COFXF3fT0rwcz+vHjx9vb20iu6vX6/fv3O50OkIjxePzFF18cHh6CWMeoVFKlZBjB/JNRqVVAthqW35xndmMhWm1adkixKpkqI/IAL5IdZ2AfAKys1+twoKJyFugJeI4YCoCzLCcwHQIxE4AsUScS2zF7ZbEdVAVAzMhm6fwDwEiawEwmE6xT5mx4T4nTSagin89TcxCwb2oyiQSDGGmeFNnARKXkCNkfmySg62IGkxB2LwJCwrpGGIeeBiwZjCG+PunJNE+jvyJD0lwuhwVYKBSAThIipGwxieEcDdIWCLLLLAgrFEsJwwvGBBYsnh1TZaAMVJtlJqNiDWiYgFGzGPrjaGq2FoKkqH9/0iWH3ZIstNIntWkMIjVJVaxyjgeBL863ymazkKnBMmGhi+ihlS1Iq2uZ3MryjGxhBjxNqR/YoFer1f39/Xv37rXbbRQsx+PxbDYrFApoQIH2q9Yaekez2azdbrO8h2pou91utVqj0QgtL5DMPj8/x64OLQVAvQRBpA4GPBKpNYy6kTHm8vLy7OwMKDM2cAC+2Foh3RuGYaPR2NvbazabSqlisXh8fHx0dIR9JpPJbG1tjcfjwWBAp2/sivh1IAhAcuU8wSaDbQE1OT56zDpJBcK/FgoF+NR5ngfruZOTk263i4YS6iOdnZ395je/+cd//Efk8+ickBaONzpoMbW7UQX1+1xOPJlcY5TAVbknSM1KFfuhEQ6gtAtnICVooB9F4VRH9Llb2tk8PihZS6NFTmkC6HI1cbdkj7OlmUixcq5Zwmrk96E2zE1SxfrX5XIZR5KEpInYShkQqTfKChm2U9SVJWuPGCv7KqT2gqRASk8t4k0UXuBnWYxvfi649pjJmGaEjfgR2JHYBGOtAn5NbjX8dXJXWf9D0Y7y0FTxoj8qIW98ogVGy/0Z94aTS0OG4N1kLhMcbYmzvIaq/JrmqiTJ+ka2suSJS8NDjI90bUX8j8hBdiRIIXt+FqpZ7LqTes3clKTky3XQobV2lePgyNCOo5WjldKvkF/JILZolZZtndrsu/djHG0VyxDTMWyp1FLptUrpqFJcb9UXne3548eTvd1FuxNUqjqbdbQ2UehEkRsZTylXGScMVRiSxkycPZCYl9yFEBTJDIsLEJ2FOIO4ZiV5kzgp/0k+NUtWiyVegsJSEwY9kVwmvB+rGiSnx/V3CYKUWH3J2ea4bsrztFJQnUIZBg1AqVRqPp/Dcvb4+Pji4mIwGOAMJbbIfjtW4NSm1lyyh8CqqfBb0J73VeEh3meQYXGcmaEwJ5JqYMTWpew7t2jue2EYKrVar4Mw8oNQOUaFfjpah9HSqIVSc8E2TcXOZmEsXwt4Jr35cyWnlcCIzU1TPUqAwoEgEUv94ggy2a7rGu1o141Sno+oWZJ/ZTEPwTytAhH2E0zg7iTLGMmNSyo4Wwldsn2HmTKP4GT7qeWuSR1IquSzFijrH5a221vuz7F2REqpVQzlp2JaMSw0dcz+VkpllUL3JtjEOaVGdxITd9cdQHx3/VAv7PuI7Ywx4LsBPEIGjr7vZHAJfAQHKnAZOLpUKpVnz55B1hZZBwAF4AWwx0HuBFxpOp2C0pXL5Wq1GtxvcEtAURGj4+IRRSYO7NQGgwHAgp2dHVjYI1VD3j6fz6+uriB0BVofvMIrlQpQOZw9yIUAOVWrVdd1kSeT20hZALw5UGBCfuBWkDsMAGi9XoOATIMjVMIRVUyn09FohGQP+RLAPt4M4mypweo4DkQbQF6mNhbeB0IQ4KgSuWNOLhu3KVAgK8MyNSWyBmAO6DBAUliZI9mrVCoHBwedTgdjnk6nd3Z29vb2SG2eTqcvX76EyZXkvMgoAR9qBX+3ddmrTRnit8q2lJAd5EckW+csWwPEQxgBQAbUzKLdQaPRqFQqdONlzMEUmuEjiivoJefXB9bMFBQK1DKdZnbNB4cHRC81lh8Y0wOnAyjGMIhG9oyNZEaRSqXK5TJ77gaDwXKxiGLYl7EaAjXeHsTKJ5PJcrkELxLRP8ZHxVKGUNJkpiQZTzSyk6QAgICAUMkcwVtRoBYtCJjVuCsIJvJxg+ApwSkVK97K8STsKClsRJpUrM+OxACSHel0GooB4IpijXA7Bc6OcSb2MZlMIMILnA6KrqAWso1Rmsy8ST7/VvNfapvKGiETJ/7JGoBkbXDHiKKo2+1iy0XZDDAWBg2A5mKxkI2upB8S1pc+1FJBhdZepBDSMhtuosB21+t1uVwGeRlrB/JEg8FgtVphP4TjHOBszMlOp4POkiAI8vn8arU6OzubTqfvv/9+rVaD+ep4PD4+PkZCWywWMW+Hw2G/30efNY4wbK3IQPCsUdfBsXV+ft7v94vFYrPZZKsBGNY4egBkn52dQdIXXwRNJ0ikLy4utra2dnZ2lsvl6ekpjmaCj2TrEyCTzBopEUs70/V6jTMInCm4CLiue3FxsVwut7a20HZzdXU1n89HoxFOVQwgSPFRFD19+vTv//7vv/rqKz92quQjprm5En3TsvYg6YF/KM+6V6K/m7KbalNlHpONXFqWRqQEoVx6kWiSSCaQMguVhxoWApUNmZfyhOXOIwFNnPvYlmXRlPutbCmQRVwlBGpkmp1KpSqVCtqM2B3MuIXsfmbXEr2V+u9iaK+7K3ARBASARUiFW5kcGd4VG2J4t3gr4tSEbHCkAm1kyzYLUVZnA5bhjb1BckOzmLP0dSCBGmuZHFg+HQpDAR5lW4kSKsNysmFq4by7HiulVAwbvR04vAnJybDH+lPWD2T4kRQwsSCY5DJMSmPJIM0qk9C+FboBdK678Rth+qHaJEnZCGP4RMjsfnXzWmmlgQ+7r+5Bv4LJTEI+wtKRkF9RYsd+jAuvbwKIZ0oFys2ZSnm9szt/+GD86PG02VgXijqVTjmOA5RRO66OPGPcKNJQwIgiCyB+ZavIyYwZwqCINQ9i8WhV4fYipcakwTI3BMZOcm+hgyI/nVkAPhGQGQmhMingjL0RHQ6CIDJGbZZnbo6647IKujkRnuHrIze8uLg4OTm5urrCnUiRMet+WJxQCX0YWSyxdh5OVNkyxddTbQk7EjdDLn+2VljRL7dQqqzQVBlBfhCE67Xy/WCxNErp6TRYTIw/UWam1Co2K/OUysUytU7MKo1i7dp1jBHfqJdiNkW3pUKx5BQHm7or8sWR0gaLSzuOi4fluNCX2DAakdg3S5JQlieZ2lJFl9mltNOUx5xFFiYuLzXlZS3K6m+QDoGWJwqeBR4Hqws0JIc23fWGA+/IdyjgZeMKk1KqrNRcKU+puVKZePyhR5zbfKxujP4DWb4jEd9ddwDx3fXDRIeR3CIcRyoIotZnn32GYO6jjz6CvKYlPAfRhtVq1e12K5UKeHCFQqHT6aCBFz5myCL6/X6/35/NZltbW8hPkA4dHR31er3333+/WCxC1/Lbb78FTIMe7fF4XCwWgbuhSIvoHOZ1pMqenZ2h3funP/0pK+FgRaVSqePj4xcvXuzu7sKWHXhWp9NBYz7eAVgA85ZarQZSJPBQlJdZDkWyDTYZQhyePTjbGo1GqVQCZJDP540xk8mEdt6LxQIffXZ2Bnc4sH0xvJCheBWERRF6qxeLBdA9IBd4E0Tn8/m82+26rru9vQ0UBvBTGIbojJbKtgR/wZehpTvGlsKgeOg4myeTCdB23/e73e7R0RGkPMrl8qNHj372s59BEtr3/Var9eGHH967dw8M5dls9uLFi6+//nowGJCVKTk+0n/GCnCTAYdMXazg4K3yLqk1IVvtJFoq3x9sIBgk8ikjNaWJeS6XQ0lDdryS9I0CA/1bAAHTdgOQGWyaIQkHTrGMn9hoLBWlKXsKIykZ97P6slgs2HIOnI5YPFzsJFwILelGo0Fo1Y7MEITFljtkTOMbgRuLoUDKR/4ppBhAo5am5xKoZQ5Avq3v+1hH2EZAPME7M0/gYmeSjxUHtia/Ph4BVLZZjyFlDwkb9R/ouiPhLTbDgpTKd4PYC24AD4W0Fyl7DQXbfr+PhYwtF6sMsjyIWYlNW/Kjlr/2O1wM9C2dU6s9mctQKj9IuUMknCCuYhrfu3cPoC1qZpj5yJegI0RpEZBNyP6jHybYgtA6wLNDewQZfOzJxUzDXYF4G0XRaDQChvvZZ58Nh0PMXihRcL55nre9vf3Tn/60WCyenJxcXl42Go31ev3s2bOvvvoqCILHjx9XKhWIIUJPBqom7XYbUD4sQKmsje/FZwQsFR0eo9Ho7OwsiqJOp4M5X6vVANhNp9N8Po8CpFJqPB5DBLlareIdptMpzMcgW9FqtebzebvdRlEQ9QnObUs2RHbQA4mz3MYxqwuFwtbWFtQtwDa9vLwkvoObh6jxeDzu9XpBEHQ6nWw2e3Jy8vnnn3/zzTdyt8E5ZSFKFl0OD87q8P0DXGCoAbWMM3nLsU3KawLUJkFeNrFyG5HgFJvBZf+sBCDkAYSJQThYyguwvEoittxycawTeLUqo5YnqiwDAEkhi9/qxEK8QTSEtF+piCV7wuT2a9lY4QiTNU7eKr06AUxL9NkSQQbsRYUuYr7yXEZWD0IfBsTqXOYbUjEf+wxBSVk9JbgjVeYtoWrK7iMoxZ7Dqh6+NRv/2ThF3qs0Z5OBDRutMFdM7GP8VsG53sRtk4itnJCyNVviL0l02FqeSYtaWds2t1xs5QYajioFbcQ4w2WTCv4JcQJBUgwRznSWBjewP9n3FSPErna0VhpSE2ZTRMJsYmGvYRCTRMk/g/jXg2t9CRUonVGFQtTurO4dzPfvLUuFQDlOGGaMUcboWL0MKqY4poMgCKMoVJumGphm+IL4ytiOCMuiAkGnSs4oQsNSV0FWj9guKbvuJOhMHwVE+OxmIIOYj4nCF9S+uNGE+To9CUOzXvuxTtd39qqilYfddZgwYRhOp1PakqPj87Y5L6nNtxU5knLJr3kfrl/5fZVQvCFuLgtdEs2UJG5pPqG19rylUvCBj6LIWSzCxSxaz5RZxsUJWiNKnFfHrGH5H6euNc9VQlM4SZNXmy+zKyj6uvoS2ypq7TqOq7UjN0me4yp2ZyE3RXKNbywpSRlrJ9FLweCWZV3+XYqekedh9Z8xhuetyi4cFl0oPKViuRtsU+q7dLRfd4UxB9yJ5SOoGgGhCZDEo5huDA1i0Ie9eJ+5u+6uO4D47voBXuijRMje6/UQ6IMGeHl5+emnn45GI1IjrZ0dod5yufz000+BCaLRjCwSaDJks1moSqFdHfgmopkoil6+fAnJ4FKpRKogCI/FYnE6nRYKhXa7DYbseDzmXu95XrPZHA6H7ArHC0CZOTg4QPiFnG04HF5cXABxAxRLzAKgNuJaoF3D4RAMuPl83uv1wCBGILVYLABbAExHvMUKKk8g+CM1Gg2gAMjzqU6rlIK0seM4+KB0Oo13Y98lUGxQyRAygnYBQWTSWgHXAulDVzV6fqGAWS6Xqd/KZij8HfEZ7ftw6nueN5lM+v0+nlcqlWo0GvjW1DSAZdOzZ89ms1mxWKzVauAOA8srFAq1Wm1ra6tcLodhOBwOP/nkk48//vji4gLwPVuzJf1BCVkJCzuwNPJk4Ms49U3hBqHZJwOO23zAJIELvDBLHc9iN0hM2dLBYKyDpBevYQe0ivUorE5nviFHjKAq1WAkncqSy2A+JiMtdbvtjwSXMWmvOT6uu+FSHf/EsuEGho7y0nf6AiUjRY6kJSUp8Qu+UjKviZIAdKBkML47NePIjyMiQLtkqYNGvonUFSHqRDgb+yQyAToBWhk4v5GMcS2OMDmMJK1IEZXbih/fpzGfVip8Z7mxW8YgspzDWUEWJN4BiBhOjdlshl1ud3e3Xq+v1+vnz59fXFygkADYN5VK7e3tdTqdIAjAsZW0cQwC8bJyudxsNoG30kY1nU6Xy2VQbrEZQjAX3GHHcZrNJsqNnU5nf3+/VCodHR1BPtgYMxgMWMkAsgYuzPPnzyeTCSBj4LPYnKFOmM/nDw4OgDgTNGSpidm77PPF/r+7u0vqCu4TCkLsxcY+sF6vr66uLi4uVqtVoVCoVCrL5RKlRODvV1dXp6enZ2dnFO6guywFEGhtJHFPnCn4FdwYzjU0/aCTplAooPNmMBg8f/788PAQ4kK4k1Kp1O/3tdYnJyez2ezk5ARdMqBLS34WM/Ok8KvcnSTc8P1jGDfu4UANjcUAVtGIZ9FIE0Q2bBqEDmlSL92HQJXizCf2x3XNd2CVEUcn0HmprAWVT3RlqU2ZI8pnSUYz/5VWt3KLoAACKzFyK+b2xQUl8T5LW0ZtupyRKIc/qXdMhi/bO3Doo1ZB+dRcLof6GR4BjzweYUC+WLOU+xLZXkSHlRCskEeeRFHx9bl7Y4tg5RL3RudVvFLuYEp06GPnoU0CAThpO8yVTh0JXDzZOVAbZRvPc9+mLoIVom8R0bLiEOugUTdJRlhTjgDujSRidQswzf+LNUIyLAqicgSkSKjsIqeeCdtW+GRhOSvhpOvPjQWHMSQIuLTjvI55RzZxlNAgvhE+jhKvDGNuYKhM6HieKpWDVnvdaa3TmWi5dBZLx/ddhRXjaK1VFEF3OLw20gtDOebgCmBpQJ9KdlfIZnyGNJioWBFyscj35OyVqghKqLFxgaD7DbfByr3UY+WCAr5JNwgZ5Uqdh4iFI+F48Zo5ZE3L6KbLMhZWm/IpSYe915wgUnAjGTglbTZfz7i3hDtUwoz0tqAX/3s9keM15DjGOPpaIkVv4rZ6cw5/52VuebH5rl+J14KBrvfGt1ZKmaRejTUUVribbEFIVjpvtGa1fnjjXpQ0rUle1gKxZsuNb3h96r1zxdqP9YUdpVaxqLQTw8EAgtMxcVjHSLEntKT9O4mJu+sOIL67fpCX7K2eTCZEoHK53Gw2A4G33+/DdC6JxC0Wi9PT04uLi3v37skIA8w4pEPIqJmiQMgCfVVkpw4GA6T67Xb7vffe6/f72Wy2VqshxLeyUBK7QA0DcIm4czKZQHqvWq2CjABvMZBt0dmENwGzGI3GiIdI98NXQFIEEKFSqbTbbd/3m80mkmQWOckIsBqOoPYLhi9zJ1DDwjC8d+/ewcEBBJrh+ITfRRMWCIlMXAGOEIPL5/OE4VCTR9zJkDoMw/l8jkEDrZtoFKJw0ieZ+eBfkUcBOEOYiOZx4OyUCAC8AgL19vZ2s9lkbIpfISQxGo0ODw9fvnwJZqUlMSGjAWKvkhpgWcwnscK3hcyYezCHkYEFk2oL0QiCYDweg5YIWJ9pf6FQQLM2RRvoa0eLOWaYQDBzuRwRRiV89ijbRyIb/gnEHGIHjODxjFQseYHMnENEsy8+YlYvLBYYcgbJFAZFEc8d7MJULvcKtNU6E8sF4rMwvUF1VEpNp1NwPKlOgw/yfZ8LR/oOM1+lPRQHQaqa0mJOCX9k5udg/oLbi/KGhDslMZZ4AVpigdPJHYY4Ah79Or5oAkaqL5AIZHrSEYtzknCDtFrCMyU4RSVZybaWM1/mJN9TtpXtqHIOyGnP7dFi2UhaMV8v1whAN2z1SqlWqwWRje3tbXwoNBZc1200Gvfv34e+LQ2vMD1IaCLmhXlODj4FWF3XvX///p/8yZ8Mh8Orq6tyuYyqgOd5u7u71Wq12Wzu7OxA1ffy8rLb7cJbMoqi4XDIgsF8Pg+CAIj2cDg8Pj6+urrCaUIBh0KhMBqN8vn87u5uPp8fDAbD4VASvdFlD3C8XC6Dzg+cen9/v1arEVDu9XrQbiIJHfsw0N7FYjEcDrXW7XZ7uVw+e/ZsMBhgfCDHj6MEezsmnkSygGNSZFyqo+BRgiAMKZjZbDYajTKZDMqH2LrH4/HHH38MCRQ0sjSbTcCds9kMhUPIyEhWkdq0Bbfw4mTPO2agNcm/ZwxzvWcKjxpZW5IgFzjaJJwSyJY1J0tLlzxWC5RUwtGIp5JFKcXWTVkVubIkE1YqOVjohhTBlzcgkTiaI/GjHcdBRYTcQNIDqfSaPDo5RNK9TR7HLLyRjIy9lCU0nBqAjPEVcD9EgXEiYPxlqzu5wxT/JUhNsFV2wUtnJFmKICJG+jz2VbAZMIx8IpIGSJCOpkYEgtkWxn+SMrJwIMCDTrZAXd+h4zhvr3Spb7LwfU3l9Q2hltugsWRw9Z3Y8W23ZKHJyZVo6YFYouQ3fV/hShfDL/+nrgRD0xiltXFc47rGdY3jGoSxCt351zeD7nz9nTh7cgSswnAS+boRuEziXFY3yW0AX5KSmSwAfIdkxBvPENTk5osF4iX02CmlJpPJxcUFDp3RaIQiMXIHaHNJn0w0jVEcHBUmlN8sKwUprM+tUg6p1EZXCfUPqtkQcJe6z1zRFrgpgyL6c+CwDsNIa9fz0p4XRVE6m3OrVdPZCqZjN1yoUKu15yxc7fuOWijlxXrEZpPkHgpjOotBrASynCyEWGWPpBJLpFSgorXy1yrwTRCGiFLDuMhMiRKMv1zFjHhv6z+QnXNJTjF7yFRs8SrryuSBSdeKJATPugW3a/wdIS4zekYFUp2JXRcoBrnfp6sJIh7woINwBLSJA6XSMehPnzqoiKSVWimVi+Um7q676w4gvrt+aBd7e4k5QhyzWq2iao3dltrw8gJYGUURZCgpTlSv11utVhAEyN4nkwm8j8E3QdrZbDaRlHY6nclk8vTp00wms7Oz8+DBg7/4i7/46quvIGU7m82eP39+cnICVjKb9IFhnZ+fB0GA/Ha5XI5Go16v1263G41GJpMBCXc2m8Hep16vt9ttIqSAPtHuDUBcxQYOiPiBcMF5rNlstlotdIiv1+vLy0uo0AIIRtZEGAjyFNCpBMTGzkRA1ZlMZm9v78GDBxcXF8PhcDgcQhGCcoHgr4GdhzdBHzeF+Qjfk9aK4V2tVo1GA7K/gMlorIecnM+IKRYhMBW39mACWKRCNI8DrAFABnQY3nTAvACAsqd1sVgcHh7+7ne/Ozo6wjfCgS07RlXCWUJtto9Zwa4k56qENt93ZC/x62/smrwxz2FIMZ/PJ5NJqVRC/ylSWWAuUJrmt2YBg92piF2IF0PjjD45JC6hTgDwSGpxsLgizZT4QZgbWBpSsg1IEPruJVOPcRg+F08Es4goA1YNZTGKxaKXzzsi2Uil07S9oioClyG+NRY76hP8svP5nG5mFlivYnFkBIuM7WhYx0ZvKcnNcJ9sPuBf1P0gyoyHDs0TDCAEVfHrKPMA6SN6hWFhxzTzBCqGk85m+epITw/S4jjn0f2NdyZKiJ2BEhaS0SYJbkk3pLeF0uhUhkfAqYVvjezrRkluxvEkA0pFVOwJlCX1PK/RaOzv77daLfhzopSSy+V2dnba7fbHH388Go0A2WCUMLdpHsjqxXA4nM/nmDm4cygXaa2hvYC9CxI3sDZtNpudTqfdbufz+W63++LFi6Ojo/l8jk4RHFssdLFmibcF+um6br/fX61WKIuCvFwqlYB/dbtdLA2y+xeLBfaHYrEIvfvVagUZejAZM5kMVjfOAmgEUbAYNU6UCR3HKZVKtVrt8PBwNBoBkK1WqxgEdukyMQNcha4RzGQCakx6MRuRnEs/AEK9WIPdbvfk5GQymXieV6vVEAZMJhMUXU5PT+F1SeIqVS+JmVIg0mrUleYzsnn/DwIQm5twKJXQsuf8xxZBTSfsluCJy5YImc0ylbXeioZFrLWTVYpGaYwJdldy8YhxWGK1siPEaqRVCcNPyrxQ+YG3irtlC0U6nSZej3+VJ6wEU6RbHZ8RURU2Oshjl1268omjeC/zcOlFJvUEJJ1QCVkGKanP25adOsR0uGdKurpUblWx9C2LJdIejfcgMWiLDIvf5XFDrIpGmhKrUkK2GAvTGBNprZfL7C3KvOp2hptJ8N1ue22SEfwmpGBMMNnRJRHeG6FA+c5JTzO1KcAij0jLATh5P7ez/wzA1zdmSNoIrzJv8KvS2o5cTkdpHaXTYcoLUG1fB0o7KggVBSWU0lFkeLbK2sNrYHQ5ShbV8bbizWve7TaypIVHy11FetV+J6KtRe3NMi4zjqNeC4vPZrPhYBCsVul0Gubhxpirqys4MSwWi4uLC2QrsBeuVCrYPGVLBKqb3PdkSYwbrxI9EFICSNa25YRUcfsUExyW7dkXItUVSAkiRiyZ+7SvpFMONjHXdTwvm0qpKPTKJW9vN3zyo1W1GEQrswic7ix1Nkz1JzoM9fWUM7EogSMAR0d4MJqbZniSAh8lRCrCTSO7WFkl8NVqqVbL0F/7QRApFfn+OgyCKBZCoRiIJDpILWbrkJWnCVF+Of5MZmWQj7yJo0rGuhKJmzXzZT2PKnM0H2ZTDuNb6ZVKgSBjjKO1l0q9C0acVWodw8FLpbKxtLQXS4jggeZiw0CIEeOx3qkP3113APHd9QO/kEVAKZLakdj0c7kckm1k1NYvplKpVquFQ7TZbDLt2d/f39/f/+Uvf3l2dgblBNd1obrgum6pVProo4/u3bsHnOiDDz6Yz+dnZ2e1Wm1nZ6fRaHz00UdRFPV6PVDSut3u1dVVoVCoVqv5fJ6kGGA9gDJB4EJwNh6Px+MxNBmYghaLxXq9XigUHMep1WrAbYEdL5dLz/Ogc4r7h3wqmH3Qamg2m9vb20qpcrm8tbX11VdfPXv2bDKZHB8fA1GCciskVkEpRSJKbVmQ1zCGQA3oZoMae7FYpBYwcRMERsAfcY6Ox2O0Z5K0iMOVjsYkmZLFiWo8OddKKSBW7FoF+olbZU4LIAzvs1qtgPtAmzIIgkajsbe399FHHx0cHEBVE6cvWJmu604mky+//PI//+f//A//8A8XFxfESaXtlVSZsMS/pFtdkiiRjKTfEEewKMOSs2xVuZm1yj5T4AgIRiHlLGli/IJ4NFLqkcElPwWBi1Sgo08OHz3RTwpmSU9qsinB1QIvDIs3k8mAIM84G28ObAIoHmiYmOqktQLkBdKHZZvNZvO5nCMYxBijVDrtaE0tbExdQi3Sho60OMlllsNL8Qcm9iBkycZM2YwpGWSo0IA+v1qt4PqF+5dTDhfYl9BOxZfFM0Jn63A4ZJmEQBuBeCquEhUCZoESGqJY4tfSVIpcCfpJSrV3QPygspKyavkOkQFBBESSN98OStvUZuVasIo0ljedfFhk+kumM5BupFu0IEcFsdVqoQSIHAOzFBxYiFEAGbea9Pnp2LKwjtixjsVyfn5+fHx8dnZ2fHwM9BOiQ/gUuLplMpnpdDocDpF/orSG7RcNEPCBhF0k9l4U8LDccHCgaYBSm57n4cgAqI2fY7lJrQlQznGGUgoWGwVyFZrX46GDZF0ul2ezGUEoHMqLxWIwGODe8IZyL6W7I+URpLie7CGQrF7J0GGGDBVI+JttbW2hIeD8/Pzo6Ojq6ooLRDZHWywtKWJgzb3vbkN+Z4A4inAW3sa/I3mWoihSrxa9F9SQlfuGRMqIBVBOFJNWlgaxBDjHkoxgSrXQXZ1tELKD+za1cbkz4ATHg+OTlRgfYE2rFwFfkzmzhQnSaIgZNcYHZwQPjuTpzBHDfgVpFNakUTVXsSg271wy+FAqszrQ2VRBFEBt2mRJOIAPTu5OiLJwzmLfJnIUbnbHc6PmLk07WQJD3ARoZEeyW1IUmHi67/tBFKnFohBb271V2SO6Jdqx/q+cMLdx85NMXiUU9pNs5aTfl5QB5bkmZb5YoiAqR1wJqiNJGVmJORL0SVZbHcfRjujXN7cAvub2/1Tc5R0JpCwS6sMUhFVKGeU4Jp0Lcpl1q7WoVifp1CII/Pk8CgIT+OF6bcLQlR/PbUGWWGQjhRLc/2QtSm32SiaRYglWJp+R1KGWCC/9tMkwuFG0QU5daWZLNQneITsqrqsycUXqtpADKvYZpXDgLhaLfr9/dnaGzkjkKZPJRGtdKpVarVaj0YC1w42lMmu5schhKbpY9npc3QxO5M+xs3HZcuVKbSJuGjJCYw8ZHUrpFisreel0Pp12TeQ06vpH70f16mL6k0iH0WjiPX2Z+f1Xuc++dsYz16hYcwDqBIFSbixNEMZWdeYmDWKV0BfGT9YJA0ZqbUP9NlJaG9cxjgngJb9eh0EQLZeveuZQUIexhHRqYSgoJ5U8/WkKIueVbIRl4U0l1Cdw1FqdPXKLk+LRrOchV0VGIOWMsR75NCUv59p2XutsJuO8pUb8tVR0RimjlKtUVjwjVykjMDYvBpFTsQaxG79D5g4mvrvuAOK76wd5gaIFQIThdRAE3W5Xa72zs/Po0aP9/f2cRIhEKFkoFA4ODuSRrLWu1Wr1en00GsHbDWHT4eHhcrl877332u321tYWAFmlVK1We/DgAYnAcGzb2tq6uLj4+7//exwhUDpGMEofKhw/oByCAgwhYwj7As6TCqGNRmOxWEBwudFoANvyPC+fz7MpOAzDYrGolBqNRt1uF1Tc09NT3/d3d3fBq/rZz352cHDw1Vdf/eIXv/jmm2+Au3meVywWd3d3S6USRJb7/T5QAM/zhsMhCMKMfeEa7zjOwcEBoCvaNQByAlELxzNQAAArp6enJycn0DTgIYphx08uLy/BQQNnDVQpUF+11oPBYLVaoSbMomsURcViEU4RFEh1XRdsUEJIo9HoxYsX3W63VqsdHBzs7OxsbW0hUPA8r9vtRlGEEdBaHx4e/qf/9J/+5//8nxcXFwxqcWaTQcw0I9lqJ72MLMN3yZswtyj0vYZBeSNT+PX9dBY5y4q/La6NpMhJyrNsVpW2b7LpmAmAJXnhxxcpOTE3wZUiDEmaD7lvlv+1lFJhVoz1kgRHVIKZ4jiO57p8oGpTMC4pFZIcf76YiZAM9KnuKjNeqe6qhFMTGQ0oY8honsMug36+gBAzIfjVaiUbvaXDlXxAyBwsKczb/DduHB+rydRiHqmbXLxuG8m3uqR8ilSKJGmdN8MM1vpcVqSUaCEEBIPVsV6v4c/JwkO5XMZzGQwGxpjhcFir1fb29nZ2dr766qvf//73p6enVMhRQoUjl8uRHY/CValUqtfrWBGXl5e/+tWvoAsBt8xGo4EjAIxsUIYLhUKj0YDfGoptuBPf92u12u7uLl3L8H2HwyEYvpPJBJRntk2guokdFRRR/GI2m8WmB5QcBQD0WGSzWcjQY0/G2wLOBkCM8Vyv14PBoNlsVqtVFg4rlQqaYMBuxutzuVy1WsVHg0oMFaNerzeZTKSpPbdZAprY+QHo4MCiujSGGjcPTP/x48etVut3v/vd4eHhixcv8ObsipDZGieJJbQip6gli8yS2B9EgziK15IsdVhLMmlKJp3ZcfImSY5SLoP4AitA3Hvl6qa4AVpMuENKnQ0ingBBZBsEt/fksWJtNVLXlTUkyQaVfn1KyIAwZFJCT0YJrSe53xLjoMUC8CZuAjyppSMZm0K4MyihZpZUpsZFeEXu+VbtUA6F3Ns55aztOhSXFAqXR4NKyOIzBJK7JX9R2jbwlcnQgnpNYRiufd/EvSlvW8+7USk4CRbLJfkaPaIbifaWe55l22hhxKQDEx2m+JLUCeEhTmdRtJFxerCgJW1y6WapNlUyXOeVfaJROpZOFfCsSegORwnKJF9mcSoDpdaxJd1CKcD4rvLSYamyaFRmO7ujTmdQLEyVWi4WYRCYKNRBaCwlK8YYXHqS2y6xTukGaUlMSAF0ObvkaEjuPwtXVjmKz4tIGcec4Z+FTVv/VxaQuLejI+GV/oPnuamUl0rdpuJ6LTExn3uZDM50bAsnJycvXrxAzQDFYziatFqtZrNZKBQkQMydgaU1a1HIEFp6ysmlzSgiqdlF8RyLJszVJ1cWA0hrO5LdBgyT4jzLc92M9pxqJcqkg+3O2hhfq2g48hpN42hnPE4dnemF7wRDZSZKOUqllSp+F0CsblLWlpAxcWH+F8R/iZSOVCoTZVJRsxE064tsdhmGq+Uy1DparV4pnuGcugZSRfMlT5ykKJ81VtyZWVeAsj8r2VLKSQbMUj5CJUSfJYMYxV1kAeAH0Jha7v8WGegVAdzzstms576T3EM+1h2GmkQmZn+r+C8sTZmYHm7iZ+oqlb5Doe6uO4D47vpBXojbpD4pWUjIRRuNBqDbG3/dCvFlxMyeZbzb1dWV1vqP//iPQfWSJ0GxWASmgB/Cg8gY8+WXX2qtO50O+LxgQTL1JahBRyMoOVImT0rFIZ8fDocQI4aML02KcGAgMwfHbTKZ9Hq9ra2t1Wp1dnZWqVQIoINgBXYV8Atq/wEp8DxvPB7jViE4OxwOkcyjeR9V9Fwuh3jIcRzUz8G7ga6FNPHAaYfcbzabwe++XC6zSRz9wkhKZ7MZ+XQ8gGWwwmAIBz/g3WKxCCFR8oaYQBIgnk6noITv7+/v7u7Ct5CxLBB2RG+wn/rqq68uLi5A1ra85pIhqeSXWbJrlkqdirvG3kGVlfCr5CZINtyNDrwglYPvifUCpRHI0cI8EIRiEJoADbCXDcgLKF2gWhNnsTphk6qL+DgVu4sAD8KDA/OCCRvnJyJywl5cEdQoIHFSKYV3Q9QOYIvRPwV5/SBQIrPVSkF3AusayqeIIPErqHygiRg0fCw0aljj+yY9o+mLIjsZmXqRuYaVDtaqzN4Z0xMWx6BROAJvhc/FnSB14YogURdMQJKvKZcJSj4tNKnLxrElAZABMVnkZHzPZrP5fC4bw6XXJTMcCYLLQoJUBH63S6Z8sh5jIfv8J048sJDI15OcqcVige+FHRugMFK7e/fuVSoVkGExsUul0vb2NnsMq9UqSB+Q96VFD/2mAOGhCwSWp9gS0f8hFegwM6nJA41dx3H6/f54PMYbQi4ZJwImLWqEWCy8sDcqpRaLRbfbRQsLpjFqkEEQoBkWB4E0f8dY1et1rXW/3wdOzeQfiRDqGeREDwYD1OQAbUOn/sGDB3BnxWnF4yOTyczn8/F4jCWM6uOLFy9Ai87lcu12G4r8mGb4diTIYzyr1Wq1WkXtEKWmarWKQa5Wq8DKv/nmm8PDQ1SLcZRbFDNZobSYU1Yhh6GFBB//z12vf3/eKpNGq8P99W9yIzxnJbFWmU0i48SGJHh9o2lPUivgxlv6TlWBGwVMk5qkr3kf65U3Fvysw12ObRLYekOE1Lrh5MgnB+cNhaduHPbXaL/KqIA6PN9pk/WdjqPfMUuFf2+yHJ50aLDipWTBUhZWrRlo0YrZ7mN54Upshee1bEqQlWZs5thmQfKwOqKCIJBS+OTXS5Rfa8pPu1QzMBbdmqZPJmFDR5iYL46b66/bvTf/02ulIqUzJltc12vT3e3+vf3+VmdUKq20E61WURBoE+nIaOBArDQwTiD5lJshrhthWbkoWMmW2tzW4FvblFVVSj5NhpTEyJIxtqwmytq5DD8QCOGIkbRNPODXrwLWCRCYQf3s8vJyuVwizSyVSpVKBd7d+XweH8Fj3cIWpaDEjbufVeSzwHS5CggQEw1nVUn2ad22PfI9JZAN+iqCjVguOe15qXTay2Z1Jh0Zo11XOY6qVIzjRCYKpvMgnXKOztRw5AQLpVylCkpFSmVizmkoFAkiEYsnV4EEiCUuHAqm/FqpULmeKZXDrcrq4cHqvcfLZmPlOuF6HSll+OSTlQlZN7XyuCRAjHehEBNXCvswkFIRvrdsq63yW1L3zNqd5NxOsr9vtNS73uU8L73Z8fN2QJqJlaPDWGtYx3uRikFhIMIkF+Nf0zGUfHfdXXcA8d31A7xkpEjnXDBwmUW/yZvQHIZEAEC96CMGCxg4AoAt7tqlUml/fx9iEfhdJL3z+RyoKFJirTVMrvDDbDYL6x56qUFREWwXgAi4ecINlMCjlB54u0BFGRNMp9NutzudTvP5PFQjwjAcDoeQMPZ9H9rKgJZU3IROFQj8HTZHWmuAGugiH41Gs9kMBXO8ba/XwzkKPAK2e9VqFYA1IwyIq9KPjjQuDDva6oEXAzpE4z/YkRgQoGlAtUBJw8Esy7+lUok/x1sh7pxMJt1uFzqeuVwOCIJ0GABQDi4ABEN++9vfgnltJXVSRDhJv5VnvLpFCC9JhHnDvMt6JYlvspveyproPYVpoJSCxAcePWYXlUwl6YBxLch6KF1g4s3nc8I0BDTxoGkWT+xS6u1KYzFWdPD+UFOhfiJwSTx9gF8gaCBmRcM7Iify1qn8KwXdCCp5qZQSEhPSTQ54GfF6hP5YkpirUgiYjwCIlaWZwKybFAyLmkH2H/WCrVyIWiiYnEjY8EOyRIHxYWIvFgva9AEi5+cyPaDlOhQqgHuWSqVqtVooFCxojARDKL0C98QeRc9MYItUpUBhZjQa4ecq4TZjLRNLYu+tLoJ0slGUvJskeZk8dCjnZDIZCPXK2hUe1ng8/uabb6IounfvXrFY3N7e9n0fX5YoKj6RUHgYhhAvevLkiVLq/Pz8V7/6FUplIDlSaQe5BN4H0yCbzVYqlXK5DAEHJhuYljhiqtVqq9VCqtlqtY6OjrAlYnWgpohpWS6X0eXKFlRkqhDQn81mw+EQQHOtVkNhb7lcoj8GZOHLy8tmswkoHFXGcrncarXS6fRgMMAEoxQs/OjwxMFr3tnZQVkRBSSqxHQ6Heif4Ier1arf72Mq9vt9JO1IsFOp1NnZmTGmWCwWCoWdnZ31ev306VNwpfE0pZslRJPoNICfHxwcUPRAKTWZTJ4/f35xcQGeFzk7MmGTxozcPGnIKRXAMcEs3PAPFcDI5mtsaGTPydZXuZTwjUhwBvwBZIp4BGcUafVsqZES4bLrlt0eUt9GxQLr2DGw+qicmNRfMptsaAkGSeaalO2W3bjMe7lLS5DoRplO7HLs+ZU+ToS9CHXhV5iW0//HMhOWYBPGDQBTcvsCid6CYyimxBKg2vTS3BAfiM9cC9/n4HMoGKpJhSsr6rAAIISyhEStFhMLPUlCGKlUyigVeZ7zDgBEgvD7JuhwEtlJyhNbZD2pxZRokE/TPFDGBqT6kq5BkiZ3Cb4DNkBaOxIgxv5jsWvVpqS11iqV8jyIdDuu0ZuKxJaORLSpvhqIv6tYYoJIWdx9rwOjI+M6kXaN9owyxs2YannWbg12t7u7O/1mY1ooIDADGIqz2OE+IwvJSfMM6y+SbiklbmW3k1Qt50YhyxKyYCwB4tv2xttalCxjD7m+blR9BfHlWkXdcRz0Vdw+hdPpdDauxSJaRrzKr4Yjtdls1ut1eLdIYrV0obSI2JLYnlS0l0vbShbkJJcWzRIgli9OVhAlOqlEbxkmAG8mjoHTjoMuPdfzXKNcR3vaifI5vbNltA6X/spxVRCmlzM9X2lY1ZmVMqC0O/GMdTYZxDrxF5MAiINNmBj/d6VUoNyiqVaDx4+Xf/Rk/uSj1c52mM6oIMBGoRzn1VEOiRI5haydxKoTy4GlNhETIkotIW1njCdl3DmTpRZKsvYmZ7I8DuT5Zc12q4Pkei7hCH6tmvat1youTbmxOk1GqZlSjlIZpeB0kFXKj7egUKmsUgulMtdI/d11d90BxHfXD/SymukoYMdyKEiRr3EzQMzX6/VGo1E2m4VQ7x/90R89e/YMuRASexi+JTd6CCbI90+n09VqFXk4TmvEJdKxKpPJNBoNOs8CFB4Oh+icpbQFgyrARvAyQpqNEAfIBVifALKRqFOYAi72QE5B8jo9Pf3yyy97vR6AHsDo6EReLpeQkqBEQ6PRaLVaw+FwPB6fn5+v1+tms4lbAh14tVrlcrlyuQwUCXQ8nqxAkyHKTGQHUKMMdGiuhUMXdkbkhAKoApEtl8sRMqNimooFwpArIhoDrg2l5sPDw6urq1wut7u722q1QBPGgARBMBqNAByXy+Wrq6tf/OIX/+N//I+rqysVu6JZuYrEZCWf5TZmlow5SLV4K4c6vJ3FHU7SnZj3As4Yj8cXFxfQBs1ms6enpyhRLBaL8Xhcr9e3trZmsxmkOYAacxGxuwprh65uEuNDPYAoMLEzZuxgbkLhFMAuee6yqRCgKkjNdFui7YNkEklnBqLk9PmRYTGy4jAMtevmNxVm2JRHpgymEHV+ZQMvW+khyY0BQS2EPktUuyarSJKI+UEqtqFjt6MlV41PByZrSdRRFBI/lA3LxHDpHScxYrwDxHDxdKBmUCqVKMZKcxK8GGgjFF1Xq1U+ny8WixT79n0f+TY+FyI/FxcX3W4XSw+oNFnkFi1Cvau+hOQOK6EZJ2UlLUIxl0k6na7VaqVSaTweo8sBEwm6yWgvODw8XK/XIPBi8gCCR2cxNnno5KxWKzSUVCqVarX6/vvvFwqFp0+fHh0dYfVhe0FNC7AXoTqsNUgDwzUO1URs7NC4gApEq9XChoYjplKpYPJg8HO5HJizNKmbTCYku4HmDJFECPWgTgl4qFKpDAYDrHdcqPrUarVKpdLr9VzXBStKKQU3UZCCOffg4Nrtdn3f39rawpGBOh82fCxSyDRTknu5XJbL5cFggKcA2F0CWBCm6HQ6Dx8+XC6XfCXgG5wC6IDpdDqdTgdSFVhu8GLNZDKArdEnARPXZHsydw9p3kiogvVXUsAkdCUtvP4wZOG4uduJSVus+NKXTKb90pMdP8HBDagCOBfvExUyWtEmgR6LdL9YLChfy/VLTQ9EC2yuouoxHh+xsyTHLckllMaeeDcJOYWxvxCeDjdYRA4E77jrohSK2jPr6Kx6onLJFm+qLeN98FtUZCY4zi2XfcSUvJA6yJbzKicMsUgl5K1lAY8jILFpvli6J2FvBzrJt8V98uRK4msSekYxCVuTdByVlnc3EtyugQzHiXz/rVuYYxTkDaW0knzqGwnX1mtu8zcjrQ8AcSa+2PVCCX764pL1mSTOSzsvKeFNz14pPGLJMSmlvJSb8jzXcx332hVNS0SMZGGVIA4HMUYcCeAsjCEzKEsExg3DjOtnC6tUNnSjUBvl5sJ2Y9xuDdrtQaM+LJWWrqejyAsCZcy14TEhbERlVJawDuvbeO5JD0AGNpJYbdFvGdLI4SU9JRkeyJrTBiiWYGVaBHwLHaa+Cm4AW5nW2sHN3DI/sfqy2awThpD4g/trJpOp1+tBEOTz+Xa7DVPZSqWC97wR7SUlhSeRVMGSeKXlfintUuVoqE3baryeEL+lDsfTTarikn1MOoWkaceqI/5qtXQcR2tlTAqptlGeVkZrVSioe3uhH6xWvprM1XKpBsoxjgqzap3Rq8AJ5jE1lWxTCyDWCb6qBIhvlJhYKxUox6hSOTq47//4x+sP3vcLBaW0Z4xrjHFd5XnXk4THqFXV47lPuNxC5Kneg3VBRSnOaipAcnon25GtphOLXyyfjrUPc3rggJClXF4bW+I7RyMZpXylPKVWsUndOn5Ya6VSwmzQiRnEfsw7Blh8RyK+u+4A4rvrB3hZvU6AYpE8gy95enp6fHzcarUAiNz2PovF4quvvvryyy/T6fSf//mf//jHP240Gr/61a9+9atfXV1dpVKpcrn8/vvv/+QnP1FKkY/JIxmJK3/oed7u7u4/+Sf/5Msvv5xOp6DZ1mo1EtOkLy1zG9BmIVW5v7+Pf2KsgM53sN7o64XADmRAHBhXV1ej0chxnEKhcH5+HoZhu93e3t6u1WrMK6CfcHV1BRopcngwi/EX4GI8/CqVymw2A30Y8PRgMKDb0mw2Q/aVzWaR6Y3HY/w6gBUyhQFmASgZj8dItBqNRqPRSKfTwGJIt2H8HYYhYCk0U4/HY4DdWuvhcAg0B8kzdANmsxnuGSKYcBe8uroql8sPHjzY29tDioujd71e93q92Wz24YcfPnz4cHd395NPPvnFL37xm9/8Bsig1K5KUlqSLljqzVpE5S++OdBgMQiS8rKMdRBwTyaTq6srRK6e581ms9lsViwWu90uTDZWq1Wv14OiCP6UWt74C6X6uNwIoJBEjPFkmgE/wNFopLVutVpSaQvFAJB/qdgAGiNQDCI1Ku4cJJRMqjsTDBAkkZJRyYSGWtec9FTqRpEZMnmZz0NgBBRdqmri4xA9A0HAxCCHiJE6kWIVKy8Dcaagh8z5KeDA3kC8WMoQsweCeRfkBfApfMqENtSm0ZZkRGLTAP7earXK5TI+kXx8PHoV23YPBoNutwv+ZrPZBFaIRCKXywF1whwgQDwYDKgrzTxTSkDeKEb5VhfVZmTkzbSTxEOLfIGy0JMnT6rVKvxCgU5CGGE0GuHp0AOQQCQeerfbhcY6KxPT6fTq6gqbMPZVbGggaAMVpZYfelp5M5hOHHbLNI+eVICSe70eUOlUKtXpdKDeAAI42iCAhw6Hw9lsBvrtcrlEg0i73ZaqI8aYbrcLXWOtNeSJQdfFu5VKJchB9Pt9DAgmMCAV1ORAHwaM2O12x+NxqVSCaSoOL1LGuGqwKaFShYIiv3U+n5faozi1t7e39/f3W63WdDotl8s8g3guYObzcbAPAMfKarWCZs5sNut2u0CH5UJQQqY2SXG1NmeLqCUzc8zzPwxGHFeIvXjrBkgtdWmwn2DdQX+J3fFsGyLrFo+MaT/qCnKvQz0J7Rfya6IIxDWL/Zn1NtTO0dsEAiZxYXagsxIm4R6rAZyYFOFaCRgRqyX+S7lq7MnYdpio41fm8zlWAQwJCoWCrFlyU8UXZ3EdZXUMNep2PD0xAliPsk6Mah80WDDZ6NmISSjxIAvyJqAs9f0J9FvgF+c23rxQKBBQZoHZmp9WKzo7z6QaklSPtVqV5SRXwmlWax1p/Q4MYkBvziZJ+fVCIjdGUElf36S8xo2sER6geXHhsSIWpeY1JgOtonDWs9Jw26OkHSKhYcuRLN58lOe5HhjMrhdd29U5ysKIw00PujCGwyRATA1iig4vlWNMxvMr2UmnPCym5xlnrbXRaVOpzjudca06yucWrusr5RnjBEFojBxnk1Stlf4EG1KnNxV+LIAYcRFnjhKS5XIfkMR8y7XyRrJ5EiC2GOhJxzyVkAsg7Rd1oFcb+GvLF3iQq9VqMpn0+31wYmq1GuxegBTv7e2hO0fyA2SIwqqM1BOXJQcaKkhtcRmHW3wUOQiI3Pgm0sVXqkJTQl1GUOhzSo6wqGNFvu87zjIMg5hf7+DWXNdkMlE+H+3uhLOlCcKoVQ1mPScwauQ7pyPv+SA1njrRSilfqVysTrAxuErp+M+NR65UFKtJSIx4/QopdiOVz6pWy9nbd/f2PNd15svUegUHRc9xXJ6ejJCTgv7c8KXdMZ1OseFb2ibYWKQduuWvKHcD2Xpo+T1SF9uie7Mv01KqsYTaJZEfMvFRGL41TJwSFSk3lpjwlXKUcmJOMfUlnFf65pCBVmmlJolnenfdXXcA8d31w7mwmyPac123XC7v7u4iH+71er1eDxSt17yD7/uj0ej09BQikn/5l3+5s7PzZ3/2Z57n/ff//t/RLI9TBKKHsjEEoUMul2P1WCkFF/UwDD/99NPhcBhF0dbWVqfT6Xa7FxcXwIbAvkRWBvkFWLGDLQv3eQiGqlgmksVniQlCchEqusREoOcLbd9Wq1WpVMitBqADCYtSqUQCGj4I+ClIwThZ8aGe51UqFYQUwFvJVgOdcLlcAlzDU2AvPJIi0BuBIzAc4XGLz8WbEOVB8A1YBLTTIAguLy9930dXMhzk0GiMB4GPAFbi+/7x8fHJyclsNiuVSu+///7BwUEulwMbDuy8y8vL09PTVqv16NGjBw8euK57cXFxcXEBvrZVfpCMqhv7OqVdiYUsqIQMlqUJ+IbzXEbnN2qWSRs3MnnxHNknBSQFGqC9Xg+oE/SIAb7D/BAUbFygeAObIJ8dtEoa0OG5I+JBLx5YlvRVB0ZMtWi8HhUdGoVDxpQleq4psqeRioP+AyVTUNsADOGfKGScz+fT2ayEf3RMW0MqyEkI5KtQKEDGRNKs6GPDoBB/LhYLdK/jE/n0yfiDqRchSLwVXU0kWZstfrKJGOUWcOoZMmKIpJEx3wQ/Z/mEYSugJcja4JHh3qTVBvAR6aSM+cCECm8FVBG1HMSsgG8ArSrh5SgZMTSC/4NgarKh2HKis+QOsQ98+OGHH374IaxKt7a2PvjgAxQP8vn8YrHAZvjFF1+gYwAbESAVCLg/ffo0iiIoDGJDgwKD67qDweDly5dKqUKh8OLFi5OTE9/3S6XS3t4eVCCAGmOGgOp77949pMrYbAHDAc9iyQFPczKZgHsLeQrf94F4ArzGlohfhIgEVsHFxcXJycnz588fPXoEYRaA0YCwZ7MZujoePHgApBi6E0Cfv/rqq5cvX45Go0Kh0Gq10AiCkg/0N/f39/f392Fbenp6aozZ3t6+d+8elpukwwBhGY/H6OBZLBZHR0ej0QinDM4duNVR1LjRaLiu2+l0ms0mxrlUKrXb7VQqhamFLT0IAlChsY6wbLGrgAd9cXExHA5BgWf5kMQxPD7CmjheJXCphGUWvoXct5NCmX+YOreoHxCOwchjSqDSQBVm4qpcTdhh+MSJruLBEfbCrovhAhyGwZe9DlCrx8YL2JeC2uyfoJO75FNbavsYIgK+1obA40AipBJaZZGY7G/cA+XsmWZDrof9DXgrTHucAhYtTm0K3aK8AZY9vxoZ3JKpLVUgKG3EmYP9H6MkZQp4EEuFVotMndSalPwykqklnZztcRgW4trW31lYlUqXSUNdiYzwfgivhEEQCkXXN0eHr02qhOfejVENVxOVgqyKeFJJWY6SpWjEyi5OT0LDONxxINK0EMuftWcsJeK/mAn0qZPjIwswVEiQhMG4rKW0Np4Xw+2eq2PR0VeAr9lkEIcJlYngFoB4jhZ+ky749eLk4f5JqzYo5maOYyLteOkgnw9yubUx4dp3tHaiSEeRARU11oh+BZ5aVgQS8CIUZQnsJBXPSbqX8426zFiVbPxnPUkaz1olBAmJ3kgiTvZacUpLER4+Hbp+YWLrMDRRZL4ru5xOp+fn58fHx2gzarVasG91XbdQKNRqNZzF2K4lMohxYOiLHQlDjaRVCTUDfAUeSSzSSBkfa/tiGMZJq2JlZ+6itJfE2Yc9H2Ehgkb+yo1lGEbmjMk9L6W1DsMoCo3rKs/Ru51VLhP+9IOVE+ploI7OU7/+PDv8jTsd6kjp6wmcxGyc+D8dn4KSQRwIce1YTUUBbjbK+EoHXspN57Imn085rqOU5zp0IvXwOKR8k6xPSI0jKT1EVF16pUpXWKrQsMIqNx8+OCmjx/OLNBF5FlgtSnLasCbKVhX+loS2gyBYLhb+W5qIvoo8zKbcsPWvErV3YihZxch+cAcQ3113APHd9UOFhi2kAFszECjkIdY+fuOVTqf39vbW6/X5+floNPr666/39vaKxSJ6XZEyVatVlmE3JqLnQSmS+ztymGw2izBiOBxSVBf5DDACxhDI6HzfR0vsfD5HIJVOp/FW0nEbMCiVCgHvIgtCazCgPYRfMqTA+6DZnBguWFqUdwCNC+gGpCGQdUdRBHkHIICr1erFixfodAa8i/dHRg0dLgTiSEdJCyU0xrbr2WymRAfWYrHA40C3NUvfDDSLxSIHEB+N32JDKHKA+Xx+cXHx7bffLpfLer2OHm2gnAgoQXMul8v5fB6h3sXFxfHx8W9/+9vxeOxt2lZIYUR1k5W2uslN2xIdU7co673btE8i0TKkpkDE/5e9P/2R7MquPNFzr83z4PMQc5DJnCSlMiWhJBVUQH9ooD810H/H+9ceutFoVHWjS6rurITmlCqTFJNkMGYPH21wm8d734df2OL2c82dEcF8r4kHvxBSTg9zs2vnnmHvtddeyyowKhLlKwNxwttV/ukSfr5S6LO1awn+WvVJlhuDgKCEVzZXumuBVyGkVhhBUZqgVUv7lTYIuRwrQiKbunPl8Gu7wdcSVaytjRzb9K8qzyD3aYlCYnspTZLPnqcjISCY8eE/La9EzC+X0Ou07Z9W286qi3rJs9Sc5b2jzmtb8BBWIihKUqSiKlv4klTEozM407e+1kLKS/s/uF/EenPr67OhyViPOL7ZbD58+HBzc1MAIghaqVT6wQ9+AEaM2jiA+MnJCZCuWwlSs/M3Gg04xaAGDx8+DIKg1Wo9efLk2bNnFK4GgwHqBwcHB5C1z87OWq2WjOAymcwnn3ySTqfb7TZS18Cj0pGn34LJw+dCSiIL5QRBAAQSk8BTXgDHHGWGKIr29/fRYQDshsgMU5hvBEiHOEO/3//tb397fHw8n8+pDHFX8N9xtEP5F78+lqHGmUnCTsIscs7Rd0JbDGAuhQTSNrUmSCaCOuXFxUU2m0UBA9/UfD7PAsnn8/V6ne9F34ykA6EnB0FwcnJyfHws/1WmrgSFAcRRZC6VSi9fvjw/P9fasTu5h2d5xvHvXtX7digtlcpks7lcLrWa2FbcXPimIFRRiZN6hRa/ttiZpThZWQm30qeSHgWAo56IviZ1I2p72hZUvbOiHFbQWfCETXFtc67dLQWwcjHBVBuzeK7yaou96mfqnWr9sT3a+l72sVKBpnbCGhc32cO+7W7PBNYWKmElkHd7XsiGSLpGNlrQd7cSHPoUDZ3umbel/kpUyUOkNmARJc9izkN8rI2t3bHFVdepNJ/Pp/N5NJ0uVmrg7zqxwzB0LmU2ba9YboOrpKSyBVy8CMprSUme6dZYTCoTKi1boSqB9WpTYI8V0qeGsyScqsNdgU1yl+CbpUKY26kwDF3Ss81Kr66VJI6uAsTRCj6bOzdxLh2GxSiXndbrl9s7rXqln0pFi2Vq6cJU6FKBWy6D+SwVhKnVR8YQh+03slufpfa7q1o0zoge2MfnkRg8M0/N9qSAu+VcCwLzDn13VTjCBlTaMNdG3XZGaT1alPmbd7shIIFYs9IAxNm4WCxSyGQuKQ/SnukNkRBD4eDe0NlgxhLqPV/QtbmAQHntlvYEUWysgFzDZeuOnMV29/bqfGrvUxfCYhEvl3HgYueCQj4+2I2z6SCXdZNpUCi7N+fpQiYKlym3cC7v3CIBAVtLxiABR0amWKI5P3+LDjvnolmwmISLeSZaxi5IhWGQSoeZOIwiFwQujqM4TlsCr5dzeRVfb3gVS1tqvMUZrJ/B2qqJ3dZsac1u7F5pUDPB3o+SX2/GWgGK2DQbvd81cy61+r+Jc3nnZg4JaResJCbcSlliunqOi9XvF0b65va6vW4B4tvr+3YR4amtAw938uGtrS3EJdTMft2Vz+cfPXq0u7v75s2bX/7yl//0T/80n88PDg4ODg729/d1yqbT6VKpRFig7V5BpwcQFwqFw8PD4+Pj58+f03EP806UPTq7icZAPHnZfD4/OzsDIGDfB+YGUACwFgBHhsOHgkHs7e01m83T09NUKoVCVrFYBBsFZbi8vISk2Wg0ms2mcw72MeRoOn9xMwPwJWUql8tKIWiyhr1LaxUpHwFKo9Ggu580BkRGUDiIthBGhDJlpCZiqSBm0Grhd2hxAm7WajVVaBWyg1C8fPny6dOnnU6n0Wjcu3dve3u73+9D5SYJnM/njx49+uijj6rV6nA4PD09ffXq1d///d//27/9W7fbFdzvlXY9wNfGGWsNc5OeM7b/6H1VJpI8miSJWCk0sQWyEgg6g/hMp9Nms1kqlfr9/tdff40+NaxSt5LuBUwBpRJIKl4S/d0CMggcxUiN4ximOVCCgABb97Y4AumuTfvlFWnhYO5EbdfMQ+gPzF6V+gmtVJzIFQrLxcJdfWReqy9Zsfp5SSnhbypTFTzKoqBYoi5sKy4JGgicp05GJUvy1CIif8tkWcXfpVKJBchnWS4bc4aNQmAuT0EkEc8ZiegfthQblxa1WpUVIoOtIDaCdgeMbOw0Z7NZp9OhtsRWo68mzpFHzbCZjwU4rqOSfcDO764qHVs8CwieDU3iv1ZZGPyRmb+xsZHL5QaDAXI0QGDsz2C+lUpFuze99nCxO51Ou92mBQTceXNzs9FoCP1n03MrzVCqjKgACRfW+qIuyD9B1k6lUhJK1jwcDAbZbBbWJK0V7MDKTqk1FotFbPRyuRwqGcyo2WzWaDRQGbY+qNINZ6+wHY5MdZz0lLWCqk8mE05YAGhNKnmTqh2BW5WOEJOZWarS3Wg0YqVrmWezWXBz7u3g4ODevXuwuSUlLx1eUOlut8sBl81mIV+z4fDD9vY2ujflcnk0GqmpxV01NPd4au6qIOnvMYDJpNOFQqFQLAbL5WKFAts1pSND48ZQiBmqYpXYSW6lnCBEgHIvdT5Vp7SB8HtL2rVYg1vps2uQpT5si1LW7dar/FkesRTVtekpW37rHGU6ry3eIXodf8g+piNPQ8SBYutVFlxmCXPS8Vas6yTXzPZhyG4XUwSVzVREpH9FIIJX8GNBSb6ZE00NYR7z1OJxYgpLiYgnOx6PB4MBlHzsFnBC5miGEuGBRLbC7fWhqyxq7ViFEc9ms0UUxbPZ4r02bX0XExclZYXX4oDuGt88T/02CU16H65np4fFZQ1mvb4rpqLmgzYia4QgmMa2pa+9228eaApwOAjDkMfscIq7LimJ14HF7ipZTxTL2MWRSwXLQmFSqQ5qtX46Fc3m6dkiEy3TcZyKlqlFEKR8Qb7Yil/beFWRnucEaDHf5FNLagfbOeZZO3q+gkmBCA8ndev8Njws2LO/82oPtgr47jpXwephxSutc4Gt9IzKxln7TFLjwp4pHjfC43ysFYC+TjcjCcorClU9wxsx76lJL0WbgLfuvG4GUeZXsrfxMopd7FJhnM64Qi4qlVyhEE8mYb29LBajVGC48NE1c1hU4uQS8Kom0UpuZfXL5SJYLsI44suybfLVQ1v6Wvv1vd+oKOi5zNmKQtKNwKMkJ+te3m5mf0hKgiTnjCXye2vWllW+k2vuZGVSl11pDY+dy6wM64IVcIzuMA0NeecmzrmVbMjtdXvdAsS31/fzshqs5Ng0wpdKpY8++gjN2W+traXT6Wq1CgZaLpdfvXr1u9/9brFYPH78+PDw0J7BVnmAS/0ptlxMgre5uQkigAig6n6E+DjwoC5Ho/3e3h5xudRd1bNfLBYBpmF9UrWmgR3e1mQyefXqVRiGDx48uHv3Lt5xaGOlUql+v48a5mKx6PV6IKfVarVWq+Fob5uh5IiSz+dxqH/z5g0p0Hw+V3c84Ahue3t7eyC8BBnA9CT8CAhqAFEn4GRVyEXLP61MKDKT8NjIkhdDA8nn83wpQECABshu3W737Ozs2bNnx8fHW1tbYBMg0YPBAHhoMBgcHh5+8sknv/jFL3K53BdffPF//V//12efffab3/ym3W7L4iZ5zHukKs+Ay4rMWqqFtbQWGKT2Ri9XWU/GIYISlSmVCpyLTMIGzeDtS1Ydc0vnup1Ot9OZTaelYrFWrU4nk+l4fLC/X9nfP37z5ovf/W40GEwnk0WhMJtOZ5PJfDqdp9MwBFw2y2OL4ziTThcLhbRhQs1ms1w2m83louUyl8kslksXx4vlMnAuTKVcFE1Go/FkUimVMul0Jp1eYBMUhpVSqVQui7gRx/FoPJ5OJkugBIhmcRyFYRCG0XI5HI2cc9lMBvDaBcHbajl9fEKIFosFkKVzDgHBbDYFwGR6r2Jjx2EpumgsgKGIdgSIwPoVk13xNK3ugsOE0uIzhiwsTx9cXqAJSCWInghrrHrJdruV1gGbgzzT6T0HuxwMBvJa4TVsUAJ/JRHOx/Ep2ifVGMsmQwVlMpm0Wi1YosxkVMJZPmDEwN+CxT3+hSfHpjzEci4+gH1p2dBeWiUMyxqJ8JiGwyEiKujtbG1t7ezsBEHQ7/f/5m/+BoIq+Nrm5iZC8F9//fXjx49RsGHw+/3+YDAQMRCKGZWJu3fv/uhHPxoMBs+fP3/x4kUulzs4OEAJBE/zBw8e8LaDwaBYLLLZnpyc9Pt95Fny+fzOzg445vn5OSq9GHKCwo9Go7OzsxcvXrx69Qohez3ufr8fhiHoNqDYgwcPFovFF1980ev1zs/PU6nUYDD4wQ9+AKmZ51Wv1+EmcwMXFxdHR0e/+c1vvv76a4qIkIt7vV4ul0MuA12Ly8vLo6OjwWCQy+UajcbFxcXl5eXz58/39vYQuEBhX/zWSqVCDY9dnUWBaoSajuXmt7e3Z7mlHAp7e3tIGdRqte3tbWSIMBSl1MFWwOPgrcrlcrVaRdflk08+uXfvHpoY8/mcagFHFcdxqVSq1+svX75stVoCVS2IlkQ0bAL5HUnE8ao4Tb1huQLcpYmhQqlooSL+C6dQP4eKQxJXlaCNChVi2lp3OwEKYqoC2ZdKJXAQfkNxiI1RW5PAaz1Ti4NYhM4D49iBbaXQkxogWGJzE9+TkgNdVkQOaqOWyIbtiPdYwMwQVchUzpcsuOhabuXCJ9opAjuEYfp2soWEXm2VKKSMoa/AH6pZR3svI6kAQ6AM7yDnUhkn0BDATgJALIeGcrksz2HNE+HvehCqz6kA4AkBsWAlbwJ29QE+SEFCDuuG7f2GivgN3SQ3IM43X9e92EIwN+C/az/Xm8arOzSf8o0b2ndrzLZYWxy7OA6COBXG6TBKpaNUapmKw3AZxWEURywEzwvMfevAejve2oeSRGOvw16Tr7yhSOB96Nqd1kO7k2IXa1v31nz0jVMzjuP5bDZZGfzaIrQWuMcPTX6jJGXE06u1kLFF0i1x20Pbr2QHxpFCUmxrR8/W7z0t6aSLWvIjBOXzNnEcu5hZGMZxsIyC5dJFy2C5DBaLYLEIlksXgw7HiUmrDcKb0i4BCkcrXDJ2QSYOIxcunXMuW3CFUpzNxkF4ZcD1OD0k17MWSELha3XSLXTuUbm9mgRnlj19vGlgudvemNsHlNg94rXVr+Ri+JBtJOdcesUOTq20hovOTZzLvS0+fQMcwyCOVv8ZOzc3eP3tdXvdAsS31/cQIBZNRjXAnZ0dMEcwFJLV1DuYbOTz+Tt37jjnNjY2IAnaNINE5VvvRzwdUik4XIgewLIkage4lMdaPp8/ODhoNBp8HC3PQB7whSG1AdAIGAJXajQa0+n09PQUgvDx8XG/39/Y2IDeO5/PkVcWpZRPJPmBXFYsFklTQVqh1fDdaUMul8skJBIkjaKIjmzRdg4PD1EEvry87Ha7IFkkrrQtW896QajyExNZGHxZgy9RRTAvxe5Y86ntHcjs1atXR0dHk8lkc3Pzpz/9KVZOs9msUqlUq1VGKQzDR48ebW9vp9PpXq8H3fjs7IwE2NMatrxIj/mbpBjbI9xjHHv9ku9FH/5/OdddLvP9fmzRCpqpCPzDMOQ+CbpWv0/1es1+f/PJk0Kh8MPZbDqdBmFY/Zd/KRQK0+n0jy4ujsbj0WiUmc9rk8nm8TE8U5ohs/l8ymgdWFE523Jly+9KdO+Pxz8ZDqPlku7pTDodxbGL43Qmk8/l0pkMJW+3IsRBnfvGXXtFPnLOzRcLF8dhwqmDLrIoingrFOUo9uiucrlcvlAoDgbhYGCf18wQ0NyqgRoiebvdRtF4MplQ87CUPX1N2yQoGTiIbGAQNgkHC7N8Us1nKzqcyWTI8KWRKtKT9Lg1x/gscC4ZW4kEKp1KPSPwDl4pUy/+HBQSbW7U2Cm9YMDy4MEDCPgnJydSrGOFFgoFcAqgTJcw0U4mTmsD6A8AiyW8Y7sIxR93K2eSy8vL169f7+7uskWMRqNUKvXo0aPxePyrX/1qOBxCIobqDnTonPv7v/97EFiUcIvFIuNDGQ8J4CiKWq1WNpu9c+fO3t4ebm9xHO/u7iJtLLLhkydP2AwXi8Xp6alkqdmyUMpGol1WgbRfgFB3u90XL16wpaM4gYAv3p4qXUBgjKKoWq02m83hcDgajdrtdrlcrtVqu7u7IGtuJWJbKBTy+TzHwevXr1+8eHF+fr5YLDY2NvL5fLvdXi6XW1tbDx48oOoAo5mJx1xCMb/dbj948GB3d3cwGFxcXAiz4/vW63WMQDGpQ82Zv2X2IkPB50obl/OxWCzu7+9XKpXBYAD5ulKpdDodni+lFF7Z6/VQk+eMA/dfLpd/8id/8vHHH0+n05OTk8Fg0Gw2aZrhhBoMBjs7O5QQzs/PZV7klZNtZ4DFjj9YKcVD0NKZDAzi+WSiiql2D8F26sOwPmO6MW0U2qwks6NClJzWgFNRw4SE7nXHsycQ8EAMB3dWAV791B7r0FOxtJ54nu4NJUbZqVnWsCw9BYurZgCiLfVMbkD0ZABiaUpqZxNPn4+WBZkepeI67lNHnt0zJbsMbdCaSlkmJgtEW7FkCgTWAxATL7lV0xtfTax5hTTyGBwOh/SdqH1HvGyaWpDkUlFBKLYzklN6LppdshCU6r1cAdnq34IRRtr1PfboOI5WTrPvuFjeBSb+1rfyeHb2Aa29rOYAM1muvLYkbEkest/wqvvJt8WkLlq6aBkhuxCHsU8QvoE1HF9twxdxeOFc5ILAhbk4k10WC4tcbhmGLopTi2UmjlPLRSqK0nGUdi50oaCoNRirXarOqGnbE9wrt7jrrZjteHok2Zvx4iSd2ZsSXuHHY9xbVDQJ7icdIL/5xJsnZBR1O503x8ejdpuquXVMVYVMVerr1oi1OJOGmL0TyQTL4tVyVMV/WlvhsCeCRbFtQ4zGhNNBPXbW7Po6PrgFWJOS8atXBssoXCyDxdLNF8FslpqOU7NBEA9XkOJiRRO2EhPRVRli/T421OOpcwPnxi6IXaUabxSjSjZKpV2+HD98sNxoLjPpaLmMU6lQPJkoCqzbm1WmtmazyZ4G7RW2m4QoTr1TOuZEeljr65isT0jlXM7e7ipB3kOovd3J6sJ7H8Ez/hCMeLmSj3DOLVYOdW6lNRyteMSplUmd5G6C1e+DWwjq9roFiG+v7ys6bCt4cpmoVCpBEJydnZHPb29vv8vuCaKEgU8mk0G71pLXvpXsSWuezNNzudz29vb29vbTp08vLy+fPn1Kxnt5eTkcDqVNAUMERQjy82w2+/XXX5+dnU0mk3K5LKE6SLKKGMDy5E0HC2YwGLx8+ZLsV27yp6enJycnm5ubZ2dnnU6HPwS/hvCbyWQAiHHGg2wLCEJmAlACnwiMACUKcA3wC9ob8cfDMUZuYJyO4h9JsI+MCyw+CIJGo8HQMYyiO6n6Kqv6VColKYPJZDKdTlut1ps3b54/fz4YDPb29j766KMHDx7I8wEuG5BQtVr9xS9+0Ww2Z7PZixcv/uEf/uHJkyd8Fz3itbQXG1IqTFSMtZat4PmoeA1xSara2ut/Akwfj/UZb5kjFoO7GnopEkv1++Hr11b5l3AvXpEul9B++/3w5MTjfuo9vZhRgYxdhM5TmbUO0UHgzIvXxM6rv/UpGOYG9ObOvKH+1ssZruwPURROJt+8YRwvVtm4BYg7nc7R0dHZ2VkYhhcXF51OZ29vr1qtMnSULrw+R3FJAFyEFBNJK+4HWVA5B4xA0m+AGta7SYk6KwjIjFqLUgV1z4FHaDbKol2rho0xm80i5woyOJ1OQS2pRcEXAyjR4s1ms41G4+DgoNls4t+tBCadTuMqhh4FO5huj1jWLiU7/b4L9dIK/NkyjDOycZYpA1a7vb0tHdtUKrWxsUHtDTFfBh+G6f7+Pgxcqm57e3t4xNG6wT4GLCt3vrOzs3q97pwrFotww9lR0SFB3eLs7Aycrt/v41xnJWXhjfKkmBtRFLXbbWZIu91utVpy44TkW6vVarUaGheXl5dMJ0SW+VyqYnxl5hj+nwBJSDBBewdHFo7G6YMujSY5k6dardomCZ4ywhE4yAHa6iPguQNjqfvESoKwt7PPM0lYlcINNzY2yuXydHVxcPChrCkBiPP5/OTk5Pz8fHt7e3NzE3nix48fb2xsoLYBEI81X6/XOz095TC1fnSaUXZzsrKMdu1/iOTfuiuVSmUQ9Fixg+3eolqsWydbZO0Z1eZsib0pc1mVBsaQR2PXqeAPFSrYjmgDAs0kppI3KUtSGgWe2Y7eVjRnGN/A01ahy7axs9AEOqttS0myFN4Vm+mt2DBt760FqrRDqtaomxcg6Iwevf6XfY/wRhi3YAjPPosBZHxkxiVlD35pn5E0mi3kpPdkq2GDtTQ0Z2zlrAKpFSC23Uv6EwsQS+nFXXWT4w3fYvRXEZB3vIBYohU6/I5llbXyxMl39iC2ZDRx82fZLm8L9xMVMxP0v9Ayer0eOwZ1CFvbsEGd7TNbfXqcCqLFIhUt3kLEEdTL+BoRCXEn46syrPrPqXNT5xYuTMWl8rxUnmxuDBu1STYbxy69XGTjMFpGqdilY5da4aeBF9lZnwmLVEr4W9RyCyUnG+2TsbGECyR7ZY9v2///VkHVDxvXaK+JyOnJeiS1RKwtZLI24DFAl1GUupEaH0XR2fn506dPl8MhzZqqGHk1bw1XUgjFBqXqGPCUZPR97XbtVr2GaiywWLA2ECG/SLdbH44kDE1kSAVdpnbJmNkr6qs3VPuSheyDIAzjMBBeGIdxlFrOguUocMPAxc6VnJtqTE1wHyYA4sC8DAWViXN95yYuU4wPd5c/fDg72F4WCnEq67a244P9KJ+PlstguQx4vHZvZzzVsWrNPJKHuC3qKK3T33qP29IRrBCE3Vet7oficDXQ2GJMspinT9FdqciXlJ4IgMY/IKgWQJ92LnYuvdpqcs4tDcaWdW6+Yg2HRg8ks1Irvr1ur1uA+Pb6vl2WXaJoG5wXdCCKomaziQvZO82qdHpnZyefz3c6HfFQrGGUW9fTFMcxervyCOIGSKq3trZgeD179iyKop2dHYRfC4UCxsrj8Xg4HFJjbLVagC8cIXr/8Xh8cXEBjgBMQGZONn5xcQHKk0qlcG93phkqCIJisdhoNMIwpCfx4OBAZGdyZkVvknkFUYXIXCqVsF3a2trCJQmRZd6T0GEymQCu8a+0P+/v74suLdFk63csKQkJe8GIGQ6HIGJYDgpAEQlINuXn5+dAXcfHx5eXl+l0em9v7+HDhx999JFtZWU+ZLPZBw8e3L9///DwsNVqffHFF//8z//8X//rf3316lVS/86Lk4TB2WjADl2yIdG2nXrRw3UY9NqrZrHRtT/cmKi56/1t8+/2sv8/u5aGMSTEYTQa9Xq9brdLxk5RhCUmhCIp4yc4QJRk7UUit1ICAZpBIAUqHNuXyjyCePgrQnkvYRAeZHM88REUkk4mkyiKwEoUm2KuwoqTNijf3YI13Btrtlwu1+t14E7wAj4XTNA5d35+rg5oLfC1aow3a1C+Oy9NIbLdgS045SnJUq6rVCo8zfl8/sUXX/DLUqlEVazX67F7v379mmGRp990OgXSBWaVzycocBRF5+fnrVYLR7vJZMLmDyIv9hmlNaiXwDE0XuARarmTiE3zUMjinHPlchkwlB94Z4jDhUJhMBhYlVJ46BsbG0wDSL71ep2X8bfoGudyOQ6ss7MzWkO4vUKhUK1W+YLwptU1olZKVK0ZfKQngE7In6U/y3FDDwpQI4eUW5m70hov7Sa+SL1eZ/BZGtDVmbfyCQyCAA4pBwfPV6en6jHHx8fn5+eQvxhzukzoI1kul+fn571eT8bx1ufNFoQ827ffZ5H7qkiLZQldV3FM+iB5J4vXj2z7mj18QeiDM33EXj3GYgECTJMV06RUok2nw6ssVIGzFm+yeK5t6fU4bmsVVL379PCa5I6tp+mx7ay9lbumoX5tM9ANTNK1AqBr2ZT2DZPAmQWgkx1O3m2vpWd6E9gOe5JO+11mdRTHi1UH/tqJ8e7kD7eu21pSMO5qn74g2iRj1DtHrACrqsVsdMSWWh3EwK1WCxNpImGVFmxblZ2KRlXWBS41m4fzxXyxXLhwGUdRvIyvGNCJl2eN6ZYr0dXF6l+Xzs2dGzk3cWEU5zPL7WZ/a7O/t93a3epVyotMOozjbBRFUZzi7gRf2kJX8kRmV+eibOaNrUeQdMZIw26MnqmjOKceJM2Zog6AJGXSJegC3rbjrSb7HVVTEUZsFWkFIr8l/fDp1weKZ2dnT6Mos2LklMvlcrlMOkP9wMZm+qwrbAzz6fzSc3iWAHpSZcLTr7Ci6vpPFTNss2PSEFLSatfxwdfGbNbdwXpm6KutqNNBFIdxHEQuiAOXSrliNq4Wolw2DmZuOQui4YqdqrEGFE6tfggMRhyvLOmmLhi7cOEy6XirsfyDH87+3S9mjx/Nq5UoioN0JqhWXaEQLJfBbOaCIOaW7WBaOTXr123PRFs+9HBYEYQ1INbwZr7y7UweAfwrdXFbtbUdPETp1t5cgDIhlreV2ZVo66nLKAo/SALIFZwrORc7VzZYcGA4ws5gwYHpY7AJ5C1AfHvdAsS31/dxEqTTpJekvhyWGxsb9Xp9PB7v7+//wR/8wcOHD23D3bfSeYrF4mw2wzwN1oba+tiaRf3TeUAiCu4A1pDNZs/Pz3d3d4mQtre337x5c3x8PBwOj46OCMJev369t7f34MEDjvZqtdpoNH7729++ePGiXC4/evTozp07/X5/sVjARPv6668RjoCqNhqNMI+CdSsPpVardXl5effuXcUfmUzmpz/9KZEB7xwEwfn5uQAIyI+VSoU2utlsViwWd3d30+n08+fPW60WpxpG9icnJxcXFxx7MLUhdoVhuLW1VavVnjx5cnJyEscxdvP0adI0DXXO6glyFhKRZzIZ5C/oba9Wq4PBgI9WXAKEAe8VedAvv/zy6OgIoPzg4GB3d1fyx7g89Xq9Xq+HqOIPfvCDjz766O7du/1+/z//5//8N3/zN8+ePaNtWZwjpabuqmqErO09zwHpSgsZ9Np1k/BWUuDydi3//+wKgiBlsBKrGplKpWBQNhqNzc3NWq1GacRyN9SIKuqH6lI2QZWZkiV9WEqa9ZoXuGP930TgksSKrFFconNW9pWQggHRhD4rmQF5hLYpqVORmgUhib1SrVYR55EVmHY/Ejx9YrJecoMQ3gc/uLVYT1KzT/2/dDn0+/0/+IM/2N7enkwmJycnn3322WKxYIfE4S2O43a7fXl5+fLly3K5vLW1hdbHcrmEOIbeCEIQCAojW49YATsbSHEqlWo2m4eHhxsbG+pdYBuk+oWXHdssuKfaw6logsszCXFOR5ViuVzC5mYoptNpo9GoVCrsb6oQ8A7NZvPy8hLq8fn5OUINgLPcM2oncRwjJbxYLNAjAuVvNBrOucFgAP1WBORSqdRsNk9OTrDjA9iFFs2UtgQ0tDvkcQrajlAGKDmTk0pkvV7nFFsul6VSidfU63U15CKKwopA94DDkf/c3t5+8OCBfOqYGE+ePAHZQXk5juPz8/NXr169ePGC79vv91+9emWVMcTtUoa2Vlf0uwsQX5nWV0HbteeC8l5bMdIPSla9XhZ3jQKjWL2WgM9yYITF9dbKsl26Uj/QAhTHzfO8spUbloP1cJc+u/YiLV7rE5gcLVXI1KuRrNtZuQAri6y/lROdwDJPviOJooov7GENdjBlUucZ2YuV6QHrSTqk1wcjTQP+CXzB+qyq0Mgmb9/NPl8Ltdsh5Q3BSWWsamHZ5XLpFovl+1Dm3yIpcezMYN4g6bsWNE8uNE8PwcOILfXPk8byRlXoMJVRdaNz1AqyQdwDP8CLiwsE1rX/eAvTtlwkmLbp2TRc9frAInYxyG9qhQIvVxDwciUiAYNytgKInXNL52bOjV0wi9PpqFoYH+x27hy09nfbzdplqTBLpwMXpGMXB0G4+r8gOaWT1S/9p+A/b9PzEEnZWnrxMAtZrAj2bTv4+r06Pt1VH0W7hL2GtuTSSLo0c1do9chgUE1UdgLw9MP5HP+M66bxoN9vhWE1my0Wi81mkw4VfFkl2gP2qn1Gq5UlL/0ffVkrVqvXCBkUn90W2JKVJPuf1mdSOKPFiK27qZ0A3o6nup3AbsmX63zU5qOtWFIq83Q6NQuWyyCfDfa2w08epd3CXbRSl/NwPAyi8VWmsMcgdlehxuXbyZ+ex/VS1GhEjz9e/Nkfz//kF7OHDxeVSrxYBLNZCH12saDMGdFYqF4Kt7IIknWzdSl0xkDInhp2V7fMdOu/YpnaHg1cwygdJ2nNq3YO50miQFYwSh6q0rdxV62YtTZlG7iIomC1DN/vyjmXci5yLreqSPHLoXN5IysBXp9ZaRNHq+e1uM0mb69bgPj2+h5jPeKnkAkIGZnP5/V6Hb+dd383xS4kqG5dX6fXFaJTH94rapV0rHNL8/kcuAHSE4jMcrlstVphGNbrdVWkydh5DcoYhULh8vISid58Po+bHDczm83a7TaNt7VajdOr3+9jNrW5uQkfbT6fQ7AC2i6Xy5ubmySBCgSJXMsr6zDGEDlayR8ruJfjlls1TImDTMI/HA47nY5zDgkINCWUfljZJmt0rqMXTK1UKtEIr+iEP+d+4Fx3u93z8/NOpzOZTIrFIgTn7e1tMAIUjRkB4JWNjY2tra16vR6GYavVevLkye9+97uLiwuJQyUJQcnkxOOzeKShpMOA58Kc9Fxemyz1nHvt3Ozq7AzD0CUq1e++VAr5fDabVWyH2u9yuYyvygKEtJSm0xkj5su4fJPgSX3CpOLOSE8Qn7pVa1WwunNnitCx+Q1WeII8JZj3zepbfehbkWKPNMf9xPHSYBMoKeub8rfLWi2u1RTwKQjjZxwj8/n81tYW5Q1SQdX5BTrIuUjxtIr/VD4gsNDYzjpSci6ipTPqeNxGr9eDpkSMCFLG66H92gZnZaRIZAgoBMjDdZNiCVqi6u+W9qgan9Eil0kX+yeSC7u7u54PHvgRSgvoSwi88JLzJL0xaXrzXqBDcq1Z6pZxUPkmzxmNRs+fP9/f3w/DcHt7+/DwEPrwL37xi+Vy+eLFC9ovGo3G1tYWjxXKWKFQqFQqltMNJYSqoRCKcrnMYbFYLDKZTKPRGA6Hb968abfbtVqtWq0C+vNwe70ee2alUkGyo1AoCJatVCrpdBqEend3t16vj0aj4+Pjr7/++vT0NJPJ1Gq1YrGIBsjFxQWvZ1NVFwtMYfi8KOnDES6VSsViEQTWtkGUy+WPP/54Z2dHvBhkhfjPra2txWIBsoyUfy6XOzo62tzcpDDJ+TUYDPL5/MbGBjL3Z2dni8WiWq1Wq9XhcMg5xThwWOi0IodHuQiwWJhyvV5HBJyulHa7zTqtVqscXoA1YRiShm1ubj5+/Jg+EpRDmHWQi5vN5sXFRbvd3tzcvHfv3mg06na7p6enPH0V7ayWuodJKWMUjvx7wYiFICztfns1/7fsPJazrGL5msIrPTUJJiqlJokessDlmakNE9UOlgBbh8hxYGcSq12sLivBYQdNG7Y2SbhU6o0gx6YkxlzVaEuKga+miWr5y9Z03vaqW0KcRCGccwI95drnCeNqYCWInGQpitfvqehIX1gYEB/nSX/ann3v9NcXsR7IFspn8BX4yaBCR7m86ewpo9FTkGxd+Nyqi4vHITMJwlfFQovFInIumEzms9l7bdbRymbArbOqSzZseVF9srJocRxr6mVxEznN2rnhUeb1Srmeau1wrqkNgqONqFsHrq1E2nezwqxmzcbOxalUvFikF8vlMlq6KIqj2EXxWyzY/l9gfp47N3tLonSzlVpo7NzchctlOlyW8rONendv6+Jg92Jnq1sujVPBIorcMk65GE2wcK1k7doBtxRjVUG8JyWVA2/heL3wauhUlGXhXcUGoKh6K49HnISnbV0nqbFjEWrvcolePTVKvgWIV74ma68wDDPpdL5QQHJqf39/a2urWq0qoJIJue5WfnEMjmZUUtnA/qcaK8VnV2NZsvSi1S0E3IrVqgLnZRx2AiSXxjd5wdVhZ6O2dqBWm0Ktcs7FQZCN4nCxCHL56N69+E9+HpRK8ZdfZb5+lZn2gmjpXMoI1wIQp4zEhD1O585NXDB3uVy8v7v4wcfzn/7h4qc/mR0eRLWay2aDKAoy6WC+CBeLYD6PomhpNwdLcNYXUUZvKxCSFXIJ7WZvA9FgEnEp2ifglya+dWaWj66VN1FxgucoxRJ7Y9Kj0MEk+SmL/r/NBRaLYLGIPgAgnjmXWe0wbuVEN3Euu9qCrFghqNti9TJ+f8sgvr1uAeLb6/t56XBlE2fjpmSN1Kwt9b8jABEEAT7ptuiXxJHtX4Vh2Gg09vf3UWMA65lMJu12ez6fD4dDxBmr1SqKkIoD+v3+6enpaDQqlUovXrzo9Xrz+Xx3dxd+FhxG1DNTqdQf/MEfDAaDMAz5iKOjo88++wxI+u7du3INSqfTm5ubhUKh3W4DDJEhk5hVKpW9vT3n3NbWFpwIsSC5MaJk+ZVXq1VGdbFYIMFGx64yT51q4/G43+/D6gUO7nQ63W73zp07PBpKqZLhkwmMGuE5R4m0MA23kg6TyQS1zVQqdXFxcXx8/PnnnyNkce/evXK5XKlUtra2wjAcj8eAKdCWZ7NZqVTa2dn5+OOP79+/n0qlXr169atf/ep3v/sdDGUv1rRI1lpz2yR2rHK6LVrYCFunvkuIDq8FGv7fzv2Xq3tcKpWqVatv/0RRXULt9y0ZjaLvcsl/zufzbCbz53/xFz/85JOjo6PBcPgW9w/DdqczGAx6vd7FxcV4PN7c3NxoNkul0u7e3p07dyrlcrFUkmbuYDDgIfJBSnRhO/KUF4vFdDK5aLXarVYUx41GY3t7u1ypvIWAl8toFWtGq5RguZLBnU6ns+l0Npul0unAuWgl0IF6dYqEP59Pp9N82WwmE6ZSWvXz+bzb7ZLUMe1rtRqQFvFWJp126fSkUAhW6YcqJVjAo7IqSy5a3d1Kr42bYcaC6zHPmWPiFAAjyjQMSjKy5qT3ACKAYrY3E67r+fk56hPwl0Fv1fTKe0rv2LIV6F3gm6ISAIAIrMwqszdssWmenbRc8vk8xRgKKthIlkol+e8xbqx6VBHWkr+cMcv2wvcP3u0t9mGzmqQBvf7q7Ozs17/+da/X+w//4T989NFHWHF+/PHH2BJ2u93pdLqxsbG/v99oNMbj8aefftrv91F1YORBXtjVGU9nvEcoKG5sbOzs7Dx8+PDJkyf/9E//NB6P9/b24jjudrudTgcQeTqdogFNiI+0K+xapgqzq1qt0gmBj1wYhqPRqFarIQCCs1wmkxkMBtlsFrxbLp2tVgsFjDAMqXBcXl6yAZbLZRRUkOgFWkVNqN/vdzodliFcY8Qf7t27x8QAjQXvoyQJsxiZCBzt7t27l8vlWq0WNUIY6LCzhQmWy2WxnMC5UKKndxvcczKZSOJDrRvSueZg4vmSeMPyzmQyW1tbVD7q9boUiguFwuHhISh2HMePHz/+4Q9/+PLly7/7u78TTOnpBqgG7AEWtov598UgDsKQ/S3KZPjWSTFZnq+wXdm6Km/XDWujsNkvGankI2TjxmepX5iQCaCzWCxyRryNttNp9TGoQ0IEKG/16c5tTzc9TwQMbEFUf61YuaIppgFTS0NtIz3LcbOnqnXp5Je2mR2wRuhhEi8TlOOhJ1ZrXpiOlQOWl6DmhirfsjkVW9AZfz+hk9bc2IJ0vANDoS+oIorWI9pBwvS1SaqRwqPLOWNzR9HIYtlyN33bSb1cuslk/r4KVHHMM3AJvQiPrJcMh66rviSRvqTIhp3/liB5gzedwlHVSDgrmSo0iOj4E8vPlieFb7qEXrlzcbR8yymOoziKYgd9eGlEJJIA8fItRubGzk1WCE7gAhfnglm5MKrXBzsbF1sb581au1Ie5LKLKAqjecpF4Vt82NmS/RVl8KQIDJPEDtTaMoYoxnxl3BE8yQKmjZAvqZxbuqvAOz0FC1y6RM9+Umkk+UCtbIiNE2wXhUryLJ/5bBasjoD1m7NzmWy2WCpVKpWNjY3d3V0Kt9R0WeawAWQ4zD5pYUq2FFa3HCzF7rdgpej8op0yD9Wao51HIZC2UDYH0MP5VY8Nb6OLjahRshLpiTDI30Kgp0qDGrS3A878XaRd4PL5xZ27USYbZPPhZBoenaUDUMhwBRAHVyUmwqswcezc1LmxcwuXzsVbO8sf/2T+8z+ef/TRslZ3cZyaz1wUh1HEu8RxvKT5QcC69Os1hcTJtQPizW3bNLNWg8ITAGELxaiZ5N1dtRYUnm73BzuHuSurUmJ5+rbdUOeCPYOENQeJx/1Ol/4iXv0crtoavGUg3Ynoqmb6LTp8e90CxLfX95xH7IyzKkJR+Xx+Z2cHl7n3fTfhwp4kH1u8J3/JZo2a8Gg0AgzCSI08FnwBPWKYTRzh5Hh0EKfT6Tdv3sBZ29nZgck4Go1yuRyMrcFgcP/+/b29PfhWQRC0Wq3BYDAajU5OTgB8M5nM7u7unTt3tre3UQgdjUaiLtJtnU6nm80megvOuV6vB8SjU8oKEWIThKIFp2C73UYFQtwTDTvUac4taI+j0ejJkydgVahkcOzJxJyRAaEjZuJwhcCiKJyIpN/vv379mmHv9XqXl5fdbrdSqXz88cd0izNWcIeBBQHfNzc37969e//+/Z2dnSAIvvzyy3/913/9z//5Pz979owY1zbGerhAMrXwvF+8KkVSv9Jd7VF1xmLFI2jYq+Ncx9vvgqCZTserGMJCcpaDoMqzi+NlGMbOBUEwC4JsGD6oVre3tk4Gg3EuB6N8sViMUqlZtdrO5V4MBq3hcCuOt1OpSjq9KJXyzea8Xo/q9WKhQFwyWqmdkoSTjjrn5plMttGQ4vN4PG4FwZvZbLlczhuNzPa2azQy6XTsnOBRYmV15AFsDYdDBpnEbD6bTWcz8DhpkoIdMALgp/SVo3Yyu7i4bLUQnBlXKotmM9jcjEulTDodZTJLxdmXlzY7oo4CxRIgjEugqmARCTKIa6aWRtGLGB/lDEKcUWJRcmV7A2XPNR6PQbiYSyBHbwmGK4ZyslYhTyQWFFsQeIHlI1gOQjJPFg7IBsgXBM1kKFjUUGgtlCYWobDatZnJ2h++y+U5pbh1iqji3L148WI0Gm1tbW1ubjabTZ5IJpM5PDyE8DsajS4uLsBkm82mGiNIkETN47nw6Plf1NJRfLYb+OXlJWrFeNCxO4FaspoEtReLRbBjWQUqJVCvOk8BOHUymQhOgjWMgLJIl0L5ZSvKFCqXy8xeTEF53MwxjhueJoUK7gG5Bm5D96z0u1gsVioVThBKLEw5xDHEgqdMaxk3qqFOp1OGEZY634vFCOdaMB8HlgzrBFlqhjPzKYo8fvy4Wq0+e/aMki22dfv7+0DemUzm6Ojoq6++QoLD8oO8/E3z2WJqtgH/9xC9mF2I+QNpy9KBVZKhLUbOORav4XnpZ2GLClesmqHQBGtuprYhOh6Y81rLng6jkl6L93mDw/bIid/v91VfpKBFmYpz39MTZ7cUs16Ai/L/tf+pvgrPU976jyVFGOw2xaJmsYhMah1BOf48zp3gRXtMMPn1CL7xgzUBBr+3wLfliKkqqYeoQxO8mE2McxAtdTB9T7lIv5G3kpAmkHpKL/ZQcEaL4+2CXS7j9wUggsBd1ezyiHjXxT9JrX9vVSbx/eSLrRq11z4fXb14Adsgs07nvvUnJByF1cFW6anNJhvInAx0V41ScRy7OI4j95ZBvFghMmslJiARw+mbOBe5IB2nc4tKZbjTvNjabh3sXjTr54XcMOXmceyiKBPFKUMkfHtHQRB5TTwWGWdxqfZjtwsPILbsRZoSiJ+9QbA0SUGWtqbr7a5J9G1teJxU47WKXgrg7erT6WAFf61D42w+p53hWnAtCLKZTD6XKxYKtKE0m00KuvYm7bagiNEDKy3PWvZ9yckvxFmnuXxrLak5KdlhaxVCyb+1E8tdo+0uerK2dHv8WclyYdaZTCZMpZaRS6VcqRg0Gq5cTo8mi6++zqaC1ZR2VyUmrMpEyrmMc+mVfMHcuZmLFy5euHIlOryzePxovr3tgiA1m6Xw1Q6CQKD3crkQRYM56VWGrOOcF0ZqznjuMtcJ/eto0y46HA57vR6ZiAV8leoC+utwZEvPrC5NTmsVwA7P1qT5RuBkWxZYY6nFIv4w19zJauSpQok7nF/hxbxryjl8vnPOzZxLOxestqb4FoK6vW4B4tvr+8ogVjii8ildukg0vC/QfPNnadf2Ugtki9vtNkk4r8Tf6ezsDFVf23xN+kGoAW2QJsRGo0EbLNlIpVKZTCbPnz9//vz52dnZzs7OxsZGtVoFdHj48GEqlWq32y9fvjw7O/vhD3/4V3/1Vw8fPqzX68654+PjbDbbbDbVWYMyAwOFAiZwQBzH6Eso9+Ngi6KIBmpQP2CvWq2GEfx4PB4MBuL40GGNniY/z2azJ0+eoID5+PHjvb09CEpkcaJugXEsl8tKpSK9SwAvuMxowJ2dnT19+pTMGaXpnZ2dvb293d3dQqEASuJWTd/pdPrVq1dffPHF1tbWn/3Zn/3lX/4lfOTf/e53f/3Xf/03f/M3JycnsrD3DAwt2JQsMq/lGnsMF8uatH9i88l39/V2JqwKgyBCgcF2bq74vG9ftkoLNEe/cYCAchWGKb5jGOZzuUw6PR6NsplM4Fy0XM6m03kut5jPYQvMZ7PZSm83jqI4ihbz+XQyCVOpbCZjWzedbiyO3/7tfD4aDgf9frlUCsmoeRPneMHb7x7Hc1qxVuZgb1PZTIZWaMlYp43wRSqVymWz2Ww2nUpFURRi25VKZdLp+Wzm4nhJzBTH0XJJaCoWsxepK5i21XtCQGtqL1aRyBS2LqV0ERBErWFKOMF31FAJzCpameADJRi2p9LyXzwTGNseS1Ih7MyjLdgMyhYtSEjmq0uKaVI/cMbASkIxPJQb5FY83O06NZV3vzylPPgaQr2TGJ9tTl8ul2dnZ//lv/yXfr//k5/8ZGtra2Njo9FoPH78eGdn5ze/+c0vf/nLL7744vj4+I//+I9/+MMf8owghgCWcefUJwAxmZyj0QgmL/95dnaWz+cfPXoEfMONwe9rNpuNRoOTAvM3iOqiogOqoisiRQs2xp2dnfF43O12VY+kP4YHh38puGq5XEYeRGKyd+7caTQaURQNh8N8Pq9ChVtpGYPcofkbx3Gn0zk6OgJYR5QfyHIymUCNR/ABM1KVmhD8QV5Zeog43ZXLZU3U8XjM6Km/m6rPxsYGVcZcLse5Rk8D9SEc6nK53OXlJW/CF1HBCQfCxWLRbDaLxeKDBw/y+fy//uu/UkSkkrq3t/fxxx9HUfS3f/u3//P//D9//vnnVh3Fbs6eS7jmknI8r3L83cMYPgK8D1a4sm4WMnkmjG8AVgvZqAHISgCr40ECNZ4zpxpdLZYhREwAgdcH4JmYqXuXPwT2FU4t24Zut0tThaAHCswIakkeVInxdDpF+gPurQfW20oDN0DcQuRgN2T2XklJetRIjyMmgQtKhuIJWi9T1bmdURsj8uHIANPRz96WxQ8icWslaspJz1Q0QEtd594KhQKIA1sxCwR02DYjizonDShKMjwI+f2KzW09sjwNgXAdtvItwXQQODRB1xk7XwdaJV9zs1qxW6eZ4Iwqq+cj942zkym48uLMisIvASgmD27S/OFwODw/P1dHhagkVrt/DfV1RbSLwYijOF4ajJj/A3MRNDx3bu6CyLkoDgCZYxcGcSE33Wh2D/ZP93ZPdzbb5dLABcvpzIXLVOycJ/JMj5md8FaD1bpBilig2SIBGU+0N6kXbCeGp/Kk3gWvBGJDaKuRvXZWaMOx4uY2KRPd3nZEJdM0Z8SOpY0Qz+ez2eym9vzVTNL0EM7oKRoLwrNVkKSUtm1ySkoqW0J60q3EJhHi+OtsXev1l1R3SSYyNx9MngOh96+rWfR2+JdLiseukI9SqbhcirNZUo8EkhivSKxvecDOpQw7dfmNrEom7YrFuFyOsxm3WLooChaLMAhcGFqtu1itP2vdKb0Vmiw2vLvNgPfULGtb27s2c4sRi06B+KROLi9IVi3BNkN4xh5XHg1lqA+IPHIrUH66goYXzhVMB4OuhXOZFbObp5Z3LuNcfgXo31631y1AfHt9ry4yJSUzqChcXFwMBgMYtR72947Zmrtqj2D/CVRCOgkWwSGUJN+GqNtsNnGKv7y8VKVdGQh5UalUiuN4OBzyQaenp2/evNnf3282mzTMkodns9nf/OY3mUzmk08+2dnZ6XQ68/n8k08+KRaLn3766eeffz6ZTP7gD/7gk08+gUpJ6i7aoJjRgA7FYhEfP5I3QiVlv4JUxE5SJyOinHC7xHDc3t6O4xiwOJvNDgYD5ZmdTufp06fAEM45UHKpLRODjsfjdrvN39ZqtUwmg5IyvObRaNRut9vt9tnZWafTKZVK4Mi7u7v379+vVCpgNBzApEnwHKFdw6euVCqczePx+PXr1y9evLBzhizaZsI6oYUdcLdyuPZ0hL0UJQkQ31CBeHegQZwjSyK2RAyvhd9GPLIjy+Vy8B3Ap2BT0hiOIgpPlgrEW3mKbFYWaoAUiHhkV7ZR7qr5j8x5kRmFzCg+JpQodeur+3g2nTrnyuUyBlnWisHr6lLWB2OREA0iJyRNi7yL3iuavP5VKZA40czMXC6HS5h90HAhlRNyzywfdZbZLjzus1arQTlhQSEIQwWF+oQ6EEnUkQv3EB/r9WT7jt1KRDKOYx6l5MsZFj5C7BURGaSoC5rTarW63S6tDJBYYYYeHBzs7e2VSqXRaATGdHl5CTEWkQHRBm2LqKVo2Ra/q3J1H4ijre3ksCmTzdDUla+t+/j4+Fe/+tWXX3559+7dnZ0dFOqbzeajR48oZV1cXJydne3v71OEgwKMsoH6EwVvuZXvFk+wWCwiQLxcLvf29iqVymg0evPmDbOalg6E6tBeQGYXEJlhYYM9PDzc2trC0u3y8nI+n6M4QaGx0+lQpdve3iZfrVaroK68SbFYxE00CILBYFAoFB4/fpzNZlHgLZfLQRCg245+SK/Xe/XqVa1Wu3fvHnTgdrt9dHTUarU4epBrAJUuFosAwaenp1Cwka04Oztj56dlBxVgdmZwK80HyL+CzyRGyamRy+U2Nzd3dnYotHS7XUGKPNl6vU7TgJIukBqmdD6ff/z4MYu32+1CCd/e3u71ek+ePPnkk092d3c///zz//P//D9/85vfQMTWhDFmO4HQJdUhlO9ZjOn3ghHHK9giFQSUjZnYFIwVw4CnQ0jnuwt/Ud+ArcEI/+Lc91SPBLBy6Gs/fKvLudLWVDzg2YvZ80X1EkaM0pduT149FJitAIWq0dytuL1avKw7jl3b22Rd8uwhSBmbyEFbKJOWwrNl7DrTXK9tSvejEr6FSq03mi3XscfaZyrOoIfF2+5sfbR3J7xGUg9iqvJudj7whnZIbSQg3EEeWbwY4Xi11WsKrYV+3j7fVCoVRan0e+RcAf5olsh6NQpK6hEnV5MtZK6Fkj3+owdTWozYA+C05QpR8mjLqj0g56Iw/uTkRGbFnvtfkjViVLljsGEXuzh2cRS/tYRCldWTmFhBxmEUp1PLdH6RSUepXBRHLsjF1Xp/e6uzu9Pa3W41ar1sdu5cajZPh8tU8HYtWMx8vZRZUn7BFqGtI7cdE9uBpGKzbRjiBZZYLX0JprEHVnp1JqtWbMHfZGncXZWYEDfIajXY5gmLouqe306GxWI5n1/HvgxQLc9mSd/EQ/K+gucR51kseuJXXujuzWTR3j37sneRk/b8OT0ANIkIe4Uxbz0mWfxr2yg9A8NUijDYzWbBZBYtlnE2E1WrUbEYzlCTSK+hD8eBi2K3iFwcBfEKFw5Dl864Wt2Vyi4M3XzuFot4uYyXi+Uq5As9ONizWfYmm5zrPAxB4WsSsk/Wot6q7qyqd7JoFuzruVJLa9s7L1TMS7pVX/egPbDbpqjhhzU0zc3OE6xM6uIVap81fnRz5xaGVoxgSLz639vr9roFiG+v7yGDWChAoVDg8J5MJuR+ttPw3RFnhDjp4ysWi+QM1g4brEEEH2n/AZ4i40ACD/8XcivCC/JGVzsMhIVGowGPQxnX69evyZmbzebe3t7du3d//etfn5ycvHjx4vj4OIqix48fh2F4dna2u7v73//3//1sNvvJT36CJ9Xb6uCqGd8Z51ywjEajkcvlgAk0gBLJiqIIhlomkwHv4GvSxijRDIA/2bspUSFDG4/Hp6entMTCFXr9+vV8Pq9UKuQ/RJm4Y8Gng5i8XC7BoXBtYtiB2BByBcKDjKyuZCQLQT/7/f5yudze3v74448PDw/r9Tpf/+Tk5De/+c2rV68sH8HjJdlT3LrfWARwLR3gukTFXfXxcOs0+N6dQemMkIXwUzUoeYV0G4nyvTKZTLVaPTs763a7WJDBNz85OUEO+60Q8Gy2u7vb6XQA7llHarYFxJQIJhkFM0EoA7x1oYGDwYBqhG6JRSrYCKJiEARoIyhFyaxIxCxtEc81sUUeYWKrfqMgXvgO2b61NrKtW2Ac6O2K2m87+9QqyBID9eDTSeOBVkFdcbqjYpTJZMbjcafTgTo6Ho/twgFx1nfkPvX40HWp1+u8wK0avVkU6tkHFG40GiBHYu0Bl9OPLJoYWMxyuex2u61Wa7lc9vv9Vqt1cXFxeXlJVWB7e/vOnTsPHz48ODgAvLb7ieQ4wJdB64R0XKck6CXhH3bZt/LMarRybTundw+Qbc/Pz0EPHz16BG5bLpcPDw87nc7p6enR0RG4pwB6IBudKUp6eSK4YGkqMqQHBwebm5tHR0cvXrzQJGG7s12Z+G1Kn51i2/b2NnIKTAnoyfv7+4VC4eTk5PXr15RwEGdgwjQajUqlcnJyMhwOC4XCRx991Gw2e70eDNlSqTQcDr/44ovz8/ONjY0//MM/ZMuFXQvWj5YIHRt7e3vUOFut1mg0otCoXkgmTyqVQjTJOcdgArUzK2BVc+RtbW3pyKjVagDEnIAgU8PhUB5fOkEAi5GqYKgHg0G/32dB6YsLGUShvlgsoiPRarVevny5WCwQF/ryyy9PT08/+ugjGmuePHmChgbvYD1kPGlvXQJDP6Cw9+1hDJ1JK8VJsFHp50qpgPoKrFsPINahYM9iIbwKVLxvJw6+Mn+1Nq/tbllr4qqCNxUUYhjt2EQCHrHXykEmO8ctY1c7oaW1qqPc8gGlz4hgglWGkSOfRH5tms3NeG9uTY3sKSDSpUfo82IA4ZK210TsS0bY+uxZWFmHu/rELXDGSsESUytIh519NLZEp2oHsSstI8mGpyQ385vPff9Y+t1r4UlsOsletC+wp4xXPLZ+U5YR77WFWTVVVVNscVfvTKlAkQmVBorHdle0gZbe/xt+XxxHMfrDURDFceTiZXxFfThatXIvV7ISM5eKl+XcuFKaFFOTXDwPXOwyrlwd7u20tzZ69dq4VJwFgYuicLFMLaMwdf3R6uGwHhXG09q2EK39mRNKEab3RDy4WVAsUYf3EfaJeJ/o2eVZVa7r+JsW9NcubWVVVM/TxvgNhxU75evijTAsl0rNZrNSKBDxsqfZIrSgc4+x7g2mBQfX2plYoFkunTbIsdlcEii0JoG6H5vYWjkOd03Xl7um8TGp8Z2QYng7j1KpMAzcchmPx9F4snDxrNFMf/Q4VczGs2noMs6lY2tSF6SiIBUvlvFgEJ6epnrt1HIcuNgFgSuU3M62++gH7sEDV6m4xSIaDqM4iqazcBkF2tZsfG4noZemsbS9TcxWwpKUGqsmrNez8dJKpc4eIiIPdrfOihKhtk9ZdUTPk9OrHFwnGq6HlYYt8QH7c7ACfKNVsSpeIcJMgdQKNQ5W/Q1WfTi+pQ/fXrcA8e31PWYQE3ygHcauLTeb96UPw3h68+bNxcVFv9/f2to6PDxEkLFer+/t7UlRHjZWpVLZ3d0V0NNoNHZ2dgaDQalU2t7ebjabhEcEl2EYNptN8mESGBRUMecBj+DAIPoEb4KT9cknn2xubv7oRz/a29u7uLjodDpBEIzH46dPn7558+bf//t//5d/+ZeAQXK8ZUxE6EMgaTweM1Cbm5uXl5fHx8evX7/udrsbGxvAUrCTNjY27t+/n8/nB4MBcCFeeSBE1WoVKiU9mAgNv3r1qtfrFYtFwHFaRIXaQ46DWyrml21w457xRwJu48SdzWZ7e3sbGxscrpzEJH7K3xgx3mo4HB4fHw+Hwzt37vy7f/fvfvCDH0CtglD8H//jf/zf/rf/7cWLF2pwtnLASQUumxxa22UPdbWplEt0F+px2J6vZI797uiYvTdF8BbI0A/i9srlD4LhYrE4Pz/Hxm17e/vRo0e7u7vj8fjrr78eDAYAYag8oyIC/MeLSZM2Njby+byQQcImZdqQheEwSn1FGqnMDZq+NbuQC1dSxwRT57JaYkGCJE4CzEq83mw2mY302qsIAfuVG5NQALAsBFtF8Jpa4o7xBUWOZvrxpfggPXeAG1hyqVQK3QBQb+dcv9+/uLjAAWyxWFBMAmgWS1FlJ0ulgaeMdgojIOhcOa0iRV4PtEQdBVnYTCaDi5fsH4MgwJ/t5OQE5eiTkxNUbhA0uH///r//9//+0aNHBwcHl5eXz58/Pz4+BvXDkBPzMclTkGZ7JAiPZXMdjeV9IQZLLfd6BpOsNAtVa6VMp9Nut/v06VO+ILsu9SREqE9OTujtQBAWOqfKhLY3XEIieijgp2xxzjlUZWezGdAwiC1PTVsi9bBUKnX37l345qjaIWlHJYxHz5uPRiPYypjdwfovlUo0hSwWi+FwmMvlEMpEvYRteTabAQRTvUilUhwK7Jynp6fQk3GcQ19osVjgdohY03K5LBQKu7u72Wx2Y2Njc3MTmQuhxigDMFacJpxxvC2qQZZByYJiPUrwlLNDeoKset4Blj1oskaedYdJYzabnU6nHG27u7sPHjxAO/Lg4KDX63322Weff/755eWlEDqXUES1s9Tu/x6Q8f+9qMaTPtBqsoQyD8C97ihJdkGt9dux9o8ewT8Jidq38qBSQTleV3hSoMlrCU9m7FY9I+kdZJGmtb9fm1d7QPMN4ptreWQ3nNfebFlb07Jfea2p2nX8PnfVI9djXFp+fZIlesOt6g+vCzP8Mf8gdnxwDVh53Slg8ZokImz/ykow2aKCfYH1qkrSe2UVoF4Egh+9oRodJGtL1CSfAK/q7Ixn7DcaVnG8WATL6O2iWPXXGA1iwcRupTs8cW7uMuFio9LfrXe2KpfV3DiViqIwSGdn9eplozYu5qN0Ou2CVLDMuCADm9J+xSBYU82ytlc2OrViBVZk1hn5Jq/YYCezraAL82IcklVh4WUqzNgBtJLfbiX/ZbcCK4ZuNxm1AOqSfa79+msm8vWbOcXyhw8fFlMpdZVRV7OVNluz1PBavFKzyKvVeRV0CWFLD1qFNE1Lq0HhFUhU25D8l+0SoGL3rQswmRQnDY1tt5y3CYepVODixWI5GC5nszifjx8/imvVeDTIRlEYB7E1QAuCOEwvw3AxGsevj9L/8I/5L3q54SKMoyBXiO8cBn/yc/eLP3U//iTe2Y6CMOoP5lEULxcuigM1/AkN11jZha/pweAkjTHXBpBS/vW4RAQnaB7S3aUh5dnZrV6CLW5lSq/38aoIa8H6JEvJAsSy13bOLYMgddV/7z1QtNRKYmLuXGGldbNYFasEEKecS634wvCLM87Nb3G42+sWIL69vt8kYknCWZ2s9aHAt12AWRcXF9jXlEql8/PzTqcTx/Hm5iZnQBiGw+Hw5ORksVhsb2/rNnK53Pb2drfblaET0Scow+XlJRKTQEuQ1HABAl4BctVxgmZlHMcnJyeoKv+H//AfPvroo3q9fnp6OhgMMJ3vdrvQcuv1uvd9dWxDv+r1ejREq+dLUpKNRgPPIs7aRqOxv78/m836/T7HEvqPcNZ2dnYODw91+p6enkZRdHR09PTpU26DRmnSeBjHqVRqe3sbPjKBuGBH0D24SxRmASZoWcU7mK8GMZMgDDBRxyfh1HQ67fV67XYb2vXjx48PDg5g7oxGo+fPn//617/+6quvFosFIKmnsqcQUye37SO2ConuqtusfR/vyPesS5JT972m6HVZukei9DhZ+ldIu6paQ050zgHr7+/vw1vkK4D6Maqj0UjObII+re/HbDZDI4UJzDMCJEKZQbmWxFV4LtxStVrlmQr1E68Wq0OkD4j4KXXwyKDH8kHWLx6QlOElhlMySQynR8mMglzAB02nU0ogGgQgb14GTAyfVNiWjMvg2rP8EXlQmK4MU+Nmhf9EjrZN05rbkgp1K/8N26dmDejJx+i1l82UdNBY/myV6lVnm6IwgBhusVjc2tp6/Pjxw4cPs9ns69evX716dXR0NJvNECEpFArUk7SIku5wa9W3bbvld0GHtdXbbj6PSmPpG3Ztss3GcfzrX/+6Vqv97Gc/q9VqSKZsbm4WCoXT01OI88r8mVTKx9ialCiyN6r8sL29DTowGAziOK7X6ygDAJ62221GmAEUE5yHC29oOBx2u136LaD8Q2HL5/PVanVzc5MvjsA98xCa+cbGRiaT+fLLLz/77DPUjSjRxXG8tbX1p3/6p9DDNzY2NB9AhNkc4OqqHYf9s9/vV6tVap98QRjKzBY6bKihsoLImgqFQr1eb7fbk8mE0gili4uLi2azyVOjnAmCjNgrB7d0jaDKCp4AFLZpHokr2wh/hWVrq9Wi8Pnnf/7nOzs7qVRqb29vNpv94z/+41dfffW73/0OlNnbS70W5utghbX6ht8xgnGr44YZpTw/qaAqfMQjn1rFZC1Dz5rSmZ5uL9vUfkIZQyKblm+7NovmBx4BT0QSOpbOxjy3CuzMB56glQbW0qZIIHFYKSPbIo1tGWYBFgoFMD5JBnmN24JmrKixHRbOCOEOzmiJipmY9DISlTsJdMrL3kpMSIDb2j1J1N6ttIY9KRsFG54fF/dj79m2LnkGntdBxmsQYTvJ33+6r5WMuO5D7dvbEMuLYbwmd0vTs1pDNmCzZ4RnuabWjbm5kgCxzn2gQPSXODo9Irze1lLgXRwvl+FyhRBz/rkofsvFi8z/OeeiVTf30mVSy2pptL3RvbN9sVnpp9PRIg6jYJlJz3LZZRCmYxcGLh2mUmGYckFoxUi96oIdE20LFjz17Goj4y5oMUEBu3JCswrmtmteLHiPEm43hKQhmIedqTpl+b/e+zuj87A09hJqPrAguK0W8G8xStnXAcRB0Gw07hweppZLtgWxhj2XYytuYDmedko742aprcBWnjQyws293SbJT5cUu7ZrT99GDYXemrrBjc3qMzAZJKxhKy52C9KcQUhluYyW0XK5XBYK8Z3D4HA/DILYudAF8dsxXw1MKr0Mw/lgED15kr48D/vnqfMovVwGjbr7+FH8x3/s/uxPo7uHcRi62cxNZ0xTF8dXhHq9XCxlLm2YdqDWltmslLOOP6UJAoiJnPv9fq/XI9KTPrVk32zkwLOAOmBBdo9gZGNXq5bujFiKXUE6taMoChPf612v6cohM7tywnQrdDi/6mbIruShJyt5YlvTujWpu71uAeLb63t7CXQggOP0WmtQ8O5wM3J1whaxpLCmKyIgeEbetVptf38fHAeUSvpunApkPqS76sonKuUGIEOBE5VKpVqt1ul0BoMBWB502t3d3Tdv3nz55ZfCWCWneB0BBLjWuqPA5FLDvlv1pMvBGUYkyBcvRi8Ci3MOy/Pz8y+//BIGcbvdlqoA391SvPlECSYCDSjZA2Gcz+cgcbVaDdVL+faQPI/HY05EUlnbK4dP+ng8LpfLGxsb+/v7BPHg4CcnJ1988cXFxYUS1GTpeG3mnxS8W9u97lEmk5ygZFbzXUiUSTzaA+bWTn7SIbBXeslxuGK60rvNvxIHk6Za6VXZ3GvSEvQAmFr7DjUGSpvbzoTZbKbGTCtO4q6aj7M6QKgBIJgDTAO5AFtOkCJmUX31e1icNuZmCWt2qT2ZlaI1LuVcRcxk+0KZJUHOzyxta8zCqMIyUDXI5l1KLC1jTsmYW/VReimfhsgq8fG3sPvdqnlWMauSXgJ6boOJwaYEfoqpGgWD2WwGnRwZDWf0WLWOrqNCeNLA35F6KWUGL6C3S0D5gHABflbYrWfx29/+lu9+//59EFLousCawOu5XG44HFo/QwJ9Zsh0OqWwwRvCRBMFGOhBDm8swFarpQ0N9Xzk4LF6o2ljPB6/evXq6dOnrJFarfbw4cO7d+8WCgVqgcwE7hCJ8HK5fPfuXaQkJpMJ8OjBwUGj0QDGbTabarPgGHLOAeyirHJxcfHy5UveH0b/7u7ucDhEEB+BC+oHqVTqzp07SnKOj4+fP3/+2WefYQwLFL67u7u9vT2ZTPAyBekWksvK5Q09+jmb0nA4RP2c1zMhWTti9EvUm3fgAdGOE0XRq1evRqNRo9GgnaVer0Mr/uUvf3lxcWEFGeyc8YBCr83T+lx9WPn5W7laUiORbgObqnZjZPQB05UrSprWo/CzP/BPSWKgdgPb3C3U1WoWX4fT2dBLZTOxxT1xHs/Sh84D1oWFbCwkId0VSpI6m4hDrOAjw8Upk4SGbTnNo8IJHFT5jTNOHV3efpWkB+psFXyvc02AL6UOel8keWTPSiaVlQxiZ6CqJCkJQWDsQsKs5aonoMojMCbpwxZoTvZZr1EXxRPqO4Qr7/j7ZDy2VhzZSkVZJrWNxJIWr8nlJvxdAtyepqo+XaEyvAdtRIoxvG4Dq2ywjKIIkYk4/saGS83a3s8reeIwiAq5Wb062tzo7Ta6mcxyvgznyxBQNAhSUUR4FgZB6FzAEafRWmvlJ00Yb/pJtsUqNniRpICqpAqzdg87/z3LNc1z9jEtAdsKYO15OZ2dMd7UtsZHKMVYi/5731qw6ZUv9W2aV0EYVqrVza0tt1L/S8KLlsfqmcUlY3J9X301d9ViV4PjrqoSewtB899DwxX2CFKUvJV9rF5NUTfmlQ95Z/Yf8SEIMt/6SC8W4lBbJejFAsg+yOdcPh/l8/Nsln0evnawUimIw9QyDBbDYZSK45PX0/k4PNtaLhau0Qx++lP3ySfBg/tRsxFNJi6Kwtks5YKQjc3C8WvbIOwpZu0Z7S7nUXm8x2eNByyDGNEksidLULDEds8hxpMB9PjvVgBEdBCbU1g0XJIm31hVJ/wD3+PKOTddmdRFzqWcWziXcm7qXORc1rnQucnKpA7IOFj1hhScS91CULfXLUB8e31f6cNqJmJzBxkhMf4A0TScu+SERpoqMxC11ZC6gPai5MA9lMvl+/fvi0fDeQkjTH3xUF0wC0J9ggQP+ADN4iAILi8vSXiazSboFQqVcGTK5XKr1QLIazQa5JDcj9qddA7FcVyr1crlMqLADAvgArKYhUIB9JaDfzQaQVKGUwZJExYYkp1Ada1W6/PPP//000+Pjo7S6fT9+/cfPHjQbDZ1Ug6HQ7B1pJlJ5qfTaalUgmIZBAGsN9InZVkQyiAUW8EvkkOB7IK6aD0+Pz8Pw/CHP/zhxx9/vLu7WyqVaN/+9NNP//mf//k3v/nN+fk5E0aNhDqwvf4jr+Zvz3W3zjXbvsYjHbtvc+h+d0JlskPKs6heWxLXP4m1BOigVJwMs1gsVqvVcrkM7EVGJDRZxmgqlYvNIcIXJF/BGdJt4D9RwlXwVCgUCDQ9gWZBn1JR0E3yr4j/qmPA/hPhNR/EX9GVb4knWhrCCyx9AxCN35OEU1ABjLM0jStKdquFJsNui3pLUkA2lXwFYQGydlHnpgQxJOvJZ0mJWM8OxET8CLBLMZfZqYT/qgECHIcYFKBTpCdbu9K0sYLREDmlLipqm63WrPVI9DRePxhrWOugYlectzw97r9eMxgMXr58+W//9m90h1CHYFeczWaAkuVyGeBYiRCbkqYfxD3tS/IzZMmQWsCr5aN5Z34YjUZ0raKOwpmCfxSKH+xgp6en+XweMWj2OnkPsoEj1H5wcIAiSjqdBt4ql8vYc/EpdmegrMJJQdP0YrHodrucLBDzYQcjl7Szs2MLP2SJ5I3U3j777LPt7W3mniQgtDnj9cRUpzooqFpcKq07K0kv1IzCpGo82q6ZnFYokJM0SRSyNE++hc3rvOTZ4mheypfccn8vJW4YVlZTWGqzQlf5UM5QC9FqEgofFK+Nd1CJy+a62vFY6UClPFmPdmoPF8FqqjlJhxEYVIi/NU+zoRo5NvOc/cQ6icnXTi0CqPTohvlSfFlnxEyF/ihm8GQfGFLL2rN+btohgf+ogybFhS3SZKeHBC7la2cpfgwOW7GlFds8ny1dbGXs9fRBWiP2ABIIzm3TZyC43Opre/RbIUo6eQXoW7ROp9jvmTL/nshy0ikrub1fx4L8VgxaR6f9wa50gcgaH4mbCbjRs07SC6Iocu4tYfgapDzxn7FzkQucCwKXTi1y2VkxPy2VJtnsYr5Ijaep2Sy1jII4DuM4jONvOgyYoTeUaZPcagFn6pS/QXxca9CSdteaa1lbNgtNWvUPz6HuuuLEWgLH2itJM9dHWPeOKyPzbfTHIAjyuVy5XI5SKRavV4pgm5URq5onPA6KHXCbYngxCdNJRpSebJ39dNs54ckR2KKIeAM67LRP2k1ejWVJ9Rt0V0SEEs/DA4jJ1yj48azCMEyl0tlsKpcLc7k4m12mUlHgQis6EzgXhnHgXBy5zY34hz+c53Oue5laLly5Gty/Fxzsp0pF54IoCINUKp3LhR5Zh8sqYidnvp2TSQUeL2LU/4oA4QHEbOPsn5ytOqPXos9eQ6fHaFZhRi1EnO+i8siNWQ8oqcG9WCyiFQDy3tcCK0ajLxw5l17ZCUITzqyIxrFzmZVz3cy52arv4fa6vW4B4tvrewgQsz+qUzsIAkQSq9Xq+2oQs4NzANRqtUajAVKMbCgwAT7yx8fHFxcXGD1BvUT5kc5fPNzVbDWfz/nNdDpFVgLEh87uVCq1s7PTbDb7/T6m8xzA4/H47OwM0YZut4v2AvA3x/DGxsZPfvITLOywBppMJu12G4UHOos5SCBwkWA/ffo0jmMkRM/Pz/lqpVIJTQkw3Ddv3pyfn4vdhmvceDyGk4hZUL/f/4d/+IfXr19XKpWf//znUAuxPAL1zufz/X4/CAIch2TLzleoVqsgyMQfKDWLeqlmWz6RLwJqPBqNyIeVqQq+z2aze3t7P//5zz/++GPSqrOzs6+++up//V//11/+8pewoUV/ENcDlCHJhVRIZLFOa5SxNoexTa/C/kT/tF1CXnPrO1LMvOBb8b1HVbDqIno9ylm1Wg13KVQFqGSgL/zxxx+fnp6iGTIcDs/Pz5vNJmxuCOyknaw1tbNJ0xbgDIhWeTJ1EVBm/oqaCu+sSSWLNkteAIyDWi6qGiUHBWSeYwNol4hXKC0wOEJ71eGuT1wsFuAO5XJZbIj5fC65bc+iGozDdlKLoG2JdcrhJRgnpIZgGlo9vfZsF2LVKbHhWYhNLxliuNUsKBFSgIAZE7ofeL7CR1CGPT4+xpYQ5iwyNRJ13dnZQW8EofN2u91ut7vdLt+dvWU0GiHnwhiKW2SBBq+HXXwrOz8/rFnEQw0sWGNfnDSQsQY7YRien5//4z/+Y6vV+qu/+ivwzfl8ns/nAbyKxeLe3h6gPCsFbBSCIfUq55zERsSxlb45f0grIlAdm5hYk+VymZ4JSixA/BQU2fNJ554+fRpF0Z07d3CBoz0F71PsEGu1GlIh6XT64cOHh4eHQRDs7OxIGSYpeMcumsvler3eq1evGo3G/fv3OeCm0yn2dIgmlUola33DYn/58mW73R4MBs+ePZtMJgcHB5lMBnmf+Xx+dHTU6XRevXqlUhxTHeVikETmHmRhMG52cgBfZd1A7aPRCO4es5RZreKWkGKo32EY7u/vL5dLqp6MKl0InoO8V8xT9cjyAb1Jtdb2/bugw28XZjrtrhLxrP+VdUW31ogaWzVO6UEz2WCV6usIyUpixMxh8ZVU+bPog4riOnNt0U7osG3U1bbAX3EPdIEQllAPJoii8Mw7sJeyJPUs2KashLfV3FfrmL1zZ3p+FS4qEhBrj6fBipA+j7vqca9vpF1dspIWWyFO0BAJRpEql56aTektPCFaotjfmooQnOla0JGk3nleQ7AngFhoflI31hoYqEnOtv+/nSTfTXH7vbxJrwuHrmu68pq0vsu9JWVkPJhpLfx0w2u+gaUSEHAcB/F1mHFsX/nWsMt9I/XBz/L5Cr51iJJ3+61j9b71gCSSu3Y8r6urJdV4byBPrNUHv+5lyQLPlT8MgmD1w3Vf7e0mFoaR4Thrp1UdDvdadi11sFlvSauY4Y2SJWJbWWH7YlV0bCzqoc9eh6vKTlYGxPtDDzC1LFpxcSAH8Lm2Hc2+mJiEc8Q5F4apXC6/kkIO53O3XCLmIULGN7tL4MLlMi6W3A9+EB0eTmezOI5dJhOWyqlaNb1YpKJRDCidz4d8y2TdyNrJeI6UNifywGXr5+kSrZ/CcLX96uurFuipeXjsbGcMMO1O5QHEug0SHAHEMpYnzlGBShJnxKWjySQzmUTXoOQ3EuKcC51LOZcx2064UhwOnZtyLq6M7NyKaBwaHC5wt9ftdQsQ317fR4BYQIwYfCSQHNXv+4byEdre3t7a2spmszs7O9VqFWldZHl7vV6v12u1Wv1+P51OVyqVRqPBGSAUDBhLsq2lUqnVag0GAzQoXr9+fXx8jHpjs9lE8/f8/Hy5XG5vb0PgRQ6VjJrOWcCFTqfz+eefP3/+vFgs/vjHP67X60gMA21Uq9XRaNRqtWq1moy8dLS/efPmV7/6Va/Xq9fr+/v7GM2DiDWbTXUy8jUbjYZa+OM4bjabd+7cKRaL3W73yZMni8Xi1atXw+Hw8PCwXC4DSCmZ6ff7pItK5ADd4C0CR6ZSqdPTUwYKJ7FyuVytVqEbSzqW2ItHDPORoZhOp2dnZ5eXl5lMZmNjA2O9O3fuoJUJ+vN//B//x+eff/7rX//6+PhYFE7BZ5YTZFU+PED2m0aeq6Qtz17Gtrl5qn/JgPu6lONbo3ALodrb8DpnbVegiGNMWkjo9Xo9juNut9vpdM7OzpxzpVLp0aNHX3755fn5OVALmNfGxga1FuJFniAopC3LSwAXBjpptoRf6It3RlpRbH0M32ysKXIirmgAcPTpA5nJYos02ArqKVAW5UfNyCKvqe1aGbtbNReL+iECsryzvNwAYFSgiWVBsmrAesBx+Aq8gNdYspJAGbaLwWAAIjyfz/FMdysDPd0qBDfwR/5Vro+SZwV9YzcD8uAmT05OwO8gnI7H436/z0CxXezv71Nzms/nJycnFxcXavpGr4AVenx83O/3KeR4kJnt7NYvrazhh+32SelP7yxQeUaPSfPKEmSUKU0mk+Pj416vt7Gx8Vd/9Vc7Ozunp6dY2IEqbmxssOGjq8PNS3Q4l8sRoKvulc1mu92u5FNlqMgxwSWFHH7Jc0Eeh2l5eXmJMDfA2Xw+Pzs7e/bsWbPZ/OEPf/ijH/1oc3Mzm81StKMzo1QqUbcbDoeFQmFra4tqB5nG+fk5TEx2A9RgnHO8fjqdUjfa29vDf/Xs7AyZeL4y8wclYmb+kydP/vVf/7Xf73P0MHkkTTMajV6+fJlOp7vdLo3/WhHs6qysIAhQ0kdY4+LigrNAahulUokdGzTc9kSzWETMlxcNEzWdTnOO0P1TKBTa7fY///M/P336FPRZmKDlv9t00XZ0ejttUtnzO17asoIVRdfqhHpSqqoI8mh05175ykMJhQ96nnK2d0EEYXVXJH3bpPgsmjBvRUHF9oNbeVy3klmw3esCVvKrS2mw6MP6W7lK2I5p6zyhZS46MxUI2w7Ps2ZF6J+kwqGSiQ0SPMREDfLiXHtbk84dCi22LQk8155NOpeTBbPQXCr+cWMI4NIi4FER9aV0IFrgKUkOtexLRtWGcBZPCdNpoP0PQ4fflzLsBVoegJvkOF+ng78WmE7aAMpaTY3zHlnY08a17EJPCNUjNq6mkAsCHV08CRdHYRyFLrqqL2EYxPHCRYtgsUjPF+nFIr1YZIIgmC/C5TIVxyFfAojsbcN+EMQJFfW1AacVvLY0BQ9Lvc7LURR4bzqt9V20Sh2e7sdaMbdk38Z14m8eROjtb7a138JqvjTzO2zib2/gqvCI1YL3lpvGVneiZiyFypZdkVyhXkhjg0+rwLZ2r7Ai/pYjr70oKcNiNzdvBUkLSGNo60w6i7WbKQrNZDJBQB9MJgxScRzN59GqpOFA5oMgCMNUGIYudrGL0pmoubFsbizjKHIuDsIwCFwQhMtlOJ+/FepPpUK7Tr1tTfuwBjZZELWLNEn7tWRt4cJ2d7XbLBuylfLwmjCsAIiF6W3Tht067Llpnz7Jqe354CkjhTyZTKaLRWk+j66tOF1/5ZwrrfQi0qbqpMJlZrUpZa+Wr4LVb4a3KNTtdQsQ317f18uaNamLud/vQ/h639hUPETpQtbrdRDeTCbDe4o5OB6PgYnL5TLGUEi7cnhjhobRvJpHCPGBoqSmSu7Nf6KcC7IAwCRuCAfSYDA4Pj7udDqbm5t4wXW7XSE10ISn0ylwgPyCOatGo9HFxQX9zvQv67AktydBgg2qw4zviwkSDFBc+5xzfEEbmkDzkXeEYGLQExiUMJsA+AAp0A6Gv2PDVs9gB3SGLzUcDtvtdq/XA8/a39//5JNPdnZ2dNa22+1/+qd/evLkSavVSjbMevVnZ7TMvCmRdMf2lFU9JYe1f/VhiPBagNgz37DD5fEmbAIJDfzo6Ghra6vZbG5ubgKgtFqtr7/+ejQaHRwc/OhHP2q1Wul0ut1u4/V0fn4OUhNFEdx2SUUz1aWZWyqVhBXy3CVKwG9k5CVnObWEKz5mSkDaleq0WGmwbiH1W/yRSSsBB8ks8CfD4RDok9cDfANSy52ZAE4xtGAIVGLgJ4rEYVss+SWSZIVCASIkgi18CkoyzohCMBSWz4hAivAOmyaBuSsTEB43mUz4jniaKZRkiHjD6eoCGRFngZjSrcSFUYCpVCpq4T84OEByodPpICy+s7ND0wAWhaPRCJFc/DosLdcldPpcQkPwg8E1ZVa2BdgmPJZ/J762pUCKU6y+Afiwn376KT6N8/n8zZs30siGd9/tdkulUr1eF5sY3qsaDAHjgDK73S4NKMDHDBFaDRsbG9TkUPVBMgiol01yOp2en5/3er04jqmWZTKZXq/Hvj0YDKiKNRqNcrkMPZYKSqfT+eqrr1AEwtoUFQII+Ofn569evUI6KZfLdbtdvl2n02m1Wsyfy8vLVqsFM5rlwAtOTk6gK1KWQA7ozZs3b968AYNjPFF+p1AKs1hekRQVQKs7nU6n0wFPt+KGDKOo7vA3pTDD48PNFUop5FN6XFTb29jYkLC+CopM+08//fQ//af/9Pz5c8GOli3rjEqM5mpS+zvZwPF7q3OvtnE2Q2ur5aEAMgIFIBbCa2+elQgi6bWqXGdM5FUZNRr2ZbwzFRHKhJYkpYVJKdFqEKt/X4OmvVo8cQ98Af232yNjwv4m00h78zKTlBec6pHimLPnW4CY84jgxMI9ll1rW1WsnA4vloK2JpV3D9Jl4hJyIUliC9B7sJrYykjfED2q7cCqz7PWWEfCzd1VbUo7DTw1AA/CkDz92808lXKLxXxVEnhX6gYE1+ux2rUcUi/08kQMLIzlCbDaEMhDzew897q4ZK3GuMmTylZZVPe1RUdJRXvYkPUPoLUxjqN0OhUGQRAgNhEvl8FyEUaL0C2cSyc0iJfOzZ2bu2U6tZino0V6uUxHUTqK4ihORXEoRvI3I7qCV9cyoK8DiD0+oz1A125u1gXBVjispLWtrn0rQOxxKj0/WwHxa5Ffr4vf42Pa/VOAnS25eVztG+bxkh3VTC3L1bWys2t3JO0VNrbUbm8fiuTU7GhI4URbgffR0g0TUcDr5HBGZVgS0l5ly3psWoqJejRttUCFWG+FWizbaNCpbWIpIBd54iAIgyAVhqnVPS5haRsR7dA5ZnscRXEQuDD0kylbz0haCyS9Fi1A7FWJ7ErRVLdGfB5f23oDJjcBDYKGkcjc7l3ejid5PT1QicDYrhfOMgzq0a50qVTuqkXqewDEqRX+O14Z02WdGxgUOHBuurKni1caxBnnghXR+JZBfHvdAsS31/cTHRZjgtwPpHg0GiFf8F6ENd6N3mo5yJHKSoHUOYdYAbRZJbqQekhsSDlohwTq4gW0bAPxgI3axhben6SlXC4DpNZqNfXPcrqQe9BpCKey3W4j0YCVvO3c9A7FTCZTq9UKhQI0UkFyYIWEs2QX9q34vgCCjCo96XDoFB+Q81i2js1h1PzOlx2NRuBcw+Gw1+vhRKRiqeJUSUkISSQ1Av+9vLxEoOP+/fs0X+vg7/V6L168OD09xVxL7Tnuar/bWmtvr6osWQCrHuCuURb2SA0edpzU0XuvVj7PVWktGdkjL1t7EICky8tLSgvz+bzX61FvCMNwa2vr8PDwxz/+8WKxQGXi+Pi42+1ms1mUQwCPIBnxQRoWFos6akEt6X+35u8Kd8CapdIgcbd0Ok3/PoIkbqXbANeVQDmXyzGxreKbzUMAiFl3TFRuT+mfc450Wvcv5S8VCYRHS3HV9rLZtjKW/3g8rlarOGJJPhj4Q19fSTj7kvApheD6aFkhCdMUaQWW5Xg8Rl5WcSrvM5lMWLlAD2oSBN7lndW2z9MEr0ToE/0WtojRaNRut9HZ2N7ePj091Uii9/369WvGTWG0hW5thK0c0raEfxhAbHXAPdKWUi9LBLuOBComJs+r3W7/y7/8y/PnzxuNBsI4mGSKwK5pBurKa+DVgp9yQFBUYJzz+Tz8XHzb5IEOrAkHvFgsKqkuFAqtVuv09HQ0GtXrdZ6UnhFFNWzl6JmgGAatGzAXfSEkBaQuTd0RzBTTNrw6U6kUZVTAkel0enFxwaKjwlcul3u9XqfT6fV67NUMCyUBxoSfNzc3m83m9vZ2vV6X5rUlqLJ7UHocDocyKeWLUwetVCo8lHw+jxATWBv9CmguTafTer1OYYPB51BgPmA8ILBM5YTlcnlycvLs2TPQec8rxk4VZ9pmBduJJLXW1ub30wYFwLo6o0ViXUvEk0SJbVvRKrNtMR7knWxktoCXJ1VkKysaFu2T0IE99zMLHlm2VJJapfqNFXxXsq0kWYevKPnqAxAY5PkpidfJ16cSI90qQRtW6IbJyUatFN0zEbKKHBZZ0C3ZR2AbuiUnTfHbCoBaTydrzGVLX2p9kLI2bGs9OE1Fi0uK0+d5Itm5neS+WRUO+56LxSKaToHe33die4heki56A1JsZV49AqZHfrSGtGvFWL03t58rCrmERAWKqbwhwmByvXgzxPo9ro7sMI5dGKbCVBgELnagmfFyGUSL4K3E59IAxCuHOjd38SKIlkEcpWKXioPQBSkX0P4dBEEsGuY3o70iEXtLMqnEKgKHBWfXGtN5kL0Obs0Zj19p6fze9uXhj/aRXXdYq6a+llFuy88WrdZekayxeQDxu5Tu3u5Oif48C/h6xZjk1/GqZSKtJ8N1Z0Rvrfi41qN9IrJHlnwWxx8nvjZDvrinNGWfhTZ8r1jlyWVY5Tp7INoxUeyhOzTSz1ce5SqkTQWB+BbhYhFKwnj1vAjaGedgbaXTO6898Wtv1iV56B5Y7BKagZ4UlWcunXzc7qrEs9gqSR53UpuCMoDO97VusWRzaAbO5/NMPr/8oPYON3Mu69xkJSUxXRWonHOhc1nnZqtlMFn9EDiXX71+sXrx7XV73QLEt9f3ECBWZVhaE9i4N5tNbNzfr6KWy+3u7sohxK2sw0WSBX1OpVLb29vlchlcErlDkpBMJtNoNKDxYkkPQAAigAFdJpMpFosvXrwA16bNFhYhUGy1WsVNPgiCTqfDYa8eeVQaKpUKirHYtVcqlcFggHYwuhPg0fRH12o1CL93795dLpcQ3C4uLur1OvqVrVaLLyjPJQAyBqHRaBSLRcBoOKfT6RRwBByw2+2C+eoshO0iZ21gaDCU6XTabrcBlMGtMFyCAQfqQfCEZCpxPL+kVbndbh8fHwdBcP/+/Z///Oc//elP5X00n8+73e6nn376v/wv/8uXX36JJAVA89rmSlGZbAHcqgqsDYNcwt/Z0jw9KoH3sxfBv5c8XxJTXquUlwzoxVpimtERL/tBJFnK5fL+/n6v18vlcsfHx5Dc0R/wbItcQtZNqBwRD7MUNNnTCJPOplsnE0YibaNSANzxeOxWtlrMDZUT1CnMZynAgilGbUYFHhnOeBZDcjC3abNlVXhicDbl5m9Bt5k54v6rRKRP4QYEE/B61otnHiIBSmt4wuKSeoxcLJDgkHGcrJBJGNALZn+r1Woi6AkklV8foHYqlUKyAPQfhp2yGniplF6SSj5eM/4NDo0fsNsnyWjW/i4ZcyvvYoSF2ljCI8g4o9TpdEAkkX2AbLu5uWnb/fjKohNCE1ZVI51Ok6HBgRVNEsY3f8tIzudzSXWzVUrwB3GJer1OcU6bm+wK2eUAr/f29g4ODjgj1L1BWUXiS+AdqOQjVU89Fdo7utIg3RxAGE6iEv7mzRteXy6X2b2ZDyrhpNNpJpW0VjnskDmyVo0yunQreQfmlTRqKVhKhJf9X99I6L+87HgKshSbTCatVqvX6yF0Lj0B2/Jv7X3spmrbPy3Vy/rM/N65wy6OF8vlDBPaVcYsnXcPSlOVRciC7U6wBlD2FLMcKKspIUF2/bk9KNlk7DnCgCOAw7/qQPS0L61uo9V40YtV5GM1waW1eT6vEZBK4Yqii8TEtPPYm0QNk5IJ07tWq1mA2G4gfN9SqVSr1Sg82zv3aInckqdCQMnHrTyKpYbhjGSk0GEVM/T7FcM0luaMTmrhkuzz3s0LZpK8O8eiPEtVOhUwZNEKrUFxrm1nhtYpbz6fzxfT6WQ6pe/kvePzdcZlN6DDyfDe+3PvfLERjl0gNlS47tN5pWwJ0XDThGTM8UjQ2Kobz8Ka+lwdCoL2Uql0HEcr4dQVorScu2gWxEsXxytEOHDws5fOLeNg6VzsUnGcdnEqcClxomNQ7yBptLh2d0pqdCjg8Sq4GklPb8frLfD4kkmwXmRkT5wtCVjbdgeP0ay5an0dr9OX8NBhpYQ8rKTkru3PCFYo+01lafwnVwW8pJS/LVF4XX1JirT2ByanFclxxgtXyDgbnSWzO6OsqE1bthmwBIhnOGHFCbDngme1p6csiQYLmyatTTw5L6u+4r0+DFPaCVeHVMRdhGGQSgXp9Nu7Wi7j+TxcLIIoCuI4SKXCbPYtQMzH8pQl3e41dnhTQgMolHxtFOqhw96qsTQOD5S3hiLX4RIaHx2gOjdlUOT9oTaQZNRhLQrZo/r9PvFqMY6jD4tJIufmKy4w0HCwcqjjP0NjYReuQGH7c+aWQXx73QLEt9f39VKIAIZIi02v15Mp2btDDwSCAKYK1rWJK/SsVquksnDrkIzg3AL3FDCKoiWMYGzrstns5uYm4p7T6bRUKi0WC1G6oL622+1Op8NtjEYjenLv3LkDx0rJA9AzHvflcrlWq0mq9eLiolqtdrvds7Oz8XhcKpV+/OMf0x5eLpfPzs6Ojo4ePnxYLBY3NjZqtRrcLjIW4GOayokw8BObz+cXFxenp6etVovgYzQakbpw8gFtkAVJg1WdSjwO1DCgj8GapJM6iiKUNyHyyIZuMBjEcYxSJ/LQnU4HbuPOzs69e/cePnz46NEjaQ4gKvrZZ5/93d/93T/8wz8ALidJizattSRfGwfYrMOiw3qx5Qu4dU27SRjiO1LP1vKdrwOOvYq36KiCLwH+gIey2SwBB23vlASso85VTb2YyoG63oRvWvDFmnFZwJ1JJa8tZp3qB2IWk/+T3ALwSU1CMAd2PUwP8fflFoJasZpD3VWNAk1OuTDzXdRizJsQ0smKzWpxcp809FkM10IMMi0Bq+KVAIisOBHlrLad5yhim4hZ+0T8wh1coo8btWiIJHwuoIC121YKQeWgWCweHh7eu3cPBQzEbcl1O50O0iKEtm7VNOdpaCYF3dw6I5QPRoo9mMB2gos1KZK4wF/WKbi8/LjIVSzvBpiy3+9ns9mtrS35d7NGJpOJhJjlkVUsFtPpdKvVmkwmjUZjY2MDyzg2IqTwURRhgyLTQ11kPp9TQmDHA2miH6JYLCKhu7Oz02q1ECrBm5QnAj4rT1Hp/JZKJep2W1tbfDRgK6uVyUw9D+4wqkEoolDvZKOGqtzpdFDV6Ha7rVaLLysASy5qlBDA15gkaI5vbW3l83k0N2C7UJ0CidYaYQksFgtcEIEFYRnDI+ZJcXSiWhvHcalU4lZplKGbR3vg+fl5u91G9YLPevPmzeJqg7yFrZM7v1xSLfD0+2QNm2u5WLytTqVSqkYL2BLl2dMRtgCx6k9J1W/bJ2HXIOMpTUm9J7olqoJYy1bRh63csGf+ow9NertZ+Ez9KJgNIofCu0mNwTJz2fytWLCQaE+LQx0k/B5BBko1MpQLr5pNsZBlhyvAVDsqP3A/OqRoSxLqzWwRoGxlSa3MRRIOEJcCAk8AAQAASURBVE3YvoZtWfxWe6CrR8GSCnVG8yY8INq5bLHB9slpzlgE3IOn9Z/T2SxemZ1+AIHj3ZWFBPqsxWvcVbVWL/jxrBftlSQR2yiFCcAcYH/mjGbb0U6lt/KoiBYSFbVfL165oIWBC4FbgmAZhtNM2M+mL9MLtwwycRzGi7SbB865YOnCIA7TUSpclgrjcn6Szy7SKRcEKRfGwVu06gpWbiEkb4PyzAavq3JZPQQb8rmrRmRr0WcrPuCNhvfRnoWXcOokQGyB7KRyrt0SPZzaGblhrxXD1s+uTAze+eYEE9XnBLboSZfY36/FDdeqM2uVrX1Z8sRJItRrBTek3eRx3t01iite2nKDJ+Tan9emJO6tTPaaJkv93eqXsm0EII7DMEBfIgyDtan62jZKjxxw3ejd4IS5lnTvVWq9N7nZGdIrtNxQHrOTX3ya5M6pt6IEtVwuo+Uy/iDb57ek4Hj1HNIrA7poBR+HBv8NTJdDsHrxLTp8e90CxLfX9/kiaQceAvUgzVBs/e6X15LmXfBN6vV6v98HOXIrrWHwhYuLi06ns7e3R0dtFEUoPGLz5ZxrNpsPHz48OzsT/gWPZjKZEM0Mh8OLiws6fyuVyuXl5cXFRaPRePjwYa1W400Im9ABHI/H9Xq92WxWKhUIYrTx1ut1pEIBiO/duwdNjPyZ94zjmOyaXBEVyMvLy0qlsrGx4ZwbDAbQmelHfvXq1Zs3b0D31EoM3gQgDmIlpjBCH+gjV6tV2NDtdhtmNMId2OWBskmJgu+IBj/6BshHDIfDTqeDHOd/99/9d3/2Z3+2tbXFl9JMOD4+/u1vf/u73/2u3W4r0oXdY2mbetASxBC6pPTM45pp5D3DK2dM6m6ICTzig0v48L4LQEwcKXDTGQfeZIRnZzV3OJ/PmZD5fB4QB0mHbDY7Go3evHmDR1mxWGw0Gl5Bniyd/AcyUblcBm4DuxR6q7xLCDL4JlxIKiu0h0Oi5A6ZQhJOlUICwMR4PAYMtcws7rNardrWWrm3wYmWuotGDyVrqzqCuqWIVGwd0OX0lQG2JIVJs79gX15D6m6pjnJGGo/H0HvJ8EEJGRzopWAQAGQiGojfx+yVhK5ADZQQZqvLIqcoigwGA3FFkaCl7HR+fo5+mRK8zc3Nn/3sZxSiLi8v+/0+S+Py8vLk5IRpwyOGV84OZtuBXcJT3tYn1tLe33dztkAAaJpKOFYe2mIromzbRFf8cduoDooEjE7toVAoINks2y7QK5EZmUusQflngrRawIidkAc3HA4nk0m5XK5UKtVqFRY/c34ymezs7Ozs7KRSKZSIgcwgQkI7QtODL8WEZD/f2dkplUp7e3t7e3tbW1t0aYg7DL2XScvjEwOI7gHk7PGmC4KgUqlwvnQ6HQToaWoRrQmnrGw2C6FYDo2i8zOGQqM4DiD2OqMNBZqGYR3S/yjDiMoqJQqdXzwFboNPEQIIgtntdvnur1+/fvPmzcXFxRdffDEYDNYauFu2js2lBSaKfGqR2d8LI97u6svlMjI5Z7LV1yJiXlZsk+G1Z9Da/F/Wte5qL4uc6D1HPsuo9fQl3mUohPJohki7Q2wv6x/oId2e8qy7qmOTpG4JA7JOpC7R+KJXWnEA2+JtJ4NHOEiyz7zj3kYa142PrVWrq8ZOTg/+Vp3Aq2p4H2QB7rUiWt6T1dy2m+Q3HxpF0ao14X3redc5xSWhxhuK4kncJzmGtvHfdoJfN/6WakoUhOCPnoI3B4Rmeo5nFsf0yATWsy2KgzhOORemwkUuMygWzsqFwjwYT4PSwpWW81LsUs65YBln0/NCaVJIzbZqvY16v1ScZDKRC0IXp5wLvaHyVBo0Ub25kcS5rmt0S4qVKb5NPjVP9EC6EJ7KRzLodcbMLYn4e8K+4rTa0XYr1xNPQ0D8ccWEHnnc7gzpVCq+Wj+4gQ2apErYmebhs7ZabzWdvXVnbdCiqzLHulsZcurOkxGR/lxfnxvQ/mZFaZJIsUvwu207RXIbXPvn3kyz9GctDVtQtLMiimLn1qqI+O4vyRPN7gzetLECd2vBXG/3S25WSc3Amy87t62JN4/A6wG6zpkmaSWa9HWEVYAwYyaTCT9ItM25qxITBecWzk1X0HDuqrLEYgUT55wbr0ztZu+i5H173V63APHt9f/EpaCBLZhO28vLy9PT0/Pzc/Q03+vdvN/o/OC8pEcbHk2lUrHdncJlBEkUCgV0D+XDgy1Yp9MBVHWr1nvyJdDh8/NzWJnwlGu1Wq1Wg+Yp2JSu5FqtVq/Xgfn0Vnh8kTCDVqRSqZcvX15cXIALcHRBssZNS1RHULlut4tKgIyYOI1gDeORMp/P+/0+IrbgF4DI8J1B+obDIbk6qqkYK21tbcHqspLHAApAJErS5DMDYAfCCBQex/Enn3yyv79v0eEois7Ozn7729/+t//2305PTz1RVJdw7LXoqqdhZ8Mvd7XD110160jGx986o74Lg9LaBzkjleBMK5OXBlsOF+qx3W63Xq+jSTqdTi8vL4MgKJfL7XYbIqT97szn+XzOfBPgK5a3Jo+n+Cb0E0QSpBK4lplA5MrU5UELfQZ4ZarjzaXOLNAxEF6IP6qyWAFKBF7xP9QKtbxmK+JpdbTBrJnteGoxITHHkykNhGuIomSYkI/EqQF7RekC4NimNPA9WVYqZYmSaeeYZA2sd7Z0MPjK8MWIxcErRYmVeIhEMFGbPT4+7vf7esNCoXDv3r2//Mu/rNfryILzSyza+v0+NFi4tEdHR+fn59adaW2vt4ehrCWefPDlQSG2w9cjyEiRUHUOG3bbfnCJAzJWNB2fn58PBoPNzU1kmuG0Uodghzk4OKDCxy8Fo1OtRPKo3++jmauHWCwWqSOihIAt5HA45EMpurTbbRovmFHlcllNKtIYCcOQFV2tVu/du/fgwYNqtco2WygUer0eMtzs5+DUaA2z7tjzKUwyiygoHhwcOOdQlgAor1arkkjK5/MwjlmhqVSq2+0WCoW9vb1qtYo0HkCz3HLkIYZAEx0MION8F3ztaFxg3jrnMGRjh+FNMIQkKYIfSo40HA6RyrFU99FodHx8/OzZs1arpeeuIqtY5BDqpeRom1itEKq2F7EUfy8AcSqVyqTTmZUcjSUFe4yhpFHqVa5W4HnyeC2xFrIUN9kuUklLqw/aQzAFUqh1wLP08brOk+5ANi3X12dTVdVHB9l1hqvJdpwkTHwdHuod7ta905rUe02+9incACcljews49UTBPBIf8kvktSV9lx2vcFJivCq7O3x3ewYenRRy8D9xigvlYqz2XSiIfrmYMUDntZiOslGkyS51ZOev4G66BE5JaWSxIj1pNjt6aYiLpXnrZz61DBEjCG4RxNG4tdSarqK2/J/YRxnnEulM8tC8bJaWTZG0yjdHSy3R+HOcl5wi5QLXBDEhey0WeltlC73mpd72516bZTNLt1bbzoWo/NwfE8O2CtluXU03rV4/XVHsycvZtXPBWXa1n5vq7Ez0FPr9trnk5CZR9mxvR1WK0M7p3j0npWcbTySAkkmk4lW2tPXRhpAycbmTmi1XSy6GZkbKyyRwYa9Ex1A7qo0h9UUhjSgpkyaxqRUYw8m/TnlbUrCtltO9wzbwP65Z+ogSBdaAyc4rAUdHGtrkHbWkRfLDFnPwspc2D3Wkw53V4nYVg7Ow3/XCp444+Dn2SO7hAmNzQGtJondaZXmi67hrTiVOtxbuYylmjUF5sLP8LyavVNmLV9NUnX2xvCGIaZKZbPhcPiB8cdkxRfm55RzOeeGzkXOTZzLOhc6N13512FSN3YuNpjyLYn49roFiG+v7+ElhTUJkkKpe/LkyWg0KpVKjUbj8PDwu3yEAF/4jPV6vV6v0yApzqBevLm5iUgFEFWhUBA5EW3iV69effXVVwQHWPqI/Tefz3GNhzZLsFWtVsmZ6cQ/OTl5/fo1whGDweDnP/85lDHQVTC4g4ODYrHI2by1tVWr1brd7j/+4z/2er3t7W0+t9lsupXhGF+h1+vNZjNgoLOzs88//7xWqx0eHi4Wi8FgwDcqFov1er1UKpVKJb77s2fP2u12tVp9+PBhvV4/OzvjPyEqcsLBfSPQOTg42NjY6Pf79GXDd37x4gWZP8RMWp4ZXrAJqM3IK//0pz/d2dnJ5/ONRgN0WwFWu93+1a9+9R//43/87W9/a+E/RS2Wf20dacQdVvRv2aaWSyIY0eu/s9QGm58nTZA8zstaebWbqxdWek/gr9dsaDlTtrA/m81ardbr16+BwPL5/NHRUafTOTw83NnZIaYkFxoOh/wh+CxyIpVKBcYfTe5ogFqjDLfqlVOXJaAkVHemdK/XI/tC8zSfzzebTYVx0GwZtPF4LG1rFJOl8MsnMgFYof1+nwZ8+vHVQg5XVzqP4gvbRloqExLwTafT0vg+OTkZj8d85UqlwkejaKHAHRVLtAXArcB5vTzHOccNU2eygTWAl7SAUWGWiDAAseSGRYrn0TjneECqQvGGEJOB1CU1MJlMut3u8fFxr9ez8n+VSqVer9+9ezeTyQwGA7YCwMfz8/PZbLazs9NoNNLp9MuXL589e9bpdNxV9xW7FjyRu6QkcfhBDXEML9/Ia5m0S8MKN3vQgGTseHBQvK1YqtYR+x7aBcon+RYAuErMlJPLqFqs2FQqRSsJeh3KtXK5HDKsUO+lZN3r9c7OzqidDAYDHhlvPh6Phbeq8MCaqlQq7MxIr5LXMW36/f7l5SVvoi+uJhtoy8wfThkkUPL5/N7eHmoDVsSZwQEslqgF5qiw6dmZ+VKMhmzonDFXgf+ey+U4+JQBgrM756iqMpk9NiW+pmKKgcIzFJKI1WDO5/N2uz0ajeTzo3nIyrJKgkmTGZUQPIuYGwihH1D0y+fzYaVSqVYzKwACyZekYL1H2F9L9pQ0BNudDiALGnqULlEmqWToqVn+HTs5mzYZskTbeX+JHcuHx9rlaQ5oGjCdKDbotLLHIi/wGIhMKrlXJQXxbV1KneYqQie98jTaSbagu6pvq29ngddkOCqtGDtJWPUCkrRNqRDOkFotCEsWtvRJt/LVdAm/ASuGy0HDqSfZXDuM6v9Q0VS6xvK7kxp4mE6HqVQun3+Peb36X8+wNEm1W9t7nmxDSXKKk45SnsaRQrukNIStmtiiIAJxzAc1xrHJyKrB86OzNRVNPE+UJnYucKFz6SBIZzOLdNiJ48540YkzXTeeL+bF+Wxjuci4wIXZuFifbjW7d7bPDje7d7YGpVKUywVhmIpXwHsYxkl3QXeNgrMnjWV3A4/w6J3LnuCDF2F6BQmv5136chbe9eocsn61YUOy0yipb+6xOnRS2IKT3XC8MZFhbCaTyWSzsYFcb8gx06s/tIreVtRY350oC6qNbMBtt4rGypb0PItdrxhmKxnWa05lVyGkHMpUrz1irCJJW+m025QdW9LD0WgERqycyHZP2qCdZaLvSIWb0EJ2zajAWfdUd7WpxcKgNvOysZx1AdEylL2H7R5T15duzK1ri7FPylY+7IkpiXlrJaInbpVSNMn5dE43kiMOUMs28/48WehSM5ZNr0QEaTQaaFTOlsvsbPYhEUnOuWDlRyd7THDh2LnQubnBiGPDIOY1C/P72+v2ugWIb6/v1aVysUhAHPb9fv/169dPnz796U9/enBw8C7pnJJ8KZ8KIB4Oh1KIs1p4ZKE6LJfL5ebmZr1e58isVCrtdluNNiKdQR+W58B8Pr+8vOQoFWqDipxiXICeXq93enoKOgPfCoCADAQ/ul6v9+jRo93dXazt4LuNx2Pae8HaNjY2SqVSv99vt9ugCYIV6vX63t7eeDzmllA9BkED2Go2m/TijcdjAL75fH58fIyr0tbWVqPRAFxQ0ygGd4AIoIFSMEylUpeXl+12ezKZZLPZO3fucKDaUC+dTnc6HRCWTz755MGDB5ubmzaKIiYbDAa//vWvf/nLX3799dfodbiEo5oCO69q7RVsbaOxbYKzaJR13nDXNwLr3W6gZnjY8bdOeA/IsIwwL+/yaJWK2xCnBvE8OTk5OzuDdFCv15lLYC78IezvTCYDfABWC1ipvBdMX0CDdZO31nPAmgihElDyh3AJk92CfCkUilkC1qVa0RsLod1ud7tdJrxEjS1p1BnhTgBZkT4IginSiLkvpVfAGnATkGKoHAway5NFAedRqpeElaxiVjSpi8gIvADdCbYdqxEBb9pjk9lvrWDRWlR5jYoyl5MOcqvVYjnzS7nkiaQpjglitYjDNhqNra0tqlC9Xg+gRMm/tRy0jCEBcJ410IcBxPRkIAGvrdLCJZKYsOwST+5Q5ku6VdH0BMRQVzg7O6MYgLiBnibClHDNFovFy5cvgRoltF2tVhmZ0WgEdMv21W63hVVJCHg6ncI9JzsCeQekEHWFAWy1WpQA2XjZlsMwpEA4mUyeP3/e6/Uk4DMajbAwhatOR0ilUqEew7dotVqXl5ej0Sibze7v76vCgeIwFTspC8MhgvXMWcNBCbAbx3Gv10un071ej80EMBqGLwA3r2fJaOtjaaN3HARBq9V68+YN5yNbB4uOuuzr16+RqmeBsHCw49vY2MjlckdHR5lMpt1uHx0dSb4Jfre1sLf0N9ULtW16kvTa1S10+PvSI87lcrlKpVqthlHkVuC1FQ62zb+22dn2EFhUUb9RD41gMkGQAhQEHrFP9no92iBUkNNHywZQ9WwhQVYVVKtSh7in4SD0QcW2QqHg+YVK5tgrPaqEoM3KM8JSB4mogrZLyTv3tRtTULHa7kLT2L5sUcEijx4lzXZ4eB0VQrQtAsI+oO+SjEg1DSxBUgsnOQM1mdn2bYnOJcQrbbeNSmW2J5rfZzKZnHPh6rx7v4anFUbsMVWTgKYnjJAkR79jA0rSSMrOwCSp1uvQB46h607S56wOuivA/sQPFdAjjMmSFlXEyqQzYZhxQSYIUqnUMpOaxKVpbTKaRKlxtDFYToN5BCMvCOJcZl4pj7eag52t3kZzks6kgjDrXCp2QRDETB9PdFhEWgvaavKvbWa3w+gJB69l7ntqEmtnoEeKF+XCGZUzz9zP0sOvkwGxzAO7lDwar7KzpE500pDjLUb8bQAxLosUdsj7WFmepbDoF9bxWHYFkmuwYLoVLfHyCyttZyeSNNy0+Wgt2/oEh6yn8cW/CtZMVjrVP6q7IhEgMBaBRgivnQyMpz2ziBYILCUKT8OTpd4nz9akSI4NaG+WK5EFtPJ3W0izX9bONxU1bbpkWyhslwnxmOxJBC6vNWpWbZUJZvn+kuyz213ST1IAsdorVQwgGCYxGU2nqcvLMAzd+9atERHOOBeteMTplW2d5IYXV8FicOT06jXLWxTq9roFiG+v7+VFcC/+ETbEbNl0UrfbbemcfstWGUWz2QwGzc7Ojg5pEBznHGm29bai2xrRCbWBqLVHVnXYsCANnMlkNjY26HwnY0f2l8MY/gK5favVyufz2CtDw2y1Wl988cWXX355fn4OfgfEQA7f7XZpvZdBtnMOd6lcLvfgwQPyeSJdmDtqilffvdr2uXPwC+hs3Ea1WpUccCqVevToUb1e/+KLL549e+ac+x/+h//hBz/4Qblc5nHAUNvY2KhWq71e7/Xr1+12++LiAtoaNDqANozvd3Z2nHN8KL9xzp2fn798+XI4HG5tbW1vbyO1YevAw+Hw5OTkzZs3f/3Xf/3pp5+Ox2NxLb2TWyFUsh/Wy/e8DiYPh7VkNNu6a/Mrd7WByJK2LEj9/oQzv08w2U57Xbeg7gfMV83y/AaIR033sGLBVpzxSSNCZUqLTWB5QF7/r0293EoFRWGZSvGe2JmHJ6oIrwhYVA4bIlMRAb8Qs4OY3mN1wQDlbxVZJvN5m68q25SNEvmzMCxLWCMItgmARc/dytTIrdMQtE3QnkmgNWnxlEaS7iIKMRX9MzIQPC2pigieDEdZBIA4Ub6SQ5GskzF6cpa6hHOj+w42X7Io9Jg1qtZY/yg7XJLt9mzrbLqoUhA7ZKfTKZfLjUYDWjpFkW63S39DsVgU3JZOp6VhItu04XAIwsVoc0Asl0vUeLjJy8tLqmioMfBQLAxHFVATHuYmCLVEBnleiBQPBgN0olEYn06nnU7n7OyMJ4iwr4oQlUqlVCqxw/f7/YuLi6dPn0r5QTlwuVze3t7GSYxPUYYseg4qQ9wnlH8UlkHJVcxAxxlyExs7aEsQBLSksKBYidRmZL+uCSx9CdW6GGdKLzwmvgVlMCaALNdscYJxE7tTCuY8BdUXRcn0fId+XzziwLl0JpPO5/P5vFvhwraJ1S4We9Z4IA5z3k54Kz6b9Jf3wB3wwel0yoTX68V0s7or8rdU9dQy+9QSq/3HAhZeadNqx+uUUR4uRMmirh7i6RJat5Yxqo1LUJ3XCs0xpNXHAvHYl7aEIH3VtaNqgUgd/fKM8jBKb2/01CTUq2RLbvr60qb39Cvcqv3fIzh7x6tHhdaN6Sn4yH4YplOp3DtE0f4p8G12W965cPNr1sY/9hF4KJun3GrlYmx7Phs1Ow9tSWxHtsBPgITvK0GRVplgtbft3qkUU0j8wbeNL9lsmEoHQRgEy3RqlnfjUjEqzSb5yTwzXrj5W7nPIBNn3LKYW1ZKs1plVq4swjBcROFymYpd6LH1LNIqAEsVBe+7uxvly4W6uoRPhheB2CWfJD967nZCdZNNDx7C69GNPTaGZXVob/Q0xO3/Jtnldj/8JpDLZOJc7mYGsbsK29mWfxt+qLtrraCNFqn1yfQiJS8U9GayNzia8Kqoqb3A++5KWi0RW40aNhVS5Y9P19JgnxHdVRU725FD4OSJjGmSKBhOUm08Vwl1MHhhuW1/sWRwz8ktaU/n5WjegHtqgR5H3htwC2oT0thCpjU10Q0L1vcI+2qg8agMml22vqXz1NPiZ7jm83lqMokLhdT7Wy65uXOxcynnZivdYQBi5IaXzgWr/804N1/972yFFEe3ENTtdQsQ317f18ta2Vqkid69wWAA5epbIgDnAJQh1UZR1Gw21bKUtPHVRk+/fCqV2traEmVDezfQZy6XA6EmUQeZlZu8OJJSNwNgItYUhbBSqcjyDvxUkJO+Mm0+pNZiIZH/l8vl/f39XC5HMz4Ny3wQ/ZXWOlzeX/C/0Hmgt0guYYoJUAQ+PT09Pj4+Pz+vVqt3796FrUZjL4xFMBSGkVBbcp/5fB57JYSMsRKSyxm8udPT0yAI7ty502g0lLorxBkOh2/evHn69OmzZ8+AKkSNTDrGeNAq88ce3jezfdfqBriE0fZap93r2C7vhTJ4Gb5LiA7fYMKgSvVgMIDGXq1WcYVaLBaff/45GiDIevy7f/fvoij67LPPnj59SnwDPRCZVIiBcia0dsnuqu+THOEl7QebgBXHLGUGkkrBZFecmk6nqUmIfVCpVBqNBnxDFiCvB9BkbgM/IUN8584d1ojak9VjC8yBsrb6D+gnvbi44PYIQxGraTab2WwWsjA1GwuwQrrU+pWcnNQtyMBZGvKU4zuKrG01LtXMiBUk2aYYBEJ1tftZIMO2zRLLIgLAl10sFuVymU6CXC5Xr9drtdrOzk6n0+FBU1eDqMuddzqd8Xh8enr6/PnzwWCg6SQesbsqP+euKj941DBe8L5wA0guarn242zu52lhWwDdphPqc1QBg11UAgUwUnd3d8/Pz2m8uLi46PV61WpVxUI5JUqtgk0YhJfNlu4N9YUwzWCoqZ252+0yaXkoOCsOBoNWqyVDwmq1WiqVxDcEtUeJiOlEuRHTtmq1OpvNeGQIpCC2MJvNWEeQAcXnLRaLg8EAM1VmCPccx/H+/n6r1To+PqarkV6TdDrNKkDRuNfrQbtj6xBBGIY1BGQRkXCCQje51+uhaE8PAdtIpVJBlYgWV+7TOUd/AAPFo1dVlT0EpRRZNTLrxIu0p7NUceADepu/KFfKaRkl9US/y97+vpPbGX1Drd+1sYcHr1jZRPXeWlzYMwtyK49TflbLvFwE5ZAJzZyhA6YnSCgUCrxGa18bqSXhelQsyy9T3sv7C+SyMk32Z9VF3EqW+jr3MwvZSNJE1DCODAtGS/5Lh6ncEdxKO1JsaP5W4pLetLHfl9ETBm01FiwKbLdNe6Zrr9MIeA1DvJUlq9pJYnFez2k2KRFroUOP1ynSPSBc8J5tH0GiOH3dkrFoVxIOTnpGra1Ge5cQUsnRegrROhqoPOGuwRO39QyJblFW55Vsj+o9Z2DVvWR90ghi39IAU2nnXBRHLohS6TCbTeVy6Uw6lXJhAOzinJu7MApSgcukwmw2zOZSgUu7KBWE6Th+CxB73FjrimaN0YRjerzLJNpr/Sdt25xb5+VogSp9ot08rcuf3KFtZc4+IytKuzYwXksuThpyejzxZPXFXdUz0TOCJX7D3I7jOFouF2ZbJli1rUuy1ya+VZ+B50iW1Mn1WCnaf4Thql2Ayr2KdlZaQWxlVbD0ntbLdy2HwF2VSVG1wyUaIhWzqYpmt2hEJMi1bWHVfhB37hLundZ102oQq+ppn+8VDGjlvKcJrHnlieN7Aib6V3vOrnXL8JpQLX8CjhdngcgiOmFJ/0EA5JZss1Edgtp4xRO3xiTJCrEKDN8oYARBUCoJsnhvEvF4VXiKV650Oecioy8xcW7snHNuZJDl5C5/e91etwDx7fX9uaxJggBTcT1ardarV6+Ojo4ODg5IjG9gIrfb7ePj48vLy0wmU61WJXaJLC9EYMRD1cbC7nx6espHb21t2RvL5XLNZrPZbIKxknufnp52Oh0gY3qloehyVnGW4KpXLpdJ7IG5YezO53P62aMoqtVquNgDOpfLZYIDjigciqTLTPvtq1evIMuQFOXz+dFoZKkooA/7+/uNRuPy8hJsVzwLtfQyOCAjhULhzp07zjmgRpBHjK2Gw+H5+Xmn01ksFrVaDTlOyy+gXRogJp/PdzqdbrfLCJCQI2Tx8ccf12q1jz/+eG9vTwQf3qHX6/3bv/3b3/3d37158+b4+BjgzGtRFDxk/ehtuuVxjdd6vnvaDp5Am/dPnkqdl9K7q0pY7n00iK3XjfUx82TRPGq8JUoLspe7YKFQ6HQ6n3/+eTabbTQa+HH9+Z//+cOHD//6r//6l7/85dHRETz3s7MzZFXH4zGiIgDEsIwljmZJZDwm/ZMSKglNQsxRYQOivchT4BHMHAKjcrmMzolzjgb58XhMLxthokzt8vn8vXv30M2gJIMwC5/LzygU93o9ykKUFuCQCs7L5/O1Wu3g4IBthMlvY1C+O03ZitqVk9DiIIMRsvrRaGR9RXgubCzCVsTUUDjO4gX1YJtiO7JUZday1imUVbRoAdd4h3q9/qd/+qc/+tGPCoVCo9GQGxijcXR0BPkU98IgCF68eIFC7osXL8QxlA2IVTC0StxCaiwmYnXuPqBlxH5Z6zSiI8ADj6w+uEiIHsHfK6JAItvY2Dg4OODbAW6iba3NBHwNvJUHAYc9n8/zxPFm5OCQDSnSLswHVf7YmiDesr3Dw1W5ZbFYwLQdDAYoA7Ita6qUy+Vyuby5ubm9vV2v10ej0cuXL+nhQEEeEDCOY3TrbFYptLrRaPR6vel0ilFkGIb7+/svXrx4+fIlUhisXzpUAMFFKq/X69Vqlf4Yyjy6c3H85/M5ahitVouWF5p+oijq9/vs/JInZm1qf+73+zxQcidtEdZv3bN/sTK4VhhUFVwen+aAlzOrZuASHdk3A17vUfBzbj6fL8bjTCYTrdyNPKEDAZeWkGXnubWqZ5/ku0vLWH0DYpnx/hTS+CcY2WL8Ud4QskM3q4j8dBHxS/TfJRksuUkPppESjl6jtFn2X8IllWlLPFoojLYRSy4TAG23FzZMFqnt0tUupIiOShvTlZDJOubpiIcyJhDH45dJ0NaTX9f+4x3NmmAWwhNQkqQmePQxu7kpDBBClJSr1oihUGzplp6SrIioApuYTO+9aQeBW1d3T9JULdjkeWclzeU8QM3zRbTQidUYsQCTpXKzaQ8GA5w/KKnKQoOdn3emzooN5mAwkBGFlZtgl1OTk7gUK+ZHygUujlwcp4Iwm84Us+lSJpVPBRkXBW8xl4WLo9BF6TjOuiBPh1K8zARBOo59qEvPzkqaqgBgwXE71B6lWncuzqa2Vq9ioXdTSdVSj620t8zQdC6vNXazlNvrCmA3Wzp7BOek3rR27GTt4S08l8lkjPZ3EiJcLBaz+Tycz0NjgudM06Funo5PtaSoNmkZoFZowivP2GKegFSPeaolaZm/4vau1biz7ATv1FAeISxbP6gExRfxfIDdVS1pVVBg0IsznlRDkhSGmu10LlvtEbv7MXO0ij3AVPEYB59d4M6ojWk38NBzyYLZxMpya/Tdde5IZpoYSecvm4Y+jmYs+rEEK1tNGOtJqBMEaBjZJX7PuWznku2GURUzWyxmPoBBnHOu5FzsVfOcSzkXO5dzjiPuBnfS/i1GfHvdAsS31/f1st3BBHzqdrm8vPzyyy83NjbCMLxz584NQhPwrVA/SKfT7XZ7Y2ODNwS6su6uFxcX6XRaSrj9fv/o6GhjY2NjY0MIBRt3tVptNpuY0W9sbGxtbUVRdHZ2ls1mNzc39/f36S+GkkAHLpivfA84aMfj8fHxMS52YNYkNhz8gBdqNer1enQQi2+YzWa3t7fz+Xyv17u4uBCXkKNIQQaIwGQyefz4Me3Vr1+//uKLL7rdLodirVaDhiyS8uXlZRzHjx49+vGPf5zJZIbD4b/+679iTA+XEx4cHDd+2el0oIyRFsLKJH0ilSWYDoKg0+mcnp5+8sknBwcH9Xp9a2urXq9bA4fFYvHixYtf/vKX//f//X/TUm0FrWxN2MZGOlZt8CrOo41R7LtZgzsvz5HKqvUUThKW7Yy1Mcp7oQxJk3p3tVvKMyBaG++CjS6Xy2q1CiCF/jUVhUKhAEHy3r17P/7xj1+9egU7LwiC8/NzIBsgJ5sRwQQkgVeOxGtA3Gy+odJ9Mq2FpCNKl6xy3FWZQrAMqffaPkR+I5KXHQ3lDywKNVZDCJK5olYfWBgrDmAaHJCYjJuEv2wNDFlcfK4IpER1fIRSRysZyU2yJG3iQWQJ6V7hsi3zCDwSJGRVJqXOIdOqOI5Ho1G1Wv3kk0/+8i//UtA8UBGi6r1er9VqUY5qNBphGF5cXLx69WowGLC6bd7uucB5kizu25qL36tZxLIw3NXmbq/04t2Ajaet7YmKQ8oNNJ7So+dYYc5rBkq2lRPHrdSoWfvsVN1ul1xCci6W0sWfF4vF/f39crksN1RyoWaz+fjxY81wdmbQZ+E4o9EIUWa03SEgN5tNWLqICIOOcWQwY1nyTDPVBVlNiFRIpwjy8vb29t27d9HKQF87m83Sy5JKpXZ3dylk8ilirEtVWVKzqO1rtKmAQnYGegMblSgTdFGWJIsRLr8zgomCKsArK5WKxHOk4mJJWJb4JjtB8ZVk4uTVEe2E8SC/7x7AzGezaDJJrwBi0Vcl2ax5Lgqzhb+VuCYLk6I4SWRD1SyWNrC7NFKEH0mJSBm+dh6VrPShzDGCB5iSkihZiwPy5/RbUCrz4Hhx7iyzzDopKUVXWV32qvqmFlWxsvX6RhLulEoJUIXiBAZfLdvAJQLOPCAmKTniUbk9VyU7wTwUzzaGi0Sm2r8QkGTHksUd7IZsW+Dl7PoN+LtiCtuGDIU0bzGpOI5W3lYf1ud3Hek+aV7n2SomFbQ80rHd25NGhR56uHbEmL1c4gMywqwLMGJFO5JYsZ4WCmxUn9DJa2KPkCfsXBi4VCospMJ8KsgFcdpFgYuci52LgjgKoigVx+k4zoDWBGEqdOEKrXFJcJ8dz9Mxu05fwiLmbqV/5VkjeHI6XiHKc2n2NG2tP0eyh09LwLYX2DYCkWffJU5INhN4AGgy6vaQ5WAlFnHdR7DbpBaLcFUAS5qa8ntMNayckcBQO1xqVNKC0u+tD4e3q1i7Nq8O6k0/W8LUNBYOa9eXBVKZEhYPtU0VXvOHmkJUUVBDhkbSzk9bVJPUBj+LFGyFF9xVPX0rs+DtIZaOID/StW0l13WcJKXJ7UOxoYK+hQSItcylOMefq4FAw2uVyu15Z5nUVjdcyniKZBTAWE91jU8mmw1TqffemlPO5VayEikjQzy7+rK8c4vV9hOslIthHxdvAeLb6xYgvr2+r+gw5zF4jdX+J2d4/fr1P//zP+/u7u7u7t4AEJMqkEUr93hbY8vl3m6S+TyJ+sXFRSaTob1XDnJeh5QcjaSHKNwNzQfImxwA/X5/MBjA30QakqQF/izU49evX19eXiKIqTIm3108teFweHl5CeERhEJnGzdcq9Wm02m73RbzGhLQcrkk4QeMzufzYqKdnJw8f/4cdWbnXKPRIG9EbeDy8jKVSv3sZz/7yU9+kkqlfvWrX33xxRej0ejg4AArpHw+f+fOHRDDOI6Pjo5evHjxF3/xF+VymTb2XC7XarVev35dr9eLxSKDBumy3W6fnZ39j//j//jJJ58kZfVoXn769Omnn3769ddfg4l4ve2WVGL7lWz0ZtvSVSK24LJn+pxMzm253q0aUW2V2yZ+XseobZB/x0TLBlXJmMYKe3liZDboETBK0EY4YjvxEZGoVCqVSoWZT+lCOS34AtCSZYtYyjasSd5feTs3IO+gtS7VnmCogip9BdA0YWcWpvSIV2Iv2udiRY0tHmTbMy23wtKiCfLU/cfUErVB4CzlGWjIqvQIGrbdmpaiLkcLsWWtWDO7kMWwPLd0QnZLplOegDA394wgLHxVKMaSXuW7CFQSH2c6nbLJuKvWH57Sn0sIEHtL5gNkVTz6sDWjc8abzhlXLtt9bzMxr2eTr2zhHs4CmjYAAvD0c85tbm5CpqbuRT4wX7E+xRqDXFYqlXixBrbb7SIHz3nB2ul0Opubmzs7O3t7e91u9/j4GBdyqOj5fJ7iHITN8/NzToTd3d1isQilkQaX6XQK0b7RaGxsbFBd04IqlUpIsiBtQZ3DOTcYDNCpYEadnZ2B2+7u7pJVUjS6f//+w4cPLVx+dHR0fn6ez+c3NjZqtdr5+TkM4nQ6fXl5qUYTChKSEpJ2J7tNtVrlo6lJoHbCyLAvQciCTUxZQuVMyo1CaiDUo5jc7/c5HFmDFn6SEohcCtQpTJ1VZCJvz/fmuVUG+O7XMoqWaExNp5OVEAc3Kc96MctE0bLop60RimfKMrfkI6tEIVEO6tMk+cppLVSqSqet3bK4dHSyO1FOk4KQXVNWCozRBtVl+aj+qiNeUIK2RAUADAI1dXCNUqnEZ8lSyV1tkAfYtZuDJVlTz9CeLGe2pOqleOgerHkdJpW0sbURiMAjyyC+kryvaldCvaFvW21lixpokugQt8cxsSg/Q6FQ/Kw6qL1zWQUCEMeLRfSeAPHa+nQSoLkOPl6rMOBJiNqgaK32q6Wxr4XULQZkEWprmeB52elQVmzgecl6WrdXvshba6cgCFJhmA6DdBCkAhe62On/gjhwLozj0MUp58IgCIKYG77iVOm1vjEBbFO/p13rqfbbBn/75zcMuPVwTtJ+7e+9uqzdSNdAtCYgdwkBhOtAYXeNqd3NgGDSDu7tONywPy+X8/k8Xi5TK5F6O2HsZgiLiFWjHjJvz7HsFhtAen1+anXSFPIo9nb8veK3nuYN8kQaAYkpWyK5J55znRWhZIsl06eirB0TvoLUV6x7m0jBqjTYigK/1wFtDSTcVXGVJFPBrVOov257sVYxti9NHyHlDdGwlHrQDUPoYiXvraoGA2W7ZCyBw6PSW3zf49d7TRLfzGf97QfE1YFzKefm7huF89Tq53DlQRc6F5hfxiuweHkjufj2ur1uAeLb6//Bi4yFnke0fcl21ABIxzTp5Q3vk8lkNjc3S6XSeDxutVqiiqwNlXZ2dlqt1pMnTxDh5cUCbtyqt7HX6wEQ0EeMURsnKN3oAKzdbpdMle42ckLORdhhYRgeHx+fnp5SpYTnBdBAEgh5qlAoQDGzfW1oNdAIDIAOkXA0GsH0EcAhiyRM6sXTKRQK29vb8CI5t+j3Hw6HarF5+fIlwATOZul0GhgaqFrKTel0+v79+3t7ezs7O9VqdXd39/j4WCA1EUOtVkNmlB7kvb29Wq2WtM+GRPnVV19Jd9hCZjInESaoIMPKHXqphWUGWSrEWrN4G+q5qwKCHi/munzJYtPvxcTxiDBJQbHruvMUZgnEpAgBARBt4ouLi/Pzc3rbmWMbGxvb29uDweDk5ETGLDxNeuHV5a1FJzVwGwHL18VaTltk0za8WxaVvLDVSoyihaJqJrC0/+wXhxOkSj4wh2IvhFmELDBLkVgVXNtoNLhtZrvgYMsC8wjmUi3krux0EuEaMiZmlfa787dW2FcCoNaEhNdLu9x6KpLwoxJAP6x2Ra0RkDX2IqAxSOXqDJAaHbdK6C8FcwsQW7jEpu4WC0g6h3wXJppNmTzZFta+dY9hL7JMDfHvbMe6zT1owkA5dzQaPX36tNvtVioVtkQUSzqdTiaTYXMjRwLPlWjJZDJpNBpA8Cg7M43Fr+SGJQW+ubnJIcVZxgvg1Var1YcPH1Yqld/+9rdffvllOp3+6KOPHj58KILJxcXFkydPTk5OUB/WcpMmrDgpcIfr9To1AM4dSMftdhs9fY32aDR68eLFmzdv/uIv/uLHP/6xNhzqnefn5xsbG4eHh1Q0MVM9OTk5OjpCaBi9C0xQtWVBYGQEqH3OZrNut5vP5xuNBoPMAEIW5ijE4hUEmWUoUQ60LGBSZ7NZjg9p9GvFWUqmlVRyxuvGav5qt7SlHa9B+IPrHMlp/RZ3WPXx2HwSpq1dkhb2kj0RSabN5xnJXq+nVSzBBO1U7AxsQbyGxiPpP3qKkBp5tf2qiI5RQTKN11hZzpQ4VmKHqerJO4Mai0GMJAITiWqB7CXgw+qftEfpIeqxWmaljgBp0zvTHS8X3CRua63t1+JNHmrmjLmWpQALzRFd2iW8ZwX0yEJNuudWvsniXFZHIlm91jmi0EiqyhaM4M0Zk7eCpHHs3l9igsfvblwv73IcvMsqu9kr9YYPulm+wF1tO7sOkUxyFa9f60AyMXcUX/mleU3snAve/n8+JA6+lZFtpUJu4HHfTM5da2Xx7uOWTJdsAGBhffvLd58M7xUtrH1eayDjG99kuVwu5vMgitwqKrNKLJ4rJqcb2cd1E97qtyhi1LslHfDU82Q5p9fBnXauShX9uhSDf4VcJXKMZRDbJW+lpfUt0JfTdi0FCQVaHsXBxufC2TXOgpslZ7FWOs+ecTLvsX0YHhHH266vqxJ5JWELEAs6t/RhKm3k7ByvHnFHZQDRh6VFw2nOWWNLArZo55W3PbybbfztbPwugYh0h+crrYmxc7mV0ATSwxCKF0aMIlqBy1PPOPP2ur1uAeLb6/txwfgoFovqMdQWzNbZ7/dfvXrVbrdvtkUCCCNlajQaoKhrIwzn3NbW1osXL/7+7/8+k8k8fvy42WySO6lFNwzDk5OTr776ClYsh32/3wc1uHPnThAErVbr4uIC4AYgGIBYakpKIWC0dbvdjz76KAzDN2/eSFOPMxXWTDabhbyGUxApWaVSIR8+OTkpFov9fh8qKOOWSqUKhUIURZeXl69fv57NZpVK5eDgAC84UJJarfaDH/ygWCzKrb5QKOzv72ez2ePj46+++qrX641Goy+//LJUKs3nc+Sb+/1+r9dzzqkjmD+8e/dutVptt9uNRiOVSg2HQwzouEkSe9wCp9Pp1tbWn/zJn2xsbCRjrOl0+utf//o//af/9MUXX1xcXBCICFBTZ5Mle7qE4F1SI5hwhEcvRFi9XWvJLxZfls5gsrUtyer9gJjYI2h4BBybmnoRocI1DQ7RCc5UrJ1sNntxcfFv//ZvkAHhjzebzZ/97GcbGxtPnjx58eKFpCqZzLu7u8wfST1yM+JxE3eCraC0wCQHGlDnlEV7eT0PTqiHtezARIuRRw1QNkTihxJ8g/QBxUI0k08jXoiVSqVeryM0fHp6CvyB9ivE/2w2u7u7C7kSMzEkUxGaEGIr9QYFguraFlQHCgDsiNBqrVbrdrutVgswV82biLda7cJms6lwUywGVCCgLTBp4YR2u1250tn6k6JhevAxpuMT+/0+QuHZbJa3hTNbKBR2dnYwr2N/s6vJC8S9KNbLJdw6GcoPy/o8lVKrMAvJkbkt6RjLCreCEs4ofkruTegVv0eWFz0f6JbMkPPzcxCuZrPJhJQWBDkSuxmSQSDsoMN7e3vM4cvLSyoTzAfnHFkWlRiWVbFYBPN69eoVHOStra3Dw8N6vY7WB6sGEJBa4KtXr54+fdrr9fr9/vn5OZxQeNAIbUdRtLW1VS6XpTnLFJXOw2w2o+qZTqeZ/N1u93e/+12lUtnY2ACHPTw85HR4/fo1XGbRzFlNoj1a/SLZx5GURlF0cXHBeYTiEDsVFGPrL2cbYJmo1WoVuzypS1E9hTrdarWo4ohQaVVr1YSrSxuRbVNQjcruae6qnsPvDdEwYKKSXuAGdSckDe6tqqOIvfZgUmVIu4TtiOehiGVsJXptfc6mqToThYlYgyZ9hCWCJa20bIOzTkwwYtUOReWW8KJuQ5xf5j+8ckAZNYvYJW8f1jfCo6tGHF5s5QIUSFyHLnnW8x4724PYvOjC667wyIBr41vrRiW8+wZape7KqhhZrwWBOFbM3cOMrJbO2/WyXMbvP6ndVXes6yBLr5bgwUA3w5Rr5QW8WafStVpzVC2wTm7Jz7XdRRocOkXEwBW6lwRhXaJ7Jo6j5dItFss4DhaLxXyxnC/i5cLFc+eWzsXOLYJoGSwXLo7iOIrieBlFQRRFURzFsfN4uxZUumGQ1yYy3vy0/UZrUWCrnuF1XCUfh9WrFR6qEVZjmXXD82otSdfod9xv7erTgZ4cn7d3tVyGBhJde0XMn9Uh4s0NW1Zh0XnC5clKkhWUUBlMfFLNMbsJa6nadOM6jNh+0Fpc1Xtk2r09Tq6VPhen3qK6kjXT622LHu/MdxTPQzis9cPUJJFxtFgXsgJKknisboNSGw9UTSLLliNs90xrZ2eTKRsn8E3FrVG2YgXHLUBv30H4vkIOKVTYfV5LTAybtVUWu8reMohvZMHfdOWdGzuXWvGIc86NvzHMdM65rHurfpNxbrKiD2edmzpXuGUQ3163APHt9T0GiEkO4cvAerCsQ9JgmnNh466fTOk0UUsul6Pn+gZeJ4cfblrj8fj+/fskq4PBACQljuPj4+OnT59+9NFHBwcHYCvEDVB94Q6T7UA00xkJO9g5B8YEtD0ajXK53P7+PjRPhJLV10+P7Xw+73a7biXbCs0Q5MiqEKbTaczlOONRvVAW3Ww2d3Z2SqUSYQoCEQwjwC4tz7lc7v79+7VajTFHmALYmi7mfr/PCaoCrzRbEQtGoXI4HAo7A7rCdqxUKn300Uf37t370Y9+BMfTXrPZ7NmzZ//7//6//9f/+l8ZHyvn6h20a2uwnuMcsU4yPfBCLttYZ/UBFIWol9MymNYac8c3Jk43zPbrWBJWV8EWzJWBJ9uvYDtSGgEeOj4+fvPmDXMyCILHjx+Xy+VHjx4BGP32t789Pj4GlOn3+2dnZ81m0wrPSe9FhidydtY/YYYmwTvBx5ZKwHx2zmHyIJzR69lkJogpKaqFCvWIt2AsZs1nCEOZk7VaLQzD0WiEhxtUYhYI34uh4FPAuFkd0AfILYEnBO7Iy4iCE033VHQYELA/FDxoSMTcDMACIMDa7ID9CdAB2oDIyZZCpQeAmDXFXnRxcXF5eTmfz8vlMkx8JsP+/v5PfvKT/f199hlqPPBeW61Wq9UKw3Bzc7NSqWALie9fMnpem2pafpyn1Om+G+nStvpauxutC6mz2cngtbrzmFSHE11F80ok0zAMm83m/fv3qRihaSNHLyocmUwGaQV4JXw03ST6DTQTbhKG72g0AhomLZxMJlS5aOmYTqcSPkZHgjYUlCXy+fzFxUW328XakdkIl382m71+/frp06cnJyeIR7NCmUgoF7EGpSFTrVYlMtDv91Eroo5Cm8v29nav12u325VKZTAYlEolapAff/wxrz86OqI4IUidg4NiA/NZGtySdmEHQFyCNdjtdqn1OtMYRFWSksxyuWy322/evOE54gEIOqxHjFj/2dkZtSh1vTD4ysq8SqEzjeq2eGBTSmW2FjX7vZHd4A0mGnu9jmYl2BadsS+zqKVtxb0ONvI4VklpS+Hjtl3ak6/xwBf7e5cQnLGSi96BaO/WY0sl79xdI0GQ/L2HFQootIe1Z2J5Mw/0XXaw32PxwG6237qLJkfbXd9q7SljqIrseXwFQfCWC/xBxTyXABw9g4frCJ4Wn1oLQdqDRm3XVlFUJzKrnjOafYBVr/jEkuuT38LCguzShUJBthkA7uqyT96GuyrnOp9HQbBMLd10NptNF/NJNJ8G8TyAlBfP3GKWihbBchmz9F0cRNFyGS/j+JsRSFY6vR75tcQCr0qx9vheO3UtmzIpBeZVFxQbe8ZcuhN5aXpSLcllmxRSuKE6Ysfc25dsDHnFuW6xiBaL1LsVP5JIqxfMJ+sT37onrMW+kzvb2k3yg2uRa0ss1qxSNTwh4FZG2ePTeG0T1kszXudRuXayfWtl6B2J7d+xSrs2sbpBoCNZoLrhqF37la/73xsw/TXL/LsMywzp85XEzVwRiXOhc5lV4SpewcdL55YrNvFsRSW+vW6vW4D49vq+XaKczOfz4XAI8qJGaUlDoqW4tbV1czu/TNK/9XNrtdq9e/devXr18uVLALV2uw1IjZgvxnSHh4d0REIfA+UBMAI1WC6Xm5ubQMbq+wYXG4/H/X6/3++D72xubu7t7QFzIwcMvkD5FMAXEMfas0ovGNIi5GLiM8iMIFNStKDPlzQpm83W63Ww5levXgF8ZDIZoHC0JjY2No6Pj0Gp6LWBniwukorzjCoIY6fTAapwziHHrOrxyclJt9v9oz/6o5/97GePHj0SsGKv4XD42Wef/e3f/u3Z2Zn6LpMakcIOkgAxNXkrHGxlTGEgWsEQTwRqLfFH8YSgMUtasdCtF1i/O2RmP9FzuvO4QlZzw4Jfsk0nykdOAZ6jlKzPzs5ms9mdO3fA0VKpVLlcvnfv3h/90R+dnJwAV41Go9evX+NWB/+9Wq1a/I65p35VAFmahRFOFZ/LrZQfrFYXZQOSN9V7mIFMY7fyH2fJWIYUH0fJBEkWboPaDKmg1QsLgoDChpS4Sf+QUiEybjQaYkmTbQJDw1u0X0G3xONAamY4HEK9JLekNMJY0Z4mYz0tSamjUjgR/i4dXkGHIuNIHxmuK6IB1MyAKbEvKxQKH3/88Z/92Z81m02or71er9vtQmfudruj0WhzcxPTM+ccTpX9ft+D8tfy7GyXq6d2kkx+3vcSn9HzaxKWam1wWGgaH0tiEv1KJBQtXkBMin/AsltbW5PJZDgcnpycDAYDWOdwupnbnDisndFoxAaOP6FIN5jCUYQA+lRmhcID6D8CxMwTdBVwBN3b27t79242mwW+B1+mggJiy5KEM87MByAulUpgqVChIcXncjl5JzJWKDxQIXDOXVxcQOTJ5XKHh4dYngKCTyaTwWBQKBTq9Xq9XgfA1fsgrB/Hcb1e39jYUIEQMXrZotL7wv1Td8EBD9Y/T43zcTgcvnz5slqtbm1tIUYBpgy7lsGnwMPgdzqd4+PjbrdLS4R0QsVL9TZJd43y6Q0QVZKX9B2vt5PQEFdV26AAJrkntd9q71Lfq+1ZFkHYSmNbFMyCazK4lx63GFLiV1oIRki0RkbNs7ZZ2Cp0MdXlIMTG7jlWWVaaWzWjWKEnT8mBN5FusrzdbXc2n0VXFm0uIkpr2K3ghku02qwVEHBGUNhdVaNa22ZkD5q14O8NxYa1Icd1uJJb11h9nX6odlQ9CyFB2lElyRIFQTqKwveZ8N/s/9evrLVA1Q1g1nVosiawiO024JEMi7q21d+tzgO5QV432lafhP4hnrVoELYi4tniWbxssVgEbhm7eRi66XQ6m87n02gxc/HiLSgTL4NoEUTLIFrGy2UEQLyMFsso1GDI3QvKqlc5ELq3lmHglYJueC72tlWCssIslvpgNZ1sdZb9XCp21sHCGfqkvfmkbcbaQtTaspNXHvBwc0/UlV03WCzSi8UNEFuYSqUzmfTKyNGbEm4lueYSLhpr0U8bn6zFwZPYscdh/1YZkxtQYJvX2EJdkujq7T/J2aUvq30meWN6LtpRvQjNu9TeoZ3TbtdeV4qN+W2t15vGXhaWPHkVD3hWllKZc8a4WEuA08fSru3IWAFiS7K2X03nlM4+u0i1g3nUfssE0km9cC6YzaIo+hCkOHIu49zCuci5tHPLldxwsMKFl6vfS3E4dm6xMrW7BYhvr1uA+Pb63l5q/bDycOK5sJ92u92Liwu4sZLo/WB6CLDm3t4ezbnT6RQ6MO+M6jHI78bGBhE255yaeTlgbNumlXAiM6fJnSiwVCptb28j80dGROoI1mZ1FW12RIv9ZDIplUrgF7yVFJQkUIjDj3SKrfeuLOxApavVKtl4q9XKZrPw2sAZCZ0R4sTMV7qT0hkEmAANUbYGnkJzKKTOra2tjY2NJDoM2n58fPz8+fNOp+NWbG63rqdPp74UD7x/9VIpO2G8WCdZN3ZX29aui8hdwk3lW19/w8z0HI09SWKXEIBLymt4LaVMSGwJ6/V6v99vt9to15L/QEunBPKzn/3s008/vbi4AD5jkiMkSuO87a3TDcDJHY1GTCdSMiBpCK0kD7wnzxe7yGKxqMmpzju8rWApCo9AjFI6m/AK+V7YHoKt0OQOWx9nCZYqDwgaY6fTQUelVqttbGzg9Mh/8i3UDwjb1+Y8EJBJF6VLS44keY1CocASQxkDLqdWh2SOWXe0AiAQLKK9EE8rmCC+NqAY708ZhtSXJ16r1XZ2dn784x///Oc/397eRigcuvHx8THIGije7u7u4eFhJpN59uzZZ5999pvf/KbdbgtmTVY4khad1/F6PpgDok7zpJK1Jwju+aUoQ5CwjDAp8Yi95lnKjZQWyuVyuVy+vLy8uLjo9/thGKK+IqaMDGEGgwHiBo1GA+Y7CC8zE+bv+fk5cxuOMD5vu7u7w+Gw3W4DpAJACFRtNBoPHjzY2tp6+vTp8+fPoyja3d0tl8sUJIbDYafTuby8ZJJkMpkHDx7s7+8DPcscEqEVUlkQ5DAMOUHQJmYqdrtdzgJ+brfbFxcXf/7nf/7gwQNY6jimvnr16smTJ+l0ulKpIDfBc0mn09VqFWkjXGH5ykxmzik1EKTTaYxM2+02bTfUQlTUZC1TSgE3RxNcrQmsiMlkAsGZ6k6r1WJLUSt90ltMpa9kDUPVAsmpW8N3BtDqGH532hKnYSqdDoxEr8q93KqKQ0DnhAEciOoNUmFSewLvABwjHNBbpEJatXAkNsK8VViVlL7VeKpWbeXUdTyx58vLl4kkNzzeX1LR6tlXUVkfanuueU9OBIl+ygpCJxFbq1DCaIXyiArKm0uaDDiAjdSLPawXnDMawUmKpVsJK9uTVzC3PYK1KUUGflrLJfTAiySVz5uNGlvP9FWYC/PK2gN6vnbsP2/rjlGUci5MvV87ccw0WFfettv1dbDXt6LDdkpYwMizn5UfgCIo29+NaKyagdZKVXjIjnX0dZ5blMF3PBmW1SkTx/F8Gc3CMJ7NZov5LF7MwmgeuOgtUdtF6XgRxEsXR3EULaPIxctFtFwuFxYg5iy2xOekAeNaDM4La9318hRJiFxsDOVcNpbWTivUjPFURCSYjBBIIuY6xy2I6S0re0a7dQotVghYa0o3aQnmqrvDIA7WUaHtIGSz2WKhkF41wXhqcgqu+C6KCW0ThnZ16+Nn50Yy0Ug2c3jP9AZ6aZKEKyhTBT+7R631YPRyKO0b2uKUusoJY+1i0R9aFQhvQ/Nqfvqy/K21afXWuzOKOl67mKeVlCzrSuXDo0J7y0QILyG9fPPYG1V4Vhdj8s89Q2krYqZiz3Q6lb48O4xcsr3mIYvOfyMLFkWLfn+2injfM7A2uDA/hM6lnQucm60IxakVWDwz2HHaucXqP2+v2+sWIL69vm+XpPRgDOlQZPsWY+jrr7/+1a9+NZlMDg8P79y5g4jEDYjzda1YkmIolUoff/zx3bt3792794//+I8vX74slUr37t3b3Nzk0K1Wq3/8x398eHh4fHx8eXmJFfvx8TEUYAmkIkbsVn3NIFDOOSR6cf4JguDw8PDRo0eQxSRd+ubNm52dHUAxMcKazSa4G/AELnDlcvno6AjMmjfkJsG1sRhCKCOVSnW7Xd4EZtbJyQngRa/Xu3fv3kcffQTVFCmMR48e3b9/v9PpfPXVV61WC/wdriLYxGKxwLaO0SOkgD4ASKFYhD7rP/zDP9za2rp//36z2Uxyh1+9evV3f/d3//Iv//Lpp59C0JMNgo0d+TiL/1rpKxWBXcKPXr+38USSvGDb5y247CWEHuHI68q3ZYwPmPbf5TUWICbI4KnJIJGMXQEQzN9GowE4K7EF4cj1et1qZXp5haIcedbJTl2B3Xg8lsKDu9o2bjNkxZo8AjHj7MsASSU0aYN1JqTlrYj7Y5kOopsR/AEoK/GQ1LLlTTCS1vPHEtIhU1tKOzNWUoYambV0D6sPo+xCsalGUog/CKDn9ZHL5er1+s7OzsHBwcbGhkivuh8wdDRhYVs75xCy6Pf7qJwnNSuThZB3qbd9GLK2Vkg0SUz22ghsA7Vdm57fl8UQ1TsMGXY+n/f7/VKpxDzp9/tCHkHrBoPB5eVlFEWHh4f8FZIdlUql2WxiwtlsNqmpwMNlRVDqwO/OOQeVW/xNoGQ8RY+Pj1+9enV+fs7dDodDpjGq0ywcKitWd9XznGGxM/F4mqAMlUoFgWyWWKlUUvVOgsusgkqlkk6naYIRCgBHjC/CEmPC0wpDnU+kftRaOHSodLJd2yZWduzxeFyv1x8+fMhocBoir8T5Al94OBw2Go29vb3hcIjfgFB+1RI8iMpzgbei7UljT+tCaX//+2IQT2ezwWAQxXHK3Kp8JnkozmjjMmiieWpzsNGL5Z3ZDFavkUK0tXxk4lFag24JPqjinIdc2IXJxKYIZ9eRGIUolqhMqHyYWjjlZLs3Ujm23c36aI4qxgROut4ZsA/sWE+ZKUeGr32VewAItvGDbd1IEjCTKKc93C2t0qIYFkP0tiyLtq/9UO0zQnjdSv3T88FTKGUZ0ILMLApDW5i+kWVhi/gpfvF8Pl/GcTCZFBJewe8eq6ytYWvR2WApGaV4vDx3ja6IUEJbPdLXsR4kHHYC5emuI/gRLqN6oW070yjZncriUFYYSv1PFk0jVl0ul0EQLeYzF4+zmUG50IsqveUi71yQzS2qpX4xP8qk5i6Ilss4CgifmC2Bc7HFoG3Nw+MiJPnClrGukpIFEy0J17NlFkSl8ZHnhxaOvvtbrrThUUpriD9n7bMevc3fPnobJVpE3rMf8NoRbA3Mflk9wSuS09ejw860l4Urp1PuH7xbVSJOMa8xUQ1tdpKI8ZokcUtwPykPbbWAbxBbWEsQ8UBeQZN2NNaWnfRcpAWsycxHKJa29XhPv17vYBemFYuzALFdesl6AymG1wcjh4CklJ84BMmSj1rHrIe55ytokVzms0qYKGhZxSdmezJ0l96d9696CkpM3EreR5VLkdO9mquUc2gam0wmk8Wi2G6TOn0Ig3iy0iCeruQmZium8Ftm1kp3eOJc1jkE03lN7hYgvr1uAeLb6/sKEJPDKPphe0WjU2fq5eXll19+CUOwUCggrHndewq78SwagAmIacDLIEwdHR11Oh36jvP5PBjxwcHBT3/601QqdXZ2VqvVarUabKzFYoHwKH21ZOD0EeO1tbGxsbOzc/fuXbp3aSKuVqvgNUAG8Hq63e7l5eXm5iZ4AVQ1/LU4vOnHh1dF4oS3FRgEtE0sjJbL5fb29t7enppYObem0yl6l9B+35bTi8WtrS3en6i6UqlcXl6ORiNbtFf5HcoGNVIJIiuqQ7DCOXd5edlqtT755JO7d++CmySf9fPnz//6r//617/+db/fV6CZFIxWidVmDl7WYf9E+aGHDttwx/b4WLkuT97BXZWvSuaQHwyTWWM97/dW9svaECmiXetoQfjCsNNNDzJIrNbv91ut1tbWVq1WIwkpFApIVIPvK1DGU14Yq0h2SlBJ5qEGK9BRrSUIAiSAh8OhGs9FAnLGC1g/swb5IG6MKhGgFYCXYF9a/oXVkqXYZkkmLd8ik8kwt/H4ouaEbDdMXtiLudUFj5i5LQ8KgbmQ+LQ2uRkbMkqFGbUZKTIzvOSxysqkgShwHNIx70xJrNfrvX79GhqmCPiUiO7du/eHf/iHDx8+3NvbQyW81+uNx2M+Cwc/JhKg5Gw2w0Oy2+2STku/da0oZDLtv4449mEAsRgigoGQ7vF4KKpSeJqDllPGb/SYbFOhzVcpEmxtbeVyOcpmbKFv3rwhUSkWi5eXlwDE6XT6o48++qM/+qOLi4vnz5+/efMGGd9SqUQzBBt4u91mwtCGUqlU2FFh4j9//vzZs2cA0MhAoxHx/Plz+LxIWBwdHSF7UqlUIDtT8mRiy5huNBoBwpJBtdtt5CAqlUqlUiHvZS0j1LCxsQHQxtOnZyWKovPz8/PzcxAWqKD1er1cLiMizNKWgSHme2gis2XxJ0w2rY5SqUSXCTVRBFjQL8I9EpD93r17P/zhD4+OjrrdLo6vSJ9//PHH8/n8v/23/4bixB/+4R/u7+//wz/8w9/+7d+enp5aTqVF5bxe5iRIpwTeHhMW3VP18feFDsfOzabT4WAQxXHW9PuD5qvoaJcSmaq1tlcTUrIkJvqerC9tuptUidEGKyUiKRGr5GCBdYtu2HZ+Da8QYU//QehSLpfDclBCGezkcgFNyubKtojZDj0fFIPITceH9li1dNiNwq20d3gT5xzz0BaAkx3TznSvJ/UoLVPYlqg1mDfZYSX0dgWyC/IWQGzrXvapiQyrr2BVVoT1CwoUHmENbHkxW9NisYicc+NxKeEG8a1NH+4qOmy/l5Ayl1AWTvZaWbGv6wqTlkFsfeTkAKbBJ24RTCndKvp7FO27lTUlE5jam8V9hKIKrpXNgH4Qi3a1jUSLZRBHLopcFC3SqUm52AuCi3K+GMd554JMZrm9eVmrDPK5WRjEy2XggmC5iKLoGw1ij5Pu1jXxWNhdNWyvopCkY8tPzItXvXnruT6KnytAcK0sj8U9pVAsDQFbxPVeaeNGT7PF08teG5wk2aya7UJPb5DYfluOCkMxwCXk5Q2sdgyZnFveupVfu24f0KEplq7Hm/YOo2QYlnRMsVUBK/VjWcwuodhgP9FuHXa52YOABaXPZZDtvs1v2GqsOI+nROQpAdriaHK226aKJInHlhWTC8RK8Knw4xKtqMK1eaAqhLBP0sGjqCYJEHve6dq0bS1KSYEYMGIO6f29hBQiCB2fo9FoulzOLy8l2/h+V965yUpBAl5w1rmReQEmdSsNnLeaxcAn8xWmfHvdXrcA8e31fbt0fMLksqQ8mxyC1KCK0G63Nzc3bwCI14oWASFRr5vP5/V6nTbJQqFweHiorpN+v4/Jz/b2dqlUarfbs9kMIUuAWnEJ7aYvfKpQKDx+/PjRo0flclm+8zCOkY8krhL0ORgMLi4uIANOJhNUUwGGxuNxs9mcz+enp6ez2axWq5XL5U6n8+zZM+SSUcOEvJNKpba2tng9HDE1qJbL5fF4fH5+XigUYJNtbW3t7u7yFUjk8vn81tYWBn048gF2Ew3gtrdYLIi/0U5FlBbfJI52jLDQu1wLg06n0xcvXjx9+rTdbpMGKMTkWOUotUoRNkT22nzs770eTxuFe7zOZNDmbrRicNc4MifnwDvO9rX42lrlMo/xtLYTbblcXlxcoF1bKBTK5TKqtfP5HJfFdDpNIYQQp1qtbm9v12q1er0On5GsHpRfKTqRirIFMitlsKBCQJPcKquGOVMqlZjGcn6zktCpVAqMTHka2KisGlEhz+VyzWaTxT4ej1UysZpiivZ4H3jxiMBeXl72er3T01PuQeaKl5eXcPfekkoM5qvvK3YS/wRLFxwEQFlRo/i/JP+Em5YSCIWQdcQ9iPhmqQ3yzl4ul5eXl2dnZ5PJRKQzuC0HBwe/+MUv/uRP/mRvbw/0EAs7NGf1aKB2srJOTk7Oz89fvHiBbEKy4mITj+tETlxCytCt81p8x8sayimG9sAjZ4REdcN2N7DVnaTVnmgjURQxLQ8PD51zcOdh/jrnpMQ9n88xi7t///7+/j57PnULVBHQcNjd3S2VSow2tbRisbi9vU2DM0UOGRIWi8U4ji8uLjqdDpUApIfZ7qimINdT//+w92c7ll5Xlia6dt831pt5a+6URCoiUmRkKSMDkQWIUQUUUDgXop6gqCcI6QmUujjXVDwBFTgPICZQeVOFTFGJAiqzqkJyURIldu7mnfW77/tz8fkenLbWv43uTmYGs9J+EIS52W7+ZjVzjjnmGNUqZ87bGR5UExEXgqi7WCxardbJycloNCqXy6VS6Vnkn06rKpBOp3d2dsD4KBwiMT8cDtGvUJs2vHJuhaYb6yc7BerVCG3DNZYyCTsOuAlbDEWdQqFQKBSYApCFR6MRDpPb29sqpvLIqABxgVtbW9vb29/5zneSyWSz2Xzw4AGLg5fpWd6ZpdXrimyFwBMEtBqCHkX9S3rmxJZk4cFgsIjFFum0SqpWQdVdFBkQQmF3IkFR9k/k7RYLs0w9Fcysi6CASB6TbXGIxC69Pl9P8V+C7+JDCW5mADAeaJZSTXowGBAsSSTEfp1tIlY3rhAZm4qriomoEcIm1mYQIAaRffYIrbRihLmLOg82DGA+qmwgERUPBrJyE6EDm7uoU2F1bC1AbFdRSzoGzmPvE4tfndruos6PyPLS1rfgiIVa+ATd0kUsFuv1MoXCi4DDPipjIa2wiHhJHHV5WTHsytJN0G0XmCtesKJo7gYdM1SmhQtrSFsvO7H75Y0sEqLtpk+aQ1SG5bNLTl2C+5rJjFPpdql0vFjE47G0c7FEYlFdH65Vh7ncOJFw83nCxWLzOVPsc6wtvNWe/IglRgj/VXuTh7Xp6dv4RF1NioS9iogGpwUBI9USNNI04K2IrWaQ167nOeN5zUAhKmoFprxJZIe6VTxIJBIxQ6pdNZLjicTCubnRA3QXRQwsekuwR9xr1erUpyWlAk8lRvdZq4qtc1sBDQ9wj9SssA/LqtzaAqdlLlsVco/CbAO/8I1MH/XGecGYlatmlVY3nj483F88ErQLtJtXcQjsQ7lEmcdu7lbpKBINQJ4LnpPl1mhGS4jcBc6fFmRX/59kl8S1F/VBoRGHtM69IcpG2el08HufOZceDDwO9fMeU0MWTjs3c27iXMq5uXMJ58ZL4Di+FB1eGOe6Kxzu6rgCiK+OrzmDmCxa8Ycoh1j9iIUHNAkh7hKVCdl02IBDRgSz2azT6cgAB6be+vo63aCnp6dnZ2ebm5vAZI1Go91u08BLaCLQRwmbnC4gWwmJIAMH/yKrZ0sAWUN6D40IoIder8emxQaMgCb7DX2+UL1arVaz2RwMBs1mM5/PVyoV0jPCYnpnSNR5GR+OrPBwOGw0GnRD2yQTUCOXy9GaygUqA1d/K7up2H/kIc45KJbD4XBzczOxQueOZ4dPFDdTMSv5gG239yw7bPYlRMlzPJBimk1EPYT3Es9lF+gU2/9bYNfSCl4UX/Cq99798UBnJRL6djueFYBCaUQ4dXNzE/1TQM8//vGPsVjs+vXrpVKJAkyhUIDVSFJNMk9oSC0EKqLNATQIAT4giMH9ZNgT6zBP7YhF5MRW4PVwZfPFU7OMKlLl2WyGXioVHfrxRZoTzCRmhBBSYFwwAvRP4bwz3wXs0qoPv5KfYZ8pQIfDSz6A7kq5XJarkiAeCQdb8xwaovXI0ul0sViE1KleM2nUQkFlyiP8YunkLGWUnf75P//nt27d4vl2u11wRiilVKcQQEgmk8Ph8MmTJ6enpycnJw8fPsSR0qIYlmpkG+i8aeKByB4z6CWWeo1bkcLU8ul9lzJzMXHADW1/Jecf2VqIIRv3h2uHchuPx6vV6u7ubqPRODs744bncrmbN2/+2Z/9WbVa/eijj0Byd3Z2RBne2dlBrh2rOlbmtbW1arXKcMUAENDh+vXr165di8fjH3zwwUcffdTv91kkK5XKbDYDfbbkOKX9TBw89DY2NtbW1k5PT0H6AIgfPnwYi8V4Ab6grMZUaDKZzPXr15PJ5Onpaa1WoxmlUCjwXYVCgdPDwQ8Ij4G6tbV1/fp11AAwg71x4wai5IeHh6enp41Gg+YAejPZeVlzmPXK23F3FCzFLsYlZzIZSjiDwYDaRr1eb7Va3/72t7/97W/v7OycnJxoXVUtwUoJ2RWe3xMeeCQvt5QF9IoHXkXhJVbvlQnadDocj1msJbloT9VWNKWSZOugDGYWWK2Z6rHgSfGsrfYCJahOp0PkQKRRrVYLhYJ6g6yvg352F8U0Q96WzerFoxTNSjwpNnEIetpzadQAzLUOQh7PFNhOZV1P79UDbqi7sPAKxsWck2VEgZAkxalKenn+Kqq1qkpyDGOtlgClJ5ShaMRzarV9P55+qMIYK65twW4AYlkQqyQjGzoLQFvPqNDaSyD752WVWMwtFvEXlJiIc9OCVif7jV5MFRZdVtmprXqX7We37fOevapmkCURc/fkuGiZjPKyU9cUGwrz0eKPFnzkWbiLXWWzWSI2Sy0WsXjcpVLjTKaTTp9n0vN4Is2dzucXpZLLZh3q0Iv5Yr5ws/ncLXzpAOu5EvbuWKKMMiNdmg0UtaGozi2dPbsGzi4aaVpk2V0UQfYo9lb5V8/I6glYRr8l2Fpdbz7Zw/tCpxDV/CxB1SoeeA8otuRyXhJ4zGez+bKcptq8zkfDQ+Rrtc3Zrj72O2lbeUZ2thuA8NsLt7zydpjmWIlk5S9SMLBxkRYc21Olt9tCkUiyrGayefRmKI4LljSj9YevZskFAOXOSANKO4L6NuzI9Eaap0PiuerZdjFbD7C1YYuqS2suRIctcE9gT8uU6Fw4pohzrezAXTRsDFtnnNHlV+Rvqf1SQ9JYkgKGXkOkhBPMYDCIpVLT2exlHOoSS+lh6tXIR8ydSy9BYWHHiaVDHS8bG7rxlcTE1XEFEF8dX88j5IHC7SLDUQxHy/xgMPj9738Pg5i2xEvCAu2IEHgJDgj92+02YSVAaqvV4mWQzqbT6Z/+9CcoVI1Go9FosBG+8sorrVbrwYMHJCrQvmixx18lm80+efIEKyR1N29vb6+vr1cqlYODA/jCd+7caTQaZAWdTkchMnwcgtfDw8OjoyNuCKA2dwlUgkZjwCMcw9rt9gcffLC1tTWZTM7Pz2ez2enpabPZBDIDHCFCAvlSwyNMn2Qyubm5Cc6r7lQrOiYZYuAGsjXBDZPJZG1t7V/+y39ZqVS8ViCwNhScHz58KEM8dfHbEDk01rDRkiVf2C4tD0v12mBXcSL42eOgeXQYD3EIKeovBJZ5HdNhzVyX7Cnb2phPSDp/hc+4WCw2Nzd3dnaKxSLg0WQyefDgAekNpljZbPb27dvFYnFzcxPVlKdPnz59+hTAEbcoopm1tTUcsezZ0mVP57tkrG0fsc4N9Bl8DezVYjoCnT3+GiEX6DMKsEyH+XyOz5X1ThFKq4CM4QRowiiFUiTaBT9zwloEuBB8IEG+FM9xOeAOErsUlUC0DkBksUt6vR6gLW+BYQrJjryUtQK94EKhUCqVgNsajQad+NwHXgD2sbW1dfv27b29PbBCQBmmM59GoDkajfj9+fn5kydPPvnkE2nRCHyxFCT9YOn2drxZyyyNyS8Dq1nunmXTWMaiZ0rjpZpeuuWRjKQvwcrP0sRvNjY2rl+/Dom+Wq0+ffo0kUhgv7azs3Pnzp3t7e3BYPDxxx9DDIGS1ul0RGilOAc6zMrPUkk9g3xgMBiwLCNV9OjRIwSgM5lMpVJhcM5mM0aFdKJ51iLyUINB2mI4HGpmSTyBKqDs4ObzebvdpuzHV/R6PcYnYsSad7ZAor5IpjNjHtkNukCm0ykwbq1W63Q6PBoY0DwpZFUQFC6VSug4i6CNb6RgO6sojSY+1prb29s4wVqqlLJTMfvUTBouzpbFKcxII8dCWooxLFH9qylyU5MzGu6exbwHEId9yiIoeZVLVnJGGq8XCiDyMrkud4lBJRrmKpMrSTO7iwId3lZl5S+F2lupTat4oAsB1PZUobwG6miin+kb8xqltYKptcJqCBANAg46o+ZkpeG9wqqF26zIr4e82HLdJYLsalT3REVCFMyT5rfkRNHQ7CCxY1UUM/scPRNRj5T6eYQcj8de0KQuFo/H5vPY8rTD1vXI4v3lQvaRpXFt6xYN9HCfuTk8cXZqtKyKDD9x+sT+tg6N4msD9HgmaXakCRi62NOWWLjkfLFIJhap1KRQ6JZL8WJpmkol47GYi8VSyWQ6k0mnM/F4cj7nUc7m84UzYyx8iJFaT14Xv3Vvs4rVtjNJzTeaoXZzt9urUgBP5jXUQPeYCjaUtdrH7mLvvyUAWVeYyJtg0eFI0XmLsXrU0csB4me2E8vWLmdsTsTDsCnSKlIqA4ZP0D7lpQkW9PSQX/1zlRCNxp505yXlIfl1VjnbRGLXK4aBmPJs1qJYqfhhNynmjuqOmpLsLFCLuF1qUrH2azJ89qo4YYlRuLYzVtt2K9SuZBm7XtOMl4V5+7jN72zsSlVbYSQ0KRhONm5UyGHjSTFOLMHFKjvbQizRFJgvkaf1YrVyz5QZePF4PE5xei8qexVzLuNcYfnzPApXS3PHl/9MGfgt7tzCucYVBHV1XAHEV8fX8mBLU6BvAUEpZpLitttt0N5+v3/9+vVKpbK1tXW51QzoJIwtaYmSa4kanM/n2QY2NzeLxSKaD61W6/Hjx+VyuVgsLhaLs7OzwWBw7dq1/f390WiUy+W63W6j0Tg9PSVuUAMOQA9iebSxVyoVCMVnZ2enp6eDwWBtbW1tbQ05CxJvFI0REi0Wi6enp8fHx0+ePJnNZvv7+xsbG4eHhwiqOud2dnY2NjZ4PXszyhX1ev3w8BAdYYzsnj59enp6Wi6Xd3d3AaEAAkA9FFZmMpnRaJTNZkEMa7UaAB9uTq1Wi+AbLGMymRCJ0tHJpri3t5fL5TY3N19//XWP2T2bzbhwVKQ/+eQTlW1tQohypQtUumyDqhebai+3DEfFGV70aTMcG7tYVqPGktV6i/x2Kwr8QnjZqreExkG2B82yib1LFh2p1+tRaaBgAAYKsZQO8cVikclktra2stksbnUwixkYcM9JrqAxOtN3LIERRqD6pq0WsEeaIyKUMpfwHWXsXiVAzBc9lH6/T+COjInoMCIMSj5YZlaWbMikzmazAHzgcVwg0xN+sXMOXXIQZ40EdZDRbOj5yFvMS3UU+WaorAIOyE3jNqJyQ6JCCzDI3Xg8pgAG5dlaJCNuy8lbPpSnEKdMjypXrVY7PT0FmgyfTqRUi7touGQ5LGFZ5SUkXGWmZIk5Ye7qlUms9Zzn8iHTFfXxWSQLZWEkbqkWlMtluhyQDyqVSk+ePDk/P6ccQg2y3+/zdjnI8clI/VBNYeUExo3FYiQDwMSUTHiso9FofX09k8l0u91ut3t8fMzYkNkXlybAS+xRBME3Njby+Ty0l0ajgQg1ihAoHcH/5Rvr9brW23a7LaKcGJokeCAjouQoH5vP591ul92Hdn42CyooVDXYp+BK07Mpe6i9vb3FYnFyctJqtfiufr+fy+V2d3fX1tYAo8fjcblcRrJjOBzW6/VsNnvjxg2UZLh1wt9tJGBJWHYlFNpuq1Oa+7aO6IxWjzaIVR2pL1f2EKNTebtojJ56gwUOXGBJZ7ekULTRaxB2RhpSSghWZdJ6cHlVW20fllrofZcFuDUjIth5SxzTgoPWnsiWVC2mKZTKuiGFMrUeYm5VDqztmEWaImUrXeCg5f1+1dbsdR2FGLoL7ArCvT4yigh/E6Jj4Si1QJsLlFhsSOM5K7gX5Irp6yNJwZ7j3yWd45FI8WXfGDXUbR0xVEuwJPQQsLZyDVb4W1FHJNl51eFczC1ibsEGPU8mp+nMOJcbplLJeDzmXDyeWKSSiUQi/ezFz16/iBwt3sVGnoB3H2zzgTcjwvEfKT0cLiyXl3A8k9jI4e3Z6NmY3NMZ8EZvOCpWKRFHPpdn43D1oAKeJ4pVNci7NEBMUipPucXedutobddMTxTRAsShH+aqeW0riN79JORWIGpvvueMZ8UQtAh4msjetigKsPcEhQKLkhI1F9xF9ZUIgFjFfusrHm5z4TgMRYHs8Fi1yHsfLj6yXcmtA7atNHu31xModxf7Oz09HKnMuaXmmzY+PRRbixW/ezwex9Pplww+MkvhiIxzg6gXpJyLOTeM+lN6KU9xdVwdVwDx1fE1PLSZAeNCblLyTAbIno3uLVkNuWi5XEZ44RJCCtxbcCKoUqQ6UopAuTWbzV6/fn17e7vRaDx8+JBEutfrVSoVrHjOzs4qlcr169f39/dzudz5+fmnn35Kzq+ck6Sd/n2ZxZEjIYtRr9ehiYG30s6fzWaPj49RKEZK4ujo6MMPP6zVant7e+gF12o1fPBoMabbHWC32WwiIAuXjdvChgQ7MhaLlctltm26gKFMgvBKnkKG1/V6HWwC16zT01PwtVKpRD0ZmFhWM4lEYnt7e39/H5a0t1vP53Pu1dOnTz/55JPT01NRbNS1xIO2MYowoNDB2dpu2IDMQlceuByGvF57l6USMBSJDCyI4CXYXwm4cEnOeUle6llMELLQaywRXljtw+Gw2+02m03EQ+AwMmVQVtnf33fOtVot2sAJVhg5kMTlYm/r6rBxAZdt4CjFRrqMmba2CUAPju9SzKorQgfDc9l2gXKoZE+gXoJA8SHMIEE2kgO2zEH1PKolkxvItYvtojZqS1S0LZMK3PUbKR5YSRZRjHWS0qmAcYxhBUR+2aek02mI3tVqFadBK64qc2TGKvMRnvJsNgNollJeZHIYKbftSUxcUtV4CR6x2H+WAm/psbbr06JX2il07Rbd9sB6ocMwxNGL4MPb7fbp6Wk+n2eOIBmRyWTu3r27tbXFZEF1hGcaj8f7/T5md61Wi8JhtVpVLYHCzNnZGbZsvV6P9ohyuYxWw+bm5tbWVr/fPz8/Pz09lQw9mwUXAvSfz+eZtqyxvAbTucViQSWDOh/tNRBhGMPD4bDdbuOwKnSSScGux2UCKEvvmJUc/ROgWxIbxFjwNjw5OZlOp2tra5PJ5P79+6hJSL6AFBpHRHBneDpAwKDDnU7n6dOn7XbbsqgWi0W73Wb92djYYMF5+PAhNVGbhKt4LG0Ba9kkyo+2AFvDUBLINLFZsQd2fPkidzabzeXz6XiclQTOr2645epaZQArX8jio6mhMSxeGA/L9rrKfpM4h3Iaw1vT5HMrpwAjsyCOVhJrhqYVksKGFbq12T7LmqftQJzDoheqP6vMxmPCYYx4QM/RGpy6QGtVb8SHDX6WbeMNlSstnBEiknYn0mZh5T69Vp5VxrmRYlYewqWiVwj0W1qcHSrh53txQggQX0DroOhOJqkXDVGccxcRrkuw6a/8iIyyIlGhVSoWzw9SrwKbAozS18zgP+cWsRgaw4uYW/CbLzyHRdS9jdxkV93hyN+HKmpfCMpHRgKXONN+VdW1LzMYYpffZb3sOQoSq0oUtpMjEsH05IAjwUov2g8x+i+83suR5UtO/oUe06pLWPX7L8xuVn2ap1QWzoLI0sgXDt3LL2pV6WXVbV8lTxSOgUvKPGErjLeKPtvXXno2jZeywiNBKs5lnOs7l3Vu7NxkOQcyzg2dyzk3dW5mVCaujqvjCiC+Or6eh90mbbnPS/utXABs2cePH8Otuzxzw1+LhG0ymYjERC5dKBTK5XK5XF4sFqCi+/v73/nOd54+fQoisLm5Sdtvt9ut1Wq4w5GG5fN5WxVU1y2dbmpShrqIAiNJOJLE9A7D8ez1eqlUqlKpoCB5cnLS6/Xy+TzOSOR+1Wq1VCphfMQ/c7kc0BLCjvC5RGOEOg0QcH5+DiaytraGEvHDhw83NjbW19e5OtJOiZlWq1XPiUsCHWTpkk20Vq2rOFnA648fPz4+Ppa0BamjSOJ8nRyonRE1s7SISM6Cl4BFRmNeZdimbUopve62yCAvZGS8aOQUKUkREjS8ZluvBdViBEAJADH379+/ceMGfobNZhOS+3Q6PTw8TKfTW1tbe3t7hUKBykEymfwf/8f/cTgcHh0d/Z//5//5wQcfwDWOxWKnp6epVApFY3AHiUIA+Obz+Wq1KhhXdkmcZL/ff/ToUSaTWVtb29raUnMZr2RkMmKZKUIAAZ64CRI7Bmi2Biyi5qF9zLeDLGxtbW1tbY3H4/Pzc6jrcIHRogW/oBeB3jHwF8BEEDrROblS6x/ilvKU+o2qVs7Yo6kZjc4ApoaQDvWsdTqdo6Ojx48fgyYLBeMbd3Z2Xn/99ddeew2K5ebmJhZ2jFsEiDmgIWQymWq1itTMRx99dH5+DqZj55cnb+IuKrU5Y1NjW0fdklPvWca9XI6njl19mrvYTmslAuyNtZLotgdToJszisbPgufxmA4+HjRr+Pr6OoRfhlY+n7958+ba2trh4eFsNuMGsi5pZWAc0voA+VcLIB0nTA0EFhg5MPorlQoscreUGcVdkBNgUeUcyuVypVJR2RKYdTweIygPPRmiCu+iGAmXXMU/ajZuqfAgZjoIowXWNSDVZEqbC+gePZitVgu+MOIb9Xp9OBwCQ2v9QT4FPJotlQIk9zaZTDLC0+l0pVIRCgkijKMpjb3j8fj4+BjzUrvGhjK+9veeG5JX0mPAqOISamV+VagWe32hUHBLaF7NuXZmMTgRQpXjguBXnbMlHUv/UTQ3q2Yr7LhYLGrJYsUWwm650hYZl069FgeV90LHITXjIyWh8put5HGeAsFBhyXM7dEVtWuw4hWLRWButVaw9sruSRuEQgIah/kn655XidSD9hi1Em1wFwWXLaFbVX9LmlavjIXOXWBMZ6l5tqPfggIWtbf1SOccK4n9a0iit/XpEN3WIm9bpyez2XQ8To/HqRcMzt1qXDL02np+yHVx6cfat3txoLc4eOhbaHnqGWTpsGoSnkaqR1oUT3M5hl08HovHY7TAORdfLOKzWXw2S0wmrIrxRSIRj8ficZ4aIy22WMQ91MkZOrC8H70bIhqEJ6rugVkK+8Vv8NwmQ/+xVXZhmpu2kS7yyUbKYth1xhsnnhB5iEfr8YUQnqdBbNWuFl+k8pZA1DuVsjpFoQqQ54kdRv7aK+Xp6lFlvedo9yyrGGOFd63/pGUeeArmsji23RJ2YfHUGKyMEufMXm+3D/ukRJiw5FkZGFIVVgHPc3e024pXfLW6GV4Fy8vTQ85NWNvzgPXLEfbIxjj7oHmONId5G6W7KL6v22J30s89EpfbijOmf5lMRgwYK5huTxv/YayJUrlccjx+GZB47lzKufFSiXjq3GLJC+bnxRIgni1/OV++hjD5SoP46rgCiK+Ory1ArNVZWpkkJDhOgAFZ6sRoNHrw4AEL7u7uLgTYVQAxbuzgns1mE82HbrdbKpV2d3cxVxHwhO3bm2++eXp6+tvf/vaPf/zj0dHRxsZGqVRqtVqQi9fX1/P5/Hg8LhaLaFygygr3SvbTALJATqgxogsxm83wiD85OcFlpdPpbGxs0GzrnPv1r3+dSCTW1tbw3Hj06BEp1ubmJhkUlkHn5+fFYrHf74NZA5eo6Ri6HJ5jk8nk6OgIWUnOcDqdHhwcPH369JVXXrl16xYYMVhDuVze2NhwzjWbTdjcSGo653q9HpydYrEoYLfdbh8fHz98+PD8/Pyv/uqv8Iq1jwAO8h//+Mf79++3223b9Gf7m9xFR3UBbWIaam8msxXx0xKsLsbxMUVdYT+d4jBP6lTW5zZYDz8njB1ftLrupX82DLLCrN63eB1tAhG4z4eHh3/4wx/i8fgrr7ySyWR4lLVa7enTp4eHh865zc3NxWKxu7srL28oikBmyJgwrWq1GqcH9zCdTq+trQm+t3a9PBFhxMiw1uv18/NzwI5UKgUMxNOUUxbPl/qNyL8w61kE6DpHKcyqE3DJ9Xr97OyMtgPoY9zAUqm0t7eXTqer1Wqr1To6Otrc3HTOIb3C2tLtdnFzgoOPTsXp6Skt9oTaRORWM9RqWXpaDTKKAZtDszUWiwF8oG7MI0N8QKLDBwcHjx49UvRcqVTu3Lmzs7OTz+f/2T/7Z3/1V3+1v79PcC+/Y05jOp3WarVarXZychKLxdbX169du0avw2g0Qjp2MpnITsQutp5z46qEU5oe9tojSR8vEM1ezND0sV5uY2FfCxl7Zt/ygVH1wruK8Xh8dnZWq9UYVLdu3UI+hWeELAOrHAhmOp0+OzsbjUbWC4v6YrPZpDsEqV8JpwCDMnQZNuVyGeyv2WyS2jE7+BmqONrQqPEOh8Pz8/Nms8l4U70BYzoZHqIRwQyy5S5xyc/OzuxGMBgMRqNRu91GTOn8/JxNodVqnZ6eIgQEZl2v17nbtAUw8ufzealUqlQqSIHTI3J0dIQ3AFarcNvZL7rdrlv2A6HOjIDSYDBgW0kmk2xJPKyzszMLZAuApm1FqKh0D2lusE+cc7awnTJwK1vv8c0906ev5EjE4+izQxtGUYTnqJTeLUW0OFute6C0KhiwxFm8gJpECA1ohlJtsmk/48Sy8q1JHRuoRKhtMi+xSM/miA2XjcCqf2pt9BqKJbyuqoNVIgrtKJk+1DOQbeGK+A1XpHPzAIJkMskCKzMxq1TuVQK88IClWEUdC3lbaFLrv9fDZKWuXaCsauFjjwyoExNAL1EmaQeFEJhbQVu+ZEFW5ZsnHp9OX3S5XvX7EL8Osd1VRL9VQZQHMsojTh0bIZdcD0WiLs5IY1lskZ2XkcmzZqUSBiTsj8OiWhbiZG1flgTisVhisUjO58npNOVccnk30CKex2JzoKRYLKFCuFf+tzLTKg/bZ6eh4une2pvGnZG2qXcrdHOE6OkO2G4A7fWT5eGZTHqBtO6hlSnXzRQcZrW/IxFY7yZYAzqPUJ9eHtbQEgUJt1rZPJPJFAuFiRlvivF0Stwiy9m3yKBnsIbzsCavfsksU+uqV/aw3Wa2O0QulHrKttuDcyCK0KSwfAu37P5kbNviE0sxm6nVNw/N4lh1PRV4JI/VmIIYIwG8ZXRZNxH1xlkVCA8g9rT+CN1tk6IzJpzeQhHZUhm5zngK+9Ir5wTIj2BaSFXMQt7yoOOuaiiqDg39i6hPSxDLOF1oUGFoH7SKcLLbLRQKAAiDwWDmXLbZjL+gRvzysrWsPNOzcWPn4ktEOLHEiKfOJZybLK3qpss/XaHDV8cVQHx1fE0HwdLqTXbSrOzWQEnFW9bxbrd7eHiISMJrr722v7+/yqqOnIfuRVQaoN+SuMJwLJfLuA8hW7G3t7e7u7u7u9tqtZ4+fVqv1/l2SDpA1VC9ksnkxsYG4sjCCxqNBjxl2h7BpskV19fXcRiX4AM4+NraGqjQYrGo1Wrtdnt7e1sSwER7fCD0Q+KtyWRyfHxMUEgk1263m80mNGT5cbPboT/QaDQymQwwMeZmZ2dnokhzmfl8fnNz0zJf1tbWYMDBhRQnmlgBueTJZFKtVkWDssd0On3y5MnBwcHx8bGnWMemayFgjzXm5SdWsNjylbRn27d4QparusA8V1xrEKcII7Km7RXqX4yVY/Dr0LbOMo8kOxuWyj3/YmJcWMOdTofKBH6GrVaLycUwAOTKZrP1ev3k5ITMPJ/Pb2xsdLtdQliAJLj2WCCiTAqyKc1fz2FJBHlGI2ClzBUFiNCozk3m08Tys9w0z6FFYTphdLfbPTo6cs6tra1ZzTWhKirVQOrnqxF/ALYuFAoAT7iZgVXZENxm4Na9TdG8Bh4vg6QJ1NXpdMR7Qq0FKqgArE6no5chANLr9dbX12/cuPHnf/7na2tr3/nOd27fvg09kzsp+zvORLc3l8tVKpXd3V2cLdGcsTl8yBbxZqIXiFv4Sep13mtersM0sgbjzXeNf8v01EKhweaMO5kKSB4uQPNErVbb2dlB0GB9fR1RXfRYyGOPjo6AihaLxeHhIQ0f0rdNJBLoRUDGl/x6v9/HvHRrawunNfQcSBS5Xc1mU5cJmqmbD1RdrVbH4zHqE2BwSA+x7A8GA2YNOwWcYl6GCSRDt9ls8tB7vR6LOTR5BhUDGwkIZjcXXq1W3VJAny9SEkgyWalUrl271mg0SqXS9vb2bDb78MMPf/Ob3wBbc/8lDi5bOZVak8nk+fk55ns0slBGtbUi7vB0Oj06Ojo+PrbcfP6P04vSSAsQW5NDscs1dLUyW2gyrJF8JTHM3GgvWmauBTs87VTL7GMiS7raNlXAOA41x0VZQpwEuFnSPeBEHr/J+ghJmsNSoiw0rI3Stmt4RVabwFuVc3Z2kdpQkPduiMULBFd5eIEmjmzogO0MPBfT7y1E7pl6hcRMj1iqAqT2Fwt1qX7Ml3q2tyFrOLI3KERLefrC6PW8LChmX+l9RaSahPcW7xwsr/M512o+JXYxKousFIYAsf0hVBF1QV+5dxUeIOhRv0PJFDE0I0+GCaXeHbl1KVTmZ6HDApG9+NNeuxqG4vGEc/HFIrZYAM+A3M1ns3kiwSzzKfkWWLdWhN7GqiHnAcQWYrOAuGcQZz/f8iqseLcXGLDGSp5Io12wuAX+rPmYXWCtRk0IEHu83XAYW66uXaBkp6bqkUjul7eDpFKpTDYbn0xmRkVHy6O2CXFm7eVYGrtlmCJaaNFhdjT2aGHrYUHFPkHL87Uno9PwFLS9UE0PWjPFiibbiU/w6S3CLH1SKrOhoAizsp+R4TM7fsiitcZuIc085P/aM9TiH65XHt0+1Ey7XKDDllq5fJUGKVpb5WVQeC5c64DGg336oBakRZY/JK4SERfsE2ssaYPbXC5Hd2C/3++Px7nRKBGPv0xEMnJu4dzMuZlz8aW+RNq5mXML51LOzZf/pZ0bOJd2buLcdPnD6Epo4uq4Aoivjq8xQEz/L3k1tTvwLKvaSRZEet9qtXq9XiaTuX///s7ODtDVJTxiKf9CraLlHMXDfD5/fHz82Wef/f73v+/1en/91389Ho+r1WqxWNzd3YUbS+bsnANHoPkdj3g6fAGOkQAGelhbWxM1cjQaQSSkjxgRSe3E6+vr29vbzrl6vY6/ECqxEMHQiIS3y6YCJbNUKh0fH9PJAtIEPTmdTq+vr0NSbrVaYAE7OzsIQWI0B++SPl9SfQIR+DvOOWACom2IzJiGiVkAhkLUCCC+vb0dSeWmLx6h1ZABpEzYorG2iG0Ncz1ir0VXvSDeai8oYHUXZYud6QMNfTxsLd3mM0J1w69+fnQ4EnH2MAsrrhL5lvCNljxIDIQgL7OJW0FnOjzZWCyGGjWIf7VaxXRR1Q6QC/Amz5TZIh0i/itlIoi3Bnc2aQnxSj5cYIRlftmYNVKb0vtYy/a1bsg2FVE2bnkoXmxqZa8jWx2FRDvTS6g7THIlIEaUZCFoGH8xKZjFnEOhUABt3NjYgP1B1oFEsvrWgdg0caDg0d0v9eeQnO613Xk5fJi0h29/acq8bj5PzTPUEv/COqrrBvKYBK9zP5V+CBtS0iVMEN85rM9QUQfEp+uCF8xms6Ojo/F4jNJup9NBkr7T6YxGIwTl0Y5oNBqj0WhjY2NnZyebzdZqtcPDw8Vi8Y1vfOPb3/729vZ2q9X63e9+V6vVwBrW19fZF1C013BVx2ilUtnf3+f3vV7v5OQkHo+DZYONttttVkg+h2aafD6/vr5ODoNrdr1eB7Sl3olETLfbpSwkqVa+em9vD6NR8j2VPEul0ubmZiKRaDab4M4bGxu7u7vFYrFarZbL5UKhMBqNfvvb356fn2ez2Xw+jwI+lBmelHDtRqMxn8+Pj48xzOz1elpm2WJKpRKlRwqNBwcHT548YXhrVAgTkYmQZ/KmspAH5HnEWKtNzPS5pMP6JQ5qvaPRaLrkOMu1RpUwK9mkvcmTU+fEpNQsjh48Jk8wQaksi7wWBIIo6/mmrZNvF5dQ56agS5PONk8I/BWUJnSYU+VnubTHg4OynEeXCzc1JdhWVkL1GPHjbK+uZ78Zdvx40J5dxi0ebceJxaQ8Y0OLx9mN6RKQYtVrpPIBRZodE7jhksYLxTxemcFiTJ42sRbJWCaTSiZfaL2ez+eLpcKuF8N4QHnkNuECPQFLrF7JhzMLu3h8Ynd6kJkt1bP42Edv74xmpdBhDyplSZRGnKUNWuagBYzUaBLgv1bYxFn6f6jy5IlLeOoWwrasLoHXzWYBYq+Q44wiv5UR8HA9+1HyolDUpynvtWIAIHpt+HbMe1WESGEH725Y4y9hwRYgtp1kc2MAulhNr4zHYol4fL580LY5ybO14LaoG8mbTYL/WI4sg5j7hsfAYDAQGmuLeaHyrMi/SKtZ/NFqzWuIeuYclhyjHcddFNVhbVHZ0srvqEGHtcibmCzpdMFK5F1jyY4KTyTdLrZWqt5Svuzd8LjD4ThZhS9Heo1GyhlbEr3a+FRzZc+lRitONACxXQHsHAe1YKFwpjdIuyFUYpVGwqIOQTuBYi6XS/f78VYr8XIM4rhzaeeGS0EJ/OikL8zcWix/qf9nrqDhq+MKIL46vt6H7bOzIZQgKmecUmyxHX7Wxx9/vLOzc+vWLWjCYXitDR7kBV1OOr4JQSaTCSrA3W4XMYSzszO4Zvv7+6i7WoIJRC2CDHCHYrGI2KiyF/Bu8nzItvV6HdIxFGMc8PgrMhdwhbDdE9WLvYf7ww6NPVEul5M7vKRa+Xx9FPk8HdAwoPv9/unp6XA4JDkXBK97pYRWCpvk87rnhEcAVUIrXn311bW1tVu3bkGytncedLhWqyEU4EmMOeM35bFrI7XMFA16Kle2JUpbrOc268WjX2jxbM8nJOnYb7+86Sm8ITbU8HgEkd/iaeFZOzivfZUSxfn5OWqkmEQVCgVYtP1+fzwe12o17kypVLp58yZjGN0VHvqTJ09wxBKlGn3ex48f7+zs2BY/RZzgI4poGUiobDvnMMfTXzVJJWatnFwIDsAW90cFJOlOyGirUqlAOdTQktIFCClGZJoUwmhENkf4ezKZoPBLBAzFVfZEwqH4XptVok4AX09+mKDzSGqKlCebTajZvV7v8PDw9PSUL+UqIDeVy+U7d+6gFT6ZTMCRIYRChh2NRryy3+8nk8mtra1yuVytVofD4aNHjz788MPDw0OIyau02yyqvqpNWKGtMgFv0r00lKYURQUbLfW61UrkQid6/dLLSPXJIuAwHqgmttttiDBuaeeIjA+dlQI68fOsVqvpdBolH+AqccoajcbJyQmczfF43Gq1KD1ubm5ubGxwet1uF1CVMh77C5K7VP4gGTFa8GoDuUaBAbnhQqHABscN55foIC8Wi3K5jH4FJRzdDVpBRQHTYgi8O5/P8/m8cHA4y6RJpVIJ8W7IyIPBIJvNzufzbDaLTSKqSgjfn52dgUtSs2SU8nTYrWhNjcViKOnr6WhukrUi4k9N6/T09PT0tN/vWxUgVgO5lin7tYUfu4ZrVbTkYnH8tTR5XSZfCUCMHvR8OoXfzSaudcZ6uImZy6OUXI+FLbSei9XoMZVs14vq00wi8eCsUbsVuFQlRquTgB5wBIuhM/uoNQIW6C22wGaVNDweqJqTxJNNB47tFnhSWVG/BPjQTfAIklaWykNhQjDC7uleZVG7c1g88FqVPVlhb2u24UqkG5KFDOxHWcZ3ZMPQJVFKpDWW3b8SzqWSyUTqBSSIF3wIXciBJkB4Ay9RAo2MZyLDGzvypS9h6xAWF7aIudB20QDtzbdviSyRqtJAUiDyoCdkrKYWvku9SiHvO5LsrOFtywaerq7V6XZGXFhVdgFtXoeTxY69r9O7vIfosRAEsqtUH+n3aAnvFsa1qGU4hi3qp0DRK9tbMixIvQBiTwDn87m8vJJLhvFsPp/OZvNl+c1W6fSkqECwWHnTUEV9ZSVAe1ajWcVv5WIq+dtFOFyypA4hPNHzq9SFqz4qHNPbDe1ph71ZTBAbJoUlH/uwCGxY8xF7tE4tXr5mx61dNj0I3rZ82WXBa5TUe8OejHDYe+uzLZDYwqFl1tttxS31Isi4Q8DdW5D1Ah6ZqkT25K2qVaiS4RVpnm09zsWy2WQy6V4iJlksucMIDSeWfOGUERpOLSnGllAMpzh+hUJdHVcA8dXxtTzIn1lGpSTLpmhlsxKJBJmwap7xeLzZbP6H//Afzs/P7969+93vfvf27dtAAHZfFCsNiUmQSlSBMDYhI0omk+vr6/V6/T/+x/+YzWa/853v/M3f/M2tW7fW1tYODg4ODw+BCRKJhJp2nXOtVgshoXw+32g0FovF5uYmZLFms3l+fj4ej2lq5q+5XA7QFhYwTDTYWOVy+ebNm0QY0ADBgtnUC4VCs9nkGwmds9nsxsYGcJ5aznl9t9utVCrcKKCHwWCwubl5fn7+8OHD4XB448aNGzduWBomNy2bzaLfisMSfwLaQDIJMURioE6ns1gsbt269d3vfje3PLQfkwDXarX/+//+v//4xz9ilGT3b5s8K4qSrKFiFHdRskoVAjWiqrXW5gz6BAsNhEmjh/N6JBcvIgmFU9n+bbj2PBhxJHXC+714ZB4XQKdt4zx7vd1u9/Hjx7VarVQqzefz9fV1uIGAvLVa7fT0tFarMYq++c1v7u3tdbtdWOd/8zd/U61WP/nkk1qt9vDhw6dPn4JkkTPga4cT2t7eHhIoCivpBHdGzZkXNBqNbrcLd17kC5k1wSyz9xYinsI+ImMJuomLkUwmy+XytWvXAPiYDqCBvV6v0WgQ7m9ubjJ0uVEAZ7JwRGUbWkq5XEaJDKwWyUs9CMWRli0iXVFR45mzqVRqd3eX86ROI44q0uH1eh3UstPpiMcK1Pvqq69+61vf2tvby+VyuueAzt1uF2RZLP7pdFooFHZ2dugwePz48a9//evf/OY3fKxlzVtzuZCAHw54q5LpTKv1l2/MF5nLMznxuNskSKqmEH97AIHlNlpnKgsPIcj+5MmTUqlEwskgQWiIpwZezHJXLBbfeOONyWSCvgrlulwuVy6XrV2nSnfj8RhCcblc5oZXq1XgwsePH/NXynIoGlEOpAtkNBqdnZ2dnZ1ROeCSWf8pkKjBAjaKqKkkz6zD4/EYpJuUtdfrPX36lA4VSoPAi91ut91u8yifPn2KpAxCRtw0WEKj0ejo6Ojp06cA5fzAmMnlcqVSaX19fWdnB9kl2g6QD9bNh/NeqVT+1b/6VyxT1E0Zrsp1QahzuVyv1zs6OsJM0pYqbQeJJRRblzCPJuwBjpZo6RXV/nMUuWfT6WQ6jS3RXgYb6wmNAhq3FnTg3MSQdUsxbovChNQwi39J1d3eOqtQYaVyhDFZEQ8LkVD81qJqARHWcLWe2M5oD/EJ9Xa9fu3weVnoXFCLNVT0hDVDvFVgll0oIhcraxIVDoawrzmkOQtlsBQHFdIijXA9bM6KhwoD+hwsuGgY5aJMnDyU0/u/dfJ89hxjMW7NCw3s2MX5aO95KKwcQk6WnxGCSqFIgsWbrPiDVR1R0cIDiCmVMYls7BcJEglL1Q+25Uh4nHWp9XS3WfzlK2vhPA/z9e6YvUxhrAIENR7sbPJ4xJFmGJ5qjQ1TwwjWzhcvJBDR2JutniavogIxsp3xYdPk9eBy7deWKen5Cuj+W+1Xj47q80MvdVN0zk3G4+Fw6JaKRlZPw1JMrJWr1Xnz6j16arZYpYuivRISsS0RebUlu6CJIOy559n1XGUSlQpWkfTt/NIs49u5OuthyBcRJ9ihBc0WFQW5njqjRBT60VlFOK8yZzVS7GLuAi2ayNrSqiqU577oecGxONhxFcoGUueWQLN3LaE2t4UUQjkmO4O0KSt2dYH34IUPTCaT6XT8pRnEY+eSzsWdmxslYv0QW/7JLQWIZ85NnIs5l7jSIL46rgDiq+PreoQd/dprw/qb9kWV+4Ba/vEf/xFLqJ2dHXAZxe7CEeBJIZCKfrGou7AIWdbBifr9/tnZGUTdGzdudLtdLIAAbsBk0XNgGyiXy4hSgZzi5NPv98/PzwFSgQBE58Tg7u7du4DUi8VifX29XC4DAyHbB1GLpvVUKkXnOGn/eDxut9tAt4pgiFbBoaCewZGE75DNZvf39zudzscff4wXGRAbkDr3Kp1O7+zsVKvVfr+PKCTtxnwsuhMEl91uF0XjUql069atkCbT7/ePj48//fTTX//616enp8IObBSiB63eHxfl8hw2DXlkE9HNbIgcCYppjCljt0l7uJFHqhVfbsDyhaM95E3YMMstWw5DxUxLdIokFhEeMTYoXcAgRvQzl8sVi8WzszMGEmyscrlMqpNMJm/evPlnf/Zn1Wq1Xq9vbGwsFouDgwOqHcPhEPZrPB7f2NhAd1Vt0epEtufP46ZTHpEWgTvCOzSdiaQly6CEwcrgel4T6XR6Y2MDUMM5l81mcZ+jjgKLM5VKIbRCFieAmM+kLgVUB0amUFgIhXBSS/q2yY/87qF5SrwFTRWVo05PT4F3O52OjLnwBCuXy865TCZz/fr1/+6/++/u3r0L/gvjm1YD7r8IL9SQpG48n88fPXr0wQcffPjhh0dHR2QCIZ3EMxP3bn6kauQlaNpLAG16rPpqda2SkHiUE+FlNtX3VAuV6yoZsAwOhClwNN3Z2dna2mKt6Pf75J88NR7KaDS6devW/v7+6ekpFGP1fWMux+CBZEQlg4mws7MDVMqiOp/P6/X66enpeDxGyxiPR3QhBoMBgvKIUDcaDbds57x165YmFIMZbFH5m/Jb8WfFP1W+2m635aMNmzWVStXrdZxLoRFhokIbDaTjYrGYTqfb7fbZ2Vm/36f75PDwkPPJZrOoT2Qyma2trbOzs1arBUbMaJTRHMQ69ppYLHZyciJgne0SWfNOp5NMJovF4mw2++yzzz7++OMHDx5QgpUCrJVWt3CqhTmkR7FKa95qhXur+lcoMTFfLEhM44sFwwbAnTGMboZHOLU7FAPMLix2SmrlsXLA9g4QBkiIQ1GN7f8V9UwFOU9Dn7Oij4pYhdkhJVDLIPbKTlqrQ2q2t39ZACtSZcKDw9xFvalVwYD46baadcnD9UjKFpeUbkak1EPYL6/Qa1U3hrc5uovWpiqaWotOWzYLw+CQkCsRDA0ebaMX3h6IRXwxOhw4N4QaxB4/NGRqh9C2R2+0Y36VUq1VNrC1RsE6ktn1kFntCCxNoLqaR25p8ikJBWcMDMHCLEBsDSclveVhXpZfb0XAPWKBCMvqNojkS9qow4KMkbLa6rKyi4kHI2rdWBVeqq5gn4uoux5cK4OyxUUdds9OWa1jui0eE5lFRho1Kt9a4XWv5vdsSBiq+6rJPp5MhsNhbFl2dUaDzoKYtoAdytRELil2peWEpU9C3qTLF0IqeNGqaXka7u6i2aYqFkKiPTFoF/hYeh/C7sDYgNRi7Qc9nQ11jUhIUCuwJ8TsEeS9RCZc8Sx3PmwD9TYOb/WwrQC2cBJ+hY0GbSxhLVu9iDQVtFZ4z9rOPpsq2gKeTpilxlYNlVDYyyQ1eFZnIul7uWgk7dzcuely1R45l3Qu4RxuxxnnYkvdidhSViK2FJcYLr3sXvZ48803nXP37t0j83rp44033qhWqwcHBwcHBy/01e+///7zvLharb7xxhvP//qr4wogvjr+6Q81a0jKwIsDtFXblZ1YkD2p2WweHx9/5zvf+fa3vw3eajWkvB095AVkMpmdnR3Qz8FgUCqVOKXBYPDo0SPc7dfW1qADE8rIo7xYLE6n0/Pz883NTRQnOTEA4tFohDMeAhe0sQDLXrt2bW9v78aNG3DKJpMJwpcguUC07OUAfGJGcO3dbhevIaAlfilNAEBzsjt2JlqGX3nllel0WqvVJpPJyckJmhuVSkVbbCKRKBaLxWIRStpgMHj69Gk8HufSAJqJbGwra6RwUr/ff/LkyUcffQRhjbDJ2tDzQDl5oTz8n7hQTbjetm0hXRsA2QTSy6Jt74+K+QwGqyFr4WbFTxp12uBtyuou6mA8ZznEXWyx1AgPDXDcxWZ/e+vC226hh8lk8ujRI9h8lUoFsWzUQvkEsBvQyVwuB4KWyWQ2NzcZAKPRqN1un5ycQGUllFksFu12ezgcHh0dKeDD4K5YLOqEYThCXYeVdnJygthxNptFJtV2UCoQt7edYWaDYGl/61sAVqQ8CH1+Pp/3ej0Mu/ClnM1maE24ZUMZcCRUTRzA0AcvFArWmY3Q3NLYrQaOYu7BYOCWfl9QmOv1OnAMV9FsNjENQ/6VWbO7u/v6669/85vfJGHY3t6+desWOgYQD8WpVJaLwDQQM4rqJycnvV7v448/Bh0WA9rG2ZH4giep6QKF4rCVz8brL8fEDJN8RoJ859zFZkB3sQ+X0qA0B2x/Sah0yS+n0+nDhw/7/f7du3fv3LkDHoppITUJ8HfqgoPBQE3NNuUej8eMZEYaAD11BWiVNLhA1EVUlMvhA2/fvn3t2rVCofD48WM0JXQHYL3B5L1z504ymVT9AFb+cDik3USyGwgQaYOQ+Ik1HaIdhGIk+w6DvFKpFItF5JKpWGC1ingRLQJ7e3toDjLTE4lEo9E4Ozuj/wZnFXm1p9NptIZommF4ZzIZHALYH+XiLRmW0Wi0v7//6quvJhKJx48ff/jhh0+ePJlMJhRcbbpudclDCexQDv4LC3tevfArrHI7PKqWKgooRCOzYxEujwgsbEjkIylueQmqBV+sIA+jl6VGYFPY2K42fIsOi8pk9evRqtL3Mu+oUqiK43kIX15VDVueI7nG3i4WmfxHOs55UJc1vL18I7Y4mhVOvbwkFvYbKW55zkKah3h68ErY1bHKhyDSvdaK8ITr78ut2JGPya3QrF/19CPL/N4e5H2ap6trWYq6Y14pPVKni1WIOiuLlXU+EInbKiAx4K12hHA93iXdUluWcFEWW56YgyS2pDBu+yQi8Ud3UWMt0pnQCjQT2FgA1BaoBOBaJetQAkIKNraXywOIbaNSSMq20hyWFW4DAPGFlZdZ4NibyJa6/jkqDet5dUBCPBxbkopCMQQVcqyphrtoWaGQwO5HeprW3JgrsqU41lhpsokRHGlBaYXgPUTVa0ewV2G5ULpvVpHfDk4J1lulJs5QmZ0eiga8poBnnundz8jU21PHtrt5pBqDu9hLYW+Ct2541pQuEAbUMLMT0CsgfTFJd1nnsx7I4cJo1TwsZCG1TDsZyXA55l+mUD1csoOdc1nnRks1CY6xhT+cWzg3dS7r3MC5jHOTl/zO/f39d95556233tJv7t279+Mf//hF4dc33njj7/7u795++239ptlsvvfeez/+8Y9XIc5vvPHGT37yE++r//7v//7nP//5Khz5nXfeAR3m4POfH4m+Oq4A4qvjn+bwurdUgvOCUXq6bVWQGAiQEcugp0+fokxaKpVskBE2G9qCIToM6XS60+lkMhmoXqAAUkusVqvAMfIHRxqV3Bi25ubmpluqKdFnBMHKLeVWiUHX19f39vYESXN6QMCCRClEEzCRkhGMqhTMPcFATHA5t0I+PHzjzBy5XG5/f79eryOIfP369d3dXTGIvbav9fX1jY0NnghGfArObE4rzMt7rKimYutk+QKRmnRe5z4RMw/dsgItoqQAl0DKtsUpOPAMRkQqDGmSVm/RNoWpG1cRpG1fiiTOvBCVOATdALY8frGHTipmsnUUW8pmDCAlgb5wpVJZX1+/fv066BjY5fn5OTjv7u7utWvX4J53Op10On337t16vf7ZZ59BY2y326RYUhzm/jAyEW+RUaTUA8VZa7VazWaz3+8Xi8WNjQ30VYUIC2tQKiIRYQ71a6OazRyRaYbUANWbj6rvcDikhx2/LBoIiHcrlQozRbc3lUoVCoWNjQ14f/oWkTclLKBAk2uk5sEsgJpxcnLyySefgEpDzWZ2EHzr/kA+/e//+//+r//6r6XOPJlMoHgDEIPUAFvzG8itNBxQqUIz5He/+x2VGE7PK29YZ8VVFA9nTJ9UYrFEbxsBf0mVCa9gY6N/m/0yftBPp5KkogILu+jklsNo1ygGVb1en0wmn3zyyeuvv37z5s3Nzc29vb2zszMqH+jn8nrIxYLbeHaxWAzSK8gvPSKcG7NJ13J6evrBBx9Q4bt27RpYfzqd3tzcrFark8nk6OioXq/funWrWq0mEgkKb0hYMFTW19fh2jNZarVau91m6YbRqXXv6OhoMBigDgy7nOqLEA0ZRVImOTo6SiaTt27dev31169fv/7xxx//8Y9/pGHl7OyMCY7+9fr6+nQ6PTs7Gw6HqOR3u90HDx4gczSbzSqVCir8tLbAPIXyjMhGOp1+/PgxKhY8mmKxyMvYVSuVyquvvnrnzp2Tk5NWq1Wv14fDocVQIvUumUR217DG7pG9I1amQKXBr9ykzqJvYWIcCY3FLh52/FuRJa9SaHcoO6nDLniLT9n5JT1xi2fZJmv7Ro/LGfYJhUjWl1TwCJ0zL/neSJfaSKWLVRDtJa5HzymnE75l1Z8ul+h9oXd5nxB5z7+CgR3VVqLJFa7ql/O1VzVdhT7AnkazlQKwLV+K7T057LBpnU+g+IGMu7QarE+XLUmq61/Wi84oI/Muq2keSq96HQOWUR4ZQIaEeiunE4nIe49GS5x2ydBNUYGWJfnah2htJOxvFPN7dmS20cFS5m3lQztpqBphy2mROs4e9d6TTn4m+zufL5bh2coROJupBcMrOSvaQbifnMJyRwhBtZ8SyD2T9jaFAXeRe27BTcGvClDFyBafQ+NBAibip0v+YpUJpKfNYiWJPD0Krlo+qBrSqL2Rz1qveHnZKehSodobYx7zYJVkhMdkt8CxRzbS3Lfep3at4K8y6XEXdYc9iZ7IHfNFA1d3sbFj1SfY26J0zJYBFKWDDjMo5y+3daadKxivuYRzydXWc5z73LnE8r+Uc4UXVpl48803f/GLX1SrVQ+3/eUvf/njH//4Zz/72XN+zttvv/3uu++GVN+33377rbfe+tu//dt79+49z1veeOONd99993vf+94Pf/hD708/+tGP3nnnHe+Xb7311ptvvvmDH/zgik18BRBfHV/rA3gF3hBO6+Th2pks0iEfW7ZbaQVUq9WTk5N79+51u91bt26pFzIks9gN1cY66XR6e3u73W7DorIOCbJNQPaBbYyWdlR32eS63S7hhfQuZTcn79SdnZ1XXnkFgzhSwW63C22Za2fPIJZFzoI+ZS4c6yTAaPzu6vX6ycmJcFjuXiKR2NrawpeMu8TNHA6Ht27d2tvbQ8m0Uqlsb28LD1KbJLgJTM/d3d1+vw9HCZhGkqm0skJDq1QqXldpq9U6Ojo6PT2FVqbN1YaPeoja4MWKEjjrWbqHchAWxrWBvlfhF+tWSXgkB43hZJEyT4XNGlOEIc7z5FyXIHReMuBWKHN94VcoSEIdgkiU5m4I8oq9uNXgobKw4H5ic4d8NjNUtwj6vFUIQSpXVRxUNa06m42WLBHAhnqe7ZgHUqiPjw+RNrHtcVYPNcNY5DglkDaStsmGejMVyenpe5oStmOUwgyS3LwRNVutYLrV6sck2SCI39jYWFtbQ6yZLwWvBCDu9XpAkMpheEzkDHA86/X62dkZ4Lvn27YqfvUIfZ68tf05tJxa1V/8glTLC1x4txR3Fg0kMv62vCFRpdxFvQW7WdjMnFVxMBjwFblcrlqtAokyflAXIWdTq7LGAG+Hui6ggZGPSoPeMhwO6eqAWVytVguFAmo8IM4gpMlkkj8hByG0otfrFYvFcrlMDpbP5yuVCtIWcpxjbs5ms0ajQRkPlBnlCtBq6gSFQgEnQ7HGOBDfL5fLa2trEJ16vR53A4XxmzdvIoIPKs1n8jm8plwuA7WgyGTJsBRoEZZharilcKE4zgDoGFciXINkk6XIeYCIfeIWPyJT9ahMkXu9u2goavmJXwEyLKBnuViJL+bBBNpHVmm/qJVY/5TuAeGQWoVEk0cjmLUX50ASe4vtUgODVC64x5v4apZXp5TgG1SzrY6qhws8Z00oFOQNVySt88rzPXDK7qGe6KTFBcLFymvW8aAT1k/rUxdicN6qYrcYjyvq6RSHSNwqQ9pIUyMXxcu+ZN22N8Hqrr7EYu2CXSCSSuyJv7sVkhQWSIoUifaUCmx3UcizFnbJfirw0UYa0pEYjUbyVLAiXS7wTxMH0woc2aFoVWVDLMwjJUS68FkgiVHkxT8e12GVzJp3P20RV2uFogsr1apGhLBtyNPytiVYT0RFV2flNbQAWu4t6DDLiMcUtpimZfNc4i9tR8h4PB7GYvOlDv5ldRQjF+7VpBU36vOt8C5rICdJMCD9FqsxbenGoTWfwjPRIAQQ2/xLQ0LiA2rg8DSsI0sF9pM1SAhmIuWPrT6Viq9uKXxsOVs2dBf6HFnHunxTiGQWawH3xDG8tSu0yhSvSBGIV7dwFzWmv2T97HlW0bk5LNHBshnYZUg3nsl6xOOL+fxlYhFAXtSEJwYFJi5JLn+JSZ2VIY4v//+CONz+/r7Q4Z/+9Kfvv/9+s9l844033nnnnWq1+s477xwcHLz33nvPgzID9TabTfi8BwcH+/v7f/d3f/fWW29Vq9Vf/vKXd+7csTxi+5a///u/f//99+/du/fmm2/+5Cc/eeONN95+++2HDx/+63/9ry0QDDrMV9y7d69arfL6arX6i1/84i//8i+veMRXAPHV8fU9QKms7Zj0+LTRagOT5gB7tlWfbLVaH3zwwcOHD3HRef311+FwWQ6y+rvDhR6W061bt+gNB6PB8J3FHRurx48fx2KxtbU10FvoXXSRHx8fQ48SrJnNZre2tsjW6BdG/0HYcTqdPjs7q9fr5+fnw+EQLpjtNqUvGGZiuVwulUpE/OhIAnMAMXOei8UC0zyuvdPpwBFj3zo+Pr527do3vvENrIHsHt9oNGq1GpqV7Xb7yZMnW1tbGxsb3/jGN46Pj8/Pz4EV8vk8Xfz42MB9s/IX8JqHw+GHH37429/+9uHDh9DKCDWAI3X/BQRbGoiNGJRIWx9h29UlBoflBXhMNJvAWCaFZ1tkEWoboXocllXCDs+JDuuKbARjjfvcRf8uFzS0hj94MZOGn6B/BjMyC6VSiZZziJPk4eiNaqxCDF9bW/sX/+Jf3L59GzLg6enp+fk5QSQTFlFjwp3j4+N+v4/ACxoOMNMh3hKDioLBjLY+VJJe5YTlASK4We7S8Hn13BmHbtnDhT1Xv98HK2ExQdECSWIppXhosuRZlR+qvOQJ6kG1EM9Ufdlg8Y1Gg4CmVCrZEFBKZ0i4IGvzz//5P9/c3KQgxPztdDqnp6enp6d8plCbWCx2fn7OVMrn86VSaXt7ezQanZ6efvrpp7TN2rjfg8ZsfO8ZZSiFtqPRw1gtSTOUGX2hpd6TC/D0Qzz1bWkmOOcgq2qOWBlxL1uWRqq9ZEpcjF4ovefn57VajfupJl8kg1UqYGwD+2K3CI+71+tBeqJgBijMSo5K77Vr1yqVChPkyZMnDx8+BOtnuLZarZOTE1ULILmT3kBhRo8eKi5lAxRa5DuKkkm324X7z/7CVdhtDvUMWkZYmR89eiSley4HXX7yXglKMjVyuRyzDNodT18DGI58s9ksFAqlUqndblO2wY6ST9DiD3wJQDCfz/f29tbX13u93qeffnr//n1Uj6yMQOTa6xH9bO5q8Uq2S4EajCvbASMW7VflWSeebWKJ5ApHUAXLkumEMVm9QkvmsvsUcQLlanXMOONWqs5lhhOFAU+IKQTCwhR6NpvxcBn5AMSy8aROoCqOpwCzisDr1QI9YQEdnsE945DNIiQ123dZ80MrF+vJ42iJk9ETUYoVLhdGHLJiPTaoRaUtRGKVf+3N92DxSKOt8Eu93nMv3vDufwhIsXaJ6PplqPJh41e4BYTN755YfCQCHlk7F/hu73Ooc2rFbVmNoVAApXkWbRZx826dRpcVDrY76SUUSBeI9SsaEcvYe71nZqAagyBpr9gQirREPgJP3FwaGp5znTNiNe6iJaPH8HAX/f28oNSeiRwCxIu0IrkiYluA2OppeBFLZNeCVzzQ2HgmsOPcfNmAEo3rRRWbvZEp41mNOvvI3EV/XQ+rDVkdIaZpAXdLrw4/wVop8phsITMssdgHFDk4w1fa5hINeEVfl/fWhK0nzxn7XcbvNhLq4d2IbObwyiH2E1b1avwXAzTCmWudMHU+nlb4lwpELBaMJd3s4i8TRobCw5df8MaArjrnfvjDH0rV4d69e/fu3fvlL38JRvw8APFPfvITfrBM4YODg/fff//dd999++23oRJbPrLQYfuW99577/3333/w4EG1Wv27v/s7CxALHbavf//99w8ODt59991qtfqTn/wkJB1fHVcA8dXxNTrsQq94HaRVPTtkeuBcAoill0SkdXZ2dnJy8uTJk2QyubW1tb29TY5h2ZTa4yPBOzp/j4+PUTIlaSfXxekLO6PpdLq2tgY0sFgsyKkGgwF0KrQjlLBhSdRqtfr9fr1eB5VA+RfV416vBz9ra2trNpup2Uq+zPP5fDgcyiWm0WggHaDOa+Hs3KtqtVoqlSSJgNBkLBar1+tw32D4LhaLjY0N3ttoNB4+fIhkbaPR+OSTT+hf3tzcbLfbQCcKviFioGiBWrGN4YbD4fn5OfXARqMhJ3rRauQuYnd027ukKE0Ucu2jXnZNUh3KeIWpWuixa9Wu3UWRL6vdZvd7QdghyvY88UdIdlOSrwzBumfYIrkXZkUyJW38Z/v0GZzoX9+8ebNQKKAESls31PKnT59ubGxsb2+DUjWbzVQq9dprr73yyis3b94sl8uffPLJn/70J7h+NNmhcMIwQ2hYIr9gZ/LWkA8J0BukeCnxCQfkzoN1SpJFRH5L0OAWAWnBwGVlKBQKlhoDGsj34g+JWDAVDij/ygmtb6GHGliCM+Oz1+u1Wi086DQ8+L2MxYC5ZfGUz+c3Nzdv3bq1tbWVz+f39vZeeeWVSqVSq9VYbQCIEbGVPCIrhmpjsD5Rkj07O3v8+PHTp089Hd6QoxHKOIaRtKcjEWkh4i7V6HyhANqqOlqPb/v5SsmY/mHjpN4rwT5bILFKixTwUOdA0tc51263GSGI/LC+ARCrYIOeY6vVOj8/b7fb4hA552ibAPA9Ozs7ODg4OjpKpVLXr19/5ZVXYrEY0g2YfzabzZOTk3w+n0gknjx5cnh4iOwv7N1erwdOzUfdvn2b3pRMJsNii8YFZGcqNOAdMPcZD8hSs1ECK9NfggQzu9jx8fFsNjs5OcFBbjKZ3Lx585vf/Gaj0eAcULWu1+vYnNLf02q1LPMI2WJhxLlcbm9vbzwe1+v12Wx29+5diqlQtjudDrg8L+O5Y555cnLy6aefPnr0qNVqSbnFAklA1VIDVxgQuoR5fRge4iZYQRxAz5/nywcwApa0R6hkq4KoupHkv6QVyS210TUOrRR+LpdDRN62DFvUUr8RlKxtRQi7rt2WIT18AdhURW7PEEzFpMgNyOq3epo2kfCT5Z1ZYRAAYu5hCMx5KwnlEDnFhzIXNjkXQIbcNsV49il7RXygjTS0TLHpiJGnegYv8LQUvPO3QlueoHaI8oTCzR5JzSqlhHA/8ZVVII3H44nFwr3I0r2IIv1FVqYjgWNrM+CpTkeqo9gLlziVJ3VtMTWBxaIPM7M8RwcBxByhCq2t3GiChP54YZ31EvDLEl3tyPSwflW1VRRXeONWqKCEoh8egGvRYU9iOCynOdNwZjF9DeNQYtgb1ZZfzPlzLeJo6+lks1mWJu3jOmexaL02ixCplAo510gUOlwsYqPRJR36mIguLpr7Wb7q5fI4NgF5HuWZSNFtr0yyigUcrhuRKLkdll4tMPKJhzmIXQ+9uCv80lUKPy+a4z+nzM6quxpW/sIawyVf9F8MzbACJso9w7DWNlM+++tLhNZc6My5wdJ6LuFc1rmuc3PnBsuXDS++frH8IbskFD83fRi94Pfff9/T/EUI+Cc/+QmvWaUIrM/BYu5nP/tZqCPx4x//mG/5/ve/L4D47bff3t/fd879/d//vfcWCMUg12+88QZ/veT1P//5z/+X/+V/efPNN99+++2f/vSnVyTiK4D46vi6A8TuorcssKOCBonq2h3Fqh1pt+t0Op9++umf/vSnra0tSJGQGZETvbz5BaHS0WjU6XSOjo76/T5cMOLsUql0+/btzz777PDwcLFYYOclTyG1cHIJuNLxsUi7np2doS95dnYGZYxcvdfrPXNRiMVQjKU1GAXV2WwGujSZTEikucZaraawWOkcnDUomZwzqHc2m+12u/V6vdPp9Hq9hw8fDgaDa9eu5XI5NtrRaIQc5M7OTiwWK5fL29vb1Wp1Op2enp72+/21tTXkMqBCp1IpOrWlPMsxmUw+/fTTx48fP3jwoNFowOW0DryKXD3bAUW3Xke/NSUQ0B9GCR50aGVteb0Nuz00QaMoNOayDaSWeOIFi89fRVfZY1WmEfr2erfItimFAIel3dlyCzziWq0GfAlAiTQwdYXFYvHw4cPxeFwulznDYrGIWMrdu3d3dnZu3769tbWFYOjDhw9PTk4YCaJugQfJrocePXGHMUSG2Nvr9aC5CQLmT5bVKx1Vt1QbtwExODJScdRIOOHbt28j1S1oBna/cw6gjcuHVin6v26+GpmlDqa0R/K+4D5QV3iBbrKcWIDLE4kEPNCbN2/evXt3e3t7d3d3f39/e3sbQk08Hm+1WvhYUohqt9uj0YhUajQaNZtNiK7T6XRra2tvb69arYJEHB4e0jCh9ouwgz6SdOalvh5qY/MQT3clpIO9xDpvRQx1t+3Z2qjaS9FXSSvyTwB0ae8q7VGtqFardTody+WRXIP417RHIPJgMSPbrstohypL9svKfHZ2dn5+zhPf2trq9XpnZ2cfffTR+vp6sVhst9vn5+eS5UGPBaEGNjvhoYIMEAKiHFir1RqNBos/qGu73daOgMiSDOISiUSz2Tw6Ojo8PKzVavV6naICjnyMN3oCmIl/8Rd/AdpObwFcdcY5LOBms0mRg10Gr0t1e5TL5VwuJ38eniDTM5PJYF7HY9KKwa4xGAxqtRp7HJ+sVddmegIfbZFPq70VPRABihtl++stLc6qV38lhxa6xPK7hI9o79NYIk6Qzj4Dj2JbPp/Hq9YKSjCkeazECRJ/l5SEDWBUtJMokG0NtqxAzwoYNr22V6+/OOSR2eqmZILcRb+m0HLAa7334AOvTdvDxVY5nnmXtuqEqW33ej0sQzEEprPEdoKrXiukXgAxJANuEXwFdiskxTRBwlKH13h0if5PJM4ewlWqg6rlxbufjC55/05ns4Vz8fn8hZQmwvvvcW8vkduO5BGHHoNhlV3yTYoVvVhIU94KT4k+DMRvg6WQVOt9r6UPh7K/HrXTU8datYyo5hGqfnvoOWfFKhF2N4bosOXmh1u8bpotunh8altRtgGMDaftIHRG+97jX1tVZasDo6Fr4XvVxjyZDsnI2mdqwwNbSWIAsN2zXY5ns0RgZ23vzGAwaLfb8WWEINULIdo2Aox8+gSEdgx4m5G9/54piPWds0ULr7nBM76240EFM+sjZ2HucNLpgVq2OB+uGJvrVb+Rti3PZTEkcoVgtDd+woWOe25l0Dw6y+Vp1PzioROQSLG3ULuLgtqRiP/z8Hs8asXz5HrwY8j9rRKdbSdSBZdsZT6fL3jxS8QkILzYEGacmzo3c65/6etnzk2dyzg3cG5g7Oye4wDVdc79wz/8Q/jXn//85/CCv/e9710OEMsy7le/+lX412az+f7777/55pv6OsBi/hSpcfyzn/0MQWGhvd/73vd0VuHr/+Ef/oEPf/PNNy8/1avjCiC+Ov4pD5vMqzMLWT3LbrONYKy2BPHOSK3xIaenp7/97W8zmQz28Tdu3JBw8KrqonbrbDZL+/bR0dH9+/edc+VyGfJOIpG4fv36aDR6/PgxqRq/50in0yQbZCCISJIqwxQbjUY7OzvxeBwuWL1ed87BugJrAJmF1dvr9arVqqiF5JAASWSANMtbvWbnXD6fJ/eG2qwgIJ/PN5tNOo6ByUql0s2bNwUQ8wPUac7h+vXr1Wq1Xq/3+/3z83PuDFCyJJt3d3dhtFmA+Le//e0nn3yCuIQAONv+aZ0HbOIR5pniwih083AupXO2QiCymIWTLMK7io7hGb55LaJek53nTPL8GZfHGhZ1gnjXC/usuqJb2q04o8AYJu02ipLoGG9B2bbb7aJPgrVjs9kEwOVBI36NUdXJyUkymaSNHX5iv9//6KOPQIdtU2S/34dULnSPL22320Bg4piUSiV86uADJhIJkGiJC3OejByYyM5YFAoioVs/n8/TCE/FYm9vj9gLOj8oW6vV4saqm7vVaoX8X2tLKKlZEG0mHSgeahKWrGr5enwOoOGzeCybfeWVV773ve/duHGDZnyVqXq9Hs37GlHYrPOBqD9z8slkEn8/RGZOT0/v379///79drttsxSbY4QOV5G2OTZMDzmYQoc1RMPG4Rc6PNRDK7+AV3sOHlwiirEFCywC5ZFinJHJ9iRBE4nE5uamJEH4IkR1W61WtVpFnF1cQqR1yXBA/eioUGEjm82WSqWTkxPYvq1Wq9FoQA2mWIIoEGe7tbWFtMj5+TngqS1yoCFLF7xzDk0YtzT0Q6RYUr8M+0qlks/n6V9h9Wu3251Oh8GMwnKxWGTLIEljm2OO3L9/n/2RKcmEYgpw0zDl63Q6zF+aaUTsxQHPOfdXf/VXnEm73VZpkNImK3mj0UgkEru7u6i+aKHWUgC4o1qa5XHbQpHcaZTwe5meqmK2kOAhd5E2TV+SQRw3ZpsWdXIXG7e1buiXqOgg4iROq7voui5CohAEGHmeFIxV6g+TfI9vaDV2RDGORAQi1Sok32l3YVv6jeSdRaK3aiLx6sH2lxYacEsVGlXHV3FybamJbgC8H7kDEveUZDzrABpKtBdo8STV1/BD24fYj+YVpoa3tFKvusRXwEN+ecpWqjW8gV53UciaF01+Pp/HuHXzeXI2i3+JQX6J2Kil2V5CGHzOXcNSXyNJyiHVcdVQ9xrVw7p+LOp4Hp6jJ6t9CbweTqgwwpxf5Ldezk/04KpVnhYuyjgxUtE4lKpwq6VFvJOPfBw2JvGUr2xVWHB/eHqRPnXh+YCzLlaz42mmaTWbydmMjgEtv8xu+Y54Khx2SItboN5QW5mzgK/XCGUBYgsHR16sBaDFhRe3XeuP6lLeYLCWCWHSIS0+HSp4cyukMiGw1Qpw2xqel0nZ8ePJwthPE77vrdWWNh65vKiUIhMO771WdtnKWF+yflrh41U4slexs803l0cCdP1KEkqPjPGjlIHqL4g/cdvlOtrRx9hoR0ycWyz/Ay+eOJdwLu7cyLxm7txiKT0xfzFti9dff50fIu3dpCNsgd3LAWIrMWwPzwHPOffWW2855957773It4Aph1/BKYWv14u/EMu+Oq4A4qvjn+zwABo1CHuleEsvIrNCjQHERAZxUjx8/Pixc+7w8PC1116rVCqk05drzJOTQ9jZ3NxcW1v74x//+Ic//GE4HG5tbSEoEYvF/vzP//y11147ODh4+PChc65YLII9JRIJvujx48fdblcqClwR0C1Od+l0ulQqIRABiLy9vY2nHOgDtwWTon6/32w2EX9Ip9O9Xm93d3d3d5f98unTpwLmlPGCfIFrwNJyzp2fn/ObXC63s7MjciXbcLlcvn79+tOnTx89ejQej7/1rW/9xV/8hXOuUCjcvHnzo48+Ojo6isfjW1tbJB7ZbHZnZycEiBeLxcHBwSeffFKv13X5JF2hE3qkm7y6I8OAw1MlE5tAjf8h/dBmStbeJDK2jkwALD/L4lmRJmbPk2V5tJrLM4qQY2VvXahWEdqy238yZvr9PoAjhnUS3gWgtOLL4I/r6+soOezu7o5Go1qtBoSBjSG8cqivMBHcUgGG8Ii5ycmk02mm2HA4BCeF7Q4XWM+IxBsYTpKCjKXJZEKkzuNGdIXubCgh8o0UGZOEXxOExJ5TsokZ8fd4PCbW5GfR6PilGEaiwHDJBH+i+ym3hxK4ubl5/fp1tGItgkloKKK3iCrE7pD91UCABAEzAh5oq9WS/WOYta7KpT0OS+i/5KKMRL5CumWYdloBbonuiWzimdGF/GLLTxFoIpMriThbelQymbx27Vomk3nw4EGr1ZI5ofjvyKqcnJwwSsW+gf2KxxorFSU3pX/Yx33yySenp6e1Wk0XAtmTzhK2jHa73W63pRvQ7/cZzwyker1eLBb39vZYY2ezGQws5IMk24K2Mm9HboLcD1F7vjSTySAaI2gYKQPErNkr2ZIQSs7n88xu3o52syqy7JIMTkYvWNv29vZ3v/vdZDL52Wef1Wo1fUI+n2cz4qJisdhrr72GQrcASvnkyB7Q9mPKM11zVquuZo0QRi8Jt60qGsnaU74qgNhF1RTtoFW1Qzo2yhJZKmnKoR7GbXcXDY6EO3ioQdiQLs1ld5GkbyURdN/UXhNuxJF71iUh3EvggDaptruzNwA81MYircIFQrWcEE5SibTT6aDwTjymqp5bCpGp1mJ7zrw1hG4qvCs1aCnm2UWYB8SmYM2dVnVtRypyenu6C9rAwzDGFk4Y6G6xiL8EABEFTIdfGtme9YVj4HI2cdhcH+rG2h08snvmeXDecNRdvglGhlhhdfM5L9M9Xxeap1FgCQqRtPpLsN3nQXu/qi3+OQeAV37w9Fs9LtEL+UKTELVarfR8nkqnNdM9C2uPO0zl0rKnNbtF6Q21qm0Nz6uUWGqL9zQ9MFQhDfPXo3hLeN0OOeG5grC9AqElBxDZyoZXsbpsP6yjeGicGGqvhyLRQp+t5aOw9ZC74BUCvaKUOgvpuFIvlxp3KK969H93aaOGtkj3RdZz9pWhA0048ol8CHiIcKB2SQ9Tkno8x2fdQvP55OUAYk4tteQOX7jOiz/EnYsvucbO/PAih4DdVbIMAMRoO1xy/PznPweijQSa9/f3+SL9Vd8L6oKKBRzhX/3qV/fu3QtVjwUQrzpPfdcVCncFEF8dX1+AWLug7RDJ5XIsrBKfJSgXhVB0P+rABOsKGTudzpMnT5rN5mg0+sY3vgEZ5HLNQT5/NBpBDdve3t7Z2fnkk09OTk7u3r27t7dHUvHqq69ev359PB7/4z/+YywWI9dlu8UBvNFo0EEMi6pSqQAHZ7NZeJdsaeiiAvrs7e31+/1Op8MlgOJBS0HVNB6PAzah37qxsYFyhYh1bJ+ZTGYwGNTrdV4/m83a7fbh4SFwyd7eHtqR0oKEDky6yPV+8MEH9+/fR20ZkPru3busp5Cb6BqGzwhK4m2QzWazXq/DrHFLMQT0/nK5nA13KHRbLrCQOGGCVnJRGa9bSuva5iaLlgoUEC3IXZS6dhebxS6P48P0TCYwLwQxeJl22EO6qgHT82H3ODueZXlIgtZV0O6NVxsCCOvr60LPJ5MJpW84tslkcjAY8GLNuMViUS6XX3311WKxWK1WER4ZDAa///3vT09PAcIEyQlJl040DxQhYxBeij3SAibOEyvN1tiJy8fjsVCweDyO1Cloy2AwgGKP/gOpO8oqQHiiilBTYVKIYJ5MJpEC10jjZNQRKcaZ8HQCR5ACpGaq1ert27e3t7f5ilwut7Gxsbu7C6mTEFxIPQ6TEuAjakccE/5mKpVaX18HXJjNZk+ePOHOnJyc1Go19Ty61R73kcudx9nxFPHCqDrSq8eity902IZr0BM1PHoCeVoZPAhbuh+i0mg2KTnRw3XOAcCBPwo4A6VFd4WsQ1z1brfLg6OUwtkiIr+7u3v79u2NjY1isTifz3l8KAXD2KUU12w2MSPd2toCJwWHkiyMGgggHrZaLYoB/X6f1pnhcFitVr/97W9DS6Qdnu6Q0WhEsZAPxMKODpV2uy1hcdpl5JY2nU4pfG5vb0PyxblOIi2kK9JnQEQC9FmMfiirkshYLBbAbfP5vFQqra+vU/Zgg4BHTwrEZZ6enlLwkAGaRinrhlRHbWrK761joWXjqlakfYGbTOXG5qJUQy3v8qsCRJ6Bv9OpEk3rAaVCpgrhBC3ojSgn1AKo8pLdsGwhhEjDLia2MdxrCwjFAbzt4zlFGyNfYDU9wl9eDh5FZvKevY/dfEN2ngAUDx22uhl2uydmYC/ThxNFWAacet5t+dmujTLJkKwtc4QVyQYqojtAIhNLWoy/yJV2FdhkH5bdUldRXy/IZxli2ctxOEJJ0+fEZFdtJZG8Vyl4eqNIj1X2DGL2iREZaaBqqayrTsYqM3jKzqsmQhgTrqLxrkKKQ+5kCEl799lrcVslRmGtFGx44FFWL8mGPJu1F0WH7XtDnHEVlh2qSYSjy3tSzy7n8jNc1nJmi8VsPhdh1uo22GVEohM2TBL9lveSpCgytPGJ5bdGAsEWL47UtWP/soSYsHhml0TtNdoibTVRdGl1gNn5ovXBQ1c9dS9rrxdW4Lwy1Sp+emQN0hvwHkJq+1RGy4NQShcbikt84bb1ogvXCwW6JEFSORNviehUOak0AL3y50sVZJxLOzdzbuFc3BCK4ZHPzcuSS1yYl8VfeEsATg1Vg3Xcu3cP+vD+/v4l2r6riL0cmMs5I2QhQvH777//zjvv/OhHP9KL+bqDg4Mf/OAHOjHBvpef6htvvHEFEF8BxFfHfwUYMZkqIbvib6J5gnXhMiJ9WKBQm6uoEwBbn3766X/6T//p5ORkZ2fn2rVr5XJ55XBMJqVOmEwmt7e3/9k/+2fZbJaG+vv374Nygrc653Z2dsi91QtPzzL4goiriJlC2uJKQVrhURI8gV+DIv3pT39CpJgst1gssqOAJsM7ZoOnr1/JTD6flwsEonipVAq+G+5G165d49Og/equsnNns9nr16+/8cYb29vbd+7cgXNNZv7tb3+bHmpudaVS2d7eRuzY3sDBYPC73/2uXq+D69lWU8UfHnxppQMkPmuTQ+sOZ1MU5QP2NZENbtK1sI7eq9RUw4avS7rpX84PwSo8htYQXtBvtb1clOKYLlM+aerqCgW/ut3u/fv3j4+Pi8Vio9HY39+/efPmrVu3BoPB+fl5r9djQvX7/ePjY4ZQsVis1+u5XE5cxZ2dnf/5f/6faTYvlUoAxO+///4f/vCH0WgEzEp1QXicdflwzgl1EqmKcUVFBD1T+wS73S7kfej2MIiBU+nLZqAiC4vKpJ6j9bxWMYkYjklqY+tutwv7niVIkI0FHyEpA34B0aqhL5fLfeMb3/if/qf/6bvf/a4d+dg2Hh4eMvG53lar1W63pYUCbN1sNhuNBsxTpGyhiw6Hw/v373/44YeIvcCDA84OKwHh8FjF7fJ8oiwzd5WDjZWBfml6keaylAqsRpBSMoEgmikCf63LDSPN4kGSlBHXkt8MBgP0VajPAVyWy+Xz83Oh1ZittVotm2YDL47HYzonEIsg7WR4ICenWYasxNramhBPQUVA/9yEQqGA6isTh7INqCueePTHsDFtbGywIbolRRq7rdPT06dPn4LSoqwymUyYmEwTIGx2h93d3Zs3b2az2Y8++giAGG1rqimitYoI32g0mBEyQEun09T/9EQAx1ETZsapM4aTUbkFqQ34NdY7VLVAT21cW7xEim3bhFfz82RttcZaXrlA5EuqcS9xzOg8SKUSy0XDyr8qu1b2y+JDr4MHcVpWrEi+APT0R0sw16LnXs8vY1sFyBDcdBe7kr+QRXU5YSrEkiL3Mg8jWIW+aW2xT8c2R1vEIewO1r6jwqTQEOgFjGTbds3qEQJ/akrTLzVBdBXSnWf2qbwByYDCHsEtm5QzboEeJc12ZFsw1CIynuLwKrGsEAqcvdRQj8ViLkpyNMS2Ih+3p3cUSXkOYS/BPTZGUkuQlaBh5yXGtvCu+yJjPRX47SRSuKJ4QGWnsN8lpDNfgkN5tmDWCFfTMFLy23u7vCUizWM1bDSQPP6Bt05GVhTsGNMPtu0gUtTC0ibcUjjC7uPW/c+ihKqmKN5TVTiywY7zBygUkfYLeZcxVvvpVEblknTzxII1hvmT16xgy89uqTYbqdHs5Ti2NKib40Vi6kCyOnL2GVkw1+4OkiT2aqh2Kknrz55JqEAdqS8sgQsbKF5S6pMSl12fvQ8PMWKp64TiSJqe4g57FnwvagbjbXyX7H32Ep5Tg9jKLisQZYHybBXs9X6pLr25c73lz1nnhs7Nl4Z1mgAL52ZLinHMuaxzg6UGxYsDxKt0ISBS6JUvYf62v7//7rvvgvneu3dP4g9iEP/kJz/RX+/du4crHZzl3/zmN3/5l38JIizYV+cTHlzFFUB8BRBfHV/fQzGB6ITseVKN0BarzVh9mtCpeLEkC8UqZdc5Ozv7d//u35XL5Vu3bv3VX/3V3/zN30DaDQ8a1YXE5fP5a9eubW1tTSaTzz777A9/+APo6oMHDz799NPBYLCxsYG2L4hAOp2m3RhYDTU6gV/sFqC3lUoFRhUE51QqtbOzw9UdHR199tlnnU4H9plzDponGbJzDjbZ0dHRcDhst9vNZhNhSrqEstns+vo6zexweBFmlfOVTUjUfcyHFwqFu3fvQo4uFovXrl2bzWbHx8fn5+f/4l/8i7/8y78cj8ftdns8Hu/u7u7s7MD50l47mUyePHnyv/6v/ys0MT5ciaIIfTbyk76w9YCyNFht3kJh9Eq9WKqgVoQkxE8VgQmSUMhF2qb2T8+qwgv4FA56ze/P2U9n2ZFeZGNjHWvV7QKaZ9jYFUJvLuihA/yC3o40ajKZrFQq5XI5Ho+D8iB6y+vL5TIMcUjH8r4gSS4UClDjGbez2WxnZwdeYavVArFCTUVSXMrBrO3GcDhUAK35LpHTeDwOFZHXIGrBdMAujyvir8lkstPpANvxUPR1VhqM2wKEx5mTvYh3yWlIKcKSEy39ENEYdfZNp9NCofDaa69985vfvHv3roRiBoPB4eEhzXGgaWS5EsClL0HS6olEYm1tLR6Pr62tVatV1MY7nc7p6enBwcHp6al9vhondkn0QnnrwueBCHaChI43q9LsF2rwDNdYO0+9eo+8WWzS4owInW2TlHOgRZCtl6mFCIFvDg4OdnZ2bt68ube3R+LE54C9Mkqr1Soqz6yNPKn5fI5ibzKZhP/Ok+31eqVSCey11WrR/yEYiOoayu+pVOrmzZvgsLSAKEKlzlEsFqG4Av6CsSYSiXa7zc6IIjBrXb1e12QZjUYa8KqMihy0WCz29/dzuRwVFIaWWuxZBLjJUqLQ9kdBBb1yUZIHg8FkMimXy0zhV155ZTQaffrpp+Px+He/+106ne50OqhhMEfcUn8pnU6vra0559bW1ubz+cOHDz/77DO6XtjHIc5LsFWHShRUU7xahdUU9nRIvFZ0TQQtCC+HikYkaEY+Qt9iBXNtL7A2RKmgCBO00o225qcVSSUuF/j2eEiN9gILCUUaBH3J4M1zyftKAsJVKbfnYRhJBLNQmu3Ltm4EjHlb/fJoZbZ3wQYSVmDK/sDnjMdjJrigAQHQz4QmzdOJvPO2rO49Uwt9Pk+8YXEcPuVlIvNYLLYCzPU4niEb/XIFYTspQnRYqKKtlIgA7pbdfmpBs8TwVcq/oXKFPlzxiRYK66XmfU7YbRNZgvUALI+FYDHc8HNCvW93sX8/vKsy7fSASA/StRPhEhkKK6FuWcDWzNYGqPqo0FtSEaMAd1si0g33wgxV17whLbY+B5WfL4DWYrFkKpXOZOLLT6a6CWwnhFoOh3b6RNbdGW+S65XgoRKTVZNRT0TNi86oHonHEE4r6aTbpd6+V5Z9el46bRt16xst3O+JINnzt2mIRtSqlUfXyAl7dQurExiZGQkf9+ooHuQqPz2LtCqHff4N5Xkqo5bK417QjdwLpMMc0HqcxmKx5EX/2Jc/hktcOL00o3POpYzosHNu4dzI/P9rc/zoRz/6yU9+Aln43r17f/u3f6s/iUH85ptvNpvNH/zgB1ab4kc/+hGk41/84hd37ty5QtWuAOKr4/89ALEoWmqxFIlPW5QyQAtUkR4Db4nMwhIMn4sN8v79+2jjdjqdjY2N7e1t8lubLjpjHStwAT6j7Hfp8H3w4MHx8bEgM0Af7R/04abT6XK5zJ8U8ai31C37eTudTr/fz+fzvV4Ptdbj4+MPP/xwMBhsbm5ip4ASBf9nCwQRQIYCWQCCm8lkksvlyuUyWAN/VTbCyfT7fXhqBEPxeBwmJoIDa2trNmWq1+uPHz8+Ozv7H/6H/6FYLHLCo9FobW0NNAESqGien3zyyT/+4z82Gg37WG07mGeTFVKrIu2zQuFdZYkedzg0grDPJVKDwr7YosCRcHOk//tzJmxeXmTjPJuoWAEKLz2OZHp6faYe7uyRlEWxhyYMHMwTpN+ZPnf4g0LlhsNht9vFE4kJhekieS/KJ9euXUNdZDgc1mo1Bh4lCpHg9CCsPYgV4Q1vF8NeVEQa/zc2Nmaz2cnJCfqnnImVHAX55eFaAiMT08L6Vt8c6FZKpiF3QMUM8gqxMinPQHC+du0a5OJnymKzGaRO1TDUg88L2u322dkZnwZ1OpfLbW1tUbAB8sbxDMDdG6WeLKbXkys+lB23NuUOIRhnmnktnhsZ0L/EUu+JHWv22czHrhJWkMGyJjWFbY6tlj3NaysFMxqNPvroI247mu88a3Q8IJ475yqVSqfTqdfrLL+U8ebz+fr6OsRhipE82eFwWKlU1tfXc7kc97NWq1kJbPzlxuNxPp/f3NxkxqXT6UqlwsgBuaYto1Qq9fv9s7MziMms0gIH2+02s7VUKqFArY5XDpUflISgLHznzh20hqiR6IoQ2QCcTSaTaBAjbF0qlagPkY/hgIcCeLfbHY1GMK83NjZu376dTqdv3779+PHjg4MDtCmq1arlg4PaI8aN5tJwOPz1r3/9//w//8/p6alSbnGlpS3DfPF4oBo2VqjXik7YkphdJO0W4DU+f8nj8wZwM1k0wleZd4U2WSEUZWe3C9q3V2FP4Wd+oU38VwvpfiW3dJVSavjzKuZm+E8PeogEK90Krf/I1UzxlfU+skhQiBJeThYLS8LuOVSDvhiwePF3xWIxt2QQe2xHTwDEM8vyXuwu9eWL1Fa2Bo8ehisYDoCYbxefdBU91iKeFqn0dkxnSJeswCHHNmRnh0PO4m62sOGBbvY1kV1roc9bZHXWI+bbINA7bXdReEQnEGlpa09PFNRwplglhITBuSxZ28L9HqRuowJbzrHP2gOIJ8tjOp3OZ7MvVApIJJOZdDq2XI0VFlKRlUJOyDuxQb6dhiIvh4nG5VaKXgahB2r5pKHysuX/ConmZ9I3ggS37F/x+sDYXu2cChdAVdQiB4P8tK11djiFV+mGi/l+CSAbuULaQQVKbln2cvJQM6JXw7A67Ksw4tDVOaRTvNDC65VsrQ6hHeHifYMJzJxLZjKJl6vXZgzUqyczu/izt+HMzIvjzv1niQte4HjzzTffffddkXl/+tOf/ut//a9XvdhDh51zP/vZz15//fW33357f3//rbfeCvWIr44rgPjq+K/ykFQWrayQ8hSaqLPSGQafqE9sjeqska6/fKhAAdgga7XaBx98cP369bt377722mvr6+us+GgTa+NRHRLVBaKBra2tarUKfLy7uwtk88knn/zmN78BtaFBmK58yfuCIEDd4gCe6Ha7VL97vZ46Utk2Op0OzcLqlKcnd21t7fr166hYoJIMrlcoFAgO0Ckul8tAAMKSpCwJZezs7AxgolQq6U66ZSOYlX1st9vn5+fn5+cIXJbLZTQryNjlpqWQotVqPXz4EBqdMnCFs5a5GVbC2cg9SV9PLNg62ntabDZiEBPZIzLwRhWf1QUszwqrWujFfGGsIKTVA7yeByALo5BLfKUjsTnPCCWS4xkGQxaFFzWy0+nQCbtYLPhBZF76+ASjwHxXXYHRC/gFKoQYN28ZjUalUgmDRNSB0Q6zfvcijXrEDaBk0Wmxv/MMH3iC+F8xhUHKEAHnHBQoWyVH3Rk+Smgjg4q00BYeWAeoEvFL2J2FQqFUKqEbUygUgKQhOE8mk9PTUxRamJgiKXO7uByuWoMHYos8Q7gcbvL5+XmtVkN5Wbh2qEwSSVcME3UvyXdRvjphL204Al8Op/DwF0sTFv1Ei5IzTa/KLiwVRfQ9Z8zoJFetVUgiD2dnZ5999tmtW7cQ5LWGIbSAZDIZqArn5+fgpJlMplKpiOtEWU6pHRz8arVaLpctqYoJRZ2S6otGJntTvV4vl8v5fB5efzKZLJfLd+/eZZVutVqMKPkrIkCkpL3X61HLKRaLUH3VHIBUC/Iv0O0LhQJuk8rNstlspVJBqGQ4HOL0mM1mh8Nhs9kEI97d3UVkHFe9Wq3WbrdpPkD1e2tra2dnB3Ccn3/1q1+1222UW9i8gNEFVUvdpdfrffrppx988AHTmfEAlVjsKuHjeoJC3oH11ftsYV/N6EhN3ksEEL88QuyixC5WGZFZzMjz2rIimB4j2G5P1rDO2x9DprCHVl8CvLqXlZuIpIuuwgcjdTlXbZQet1dX52Fb9gNDaz6vpmv7mj30R+TfkNQZOa68MMYC0J7BhvdXDwe38IFo43ahllqOdpNLhrGPwS1v64tixIvFIha0w4dbwyrnNxfFTr28VnE5RqzbIlyMeANKqSTpL+gvLxZs3MnlIWsK1ZMEHNtDkYmN8SIbtjzlBwuw2nqVzXe8JjmLWMlqzDJwhR5Gumvaj1LnQbjzemo2oUiLfqnwiduoGWFjcndRUNtKc7iLghWeypylIVsEVjxxK/BtB5sQUlstiF1a6ovFYsl4PJVKxU0NQL5nshrWfLFOklYLwvYliJZr4VqbQYRemt66ZOeF/IrtImOfskwaBCwKvxZcbtsuva4OqxQvcoa7aNHsTDuIbcCSZ3ikmEwkUSaEnu25XSIupDzFg9Tl42qns24+HVdS5BcLW206lvUV1l9d4GQbuZ09PwFIA1i7rb18r1gInywej8dTqXgul0h+OUwssQSCE0u+MOCvlCUSzk2dSxoNivmLocPvv//+m2++KcGH8Hj99df1yuf5wGq1+u6777711lt6149//ONQOFhqFffu3Yv85L//+79/++23nXPf+9733nvvPb1G5xMeng/e1XEFEF8dX7tDiy+poDUxZycWqmjb823sIkFGW/2WhZ3EH1H4/fDDD7vdLhk7qSyxl8IvYRNsLcBksMz4fNpmsRX6P/6P/2M2m4Edg5lyIQiz9no9Yla2B7Xb4zhPI3C1WiUiyeVyULposQceIsHmKyTdCF4AlxNdYwzlyfMptHLf2BpB3LhRYILwEwX8Cauyuz4Ad6/Xa7fbJPleE5niBvDoWq12dnamurpbqkjrnG164C6KczkjPhg26Lmgg14C/15mZdtIbVbsBS6Wt6hT0leErBaPahTZTfn85ZAwavcSVwuvW3lEF4gRR9q122BOkhqSeBMW2e12E4nE4eFhr9dDqHpjYyORSFC96Pf7rVYLHI1IC/XVXC5XrVar1SoKJ4irtNvt3d1dqMS4Hd68eZPBBq+QsgHXOxgMTk9PG40GeGipVCLB06NXQxwX0m63FRqilQwXEjSW82H64O51fn7earWAaxOJxGAwkHuYzXz4fNmVUB0B6vWkzJPJ5Pr6OmZx2DaiywEwZ92iaGU4PT398MMP19fXoQNzw8GXu91us9ns9/vMcRig9CUQVsJa5dlNJpNGo/HZZ58hF4t5nWJoWXd6KiJKaTx9YY0fj+zmpfderhipNXlJm+FzYsQWAvAk56zfiJikFAhtdsfi7KXBYtnAV9VYehZtJJNsAYgXaT56BByUdsW/LhQKVAQRWkE5msWW7aNarYIsb21tsbrigDcajc7Ozmq1Gq7W4u3i/zkYDMbj8Y0bNwCCRWiibYWiIKOXAgwyFFRoUqlUp9Nh/oJfO+d6vR5bEnsHX7q2tra+vs4JQ3/mZiLbcn5+jl4Eqsrj8XgwGCBbNB6Pb926JXmf7e3tUqnUbDYPDw8fPXrU6XSYOOvr65w/nSuVSiWTyWxubjrnuFieNXVT6PYgCLTLNBoNHp9VObRsJm+5044gxIGhaGu6kvhwhkRvoVUlvXbkfMljrgm1xHbtVuUCvQthHLYbQGer9Ue/AXOhAOY1lYfWTxZWc4F+UaRplb2xAjFDBOrymyDYQkio9RjwZCis2qYFTyNBba9CrKYli8PqxRoSNlQgXbfeTVKssg71Goe2DcXzPFCEY9uxLYBrsWkpF8Px9+pedpW2yhhEfUSPtqNIXhfiPaxqYFLF/fPwwLnFyyqKhOKhq1xMQ1vFsCoTVi8iQym7R1gfY63VQGOiEsOckBC853hBKpHNZqmCS1RKpUQiHP5qAWI7kfV01GDkqQRY/ormoO2dVxHU06UNSZcWW7TQm3ZG72U6W0GfoWWxDeBXSYFbgNg+EcvMsEsHD0i31Fqihcoe7mLvkfWZkMw0j1IYsaefo4zDE425vD3f1hu0rXiiBwqitLx4U0Cvhx8jjrNNDaxraNgR5aGQnpiG3ao87SC+nUBFbAkPlNRm4S0ItlZhDWC13moZFL5vH5yniWE/2Q5sjcxIdFi72CWCv3br8cpImoae0DP3hMnL5mjrRsJeQ/O60PXR7n1efetF10xpZHNL9ZmWxmFn2bP9fTaLL1uEXxBAcW6CzLZzmaWmRHYJCiedSy11JxLOpZ2bL6WHuayxc/MXFpqQ4MML/SkSov3FL34Bcfjg4OCHP/zhKrhWAPGqFwhT9sDrr+pUr44rgPjq+Kc5FGmRKluPEaABr1xv+1zAH+kxEV4gABRCotKGRCJxdHR0enpaq9X+5b/8l6+++ipNvugIF4vF7e1tfZ2CUbYfD4ZIJBJbW1v/6l/9K77l7OwMOWDiG3SB6S9G+RHAgoag4XBIOCtpxXa7vbGxsbOzs7Ozc+vWLcyLhFpmMhn6f8EFwDigWNLv3+12uerhcEiHb6/XazQaOPLBYl5fX9/b27t+/XqlUlksFihFKqwMeT00AsNNY3/FE49eeOB1srtarfbxxx//5je/+eyzz6DLSQoDOpv1lvFYGJYvZtvDFQMpdpTSsRUslh+CSgs2sPDSFSv75aG9l3iMuKDhN5Im80LpVtj567E+bWjoQdUW4PNENj3PeovjW0IK4wop1WQyWa/X19bW0uk0wqyFQgFqIS3tiu2q1So64NPplFmpnBZUFNIiYBCEeuccaNFsNoNyi2PbZ5999uDBAyytwLyocKDzwIkJ67E0ASTCMRBjZkGHJAMXyMsJ5/N5lW0YGNlsNpfLyRayVCqBpsnRsVKpMGdtuE/3PZaM8Kx5se4znFApz25tbfFi6ZL3ej0EIiBgkvXBnYRczCdzAtlsltpMp9N5+PDhJ598goSx9dqyc8fmG5H+ORZJ8SLyy+3XV5HcXxodXsVy8qglAshsqcktpVrlN6VL4Ge9XtxSqVpLEhcAtNFo0BKhmwka2+12+/1+rVZD0peVeTgcbm5u7u7uplIpzBVZ3Kj8MXSpOLJN0EGi1IUxSbMFAymTyfT7fRBVBjPc8PF4/Kc//Wk2m4Ffw0BvNBq8WPUw9F4g17OAMwbQmmcfZOAhOk+xBzdUpX+CJ5hcrVZrY2OjXC6T+rL7sL8welFMAuauVCrsPlDpKWn0+/2TkxNWCcY8CzUPJZ/PYwzIBEwkEuDsHn5hQRPJSnjD2Co2WOKtAAJiCTaIsH1b7DZLU/pKitw2JfbEXlzQ7SGM2GOzhlZ7FhW1O3U4SW3dxQMIxErWRuxRmSyS64K+mUsowCFtSnA/eARf51Wg7Vv4wQNlbMHeLeXFeNCUxi0eJMDI3nl7EwAQRfQTeAoaRZ1e8C6CXerQEojjPTWLEeumWe6hdVPQh7NrCM3xuHgKOCeTiVeYV+WMSY1fsZqibO9XGGY8+30sxhT6Ckd7qDYbGep4E80b8yHi7DWaeIFNGHEJOIZEbJna9tzY6EOAWLRKaswKJKxMsMInzVk7x6VgYzm/fIUnEWtFkwRxuoutae6i9oLV7VU07pl5eFVVtzQ+8RQSLOZup6QnYOJ9qRUP8RA0fTWj0eNNW7NoD+EN6Zka/wQ/Mt/2mi08JeVnJ7DUiPjCqNsrNOpu64mIaRsu7KtKfS5KRCKy+cO7G2Gflu0GC1Ua1NUnvrBd5ez2EUkftr4v7qKkiUajvUUh3TVy+utLI1F1fXgI+4blQFuVDPWXJCDmoc/eeLDb3OXkXztBQiDYMtJeKO61RG9rnG65R1o6Pie6TadxiCYvGpBknSsZsDiz/KG8/ME5l7r4c8y5tHl7egkWP8fxq1/9Co+4N998MxKr5a/PQ8utVqu//OUvQWl//OMf/+xnP7vkxS/hdwfZmfNZdZ5c0RUEdwUQXx1fXwax6roSiNDODQIopgkRtrVZgH7oNftbK1UrTbhYLGDwgbF++OGHxWKxWq2SKuzt7f3FX/wFDm+TyQQoAe4wKKdwxul02uv1crnc66+/zlrf7Xah+NXr9bOzM1E/2FTAhlCihK2Zy+W63W48Hr9x40apVNrY2CDo//M//3M5Jh0fH3e7XajHJOGDwYDcpt1uA8XS8owoZC6Xw/7o+vXrCp2RQO33+6gGA0y02+2PPvro8PCwXC5/61vf2tvbU5wBLwPasnPuzp07+CnhVheLxfb29kDZlO3cv3//P/yH//C73/3u/Pxc7kbg8sSO6pAiwhbHB5hMT1ZPUMPAaiNIv9WTGBa1IaQUiYVqWzXDlmR3UfLPI3+totJ4ar/PX152RtM2jKsiMTsbblqA2K22Hl4VquqX3PmzszNALoAeyYCA27bbbUBMft/r9WC/ArqJLAasxlQCCQL5guxASlapVIBNeazr6+vMbijw1B4orggzFeufPBnaVK/XOz4+VnOA6JBScNva2rLBulI1wCmAJzQxIDyqV0BcA0ajxhWt/SDOUr/hnCkFgbYj7S1tAWo2zjmkWpj+4MgAEMBYIBF8LOcmevXp6enjx4/Pz8/pS4jUavRYKiHvwyYJobuO9WIKc6GwGf9FY+VInognHSPHwpA+Znv0LDdHi7DAPsaDyooqF2kJEtGs1WodHBw8fPiQZY3ljnHCggZjHXyWfWGxWKAIX6/XT05ObMLDPEKEp1gsDodDSPRqQWX106hmoKL/WygU4AmycSAoIaBtNBqVy+WtrS0GkmAFapnqSoFsSF8LbpNME2qKyWSSVgAGZ6lU4lazY4LYMou5TL4xFosxsBnVk8kknU5PJhM+J5/PUwKBbp/JZHD/e/LkCUs3BUsKIcBt+Xwe4BuZ+/F4/PHHHx8dHQn011xjURLELwqkl1db00jbMsKQEEdY0vP2Q8R7cl/SOtwGsvH4M2HTizxWact4EydUHdVEtluVZfwJQ7FuRYIa9XYLf4cCo4yuSIM+2ylv9aPdRZVnW6YS5CoylxX+tjmwuuY9rERvZ6cQ0qqGEqnNMikohDBCrB6r4CQWcwIh3QqAFZmbKVefTqdIuIi7JzMowWcaabTd6Fvs0sr24TGvNdjUA64L9EiRHkAGgYCtVm6TwhGEmjHNxZ4LaY8edPtMUPhLexJ6qJ8niL+qrrBKPyT8fSShNTw8arz4lXRahG1eglCtxAQIDoWuXC5HYUw3VvumtZ30ViErMWFRMAlWeCRxTz5VwFZoU+xJpXumiKGFmqYb00QYog10dWKqNoW1ZK/I5MUVqyq+ut5VrrbetVsGg24Ou54FiD1lGGfUHmzDxDM3xctjkkD2PeSpRIrGhBSNyPL55dT7y+WJL/+lHRgaNrZ9wSufeAPVs3lYJQTkyfu6F2mLfCFyzBeuMKtSqsh7FSl6E4lrX35Wq175ooGu3UN1S1d1Xdjmzng8Hns5R4TYCng3fvE1kT+7F1YfFlH3+9//fogCSynieVDXX/ziF6DDP/jBD75QNfjg4ODg4GB/f38V4CvisL763r17vDhSlfj73/++cOQrFO4KIL46vqaH2CtE9thneSs+iR/EKOUPxHzseepBttJycBhV37aklcFg8Kc//emjjz5CG5FWlGvXrg2Hw1dffZVMGxIuJMR+v0/ajNwEXN14PL65uUlj+O3bt3GUOj09RTP06OgIucbRaNTpdIrFIonH9vY2TcS0Iefz+Y2Njb29PXCujY2N9fV1EIeTkxPsg+hPB12SDCuJlgIpJFmLxSK6k0AbrVaLM2e7sn2On3766b//9/++Wq1iSY8ksW74aDT6+OOPW63W9evXv/vd79JZfHx8jIrF1taWNrzpdPrw4cPf/e53Dx48UNAs7y9gRPuktHF6zCC9DA4IDZ56phokNknwet9kLxZKDVpSj8Jxr9/HNi97Hs2REUBk7Pg80YOXeLsoR5rQ1doiy54u3qr+RJsgReqjTSaTTqdDAQNRFFJr+tar1WqpVKLxnLyLZ9doNAaDgTgjPLVMJsOsxHSRkglFAjL8brcrkprGOTILZMIUURBdwQURJOvBgwfdbpcTQ2i1VCpxJplMZn19fXNzM51Og0k550qlUj6fh1k/Ho9FBysWi3wdlGcgY24CFRE6CWifr1arKD+MRiOkNjY3NymNyGey3W63223QAT4knU6PRiPNfZGLQXjFZeMmsPJAGebBDYfDJ0+e3L9///j4eDQaSQ3WppoWNvKkOVeJxEVaIHrD5hIXDjs3v8KcwaOG2XYBYUleDuDRjT2tOq9jVzCBepPlLPfo0aMPP/zwm9/8JpAuuA9YjHim2HVCZodUWygUjo+PHzx4wCi1dCrhts6ImzPsreg5/SUsjBI9xKG00WhAfmcnggi8vb199+7ddrutOVUsFjOZDE6hbiklTN0C4ry0ibhR8BDPzs5GoxGfjNcoSsci9SOyPBgMstnsxsYGzOXRaNRoNISb12q1g4ODfr+fzWZv3LiRTqeRM+JbHj9+3O/3AccbjQbzAnSYHYECyY0bN5LJ5NHR0Ycffnh+fk41xeaoKgR6dHhbO7SW6x7G6i2S4aooKqg2o68GIE6lMul0JpOJGzctyUSAHlqkxjZxh+0sVuxShZPPBTdjMbU3WRt0faz6u6kTCEvl8lV2De+Phy+EnDiI4VakXjxx2z0tCUj17NsiJUROew5WgpMCD9NESgLARqycEmCRBI0QWL6FmcJXyNWKU7X1YwBfOrpsqRVyAIUce/NlKWFL1BTv8/l8LpcTd8GTqGILQLbb8kPRuLAPTmdF6VFFULtIinmAswVPmSqsHVGegZgHk315gHiVWKcLpLdWYTqXbD2RbGJnmuVDq2HF/Mw7K/7gda1ZlqsUogCIaXSwJOJV2FNkjWcVmBXi2na9ssIyHuDlyZ2phOz1n1l1V9Wz2WXsiqHajHVD8ao+HmXbap17uLzHTvVM+cJruQQg1tIkhiwhk9dG4C72SNkh8YVjOkbJypD9dcLuopmzR4m1dTsv/re1aquV4QJp9ZAp7Ml/2UUjLB5YhqxnM3jJSLPUbw/rF+PeNmt6dJPIj3o58HeV88olKO0lctKEB3ZA2nFl1dsV21sx8bDwuWqZemngO6wDWYqS8H0VVp89Sv772h/vvfdes9msVqtvv/32T3/602azaf/6d3/3d/zw85///PLPEbf3xz/+8XN6yr333ns/+tGP3njjjUjysr5af/qHf/iHH/3oR/zJ+wrOH9z5CiC+Aoivjq/vQUwsmUIIFMqobWAXWYKTiq50qVhwyZ0IqkhTbUeqZJ7o/2KxhlbcaDS2t7cRWq1UKtPptNFo1Ot1oLF2u721tQUuTKM6GxLgLJyp69evn5+fJxIJxBxhYykbl+l8KpU6PT09Pj6ezWYIOILSolbJyYBw0b9M/oAaJplMp9OhzZl7BU4HxipT+EKhAAJSqVS2t7c5SZjFR0dH5+fnd+7c+eY3v6nWeyLjRCLx+9///qOPPvrrv/7r/f39RqNxdHTE9/b7ffsU4Hi2Wi3wBXBGAlMSY3ZrhSaW6UCDp6U+Ke4Rpj8YDKw5uDXpClXYPAdbL0rzUCTbV6vkMAzyLHTlgbMali8tZxnq7nmp3ap2vHAi2FgzpJrqtG0rmVsqKvb7fZiqEANh2pbLZQRYEDYREsEMtTB6KpXa3NwsFov0P5Kfy2OKmViv12u1GsN1d3cXxA10TBdLTr62tra3t5fP5ynDwFsHBUbygkZ4CI+7u7tbW1upVAo41Tm3sbFRKpWGwyHt+fKpgFCpqYGMBpk/4PJsNnv8+PHp6Wkmk9nd3YVD2uv1Tk9Pp9PpzZs38QRjTlENarfbmUwGNRiRqR89evSHP/yBRUyst1KpBJmUFGixWLAgIF7BXGi328fHxwcHB3wj09YyB0PXb69CEJYfwhqDTYRCNW0XJatt22mtxMpLhNGeaKAEgqTXJjgGeMt62gg/8gy+uPMWY1L+bzUrtd00Go1PP/20Xq/ncjlZvrCsSSkeXh5YLaBMpVIRasyYJwOPx+P0fACqqhIgNutsNpO0Je8SQIxZ6GQyOTs763Q6169fL5fLvCyXy62vr9+4cYPGEQoJeNPBLqcxv1gsUvnQtjIej9FQYlLr/1AveYgwnRnJEnRmcQDmZpp0Op21tTXuUr1ePzw8TCQS29vb5XKZzcWq1RcKBfSOWS729/dZPYTQiQR9dHT05MkTQHCAMJFMufn80pYVPw8Zl73hUpHWa0IbHCvCI5Zo2D7y5Y9UKpXN5fL5fGwZURAVOCONZaFAaIzWD9NyEsMubLnVW049SApLhHU/0xijrqy/WlpTiB56upxezswNpOANoMD6qVI9vEtqtKz5sViM9Q0wV6IfarzVwiWZLAoqYtlbCSO5NbJ45nI53gjyKxkx7gwhk3QkBCLLjkLEXqs1bwFWwfEMcr6ITiwh0Zw80LAaqjysh3WAMEbdM6F8rVRrqc1T2iScsw+IK5W3qtpZuBAWGU+5+8JzfAkMAt7xRf2BSxwIvYK3B2Wu+hLrTOW15LuLBmu2fk8YYKv4lrtnv1HbihUCtuxXBgwYMaVoIUqekNcqkTFL6tRXq8Ag3QlvQfD86LxbpA4JG/VZom4kz1Repuqp8njBYvu6i74dkcRGC6eGqHEoVawIwXMG9gBQd1G3TesbNRtVnsICnhcMaw+aRfF/L6zP2WziohSVbSV0FxsdVkXamlwqSjHrQxqKrV5YLNgborawYVXUbdFLhT2VzTwFiRAxt86H9rlLksvyhXWfpXXmSWB7TTCXcF+8ae6VDSIzmvDJXo4Ok5+qSCnfGkICdiXYHvA2mAXIzXkhrqf5cLmG9XOyj70WN08cXz+oIcYmbjGGxNceJv7pT3/6zjvvVKvVX/ziFz/4wQ+EEb/zzjtgvj//+c+tIsQbb7zxzjvvQOn98Y9/7BF4xfNddQjA/elPf/r222/rey2w+6Mf/QjA9/3339fv7927995777311ltvvvnmO++8o6/mEyAv//SnP72C4K4A4qvj684gZj2VsoEt4GuPUdZtew/BrawesVtqU8hfS0iN9eElF0XuDVwAKdVcLtdsNovF4v7+/iuvvCIXI9Ibdb6Tq2PSlcvlEH9AmXc6nRYKhZ2dHXyNiPUlG5dKpQC/4C222+1arfbo0aPxeLy5uQlns9Pp8N61tTWgZ3yTBGJy2lwU6pClUgnH+clkcnx83Gw2yRnI9kk8ms3m7u4u4B14MXFYr9er1+s00ZOTnJ6enp6eNpvNRqPx5MkTgLm1tTUsxbzdUV2rnkYbj8ZKc7iLfb42uPfMiKQxarvIPRzZFvBtNO8V2MOuNC8otBS/UMPXXZSj8joBL2dfPg867Fa0OIU8oJCD4DGg3QpXPRe05lnZYl7DaJTYApipDFuQHwVxGAwGoPY6K/Ge0HshAlbrbiaTKRQKjHwyeRl8uYs2YurkJcIDeGWeWmIafQa8wDlXr9cBsGjzL5fL5BuSzIazBrOSD6/VajTdg3QAZ4CXVatV2vOhZDrnyuUyiFW73WYqgcRJTLzf73PJKCyjJMOdsY46PAjSeKijrAOijJ2fn8POvkQq1EVpTbgVmqpKEjyRwecJfCPLGF++99Dzq7TQgM2vPG9G69JjX2mneWi3LbKG2mlF3Gu1Wt1ul9YTACk7p5gO1tgTdEmok1vKkgBPA6GqmuWcg2wojWDqIpoIovoK7x4MBo1GA4FvlRIFMqbT6UqlUqlUlPCUy2UIlcKIqcpQXFT5Dfo/B4VDZiX7F4kKWwPcZGpFKtVosxO6B9WOfZMpxs92YWQj1v3h69xS5QmAvtfrhbQybqaobaIMh5mnVwKxhYdVjCQ1WVu/yi+vQbxA9y+bzRcKhXzeLW+phf88DqA0Abys2+tVt2RhMVgtjqCnaUnTtgiB1I+sLKXYGF6y+NTep9nbiwEj7HVWtl6vh3YKYDQXJRxTqTuIlbZve138kqy+2WyyJtOfYSlXDGNWabkKU7yxLGAtBQj1ClS1yJ0nEkVHmsaSRUM89JPJwmnoGYWqFF5NQv8Uiq2B54nq6Ft41rPZTEuEtMI1zoXL8zkKbjV3bED17JO5nMXihYZ7jP8MTdVzcYiEdTR67VblyQd5AJynBeEhj1ZBRSJOqjp4et+yaNYnMwBYD60QilAzZiXDBoCYgWFHjjMK4+6itoDX9a85a3mLKgl4qJnVYQ/N1rxyrDoDROPwFHVppONaQu2IyHltGazeuXnYnCdJbE0dLX07ZEt4IavHpLbcYR6QtjkrxmLDV+szGY/HyQMvYbBms9lSsRhblpGoidrYWI9P7Zje+LTCxISRMkbThsIq90xryACOnsgPWzPrkg1ULG9J/RlambktWsCtpaf3oL22A+83Wj20Oin9UReCHaXqOvWk7cNvl666F7YpK4908IvkPkeixlDBLJuHKSZInfI20QVRH3LtlUqFzFoVmhBbD50zvQLb5RixLscrSdow0kY7PEpNotlsNplOYxepDF/b42c/+9n3v/99KMAPHjyAU/zWW2/hNddsNgXFCpANIWApQvzyl798zjSZT3733XcRL753796/+Tf/plKp2K/+wQ9+YN/7wx/+8M0336xWqz/60Y8QmqhWq2+99Rbo8Pvvv/+FTOer4wogvjr+KQ9t9tC4BIOqo1lURAGOqpESdhPMyU1Cllaqk0O0se66tg48Ho+hvsICEzR5//79p0+fsjvy4fl8fnNzE8ug4XDYbDan02mpVMrlcggWQ0BgA7527VoqlULRmN5bNv5MJgOkSzd9s9mEOPPgwYODg4Nvfetbo9Ho0aNHh4eHe3t73/rWt/L5PCECmC9t6Y1GA4xpsVhUq1Xsj65fv37nzp35fP7gwYNms5nP56Eks0vBT0TLIpPJ/Nmf/Rmql7u7u+Vymab47e3tGzduJBIJepDVrQ8lDQTBi//ImrhG2GSq8dpg2trvWBUILsGW03mCoOrCK3nokYRH1fytqbG3navmHHJSPKjU6laH6U2kXtuL9imHoIAH73raETaUCbUCIpEIG7h4GZ2HdxMKo/MglUaCdX4PkiviOcIOTD3hDoPBgLlAQgu6yj0sFov4XwHdQgQrl8tgu2JJ8JQRkUBcBWS2UCggvcJ8obFdhK/Nzc3xeHxwcHB0dAQ9+fbt26gnNxqNWq0Wj8fX19fL5TLnDB240+kcHh4Oh0Oa7mFi8vP6+jqFHNRaZWndbrdHo9GTJ0/QmRFcCARDZYtlh06ItbU13k4moBuOYjIEbdYTFGzPz88Hg8Hh4eGTJ09oxrdPSnqporSH+tcKzb3eQwvbea5ZkVF+ZOnC9o1+JRVBzwyd1Vs0FvFtddUs3bZB1aIzvJG3qL5oy4SqCyqj63Q6jUaDVbrVah0dHbFZQGakDQLWPFBpu93e3NykqPbkyZNMJgO1FoCsVquNx2M87sCtTk9PJ5PJ9evXOUlwJUnbp9PparWazWZRKWm1WtVqVeZCqiA2Gg3ta4xbObCJZjUajXK53M7OTj6fp8bQbrfn83kulxuPxyDX6+vr6+vr4Mjgcdlsttvt1mo1MdnB5sgSOWFmPVfHQiENbsBB+Du9Xo/yIXIWsHVQ2IenXKlU5vM5DQpUbp48edLr9VilqTlp4ZXSKxNT9HD1Gsv9TyPH7ibOSJEIUIgvBYJDoOoLiVHPecTj8XQqlUqn3RJf4LlbzSJLbLfJdsjft3IuVl9VcihhM7J2B2YEF6udkdXVVmVUuLXoJ7CaAA5L4VTJrdvtAhDLdEt/lRmXkmGaMyQfL5lpsSb5drqsLKwcNmVLFlZEsLCPW73qlNy4WHmHeqRd+ZpaYEJPRxRv0QtsOcEqv1s/Lq9RXfiI1+PsLurCW+a714xsyWgeo1CXL0691S0JKygLMPH5PPaCwbkYxJH04VUkYg/iidxZVtUave+yKrQCsJQmeNTjSFyVwQZALHK6Vz2S3IQkei3p3gsFbVHW9ozbPVpkT1sPCK/Omq15UgCWc2qbDywLWDNd8JwKe940ifQWs+iwggQLJtpztgCx1TKWM569Xd4jiJytVv2J9UcNPXYKhGGDDZvnQJPT6WJ1kSOVTGay2Vg8Pl/WwNzFxjs1unmWa95p28VT5+wBjlZ5w9493WRlndMA1JZ6jMzo5OVrjen0fK2Xgxf12cM+U4BUMmJv4HkPiHcpBbtEHdizwra8BLuXhVCptx5GQrG2fOKFheT+MmOg0A5tixWb0jjbCupDgr/DeskLEYdXsXk8goIn66/X2DLVM8GoxSK+LPe+cJPHl4ZgXvRDfvCDH7z77rsgrVB3Rdr94Q9/6OlORB6Xs4ZXHT//+c+bzSYY8RtvvCGUma+2dGZhyn/7t3/77rvvvvHGG/v7+yhOcLz33ns//OEPr/C3K4D46vi6A8RJc5AtQPqTRweptXBk9aIKL4Z14kw3tAAFGz8pSYDqSD6jBlsSbzFzz8/P79+/n8vlUGbIZrO3b9/e3d0l98bYfX19HTij2+3Sby4W2O7uLt9eLBZ3dna4ilarxXuJ89bW1nZ2dogA7t27d3R0hA7ywcHB/fv3U6nU3/zN36yvrzebzXq9Ts6jwnUul6tWq5SyIT7s7OyAd/T7/UajQQ8vUpJQKbl7qNfdunVrc3NTfcq0/S4WCy62Wq2Wy+VOp1MoFNbW1lqt1scff9zr9V555ZXbt297ElpghYVCAfokTB930dzZBU7NAA00Ptt+YVuLhkfDCPHCfeGntnknDIttBdj7pRdu2u3cE61zF416ItGu58GIQ1lkT1zCyxUjQxB3sU3PY9l4HWf2T57vtrgJFuvn//IMRH0VeQSogoznQqEAAxFZVVqAhTjU6/VCocAc5NPEtJUCb6PR4GLRJqZlGOmGwWBQr9dhNW5ubsKgx2IRggZBZ7lc3tzcrNfrRIoKTJm/KE7ANYbT1+12j46Onj592u/34cG1222mYTqdpjQlxyS6CgQ3iDfH52MLRvlE2QV3slQqra+vwwsWe4UZim7A2tpauVzGPazb7T59+vT3v//96enpfD4XjS4cyd4oiqwEeIx4D/+y9QyPtOsx+j2Fa3dR8y6UvX7RWqClYil5UKomiV7JKdreTzvIRbIW9GZvAqu9tgl1JaNgwCOeTqeULlhOeWrD4VDSur1eD8yUM6lWq7u7u7xebHfUh9iwwMiQN6EQsr6+DmQM7kzxY2trCzVeXp/JZG7cuJFKpVDpQYObGuRwONzc3ES3l/2FkSOacKfToavj5s2bjGRBz+gFq0jJFR0cHNTr9d3dXTjLmnRMZ8lxioNMEVEyINxYtmk07pmwkKaRiiqVSuyePMpr164lk0lmNBsQmyDfy7NQxshElt0T3+Uudu9aeFSUK0vJtHmsZorFVV0gB/8lj0Q8nqRcsVxjpZdi7eBCJMvbFDzxXw8FBjiQHosq4lbZ34I1KrSrpi5QSSR9C6qSVHtNyrYPmtmhlc1WWDkBT1WDjxVOqr4iabLLxsASBm2J18KgXC9TwMPcbTygoauOabsSWiAMcEFPR+iqJwPiln39Xi32cts0S7kVNcGetmWAeufmTOu9CkIS9NcT1xvF+xbAHVIXFdPE//OE8WF3udfpEilV/IWRko24PN1YO1lCsRTvA1mupboQnol9WNbAzaMGh3x/KyUcFvhdlMiMtzqFThieMJSdFJbna/me3nV5pQIXGLJ5Au52jVXV5BICssXTFVcoI/AEc0Og2V0UFLYguwUQQ3HeyJ65Z9HLqgicE47HY4lE/CKMq2KDvY3OdBNa0FwDQwupNz5VovNGi52PLhBlDhW3J+YQQKxOO/tcPFAyrN+4QFfarpn2aZK6yr3Qc3SMlIbwDBW97MnuEZf4Uobx4SVxrw0gF4tFNpsFFuCv3CX7OLiBTA3CIa5FkjKy5g5XM29xeE7ejzY72lysjrYHHPNA1Tw9XSxSSx2/Fzjmc/e//++u0/lSa/f5uVtaaj/nAVf3zTff/P73vw9Ke3Bw8Ktf/SqSkHvv3r2//du/5V36Jb95ieO99957//3333rrre9973sQh+/du/erX/1qlZDxvXv3/vIv//Ltt9+2r/83/+bfXEkPXwHEV8d/NQAxAQd8IlAqMhbBWKToAhCtnJy4hySBhD7sFtbOyAYTSjthAqpbjSwaokqv1zs7O0PDF4iKNR2rK5SFZRuCkRfNLKDVkMsA2jqdDijqdDrNZrOQItkzisUir+90OtAPcfihR0xqStIrdM5tbGxsbm7i8XV2dkafb7Vahd18eHiI15aYONyfTCaDEz1+zUB4tFqTfoBxEEDs7u5+5zvf2dzcvHPnzs7Ozp07d4bD4cnJyfr6Ovm/9lFQDPG7QUMUQSrJ8RqB+QQemQc2WQ6CtWi30UbYUCz9AaWIQrUUGLnAL16Zs7KsFbvwhVQk0hnsJejD1ron0vrZfrXti1yVRHnBt5e0WCM+vcYSrBi0EgwBZgXT7Ha7lN8lnIoUCRWIZDLZbDalpYADO4N2OBzitKYe4VQqVavV2u32+vo6kqmCd4GJ2+12vV7HMa9Wq0HmFW9FGXWz2YT2Xq/XZSjU6XR6vZ6M9RAjBrlotVqNRoNpi/scSsooDIjjiRIFSwcwJWsRgII0NLgVfJoIgzQHwLkWCgBVTbGpZG0bjcajR4/+9Kc//f73v2+1WhJStwGuTTw8HRVPPsIOVGvq5UwTq+fB4ow8ohf9ryJ2WfHflxOaUJHPo12EVGit7dZ7xxM2sWRh5f/gPlLjEd2YAcnDmk6nR0dHjx8/vn79OriktVu0MDpzhAYRCOCAoYwl3kipj2qE9iyUghCLyGQydOjDqdzY2BB6BTMIXLharQLRMva4FZJ/bTabZOP9fp8BLwCuVquxj+B0xy6GWARjT48Y/Jo/gXTDVnbOqWzJdtxqtdrtNjujUPXFYtFqtdLp9GAwgD7MzbRNsha7EfkRNQ9YxmjC6HFrhVf1VyPZahB7JCaNIi+B9AjFdvxY2zdPpfTLxzDPdpmLGp2XNNKGv/dS+rDIJ3MhyfgKc7RVUs/s3sZOQnOs1rBbOkRZoRUP1NAO68lQaFzZDxRMaYVf7QIiHFljwOMJhjiCmustjGulxj1qp0wC7UO33FsLNdqueUsH1m4bKfFkq7keRqBF0sNtQ2FQj6btRR16ppKY8PR2vYqgPflQdOirErh8zvU/LGS+XJgUzhS3oid9lXWehzauwp68SMyDKSM1+kMHNu8bPTUAuw9GQrch4hZ++CrCgb0VnspBJNUx0k7QwnCR+Je9hFBpd5UilreGh51z3ltW6VlF/HOxcJcSNBaLxXQ2G08myWVSoMmovUDLi4Ir639oWwFklk7xNbzJnmSH7pVaCoSte/mLrbRp6bYQudUgCm+OHQw27JfZg3JtydNbVj6yKmq3krab1QAMiT6WfSJ+tK156D7bWyEDxsid0ZMvvwQ0IF/IZrNSJkmlUoVCgeSaXYDWrna7rTUzlUqRp+/s7GxubpL+Xx73Pk9Y6w1p0dqs0IQzEovkzjhMIGFZqNdHo9GLLdHzufu3/9b923/7TwLdWMHfy9Hk8GVfBp9tNps///nPX0gd4kVff3VcAcRXx9cFIBZNjPZDcmNLLFLtVPABOY9bitKqydFLOSz7gFeKvSIbIlAtVd3l8ytZUtGNP/30008++YRYgSQN2iw7bjab3dvbS6fTxWKRVmL114gCXCgUeA34rwqGyWTy7t27W1tbs9ms3W7/xV/8xY0bN8B/5/M5yX+5XAY0397e3tvb29zcRIb16OjIOVepVBBLRT5YHllAD/l8vtVqQbfs9/s7OzvVavXk5OTg4KDT6QBtlEqljY0N9Dpyudzrr7/+6quvYjLz13/913/2Z38GSri7u2vDGgiVsO2AGBA+tlGy9U6Bx0cnqYjhVpHN9lKxiYrHIXaDlyat8uPymLNqW/Z0hG18EAlghT2tXgTzon5HHqnZhlNhruiF0TZKCwkgHm5uXVwsmz7SKNwC5TyFVquVyWRgI5bL5bW1NdA35xy2ihisidjIY5KXEUgouJhA1X6/L51iai2tVuv4+HixWNy4caNYLLZarU6nIzzi8PCw0+mAOFMXQU31/Py81WopGWZeQ1RELgOfvUePHp2cnCDyC1+Sqd3v9ykFYTsGdRdxZA1aYYUI1KAszGmzLEDSp6eeF0C9LxQKvNca49BeDX2Sq3706NHTp0/1G6Ur9tkJVbFVFsuf9Ua+R9mwTZrWT9kbAGFzrsdhDEnEL538W1k6C7LYBm1CarWlezCHEm+J5DojQG8zDQakCL9K54bD4R//+Efn3He/+1055MA6RDIFUjDS28Ph8Pj4OB6Pb21t0emPSLFoklL1RXiBLUDrTCqV2traSqfTR0dHzCMEWJiqyLMMh0M0qVGKHwwGSOaxcbAgb21tkfOgdATa22g00N1DMkXGnicnJ8hHoBEh7c7t7W0qLmRTAsSr1Sp4MZB3q9U6OzvjfqKjIsFZLj+dTudyuX6/zxNkRlN6ZJklfy6Xy71eD5GKUql0//79g4ODJ0+eSDzX2kYxwLwsHXDZAn9qs5WheTiMPZRT08ciqqsaZl+SQelczLlFgBVaK3mLCV5i7G7nmhx4VunUu4vK8p6sc2Qzb2htZFcSjwXmjMTqqrbxyxPs0Cs15DNenplbsMauAKH4plVhokgssNhaIHh2Wx4g6KIkKcULI2KRp5N17/RW2kuKuJevn96VhkxM75HZ2MAqZX2Fw3sV9BZOvRfFfC/55BAN9PQHVikjeffQI1FGGu55Y8DzjbxE3zZSUvk5w79VN/M577mnPuzBlC6KoRkp+uyVpiJXJE8EwGOMeqJnq8aDtyqGP0R+r7eMrJQlWX3TppPJeDRaGI17qzlD8KAFxK4Adh2wZWbkxdhArVlOuJh4TiFWJt6+QBWgSKl9G3rZBMGrg9rin/XfVhNJqFBsWxxk/KMgTbUNj1hg41IXNMFYKNnW86w+yapN5IUYu8DZuAcR81NcF2iAxw9qWpTMaXLa2dkZjUb5fH5tbW1VBeL5z8SqunnlGUgnXlKpIutkMul2u61WazQaTReLeaczmUy+7hZ1V8fVcQUQXx3/5TFiEnU5YosR5oz8liJ+MlJ5TAMs2t5A29lheWduKcnnuToo9BSlV25U0Co5VRhbkhdU3z2vPDk5efjwIYCsqrLoMHKeNFmwOWWz2Z2dHTx/SNHL5XK32+12uzSh12q1x48fHx8fQwrL5XK5XO78/JzmGtDt9fV19Cjn83mtVuPSNjY2jo+PO50OMLS6MheLxeHh4cnJyfXr1/P5/NnZGeAdZ4sQLVgYn6yde2NjY21tDRhLvi5u2cUDbM0NlJCF3CoUZ/BPG8SIGaoSNxdCniNLdGfEWNUG62kyhPwLC5IKfXOGhOtJskZ2NXphn83WPL7PV6VlaTMfW06P9HuJTKKekxkXxtleC636MXu9HiRExuFwOIR3b+VcIN7K6EPEcDlISJRTgBpQFMga6qWVSiUej6NEIZP6drt9enra7XblOcmUPD8/Pzs7A5+1QJL0Lgh5gZLRE5BBHKNRVYRV6oSW+WIDa7XhE6RC/Kc0Au0CrWTKUdaVezgcdrtd0HPIzpTBBDGEFYvItHBVJryKAWSBpFV9gl/o1Pw8LOPnGXU2ExMLWMmY/KkJ/dWCAJvbg5UtgdFqp3owECPQGoIvFos//elPnU7n2rVr+/v71WqVUY26Ll8N7u+cQ8nu8PAQheJcLid7KwYwQ4i6CANgfX2dTBKeC4Ph6dOnw+GwUCiMx+NarSbWPOrAiUSiVqvVajXo5LCJ+dh0Ov3qq68WCoVWqzUcDiHOaExOJhNEkHHe6HQ6rVYrHo/v7Ow444ZHngZk7Jxjo2Hs0WvJbSHXOj09PTs7W19ff+WVVxC4oB7DIs/pISPO7aWMh2I4I02Wj/1+v16vI5Txu9/97j/9p/90cnKiZ6HagxYfsYZtrs59lv+bYFZbvXCm38L274foia0gLv6zmYZbsQKxxlgilIprX/OSZ486avVnxR0WfKyFmiBKwKitiwhE0Drs7XFWdoaFV8rdk8kEolMIYXxhochicxbntU8ksus/FIt0FzXZ1SWmrnBniNtSJxNAbBcNiiUukIxU4OH1mNP4ks/nVW1ioPJArV6th9Tr08SbJlZUwcYZ4RSt7WLlWzqeiui2lmZbtTRBFELonrw0dxiTusiNILLEHrlrPE/ssaqEYEMyzQW3VDaLtH/wtj89d9syb6niYVOXhw6H0VfIJrZVzFUYn6fNGu6/XnNPZLBnEWGFoCHl1lvZvKhAQ0grT4gRezC6J5tu+3gE3Ns/eSdgx0nYBucCrbbQe8MF4nLPvktM/9UBDKmlW2Z/XqnAnoy36VhpGrf0SJTpsW0L8Nq8QqTbXdT29TIUZzjdkfi4BJQ8BbzYxZ4VZ1o93EVLcJVdraywLX3Z+N8+8XBNC5/vBTUb007kohRXXjpXCi9cdWKa/OzSzY7JWtputwlgiN+ccyTOXz5xi5zy3oOQoIdX54AG96z0HovlBoP5S2gQXx1XxxVAfHX8v/VgcRcmJbBAXaiSGFbErxodMBPbAF0zLMe2WdsaoGmjhSoFZUyYkQJuwiYKxXyFWs6V81tEm4UesmSr1cIRSJt0Npvd3d1FTZXTa7fb2N+lUqm1tTVhl+BuiFSQtJ+fn5+fn9fr9Xw+v729TYALzmVxkPl83mw22+32zs7O1tZWNpsdDodHR0dK1OXC1+l0qKkin8rWxb3CbghNWL6FxENsr5OTk+FwuLGxAUKhJ6idWIkQt5rECbCeMwdqF5Yn0Mcm827pgAGVLAR/tdcq61O84sVneA7FAAEAAElEQVSXkb17tpzrLjaRWTE1izh4ka6Xn0v89IUCnbAncVWzpFvh8bIqV/HiNg80t9JpkW5moa86DfUkZoyKbDbbbDZrtRowsVVg4DVAvfK7Y8QK7+PhAlFB+CXyHo/H9XodFExhK+IPoB7oQoDH4XCo8gPTlqEFeAfLg/JGuVxmbYFBjMaLWqppnwc+Q0nWlqZ43PLHg5ssezprQBSPxzudTq1Wc86BCcJLRYZFYLE00fCm8/T+3Iq2Sq/T8HKAJhLPDYUFvb96w8wShy2r3RpMvVyI78kFWIVxC+FZMVPGFXG/aJU8QT1Hz4CUT2Z5Fx9T5tEItQ+Hw1KphMw6E5klmqVvMplks9n19fV2u41YCkRdzg3GLnomwKDxeLxcLjPU19bWYBNz/vl8/ubNm/l8HnyQnkekWii/jUaj3/72t9jlbWxssNE0Gg28TyeTSafTOTo6glxMW6I8wVBQodPl/Px8OBzevHlzc3MTwWu5O/b7fRjrGCTCQS6VSuDjjUYDy28UkxEvfvXVV9vt9uPHj3EGR0dbRVarIct2jPQEbGIQ5Eaj0el0tre3oerDl2GScgIqAUqvifEg1WNJFTEepDGtYoALbMctQ1YFCStEYEuMXyUobIpJ0sylumarDoxkT7TRkovlVsQSir4zN0qD0+tE9lAYllnZrKkjR/CEB9FaiEoNDXqmhA2qZkWCUC4gcVsY2j4sKbFYQMGZRuxQR8LublqIiCWY6VZ0Fe4YfQAWU+AREHepEU23Tkop6l2wcAni2olEQgu4mrVpmdKW4YnPCiCW6oUiHHtP7Au48xYBtGCNJ8Wr3ysYDlnSL93xIfApFBT29GEjqbiXl88jbbUitzzdHzZTDS0miC2ZeJLQuntEwhYjpkxi1aW967JFAk8/NAzGrLliiPyq48GbJqGEhWbiJfu4RqmLkqfQebqg09+DET2TzxCm97RrQ8Vtbb621KfqVOS5Wcarp5wggQVPI8jSSlyUmDXndwnOtwj8pVcVJ+z3hq0ekRZwL82I8gKz5+Hgezxir9igF1iKSRhYqnLpFVM9nvKq6r67VFU8FFp5aTLBF1aVwlYAe2meHBm9X/Q/Sb7yP1Nh2EX5OoavuaAEFYvBULtChK6Oq+MKIL46Pl/3PWl2UhS0TeViL36iMEQgIcuXcUagU+VxZ7xQlHx64aBVc+N8CP2TySQ4tdqL4AyWy+V4PE6oSmho90VcXKbTKfK+8Xi83W4PBoPd3V1yRTrN0+k0r7wwJZJJ3HtILMGh8JQHJuM1YtdyBxB5iMViW1tbmBQVi0VOiZSeCAB4q9lsckPIVG28CMkR0zCRjpXO0eyfSCSsyoQegSjAmOlJzlhqEoD+QHjO+Le6i7QpflaGJgkRDzmyxlweZBapZuVhx5Y/5SUqYSNwZNuRWJAvFCN67aVeq6/XTe+i2ni9aImha0evLVbbdr+wF1L3yhOyFFgg4h69Wo1GQxostJBL4OzatWvS84JgiFYD8K6yMn1jr9cDyeKvEjUeDAZAwIwWivz5fJ6pB5jLD7lcjrKHmF9Q4Jk74kSgXOGWTXMcSGkDQjGJ3JJryZhkQkGjA1BQMz5wGOMcJAUWABBzt9s9Ozvr9XqcMPgFALTVTlFxS1oKtsIRRt5houKixBBDHUBnZFhdVM+pC5wSLfXbVm7CXt2XXvDFbnNGccJS8jX7JEdD24RWJIug2TXcGT1iwYjWdMjjhYHzcv+p/Fn1OoZfNpvFDkUOnMKMWMw7nU632202mwg14MCWzWYZjeB6uVzuzp07/JWlUmqDIMKgzP1+f21trVgslsvlRCLR7XY7nY5bOptTUCHDQWu7UCggey2nOGQfcrkcLo50pRSLxY2NjVarhcwFFHhOslQq5XK5TqfT6XR4oxz59vb2SqUSsi0s6fhGUr+RgorMeVTrdc5Vq1Xk+2u1GuxsNeRaNN+z3qK4qKesjRWIR1COx9ezPGILfOhbLDvP+oN9hRrE6h+GGcoyEo/HMcMRQMxtVynCBfpC7mJPMRTybrerqipnzs2RrJZti1HTBoUB6bNzt1nTLB3VZrNs0MD0fBcngOwPg9+2bQlxZkHzwA6R6yVwPF0e8l/yqkG6UQLUpCtlpXgVrvDJTChFFBJrlhWBBQ5krqVxonMQRV2la/2V3QQjB7vYeh4GdihK0Vtor0gPQgO5Urc01pPZaejP5tWnPa1kS7N1FxvkxR6cO7d4wVHt4vHYYuEMkiIEKjQi83728DgvGAvjIhcocnjoMJUScH+djMaMd0/sONSaI+6nCicaDKHWqqcY4IzGhbcLW8NMG6bqr+I2aoGymrPWJMBdKoRqZV5dlDFgyKWwNSFnpLdZgqS6toruqrVCa29onmk/QZYAkcRnF6hMWD9qT8fGC3u0stntw+KCl0XdsVg8kYgHFN1L6O0yyPVuiyBsq270PDGPna1eccVdFKi5pF3MBRRvmzV7jg7hXIhkzXt328oxRX51KNLi5R22WuOJVIRF2S+Ds9vSWig4o1IfQQ6bl2IecuHBYCApuS8sZbnn1r6wj0BmkvYrrAcg7ctxYt3/nIpAV8fVcQUQXx3/lR0s4nIWImSxoQMkGvWtiPrBzyS0xI4K9YQXW6jRLf1qBfDxpfAfSQnELxP/UQymZ2aj0ynQMMmwQi7BGc45CpWkW+TzjUZjsVh0u91KpULCP5lMkIzwLCxkkwVQS98uGsHtdluyvO12m7xrsDzoFNapas/mNexw8lXAeQxEDJAOteJMJgMUiNos10ViD4Di9bWNx2OIRaE5jI2AxfFxRujZ0n4VdbmL7W8W1RIgayvnIXPENu16VKkQR1Z9woMbPNzWS+NDH/MXHfAej9KjD6+i+4R0YC9k9IJOTzNOYZMHw+kFdn6FVsvAr0wHcdj5BEKcwWAAZJbL5dbX1yXeUiqVUO8lPdaLmbOgcmLVMX8BoBGLUP6s1YBxyIQFNHTOyRkSCMYmZszQQqGAlApniDgMp0FabpuFbXwJoCNsAhiLNvx2uy0dMVS/JTXAeAYUtofFtqxdiVYYD6O3HfS2y89j1l8CWoWprzeqL2kTDllRlzTSPj+9QgxfTSjLeVEtwV1sNbWrhMens+RQD8v2aMjeNJEsSaPRQFqa1YzTY6xiMYpXWzabLZfLjBZ19APsZrPZjY2NjY2N0WiknYjRRU6Sz+cpPCQSCQi2fDjc+UQisb+/zxCFbMvXlUql+Xzebrd5lwCRXC4H4IhWcrFYBEFm+xCcjTgA1y7CuwA4rpHhSl8Im0Umk6lWq7PZ7KOPPjo8PByNRqCc+XwevqTWZ3YH/l+tVnG3Qzc/n89TOIGzn8lkmPLSslA6qhWbjgRbQrBd9t7YtnZn4YIsSNHW3sTcjKzGffkDDBGmsJZK1UpJVlm4VO4V3dh6EPEzeC41M7VGWTCLJYVasu1B5rZ4ZC5WKhntSt9JKCeQmSS5WWdY0NBwt4IJFtgSIddTyVBxHd0SraJWHMDuaNYDyqpwiADuDPPRomDSs7JbvMd5FL4jT1SB3VKh0ZhBaDjcZGkOuGQ5tddlXWElZcsBhW00GhFlKdxVMKZ3eeai3sIlZrR46zbK0mL4eaXlRUhzMZbrqOhilS1biAmu6iv34EJ3kejqLpp9qeZHu4aK4rpYrWa2/udxZlnW0svDAsSeapnFcbyoTGGShUo93C1UjrbKs/yJVMJjEIecUHexN8LWAGwuE1n+tyJ7dlt0URZ5q5Q6PItFz1hSNSolLyGpIjLSsJ/jaQGFcbXnwuf7Qz5HEB6PxYC3vTgqLFE8u7TZDC5nbCkuH1MdaDqdJhKz6XQOe2mxcAFt3Bv89oSfAeim+CQauScfEWncx5l8vsctSz6LxcKecywWS8TjLhZLxOP+f97j5BHH48lEIr7cQexqHDnAPs/I5vO5kQxSuOW95Rk67NxC83o+XxiRYk9z4/K8yQtQ1UciBjofNF+W/6uVynw2K+TzvY2NyWSSTCTyhUIykeh2OrXz85hzsUoFakjkOdiY8/kxYm5tKpVyy4fyuQZxIkEAkM1kctlsLpuNx2JT5zKjUTzK0PLquDquAOKr479dgFh2Q8IObP4vr3ZtJ27pNQc9R8IFwnypFnoFW+taK/QHfp/8W1UFZcdSRm2tTuDXkOQUi0XlfrwFVGs6nSJ5IZ4UAo71ep2QKJvNDgYDyFnSM3VLPQ2yet5eqVRSqdTx8fHx8TGZZ6fTefLkicJi2o3BCMjwu92uGvHQB5Bh/a1bt0qlEq3EwB+cD+k6J99ut3kEMFykAbq3t8e3KP1rt9tnZ2fq5RTPWjgakZ9oPp6un8A+T9xQ4p729ZZK7FnieuVxG8F7rFhP0ktcACEOtnIeyTIOMbUX7Z/yLtMDiCPbskJhvku+PaTt2B+sqLf9qwtU//TJCinprvXEy3gj9EOQApAvjclyuUxXPu9Np9NiomUymXw+j+o36AlcS6A66JOWe07PPp9GIg0Ew8cywgGCSV2kBcE8ov1fSwq4HjknJH3wAkYs04reBTAOcZe43qdPn9brdVH8WJGEcUhxUhmsGuq9Rj/bMx7Khti02euRd0ZlxVYFPGhVf122ssUiszhv1FnepcWjn59JcQnvQ5Qr0Bamvxhh0ki1ei+sbIIUlZlz6zyTFshiYrt7pihWs5i1Wux18FzkdwqFQqlUAlbj4aKdUiwWWWOtfvTGxsbdu3evXbu2WCwePnzY7XYhGx4fH08mE5jFGsaFQuHatWvJZPLp06cMs3q9jncKCHWn0zk/Pwf4y2azo9Ho9PSUOaJCC8kPiy0GifV6HfyaMab9JZVKsSMAVlJTUesGHSqLxYKrZpAjSXxwcHB0dDQcDhFg5cX1el33M5fLWcFB8GtVVYHA4vH49vb2zs5OLBar1+vNZpPhxA4l/g53mK2w1+tp6/SKeTbnZDaJDWp9CC2mpsVcFkMit76ouegXjGrnrMKjdkOhV3YdAApkUPFEJJjL42OJE2LojHiFyidisrOE6u3OdJYo7GFNw0cR1rk+R9CzxeVZ6ygzCC8W4wlgSPOIjcCWV1VRE4JpVaRC20m+mkgMIaOw9Ud1Yrtf2z533WT1gliMki8i1OExaWsjnhH2LQ61F6YK5lODmtqeLLKvi6KqJL0Cka9FHdCnibdo20qY7+xWVm3ZTgch3RpI7qKSAI9yzim9aKxi4gGrZRyKF33+G+kdLyEtnpwnVWGRtXgsNl+hq+DdTOpeVipaUyxpvLA08u2tSCaTqWUrE8OY5yK8LALHdI59ZWGFhp3z5G5j+u+iEAqvF+gJih+PxaazmSfu7FZoByvSsmR2zW4iZBf0sz97DdGCc/FYjIeSSCSeiZwuFgsT/fJKdxFzjMdiC0MU8MIJwdyT8Xg2n8eciy/VVCIYDLpji4W7+Dl0E3josxVOsW+/YPC4WMR4ZCsMPC8c2WysWIzNZi6RmCeT82TSxePzi+kAy5Obz6fj8XQyedYhscQx484l4/F5IuFSqVgqNc1kUtnsIp1eJJOcxrNbGovNEolYMhlLJBYafjDx4/FELIav+jyZnE2nTjye2WwWj8/G41k8PkskZovFbLGYOTcNOh1F5f58m3NuMZ/PplM1TKiImGDTSaWS2Wwym02mUslUKpVOpzKZFPo2PItYLBmPp5LJhCbgMrdKxOMxbZGJBDoeny/di0WMy08kaFDgo5IWv16e5Gw5iabOzZybEuzFYinn0s7FnEu8SOr0DCtwburcOBYbJ5PTdHo2n8+XjSzPVuxMJl8opCqV7MbGaDhk6ZgvyzOnvd7k7GyUTM6y2WoqlebpBLNy5tx8OQITz53jxROJVCaTSCYT6XRiNkvOZrP5nEEym89j4/EsnR7G4/lYbBCPJ0ajqXO5eDxpuMxXx9VxBRBfHf+tHyRCCvgEWVqRUFXL1TJM+MVCn0gkaN2F1Wv5j2TCpKykDeQtlrVnw0ppWSjTgO8j1iSZEonE5xXL5dsJ7nmlMlIukyi22Wy2Wi128Xq9vr6+fu3atevXr1sIg6vAzEpwFS3qJBgA4tPpVOgbeC77WavVQoyfy0ehn67/bDa7v7+fSqVOTk7Oz89B8UCB0bjkwofDYbFY5Luy2ez5+TlayTs7O5ubm3oQQGygJzKb4h5KiViazmQpSs6FTUAAFwwkywvxkpSpekYZtgFZuJK1YrAyTx5vF8KpGMqR5iGetLEHtoZkkxdFE/SsPS7bKoWBS1DmEA4O3+s5YHjGEV6aF/7JS+w9RVrnHJ3LshCE+SsyFPQxZctMcEiFTDGgLp64GGQAwSJtQYcEh5JMsGRS1MIJpkasLOYRohbyRYSD32q1IFdKCFVPRMrj1HK4QDjCYAHdbhdd2ukyNGdUc2m2O9jjAVkaguVOek2pq/iJl7DLPSsnz1TkklA7csxYffPIKsXL6cpZ/q9lB/M0JVxg2f12EIJ2sWUwi70bqwTbetw506gOUiYgrNFo9Pv927dvx+Px4+Pj8/Nz2/QKTqRW91QqRfmh1WrBIgdXTaVSt27d+u53v1sulx89ejQYDE5PT1HgxUcxnU7XajVW9el0iqA8f0Vf+OjoKJVKPXnyhKrnfD7HL5Q1Px6PI91LdQR+McggmtoIttBnQ18IJPrxeExNUXROGPESmlfntW4OhZBOp3N2dkb1lD+xYyK1nM/nx+Mx5OV2u93v9/nedrvN8+X3rL17e3s3btxYX19/9OgRBRVQYAvgSr9eysK2lBXKxFvOqQBQj4unRNHOCzuV7G7y1QDEy1OyTnTWNkcyDuy8xCqCDm2jkvoP5MMmaJiPFbFaw4BKGOUuxTAC0VjB+BMjWbI23C7upM5WU89zeBNqadVLtfm6ix3Tio7YHSwjWAq8YiMKgAYjtrpJsn23w0CCxQLjuGQLMXtefERWVrJc/SVWJdZKCdvhISzSo2r6RLlg37R1LzGIma3WLU0WDsx61T6FioolrXurwc8iYw2E3UX1IdCZF7Kqmzs3jcXiBuiZL0HeZ/8E9KGFPxZzsdgiFgPtBVWZO8fb45q2ZpsRfDYn8IvFFrHYxDn+m8Xj01hsFo/P4vFYPD5PJKax2HixGC8Ws/k8EYu5eDyTTMYzmUQ2G89kXDrtUin+i6XTCUO0/3zPTaddKhXLZGLpdCyVijkXSyRcKrVIpRbJpPffPJGIJRILU3ecx2LzxWKeSFicfbZYzBKJWTI5F6g9n88Wi+mSE5p2bga2mE7r7olgzH8xDVF+I1720oTNxWKLeHwRi7lYbLZYxBcLN5tZ5NSqyj4bJMsb/gzqjcXizi0AucTLZhEWlG9jlVgssXwjN8ElErFE4hlavVhMY7GJc6PFYo4qSyLhkslYMqkx9/mnXWSIX5DEmUwmziVGo1g67cZjVvbPS4M2/BYvwcTerF/zWGy6Wj4ltlgU2+2N4+OkEfi2msWWLTufzZ4VxCaTmZa+eDxB5S+dTqVSmXQ6m88/W+RTqfgS+nRLrrHVL4pJqgWt5FjMLRbzxWI+m8VmM94Yn83ceBybTOKzWXI2i49GidEoNR6Pl24uMVWDlvWMmAD0ZcvIeDKZTqfxWIyThBEccy6RTGbSaSLt5NJF59mHOPeMZexciims4o2t68DGDQohzrn4YsF/n29/FEIEEC8Wc+ee6dvw//l8MZ8Djs8TiUUi4TAYfO6NOGYqsovFws1m8ckkOR6nx+P4ZJI05H02P2cETOCAd3s9Ar9ROt3b3u7v7uYqFbtieOPnWVUsFls8X7KnG7VwLrFYJJ1LLRYz1boWi/RkkhwM4p1OqtnMdzrj8XjmXLHfL0ynzszEq+PquAKIr47/pg/ie0BGSb9J4VHwn3XtUNc5Eb+6XCVpStOuVLGEwojwoiCbDySdIxcig5IEJ5nVYrEolUrYrMH64bvo/EV6FShKQnWkf0o5YIohJii5xoODg/v372ez2bW1NbV8zmazbrdbq9VgUPb7fX6/tbWVTCYRdc1ms4QxUCYxvgMCEHSl/l+YcblcrlqtXrt2LZ/P9/v9zz77DLInEC0Kg5PJBKYbWpaVSmU0Gj169CgWi+3t7d29e7dUKllgCJiYO+Y1v+u+SbuD/5PDSIBCTC7lYwCLkhyV9iI3QdKuYkhZJUTpA7qgjywkIikvtYiD2IWhjYaHQKmK8EIAcdhXq4/ytKssWhfaUIR8Op9hYVBji/F5JnXq7wvxR9svaUE9CVDaLk5wJcYbnEconExGmMJqvoYzWKlUFosFuK2sfkB4uauSngD+QD4bvj/jSu3V8l8CgGbwS7YVAEs9ws65Vqt1dnZWq9XgMgujlB+jh5KrwqH6B0CDqPTMbmd0tEV4t8i71fLTGBC47NUeQm0Hy6kMHVe8FldnPKwtUd2DUz2MOOy+tyM8/PYXPcSCdMY5SrfUVtQkYiDdCYneqPAgmAn4ksqZVSzlwcGcZWvQc2GtALK8c+cOrHOIuqwz3W63Xq9DPOd7s9ksUj+xWKxYLGLpWalUMLCiM4MfGo0G8C4UV7lsc0qcZKFQ2NraWiwWZ2dnlOuePHmSTCbX1tYAfBHLptWDdg10GxKJRKfToW5BJaPZbHY6nVwux+qNAAUbKKIrbEBoFu/s7GSz2ZOTE2jOTMZ0Ol0qldh62u02xcJyuUxXCudM4ROuYq/XE+NbFl7OuW63y9bJRrm2tvbnf/7n165d63a7Dx8+rNVqYN+qzmp5Z/pI0kQaRLaPW/VdDT9+Q+QgnygrEGkZhRZGtGDoVxDDAE9c9KRSycoCxCGd304NF4h7egqh4TS0BgmKXjw6niWoCnG2qqleK4lbISNgW7LsCXiHZX3aC/HUlr3Xh2CNRV29y/d+sN3Z0iNm3s0DguH8Yjd3uNvaHdmrnEX261yiuhPePQ/UttxMz2BKyLWnbhzReP5FovB69QtxhzOLxd50mprNYkssZr4kwT1DpvSZ83kiFovPZonFIrasej67umV7vt+zwoWDUs1mPJLEYpGeTIrjcWU4rHQ65VyumE7naSjs9SadzrzbTfR6z1yUZ7NiLJaLx4vJZDGRKCUS+ckkOxxmc7l0JqOWebBFt1jEJpNco1FstSrdbn8wSIxG0+k0EY9n4vGsc9n5PDefF53Lj8e54TC9FNGy99CWPZ5hRsDBs1lKIxzuPwjjbJZIJDKjUXY0ygyH6Wz2mfzdbJaYTudGzvbzsNCEd+6iQVzcEDxjBkT+XGMBrFn1BjNwqSzF02kgb077Wac/bFz76LV6xOMO/C6ZdKmUSyaf/XM+d9NpfDiMDQbx4TC2JN+kqMo4N5/NnG1FgsrKeF4SYJ8FXZPJvN8ft1qjVivW67EL8PVzM4qUWdiBpFs3T6cz9XrsopPNswzFucR4fPd/+9+u/1//17MhFxDAdZKasXyus2xuWeGx3mqNjcdjATbtfYunCxF3LjGfZ4NZ/Exogkdz0QTSK95/vtqY9z8bReY8I9nl8vQT0nph/EStAwvn4nb1iMWe/XKxiDmXWCzS8/nC7GL2o2KLRTzIehYXX//5W55/LyZ0XCzii0VqPs9dlKO5QMAHfV7O1tiyqYLiKyFEJp1OIfXDiy+iw3yLmOyxLzzP5WzSXUo6l1quGG5pmTifz7eWgMN8Pl84l5hMCrWaMzfn6rg6rgDiq+O/6QOqlyBChWW2lclddOewPjO8HrzPBta2q5G0Vo7SCtOty5bASkkJC32Wjpu6ojjzTCYjJxn59nLyyBMLnYGYTGYL1wOc4vz8/IMPPuh0Oq+99tr169cLhQI3pFAoSBEP9iWXKeUyrgihQ2fsWbiE4XCIhVEulwOGW19fByZQyl2v14fD4fXr19fX13u9XqfTkR4lsF0ulwOycc49efKk2+1ubW3BbuNu068qoxUCYi+tkm1RaH1OKmilA72GUNmpe3mjbS23vAmP2BtpAO0haCEHM9IrTPijZw38EhKWIa4Xugy7i8J5l7TlWo5nJHgXYgSqjlgTHov1RDJMLY/S8pHtV4u/z/ATq4WxCmLFZAd4gkgIoR4JV0YgpmFMQ8liMlT6/b58DqnQQOrU/JpMJo1Go9vtqmJ0fn7e6XR0npSLkAjg05yxH2EiX4h0l/Kd1H7USqymb7cU49ayYI3UPGUbj97rkYiVDVroVjCZVRPWI7Be2AKeQlajN65CF6AQng6hEzvw3MuqTKgbPbQStbUKzVZreqP1WfxfFT/El/TUadU4b/XltRDRNsECi1oRrFiwSGyv0VtAgBvKMP+XNoXWVUsgZexRRQDD7fV6yOxIwARSD9eOPkC5XFbvBZrFmOMxtCRYz75G243UNtPp9MbGxo0bN2CSgiOjF9HtdtEUkv4AugHik2JlhoYMO5doiUxn1nyqKevr68Vikck+GAwo7QifZd4hI8OZU8I8Pz8/PT0FPrYiCXroWi4oCqqya1tABIZKpFX7vuaIJp1XDrHWphJzEGr5JY94PE54YRX2nzHgYrHFfO5AW8xEe9YUf1EHwMopWkVOJ6sxI5oRj8dTyST0KJ6Reqrms9liSeCy7r7WrupzZMr4vM/m8+kyX2WGew5gn2N/3iYlFFJ4yjLs8e6Ji8XmS4Uu/rlYcmNdLEbn+2w6dUKHF4vZEtG2QKfWT68tY2EkzoX1LJZ9IaOlz6Sm3gXx03g8nkgkaXlOJJx1V1uO1QhmrlECtTWDzzv4oXvP5255RcBwCVMvfFYRMWgv40GU87kBDmIWA1qWbOl38UDz6XQ6mU4Xs9kiHnfGAeyLh7Rzr47H/99aLa4IwVz5BaZhgF0tAmTc7h/OysXok01PQDKZTB8f5x49ymWzALXw/kaTyXhJALdGT88kJpYlmaRpn3cXY9Ht8fjWYIAi9mQyWcznMSOz+0yPOJlMMuCX+rafI7ZLZQZd++JiNcUGbLa0KT2TZwvUMsp0y/HjLrWn88oPEXrBgiOXr/ZgUK/97vOwM+orL1Bfl5Bi3ITZbinT94xju5yGCRY0T+raIpVGo0CfU55ON8fjG+OxbRZ0gdfuM+jTXNfn9zwWS41GxVqtcVG4Y+zciXPj2Sx9cpI5OfmnZEFFEZxDmZH/8mfl/fDlj+dZX7wLn3/5/RcI+7mP9Iozn/+XuvNIakQKVgyc6/wXPJOr4+q4Aoivjq/1IQxFkK6oqTbx9qSpvHSLYFqqbbSoi66lLMWKEkBFVGstwJMYKIBQyiHllCp3EdGX1PDOmQjo5AfbPeouem03m8179+59+umn4/G4WCwWCgW+AjIapqvY0yMTrGuRfgXaqcBkgk64ajJJPrZcLtNWPxwO19bWisXibDY7ODgQ0xl3oOl0CrSXy+XAf4vF4vr6+n/8j//xs88+29/fX1tbsw2/3ORiscjngIlYhEutzc6QwuxzD11BhP5w891Fg13dQ+ByZcu2BdXTW7CZpAWjPU88gVa2M9QFXr2rAN8XCA4uall4JCwPm7PYhwssqj19iRButiID9no9OFgZlKcx5+GPFrP2qByqTzjneOJCMFXCkRBnsVgsFouwfaH3gjHBNbbqsR7fXJ8JJgtGBqAsF6Z6vd7tdgGamWLdbtfDRkPbH68WZQsAgiYlgGAfgSQ7JWUQku+8zrXQidtdFIB2F3nf4WCLtLd2S90VZ+je9vFZr85VVQS3wrMu8s68cFi8XMYRiPDa0rUaa6mUYiz4uxBeAYsSq7EVRPGmaQUA/fS0KflTLBar1Wr1el3gNaAtAC6YrBreuWmtVuvg4AD9XOwQKVSwd0ynU4i6PFx9GgIRCMFzOep7ANlh+mA0R1/ItWvXtre30+k0WkOqaCLGQlNIPB4vlUpg2bPZbHt7e29vD2xazGK+q9Vqccf4ZW/JwuOqkRKeTCaUFWX9SotMu92G78z0pJFlb28P1jzsXbYnPnZtba1SqfT7/UajUa/XqTj2+/1mszmdTvGHdEZoiEfDTJeRl9o4VMKx4vLePq4BzM4oXMabL3Yaqpj6FQDEsVgim01Xq9lyOZ1IQEeCqTdb9qWyjiSYs4lEolBIJRKLbNY5F08mx8nkdD6fI7E6mYxnM7af6WIxSSbnmQw/u1hsFoulkeNIp+PFYjqdnk2nvcVi2OvF+n1BRfNkchaLLeLxcTKZiMdpbp0mk7FCIblYuHx+kkoN4/HkslV5FovNnBtOp7P5fDSfD2KxaSq1AEKdTmNLI4VpLIZUxGyxmKZSi1xusVgscrl5JjNLpaYXq1OJTCYxmcRQUchkYtmsW6Jj0/l8OpvNRqPJdLqYzxPJZAr7vmx2kcmMk8mJc4ulqdHnbnjxeCyRiFtmMUtBPD4znUPTZHLg3HQ2Sywx+umS8jmZTLr9/mA4TKVSsUIhn83OMxkW2UU8PstkYqhABr04LhZLxGJxDJCXnf6LRGLGshCPu2QytlQSAMl9pueQTC7i8VkslljSyhaLxSweX2SzSW2LskOYzeazWSyZpHgyjMdH0+nCudl0OnBuHI9PabbIZGKZTDyVeoaBJpPTVGrg3GI6zZje+cViMZ3NppPJTPUV5+LO5Z8D4uk4N18sNmez/0+3+193amE3qcUVM+8rupOX3E9pDV/+XnNkvrrnsnBuZuDOmnP/P+f+cQUgeHVcHV/DY+jcr52bXN2Iq+MKIL66BVcHXCSbN3JAX7Xpn6eRCkiEDilIjZi/9MPK0kf9pG4pQOmpwskbxBpwSQCX9FVwRgiKyfnKGVtk6GNqd1V/K1oWnPB8Pj8/Pz85OXn11VfRpAMZR2sSjnC1WrXN79woaLm5XI6uYSzmZXQOuCbQFpnLdrsNop1IJACgG40GPul7e3tbW1sgwrJsksXKxsZGq9U6PDw8OTn51re+BfEzmUyWy+XpdFqtVvP5PKBPvV7v9/tCxKwhtQWtrD29lD3kriAqqPBEZ8zZdY3WccvyNZCutrREq6ZqRQPUkGtVHaU2YPm5Aq0kk+oMbdbrAv5CjMwD18IWXQ/Us2jghW5Egy+7wF/FXSRre828XKZ4fC5KkcOihyKgeWCfM/Q364Mnrjq0RPu9NMirUUCMYGApuQnzSuth6Ix+pR6HbdGFO08dRVMeo6ewpGTJqvqnZclJGjgEfK3vtof/Cp8V11iz3nus1m/ELelmoX6l9VK3EtvuohCEYHSvTBKRRBmpVutpHvqAeSWWrwRNY1EF2bdOpJ7ztWcXyRJtq4P8LPRQlG0hv/pk+GWwdy1ZjwfU6XTa7bZF/GezWa/XGwwG2WwWHq4UGyaTydOnTz/55JPBYFAoFHZ3d2OxWKvVWiwWe3t7nGS73YaEm81mEW2QTBDVPh4iUK8sVSXmzlAvlUo3bty4ffv2xsaGBjAVTZRY3LJJhQ/h0RQKBRjHkhsqFovD4fDs7OzTTz/t9XobGxupVOr09HQ8HuObx4ZSLBa1xWhzdM51Op1GowG4zBZTLpfL5bJz7ubNm8658/NzcHxKkhixYpgWi8UajUa73aYYwGaUSCTK5TISRpKnd0tBANsE401VT9nGCjVoHrE1aF5Ik1cLBQND1TIrkvPy49k5N59X//jHWaWSz+cT2LglEpYaGVe5ZWl0k5nPY9NphkZsOoUXi8VsFp9OU9NpfDajf38+n2em09xwyMYXTyRSS5qkCKrYE81ms/mS5ZpMJp1BzNOp1DN7+uWsp+YhgDJmzKli83lqOo1Np9klqjibz6eTyWg5MuPL6VmaTKrDYSwWS6dS6UzmWb12SQqm/fkZuzAWSySTqXRai9p0NptMJiiwzBeLRCKRzWRy+Xw2nY4nk2JZPltRzZNKJBJxcyfns9lkGS5+3nKxbOiOG7l8SLvTySQ3GBBfMZKTy/4wPu3/z96fNUly5du92I7RPcI9PObIjJwza0YBaKCH002ec8+5pEQ7NNFMD4cmk8mM90VmetPHkR70AWj3QWY0mcxIGXXJa4fi6UN0g91ooAHUgBqycoyMefDw8Jj1sDr/vcs9slBAdwPVlev3AGRFevi4fXv62muv/++96mhyWtXQ3/VXYhpVCmEC8AXDXylDjvIw/l1saKAAlDa2AeOluH3nKF+GrNvLEIDFYmHNZrPLNpxIJJKofHhp8IzFYvFEIoYEAKWW8vfAYhFB7EMkEonFopNJ7PPPv7ZJT5X6pVIVpfJvgZGNovB3fCZXLvZdXYWmUodKSdJET6n/j1L/6/dt1CXkG+ghSo0pEBNCgZioSy8PkgpEmsEbnQjE8loYiC/AfExYqPS5/7pQJS+QeCeUEvDqsjqKetlkKmIEpF59iqtU4JFq1PgEyqY4kvB2Km4+ee+VuiiBgkvz+bzT6bx48QKKsJRpwts1lkFpe6RPKKUwpRSF6SOXGfzwrEExTyaTw+EQrmE4NCGae57XarUGg0GhUNjd3UXW8HK5rFQqw+EQfjckxkLag1BSKpUQc+m6LoovQciWIvJivlOXU6FlYrKYLuXqiBl8ZXn6SGhmXEQrMoALqp9qsYLK5vTUBVGCAjZJ3U6rK6GBoQjdOxz4RJ9t+k3+zF6+aqrga7gyV1pHV65EVN1gnfFLrTZwN0nWoQpFK15llBZtURdudINqIMtCZoWjlDwuJYrwYDJ7Qntjx+0vk5GxcsmdkP0U479etl7yKHUtKVCEUD8KsS6KsKsnP8opkmna0qh0Q33gSKVSVsAzrldXXxnjEHD46vWa9KscLp/4ikEIafO65BFu8OE1hANbgmmS33A4UF36Rq/yUOvp2GiWMpgkYwPhClHSS0hxsICbGx2pennSwHw+73a7qKkIcy5iFkajEczpCJdADkMikUin08Vicblc5vN5x3HgukWMQ6fTQXE2KdWIhwVWgmkcGIaUHGRJg0WchVIKfW+xWITsm81mMdtjOBxCZcbYGPZW9krasB66mkgkMJiHg+r1eqZpWpaF2w0aN1I1RFeFhC0F+rAh9PBQgReLBcYRs9ksVq60iosoXgepCxoc5qbMZrNWq4UwGT2SXi/dJuXI8OwLDMDogfV6soHk7AdmSEAnlZyBoMy36lnz7d7l5kpF5vP1f/fv1L//978PdrycaP97EVm7tZRSseXSeDn8SK2cwq/riaJ+Bqz9L0eXBhbQhWn1cjD9Vc+bcFjtygTbcBDNq1JuX96Q7uwOPOhftTNX7+3y6u2qlzOmAi1hxdpevl7hT8LL6wusOAmvbGSRgHB8ubbly61C35MVecfa1PvI1WdPLZdR319+3YzyqVL/Uan/esUMaELeWGZKuZq4tlDKVcrleSGEEArE5M8OkfDg+5Op6LqSqAsluocOSo0Ue5DXTkwKFo0SdkXYabEA0nuhjeK3qE0kaqborXhPlrJUeOOVz5HMIOXFYQHD/ouMpSukYgHDJ5LA++DBg36/f/v27Q8++ODu3bvdbrfVap2dndVqNSwzGAza7bZkQUynUxQpwjx6lGRFGTrDMIrFYjqdbjabiG2F8os6eC9evPj0008hx//N3/xNu90+PDzEITiOk0qlJP9RKdXv909PTyuVynvvvWdZluu69Xq9Uqkopbrd7sOHDxuNBpQ+BAVgurHjOBDmZGK+KFwwk+ohwqLgSywGrrWYwvQ3yUCZZj0TUIyH8gYYSGDQzZ56yQv1snlTprHrte9E1QpXrlOXM+VfU9sNpBivXObll76IntGp/yqcZRy4rXTfsdw1evky3TMbcBBLVKisQVRRkUF1cV9/2Q74x3VROyC+y8AM/IN6/UBZRoo36g1DT5wI5PPqRyHlE3UZS4XiRyS6V29CAYlW9kEPFP59qqCWJqHLVUrzpcoVCdiExbapXp47vzI5JGDiDlx3XXQOuMVXFjXS3fHhFqi0KOSAdvztunpsPZlMIrdXZgnoXTd6RT1tAKcOPSe6Pjmr6LR1oVBShqSFTy7DDWU2AIRmacaHh4cnJyf7+/vr6+udTuf58+cwzEr87mKxGA6H0FvX1tb+1b/6VwjR7vV6GNUbDoe9Xu/zzz9H/U8oy8Ph8Pz8HIEqcOlWq1XTNJHYUKvV+v2+67qRSARGY9yM6XR6bW0tnU4PBoPz83NUwIvH4+PxuNFodLtdHD5kX6n9iJFFPMVk+shgMBgMBgiUyGazyAFXSqXT6dlsVqvVJpPJ9vZ2JpPBOKvjOKh3OhqNEMySTCZLpVKv1zMMw7ZtaMfxeLzZbH7xxRcIACmXyxCpE4lELpfDhACkHheLxRs3bpRKpWfPnn388cdfffWVnE89ExwPRCRR6BbglXURA+Hs8gjQGyqe+NKq9XAbPaQYg09/yJ8urlIvlGorZbju0qUQQf48RLT2Kx1qC6U8pTyeKUIIIYRQICbfC5KKoL/v4RVX3vxN04RfNSwli4yI10IYlPDmiQRDzDNFBgIsUVBAMOlVF33EeSSaGsIcxdGMbUmorshnMGRhjnwmk8Ecaqlch52E4QtbkZdkyBmLxaLdbiPbYXd3F+4w1PmRdMtYLFYqlXBmxCIHbQXv55PJxHVdzALe2trCPvd6vW63m81m5ZyMRqNGo9Hv9w3D2NnZQZDFyckJZknn83mZsCyhH8PhsFqtJpPJs7MzpFIkk0kIFsfHx3IqREfrdrsQbnAIkH5w2vVSdVCFJLtDTNCiSOr5EvIJ1HysRwQmpZnB9fnmge+uDHvVBUHdwqmLZbofWRcKRel4fTdluG5e+OewR1iXYkV/XCkTB3TYgDio7+3K2OXwRvVRHPVyHvRKoVC0UX3TAb+nNH69E5BUE7noMv1cLpNYlXH19ZMgkwYCdfMCpzdctFAajN4eAnENukyM/dHTNgNnXo5FP3ZZf6AhSdnJ8Gz3cGvUT6DSnJW6aXplBndAl185aBFoaXrLF1U9sOZvpxHr7URG13S7KDoEfbBH6ouqy7gJXGi9u8BphCIsJwd9tV7RUfRoGQis1+uNRmN3dzedThcKhZOTE3GeTqdTpCXIwpFIZGtrq1AooA/E3sKKO5vNOp0OPpQKnzLuWCqVbt68iZD3brc7Ho/T6bRt2xsbG/l8fjKZdDqdwWDg+75t247j5HI5iSpOJpPZbDaZTK6traHhSSKzyOJ4BGDNeBLhNI5GIzwFBoOBZVmQgHO5HPLiMeppGAbyNHzfT6VS6XQ6kUigcqlSCrHg6XTacRxcgm632+12E4lEoVDAFbFtOxqNdjodZOLj6VAqlXZ2dmaz2YsXL05PT3u9nlwFyWuSypa6pxiXHo85cTHjuou4L32vetlxL39CIAlabqtABoucsW8/2qHUkVL/d6X+X/Rakj8fFkq1lerxRBBCCCGEAjF5Mwn7FiHyQpxF7oTMwIWaIFohfvY8D2m5yFvAe7W4TaUYNF6qYUjEazxWrsu1WKeEh4pyDesuzFbD4VDeReHt0vVEsa9C0RbHMY5CJthCGTEuazQj6qHZbCLDFxOTl8tlt9tVSmE+r2VZkD9Q3R7rH41GhmHgrX48Hp+fn08mk52dnR/96EfpdPqXv/yl7/v37t0zTbPdbne7XWiyKBEGgSAej/u+//Dhw1gsVigUpPAdznA2m83n81BMPv/8c6XUzZs3q9XqeDw+Ozt78eJFqVQyDAM7AykBVZUkTFZdZt1KRjM0aKlBBz0dL/96oDDUcHmf16fw66ZRSQ0W77acXtHiA7GqumNUvIpi89TVN9Gn9IwCXcWAhCEhua/DSuNnuDadbjTWZd+VJa3DCmM4YFdPatYTeEU1Dku6cNjhBOpKekC4DLiSdePnVaJ8YI657nSWqBAZA9BlUP3S6PLl/OUS7WHjYeC062dV7tnwxOffv1drww+BsIVARSN93wLGdl1s1ZNPAj1hwDu5svS87qPUtWAJwQgXOdT98url9Gr9/IQd5eEyid9aVhO5Fu1NVH49jFjSOYbDoV5WDpKfpProNm3dBy0WUX0oUeRUqQuHTc9ms3a7fX5+3u/3MRtjNBql02mkJWDYzzCMWCyGAnRYFXIkILlCV83lcoVCod/v93o9DOz5vl8qlSqViuu6mGsC+zC6O8/zGo1GJpPZ3NxcLBb9fh9RxYj0MU0TpUT1+nuo2YgBQs/z2u02bMJIw8BDAddlMBg0Gg3oxcvlEsfV7/cRGZxOpzc3NyuVCjzF0+m02Wyapolj9H0fZ8yyrG632+v1otGoZVkodir1IXFOcJYwpOr7/mAwQE7FfD5HGNFsNoP+joFedPJIq0CNu2UoAQDRENKH4DJhfFEf55CAcnWZJQXdWb2csq1Hz4tVH1sxDGNlrMHr4yn1SKmv+Dcc+fP6k1upOc8CIYQQQigQkzdcJtarOekVqKRqmRSZEcVQZvfrhcJ0rUSkn4BsBDUTdWykLJ5eEwnKgsx8x+aQ7QvXlcgZWDmkTJk3rS4jkvEumkwmIU9jWqs+0xmaxXK5dF3X8zyYmqUmG9IhsP5yuRyJRC4uLnCAEFXxso21JZPJ0WiEY8lkMmtra/gE0RNY+Xg8huwrBZSy2SyyI7BjkOBhYYaCUCwWUftrOByiEtH6+vp4PG61WvV6vVAopFIp3/cRailKH+pQiewooa6BCEiJcpaTvFLmwwFK0aGAQKZCRlql+bvDhdoCs49FcZNoET14QRfs9CxsvfLeN1WHAxquuiIBWb3sZQ6rnLoCIkehJ2sHUm5lPXqK68oyTWEVW4JcxMEtscWBIwpUult5fsIpt7pGrKvAiFjRpUl8op+igFtWJpXr2n34PASimfWfV2qgYdE5cDi6Oqw3D90IHzh2PQpzRXjoFedWBHQZfdHlM91aq5+icOhHOCTkqkp0uoare7S/qTqs+3kRp6u3Ij1nQ5qczPmQgR90myhSJx5kPZZEemY0ABks1AdaJN0eyqbneaKQOo6D5Fy9Q8CqfN+v1+uSg4Ego+VyCc8v9gdxQEqpcrmM2ApYcbEtrBB9O3pjpZTrukgNwtSZTqezWCxs20YvPZlMGo0GLMl4bHmed3Z2NhqNxuMxQpBt287lcrlcDoHIFxcXOKhKpZLP55FNjyURQ4EJIgid6PV6o9FIhir1Oo0YQcRTDLEbeMAhNwOPM0jGMAKjABo6f5zPVqvV6XTm8zlGSQNP/EAYC66LHiUf8JJjr2QZ/XYLRHgHbgG9SQQqc/6BQhu1NkIIIYQQQigQkz8OehQs3sMxRxgvgSJqyPu87g7TC0DBtIvXRdELdJccJFQ4yNTL1Y3wNqu/TIrAJGnCSGbEG7IIxKK16S+rIkBIjSyZ9azLVUpLaxUvLURYkcYwQxmGXEghKJrkum6/389kMpgni3jleDyezWZN0xwMBkdHRxcXF9A+njx5UigUDMNwHMd13clkUqlU1tfX8f7farVwejOZjNQBQwon1AqYlLPZbC6XG4/HOBZcJogv+JVuxNaFJHHyylmFCC4jAVK5SHQ9vbCYzCUXsT7grBQvsJ6Zq3s5V/pqVyqSel6t/oPuwVxZw22lxvoKmSycF6xCXmARy3RFIyByKc2dLZqXCkXH6qGfukinS+R6roI0YBVKpNV11cDyKysOBbQYPa5BChhKm5EzIKM1AQ+10qInAnZmWZvcWQFTsJ6qLFZ00ZIkIyXQeAJ9lHo5xld3N6uQWVu6Jj0JIXC6RHyUkQY9fCMwRBHoN2SLYseW/Qz4i+W8ha3oV7XDcKlG9YeFS4TbGHpI3cuvLocG8VuxxOp2b+lP0GFiikYymZQZCXLLy2FKPIUMNshMFDwyPM/r9Xoy3IjudDQaoc1I2BG+UqvV9EHBwWCwtraWz+f1BG3o2lg/Rg2RBT8ajWSIC3bg4XCIny3LyuVy8M+6ruu6LtTbZDIZi8WOj48xHKguw21OT0/H4zGeC5g00+/3Ee+DqArsA+bEIEQY6c+5XA7TTdRlSDduHMlbwCwc1EdF6/J933VduIZHo1Gz2UToBCajSCoRjgg9EuKeUAOw2WxCm8YInzxVJVxIyjnqtxsOUw+mV1r0sLqs8qfL/YGyjXr/jDagW5LVZSUA/g1GCCGEEEIIBWLyRiBSlFgUA2+JYiBVSmHOu7huYSaSd2apYg/dQTQOibCENgR9AZEUUFd1R6QkjSIGAdsSPRQv8PLWCl8w3o1jsRjeqy3LMgwD4in2BJsQI5vEaIpGA9F5NBrV6/Vut5vP5zOZDIImcE48z6vVaolEAnkaWKdt2yiL1Ol0IpGIZVkIpjg9PcWrb6FQmEwm5+fnnueVy+WbN29mMpnJZLK3t7e5uQkF/OLiwnVd3/eLxaIEKOO0Q/5wXffg4MBxnJs3b6K0Ec4A1IFoNLq+vv7BBx9gz5FxIaXeRH0TcX86nUKJSKVSor1KlISeL6EugyNEO9YFUH0Wv9LyYXVlUNdAxUwasBPq+u/K+f6i2Yn6Foh90EcCXl8p+0ME5W+qyr1io6/ebV2i/dbbDXwYTslQVzh2X3NvV373D49BWHkevnb51wyVVpdDI6/fMMKe7kD2yOtc0PApumqLrz6Bf4j1Uh9IQIaPnoCBmzfQY0vwtO42FVlcviX3u7q0G2NgCcomcorQh4uuigvx5MkTwzAODg4ktxe15lBMz3Vdx3FEBpVUekwlqVQqd+/eLRQKzWZTNlosFjGdotFouK47GAww2gfjMKKH0ul0JBLp9XroulOpVDabXS6XEkaM8J+joyMcl23bCJHHIXQ6HRlBXC6XhmF0Oh3TNLPZLPTQdDqN6CFMItna2sIXLctCBw5PsdSFg3dYXU6VQMoEDhlJzSg9F4vFhsMhKsvF4/HNzU3TNM/Pz0U0x3MQfbLv+81ms16v9/t9SQhBLQGsSkoOQo7HRZEBFcRA4WmLn2UMUnYVj3tpJ7rdW4qR6oMEskUZfeTfYIQQQgghhLwJUCAmv08eDMgWepUh/ArvvZIGC0spXuNhyxIbKeRd8QeJHxNzhKVwEF5WoeTCXIYUY3wCEUGmtcrsWnwL28IP2Ja61IthUMIrNBQKpRQMbig6jzXDTaYrO7PZrNvttlotmLxg+MIueZ53fn4OWxb0FMzwtSxLKdXr9eA+9jwPvi1Uq0MqBWxlyKw8ODhAPSIRXkejUafTQcSzOM7Upduu0+kcHR1Np9Pd3V0kS9RqNeRd/vjHP15bWxuPx/l8fmtrq9/vdzqd58+f/+IXv+j3+4GcDbyl6+4tvKhDLNBjZLGAiMt69TBJboUvL5BDqpc+0z2zMhk8PM1chUIqwqJeWNPUU2UlqPpbCGR6yb7ALunqoa7T6Qq15C3I6Q1UV9OtuOrSWSlyuZ4RrEIZHTKdXzzycvfJ6Q1bpwNl2dTLvmz1crquHLWY9wOWVT05YWU0hz5IEKi8J5EmGDqSXkUsh4HAZf1y6Dm86nLsQWkVCwNF//RzqIu2Spvtrs91UJc+WfWyNzlwgHLqAnEQeniOHt2rLidhqFWl5+QUhQMi9PsrnL8cPgmBlX8j5V1vM3pQuLqMFRYzqaSL4Ft6GIU0YykUKSNSchTiJZeGKvVC9YgYVD979OhRq9VqNBp7e3s45xj9SqfTkHdN07QsazgcDodD/Ar12VDdrlQqdTqder3ueV4qlSqVSujYYVnFoU2n0263i4AIpRQS7dFKJZBBEoei0Wi32x2NRicnJ7AYo0wo8H2/1+vhc8/z0BPato2ZJbPZrFQq2baNx5lSCuKsbseWACWcVeTRn5+fz+fzXC7nOI5hGJlMBv0wnhT9fv/s7KxUKm1ubiqlhsOhfBcPNYn7mEwmSEYKZCtLtjjOCS4c+n+4xWFVhootA36B3GGZG4S2gSlBgShwGSeQ/YeUL8N4VznoCSGEEEIIIRSIyfcsEOvan9KyCGFWlWhaUV1d14WmjMWSySQcQ9Cw5I0RPiZ4fkXawJuq6IaS54CMY3iU8Mqt1yYSdUzEBRiXICXD9yS2YklFkFWZpgmBGG5Zx3ESiUSr1Wq1Wjg6EaMxKxmVfzCnOJPJQBKF6BCNRlERTrKJU6lUKpUaDoeohpTL5ZQW7ID6RVCop9Op4ziFQmE6nbZarfF4bBhGu91GRiRe40ulUqFQwPs/Jl+fnZ3Bzoz3bdiTP/jgg/fee89xnAcPHqCcfTqdRo27R48ewaEmiOcLZ0Dc3zhXIsbJBHCI4DgJ0JEDAwmwUaMOnswrF20okBIrBQnDmQnq5ShMfYaynjV8lZpwVfzx1w6HhFXFgEIazpQI77YIYbripluwwxm7MkM/vPJwwTRRkPWhFzHa6+68cGy06LMrc5YDKnlgbrhuGr3qzIf1TV1F1WchBETwQOxyoBzcyop2Ijnp8QiyFX3CQUAJla/IseinSw9GD+ei6MeoZ1nI+ETgNAaugh4GEo5GCYi8+vT8lYkWalWu9Lfr7fUBA+iJehlJ/FP6B4mICSRr61qhNDMZO9TLkUlTDJw00W1xVjFClslkMpmMlGjDRBDf9z3Pw64ul8vhcOj7PuIgoNXCZtvv94fDIXTYeDyO3hW1QPUymEh7UErZtp3NZqfTKTptEf0xKBiJRLBdpMYjmwiDkXgqIQFDHyGQ+RnIAo7H41CQIf6ORiM83SQiCU80fB1WZexzPB6HNIxHIfzCsC0j9QL7sFgs4COWAVdUl8WDFfkVk8kEVmiZZyOzNzAAqScCyyiRPgagR73r9zi+KD2SlCuQoReow3hgydQiGZDQU2UoExNCCCGEEEKBmLxBAnGgCrnuIdWLYgWmVOtZqOIYhTdKjzTVJ59KZKeIlXpGbUBdwos9VEtd10A+r/iIYcXS5UvMPpb5yDBJwZkrs1zxdXk9xm4kk0nDMGDs8n0f0oBeIwi+MMijsGgNBgOpcY/AB8zJxfs8ZvVCasd0Y2gE+mqhJojIBTMX3M1YIJ1OD4fDer1eKpXi8bjnecfHx/fu3UOQcbPZ7PV6eCdH+btKpRKJRDqdDg5QdEz18rx13ZoqE8YlyUFiJfVkVT29VC9DJIpPwBSstDAKXX27KkBAxGJ9zQErqy4+qpcdna/f4AOqRNjdGbaOBvRo/YTocbcrs4DDpmmlRScHFGq1qv6bXCy1yu+sq73qZY9qwNu7cnMqlMKsV8MLi+N6wmxAAg4InfongRO7sujfSrlZWle4tYRV3cAOh69dWEzX7cAqVD1P2rlI//qJDaQMh9t2OPJiZVTFyn3W21KgGuEfgl5DLFBhbGVTkfEJdFkrL5wu1stwlAjK4jlFt4xBRN2dCjFxMpm02+35fF4oFIrFYjQa9TxvsVig53QcJx6Pj8fjwWCAkPdYLOa6LiIdUqlUPp8fDAZ4AGUyGdM0ERCkhylL4jYecBi0gy6sP/sg487nc9u2LctCLgSK1+H5ZRjGcDiczWbpdDqdTuMBBPcx5NrZbIbUY8uyEPWAgnjRaBQDb+l0Wk4vknywxclk4rqu+O6RaDwYDGKx2N7eHnZmb28Pmng0Gu31euPxuNvtyhMcperm83mv1+t2u/1+X+865OaVh2mgogA+QUIxGp5cej1RRK4g1Gd5RuvdmnRf4SqFv/sD9BtGAxFCCCGEEEIoEJM/IXhBjUajqOGuxzXIW5+ECUC1FM8vXghFBsV3RfGUNAZd3k2n09Ai9QpmeLuGHIwXXZiCsUV1OVtfTLumabqu63me2KxM09TTD7FLEkMBL7BkJiARAlYvvMHiWKAgy8EmEgl529e1J7ze53K52WxWr9fhL0skEqVSyTCMbrfruq66dM4iCrPX60Wj0VwuZ5omXsvz+TzWXCqVyuUylI50Oj2ZTHq9HsTlZDKZyWTW19fhBctmsziK8/Pz8/PzTCaTzWZ3d3f/4R/+odPp2LZdLBar1eqtW7dKpdKzZ8+gg+sFwcLyKwRr3SooFe3gENRrr4lUB/lALGDiIJM161ZlRHwE7J968cNAsrDuaQ2oriKjy17pYcevLxCH5WkxSK4UMvSbJXAC5dyqy4J1gTUHjkgyW8Jaqv4tFfLhqsvcCTlL+g6oUBQGdkYPKBCVU/9Zvwd11TWgAOoW2oDAqqdOh3XDQE5FuB5gWDeXVaG1S9atyEwBiVOPOxdRUnfvrjS2S2MInAQ9XSQs3OvJHnpiux5uLirbVedBv0xhdTjsEdYl8j9wbr6ej6Eu7b1S/y1wLPqtJzXNpGScHL4cNXpO/CyXTHoYiX1HJyOZQnjooCBno9FALO/GxkYsFsPwWyKRgGXYcRysdjgcnp6eTqfTXC5XKBTy+Xy5XEZVz9PTU9M0Dw4OYrFYo9FotVrL5TKdTiPMBzXxxuMxBuFgOkaCcC6XwwKTyQSOXaUUdl7moDQajVgsJuXmPM/DwCF6eDwF8ECEbxebQ0JRt9uVMH2ESCilMPFF5qwopYbDIXzEiUtc1221Wpubm3/5l385nU7r9TpODoqgzmazwWDQbDaVUpJZnMlkkOB/cnKCeGI8y2TMVb9z0ftJTL884KCSSzyIuMXlQovzXRonBimxJIJK0GXJ0EJgeAmKOf8GI4QQQgghhAIxeYM0Yl3ckZgFxPUqpUTVklwCvO1LtTrLspBHoQenSkDheDzGfFskP4r4K1HC6jLWQBxYqGgkL6J43Y1EIrZtx2IxvHgnEgl5vYcrDc4pJB7KWzFe9SEQyOsubMh4OYdTDJ4sTHbGgRcKBXiEkUQBFWA6nVqWtbGxsb6+3mg0ut2uFO6DyjwajZbLpWmaSDSeTCbVahWhlrryCDkgGo2WSqW9vb1arYYUSKwQr+iO4yB6AnsIhQLpExcXF4lEIpfLZbPZ+Xz+q1/9CjnFf/3Xf72/v7+1tSUl/mBk09UfKLaSvwx5CBqKTEaWufki2SeTSXn5F/EdFxHXUbKAdUO6ruiJzRCLSeqFvm+6BxbfEmef1M4Sbx3Ulm8qmQWSdsPCsYR1yud6tq/SYhn03OFAWoKsSndKBiryBdy1SvPYRkKol0MY9BwAPfpZlEf5JCC7y1ZwjwTkYAkO1nNIAspswMusQrZf/dQFlglo2YFTIZqpPoFdd7BieEBWghwYKY0lJ0SuqT6nXt/zV1iMVwZrBMy/uh85HBMRGGYI1HYLGK51QTxckFDPXdGv8reT1WQcSDpzmSki0cPSeMRsK5HoclfiBsch67HaupgIK65pmpCAcXWQnIA8H+TqWJaFaRmSmmIYBoIdSqUSZkIMBoNer4egHn18BYHCKCUqUzGQTVQoFCKRyMnJCcY+sW+YIOJ5Xr/f9zwPhe8wzocxRUm0mEwmGKsbDAbI88VzDQIoToIYh3u9HtaJjHs8j6LRKB4HsnLJUDJN07ZtyNnz+Rw6NcY4kW48nU5TqVQmk4HWjGdcNpu9e/fuYDB4+vTpJ598gtJ/5XK5Wq16ntdoNHAOMTaZzWa3trY6nc6LFy/a7TZ2CU9YxHSIbVmys+WmgyotNxrGtEQpRgvBeZaWj7YhfmFpz/r0IwlowsXSY6/5BxghhBBCCCEUiMmbgh4sqDvsdNudlBgSH65etVxqwUlYpC4jSiCv6CnyT5HDZDcgK+OVErYmcSJLQSS42PCeqUtvUuBejK6BSkoyW1YEJkjV2FskSyDeAfIHphJDjoSoild3wzBEJIJADB0cBwi3Hd7AsUKIzhAU9FBdbDGZTBaLRcgKODqcTFmzaZqpVEophdnWmOyslOp2u47j5PP5W7duDYfDYrE4Ho9brdZkMpnP547jmKY5nU4vLi76/T7WpqtREjkaqLGm5zaIVqhPsQ9kI3ztS344snalABeYsR6wr4YjBQJ219ds51cJfyvF4quEtpXL6NbLq5Zf+StdudbF9KvicV9RpiyQpRCIuw1U/AvYpaWeW+CI9DTesAM3fJUDSnQgsUE/rnBQhl7RTvJtwxL5ylyOQOhzeP26ABqQklcuv/Iww/nUgbYUbo0rfcErRwgCa9av/h/utdSTrPW9RW8cMKfr4SGiIKM30E+yPkEBIqCebIsFMFcDAjQmggQSinGt8fV8Po8AX+jIiI/AQB0EUBkwS6fTGC8USyzcwYvFotVqxeNxZEFMJhOkMUCQnc1mcO9iTyTp3nVddNoSPYTKeHgklUoliQCSEqwSl4GUYQxA4lsQhbGeVCplmmav18NvMUrqOI5Syvd9XYfF+qG6mqaJKSOj0QhHCrEYqrGMAOHhgiuCSqd4diBtGWos9kRSngLjECIcS3FCmS2kz0GRcVxJltATJPRQERlU0IeyAmE7gfEVQgghhBBCCAVi8kaowxBDZXK01KsR9VMkA7zs6cWyMIkYRi0pcY6vS0ABXlkh90Dz1XUukYRESha3oBQCkjQD7CSWhxlN3E8yixk7hvdeUWOhKeOFGVOJxREmiZPQFFzXRf0fKAjIvkC9o+FwWCgULMtaLpfdbheF7yBJIGjS931R0OC6he94OBzevXsXyRjQeZGP2ev1Xrx4MZvNNjY2xuMxXvVxnlEiCZoyTkg2m10ul41Go9frnZ2d1Wq1SCTiOM5777139+5dSAC1Wu3TTz/FxOpUKrW2tpZKpcrl8unpKbx4o9EISoHEMePiwkktjlcZFRBlHAtICoecc92DpkvP6tLqGAgZUJe5lgFBTZfwRNwM5FOrS6ehugyS/kbhEioUthuQQcMKdSBQQq0Knw0I37qcLfusVtW7C0RCB6RPPRdCdysrLZogrAsHYpH1z3XxWs/KWBn7q6c6yPJhSXRlqq++acku0M/JyhzbsECMzkdka3Gwiq6k+5HDyc6Ba6cHTEsFy0DBQN2IrZ+rsBItcasBPTpQzi4QkBLY1YCcLSr8yisSlq2/BXLsK9emK8gq5JvGacd0DT0cXPLNAz259DB4EKiX6/7JQwcDcpjukEgk9vf3h8MhZpykUinYkOfzebvdxsIIdsDAGHrpwWCQTCZHo9FgMOh2u5CkU6nUcrl0HKfX6yH/AUOPSCtGV48Vqss5MaKNQvnNZDLItUin09lsFrZZyMFSvA4+Yhxgu93u9/s4TAzIQbHNZDLdblf6Qxy4VJaDjDudTtvt9mKxQFwyIi+2trZyuZzneZVKxTTNVqvV7/f1QbvBYOB5Hhy+km6sLsu0StQJjk5cwOLexQVCexNnNNasu56VlsSNZy6ul/Qh8gfDyiQZ/W8AcXPjJOOhzL/BCCGEEEIIoUBM3iCBWJdU5PUyUJ0cKjBe82C2EnVgMpnIG6auIumpxCLKSMqwvpjMUYXdTPIE1GXKra7m4B0b64RRV7c/QwgwDAMChK5RYjHInZCG8cYrFeexQrEuYmFokZgUnMlkEPsgKrBoqShGD8twJpNBgjDsabFYrFAo+L5fq9Vms9nu7u7m5iYyNw8PDx3H2draQvok0h4Wi4XneVJeKaCTSmyluPPW19chiFiW9fz5816vB9kFJwehE9jWs2fP9MRhyBxYJxQERIKqy/xNiYwUTRbiQiAXVZqNXtFId4uHnae6fKCLGkoL8w1YLHU5Eg3vW7T2gEdeVwDDWm3ALxmQcfW6TIGsW/VyGb2AyqYLi+FI3ICYGP6KXkQunPMb0LjxXT1aV9+ECJq63S9wKgLp1bqGG1AGA1EbogaG9fSwZKxezg4OZHeExe6wuhr+MBzNETjJK+3nepvXz/ZVmm/gxF6lvepfDAxR6A175UkO242/hVishzIHTPr6aIGMu+iGU8m/RnSPvgOSKS/HiDiawMWSU6TnfaODlXkhsVisWCxOp9Nutyv9J3oeWc9oNELXhO663+8PBgP4ajudDvITxuNxOp0uFAoSYTwcDqFpRqNRx3FSqdRsNru4uGg0GtFoVNKEEN0AiTafz2ezWSyMzh8V5waDgboMu4AOjjwlxOtPp1NMQLEsCwn4WAxWZTxfhsMhTM2YPlKtVjHKCBczxiMLhQI26jiObduz2azT6UCAFsvzYDBARn86ncbC8Xh8Op0ihmg6nQ4GA9/38QjTS8mpyxgZedjJvB/9lsfn0huHE+316UEyWChNRW9yWIkMEOpTVfg3GCGEEEIIIRSIyZsiEOtzQsXaA0lIEoHh+lSaMVYkBpQSgtULuoAYimXiKv6Leb56mXsRHGFZEtVPqtvLVmR6L+RpdVnPSo8rxVcgVoptUyJ0EfiAl3b9BVWq7uDndDptWRbSLdvtNjTfi4sL2NZ83z8/P3ddN5/P5/N5x3HwXo1CSZ7nPX78+MWLF0iNKBQKqPaTy+VisZjruk+fPoXfbX19Hd43hE52u93BYDAej4vFYi6X63Q6ruuiBhEmSs9ms7Ozs36/7zjOvXv3ut0udGfTNB89evQP//APsVjs7t27P/3pT//1v/7Xnud9/PHHX3zxxenpabfbfe+99374wx++88471Wq13++fnZ2J3o05y3BJ6y/w6tJNJo5d8abhMklChQwA4FtYTNKoJc8U51xUNpx58Zjrn6PVQWUWYUiXFfR2q+tN30IpFnkuoBLqxt6wcKxCjtSVCq/eyAPSpC7XhnVwpSX2hmN8V0YoiF6stIJygehkXbsMyLgSGhuoDYg14/aXXkLuLLlwuuNbj3EIFNBbGeAQDs3QxUrdEaxCFQ7D8qsKxWiEBxjQYrH/gT0JJ2AE4rPD+Sr4EPdCoHmE83MCh6wfguh3+hoCacXhpvtNgZcTd5YMuenaN0y16DCTySSOC7MHxAgs6eToz5PJJIaskLGrt0AJj8Y+Yz0ywCPqM1zJ6KIHg0G9Xvd9P5vNIskH80gymUwmk2k2m1999RVKw2UymXQ63ev1Op0OBFacczxi0FONRiPDMIrFYjqdRlW34XA4m82y2SzqvD18+BCrWi6X9Xo9m82i6Nx4PJYDQYb+crlEogVChy8uLmazWbFYtCwLufMii8P5DjXZ8zzf96PRKEKE0OUiBANxGaVS6fbt25lMBpHHOGm5XC6fz2P2CTIroF/DGR2NRofDIYqv4rRjW/gVcupd10V1O6wzoPjLycc1xUNTYi6kH5ZwJzzB0RvrhWoxxURGB0Uphjytx9CHB5wknIp/gxFCCCGEEEKBmLwpBCaeB6bJy+uiPiEdCoLYSEUFkwp1uuYiijMyH/U6aaIrQWGULYrXOCClBTx3UlpHDz2ABjSdTvHGrrvPAsW75Gco0SJSy0RpsSfjPd+yrOl0CukW7/npdNo0zclkgshIZEcg9RLzhZPJJOZE+76P38JTJqcUb/swvuHMZDIZzE2GsiBHDb04l8vhHKKIXzKZ7HQ6p6en7XZ7MBjkcrmf/exnWCAajT5//nw0Gh0fH5dKpe3t7Vwut76+DqEE4jJOpm5aFKs1DH0iiokEhksDWUEKUoUroalVM47lQgRSAsSbJuuRwFA9XUGfqx5wqb+mZBbQJQOfr0yNUKFSZmHtOKBUrgzJDS/5av06sMLwgYRjB0TckcXCeRcq5HsNRxuvzP14ddcRCCUIRB6HT/vKm1pXdcOL6bMTwpbklVdQD7EJHPhKuXZlKrEKJQsHhgoCqSOvGHj42rEK/ZbR7/0/UBcOHI6YQ+VDvT/Ujw4dowwjBXT/gHVdPwMQSfUORDeWBs6VaZpSBQ4DjVLNDEI26sthABLrQTU5iar3PA97DlEbI0zYcxzjaDRCxwujLrKAkOQei8U8z4NmikcGhFfM58AcDgnEx1gm0oTn8zlC4dENWpaF/CJ0U3q3mUgkUqkUtFSlVCKRGI/HCMSIRCKtVgvzP5SW+CT1WjHkBgleP6voHuUeR3K9DMq6rgthXeo06jMe9GEeSPz4lgy46gMk8sTHKYXyGy6zKXcoROFABnp4nGNlP0wIIYQQQgihQEy+T3VYd/RI2Rld9hXfrpSPw+v6YrEYjUapVEoK4Ii0KhZR0T2xWj0aQiQJOH/FdIZXX9GDRDqEFCjvn/JCqxtLpcSQCGSSjKy/9wbeV8VONZlMWq2W53mIv1wul57nDYdDKeyOCc5SZUj2AQnC0Jrxvg2pAucNYsRsNnMcp1Ao5PP5WCwmsst4PO73+zhFEDs8z4MADREWO4kojE6nA90ESzqOU61WI5HIixcvRqPRL37xixs3blQqlVKp9OGHH1arVYROPH/+fDgcZrPZ9fX1RqOBkGJdAtZzV3VnqNQhlDMmRYfwRVFM9HJ2uik7YAuVEk/qcl6zbpYUSUWvjyQycUA+082qr9nUV9YxWxlJHA7MFZ1ar70W0Dj0oAlxTOvo8QVXVcwLfK7XeQvHHweCYgN7pZcgW6l961EGYVE7MPCjG3jDonl4GEC/WPp9Gg5q0CM7VMjMq592nGFRG8OlC8MpqAG3b6A9vELPDTTdsDqvXnaFv1pJD+vRgSAOFarvJ11Z4LffGoyBSRSMlMGUkTZIopi4AM1RYnOl2aNPgFwoF0K6ZT23Gm1PpnToebV4CuATCahFUMO9e/cQARSPxyHUQqJFr4hhLWigaJ/YW9hdcRRQYyGtLhYLxK9PJhPbtg3DGI/Hks9QqVQMw2g2m0qpQqGQzWalW9NPPj6ExGyaJlKJRTRPp9PY+cFgIKcUXRxOC8zReK4hQUIyl1zXPTk5gYMYI4J4sOKUYuuIM5aYCLlGkv4MazZ2GycccfOS4IwrpV6uRYnnC2RlPR9Z77plbgGkeQju+kMTxyuXG0HSsrwYxiX7WJ/fQHWYEEIIIYQQCsTkzRKIddNQIF9VadnEqNKDsFq8VeIVES/JuvCBt2u9iI2uOcpUVl34kKxJ+VDXrCUbdzqdGoah+9GwcskZ0PUL6I94a9WlGRh7lTaFH2IutO/BYICKRplMBkbd8XicTCbxLaQ9ijiCU4HFTk9PI5EIsoNRQwn+snQ67Xleu912Xff27dsHBwemacKejJnLyWQSZrRYLIaszH6/D/8XTGeQg3EqOp3OdDrNZrO5XG48HkMx397etm273W6Px+Nf/epX0C+y2ezu7m4mk6lWq/hWv9+PRCLvvvsuPNGPHj1CWqXu3Q4odJLsLOZB9XK8gD6PWI+O1TUpJIGGcyexBl3/FfkPvm9dcQ7sgIgUUjLrNVu7rmyG4xcCWqd6ObJAF1jDFlRdDg6bTFeKvyvL3IUV7bBsqkKeWV3zDfv9Vzp8VwrTgcps6jLyW74lIwQBu3FAIJbCkoGxKPWyr1k/wMBsdD2eQr6yMrc3UF1QD88NZ3eEK2QGhgpW6sWBcYLAVZBZ/PqpCNc2DI9DKC2aI3ACV9rGw03oG3X1utwsFzcej08mEz2qRQ5KEuElgF6PDRHRH6ZdfQ6HSOpSi0w/1ciIF7FYVt7v91+8ePHTn/7UsqxardZut7FC1Pk0DGM4HCJfwrZt27Y3NzcPDw8vLi6UUhsbG4jiwRMH3bVo04ZhpNNpJEIopZDt47ouaru1222cB2igsVgsk8mkUikIuIlEwrbtSCSC3hIdNeaUYFYHnguxWAzRQIF4ffR+sVhsNBrFYrFcLofHRzablRp3g8EAj1fTNDHRRHKT0PkjVh4VR0XqbbVaX331leu6kUgEOcVSpnU8Ho9GI/imkYCM0U0ZysX69dRpXZvW49f157iUsJMFZChXv/H1CUYy0Udahdif/5DGTAghhBBCCKFATP74AnGg4pa4vSB9yhsj4hekCrnv+yLPyWu/pEPoYp+ucOElFinGMoMVr8FiPdazIHRlLeA+xj9N04QpDPXoxXKrv7JCwRS/FV7XofyKcxkvwMlk0rKsVCqFOvKQd5HqAJUE0ZwQgj3PG4/HyHMYDAa1Wm00GvV6vWQyef/+/Z2dHQlGSCQSSK5MJBL5fB6bhgluMpk4jpPJZOCMGw6HkB7g1RKZG4ay+Xzu+/5gMCgWi9VqdbFYIJg4lUpZlpXJZLDaRqPRbDZt215bW9vc3ISU7Hne06dPf/WrX0G/LhaLqIDU6/VgNxOrta5X4ipIWLDIdvhZZIJA0q6uuEm4qq6ZykEF3LjidNNFYRGbdHFQSie9vjocUN+umvisG3XVFbOkA9Or5b964b6rthLQamXTkgOuXvbZheXdcPCx7FIg7iNQzk69HCghOxZwiOtyp8hJ6uXyU2qVAXZlhT31ciG7wIXQT6m0onCkgwpVnAu0n0CUcEAO1iOVdSlZrQqAXpm5oV/EgJAa+K7eXFdmkgTcxHqtPD3jJTDYoO9wQKp+TSTbB6E3hmGI7RTdu37744pDUpS5I/pYjlxTSIQyF0GyGmRuinxdP0w9Ox5dN3RD3/ffe++9nZ0d13Xr9Tpss1A8UUr04OCgVCph9C6dTvu+3+l00PtlMhkZeoxEIlB41aU3GRqxYRjoLdPpNMTcXq/X7/cxJwbHZZqm4zhw6WJXx+PxxcVFvV5PJBK5XA5Rv3gELJdL1LLzPA/JQkixl1kpqG6XTCa73S6Kiw6Hw2azaZrm5uamUuri4sJ1XYjCkuOBcny9Xs/3/fl83m63Ly4uCoXCnTt31tbWkLZxeHh4cnLSbrcxymhZlij7o9Go3+93u91er4enmLqcn4HzLH24qNgSkYxzKAnyWGAymUgvAS1bBgkCFQ7FOg1jsj5wot9oaBX8A4wQQgghhBAKxOQNQiS/QCyAfAj5AG+qUFHxCiqZwrpiAvsnXshlDjLetCURAi5geXtUSsGKi6m4Mqtdn7sNp6pUEBJTMyxX2B+lVV2HbQ2ShIgR2BnRy2azGeojycGm0+l8Po8pw6ZpmqZp2zbeY1G2CMXrsKvywh+JRFzX7Xa79Xrd87wbN26899579+7dq9frtVptOBxini/80fP53HVdWJihxaNKkiyAM6yUQhIxLooEL2C68WKxsCwLnjUUL4JyHY1Gy+XyeDw+PDw8OjqazWabm5u2ba+vr+NU/PKXv3z8+LFlWXfv3r1161axWDw5OXn69ClmN0spKtEOlOaO1E1kurSnV5zTfaZ6w9DnFOvT5/XkYkxYlvWIQq2rGHq4pyhQ33Q4RA9tCBhgV4YIrzR16uKgKB0r/cjhr6wMQwi4UwNG7LAZNnBWw4qknh6jf4IzoIu5Afk+rM8GUsV1UVjuKfWyxTWgrurK71WHr162P+txt+rl1At9H8LquX6lpHOTmIuAqq4fl0Tr6EMaK6XYgKNZF9b1s6FeDtDQFfzwIIF+WsIT8PWG8e36eelGULoNAnFggCHgIpdidBI4jpCEwPCMXkRUL+snRyT17rDAdDpFrTP05/q4I5y2kHEl8Vb6z0wmc/fu3VKphGJxrutKQjG6ZSmJKbk3GDvE1BN8nkgkYJVF00Xlt1QqpZTCb/GggbEanbDrusfHx/V6PZ1Oj0aj2WyGORmSwLNYLJACjyKoIpfjB1ieUQev2+1C+cX8EpxGTBBB3BAcwejePc9zXRfr7PV6eFAiOGg+n3uet7a21u/3EXAk7Sow9Uf3+eIZMZlMIPim02mZ7oPri5FamTAkcU8yvCpSsjR1tAd5jsuzXr+jMTIh68GwAf/0IoQQQgghhAIxebPQrZp4X8WbtlhE8W4vXiHR7PRAQ11w0avb615IFcqUCJQXk7fKSAhI1Xj/h2aB93xZCYRUvHbqVjgJnZDtQuyAzC3Bi+I1ljVIwTrsqnipRL/GYlCrlVLQKSKRyMbGRqlUgvQsr+VQKGazmSRpxuPxSqXS7XYhbaDskpx8FG7CSlAKbzweo/BdNpvF3Gd8ESXsIdlgbrVpmoVCAa/9rusi8hKb29raOj4+HgwG7XZ7e3t7e3sbbrhGo6GHJOjGXlGswnEBAbEvkBQRtg3qil5AkA3ov1cVSQtE0367Bh+QWQOidliDCyiJAeNbwBoc3k9dkXzFPl8VQLHS1hoWoAP7HNBVr6rOp17OFQlcpnCRN/VytIX8rBeTDNiHX3FcYSN2IE04oM6vTI1YadPW80zCRflWNomVKSL6cIi6uqZWWMoPu9pFRH51AwiUCb1qmOFbt3z0GOhLMRlC4gVEQNcfBHo+j97/y35iVehhdE+3dEqik+qxQuiT9TQSZAdnMhl0pOgGkSY8Go0Gg0E0Gi0UCtVqdblcdrtdzL1AnyYBQTgoPH2wrdFoJFEVmBqyXC6RCDEajZCnXygUEomE53l4rOBhB4UaWiqcwvg6+vNMJqO7xeGzht4tzxfk0eM8wL+cTCZRa05OVzKZzOfzGFK1LEu2Ho1GM5mMZVmYerJYLIrFomEYvu+7rtvr9SKRiGEY77zzTiwWOzw8xCBlNBpFbT1kYpTLZTyw5MqKoVvq4GEcF8nUuuCLDBA83eTySYSIrFYuPT4RE3Sg9CK+jtMijyr8ecA/wAghhBBCCKFATN4UdVjiCMXqi7c4TDXFy54EDUsgA17t4BhCbqNUNIKzGFXXZI6wOK2wlUQigZdtmbuKxaBH6LsHSxde+GGhldQCaAeYeizaLur5iLAr02l1qQKqq0iB8vYLXbjf7y+Xy0ajMRgMZM/FRwyvLk7UcrmExQyv67lcLpPJvP/++47jjMfjdruNmnJwTJum2e12v/rqK+gLhmHs7e2NRiO8OaMAHSogiYkYDi/UVsKS+Xy+WCxOp9OzszNIIVB28DaezWYhEziOA7Hg4uICK4xGo7lc7sMPP/Q87+joaDKZ1Ov1999/f2tr6/Dw8MWLF1AWMBgQngWPFiJePykUpmtbIjHoAq6enBCe6R/4rm5elhBkXVUUZ6LMX/5GxY5WynZfK8BdJfldJTRfpR1/rbwY1jpXJkKEA23DK9Rji8Oq6+sc3UojcFh0DqjYAWFoZR5FeOtqVd22lVc2UFgyELWx8hDC8r0K5R2/IqXk1erw114LfTHdPhyo0fctmu63UIcxlyKTyeBWwiAZTMHoeGUsDfedjMmhR1VaPU/ZZ3S8EkkcCB7RpwvoD5RA7A+Ua8QsIE1CfLipVMp13X6/DxHWNM2Tk5Pnz58XCoVKpVIulweDge/7UHtN07QsCwq4aKndbhcdu23buVwOc188z0OuDkTSaDTq+z4SgV3XVZeuc6Qu9Hq92WyG/OLhcAjHMX47m80whwOe5XB2P6aeiDkdA4HT6XQ4HA4GAwjiWAy9PR6pvu9ns9nNzc1MJgP9N5fLxWKxZrP5+eefI0Hozp07u7u7vu+fn59DR1aXc3GgJmezWSQISe1W6T9xZaEL43LLsxUXEV29lDRUL08KkbxjPOVl6ok8heUhgjMcjUaRzl8oFGzbVpf+dPqICSGEEEIIoUBM3hTm8znmzOJtWeqn400Vr3B60DDiIGVWKd4npVAP7EiIQUAdNnkFlUhi1FWDjilFbLAMXtSlIBu0Y0wfxpsk3kvxBov0yfF4DHFBRAp5V8e35D1WCvVgeaRkQhxRl6bj8Xj8i1/8otlsWpbV7XYvLi7w0ovUYJjUMplMPp9fLBaI7sX+IOQ3nU47jtPpdH71q1+5rnt4eNhqtZCPiVfoL774wvO8SqXyzjvv5HK56XR6fn7u+/7FxUWtVoOabFmWYRidTsf3fYRXwnqGeGJcncFg4HkeahOl02nIN6Zp5vN5ycFMJBLT6fT09LTZbBaLRZjpms1mpVKJx+Onp6effPLJ6elpNpvFBcUKdXVDrGcSGQlXtX41IQGgDUjNQFGjwhKYnnkdCKPQ5TMpfhUQ4OSfMv9dvWwYfx1EJVGhym/qCouu2KXDycLq5Rzbq7S8sCtWaaG98mEgsSGQtxuI913pnJXf6qEHusSp+4XVZTJ4eM91c/fKr0MS0k+RpDAHkjoCpzosnQdkdF1qDIcF4/PAQIJeUCtgCVfaMENY8NX/iSOSkYlA2q8etC1z6pU2dKG3pXB7kEyVV1jCwx9epct/o3ER6eqbzSay42VehZ5SLZMz1Ms5G5JKr9eK1C+EaMpYDGOE2Kj0BugisC1JipdUa3GzxmKxfr//0UcfwfmLo+73+71eb7FYPH78+NNPP63X661Wq1gsbmxsNJtNFOeUPh9eXQy5oeYn5l7gt7ZtY3IGHgQIeRgMBnig4DmCA8cYHoImzs/PkWUBIRVCtqQ3oFSdhJkgFl9EWKlxCqF5OByOx+PxeGxZFtLt5/N5r9ebTqcIC8YgGdKNisXiZDKp1WrIlxBnbq/Xcxxnb2/Ptu2Li4unT58iLVra7ePHj+PxeKfTwRXXe85AuHCgxQb6RkmcUNowoe5K1m9DCaTSOw1xDSPFaDQaIRB5Pp+3Wi2o54QQQgghhBAKxOT7BybTQGqEHgAaEA31tFm9hB08aDDqQm/S1aWw+hawCqqXcyd0kUI3OKuXzZi6nTkQUSpmYZFCMHsXEqcEList1hNHhIheiV/ESz4kb+ybREmIQAnhGP61jz/+OJPJzGYz+OAmk4nUtVNKua47Go0syyoUCvAIj8djsdfhbRnqCSQPqVkUmHIOtxeUbhyXvIpDkYe5WGmWZ0mihG2w2+02m02lFMIuXdeF+hwOZg3LuCrkIZULfVU6RNiGGdYH1ar6XeHCd3pT1JvB1zZ1sXsHtrVSsgyz0um5MrtAN4eubPZhfVmtqkW28oxdVQAtsHuBAN/wkuHbcKVGHBYiV1648LUL5PAGTuxVRxeWbl+xn4GBh/AowjeKInm1W/kqRf6qdquucM1f1cyu+qd+0XW+RRIxBOJOpxOQ2gP5GCuF+5X3YzhUJKDL6wFEunyvQqMUuvr54MEDyb6QUQf8gO4OTmRJMdJHQSSgXDywel+hRwPBTA0DrDyw9AMRpVv6Dbmn5AB1jTUw2SIQwivflSPSI91lPyX/QV1WclNKoX6g9MAYuMWQp4zCBoYW8HTDwisvnD5oobQUdb0lhK+yXCNdR1ZajLX+4A5/Syl1dnYmYwaIoubfYIQQQgghhFAgJm8EeIt+tRy2UgpZ+ZWrlJeVa3iFaPhqbegP4WvnvENAWbknalVWqf46HYlETk9PV0ajBhY7PDy8Sl1SIS1y5ST3lScnLE1eJeqJ1NvpdNS3MiS+UbzOzgfKvhHydjf48Ff0Mn3fbluv7o1f3WO/Zn8uqe7hrYv9+RVPpa99WoUfba8YE/rWZ/sVG/3aJV/xzBIVGM7lq/YNuvBrXhF16Tv+Qy76t3tSs0MmhBBCCCHkDYECMbnyJS2sRf4hL3tfu4nAJ99i62/Iq+lKtZ28yU2dEN4Cf8Svv3qZP3ANryi3+Jrrf/2Hyx+xu3j9Vb3mY/QbDen9sc45e1dCCCGEEELeVlg/mhBCCCGEEEIIIYQQQq4pFIgJIYQQQgghhBBCCCHkmkKBmBBCCCGEEEIIIYQQQq4pFIgJIYQQQgghhBBCCCHkmkKBmBBCCCGEEEIIIYQQQq4pFIgJIYQQQgghhBBCCCHkmkKBmBBCCCGEEEIIIYQQQq4pFIgJIYQQQgghhBBCCCHkmkKBmBBCCCGEEEIIIYQQQq4pFIgJIYQQQgghhBBCCCHkmkKBmBBCCCGEEEIIIYQQQq4pFIgJIYQQQgghhBBCCCHkmkKBmBBCCCGEEEIIIYQQQq4pFIgJIYQQQgghhBBCCCHkmkKBmBBCCCGEEEIIIYQQQq4pFIgJIYQQQgghhBBCCCHkmkKBmBBCCCGEEEIIIYQQQq4pFIgJIYQQQgghhBBCCCHkmkKBmBBCCCGEEEIIIYQQQq4pFIgJIYQQQgghhBBCCCHkmkKBmBBCCCGEEEIIIYQQQq4pFIgJIYQQQgghhBBCCCHkmkKBmBBCCCGEEEIIIYQQQq4pFIgJIYQQQgghhBBCCCHkmkKBmBBCCCGEEEIIIYQQQq4pFIgJIYQQQgghhBBCCCHkmkKBmBBCCCGEEEIIIYQQQq4pFIgJIYQQQgghhBBCCCHkmkKBmBBCCCGEEEIIIYQQQq4pFIgJIYQQQgghhBBCCCHkmkKBmBBCCCGEEEIIIYQQQq4pFIgJIYQQQgghhBBCCCHkmkKBmBBCCCGEEEIIIYQQQq4pFIgJIYQQQgghhBBCCCHkmkKBmBBCCCGEEEIIIYQQQq4pFIgJIYQQQgghhBBCCCHkmkKBmBBCCCGEEEIIIYQQQq4pFIgJIYQQQgghhBBCCCHkmkKBmBBCCCGEEEIIIYQQQq4pFIgJIYQQQgghhBBCCCHkmkKBmBBCCCGEEEIIIYQQQq4pFIgJIYQQQgghhBBCCCHkmkKBmBBCCCGEEEIIIYQQQq4pFIgJIYQQQgghhBBCCCHkmkKBmBBCCCGEEEIIIYQQQq4pFIgJIYQQQgghhBBCCCHkmkKBmBBCCCGEEEIIIYQQQq4pFIgJIYQQQgghhBBCCCHkmkKBmBBCCCGEEEIIIYQQQq4pFIgJIYQQQgghhBBCCCHkmkKBmBBCCCGEEEIIIYQQQq4pFIgJIYQQQgghhBBCCCHkmkKBmBBCCCGEEEIIIYQQQq4pFIgJIYQQQgghhBBCCCHkmkKBmBBCCCGEEEIIIYQQQq4pFIgJIYQQQgghhBBCCCHkmkKBmBBCCCGEEEIIIYQQQq4pFIgJIYQQQgghhBBCCCHkmkKBmBBCCCGEEEIIIYQQQq4pFIgJIYQQQgghhBBCCCHkmkKBmBBCCCGEEEIIIYQQQq4pFIgJIYQQQgghhBBCCCHkmkKBmBBCCCGEEEIIIYQQQq4pFIgJIYQQQgghhBBCCCHkmkKBmBBCCCGEEEIIIYQQQq4pFIgJIYQQQgghhBBCCCHkmkKBmBBCCCGEEEIIIYQQQq4pFIgJIYQQQgghhBBCCCHkmkKBmBBCCCGEEEIIIYQQQq4pFIgJIYQQQgghhBBCCCHkmkKBmBBCCCGEEEIIIYQQQq4pFIgJIYQQQgghhBBCCCHkmkKBmBBCCCGEEEIIIYQQQq4pFIgJIYQQQgghhBBCCCHkmkKBmBBCCCGEEEIIIYQQQq4pFIgJIYQQQgghhBBCCCHkmkKBmBBCCCGEEEIIIYQQQq4pFIgJIYQQQgghhBBCCCHkmkKBmBBCCCGEEEIIIYQQQq4pFIgJIYQQQgghhBBCCCHkmkKBmBBCCCGEEEIIIYQQQq4pFIgJIYQQQgghhBBCCCHkmkKBmBBCCCGEEEIIIYQQQq4pFIgJIYQQQgghhBBCCCHkmhLnKSCEEEIIUUpFIpHwh8vl8qpfvQ74OiGEEEIIIYS8sdBBTAghhBDyewn41Vrw1/72W0vJhBBCCCGEEPK9QAcxIYQQQohSqzRisQ/rsm9YAg7YhAML0ERMCCGEEEIIeZOhQEwIIYQQopSm5ELhXRkuAbF4sVgEPnzFagNyMyGEEEIIIYS8UVAgJoQQQt5CKEq+/ikK/1MswwHJWH6ORqNXnVj981c7i3l1CCGEEEIIIW8CFIgJIYSQt5DlchmJRKg/fu0pWvkrSMBYJnwOdWdxOE1Cltd/DovRvDSEEEIIIYSQNwQKxIQQQsjbCSXI1zxFYhYOZBB/rYyrZxPLSkQXDniQVUhZ5gUihBBCCCGEvAlQICaEEELItWClX/gqIzCChl+t4eK38Bq/5ua+dgGqxoQQQgghhJDvGArEhBBC/oSETZRXLaZn5urL67+SBRR1NPING+HKtqQ3p0CrE0PxyiJ1egvUrce6gzh8C0SjUYQXr8wmFn8xts4WTgghhBBCCPluiPIUEEII+XPka+2ZhKhVped08PlVQcOvLkO3ssbd8mUCC0SjUfmvvkts3oQQQgghhJDvETqICSGE/EHoKlv4w8DPVy0TXqHuppS01pW+y5UrJ+QV7SrwCT6MxWLSkKS9ofnpwm5YWQaz2UwiKWQBvdKdvtrAYgE1mS2ZEEIIIYQQ8l1CgZgQQsi3J+B/XDkrX1d49Q+v+qcsKdoc/qmrbyvXqe8DJTbFMmhac7pKHUYDE4E4eok07EQiEY/HDcMwDCMWi0UiESyGhOL5fL5YLJRSs9lsNBr5vg+ZeLFY4OuLxWI2m83nc7kcK7MswjtMCCGEEEIIId8ZFIgJIYR8M3RROCwQ6z/oYrEe6nrVOrEMFDf5FlgsFoFSYOEo2MAmXi3DXQde/5Df+vOzsmUqpaLRaDweXy6X8/k8kUikUinLsgqFQqVSsSwrkUiYl6RSKWjEiUQimUxGIpHZbDaZTKRlep43HA49z2u1Wu1223Vdz/MajUav18MykJXRwkVBhl786jGPb3o1CSGEEEIIIeQbQYGYEELINyM8Ox4/6ApXQN7VVbDAegJrDpenW5n3qm80sBLoy0oTPcNSMgnzFmjEK8cGXt3elFLxeBzqreM4juPkcrmNjY2bN2/mcjnDMKAOQylOJpOxWCwej6dSqWg0Op1Ox+PxfD43DCMej0+nU9/3h8PhycnJ0dFRo9Fot9toe+PxGG17Pp/PZjM9v2Ll7aMfDh3xhBBCCCGEkD81FIgJIYR8e0S90j3FrxB5A3rxytzVV0y6D1uG1cvGYT3ddWWqAIW2AG9BMbRA4K/S0kjCjVBduoYh+Obz+c3NTejCpVIpk8mkUinHcbLZLCKJ9YYEnVcp5bpuJBKZz+fT6XSxWCSTyWQyGY/HI5FIKpVaW1tLJpPr6+ue5929e9fzvPF47Lpup9NxXbfZbLZaLd/3oRcjfUJuB7k1AkcXCOYO3xqEEEIIIYQQ8q2hQEwIIeTrCReOk+RW9Urn5kqr7yuKywVSKQL7ENhQQF/Gb8NJFOpqxzH1tT+787CyhqEKpZroIxBorvF4PB6Px2KxdDq9vr6+vr7uOE65XN7d3c1kMoVCIZ1OYz2z2WwwGHS73clk4vs+VGCYfxErMZ/PAwER0Wg0kUgkEglYjGOxWCwWy2QyEIuVUp7ndbvdwWBwfn5eq9Vc1/V9v9vttttteIolXEUs8AE5OPwDGzAhhBBCCCHkjwIFYkKuHZxrT75FgwkYgfU01bB7V61S7lQovFh+CPuF9Y3qeyIuy/Dm5IuxWCy8gL7ywM9hC+21ujv+HA9WGkagjUmwr1IKAxjSDmOxWLlcLpfLuVxubW3tnXfe2dvbcxwHdefm8/lwODw6OhoOh+PxeDQatdvt4XA4mUym0+l0Op1dAtfwbDbTy9nhc8nOjsVihmFInHEqlUomkzApFwqF7e1tKMLD4fD4+Pizzz7rdrvT6RT5xZPJRL2cmKy3Ugx+6L99daoGIYQQQgghhLwOFIgJeatY6Y4M280CQhshK5tQQJ9Vq5zCkOF0P2/4K/oC4fV/bW0uXX1e6VnWW3UsFhMRDZP3r1o+cIwrwy7+3C/lW3mD621Pbxt69rS69OGKjhyLxdbW1u7fv7+1tVWpVLa3t23bXi6X/X6/0WiMRiPXdQeDwXg8RpRwt9v1fX8+n08u8TzP9/3ZbKZvCK5hqTsnOxaPx5PJpG3bg8EA++k4TqlUSqfT+Xx+bW2tUChEIpH19fXpdHpycjIYDJRSvu/jcGRV4RthZfa3okBMCCGEEEII+QOgQEzI20l46r2Y6cJz8wnR0b29Irbq0ajhOf7hFqV/GFCQhYDAd1UbDuvU8qGuo4mv+dXl7F4dMfE23Re6Xv/WSN76z3qzCRxgLBZLpVKJRMK27bW1tVKplM/n9/f3y+WyYRhKqaOjI9h1Pc/r9/uz2cz3/Var5bquUiqRSEwmk+FwCKsvLMaLxSKdTqNanVLK9/3JZBKPxw3DiEajs9kMqRHYk9FoNBwOe71eKpVC2DH+iV06PT3NZrOmacZisb29vZ2dnfl87rpuq9Wq1+snJyedTsf3fajVeuJE2K0vgSrM1yaEEEIIIYR8aygQE/JWEXBo6p+/4p+E6ARSIJYvE57af5XwKpPidZexejmzQgYtAlXFIIrJFkWqDuxSNBoNfFFv4brXUsIHAgbMlUL2W9YnvDWtUddAw3kmesNLpVIbGxvVarVSqezv76+vr6dSKaWU67rwC3ueh9px0G1ns9l0Ou10OsPhMJFIZDIZpdRwOIQonM1mbdsuFouFQgFV7BaLBdYQi8Xy+XyhUJhOp8+ePTs5ORkOh77vt9vtXq/nuu5wOHQcxzAM1LWLRqOIm7Bt2zRNy7LK5TLSJzY3N2ezWbfbPT8/bzab/X7/5OTk/Py83+8vFgt9qEaFhmdWPgLYzxNCCCGEEEJeEwrEhHzPqsfXvsmL+VddHZl6lV6wMkdCF1lYsIusDJEIy6ai1UpJLllGYoh19RY1uzDR3jTNRCKBaf6JRMIwDBTySiaTiUQiEGe8XC6R8YoPURkM8u5iscCvEAIwmUwWi8VsNhuPx5jgH9gNORb8KqARr6x3t/LmeitvjT8Xw2lgOEFvJ+HeT9rV+vr6u+++e+fOnUqlsra2lslkZrPZyclJvV5vNpuj0QipwbPZrNPp1Go1NKfxeKyUsixruVzCLJxIJCqVyubmZrVaPTg42NzczGQyiURisVj4vg+BeG1trVqtTqfThw8fPnr0qNFoXFxcnJ6e1mq1er3ebrexcll/KpWCapxIJFKpFKzKhUKhXC5nMhlIxqPRqNfrPXz4EAeIQnmBaJTACMdVASzs4gghhBBCCCFfCwViQr5rpeMVH640fwUkLUhvAWVEX1vYzqmrZuF0Tv27K4MvRYag1vD2tcZX+82viuuVJAddloL8KnJVNBpNpVKpVCqdThcKhUKhYBgGvJMwVKZSqVwuZ9s2dORoNDqfz5fL5Ww2Q3EwyNDj8XgwGIxGo8ViMR6PO52OTN7vdDrj8djzPFQPw07KvkkAcTjmOJDBDYPzysZ/1Zl5K9vDG3t0ersSw7i+w5L5WywW4fPd2tq6efNmuVyOx+PD4XAwGPi+f35+jhAJz/NGoxFSIwaDAazE8Xh8Y2Mjn8/DEYwIiEwms76+Dum2UCiguaLBIJ44Foul02kEQVSrVcMwhsMhttjr9Wq12ueff95oNCaTSa/Xa7Vak8lkNpt5nrdcLmOxmOd5SinEXHS7XdiK0+m0YRjZbPbg4CCRSGxubnY6nYuLC9Syw7YC2Rq6WHzVIAchhBBCCCGEXAUFYkK+O41DraoXpzS5Svf/BsJVdVNkwCOsQmqyuloI1pOIV+a6XrXngX0mb2WblKt8VcU20YL15pRMJuPxeCwWMwwjnU7jh0wmk81mU6mUZVnZbDabzWKZdDqdyWSSySQWTqVS+HokEplMJjB1WpY1nU7hBl0ul6PRaDKZLJdLCMTj8RiqcbfbxQ+NRmMwGEynU6hv2MNAPTF1hWU4fIsF7sq3bIBkZeizPv705uzkymYpl0NEYUi3uVwun89vbW1tbGzkcjkEDQ+Hw36/32w2e73eaDTqdDqe58GHDmUWDXV7ezuVSu3v79+/f79QKESjUc/zut1uLBazbdtxnGQyOZvNnj592ul0XNeFAVk88vP53Pf9eDwOWTmVSlUqlb29vVgstlwu//Zv/xaNs9VqnZyctNvts7Ozi4sLCNP9fr/T6aCpI63YsiwMqFiW5TjOhx9+mEwmR6PR8fHx2dmZ67rInUDzhsYdaMOBk8aOjhBCCCGEEPK1UCAm5HvTOwJZrvpLfmAufEDPkt8GdIGr5siLznXVYitjKNTV6jN1h7egHQZM5YGrLHbg8Kx26GIQdqPRqGEYtm1nMhl4HvP5vGVZmUwmn8/bth2Px6ELz+dzpEMopWAWhniHtSFK2Pd9CF4w/yKAIpVKGYYBvQ81wZRSiUQC/4QZE7Kd7/v9fr/X6w2Hw+l02u/3W60WtDzdYixBGXJE+jhKeKjmqgp7bx9vwgEGzrwK+dllAcMwyuXy+vr6xsbGzs5OsVhEdIlSyvO8drsNT+5gMIBrGGbz6XQajUYxhlEoFKrV6nvvvfejH/0onU6XSiXDMJrN5vHx8VdfffXll1/6vo+RjEQisVwuXddF64KlPRKJ4Ffz+RxZE8ViEQJxNpuFX35tbe3HP/7x/fv3bdtG3vFoNGq1Wi9evDg+Pn7x4sUXX3zx4MGD8XiMgRbQaDRs206n08VicWNjo1gsplKpW7du3blzZzKZPH78+PPPP7+4uMABTiYT/fZc2fmz6yOEEEIIIYS8GgrEhPzRdI2wI0+XOcLLX/VJ2MMYUEnC3wrUcZIlA4ZiFVJ+V1blCjuUwysM7ypliDe8fV7VDFbGlQbqwkUiEUi90HOhrOVyORgebduGFmyaJoRjJA5Pp9PxeAxNDQrdeDz2fR8T5CHaQq2DZCyhEEopGCoRSZHL5VKpVCQSwXoikUgmk0GEayQSSafT2DqCiUejEebgD4fDk5OTTqcDibDRaMxmMyQDIMtipWU4fB6kwl74RL01bf6NOpCAd3vl7sViMcuytra27t69u729vbm5CQW22Ww2m02Uhuv3+57nua7b7XZd10U4g1IKNeg2NjZu3rx569atn/zkJz/84Q/Rfh49evTgwYPPP//8888///LLL4fDYTwex/gEhkPEfTwcDmezWTweRyNEIkqr1Uomk7FYbDabQUHe3t5eLpeO41Sr1XQ67ThOLBa7efPmvXv3Tk9Pv/jii0gkUqvVWq0WWu94PE4kEpPJZDQamaaJtIp2u10oFHZ3dyuVCm4WuOxrtdp4PBaBeOVFXBlbTAghhBBCCCEBKBAT8kdTNFZ+Egg2FQdcuHxcwCy8Uq5SobpzUjEM/9TNxWEtQA8vVlrxrsA+rJSblebgU4y5/DNvouFga70F6gXootEoSszBFIyAiL29va2trVwuF4vFIAQjBcJ13Xa7DRHWdd1WqzUcDmGchHkT7mC0QzEUJxIJaMoQvyKRyGw2i8ViUJ83NjbgQUaY7MnJie/7kUjENE3IyhCRUVgM+5nL5ZLJpGVZH3zwAcykjx49+uyzz+Am7vV6vV4PNybkaRUa/AhEGYQt/OrPXx1eWazyezyolec/kO8Rj8cdx0F6yfb29p07dzY3Nw3DmM/nrVar3+/X6/VutzsajUaj0WAwQNwwhiii0Sgcx+VyeXNz8969e6VSKZfLJRKJzz77zHXdWq326aefPn369PT09OzsrNPpoCVjMEPc6+gzEYqin0NkZ4/H41gshrQTpdT5+fnPf/7zVquVz+dzuVypVHIcZ319vVQqFYvFe/fuOY6zs7Pz4sWLZrNZq9VQ0Q4p2+NLhsNht9v1PK/VaqXT6Xg8vr29jTyNXC73/PlzHCZiWF79YCKEEEIIIYSQlVAgJuR1lZRXeH5XLqALHIH3dn2Su3oN55eoJCtlaGRxQqpTSkFlA7IViBpinxRFY2VtLn3GfUCM1oWzlYXvXnFE5HvkFU0IbUMftEALgWs4m81ihnupVEK6ay6X29jYsG1bKYXSW+fn50hHRaSDUmo6nbquOxgMpNacNHvM7kf7RMSwNFc0Y9kZWJIty4J/E5pvNBqdTCawdmJD0WgUKcbT6TSRSJRKpUqlYlnW9vb23t6eZVmu6yIBGckAtVrt+fPnyKKFYB2WzuWc6DcaTg7GYAIjK29+D6Y0ETy8568YkfrOdk8vQ6f/CkMUKN1WLpfv3r27traGMBPbtn3fbzQa7XYbrmGUN0TwCJJ/TdPc2dlBXMO77767s7MDrTYej5+cnHz55ZfHx8dPnjzpdrvn5+edTge51fP53DRNtCu0NAQNj8fjxWKBNozmivEDyb/G7YMbJ5VKxePxr7766sGDB/P5PJVK5fP5TCZTrVah8BaLxYODg7/7u78bDAbI1O50OsfHx5999tnp6anv+5PJpN/vt9vteDz+/Plz27ZTqRRSNZC8vL29/e6777ZarfPz82fPnnU6nel0KsHE8qAJx8UQQgghhBBCiA4FYkK+XrzQxVDRU1QoiiFgw1RXhwLrsoi6Ihk2IJ3A6og5/voPsVgskUhAQYNGDCkNfky4I6F34L/j8RgKAnIzURYMLBaL2Wwm+oLIwboWdpWpWV1R60xxXvP33Xpf8U91xQAGRDHDMPL5/O7u7vr6OoTaTCZjmqZhGAhtwET7drvdbDYHgwGsjtBPUT4L7XCxWCSTyVQqhSTi2WwG8RcluTAfH05JCNMoZIfs11Qq5Xne8+fPl8sllkSROjhJDcNAi8XmfN/vdru+7/u+n06nYVvO5XJo+evr6/l8fjabISgWpstOp9NsNpE8EBiwCQR2B07Um2C5fX1WdkRXHdr31URlfwKlNROJxNra2sbGRqVS2d3dvXv3bjqdns1m3W73+Pi43W7DO4yuDNca9uHZbFYqle7cufPhhx9ub28Xi8VCodDr9RqNxuPHj58/f/7o0aPz8/NWqwVdeDKZoC/FKEUsFpNQYKQ6oDzdfD6HtptKpcT8rpSazWaDwQDRFqPRCAKuYRij0Uh2r9FoXFxcPHr0CO2/UqncuXPn/v375XK5XC5/+OGHtm232+0PP/zw8PCw1Wo9evTo888/Pzk5mc1mqVSq2+1Go9FWq9XtdrPZLLTm+/fvRyKRZrP5y1/+8uHDh7gxX5078X2NBBBCCCGEEELeWCgQE/I1soUotpLPENZT5Gd9bn6gFpa61HmVJviK9IwvwkQpP4utMhKJJBIJaHMo22VZViKRiMfj8LhBp4CjTTQLmT6vH9FkMvF9H7Jav98fj8dQRiAcI7JzMpkgPdbzPCh6EOB04TjsO1ZXy5Ei+pDvpQGrlx3fAQFOaVZ0BDtASoNT+MaNG9lsFimrKCLn+369XkdwqpTJQntDzTqJKsYPs9kMam80Gh2Px7AVR6NR6GuYvz8ej13XxS2TTCbT6TQsmZPJBCHCnufBSYr1S4m8eDy+WCwgVXe7XYQM1Go10zQzmcyTJ0+wFcuyEENhGMbW1taNGzdgQz49PX306FGj0ZAEWLFbyriIuIbxT3FDByJi/izktjewjpnuaw4nuaNFVavVe/fubW1tVavVQqGAVnR6elqv1weDAS4cnOBoh2hgtm3fvn37r/7qr/7qr/6qWq0mEonj4+MHDx588sknp6entVoNHSCMuuoyv8KyrHg8jk4PwyQYxkAuMO6dbDa7traGLteyLJiFF4tFu91uNBrn5+cXFxcYBbFtG60OjdnzPFibEaKCgniPHj3a3d29ffs2yu7t7u6ura39xV/8RaPR+I//8T/W6/WLiwvsD0bv4Jp3Xdc0zcViUSgU1tbWHMeBMI1mCS/zK5olNWJCCCGEEEKIDgViQl4lpqhXOohF0QiowAF1GP/UZV9oBzJJWaQ0mVAvlbsgAUNugygG+SyTyUisBNQraHBYj1IK0+eVUtgi3MT4FXRe+IWh/0ppL8zRhmDXarXq9TpU49FohGXwFXVFFb5XyA30EX+XyEBFuCWLUq8nhMRiMdu2s9msZVmVSmVnZ6darUJanc/n8NhCgcWIAqbD+74fi8UKhQIaLSbaI2gYHmQIVbFYDBouGhvWsFwuXdeVgQfU2oImC+cmWixaNb4oecdwIsNHjA8TiUQ6ncZRICJguVxCLMbylmXBzmlZVrlcLhaLhmFkMplKpbK5uVmv18fjcafTgcQGW/RwONTTJwKqemDsJ3wvvGn9mHrlVIbv1xAdtmwrpaCu2ra9tbX1/vvv37x5M5PJKKVevHjhum6v17u4uMCQAMoeLhaLRCIBQbZUKq2trR0cHNy4cWNzcxNpEvV6/Ze//OWvfvWrw8NDtF60n1wuh4G3ZDJpmiaGHNDd4cwghhjtEyEPxWIRaSeYzCFB1fP5HItFIhHf95HBjfaPpwAGYJCdjUbleR7SJDqdTr1e/+ijjzY2Nu7cubO1tbW1tfXP//k/L5VKn3zyybNnz46OjlCVbjweNxqNbrdrmuZ8Po/FYo1GI5vNlkqlH/3oR1tbW0dHR48ePer1ehjRecXlZrdMCCGEEEII+d0rGE8Buc4EZpGH35/VqhnQAT1Fr6e0WCxEAobIhYBUmYxsWZZt2zBC2rYtKlgikZB59zDBiV0RU56xTugg+Are7aGdQcbFtyBPSNawaM2xS8QQDWlDKSVRAI7jyFx+ZF8iBBMWTpFj4PecTqfhVFMa096Qhh3OP7kq9gSRqblc7ubNm5VK5caNG9vb27lcbjKZnJ2dYRo+DLb9ft/zPERJxGKxbDa7s7Pzgx/8YHNzcz6fw9R5dHSEtgFXr+/76lKwxviEtGTYdXGbYJfEoi7RrqhiJ/faeDzu9Xqz2cw0zXK5vLW1ZZpmKpUS4+dyufQ8DzrvyclJrVYbjUZIH4YNMx6PVyqVmzdvOo5TLpe3t7d3d3chTyOsoN1uHx4eorIZ7jWpYoe7LyC+q5fnFrxp2cThapnhZImVgz1/6l5XR+894vF4Op02DGN/f//mzZulUqlcLluWNZ/Pz87O2u32xcWFzIEAKBlnWVa1Wv3BD35w48aNfD5vmuZkMjk5OXn06NHJyQku7uHhIYzq0WgUw2zpdBpDI8jkkZkTGJDAPyeTCcYYdnd3IUBblgXZFwIxSjL2+/0nT56cnp6iYcNxrJSSqGJ5Xsznc2RZSBDQZDJ58eLFkydPlFKO42xvb29sbCA0+ac//elPfvKTbrd7cnLy1VdfnZ+ff/7559jKaDQ6PT1ttVqGYTiOgzu3Wq0eHBxsb29fXFwcHR2dn59L3Hb4QrCjJoQQQgghhAAKxOTasbLOm/6rlcWadAkDjsvACzaUAhge8drvOA6EV9u2HceBQAxVAgKxYRgrqzOJ0xN6GX4LyySCIKCaYXkxYI5GI0nhlMwK+SGgEStNIMZv8TN+kIiAcrm8WCyKxSKEmH6/D+nN8zwkXUJAgSASKI60MtFVUTv+TgjXHNNTUKAWiZ/dMIxisQjHYi6XSyaT3W4XVb/Ozs5evHjRarXES4tyYbZtRyIR/DydTpE14bpuu92WUQTksYrCi5tCTJdoIZJNLFIs1GFphGLMlBtBoophVYbZU5zF8MVjc6VSSSmF8YzhcIh8gOl02u12X7x4YZpmu90ej8e7u7sYnrFtG8M2SinIiLDMi2tehQaE1KqkjjethX+twR/n9rvc85Ujc/hnOp3e399fW1t75513bt++jbCRWq12fn7e7XYHg0G/34dMj15RKQXzbLVavXPnzj/9p/90Y2Oj2+1+9tlnv/rVr7788svT09OLiwuESMBjDsN7KpVKp9MYYIAVdzAY9Ho9hFOjT0ODmc1miUQil8uVSqV8Pq8P4El3iuBjtH8MQti2jXyVXq/X7/eRcy3TO1C/Ds8LPAikCF6j0Xjx4kU0GnUc54MPPvjxj398cHAAN/Ff/uVf1uv1jz/++Oc///mzZ8/a7TbSjWOxWKvVguu5Wq3atn3//v39/f2NjY3f/OY3z5498zyPHS8hhBBCCCHkFVAgJteIlbXUwqKwWL2UpvjoVllJB0Y6BMIfoDs4joP6WrBkQgg2TROGX6WlD4vbFxZgxP6KgxLT5MUdrC4nI0MgnkwmMo9eXVovsQY412azmQS2qssMAUk0ljnRqK0E5IgkAQPyH7KPM5lMLBYrlUqQ5GArRp4mPH1IBR0Oh3IUeq6oukJtJ38iXlFaTS4HasFZlpXP5/f29nZ3d/P5/Hw+Pz4+rtfrEE/R3vr9PgpzbWxswGuplBoMBoh//fzzz3u9Xr1eXywWpmlCq5Vgh0BWr7R5dWklhv6L2yqZTGIxBK1iJ/Xw3+VyiTsuHo+Px+OTkxPo3RLPqpTCzZhOpzc3N6vV6ng8rtfrJycn8GxiNKVWqy2Xy4uLi0ajcXx8DMWwWCzmcrlMJrO/v2/bNnTGZrN5fn7e6/X0bGJp2OIdDvQnb1pLCO9kWA4ORCqrP73DNNwVx+PxYrF4586d/f39vb29UqkEwVTM4LjKaC0YTkin0zs7Ozdv3sTlNgyj0Wj85je/+Q//4T98/PHHk8kEgi8aRqFQKJfLyOeRQTjIsqPRqFarXVxcoBNTSiFuQq6yZLXDcS++YJwldIyIxchkMnfu3FlbWzMMw/O8x48fD4dDcS5LbAU0a7E/JxKJbDaLqBO4mCeTyc9//vOHDx/u7e39xV/8xb/8l/9yf38fCTD5fP4Xv/jFgwcPnjx5gu7d87xarTadThuNxubm5p07d9bX1x3HwVBNvV5HAUm51jIVJpxBQQghhBBCCLmOihmVmlfwb//tv/03/+bf8Dy8JW09lCOsQlGtuhAs34IsJW/UeJ+H+SuTyTiOUygUKpVKpVLJZDKpVAqT8ZfLpeM4iJuczWYw2+JXUL6UUlA6oBRAjIOwi6n0ogLLziAIGNOrJ5MJdgmyF0BCca/XazQakUgEfjcYKnUlS7RgUUDEvAxJWurRwSUKyQOzmGF/hocOX4Efs9Pp1Gq1ZrOJwGL479TLJkFoKLp2yf7nj9W2wz/ruQf6z2g2sVgsn8/fvHlzb2+vUCjYtg0lrtPpHB4e1mo1z/MMw6hUKuVy+eLiYjqd3rt370c/+lE2m63X659//vnTp0+hu0Fy9TwPrQWGylgsBqHWNE2YcCHDoakjg1ic+PooAkRhpRTaYfRl0DIhbSulXNeFWqeXZJRjTKVSu7u7pVIpnU7jNhGxuNPp4N5RSsF3n0wmq9VqtVotFovlcrlUKkUiESz/6NGjTz/9tNPpyBiM3jnIjSxnWL3sin1jU4kD5eC+S/twYAcwcIXYkB//+Md37tzJ5XKI8UXQzcXFheu6WBg15QzDWFtbW1tbu3v37vb2djqd7na7jx8/brVa4/G42+0eHh6en5+rS90Z4wrwmEvHqxvD0YxxfaXvQmNDv2rbdrFYzOfzGFYRh7tSajqdIpV7MBgglXt3dzeXyyF9olarvXjxAkUdO52OHhMEBz0GFPVAcOmKx+NxJBLJZDLlcvnOnTs3btxYW1u7c+dOJBLp9XpnZ2cff/zxr3/961qthoNCsy+VSjs7O4VCoVAouK57cnJycnKCE4LIl0AzYD9MCCGEEELebiqVysXFBc/Dq6GDmLzlrAyUCATmqpcDOgNfwa+gSWFGMDQC0zRzuVw2m0WChG3bUKnG4zEsjcPhEOGPyGSQ0EwpWITJy1B7gcyaR6UjdTmFGfuMEAnRF3AsupEN/0Qxrmg0mkqlotGohMCKcIbgC90Et7gEWxQ9F3495MkmEonBYJBOp1OpFLzSWINlWdvb26VSaX19vdlsosBXs9ns9/s4Ol0UDp98ahN/UgLVFKWeoWma+Xx+fX19c3MznU6j7ly9Xu90OqhEpy4FUDQSjIvIaEez2Ww2myjzhTWj8WNhpRSqxmWzWUzen8/nCHnA2Ik4LuV2CLQNWY8K1YqUuxLeT5npD4E4EomIBt3v93Ej4F7IZDLJZNL3fYiPWM9oNMJ4BjREpdRkMoGX03GcVCqllOr3+6enp4vFAiUcRSP+89XXwr3cdx8uoVf5S6VS6+vr29vbe3t7H3zwATJ5T09Pz87OXNdFpTXEgOBKZbPZra2tn/zkJ/fu3Usmk6enp1988cXx8fHjx4+fPn3a6/WUUpZlYd6DXCAkBY9GIzRm9KgYbxOtH4nYMgQoX5dJGDgKGRLAJ6PRCHdNuVyuVCrFYrFUKiE7BbHXCHJZLpeDwQDGYYwLog3LvYZZHRiHQ88fj8cnk0m32724uHj48GGhUCgWix988MH9+/cLhUI8Hr9582Y+n+/1esfHx5999hl8yhcXF57nOY6zs7Ozvb394Ycf7u7uFgqF3/zmN8fHx+E+OTxcx86ZEEIIIYSQ6wYFYvJ2slIX1jUm3d8adtKJeCFCqm3bOzs7qIVVLBZt25a4YYlJhecRgaeTyaTX60EChvIrdmAoX1CBIaFiRnMsFpvP571ebzKZSBZEKpXK5XJKKd/3YUmGbIHtSqywFDvCpP5utxuJRDBtGaoWHMoIqUSEBRSKSCQC6zHMbpAkYNWUvGPEa6JsF86JbdulUglfTKfTsNStr6+j3len0zk7O7u4uIBu0ul0RMgLK1PkD2/qK09pwJaL84/kE9SgQ2yrYRj9fv/s7Oz4+Bi+2kqlsr6+jvYcjUbRIGez2dnZGT6BWxyNBy1QyjCKuzwejxuGgTEVyMHpdBqNEJLfTEOs5dhny7Ky2WwymZRIbv3exMKINJEEFejF0+kUrReyNVTvk5OTVquVyWQqlQoSMCqVSi6Xww3Y6/Wi0Sj8+LPZDDPxfd8fDofr6+sIil1bW/vBD36Alnx+fo76YDCfSnqvnPOVF+jNNBF/93u1shoervjm5ubt27ehY7bbbUyDqNfr6Dr0iQ65XG5ra+vOnTvvvvvu/v7+0dHR06dPf/3rX5+fn6PGYK/Xw/iEBJ5g0A4+X0jMWJsETOt1CCXJpFgsYuwEaQ+I3EFYkAjEMtSH/bQsq1AoIKgEbnr8CqXwMKFEVGZsCINw0pmjbaNho7PF5jzPGwwGruuiRh+yhrHA9vb2wcGBZVnHx8c4Ukjq4/E4kUjk83mY4l3XrdVqCFmWGR5/Ls2VEEIIIYQQ8qeGAjF5C1kZJaE0mVj3CwfEC1F84GHEez4m7d67d0/mF+tZq9PpVDzCs9kMnkTf95vNJtRY3Z+LUnXQpHzfl1/Bj4xwCaVUoVBALmoul6tUKkqpwWCQy+XK5bJlWZibLJoCJsvjGFOpVKvV+uKLL2az2dbW1ubmJgxo/UsQcAn5DzodJvVL2SXMxVZKGYYBdRtzuuEjht/NNM3hcIjJ0fl8vlwuQwHJ5/ORSKRcLufz+bW1Ndd1T09PI5FIo9HAyQlHEgf0CDrXvl1Tlx/0TBK9/UP6LxaLN27cuH37NiyK4/EYJbxevHjR7/dN0ywUCtvb27i+vV4Pk+JhhD8+Pj46OoI0hoQK8dTbtm3btowuSLKw6GgYh0CMQCqVghwsJRah7WKkZLlc2rZdrVYdx1GX4QPifweTyaTVal1cXKD2l4y+wAqKNAmlFFbYbreh9zUaDfsSOENRByyVSqGdw14KDbHVap2dnWUyGehru7u729vbqNpnmiZUNtd19cpj4QDfwFV4c1r1dyAChjcRPiEYYLBte3d399atWzs7O7Ztt9vto6MjONlxQePxOBo2cqJv3ry5trZWLBb7/f6XX3752WefffLJJ8+ePRsMBrPZDNMm0ODhT8fkDPR46ILwM/ouiZKHoRgCazKZzOVySF9BY+t0OjLggdaoJ9qjDWOABPMzcFPA/9vv97EJ/AqjLEopyMHSNrBjSqnhcCiGfcMwkAWETHnkBbVarQcPHhwfHy8WC9u2b9++XSwWTdO8fft2KpXq9XpIh8dAo2VZ8/k8nU4bhrG7uxuNRpvNJu4dPRpFvTwSw66VEEIIIYSQ6wYFYvI2oL+rB17dAzPTwynDulSBJU3TxATzdDqdy+VSqRTe9hFmGovFUPZnOp1i1jw8YsPhUGy5cFyORqP5fA6BQ4odQV+GQKyUkljMbDa7v79vmubp6el0Ot3f389kMrCzQfKYTqeO42DOPlaoz3MXV1okEhkMBmdnZ/BXViqVWCy2vb0diUQQeaEujXLT6RQVmVAZDOIIlBRY6mBeg7kY0RaWZUGPk/nREBkHgwEiC4rFIib127YN3a1QKGQymZOTE2jTruuKkzowxzmgo73alUkCrVdXiuUEwgmOy4Fc3Rs3bhwcHESj0eFwWKvVEEs6GAyi0Wi1Wt3Y2IDht9Vq9ft93/c9z4P9HHcN2gYUvYODg2KxCO9wKpXCeMlgMMBIie/7rutiNEISrrFLhmHAbgxxGfIfWhQkV8jH0gJN04QXHsIfDKEQvFqtFtyU+CJWDnc/1gZbPUQ9WOAhz8GGb5omwmEgw2F2P2b993q9druNu69UKu3t7aFDuHv3bqVS6Xa7tVrtyZMnyH6VCfvqCl04MC/h+2okelDyyj7w2+3eyi++4oSgrSaTScdxSqXS9vb2e++9V6lUotFou91GBPZoNELPiVkaGIVaW1vb3t62LKvdbj979uzo6KjRaJyenqKEoFIKHSa85xBJZQQOjVCuQjwe39ra2tnZyeVyCHCfTCbNZvP4+Ljb7cKW+957762vr08mk1qtdnZ2Bo8w2rDMBUGDROaPZVkSOoQfEokE4rlRzhFNCMMh+lwWScBQl+UZPc9Dx4t9w9CLbdt4xEyn0xcvXuBmTCaTjx8/Rk3Fzc3NbDYL8/Xx8TGeUw8fPjw9PcXgYrVa3dra6vf7R0dHR0dHrVar1WrhSaSPzOl5L+x+CSGEEEIIuSZQICZvlUamLuvOBcTHgDgiP8QuSSQSlmXBIFYulzc3N/P5PJSpZDIpZlsITL1eD0KY2+8rz0tNp7PpdDyZzGez+WIBZ2IiHs/btpFKJZJJTHaORaNJw7AsC/PWU6kUNhGLRqezmZVOb25tmabZbDan02m5XJ7NZt1Op9fvz1w3FovFY7GE60Y8bxqJTCOR5WIxXyxki5IXvFwuj54/dx8/dgeDE9eNnp/H4vHt7e1isWjH4040WiwUMo4Di2V/d3cyHsdiscVy6fv+yPOazWar3Z5NpyoSmYzH/ckkEolMlIKEYGYy0VgMiRPD4XCxWCxms7nnjS8uprHY0rIixWIqnTZNM+s4juMkTXN/Y+Ou43R3dhqNxsnxcb3R6HQ6br8/m80Wy6W/XLaVWrwsM4WFTooUr27zgSgJUWNFac3lcjdu3Njd3d3Z2clkMo8fPz47O6vX6/V6vd/vTyaTbDabzWYNwxgMBi9evGg2m9C/9PwTqFeRSMRxnLt3796/fz+bzUptQ0kRkeJaw+EQ7mN8InuFBGTYLXHTSX05XOter9fr9ZAgDGMmBmyg5EL4a7VarusiDhuu9m63u1wuDcOAux/G+WKxmMvlbNuORCK4s9BFYA8Hg0G73UbaBmYMIGoWwTKQyIfDIXJjs9lspVLBOdzY2CgUCtD+MGNAyp0F0C/H9y4QB3q/8K7+6ZqoHnGLpN1yufzuu+/evXt3fX09mUx2u916vQ5lU11mvmMwzHGcn/3sZz/84Q+z2ezFxcXf//3ff/nll+fn5xjfkjkZGGMQO7mMQumZ11Kcc21t7d133z04OMhkMjD8zufzZrMZi8VOT0+j0WihUICeC+14Op02Go3BYCBHgSuOo4OEncvlHMeReqGwACPsAuOCtm2n02nUKcVAhV4OVD9XUqHR9320RoT5oJXqsRsYxYnFYufn5ycnJxsbG6VS6ebNmwcHB71e7+nTp61Wq9vtuq7bbrcRSbyxsVGtVm/duvXo0aNf//rXzWZTRjhW9sDq5f6ZEEIIIYQQ8lZCgZi8bZJZeP5v4LU24DUrFosoClQsFjFRFyGSeEuHyuZ5Xq1Wa7fbMAt3u93RaDSeTBau+57v/4vpNH6pcInzMZlMFiwrFY3GlTIXiyR8i9FoYjiMeF40FkuZZrLXgxkNkgEcmonL2IfpaJQcjTK+L/LB7/Z8uVRQnZbLyGIRuzwcNZvFFgul1I3pdGM0ms/n8V4v/tVXKhKx0ul0Oh1PJOKxmJFKRVMpFY9Ho9FCNKrb9KD8LhYLSBuj0ajT6cAyjFQKqdSEkwPlBer5YrFQkQgCm6H9wSWKUwGjsbtceul02/c7vj+azyfL5dNI5H9eLodX+A0pSaxs4SoUjRLwX+vm60Qikclk1tbW1tfXC4VCLBYbDAaNRqPZbCJcOH55yVB+bTgcIqJUbiWsEK0CKdjr6+uO46Bi2HQ6hXyGn5FGAvtwv993XRcuTqkDpmvBuL5o+dhhCGfYKKzHuKHkGEejUaPRgNo1HA6x8/gKxjywQmzFsqzY5XgGJGyRCJEpAQs81gN3v0h72Khpmp7nTafTbreLnGLbtjFolMvlqtWq53n9fv/i4mIwGIhiqE/VD1yd77FJ/+m2+4o020DmOz5EZctKpXJwcHD79m3bti8uLprN5unpKaRMZNdIN1KtVnd2diqVymQyOTw8/Pjjj4+OjiDNT6dTLDyZTBAejQFCzKhAy9Rjf5VScJQj5xqXEn0ULi6KcCql0AzQMLAMVoh7Sl3K3PC/Q3QWn7t6eToLRkRM00Trgi9eNGuRsGUWi+wqhv0mk4lhGMjUxjNCKYW1+b4/Ho9hnJ9Op8fHxxi5vHnz5t27d5GCgsaPNgzxGrHajuP4vn90dNTv9+VeYwdLCCGEEELItYUCMXlLVLNwiIREskpCKHQu6K2QcW3b3tzcXFtby2azmIMvfjREkUL26na7p6entVpNFDRkQTqz2Qfz+f91PF4d2Xhy8pr7n7mWV22u1H+NRP7fy+XwZe+wojT8Gu088AnOmK4OQ0LKZrNbW1sHBwflcjkSiaB44OHhoeu68/kcflul1Hw+v7i4QKuORCKw3CI1AqKYlO2CTdL3/dPTU3wRgweQ4RD5Cu8wTL74ulIqlUphl7AGiWTFvQlZGSL1bDaDsAv9WoIgFotFq9XCziMRRc6DVGtUSiF6NRKJwJssdcBQXgzHiIQWyHNIDIdAjCqUSJJdW1tTSoli7vt+o9FAB4L939jYsG272+2apvn8+XMEHUhSjVwgUSe/3yZ9Ver3H7d9qpdjCvQ+GR8mEolKpbKzs3Pjxo2tra1UKjUajc7Ozo6OjmDxRqKCUspxnJ2dnVKpVKlUBoPBf/kv/6XRaDx8+PDFixfQ9MXAjsYwHo9hy9UvrjQPpSWcOI6D7GmMYMGKq5SKxWKpVCqdTiuloKUiLzudTmcyGdu2W60WJpFMp9NEIgEDO0bXsB79Wks7TCaTtm2Px+NCoVAul9Em+/0+Bjb0K6L7zWU9aLH4FeKAYD3G59COpeX3+/2TkxPEKycSic3NTXifoTUjPQP3MmLi79y5Mx6Pm80mbr1wg2FXTAghhBBCyDWBAjF5G/SyV+TV4m0crqtkMpnJZPBfKEGO49y4caNcLuPFG/pRp9NBvXgULFoul91u9/z8HNWu4vH4+vq6bdtpy9pznA8bjeVHH0VWVQYjr2YeiSzj8chioRYLvQrZyjwQojTJRo+cVto8eqUV/rp169b6+jqGPebz+dnZWbPZHAwGCEyA2AQdFjG+MNhCJJWQa8ijv0tNSSQmk0mn04FnFjZb3GIwhJqmuVwuXdet1+vNZhNFxuDtzWazCEg1TRP51GLPVEotFgvUhYPbESoz9GtsN5VKLZfLk5OTx48fn5+fI/IVNe7kqDHkA21XXbovkfENMRqh3pCzIbdByx4MBki8RUgxZEFktqIuWTqdhgl6MBgcHx+32+18Pl8oFDY3N/f29mazWalUQnAHfMSSMKuPVK2cx/A9tqI/1Zpf1oXlw3gikTSMbDa7s7Pz/vvvHxwcmKY5Go2+ePCgXq+/ePFi6LrRWMx2HLRYx3G2NjfX1tcjkcj5+fn/93/5X7588MAdDCLRaDwety+zbuaTSa/Xm89miWTSdhzdKTybzaaTyfTSkI49MQyjUCptVKsbW1ulcrlQLJqpVCwaXSo1m80WSm1sbaVtWylVKpUq6+u5bHa5WCBoGwH0x8fHrVar2WyOx2PLsgqFQj6fF9e5HLjU80TQdqVSQc26SCTSarVs23727Fmr1ZIWgsEVsRUHUsVRXg9xE7FYDOVDPc+D+oxRFqUUvMmj0QjJEqZpZjKZSqVSrVZd1200Gtjz4XDYbrcrlUqxWLx//34+n6/X68+fPz85OcHNHuhP2PESQgghhBByHaBATP7MCBegCwsf+vTe+CWJRKJUKm1sbGQyGcuy4BOEnzGVSvm+32w2kajg+75IZtC/fN+PRCK3bt2C8WpnZyefzxuGUUkkbv3615GPPpKdW0ajStdfIEzIzms/B5QVfP3NOtVKLZWKhHdM1NtVyweEKDFSKvl5ucQP0UjEsqyiaXY6HWRxBq7y917X6w1EV5R05Us+x8/ZbPbmzZv7+/uWZc3n86dPn3766afNZhPKJlQkqe02mUyQKQEVDMGvsVhMQhgwcR4artxWME7CdIkoYcMwoLcig0XszKZpIr03m82KnV9dpg0gzAEBEUj1rdfrvV4PrmTcudjhRqPRaDTgEpUqYTgtkGUlfNYwDAjEiELGhmzbNk0TOeMoLwn9OplMQpWGfAx/KGrcIUC2UCggnQN+Us/zcBToRgzD2Nzc9DzPdd1arYbyla+Ilfjum3RCqdtKOd9Vp/H7XgInYbmMRCJGPJ7LZKpra3sbG3uWZXa7ruue12rRej3V692YTJKGYRiGOZ/vm+btzc1isTh03fp//++NRqNzcpJ8/ny/31dKxdEaI5H5YjGZTKaTyWw+T6XTjm2bqVQsFsMO4OqjD59Op9PJZL5YKKXSyWRxPi+Nx9Vud/f0tDAawVeulELqSG44nEwmkUgk3enkjo+jy6VfKCDVOhaLIYai1WpFIpGTkxPothg+QfaOtEa0f3Vp5Ed8sOd5pVIJdUTPz89hBMa9jKEa8RTrsUKyZvwAgRgOZWjKuBmVUigpiWPHvs3n85s3b77//vs7OzudTueLL744Pj4ej8coILmxsbG3t7e1tbW2tmbb9nK5fP78udTiC4RHUykmhBBCCCHk7YYCMflzYmW45yuseXh5LpVKxWLRsqydnR1Malaau8113V6v1263X7x4cXR0NJvNMH8c7kJoPaZp7uzs/A//w/9gmmapVFpbW8MCk4uLueYd/qJQ+F9LpYnvz6ZT2JbxAj+fzxfz+RLqnlKRaBRyA+IgIS1EotHFpR0Sb/iiJc0XC7VYLJRaLBbLy8zKCCSDaDQRj0djMbGeKU1dhe0R68QmIpFILB6PR6MLrBYBrxB2l0sY2CKRyFIpCCuYhb24rLxn2za8chnHqa6vz2az+WJhWZaVTruue3FxgeVnsxniQZE/MBgMhp4Xi0SShpFMpX46Ht8/PU2Nx5FIJJfLHWxunj94MBwO4esMKGvha8rGH/hE14ghpyaTyVKpVC6XC4XCYrHo9XoXFxetVms6ndq2XS6X+/0+AlsRNKEuHbhwOKL5ARGwlFLQW9WlKx9CGIIdJIkCDmXcOBKrahiGbdswDsO3C5EXapdEryaTSRTKQxk62StsGuIX2rO0c3iQsQaow1D3sNp4PD4ej7E5lK1DRTKodTiHIu2J7I5/jsfj0WgUjUYzmQwKpqG8ZD6fF9253++j8lgmk8GEfUjqiF0OX7XvK+Y1rdT/Ran3v5uNhYbHlFJqsYhNJqnBwFos7F7PePAAWrzneVDkpe1Fo9H8+Xnh0aNkMtnr9Yqt1t5o9OF0OplOJb5jcQmafjQaTUynhu9LUsRyuVTL5XyxEJFUnObxycQYjZL1uvn0afo3v0kmElHN9iuhwEqpaCSiisXWv/gX3v/4P6INLxaLbDaLx0G/3+/1erjQEHMl6RjGdtwO0ixhhEeiSyqVSqVSSNLAM0K/o6W2pHSGch/J3W2aJozwaNhiKzZNE+kr2Jn5fD4YDJ4/f27b9r1790qlUqlUuri4cF13OBxinAMhS7Ztb21ttdvtTqfTbrexz4Eof0IIIYQQQsjbDQVi8meplF1VlUv0MqkglM1m19bWtra2MpnM5uamFNeClIOKc5g4f3Z2htnrSC9FgSPJplhfX9/a2orH45lMBp7iXq/XPj5Onp+/d+mbe5BM/j+y2Wk8Pp1Mlpe7+nuBeLkUjRj13NKWBb0V8+LFjzabTv3xWCkVj8XgbFwuFkulsD9S+B4T7VOpFIpuiawAxQHhlXCZKS2kFduCihFRKqqpY1hnPB5fLBYodlTI581USoRC27LMVCqdTq+vr9+/fx9i3O7Ozu7eXq1W+8UvfgHxYj6b+eMx1ua67vn5eb1eR6aBYdum6964uIBAbJrm/v7+005H7NtXCaPUiAMBzbouLD9jAKNSqezt7VmWNR6Pu93u4eFhrVYzTbNYLMI+jIBgZJiiwaNVQDaFhVBdjq9IyjBuGT1lFU0LkmitVlNK9Xo9hKtitWgPmIYPkyPMwmi0kHHxIRoeBhiKxSI0Yomb6Ha7nU4HqjE2LYobfJ0YyMF2Z7PZeDyG8RkbwiHgduj1ejheTB0YDocIZpUbBDeO3GWe57Xb7Xg8Pp1OHcfJ5/OdTqfRaAwGA+yb4zhbW1u2be/u7iJPwHVdsWHqoQeBePTvrEknlfqRUn/1/Tbf+Vy5rnJddXHxNUvW6/h/Xqn8a658PFau+1pLTqdqNHrNtU7y+e69e+PJJHLpEYYIO5/Pi8ViNptFxyhPHFxrua3UZd4LenWMWyQ1cHPpt7N+g4f3R/KIJ5MJBi0gQ6MQH7aVzWYRvY3Wi+KTT548mc/n6+vrmEYjY5+dTqdWqyUSiVwuZxjG1taW7/uIKR8Oh7p3GHco//YghBBCCCHkLYYCMXmjCXuX9DrvgTdYzMaF/JTNZvf29rKXWJaFd+ajoyPP82Aq9H0fgap4x57NZtVqFSoV7FqwYUK0Mk3zP/2n/+S6rlLK931432L9/v++Xv/fXr7MD3q9s+UyuVyKOxL7Fo9GE4aBncSHKBMUi8WWi4WaTpOplG0Y3nw+m04jmAedzaZSKaTEomieuvSmwXzXbDZ7vZ7rul6/D7emfnLg8YwoFV8uo5dbjCwWkeVy6nnTS+ObUmo+n2OGMjJnk8mkk0olEgknlfJ9Hw7N5GUI5ng4nI/HU8/zer2zFy+Wy2UqlXLffTeTSvmDQb/Vevbs2XK5LBaL29vb29vb0O+8mzcRSttoNNqDQbvZhMyhlEomk3/zN3+z++GHz58///u///sXL15AhdR1T3WN1eGwg0/EIykoJ7/N5/PvvPPO+++/v7m5uVwuLy4unj59en5+3mw2U6nUwcEBpOHDw8N+vy9T4KPRKKrAYdgANwLaA3RV0WrVy+Z0qGNo6vAeIpwBspRSyjCMfD6fz+eRKotoYOQRZ7NZ+I4hPSulptMpbKRQiqWyFlzJGD/o9/tibMSwim3bCCNGYgbaDOImUAwNZn/EVqAGWq/XGw6HlmVBzM3lclD6kCkhxmf0CSI39/v9dDqN0OFqtRqNRs/Pz58/f35+fl4oFMbj8d27d+/du3dwcHBycrJcLp89ezYcDgPXUZzX8mFYHPwTQW3v25y0SGQ8nQ4Gg5jmSceQw9bWVqvVQp4DPofgizEDjJyhN57NZsg2gfk3nU77vg83OuaySK8utl+9A5SnBipGYlCwXC7v7u46joPakoeHh41GIxKJZLNZ27Yty1JKTSYTJGxIKvHR0RE6ZBzFdDrt9/uPHz9ut9u5XA7Ta27cuFGv1//bf/tvDx8+FI1YzPV6CtB31vtxaJAQQgghhJDvBgrE5I1GTyxVL8thurwi83yREVytVjc2Nm7dupXJZGQS+nA4PD4+bjQa0KSgfGHSeiwW8zwvk8ns7OxATkJNLVQfms/nKA3/9OlT+BBd1/U8bzKd5haLwWIhM6mn06nnurPLZFWZTQ/5ALth27bjOKlUyrZtwzBgaUTtIKnHhZns8IJBU9DnVi+Xy/F4nM1m2+326elpv98fDAZYQGZhQ1CQ13vxCMsplZ9lfr24NWezGfYW0iGEY8hkmJgM4Xg4HCaTyel0+vnnn5+cnPi+f3p62ul08C1YMufzOeo4VavVWq325Zdftvp9bzgUoWGxWJSKxdLt2xsbG6enp61Wq9Pp6LObr7lAEB4g0UXzQIU6wzCKxeLGxkalUul2u/1+v1arocGXy2XbtpEO3G63cXH1UnVosWgDYjNHEjcke5lHLw1JHOuSnQptC40K64HJF3IzvoWVY8BG/I9Ym4SZwHeMrBKlFNqe7IZ+cmQYBkekWy9jsRiqUEIsg6INMQ4KcjQahSyO4nWYmy/SHnoVHA4iZWezWTabRWmyYrHY6/UQw4KeZLFYIDcgn88jo0aFJjfIbn+/kcSL71IvjkTQiF+6nUPHG7kMwFkqtZjPVWCZSOSqXuClQHr9NrncmLrMz1leLv/7Ba+KTlgsIlgcgw2z2ULLQ5dyiFCEZaxLvy/00AncHQhjkXktgXAVJUN6l3e0JIxLALEe2JLL5SqVSjabxZrr9fpwOIQiLLdzIpFAI1eXGjRmzCAsJRaLdbtdlGfEnZjJZNbW1nK5XDQarVQqp6enaNt6G6ZiSwghhBBCyFsMBWLypqtjYUVYe5H/nQ0WblzLstbX1/f399fW1kql0vr6ejKZHI/HUGB7vd6LFy88z4PACpl4uVzCS7i+vn779u27d++ORqMnT54gnDEejyNostvt1mo1hDNOJhPf9zH/PBaPG4mE8n1UZEoaRsZxYpdqmqgJ0MhQWQuCL8pboSAelC84IlFADwJxPp9Pp9OQ2EQjADLFeLlcYg917UwvYiZxE6LO6JPcMac+Go3CNyrVlkQEgaFS7G/RaBThwkAqQTWbTZyZ9fX1XC53586du3fvRqNRz/MSiYQkF/f7/fZgkDw9jVwezngyGQwGhfX1SqXy3nvvjcfjhw8fnp6eQjrUFbTrqReH1ZnA5/gBkuv+/v7W1lYikeh2u+fn5ycnJxcXF5FIpFKpQB1ut9s4sfCDY0AFjvtUKoW2kUwmHcexLEuyUCWiJLBjeuuSQRq0ChhvY7HYcDjEJjKZDMY5lFLYOip3GYaBQRc0QqwcrnlU4oIHU5YxTTNwWpYaEpYtFuBer4cxmH6/D7VL17lGo1Gv14OdXymF8RilFG4HyRCHvrZcLtvt9vHxcTqdhiyYyWRM0zRNczgcIoAbwnq1Wm21WrFYLJA1Id3X9xjq2lLq/6bU/0+pyR+pjw43WaUUer3S+vr+3t7GxkbGcZRS/X4fUSEI6IhGo7Zl2ZlMoVC4ffv2WqUync2Ojo9/88kniLqWPm25WLiu63vecj6HWKyUUtGokU7blrW3v3/r1q21tTVUTURDgiXc930UZEPKzWw2W19fX6tUMo6Ty+XW19fRyUtvOV8s4sfHG//u32V/+9vIbIZUn5HnRZXCCIo+GImucnk5X0Svm/r7ZKHLxB4cCOZqSJwL+lhZlQSSYHbLaDSaa6n0+Ho6nc5kMuvr68ViMZVKQfadzWblcrndbne7Xdd1McKHuBikfmNAFHsIfblarY5Go5OTk/Pz88FgMB6PU6mU4zgQrzc3N+fzeaPRODo6gpFfD/3/k/bD+iOeSjQhhBBCCCHfJRSIyZtIQECRd+/AjFe87qLuVj6fLxaLkIZN04zFYoPBYDabdbtdvAZDL4CBCy+fcFyWy2WlVLlcvnv3bj6fPzs7WywWzWYTIa3wCUoMK17UU6kUfLXZaNSYTlWvh9fZZCKRcZzYbIbdw8s/fhb5DEmssDRCR7Msa2NjI5vNJpNJKN2JRALFr2RGsG77hSShlEokEsvl0vM87Kde10siKSFh6NPYYS6Lx+PwNSeTSdTvwmFiDfC7RSIRz/NkbvV8Pof+Mh6Pfd+HfRKRsqZpQgpZX18vl8vVajWfz08mExg/x+MxQgy2t7fn0Wi1Vks0GmoyWS6X7mDw29/+dm0+T6fTN27cyOVypVLpo48+ev78uagq4VZxfYQDXSXXBwn0TBXHcTY3Nzc3N/f39/P5fK1WOzs763Q6g8HAsqxcLuc4zmAwOD8/7/f7uMS6vRficiwW830fAxgQZ6WBiZ/xqj2E4Ksu44yhl4mJ3nVdNBJsDlESGIApFAq5XA76b6/XgxUXTdQ0TSyMQBXf92ezGZJeDMOApRe3D/Qv6Ll67O9kMkFpPrRAmNml2ePeRCZGu91OJpM4TBgwDcOA7A4TJba1WCyQg4yQAajVsF33er3Hjx93u918Pp/L5ba2tiKRSLPZPD09PTw8HI1GYZvwd28cBlOlXij1kVLeH2NtUW3Q7neHE4kYhlGtVtfX12M7O5Hd3aHjtHz//Py83uu5w+FoPvfT6YhlOY6TKBbjlnU0mx2125FOx3XdZrPZ8n007+lyOZ3Nftd3mWYklUI7REaQUsqIRq1o1E0mI44zKZcdx7FtG8Nm0/F45HkYFXBdt5tKtdPp6XSarFbNjY1YoWAWCtPNzVkms4zF5G6azGaxeHxmWRh/wFDccDiMXJZ/lIAgpRTuIH28TSmFcRcZrkAPjPEG3HQYF8R+ptNpDNFZloWGjVgh9OftdtvzvNFoJDUPUcWxUCiUSqVCoYAbwTTNbDY7mUzq9fpvf/vb8/Pz0WgkeysDe1KzdDgcptPpnZ2dd95558aNGw8fPnz69KnrumdnZ/P5vNVqlUqlfD7/wQcf9Hq9TCbz6aefopSlPuq5so/6Iz79KQ0TQgghhBDy3UOBmLxxBNx2+ouoeHKVUrAlFgqFzc3N27dvb25uplIpCJ0oOnd+fu66br1er9friH0slUoQifAmn0gkoKl1Op3RaPTJJ5+02204hTHTHE4uKEeQOOE0FC0gOR7PtZJHk+l06Lp2MgnlK5/PQ0ceDAYXFxf9fh9mYchVhmHA8pnNZnO5XDqdhjKLaFcoULrWJkWQoDvgbOTz+a2tLewtZAgxr0FZhvKFo4AxExXDLMsyDKNQKEDt8jxvMBhAJqjVaqjHBQvnYrEYDoeoUQYFDdIhdnWxWMDsBm3x4uICOQb1er1UKkFE9jwPp71QKKQcZ//wMPnggfK85XI5HA5/+ctfFjqdtbW1d9555/79+4VCIZlMDodDiDuSzvknEiPe8BtBftDt87pXMZvN3r59+7333tvY2Fgul+fn519++eXz588ty7p161a1Wp3NZrVa7fDwcDAYSBYErLJSHTESibiui1aEmAVcMgxj6GZhfYgCbRK/Go/HGHWwbRsDG9CnRBrr9/tKKWxuPB7DOw9tSzYEVylGGqBT459QfjHigjJx0Gq73S5yfiU6WV3GcKPNu64rsm8+n9/c3EQaLNq8Usr3/VardXFxMRqNxKScSqWQTYF5BrgrsRUpXodbCTIlEl1xj2cyma2trbt37965c2d3d7dcLiNMGRUvZcBDb89vSJP+RukBK5NP8N1EIrG2tvbjH//49u3bqOeGrvjo6AgtMBqN5vP5g4OD7e1t27b7/f7Tp0+//PLLwWAg7RzCPdoJ9NOtra1KpWKa5ng8Pj09vbi48H0f6irkVCm6CDs8snHQe2BCBnrsfD6fuQQGdrkWi8UitlxGJJ5CKXWZtR25fPQoLcxE+me90CKiSNAqsAxiKNBy0FRms1kmk3EcJ5PJ4BByuVwmk0H6UDqdns/n7Xbbsqx+v4/GgxYI2Rek02nbtpVSo9EI5zmVSrXbbZwKBEeg5ReLxVwuF4/HYaXvdrue52Gex3vvvffuu+/++3//7x8/ftxqtZ4/f95oNCqVyt27d7e3t9fX19EhnJ6eIu8evYFk6y+10/LHasaUhgkhhBBCCPm+oEBM3iw5LCCB6e+NcDDJPN90On1wcLC3t1epVJAXjEn0yFVsNBpPnjxB9gJqytm2/YMf/CAWizUaDdM0K5VKKpWC3HB0dAT9AoJmLBZDnTrdlphIJLa3tyuVCrKMUZ4oFo/jbVnfScMwNjc3NzY28vk8PoHWORwOIVsMh8PBYFCtVnd2dqB6wNj4OzHisiIcwot1dViXCOXkSCZAt9sV7VhKJ0FEgEAMPQ5v/shBxn+hHYxGo36/j2xKyG3D4RASG4zMUEBgWIaXEx9C8oZ8hjn1vV7v/PwckjeqIaH6XywWWy+V1isV0dkXi8XJyUlzuRwOh8ViEbOnP/jgg0ePHj1//rzVaiFG87qpBnJ99RwJ+ZVotaZpbm9v379//8aNG9Fo9PDw8OHDh8+ePet2u7lcLhKJ9Pt9pCJ0u93RaKQuzblQbyETw5KJLBFYBQ3DwIVG5TeJhNavArQniGtQrxCfXS6X19bWMPyA9cxmM4S09Hq9TqcDszmaNFaOARtx9apQ9TYYIWUTmUwG2x0Oh5DPoLJJAqzSZGLcBYZhOI6ztraWvaz9iCVRwms2m+EOHQwG0+l0OBwOh8N4PG5ZFgJSotEoxE2o1RgpGY/HuVyuWCzGYjEI3CgdOZ/Py+Xy3t4expN6vZ5lWajQiC/qsprSJgQE/PLfbw/8Ogu/ZBy+/BCK5MbGxtra2mQywVSMdrstaRuwwd69e3dnZwcNA0NiCD/BpcEgnwykWZa1ubm5s7ODoaPRaCTSvwjBUPMRoa4uwxwMwxiNRlDzLctCsInMn9ADtX9/RV4OUvjdB688Y+pSH8dR4ECwIZwlGWWRcnaGYUjKBERk7JW0ZITUI/5eAuVlPopYg3H3oflJlhFOCMZ7YILGzBWYl/v9/nQ6hb19a2tra2vr4OCg1+sNBgPUazUMo91ui4S9vr6OC4HIC73F/tHVYUIIIYQQQsj3CAVi8uZKY+HXTryRwhJVrVZv3LiBoOHpdHpxcdHtdpvNZr/fd10X0aKYKl4qlSqVSqVSqVarzWYT8gGMk9CRa7UapqLLVqbTKXQrCXOAPbnVao3HY8wFjicSpWi0EI1G6nV8Mes4+wcH+XS6XC5De5U9x5zixSWRSKRQKGSzWVHrdD+mTAfWTbuiR2ABOVeQP2TqvShNWAZKBOQJy7Ky2SymJ8NKCYlQBOjlcplKpaBrQGKQGFZZBoq5aNmQWnBKYeWDhCG19SCxQRyfTqfT5XJzOpXZ6IlkcrFYYHbz1taW4ziYnP7DH/7QMIyHDx/WajUJvgi0ird1JnJklUQlaqkegZpOp+EHR2XFXq83HA4xPmFZFlS2Xq8HV6MEiUpJOkmHkERpCP2RSATfldQRaU6BcpFQqzF8Ai8wvPMQYcUCDKUYkh8GVHTJDEkUgZBTsevinxDF0M4xMoHbEEtCDcR8f0iEcoPgzkIrlfpgeiE7BH/DKYmTIMNCyESGEI/bAQvoqceiRCOsA8u0Wq1KpQId0HEcz/MQ1aL3Y2pVkM53154lyffl3vU1v72yyB4kyPX19Tt37iC3x3Xdi4uL8/PzVquFcTvTNPf393/84x/fuHFjMpkcHh4+efLk/PwcqRE452iry+XScRzHcVAvdG9vL5/PQwNdW1ubTqfdbnc2m8EvjLBpuL9934dDHFNMcBGlECJcwxiNwF0gN9fvbPLz+VIvhIh04EtJVO+IZNAOnSFUWkzF8H0f5Qoh8kqPjf5wPp8jhh57rjRXcuwS+IjRzjEmJwndkoOMBgxLMrpoUb2VUlJf0fO8eDw+nU6xaTzIms3mxx9/3O12f/jDH/74xz9+5513Pvroo3/8x39EOg0q1OXz+XK5vLOz4zhOoVBYLBb1el02rbfeP65MzIgJQgghhBBCvhcoEJM3SxpTL8+s1yf24q2+WCzeuXNne3vbsizETbquC3saQhLgGo5Go7lcLplMViqVjY2NQqEwm82azeb5+flwOMRb93Q6PTs7Ozs78zwPMpC6tEPiNRs+WUhdsVisXq8vl8tMJrO5uZnL5ZKGkVssSuOxqC2FQuH+/ftmJCJpp3A+okZ8NpsdDofYvVQqVSwWE4kEtANJikSoBWo0SRF5efMXNQrz3OUtGjOOUTtLXuDFcYaqWZCD0+l0qVRCosXvZO54XHItpMaXhCaLcKzP34dYLGoFlEpYzLDD+LrI2UhiLZfL8Xh8FolIrbBoJJKx7f39/Sedju/7T548mUwmg8EAJuJCoWCa5ieffFKr1cJ6gW79uyZ3h2hYkUgknU4Xi8X19fXNzU3DMAaDARq/UiqfzxcKBUxOR9ICpCtdGpaAYGktsNNCaUIqCKy1Ejwa3h98F9poqVSqVqvpdBpz5CWtFW3GMIxsNgunrbg+IZZhSYkwxs7gLvA8D4Iy1mCapm3bmIyPOpOO4yDDIZVKYawF0wUglOMe0dU3iL/SjHFKMYABYzUOE9MIlFIScYBlcFpktbivYfBUSsGeD1W0Xq/DrYloC9wO/X4fKc96X4edCcR3fF+t6xuVzpPuRTqZzc3NarWKLGzc9RcXF6enp+12W+JE1tbW3n333Y2NjWazeXh4+Nvf/vb09NR1XUQiYAcQim0YBtzoSN3N5/Ponw3D2NjYgBbc7XbRT/b7ffhbkd6O4IhkMommgrEQNHgUeUPmr2S1S4e5mM+Xs5lu5Y5Fo/F4PHLZKyptpETOwGw2Q1JwPB4fDAadTqff72OYDaMaukCM0T5or81mE1Z0GbTAkJvIxIZhYFoG2jP6YQy0oCVjbRgUkeQH/TpCs57P54PBAA8yeSS9ePECiUB/+7d/u7OzgyXxPG21Wq7rZjKZ8Xi8v7+/ubmZTqcxXOS6rgyTUMwlhBBCCCHkbYICMfn+EQlY1ylENMH7p1SiOzg4uHnzZj6fh2USiYqo3g75FRpuuVwuFosofZbJZJ4+fXp0dPT8+XO8LUNjHY1GEIsDAhz0VnjTUCx+NBpdXFxMJhNY5HZ3d23bjsVi9myaObblddyy7e3t7eh0qpRCXiqCSl3XRbkwGN+gU1iWBV0AQRDQlBH4i7RHvPZjbzEfGTXisPOYT41kADjOHMfB5/D2Xk4EXkajEdQ1QjhsPp/PZrPpdBqS8Xw+Hw6HsO9BfQg4VfXLJNoipkWLiw0WUVw7fBGFxeTE/vf//t93d3dv3bpVqFR0L55t2z/72c/K3e7JycmTJ0+ePXt269atH/3oRx988AG0oWg0+o//+I+oNyhJuG834RQR3UEMOX5nZ+fOnTtra2vr6+uox4g2Ay0MmcII6FBKQUuCGptKpTA2IEMOEFthgcRJlvnp6tK6KxkIuiqEzSWTyVKptLOzU61WIT+hlUqSuJh/M5mMuNGTyaRt25lMxjRNWTlGKRBJ0W63ET6AKpSO40BhhE8ZKm2lUrFtOxKJwBqP8ArcqogVRnCE7k2WJoSIWAHiMiS2fr8PEyh6Brk9ITtCScflGI/H3W4XYiXmMUB/bLfbT58+9TxvfX0dZTAdx8EXB4NBWHP/HlS2UGbIt+i05ZTG4/FKpfKTn/xkf3/fsqzFYnF0dHRycoIya0op1OG8d+/e1taWUur58+cPHjw4Pz9vNpuu60pkDYIgtra21tbW0KGhm8Xn6DAhU2Lrw+Gw0+n4vo/RuOl0iqR40zTRWaXT6Vwuh5sC1w6rRWuJXwYESc+/fDkTGluBQCzHK+VGJW8BhezQPyOfZDAYxOPxbDYLB3Gg/8T0kWq12u/34/F4t9tFe5Z0FHE3JxIJ3/dt204kEshjwdAmPMVSJU9mn4R7Eoz34IkA9RzjN0opDHj8+te/HgwG+/v7BwcH77//vuM4jx8//uqrr/r9fr/fR4JzuVy2bfvGjRvz+bzZbEIBl6fMH712KBVnQgghhBBCvhcoEJPvjXAKJxBLoyhH8Xi8WCz+4Ac/qFarW1tbyWQSUkuv18OL+ng8brfb7XYbopVS6vbt23/3d3+XyWSOjo5++ctf/uf//J89z8MLvOd5mP0NoQE2XtFVIQk5jrO7u+s4DuSqTqfTbDbv3Llz48aNtbU1fCUSUbGoimozxyORSCwajScSKEYEfRM2TLyco5KSmNqkghYkMGQ1IPAX+hQyT13XjUajlmUppXB0s9lsPB7DsSv1iyBkQ2uA9meaRso0LctIpRKZjO04WcMwcrkcVDZEQPR6PckZ8H0fYrFcAsgWMDibpomidiiIB/UNlwlGNjg9o9EolGsoGlAiUFUsmUxWNjdjl1ZBfOXW7dsH2eyXX3759OlTyGqwx25sbNy9e3c0GtVqtWfPnumSxFusI+gm+rDygquwubn5gx/84P79+6giOBwOEVqKGO6LiwtUWcQQAvQmWMUhw2HkA/5xZLAMh0M0Od3iKhIq5CqllJQlxFgCmlwul4Oih4aBOfu6VRlqFJRfrNayLLg4y+Wy5K6g3eI27Ha70BahfyG/AlW8pPwdWm+1WsUnMnaCnFnTNBGoKqMsaKjYJeRUSI4KREBIaRiPgXkZSi6EY2xFXMZiukebhAbX6/VyudzOzs7W1tb5+fmTJ0+63e4PfvCDcrm8u7sLA/XTp09RBlDkxYAu9keX215ThvumAcSSE427vlqt3rt3b3t7ezKZnJycwDsM2TSbzZbL5ffff/+f/JN/kkgkPvroo48++qjRaCD02XXdWCyG2oaZTKZSqdy/f79UKklONIbHbNtGdwp51Pf9dDodj8fH4zFkVjiCMS/E931cLMj6EpKObAeMjWH9Ygf+3XhkNBqJRiMvH2k0Go1oYbtYD/pMiR7GeJgUS5QmLS57fW3ozHO5XKFQwPKDwUBvABL4jnE43InqMncFqEtrvGxFyjmql+V7uVKYkoKxkEgkgqgN13X/4R/+4aOPPvpn/+yf/e3f/u3f/M3fpFKpk5MTCPf9fr9Wq81mM4j1mLiD9HBJh6eJmJA/BFMpR6kUTwT5s8JXaqDUSC/r+rK4YCtlKxW/YgFC3iiWl03aZ4slhAIxeaMUMT3nVAyMsKfdvHnz4OAAqRGYz+u6bqPRaLfbsLJKDuba2trGxkY2m/3000993z8/P3/+/LlMn5f/6lkNeMeGoADZy3EcTP6VCkuO42xvbxcKBQhe0WjUSCZSMZVM/v4mikajiWTSUAq2R5gK9bhV/TDxq98ry5dVthCdKaGcy+USsi90Byh6sPoCPVYCnrLpdLpc/m46c9axS4VCvpB3sk7GduDFs20bWcNQhH3fh92y1Wp1Oh2IKdg0tEXEJUMNRLDyeDyu1Wq1Wk1XZJBuKWo4FDEIcLB2Pnv2zJ/PncPDvcnElAagFBSTjY0NzKQ+Ozt79uzZZDLZ2NgoFov37t2bz+fQiMXhd92SJdBcJVkVISG4EMghFTUW9RUjkQhiIuLxODyD0FXxAxKoE4kERiNQOBFz4QO2cRFV8U8oU/p8eSjOUHLVpf9RdgbR2GixuAdhJYY0jGwHGZjB/Yi2Lfm/4p6WDgHjRogRh7NebPVYEp5TZLbgk9llboAobhCU5R5EJ4DPJR9DcjnwLXyIwRIovCI947tKKVTMy+fzjUYDo0HQ1KBvlkqli4sLyMphoTZQk/OP2Luq11jb124xIDjiQ4R+rK2t3blzB1HjkBS73S6SE5AucvPmzf39/Xa7fXJy8uWXXzabTeRiRyIRZLVXq9VqtVooFBDFk0wal2b0BJpZKpWGpJtIJMVCjqG+VquF3Pn5fG7bdrFYhDsYI2pIYIffdjabwYksISdKK3/6u6al5edI7xR9+fxACIa2KwZhdJsIf8DEDllGt96jFcXjcajh+rCEGPOxPxJGLyozbkY9BBkDGNgQQsPlSYej+P1xXd6//X5fsi+gEWPA9fnz51999dUPf/jDO3fu1Ov1Bw8eoDeu1+uu6+ZyufX19XK5jEcwirvqx6W+lRH+D2zzUaUSSqWVivKNjrzxTJXylZqGPv9Qqf+TUn+hVIzNmPxZvLUpNVXqgVL/s1J/r9Rs1QJlpf6PSv3vlCoqNecpI298kx4r9Wul/p9K/bdVTZoQCsSEfHfKV+D9MKD9xePxUqmE0GEUPsJ7abPZ9DxvNBr1ej1URUNZrWQyCaPTfD4/Ojr6+OOPEU2A92e8iot3Dy/qEKfgvoSpFlGV8/m83W7PZrN2uz0cDi3LunHjxsbGBmySiUQ8Hjf8cfa8kfkw+vT3t1MsZlmWFY/DIAkXsLyx68eO+eZ4wRZ7o6R5ouAbrIuQwqG8+L4PCVtyIeAjlmnXEL9isdh8vjQMlbJyk8SPX3Tfn8biBzdGWxuRxTLtOLZlWTBBYzY9/NfPnz+v1WrQbhC9iszQYrG4trbmOA70RAgrk8kEDr5ms4mrAHldLiKUHcMwIBkjZ+Pw8PDk4uLuYPBPL+sBRiIRdzh0p9N4PP6Tn/xkc3MTRas+/fRTSNXr6+t//dd/nclkJpMJVOOXZ4G/jX+phDykos1ZloUag7r1O5lMIuIA0s94PEZwCub+ixFY1CUEkop8HIvF4H6FoieiEoRRyWkNC9Z6iLBIqBBDYTqGlgqhFoIXhFTHcSAzQbzTjxGq63g8htCGm1RKOMohYNP4la6XiQoshemgTaMT0FO2dVkZ944o1HpirGhwo9EIa5Ovi2FTivVBNxwMBo7joASZ53lHR0dIwzBNs1KpDAaDer1+dnbW7/f1KOQ/lzapN4NkMrmzs7O/v7+1tbWxsYHestFoHB4eNpvN6XTqOM7GxsbBwcHe3l6n08EUAVQExSwHtJZcLre3t7e5uZnNZiEo27adTCSThmEYyVgsdlnSUi0Wi2Qykc3mDMPEZIVcLlev109OTur1uu/7Z2dnmUwGzca2bdwCOM+w28M8jjYp6rDIqQmlIsnkS5NC0OouWy+QJqqnsuA+wod4xMw0JIFH0u0dx1lbW1NKQdiVsqjYkNwvMqtDXZYBFCs9Dg29K54FGO2T6G0cFw4ZK8ceIncFgz2ZTKZarfq+32q1fvGLX7iuu729/bOf/ezWrVvPnz//5JNPTk9Po9Go4zhKqYODg0KhYBgGlOhOp6OPGH27xvyHGJAtpe4r9S+UsqmskTdbfVgq9VSp/6rUw9Bv/zdK/R+UWlNq8cfoqbE5+Tn8Z7eSm0XuO/1b4W9cHoJalVK/DKxTvTweGVjzql16/eT75RUvElf99qXtylPk2239ioD+yOvs57fr377FufomVQT+wJc3tVjcXS6/UuofrhCIN5X6n5T6AO873+Qqk9e/ryOvc7Nc0fyWr3dRlvqGwpt+OYXw912BNtPz2+ze1ce4fM32+fr3xeXCUaW2lXqq1McUiAmhQEzeEPUhHC8bi8Uymcy7776LeMRcLjcYDJrN5uPHj+v1OsJJIUp2Oh3ovJZlJZPJwWBwdnY2HA4hQ0DHlMwEvXgaNm1ZFhyy4gEcjUYw7ULcTKfT1Wp1b28PAmg0GrVtyzCt7unWo0cbP519vLx8ehtmLJdLW/F0Pl8wjOTR0VG/30depEToyg4Mh0OZpS6pmtFLstmsKMimaUINH41GmDStlIKCBgEaOoW6dKhFo1GlFqlkMpLYO5v+i5POXzUH3gfvPdisthJmajaz4vGEUgohzlhDrVZ7+PBhp9NxXRdHjTBQxD3ncjlMyYc9U2Qy7Dn0a+gOUG0kuxMiIFKVkfi8iEabk8l8NhOZaez7Xc+zbfv+/fsHBwexWOznP//5w4cPB4NBJBIpFot3796Nx+O1Wq3f7zebTb0639t3IwRqTOmZv8lkcm9vb3t7G2HWx8fHCGSAbKSUQsXFWq2Gqf1wCEIn0o2xvu/X63WJUEDaCc4qonIlsVSKZYkoL8vDqgyBD/ELSK6oVCrlchnz/SEToyVgGX3sR+RgmSOPjUriNibUI3M5k8lABMeBYBxFjgtHipQMaN8iEIv32fd9ZBGgfUqoN+r44Q6FGAdTPCRFDBdhkAb2bRyaCNMyyx57OxwOj4+Po9EohoiQSPv06VPXdXd3d3d2dgqFQqPR+Oyzzx4+fAhzvRRJWzkk8Ae/x/0x75RAbjJyad95551isYg7tFarQa7t9/uGYcD+f/v27cVi8fHHH3/++eetVgvlB9GvptPpfD5fLBar1WqpVDbNpGUlq1U762QlI3uxXE7H0+lsGlHLSDySNmO5bGo6S/R6sUhEpVJpjJklEolWqzUajU5PTyGeFgoFvcInRhSwJJqlaL4yGBCNxaKGEXs5ZSJ62aOJ2guZFaruTCtqBzu89Ocyz0MfnFCXlegwIQNDfd1uV8r04bmDZjkajTqdTq/XgzMdpwsTCPCwg0CMjWLQNFBBLplMZrNZzPyIx+O+77uuOxgM4OBGV5/P523brtVqz58/r9frt27d+ru/+7uf/vSnlUrl+Pj40aNHeEhlMhmow7lcbn9/v9/vo8H7vh/otb6bJhpRalup/7NS/5NSJv+K+v+z9ydPkt3nliD23Xt9nmf3GDIyMhNAYiCIJN8rvqEGJtVmkqy6JQI7mcmsi1z1ksRfQONCG21AbrSQZEbSZFppQajNuiWZWvXwyqq6ql+/ekxOADHlEBmjz/Ps92pxwg+++F13z8jEQAKMa2lpkZE+3OE3fN/5znfO1fEnfzwW+ekqgPi2SELkUOSXIs2L8cBlID9vuf6wwSiRSMTi8Ug4HAgEZBlYishsNhuPRtjj+sv4E4X8WCwWjUSCoZC9/EbX81B2WiwWkUgknUolUylsf5y5WENGw+FgOOz3eqPxeDqZnFsoizi2HQyFYrFYJByG8FpouYXbtn1+YpYVCAZZi9WzG2o/nsjCdRfzubf0EsV3u8tvp5rWZDJZzOcLFHdRJ0YbUzjsLPtFbNsOIDJZFrbxxaJEz2wG4pbF4jSeBc7KcZyAKlrLcvUDhu65LhbM6Ww2m8+9xcLzPNfzsNnMsRG4Lt7l2DaxP1TjcaNQnD9/rLZtO07Qcezl7x32uCy/Gr8/J4ioDhgDWWOvoRl34pOW9/zJR7Uq/8P/kPrgg9x6kDElclukL/JvRe5dTf51GOiTtj/bcYLBYDgUOreAjscxfWzLCoVC4UiEofV8Pp8tJ6wsBakm0+lkOp1Np+dTw9A08zxOQw5yWRbOXbWwRMLhcCQSDoUQ+gZDocTyQMWdjKvRaATf+G6n0+v1hqPRZDKZz2beEjv2XHfhuvP5/Dz6RwvvYuF6nizpIOftY8twXccJ6KtaLNuqdIpEBbDFYuG5rsdlBLcaxBflNvyJEJjnhTzvfzeZxDyvKGJfDc6r4+q4Aoivjj8dgJh/Q5Iyl8vt7Ox8/etfL5fL4XC4VqsdHBzU63XYTyFMQpI8GAxEBCQpyPIi+wWmqQUoRCQUCpGyhAZnOGWBq0W8FVusZVnFYjGXyxWLxWg0Cp5vJBJJJOKRSCwUj9TdxMNa6rym6Ym7CAecTCIRCAZtcGaBnAJTQAhL/Gs6naJFOhQKUTWYOzdUGkB8nk6nYA1Xq9XBYIC+YKIVQAkRkhJui0TtUKg0dF+sBZ4f7YebDfnNx5WtknNzf+4ELcSuvV4fF9vpdKrVaqvVgmowDPrK5fK1a9dg9AdcjHqX2FlhzYRbjXOmMCUyAcKLVKucz+eubTOf8UTguTSxLACUgUCgUqk8//zzkGoF2JTP58Ph8AsvvDAajX7/+9+jtVl81LOvgBSmHyCWpQwrCN2galqW1W636/U6sKfzQHAyabfbxJIwSDCoAKFCZhcwKLAtEQFYRv0E+lnRMkvTmUmExOfD7w7RIbQmUGspFov4akPXgjRbEucp4UrmLzBZgIZAr8CPBjoMdI8MZXwpO+U9zwOrGpeDr4PMBf7Z7/cxknkJ0ATA3JlMJv1+v9Pp9Ho9aDcjAyRpFJdvWRbkj/GNhLZxf1AHarfbUJhNJBLHx8cQhoZ/WqlUAnDcaDSq1SoFCjQu/DnBuytX3cujeIZrYigUyuVyuVwOQjqdTgfSw61WCwA9BgOKGUdHR6enpyCuiqKE4wQCgUAw6AUCI8tyh8PQ0VG0UQ9YDuRBZgvXnc/mC9d1HDsIDZBA2JaF5Tj53DQec8NhC8z0dDrd7XZEzkn09Nv096aY0sOWda44YVlOOOw4zgW8wLbF8zBIIH+MoYLFHFcEuQxSjLlCklDsLQ86QxLNyWazqVSKk240GqGeASSX9R4AylDhgC4HedCG5AX57xCfyeVyGHXoGkEVBGsFfiaMjqrho0eP/uEf/gGw/vb29vXr1/v9PppaMGLz+XwwGNze3nZdt1arnZ2dacmUpxLR9pS48zOM4aTINZGQyP8scrzElS6k3xe/TNbwj56Wl/dETtOzgeXeJT7h2VeEJ97hVSQ1y3gB59GlmZje05zhJkj0It11balhOZIsfvsa6ugzFCQ+IaI+zaP0RIKed0ckKbK16sVzEU/kQOT/LPJ7fY2bAWKejG2L64pl2Y6TjMWubW2Vt7aKxWI2nQ5HIkBYsL8PBoNms1mtVmu1GoLJ6WwWDARSqRQ6k86dk13XE0HtqtfrzWazXC537dq17e3tTCaDSpslsnDd8WjU7febjUa9Vjs5PYUaGyJSz3WBIsGjNRqNRiKRRDweTyRisVjAcQDcBAOBcCSCzd2iffFy+QIeNJ/Pp5PJAlpqy4cM5Xeo2Pd6PZhqTtg/4ThA1mKxGBpTHMcB4Iu4BQYMAZgloMtqicexHQoxxie+u0vIOIyAIxwOBoMBlIqXGKtY1sJ1Z7PZcDA4D49nM3e5HWDvQMyGC3QCAcDT53X0UCgaiURjsXAoZC+bpQLBYCgUii6hQHypqL0YJ4wOPysUsizLXjUgPZHFsmPGHwwAqnYuzmVv5Rz3PHn3XXn8WD74wNs4BRYiHZH/p8j/fZWyyp8RCqwXMf5G/9eaVcVynHA0GovH06lUoVjc3dkpFIuJeBwRVCQaRcssjBZGo1Gv3+91u4hMFovFZDweLDtQEei6nmdxmbUsUQCrDvA+QYctKxQMxhOJbDabzWTQSGrbdiwaLZbLpWIxl8/HlxUgrDCNRuPs7Oz05OT45OT09BSWtqPRaLHME+con0yns+l0Opudx9aLhbtYyJJXdG6UEgo5gYAsMeVPwrbFYkYTCKDAWBNcdz6fz+bzOSr3i4UQ+EYstyztsJDDiC3ruv9yPt+fz92rbqSr4+q4Aoivjj8iECbKSEejFTCeun379v7+/tbWVrFYdBzn9PT03Xffff/994FggiIBSpTneYlEAtDDbDbr9/tIVoFPUdWUXwfgkkFzKpWKxWJAh1H21BBnOp2+detWqVRCQBmLxaBikcumQqFQYh7t74QeH8a9ZeDUbGX6w939re5kMq43ejDaYiDb6/XG47HjOJFIJJlMWpY1Go2AWJHLyfuAb0fYB8gsGAzW6/WTkxPP86DrqgWUiWHNZjPX9UqFVDL+wmP7693Kjvd1u/W7yL+7v9uupv/2641v/vWR5fX6/VG/P2y327Va7fDw8NGjR51OB2xNeI6VSqVyuYzYOplMxmIxQGyDwQDf0mq1Tk5O6vX6ZDIBuEBsjoAgNXARHE+n05nnzZjKuW6v1/vwww9btu26brFYLBaL6XQa9mutVqvRaPzud79zHGdra+uVV15Bn/5kMqnValoW4CuDDq/7PYYHYFNYEQ4Gg6OjI9QVptMpNFiB7UL2V2vm6tECmqFt25hBILoGl7Fdq9UCZINBhTlFwizFVUkKDi0JBdr/jbrAJA5D3Vi/l4x+dg9ogRTkqyAHQfWFvflQqABzGWx6nB7QbQhukI4EfBly2DgBgoZ8F5RniJq1221Q+2XZ7I+f+SG4jRjkuP/UBMAnA4IHYEc+MuRck8nk9evXY7HY9vZ2pVLpdDqA5wxSz6fhY34BlTzqkl+/fj2dTs/n83q9fnp6+uGHH6I+4XleNpstlUrJZLLb7Z6dnd2/f//x48fopaCcDkpfyJZH40CvH1q48ZPjraPHz7lWQCxxrYUrriuu67meJY7jBJxAMBAMuqFo2L1xc/DS7Xg83g8ER8lErlwu9/u9drvTbrfxFboawQF2Tl5TWRDhUcdxLMcJRaPOknXONXk6mYxGo16v12w2sYxD8AfoNsWLKOGCagGI5/F4HEgxqT04AUxSFN76/T4MVNFs0e/3m81mq9XCP0Ukn8+jYlqpVIC5gFNPtWLwjkkfJl6Qy+W2trZ2dnaweeG2o5iEBRaC0ehTwcnXarV/9+/+3QcffFCpVOANe3p6ihaQ4+PjRqNRLBbL5XKlUkkmk/l8HhURXN0zVDg+/bo9F/k/Wdb/R8Qj94czSBOmDMTwEmvv2v/1p/1PwpRXI57rPueJb99w09YIC3iXi8nMS774m0/u3uUv+amer3/pWz5Hb4nzWhsu0PNQ9vnkZIgXX46N++SbpD55033VkuUiecv6P3jev9h4KywfyG4ZFRd98y9ad+Bzbcty4JNsWQGwAi0L3Q/nIt2u6y0W7nzuzuceWHsARBYLLLTufO4tV7DFfL6Yz8V1A7YdJMoC9qvniWV5oOktFh54A4sF/suCmDJOZvnHFrE8z1pegqWu1/I8G5xfNYoc2wYTFv01tmW5lmXrJ2hZAdsOOk4oEAg6TsBxApY1tyzBu0Qsz8MVLWYz13HQM2gFg+5iweu1wNLFiS13BU/Enc8tEdey3Pncs20XvFrX9eBqEAh4uA+u6+HrlkxM8Tzb82zAcLxM/NPzcM/P7xL/4ARs23Jd/BMP0XEc0IqDjhMOBCKhEATjAV1bF6U/HNt28Kw3VKc8j8/IrEXZtidiEzd8YqELY+DPANi1NFB+yUu+WGnz1iyY55+8vubkOE4oGs2k0+l0OpvLFQqFUqGQy+fP6ysigWAwHAyK503G4+l4PBgM+r1er9ebTiZgrE9nszFI/bPZ+bD3PFEKcrJs45uzyWk5aG3HCYZC0XA4k8nk8vlioYDiNDK7cDicSqVikchiOu1MJo3ZzBOBvXO90Tg7Pa1Wq81ms9vtjgaDyWg0Gg4XS1Pf8yx1sXA9z7GsQCgUhtYcNLjgXxIKBR3H8jx3STKeY+gu6/0awuYeYXmebVkBy7Js23IcfB9mtOd5YtveYuFe5PvblhUMhcSyQq5r9/tX0PDVcXVcAcRXxx8NYliXQwIDSqVSd+7c+da3vlUul+fz+f3791ut1uHh4ccff3x8fBwIBIrFYqVS2d3dRUd5vV7nlkNzHuqB6jZw/ADvOGyNoLkhMYa48Gg0gtpjKBQqFAqVSmVrawv0rmAwmMlkEolELBaPRUKOYwfzQXnZnh/Y8r6IJ55Y7W6i08+4XrPVqp2etoAKnZd2ez1wMYLBIClgPFXKU9JWy/M8eH/Ztg3kd3t7++zsrNPp1Go1KC+LagUiTgq68e7OdjZ3szsvyI4lL8t8blVPIv/wnjMbjXdu1gLS6PXn4/H87OzsD3/4w/Hxcb1eF5FYLHbjxo0XXnghn88nEolsNlsoFED9gGUfNJ2BfRweHh4fH0PKFkRL27afe+45YPqdTufk5GQ8HgPgg3UeYgtvPGYpeDgc/v73vz+dzUKh0EsvvQRwMxaLvfzyy81m88MPP3zw4AFe9tJLLz333HPD4RAK1EDejVH0FYCJtZqnPoDdo+bhLfmMQCqpiIpxi4MTTavrYo4A7kTBI51OU9Uan0ZOIqW66WUXDAYhTBHU7Zk2W/At/2/4UURaCTfrpYD6wgBhAZzF4/FPqJ1qiaAXX5zddktuu78fTZt08cR4ksTywCBG/wGWEfasydJSDIgw1gd+F5FofUXz+RyaxaPRCGgd6PatVqtUKp1zqRKJaDSKr9vw3D8TSPeJwNxlvML4e4jP7OzsbG9vO47T7XZbrdbp6Sno25Ag2NraymQy0+n0/fffh4lcp9PBgoynvNT0GPX73VYr1h/nZvLaeJKpnuXrh0VXbLHFC7pewBNLvIAnAbEsyxbbFktmdiggpYfp372XSUcmf/u3jb29aDaX6PVG/f4AdBXorhCuBQrMwpUoiSHVT2w5tu2o8YZUSiyLjZMQbUe5C08WhRNkWeSt45nq3ufRaITiFlRTONRxV8vlMqYbKHtQqe71emjuzufzaGSBIjymLXYHUKeBbnMSUXQlGo2m02loOlOzGFXSSCSSzWbRGfPxxx93u93pdBqNRlFtrdVq9Xr98ePHL7zwQi6Xy2azHNVg6s3n8xs3bhSLRcDfZ2dnkAC65Nj7jNdMkbpI1bIWmgB7Eci7kKs/Jd5q+fP/S5C/LgvdPtuLASusQ2lXItqu++SvW0m71hgxkMFnglqeBSC2LMtPY1z1gd7yhnjGN2qk+9OtrpbxIeDfPWk44aeA542e2Euu8DhLQcbWxaEuS/FQS127i0DX8xwR/Dn/2fMs7E0AUFzXcl2bP+APAE3XxR8REQBJrmstFvDNcyzL8Tx7+a7zhpLlP63l5zjLP+CrOhf/4Iscz3Nc13EccV3btu3lKeGPLPdB23WdJfbqeh5O1XVdW91GRyRgWfg7QIiZt87zzs95sZD53ELUwRNeXvX5FzFgWD4IC7JvjmPhEzDyXVcCAVks8EvLcazFgs4N509teSdt9V3e8pfWYnF+AxGQLBXnbHzC8unYOHPch+VjxcU6S56vHpnnT3CxsGxbFL/4wpj0PFksxM8g5mJi24DXn6zZeulFz/pyqg9bxmqzvvtk3XvNPNf/yYyrVLDKTRPsilQqVSoW8/k8KsSlJRkfOm/nr59OJ9MpIgdQ6RGlY8uGfe1iOpXFgkULRyRo2+c9hZ7niYDkbqFqgt6jZXtTpVwulkq5XA5sKrDXz304ZrPesqSNCHw4HKKpCOY9IHmMh8PZePwJQLxkNZEUcp4viFjLxNy2bZrILxnGC02k0Mbv550HAIgxvJelDpeUec87F51YpkVMbSKRiB0IJDwv2G5bs5l4Vyjx1XF1XAHEV8cfAx32IzjkzCaTyWvXrr366qvXr18XkcPDw1//+tfHx8eg9aFHu1KpoBtOREAZbrfb6EbnzgEiFRiCBLyA6SBzJhwGeizogch1sQ+Fw+FyuVwul2OxGD42Eokg03YcxxLPEsuOW9ZNke1P9vvhLHhSD1XPRs1Gs9vtgTIJRiGYm6A04hyw3VLplVAFyZXouE8kEuAhhkKhnZ0dEEWPj4+p26A9tXBPstlEpbyVzZcfTmNW2ZJtkYYstqVbcx6OQ0fHo0y0NZlao8ni5OTk4cOHjUYD6HA+n7958+bu7i4Y08DiIawJXWYoTrqu2+l0zs7Oer0eUBLc3nQ6/fWvf/3GjRue5x0cHAyHQzwa8kbPG9nGYw4J0A/PxuNYLIbLBM6SSCRKpVK3263Vah999JHjOPl8HtqXL7300sHBAdAKAnlfPCrx2c6LdSUTXA7a5yuVymKxgBS1ZVmlUgkgFB4fAkoYLeL3fDv8r0ByjEajOzs7W1tbAJgoTAwkKxQKAWhm6BaPx7WsMDQZAJBBY4G1DQo7gLyPHwC8shDCsIwIHaj6KIdEIpFgMDifz9EZCmFlx3EALuNdsvT+4nzXJnWA56gDi774Xq8HZRiI3uI8cZxTpRYLyG5obRlSsOPxeCaT2d3djUajnucNBoOzszPw6LFqkb+MOWhZ1mAwePToESBsCJeD931wcABZ7WQyub+/P5/Pa7Ua6j262qHB/S9gMD8VKg155b29vb29vVQqBRVa0EvRGJhIJMA8tW375OTk6Oio1+uhwRZPBJg+Fq7ZbNbvdy0r2BhlGu1XZ9PMXBygw5+gJgGREPzjlplWUMSTs6PQB7+Lh6ZuKm3v35iVilYwFA6Ho+hXgIQ95bMx8DhECf3jnwEldacLF5YIJYw5KjBKUV2gAyfSGC5HGFeYcSD2QrwILcZUisc5YGeBWSg+FostKjHZbHZ7exuU4UwmA+Iw6MA4eUqsUHcFGweKbaDw84brqYoajIj0+33MaxRCILg0GAzQqHHr1i18FxxHId+RSCQKhQIc865fvx4KhcDBRw3gC+a/WyJhy3IuJuEcLN4qQPmpPtza+JuVX7GSpOwXplg3uy+DqnjrpS1Wvtd94mWuqRJ98plLPRC/jOlTidVsWHxs275wJhcLdVwS1t0Q9+JtMa7C+izCV3MgrVqivYtD8Xyp+WIDCd2cZ/TqGYUxVnONovLmrWGdes8lNxTDoXrlaeuTX7mqfNI5rmxpDdUm8g3xSt11Z4yrlWGYp47zeeS62rCUyngroxF9S9ddhXECrKHq3iwtQLd5fF6yVWDzwP7K5JtPuzp9VkHUurHqnwU8N2qy0cYWm+zu7i7Kw6lUKpVKYUNnHRqWOb1eDzbmLGCzOU+LxSFS1ZwJHeprE+ZoNApz8kqlUqlU4CnNzkJ8LNTYOp1Oq9VCMRsAcaPRQEwLoTYG/6TYO0pVknLA5xVcxRHWTOGV6LDh2KEnu9bN0K8nUwTSc3A3SSaToXA45nnhkxMZja6Amqvj6rgCiK+OPxr+5RlK+SKhUOjmzZsvvPDCzZs3y+Xy6enp8fHxwcHBRx991G63+b/hcLjf79dqtdPTU+S0oD7RSl5EACchAcaWpr+30+mAohiLxSCxn81mkW+jyRfJeSgUAsUP5w8qFriW8/kcEvnzxEJuiFQ+yTw6I/t/uheKThbZ9GCxOPeOg3jFcDiEMhQwXyCwqAYj52fPO7Y3xu6AD0CXzmQyt27dAiHx5OTE4C3ibyCA21s7kUQmNA1bBZGySFNkX7yBVe+k/uEPey8UDkOBR53O8ODgADekUChsb28XCoVyuQxNzEwmk06nLcuC8Re8vyDBORwOq9UqJCkIycXj8ZdffvnatWvpdNp13WvXrnmeV61WoUJFlrEsu7aRR6G7H6Xsw8PD6XQKnbvT01PHcXK53Pb29gcffPDgwYNcLheNRguFwksvvfT48eNQKPTo0SP6I31lGMT+NA/QDHr2oSYxGo0cx9ne3g4Gg9ASBX0bYwl6DsDlgcYCCQU8VywW9/b2SqUSBRZ0eEqYDF8aj8cLhQKkqMHshowpokD02lNTjzonQgqAQjmZTRGVE6UDw9ANWiUa/AXQhkuGPSMp88iddK7LHn9gdohNEacSQePMwklSGWM+n8diseFwSLQXaGYymdzZ2dnd3YVSB9B5sGLH4zG/FIIJiHo58QENu64LMG4wGDx8+LDX6z3//POlUsmyrGQyCTBOp9l/UtmaMRoDgUAmk4EUjG3bWIohjA6SdSQSiUQiGB4QSUCRDEsfkhCuyfPZfDCYz+ZWzx6MQ84iGBRHJLgkcYWX0HBYJCziKE6dJ25PRgFr3HH+3W/TW9fH3/4b79rOuNWODgbx2WwWCDiwT8EY4IDU6sM6FceJWcp+EOMzHo/n8/mAZTmOA7kSFCem02mtVsOqSEESbjQAiLFyRqNRSI6AfhuJRLjy866mUqlisQisFkU4DCSseLjbpAODfs4+GLJgAAejjMFOAthUYi6g7oK9hsLl6XS6XC67rgspYZRnkskkqjvT6fT4+BiVFSzsmO/T6fT09HQ6naJeGwwGKcFx+XHlXVF1vqh6z8pbvRId2/BQnohtXWbt2gwQf05Y1To48iv59FceNFPVWDxbGbg86kjSwFb8ATwx1sVCi3l6xicYMb/xs/5BnwA1iBFhIoYhf0JfBVZvgGugffD0ZKnPrvvzZssDSz1ery3yNDjFkIb3R0fdxLl45ka3Ez6cQkCA4fAbP+DL/Si4PHTLlG4TMd5roPyb67srkbXNQPyXdA28TF/U0xa0nlg68tYrz6yriJAyDFYE4nDswqVSCTss9n2QJBBvIMqFjBW80MHkRZnWYJkY1XHW+fAzwoZkMoloAWQpKFNtbW1ls1nY2wIRBvdiMpk0Go1GowHRLXCWEfO0Wq12uw1OMd1ozuOriwEYCy3aEM+4gRtGo7/G47et40zULAFSGVB0z2QywXA4tliEQqGr+OHquDquAOKr4wsNWDfsvsBu9vb2/vZv//bFF19MpVJnZ2e/+93vHj582O12Q6HQ/v5+pVK5du1auVwejUaNRgOsNC793G9o3sqYiW3gBL9gpAYCb3Z5QO3Btu1isYhWaKqpopkdGwm4mbZteXPbcWzHchaLC5c287xqe3h61nas7mQ2brU6dKKHeAVY0tBywg8gYWH7p3M9FCEZDsIZoN1uo4AcCoVgKzefz8FSRHUXFxiPx1966eX9/f25lY/1YpK0JCWyI3JD3LHVO4z+48GL9eN6OtAYD09arWY0Gsnl8jdu7N+8eTOVSiEsgPzxdDqt1+vI/Cml2m634R03GAwYh6XT6Z2dnVdffbVQKOBCQqEQtFYPDg4ePXrUaDQAfCwsC87aePxQxZ1Fo57nnZyc4Ebt7u7C9AkCmuAnfvTRR9Pp9Otf/3qlUrl7926lUhmNRkdHR0ba82ksj/5Yhz+n0n9jgsAOrtvtttvt4XAIvAYxH/MNJBUAiJFKkQkLeWhiTEBakc7pFnvmRYgR0+l0NptNp9OooMA4AjLHeDsd3gCJIu9iBsXZx0Bw5bKA6M3IMHXkR3GMCzwy20a6xdDQUp7jvKUAwpg06rdrXWMM2kQiAYswhs7gUEODG9+F0Y5rB9saoDNKHUhQ+b2g2wMZR3mp2+1aljUcDtPpdD6fXywWZ2dnjuOA8b2uivYph9blEboNiQ1ETsBkz2QyItJsNh88eIDz397e3t3dhWFdo9FA5YkDDO0OVLImxcP1XHe6mM+H09TQyy7OWXb2EgWOikRFgiIRkdgSOAaCLCJjkYJ4HXm3H/vv/6noRIN/+WI/Hp9HozPXXViWDYSUxTZSwnlvwbRlzQD6d0G4BuFEHCeZTG5vb2eSSdQO8Yhh9ZZOpxuNRr1eh4kc0zZeNXxKKSQymUy0Cke5XIZ4kW3bmMvhcBgrJxjrGJapVIoTELrb2JI4GrGnLBYLAPeYv8AU8FFAhJF/5vP5VCqFswX1G1+BjRXaEbB7hTQ/8sBut1sulzOZDJKrfr+PCiUe8fPPP5/NZvf29lAy0TT8davx541B+BGoZ0YKNmOLT/VpnyFMuXl9eCIcvDLZNjT9/RASYamVZEb/znWZJ76Zf0rum7tZH+OzAHqe7dE88WPJsH2GUfe0A0YXSjWYSIhEw6DYLrHXB9ShRc/8364JeprcR80rQ7rHIID7N3cNQGuY1djK8cnAapk40CwkGo1S5AeLD0Xn2OdBsJU/8M4wijBYw3oF4/hHPIP7gLCKjiZYePkyLML05oV8P5uWLGWfRWQWVXBwGykURsiYzs/Gc9TBzGUA4g1p2mXKS38OlRYDoHxiWevydTvDgAcjDb07oOYgG8Vv4MuC3JMuIBxC6OaBrASCE6SZnCbsVcLUPpf4UzMO/4UqeLFYhP8z6uJbW1uVSgUuxECHm83m6ekp8tPRaHR6elqr1Vqt1nipGWhZFvx7tUWwUYLSywhmqNaHFB+r2ljH5KLDsNZXZNxuzAsG/wz1kdogsspmswCIo/P5FUB8dVwdVwDx1fGFosMGfscIElEXNBbv3Lnz2muvZTKZVqv13nvv/eY3v2k0GolE4lvf+tZzzz1XLpd7vd4HH3wAYUTo3upuxwuCRMuvg9ojdgj4WWHrRXBG7zUcYE6BUwwaFE2NSNECJdl1Pctb2LaEp2H7I8t6/Ek/YSQ83SqfptNnk8mw2x/X63V4OtM6Dx53cNmC1V4ikUDjcDgcxh7f7XYZTeJaEClOJpPhcGjbNrQjEcqn0+nt7W0QvnC2sVhs/8bNUrnUH6XDo5DlilgiKZGiSEu8hdSPSoOHfxsfB2OhcSL+Yam0VSic4+9QF93e3gYGXa/X4UGHLmlQHev1+vHxca1WQ2oB1YK9vb2bN2+WSiW4hwGIFxGS2g4ODqrVar/fn4mEJhM9JGbzOQQ0QqHQdDp9+PAhXLPx9kwm8+qrr56enh4cHDSbzWAwmMvlXnvttVwu9+67756dnYEf6s8wv1wY8bpkjHYQEFQFOj8ajSCKgscETisJJhoAxXTDWIJASiqVojQEi+r4Lkp9AXVC/ISJAwILuZ949MjKONem0ymUplnGR97ILNdYB/CA0AQA7gOKN0xBdf3fb2iJbyTqp9kBGHIYP+e8dUUu0J9MYgWIzNlsFrUZ27axyFDRVcOpeCJA/XAOaCzg+TN/RtOAiIABjbePRqN2uw391lwuV6lUjo6OcOcNuORzHMNrxtumWCEQAKO/VCoFAoF+v39ycvL48eN2uw0dEiynaDCsVqvQeUAmg/uMa+TgDAQCtm15ru16lue4EvHOkV8CxHGRuEhIJCKSEAkvFSeiIpbIWCQmkpFxw/5VNT7474On9yN3/1Vvb29oWXPXtbV6NQFi0nu5vF8AiOFob9v0mQmHw/l8PpdOowqCJRpEfnzOZDLBBGEXCxnxbPAkdwbtKRhdaA0BJZ+JnIiANQwNa/TBgPYL4WAMRf28sG2JyHg8RlcBqmsYugSX4YyKFBQqKBO1DuMHJJxwiUyn06FQCGs+dGwSiQTKS67r4j6AQZ/L5UDD2d7ebjab7XabDGgydz6rgsfTZvjGlz7bNrEZb70k/G2oIV0S+Lv8TVspL7Du2y8fsxGi0iTTlRL5mqx6eV6wAckZfcTM/58IiGue5kq666eHhjcUG1YOM2+zi92lMeInjlUuOESCtIySprLqx4rVT5a+BQhxQ6EQ5Zv4mbqhjXAni2FAZinrpPuB/C3em2DH5eAhqITmJ7rmatoyy9vEdFgYww+UiUdljiRi1tW0FhBVhnTIIUv7BBQ4NYSKjQyyV6RG0raXdA0EFVrehwA67VJ0rz1FUTXtQ5YyR3qrYsxjKFr4p55/Fvgno1GZ3owR/5kw8TfMeoNff5l3GTfNWEvR/IdWoVwuB9cW8DkymQwJTKjpIsjEyISsExjEyNEweTUGrQnpGD9cUZFcxGKxbDZbqVS2t7dBRULfKtJSy7J6vR5YWQcHB6enp8PhEEymarVar9fBKeblsHuPQ1qvAOKj51NiWKvGaYAYfZCGvwgbFwyA2MC+OSn4aaDapFIpBi1AioPhcGQ2g7zylQbx1XF1XAHEV8fnjnn58SC52PoRj8d3dnauX7/+4osvRqPRarX64MEDdGGHQqFKpfL1r3/9xRdfFJF/+Id/+Kd/+ifY4NhLfX1+C6umJFSi4xsvpnxwKpWKRCIoXUIOGGFxIpGAeAL2D7bkU26J+y7CwYAtlm3lesEX6tNye0qEOCLjcuo0Eau1Wv12e9hsNuGlRqIBUn1gzQgEAU+zdx56FADg4AzGCjC1AoAMIvoEdTeTyeCXuKJisZhMJqbzcGARkLElIuIsQZaMLHLB/sHudCjhyMnW1u9Kpe18fjuXy+H+FItFVIxbrVa1Wm21Wrh23JBut4uuotFohJq2iKTT6evXr+/s7ACqyOVytm1DNhpN9Nvb29ibG43GaD6P9Hr20hIHkdBiPp/NZqFQKBAIDIfD09NT3Cs0FebzecdxTk5OTk5ODg8Pq9VqpVIpl8v7+/v379+vVqssPDAz+fLOFCPDDIVCxWLx5s2b2Wx2sVggSptOp+l0Gq9EyEjxMgw2UGYYDgJVr1QqGP+YAmQJ4eEOh0NGn47jgOGI4An0ebBXKOQCBDYej7PeQzoAPhmAGhiXSJyYNLKuM5lMzs7Ojo6OBoPBYDAA2I3pDFUTTFKMbUqkoVu/0WhMJpNMJsMiBGiPIAVA8hUUeHpFkuCMn5FIp1IpiF9DeTybzfZ6vePj4+PjY6Ci4E1T+8KyLEjEYHpCPgXzFydG0WfXdfHJtm2Px2NwM6EV8/jx42w2e+PGja2tLeD+MIrs9Xp+vchPiaxZK0New3vqEt8CcQkoz7qu2+/3m83mZDLBwANcGAwGh8MhVPBIcpnNZqlUClgq6nDIVUTEc11LFnPXHgXtc48ha0kTtkVCS5WJiEhUJCwSWALE+F/vnF/cPXB+9bvo4KG1vz/e3XVtezFfiON8wpgjwKGleLGKEkMREXexcOFHtLw12D7ghIgaANopcOG4do3maJEWWUq1sBmFdDbP85BZYV4glYrFYrlcLhgMxuNxCqyDHwd1F0wBIynCsMfp9Xq9cDgMXj92K+wv+BBYU6KKAzVhuOdBOwh7KKYG206x70yn03a7vVgsKpUKFPyBhszn81ardXZ2hkkBGz0Wb3QX9hNB1S8MI/ajJJchgW7GXIxPvjzovBJHuDySu/K9G5i8/kb+lQidn59IpwTjf/kh2iPRMCnd3LquVSP9yrCGYiyBS//bSWX14wXGZ2rgdSWhdTMMvW5gPC0q/SlRqpXjATsalhqKEhCpoSwpIVGsVwCJ0NMGH1pMYbwGDUlElwjNrOQAssC80m7EnxQYpSPN0sWmTx8Roy9e1yQ46qBihBObTCYUoKfDFfnF+ByQG3DmfuYvwxXeMZ4koyzWp/Gu2WwGhR982nmysMSsDUF8Fg6ZWSCSgQYROsY4XDWP0tADWYmFbRiQ66b/yilgVOW/vKjuF8DnuEwliXA/mezY95HHwbzh3OfGstAqBFoS2zcpMYxBPlh6xNEDQ7smcDCTe05GLVkguVyuWCxub2+DaUQyBKrI1WoVIfrR0dHZ2Vmr1UJoN51OO51Ot9tFdG3sF3rLwOWPx2O5KDfHJZ0ZxMrcTatPGJusf233I9FaWwbBGAS+MssDtAYnGAzbtmXbf17Vj6vj6rgCiK+OP5Gt2gjE4/H47du3/+Iv/mJ3dzeVSn3wwQcfffTR2dnZeDze3d2tVCpAT+7fv39wcHDv3r1ms4l0nb1dIEaJCDTyRTWVA2aCBij81vAD9z+AjyDwZjIZ9H1jy0SO3ev1oPwA3LbX65GG7ATDju3czHjff7lZfr+z3Na8kAzcYfWsVj89OW40hu12G11vNAsC3AYnMQTlrbbLbQABAABJREFU2KIQRAJgwrUgPpYlvwNBJxVXceHBYDCTyZRKpXw+D/VP3JNcLhdPJHqdoDWxZbiEURIiGZG5SFmkYll2Mpx+4fr+X2xV4olEOpcrwAcpHo83m816vY7IAD5F2Kfn83mj0Tg7O+t0OpZlQXoSqMH169ehEZxKpRKJBDDBeDwOnA7nCR5rdzSK1uvnwbdIIBCIx2LR2YxPDarHJycn2WwWD3cwGMRiMWhKtNvt9957LxgMFgqFb37zm/V6/R//8R/RV8Xa+IbW5j9laHglySsej29vb9+6dQuYe7vdns1mIAOGw2HwVVkjGS0NFjA7aHCXSqVKpRLuJx3VCJUig0Koh+I/mtZRU4nH49lstlwu470UlOj3+9AgxjdqBApYFbjwAHnxIfF4XPeczufzZrN5fHwM7WlINIAKAQtEdO67rouwFWoARF0xnIDVZrPZra0tOMKBczEYDFDnyOfz4BDZtj1ZHjh/AJfJZFJE0CiHoNxxnH6/32g0sIAYDCOMUtd1QXKPRCJA2eCsGAgEALIzRkeZCqk4MGggwoeHh9FoFLfl1q1boITjPvh9bz4t4mBZ1pN67TdMGY0jYD3sdrvQF4a5NrR3QPNvt9vdbpcMLFCiwLqibLQCkqyAIzM32gsmLds5x4gdkYCIIxJaYsTR5R/8MiZii8xE7CV2PJNFQ8aWMw1EnEA0HLRt2yKNTjcIi1KHpEkjkY7pbBYZjUKu6wBKg36I41gXUzuuhwRVKTktSr1EljLW2DWAtOL12FD6/T7BCDoioguERCFW/ogOYzRyP8U1AoOGStJoNAIWT91hFCbx4ehoaTabnU4HP2CdR42EtF/8EydPmk+326VeIdYQkKlR74RaN7ZLSs18cevwkvT96Rmjm7HjzcxQztyVMME6UGYddnkZIy+NWRjOY7p6QcBrXUM6IWAm9vw98EGCGob6Ksa5lnQ3eln8sLJc7BTWOK/ubqEILHUMDLVKwg3UE9B2RvozEcb4sWPj2ID5ynpC+lqzwWUhXDzvaYlpehBuGJCa9AokiCRig1WqrxePTGsaoFMBqyU5gGQZ0+tSPzLKPhg4vr8eoDHWlQUDvzkexxJRVOM5Gt56rutijdVoLBnNDGIxnKANxaUb8ZIsTRHQeKSHt1Hl4qgDjE4GMUcvgnNS71nbQE+GLHUq9DwiQIxquhZE8lveGY/efw9Xoma6PqQx980Lmj7JtfXmPxuYeOXovUyFyZBHI8oPYwOU3kulEpg6uisO4TSCTGDBBIihQYxuHsSNdKzVALFeDXgVmPgAiEulErLIRCKBEgvy33a7fXJy8uDBg8PDw7OzM6jbkQKvG/646rI0xRUDYRJEihk40dGXmLUfHSaCbFT+1q0e6yoZuozEqI++vsypr2jDV8fVcQUQXx1fEPK11hR7iXekUqnbt2+/9tpr2Wz24ODg3Xff/eijj+bzOSiTL7/8ciAQeO+9987OzgBKAiFCZIZ0F1AOSItQR4UME7Eea0kBA+NPsypwJrFYDADxeDzG5gGu1nA4hK5TJpMBMRONPCBVRSIRy7ITIclmp4nElBeaTVVj4funp82Hj467nT6CbIStwKaBoCEch0w+SJ3YR4EyjEajxWIRiURwSrohiJAH4gBAbzS3xSeHQqF4PBmNBQK2AohBu0uKLERyIiWZjZKtydcikYf5XD+RjG9tbe3uXguHw3ShbbVa9XodIr/YvAEQt9vtyWSC7wIwsbOzUy6XQb7G3WNWSYuwQCCQSCTm87nrOHgBQyVrSUsB3ADFTBHpdDrj8TiZTFYqlf39/Z2dneFweHx8/MEHH+Dab9y48bWvfe3w8PD4+Bgw3Eqi+p/4HNmcW6Jikc1mIfo5GAyIt0YiEZbu2VyG/00kErZtA41CLQHDj0QbqgYz96aKCEi7jPMwI6iMRoAY0CczScam4NUyeMUJg2DIcJBVHHAiwEHAKgGcGsMPl4YcjyQIkJ3JAx0MBuDsAGkliImxh4oFYmvcEABn1AumvDjCayDsDN81akDmBSA5ZJIQaOv1eoiVwbtEQAyWJYY6ro4UD9y6RqORSqWACaZSqfl8Xq/XoQ9AotZnNoBXJXXaymOzZihWAAyDeDw+m83AG51MJqlUCpzoVqvVbDZJj2X+SWCdPcIq/w+Ew3Yo6HQH35jO/8K1Yue4cGD5B+AvBIgTSz3isEhcJCAyE4mITESmIgGRiTTqzt+/G//Gy9Pn9pxQSFzPCQYDxhJKAJfedDh/VDsWruvM5+RWeyJgxwWXq5bWywZBHnOBmAK7rSeTCSADpFIQYMHTJ0A8GAzi8TgWUiRCSF3QPEEMQqdGbMEmGxp9Bq7rwnYVNTm4R3L7AzTsui6yvm63C/pPq9U6PDw8ODhotVrYdLCAU+4QRU3oDk8mk3a7bds2qlPhcDidTuMD8e35fL5SqUynU9qar3Sm+lzWUrMa8mT7tXUqq09U4Xxamd3NFcF1r1l5erpz358ka/1ZHefIRVFX/myQfLUQLQFicu21XoEfmNaaBsi6NXmf3+vHW/VCp38gRqAxYm5YRNKJDnNhp46NKGsKDWEYGB8VEvhPA1PzA9nGMNsw2AgQW55nua48pWDIE0nu+mR487F92+rg+eNKcSEE9KlvS4lS3FIq2IDkiDEA/ixVUHkDiQ6vHMnGzVyZKawUaeVA4uNjqGB0nWPl1Cxd/chYr6JKBvZoxjOE5MDe1XoXvIH+266Ljnqjod6FLsMwJCaa7AeIEboYZmIGEKlVnuVplM11972sshA0RrLu9fxzU5a4ZG77DFmGnguUPWGfEFgOWjYX0xY1bIxVEBc0fx/ROwaYtlvgz4b7As8fySzyULAlABBTR7jb7dbr9bOzM+glgh7Bb9di3EwEkDhQawXhrl5ScLYgr7BSZQDErA6yLKQNMHX5c+VGvK7m4Xe0Pl8onr6Ad3VcHVcA8dVxdXw2e6ruE0FIure3t7e3Fw6He73eo0ePkKZCd6lQKIhIvV7/wx/+cHZ2BrYvmGj4HGbIuqEeiTcNkXS5Uqc6mu2STCaB+VLJAdAnCFbtdjubzaJ/HGKp6CyOx+Oe47nuwhPxmJxaEgi057ODZqPV6w3n8zkZx6lUCiZXwKkpe0pqmE6EwHCMRqMAiHUuJKqHCLRiFEJxzqCJBYPBcDgUCNi2Z1sTy3JEPBFbJCqSEFmIpEXS4sadYTsfS+6VS41kKgaf3MViAV4b8Iuzs7PT01MdVfd6PQBYIjIcDlGCTiQSwDhwvQC7iTYyCYE7U3g61YmrZVnBi+kodd9A8wSte2trK5fL7ezstFot0Euz2ez+/v7u7u7NmzcHg0G3291AufoTnxr+M2ccg3gRvD8AqRjDkDGFbq8W/GKTKQFfzSPDBBmNRp1OBxk1mTXoNCfAp7N9LcBN64lEIgFkCt8CtehEIkEcGbAsut2hbEjmIx4xNLUB1GKo9Pv9Wq0GIz4QpTmF8S2Y+FpLBHQn9NkBGibXGGoGmBd4GatHXBOAkiM3Q4Rt5AAaIGayx/t2vhR4XiQSgToEng7IpMxIZSnxDCE5TOrRaNTtdrEsgBKOWhG0Bb6w4beB8KjHJ8TisXyBdtpqtTBCcD/x7ACDYhXikCaNixn+Uh3edhwnHAm5o+ems+c8OyxBsHZFgkuycHj5J7r0qSNAPBcJiExFZiKeyFD6Q/s/3w+/ez+8vzNPJt3x2LYsRzcyG1RKPmIA3KPRyHac+GTiEiRy3eFwOOp04svGYZLu8UYMy1AolM/nMbZRFEE1ETvRcDhsNpvZbJZaLignADXmCqkTfqZzgKEpoGSQ5rS8L6VCMebxFg5ITF5Q71utVr/f73Q6cDo9PT1tNBqj0Qh89lwuh8oT5JLBM0L39HA4xGksFgvMdPSkQ5dwOBzm83nYvyDF1aaUX1zqvh5+XZfM+xdePxK0UsFzg5jDum3oibCyH5cx6LorxUY1cZhbgC6EE7clfKw5ZUzsyRQ26PYEHFnkM75as481g1jDfGwfMYASWS+gzHVjrg6t1U7chE4J/hcwstIWZ/wlMBdCLdoK1SAX64IHDmNlWwfdAn2wPmsMwnBzIihDSEiD8ux4wKHRUh1Lu66LuAIS/IhRUXlCnEzJNc2i9QPEfkjRrwSiPRLW6RtwbUQ7ndaY1o3t/HDWVg1sGsuRLqvwZDB4OBGgiUQRCax+/klqgFPk5OqahCYCM21B8IaRY+DLBIgZMxi6KP76ikEy2Bz9MnvyQ8zrWiVWNitcHZ8Vyuxv++AqqrsotLqOX1rBeHzrKi4rcVLDzVKPLgbeWB5ZQuN6spL45b86PyyuW0ZWZm3rek3WTYenrbqt+OEL90i4Oq6OK4D46vjzPfyCd/hNIBDY39/f29t75ZVXUqnU+++///jx4/v3749Go3w+D5ip1Wp98MEHUDlAX7bjODSaAFAF6hYOgIngS9K0bbQ80JiDVBlwajQaBbQKAhcyB0TDQGpOT0/RBg64B4RlBKDk7YoIAIflBctgMD45qQ4G/XQqBVUEYCUQf6DhGE4AaAuJYMxPAM7ibGVpZ0HiBpMB0BxASUb4TpaH4wQWrhUNu5XSLJuYV52gC4A4JWKJFESKIl1xbac3u54v5LcqgWAoggb/o6Ojer3ebDYfP3784MEDqEloxzPEr57ndTqdra0tmCCBp1YqlRzHmUwmnU6n0WiARAZgDggCoOdPEi3LCgQCuXyeIrDBYBAiG0RDhsPh0dFROBze3d21LKtYLAIjfvDgwfb2dj6f/5u/+ZvFYsHupy9LIOsHGngw94hEIsViEc5puHto5YZSM3r8oWGC0QK9BaBUnU4HkBYSOcwOz/Pa7XatVms2m4ZNCg24qKhLaxQMrWg0yoQKNlaFQgFoKTBW0NgDgQA+ChRFwJ1gfOMDiVMDSqPi4WAwgNwEcCggjMj/e70e7kChUMhms2gjpaQMfLQajYbjONlsNhQKQWUCnwNOJcZhv9+H5kw2m4Wv12g0AouT0o24IYDFgfNi9mEWE8jDZ+LSLMsqlUpQ6EalClRlLFDAXGinLiL4nPl83m638aUQ/i6Xy8fHx9Cl+Vw5O8wLL/96LDjgoYNB3Ol0yuVyIBDAE8RqxqSdUCwybSbkGDBY1qJRz7aj8Xgy6QXD/dnCE3ch4ixliANLpBgwcUQkcq44LAmRgMhCJCQyE1mce9a5fWkcOv/d/xiNO+PXXlqkMxKLnUtrMBXRupZ4juPx+Ozs7PHjx7PZLBgOB9rt9HgcErFEFotFu9OpPn6cWF6753kctLKks6XT6WKxmE6nLcuC9AoW0na7jVF3eHg4n8+j0SjqfxiEpVIJMK6xahkeLNgx8XuAd/STNPAOFF3wgah5ELMA6oGmkEaj0e12YUGOf2I6l8vl3d3dbDZLOjN2BLDvgVwAScHmi3ILGfqoLOI+5HK5k5MTdnX4UbPP5bBtS1GJ1xm1rcwYV2bXfv6m/i8tgboS5NUv9vfda2zOcITTG4H/N/rwKz8S/KViNeEnjHxCwCtRYK1aqy9Hc4eNcxbVCq1PzK9BrL9uJea+jhmtAyRNJeOwny0P4wUalGSTDbFdvhGzgwiI5p+yIQCHAVKQm7ySevwJlAlo2Acif/romoRQbUVFvWBjcUBRCk0PrNdqRi1kl9AL0u/3oeAErTCEedzI2K6kgXt/G7ifv8wHpAVPVmqUayNZvhhLE9ErQ1SB8TmiFz2QwGHUuiW6coAoBeEQdoThcIjQGgG8xoh1FcQYurrkgP4k7Z0gS5ssBDDGjGBfoBbB0z6BXBBWlqxWcjD90LAfIzZI8bK+s+0KI/5MQi9EkuzniywPJlbkzFKKjRAt9b61xgutcci111MD45zBLQcbSAnUlEAZezAYgOSO/AJtVcxAxSdmze+lvgrb5jBDcf56tJM4rA0bDHq+n5yhG/j8QvmbIXjSxQxA/MJ2c8WRvzqujiuA+Or4IvdCI2JGDFQoFL71rW+98sor8Xj84cOH//E//scHDx44jrO/v3/z5s1EIvHxxx//5je/qdfrsHUC+RToISMnAA1sE0OAGwwGd3d3X375ZWgKAzn68MMPm83m4eFhuVwG8gVvd9hbwbGHQvsI4IAaA3WyLKvZbCYSiUKhkM/nQY/N5XLxeDwUDiNS5AXPF4tef2Db9u7ubqlUKhQKiPYYTYJmCzw3k8kAKtKOrrgQ9N0TUEMDnaHBB4w7kUgkEolkMokgg3XoycwqFhb/qjD4KBv5ZTA98SyJiKREbJGcSFFkKJOp8//9n2/9F/+89mJ6OhwOTk7PIDF8eHj46NGjhw8f1ut19iiRCkEeSjAY3NraqlQq4IvF4/FcLjcYDJrNZrVarVarIFyDTIefh8PhaD5/rdM5D09FQsFgpVwetNuBQACaEkghEKkAbkYr9LvvvptOp7e3twuFQr1e/+ijjzKZzLe+9a2//Mu/dF23Wq0eHBzA34940J+sysQ6CS2W7pHh5PP57e3tRCIBt+LpdAqwGEhNr9cDXsNiPh4THN4wfpDwdDodmCWiSbzZbI7HYyAChgYrMjdD+QtTBuIJ9BOHZgigVUofLhaLTqfTbDbZww78muoKQAxJHx4MBqD8AzgDPE07LwgHw0YZ7ojwsgNUjRdD9nc2m2HORqPRXC63tbVl2zYMLXEOMPQAzZwibrg5w+GQWjR0CWe/qjYQQzCNf4IcDUwhEAhA6RgfCG0NJuHs3qWqLEyrPc+DA2QkEqlUKrFYrFwuVyqV4+NjANlGzraSp3bZRfjiNPCWQbf/K1YCapDiQfUOdGy4tGFxRnUHsum4PxiT2sCaU1IT7oLBYCgYTiRS8Wyjd/L4YTc9GUUkImKLhJUYcVApEYdE4iIpkaCIKzIVmYu4IkERT2Qho6n1//tN7PC38l/8s9Hrb7h/+ZfWYCB0ZzKesuu6rVarVqvBk9B1XScYnLVapV4v5XkWRHXq9Y8+/jgWDmt1PwxXrIQiAgfIYrGoq5JYRWu1Wr/fPzk5aTQafBfKXdDMGY1GwI7ZRk1tE/yTfEzMTfqvYh3AtbDtWm80yNPYh9Hv94GDn56eNpvNhw8fnpycoCHm2rVrmUxmZ2enUCiAti9Lznu9Xn/48CHmCIjJOJnpdFqtVsfj8fPPP59MJufzea1WC4fDhUIBWDOGMQsGmkv+BSzLm6V7jer1SiXfDZiLJnxpSFRrmJDnayCtWpkXRSlqsLAP3VD89GtHGi5wclHGgRoRhkOjJghT3VWfmB/5lYtt6eyy8tOBV2qkGp/wRLLYBpyd95MACr/dEJEwpIQ1U9gAjg1kWVOM+V6IEWFGU5KeF8V3scFFU54/8dxzXXkmyttTHaSH+zF6DXYToqWoAiYmClfYJTudDgwAYFeLNjgEz4ZJnQ5cuT2tE2nV/lSMt1cSIf2auQizGe2w8wldGpxrWD/xIYgiMOyNtgz9LWyWF9XRr208qU2nkVyCVkbkhlBHlj2O+KUWhDWqMhoo53quK5qGI98GHvGGBdAQgNb39pJL8Topqq9Afrq5ePkZXjJ950ASwrOGUhMMP/hLPRTR24fQF1QnsBO4R8tSB8ZeWukaywJ4G4he8DIQldCqCz06zHreCoQNjUYDyhKoKlFKmJsjgn9jtvI0ONPZzMQoRcdjTHmMB6GXcW1eonfnza6hDISot24YePKwAoHAElW/Oq6Oq+MKIL46vgj8S2MECDdv3779yiuv3Lp1C7rD7733Xr/fv3379ssvvwzm0YcffthoNCgHgZ2SrbKz2QxuqtgjIQqBbTWbzV67dq1cLmOLymQySIR+9atfHR4ewlcNnmkiAqc4I9ZHmIuNBDE0dkfATMB2Z7MZqBaxWMzWALHIuVlQOFypVIAOa8dhxgf46ng8Tn0JTW+BZW23283n87hGkiUZN8AFi5VnHVVYlhUIOHYgmAhLLhhIJW3bEkvECywbtKMicZGEeAkZDZx0wc4X7NZH/ceHR/1edzQanZyc3L9/v16vAxgChYQC0MPhEIxOyFBqf9hgMNjv96Fx2Wg04FhFQsp5TO843cFAqwEyT9a6bKx7wzAQkprT6TSfz5dKpdlsBtD/1q1bN27ceP7552/fvo2ebmJ/X7RF0rOiw/4zxIAJh8OgSIsIEjZkO8Dox+MxHjqGDXjxLDZ4ngerQHCHiQ4T0CyXyxiHEB1DWQI5MJkL8JcLBAKgTGpKL04AzwiaEkSlq9VqvV4fDAaaj0zYQqMemiMAsZednR1IPYABTV4PKIrwRjs+PsYdQLtAsViMx+Ow10gmkzCfofwFSjvoPJhMJs1mU1tkaMVYI2dD1MjAGhkypi3N31G9oAc6UGatmCwiFHWNRqOTyaRarSIDh2YrmEogOwM1BgETIssaFNY4kV/qcfOx+sWe562BzAw0B2eSSCTK5XI2m8UJoF1ARJrNJhKAwWBg2zb6KpDAcA5CIZfJDH3eAoGAEwzaTiCVaKfnbfvh4lwhHYiwJbIQcUWwVGhOMUQn4L0JgNgTGYtkRcoyObHf/6dYLhr6V//LmW3PAwHX884vRDfa27bd6/WADrdarXNfI9dtt9vDwcBzXaCrH3/88X/49/++XCxChCebzaJ1AyshZhZXMHaoQB0ol8sNh8N6vf7xxx9Xq1Ut0QBOENY0Mv21fyNGEZ476UKopiDvQgED30uDGgjRIItjKoUqHRSTWL2rVqtQZdnb29vf30+n07Dz1lvSbDbLZDLpdBoingCCoSeDWgiAM9DnO53O0dEREt1QKJROp+v1OqatRk6frc7xDEn/5rbrlcZfhtqPsVjp1dvntXgBIDagOr2waw4X4hkaCvH3+rsMPQf9jSuB408yXvVRhJ+YGBPkNTYd7QbGm6OXILKPDe0LPyLsP/zQoXGHDckLg6DNK9qwAPq1bjVATAFNgpv4JbnDxsgEUELRGI3LMAwDboKOEN2abYDj8vlXRFbyrw28Wx8sS1A1gvxZIEFYiGhVx/DM0I+WyymMr3vxBh9II17SE81vebfyhnDEYhjIRbs8XSrQtSseKycal+uVBQ+tvKErFvoqdKShx7YhCaJf/xkefkGPP0Nc7IlB+AaNoJWg5LrX680FimSEZRGKAKuF2S9SQtYI6VUAhkS73e50OnC80CgtUmMN/TOglaU8N1pjoVYXCATgYoJqLto0G41Go9EYDofsk0Drbbvdrtfr7XabMDHtK5HxsetOg9qovWnjSqpgGUXQlfrX/iYMw3hcA8T+x6GbD+hHh3+yG5JVHyxuTiAQ/GrVP66Oq+MKIL46/nR3Xz/slclkXnjhhRdffDEUCoHy2W63YRNXqVTq9frBwQEoV8i02cOFHygzh4/S3TTYk7AfcPdCZJbJZMrlMji5w+EQ9VK4UeE1KNIiqUYX3mKxgLsr6FSIHWez2enpaSKRSKfT5zbxi0X4YpwRcJxIJBK1bWBJQFd1rgjPMYj2gnjLXU1r581ms1qtBsVStNXTdwvAxHg8Bn0YXWxE0hlQjsej9nTaDDoDJ+DGEp5Y55qe7hIgTopkpVu1fvZ/S77/m342M55OOv3BAAxiAPT5fD6fz3M3BSMDtEc8BQavvPPo2YdCxUcffUSoCAIdi8ViovJPT2S+WEAHADK4QFtk6eiF60JrNgBxMHqgG1Cv1x88eFCpVGzbvn379nA4fPfdd4+OjkiDlT9Jq7onRiEsJBC9xcgn9g3sRvd2AWtgrYJoEeYL7ifeDtO5XC4Xi8WgpoIWM9xYJofIeEmloQkGcypwJyHtB3ANvhZoTKNwqtHyabAMdE6LqUHHGPoya0CNQpBI7GHnhTIGL5akIc4LgM64P1oDQXOaNIlPD2lNu9PamqJod8QFNF0CuA9Rdep44naxSRCsUrBxYQTHosvKpOUZHFE+/WuA8iOlwQgBfxzzHfcZjDMOVzb80obbQOGXqJAlnmeLm431r5V7I9fuBQLdccCdWeek4PNTXOpOOIpWLMtfuksNCqxsaXHjtpdwgvGFWLZleUwltAYrJgWIOcCALMuaLxaTdnsyneKbgXseHh1Nx2Og+ezngIvpYDDQ4xmpCDo0sZSBdQ76P9ZPlNaQqmn0zcAjWKjAeWKfwlChEDm5dUwLkdFBeQZARjQaRXEIB9ZnkOixLGcyGQjxo5iBpwxcDFeEyUVqv55ieDjQ1gChuNvtYpyjeIk154uo0q3P9tchUCu5zIaA40q5A7nIyJOLLSDrFI0NXx1tDqZpxcby4hemMFBpP2ZN8NfAf/H4/Kb2mqJoaJtoMFTb3xlv93NFCbeJsndbCRCz6KUv3Phkg/boJ45pcFmvnDwZNLIYADEiRvzXSo81rBisx88VxUxDqwab2+icO6fWPmVV76mW98sv8iud4gwXvnXg78rvMqDGp61cbkCHV+pOrDRsuAxuLms0UmWNmMxKSF0uag3z+eq3a0akZrvrq/MP9c1Y8GYO/tPecI3N/TlnqZckRD/Rs3TdLw0DSUC0uVwOjWKwfkVYCMXCZDJJD3YsLBBugjE4oGF0DYIUgqWexT8G2Bx19NTJZDLb29tbW1v4UqDSqAejP69Wqx0cHDx69AgO5DhtxhvsljOEy5l0cFMj5QKpBPsq/FpJRlfZhvriysdhzN91PBtEpCh7sxEQNC9k6NT3sAOBECTRruCbq+PquAKIr44vAPzSZfN4PL6/v//KK69sb2+fnJycnp4eHR2Nx+Pt7e1iseg4zscff1yr1QgFIodnMo+EXERisdjOzg64bPCngkfZYDAgJYSk18lkAu5btVqdz+eNRgMlUzT2Yj9GMoz9DPRY27aLxSJ3UCbngMAAZY5Go9l0amx7qM1GbRtasTSeYrs6Lg14K9UwdSLBzkeYJoGfVS6XiTWjR34ymQDCRrOSBogBTzTbba/TOYiE23bQyxfO+XdhEUskIZIQyYhMZPBI/t//NlY7Hv3Lv55uF8eT8ejw8LDdboNkur+/n8vlNFIG6BBNTzrrA3Zm6PGlUindRYvfj+bz3O9/7wyHsliI5+EN0XgcD4UsD8oOwLiDaRh6pWH61+l07t+/H4/HQYKDM1u9Xh+Px3I5VsunGefP/OEbonx8bDAYzGQyuVwOeqAY3qD3YtASfsWdh1Ie8n9iAWA/AarD2IvFYiihFwqFUqkE3J8TDZxWqmDDeovpMb6OBXmIDPR6PQgEo0EelGFgT6x28C3aeoXwK4IzrXEGHjQIkiBXAl7EC8CxBUoFxC2dTgPbwmpABjS4/OAz4u3QoDBgbgTiZEvRZ5mqu1hJQPQDwAd5ZSCA5EpAkhU8d2DQ0MGgagfwa8PiIxKJuK47GAza7TbtxXDONHo2GFvPgLVRZeIZ1nDK1QE3HA6H6A+wLCuZTLrg2w6HJM0xi2DsTidroycdv5zP5uPxbByZ7e4ePX/7dwur9OuPyv/4qDhNWhJVALGlFCcCIiGREJIAkYCIJ+Iti14pkZx4uzJJSKsr07HrOJ7rYuC5fLKAezBcO51OvV6vVquu6y5cd7vb9ZboGMR5s5mM53n1er3X67VarWQyGQqF2u32wcFBt9uF3j19R9PpNMZnKBQ6N76zbVB0kdphHuVyuXQ6bdjCiOJpGiLOYPZBkgWmiBrFmM/nIN0/fvwYBo8U8YjH41r4YjAYIMmE9xRkQ7AlpVIp7Hp4PXDt8XiMWqaIjMdjWDJi08QTR68ABjwQaugdYe/TIsu6A/2zh4zpAHZxZV6X3vsxGgM5MhQkjBcQhyVv1yDzahKxRjA5LwjUcmGUixRaudiEzhdchkGswWjjk/3YnAH/+U3DNBDGEMX/HPUyRUBNBzYrgTlNLfcrNRtI5Tp0Rqs8G8iCRkwMq2R9c1Z+uFFSgtaZAVbyBZq5xka0cxxkuYZ9HuiwcR82SHMaD8gfIBmDn/EktYNXYscG3W8DoGa8dwM8Z7x+nSTuSvVqvzoTK23GeAbKpsUutHMX5xEFOvh1qHwbZGR+CPskOFl4bmT3Gz8bC866B/3pnQn0dHuqj/qK6UtooNyoPTwVmWPdZDRW5kgkgnytVCpBlw/kD5oT0gkWQQLCUYSa9Xq91WohBUBMqB3tKO+ma4eybM1EAZhfiiiOJzafz7vdbq1WOzo6evjwIQhbNGzEmNcWzThhprqM6jU9HxQramf5afgGGX/zZm3IoWyOV43FH/cWGSjoF3gQyBcQ84SWh33FIL46ro4rgPjq+FzR4ZWO3si0S6XS7du3b9y44Xne+++//9577wHlzOfzhULh0aNHUC0EcRJ9667rAi4BvIK0tlQq3bp1C633QMHAVz07O3Mch8BKNBqtVCrD4RBarsVisVqt1mq1SqUSCoXIOCZrGEpzSHcBiKTTadpSARQ+Pj4eDAZ8/Ww+l8CFGRQIBlOpVFgE2w8qw5AJJhwsS3kyAlVykdWCKAHRAPlo2OcgpgG2Sy6Xg4MZetgBEEMooFqtnlars3r9KJns5PKe54kl4ixBloRISmQkMpFF0moO5LA26wxHW95sNBqfnZ2JyM7OzgsvvHD9+nVA5MD4oFQ1n89brVa73ebWTkFDUD4BgiMioY8zhTVd277W6wXOzmQ6FREPDbmRCFBguKiRsAOeMi6Q9n2IcsB3azQav//970Oh0De/+c1isdhoNH73u9+1220DkvgSTR9go1tbW1Bbnk6ntVrt7OwMiC09KwgWgwiMCjnYxPgBYCVa3fEy1BKSyWSxWMzlctQO04klqYhaNRijMbyUYQV1FHSGTqeDCJW+bUwmkUvDOg8Yq/ZawRTLZrMQBqGuBZBu1IFIP8S1W5aVz+dv3ryZTqcxGEjUpcwFQFiArUCTG40GhuhwOEylUuPxGJ9PHRLQSBEKA5LG8oUZhykMukEoFBqNRpBMwetJr240Gs1mE9RpUEcjkQjuCc4ErArkisw8oWODzonRaFQsFqHiihsLj0fNwvuUBY0LIfVFCuSG/spIJIIlOhgMtlqtk5OTdrsNSRC0OnY6HSCSdLLiQsexgftJyJtp8GQyBdz8/PMffu2VfjC0s5i9+O6H6fk47EYsmS9VJjRGHFyShaFBAcjdEVmIzETGImVx+3I8tP/pnvWNvcWNW5YEHRGL6BNVkmHMUq1WT09PT09PRSQYDu8EAoFg0Fqe/9bW1u3bt7vtdrfbhXML7g/UAFHLwSonS0YMUr5YLIbhPRgMMpkMZgcGDPRP0KFieNZr4ECWDcsY7cB2Mexxh/Gy8XiM/tCTk5ODgwNseXwQtJYCuRivnM1mMJksFArlcjmXy6GMWigUwAGnj+toNELPDWq0WI1hxIczaTQaR0dHKJ9Eo1HcFnQFlctlFE4MWO3zAIiJIHo+vMw/sA1Crh9p0hm41sYRxeHlvqZRHm6IfoDYUEug0DkniFxkEK+EhAxIeuU5a7jZuEtErDRErr+IwJYfTMQ6zE1ZS2GIEpE03iI+r6GVrEldQ/LTrte5Zq3ECg28xpC+NczreFZ++y/uhhDfh9qSoWKMQIUFJy0xodWNncXCXiyc+Vxc95KFOgPAujw67C8eaDxUyzEbT9BfAsGjoVKzNtEiyVFrEPt1Ifw1CYOZvk5uwrDl0LCm7lrjHNTjRCv/EtynpIa2wGLnu+55RyxNSiZrn7ylwP0RfRmawpQqlqUKFnWWWPvnCk8VVD0vDO+7DYjYZgmddW9kR5cxljbIGX9Vj81w8OXn3bppSCYE0OFCoVAsFoHVQhgNg4HfBXkoNBth2I/HY6hCdTodqBpSVIo0Xo5V/Iy0CFMbQk/FYrFcLheLRdCHsYjBwqTVah0dHYGtdXJyUq1WEQnrdZtRnEai9d6KajE4FsgdIL2F3xgLkV/Eyb8p+GtO/hG7kv7P4hyXC/qjaPHl0MXj3IglGAw8o8O5JbIjUvp0g3Ei8oHI7ApEujquAOKr4yu74xrOGNxNw+EwTNsWi8Xx8fHh4WGn00HuCl7w48eP5/N5JpOBDBM2HkhJ5PN5QFStVisej5fLZfS0gg6JznRsyZBfHA6HiOkBy6LpNZFIQNVUtwQapX6Ay+hYp3oDBfWxDQO0QtRoG4nusqU3sFgYUn2ypEyKEhTW/ZX8HG63cL7a2toKh8OQleh0OjBWhiJqNpuFcCSgN2z8CCnq9Xqz0Zg2m63FYjyZnJ8hLN6di2qeUfEKYiUXtiOW2K63mIwnhULh1q1b+/v7gGLJM8Ut0uVuUZQ3VKSBjKTTaey+/pwtGI2Wy2Vdxw4Gg04kIiK5XA4wH9rVcWfQz04FZPwv6G+7u7v1eh01duBrW1tb6XT68ePHst6L+XMKLp+2iGKk5aJYyQCPIBN8dnYGBgGszAaDQb1exxBCkzj1AWnSch5xTCb0r4BKL4TPEolEJpOJRqMigvQVkJZWn6RUq7ZRBlgJ3BMcRjDZSTQA/MfZNJ/PIWeBUaqfOAI1PHEwUrWJJTQKENgxSMUpIcIuFAo4eaS7FFljnz6j2GQyCUGY2WwG9THCahraoPkGcWosZaQbcMwjaqeVYq/X6/f7o9EIz2iynGu4BIztSqWSTqchw80L19TsTqcDOWOIuqA0BZMQ3b66rpNu8/FEBUPNvBOfKjE6P4rFYj6fDwaDtVqt2WyORiPQh1Etw4FJigoWZKMBGetkHjUJjlXo3M1ms8lkmkql4vFoJh3MpWPlwv5oHJz2HC8hMhYJiMyWQsPWEiMOXwSIXaWunha3LNXfy3/+J+/bL89vPmdZVigYDBCAw4gCQwdY/GQyicfj8Xg8VyjctO34H/4gyxwjmUrt7u5OCwXuQWDggp4TDAaz2SyeKbYGSFXEYrH9/f1bt26JCIm92F9IJIdZTTqdjsViILJp9Bxt7xjebGHB2MMzJRjRbrfv379/enpaq9VarRamA11rgIzM5/Nerwc0HPsINhfoIe7s7EBoAtxhKEjE43HLsjqdDqY82EaWZWUyGWh8Y4T3+/1arYY5AjtNdKSCngzlRMwLIwP8vNN+7bpmpKO4gVowQSOSGvmlBLnOisnbMujDGiAmOOWXU9Cfw9qqgVSuE2w11I0NjrC+vYaOsOF1uTLr9jfOa3TVCPB4Ldp80uh4kFVisis1iFfSC1aK6q7M4f0MNT0M/HixXBTWMKBSvdKiNokQiKqy+F/W8qG6g3BIl/kpzTSezeLTqTOZyGz2tOH05Zmbfuq6jn9wLfqsKB6qMWXj7mHlwf6IziG2iLF2RX1n3VLGT2aIq9vLqFCv5RqM1hP9YoNKr0FeQPOaWa/FTKC+xa9jkcPy9RmwWgDMCOxIxkUseLOrA1uergBhxUZdmdsczpDjENdItXp+xUrRlZWP/jLTYTOyfBmM2BCEMSHpryJMvI7b9MT433h2+rEimOduWyqVoDUM+jBzHEwxGjsjdkKoCfVhBFr4NCSAWLK0KDz+K5lMZrNZ0CaQGufz+Ww2CwoFJdf7/X69Xj8+Pr5///7Z2RlULMiT0CU0TGEEb1oQiWEJmCjs/kSgglyApnCG/akfFDY0KHQeYdhlr4yBjRqqzri1Kx2Kspx6AXUYrq1Pczgi/43If/PphuGByL8WqV6BSFfHFUB8dXyljnWie7Ls0Usmk7u7u7u7uyLy8ccf379/fzQagcOIfbHRaEB3mDqhCGRDoVCn06EhD5Z+w4QUERia8cEWhH0WiYR6Y0AoaWwkIsK9gS5D8KQCQoTID2RMwDrniX08bk8mntq3Ao4TCYe9JdgEPi+1mbjLsgLMwFRnWRB+CgQCpVLpxo0b6OqdTqftdhudvEhXAPmBQQzaF2xngbidVaudx4+r2Wzn5Zcv7KbWUscTTlBhkYwcNXMfPtgqJ08s78SyPKCTaD2GRAaQHZSdcedxA3FXcT5IpHO5HP45GAzQkcR4ApjXDEi1TsiDQbGs4XA4nU4TiUSxWByNRt1ul6oUQEJR+4XrGsryOzs74/G42WyenJwcHh7KUn7k8PAQbe+GrYF8RrS1zxx31sk2utrR+o17SzYfJA4IMBntkAAltTsKRnIikcjlcvhAwJ0YzzTNoFYvQzHkvUyGeQIsFcC1DL55mK10fiOZCLEy8Gi2tpFVAYQL9OdYLEZjLkx/Ajf4KJxeLBYrlUqAsTQ3ATdNa7Yy26GFMakESPi5epBMqkNe5MPUtWDaiTvT6/VOTk6AbCI4xg2HYgAyWxh64O1UsMH4hKwE3gjgCW9B3i4i4CwDTdbD49lgtfMkcyP5bkOqiYmGKhTwXKi3iwi4onhkeEyRSCSbzdq2jbnMp0PgnsxW/he84heLeafTaTQy4WA7lz3NZ/qHh+mp58hYZLr8M19KSYiIvSx34Q55Pg2KoHhhWTie5SwWC8sTjwiCoT2Na8Q4TKfThVIpPR5rN0XIygcdB6zYbDbLPAosWsiPkHeP8d/v9wH0Y/BjZ2H9EskepznWSb0k+oexbh2lQAEUVLHsNxoNVEC1yi3uPKYzNGEwZ1Fgg1sLUko8OAhuLBYL/BcFkWBLGA6H0TqKec3BgFVF58aoFOIwXNfk89EjPr8hlmX77NQM3q4hGoBEXbMmifvgBbwVOu1kS42R+hr47zo0Z6UWqlz0YdOHxt1WSkxoaJgNHAYRmFjbygeBNZBfp00y/Y5bfhc4LqErJQ5W+on5KWB+gFjWy8XqW+3XazZI2X4A1IAnOOl0Xxd+gMQK2lYMDjJ9Jqm4YgDEwI5H02lkNIr0+7JcPD/zqFsrUGterSZogzlIpymyEVkFAdhqDGluixRrZuGKl8mlj5obYEdql0W8hQVFUWR8DQTzogg9G7LsHHW8KKJIRNz8pQsKtePkWaTE5qXVbxB0aWqI37h1uXnN9Dlri2Aia2Rq49MoH4/Mgp1/xglzNhkdOf4JJc8kg7CS2W2Quy9Zm/mqZrIbgOB1OS+GEyrNjJOh3VQul7e2tvL5PEIpJpJ0ogPzo9VqIXQkYwlsXHiHgHxD2V/ankPMEPt4LpcrFAr4ChqTokrdbrch+wC+UbPZPDs7Ozg4aDab0JJiOKSvnewfTHbOO93tSn8Uzj7yihAbaD8huSjH79em1zr4uv5E8JrfjgVHl0L1dqDpwwQQtKeIXiSxej4red4RSYmMRVyRiMhcZL6MRMdLKtZIxBaJiAxFRCQqMhOZL38IXuFIV8cVQHx1fJV31pXheyQS2dvb+4u/+ItMJtPtdt97773Dw0PggIvF4uzsrN1uI7YDoRgfQm7j48ePbdumf7puDERtli49aAMHoIwXs+cL6z/SeOx/1qoDKR/63yECi30X1Ak48GBPQttOPBazZjOd7DqBQCgchgAFOoa4zWNnQls90mkGzYbjDZkR2WwWastgqIEny/7l3d3dQqFA33ng7GdnZ91u9/j4+KOPPqp9/HF3a6vd6ZgAMUU8wyIxkay0G7Gj02xjxx6PB+FIqFyulEqldDqdzWa3t7cBcoE3B6kNsOTy+TzobyBcQxgE8RBaqrXDGBCK0Wg0VsEEHmKhUBjHYgDmgsFgLpeD1jPeiyhEllxjy7JYTt/e3k6n06lUqt1uv//++7PZLJ/Pv/TSS+12+9GjR4BvdKzz+cETT0tYWNceBXQY+hK5XA49ZXjcQId7vR4AJsdxqI2L+QJaKxNXfBRQqnw+D30JgiMcjfwvDH66IKKpDZMIQSeeL6jHJBNBehiAIK3JEJ9Fo9FcLgdzDHD5dcaO68XFzudzUCfw0AFLRSIRMBFEBCk6xNSg7ctIkQQHIOla15tNBtFoFKaOsIXEb8gaoHEc0lcoPjcajcFgADFZzeJEkeP09BT6y6RIpNNpqCGLyGQyOTo6qtVqsPsALIilAPaAruvW63UIFITDYdDt6XeUy+VAbq3Varghn7I+4Xmef9BfppMUMy6RSKRSqWAwOBgMarVar9cDVgioERQSsMVJQudNI2DEZAafzMZhStO0Wq1oNBYKzuOJYDLUCc9Lo1nA61uSFHFEpstwWst5aoDYVgBxUCQoVlSCESscdxxHXM92nABIxBg5PCusVxg55+4ljsOx6jhOJpPZ2toaDQZahhujKxaL9Xo96pwQnsM9OTg48DwPAg7oegH/F8uX53lQJEwkEhqZEsV9402DHgs+FqUyqMqIyHQ6bbVarAuOx2Ma3XCWQcqwVqtB4h+ZJCjDUAqGkx5mfbvd1tgEph4eazweB88I2xPE0EE6RhEX4x8LPjwAdEXqc4SJLSsaiSRiMcu2naXCr04FmZeS/0tuETN5DRRiWVgHEPPDWfBYCb6slFyUjSY8+tM0c0pzCY0OXx0zyEWqpgZzGRTJGj8xA/zVp6pTdCbq/lxdLrqPGuvVOsjJkJvYQCJe9wkrAWJd4mIvtsFi4+Mm49sgV2r3P8x68dnf8c5oiV7KMpwLPU2nwX4/cnR0GUssudjJsQFtN0z8VqrZArXkoMIWhj451I/p44pBrgFiP4GUlGHKpOrL59KK2aEBYsr900FBY/ca5NWXiR3W4ERrV0PgVqxhcA9iUI2VirrABHbZQ2AIo2NHQFhFuNkoiuiKsoFwcdpqX1aESWjsYKGU6w9haD3r/SPckCEyppXxXxsiz3VOg/rm0zHS8Mz8c8tq1/VArIOPsWWgkIyIF5t1NpuFMR0iPVm27rHTDht0q9VqtVoIFwkQg3+AqQp0mKViapKgME8pCWSFuuGy3W4fHx8fHR21Wi0oXNG0AHYa+KWhlWQI2VMdi9fOWpGGaDmpUYROJBIgMBldOJp1YagM64oUDlCmaHnHKIt9jXon1YVejQUz8TEKTufX+2mH92xJXpgtg1R3KRmxWP6XJzJdvn66fBl/uDqujiuA+Or46mLEftMSx3ESicT169cB23300UfNZhOdL+FwGIwnRFEImETxAcEvhsAlsjjsHMAj8GKw2+A1D2JpMBhEtwsjSG0LI6r9U+v6IxvHHmzbdiKRgDUc5FOZ/1PhFKRaWSW1HAwEurNZt9vF/gS4TSvlp1Ip7MRkg9KpBnAA0DpcTjweh5QExUkhigfJSKhNIcJGCRodxPfv33/w4EHn8HASDI5HIzMVZ492RCQmkhQJyWBmtTrD+aQbDAZzuSy4b1tbW9euXZtMJmdnZ3QeqNfr7XY7EonAwg5BAFmiuFEwvseTQo7U7/fBo5xMp8PRiABxNBbb2d7uBoORSKTRaNDBqV6vwxCPIYio/j6YeoGHfu3atcPDw4cPH0KQ5OWXX0bQ8OGHHwJPMZym/6Tmi54yiKi2trb29vby+XwkEgF9AM2MIGYS9aZ5Guyq4N3HMGs+n0ej0a2tLdgYQk2bGActjNPpNKArrQeCcQ4xbs4LvIb0OqLSmGWIYkkLwgvy+TzMA6EcQkBZAwGQCY5EIt1ut16vn56esgYDGsVoNAKHi6ovWtSPzxRUd0Bd1JfAt6RSKVAwRqNRJpNBXwIF4HgmFHhBJQP0WExztMyDCkTXC2R3qIvQkguLEs5cRPr9PhkQuDm07COkAsoJEgYsXKlUCh6AUPtdqfzwDHnOJf/LmCas90BtFuU3DB6o8RIswHPhU6NPmlyUZMVbMKlZjROR0WjUaNRFZrmcfX3r/oOjSv8sPG05khCxRYZLjBg5rK0wYkfEW9I1AkuF4ph4cRmL0+6H53MvFA44y74HrfbI9k/y6RLxeDYSgemiLL1Vc/n8KBxGigKvSEIhZK6RZYMyA8iD4Ons7u7evn27Uqkgy0L6h2UcO8J5KKbk7GntouUONAU+nU57njcYDNA/gYIEihYkxmJkBgKBTqdTrVZBUEJBDu2ugInRf4pPQ5GG+ybmXSaTwcWiFIebwMc6n89rtVo4HC6XyyhkQn8QeA3yQ9iHalTlMz8SiUQ+m3UCAUeJD6LrQgPERn83uEVaCUpLQ/Ce4zFpmpjmdBsFG+JQzHWNTn+dFRvKrVoygoo33Ps2eLvLRe4qYVyD7qoldI2387sM8Et7EpL+qZUWCGRryNXoF/Zvef59UCts+CnVWhZsg6mgf2UjrE8qnP5kDQ3rYSA+vvlKKQB8yEpKNb0lZ9PpeD4PRqPhSEQ2NnPoJXhzuOJXpvZj6BqFweDh2ICGDEJNlFQ5yDlf/AC6VlgmQEyMmAo53CWJwuhxBfEooFfkxobDYYC2WjsCq6XuJSL8pGWRgsEgix9+XRRiuyzgabNEUia1SowBEGvivIbG/Ox+f3XEb8rHQWVo0BnEdgMj1lGKX8jFEHhZuTL4X2z8r+HuZVg+GrUo+aNyLL5IdPgyvCh9EBglUxgAMRynYRiL2ABbJIYupIdBixkOh5xNCDmQFeIzkQVzGWeWDcMDwNDFYhFckNlshpoxOA0PHjwAx4ihC8i/nBFGZYhy2HrlR23bbxyq90eascdisfjywN0wFl5dy9QAMQts5xruy1UaXRoEhf2WpPpB6LVLN5EYW4woysGnOOZLFJglLsK+3vKXnsic+63vh2c/7t69KyL37t1Ddf/THPv7+/v7++12+969e5/ti0Ukk8ncuXNHRN55550rxOwKIL46vvqg8DqOjAaI8/l8PB5/9OhRtVoNBAI7Ozu2bXc6nZOTEwCp2E50PZ8MAmDH9JSDJMVkMgGRENgx6qXYS6hH7FcaFdWrayTeTAURIkPNFp5RfBmSbew9QJHms1nwIvLo2HYgGFwsFriuVCrF+4BtntiWNgBhQot4AqzYWq0GJjK0AsCPRq6OtBbsaZwetCyAasFIqj8Y2I4ViTiTkGVp6x7LpzIREInLzB51OvXJqIXPxxMBsAhEANxVCP6Ox2P0TGHjpwsfcVgwMTudDqBG4A4A2kbzOQA7PONwKJRKp2Vp6oWaAbrsW60WK8ZsZkQhGk4InU4HT6rX6x0eHh4dHd28efP5559/9dVXu93u2dlZq9XSYtNfZOz4VDOIZjjXrl27fv16pVJBdQSsQND00OAPUipGuG4LRY1dyw5GIhHYGFKzjIV94MLgD5L3Sm0+OsgZ2Yvm0fA1wK97vR6zLIAy0Wi0VCrt7e0BNtKAhcGNQlWG0TN4ExjSOB/yfajTouktOD2A3el0Ghxhks2BZhK1BECMWUY8Tp8V7g8uAW8BcxafgEUAwDeqF8SsNUIRDofxRWBlkmtMSggeDfjgwN/xexRRcrkc6NLpdPr4+BgZwsox88xjFankOqRJPyBkO0jg2+02UD8SgTnStDKjFqHDvcVii/VNlm0ByAoCgUAymaTtT7vdC4WCL7zwQeLeq1YnLyGRrEhgCRAvlJqEEd2TPhw6FyOeJ6yjQ+c//U+Rv35tsbPrOLZlYHB0MgT6DyWTVDpddJxoNGotL3AyHo9HI/DxwQuj6B46HphUA72l9ggGPC6zWCyiCQBz9pLLArJBVk/j8Tjo57iEWq2GiiAEds7OzqB9QVYRTVabzSbZ6MVicXt7G30DaC/A/WdNCOONQAaKf3iO0Wg0k8lg74aWBQqB6IqFf0AsFqtWq1iOAD9x8dHj7TOW6BFJpdPlcjkQDNpLCXWDoyc+BjEPJq4G3LYO7sRo0Uqmhjyi5v8a0LAhJ7XBxt14GX+ppdL1TdAuZBQB0ACxZv7677/R3q4fkyE1q4FmfUNESfquBIJlo20g36shNr3I6x/8UKkfmNM/G3IHGt7lV2hnSJYKSEDTcrHUzFlnCseILhgMzmezkOuGVV/CEwfzJYvZht6urBL39JN/DX0qDYsb+Kl2wWKrjWYQGzgOAl3KXBjqFhpBpk8AVn5OUiPkYJcP7j8wZUNknLQSCjtQYp5gvV5/jOoyuw10HyFXLSPs0QNeL+/+cgXPnMwP3XbgF/EwHqsffNQYsUbTuPisa+JcWZfS5RP/ErRBKPzq2BBocanB8GbpRUvwoX7MIeSvsujCBg7ypSBFRSkbvW4jNI3H42Aq4JVUUwF/CH53w+EQsQplvvVpcw2kOBu+C/V+knaN0aJHrCGvT50HDRBr33J/aqC9K1g7ZxrODdcYkH6pinWrolyuf+5P/9jf33/rrbdef/11/ubevXtvvvnmp4Fff/CDH/zwhz985513vvOd72z43h/96Eevv/464Agcb7/99k9/+tN1X3337t233noL6DBf/+abbz58+PBq6bgCiK+Orz5SrEMNQDOg4u7t7RWLxWq1+vjx42azCSR3OBzW6/Vut4vWVGwe1CCGX/x8Po9EIteuXcNuN5lMYHdTrVYzmQwQHFTM4Ox048YN1GB7vZ5t22i0IU8NexV71vTels1mAQYhFUdqjexaN1hpTdLzIHuZsvAuhCORUrE4HwxwaSh+ImHA1QFRIpeZXf8iEovFxuNxLBYrFovPP/88LuTjjz8Gk2uxWMBtgMQHjTLDGgjMx1arNZ/PK+VCLFcZbr80je63rIsSZvYSUiFYHJZWp/Vu672APCqUdkGgQPl3Npt1Op1erwehjHq9HgwG9/b2KpUK/Bay2WyhUCCWgf5B6FvBZQukOZxet9ttdDq5dnuhhZuX6DAuExe4u7sbj8dPTk7YRgR8jSjeZDJ59OhROp3e29uDAsmDBw8ASt64cWOxWLRarWq1Ci1Uf1b8+fnXXX6yiLJbAT5VKpVKpRJVp2kYheI5Y0q6UevrIuLJNAwzi01VlJXI5XLQIybDHaQGRK66O4x8YSPxpsYL0Gd2erIpG1IqkCZgeqNzdQ5dyKtRrbjVauHFIEfraNhoCiPBAXIWkDrR/pa8CYlEAmQKwMdsPtVXhPPBlEcFCCLCdPVh6wAVVHBL8YGa1CDLPnScIaaATtTxRZFIpNPpYMrj/mPKA3ZEzy9oIJ9TYe8y4x/lN9CoiXRjqLB4g0RIsxeRThjmXcTLmAhRZQJIooh4njufu91uLxNrXitkqoFkbxj2wnIuRrxYYsTeKliFKhOOSEAWYTk+dd752P7f/2/nO7tIpTzLuuAkBkATTHnQcCqVSnY+dxwH3SEL1x0Mh51uN7HU4KYFHAEC6toTCyCGAqS41+vVajW6wD3RNtCfw1B3mCMWVTdgxK1Wq1arQRebddBoNIrOFfjmAR1GQQji8iSzU9lc624TFgHDHdcCkBrIDgjvunLT6/VGo1GpVMJ6MpvNsDJs5r1+VgM6nU5XKpVgKEQGMaXViVURcNT2XEZ522DObk4jNeZr/FKn+nJR6NPw2zFQWo12GSwt4xNWMgG1tZd+DQHidc9iHU6tv9rPptT3TX+pTs6JlHGp9H8X13Z9zw1KpuExaGBnGlPwg/J+qGsdYC0XPf3IFuc2qhulWWPgZuSHToKhkGNZEc8LBgJP1ci8UjF23VphoNXGI8MuBsIg8R3EjQjU8QJ4TpKywHYZSkZQVoIgl94fNf6r/eK0rx23AM5EbI54MSga9HPTH8VZrKN3osx8F7Ye7btLDQfOQU0Y50Pk+NEN6Tqs0jmO1sTwyzXgJLGDA2jGqWK7QUhG9FnHosZc2LDgrCzoGmWSlSWrlURjPa30jDOUu6+ODaulpqwaxFWN7HMN51LprjlW1iSIkIoStdADGFs5M1YUszk95aL1pWY2GKNiQ0XB3ytsLJuihCb0rVgppc257y9I+CtwRknMYNZfXi/7841GvpDj7t27v/zlLzVEKyJ37tz5u7/7uzfffPMnP/nJM3xmJpP53ve+t/k1+Arje0Xk9ddff/3117///e///Oc/N/7rhz/84VtvveV//d27d994440rNvEVQHx1fGW3yXWeJ0iYwbaLRCIPHjw4PT2FdTLayQEBQ/4METbIs5Zl1et1tMqWy+VXXnkF/kjT6bRer5+dnT1+/Bh1p1Kp5DgOeG1QYCgUCgAiRQTubXB7A90SrEx98ti0UqlULBZDLEg2MSEtLW5ApOO86wp7mGq8isVi5UplNhiQCoGEB0S5VCqFswKeAoQCvLP5fB6LxQCdA/5ut9sHBwcffvghxIgBJOXz+UAggCZl7rgQBUZHc6vVajabjhO4fqMcX+x9HPxmv/c1z/MBxI76Y4mEpDvqLU4PUrH69f3bANoQy6LyDHcjuBlA5SqbzebzeeggJ5NJxOKO44DYe3Jycnp6OlqqW4CDDGnXk3p9v9Nxl1kKGJSRbBbgPkcUUGM0XtEeEI8Pz2ixWDSbzcPDQ2AWkUik2Wyii2p3d/e555575ZVX/vN//s/1et3wZf4jFlFkjQk1UKdUKlUoFBKJBAAgsvmQNYGYyf5QZqRM80AK0DC64cUECDWdTudyOTTR46HgkzVATFFCoMOZTIa6KDp5AFoKSixgJuC8xWIREt6whdRRI4Ud5KIRExV4KcxiEJeISmgPDRJzICsMKJM3gYk9RFQxQfr9PgUxiCAj7EZPH0YaWuO5XDDUDgaDmUwmk8lAiZW9tBiTtKbUMmrslgWVCcUSpJ3sMaT1OXipJDEREzRGy+ehpq0TYD5ijBmU1kajEXTJ6bdG4Ik5ANVv/aKfzIW4qOpuZTxHEQmFQpbl/vVfPbx1U/7Du/sftArzkC0jkbHIWGSi1N5WY2zLP56ILV7IckKOrKJAQTNha2sLDHrUw/LFYvj01FKwsyacLlFsD5eMkcYny8kI0IS4DIQmarUatHcAmz7tPmvoybbbbSh+dLtd9HbglFjLgewScQEaP+KBYoCRIkRTSlHKg1w6wOIfjUZ0K0UFUXedg6ZUr9cjkQiccID+g9kUjUbxoD+nypwlEgmH44lEKBwOKIkJZs660GuMSc0B1FmxoQKxEga6JEDMF2t2mB6H+gMN93Y/4qkb29dpiRqysKJ0D1Zejr8Ip+8Yb5pRTuMLsB2vpJhRjwgxlfjovX7wSy93mim2DtKlyhbBLOPzL8Nb98t9GJfvt31DJZULtdavIHB5PvaUiMFlFmK5hC7QOoxP32Q8CDwXrEUIR/EaVKC5QWNjZfOHRruMeFiPTz3SVg4q3lg98nEabKrjPdSCb7rSxkOrH2jSMYVQWF/Bt7AtXQ8MYsSsXvi3KqxgfJmBT2G80ftuJUBMhy4CxDTsMsz0/JDWSgVqv12ejgT0irSOROx/o7EqGlR6HW5dHX4dIb0AImZGMyVFFbBEYA+loiCsCOgCbdCHsYTqKcPgfzQasf2I9Hk6CiCMQRcR+0o7nQ5sfobDIT0k/bqLhva6LFnDbBRg+ccv42MsufrcNHWa7iCienTYDqU/Qe8+dJhkXsAliEUmf7XVAJf9tOLNzsx/+sf+/j7R4R//+MfvvPNOu92+c+fOW2+9lclk3nrrrYcPH7799ttPiw6vRH7XvQbf+84779y9e/fu3bs/+MEPMpnMz372s4cPH2rM9/XXXwc63G6333zzzXv37mUymbt37/7oRz/KZDK//OUvv/GNb1zxiK8A4qvjK44R+7dSaCyAvnd6etrv95G5wbKJoSoiPISh4JCixzyZTObz+Xw+Dxd16A57ngetfVDwUqkU/NP6/T6Am1gslkqlXNclQZIxLtXijECKWoQIUv0ohuYdXBBd8jx7yTXDge7yTjKJrZ3yeVApRQs8c3jt0QREDLspaJ7FYvH4+Ljf73e7XXC1gAuLr2UGIQX+hs5vJBIpFTPB8a7buT7s5j3XNvNpS/1giziycBez6dSKCVA2NscBcB8Oh8BqYaIFb6VkMgkuKvAjXCms/Lrdbr/fJ0CME+t2u+12u91ua68Dy7LCoVAgkQCTFNE8/wZGKUrYEfQWBGTQG+l0OnCXCgaDvV4PtQdIbSYSiUajYdA0/ojosP83jOzj8XihUIAiBJzQAPpjaiBcAxCMIA/xFrR6IbUMrQMwaJAtM60FqxeTEdMEEGqv16MOOMzNkRkSW8EQLRQKlUqFLF2qAJMhOBqNLMvCbYcOGr4LoS0Hqm4Qw5gn+QiCaJRn9SddWopa3zeSbePxOLn5JMsgQEciisi41+sBU4OJIiJsIMhQUcBSg+oIUmV8IHwmU6lUMpm8du0a9IUZDYfDYTTpAzYlr4ppAE+p1+vJ0tMcc386nfK0gV+D4wlXQOqx+JV8Pr8hrbNczEokHqVSaWdnB7kK6So4fwqVYN3jqkskEbwz3B8mFfgNylFYcAKBoOPI7duNSjn2/v3yh01PYiI9kb7IUCS2dPXw1ujGeQojdiQQESewOglAg8vu7m6xWMRICIVC4UgkUKt9MknBpo9Gke1D14g7FJYm4CxYhWChCRFeTbSpVqu4P6VSiWLfl38WhkTAdDoFdxiecmgZwRRIJBKQuej3+9ALRn5FeRm8Bu0s2Gs4XLmGa6Feyq3Adw6iKKDCoTRLxqjned1u9/T0lI52JCAnEgnMbvmcNIgtywkEwqFQSDGINUDsl45l0mso8xIb0vQuv2SBgbmsBIj5yDSw65dc9APE+r3rBEPX3UnCdlopWF+X1jX24x1ka+oYQxs2+DNtNibj88lFFSWuRf161gXlIpfNb7zmR+HlItXRX+mX9TLH/mBVI/va3098BGQNamg6M2gHmCNA/fjVNEdijfPyw97aCASvw/tWXppW6GJjB+8z61iU9+UrDSIwH72fCG9Ey/4Hx/FsAMQsACCQw3BFuG4US/zUexLG+URom0m82wCGVlIgV9oeUj0GcQ6pxKwiczxs4CHqJYhANuv6Bvtk5YmtrAFo3VV/5ePTLK1GIeQr1oz/DCjwOm2ulbcO8U88Hgf9ArYxaItEWoeKAqovyKQQdWMMIGAYLw8menzcmLygL5AsTJdpeNMlk0kRgQAjt7ZerwfrcjSrGW4uJOZj4ugyj94ptIa4ARCvvCFIT6LRKJLERCKBbN0oK/o5IrpWp/MXvW5QJYZJhK5HykXxHLbx+fFijm2jdPel4BUDXRURzdi9d+/evXv3AOC+9dZblwSIv/e97+3v73/729++c+fOZnQYL8ZrNEn5neXxd3/3dyLygx/8QAPERIe/853vUKr4nXfeefjw4c9+9rNMJvOjH/3o+9///hWSdgUQXx1fwWMdOhwOh7FTep5Xq9VOT0/BA9WOxkw8sIIjI0UamUwmwU4lCAIIDLKqp6en1WoVSrXQ+e10OoCP0+l0IpEwEl1Ud7FhG1V3vVPi3NiHRbNXtJNDAhjblW5Z1RIT0UikUCgMmk0EBIDYIB0AGUpgatq4hvsZ1DZisRiYX6AbI8XixkzDDSOC1Fl6MBgsFkuFfG5Uj81nYXdorc5CLNWXbUkoHMzmsuWim8lmgR2AuA10GBIWruvmcjnoVwK+BwiIBnncmV6vh15jSIKgBA0CGjqdkT1qVmkoFApFIiBOoiwMtggK8nS/Na6Ubc7dbheOTOl0ejgcHh8fn5ycgNecz+ePjo7wmTodlc/NK2lD8O2vqTBIApx97dq1XC4nImBhD4dDPH06p8E/ShfnSR+ORqPgcZMea3RWAvYlVYeharPZ7PV67BWl1xCJD5AUGI/HCEZLpRLo9kBdGYTlcjloI2SzWZBMcbGa2IV3EcACskYLOMosEN0wfGZIOEWqRkIxMGLGoERnNKkKiFgsFkNvPtyisUwhfsUdhkCbll0md6nf7yMSLZVKW1tb1PrkaoA7iTgetRCkAYDd8dBRxfE8Dy550NCYzWaoZmEwE+7PZrPJZBIi1MRBNHDwdD4q/r7UNW/XQhkAEFHgAbE6mUzye4k78BGThUrhSPqLUuwFB9UYJpMJSoCiOhNjsYUl02R44cxlNlxyh+lT98Tr9vQqh4G34s6EQiGo+opWfrxIrTrXf49EwAnCoJUlHR41SFhHUh6dBT9yV9vtNm0hn2rlMbASzAgUkFBDwg+WZWUymWKxmM1mp9Npq9VyXReen5rwyK5nQFrksnHG6RSLnQdk86GzhIw/yi5xmKFix8UZNWCtP7ghzf6Uh0Ppw2XNRrM+iToZcqskbRl4ltZS8LMjN4C2BlCrGbuGdKlc7CU3WMYkZq78rg24oQaINTxNHUm9ovpnPZ67NvjVm6bfSo5vMbAMfiZGkdZIoYiEVu18os6pfqUBq8lFB7DNjcZ+t09NA9e3xagQ+JloiNl4h7UFq6Za27Zt/TGoasZ1+YsN2PSJAWn8V9YY310GWfNj8X5lFS5KWEP0OH+i09rKyGodoLmy2GzIlfrFTA35KUMTzC9a4r/wdYaB66wUdanDPxc+25BVR8J+KrGuwei5+edGe7pkwksnA8gS5nK5crmMyA1sX5I5EBlCcoq0DAw2bOij5UFBM92GpbWGsa/B/g5mMIVCARyFdrsNNwLsAqPRqN1u1+v1er2O5MvoGEAMgwWfkao2JjXs41bW27RMBG8IHA5gLoJ4Y10BaaXUPsXKKAWDVAgLF+MWanyRcMYdn1a0WsLYX/Q6H/CrtIb+NI/9/X0IQbzzzjuGnsO9e/d++tOf/uhHP8Jr/GoP/uPf/Jt/A4+7yxzf/e538YNfwuKdd965d+/enTt39KcBfRaRn/70p4aR3c9//nN89fe+970f//jHVyTiK4D46vjygb+bgxIjheDrA4HA9evXX3311WKxOBqNPvjgg8PDQyA4NF6jvgS2QDoRLyHO4v7+PkQb6d7uOE4+n7916xZcWUGfLJfL+Xwe5LtWq7WzswNRWlGd+8lkEsKI8D3TfYJaPI4MC5oR9fv9Wq0GbCgSiVy/fh3utNh16PXEGxIOh/f393PxODr3ySLRLq4aViZ9iYQ7nBXUe+fzeafTQTkabf5kWyOLo9c8POuo+bC9vX39em4YLeyFwu9VpG6Luw4jhtyEK7lc7hvXv3F9t3vj5s1yuby9vV0oFABtwGsuEAigWL21tZXL5dCDP5lM8L/Ysy3LOj09hRnC0dHR8fExKBjMG0EDTyYSdrOJU3ACgVQqFc1mA4EAvM6AACJkKZVKvV4Pz4IKvPxM6CMfHh4uFotKpfLCCy88fvz4wYMHjuPcvn27UCh861vfcl334OAAJ2k06H2RMPE63TcEQ5FIZGtr69q1a6lUCrEdqX+4dYQvCQ2D+oqIEwMMNFgRAe2afscUDQRPRx8ITEGb5Z3B60E6BoSEcDYcDvf7fQrCcNbg27e2trSnE6EQv5XKfD6HfCoM3DqdDtBqtoLKssEN7FTADZr0RF1jTBzOMpqn6cZPtrpjjuDeAlnDoAXtHdrHRIgAiQ4GA5jUDQaDaDSKQQifOureAFVHry7+ORwOURJD4z+pcxomns/nYHNzPCPeRXEFjoWY+LVajUTmTzPw/ImsXt4NPrss/dwBZOO6UIaJx+PD4VC7DDHsxsCgsrB2QAJGz9djhGDZR3sE+O/AH+fzRa8XyKblhZcn7x3MH9WcRUpktASI5+sBYm/5hxRj58no+YYuWse2U6lUuFKBLCVGDrYSTE/4K9q2DckRXjvuHmYQ9qlut9tsNrGSr1SKXJemavLObDYjNIxSR7vdtm372rVr6XQ6n89jTQbNH9OKQwukHiSr1JCBvoqWTcRkQcNBKpVCDUP3+ujzwZTRmqGs53ERowGAX+dnpZjmMw51BfasM+zyY2dGauonSK6EUy8JEGvilZ8IaVhObZCYWMn23QAQ+9mdskpE2P+x3I+0lxcmqXGjNrB0/YUNA2XbwLtc145m3O0NEPA6KFMXhg23jM3nY6iIaE88UcaAmtwqF53Nvki9S2v9sfLFpEXLks+rCe989Otm6DpZg5UU3ZWap+t8Bdd9izFVN7irrbt8f0f8ytuiqRt+MdkN/q5svjE2R8PJcGWT+6eBYo0beBndaqNgtnIGfRnR4cvvI/5Vyw+amyHBRe0scIdhxIID7ZWIk3UpHTQLSPa1221KuiHkBnCMX2qBJjA/kDsnEolCoYD2MgDEmUymVCoVCoVIJDIej2u12uHh4YMHD9jcw1oy3KS1ZLYWWNc6b3iNbu/jLFhXaNHudgh7UqlULpeDFCGiIGP66BqMMaF4TyiMEw6HiZvjZkLtTYtB6WYXxDZQdGGnFP4XGQ2tLz8xKbVty7blyzDaicD+4he/8P/vz3/+8x/96Eci8u1vf/syAPEvfvGLv//7v+c/8d5nO+AIpWnI3/72t3lWK78a13L37t3LnOrVcQUQXx1fpm14JS8SsOzu7u6LL75o2/ZHH30EQhM2GJAHAfqwAQSLfqPRAOJD3yp2xyeTSdiOua6LHBt6uIeHh2jKPodrPQ/JLd6OlBW9P2yqNeJXQ32MSprD4RAijyi9giXnum42mwVC6jiO63muiKsCEdd1w6HQ9vZ2pVLRGx6hZ1G8Id3YyPAxkUhAmxhbdT6fTyaTpVIpnU6DK02fPbQqw1w+nU5PJpNSqYSm9Xg8nskWruUKi9vxwy3v3wcVQKxbsF2RhYgrMpdUIvXc889f3+nkiyWoBCQSCSCDlF4NBAI7Ozs3b94EdlytVgHzUSUKXfbAbY+Pj7vdbiwW03YiwWAwYlnp6fQTSxDHSSQS0UTCsixCLbPZLBKJgBhbKpVmsxnomTog4JPqdDoisrW19fLLL+fz+V//+te/+tWvptPpX/3VX7388svAlHEV7OyTL9ymYIPlLnrQoCdgXB0LJ+AFiwiGMZrx6SGjSwu4yYRiOW51kykbHlFgp/SKThchhw1nKraIgnsLhBqGb5w1BP5I4NW+9hqhgN0ZKNIAamksI8rQDN4a7LOGXAP0jo1Ey7AF15+jQ09DX4+kAwDW4G6wL5t/Qw+63+9DHh34L2aEfkaaUEy9No2JaO1mrbKN2JcAHMXmQLwFokddyGfrJPU8TyzLW5/N+nNUPFAE+nANdV03n8/v7OwUCoV+v8+8Atg35QjYh+u3KgL+y3ECjBXjATA6SLjJZDKfL4xG7s72/NVXxkeH0+k/BOoje9K1vJ5ITGQkslg3zUQs5WK3bI946mRbvSkUDHrh8HypI9FoNDAvKJSUTCah2aIbHpmrcOj2+/2zszMSw7G7XeZkiCdC8AeSgmdnZ9Vq9fT0tNPpQEmZKoSYI1gokN1B3kdE0MKCRQMEHwjiY71FzQPQNrSDIpFIv99vNBokN1G1gLbpuBv0W8eIxZNFfYWlJnI/N2ikPDNG7EfBNMBq3GrNHabSIjN5rebhJ5b6ESIDBvUzkXVDEhsjZBWDmO/Svl7+tHxDBzpFLf0SE/p8Vuo26oXawNooVsAqmhagwFdj66HuEPEUDDnKeuhYSFYxLjcAtdTBN0SlDTBuHVptwIvGZmF8u8H0XHnPteizlm7Xp+26bkBkgqt+moF9eQUhYjQrDbK01x//xiKAFZvXC0SJuAxJGwbYva6+YrjIstkOyyDtmqnVphdJsuZplaa/lCUNKlbx7RwSpE3wjbQS1Z603Pd1QK5J8Tr6QmSldSHkoqTMugeE5RG9Gnwc2i3TT869JFd3nfTBSgnvJ1YRZI1z45c9LfUu1r8vE5Nv2I9EiW4xAsfAAz2iUChA5yGXy6XTaXotckFGAyWwWghDQfBBd5ZAWYLLKcrPqVQKOSD260qlAvd1jHzAoI7jwNfn6Ojo8PDw6OgITYGYzqBkUbFXfOafK90m9dznzkIis54F5GfoLqXY8kAR2hj5/pqf+IR9cE8o0UP2ALZRfB2ZJVTVI3FYKyCzG5K1av9SCYD4Wcf9F6pL8dprr+GHlfZuDx8+fPjw4f7+/iV5wQYyuxkgJs/37t27xrdDWdg4qzt37vCU/J/GV14Sy746rgDiq+NLuRkbVWvgiYlEAsKmoN0hRUS2jOiNKzXsoWAuB19j3VEIDV94atFLPR6PoyTbarWQdWPbHg6H7XY7Ho+DfczdixGkborxpwT4DQhfjUYDcqWAMCAlOZ1OgQjYtu0h3dWZp+ctFouQ42hFTgIHBKM1SUFzUnDJ0LJMJpPz+RyRATWtmIcTEwTZMJlMokMfDNxgMJhKFfZy2VAqei+1+I+LwIyYhyey8P2ZSTgRzuay2awD/B3MQd4WhLnoyIbEBAKdVquFL41GozRoIs0NLFeTeREIxPv983Bh6WIEsDIajeLteGrAViDQQbySiAkCKYJNlmWVSqVoNPrb3/724OAgFou9+OKLN27cuHHjxuPHjx89etTpdC7TKfl511H8iQR4AdDahosavcURkEF5ALcCOA5FonmXAAzhiwDDoWWMc0pDIXSGRAQZCARASKQjBKAogErAdzAebNs+PDyESO729jaIikzhGEdqFEmLiIEE3ev1IBFDvi0eH7I7RMnj8bjT6QCAQ1AIlWToAhPqxdkiHDR62A3aGiNdZsiAsXD30HwACAxhMQRqKcRRq9VQoYFwc7PZBCWTjh+gDwP7sG07nU6DFYLPNOxlCPkhckW7AHR4sfLUarVsNus4DoRTUK/Syt1Pjab5X3MxF/I3TgK/xpoDkm+5XC6Xy/CExFVADsjwPfMrtrP/miQO4E3angU+KtCacN2F58l05u1su//6fzXN5QP/r1+Hj9rWvCnnesQThQKLEswx/tCE8ynxdM/zrCWS2O1268fHk2Uxo9VqQeaPNRu4j6ZSKaNcivGAq8NAmkwmrVarWq0uFgtYOF4GIeICggpNtVpttVpHR0ePHz9uNBqO46CrA6U47K1YVKGe4bouzF2pEcGW2Gw2y+eFVRT/C9Vg27bb7fbh4eHh4SF2ZFwFC6vQO6ZuOH1TQSJuNpswBqCKC52d/Nn4ShrdU8HEnwBkCgXGzquhTy3WwQZVop8aiiK47IcUDahRI8h6DdRYsAaItV+fUdbyC1yspD+vo83iKzjwNE1Y1+0MVNQPM1EXSF84tyRdC2R7BFcMatMzqqHGCM6Ndoj6Neu43hpz15gdn7MGiP0Sk/qi2C7tNwfTRPiVyLVx33hD2K9Nm0rODt3X4kwmsljM5vPL1vN8T3bzjKCHB3VjtPKm/xbhxbR1Jdi6WCxANqR/HVY5P//dqKFqPQ0iLxyTWh5ae2Rx2LAXB3s6n0g4HNaziSZ7KDawf4hXhJWHzfjEmlmT8AvLsPdFV46JC1NEWDMotTTKSoc6mnMCn+IlU494ZZlnQ41kHWnaX7XizPLvaLrs4Z9rxu83Q8x/+qSlSza/rkONV7qvk35B516aWJRKpUqlgswIJCQWjbBFIl1CWkRfWS1myEGr2+Di8Tg4wki70BtaKBQYg2FSdLvd4+NjQMPVahUuL7QrQA7Ok9di05iYgIahfUyWrl9qRpQwMbsN2IOFqYdUnfaMeloZq65RxjPKdYzVudGQOsbtCSKE4E9QhoILb0gdnHcaIF4hNKHceZ4eRrOWlITFeU/u+Ye5y1/ay/TbeI2oF1/qAOqq4Vo/jLu/vw9th8/2+OlPfwp1i1/+8pdvvPEGEV6Y5vE1foB4M9z8eZzq1XEFEF8dn+9x+S1Wx4iBQCCZTCaTydFoVKvVGo2GiKTTaXDEAHNgC6GfO2M4Cg8hkYAoLTizsVgM2163200mk+VymVDacDisVque54HY22g0LMsqFos7OzvYupiKs0GetX32pwCwQObfaDSq1SqYU4PBgBw3AG3oJ4pGowvXdSzL8eUVZCSxI0azF3UjJw1McA7cfcPhcD6fh88P4G9tX2uwnoPBYDKZRDyBUw0Gg7FYPB2PDJxQrO9YdbFi4sVFgiIB1akNQc+5yEyCdjCVSpVK4VJ5J5VKA60LBoPlchmpHVSYy+WyiOCxnpycwB+JYluz2QxyV81mM5FIoNmKHcfnYWggkGy3z3MGESQqM8V74nhot9snJyee5+XzeeD+GAAiAkgUEOdwOEwkEtDlCIfDUPlstVqtVuull166ceNGs9k8OTmBW90Xb8rst+LRsEgoFNre3oYwSCAQgF4Y3KUwOCFo22w2cb0YJADTESZGo9Fms4kHgTIMox9IPyNoI16AMcbqOgQTOp1OrVYDr8GyLKgMUzQN4mUgOKN1fTqdgn6ocU8d7zLRwlhFuIyiCx5rt9vFWxA6A30AGgtWKc4E/AjQAUBOZKyJcaUBYt5qzcLGbdRIjU7+Oe+QoFI4NZVKQZ0GAT3OXJaC0c1mczKZAEcD8sVHgzpQuVzOZDKTyaTX61WrVeh345ZihIMmDOIG5TiwvOD+2LadzWbRqUdyh6gW5s9poLJMRW93erLBB5KrNFZLLFCYgNp+B1G4NujTvYo0RWEqAiRisVgAaXUcezJxKhV58fa8tDP7p0eBk74lfUuGIkORyTLk1hixvR4pvnTU73rebDaz53N7uYC32u3Dx4+n4zHgUVB1qCCE3QRFC6o3oI2DsBGAM2ZfvV4vEomk0+nLZ7zE/lDIwWIInBqiH0jPtO0qqobEqUF719sfiqyYdNiIaV6H6iYKFQ8ePDg9PZVl07QWY8WLDeskIjio3eJMMEMvk7Q/c1fHJ9iK0uUwoBzN99QArqE8aygwGNUdI6XnZ+rklvQrAyA2qMEG4Kg/Squ1GoCarBJS0K6PrFT5m/QNTNZPtjWophp811Cj38KOQvDkbBpwGw05tYOovzq+IRAl6ucHiFeemFEVwFJmtKoYMJCfaW5A9v4+aBrnalIzQdJzPCIUwip6+ajb0Enwx+SGDoAGiIkRs8HF4BcjAACLAlsqdcMBm9IRl80BeKYs6ZFfjEP7AWiHWyI7+m4YRSBcEWIVWRoUI/5kh5PjOOx2l6X/AesTZA6iOs66L74uHA7r5np92hhyGLrkjrC5yq9hamik+IcrR76WQNUcbU2l9D/EywDEflxYLjYuaBfHJ+p+mGXRNV2hX66k9dOfs19kgzcfGSU9dcPhcCqVgvMzQmImsxogptc3D5Bp9Cdz4FEdGDMUQsMoAyNTgB4X4uRms1mv16vV6uHh4fHxcafTIYXCoEqQKaWxVyqq0VRZyx/pvUCXQvlG1mDo0kljW+a2/mBVW/is5Dro7YCVNlHttoiWNclMZxz68NfJ1skQG/4TT3OERAIirkhYZCQSERmL2CIBkdnyl+Fl025w+c/ZMmadPlWnG+BUQ9JXH/fu3QOZd39//7PV9r13794bb7wBc7m/+7u/AzU4k8kQs37zzTdpjkfYd/Op3rlz5wogvgKIr46v8sH1HU5We3t7kUgEgrCHh4dgwhITQX9rPB6XZS85xQSi0SgkaAeDwcnJCfWCR6NRLpe7du1aPB4HNS8ajQK6RfA3m80ajQaF6qEnsLu7CygNeaxt25lMBiZa8POBKgLOfDweN5tNKA4DcYOEqFY4AopRq9X29vaAl4mIrTBHy7I8EQqqMtQgp8aQ5EPAwRSR7EWEILL0QEC4zM9c2WIPbFRrBcw9cVuy+J3Ir8TbEtkTyYokRVyRqchk+WcmMpJkJPncredefFFSqUI4EsUOHYlEbt26de3aNYTX6PE5Ozs7OztrtVonJyfojgeVW0T6/f7BwUGv14vFYnt7ewA9kZDguoLBoB0OFxsN5AliWYFAYDyZnB0fU5cWbdQfffQRYGiU6FOpVDqdBoRHSeJsNgud6FQqdXR0NJ1Ov/a1r925cwe+iAcHB6+99trOzs5f//Vfj0YjIP46n/nCDi3FawSykUgEImKgYINgC+puJBIhkjgcDpFpIOhk3xaiH2Axs9kMYixs8jU0NJHv4StIX83lcri95BKKElh0HAdkBwq/UJwXc5k1D51pM1xjJQPDCcAWmBTIP0ejUavVQlCLc2NeKiJQ7mbBifC3Hvm03VuXRRvcH6NLlMS3aDQKwQSKnoMngnsFQQwQMMEHAdhBSEW360IiBisVKM/BYBBYKgFosOxB8aDuM84NggDZbDaXy+GBQpHjmUG08zuz/l06i+BtwU1Apg3fPFx7r9cD2xpDkbJuuBsclnhY5EviyWrgiQmGUThBxh4KhYKhcCwWKBRlt++WU16oJdOOSG/5JykSXEqoB5fsDXv5G/59uaib+F2v3++dnaWHw7TnWUsi8HA4nI7HtHAE9gqmjCzd7TH7WLZB2WwwGBD4BmIiIoPBAKMCu9ITz40EfAw57hHZbBZtOqlUCsMPG4fO8ZBNgfk+nU7ZsgquEx4Qrgi7DIqLnucdHx8/fvwY1T4s8oRRcLGitC84+1AzoC6NXiVQkdV64n7V0UtWplcei8VivlhYs5m1JBnReU+zgEke1KWLdXoRfrzAAIg1m1LPIEKKxl6j36txauM1Gqs1KLFaS8G/4mHF1oSplQ5UupZj4FMGmVcDxIZSAf9LS4gAOtSsbbodYipFo1GEVYYosPbg1dC81nE2RBLYoMDIiloi+sI1tGdEZUb/1sqNm0+KiI9RMOC1+G/1J7SAQGDmuuPx+FISE8sPsny+SX4wUT8gzFA6x1IGFxNQH9SXxzrGD0EbHz1gDZEHkg1Z62JvBFFdLESoCWkGA36vC0VcMdjYjqCO6BjWIs1E1gZu6Gng4kM8iIOHQDbrJXJREoSVDD9ArM+WCLUGiHW0o6MLfjtFTjUFZKWgkx8v3oARy0YJco0R68qi+NT2VxZR/GsvP00urYDx53DocgtgSj1guCYYdHWW7qiuy5cxUsXwYxEdnwwpJ8DQkH46z55E0PwnItBtg9MdqUh+VUNN7cfXafEWw3VZq9P4Bwl3fy32ou+Mni8rFY38zuH+tc7wnfO7Pq6TOF8pwr5hfn3qkR1bKpMF1N/AjvU/8ZqgiCXCBrLwE7wyVgHEEPxdeTBZ+MwBYlk64/3whz/E52ts95133iE6rAFino//wFVcAcRXAPHV8dU8DLgzHo/v7e3duHFDRKrVarVahdSAiCBWAzKF+if+BiS0t7e3u7sLm3jHcWq12tHRkWVZUNdF/3s+nw8Gg71er9friQhto7h1IQ8BOgxQg8wFvCwWiwEjhs2aDs4gm1ur1abTaaPRaLVa4M1Rt5Fma59kfZ4nhpQtGjmXrj4GqcTwx9B5MjtxGFOKkkgWJaS4QTyXu/4yvxFv4i2OxPuVyEAksgRQAiLzi3+mEo/Et7d3SmWx7QCepywFEPi9QIebzWaz2QR/jWpuoHzW63UwrIFBRKNRlKwRdgCJC8Zi2UyG5+l5Xr1WO+h2AYPOZrPj4+M//OEP9+/fl6VoJszZ8DN5UgDU8DmDweD09HQ6nd6+ffuFF14Qkf/0n/7T6enp2dkZ6N6vvPLKr371q9ls1uv1WBL4IssnfncXZCa5XK5SqUCxBGkSEDd2VJF1xbgfGQtAYeCJ8PHDbaFeNusKYH0aJJ12uw1WPjiwiURie3sbyjBAeXq9HnigSMagXxGLxXAmmJKQ4jV6+oywjIk0reHARwbs2Gq18EXklzGNobA1WtSBZ2mFlmg0Cv9J4MiaqmMwvIwYlL1m/BY0CY5GIyCbiON526EwS4IwRjuacCl8AcMQqFUAQQbpPhKJQP1mMBgg4o9Go4D5ut0urhowMUA0x3GQpQOBhTg1JNT1YuJfRp5t3V5Z5NMdsoAAxuMxZjTWRnpks2UbtwtlP0DDoLUSYcGjB44AqEibaGlRZuTk4XA4Fo0GAuHFIpBKWH/zzcXvTgP9hiVJkZxIUySs/ojq8CNG/DT6Enimw+Gw3myOarXoZIJAnhaR08kE0woQMH5AyRBTAwMJ9VEUe1C+Qg9Ks9mE2AtHEYill1w9sBTop59Op6H6EolEkDfin3heyPTYlBOJRFKplOu6sVhsa2tre3s7Ho+D64RlmWanGN4Qumm321hYMB2IeuMFGPx4asj0QETCSOAkpZIg+tnRV+t3QPKrVD3taJ7OZqiiWQpMp8SHQdHVYgt+gNjAgPw1DI01+w3f9LcYXGCSOrEeYvCwLcZIhv0YLusuGjjznwzxMt3hqxFnv2WW+IQp/YCIX5WLPdEoiqDASSUohhAYpdiG0MjMe67VeymFqZ8Xf0PXJt0j4l20f9BArf527b7o36f0BcoqBWFC+TS68I+BlRDbJ790HMd157PZZZZpjQ6vFBFaqU7gt0TTIajxS8Kg0DDVKiIEvMgEpNQVhUoxdKkozU12JUBMUmEsFsNGqQcYiv2IJahZxEheV8E1l0I3oeMM8RZdJ8aaGQqFSBY2ninb9VjjNBiLGmrXgJcePDrIN7TIjdq5MWhXaqo8lQba5pcZoNhK6M0QZPDPKT+Q/eeDEa80sdSzTP9gPGId26wT7NYPQs/olT4TmvzO1ZXLKb06jK6XlfUDyvWsVExaKfuwUsNdnuT7ahA1VlZBNox2a6MGmqzpsdggG/LEmfXpRjb71KyLH7b5n58ROv1FHSAOgy/cbrfffvvtR48epdPp119/HarHv/rVr77zne9soAxfHVcA8dXxZ3ToLQ1pM6CEZrPZbrcR8BFdZbMbtjqq18VisVwul8vlmOJ2u11gCkBp0SFLVaZUKgUNUHBa6XSHEyANUMuTIVIMBoP5fL5YLKbTadINkNk2Go16vQ4yI1AeWfYTobcdLXjgb54bv3qe+HqyXNd1VLq1UjLMEEjVmRhBYd4rxrvaOPuSQY41E6cngVOxsuK1RRJLSGWqhCbmIlMJ2oFY1AkGPded47KMvZzpkCjyJn4PPBG9z+VyGfQ08OmoCQDV6VgsFk0mIUyMGzGfz5vNZqPTAYF0OBweHh6enp5alpXL5UqlUiAQAKslEonEYjGk1lq2QjuTgKNULpeTyeTR0dHp6Wk+n49EIpVK5fnnnx8MBo8fP4ar3hePDhuxGsD3vb29a9eugUsIalUoFIIbISBjJGOkcuAegmKPMglQyFKppONRJD+9Xg/oFWAF0OQhoYsxBnuNXC6XSqXgnYXGNwgjgPcaDAbxLsjpwlN4OBy2Wq1MJkNTYH/uqs2XyMQcDAZ0akbmD5UMpJG4tEAggKiXMCVEkMkVAtwQj8exaJBorHlG9NnQhAiNL+iM13GcVCoFTDOdTtNsGpgOElcQe0HS5KVBHyMej5dKpXg8vrOzg/dWq1VgYUhxARyTUoqVDdrEWFIwJpFIgy/carXQUZHP58GzbrfbRBVX0qWfGSFeCQkhz8eYmc/n6XS6WCxiVQcfFgxoJi0ov6HLEpwX0hhxAzEa8WQx1NmfgS9ltweBhmAw7DjBYsH6F3+9+OW/9R4ciCRFCiItkYhIVCQu4ok4IqFV6LBzWX0JaEe02+1mq+UNhzrRms5mw9HIW4p3p1IpSG3gqZH3jbFE9SRsExhjqG/BVdW2bcjKkwR0yTUElRIUyVB1IH2+WCxWKhUCxOSuYvUYj8cQFQV+DQoSs01uKxQhpdQ1F3kRwfiH6RyGBPBunBVuILBvNNii1gUxfWy7mMiGwuO6nNx4zRNHuCcyGY+Hg4ETDFpL3X/oWVHJRHyMVK0U4U+JtVajX50WT5wQsJ8mLKpPlt5c5CqiXo57iBtOEpb2WDcgQix6rFiThIXrJXMcI4RdJnoIYUFbmZwbAKIhZWCg1bqwjXUbbV6oO6KdiHELJGjQlM3CEisK2qwJV0F9DF4XlTFJBDaeqYHNGZA6QElcuy7M6C4ubXfmB4ixC+haguHjZKAzeotxXXchElos5k+sCaHHeT1FdB0+uA5tXIf+85kCBmVoh3GI8h4CNoRwQKMoAsaqhiZCsulEi37qEJqOVTpaQBaAW4r1iuI8IkIBX1l6X+sRSI9fPcL5AvyefVEasTLEZzjdWCEw9Jr12NBytIQI/QDxuuel63yySspg5YpnQG9Phro2SglvAI4NrHBly/+fIf+JuyFGMg50s7GDTZTqPUFbisKTn6vLEvrh+gtCBtKKz4EyG756Mpl0Op1qtVqv15EpGw5yhk00FWPYciGKQewfLdzm9Hbpx68NeWJGIDpV1HVKudgLwuYPKvys5C7okoxWreGhy2DGfzGP9lt3ni+MOLcrgvyTjl/+8pdAh3/+859///vf5+/ffPPN733ve5SeuHHjxgaC89VxBRBfHV9xUHjlVgouXjqdDofD0Gr0PA/yuAj+WLoEkkuVWwA9CAeDwWCpVFosFo1Gw7btwWDgui4+EHBVpVIBKwp4ItWBsRkgXYGxO0CxQCCQyWSA3UQikRs3bkDmn2EiAJ2TkxPIOSGNRwQQDAaR24ATgd1la2sLRCrL15noqZ5KYuLMOpic6DiSDWhEgY1ExbjtK3sh19U0I45UonIrLR/2ZHgmEhUJiERFBss/I5GRyFC8iXiuJZ5HdFiU1ADjg3g8XiwW4V/EmB7SAZ7nlcvla9eukZQKFJ4b/DkAlEiAgnee2E8mjWZzNJ32er1Hjx6Bn5jJZF599dVsNguIAcYpACAANrH5HfAiEaWzs7N2uw01Erj6AsTMZrN/9Vd/JSIQEoG3zBcJExvVFNyNYrG4t7dHeW6kXo7jwAfZ8zyQTGXJnXFdF2gpuAOgBBYKhWw2i55ukD0Bw7H9E4IV0+kUEJKGIQD74o5tbW3l8/lMJgMACFWQXq8XCASAC1OSGJBQp9NpNpsAraCJxnHCyzQcaXTQBmQZ/HTaLXLwA4CGgDJp4/iEZDIJkibgyFQqRaNCLbZoJDy0Eccoms1m0BGmMR1nHzQ6IKiNEB9JJmSgQYMtl8sY2KCXor+hUqkkEgkugJ1OB7cLkA3QNzwaEQFkT+s53CKIwFqWBRC/2+2COg0EH9DbypXh0lDwU2DKWj+auCeyFKzSBlGOExwgL2ypGJpjvFEvBWU/MvIIbJF6ptJvx7ElEZewJ/ZI3IHIUKQvMhARkaBIUMRdtu5pisZTGo4ArppMpzKdLlyXzeAe1nnHwVID4WlMCtLM6bOKjhamIvgE3KtAINDr9WzbhtE5O7sveWAiwFkOch+y7PCoVCq7u7v0xiHjGPANRziayjm2OfCYy4mPxApAMxwOA80cDocUu0DxA4couYlwOAxh8cVigZWN1UGSCg0g2AAjjOTzkqv0bD4fj8eBxcJaXjgA4pVqvEZBd531E50w2dPg33/9zlFyUeJcS0ACusV9YOWJ9HDtsYODKyerg5iGbM3ByWAVwsoGfZtEIpFIJPAy7r+kQ66zgzMULfTvNUCsAVDsvIim8NAxrnhDCBCjZmyUDMGvZwV0sjyw5iC0IwubtU/KC+gzMRBt6g9osE/zozWarFmiur6oOQ1kEGuxAhqm+Q05LijeikyfRtjK34KzGQdc5/G4cnAaCKksqdBk2gIXxsKFch1msQaIUY1A7wtXPGqy69GiacV0/tC66pTQIYAlS/9SRH36PA0mL3YWPdi0DTVLwhtWlZVFIONp8kH7e6SMe+43slvpK7tuI15JIN28Rl3+oRtMVXlSx8YXHx7/scBffQ9Xkl5ZCoUiMChKyAdRtKMFKwRYEIRTgxiNRBDiYyJMTX89kjdIyiAsR28rfj+dTjudztnZGagwnU4HxTZNRtbGEgSs9VKPspxRqjeqXH45Y6PPRnu6YqnUPtVa+9gPENM9Vcs0aTMDRiPaXATLFCtSWEZY7GETAFJ4dtLo+qveGiz8+ZIAxO+8887du3cp++s/XnvtNb7yM/zeO3fuQNr4nXfe0egwjp///Of7+/s/+tGPMpnM9773vZ/85Cf8dp7Pys/8zM/z6rgCiK+OPyY6zGhJR05Ar7B3igjEB8GA8zzv5OQE/ePIbCmkmMlkbty4AU4TkyKUaovFIvxekUQBzAqFQvB/z+fzjUajVqshNSLqlE6nt7e3i8UifJNg9lUsFiFqBu4V0DRQFUSk3W6fnp7CmO7o6GixWOzs7GQyGWwe8B9AuoVdJ5fLIYC2bDswmVwojYKX4Tio8bI1kuCmtsY2RPTE19DqT6d11vpkiMe2ilnvv/pXsluU/+N/J785FImKhETmS4QFf8ZiD0X64s7FE88vXqY3ZtAkM5lMtVol+kBjX4CM0Wg0nU5D3FZ3d+LuWaEQdQnE8yaTSbPRqI5GR0dHBwcHnudtbW3t7+/DYBBRSDKZBGrveR7EtpBdj0YjdkEiPxkOh7Ztv/jii4FAoFqtHh8fw4YlFot97Wtfm0wmDx48+Pjjj3Vj+7p4+jOcLEZISjQNwsrE2iDVChwHXOnBYMCxjYGEiAe8GwDfOzs7pVIptLTBAXkBkShIi9PpFGArxjAiKnB5wM3HXOBDRNiUzWb7/T7GLSQm8bLxeAx8H8AolBMMtEsnOYwC6WIEhBHhNVuPZcn2Qro4Go0CgQBqQtRKwwhEvzxuEWiqspQyhPgpBccRvjPwZfYIcw+UgsCL5NKE89HZJqJq1BVABMayRhopYmvwiJEAR6PRQqEQCoVGo1G328UdJlcLrydYTz41nhoKA7jPEMnBB+JhGeSpzzCLWwkVsZiHh0KBIPr+ierONkAH3f0gylaIgw3AItoyAGxB8ATVOPZ/uK5YIvmc9c++6d6v2sdN6xMZYgLE86XUG52ivaUjyOUOUMiRiIySyUAgIMsVOBqNZrLZoG1DOh/YLum3XHyYhPhhIFQ1UPiBTgsJ70/1dAKBQDabBXMZJE1MPZDo2XTCB8cucpZmqZKkNQ1ItEebDlTdIcVD6XksC91ul+rb9BkTpdnCdRhSyJxugPw4oQw8azPAetlsn1ZaylhMO3NuKGwbj0x3RPklFDU0uRJu8DcR601fsxENENngORq5ul5RWbwh5UqzoqiJiXnEr9bStCvH2BMBYi02RYAYX4T1gV9hYHYcirq1mXrWbHnhtNKPwIDqiD4QmzAAYp4kIUhNpjOetX4QGkRm7YRfzfcaxHBtMuwfwJ/criX88VQxgz84MZBNXpdmfxvSn0aru5YcZfMH5XoB8WAPJUBMlXwGGFgBtN8gwReNyeoBaWg16OIH1MlxUHJkPp/D3FWLdHOZ5dWhEUcXKTX336+LIj5/Qv3Q9aLE+8beCB2B4zb61cD9YuUrlwjxicVpETlRXGP/53AErpToMZSIN4Sj69gnxtd9edWHV4os+7FgAz3nvOaoQBiWSCQKhUKxWESLJLd+kDbIAIDyvgaIoTkGXSbUlTVbluOQ7o4UgWH9D1UZWCXT6R0Aca1Wg5gexOW4Uuk5IksOMieX3n0w7zij/WIsmvmhlYX1+KTODHgMetXlFuBXEJaLxgC6EIhJR+jcv6whnUdCgRPQaaZRlGKzslZp1wIyluMEHOdLNMqBmTztf32aA+iwiPziF79Y+YK33377Rz/6kYh8+9vf/slPfvJHPNWr4wogvjr+mPvuyt+A4pRMJkmNIfmC/Y/cscbjMQ1zAIsAukIlFpSTaDR6dnbGVkRsurFYLJ/PgzyIpni2QAKhrlQqAKnH4zFKtQBZIGpGFUhuQoPl0W63h8NhOp0GAQcw1tbWVrFYBPqDrYV8yZUaEcFAwL5oDsA+GsNBRcf3egNeV0Z+4i99r5Fk3Hr5OUkn5P/634p9Jm5OJCNiiQxFhiIjkbFIW1J52X9OUimxbcvzbH9vr471gWAGAgFEJ6CmgssGvzXYKbDGbjQ2eoGAQ56FyGw6PTk9/ahWA8SWz+d3d3e3t7fBLaUCIPwPwU0GqIQQgcqz6HqOx+Oz2SyTybz88sv/+I//+Nvf/hZnXiwWb9++ffPmzb29vXv37vm9iT4n0oRhEsLfEOjEyGdkCcoMhgrwYlJ1QLcnBSwUCmWWB+4JY1wAOmj5h5wohFNQYqERPELebDYLfdJGo5FMJtEIjEGezWZRYoFVGvpzp9Npr9cDi63b7QLmIzPIsMXQ6Q1OeDabYQ4ir6N6IJMiMqZh5KXzfGZlureXeaA2ICIBgTRV/BdCYaiNHx4eglnJdJfhI5Yg3Hy0B2J4g/zb6XROTk6w0KVSKV4OLBApkmD0iZMeyKBcI+aIbmnwBQgSdFSCzk8lSvDkBVwNSz09uayRdQLofDQanZycgEBNmAbPDoMEwxUCFLiNYHYgT8AkxZ0EWgS6NMb8YrHA0g053WQyCUzcsqzZbO46Uio7f/vPvP/w93LynnhFkZqIIzJZKqrHRdwlZRjQ8EJkLjJb/uZJ0zoYDGLwpzKZSbcbTyZxT4LB4Pb2durrX3eWZUtMWCqQAMwiPkKg3IAMUNdJJpNPlN5jyiRLAr5GBkHDJECmk1hSJg3dWzL0qanCTIxO6CiWAP/FmO92u6Aj4cV0mQOJmCUog56PFbtQKOzu7rbb7Xa7rV310OxPCQuC1CsFEI3185IA8WKxsC46c/rh3c08MqNGYsCmRtHUQCfX+e3wA8lswo1iPz4HG82OKCKh7w9qivF4nJpXlDdBlguWKxwy0dihAWKW5QzlK6MmtBIgNlJ6zSDG6oTpz/4M3hN0j2mXOT2eAUGSZs4AidgKq8vE+g1RaU1AY1CneX+ar6qhRq0VYBgD+rmE6xijG3BAzgvHcVzLcp6mQ99P5VsJPRvEAsM/UGPoWiiZMRU7lhCuU1mYavjOkuiAMUYGMQ7OMj22ud8RopKLCh5+cVJ8Cw58LFF1yqmjnGDobovP3YHWJrgPBItXWgj6OcLGpNBESIP/qNuwtDiv/5P9T1YXhIxFT7cY+kVURLHjDR6JYfnIieBXinuiNsVK9smXESP2k+s3VNaNsh+dcsk8jUajmUxma2urVCohRAHVicMbw3U0GsHQmO444MWjcYpsAOPbMQUAd7IEQkmcfr+P2BKWdJ1OB+wrhLL1er3VavX7fZ4J1k8/V50rpIbIda1ocbGIxRqJjjdklfQwToa/pzMkBeVZsOEY49zR7Qt67pO/hWVcL9REEmKxGJYIxP/8FuLCuKXsWsCagN9gwflEqV9pSf+JH3//938PrPbu3bsrubfk+X5OkPQ64ztKD/OVIDsTWV6HOP/93//9Fap2BRBfHV+Rwx8NY99FZmLbdr/fH4/HsVgM0Alqp+QFIIcBSxFaisCPdNpDQorjOKAcsgSKEDAUChUKhWQyyVxat8RSndYA6bjhMRuhOTX2D/St42Ty+TzcqwDksS2F1UgR8fxcG9v2lpGl5hes7HzXZrLP0Dx+uThJwiF5viT3zqR9JpIVEZGuSG8pMXEmz70kd74p6bzYtoUEyuBTUMKJl5lMJnd2dqDFkU6nobmZz+chxooN2OBTnF+mCDIV/Md0Nmu1WrPZLJ/Pb21tgVQL4BIauDBKcl2XrmjRaBSKFjpsHQwGgCBbrdbp6Wkmk4FQycOHD2Ox2I0bN/r9fjqdvnXr1u7u7uHhIY3dnhaJ2AwEbwDxtWcLyL+5XA5U6HMjrOkU+TahWJARKGfGhB9gE241fonPQZbI1ILtxvF4HIAOZcLQ8oboCqRgEQHsi7eAqg/VyHa7jTPEh2Au07IZSSbEWMht4VBh0Ok4DmRkBoNBKpXqdrvsc0dkpp27dLc1P4dtp61WCxUdmKeBXYshh9BTFOOY/xyPx51OB+oNx8fHZ2dnEDoQpbNGF3Xcf0pA5HK5WCxGRx1462HYo+Xfdd1WqwWbLLSB47HCVJp6iMg6cOcBmeVyOSo54kEDHQZZfjqdIpwF3DNU8rh+qOKzqvZpsBhxP+YyVJjBISUCAikJwPEgvM9mMwwnXLX2VNGSfFS4ozcjufO45CXBcC6eFQ7Z+bQU0xIJynwss45ITCQgkhSZiCwuQsDEiN0lQHyJAwt1PBCIZTL2Ui3XcZx0MpmsVCw1zVmzYWrE0sgGk5+nWt4JvPqhOowi48W8yeQz+i1oDKiU5bder3d6egqRa2SeOo3UJl2aDYQ8kGVgXhq0LCqVCtS0oR6A0qxm/63k236aYTxfLCaTiT2f28uHQoe6dcKg6zj42rgMKxuxWp0wk/TkL+v6KcmIWFBpi8VigUBgPB6zukmPSiy/6ORgWstbhMCJGa8WQ9BrKVoryMTn8NP1xZUbkzZ/98NGfjIvTeqA+89ms2q1CmVMygojogNpgL0IuD8AyiF0ziWa/pyMzVhj0EORTw2/xK5EUEafNmt+xDeNS8ODRu2KERo51xpiM/AR1tKo361vzgWlS88L+Qr/l4mxNwAWRm1v3cA2pj8BHdaKMIY15sv9Vz90rngsimgPRq3pufISNOzO5nEdmWvUlSOEeDFCer+fJIcEniDcKVhUwFv8FRED61+nxqvpk1pFRCsD6FVaEyTXNStsgP4NLG8lg1iv8Ot2cL96+9O63n15+cKyRm7lMpem1w3E4dSOwKKayWTy+TwUotABxnnBcBFsDKQqVF3gfmRUtpgAYlvnso8gn7T9ZrMJP2c0nKGIiznb7XZbrVa324V5CXNJ/6UZtUztEarrqeumrb/srTc7HbpzJmqYmMVjPd243jKEYMeDfy01emhw8vTSRK6te2i00ITewYPq0Axi7PdfChli4rDf/e53/Sjw66+//jmhrvzeO3furESf9/f3jVfeu3cPKPDrr7/+9ttvG6//7ne/Sxz5ClW7Aoivjq8sWIx9Dsyv8Xhcq9XG43EymYTDVb/fh78NMqJQKJRMJuPxeLlchkztufjAkl/MRm/0YgM7w1bN/Q+hfzqd1vLzei+Ui3KBhhy+wR2geDFiTZzD9vZ2Pp8HW5aUQF2Itm3bDQRs1Ult23bAthdLPiNV8IiC6VBPc5AvWeF/tiOVkP/138o/vC/t+yJpkYXIQKQj0hNpi3SlFJOtsoSCImLZtmWAnjoCZqwcjUb39vaSySRAK2omQLsWFwIGqMGuglxsEPs98CPP29nZyeVyaMxPp9OVSqVYLM7n87Ozs16vh2oB5LfC4XAmkwHEplFFREgiMh6Pq9VqMpnc39/P5/Mffvjh48ePHz58eHp6WiwWn3/++du3bxP7W9kb+AyB6Yb3XmBPe56IoFEdQijQQEBEhSZ0VCOAhKIfDVkc1ZZxq9PpdKFQAByZTCbB8NWWPgjR5vN5PB5PpVLkBzHuRMAKzBeoH6idwIVTqRSAThHp9Xp4msBY8Tn9fh82elDgxXvZdqctWRgKY9bP5/N8Pg/1cG1SBDh1MBjQWc5I7TBbR6NRs9lE1B6PxweDAQJrMKkRaxr6ZUAHRqPR0dERgDDYUSKsNJhNJK8xeYagNlYkLG4PHjxoNptwlsPAAzwNhROSBDVDBLcI5at4PA45WiixwOyObGXU2NClCO2LcDiMbgkwwQ02ul7cPmW1z58z40FEo1FM7Vqthk5GLKQAiIGGY7IDI26326lUyuh7BZ6IeiGfPqch6wrUrAS0JOK5njedu4W8/It/KcOg/H4g1bZISiQmMl0CwXJRdNhdwsT2ZQHi8wsXEdsWw7xLrfC0msFrcRWgqhmeRZ8m0d1gCrTS8VK/nm/X6ahmuerKaK/XOzs7wzILrRVcIF7GwhWTW6Sv2KAhEW6QLnFzsIAkEgkU/1hS9UMnG9bblXoL647xZNLv923HsZRxoga7V97kldiQKJYT0E9C2/hAUmJZheIL/B9FIBX6lWh+AiW/1+shZAKwBfgYMtMwe9S1LtxA7QCmi6+6DkcRcJ4Vc+OVQ9TfRqABJg17ia+Dntx5dE9j4Wq1WsBqsXhalpVOp0E3JjuYJmm8vWjawEHOmoY11wHE7F3o9XqQ5tcABwNLQ+lSr3WQsNR4qL5duj3F4OwT09QQiWGCGggEgp4XcZyAWkaeOcxeCXFefnn3fIeGeo0lwv/JBv/a//PKQMggXPt5A+s42gYk7a/HG7oZ62pj/nvoVwXx32Q/z9fQ9yB0pT/KoFY887P2V9FWqiVcHf4Z4QeLvUsbP+JAUA1pQawAYBDjNxTmFkV1h/Nwr9frdrsI3jQf/Ly7ZSmKzUIj1hmqtGtuDZY1mFG3Wi0kodjX8Ha4qSN+FiX2xQ4kPZY0359ThsGMrJI3pESYe7EpR1ZpZDMiIiWZijR0udSNOKipG0uu/jS9kBqSjFx4sX1QJEev+UR+jRKvgQt/Ut62vzQixG+//Xa73YbU749//GPDDu4HP/gBfvj5z3/+OQHEP/jBD7SCBI/vfe97+OHXv/41fvjFL37xwx/+EG8xAGKcv4g8fPjwCiC+Aoivjq/OoRW7tNJQIpEQkXq9Xq/XoVIKuFA71JGlqNFhsAYANYIpCcwL/SB4OxJOtLRrySEayLADUZSplyw7FglWasYTImOcz2g0AtyJJJn1T1RrRYRWWqK9WcNhUa3ftm0HHcdeotv+2jU5F7o3jeSsz+l5BYOyXZacJ/aZuKcitsjgXMfTbks8LCERmYrnrnjK/uiKYAR0orWxsgEtiWqXZveoCw8013WWn7a9vR3f27MsK5FI5HK5nZ2dYrGIgQSW6HA4rFarh4eH7Xa7UCik0+ler8dIYjwek4eFX4Id/Pzzz//zf/7PA4FArVYDCBKJROLx+K1bt5rN5tHREdidGxqcLx/Qb27KM/K6VCq1u7tbqVRgN0folmqzi8Wi0+mgVY0kGuiNUpMBYDEANYijQQeNVzQej8HgA7uKBCtZmhrR8Q8jfD6fo5cNm3cmkyH3Chk76LHoCQCwS0Io3SlB/+RI1v4zmLCIzILBIPRYwRoDb3EymUDjBZ+JM8e5AV1lfWIwGGCA4S6BOb6zswM2sU7sdQsbRNzA74Amsr+ljlrGWC7Yj0Y7NfwAIYXhcPj48eNarQbRG6hvY7XBUNSyEqxCRaNR1EjYukhpTt0egXMG3gHmIOQsVlrWfMrMSnxCh4RLMGDi8TjaNXBKnHpYz8EXRvCNN04mk8ePH7PLDxIitJ8C/x1ZRDQaRWoBfz/0oGQyGVjBMA1zF/bNm95//V97125Z/5f/hzQfyVxE5iIRkYhIRiQpEljqDs/Vn89hTcXEQaZBmAw5HkG9T+n5bgA0mz/KL6ApqiWF8vc8q2AwCPIR5AsfPnxYr9epXQ72E1rOF8uD1FQUpQAIwhUHHQaoZODpAz/d29vDUH/48CEKJ5TBJX98Q13t6Ya35w36/VYgYDmOfZEs6UcDNf7lF1XgL7WUIfqHCBBjxY5EIljTMKlJ+9IfoqUYstlsuVyuVCpwQcBy1G63IW6OchfQ4Xw+n81mEU1hMVkJzBlolKY8a68wuWjFpmVz133U5TEsvemjkxpCmajzQa4dpUEo4INfhvsGjSNEeiiUYhKhEVuUZ+9KKivPGcXURqPB7cN41igwg6bAm6kVjQ1mn1zktIoSL+bCqA2ggC9rSwlWxTD1Zp6XmEyCwaB1mTu7arY/M9RoPFZdNNUXSIkSQjwAdAy1ls2wmsHP0MYbl3m7pt+yQqwhNjwv5yIhQ98ZrTau6SDrugTWrTybweV1MK7/nm8QtPGzNZ8YUm4oEBqmYZcbU1eHWS+kWno2my0UCmghZdMe1udQKISwmRViSAyjuQp4LnbPlfZuGqCUZUNhPB6HXhm+C8MeGeh8PofcE0e79jzH/mvo/2ithnW1E/6tObbsaNFwM76IyuOa9KNpxQa+zOYPVA3xT2q/aMxXa+Pw6wg3+0s1ZHThhNFvR1KIKAI4FSTIPyODmHXWTyqmT9nh8cc9fvzjH7/11luZTOaXv/zlG2+8QYz4rbfeAmP35z//uRaCuHPnzltvvQWQ980333y2LwWSe/fu3f39/Z/97Gdvvvmmxqbv3r0LbPrhw4fEpu/du/f222+//vrrd+/efeutt/jVOHMoUfz4xz++Wn+uAOKr46uzla5LU+FV1ev1wC6kRKPew8i5IOyCRR/lUGSShUKB0ABSC6gSE3siu0QTHwzxNb6AbloEiCkKSUF9pCvA5iBDTKgIGY5cJIFeSDU148yyrGWDHpU3uY9qm4uVbKPPKZizLMnn5JWX5LeHUn8skhQZinRFOhL25F/+C/lf/CvZ3vKQS16mOM9/+nVRdclaywJ+0pnrupShtESCwWA6kwlGo4FAoFKpQMU4FAqB4zkcDnu93uHh4eHhIaiaNFEBfkFJL6ToUM98+PCh4zjPPffc9vb29evX8fSr1Wo6nQ6Hw1tbW4A51kXtnzmdwZgmqH/A94mUKPp9A2GBRxmFF2U5qAheMHojlsG4ByMNpHtgrGA3AOcFl5NlCUI2mKrsy+acgndzPB5nyzB5B0DYLcsCoVvHxCup8ZqcpZW4Zam+R5VhDh46m+u2X52IAs+CmST4znRwMgoV+hHjujQugFHEuBbqE1ijEEpScRVwLUJzVC8w/BKJBLvvuTTpTnBHHbKKfqhrLfQnAXkc5QHcfMTon8lANShjRrGHFlL40n6/jysFf5y97dBNBikeUu8Yckhv8L/4fFRoDOUQognosozH47lcDgR27TUUCNiRiPW3fykfPpBf/7fSORJPRJIiUZG0SFwktNTMmYrMlcTE55lMAtjC3oHLxCUzA/xsN9lLLjjau1w301DsdTQawZEV9pWG/gB4oJQhxpoDChWWUPhkxuNxrCrQJgbxKpfLLRaLR48eeZ6XyWTK5fLp6Wm1WoXBKYa6kc6tXH41yvbkYSyCehhZTzr/NMBfx3cYADGTT72oGt1I2i8OJkUEiPVXa4A4l8uVy+VyuZzJZEKhEMTcO50OSNZgECcSCVRHkskkdBuwA7K5np0fxoqq8V9OK/918SoMpEAn/CtFPwxBZz+43O/3j4+PG41Gr9djiwDW8FardXZ2Rq0wbHkk5YFohsnO08ZmRL1yGu75HyhwQBQXIbKvwQXOAgDEKLiSvofNERVKBHv0cUKVDjLousDJCFMuEvP1vDOweBGZe15sPA4Gg7IUf1+3HMtF04KVnNZ1y8XKFjQ/Oow6pW6y1maMeAq4Gyg24LZwxfZbJqJ2QgV2APQrTQL9CgyadsDllPEAhhAwODhUY2Cw4KrPHK/UDl0aODMsXldiT8Z9YwSy0hHOyAjkov7DuoVrpXSyIXS2Tth6gyyGgRH7C2Pr6NKfye7zJ5KHarDSL2S0obpGxQOU+mCmUiqVaEZH+VqQYanVJiLoq8NKDkMFKOSQw2s8NdRZ2SCCVBR1snA4zKyTBRKs+fhMxpAsojBs1su+IebLGo9xvaQsoN0E3A6ssYYfHWYfro4yPpza2jSVSx+Teqz5nI8MRahVxQCPGY1fjItyZHpmYWsgQGzYnxAg5lbOlVkLUGgGsXWxdexP+fjJT37y3e9+F/K+Dx48AKf49ddfh8hDu902UOBMJrNOCPipjjfeeOPBgwcg/77++uvvvPPOr3/963Q6fffu3Tt37vA1+i3f//737969m8lkfvjDH0JoIpPJvP7660CH33nnnc+c6Xx1XAHEV8cf7fAnD4jtYLoFAeLBYJDJZOLxOPmGrOlhmaZgKHfB6XRar9dPT0/5mQjWARlgE4XYKLcKBP2I5LDfsPeHEmbj8bjRaFSr1U6nw30FoAwkj8G1RC8/zQTwgbT8Yr1Rlv283JJd1xXPs32xixazM0LGlcqSn17/a4MqmWVJLi9/85fym9/K//iuLAriDUXaIm3JxeWN/418+2+kXBGjgLqOQ7FB5Et3/AEo4dUBzBWRietCmBJvC4fDxUIhWCzG4/Hd3V3QBiGLCX7o48ePP/jgg/l8vrW1FQ6HkdEVCoVwOAwZWTTdg3vY7XYPDg6Oj4/r9ToK/pVK5ezsbDgcHh4egrdeLBbL5TKKGZv9iz7DQJZ/Q6kZfEwRwezAeAYYAe4AutXwvzhJRjZgZQKNQryIGA6fpu1TMHcWi0Umk0HkiiQK3c2IIylJYds21IppN8dO82QyWSwWY7FYp9PBc8QJ00MvkUiQeOvPmbUB0UrtUXwdX6lZPyCmtdvtRqMRi8XQfA3KrUYYoTvheV4qleI6wOwOs5UKDxiHeCVWiX6/D8N03bxG0Qx6RjHexXvhkAljKGDTJMsTyocCAzB0zVhHbA3QIZlMRiKR4XAoSw4UvhTvgiUgvhRjBoDRZ1A18rkwGdZezNVRscCLeQP1hYD/CA41VlQYqmiwgO3k4H2QEs7PEREmSxSjp/mbZVm2bVXK8uLzEl6INEUSIj0lpz5fum7OlhITn2cnrraR0QUJrHufq2TQEzcCo89alu0peKyQhYEeNx4rezCRIUejUUL8elRzK8SEgrSIlv8DNxwiP7PZ7MaNG3j0RqPo097ny6zMc8COnie+PJB7Matr2lHAkFzAbzABDd8t4oY40O2BDgPqBRsbOucR5i9YaWhbns/nmNHJZBIAMT4NgjnobxiNRvD6Y6WQzcv+jFrXmdZVmvm/TPL14Zd51ck5gQY/KxMGm7Va7eTkZDAY6A9Bxb1arU6n01arxVYJXG86nQZdmoIYhjIPFg0osNNcSEsD41bjEQBuNmItaoNgEaOcAhWNIBsK7AOi/PR7JPtY+7xhr1yp8a3vPOXCHcdZWFZUVcUuH8n5qQn+spBfAFe3chvQISAhep9iOmttYr3gYxagzseqrZZ90JsdCySUG8Kl8PP1HDQuhDOOog306UW8MRqN9BrF26t5iyjLURRYG7UZtWq/1oSffqttD/0AsaFBrHeElUI6K0Nov46QsWgYQPNm7oiOvTWZfeUbN2jlfxm5Suvo2BsUn/0EHYxkqGlB7w5mdFrGHXAte6GwlI3H4263i8IYuh9Win1xFEUiEbjvgCOCmAfJcr/fRzuOLpVxBdMxub4ELiwsqJBsa7h6Glpe6GBjGwcSbboUciaORiNQvrQijf5MLgJarZ4ODdxqyRSm6wYqT0Yfj+G+iGScM5F8Au7UKOPph8sMiAiDliY3xCW0xITgz5fheOONN372s58BaaW2g4jcu3fv+9//vqE78Vkd7Xb7G9/4xs9+9jNgvq+//jolj0Xk4cOHb7zxBpUo+JbvfOc7P/vZz+7cubO/vw/FCRxvv/3297///StI7Qogvjq+ahixdVGlETKdiUTCXcJ/kAuAmxOsbFiAxevpKEXWwGw2gxIi2KCpVApO39PpNJ/P05wHWzJeDHl+gmvIN1KpFMJcJFeHh4cHBwe1Wg1EHnw4LQjYN4ru2kAgALVNkN1g9sJIlGDTuYyUiDWfW4uF/SSFAZ06+u/nZ9Lbgs0YZ4j7rP83GZe/eFX+y2/LeCG/rcuoJtIUZyZ/86/lb74lN26Kn+7GjFF3uRrNgMRxNAORlEOSOGgw6HneaNmmJCKWSCgU2t3dje7uQqMASBkAwcFgUK/XoQVRLpeff/75ZDJZr9ebzeZ8Pu90Os1mk1V0JDzdbhd4DTqztra2BoPB2dnZ+++/f3x8jKJFsViEWxoe/WYF4c+Q5oAvgrlcuVyOxWIcwyAhIk8GzEpKAoirGLH0K0MkRxoj1CGgI4zLBxkzl/v/s/dnzZJtWXYetvb2vm9OG91tKyuLaVWJKgA0Iww0FWFGSWYyiQD4JKNkFKR/oB+gP6InvusJ5ANhpheAImUgrAAkq1jM/ua9EXHj9N733dbDFz5inrW2e5xobta9Jd+WdjPihB/37WuvZs4xxxyjzUxG/lIsG8BKHqtVMYO8id4u04nHx6DxczBrniwFGOiEZJUkk1beQWK1MsWyZlkKIj3asrVLYiEPh0Pmxnw+J2qXWBsavs45QHAI2lK3sM4VMH+JSpkMbC83Nzfw+EajEfk/qBmApqSTkYQTsiOas5cfQjGWWisYojJJccZBKGQJqH+lL5vRAyAmB8C/kTKAZ7X0PsWk3W2tNkFN3WTEtnZbtRMyHJlNQ+vIZDLiwogJyB8A1zxjepD9VqsFbcc2HmqHLBTcUctVNi66dUnJucfO1Z3rO9dwrrhlEAsg/qiQq/JDJrkcU5fL5Xg8hobjto7b4t+pqPn7hIaVH+p8gbSLgRiahtRBnaHtc/OcIOwzAoNUXNEjI1/1ABGdCODLl5eXiGvLWDwVMQ/Br11J/p4rl83m83nYjKqiUQNWN5JYiqxNS1+ylV3514vsr7FlirJmqVRZk3Tvtq3Io1JxQg7NKLVSMcmBU8HleViY1LOOgIzBJuzIW2Z0qiGhu88Otgvc/nyXp5/tB2Ljsok6A8u9Eb9pFTBDqPChAmG/Oxtys9mkQialDlMQes08KJVK4Oby6BNEYmnglg+uo0TUeDsmhKnc8GAwqNfriFlJ0MkZ/Qq5aAj6sSi86nyKiq1d0muoIo7z63X8kJaCtHp8Kn01FXYMjQS9/Vwxg6STNHS2A09olNV28Jp7mITSjbHMQRls2Om0q2bGO9hZIVRIYqbz+XwymQCESfAduTlFntZXkD/YDdB2XKm3bz9AbGshoWKYMOhdAHG47Yf04dAlJQSI3wm63dUMJ+DY+9a7duPvP1Lshdb7j4lUJZAQumXzl1EzCSAsIq10akii9JI5yvOZ6CikAWm0VU1n3yMc4rMAdqWeZy3srB+p1U602763Tm2RQ5Cxnaiq6UoBGREzHSLqAGApQc15Q+5xjn3P7nWenakVELfnxeb+JZ0uj1/lMaY9tr7dYDUydr2H6HCoaGHB6Pcvj2Q/WMoscW75biFrr9f7p//0n/4n/8l/8o//8T+Gvfv111//q3/1r1IJuT/72c/+0T/6R/zW/rd968u+/vrrf/SP/tGf/umf/pN/8k/+zt/5OxCBf/azn/2rf/WvQhs6ffqf/dmf/bN/9s/+/M//HI7zz372s3/+z//5QXr4ABAfrr+dl5WrVx86iACiqKRhHE7asoneOIYFphSLRejAzWbzk08+ub29RdaTNOD6+vru7g79U+ybNpsNAGKn07m7u1sul0r5MOPizIOSDH341atXL1++BJ7DBIyCLWc8CT9516NHjxqNRqPRaDabx8fHrVaLtNZt/ZrU+v06OlytsjbySNMUk+6SCzrFwmDlPQ4pTnGK2ECN7XabRNTkz+6LT91/+X92J5+5//v/wyU3rl5w7WP3f/k/uk+fuUwmvWMLidjBYDAYDMha7RlMIKVWXGt/RKJFcg70Lw7UPXmpKMLyvvrkCeEFaEuv16NKj9jrH/zBH3z22WftdlsdQ9PpVNCGBD2khwv8tFqtPv/88ziOLy4ufvWrXw0GA/BW2yz2+4Fs3NamDAYxWqX4N0KRTpKEtnpINASdkpggF4JjxVS3mAIFecowgAssNMBQYlzsL6xKJvdGmzO/S1Gn1WqR6UmAwm2F0pxzwvX0INQZIPxXqaPttlbAJ0xNNveWTuu2RGmwaWv8Ja1Jak7gtq1WC+ouEDl0ZvTjJFCgpwClGlO+xWJBQ3e1WpX1ExCAKA/0r9EHXa/XGSu0OxTsinDBV+CGabRnwLPZLLC15//OyEwmk06nU6vVBNbw5iTJjNJsNmPMKcLRsg3x09M6fCcVUZfmHWQjeIk58ohx0Aag597kRYYsOF2TTGxkiMmXqAYJIAZfEzovhqZmuHAiS0gx9+w+e+L+07/v/j//X3c9csOXbrHeOtFVnJs5N3Ru4tzSubVzyUeQmEiSZLFczrfcQ3AlAFDgMExpKGjJZNI5B9it3sbfw1Zj2d+WTsWzmM1mnU7n6uqq3+/DEBRTSSAgExLdQABiKkDsIfLn0fSwGZfSPF7JchDbXbZpqhU9xMrpgfM5cq5Wq52enBBY4DfLs1CzhYIQC0TKeFaHGhOVX7HfS/sh0DmsK/FenempV31U2gV8wcVi0e/3B4OBtkEeinzV9HNVj+ihodtDx7FATJuKC5e0EHBqJ0eIC6vLXmoAIV4vDqmsOy1wxkGszN/eDB/NDKSMZxtH8vl8p9MBx0eCXwRhFY0os5W2VwgQq9VDrDE7JmwsYiRYkyi9gIlty//O+NcBEINxy1JV+62sVllNdt6y9a3X6yibLewwS9y/OVtrstTFEkpsWyxJz3q5vYS5MBpWM1SlL7f12yBQV0FIdVz9V0w9K3ut8rAntWGLGZ5Wm5gE7C2yfrVef8wfDh3emQ4GypacmEQCOrYsWCaGY9g04AIJAm+BhLi2tU/0ettT3z8VIE59fOHp7DHEUxF2T8E5nB5W+8sTCXFBl9v/f3KebM+BjW8t/iiRbi0ur7VCZZjwKYdEfimYqQfFasd5K9rrCXD3ZZTcbu3sVI9Hi1mrZ46DT9UaTRuvkyaVC7VnfoZBZiiFHM69VHNUl0aKTxWu8cjID5nk7z/vc84VPhBPcW71PpyGf/kv/+VDYNZer/dANPaBL/vZz37mMYXfev1X/9V/dVCTOADEh+tv+ZXqFQtjkRM0m83SO6PmSkI9T6vLWo6q45Lk7fnz571eL5/Pw9TL5XKdTgeoC2cY4nUgP/EOKHLyQ/rBqesCakBCkecALj3EtSJJlUolocNnZ2cUeK19qiUXvPn64BbbQmCSJJtt1m0zT2vrp9+VQbzt17NxtgrXilG8gBuYr9frSUYDkVAwMlOVdbmcazTdoxN3VnOnj9xP/9idn7k/+WNXKqV31fAE8ZzpdrsqHasTnyeikrviG7EVrM+VM85LsXpjnctms+VtlZ6vSdpM3rVer5GJYG7Aw0IPl0SRTIaYRjQr7vz29rZcLn/66afPnj2r1WogoTIHU5vq73O9MGg8Fxip/X7/+vo6l8upzRYTMN0kY0i9REm1unHBJkjtmO3SDGUcsKfjkcHxtEuP94QC7JwD+9CcCZVPbM4peBTxMmXvCnA9RqoYYV6crVqLFfuzbBrL9kWuAZCOXzw6OpLyMmsBnq94H27bT80wkmrasBju9mazKRaLSjUBDpCKrtfr5XKZ2gODg50mWLB0KrU2wae4JTl1gPwqD+d+VqsVGspyfgNaEoIssAnUWLdhaS/vyXzfkojDrluLF9CMjKdWv9/HYlFuh0CHFDxKpVKr1YK0jpmeyF+MFTOETbjZbAI1CqQQAU3u3qnEnyhyn33m/m//pfvsU/ev/9r9m1fucuZcwbmMc3Xnls7NnJtu0WG2mA9b5RvnprPZ3c0NsKlw/OFwSB0L7iRiR8PhkDaIQqHw+PFjT3ngO81v3X1tXGkO0vsPZRjAkQ3BzkxZC15dXX3zzTfOuSdPnlQqFYH7QP9KIO3hZTcKbSyUmsrl8m9+85vnz59LZt3T/PUqE++vBR9F9Xr95PQU6i9qV+12mzoN25RgI+s8yQ5gjzzydiuSbhvqBa6pSvdGaWq7cEB+wePgpVprUHRvmTYsMdn+WC8gMEfpHkhTUtHCHtwqVcDU64v3/Oh3KZ96O7/AQYs4hPwse9yHH2qfMoMAOVT9Fp5Yh3ZpaxhoP0V2gh6VlefFnkOsokem7yJZJODpSqUi/SJx05Bkubu7A6xn+fAC+maQqkDBie+oMuTrOZPPZzebJK3x/K0xQyj3EfY8We0yO2lFchRATFRgWYdqEVNfEYPGUQ5kL2qw2ibUOqOh0MgrCNRyU9SRakig4o08S7hni/By4BKC8lYIZUiu2npHy+rK07BSxdGDp1MBI0+U36P62s0hhFktmXF/0cvrYPN20VTd4RCGs7oiqRCeJYTuac7Y9bvvzVz5vuWtqTubnq/msCQRwv0zhINDVTR3373Nfpw6aaS1pQql3fxVhLPVuPC2bWgtixfPks4KMtjZLkTYCpHv8sXxaMKyDmLpWXuhUGUlbEcLNzS3QyTEK3vsKY0o4PGOpBAvdqnevwcLx8N1uA4A8eH6WFCXd2LBs0M0E01S+m0lNgcCYh23FUhJY845NxqNULG8urp6+fJlqVR6/PhxtVqlzyWXyzWbzUKhAHtLYsG8CRglaTD2XGRf8/k8m81+/vnn9Xpd4qpoDc9mMzAgIOZWq3V6etpsNo+OjkA6FF9KdEm3TZ6cBDjjYrWaDIfyYROUphZswcHr9fri4gLWp8QBYJiihCUhQppMIUcXtxcuB2C4V1dXFxcXNzc3eAfBvxBT+81qz7jPHrv/63/hPn3sfvIfJLVqcnYexXGKkhfh6XQ6vby8vLm5QaRPQB5fitQLHK3ZbIrpIwKmtWlSGJRbr2Oxd+kzLZddJiMpXgHE5ANHR0dHR0cwwhCRIISC1HZ9fc0cUy4ka6y7u7vVanV8fPz5558/efLk3/27fwcVnRzJAsTfkfpwGJ2USiXI3ev1Gu2Ly8vLTqeDXXKz2YQjBqamqCufzyPNjNYEyZsIDnx3/ZbkXJlmLChg4mazCcojVTXBdjYIs2QKSdOSBlNrkTcFdwKZrtls8tWs6Y2HWymdc1uxAlHLha2ERINyuSyAmDnZ6XTwbkJEFR9LhGX4V4j/DJEVQ0BaJJPJ9Pt90VfZVYrF4nQ6rdfrsjliYkM9Q8eD73h6eqoHpMZ524UKpgBIBB0e6vpkMhkMBiwlrdDFYnF3dyeKMfvVbDZTcQXlYr5LvV6nAtTv93nKHqr7TvPS3rMHz+krSKSSu2JMrC+otfPS3iVfL5HKAdNFAITf7TGtbI+F5km4NnNZ9yd/7CpVlym6375wlzfOPXZu4Fzk3Nq5xZY+vHFus63afSC9Yzv/BawIKctkMtQRl8sl5RaSOuml/j6rUN4kZOTBtq6vr5V/Ko180wcTx5IC6Ha7HHzWBseS71T58LiWVpw0m80iF355eelJr+5vmk7Fix9yIaSTLxTymQzRyMnJCcI4LHk7XVVclL+5Dinl7WGDsLtPVrIbpmobbitCzZzBro2tGAokYgXsolZah31brcqCmG13sFCAsEM8tYc6TMU9Zerw9V43vX0QnneojeUsQOxxeMNhtF9HpGmNhke+s7NO0vA2+dcnCumwj0/KHjRQszWpzKOvzO9S1Wg0GmxKVjOBXhwq5ZDiJQkym83sRqfzF8gVvDVXLBa3jeFvXcneuKV6foQAsSfj4DGIBYXbaSNxDAHE0l9i9wbPUpeMFSdREGjhRfEbFFx5j2MPBuS9gF/BvZC1QHyoPjbF1dDJuVvvltD58cwwXFrHXjqjcEsN8cTTU/WIbZDjvXLXPhZqhVt54rdixC4gF3vAXCpGHDLQQ+ws9TXfN92JVEnuPceiJ+hsd2/mrfpCqBJ5+YsOfVX1mFSsHSvOkyrPJdUmZZfNZpP2NW4DV1i2F6nZ0KukoqBnzmGrkl57h+3nsHQTzSsOQRpqKfB7BXv7xVWBs52XssKziv+CnpUFyLNXzYipOLud6nYrs2rCig/Vq6TN33Nk9SQmUk/texNee+8BKT5ch+sAEB+uDz+Y7fnKYYNv1WKxwJLVcuU89Svv7CSI58iJ4/jk5IRUCrMj4tpisXh7e+uco92bg5NclEgRzWIIKTpWOYfK5fKjR4+q1eqbpr8osrw80I3T09OnT58eHR01Go18Pi8gzDrjWSm3KI43mUx0v9Q8nc1ubm7G47GVi6LlFnhOshuj0ejbb7+F1kqQIZMEshQIg3d3d69evSJWUF88zctKUQC7NWjtdhtZTIBvHYTZjHv2yP2f/nPXaLhazTmXpFohixU1mUxub28ha49GI5lEMxQwJcHiGUnsd5QqSFiDGEJJeHYbZETbNsal4WVL35NkgI/AggZyNAoDFiLXb6khUd4msBrPzs5Wq1Wv15M2xa6GqY+C1IQxPSBCvV5Hw0Gkb+CYo6Oj09PTUqlEjChDdo2AVgdSA4I2BGfIDcZL3Un/0IVcrVZEwApMxakRnBd6Erqt0RBKI/CnsNoAI67X67Lds1GgRQSIFOHTgZsAkSipZsop1BYU4pzL5/PE0zCd8auZTCboz7x48QJNlUePHrG+4HkdHR0pOlR7OJAukweyMD+EVAjMLUSGn3uEaF5g43U5IAl9w45JoHCn02G/ur29vbq6uru7gwWsTnY1jLstSZAeCHi4DBToNjI+zWaz2+16yfCHiEuESay6kgV/SxlAPbzOaIAqQ3DOwe+2Zp5qQoc1L2lXm9BaJxN1ketDvaSlXHZPHrlHx66UuKjvkjvnqlvW8HqLDi+dWzn34WZ+zsExxyqQLX25XMpFUMRG1eQgPFKP/D1XcMUKVB7b6/UkU2B9wPkzz4U5BkdyuVxSLCFlBaOxi4LHBA0/hPyUDMsDlvNdSk12pjH5rTjDez8jjXxuy/DlgPAAYsv/pfCjjFedv++tGS1QknTX1sAkTsIZDVXTboACiK1bmjUCcvc1pr1C2h6AOBXpTkWHvTMr9TWWpKbXK8MPu/K9ooX4bt5tswdKWSjE6fgnz5fM4gghQMzPCfNUcyKGsYOjJjbbC+UNAi0UlFjU4UFplsjHCkBbg6bXCyeTWd3vQts/mffrSHgb9Z4JYBErTwlUN8kaJNxSSKyTUX/wPsjjm3sqBxag32Pa5k0277lwJ566sb1/UgOvZGJZnKlfPATvdjXFW2ai563nrUcP5/XGxNuf96hIp4LFqV4mboeQ3R5HDa+k5B36bw2GfxAM4l3PMQQfLWDKtt9oNPCmOzk5QS9LxSRVU2DZU/YTD4PKCju2Lk+FCU4PYerTp0/Pz8/b7TbMJKLE0Wh0c3NzfX0N+4FZjS8OskLW/9ly1UXkt+LgnqCEdVrmfmAs0WcjTDxseKL3S9Z8pPMk0eDjdGRam1YJ/sjhU4Og3Vvy4joBtb48PwBB8563Ks9UijRej69OBLuBWHmZULbF/U34CR+uw3UAiA/X33KwuFgsUhcFSMLw1DnX7Xa73S7BtFg2VoHUdi+Wy+Xz8/NSqTQcDjOZzNOnT6vV6mg0giS42WxKpRIoFT3mOgh5fxim8/m82+32+31ONWBi55wSeGCmxWIBxpokCb8Ix6Tdbh8dHZEh2JZSIZvEo0KF3GYTJYlNvwb9/m+++ur21SvkgC119ObmplKpgKPhRfDq1asXL15I2I4TVHxPiNKz2QxcCe+CZrPJt8bNTBJ4fEcQNIKJu7s77Lzk6MUZWam4SoWbdUnCkZySitAm2el0QCqXyyUoPDxWgXrWyIVnpC4qj+mj8SyWSrltFycXiTGsTABNgCR6uqUsAf2TCYDEMB8nq1y5cIiG+c0331QqlVqt9ujRIxqoR6ORVBG+I/gmVYOFbAcek4JCLBYfP3789OlTVA5YMshw01bJd4TBSrjmGfICbgqAs8oDNg8HWIfQVC6XtRg9lWR3v4NV3EC6aKE2EJmxTOjmxljMGhPZghAfNJ1OLy4u7u7uqGeoyiJrC9Y1aaq1Y5ZVnaRgWq0W3N71ev3zn/8csU7I5igeSCaS4QI6Z+GI8iltULEkGMxQxNOmFsSd8vrr9/toH1NBmUwmAHOj0UhQCJvGcDi8ubnhsVqiJZG63D+Yz4DgwiDg8+IWSKMDxHlntODfOboNXM695Fw9DQq+2WoYTKX0UkFBo4ANfzQaIWUr7JjXSLFHLDN18koJmnoA7QIUM6S4bZOHUtF98an7yZfut1+57m+c2zjXdi7e/i/j3MS5qXPZD2UQx1FULhZLhYKn68fKxc0DlWrtJ9ar6vd8IlOKsJTAm5sbCmOWrKp8crlconLT7/eRoYBSpPdBEJxDGUMSPXGbOUuQVBRdyi24EYgEGqIqYTlqF3P8LYEsSo7FIhITVt56jyqiCh6qVWsr8AS+U9FYbW5WsWGz2bBVig7MC+zOZtWivT+ngkFacam84D3Q2y64JPWHlk64n1PpjFJWyAAVEJwKEKeOpGobqciXZTF7vf8eHSyEVq2wD9GLB0TKOYq4RcJNItKyrChe2g/VyVIqlRSMacNnrb3GRzKZ6LvpUvKe5h5iuPWs0z95Yi8qAnmM1HBUkx22zKFy6AOrmKkipC7N7Mu7h10rIvxXWwp9yCKyszcMisKR3M+neb8i7jupA6fWet9K9HkgNfh7ziDeP828OMcq0QvAxTv69PQUOxC2AjEVoJuMRiN05BUJq1OEfV523NJg4UysVCrn5+effPLJJ5988uTJk6OjI3JSXk+W9+LFi6urK4qy2j0QTNNPvGBPu6InNGxF2DmO4RWRTMGTwGe11WrJDeJ1U+x9NUXapDR6+XyeL47ZCVQAaU8R2pGKijkhaFujLV1jK0xhyzD6gyU1yzRIcoJEFB61xRkGsdUdslauNjC4p37zXfaSHq7DdQCID9ffZjjYC5X4OdzbZrN5eXnJeTkYDDKZDKcdB4aIG2B/+PkAaMIpA/hotVroh+bz+VarNZlMXr58SS95p9ORnZ0IOHpb2KwiKk4mE4BC4BjOiUql8vjxY6J5gZ6lUokKKjIXYsy5LeXQSgDDEAS1eW0Cu1rlzRD1er1f//rXw7s7XKSs3uv19XWxWHzy5MnTp09zudzNzc3Lly8vLy8leiAtZkKBq6srSX9CKcWUQwVq0CgaV4GYqWZj4oeZlRRCEVa2Lc+pOaAl/siwCK6l4BuxMMilYT3TPI7SH4GXODX2/TOZTC6TyRhx5MS5+Xw+iyKRQfgD8ATU8mq1iqAkiKQ4enyQqg7cD9D2aDS6u7v7xS9+wReHdU57L5GKZYq9v5Drw1aNOkNFjSRfFaoO1xtkf769KNdLEtHLny2iR11BOIJmncImkb5BJAnj3I72xj0ZprtvMUTTHMsHMQflmZYOINAEV0m+moBCFfkJKCVEyPg452RWo/u0si35fJ61DGWeKo5QGHdfKEOgrXpgrYONRsyypZxR4RQexIrjGxHQs+ewDCnSaP6DtTH32EAsxUzxq1r2WOP2oWvnoVqg/keLDr9TcrgfS7I+dULnpbEgiUkBRgKR4bwzPuRRVotcsjxWmkNDAc+F+TkcDpErabfbCBaJba37LJbcl1+4f/Afum9+6/7NN2565VziXN65rHMF53LOLV0yc6vYbdYfKjJhoS5bJyARWq/XyJvuKRT93i6lZNIlB6mUPrtKLxBap9Pp7e3t5eXlcDiEME7GyMmo1gFZ8znD+xZcqNYfLhVy4GSpacbSuEL3LS+Tf9cnVKvVTk5OiqUSALE1kbMSqJbPyPJhZCw/Wt2ynvGa2/rIWZqY+vctQMyGMBgMUKnWEgY4hhGm31WlR/wvb78NeZFhTWi/cMe7QlSpEJjd1T0NYrtpeCBa+Fg9AMIFpkku6DK2r1EZRq3T7r5irH1PPEVR6XHOzedz1Tbsx+VyueFwyK5Few28B0lScL4QC9ndjCYP6AXi/eEYDHOf0yGJ4+x6/VH6l1NtzWJzPbxgYBu0VXh2adTXkDKcaofljB6uRXy8H9q64FtZqyqEWw9GLw3ZZc/lcd7tuWYb2/ejwy6wuvKEILxiwx4MPVVodQ/Ivgs636UeEz6Ot86BVN2JH25yuusI9oje9OGRqjC1aOND/IHiNIepVfGG/EQ2CoNYsmA0xmlLtEINUCgePXr02Wefff7557ig4w5CmykaULe3t7e3t9CHdbKQqFKasr0Xu6BhawUvlr2wYPm4EICRGwKFi1kc1mBEJZGRAAfWbGvbS23YWuOoNM7JqCUv0XCds+Jxa1O1X1PDqPxFW7ftggrbAlS9s6LSFiD25CbiOCZPOIA8h+twHQDiw/URsmUdt+RjhUJhsVhQmOXYIDXijCTIZqMfjUbdbheN3VwuR1trJpPhDCM7zWaz2OnEcdztdm9ubjqdTrlcVnlW4v2ia+XzeTC18Xg8Go2kncodIpjbaDRo0waFhE1p25mdaYTkfILKCurktpxipSXRcpk3QzOdza6vr0edjsA4AX8UckG1EBMghxyNRvl8vlqt6tAFfeh2u6TWCC5Pp1MMxBRek4FIoE3hC55+6/Ua7Gw8HqMBHccx+gb70X9lgPP5fDwecz907ILJysVe6lSyMJKpoEchudd7GMeRkX10RtBTwovcjyywEDFoNBpQp61AnhQkrZQB4F232/3tb3/bbrc/+eQTpiIDJZAuVWnxO1oyMj1DemU4HEI+xdAJSq+M5uSHLrdxBpwXQC/lnVllqpMr3lKgZlNlyzi2QP8u/wer3SZkUDB0LpcDlDk+PoY+6fmSWxh0PB7f3t7e3d31ej1xyeE5ysdGNGG+F318/KtGAxgaYB3Hv6OjIz6UJysd6vl8LmdzGzV6bjYqBSmitSb1oQ81DpmXl5cgwlJCl+K52hrUV06VhbyC91cBhlnBIrLKFcTcFpMCnoCmTRkGPNrj3D1QVjtsRg5zSC/rsJRhZ2xYtO5Yv6QBajiwzErAOPZ2vbOgCm2/CGdT1WPXZROg69PScqs196d/5mYTt/p/u59dusm3Lik5V3Ou5lzi3NLlM65VcbmMiz7SKvYSdSRWAEM/BBFma9Lh8h7vY8m8Fh22DFaBwkxUYEr5EHKySOpdj2w2m9FzI//JcLIBa4ogTCkOeSivcdWDNjyNzg+RmGi3Ws+ePStXKtkoklYAp5Kkru1Gp7yaQ0fCKdb91bOAJzemAYKxlZqHVQp2W9FqjiHxp/iJNNxt1q26lPUp8vBid9/nLTSk2rWTp8JP7wQQW3RY5sOpdDa1PO/Cr90Ofl+oz6sWJRaFaof23gSIsNUwXN4KpZdoNBrJezAE2ngHwhjWAlGrOq8tMMGf1T0DDZAHJ1hnMBhQDb25uRkOh/PVKjefvwcAsScssduydefzUJ5dlzX3k0coX83CTLa8apv2VD70nEWs2ZczHtQ2JrFAdoi93iMTbKkAxWKRHczK39sVpFuyM0orSHwObpjTVk56u7Z6+9BTMWLrMhIuHMv6Dyf/HujZS0ZCUo5X3ghJ4t608Rrqd8X8breMr/shSEyE8ta7Vg2YKc4WzM9isYj+OJks7CLBvirvUUZi/7fSQDYbFfTJXyuVysnJyWefffbFF188e/YMGwlyN+Ta6NREbo52NG2wUiiyZoap2Lf0kVgsyk/Jx9EartVqOg05IuGmyJHV2xs1t9keoXk54/lMCOHum+ISAYrrQwIukTHb+AgHWbxjT9jnTYodAMQqQ+rUthUgz3VQQhOpDOJ79OE4PmgQH67DdQCID9cHocNe/CENU+AepH7FKlL8ijyxc26xWPT7/bu7O/llrVarQqEwmUwI0BuNBpQcmeEAr/R6PUVI5L22rVXu5MKF5YYMz5GzHzSKIIBKMuiSFPc9mws0YTm2OWy4baQ3M8uljcQ36zX8aOIDcmPScnCE+XwOqZksHUiL01qK/lzkn3ql2/bL85Xxpuv1ekQwq9VKsUsmk+l2u3w6VoEMVKVSIefZTzPxcid1YGEFjjqzWNXq1UIO2FKwPc6prS0nNtDZwiIK5Xlb+fWBDUkWwBnKkmeBYgELkvNer3d5eVmpVICuxAdXIvGBwMRDFgvQSblcPj4+bjabcRz3er2bmxu4tJieYfAIxC/oQeEdrFhg1pubGwJHWABKgXBiVFOVVMakrkiEpynEoNmEKrWx123lF5A04fnygGq12pMnT548eULoKTDaBujcGCzFV69e3d7eogEtTWq+JpGig0u+pcBT/OBNhECRLjIT4jiu1WpnZ2dxHLOmlNRBxCZ196JGj8WmqFHITmoZTFy/4XB4cXHxu9/9DuhH0hDWbwpBCQj+s9mM3QPAjrUsKBzcrdFoQACXfLaEiSUaQ6WHqk+j0Tg5OVmtVt1ul0/fBes8EJ20CaSFfeXDJt85hdrCslHls0bYrGKA7JDrpO1Okr42oNfjYwdjzwe1fPTo0fHxsdpCUZn4D37szk9cpeXy/9z95c/dbO7mS7daOFd12ZE7b7l/8A9d68hFsfPuwRNCee9Lc+z9UF0wwX6/f3t7u9ls6vX68fExJdJ3ekNLZYLqS02CehJaE3TIiufIE6dTh/1HCZUAOzbMarXKSoSwD2la2KU1u+NmEFjHI9Rape+S4PwIGHEU1ev11elprVbLOBfdN9NTScYaqal+DKVXFC0LdFoJCJ6IqMGDwQCql6yBbGuFnAylSyAxKK88KQaxcHZ2AAHHniOcBYi9WkIIA+1q2N8Diu36oWXdhhrElptpNanf+imeEpHFnS1TTNYIBEL3EphslvNR2EcorqpTz1vvFtmUKLyACVAkygyUxhU9OiM+Bu6MM7BgHV7MTlUoFIbTaX40eldJqz0NPbrn131suZyq5rZskFqP8b4y8LcVbrYAsbZoOXRJQAPQyi4Q+57q/tbyl1p9WAazB5YteRL/qEIjZTnhR6oxCx/3EFXWuzr/JCei2oMnkbyLlR8aJ9oJ7BHtd+1sntJ36Je1i9G83xZPYLRnS7AfHQ5B6j2FpR9clpoKDQsdRhUNa2haBJAfJIthCZPHQdmRjgS0HvVreqxkAjYSJUhRURRVq9XT09NPP/30/Py8VqvB7Hn58iWygTKSpdtAkLQ18NSKCDcQVpyYOiRiskNXBkE/jVSVRT3RuWylw0O9e1aliBpaj6VSicSZ2MOes4yMAGJulRcIIBaDGMKW7UTRjm1LWRYgljlKuCSd6WyzTi2h14WvinNAhw/X4ToAxIfrA+u09lKzPxgfTmWTyeTm5gaqIyACgbXE+6+vr3u93ng8/vGPf9xqtXBwAghGzhjPrtvbW06g09PT5XJ5cXFxe3tL66hg31qtdnR0JGMB8uFutwuyDDn32bNnX375JXwQK1EPRmOxbGUR8/n8+vr67u7u5cuX9ErrGMYwrVwuF0ulZL3OTSZVorokmWwZuyIG5vN5TkpGD4wJtAgwF5cA9DGiKKILlXGGJIgKs5qhoF5SbSbtBz2nQZLI5u7ujtO02Ww+efKk1Wo9efIEKHw+nzebzZBHHMaOIIzQliuVSrPZbLfbJycnCH14TaBSktI5LbTX5i33TGO36XSlUolKJYAzupjlc3V0dIRuVy6X6/V6nU6n2+0STPDUwNdIWmymQYEBum6hUHj06NHp6enV1ZVy74/T2ry3gqLoqlgsnp+ff/bZZ0z16+vrV69e9Xq9Uqn02WefffLJJ7VaDfyX5wj6CQjbaDSy2SxA5Gw2e/78+dXVVaPRePr06dOnTxF5IHi1MCgd4jhrAevz9D2ShaXzKL1395l0BIJwhNVVV6lUzs7Ozs/PEfUW4CLGAZ8F37bX67FyKRGRZFr5Wj50Op1i4izqgRX85a9M6aOjI9Z4kiSnp6fZbLbX64FGcc/gOGw4LEALH2sf8wiDAsU87VHSA8C129vbb7755sWLF8iAoD0n9UlGEjtEljmPVbYe4iqKogLTuV6vU8vp9/uE0fhrVSoVMCNUy29vb1mSz549Y9iBod81i7NJQKpqkOAthh2IRER1pS4o2GazWdXqeEP2vdDPyhnWkhWJVhrAzIFiDw18OBwWCgV2tul02mg0KBfFcZzJRI26a9Tdf3Hs/vjH7nffuN+8cP+v/8b96n9xy4LLLt2Xf+L+N/+pOzp2FhcCfYZReHp6yvT4kMX+3sfoZDK5urr67W9/+7Of/eyv//qvkyT5gz/4gz//8z//sz/7M6mEPxwdZs53u12cJCG68kP6b9haSSAlXG4pclYxUNVTzFrJWilOFAoF9ihpI1iECGBoPB5/9dVXJycnTG8hOJYDa2eCB9C8h2FdRiykJKF+zNIQqd/dZ8nJdEiWcVaNJ9U13gLEKMZYK3a9THZAwNM229fwWv9M2wglOUXPW8yD0vbLwoaCAylii3slUy2wZSs33Iy+tQXEmUtqgNglveoBcPYm7ff1vJg8YqbdUuTHSA3YBYTNXVrSdi8SJGqLzawR7Ao4RiWfxRlXLpeHw2G9XidGspAKfIJSqXR8fFwsFiuTSZLN5t661eCV9DZUTmeZQGo1D1mQV056qrjLE9WLZmUvIZafVzyz3VcKmDUZLGDNoLFvuK1BFnixtRAULOWpb9uZaUNKtaVbFxC3ta+wM9zTCNbPOVUFqLltj5oHWHvVvnDmhEGUx6BnToZvolPVq0x7PXbWzsti0HYNpq5fbwDtp3sIeCoV4OEtdN8TvHiPRkcYz2tyylT55OQErWEmqpxUnXOQS3B2lZSENIiBjN19gRfxMMrlcrvdxiSD5UaG0m63s9nscDgcDAYXFxdff/319fU1ThUiNEAfVn+J6pRWjc2r8OnMVY8sQaPKM/yTLvvr3vrSBmJV5rk922zHFsERpuYbCeIRX6Gcps0ZZEBqY6IMWwc50Q4sV0Dpicq9wMSypmctWPs+2yDIzsPF0Gkn9BR1tPe+J4N46VzOuci51Wtxs9fWFxvnMs4tncs7t8J+1Ln19jWZrT0GrzmoHx+uA0B8uH64l42NlMmQNOZyOeQgMBBDRwLpN44rC8SAA06n0+fPn2ez2adPn3K8QRmrVCqLxeLs7Az5Qvr1hD4LSgZS4VAkRgeVePLkCU53nLWZTAYFqJOTExUkbeFX5BQrdb9YLK6vr7/++utOp0MrEMkwSTW4TL1er9XryXqdGQwqW9ATiit4nIJ4TOEHgwF8Ew7F4XDY7XbBmgX+oiwMTFYul0GH8abjaAQ6BJzi3lAons/nNEiWSiVa4AFYae0vFAp/5+/8Hbio6/Va3L1dySF3Xi6XISrKpoBQSSSa/eGafMM9Vsvrw9gEdMV8Pluvg/aS6dXr9ZOTE8rvQJMg9be3t5gp4YJ1c3OTzWZPTk4gnAqhs5Bfv9+/ubk5Ozt7+vQpZk10h1k/BLVHfaDQREjEUIBFhgn1myyLzm70JSCKWnazWsY8wqbcMJS1EgXaBF4miqCrQPC28O7hMqkhtbuvoC0OMp8IiZXw2lbvvSRcrEYru0mo7baNvbLX45mqOqJvYRET8U9hDUsxQwqwngeXB6/Y11jQxA6dRtJy2aTvQXchvD918WvhWJcPAaYsOnHrPEoR8Lc6ISTEzEbKhCG2pvbjnKtWqzx6KOGWVZfq25Ne5NsNPdikXcC3xzYSGiLVbAHfciARuVIkFI08X1lbhG3fFuFdKQofAYeagdI+zP1Uqu7P/tT9yR+7/+WX7ud/6Qav3ChyudgdVVy96izQypb47bffXl9fQ/NptVpvNXD/juqs4/H466+//su//Mu/+Iu/+PnPf87G/vnnn3/55ZdiMr4TRowwC0msBE9msxkN70mSIBfOzCF99SQONAeoPDFEbFn04ljed6o6ufK64XD47bffqkxoEc+P37GRJIPh8Pr6ejQeR+v1aushCZnabqqeFgelNYHdmnJeBdHWfiTHzD4cUrr0YnU/WDoVn2V3HmfkdK00k5AmbwfzqLupmrB2cwvRWA9BswCTtw9oPRJ+kPDbaFD0VaaTNrRQDTYsxIaVY4vLp9IRtLHbI0YKKqmQnF0gqUR1gSO2G4mlwVElIFXmh9KMolgl9RV7z6p4lcvlJJNZT6eZB/cr7I9D9iDg9lxTPUYVO3YV1rIo855MsPSCJMvAJJSUij1VPa0D29YtCNhiPQy1DCos4m8PGn1Bi5PyryDvtqdHfgZ8tOIWaaFwgujLqs/dKydosVin1nDqekvJ4z5LdiC15irHs5ADbi87FfUonSEd75kS3mH9EFw1rAm9dWZG349s9K0lW7sZgt7So3N6enp6eoravuTaJFpC1RAVOAsQc6BAPLJ0dcJjTsx6vX52dnZ8fExbmLVeIK1D8R/Rf01mwkud2t6GbzdhsV+190LPUq+Dujm1+gizw1ZLTSeVb60ck6aruFMi72uLLhaLUqDSIev9CgGwrVzyQdpM1DdjT0ASIvmaaKVouxABRees3QNtGGnHzR46HtSeJAm+7e8Vfmz/y3PbmL9mzL/CjdK/6n+Z7Q8P1+E6AMSH6weKDtsYQtEM5y7Yrm0zhxwHPlutViFMER7prQaDwe9+9zt4YWdnZ3AZpF34+PHjVqu1WCzAjufzOVq6oLdAqI8ePXKmNTufzyMlIcoDQGelUtG92a+gqFEd95zNNMVfXV3RFQ55U6fLm68fx5n1ujgev8E9kySTzQLe2Rb+9XqN1Q+ST1EUDQaD4XB4enoqthHnIiOJ5gaAFP4JfC7Uy/V63el0vvrqK9znR6NRNpv9/PPPz87O5LlHG9R4PL68vLy4uGg0Gk+ePMGAJezTdPctYrj4XBAxEmmoo4o/3G6bEY+Esg9/iaJsHGcKBeccbLXVatVoNBR7zWazm5ubi4uLly9f9no9YEQassDcoY070/okOHs6nd7c3KjxirADJp064nelXh8C/XhpHlkirEAphMLIQ5WYZyr4wFr9CD+1zshJktzd3fHdId3DDlBqwRvCoaOnMpPJVKtVglqlSV7OYzEpD1AWYAdCBHAv9mWoianpIWlpKyAoq0kb86FLcHR0BFEIPgUfrW/NH/hc8ZIQTuH2COLFU9bXT306gkWU11nymlJEaxtlX8DWpyRW3ITValUul/noxWKB8chkMpFohpfs8aVs1iEsRhMmiiJqG9D5QerVERkym/bP5CiK3G53ddtXKDQNVJePs0O0Xq95jgD3ssFUjG4NviwrypoTKtYXhQTQX/ZfEtlQAsCvC+gsFKJi0X3xqfsn/wf3x3/kJpGLE/cHj93xsYvjN2n8YDD4i7/4i3//7/89lqHPnz//0Y9+dHp6enR0VK1Wf28wcZIk/X7/Zz/72f/wP/wPv/rVr16+fDmbzaIour6+/uqrr549exbH8fn5+QPvR4kcBcXRaCRsCwr2arUC2+Islsqq0ARld2rArNVq0KBowrDCiLLQkda2RWDdts12uVxeXl7CoNcTFBTrHQ3J7tn4wATt9vb269/9rlAqRZsNsBEcapWmbNFOSSmHu0fjtbCvl1Frp9JW7O2cKe0yATPRU++1iLBHa7KdDXvOa8vB3A+g7GLU7vHUcqb53fawayV68BwlyVQ3s7Brx0KHqiFp/G3dTv/1YHF337jP++4ePJfKxbbjbEUVpP5hVfgtiU+aWhZY0RyAq9hsNiFMbDabxJbGd6xktwPhSn36nnthWB7grpjwACWynJJovtav3lDyEbYoKGNGxfCpIV/GXBYgtvRYQed6dvKaDm14vWhEFVN5nFAKsjRDK6hKIGQfDdVWGSqoD9KK/odDGgLEIRYZCsJ4i8XKInt7hQ2iQoSdkw6Gh/DBPUUjL7L1RnIPxPz2sOH7qjgR8qbDOpCkh4+PjzE1IX7TnOekk7krPhMAxEwz0kAK8xa1JwTl0Dw7OyOigEsBsoym4uXl5dXV1e3t7WAwILBRqUP0fPFhbWYqQFMHNLwTodLoKdPuQB6tc8RT17EHh95ZyjACUr2tgPIwVX81KKjtQLtlKAQkYWLP1dY2ElnTDrelNivG0AjoxLENEF6xytuuPYayu2+x+2a2bH//PSdfYQuk8d8SE865nPlr4T7kVrz/DqUDifhwHQDiw/UDx4i9TMNtBYgXiwU6DJyyOlpELgub0BEzXS6XKJPSNlKv1zkMGo0G3kTNZlNdrrlcDrgE+i3qwNwYWEmr1aKjxFKDrdyqjRRtviGqDr81GAy63S50YBJvcff0i8vlcj6bjZfL+mLhthITURxTnSRtkH28gnI6iVAmXa1WdCwCAuq85KzdAh8FsGZiF+ccYcrLly9/+9vf9no98rF6vd5ut9vtNszlZ8+eEar2+/16vX5xcYEu6mg0AnJ6iH80KqKNRoObx7NuOBxWq1WLru5qWU3tgd1sNhAIM9AQSPDcm253jnOZJtHDfn19fXt7S18zNw9GeXR0RJKAm5nXF7xYLGhUZ9jpgdJD91Lx5EPigzRow0bqzWbz7Oys1WrxFHq93mAwgB+NrCrTG40zvqaE9uQWKCEUiVADbbAceCJq55SFDv7sQEXtdhtXirB+btMqZePgknwixEMcNhR7eYlKqjU5N0+5AskXq0gOfGNJ1qx3xDRevXrFjLW8IQJTPC6oXoghxcso58g1yHqma717+n02PQ6bJJzpWdNNWpac7Yp1W+9mt5U6ubm5QQ6bxWttnVVLWywW7BggazRM8FiZHhKThfBCTa7f79Mt4R6gJBiucHe/kcKlNWaCxUPW5ibtt2YbBzUeDoedTgf5AsZZ+YPCdJlEeW5F0rCTxxQ7gO1ehFrOTCZdQfqTK5vNOhc1m+5/+792f/6/eh1pF3KuWnVx7Nbr150Zv/71r//r//q//qu/+qvxeBxF0b/9t//2yy+//PTTT3/605/+/b//94vFYrFUynyXZyjftN/v/8Vf/MW/+Bf/4mc/+xlKBaDhg8Hg5z//OTUY0tcHvud0OiUF7XQ6JJ/8hJ2kVqu1220hWW5r8KJ2ZpJkrSN2fvzNxbGVZ53EKwRDi6CnGSiuJfx68kn2Ae/0CZGO9wGIk+Tq6upXv/51Lp+Pt8UV9gGpAHuYozRSrAtcqJL8xuU8gLMt9dLzwQv1Rp3Ri7SN8KF4ov0t1fPCUybEOr0fpsLK9hmFoLzVKdabMFaqQ6gnwPLNudjZPGkOD+f1hjc0vk/9RQ8Dsk3QqcQFLwixbqup0yy011OJTuCpYE1hDW6r7RAar7GT08xeLpfXzmX6/YUCxd11Dlulf3sXyH3yvocOO9Md5WlGqf1lPB6rp0elFAsQ8w5uqxhmFR7C+EH7vAcQ2yGyXEhVa1waBd6+rTNKr9wAVAnVzqEIcGRIX5jTyvMYIAC2ig3EjRYvDuvBqQCxF0B6Nnou0A62lnq2uOIxl+mL0vNSs/xms5HQU6i17QIlmV31pHud9W+LY/cXnL63+am3xlX7QXIBpi0XIKPVi9dUF2OD+abmD48qpNKRBH+bzSblVQgudHkiAHVzc4N1hDSF7SRU/UCCDKnK8pZaToZIsizTudB7MLVKZxeyVZnwOgOsyaQCNk9MzyoK2iei1lhVlbzTwaveiZnhqUa4+wJxdu1oj9KKsHi0PabdLkGVJHFR9P4OuQXnqh82d1fODQ8I0+E6AMSH6wd7pTbogUaRjpLMi/bIOYd/FO02qk+qF0b1206nM51OOeqePn0KFHt2dgYrlmPm4uJiMpmcnp7O53PKszc3N9b2bbPZnJ2dSYJWcaG1L7PcQA8I0yGE1i3BHNK3gCMWNgKKcpPJcrF4U6aO42wuh1MfXkMAwYVC4ejoiE/vdrsXFxej0ejp06f1el34L1EjSBmYL/fmnJOjHePZ6XSurq56vR5I+uPHj6EPt1otCTzxrR89evTkyRPctNFPBG9KdQoKQ8Bisdhut61pFZLHhLCKJx4CYRByzWaz+XpdHAwam01mm1XOZzM3mQh5VNyP5qNCNDluM5hJkiDcMRqN1uv13d2d/PrU34QJ2NOnT4+OjlAQQzE29PL6KNxhL4bjNkql0unp6aNHjxqNBt5NMAhwFkabDDhD6pYw32EHgP9OJhOyo3a7TSzYaDSwlvJkHASMIr3darUQKebpV6vVVqulinqo2xU2mQp03mXM4rZNXjZKUxov5iDiJGJgMR+oHkEHgMKgNther3d9fc3XAedSfClzLdArcFv63YCP9RSsrKT3XDzcwSsVWAyIMZGoImvTal5rBCx1kTcBLYW9Tn2Ff7I9qlTXIJgjOiy10+Pj4/Pz81KpdH19bVvXSSAx3b67u7Ms3QdCbHa12yTWph9kU8658XiMXIkH7uTz+aOjo6OjI2p4EKUxgWEBggU4Qxnm+dqedNFGbGIm2hoMcTbAXq+H4oFU5MTEZ8fLZl2zmfJll8vl1dXVz3/+83/7b//tX/3VX3U6HZ7p7373u2+++aZSqfz6179G3uGLL78s3xdJ/7jXfD6/urr69a9//d/+t//tv/t3/w6ZfsSyAW6ur69/+ctfHh8ff/rpp6liPuGFoNPt7e3t7S07DB2yd3d3nKEI+msfZjHqEfMc1XwDNC8h/levXn311VeUYdTNoMNIPquWSMsKPT4+/uKLL+ioReBCAJNtTXgrMPHA0OSu03mRyXAHgjUtNdLLRZWQpyar4a4YYpTen21iHGrcC95iR3X3JSyFSHqqOJ5vlXdv4dHjafVaKq5XHrOaue4+59Td16DgkfGUQ81lnbPMkNRdyIoXe9CDRy4LS4yq8Nmd3JNDCWG71HkViqFbHNDWX+2pqmKtFC3t4FhdHfuh2Wx2NBphI1woFFw2W5nNZtPpW2YxUMV9HnGoZru/Z8uKuaVi9FJd4Ohkax0Oh9RvND81QxhqSx9OjXYEMFnKnp6dJReLIeu2LrVMLQE99rKeWiquEDBI+IIIQepwam20HhjWgIt42wLEYhlbdSmPlB1WNTzGjJawZWjq8uC/VGtZKz1h1wUHMepwhDqcnl4bn6czHuq07LHd29V4FP1gnbvC7+Ix3C233TqUhpdX3PLE2dx9+rxUtkX3thmQFlFokBtKNu3Z562Fhv1eqaaLe8qx4c7pFdj2yNbvP8S1WsOTa9cp9k65WIiAez/fYzj5sUsTzn2g23HsDtfhOgDEh+uHjQ6HUAKhXr/fv7y8rNVqZAvgBYL82L4J8kBM2u328fExrfEkIWjFXl9fc6jACM7n8/gINRoNILNOp7Nerx89etRqtWgnx78IZkG5XD46OhLobLMINZ4In4LdrI4zmJV0hWNWOx6Pp9Pp1dXVzc2Nc+709FRUXyLsxLnNdGobajKZTLFQoAG8Xq8ThS+XS1yeyDQGg8Hd3Z1Ug5UuEp0XCoXj42PIccLXBoMBN6wS9Hq9brVajUbj+Pj4xz/+8WeffQbZUDoG6uQ9Pj5++vTpX/7lX0p+YY/JuHcAZ7NZRh7sBqK3urHcViRu/4nLs4D03ev1pqvV2c1NZbXKOAcl7frqKt5ssOpiNNTXD0IESA2QQaLCp8Nlho5aqVTUW62su9lsYk9Xr9en0+nd3R1DZ7Xt3H0f9g9Bh0MzECYtAb368SlIMEkAbhheMGLYmvV6HWVtetx4q1Kp9OTJE9rh6Ra3oA+/fn19jeQoa41nJ6MJmAsIHysxFghlFRgFKHjO9Z5Wpk31mXJeOxv3pt1AADFpDxxJTyRBT18FA9v9CmBB00Cr1ep0OnIClN8IJpbqCE6lLdibtKmpxSAsiMM+VigUcMVURUePXggpTf30H/A1N5uN/I5A1nQDLCiYXBS9mCFyANM8EStZagCki3LgSRX6/JB9Xm45omV5q4ad+ezsrFKpzOdzlPW4GR6BHhlpPG6lfCMrv8gj44N4me36Zw6wQMDcES9iowvBuBR+xmo1HA6vrq6ur6/VLMlTY1v49a9//e///b9frVZn5+fFJPnuSMSM0ldffXVxcbFcLoHLLe8Mzf1Op4ODzQMfmdQSUDJB7rDf73Oo8RB1GmoxiqrDwoQaDwQm0nqn07m7uwNPEePJmb5+j8oqzhEdHrTCeJboHz1DS5ybTib9Xg9SVmpSmooVhsmtZTnZvH3XMWdNtCxA7BlVufvOn+FJwUMUUhlqNNmOh1RQO0QDLQlL+4Zu2MOktNDsDdsGi1QWsMi5qYxmgbyC4z2UVmvc9lO7+0RshWfSAQgfq6dWsat7KRwxqd9KMES6OmxE9CswPpyncuTbw4yWbyS9TVE229hs5m9jEEf3d+BUpCNEbSzob2FQT9aA0Eh3S2MctVh0YAh3hcOKMOHuq9KnUuy9e/Ds8qwhrYXnNMcsAd9biRYIszok/IESmhWwwquQk5pTEmTfguaMhj1/9VdVd7zHatEoO85h5clKDFvQzTN49KBGDxBkv7UTm9Nf6LN90GGFIOwP8PRhPJ3iXXiiS/Pi8/SpvreJqlXfkoWGKAje5ma1knaB+J5rhXWvgTtMMxPpJ7InKIOhdKRS036Kt42rbU1FM5ldSFUTiQvr64T2pPayRHLL+k8FrFNLUEoW1H5k6/12vqkj1vNHlV2ztRgJm3hSBV48RNtTXPGIHQ/xZT1ch+twHQDiw/WRj2EJsWWzWcknkWMAvHrom86nOI5hMjYaDQRGSdrJVDmnR6ORHGPBcPFMo9MK9QYYl8T3eInAvrQhHZAc3gKIMMKJo50fXV0ptGI2ohZagBtg62KxeHx8LHbPG5brcukJXckZGQSnVqsBzCn6BAMVjKWo122NlVF3JVKXKBUZO2IL2Lidn5+fnJycnJycnZ3RzcSoYuWnX+QcRZXYOl+7vYQUPTtQPCGVnrnH/nNXX2oymXDnvV5vvFgU+v2nWwLmYrG4vb3NxDHfl25r7lPP/fT0FBFhsDOQUCiWDJSaxSwvbL1eVyoVhB2UBEq+SkKc3vf9iDLE6hYEoJETBRRIhKrFtRfDGtgICFimvQwIXauor1ByEGIo+i04mjBl4DmmNJ9VLpdJej0k1AsovcZMpc1qe7S6jco6UkfP6/XT8rFm0J7ri23vpQ4B1EthBlgQnLFarbLkZVhhWRU2mg/zWxsxpzZs2rBVpmqSx7VmVqRwwI7qfrX4i6V42EY5Z7yeNYdFhdbuJwKv0hil4h8OB4d0DAvdyu3HY1MivVetVqk3FAoFknMyIrou8M4GIp/P5+rEZBWLZYPToDINqXZqExPEzKon0xP6Gb/N/WmxWNzc3Lx8+fLu7k5wD8Ubvsh8Pn/+/HmhUPj0889rUVT6zs5NKo5XV1fspUpHhdiivt3tdgeDQeiBtr9AxfRAdKhWqyGQWq1WxdfjZVpW3jbFxOZhcdxwDlqMidHWVibISdiHtg7b4bFYLGSZ5QKtKrebufbwWb1areaLhfLXVOAj9bN2EbVCfNk7LlNBOo/L783McGu1GJxVQt91GIXcRu9bWPjeNu/rr/bTbR4edhbvh5u9f7XVsv0AsR0ii9R7xEmb7fN8QxTDU0m2XNFd6Ln3Q76s7soylzmROWsYHGcY5fbXw8ckWQbOgiibLeKktH8JB70LqcJBnpJAeHl4pQdNWvyawhuLHQxL+iepkimpQtKpa0FPQU8kDi4LVtoPCoNSQVpiHFuSpia8FEt5K5GIw0jVWyDyYfZmuy0O2W9qGaCpoFhoAuwJVoS4bapaiBYsX0cKxRBrQpheg7lrwrtAFT0Vgwtn4O//2nME7JJRtqCtlQvHDLzVarVarXq9jhCWzM0sx4JL8tzWmc3OVStVB2ng+Pj45OQE9oZzDj4+Jz5NqP1+fzweS3JQj8M6Knu4tuSnOZ1FMtCCQl8CmpHnk+nu97soYrezRemqktaQfWzvRArgTB65xFO9WG5zYXECJExMZCI5x0KhgLkOIYe2Jtu14PWp2G4ztzX8kOCM13zA9yXzEgLuNXfa9XvAjg/X4ToAxIfrYx7e8uJAqRBTrKOjIxzYbNOWpW8A72JnRKBDwlkul2u1GodKLper1WqchZK0j6JIWhPVapUDmJZtTmKbx/Irk8lkPB7f3d31er3lclkqlXCYRUTi7u4O0JPTAkiuVCph7ENiAEDc6/WOjo6s+j65/Waz2SCRuY3s422mDbQHqKcePUYDzQGMgAAKLS2CSiyDQ7CiQ5F0vVAotNvtTz/99Cc/+Um73a7VaiCG8L9qtRpYlTwWJpMJbGWGXSYGfGL8AGftbDZbq9V4LuLywO/2pP28iJkhms1m33777TfffNPv94fD4XS1OptMNB/QU3bTaaFQGI/HjUYD8ixvTpzHkY9dEsEHehEvXrwQtMElXRHRFSuVSr/fR2/h8ePHpVJpNpuhcCLRgA8HhcNsgb+CoOGyOB6PRQxETKDZbAJOAeDi4shoHx0d1et1cjZyA+Q+UCaVl7pyMEBn8qVKpfL48WOwYDngUR7Armo0GvHRCgclNCmYQDwpjyDmgcLuPsfH3bdj8iy5RdWRkIhiYmFYgNdYgiAJgpAC6uRMp+FwyB1WKpUnT57wiG9ubmC4y7sDUxeb5AhE9r6UcGSRpp0xJedlvBXDgtABpD/rreG27asy7tCbsKiJ9SXDKiYIiNtyuWSsJKItkWVUCODIUyaRRjltwrugiodAwzZRDLsmw+48peJs/srG0UDHqhu6Li0OmJSy8/P12aA0Y6EPI3rLcuaJSEZWItRAGCJSaXbt/7KTyeTly5dff/317e2tldeUMnI2mx0MBldXV5cXF39wdFT8zlQmZrMZMsHOuG9bjAAEHDfOhwPENtNDfEb9rYy5xIWZYxwKeo7aQslOAalJaMXLQyiGd3POqbxqd3uLEnL+3t7e0uLDDLfQpwdwfOAm/Bpcuy+cEjLjwopIKJjjQTyphK8Qg7Pfy7aH74GqFRF50JhtXHBBe7szRNdUdNjjO3uYr4fAplrJhc3poQle+ODsdwzRK5dmV6BqWSrK6f166Mnm4SwhtBHCweGghYIhOrkAINy2t2ZXv7b3OLx/tVP0vYPtVMA0dWBDcNylUYBVlnbbBiZL6AuR37feXngzu8Dr/VNiDx8lLM94gJ29Je+7SFbFA6NVgBdsp1/0ft2TwPYWTpjpaFp6oFtq1Sdcj94UInizGi/7n8KuE3+XCNUPCCN7iHsKWCpJBAHbycnJ6enp6enp8fGxDJatV8RkMkGaaTQawaYnJLMAsQRSQJ+FDp+enj558uT8/JwwFd1hsGD+jD1dt9ulXCow1G0tK6wcirYg+V5wVatV8mKZMUqZDSsITyTdMvo9U26V06xouN3ltBz0lVkORKebzUaUBQW3mpwkX0TjojfplgjhrBaNSEuWfWK3I0/vWyemNudQ/UyEa5my2LMm1BA/XIfrcB0A4sP1QYiwonPnXC6XQwsV7zjJv65Wq263C2IlNEGdX7ZWCSzbaDREL1IyQ0m22Wy6bV8VIBcRLRgiJzG1WXGBRTNEP/H29vb6+hpEibolkOv19TU2dMPhUC1C9XodJBR7H1wFJGFRLBYFEHPcrjebZb8/GL6Rl4+jqFypwIwGypHoLWfebDYrFAqff/45mo+5fL7RaIjCkN3KVxEBiMjMGbZYLGq12pMnTx4/fvyjH/3oRz/6UaVSKRSLxUKhVC5XK5VypZLZCrpx/1ybzaZaq+Wy2Vqt1mw26et/eLcvkGU2m63V61Tj87mcAETvxeLESQvi9u6OlurJdDqdTjeZzHqr3Af08OLFi9VgAHSLIgcoJxAb3BbpV3L240Z4e3tre8dEGLHe1uVyGbrxT37yk5cvX65Wq16vV6vVJPuwR39tz1oIPdPDVkEQNAacqsnt7S0oMNUOBIiHw+FsNiMkRUfi+PgY6e1Xr14RTdK/dnJygqawbZzUg4AEUSqVjo6OvHoJyxNIaDAYDAYDKg1WY5fXwONWKOzZx9sWbOvMY4fRGgeB70t62OJHun9RJOTEKNYzDy6OY9Y7wOJ8PqfeUywW4YOgEpDL5TqdDm2zuHKhQKI7Aa5Vtq+REZffJoeqoAj/lZCiWEusWcBZsbyZhNSHxEHjDYGtkUcQkUQ7A22JBPqEvLPZbDAYsCnFcUxpoVgsNptNRcZMe4+plJ5NBY32yf3EMoTJbLYZGqMrrGeHZ0PjUdIWgNDBYrFotVra/EEYpWrNLCJbc86hgSuwkkXKM+UekGdhRukKVUfttdlsxuMxvF0M/UQwKZVKOLwp7VlvNt9p9ywbmuRHLFohliU7HgvhgduREF64UVDRBdrKwB2kvlgsovbDTqtuBszZWWIoVNB5A17c6/V6vR6VKk5eK8xtdeptk7VSX6p6Fgy1Eywsb7wzXnwfHdnl2Wilb99KKE41XfDqZNIosJ3dyrdZztoY9YhVLfZGz3avh1aiLk0qJyxM2k3bIqpeFu29ldiU2tttNeit7NHUYMCGi9YE2KUJgNjG+VQzQCECoUKo21Ljw20q1Ir1KLEec1l7GpVpYcSsDgZKEky7Bsdj+MZxHH1Y7P1+/5o6w72pFaK6qX3Z7+Qemap5GhYgP2QovLu1CK8z6ij2sgHMrgKGM/60qYq9u2i2u3rhUzeQVCvLXVtfasEmtZbjYc1hGcO9TVX2e4X/poLpe25bLa2kcki0MdVpQ7TosFiu8jwkMO73+6iHkyqqC1MFaQ5ZathE+HCHz87O2u12Pp9HTO/u7g5naRQLr6+vr6+vhQ5rW7OyaYqWRf4gSsHPBtFC6M8qiqvIrZw6BIg9RNvdZ9F6UgwuTcPXE1LTaSLoGU9OtbgRuqtsb50ACLw9f1c+gg1Wq4+hELHaA68tu0IhRwiLK1C0BOrUulSC+PvhOlyH6wAQH673uDyuKABNrVbjtEBWkpIpCbBEEtbrNWdtpVKho0SKWtIBoNuXXKtQKEAbVK1+vV5ThqXGiwvc6ekp6rSqx1arVVJW9EBp1IViTAl0PB7f3t4mSQJygfZxFEWNRiOTyQDByN8GljH4VKvVqlarHG9Unl97s/R649FIY5JxrlkoNIvFZD4fjkbd62ts3F2SrDebxWy2WizK2Wyp0chmMtFyWUySej7vnFvE8TKXWzm3IoubzxfL5WIw2IzH0XyeW62W83nRudOzsydPnz569Ojs5KSSyZTjuFYoIOUcRZGbzxPnVqtV7/Ly5vJy0O+/NnEqFAqFQq1UalarzWIxt1679ToiAt5itW/ZJpKkms2WKCnHcbTZREniVquQVTWnM3k65aMxZRre3GSWy8x8nlsuc7lcKZOJTfAxnU4X2axq6bDVeKz0Z/V6PbiEoO3lcrndbtuit6ruStiUhINLrtfrarWayWSg5ok2boP1dw1hU22I7E8U8JE889WkfCKjFWsBLOqrEFWrR2ldwsWdJAaSSSNwpMI+ChWUamzO7+6rMegGlB7bVs2HcK/st/bGJFQklBw5HGe+CDG6laq06IbaCOAgQJt1zsEEh6DtnBuPx5SXUIxRZB/SEOQpB4NV7ashDVCIksXT5dDFgCv85atJ9FDUbCERkg3xmlLloy1BCVodRWABkgMHSbUk2oMRvHUae1iVM3RI5q0aDiQ974yHFTkYbqWbzabZbJ6enoKVDwaD2WzGF2fal8vlRqNBkYasYD6fQ6qdTqfFYrFeryO+TLJHTVEFSM0oSeDtaYNgz0ffhoWv7gc0rJ1zbPscQ8dHR3y17+iyqQv64+p3kcgABVfVM9560afCqQrlXAkkb8uuAvkIzAsUHuRdgubYA2BDKtMq9Y0KiaOxZjgcokDtaUnJ4Mu2Cmm5edq1H3Fg3/ikm61pF0XIU9pNXS9avwxsCLjYxejBSTI2oGWHj7NuWpLmcIHuqnX3Cr2w9gAlqbRfC2eL4SUBH08QQxKW1jrCOpt53SEPRCo9pmdqLSr09QrRNHv/9nt5+pUu8PvSduEpY2g9StnTmkrBtSdwlU6utWO1MtypjPg39xPH6w/wYPRIqftFTkJg1923KROQJGKdJ3WqPzz8HEnVuLCHyC703B6s1kLWmxgeBVgrVOCXtlCrfEokyQukE2Ilkq0alZ2fngaxN+HDIoRd+OGYhECt9hbPJWWXkLetIanqb91EbCjrzRavNcH6mO0Suf4+oMPvUSNkPqDD1mw2m80mMT8MgOPjY0gDhIuclWh5ySi43++TINC7ZmFNMZEFPRN4wPNoNpu0RhFsXF5eAhCz045GI2hMhHBWolrPlPe3hiWc1Hwi3GF8rWmMk0S4lrNdv1a/RbTisOIYHi6eXpzlMkv3T/GqLaqR14vIBczNLRFF2OOGwbfC4jbpYJ0i42Y5JdYiRXe+ByBWW5VlT6cadSRJsnEuOgDEh+twHQDiw/UhGLHNSwG/5GGtpJROeTQBRLGhYMtfKc9ms1nSUWI4EGHnnKQnBHhBEry5uYESm8lkJpMJ2ZTb+jVBYVNTuRIJcScJE6fTKUcUnCYOKqFUQJB8Lm4/uVzu5OTk+PgY0IfQEw2KxWKRWywsoNDq9z/7y7+slUrz+TwZj91opCYmZTicWxxjp5eXsKSzw2FjMhHrlhCwPZuhMjEYDKbTaZIkjzabk82m1u1WvvmGWAEScWw8Z9aLRXx3V+p23XTqtt3HaB28Ln3n80mSKKp9aOjmXCZNV9GbHvNebz6drheLaLOJNpvsatUYjXKTCdS51WqVLRSOLy4ycLGDNnbREokq8GsSmg9eBk4EnGGTOkbPplU8SnjcRI29Xk+Er129w++0Clwgx2whBqAZ2VawTDCkJhYk4QQcFLlACIIKLdADgcyscotEognd8ApTDQMwwiZ7gKHW8MdCBvTyM7aqhXiGKrZZOxSsDLN9a1Dj8SX5ahAi9LuMg4pMcRxPJpPnz5/f3d3BHD86OtJwqQZQKBSOjo6KxSL8XMo56mBw9yVBPRVgkQts9yh3mJqXehmX/RU+AhEYdSeIbQEoCe4goXbxEPURcKvZN2RaxVNGww7lHD6XR/mBCd4umT/JWEN6FerNrLPeO8zqVqvF7UFHpVsTgrzQMYaFbR8JaaAZNjomOdtyqVQCR9ZKkZi7UkGJqOz6aovF4sWLF7/4xS+eP38OfVj5ObgqyyGTyTx79uzHP/7xJ59+Wuh2v7t0mWMONhCorrY4STTM53MYu+o+eStATOWV3Hg6nVpXMUwpa7Ua47zZbBqNhl1inNRUaDqdzvX1NQcfBCjKSxC6QeSLxeJ4PGafUVroAqanlFXIEqlwSJHwgRvvw0t3m81muVpFm03mfht4WP9LYXcGqIT9LupKCdFtr+RmM09GXowwkaesU5a1wXSmp9j60aem9B790zuGdhEM1dxDwCbRIWvXBkPf+l6G75bqV/kQsDgV/LWH9Z4qlxUDtUeS/bO7ryHrjI+TpHs8gNgaQFmSHecm+4zQfE8nN7Vo6pUrdNYs3tcCN/wUnWKWiOfVC+2v6Ihn+lkpW4UTahjSUKgE6C2BPdK3ITE5fLhhXdMaBnggvtc2bgNFPaZSqSQgT6CeJ8TstgRwgVm2yhgqSNj3TxVzcLvbCzzDFZcmYp4q8+I9L69SpZ48gjRFv6LN7jIU8UbeGjnuX8L7f/6dosPh0O1fGhamRLpNcLBalBqNBtAq+SBBFCmJ29rYco1GI/r83H12OSEH3WnIYfHOzWazVCqtVqu7u7tOp/Py5cvb29vBYMBsVM0VZbBUg01F5hQUFVwR9YEL12o1rEes3LCtN1vCrDefdaCER0YoTh1GgCLUWzEHL8ZQpwVRgfZV9hPr0afAjEReZSpCEcEI7Lq7ZF70Yts9YL+y98UtQOx92TeloO+4e+xwHa4DQHy4/rZdqYQRckXy89FodHl5uVwuj46O0CMGwuOcABSrVqtkJhwYo9Ho1atX7XabiLDX652enj59+rRerxO3KRLq9/skzDc3N7e3t4vFIooi2MqQmDhBsYNDWRW0Io5j7gQxRP4ARuyco0os42Y4buDCYCKDweDm5maz2XzxxReffvopShqcXnzf2WxWKBafVSq1Wk3Dcv4//8+nv/hFauSXXvTennnnqRHn9k9wkJP7uVnI5UGHsZgkj5Lk3IYgLnCher+Z8DYdvci5ZpI073/te+OQJC6K4s0m3sYKmWy2VC4nhYKUIjabzd3d3XA4JIyjzs98ULWA5yUwHds6XqkAC8yU2Hoymfz0pz/9u3/37+JYCKPcGu++E2dhT1egEgPbfcaiUNwJLHV8fIzgNTwXZqM4knANwAFhTDO9uWeLa4BzVSoVm56BtAIV6eK3sDcEP1XuBwpJTMYChGfhgQJuq8/gTCemkmf7T8Jbwa0s4myh7Uwmg4I24JRKR4jG8KHD4fA3v/lNFEXlcvmzzz5jhiDIO5lMKpUKb3V6eioqn6dLaxnBzrRRK1u2CYlwT2u2YxvSSdU85pqajtnrPvvss6Ojo8lk0u/3X716JfXwbDbbaDSQV4ZgQv6A2aaCflEeGBBIK6enpy9fvlwsFt1u99tvv6VvAOxPfp6puq6vl/vbWllT93zbTK25R4olrrqKHLjVrdfrk5OTer3e7XaxEuXrWwFojaoM9/gIFibtArjeLZdLKK7n5+e1Wo0si4S/UqmoIrhrnU4mk1/84he//OUvu92uFb8GaO50Osh3nJ+f/4N/8A/+8A//8PT4ONPvf3eHaalUOj8/R94X31QS18vLSwRVWIPdbpeO1OPj4z1fUA+LTAwdCQmbUIHIZrMklm7b7FkoFNTZSkMo+dvd3d2rV6/u7u5UqWILhYvnnAPapl7FrLMyKdZAhlLrt99+++LFi9VqVa1WoTanTtE9wNnDSWTL1WqxWERxnLnPMArfxyPnetZnnqukdPAtRGjfIYQppSzJDkwqq9KXxF5tkVLjJkEeCbB4rmsigu0hF7sdSqN8Lk/THqxWZlpqTh46nwoQe3rlu3ClUErCAyA8nMIWRazFaIhR7hJNFhJhFQZ2aSsTKOp084TUrIfwrnEOZWEt7Xqz2SSbzSJJ1u8CEIe6tGE12lqnWnUOr5ZpMUc7x+wpw27AgSghIFvpURShk9G7PHQ41VvPyp4K37GPmJvxgGnPq00jzPuIJSBLAPG7WYDMcwHEwHyVSgU9LqghUhuzmOwehPQhfGqLo3lMarl1aStQB4k3V63UrJ0Y1oRNbUlhvhZyh8VNSQ0S7Jv8TZl37dLl2L9Y1H6hTBBHFqYZD52nzJG3bXScKgCemGu65dZ44S75ZqPRaLfbOOLQzEqscn19/eLFi6+//lrosHqw+CBrQ6r5ICBV4loCczlqma7yTVFkazcBsifYx9ueKm7bRRH5gl+W2DbLrpNkvetBxHGcJC6KnOoK6zUnXWIzC5U/mfCMuZ1johqIfSXtxPz2krKiEAAVL8OYwSvjWUOd0GPZcyAIXQc2m03CJv9+JOIPx5UPyPThOgDEh+uHiA6HEqv8ENyqXC7f3t4inyohVCFBOmJhTdKSAy6AtgPKEqAbFCHhEdNIPhqNbm9vx+PxaDSiPJskCWQoaq06QcGIYT0I9xErE8CX04j0GJ2p+XwOX8/KgHJ+0H57fn7+2WefnZycqJ8LpVQAylar1SyXs9nsG2Oc9TrzLtbz9zDch1wPe/P4b3DCvMvXiZyLoyifzydbK14ErPGLYC4Rrim7JgRUhx0URXwICcLU86tYH/3WfD5/enqKESIszl0me++9TDx+PT3szWYziqJut9vtdpljxWIRaiRTFOVlknMtHH1fKIcEu9VqVVmBIlfxpuWBJqlE21ksDJcAmlVg6/PibqszQMNordut/++uobBJHSE1Qy0yr2We8oLZbMYaVGrtnAPnZXXj14w7HDA6Uf5rm/gtRua5Tnn5pwsINTZcdmn0HwXKDCNrHwMxC2d41iIE9HBvq9UqWHan04F9CZueEgi7HG9LpMuUAMIWYk67AJkGGjur1ero6Cifz9frdUxBhTp99NxM/nsCdMAf5UzNfGM/B4PgK7DKSqUSh4KIaVJE1W1rrjrnwKrUw4gGN9KBvBUCFJpXe/JG1JB7vR7niyXO0xDK2VQul58+fXp2dpbL5b7TnDiXy9XrdRSN0NOoVCrqa8lms7JQp8v1XaVvLP/UGZMZr/te9VeIPBQY7u7uaIMV8xfInhesViuscthnOPfppLEDrs795XLZ7XY5sqmErR4mZ/Re+VWSrNer1SqK42S7Bl3AJ7UAkMBfS6azuIylWFrHTvWuirlv5X3Fw6XTlnKmVAtsRi1CnxJ+KcvLV9CieM64yXusqF2IifdDdleS89FoRL8FRxIzUO0OVkjaGxyJLIfYX4iRhQBxKknNBQqqqeyEXaTCkI2uIfVG2N0vwwsZZ0Pj1PNmTqgMkIqAW0s0bWuae+skWe5w+duDDr+dXhAoJOwnAGhWCxjl11nCEgvS2S2kVVDmHhe7VLu8VBzZsuO1K3pHsNuKYtsfekC5Kos6gBTtC4dS9YsgXxgiJSs66ogr7Bh6Ogzv1GfmmbV4bHeLCBOI2pjHwm2eUxle1voKwPc6HzXVvaaEEJ3fRf8Pl+ffLDr8fr8rHwgLO2rbtDJ0Ft9k8lj5Dn4YFr1U4QCNtexdAvjhcDgYDDguNQfsduoVbDxE1VYE7QFhZSJCIZ0oivSrNADYl3nT2Gt5ieNNkqRpPbso2faX8t9tRMHu5DwvVht1U7zR+aUDy1q5yuSZJcCY62X7yVWeZJxXUdujpe5N7+SjaEokzi2cWzuX+YB3mB8w4sN1AIgP1w8cJrYheKlUarVawBbgFAB8YAE2RucPnKnUXTlN4ZfRPjwcDm9vbzldrIgncMlsK7ZgIyQSezh0pVJJndruvsyous/G43G/3y+XyyiWkpNXKhUwaytvxz23220c4aVPqmMV7O/Ro0eV+Tx5r87Bw2WTlrhUKpfLAL5QDknb0CDudruw4fB240llMpnZbIbbEj6EahaD2wjnAmiv1+v1+33gEl7mufpqrr5HH2iqxxdgGZnYbDZDSVk4JpETU3S+vWzMqm5fhM8EzXh9x2qXg50qyJvxESwrxMeTF7TcWIt6CB22oViqCXjIHXP3OWIE09YmwuNGWSskbpvxkbBGu91+9uzZyckJN6CbF5n3jcPYtoVWgKayLM/D3YP1xVTygA/LUGNAwNFubm5IqvUs1MXMMNJaITc27Obo4hd8X6lUAI6jKOp0OrDYyBsnk4nbujOD4vHt6IskXcQzE0SpWCyyo6biMg9MulKRIOmxuKD9QECS1+PM3D4/P69UKuRLYOLy4LIfYTNkZUT8XLqfAMTwdGgjVSv0fjSc/aTX66ljFD6++FY8HZwk6/W6BZK+O4C40Wi0Wq1sNouxKvcDTAwRibKlvCV39Q7vRwZ5EHp28pahxoCIMNIfcKkADb1+AvRA2FqpVNVqNfFbAUDJBi1dyBkTG+YqWjfSIA7dbz48VVtzdm82yVZDxvZle7u65bCHALH6G2zJTUvAGi167nN8IieXCLmeDrJtxpdIouir4m9q95BeqkBkydDvV1Le5R/LvGJ6iObGTsLNU9rhkXnt8FY53QVcYA9JSd1P9qBp+03AvNeEU8gT/dDJZYslaQX3NVMdxTNVGT0KJ8OVqkjg7itgaJVZuGSzRecfuITDUuuu7dp+3z0TwNoYcGRQXeP7ErEr6LK0a89zWMW81KQgNLnykBoPUfKwVJFABatZgDjU9VKzIH8l9WANyvtEnWeaBpwgg8GAIm5le+k0Cc0eHqjJYGE7xRXWUAHuKlUZifzYbiR1eolNqQiKOEcBBktY04MehT1SUQ/xpgt1D76fl6f3FcKCqS0O4erwHCbDdoTU0UuVc0ltU9iVO3s/3KMEnfq85KYWRa//F8cujpPtX5MoSoAboyjZApBCIqOt1u6GmkWSrPkz/xpF8falSeQS53hbdjkXRUkm8/orRtGbf9o1XKG8uNfM53b4LnoI+DuVE1Jl7r9zFO1DOFnRAYc7XAeA+HD9kK/Q1B4Cr7KLWq1GXkRgJ1EzIU2U7kFjhRRIvziKovF4THSISgD6huVymdiUfImYleyLn4CgUc5N9exW3EnPPmgLkZnQKM+WmlS2VCqh7qrcgzeUOx+A3eJHP7parSLnsKx6k9I7F28bc14DZM4lzq3X6+Vqtbax42az3jKPnHP5fD6byUymU3SH67Xa0fFxjr68bZYCN9M7aMVQgKz3Vp7RR54hm814Mul1u8ttIiHARfkzwXe1WsXxbzqfd2q1XKUSFYsgDpArpbeA0AfiA5p1vV4P6JNomykkzUTr+2GpWwAcpVIJJ7RUk5+PFVJYxwnMoEi8rdeNch7LK9FXUIOVxRG8grmaMVkOwlXtyzQCXr+VBZIsaU5oxVvDZQ88fWseG2aJFncQy0/pGXRRZAQgXDvnhBuSv5EHuq2zvFBafYtd6asnW+kCRxdvYli8DKwf+F6X3Ai5ZrMZOafdXqD6uvucLJHXrOajahVgDV5DumWFC1cSpv8ec9iTlraWOOqxcFvaoEUlrHOg3XLz+fzZ2dnp6el8PkfUL3TEIpMXhYQNWZwat2WEcSfIcfB8U/3iUw+s2Wx2cXHx6tUrGNbMcCRNuGGOrfPz8x/96EetVuv3sFXSx7Ber7/++uurq6ubmxugQI4VbOskfs1hqubiBz5KK0GjLYWThR2VfotOpyM5fqQ82EZEK0ZoeLlcZrNZ/NmxuRMnS7UZtjgrjcoOJoBYM9bt9UQKU+uHT2YAYr62PkgTLMTmrExhKkBs/dM9AILdSe6j1jaNPRmgzaou6okIhbT+YO6+8IXd863ipKhw1vYz3N9SAVm2TVB7ipdCtPVPOmJUWdcz9Tb8EHC3d6JeE68/I5X8G0pM7ocDUqGfEHYMxWrDe9bezgJR4daeEUIJLX/ce3PtgbaUaBtWNkmyfsdt2WPp7oLLUwfNe1L2fOcpM38kkE0fj76X2JTWsVkA8S7Edv8z8jC1UPNX0gfsfuoTsqI0oVavF0TxEKVW5Lbmrtqd+EQa1IbDIQ0cSOGrrqzVp8trTnJpMtwukBhOlbyAmEJASP+TSgu2cYrtRbVnhoK0KJ/Phy6+4f6/q+67CzhLvh8OXQ/kzoelAutYyCNTCdCWLQmbVTZQcKU4xLqiea0bBEJwPvSAFBxOt77cajfxuhhDuXnLvUgtpHnriGcO4IvyQxS5TCbJZNbZ7DqbXWUyyziOnNuAFScCIJMoSfh/tin3emPYrJPNVmCdT3MxH5ZEiYscIojc+yabbDbutQxD4jKxW22azj8AAQAASURBVK3iTBZaesYSRXSE6YlI1UrLVkJ8Nh6WCZ7HuX6PWbTnKEyv67w3hTdyruBc8cPmfexc7NyBaXa4DgDx4frhXjo1hfFRBsdlyP5VZjUgd8C4VOx1KpAAAwUCHEt0+OnTpySlT58+hSgqEzn8BKjGDwaDcrk8mUw+//xzKGA6s8n/ie2sY5Wt20MCgkemKBOMEjUMAGLF0zBu2u02v1UsFhv1eulP/uTr/+w/Gw4Gd50O1L84ijLZbCaOi6VSsVCghy2KY955Mh5PZzPQ5GTbaDOZTrudzmw2K5fL548eFfL55y9evHr1arNef/rZZ3/6p39ar9VyW0A8m8mUy+Xz8/NyuRzpWE6SZL3erFbr1WqzXkfFYpTJuDh+HUd899dmve5eXPz1X//1aDRyzuVzuQpCt5sNApEuSXK5XLlSOT8/z5+e5rLZ0d3d3ddflwaDTZKs12ua7mlqpnkZjptIhbPZ7ObmRsJh0Evp5VeWG9bk4Zicnp6iUAGl0bYhu93tq++xQPhvuVxGgLher/d6PYh4KIEC7pNzisGHyidgIg2/TFTlMBDtPVt5Pou1QE+6c05KFJ4uoQVkbXrGJ7rABV6YdchUslkZS2NXVd/zFFYoLyqThGhVyJFmHDx99CVk9EzvAkIZm83m4uKCRAt2+fHx8enpaSqmxue6LSnJWlTvUtUU9Dkaja6urvr9/mAwoLNeWR/5idVVBAekcbVarSJCXSgUzs7OUE4HNoUGCzG83+8jLwAkwfMVwZNCEVIb7GxK151zKM+yZDyN1zcRcCrEcJ99E8JM5K5sg3QiK+73SHlIYaARr94O/ttsNgU2Wca6PSDUC8ycZznAOFY7p8b2gRjuZrMZDofPnz9/9erVdDrlaEC5uFKpoMRaLpf/3t/7ez/5yU+ePHmyX63iY11ITOTz+f/4P/6PR6PRf/ff/XeXl5duy2VG3BC+GLIMyFA8XDbEIi/iown0wev11atXtGUAEAsJQuuGVFnneLvdbrVaDA5FL6Dh9XqNbJRk351RtOBYZ0eyt8SOZGHTXaomqW0ZD0nWvEHw5nYq7paq2ul2cCE9FDLViiq1umblX1K35T21NItMef+6Z+MNKYHcUsZcQqb2vPNDnoLHdU19rKnQz0NaHCxstIu56bWn+Pn/fWJa+K+posmeCrNXQfQOC+GVcg9TscTJE/gDggoXWB1YSQSrpGE1bQUmspdyb2KzcnxTHLKr0muHl165BYhdQIdPNSHchd3b7yIlZe5QADE7yS5GId/O60qhHKXSJv8qZrROK/Z/9ihQPzGINZ5y/RKb2N5w+H29YrlgLw0jRxunm0T87ZfiGSmUVXBie8tSgbPQiyzslLKo+vecirSnAJy6mUs2pNFoQCagMZTTSoUcJjBCENStJYuPphM1UTGcrNpDoVCo1WrHx8fY3+EcQHl1Npv1+30kEDlSwyVgw2zV2jXfPFU0icgF5UA2pUQjkcm4fN4VC65QWOfzK07XJMlsXBQlUeK2DOLEbV1sHCylZJOsN+v1ar1erzZJ4hIXx3Emm8lktgCxi+I4zsTZbDbOZjJoNyVJlCRx4pIkSVbL7GaTrFfr9WqdJDyO1yGxtY+TsS2NKSwKIj2CdomqUb6iIoI1qO1XeO89093nFO88Hbb/fa+ozrnyh036xQFbOlwHgPhw/QAR4ZAegnNrtVrdbDaDwQALuMvLS8ymdEIQVkJaERfSCkLRUQtWS3V9sVjAEVsul71e7+jo6PHjx8fHx/V6HfFfAETZ5vCLpVLp9PQUy1oFauAmSpKFR1A67vf7vV6PPkrJEFuVCdvsRmJPL/B8Pgfshk5FoDAajXqrVW+1WjiXzWbLpVK+VMrmcrV6vVatZrLZyXjc6/eXi8VrW5g4TvL5NeLFUeSWy9VmsyoWy41Gq9UqNhqr5TIpl+NabbVY9FerV4PBIp8vOJfbbOJMJpvNNovF41LJVatOOadzmSSJnSsY8uwDK/YfZ6psNvnZrNBuLwuFTBzX6/WT01OMg12SrNZrt9W3LRaLhXw+k802SqXWfD5YLkfDIViY4gb5DZIqyG/k+fPnX331VafTwd8M8AIHKhuBkT/A1IB8AWwqcU+Zlrz3uggbLS2xCNVUyiHT6RRxT6BqIE58qAWNgYjBTYD8SPBKYMrNW/M0ZxTutC7U2Sr6qroUxVOw6LDNbF0gxWs9H+y3DsE+L1H3YFnlabY5WsAfGLF+Lj41L0CrQcE6kwcmOF35wLVEn0LWRLuz5Dthr27LUfWgH3df1k1fnL3od7/7XafTGQwGSBY4o1Mpgok+l8QSAeXxeEzGgjNhrVabz+d3d3cSqdhsNrRfsDkQFpPTWo9NZQv8XJKRpEYSJk7HFN7mR5cEYLEqEID1CHl7+JFt1WRTpVMbTBl0WHU7iiKhbh1bNGAoYtw8UGhTLBbm/7suUhY7+hJ6LgwgK+7k5OSTTz754osv8Hj8/RypPLJnz559+umnx8fHCB/NZjPmNv8qRX7O0/e7N9uDbNVU1HgBKsR+67a+4TxxFiZdF7gCSLVGZDoP9PH8wSUfbxeU7SgPV9yH1OeymcxreZz7+CbTRixdS9oSsKW7sngN+w8bsuatYhhTk11LVkuke/k32qYNy6vyJBotN1mbpEcxdmnSDftP9pBE7CFckv2hpmUvWx1MrYCmovkhfGmn4q5iqn3xri9lJ8ku5MjS58MCgPWR89i16jth8EMolp+w5draqhWqshJMGuTXDgHrdeaBxgxR5B4gKbPLF86e41LPsMrg1pXOKzBz4ig4t2eiRSfdDvmIsBiTqkTsdmhTqN1N+4Pmf1hx8dgnNnTHTxJ2iDj7cnC1Sg4Sh0Wky7ZceIoc3i6hFMaeYu4+S10fZEUMiNPYH9bbeNgeiIpwKLnZngNv20llm9pnkYqF7QKIUwtmf4PQsNvbaGK/L9ssOlF407VaLZqEpLJtywlSGuz3+yjvS4RdNtdqDuMp85iKxWK9XqdcWq1WbfssZderq6ter4efhOdaGQbJ2jpSK1h2gWez2W2BIkI7Ioo2zjk4ws5Fm012tc7N5zlkHePYRdE6cpFjI1EnQZLARkoi55Jks0k2a6t5/brlN36NEEcuirKZKJtN8vk4m83EmUzkotdgs0uSxG2STTYbF4sucS6TifP5zJZ4sVkuV1ZPv1QqkdlpUcgJkPVLVk4Mz1rO5/McqaktcalnQbj57Ck/p9ZxE4l3/M1ALQe06XAdAOLD9YNCh8NaHEcy/bBoBJNnDgYDHXi2Fdo6ZRGTSSeU6EpNWJAUaBPDv2uz2ZydnQGrtdvtfr8/mUxyuRyIiU5Qt6Xy2SiNllj4UO6+GzXnkNLXkLZTLBYVTqmN2iJuYB+VSoXoczQaLRaLhPabJCGeKBQKlXK5XC6DU3Q7HWKR1ylfHMdbpklkzIvgRYIHgcusVqu721uXJGAur7vMVqs4Lc5+jTj/DV1EAwT3tVqt2WhUq1W1YtngdbPZRM6VisVarVbI5/um4x6eGt9UjDPF1kmS3N7eDgaDfD5/dHTUbDaVDLj7FtIAxJACLI+Aeeil+u/R17arlKKvIPNDkC+kVKGlSBAA4QIudJNFZucmQUJpivekACRsZz3fxMnls6Rk58Exzuh0Kxr2Vr3tYvZEOSxtdk93sNT0rICjUGPRbFn73ID63K0JhhKnSqVSr9dpCIjjGCRRLn/EuLD+gfwkZf7WHFu4gHYq/WG5XKKQjtoJgtfWiFzKMwg7FovFZrPJvjQajTabDdwW2O5qp0CcWuZpFMZQhKT6pf2HmhZvyJhjsMag4dkIQPxWAo43ez003HKgLKqipmP7WGE5oUXAaqJ/lofF1e/3G40GFK1Go8GjeUOsM++mesBisajX60qhmSq4ur1rtskoSeCIj4iiCBGbarX6k5/85JNPPuGufs8Ha6VS+elPf5rL5ah4/fKXv+z3+8x8uUROJpPhcIhg8Xt8hJppGEnr8C60i7Obx62kV9sCExX6sNasai3e4/OsIKfTaafTocTlkRm9/fYjdDdvDd9dFGUMGi5ev5d46+ce9GO9g2QNb3zh38x8i51xykgwmgVLmRwRYcsUs7wwCxCr9O5dwom4Q0sS3CVbGaLDCtvsSc2UENVUfg+qE2iFKpDbA/B5nOs99Or9QWb4Su8dPCjZ+3Oq0KptMPewGAkT2TKASzPWs75zanah0MshqGlmJXeYDPFymU8T6//AOtMubruNXe3WrTAA2FrPmhcg1uTxkW3IZL+7B8enyke4HZ51qd/F+4PiDZlWeVCRZQXKukAeDHa284iFbkuMgj5Cwvtd/eweVm5DI63EUIBFd+tBxpJyVklG8Ym0hnFVsaZ5tra6B0+0PG63m62fvK1U/H2+LNXaurASYKBFVq/XCcNsaQEiEZUAbAkAiEWcp71GFXpGW/EzFVM9GtSfmFHj8bjb7d7c3BAWEqqFk8rWCTxNXlvRMRvI6+eZzWZzuWwuF2WzSSazymSSTByBDSdJdrnIzWfFfq8ax8VMJo7iKIpEHI62mOebjsPEbdBT2CBr+NpB00VRlMlmstlcJo61hYNN5/K5XJZELHbutV5xFCWZ3KpcWuQLcaHoVqtoMc+sN4lzyWrlFovVbJafzQrz+RzucLlcJqQXQEzcSACs3FxCgpJeCaVUUunzXm0jFBp6SBn1rVyKw3W4DgDx4TpcKXG/is/EMfTJsokTJwlUFaZjd17bJKWYT45GyirlxeS2/kivXr1aLpfwMZ89e4bBDqY6cmRut9ug1Upu4QWTWufz+el0qr5yGtIh/6KJMZvNlIYR2fNb1tiHSJq4DewPlh9tStyPvKrUmAZwQ9XaxuiMmFVJFiWZWwKDZqyQ4HTOQa8mrAR4/fCQ7iMGhRD0QMGy2SxAnhhnYWjLdGo0Go8ePZJsq/xzJAlH6sJ3L5VKaJt2Oh2pYFuA2LPuAW3koeNkDeau9CPkPX0gWqElYAUNtUwghniRqxK5MP+XrLDwF+sXp1hZCwdmPSCdZCV3EU+sZK0KLaFuoNB2qUgLO/AUrneZbFjnH+VLVmTTbXvuJNsXSoWwaqAPA/7aKFw7DAnAdDoFmrFERWeE1D1HdRfQZyxSTJLPBb+13++LikUsi4sXO0OtVhPr1jk3mUysDLo6dr1B9oZd5CkLTKj0RarDngM0ptx4Vxj9ZopuTUnuPTLMTZIkYWnEcZzJrJ1bJslstdpMJgkISyaTZDIuk3GZTBLH0+XyutNJ4rg+m9VqteJ0+ppPvU2uypUKDqKVSoVGELy3ioVCxsBzcRTls9lCNos0ar1e32w2UtpjX304vMJXm8znLy8vv7283ERRJp+Ps9kojmer1V2vl81m6+32H/34x//hf/QfnZ6d+fArsjwPyyveyeDeXrlc7vPPP3/06BHk9H/9r//1N998M5/P8eLj7Li6uioUClJ4eL9cWpsGyObJyUk2m4VmNRgMZI/pwQ1WEFw4iNjrUloEl6HMA1dRgNRkMul2u4J4rDu8h/J8FE3MXC5XLBRcHGfuvwMHhLe+rBDwfZHHNy1EEmm1KsDO2KDZ7g3axoFZJeNAQYunqW1WgyaY2Go3S35U/OIQIN5jTbYfINZxox4O7Z+cFIQ6cuyUFLi6fXdNeK/XJJXT6rW9e/fsCXSEALFVELYntXdq7zGs93SBtSd7trG2h8aeFBocdcXJldT29WvV6DjLZjJRNpt3Lvp4AHHqOKcqHlhg10bjWKFaai0TQ1/BagG5+/zrPTfwcK5JOIU8PqDgP1EF7Q2EWBuLS/GA1q8oovqaVmgb6FBy4V6Muks3w67iUNlDe0ioiaFCvnZUtVeqEC5ugZcvhN4PuyRH9pAudzGIf28NNB8YWts9XAZ9BPa4DkrvSMcNZxZpGkpc/X5/OBwSQUGwgKOgKoJ0qEHw1VJD2CktL2Dl29vbu7s72EuWmW4fkyXg27VpuSAeYZZY1bk4iqM44zLxOpvZZDObOI7ieBNHyWJZGA1rvV5tMDhaLsuRi6I42moHm0FzySZJNvyH4CjBn+61AU7ikiiKM5k4k8m+YR1FUTbOZrKZXDabzWTjKI6i2CUuWkVu7eLsptZcff7Z+NGjqNnYuCiazbMUPtYrN5uvp9NVLrfM5fK53GsTC1t3JGAoFotIWokx5m1fnvVf6hnh9S1p79rV2RBOp3uL5f2yv6Vzmw/zqTtch+sAEB+uHwQo7HY4gSqIbLVaJycnURQNh0NEEjkDRqORaF+0e8OLFKgUUgCo0PIawTGAtvl8nq78yWTy5MmTVqtFUzliFPhOEBzgMuE1imYymaOjI4h76iSaTqdXV1fD4bBQKBwdHUVR1Ol0+v2+mCA6jdTRLHrFYrEge4d41ev1dLfAPaQZ4lZDrxO+bDEppaZKzuEYOueQP87n8yh4SBNjNpvRM0Wj08nJyXv0XH/XM6dYLJ6fnyMeR6Lrnc2WWAGwW6/Xs9ns0dGRoAqLmkkZczQa0cB+fHx8dnb2/Plz2gnl70QSLqCTmcbIV6tVfoKmgSXUuI8qsqHpJz9GhGUR2Go2m6VSCWVPwiM5ZohXAhasXMIGl4K/Lfveep1JwDcMm6w4Yyqe6zF0PAM6C+hbZiK7wf7k0CIy4h7C+JBInOX7iE4r4NWq7hJJy/bNtmwDcAh3Ts2pPBDBelqmQhh2HPjcWq2Gmo1SPu5TzjOQB2u1mhWuIRvHhlH6wiTnfDUmCf/qNa5qC5IHtN0nYWiu12t52rx1Ptec+8+d+w+cW9uAGAHN1xYkzm020WpV6vcb33zDFs24NV69KpRKg37/z29uptNpcbGoDIfA03qU+grWB4nqDmAZlJjX/M04xgNFTyV2LmTzvtP6RGUvM5udPH/+57/5zd8bjd5M8iSJo6hcKjVbrbNu97NXr/Dfu3d1u+7nP3dbsY5dF4Q7D797192SzJYBvLm5ubu7w08PTecXL14sFotnz541Go13sqrzyirq4OagKRaLR0dHp6en1Eo52kKBUYspWJ8lmT5JWUW7mYiTHFij0QhpplRg4q0T9Z0w4tdSpHGcMQs89JKygIsnMWT1ASyxS4iSLZWhf8I0QCbLmtoBKNDuoLNJhXOrqGP71kOfJa/xwt3nje566OGer3NE1UTPSYmiuDBQGYXJBZRAbg/Gt985zWO2hlDgHmdU7/DywCyvs9574p7vq8WIQ8tEgT7Wns5K3HogoIUYrAufRtiphyaK8qvV77lNYY9Bk60oq2ZjT/OHf8SeJu4P5yiEBGQ90F1UcfWmWE0YHUwWQvIUObwl71WUvbvSawT4qozhsa29ue0JPdvJn0rE9rjhexb7nqLL37JLmhJi7sPttegwkb+1ykBvGulhhKfQ+rBkEWIS4nDyOD5F4vvkfWDNvD/tZciOiVbsNSto87E7odU8sW6QivYj59brFWt0sUjiONok2cwqzmSibCaJM24yyd3clp8/b317cT4eVSMXuShJfC2bJIkSPOoS48SWOJdEm8S511Z20daLzizH2MVRrOMnRt/CLZxbuUw+OTlfRJm4XHW1WpLLZaNoO7HjJJdbJ8k6ihaqvuXzCyvGTcBQLpdpmbKPQIbPoQF7eDqn5jXeItpTxfdFWt5/q93+d+1c1rmVc5mt7V28/eHauYiHuv1rvP3F2LnVe3vkHa7DdQCID9fvMazcVXDjD4VC4eTk5OjoaDqdcliS5WKqY/unvL4/C8zZFj+JeSmEIj0mJ7m7u4uiCPkFdSiDp3jplhduomREniaajBST+ZqLxeLi4gKXPEXzwoOU15E4cfwTQ1CI5mXCreTOhA6aFOvIvjxKgoV+UJPgvDSyUJHuIZvNkm222+3z83OkFX7P+cZDLpQldsX9XhGYkCifz8M19hzS+fqyX+t0OowzD5TigRK53BZvUgTGyPNfpKj1OKTs6c3td42n9xgEwWrncy8vL+/u7vBPq1QqFxcXFCdEYIfIA6per9cLhQJhE+rJUJasPxhgHDGWu8/wUp841Q63g1DmxV4WYfFEDD3Whs3BpHLoCeSF0TxwCfggT5CZ3Gg00JZlgagRgUCcIF6KLnwjCi3Sj4ZqB0mQ2FoEHJvbu/v0Ey/HU/4fmudY9UbQ4Vqt9vjx49fKktu3hVRycXFxfX0N6DYajfDWkwwlxnR2eMVsmkwmSBvTKFCr1cR6ZoujIgXirN3GOYeTGLUxFoVHpkud1VXn/vfO/e/ur0zn0SiSxG02bjCIhsNw3jutl/E4urv7kNUiu7zX7/yBkbqJ9ctJ8uMk+UNjD6VvGO/nu+nr21/cjg9zfrVajUYjxL6BbvWw3knZnDaU8XjMAXd+fn5xcXFzc9Pr9WgF4ATEQ+9ddyebI2mSW/iSuaS81KKcAjt0FutEs13M0s1ENFDN+Oxa8iV398n7qcKCHx63uK3Ikq0bediKB9nYXc5W41TnFp9XYkchjxL1cyRiBF5QtKaiHIoIe7fkMePEL7bsVPuJuxjEHn7qFfy0bwtEk2UZv1KpVKSRyrZDKUv/tQ9uV8odbjt74smQMRoCW7bOoTHxpH7F5/U0Q1wg1CNSIbPUbe0c1QEtR00qH1IlVjVIXFcJgEiwRVPdyuNks9mI4u7vpYU/Sbsseq75JttYjSRHjKfCvMt08aMkGm6H+19qSJYqhfSmDcVIovMEbS+OM/KvVjXLUo9tTK5zP7xb6yFmt5fwbsOD2NpCgD9qUklVRsoG7r7Udeq1S8RjV2Fg177xQ6EuMVAoVgEjkj0RTMLJoKylII2TS+gwQljaCsJZRISJsBsAMR+K485yuRwMBoPBQAkI9GTIATZ905jb6RR6PKjGoE617f3EcezmhdxoXFmuqvGo5qJKHGXjTJLNrjOZzWhUefny5LdfnT5/fjoalKPEJVTXLZU1SlzsXBy5OHkNUG7RX0c1Pt6+/jV6HN3Hlrd/3bgoidzauYVLli5TSI67y1LdZYrRfJkt5lez6WaxiJLEZbObYnFVLC7K5Xk+n83nc7PZQtuj9ljExCBVeNI9asWz1ikhLmxPEKsn463KPVDGvUMqjqMHtI6lX/ktELx0Luvccgv+Lp3Lb3+42g61XpODo+FczrnFASA+XAeA+HD9QC5PUU77MnKQcOgQ3nXOCdMhq8HIVRkahVYde+v1WpqPNpJTkT+TychPTFgwSYtSUDBTCVlYhp3NCtRNqaRUlnTcFUkd2S+nFKwuDxHjjFfiRPYrwoXVMCXrUCZm69LS+7OBi45DQGeCGOUqkF4rlQrg+NHR0bNnz05OTtBw+D7PnF0JvJcxiopliYc2riKGY4j0xIkLQS5ms1mpVFJ4LUaAM2yO+Xze7XYvLi6YqFLeVLU5bMN812VikwHhoTzT6+vrXq+H7R7JAPRwxKkhoImNyNLArRFVDfWm2c+C0YAwsaYucx54worW7fdAtzAuy8E6mYgTJ7hZEZins7YHpeLNeUBMaRgfQk+sjZ4IxYCq5Nj6LIJvAUAS8ZRpTIhWe97iznB5hA15eWAIXqjfkCKQFBvF4wb85dlJRV2trIIMJGiu8ZQqCBfVBRmUua2xHkA8dZTZbGabmgXSiT/uQUjhA4of3g8XPtz368j7vbOZojQm8rveTOLcerVazmabbW0JfxtwNB6W3CYzmUy9Xj85OaFy89a2ay4cCweDAb+Fuj28JNJOwGKR1h8OElmqpvYHFxgoOSNcoJ94YgtCWFQW4q0kuCRVBJWmKFpIJD31IPAWmndGvNNuHEURm0LGyAcLfAlHRoC4bHLtt9Y+s1gsrBCwRwzkKzMCCmby+TzNzvhSah/2Nt6wCGeDDT0LD5iz38UjFXqk6ZCEq7965DV9He1yyFtpAiyXS04iS6vcdbjboyoxfrmpksSebkAoHKnzTsRqK1ol+Ew4vu3618wXpV3nPtOSk1fCEfaIYdeVApIVaZEWk/6sIq6ICODpWAiUSqU4l3tobHG/ivnWaMrTAhZ46tmj6ZhQkxzxBuMveRM6ewiTUkHnB2LT+6s4YUOPp4cT2q95oiJWB8MyTizz3XYOeauJthuyACaA4EJNGLs9WuK5uy8MZcFZO5N3pVHSJMH/0xrqqrBkJXQVmwk7tiLmtmpi54A4FmHL5i4NFvcd9NJ9nIKfuTexDarVarPZZKLKM5zmGHXgiUQsfo/Wu9a4DWtt90Zpe6lewuk/HA7H4/FgMEC/WHfLZ6nUarc721BliUHufm+EkkfeNo6jTCaKolVuErm4kbjcYn08X526JBfFLpPdZOLNdFq8um5d3jWH48Jynnkd9ERb8FdhULxty7JhX3T/h7GRHosMXmz/t3Fu7dzKuY1zS3c3dr/+tuRy7uqmkI/Xi4lbLZyLXKW6fvRo9uTxpNlyxaLL5zOZTA683h46jFihUBCqbl2RCbPDBppUv0qbNlrj2T1aK+EOo13m/S18Ms4VnXPOFbdjmNn+1TmnRjX91UaopYNJ3eE6AMSH6weFEXvync65RqPx6aefnp+fIyQPua9UKk0mk+vrawFwHMBkSs45gLw4jqnf5nI5TneMBaTnILIG1XXODMnRzmYzUmVopwSyCH2ys1sZBzm2k2vhJICEKLVfGxFSUsZBntsOA1aCAHnUWuKkfMl4jWUnOcNwkT6y8D6+OG+CcKpyGMGIgIYnJye1Wu34+Pj8/BwB1h+EoYSX+dss11LJpNiljJ3L6q4Cn4kXALP48vIS6YbNZgMFezgcQsVVEEbSyO+Wy2UXMCs/7kha4WDKG/DvJIkrdTzJGlJ4cFuWn6TxRE9grooZDf4ogBs0RJG0kBGr6qXRtuFpWP5R8rwLU7a/Lsxo/2y0feilUilJklKpVK1W6/U6Ho/OUHts6zf20KwRmglE+xLDiy/LfEiV7LQr0TOTsV9Q+bDSQilaiBmq1Is1LhSMTRJZcKBbNKDDtlD5/tkSCII5zE9YaQhTePaJlKOKxaKaEIWJi5ok2lEKEufcyrnZu0/mN76XWzlgd7+57/W/m/nk3ooQ6LXO7yL+KGsQmGejaZwkyZZbquPB7Ua43tCZk2SRJN9eXHzzP/6Pq8WCogXW55bpSV2q2+0OBoNWq/Xll1+22+1isch/30ooZh/A34ZjAoyYbWG1WnU6nclk0m63H7JTeSCFtVK0OIgVT5AAlKhPIFx2s3XGessTo2BaFotFsFQJptNNgsiSZwfqgcIfRYOYYCOby2W3JTp6KcT39OyAwIYA6FWMsYa6YkODKXhGZxzQdHKATcgOlHYftjvrbudh3yJo2xqb93Qkamx/3bNj9X6+ZzcOdYG95nptIzKb5QaWyyWGE+HDSt1wPCKwx3r2qvi2kuG1BotnIBRe/TH6ItKxAVCwwJm3zVJu0bfg5CUiJWyQM5LsDS1sYbEePRHpjTCdxI+bTqeqfDvnsuv1wph8vsPeu/dRpupseoYf2hDYshgKAcQyAGBs6X5z9wU6PSVQt0OlKjxbU1HjXXzhUP/KgwjDDxUFhKGWkqwCJzUY8UP70QzO0lwaKFnJ6ai1aLu3Hr3SiL08m1/uUB1OFPgtg5iNtFQq8RTsFxdGLI1ydYnZtpVwJqQW5B5C4/g+5BchYC2AmH7KSqXCd1dNjjBbWjG69BCtEJAtR9kCCTA9W41EJ7RdgBFLvNvGjZotCo0UHlvGgApvSgOt47RUGbPZJI5m06xbrufTRb4/PhlOv9isCi5OomwSRclqmR1PSsNJZRVnX+OPQoejAAjeBRBnDECcBOVxdx8gRkVh41zs5pn4+W1xPM3+JrfKrJP1xG2WURQn7ePln/xJptFYn5ysKpVkNos3mwxwgQWIVeewJBh7ttrxf+CJFhpmpgLEXoz0GuX4wDm/cC63HfYooCqEfw1/eACID9cBID5cPziY2CIs7XYbScR+v08dnricphtYk+Lj0BUr7q3982g0wumOHBXPN/WEWqVayIb5fH44HL548WIymUhnoNVqHR8fE2Op45twQWEuBNK7u7vnz5/z0QoN+Sf+PJ1O6/W6AC+prHrxFpGBF7sA/Fk8Xa27FiDzom1BSPRv4qsrcqiElVFg+PTTT9VC9f13k9iT6ntagRYChho5nU77/X632x2NRtYoiTlD6gUWM51Ob25uSF/hpVKosJVqQHaIAOBumma7stwPvORNZNeCHnEmk2k0GsfHx0DVhIMkruKzMzfELlksFoPBQP4byltQ3xZzilhKJAjxdq2a8x7xPrXWWqHMVBqaBUyl+7zffAbq69HREWlPqVRqNpvNZpN7RsAXkBStCX6RVQmCIz1iZgjhNUsDbW61eMvD2nPnC2EpZdcikjBEnt+0UGAGEyxA7aU2CYfYIn6E16aqvFRUNQpCk8nk9vaWylO5XD4+Pm61WrRNaCfkocNHYxBUGGPywz8CjrSETT2+mXP/jXM/Dzb314Q1MRzvJ4ig3qgogJHR1zkYDG5vbxfzealcrtVqjDaQnDBEi6pwH8qgnHO5bDaXz+dyOSb266w4m41MSfI9/N9I5C4vL7/5+uvBYIAP3nK5TDabQrFYKZdrtdr5+Xmj2ZT2PW7eEPndVk3idbPLanW7XP4qjr/6n/6n+WymXE7CwbwJM7Pb7T5//vzm5ma1WrXb7Vqtxh+oO3pozr0ILJtVbVJzjxZa0lH4Siz5B262mrfSv+bkAvN1hoiqs8kyZ9frNQIvzHbJAqpfQfkwM1OLSErHqhBT4/HEpvYQh98zSnGuXC63W618sZjdrgX2T6GuNj+UhLeMdj1JWb4yS95zaXNGegIiG0ezUEtOcIvgpNcwDExgoRzLcbZnpbtPCdzlCBpCbGEuHUozW04AUJTIsM45CpySxAnVe8NJGN6nxMQ0BzSwttggtXqh7VYPFFoAuL8zXlLgbtZ70DaFsAo0/y2Mi7YPRyoxqtshGivxNE+USaenQlDr4Ips93KzyW+3vgdCw/tf4ALusOAnDazVM1W0Ke1s5jA7WCaToWpLWAJNwRoYamfw7tBjOoe92x6WamsS9jXhhFThNlS48maadK64VABgEEqlkhZvWJmQtI4AYgmSiBPKnLEt8N46tevX9nJZJqNmCzOZs1J+pMIQmeoEM95aFsWV32WHEcqpCe/h76krcX/rfbhvfH9SUavwTmLIXsGwqGXE6tXuiUut050d3kqlUqvVRE9WGDbbXrbeEIbHqRCkAkhntM5DERLmHveeJC6XTZaL3GK16o9y171Wv3+6WhRdnLhMEsUu2cSbTbxKMkkudtktyBh5EhNpAHF0n1mc2YFO2u+3MXixcy5x6yTqDrKju0xmno8Wzi1csnEucsfd5dnpcvnjbKGQqVQyceQWi9cqyEnyxlXFRgVeHc66lL+VC7XLGXU/ZyVFs3urwPy+We4HzOyDAPHhOgDEh+sHd3kNX6VS6eTkpN1uJ0kymUyccwBhkBFqtZqlMOjXSafxaOJ0Xy6X4/GYPnqiOmJrJEq9XLrRaDQajTiO7+7uvv32W3ATGC74fTUaDX5RCokwenS0LBaLXq93c3MD+1hEA+hg/FC9h+oB9zxehG4zMmSPRIHAZNZdzYaPlj4QWqPgbECiMplM8vk8clrEKIQpzWbzyZMnPzhoODX/tO38esqKD3iI4/H49va20+lI2RkrajK0brd7fX2NUyLoT7fbBQiwETPjTxQuxFYNlZ5M4cdaKYSq0ssWq905NxwOnz9/XqlU/uiP/ujp06eURoClxuPxfD4HRWUm5/P5s7MzuKjT6fTu7i5JkmazibQISYt1aCQsVmM1GbKnSuE5mNmQ1BJsPeHLEK14J/xObZX1eh2VUjF/5U4+n8953NfX1+iriMxlA/3V1jSs3+9Pp1NC+Varlc/nwb+oKDQajaOjI5TjXNB2bW/MCoPabEp5CHfOlqL+YutPZc1G4jgmuyZHvb297ff7i8WCbFCKKHhnQ+Piz5LQgV7UaDTq9fpkMmk2m0mSoJonvLjVamWzWemzj0ajwWBwdHQk3z+QXGdoWXy1sXP/z0ByQa2EUZI4muxYFIyGc41q9cmTJ48ePQKszOVyX375Zb1W+93XX//VX/1Vv9drtduffvpps9msVqsnJyefPHtWLJUohyDzt1wu57PZclswWywWq+XSRZESvPPz87Ozs+Pj4/j42OXzb5iD797ulyTJcr2+6XT+9X//3/+P/+bfdLtdcK5erxfH8dnZ2dOnTz/55JPi3/27tSdPXDbroihJktlyOZ3NYHAzzaRpPpvNXv7ud1cvXixHIzo8oiiyLcDCs7R3DQaDFy9edDodhO/X63Wj0ZA2jko4NjMsFAqNRkPS7cBYtObUarXlctnv91++fHl8fNxsNm3ZY/+uq2yz1+tdXFzc3t6ql5NZanUtdVCqP4adR/ivZHNU4oUyOdsOnS3LWQoePxc9OczQPo6qaRRVa7Xjk5NiqZSLY2yLODF5Lp75nirHaEpK8cltVY+AzKhw8wUZPTXjZzIZpJ/a7Xar1WJn1iYjLYKwm8EF6q5ey5Hn4+qZ++1vErdV6tDqzYJNoUSjXsD8t+Cg+vFt6/qu8z38RNUUAXZVgJf4mPxOWXdyKPIEnXmmIEES9BDlmUMwFCnW2LKy7FPGPyOOY6a6QjgJMggXtli25eSmjiSMB43JarVaLZfZ5XL9Nt/LdwquPBVaK60rwPqN4ZUROpMyhkXBAIiLxSJfUwaqottbip8333bxVUPgzKLD9pUKOdx951hPfCw8xPVwRefXPqM2dk833H60akVWP9oDiMUpsW/isVM9vNhWCGy4qzIqlAWrL6EFohDOC1Bta5otk1j5ArU3KSxxgbKEbmZXRSeVJL4LU/4bwYi1Cb8W+N5K/XhMau9Xwpv3dEKscBmbjMJggkAdbVZlONX6ONVj0zKId6mmmLTRbTbJJknWm9V6ncwW2fGkMB0V1/PCa2mCaKtRkHUue584/FYGcbRbeiIMED2AmJ9vXLJwy0m0HERu7NzyDUiazSfjcSZJolzWFfLRahlnMpCuos3Gt1rVAnemBSEUEd4vgRLaloYiSw9KVz9kehcUTN+X6YjMf939v+o18wN9+HAdAOLD9QPB9cKUhv262WweHx9nMpnb29tutysfdkxanjx50ul0SCcQ7+Pd8vk8tkuEhhTJ5dHU6/Wcc9VqlSBP7h/ws0BMisXiaDTqdrtkFFK151RAHQIm5nQ6BTI+PT2FS6goH/0pWFFuS5hCMDRJEth8ZEGIKcvxySa30qtVICKRPvW5izKcyWQYBHEPGQE1HqKNC6BDFgRY0Gq1qtUqyDhWCWBMfwtmVxj1qgOUyICgWa4v/EEi0bDInXN/9md/BsZ6d3fX7/cZWwUWhUKBmF48MpJ5yKc2PntrYfkhy8Q2HoJNCBMUvKIucvWnkxiDmrGCyIHR7qzVarlcrt/vX1xcDIfD29vb9XrdarX41rBreUO31fKWTCTZqY04hVYoN+bTrbudhCk8mUu31UURq+6B4qr2wkiEYpIXvrMKwIi73e7NzQ1scY0DShR8a1DRfr/PVOEFQGk0s7NeLNdSaK/tZZaahxeX2+DVavlZAUcl214bLHg9AiDj8bjT6agbII7j2WzW6XQ6nQ7kLGlluC29iyrCt99+iwhPu93+5JNPXrx48ctf/pJkFV55sVi8ubl59erVeDyGw2hluKmUePOZ0Z4GeBzRNwxftx2WKIqS7YDkk2Tm3My53GYzcy6Tz0elkiuVkkJhk88vMpnxer3MZDKVSrZazVar5aOj5pacy+RnlgKxARkzgPSE1mq19slJ/eio1GhEpdJy27udzWYzuVz0Liac7CF3g8Gvvvnmxe1tplI5rlSiKBoOh/FiUSqVjp48Of/ss2dffnny7Fmh0XidcqzX68lks9kU8vnyVthE3M/FYjFer/vz+SaOe73e3d3dZrNpt9ta4DQlLBYL5m232wWPzmaztVoNPWKR2QUQeJaqCC7VajWKBICzaCvV6/XlctnpdH7xi1/U6/Uvv/yyXq97QiKpIJ14bYvF4u7u7re//e3FxYXlq3LAeUqjAoj5RahSzFJmsipYFDakny6bTdujwHY9nU5lL2k1kd1uR7IQYXzIBZJYrlSyWzVPqkTyW7Mwh3ZFHjeNGp5aC3iTKF3WYlcPjjqHRRM8tZzUYyL1+6a6tIVuPKlB2p7EOIUq9QCsRxiuTddDa/hddRqvburui9droFSJt6JbFnYUXmM763kudtcVVJQxlxdpSBbJGiW5LTna/rp6RzxtUI+TK8zOVgL0K2IyvkYbwRkDjdpdgUWI6e8KP0LSnBisXnuWFbQlWKJqLp0c5rCnxWyL914fwMPDgFCnwmKXEliw25FlmXizItSaUITDV3PGPFZVDRVaPO8+VUE8kzpBgaleCxYdtoQSWz/w1qOc6Kxiu8rkKvDbznpvSVqtFfsa63agT/cI2g/cTu3NhzPt+yBS7HVUhPPBY3bbxxROJMtM91TU7LTxNBDcXmUkb5SitBX91vVC1T7Z8I4b59ZxvHbZxK23eK4FeaMdqO4ewHfXz6M0BoEwZXv7gMs557JbeeKIiZpsEjebx9NpXKlEm8TFkZPGb3hapQL6u/7pnegC7zy1PnBqrp1bOFdybupc0bmNcyvn8s7NnCs7t9g+LF4z2w5dtP3Xw3W4DgDx4fr+X2FfWDabbbVaP/rRj5rNZr/fv7q6mkwmwJeFQqHX6w2Hw0ajcXl5ScCNZATxkCT5IGEpO1XLarfb7ff74/F4tVrVajUoJIvFgoZleL6DweDu7o4sFACXbHaxWEBtE20N5hexHdk4+GC1WoW7JxhIQTx05n6/f3R0RH5OrCx1JMuNshJmygG4E9ISvPUgH3nkLMZTfb50xskWhni92WwKIFbamXkXrGTP0/y4c+MD0WEbTsmmA9cCmfVJfoEm7qurq+Vy+eMf//iLL76gefDm5ub6+hqE0W2pWySQi8WiXq8DSh4fHzcaDfiYIit9RClnm/DYBFWVDOaD23LGLV1FFFRuXm1uCKcUCgX0BzSF1MSN2rL4L55bnefTQjbrtpQoJqFtOU9tzbNS0XqI7zdou7zsbSYGnxq+HvmPIGlF5FIFVc5vld3UffzWqWjlPu37hyBLaBRuvext+iQMZbVajcdj55xA2+l0ioyMOJX2oXAn8/m83+9TMGu1Wq1Wq9vtCqkRIommNj0cVvPOSqK/NWhO9eILE2+yI3ZOYf1ktpvNhpnJtx6Px19//TVoS7lcZhNDHgcUdTAYUJZwW8VYkH0A9BD1cGkGg7uufr//4sWL58+fv3z5stfr0Qo6HA5pRPjkk09OT09Rz6eTQNMAMpfb6lCzWu0wAnNLpWE4HPZ6vXq9jo5EFEWz2ez29vbbb7/FqJB5K4Yp3FKhuqHmAL9CkZIdoFQqQSrPZrONRoMboP9AsgkPmeG8s5R8dHjxE1mhWrFdrUQZtSOpRKdCu91mO2X2yuQKIVe5UAo4o/4kzDrsXE6FwN6PU+xJKGglepimdZQK9RY8305re+vdXgjP2Y1xF9EpRId3rdbUFuYP5/HtYb3tH1L3YNPFBz6jXeJF4f7jEf127cbea1wgsu99ujdb9jy7EK+3dIHUSaLOFU9p560D9K7hVupD8SBdD2MVU5uw0zKL3X1urDWl9MQKUkUhdpnU7fknPQLdgDf52UB2fVmr8KsYRoMgyFgHqKe7bYMQ8Y4VS4Tiyx7k7THKQ20By6rW17QqKHZyWrtdTlhvP1eZxGpQ2CkdWm955pa7+g80Yqky09+F5cl+zHQXJ90WjUJrYs+kUdwLyyV3Rm5FzGs1KzCwxDb2fKRvRho1IZveQ6VDbnL4TcNlq3d4HXWvk9VqvVyskmiVJMsos3J5QxwWohkbcYkokLj1GMSR+S3+l93BILa3lqT9IXKuuP3D1Lm5cxsXRc5l3XiSubjKv3hViDKbSjEpFTdxHDmXWS4jHmkYAtm5p7Df9jntOlLfKpwSLodwO3r9mKIo+pB+psi5nHOJe/2Y4q0qcX6LtEXmr/n7z8gdVCYO1wEgPlw/hCvkI2QyGdSHM5nM5eXl9fU1JCnOVzQBlAOLJCJtUM5IACBr6AEGCj57c3MDDlipVHgNOBpxEvm57fxS5D2fz/kIoKV6vQ7+BbmJPLbdbp+cnAwGAyIM6Qw45yqVSqfTAaFuNpsgAmK4CISyLskEJWq6l5+V7Wq3LXXcCYecRFTBAWGEgWnW6/Wzs7PT01Oidtuy+iGo5fdhOqXeG1MLWmh+211OH/1oNILyBsoA3HZxcdHtdp89e/bFF1/QVg/SBIeLxme5dhANAD/x3CEmKwT5QBJxKLMg5UqQLzjCt7e3V1dXzrnz83PInqvVCuzbOaegEwgG8gi9h9QGarXaycnJarXq9/vz+fzq6grOGl+QCNj6q3jJoc1dmaXQ/fr9PrY86qCkpf34+Pj4+Fg3YGFQRdV2bn945iABYtoCxuPxN998MxqNGo3G+fk5O4xUyNlGEBWJogjCtYy8ccB7eA9+aOciZ0s7P52REZdBtkUW2BzEjeWVLGrkX922keLx48dffPEF8xBXz8FgoN58nh07JDve5eVlp9MRgVGWYoyJcw60DiELr+rmqSXuX5J7OGt8O6ao9kMtMUo4TMI4jrvdLu/Aomu1Wqenp+i0JknSarUk3icFbeo0qpF4W+gDUZLlcnl9ff3rX//65cuX/X4fXdHBYACDtd1uHx0doZXRbDZt4i1w1mI6KuOBL49GI4zpeAEwMfgpfP/lcskHacWpfKhFbe0EwwIGGRGL1CJWcRxzLgCvdzodtIb2Z0HufgO4bdjUOL8WWd5abKnaKptQqracVnyR+Xwu+0QrqUTxYz6fC7y2sL7tfE/N4t7KeH14dhZade2CbCz24XWCO0PjtWoPngKD1wlu60wP5PCmoiEefBMafIUe7l4h0OpU7Aed9yCh4Q3vki1+13jDTkjOfcgEhE+S1BeD2PrO2ZmcOkp6Ch4QvItR67FZ98CaFmjTp1jdsFS5D2e0dOPNxj2kCexdztPU9v/938vSdQW0WU8nj32Ziu3uAdP3zJBd6LCtqVvVCLum9qDDHuJvAWLPWNJuTXbPD89KZqOnJ2s/OpSYsApyqVPIBgyCJsON0YYW4Rq0A5Xag+8RvVOnRGroGxZsvPX1ETHicP8P7SJSq4ZSH6ZRTMI+cvCjFE37C6e25PKlIiWxcqu6ppaRYrFI6C7+hHockQgj0bDDRVnC8tB5Qz1iryS2SxVawWcmk4kit443yWa5Wm2SeDRbTdfxIiluXC5xLrrHGg5lJeIAIM7ex4idYR9ng5+nnKxbBNOu4JVzOefyzuWcKzg3d27tnHPzbPTiuhD/z7XxIjObZ3785bhei/KFKIoy8wW9am9EqKxNqwcQK3ayMiy7dqG39rWEUP69clcmE2ezcSbznioTOefK75SZB+O8S+XjcB2uA0B8uL7nF5lqqVRSy3Aul5ORxXg87na7oCciLtncKXTX5fRVwRay5HA4hBFZq9UUbEkamNMa4NhtqV6czaS1k8nE+nTJwQm22qNHj4BRBMooOBDMMZ1OPW+xMISS2pdOGqKQkK/ktqZJQJwAEwBJfOVSqdRqtRDTQHr46OhImpUf+Mh0Cn7c+v9HeStE7iaTCahEoVAACmTC8NdKpSLhDokhFIvFdruN5qn43YvFQp5R9ssyqjDKJQ0JivGuAlVvHRNFNgA61Wo1k8mMRqObm5tOpyMDDRqZ3Zb4CTYKW5bYVAJzKrE0m014EIvF4vLyslwu0+RO3zQ0Q8llStfCZoNabnJs7/V64Flu2z/LsMNbxFDO9ttaM5xdSch7zwRYw5Ks7Xa7iMZ+/vnnp6engs65GcZhMBgwvML7LEf7revCy3+8ZWJJQ9bhGn1D0g9rGgNHaTwei2YLgEuWslgsAEFardb5+Xm73eY+x+Pxr3/962+++WY4HNLLb6tryE9LWkQVL3a/1WqFYTfp0HQ6ZflIoiSV9OQNgpd9hRixpc9IEkflBBG+hsPhzc0NvnmVSoW9ERSVwtt0OgUmxolOJRybJHvsdY/099ZnOplM6GKB9UPfdKvV2mw2pVLpk08++eyzz370ox+dnp6mavV4H0HZ5ubm5sWLF5eXlyIfUbPBBpCJOhgMxF73sE6kIW5ubjabjbx0dn2XXC53cnKCMgm6MRYu53CcTCbI6dBb8FaMOMzzKbOx8GU6B7rd7XY1CVlo6F2wqerUAywGWZ5MJhjGIv8tVXTb3yCSvgvoYLuqhu+NDmcymdekMgNh23pGuGNb/FHN6RagDzEybQUyV5Qmj3UXSKXKpjbQeMKgXlXPlqVdICfqiTNqH9sD+qQypyys5j0gy3m0Igybh6glpNVT9VZuy9lH3UhmxXKasrZdcuWSF2tYAvGmvQeae85I4faYavHnKcxasmooHm25rlbjAqgvm81mou+d0qQ3nR6yAB8CCu/SUQkLJ/s/8T0CjNRe9TCd8dS0LfXYpTETXZrGizVC3DUOtmjhEUs9lH+/h2QqR35XeOO+T+Zy74oXhxNAHAW4C9VqFWExDnqWm4r3RESUdcfjsdYvUS7BmHhLFs+VuDk53WQyofApUW/KpXKp0R1qe7EKZtZx3VYQbaHdu/jha6Zz5GK3Wi0Xmfk6yY5m0XQVrVw+STn5QiQ3vg8Wx1ud4hAgtj+Pd79nqC8BQDx3LmcA4o1LnJtvMhf9wvCr7HiVLRRcs5EUi3GpuKpU1vkCm6pbrzer1Roqtu3QtTI4KhYq1Ew1Pg2F4PfXqMJa1+uQO46jHY6yD0LRSs6tt2ob0V60d719QbJVdo4P9OHDdQCID9cP5JwOd0nIHc45ek45I2k+pTd2Op12Op1GoyHeE6/nlWqjVmWV/5KUqpd8uVze3t6Ox+MkSdBalTsWB7AUD922U14tfvP5PI5j8BfKjyKfIvB6fn6O4Xi32yWGANMhWy6VSvDFUEwOxUnV4i1RY96Zt4rjGIzGbblLFkoTska2z3dHP/Tk5KRWqxH0VCoVcc0+/Gkqt/leiRdzV6PR6Pr6+ubmhqE7Pj6m11sk30KhgBeiRhgcuV6vgw4/evQon88PBgP442rrtjkzowodgDAOeq+iwNA36f0QCgsfWEO8yWRCW302mx0Oh9zt559/ThGCVYPhmFhp1m+Hu0J1BBLxxcXF1dXVarVqNps4VoEyj0Yj8GLFoOpAFF7T6/Wurq4ImombxYV3Wyb+cDhk1UDTEGHQ4heefsWHlzHwlwf3pC+BJ6WVK+KYmjrBSdmI3nsSaoGnel57FiK5XA7fy/l8ToFK0AmIIW0BgInWmrJSqZycnDBvj46OqBzEcVyv14fD4XA4tKQty5LDNZsNCoBY6pAwcHH7JI1BW0Oakqlg0C7IJhUYEuRh1QlEqBH7jDlzcXHR6/VqtRoILOOGkDSI583NzdnZGWZ3Vm4ypLlZxt87NdRXq9UnT55UKpXZbMbDIg8El4eBbunJqeU0phZy2M+fP//qq69oYuCLk6Bms1nmqjqvnTGGYnDA93/1q1+tVitc+J49e8aj96Q23ZZdfnZ2Vq/XUTGezWbWHFJtKK9evWo0Gs45/Et3wcTeQxfXlRmFWas0iOlyuL6+poqGKgibGFwqrXow316vx4mPAAW73HA4FA6rjYiyq2VXWZTNk0ZNVZ94px0GndpcPp8JCgyEH/aDdCZKElRwtvX1snVW3Sp1x3q9Xq/XGSX7IDwNYg+E0ucK5bHuWG5r6W7Hx8KOHrrkYcECl3fhcR5g6u7b+1hpXSvNqbMpn8/bnvpUZuUeuQzVPAiB3NaaDHRY0uTSwZdtF4UlmlosgqzbU2UiVTJiV2UixONC6C1UaXBpjF0P8ZEXrn3zzEet04cc4VTc375Gy5DLw1xCUHUPbLdnF009d0JfOKsIrBvbw7JMZbDuYmJ60M8uHQx7A2ErmFXW8ia8u6/3kura4lEHbD0jFCi3EhNSTgglJsLjI7Q4C7WDQ6w83HLDutGHYPQfkWti90xV5siVpPxuC2mLxYKQg3ibmr3K+eDLsEks0UeIJKeVNO6sHJw68GwLjkWHFQzo8cl7QGef175gd35bC1yvN84lkVuu3TzKrDe56SI3X+VXSSZ5jTwmezFiz60OI7vclkRsgWOJCMf3BSi8N4zTmMWrLX0471zBucVruHM1jwbjzLiX2cRRq74+aifZfPz4dFGtrCrZxDm3Xrn5Ilkuk+Uygd4dTj/bh2cF8VMnpz3F9nS6JMGlJZnNZOJMJspm35NBPHdu4dzCufIWNM+mGdPx4BAjzju33trTZZ2bHjDiw3UAiA/XDwos1n85XKWQAKTF3gpRTgRGtzVxVlMtbbNKBpxzHM/r9fru7g4FYS7cb0C7APjQNBT3FjOc8XhMPkBbuiytTk5ORPJSt5Hb9ouhmNxqtcj2b29vX716dXNzg9pDpVLp9XrdbpfeJXF5aOS3Rl5QjcSkhiRof0ugtgtIcBI+hvBYr9cfPXp0dHTEbX+4xt/7BWG/twvYaDweX15efv3119iRoRcM81HspGw2i0ET9QCA1GKxCMO6Xq8fHR3FcTwajcDZgaUkh8LHoXAKCOKZniMzYvPkDxwriyQCrDjnYJtKSUMiGMwB+e+BK8lD2bZTqSxRqVT4Fv1+n2CUzBn++2QyIeUWGqIeWJYhICykP6omLGG3tdMRV3S5vZSTWJqtTUhUm/nAOSYJb+dcvV7/0Y9+BKt6Pp/3ej0QMd2kFtd7fGh0n1pocZ9QmtPrWQZ+tVKJFgNSGsk1n8/RN6DQJbdJ+N3CcZgqpVKJeWLxGpaAvqYkC5ha5XK52+1KCkOQljZSr1M4tbfXk0dMHU9VAmyqaQEjqVprJnPnmsP0hXAnIJISXrepu1er8OC5t8og1mq1P/zDP/z000+ZOYyqWqdt3WjPJKRKgQ3m7e2tkFDEo0UbV080JCbnHGcWZQPOO3i1P//5z7/++ut2u/3555//9Kc/ffz4MXtXuVwOb0ZUVs4apC3IThne0WjU6/VQ2jk/P//jP/7jk5OTXZw1W45Fzh53RGk1SluGWh0Ib6vVOj4+Pjo6wuGNE9+6MPX7/Zubm8FgAOMYaqdsXT0tTqompVKJFaEtxRNG37WXvuvazmWzuXw+m81m7gcwsra3m5g+V6ZnWkRyTLUFEou/0LEhe0zO7lBF1zoHCCDWnbAQoGxbnrULKPzCbd19/fdUsY5dZ1mSdu0JFUQk16GJ/abaqC2cZ/vQXaAP492AXcs8Gk4xNXpbH1Qp8tNVQ+HfK6Ba47tQUdozm7IYmSdUHSJiHrE6datM1bS1IPvrGm0cb95lWr91s/J83lKFU+x0UqlJnAlvMoQUV7ebhKvCszd0YTWFcbZqDJo/FkkXQKwzOqRWeCeX9+3C++RzmcahRrP9oTWM9Ra+504WurN4TzWVHGqLUpbzaGnmKofIg86bk1Y8ehcK5q3B1Oe4S34kVZRmlxTbx0oH9r+t5eHSCSpxCQIh+42knzYYDJCZGo1GAMTyBiQjYNO2amlaqrQ2YoOs1i67gjTThNRLY5D1ZfWRvY3CLlspqIR4scEU15tk5dbJxi1WmeUm2rj8FuG1ag+pALGHAmcNWdj+U3aLZmbSAGJBw3GauvHKucKWQZx/AxAnBedctJ65/iT7m2/LlVqyieMkmv5hdVatrOPYLRYujqM4juI4YUg0BvbR6+AOax5hJcwFTPxd5edQa+WNzc97M4iLW6x8vR3bqXN555bOJc5lt6zhyLmVc6WtanPOudL2Hcof7pF3uA7XASA+XL8XIM9rtZP3ju3fp3mflliou9aoV1GR9XNQLMLxrLIt9DSdnf1+n+5g0gNCPUAuIjlyV+A2GJT03YMyUwGmuZszgC5a9a1wKqAJCxRFObrf70OFs2xWazswmUzgTGGFJOECpAxEZiEqtbZOCimkqVoqldrtdqvVou36u4D4BeJ/9OnxTnCq2N/wzhBeAOzgaVJ1KJfLQCceTgRtbbFYHB8fQx9GbXYymXQ6nclkIhwfSjtQBf3RsJPG4zGkXVHAQPktg9h9DMlmq+unnlZMGmu1GkUFq32mvMgCT6KRqnEYAQoZLSKwIAk2KNKi8yu/AmxCHFbGGnaBe+YwCGHD/bc+Hh7ZIczZPspclTEFvNROpzObzdQACELBWgN1BWhTa8J7fJwVFRV2YzuRrZQzGL0eLlmH2Nlefyj4KcAH0xVQg+FlPWquyo5Guy7gneT2yOeVnJBG2h5ttN2pkYCwAHKlpny7pnoq4c4+bg/iUaN3oVBoNBqgkK1WS+w/rTWwMFo+a7WaCDVW1Zr/atp7OqpvzVE5dKB2emTkUDbEswziBSgtQHlGp6JYLDabTdSTwJ3dtiFGcgoqCnIwgTNypshAdT6fU8SazWbn5+eMWCgx6ba99sfHx/JHRSg8iiJurN/v393doQ787NkzimR7oCU9AvaK6XSqEqnbCl5zq6vVioLl6elpu91WfitDV4arUqmQdetu2ZG8SoknQeCd/u4+MfOtccgDtxrtoW6HJZTnuCWMEthRyjwcSbD1wR0stVZcM6kGiUem8qTQHFvz8GRVANA5tlLNc0KBC0911PN1dPdlEFI1Ri0SYQV5XeBjZlPuVIBYXzl0Md2l3KqygQ5o6XVYTQlJvdu9VMRh1aW8E9OKitqvb72qPE0AD/xKNbjbL96qA9rtMCh7I18Qx+X7FNT959Oe+MoGpV5FU5thWImxhhnMf4YFCEwd+iwTF3QhpA6ChyazuFbby05+Xom3B5sn0K2eiK0ZeEFmOMNTi2FuB3nQo8Onli4khGp/IoBYI5Za0wqrBbsiZEv89wSFnbFfU2e9B42FTox76goej95rw9eG5gHELk0V9yGd+++XQeyphYgwIXkxYhv1bZDEqb2GIiW9LGC7wLuo/2mmgRGXy2UPf1eTFhkKVCG4FGGC4E17lRNsZ5WE3WwJ326S3voN1LQi55xLIpe4xCWbZL1xmySTvMZz3dsYxPavQodz9yUm4q2LWn77mkyAL0eGWRzf169ItgRY3mG+BUMT51bOFV0ydbNp/KKbX/4yHq1y6yQuF9xmucxmk+UqWm+iKHK5XLplnM1eU2nvtvi0R7Nlz1bm7quxZ9AgjuP3nOIL51bOLZ0rbLHy7FY4AhR+5VziXGH7CGbb4V2QgTg3PzCID9cBID5cPxBc2PuJhZOKxeJms6lUKplMBuAVA6JisXh7ewt0VSqVYAyRDIh3TKQushXolfBfJWyLxaLT6diOKsVqBApEnyQM3Co5MGFov98XMdnyXMARBGSTfujdqtVqv9+/urrabDZ0hctyhzehV1oSV3CcuQep6dPEBBUarpwENJA7yOfz4MLF7fUdSUC8a0j31qDNRs/uPptp/4W+weXlJbV9NCtBinniUmu14B3h3Xw+7/f719fX4DWtVqtWq0Fb6/V6Nzc34/E4iqJOpzMcDsfjMTcGvkYciRhoq9UCBgLHAYX07N3eY3i9fBKtEmaF5GKRHzk5OeH2JHDBC8RMtOLdRJk2midgmk6nz58/ly6KuGykGRJLhZetNMMSV52R3CWcBenQW4Fmyv1DT9DehsCgD5e31pKkpIR0LAvn6urKdv8xquQM7XYbqIsV+n61EzsaegQWQLEapsib8MiYfm5rZealfIxku90msUENAHy/2WyWSiUeEPqtUthUOQpsdzab8Wj4UAtaqQ7ByPArUDWB+CuVioTR31vA0SIR5DnSMyHD56nxOGq1mhaml0+KJ8Xv0mvi8ZhSheQ8gOAhX4SXUfCTyjw3IGo8sIgmVaPRwOhvuVxKcBCRX/YN4YZ0jdhGAamC8Fb8nGcEM7RSqSArT2uLc478kyUmEpO3HKgXFovFRqNB8XU8HvNDJo/tltg1Dra8kc/nW63WkydPYF2xjcisVTtkHMfNZpPiqCVjCgBlDKlY4GKnlltYtDIaDemNHgvvXefku0qjim0HmCjCqdBYK5WgJygSNE+cTU8AsWoYltxkYUGbjlofMFs+tGo56oLSFwzhWnvgWl/QVMnFEOvcdXwLEbNiQSEk55VSEOKwWhyh3rHn92VzeC+KU6WWmcPebnsLJA8iXFjYmeAznZhWmMK2ubAH8n3DumYqdmOHLsRhQ+ws9W19LaY4Xj+w1BFF0V4Bh/3RiNqwrIi2Rl5wNgMCiMbMpPVeZQAxHK3nrU0EPGBXT5Ztlqki6FMAMQJWQHvWKtOOqsbTU//YRda2xdpU/RDbQ7ArQLU8fYu/awewi8WliVqElbldr/Fq81aIXxzhVO7kHtWU1DUbbgipBoYhAz0smfw+OxGtXjk1SNY7OZRUfdScCvsE5oRSDJtvyqXGsx3WEEnCCw4HqYQlKNiynI4PK0nk9YhIb8oZu9TUbkVebMvk25clySbjXJy4aBNFURy5OHoD44YM4ugBAHF2q40bbZUNBBBntv9qf13axFaAQh+xMt53OedWW57sxrmSc1O3GbjxIP62m1s/d6XCppxxN8eLbCZJ4qhe3zQb62p1ncsk602y2URJEoVdGrvmnqfaZMvt1j/AysSFM9xKRWcyGRbMe0pMaEzWzuW3cHBsuMM555ZbZH9lXuYCUP5wHa4DQHy4vreXJ75ps01gAoJIixfUajUSIdATEmACoFKpBHV0NBoJWMRyRzk8EDBSD3JBAShxpolMOz4hJnAS1BKEZYkV4HBZlo0IRLbeWywWuW3BKNVqtVqtvnjxAnMhMGIyefDEy8vLr776ajqd1uv1n/zkJ48fP6YHOYqiRqMBJFev10ulEsgmmTMnUKPRQKAT+UKw7O/6OT78xYw28ZbC09So2kpt7pJLVoTNk51Op1dXV7/97W8VeKETMhqNKOkDPZCyikKIVO5gMECWGts64FfgGKYTWPOrV6+63S5irIRuqNnGcdzr9TqdDn8mCuRBwzH3eIUfMsKMmNrbgcNms5lwQ5HrIfKAZAmusjRzmzyAVvAmrVbr4uIC7exerwdqKTlR5bq6JHahRN1tSVWisxGC45FYr9e5T75C2E1pdR4/yixlTEqlkp5+Pp9Hetgmh3oZTNV2u83Cfz/qvfYc24MspxqhBiKY68mqniTbQOEdSsl4HEjEZrNZaYvDIi8UCtBRQRJhdyJJocdHqwTvw4ShJECSY3mdgJuqfDBEbLkuUMzYD72FoTlfn+2UEpfosQAKavP0rNWtGT3vw38la2DTV9F4bbOtxQgemJ0yP5HC7/f7Ss+caefnv8PhkPaCcrl8dnZ2cnIC5MrEo/SSy+Vmsxnvw7bDVgOcB+wosxqyeq0yEdvz+fyTJ0+ePHnSbrfb7TZvMpvNut0uesShrSLvxtg2m03Qltls9umnn6JoxJQrl8utVmvPGrSNL/l8HpPAs7Ozdrv9/Pnz29tbuFFJkjx69CiTyXQ6nfV63Ww26cIhFYdpRb2WzBlxJ/p80SAmtRbNU0RdKeoIZJFOxfvhBQ9Z1My97JZ5Sqe2OnsE+Qle9wQoteSl/2MJs6KhWejNqql6pWiL9djcVTR5YWR6FtbFyP7VDoJVr1InlgsoV6k8R6/6ZaENK3idCj+Jjo06vAtkaqyQawgQh0ifZUAz/vzXis9YzWIPIBakortSL5qwGw17KMiraamqqj0IvFPPw9G8onLqmFsadRRFmyjKfrCGlX0i8f1rl55y+EWkfAIcxnfnnMJclzBecdQuAN2ztpMSDsr4/EHnFH/mNZSUiOFVvbYiIR4VOhQAseIAoaiFB8LaP+zfOsK4TnPJVlPcboneVCZjKrBlAWJp8YXPNPWWUstsdhrskttOVay2qPoDBUbefHSSfHeZi6JTJIPVsoP2EcU86YHIVIZWG4w9rNM4s308HkviT1NODQ28hkvKb/Z+RCCwfHOv/sf9hJaYbocStJ6FJe8zU1zikii7SdwmzkRx9EYO2N23jPOg4ciYnkUG/PUg4NhoEwvnzdynD+vXLUAcG4A4NmZ3S+c0JPnXwFKycbNpdD3K/vx3xWQYtcuFTOwK5c0f/MHiD76Yl0rrQn69SZLNxm21Ju6dOJZYHQ6au0+Nt/R89bWEZRX7/rZky+vec4POOxdvnfqAy+dbcYmVcyvnMts/rI3u89S58tbULnfAiA/XASA+XN9vaNiLRSyTQvCENmKS7Vwu12g07u7uSAhpNy6VStPplOgHJBfuiVqqOWW1v9uYHr94xAGUWFqyBgkVO7uymvl8jrud508iprBoDnTVYTZVKBSIgHESazabt7e3t7e3wI7oPzQajXw+PxqNnj9/fnl5uV6vnz59+g//4T/88ssv7+7uXr16NZ1OhSOT24PNIRRL6RuAmOr3xxWUSPVgeXgqwiBTgcd0SCIDsvoNf8XmrntIGUSl0+mUti/5AsMoR69D2ZrteAXKQVNsPB6DhQk2EpO91WrRds3NK9lbr9cgZcvlcjAYLJdLEE9egFYDKMauJPDhS8ZrclRF2jmnJcP8lLkZH627DXvWPJcGvhGzq1qt6neR3ob7wy+SgAnbxblRPGLr/67VQaUE4BXJZkvS9zA7i0d8rD2H7wXdY7Vajcdjmgzkk6ZMnnILkCtA9ntn2l6Ptme7ZyNUT2yB5yJKmgvkKXmNNNnVjS7rQrFZISZHUVSv11GIpqLA3sjlIft2TCi/5XI56UozPmKOO2OxvWsoLKsojMiV+euH2pAF0+hWF4uF4EUBhRal1dKw5B3vPr0O+odf4PWDweDu7q7X61l2j2dVzwRjqBH8AUxsNBoY0OEMyRmRzWZPT0/ZDIXja55INFzPqFwuo4SD2Hq9Xm+1Wu12++TkBK4uP6c2YM36BE1aNjq8Y+fc+fm5inOUPyGMP6TWy03CuAeYLhaLkK04AY+Pj9FYgH4O/nt2doYNJq599Pq4++q6zGGVFSUWqSKHqNwqBr8T5vtOr3zTD7Qt0ugg01oWompr3gKwqMZZU1xZEdryj61/8CYeQqeKIKilBxDb5fwa0c5mVZeyyhK6Zy9Dtva89nO9tv0QYPIA4lB3KEQDPQRKALG17QqVnRXU3QPuTXOMu2+6JRI3x/R+gFgSE3p20l5X+ZMh8jiwCjI1RVWj9WR5UyOrXV5wIafb4hSvCfhxXN1scvO5Wyw+BB32LBDDiedBhOFuz3hyXiCUzy6HBNZ0OqUQyACqci+ZBQ/n0mpSFA1HWNbTekYqiugE0bmgmlxowBAGG96fLX0kFAF3Wzm7PfGqBW0tMO1tFJ5Ijve7ls8YCv7uAYhtxcjDwvYUeFzAiLRE6VSedTiZU7HL8Fx297Vrfg9JqK3KExzKoQSSO0enVQFSpWexvbR1KzYYj8dChGXVYE3/iGFUvE/F0G1uwpurkG8nubeR6iBO1Qd3KXrW27njMnESreNMFMVRFPkqwCFAHJrUxUaJODYQcGzA38x9lYk3m74BjkOAWHZ5yX3MOtki1EgSZ91sFr+4zA+/iYvrJIpcvb3eRK7dWp6ebCK3RovRVPTe8N/fKmYY1sM8E1dblrZhrZbMvTXrnHvvST51rviaOv1aXHi9FZ2YOpd1buNc8f5Tg90xcy53MKk7XAeA+HB9v69UQXf9gUOXkxg5QsBWmiURVQDsODk5yWQy6MYi/9poNMjJpcfabDaVwtEXfHl5+c033+Clg24Uh64nmMWhrqOXzX2xWFxfXw8GA/q1acjVSbxcLrEmQIWK5B8IGDBFmVI+n3/8+HG1WuW0BrIBhqM7mLs6Pj52zl1fX/f7fe52tVoByhBN0i8vTnSxWGy329Vq9V05j6GVc6j0l9LPuI17bDa7C1UhSYAYaBU8ILJVq1WrSOtMe/V+BMdGVzxNWTOpjVRscXrq4f9SUZChue0eFUtltVqhh4BoJkZt3377LSCsR3Ufj8fQENAtocUbvgCB4HvAFiHa6ExPnIJF4Ffus1wuI1SqIgcQFRITqVxdEEBrZw9wUyqVRqMRsDt8HP5VgIiEXNCaoGiB9ov1rIcM2Gq14LZb9WFld/qCHrIcZi/vnQ+USqXj4+N8Pg9opa5AlhX0VfBWMFDLDnuP/U1fSiCClwBIvUFpIYw5UbydUfGDAO7RZhlqwN9qtXp8fFyr1egtGA6HTGC39epEUrnZbM5ms06nc319zUYqNQCmDegV6D9rJEkSRAxevXo1HA5ZESDRQJ8CdvdM7LBn1t0nZ5HqKwsCEFSiJX0YPlHN+PBPhXxRxgBzBNS2WIZQNguy2LbNh0yz6XR6c3Nze3tLQUhAPGrCFqpoNBoohERRxK6OEKpWGUDz9fV1p9M5PT199OhRLpfr9XpHR0evXr26vr6ma0TcJXA91j6WdEdHR7PZ7Pnz5/1+/+uvv57NZjx9jRjLn6IXp2S/3wcogbdrtSnd/f59vs6ucyRUkrXZVKVSefLkSa1WG4/HvV4PphXiyxTVpDKBPSydCnQtIFpi0ViVAQTO6hC0mz8twFbP8UO23F1XJpMBRMxunUKtm5kWpoftWiSC4VXhxxMsDvNPK2ythNbi+2JVe7/LVOdYVBFdtErhC8pvwwPC+7n9CuqNCDWj9LvihwrqtT/fVVKyNqqW7+YhYmHGbsmSuXy+kM9rlKyTpKaQpq5lB4tibB+r2N+8v1UGEDa0vn9ZlGe+vSxA7HbzNAWIK2ywKIPHidbXyWQySSbTWK3yg4GbTN5+TjnnjG/qrhZpS38LcclU6VhKkrRKyPCWKAh2xWw2o8ooXSCVMy1C6sHi6qlnGaK6bp0GZYQg00t9Ix6xxt/tMFhzAWNd6y7ViNX+Stgith96trVS2xbjjb+3OafqMu+RBJEcgVWLTnXAC0/wVEdEW250Wx5rSBxJNbcMbz6MB1J+8TtOSK1SEBNSCyoMVFbmsrU9CYWLKlQsFiGIqHBl7Ys9NWpLDrC1JaIyt/VPliu7Pl3vkzq2nhJOSi3BucTFSRRtXBRF7yIYGAUs4F3Y8Z5/Tf31+L5bXWJwZ/6QbP/HXwuvYeL11A268fAqFy2cS1zjaP3JZ/PBKFqtNkmy2mzWq9U9gNirl7g0z9U9Kih29dnN0P7uruv9J2t+Cw27rUldaSs3XHAu61yyRYrXzm2cy2z/C//6YFJ3uA4A8eH6QcDEYSiAAiNm5cII4PnKmA6FRPBWjN2JBTmSz8/POZjRWDg9PSVU5WRdr9evXr2q1WqvXr0ajUbdbhfyo7h4BKnOMP5EaiCQ7fV65FdYwNFvSBzfarUI2eU3hd1ct9uFTCquxGazQX+gWCwmSfLtt9/KrIDottVqEay8ePHCAiLKDcBT0OVMkoQ7qVQqNMU/hBa3p1bv+aqpTC1IxbIOiRd3yRwT6EynU2BuD0tSU/9kMgF1AtZxxhd+P2RjEQqAiZOTE2iS4Fyj0QjQFhii3+/ncjmJdSLeOp/PeUB3d3dS7IV6DIzCXIrjeDgcQoJjDtAiXa/XMcQDhez3+zc3N6PRiIcrhbKPRegGUhf+JSUTmLk8AiyYLSYuap4NdhXxgyESHBOPLhYL+rthSs5ms16vh54gbHfUlhn5yWQCyowSruhsEgRsNBrNZhNlCZuri4piCw9etvBRlOlYsOfn5/V6vdPpONPfanMnnhQkYuRu3VY65v3IKVrvWiweu0frWkYotrtc4A6ZM9Ce/KwBf5kSzWbz/Py81Woho0FODqTI/sm9QQyniHJxccF6BOWfTCZsvACL2WwWXqrkJijUoZDLzjObzVAGePiAeCmKoBDehCnN1MVrrlqtIjqMmDjbuJwSq9tLEEapVEJ4PWyEFwuMnEqtIYlBSfa3CXNXl5eX19fXKH2DbzJccISVezCRxGwdDodqUGB3urm5ubq6YjZ++eWXz549y2Qyx8fHR0dHtVpts9lcXV0xRakgchIh1cICpII4nU5//vOfX15e9no9SiBy0uMYomg6HA6vr6+vrq7kFAe2blEnrcRcLsewp46GnFFTTfBAD4GAxfBV7wj1UT53vV53Op1Op0MZlVqvVV1ASYMuoul0Kh8z+fOwIoSAg8Glzr2PiSZsl6gtYHgsv1TcTcPl6SR4nfUh4uapuNjXWMkgL3f1cGpb6KXg9FYjrJDzGGJh4X3ab+T51Fmy7Z7nkooihShkqujq6+++fS4hU8wFlmJW2D1z/5IktG1K8L5myCD2lJ29fwoVJMKh8HRFUueznrJUsF0mUzA6J/vjP95i/+qwMpqhgLvHBrWDqf0nm80i+0b7EYcXXAEqymyhQtgtgGsbHUIZYmHxOlaI8EHwLYs/ZAqHT9/ugc6wAkUN9jxU7a/vwph2lQE8F7Kwr8sCl1ZzILz/t4bH+yMoD84Oe7m8SMz+1dtVQlBbAJwHloWtbF4EaBPD3wOc5c3kVPmUkK6xS28k1d0x9dcfyAtJ7d10aa5rXrUgVYY4DXyPXBS5xEXfkUathxSnAs2Rewtt2b4yCX4SvyYaJ2uXrCJUd1eraLWOko2LXu9zSZLcUyv5kMBgl67L/jn2EQZztRWOWG8h8plhXi+3I7N0Lr/9Q2zgt8WBQXy4DgDx4fqBXJ5fEBSD0WgEtwgRhqdPnz5+/BhgAiSUVPPly5ciHURRNB6PV6sV/FlYdbPZDC840l1ctnK53CeffHJ2drZYLH75y1/+9re/RboBqEWCfaJuEdHyQZJ9JF8VP3Q0GgGQ8YlALWhB0lsHU1VQCIzOxWJRrVbb7fbR0VEul6MVF5QEo7lsNtvtdsn2RWwB75byEQjmycmJjOzeoyPeI01YTNyGxSJ4SvlRxfNKpXJ8fFytVr34GFAJSwdgHSmBioMDG5cRg1/mttwx6wOwa/4oDctkMvV6HT4v7zmbze7u7khRgA+Gw6FzDhUObqPdbvOYQFeHw+FgMMDUuN/vA3zrHrxOXnyZms3meDwGIK7X60hmA95J88QLJd8pNPEYqaRe8AQZXinJQtPr9XqffPIJ5QoQPUh5ot1Zv2wLOpMDUyBZLBbSEACyWa1WvV6v1+tls9l2uz2ZTAT4wl/jg+bzObR9JiRoUb1eZ325NDqMzYpDBlPYyPx+8Vw+n282m6hGoNDKN5XlI6UdHhbVo3a7LSz7PcJHDySSV5X2Ftsc/Tr82xpSa4LZjmy39R6k+CHyYLFYPDk5OT09rdfrTGZPqsKucfB6NTfATpW1Gu8MRA5SyU/u7u76/b4WPuWo8Xicz+dlqrZ/eqdy5ay+hPRSoNz2ej30CpbL5dXV1dXVlVo32GBRqmEhaPdje7TJ7b1sM4rYvd22w0BbnHUR3LMSUbpHKpeDgz1BFRGeLB0h8LhZrajQzOdzSpur1erq6uqbb77ZbDbPnj1jA6cpBKI3oCfPhV2LGg+9AohUzOdzmOP1er3b7V5dXT1//hy9aXzY2YKWy2W/3+/1evwX+h7gvrRBRZZkKCApq8IaDgUTUqLnqdVHOjOkuazVvVwu7+7ubm9ve73et99+2+l04EerWqDZ6JwjEkBNXmpRjDZbOns4PmxWzzH5bpQrXRpxNcQu9+wJgZW8czucwXa9T9iDv4vclPqCXWym0Jwq1RXt9xAWhgzEPQn2ni9r/8Xd7+t922+lj1j4rHeNVfiv72RCEMpQ2CvVJC2OYzDFt0MR3NU7Rulh8cz7dHsKEA+zIdNgxFaD5Pp4PFaJPRVG90A679OFEXPp57I9sLtxSNGNTfHAGRESuwE6IwEhBvGuCZPK/3WGoui132kLtfeZ6hdnHTi8CvpbNwr7c0UaHttxF23cGVq0d7KLW2C9KLwdyVZn3W59Cfu2tknxTVb4NgT84+3l0R741T4++32lq2anGUpfyhTkJUtsKVUKb9CsrpodMbVQ2GqfC4RuXZpVya75sP1dfjGJnHOxi10Sx0kUJUbi970gYBcwi3fBvrveJ97NQY4D7WMrSZHdqhKvnHMuzrl8weXzUS4XZTNxJpPEcWLlW946rz4KMeWtgcE7Euucy70BxF3WudlWxNk5t96yqtdblrEs/vjdtTtch+sAEB+uH8DlhVkcmXCdJLZL6y7+NovFgqATgicAARgcjkyELHC1nKG7ViqV8/PzdrsNGAT2wfvc3d2hKms7msOSuEQD4VVJ0lSgEmjafD6/u7ujl1b4JggOHjuEF/P5vN/vw2ZdrVaNRgO2hdx+gAAkf6H+Rxr5weO4W3q9dVdvBRl3ddOk+sLbAIXvwpeCCAa2K4KYbNPu1TtXKwkyEOKIQ+q2NBkhL4RBIlGC7IdOGuGlpIKhBoNYr9c0LI9GIzjFoIRMsMlkAtZWqVSYVwzgeDweDofValU+EkLMeU+bAknyFboxYLH4WYBWcmN/CIj2kEuuRDJWhna32WxGoxGd6aRnzGrd9muZQkPVsTQHng4FEt4f/eVKpQKpn2fNo4eDCabPuEHeIXOggAGnkgwHtEs98u4+LcUiJnaEP66/oiaSBGf0xdltrJigiOTE+qHx8QMxYoHCYcIvw3erXioGtxxFxLKX3Zy2ShGEpS4C5CfxE884SxmORMyHw6FVYPdydewEN5vNxcXF119/jfQNOTljqIZHb3B2daqmclus9xQjL0WUzWYjzz0Q7Xq9TpbFqqSERkNGrVaTBZxl51n+oMfvsyUo2zPx1okkr1QWV6lUsoZIlKaoipEQHh0diamt3JuWEeQ78vk8A6vlrNkodRfA5ePjYxU5OGWq1erp6Sl49O3tLRUv3lD2fWjFWDUPTkYM8TzPLki+TAzubReJ2LPkstw32+KtbYFxQ27o1atXt7e3d3d33JgFaDzAwmpJ69PZ2dhpMSDdlYY9ZL99+J4cidsYKGm6B7DDUrvO90OE+99t/z2HrEMtNA+Dk5jv/o+QvJW6dvbfufctHoiThjDoW8fqzYudi+Mom3G5rMtmEmCQXM7l8y6Xi7LZSFzYKIr5pT3ouUdett/CMqM91rBnUheqhSZ7tR0shVbBht3PraUqAS2LK8lk8qtV9B34Eu8XrvUgNilyYPxFeEwlstfrjcdjNh8U0nbN9j31DM/XTnelEbaUVfXuWFUWC+aGdm2eP8r++sr+/vFUkFGfYoXmFYPZw1R2Dta6ICyl71ojqdULb+Xu8pXVYk/Fmt395gDlCOGsCPv0PR1tjx9wDyL/eOWoUKPZ3bdhtDPEIvKiU1gNYsk+SLjcLlXkB2EpEY+hYAb/ifK21E48DoQl65BdqkdEMb+dADZODjn+qfPZPKDYucQlaxdFm806ya5WmVUUJzuOvTS41qUBtXHaXz2R4uj+72buu9vF9z9xs1XX5dY2W7gz2mpNbJzLOVdwruxc5fULMlVXqrlqNa5WsuXier2OFtnXI+tFhiGG69VKw1aV/RPM3W9MuafPs/Wpe8+rtB2WwvYPFYOthzyW4v2hPkhMHK4DQHy4vv9XiLkAkYzH46+//no4HBaLxaOjo+PjY2hQ4Lmq6tPjnM1m+/0++AtZLgewfJnAGsrlspp8a7Xa559/jkPOH/3RH2Wz2efPnw8GAwhKYIsIpdljWPp9MDEBmvGCE8N3PB6DDhNMkPcCqiKFAcGWQBmgyjlHqx26B0BRzjkCawBliAZAnxgpgJjj+tVoNADNP0qZXZJ86s0UEUwhCHqag8EA7Qj5LfAraFzYCJIguFwuS0RS8nPqExTCq358NOYEwu4Ba6SGLDafUgVLPUMXeDabNRqN6+vrzWZzenqKP5KmH1Am+LucmgB85WAmtxmiwHq9ns/nv/nmm1evXp2dndVqtevr67u7O2iz6/Ua6vR7c6/CAEUSaUScQLciucjawpppoMsp2J0AV7Q+JiQIPk3lxLvy7pBqhNIbKje0vQOTMUmkeLBerxuNBk6S8oRJNVl29+2b3f0O5fhj57rwuyeTCXE209vOHAEowGcqXcBUQr7GCiW/9cGJqWSzKRtoyuDCA82doRKrj77RaDx69IiCk3OuUqlAi2YeSqQCm3hYopLoRcZdCC/MVutVpelBRoTORiaTkd8aRLDFYiGAWIvF7eAIp24yVklZrnTs6uyxo9FoMpmcnZ0JAU+SpNvtCpxFbRyYlQIhpQuAfiHy1ulbRT72UhUq7OCrQrCLgIOMj7Yylt5iseh2u5xZSOUIEmX+0MegD0VlolarPXv2TLpA1qAP/RMtdjYlYN+Tk5Nms2nzz2q1+uWXX9brdRRyxuMxT+fm5qbf79MYIQPVm5ubTqeDFDXos8RVLP4SxzGlMqoOYfVRs5RmGm6YEqbEFp1RB3ZG3OP6+vrly5fffvstZV1pWVpdRW5YXqNcQkwohvETjlRpNarQsp+2+d4U40wmk+cI22oQayve9Yke7OVBYKnZu7VUTVU13ZWR7jolrZgPd2sLhF53i/YENZpYMIJtxFpBhiouthgTSkzYcz8cIvuJWsu2LJGWxr/+olEUx5lMsZCplONKOc5mX99bLh8Xy9liMZfP5XK5fKFYzGZRKHbOJXK2tIiPql8WT9f963hVPU9hjETJFUKMx2MLDHm1KGvEZwvzzhi+sQNYO0RtDqDDrw/oOK4uFoVCwUWR+6hc7/307ZD6qviBc0SqPpPJRB0b4dxOXach/BoaY+yqPYSK3nuEfT1FUZcmXbJnBDyUOayShqiTd+KHBVQ78dx9sdp3cuB8JzuH/ZIU1r/OG3NOPQU8qZowbxUN+4g9CmFdJ9wVlc0J55X0OStaYC45nRywoS7RqUMqqq1P72wpw2qX7PV6tB/RyeThubaE4PHc7RakPcTqoqRaoqXi/ttgG4DYRevCOskkcW6RzcSZyMdnXZpMsAWI4y2Bl//l7gPEGefyW25v1pjURTsAYk+DeL39p+yWHSyYeLX9uOwWR144N3n9u3HD5aqZXClbyOcL+WSx3CwWG9bZrr3FyjR5s3GX3lGqv4h9Q6tDRZPH+6fqkXNV55xzC+eK2+9b2v366XbwF1v6cMk8tcN1uA4A8eH6PmPEtplL3Kurq6vxeNxut1utltClSqXCccsZXK1WHz16FEXRzc3NeDyGQZbNZheLBcQ3hCkHgwEgJgSrJEmOjo5OTk5gV9HYe3Z2dnNz85vf/AZ94clkQhRLRm1Pa7mUWJ+BXC7XaDSSJEFmlyZoKG8EB4hm9Ho9snqOCmjCoiEjKwniQEce/0oqAkBs7dTy+Txf853Q4VBEP/U11pzBno6Mxng8RjUS0zYyPRBYzLJsS7LYRvwQwJfUCxhFRDB5phOWAcWCBaBetz/+swLNCqBpUUc8N5vN9nq9u7u7s7OzSqUCplmv1wFZACBwmUMrg1GVdwqzztqR094O/nJxcfHy5cuf/vSnmUwGUZF8Pl+tVheLBQaDXlj/wCA4la0jR3XY1lDpUcQmKoW+Z5WUETmhrkCYOx6PeQQAQ9PpFPMxucwhU6uZwDfikdHDjhKIbTYkRKYcAj4OfElxRT3pqb7VIbtWGNzH3XOI+NkTWL/gkhI25UHjsY6/VpIkpARxHNfr9cePH7daLcu43I+EepR8mxNapMZtiVGWeiOARsxrwMHHjx+zXpixkmTl9ZjFI0Zcr9eHw6EqHEBySI40m01WGQUMUBJnFGbg4APGscTQMAHcBB0DELQA0APzVW8asJMwIMVisdPpdLvdu7u7J0+eqBUXxQb5KCZJgr6EGNZI34ony+Ul/NywnrXdpt6qec0xdHZ2JrCGTI9LvH5hZ7VajdEej8cXFxcg8uxmjD8nAjJBLDceq3Q8yuXyo0ePnj17JpYxnSgoJgk/arVa3Fi32+XjpOA/m80oTKIec3d3d3V1JYEOThYrfi3khS/VbDaFX4fPEeO7y8tLREXRRxafnQ1KjQUy7Lq9vcXrVTNNCtfy4uOg5H6gY1OW4Nk551T3EkvakohD3D/1ae7BW3claG+m/ba2BArmtcm7NPLgLoubVAjDaq16BFW3g3GZWk6zDHoVU1NLWfa2rcWcBTQZamv1Rj9QKKfj+bZZVWKrISsycoiwq4HJEie1bO9TFJ1zUSbDyZjPF4qFYrVYKua2CG82nysVS4ViOZ8v5XOlQrEkgBhrJr6RwFbFWiEdT6ViT/NaJSjCCWajIs9+v09Jw/YheXxkC/HYgzKfz7PeKT5Z2FrVzddHQBxX5vNUTZjvmudhv44eOruZhc693o73gAUFb1ky9QO9ClIDqvcAylO1mN1eYRA7AhZO9YBUG3Kr6crTIH6/O3+/y9PW8DbPVFBsPzatVex29G18iDpQtDff8U4Hu+q96gsPl1IlFWhKoUKH2QNJ00jEFOVqx+aEkjuljIjp5iGTDQ3l/n/s/deSJGl2HQrvz0VoHZG6ZHe1GIWZAWgwGmj2G3B3nuI3vgKfgHgDPsZ/c66PGa8A+0kaDQRIDDCyVXWplKG18HD3c7HSV+38PCI6K6tGNCx9Co2sqMgIF5/Ye+2117KYAWlled0CuK1Os3FkMo9TILIRiSXKRWuJ167IoUhTTN4YJ3a2+8ilMVyjEF5fAcSigGM/QXK9FInYVb/u3iQRgyBMnYQ0QJxJ9HbdBDCdX59YVDSzyB3M/O448lwTx2vPD8WJ4yiObtJunJvHDh7b7gxay+xoKZu3NxxPE3/ucPgikUhG2fS5ImsRJ9EmXiU+dXFyqyW5XRmRxT06fH/cA8T3x/cNI7a2MSgS4K+1Wg3AYqFQWC6XvV4PuzXwLBCmut0uXbzBegPGB11UWJN1u11kpK7rtttteLsRR4auJUjK5Egi8RNFKgQLDLAabdDA70BWYIyBfCS8mxAc8AcQ93RLIK4CJehcLqftzll+BNYAAEuDy6QS3yZSvFs0aTEpECQh2wF6SxddgMVgpaV5E9wgkV3jYUGUGcAiOKeMoshpTVOodiDFrKUTVkP/NUQkKpVKHMedTsd13YODA9DTgLYASIUt2/7+frPZxEmCTquZXLhGAouEe8BIZfSGEQuaJ5Ux7xD4puMP9poh/kDMim5NjB/Cx5hHIC6hwQ1oGto8kbvizQh2oTkAAma1WoXvHJBlEQE6jBoGSyBMe4iYM6OmnyQ+ENCw7qul64tVS9D4wm1sWHavLRvvJJnXeDomYQKynZO3GsAo8HQUCdCLEMdxuVymIvmOryYrmdSSNEhqsfl0GEoeH+FL9A1YBjJapxgAENVvIGgLwBHsFSiQADuOomg8HmMA4PIpSQwDsbOzs+l0Ci2RUqnU7/dRYKBwLY2/LT74d7aQc9kn8503oVgsZjKZ5XLZ7/eHwyFxc0DVGI1883K5hIQ06Gl4ppDexsEODFg7Ig/EDQRTVT+O71xOwRgFmxuVBtw69nNgJcdCjakxHo/Pz8/7/f5oNIKLI8onQPCxWGE9BN+Qd7hcLu/t7f35n//5T37yk1qtZowZj8cvXrzAIobhh24AGmlWq9Xz83NohaPQiFGEggfhcnwv7jP6VFBXIEBM3BYL40ZmH/613W6/fPkSFoLo46nVag8ePHjw4AGUH7SLFPZNiJBarmXL5RKZ83q9Jj8aIB2wY73C82dcfqlUQsyQ7vTf7Rsjt6a988hks/lisVgseiJuUmkgEMb9K21fZnG4ZJPepTX3tU992vBK0zDTOrCSatLnhm6pnfLXtbgNPhlfrcF3xADaLZCoinUt5NLSqpFrO+XOWT/eSJfm+sBLZg6fTtqNMZ7rZHw3m836map4rcCpxI5vjGNEwtA1Qc7LZIzjZ3NesZhJRLff4n3a44EUactLEE9kmRxkEBMgxp6L/ULHS+hRA7S00bUM30JPZgR7knTLAYRCXZZnhQ2XML0xJnacwmKByOp9Io3bRFxWNZcDHqNlOp0Cp0ZkiDWEy50uZtxmklr0BUQXWLsoE2Q1pmyMGy1fOGuabFsfNEdYlH8yH1naV0DfGc3Hx6jYFpZYcCFCDpQELCcGPSneKRza2K+wLZa2tHHTiwnhY90GamnpWsgsCzx6sdpYZrgTQmzwEbuvUZSCByJnTcPnuWE7RlCBxZBNACjb4BetfjKyW+jLqvsGCBzr+7ax+Kq1ra0gOc2+T+vVbFTpuenG6biuGInDtb+OqmHcCMLP1s7TKK7HxhXHbAaInQQOdm5KTGiSL0VvyQ4GOpxR/+re/F1XfYKjYOg4AYKJDq+VxESYvEJgNBBZXqNNQd5cTd2v3mTyGVkemUbV+L7xvCgK43V0o7/CEoLYVuFIo8M7/AAt98vrvxoD/Z871naMUo5fJ7haIBIldylOzOtEJBDxk1t0f9wf9wDx/fG9O7iwEj/SsRQbilm/BZZ3cnJSLBZhgB4EQT6fN8YApAMVFD3+VFN1HKdWq9VqNeTecHJvNBonJyf1eh2d4z/84Q/DMPzqq68KhcJoNBIR5KtWeRDproiASIvwvVarIeev1+v7+/tAPNHdTx0rcqOYisBtDHE/gmk0b7IDGtkC1WCBAuBCgEFvlBndDXCkOVMbPXPSNX8E/f1+/+rqijANhCBgaQUFDGt/JRCM13Hh2kmPqCLDa+RggLdQ3k+38GyjsehuZUAeuVzu6OjI87zRaLS/v4+IbTAY5HI5AEkQdQUqWq/X6/U6IB6AFMDLaEvV6XSgrWGMqdfrjx49arVaQRCUy+Wf/OQnn3/+eRAEv/nNby4vL5HLwQRMVEf2uwoQp6VvGcTgxICMzGazy8tLdNwjckXCzzyWJDJUMgB6YuTjucznczAZPc+rVCrQaQEEA3FVFmCQklEKmTgCzi2Xy0GLGWgyESKNSmi2lNU3d71beB6myZ2ViDUNOU3c432Avx+/EcOV10XAUUTgoBhF0WAwwIJjISPWaOQ14qMkMaWhELn2jeHA0EEqNR/4X1E6ffhqunQyYWBbIj6QQBuqCOhqxPwCEgFlWxaiQI7DfyeTybfffjudTh88eHB0dASFa7ZS6u9613TO8qKRm123qM9BthIPSEO3WEsxpCkmwHUSeATQRoxzrFQYtPgBH4Jl+ZYFNr1hobBXrVZ7vR5uHRBhlBsxiTAHQbAF9RWKQ+TaAwHX4wTXjqwSv1KpVB49eoRFBoR9LDuYucwwQZ3GAAYODi0dVjqn0ynJvKiT5fP5ZrOJGaoroKJEADDsN6qpaNsAzY0C3R4jCi6gopithAu14o0eD2Bba3CHT5wemxaUgH/STevpsXSbrfD2jz+byZQKhWKp5KoZiilDqz1OIl35SPvaWyCvtc5j68H2qjFi3YYCmFW3G29US7dIahZGZhHn9WZqVVBwVlilQUjHkmIZFVoAMU+eADGV8S1ALe3dZJ0YaVncVZXGlJPJmELByxcKsXc8Cp+uZ8fi5ExsJBQndHOu26iGRweranVVqUTZjBcnaISWRGCXmCaocp6iNQe0A00Hph/AdDodDAZoXGNbOioiKH5weOuJT9SGrgYEgjGpwSFARQcrMPcL3VEurptDVfI71zTlVLUNkLXURdIyxBbjGw9UG05ibOBGcfCkIdQ0edwiPOr/UgBEl7QZNnA/Sp85B48VM2+MftMqE9wpLIo3PTNpU6Gxcm0IjPGQXgQsBgDBQQT8LGrqwgC/dGMZbEe0vA3S0ieQhtE3mlUyLEmjkJoPa1VBdBOAbCH53nh8746h6ZV/myOoJJpyyFxwh7UHNR4W2nFICgG2K0kfCYIrBOH8LSza8/l8Mplg97fKewyVN5qC6pHPz9Rv05+2cdByN7e0g6xShOs6nhcZIyL51fJ4ufrBbPWzRfw4zO6LuJJmEMsmQWEyiDU0TBEJSRjEQId99TZnE/uY2LGTAoiJDpNBzH9aKwZxILIWyYpEsvTk+YW3npt+14w/i//8h+F+M85mZL0WCWx1a80g3mahYU2fjb07elWxMheTCN47IndkEAcJDk4zOi+5DzmRpUjhLT4uQfIUlopoHMn9cX/cA8T3x/fj0K2g6SyFalAiMhwOLy8v4dLz+PFjiEssl8ujoyPkG9CaQNZN0xvEgr7vN5vNw8PDUqm0WCzOz8/b7XalUpnP50+fPq3ValBsAI8JOg/T6fTVq1dXV1ez2YygDN5gjAFzhLkxyJIHBwdHR0elUgmxHXszNQSmFaboMUJYnJrFCD5IgCVeCelkJA/kk1rWEBuRMt2kKTcFrfQpyU2F0OtS5XoNpvZgMBgOh+hYR5IGRBsSw41Go9Vq0dGLvD8isAB8qdEBHEc7m4EPgrsBdVRC/LuHEINyJGng7KzX63K5jLMyxgyHw6OjoyAIkK2BGjCfz6GTe3x8DC8sqjzTsA760Z1O5/T09NWrV/jkfD7/4MGDH/7wh81m8+rqqtls/uVf/uVf/MVfhGH46tWr+Xx+eHgYRRG5cmmfrnfC0fRkwXjWwBzpn+Qm4HXafHM6UKkAMTpuAsnOi8WCETM0o5nUIdUhcodfgbyJpaiYy+VqtRoIkswHNjo/bARNdLK3+7l/54Fg3fI01+3MPAcau0lC/QavXGc+NPFjL/wOTycrO2XcqVtTdTMa+dQWK4RvJrzOaUUUyaKT0C/bKk1pHD8NG+m1l+I5nMUUB4DORrpWcRvG2W6fTMpowGUUpFcRWS6XgFw54LF60J2sVCphvEGSyHVd8PUADQPxR6MGtDhIR2XdC/UP3mTnFiJxKKI8fvwYCh4AgzBrgONA24HjBL2oIO02m01UBAEYoRKGsYqyDQw/Hz16dHJycnJygrrmZDLBHcDqhGehxzbPGenuYDDAHoctiVsMJIzBd87lciS1Ue1EEtIitphGowG1mTQXD/sUIAycDDHuTqfj+/5isWBfvAaDWFuyFnAA+tQ61/MITEkuzszisOBDFcqSE9kNE6dFTm65quCq8/m8exMJpew7y9tpEd5tZMm0KS5nMaQMrDVWV9Q4qTeSmNJgUFqDVUcIlsgpPl8LTGGgYr3CyoDtQCulpk9Pf77eUBgj6c9Pn7zWc0epQ18LliDXNdmMU8g5uVwucPeHq096q8/WYQF9x2ZmsiJHe7NCoXN81CuX5tmMF8WZKLq2sdMlTy1XZa1RNOalHAojQ9aSx+Nxr9cDXwG3C1aQWtCZODtDOA5vXWfCaUBiAiNfo4QbxsytPVS3lZ81kLeD0rGxyMHCElmWYRiiyo6/olpg2VdapEgrGNDWYUT00JmEG6LVb/h+C6MhLsz4U+9cG9Va9QSxoGTsUxYrHw9a1wx0IcQKePREs3wL9bV4nof1E1cKGSLyXrlVpZ/UtnUmDRynNSK0fAdFfqyVyiKobmT9p60700rK6XH4XvTh5Axku+2ehfFReZwdA1aVFGEPdmouaEhqkKBBc49NNmQeQFgGnUAWEVhjkRvdTa0+kt0VTWvwbAsm09u36xrXjYzEofHDcH+5+ny2+PnKNOJ1Jhb3msMba9x9J0DsKCKwk2IQu1towqLYx/qf3JsSE9ZXSwIQh+pj40SQt3iNJgcrc3rpDs7MpB9XcusffGQyvsnnzHJlwsgJI4yU2KKqSIqev2NYbiyNbJtcGmm/I4M4m/CC8fM8ueqiyEJpDbuJmsRaJExw+YWIrx7o/XF/3APE98f3AiNOu6BYBW2w8EajUa1WA2YKi4Bms5nP54fD4enpabfbnUwmWNwt53rgAugQh8ca8ljACgQgkD+Xy+XxeAxB4eFwCKABZ0iG2mKxQK6O7R+gUqlUyuVyiP5BK9PpN+VNLfsX4G5Wxz3DWZpQgTLMKrdlfbv79hL/QoiD/F/vgloFFbmKliEGXD4ajYbDIXqsAAdQzQCSF6A201hPo1FkWDAuB0wzmUyoPowe9lKpBIyYfn3fiddowUQwBy8uLs7PzxeLRavVAsiOMYMfEMSTWgvd5JOTE9AJaVWBpA6CwkEQ9Hq9ly9fXl5eQl7Qdd1Go7G3t+e6br/fz+VyP/3pTx89enR+fo6Mulgs0knpfeJdK+YA4EUPQxz5fL7Vah0cHCA1Bd+BTGGUNEhKArcRTfqO44DjDAmXyWSC/m4MZuRghUIBKhYYyRTfKJVKGJNkMrK8AeAY+YwVDWuHE6ry6WmuU19NM3mnvJdN65BTQBlG11E4dHEHUHnK5XLVahVTmJ7RDBAJB1CHWkMbOtlLE2dIjtbeWTrd0jEo80mCoZJ09OsUmsZrliUUNFtRAqFjIW8LBr+FblugDHl/6I3AwgV9HsxNJPlWTq4VYN8JntAQAxmj8CAVEQCjqC3x7gH1xvisJAe6sEUEsyAIApTTyuUyFOpBwuW6hEWJzxGrIlaA28zKbDbbarUqlQp6SEkPB3gB5iDBAha6yuXy8fExRG+urq4AEDPPx7kBfa5UKg8ePGi1WkRYyFyDxhE+GcR21AxYT0KtqNPpzGYzLBTQaIbGEaBhzFzcSU0OxaiDJn6xWDw8PNR9IbqqgTUElUut1ooiHMZhq9Wi4o2mlLJgg0IjBhUWK0oPEUgCIAJV92q1CsCauypkKzDaNzpN7S5Ov+ugdRzH8/2M7zvJFaUvTW/0FgK7g9MnKTXS3SJLFvSs4dSN9kT6ehFCaHAEA0x/EdWfNBbGipFGgrSusabcagfadLzH9X8bArLN5GoTA9E4Rnw/zmbiTMaspDBZtbqTkyAoSCgyFxmJH0UZdzxfrFxnWsgvMxkTrN312ovFcZzr3YfocHrwaO0Ci7itF1IiStPpFG+gh0Ea3JebFs3YqlDNQlmFJADSSC0WBUfa29X7FpJct+RtyHZ2rQUocxBSggNRN4pAJAGQNm5xRS0pBq1LpgFiDFc2q2GlxZakEWEe/HUdqWr68EaW+o4wzILmNesCXp2UI7DGSRqd1HrcFnWUqDRmJcYPFkZyqEGhwJ5ocfw1vr+7SJbWN9D0ZEs5yhq9lvSctUJaBBTLdWDj6qQbpO4eLb9jaC03jd0s4i0rlxy0HMkaPUdZCNOZADG13URRzkUR/7elwHr27RbQl5sKuZKSmLhFQhGLiUXcMCqs180gaER+QWLzFhGWmxjxbW63SYGglh+duWlwZ25qSpiUBnGUQNVpgFgSPDS66XQXiRiJVrKcynpq2p4zmhiJJZOJsxkTRsY4jonB4o00FWMjwrtjQFoiHt9pvWjeNZNJ39s4IWUTCyYuDKGJrMgqUSuOE2Fi/tboHiO+P+4B4vvjewINkzmy0QUYWAbQAcB2eGUymQBBAHdpPB4PBoPJZIKeR0sUDPvxcrm8urqiYiAyUtb8cSbQegvDsN1ux3E8mUy63W6/37ck8MAVAgSMGAgxPfEyxHZQp0W8CDIFsQnSatI5IWmeWtcSSbjctFLVHVu7TYe1WwhupgXQMM+kCAbzPSC5s9kMEQ9ItePxGI+Dpwp4F+AaNUx1TyjkMi09AXpk4ZmiLRqq0HyC2yTbNKmHnZuw4QJ7DtTdVqvVarWIehPMIq0Suq76niDcB3EYXJjlctntdk9PTweDAW4RKIGO44C8dnx8fHx8XKlUrq6uAAxRIpOjS+7kv6GZwriTWsOaKVOtVmu1WgCM8HWgMqHC4TgOYDL0rdfrdcC+bH2lEgIs73zfbzQaQNWr1SqpXiJCJx+gwHhMmtGsY325SYO1RDP1wNMmwswrtGPbO900PbSQQGrUjyxs4BpI6qBCw3WGbbwYM1gr0F3oeR7h141Rvg70KTyniUjW3LRcrUQ52us6Ge+kblll6gJ8DWMVZoygsGH9YUqM/1p9rxaIg85K3DpqXJZKpcPDQ0iRACLH+kbqzW6AeGObnp4XrCpRtEFEUO8B/5QkYpD48FjZaUHx0DAMMSWhZQwEGSxX/KtGt/FmVImsmtl3Cu9gyuBUrWIAFDAoPk48GnUalKnG47EejZh9xDJQgAFIxNwVowXILHjHBOaw3urbiP8id6VbHVoEqFiK6YwNke0geBHyx1grSPXFpVEDBMUqSrJQblvn1cCa8exQn9CNt1woMG55FTQIolYDvgsKzpRjwn1DnKBB59svs3cAI96CUJsYXulFII0KbVwrdtfOrW53/a/bsIPvTlNvZsXb0Nj0LOCKbSHgG9UJNqpqbNQeTX/7biqWDVQYcU3supHnxhK7QZhbrgrrVVZCkYXIVOIoXizWYeQ7jpPxxfdMFJswciS+Boi3+dRvA+U1cdsCvjWCvBES1ZuCxo7ZDKTVdamKYNECdPvX9f4Sx3EUyZ0Ef3YgaGkU1UL5daEC14soS7fZSaIYzrhLw6waI9Y7L2vG+rZQppltRgyQCMYREdYC05bxoDXeNJy6cYjKJkkHBhsIjxn6UgFGE1b0FN7o3afbrbAyI4bE7iaJSjU+HxlHerLcEiVMa4ZoEvHG8U/+jUUr1gNGy1NY+2l6du+Y9XfJKN+DfpEm5vPqti3XugUzLRORdhN9H/+9HZdwSwTz5usSx9f+nGKMGCcWV2LHpgzHWxBhsx2Mf0/rxI3gsv5MSydh4zsJQMcSR7Jem2Bt1qFEkcQSizG6EhrH8gewe7wxtu/8fYGIkwhN4OdQxBNZKkZ2lIDFbvIevM0kL94f98c9QHx/fL8wYsu6GnHwaDS6urqqVCroAm61Wvin0WgEk/TZbPbVV1+9ePECpVrSTlkKZphC0zMCghpqoacWjOmjKALV6/z8vNPpgOWqmyIJMSCIB9ESASjOENZzFPcEUgxcWHfhacsOXDKS83q9Dj7j/v5+sVikYx59e6zivM5etNKrlcYQYUwrh7KjSm4arK/UMZvNxuNxt9sdj8do65bEAYm0biDIIB8RNaCaHmhldPrGxwKAhl/WeDyG0B5dBzWxlHEnbwKFGjFsAGcjD4HW8NXV1d7eHnWQGQISv+bNxHMBpALwFFKeq9XqxYsXX3/9NQy7RCSbze7v75fLZUhPhGH47NkzuEhNp9PT01NidoQR38nCayNN4Kb7sKMjVwxsjCiQJTOZDKQPh8MhkD7c1Xw+X6vVMLoAcCOxgX6xiFQqFZRPgOxAEpHcByZgBDdJq9etnYSARVl1W0RaXQCw3Jxvg3TsXlIwKqzuZp3k8DaCTw351Fwuh2GJX0FuifnL+ook0s+gaacVIay6i1YklJt8MaaXTCN5ezkgAXvpLE6XvghiArnr9XqoClxdXXW7XZZAkFHjw8nD1aosROLIgsGcgnztcrk8Pj6GRPvl5eWLFy/G4zE4cTQLogbfO0XM1iBH8Q81NqweoK7DkA1oKaB8JOS8QJ2QY/IGQUB0G1rSyLGprxKG4Xw+hwleEASlUqnZbOKR0bWcNpXaVgs30+JLcmtYLBZoLMXcn0wmk8kEl4OWAqiEo+RAXhtOlbLIq9UK7wdJn7UTLgIAR7DSYnwCiuWwgbJKs9mE/oaITKdT9AdUKhUMfqhDoGmdA0ButjZDW1kSPu9oNLq4uIAqNAQ98PRRQ0JFjS5MuMPw01sul7DmG41G/X5/MBiMx2PcAUjbo/qI70VtAFsDntF4PMZOCh4lOewUocIN3zi0PnhCztkoKYBso47qRiQ6/TZLYmsbEpdGgr4TZb4l3m0Vqi0USfvCsV1AVwIsPNG6wFvC6NsYcGnwRSw1VRM7xkSxtw7zq6AQOLnIuOJLLEZCkVAkJxLGsZHVyp3N/NnCKzqOY4zv486L4zBtN2nIwLqWHTgRy9UbO/GtVjms+QQ0taXERiLbxr7+GwvpXSG2jSK2Vqs7u1j0qstX+NebRlguwy1RPQoW9rrxofNDNBGBXVMbdYTd5KCVLmvYqOQxRLdaDTbGZhthPv2IJdHppifqdDrl09fujhtnWagODYvri0JhbLFYUD0fF8L6GT0h0uhwenho6HljxHXLADWNq26sKqV50ztCu42iCn8Y2G4jw0ZLwXBz1MkaZz3ru/hAPClEBZpzs/FubwRwLZw6ffc2LoPWOsNl2epyS5pvjOsi1BTXdRxXxInEja5xVbMdEU7/oMFZc5MmbFJ6FObmz7JdvEKLIMeJiESszipWP0Q3tSxg1JYRKYojIr7MFub8ym3Ww71G5HmR60aOI3FkwiiOIhPH7t3aiaxC2ncW4aIoio1x7rxhRwk0LEqg2SQAW5zISrjJ61GiVhwr1NjI/XF/3APE98f3BiPWDVYUDhaR+Xx+cXEhIuVyGUqOjUYDkd9oNOp0Ou12+/T0dDwea40nq8mR5AXaH7PBlngfQ8n5fP7q1asvv/wS79zf3/d9v9PpnJ+fQ21AVLu39neiTw61dClWmM/nEZIyyKO92Hg8hswCkfF8Pr+3t3d8fAyyJ1A83pON5ss6tAJ3FXcPMDRiSgYo7KO0dkT8LtAxnB4RWDwaYEa0bgDtDlgt+rvR19zr9SD0AVybZve4XnpqsRVLN+yLyHA4JJJFHTRN+sAl4BsZh+Fk0PKMFAUnP5/P4WRYKpVQIdAeX4zF1+v1YDDo9/ugE6I1DG1ieP1//a//9dVXX0GZBNf74MGDYrHY7/dfvXoVRdHDhw8LhQKUKEajUalUwrWAcawLFXeLDSwTM8v2HXcAJ88eeYJoMMKmqxWb3TDY8vk8rLQGgwG4lsDIwHBkBmuVDejHgpEJJUqL9231vjGt4tOx2BkbM427IcVaNWVHeoOnCSkDgGU4fwxyCxa3VhVNRE1/rFbJIIZrmX3rOwC81SK5I/lMKxdrcJl3BggdOOPD4RBQnbYLT2sCWnms9jbR4omY45jg8OiDhu+2PHMbGW2HkQ5tA9FIu1qtoBeMF1H5Q0PxYrFAVQPbAaYqFLSxnI5GI0w6QJ+czuBbQQYHjqa9Xu/bb7+FGSOkfoHejkaj8XjsOA5k64FTX11d9fv99Xpdq9UODg4Ad1J2E+6dKE1RcWK9XkMKOZfL7e3tYbsBggyDL+pOEOLHJ8DvrtFoVCqVXC4H9IH5J2Q90QEwm80cx4HSBSYgFGMwehuNRrPZbLVai8ViNBoBd2Zfdrlcbjab6E3hEJWUiCQAXIDdr1+//vrrr3FzHj169PDhQ2zH+/v7kEWGBhGHLjDi8XjcbrdbrVaj0cA5U2qZusNQQWk2m5yAeGqo0gGsxzZNj0ECxMYYAtOW0sJtFtvbV+yutRCNMY5j1CKDccsSsmwRV7UkVtOAo4UjsJeFBdo0W9CC2DauRTsAQW4Hvu/TTY7vwc4L3j3qE9y4LRiUUKDc1CVPdydI0la/W31iI9S+0crJdV3PM44Rx/HXYXk6O5pFT8fZ48ApSEmMkTgSmYl4Ei8kcKQ3yL48rTQb4dFhWK2aQi4WicPQ1bxbfI+FudAbk9uuXtMYNWF4c+e19jgdfrClA5pRlMBCFYTxz7YhSpUVHTmL2oLfKbRI485p9zlyWrX3Gn/WwRWFILAIs7nh9lR6C/Bl4Mpo0Go3FKUVAOIwYm9WRhHtgIerpXU3Tqhtzm+UbNKK0ljzsV7hdT340zokOkQh/sidmuGZKNWR5XKJ6iauUXMsoMhMsvlm60I1YCwA11KVsbyCt60qWihZNrGA71bp38bh/T1BwxwtFq9c+xMg2UGBWa+WLLTzMSF8wthDcIIxj9hjYzS7sQyWbrnbCBBv8zVJL6eWAEsyQlzP8zK+4zhxFGUc34szThyYt+K/GwFiCwJmR5yjnOWoO2xSGsTahs5Vn+wq8zpPqRiTEqs/ObxpUhcm749F1iI5kXzCMnZE6iKeBMacXXn//JtcEMqnT6Kjg6BUWruurAPHrE0QoxkLrOoNC5TcWnlmBw1Ckm5miSITx97dRngmAdKgtjwXyYqEyW1cieREVolnYJDcJbx5KRKLLO4lJu6Pe4D4/vj+oMPpzjU220LF9fT0FOHO3t7e4eEhuLrtdvvi4uLy8hIore5zRNIuN00huHcCzAIzC4522NQRlk2nU0KKH3/88U9+8pP5fP6LX/wC6BuNj5Cj4qvp1gLtOQA92IlpXAOwGAkAOmRxwuPxuNPpIKtH7FssFlutVrPZRIyLFlripHLTyCVN/GGMjnyGypUUfLT01xjk6ZsG3IH6boifIEYMnAWXGQQBmp3xNt1kByo3HiIkjDudDrQXGA0TRNB0JCr2MjFIp82O4wACQw5A9QAt94wUhdpwOD0i0SC+ISgMgmAymZydnfV6PeDpgK2hpHl2dnZ6evrixQug3igAoPPacZxer3d1dQUNkEwmA5jV930otwJU4sO6AzqsucOSag1mjyrJgOjdRgKDxAzsRST5gNIsj8RSqYRHP5vNIKaMx42bpoktOk5iWkjcmR3f2lxba00wWSI6rJlxaRjxffoNOV8ALVneI5gXfCdyclAXEdxjLHElISKQtpzaATlZKLl7M3VPo+cWSq4FKCzMhRMBYxt1l8lkQmACCxEXN04KnXhYBGe6F+KvGEWO41SrVXClLy8vHcfpdrtQbtH2U7d5UhslCy2eGjGjIAjy+TzkfQF55/N50op5WyaTCQjyWGMBW+PCyR2GqSbW7Ww2GwQBPqHf77fb7cFgQBdNXP5oNDo/Px8Oh3ix0WgAfzw/P7+8vIQkBVZmYwxObzKZAJXGYou8EaAhaPh4M1BRTEACLmiVwFTF2ug4DuV6gM+CRQveMcAjvAcdG1j0arUaClTD4RDLqdYzlcR6kSgDOjm63e5oNIJ8vF5I9VMbDocXFxfj8XixWFxdXfV6veFwiCQZdoIHBweHh4eZTAZa3sPhEJsjixnYGQF8FwqFer0OEjHOHJg1enewYgOS5pbt+z6s/9ghjo2D+h4ohVrVoN00tN38rNugGJKACJSyITy0sfuekKge6hZIqhsIWAyglDy3Y60HbdEPNzaM71imCAHrKpGFsFPJCredUY0Gr7VUMZtyCLKkwzDdjJVGNHTrvZZgTtNyHcfxfS+TMa4Tx3Euipqj6bNg+aNp6eNZuRGV3DgrEovMRIoSDWW68s+6FeM4pZLvZ6alyiqXXbtuvFy667UThk4sTlLYi+P4besVDehQzKBjFctvWBmgdTYej8GI1yIqOkAlDog7RiUxqH5T3F9j7sT7dE0uXVqIHcdNbv7dMOI0dZ0gJr6anqXsh+PD4nOhhy2aLVhM5flvqwekkTKGrJYesbWz6N/CkObBaaWhwNvgkumSJ+cjLTEJECNo1MxiBg+8RXhFD2b9Bga9ujINnJ0tTXzuVL9F0RSZAscGMxoNhVt+XNZN0OEKAeL05m6hqISY9c5+58gtre5ifg/5pi4/0A+c6QDrvqwJYeMG9wL3GckF3m9VVbGd4XOQ+LBqmC5JMtVN3wR+shUeW7wK2SQkwn9lcK4XfBLqAWW7joSRn8m5fi52wijOxLFjrgmnsWLpskBqUYNlExC8ESD2UigwAWK+6N9EkI2ivobX1nPXEgqiVHfhwwbseCmyThR4MyKRREamE/PqyjORzBZRuA4cs3KdMJONg5W7XrsisXFujLiNddxtiUZaGzNdh7ihpydiwjB3N5o8rm6VaBBnRZYimQQydkVWCaSOppl5coeD5L/+PYP4/rgHiO+P7xtGrCFOEljwCgQlgbuhogtBW8Tr2Iy17APxR+0ipal2gDxAUhMRRI2EyYAh4tMKhQK7famciMCCaJEu5jN9JT+RqR36o6fTKaAoyGKSDY38GYE1iMM6UrSEWVm4tkIE7VaEyAMog6arWFZd5LMA0kX8Ciw1CALAhZqXEYYhbgUUDJDSo7ObXDN8NUQ/gESARIZGYIbI+kxoTmV5smtcSTObkKOCPQGxEXZh4+YTwojjeD6fE/MCfg1PcJhW9Xq9brfbbrfBAaTx12q1QkP9+fk5JCxwrwqFApwSl8vlxcVFp9OBdi0y536/XyqVjo6OfN8H65xP5O4RrW46FjEJCLUKguVqJcYAHTYJ7dR13SiOV0GwWq3WYeh5Xr5QcFz3+nOQL3meY0wun6/V6xgkvX6/2+1GUVQslRzX9TMZfH4Uxwa8+2wW0fN10pjM0+s8J4pcx1mH4VtuBWYHUmJjolTbssWVYxSKkOY7zQm3phnwBMtkJPH7ZigPQgdGKQdhoVCoVqulUgnfCMqqxXSjeKKWUd4N62t5ZbnJiU6zErQejvaT1AoVRAR4Vsvlst/vY0hDrpeUfCB6IgJ8MC0pyIIWJbOBkOIy8U/GGOjkrNfrbrfr+z6WRwBDuIeEPG7PEpJNDbA6FwJJtlwud7vdTqczGAyIO4B7SxQbnpla+YfvpI7EeDwGQRW2dQCUB4PBaDRCvYd9xyICC9PJZIJ6D1oTFskBFjCweMjpAGPFiOJzZCcHdF2wEGH90e7zxDIA4mPZwbIPXIOyP8hR6bUIsADcf+xWMMfjPdTrPNWTUKckKrFardCuUa1WKbeiie349n6/D4AYRGlSR0HBRr3w8PAQ2xbkhrEC47/YKJfLJe5qpVIBiRsugsB/cZKom+J6iTkS1uHPcNvjLozf0n5fuyk/HypiiaMoTiz+MIkw9TT5TqNCFGNlEKJf1PLTln4U6tDUBNcEQwsg1pPLoqHtwIixQlpiEXJz+UVUg9PGBNQaLwwweKQHkj5JS5k3jeynKcZpgJjEvVw2k887nhev18XZbH82/2gsP5xln64z+bjhSllERGYiJYl8M+v456PKdJErlP1SMVMuTzxn6XnxcuWJGMcR2n3hZvC+ERbUCw4mLC4TQU6/30cFhW1hvA+6RYP9EBix2IDgsUkrC40O4xFQV0FbuVoBUmSM57pguN85CLeIirqOyEWJgZxFk2eQiXUV1wgRG22YkYahd7DztKatNcct+jNHoBaj0DYYRFF1DUnXX3fvWXT1xGQnjEjJuI2kYy2njlKWdqjTRnZc9Dg3afyA2Bs3Ad9IbBqfTLV6/DounM2CWqMmTXi0xKCtPidrYGzUP9EeG+/fqv92VH/QZVxHHWRnY5TqTlAdg1FdGmQgvAG/grGNOkFaSYzjTSPOG60Ord6ydD+WpXUum5SOreeYnmsWw8bzvEzGz2SMY+Js7OeLUTmczr3Rwrhr1w8jN14bm0rsJGRhHWprmQiixm5KUMLdxCOW5AM1QOzfBIiREoTJH/cmQBwnhOK1iBEJRQIFEGdFROLQLBZy2XMnY2cZRL4JvDhYzsNcLgrXjuubUskUi+K64jiGAPHGYSM3XR8twZZtKxhH1DU3JYrMalW5G0CcEXFFssq1L6sY30YB+p6II5K7+WJ8Tx++P+4B4vvj+3awJE5slxY33EcR/YCaAdgRUA7dabTdh2WHpS2wQKXs9Xqu69brdbQYu66LzL/X66H7dT6f/9M//RPSodFoBKhF09MYeK3X68lkgrOlixS/EWQoTWGArmu5XC4Wi8fHx2gl1iQCEpB58mSKidJvJaZAYV9EqPgWjSawFdcK/UkcRnyjDZchWMkrxT5HMWgwZ9frNZBWXD4c2wCd0DqJwTEeHLIm5pPaMo7EHNZjdeedRX8AzEcCFPsxsRMD3UYsvlqt2u12JpOZTCZXV1edTgf98s1ms1wur1arN2/e4HIuLy9x8rjnkI8ARR0fDiXNhw8fPn36tNFodLvdb775ZrFYPHr0qNFoiAhoiYeHhx999JGIXFxcdLtd0gfuRiI2Ij8Mw5oxRsSLIj8IjqbTT9vtfcdZr9dep5PpdESk1W6bdrs0GDxYLovFYmk4XCwW2cHgeDrN5XKN1SrrONk4Lk4mjaur6mJxrVtnDNhBw9XqYjKZTafOxUWpWGx0u9eObb6fKxYzlUo2l0Ox5C35FMM1mXexGuSu6yJQ5SWIMb5yWsNvGcfxQechkZae9K5rHEeMiVMw4m3yADeOTRS5ItH+fuaTT9wE+gSng5RSbV+DrBvv4cMKU8ctH6LWH0zn4WkVDnw7IVrCKGneGYY0MpbZbNZut9HUDzA0SA5MEOBuvO06CYQNI8humNRUOWfGC6AWX0qseTAYQLcXqKulgHErcC0lisebRnwQ/GXQo2azGQjFjUZjtVpRUAgaDuPxuF6vi9JohlQI1nnAWKC/4T1gWwNAJ9kWBcLpdIpaHVdIpP0Af6H8CKn0i4sLFP9Q9MIdhuIwuityudyDBw8ajQZuIHrPwzBEXQqoKEoXsFoF6ACoFwoSWOWw8mcyGeqGZ7NZFi34CDSsBn9U3LfhcFir1SBnzz2CyA73BWyskC8HQ3k6nV5dXaGw1+/3QZycTCYYeCTmY9jgxHzfPzg4ADEZKh9Y/zmVYBJbLpdrtdrR0RF881iPIYim+Xq4LVQUAdEYw4M0bWodaEj0naTeb78Uxzyr5TJOBK+x65FXa9Fv9cMihERhJb3HEbBgPimJnhXVV4hiMBKwbpqkhDV3A3BWLYFlby1ow/uJ8UlVHAwGPkENu+hWEktKwurGSMsQczAzvEm76eLrsplsoVAsld1sRlbLyjpshvOTWfhgbmpSNNISabwFiGPXrAIvWHizWea3L1xX/PEov1dbem7sZEy9HrRaq3J56fvrIIhWqzWCFw0QowyAp4xlAXMBRWgonqFiREq7BX/TeRhqTrj58EamKSU1EKwaD1YGRHcWCfEtUyFlhfq+hRDVa4Lhoauklsi+NhEhPrvRCzGNTsqmjX53+3b61/Vvaeoxd09L5UlnB9/ZD6R3dmyyBIi1895G0zP8Fhd5Xf6xAGJOHLTBYbppUwdRYhcYh4zPGXjrgIGJlY490hi9fuIWem7p9uy+Re/pMvf+PnXyXWI7HJ/oBAKDGPOO/aAoQDJSwkGhMJRjweym/wdKwnguCDOQTRCyZ6SkYWhdYLP0vq2Wso1moWkmjcaItQSZtjHwPA8GDY7ruo5kHdNwR37+VWFe7i9PBkFjvKrGgXsNMhL/dRMUJ06AXe1oZ6HGZpMqhYUUEyB2E3Q4c5NibBQfNkowYi6oZBBDmRcA8Srh2MbXzmxxIOHEzIxZjCV+lZFVfnDlHDUy2UzsZczBgXz2eVwomGwW2vpOGG4QeU/D8RvFuzdqreC2X4fc83mwXpvJJAzDuxQ/MgmAHiZ3NRLxRdbJk6JIsZv8E1SJPSVGfM8gvj/uAeL74/t1WGRYTZJlggEFA3SqatNzDbWQ5mAZROgvAnnK9/1Go4EMH1v7aDTq9XoAoIMgAGKI3iKtUYVmZ2DHyBA8z0NCzj5QsoSYzVJXF5Jz+XwePGhwr3R4ZwWy2hee9ByaRCN2GQ6HVJstlUqMiRnZW2kDtTKBboP/q1mEFO4kUs/rghI02GRIGpEoSuIsRAo2uTZvy6frtc4cAEVNJhP0ULM4D085UsyAPmhfbABDiKvYOchhg0fZ7/dxV6fTaRzH3W739evX6IlGLydMDoEOf/nll51OBw8C+NHFxUWv1yMbDk+nXq8/ffr06dOn1Wr1zZs38/l8f3//pz/9aa1WC8MQ8qxQ24QESq/Xs6K0bVnNVoaXyP9X5GdRhMHtRFH+8rI8myE8XS6Xy8VCRLJnZ7HIarWSOPYzGfR1TqfT1XLprlbZxQI+OBh+nue5joOziRN/sMV8HgQBWLe5b755a//tup7veyAuYRTFcXyzWU/HshqYSEdLb/8qIua6tUtU2Gn4BiB6d0sz4tiNY6dQiP6v/8v56CPxPIwKoMNI0njo8gOp9KRKpekbt3mCmthl8Y8QL+o7gyciStxcx/SWUzZwGWAQ2qVNk53ZAUDqnwZ9JFHMZM0GN0GniERnWHjTHeJMdSwo4fYUno3ktSAIwJMFsOi6Lozd2u32gwcPms0mRGzx+ACNDYfDdrsNBj3IzpinbIMAEgfKLVYJSOUOBgOs84BE4ziGI2W/36c6MJi/KCoAGCLxFkUjfeY4E5QDCeVAGwEzAvgyZEwAdAJZwwkAUcI/QbMenETeeZrFYfch8gJFYA0yoqOCvCcIOqO6g/1C9z5DJgJVz1Kp1Gq16vW653ndbvfNmzdUZseqSzQWRVOIy6OYWiqV9vb2yuXy48ePwUjF+wGM4p34uVqt1uv1VqtVLBY5H7FRUtwW9xyLPPQ3KTCCWQyxY9Rfsb1aGfLulfZ9EORgvV7M58aYeL1eLJcEDTeKjWqYmKASBoxWWyK0CthCN1UQ2OI0151DGpvbCP5upOrLTXUXQB5WbZ4IIMFoFvKpvIxGIi3IDlQOKw93ZKKKGtdInzmRKQ0TWwa8Gh0G2FosFsqlTC5rlpnSPCj6i5yz9iQnUhSpitSSvNoRWYlMJV5JODRXk+xvv5XuVaborV1HKs31xx9PjLPOZUPXXQZBuFgEcEwgdRorCZ4gRf/BrMdqg6YE1Ns00VJXLwqFQqlUqtfrtVoNKwOWCxCHsWhooiufI6QGgGRpdoJlomU1s/8hQ3drF9joAvf7Po1tYPEOlO2W8dhGReyNOsVWfSgtlqJ5MNYHbiyHbMNwt93/HTLKu59duny7Gwv+gz3Zdx2L8XbkmgUM1LGyycHwgNwU/qKWNyGvhURvKlEQF0ZmpOujrM1rSxU9Biwp57Qwffpadjg67HjK2mjaGNeIJyKeF2cy46JzWlgWMyMT9DPTeTmK3Wug1iQwrpewd+ObgG+c+pNGjS3s2LmpX5zGjjWD2EnAX1GiE6LUJ6LkNAAxZ5J/BaEYe0FF4kBGS/f569zoyi17Wc+Ny9X4Bz+IDo6CRxJls8YxznLlbJxfaXORtL2hleBw9WYRF0nWMgjMbHYXJ0aToMPZRF/YTS5wkbC2g2ve9PXDMgkQn02EKdZyf9wf9wDx/fE9OzZa33LvRCiMdLRcLqebnrh80/PHSgIt3AowMd6PBA992eB5oXEVoKdm7MpNnV8iPrrzi+wwctCQAEPwAbkuKQzIKADGMTqxdL50QCmqiVib+bAbWqNdZBngZAg3Azrs9XpIztERuV6voUiL9AN5L9UzAHBAiyCXy9XrdaC0NHljfgIAC5gCEAFETuDLQFsD4CwoafS1x3myw5rOXa7rogETHF74EaHFj720IN2wezoIAlAjqTKxWCza7Xav12PDJp4vKGC9Xu/i4gK2VIvF4uzs7M2bN/CkymazuBBQs6vV6uHhYbPZxFfX6/Vnz549ffrU933QQzzPazabQHxgUcUqxd3obI4x/y6O/z/wVo9jiSIZj2UyucGY2BYa4hvXa1ksMMe+m3yxUUjrA83wP9xigv9XLruffmqSubNcLjudDipAoJGicbtUKtFaBzORMKs2GExb1e0I8qyWVQv70MCBdi1HpmGF8pJwnzEdQAuFarkuyUCpFqOO1HVwUQGxUX4OfLfBYNDpdDDIiT9yoKKfnT0E4O2KyHw+x1phiQ/eGVPQazJmGZSCobcLxXZC2KTXcZEMgqDdbuNzyuUyFjqa7GFNxodnMhkQ9GgNivsDXio+h1KDoAih0kaUE+shuUVsXkaNbTQarddriBFROx7fS4tRLvt4EU8f0hBYIdFcwhoVFeTZHbxYLNB6gsvBtwDlxynl83msVLhplNpAHQLrKtU50CuDJRrVSpQGM5kMcVsskjjVXC7HggSI0qj5gdw6m81OTk6g2gyEF5uCbhCBi+l0On348OGDBw/iOL66uhoMBoCDwdQGBNzv9/v9/mg0go4QaoRc24fDYafT0Yx77QJ6S/z3bgtysFrNZrN1FEmiSwvcPM3n0oaW3A3p4KdNINmPzNIpgx+W9NKFtx3nr6MpXRnatljpAjBt6KgFwUVPExJRGNbv1Fetoybd3i43+XE7AOJtNTbesaQTq1Kt5vJZM18W5+tCbuV5QWxKEpdFKiIVlXysRJYiIrEns67zpptrn2XcZexI3Hq4cDKrVitq1BeuO1suw/l8vVistNEcRi8uFtMHfAKS2RFHoRyVLskDkKpWq7VaDU1jWF4k0VfBU+Yw0LLOmHqIHrVBFlsuMKOvFUJ2yh/dOTi3BlXa/cJ6oLr+KpuMUt+psii38IOy9s2Nb0uPtzSBfVuZR+O81tZvkTlYzkFRgb0C7BiwRIE1CGjNIzxfEo31F1m5iS7wYNvC6KIgeBpqTJNy0rNyIzvYOv8/IXx4y7CRFIOYJooo2RIgZqBOQB8iPIwPmWCiyKf7QvC8NHWJQlKaXM+Qj2Wz9JDTgi3pm7+NgL9xtsoWUW/HMbE4sRjPifO5aTbbyWUrq1WlGx048/haqMFPkFyQfGNFH9bQMJm8sXoM8fbo3Ch5Cif1Jy0xIYowqzFofmmYiA4TII4UfloSWUq8lmBgeiNvfOm6K3FMXGtFxVownYuYte8bx7hh6Fj9EJI01kjK5tGyaLaqUNYqdO1CPJ/PlksDI987j3InYQSDLAzofK22OSDFTlIWdUWWyc28N6m7P+4B4vvj+44US9IATpcGRN65XK7ZbJJtodNCZjvcibWRl7V2Y3vGfjkYDKrV6vn5+dnZGQ3T2DyLBIB9fKKYfUiquZ0ju0YbJkAZSTQ9rdovXqRDETZsbCH8fG0ux0sA7Es3OfQxASDQMh00FZFEmoOJ32w2IywLBJNYsDEGCTlQDyZy3N5oR4bkkJIROoOixitPD9Azbia5dev1ejAYnJ2dAVhxXRf4Dshu4PQBM6JRHlAVvAgXNbp/sE0PQRt+wJuRveMrMJAADsJqDyqig8EAdCSIk3a7XTCyATDh8YGavbe3h7bxfr8vIg8fPvzss89gWAcI0nGcg4ODcrkMBh+dTHSm8a6CCXJT+Ost8rvtrzs/6gO8567kjj/0SnIzxwOECu4hOoLht4YKPzIBtPqu1+vhcAiJVctWiLkiqfGEVjcCxEwINRHPygR4hjoM5a8Dqh6NRii6QFQXUJqIAC8GE/Py8hKwRafTmUwmgAuz2SyMy8iyR2nn9PQUkCjwSupa4sBIZgkNXwQYAuU0zot0g+Td8GIKEWD+IrNFIyfyK13z018KUQgo4ZbLZarJaxyKdjRYN9gnDtQGnEdUBxnZA4jRWRwrgliU+NxxKyCajGxTQ2xyk2yixxJQe9/3AYhDawKe9cAUKEqrU1CMB/jUgf00nU5J9ya5GBZ2gBe1MRH9JLFb4Re9hGIPZjq+UWsZYyPGkOAirOWeAawDvAa2ns/nsQuQ+4zNYrFYOI5Tq9X29/exqNLCjo8VPCxcF7YD9JRogjwKq3idN9nSlfrg6LDE8XK5nEynmfXagBN005xKr/Oa1E80gagrh6geb1qDmC3nJLhZOlGynRGp29t3dD/oqEmLQrDPmg9aNikqakFVItFYJbS36jZgbiNXy8rM06adGNVAhyvVSrVWrdfy+ayTXRSmQTG39LylSEkEAHFVRBJnnkAkuMYXwpmZTcx87MhYROKgFJ6MZThZTWdzz0xn83A2Wy8WwXK5iqJQqwTQrW4wGMC9AHEpmPgY8JI0gYnihkOGpdlsQoMbZSStNsuD7mpck3G9bIG3aGscThhjAsWV3yeBIy1gormuGDlsCNBPc5sA8QfBiDUuYx0bG5s2/mABdhZWS9NprY6tuwQoTIy9G22FWN+0222avGI16BCWoqIdBwOnqm4PwrnxSpmtoAjKpWNjK9tGgFj/Na1+m14/N7rvvmc14oNUNdKIKhvFwFbh/sKSDHMKre+PR4AURpRGENk/aMJggw4yDl3m4UqrYfptOsL6EqwIM+0caNXSLAlpPcxuzkFz3apnYt9b5zNzkUneWXjrUGaxrEQySuLWU9oOhHGjmxZ28U16r2wnEWsGsdmCDnsKIDbJd0XqNDRA7CSKCmkGcVYkL1ISWUg8N0FsgrnIVIyRKBeNlrKOQ9cR1xVjXMc1brSLic8t1bqZ1rpkhVtvxazn89licUcGcazQXjfBgt0EESbJOk5EJzSgjNMP1F29P+6Pe4D4/vi+HGxm1J4nyDn39/d93+90OmEYHh4ePnr0aDqd5vN5aMhin9YbqtbqtagoOlagV8/r169F5Pnz52dnZ81mE8KX9EnH4k42LmMmEDpApIISBQ5ix+gUhqCEzv2AfRSLxUajgbbcfD4P1IbgC96DLAgQBuI8UQSf9Xo9Ho+Ba/DuaaIB4h4qL6O3+vLystfrAcYF+4lwOYAz3DTkM+BtkcwLTiV4l3AZQsSMkHSxWIDei1tnjEFWA2pwq9UCiRjudqPR6MWLF6D0glaDDnFt7AD8Hd+O+yyJcCeSJTZKk0SGAj7wmlKphPwW0HCpVKrVamhMbrfbuEsAGiA2MplMfvvb3/Z6PdCZcdNIoTo8PPz4448/++yzZrMJM7pMJvPkyZNPPvmkUCgASu52u4vFYn9/v1gsIjfQptUfhB8xM2adNKkhMwvDMIpjxxjIPjiJOMNbm3VjnIQ9ep2yGiM3XW50oJk2nHGo9pCiY+zODTZeNUOn69hv06/fPT2IY5nPZbGQlLMzngiUVVAmATzKPBaGdc1mE4kctG4J1+q0XJssbctMmKdh/JD1b9k30dlcZ9ekeQJ0wJRB8Qkjlh417Xb76uoKzfjtdhvzGpoqqLIMh0PP84bDIcpRSHuGw+HFxQXow5Q/1uklch4AQESvwM8FAotprtoV7+5Lk/ZJB3wJZ8hKpYLuAULSyJCxDrBF4/Ly8uzsDOsq7CJp+IbyErBU8G15XRT3wD6CbJAPHS0OaAKgyyjqUjAFwhbgeV6tVjs4OKjVakEQdLtd0rexcJFETP0c3G1tRwa0l8oS0MgmZQkMJkIVWPBZNgNISjwX2xO1p/EJhJawkekZqv39UOXS/4RvYaFRt6GwmAqqsoicnZ2t12vA+q1WSxIte8Ll+MDBYHB+fg4JjvF4jDYafC+eF7AVcMDZCoMhoSWMdGONKJPD34cAMY8gCBbzRRhFJgERWATSEi6aAMjYgMUPnrwuBnO4soqgPZS4lVtYg4UY6iLK7vtgrfycxdSv5C6gq0GUMcGt0Fo0XM3wmDYSaXdgTBZcpS3a5GbHPcOqUqlcKVcqlXwh67iZfGFRyE59xzGSFymKlBIGMchuS6VQWRKZSjxHIm3CTLyS9TxYzGZTXyaLRTSfR4tFoEWlWR9aLBaj0QjqK2ja4MRBHKKpZLSkg/R2q9UCdxhIE99GdBh8eSxWumhHiJBcbOLCGFpYBlfrtVmv49ugD++yZG8cdWmQUW9nOCWA4Bv5tttYqxsBl20vSsrrFZOI95NzSg/FbSiwNXn1qkKvSG1HaXGluTsQEgIFAdlEOorghqsLz2nHae6wFIvTA4MnSUoElhRU0QCAMonYyB3eUafZuGikAcqNq8odHYZ3KoHcDR1OnxtmpbYKp/A3vhrTnGlgoVBAOIFpizInDnbnYAFkPMkHoVd1npuuq21cFa1BvrGgbg1da+W3nCc0p/XmpDZixDjGOGJEZC2yFJmZ66UySpi8lCzwErpulLxiNgHEOmnR0LDcpA9bkPFtGMQbAeIoAYjxRwPEgLlzInn13xVc7IxkjeM7jucaI0YcxxjHiOPE2gDAKuFoD9htAuvWSkUTgsVyuVgsJElm78J5AUCMlSwUyST33JNrTH+t7nl8E8d37+nD98c9QHx/fD8PizyCnBzCiOBDjcdj2KCPRiP0FJPKaukRa2k/yz5blPELmEq9Xk9E3rx5AzlLz/Poa0TKEpFH/CJ7lNAOPJ1OkZNDRxIwBHp1G40GMmF2j+Zyuf39/ePj41artbe3hyx6Pp+z+R24LaSW9/f3q9UqKtjsqgb2N5lMYBgFJIU0AfyVwgsk0vZ6vbOzM1jSU4NYRNDqiEyj0+ng2pvNpud5lUoFEhzUeUQKBA4vjJUXiwXlHcAOw8Uis2XyWS6XQaxut9uAhs/Pz8vl8t7e3v7+fqVSAb+PPCZA1eCyIfiWxMsblE+iEhZdejweQ3K0XC5T+wKxGhAcBHadTgc3BwB9GIZff/31F198gSdIZjqA6Uaj8aMf/eiv/uqvgA632+12u723t/f5558/efIE5l2TyeTly5coXeAXWVGQTeKY7xbpxrGITIz5/9VqXz548PHTp416fbla9brdi8vL2WyW8f1VEMA2sNlorNfri8vLi4uLYLmsVKsnJyeHR0fVSsXzvGwuVy6VKtWqiMxns+lshnD22n1ltVosFu1OZzgYxCLFYhGjFFluLpt1k3seJf3RCJGiZN4Bj4YDNeJW5Fth0q9XLpebzWalUtHddnEcC+yVKcB9l0xWZDiU//v/lv/n/5EE50ovL1gHQCnFmOE/YdlB8kAzqLSJjVbq3JYj6YVINrlbIOgkscjCQTCzgBXiwBIHhQTQZheLxZs3b66urpCFoiBBZA1LFhj6wCVp8IWlAzUYLXzMOU5pS9wTABZw6QQYrXmaG8lEu/vfZYtVNImTAMfz+fzR0RGI3mDnAQLWzF9IhbTb7efPn89mM0xnFpNKpRJ0KorFItpBwEvFSoJ3Qkt0Mpnw2/GxuI0UVcDzYmmtUqmwkQXea9VqFXLqbDOH+gS2iXw+jz0Ly6OFFOBBULKAvCG8QioxN7jJZLJarTBKW60WslZcMsFlnW1qAjWeLxVUufiDrQZxfAJPMCDlpxFn4faBtBnNH8Ph8OzsrNVqHR0dHR8fV6vVq6srDWPhIeJ32+02JiB1h1EiHY/Hp6enMEKETHwYhqi2ggtvtfRqaya22uip907j8DtLdOv1erlaRhKbxK7K8q+3JEQ5lQgkiRJSkES3l0VxDRqSTIoxplfLdKPrRqKl7FQ3YrVbq+jgzRD0YLsSbziRa0ZHCA+4g2DH1L5baS2CbSD1bnRJFwAwngvFQqFYKBYKhawTOblcPudlPTd03iIChQQ+CBJoIJcQypYisUhWTBxnaqGXX4ozXa8ny8V0uZDlUpbLMAzXcfy2l18SqSJ0bGDRwGQX1ZNOWIH833w+r6W3AZtajwxbD1mN2s2CYCJripqySnR4uVyu49h7l+bl3Xvrbt1qjYxo5IsUAWpiXFObk0qDhTBaFyU3ucZpsqS1q1q6nwgaNR9f12X1XNAQsP4oa2enWARcrBHYIxfgG7CyobmHJGKGmqxWMnwlM1S7K3O6WSeGtj8sm6wWLBYLDCS2IWotAmzZ6OQol8soQGLH3Ia2WxX6HWZceqqyHrnDafAOBeMb9f73xog3AqlYxHSVl3Mcz4I1Yzw1UV6ReBbUwYd0FV5HOQRbOcJdru1pY0nrhqfv4cbqmrWwW4xva7Tr+5neYtS/e2GcWa+zwTIbzDLxXCQQWSd2Z85NZVtL52G3oITcBIVNSmJCo8MWUpwGiM0mQ7w4QU5dpX1BOJt//GTlD0QiMWvJViRfEj/rOCDkGsdxxDji3Lyfer2ydt7vxIh1x2GQ1IolUS66C4pG20Ci875IoIwEQ2VhBzbx/CbKf48R3x/3APH98T3FiGntitQC1FpoX85ms1evXoG/uVgsMplMpVLBAk2dBO3Di+zXIgUwxeI+DXAWQCctR0lkI18AbFY22AKYwLqvOzSJYyJERgcThRThBXR0dHRycgKAG15AFuEUiTSK26VSSeuOUU4BTY6wRABwjJwNhDJEKgCL4ziGxTaybrxOoAQZDvi/w+FQm90HQVCr1QBS6NI3011gBGh2w/UC10alnaFwGIb9fh9I+uXl5cXFBQLck5OT/f39UqlEAT5E9vR3tpzWuRnzRtFuAt+SyWTgFwd2IUI6Uf37gGYIoOBbptPp+fk56gS4b0zvoYD885///Ac/+EG9Xgck9+LFi8Vi8fDhw08//fTw8DCTyZyfn//Lv/zLy5cv8StUYdZRwrbE+DtKJsYwSg5Evsjl/tfe3uqjjw4OD6eTyVk+/0YkCIJCoQDPsVqtdnR0NJ/Pv5pOX/r+Yr1uFQqf7+9/9PgxgKRSqdRoNPb3940xEBsBoZL23IvF4uLi4uXLlyA/NgqF/VKpVCzW6/VGo4FyArMpnXfFcQwus6S6MjFkjUg2l2s1m8Hx8XpvL5vJWEQqx/cFAPGdM42rK/k//0dSsg8EXID/otuX+qqI3EB8gy8ikgedUG1ko+zg0aRl0C3PJW1Foj8N6TSlcjH7oKkNCZTz8/Nut4sT7nQ6o9EIAA0psahU0V8OkDEXNHxpvV4HUsnglam75j5j1qxWKyKMEBC/jRzk7Tk++sZS93Y2m+Xz+UajUa1WwYMGrI8aHtdhwosYzNYTZ4O2Vs7hKxTexe3V1l5YFdP8QT5QlKDQpgCMAMtOqVSqVqsEXrECk3nEmhbwIN4BKtI4jgMheGwBQHJhyoe6BehgtMxCJwquzhgDYQd2NOMHVj7wNt1rguVaRIAXk3+HYQMFHhR1sJBypwNswSZcTCg002DnghkX1FpIecagoqMpvgsA+nK5PD097ff7KNlCRIV1R5S+CJFo+3jcHL0pfCcwaiXb74QRR1EURpEThkYBW99Z897GyNPfvtEGnUpT7+qT+a5x17YOWb1/EbCgDLdGrvX9ZBSnWe3pM99IIpbvMhN7K9zsup7ruo7ruAYwjDFGHGM3Mqftj4AXJG4/biZ2vbXjBEaCOFpHkYkihzua3JR40tZwODQobD167iCYv+wJ2IZkaUFqC/Xb6GZmmwreWq6Bt37bAp7moVtutLrVT5cWCK4BvJakP0O37W/0VbNmUxqeZti5bd7p+WIVXSz1XuuH9NC1qlBsPwIQTy0Ryjuwd4cAMbByhMe0XybVgwCxVpTWPpZacAmrMRslXdcFN1mr6GoXARTteAnYerhOaqu0tOiHKEW72yyG+kltFCz+00kt00OFLVBpUrxWK9L1M5KN8LAIlMNA1VUHgUWrbyw9wtMr//tc6TbbtE2z+/qPGBHjRLEbhW4YOHForotqUQJKOglZVW4BB7/b6W75+Q6fYL7rj5Os/Bkxjrh+7HrxtV23eftBGxeWjUQf23l7ezqgVznBrLnDlS4THQkAwdCXgIASPOiW6nMzIrMEPQdYvFAQ8/1xf9wDxPfH9wsd1iEvAi9KKCDw+uUvf/ntt98ii0azHkJznc9rlzbWAC2agKhWEXQoj0YjpPH4dsAHWkAQWT0Rz8lkwg8BkguoC0GDtqXG1/m+D54sivnAZHu93uvXrzudDvoW5/N5Nput1WpAQ2i1RKycSg7T6bTdbvf7fcI6iHIymQzgQmAZCDdXq9XLly/7/T7YwVQixnva7TY+EKYrhJB83282mycnJ9Vq1VJ1xNNBbzWUKEB5RhAM/gvgGACOo9Ho5cuXcHQB8wLKIUdHR0CHGacSZ89kMlq/lfsxbjIQK/o/EIj0PG9vbw+Qn+7c5ysI5gqFQiaTgShtp9PpdrsvXrwYDAaI6sj4aDabgPJ/+tOfVioVeNk9f/58OBweHh4+efLk+Pi4XC5HUfQv//Iv//W//tcXL158/vnnYRgCBKeitNUK/W5B7U1agee6SAVMGMbrtRPHhWzWKxYrlcrQ900U5XzfdxzAihKGrjEZx/GM0dlxxnUzIKPl8yaKVpkMDdniXG6dz3vGLKbTfr8/n8+vzs977XY+n0eHbL1eB1BIEfB0LsHnrlMmDI9yuezGcSGbzbhuPp934thNUGbX8zxj3HcPjm/ADXFswjD9ETBIrFQqFGMRkeVyCTUA0H8oKQ4EuVAo6Cj/ncJ3LjjartrKwcic0nwlrAmAR6GDjC6Hi4uLTqezXC77/f7l5WW/36fuDUlqlUqFlEPMfebqBFKxRJC5D9kEKE6Ap4wkh7gwlA1ns5mI7O3tgYm80aPj9rjVRmxdm8OgfDWZTGq1WqFQKJVK3W6Xct4addJRO2FuUb5bLDuheEY0h5AWBW0BEOv6EwmqGjKDdINGzznAsDoBGIWcMdUJ9TcC5qAN+nXtJwggDAIICaAbliw8AhYt8AOxDIK/eAUgMp4IXUb5RVjcSG7CpwEgFpHJZBKpA70s0Gcnw3EjosfToG4mJCNAl65UKqAhc8Bg38HIRzsIVFCurq5Q+cCo5oaOk8Hr1ADRe+KOWsVu/PfOLosbh/rGrvmNwqYWWzbdOG8l9t/ZdH9nKGHbzdET3CKd6XWMohNaMDdtEXabM0yL9aflUC1kx0FPMP4n0E1K9SzLTUpaup05llhMEHqLZWax8P2sE0WRkciYyJjYiJFY4ljSNmUbT5JnqD2pXCXxlFY84xVpSYSNJUmLbKt5iG9v3Z0G8MaW/I2Gcpo9CvSTkrhss0CBkxMZ2yuFGujNuEOMeKNaLqWWaUa6rehioTYbMVBrX9aMZjJ58TY2dqzUwZuPUAecAPaN8atRD6CgAV2gSW6gXBjrefqTsSnjqzWwztIaeCe60I6BpL0TcLsIEOMVKldwd7AeblofZuNyYUkqfygF4Q9+pGefpFjGGx0L02vsDv71xhJOumy5cUewMtP3v4fWZ25aV/GKRJHEkRgTu26UyQTZzNpxHeOJ+Abk08iXyDWRmDi+qSYRvyPSaW73olGwZhoFtmQr4pR+haTkLDb+ccVxjeOKMfgIJBDxnUfXxpGfljj/AHYsYfJf2NDlRRaJmgTY0861I+v1luCLLEU8kelNjY774/64B4jvj+8dTAyYAIwqOvOiQ7bb7fq+DyswOEqh5VmrInKlJudLE4e1QhySTIR3oNQBDkabLdAiwLLgW1EDjjk5kSCIfqKnG2k8GtOo0gjewXQ6HQ6H7Xbb9330KqKv9ttvv+12u6VS6cmTJ+ClQiHL6kGbz+dXV1edTgfMLB0y4qImk0mhUADvrFqtiki/32+323gzPgH3CuKPkO8cDAYIbfFduPm+7+/t7T158qRUKml/bQgOVKvVo6MjwNmU9dS8vPV63el0oGtxdXWFK2o2m2ANV6tVEB9wr4jmS9LKCiwGETMb+gC4g0mHOHiaQJmO41QqlUKhAGSWPAsCRoAtWO3vdrtv3rwBcj0YDICeM7w7Ojr6d//u3/37f//va7Vap9N59epVt9vt9/uz2axer3/00Uci8uLFi5OTk0Kh8Ktf/ep//+//XSgUTk5OOp3Or3/969evX+ss4jZoxbb5oP+GWQB4BZcJHQ92fBOjIdinqTT0zeCL2WwWQ4K90pRPrdVqtOybzWbtdvubb74hNxwcTGQ79OzS/h6z2Qz0drAUq9Uquh1LpRI0u4FzWdJ4BN3S7XXfCchGURQHgbNeZzYFcPl8HhxqQG9kdHKAabgNrH8L6bCgmW0ifZbEjcYBMQHlpkgFc35Y5wGrnc1mvV7v9PQUP0AAB1g2+1s9z6vX681ms1wul8vler0O1A+iCsDUZrPZYDAA+5itpuVyudFowNItCIJer4d1AxAh4DwA6GjUAMqMeQpsGjknLpNOLHcD17RSHoF1QAlgc6MvAeeP1wFYA1cV1S0BlB+rE9FhzBdsKBALIkKBm4lVAiUuiOTo1ges9hjtpVIJ8g6j0ejq6gpPlhIWwDpzuRyKKNgvCA1gJ7I46ay3kZWG2iRGKW47OcioWKDfBVoQGKJ65cQSTZs+gBelUqnZbOZyOdw6zkrqFJNPjcIbfmA7Dt4/m80wqHj/i8VitVrFA2JZgqxJPCmUcqvVahAEw+GQOzs+AXAPlnFWKbYZlJGOzWorhMI1XiYpbv5tMOJ3HLdRHIdR7DqbAE0uR1rcWaOKRJ0sPFEv0Rsdb9iQ/rYrOEGXLGXJbbnrDgQhDfuSS451kp22orQUsFSCLc7aKioN3PvSp2EhKWl4Xd9DfikjNxDhsT5fi294vuc7XuB5nuP4rlmba93JvEg+SaSXItnkD83usyKRxLGsxB1Mim+uWn602q+EGX9szMJzozA0EjsiIIuHVJUFZkd2p167WJdioxJUbtBWxYWOmwKfLCrr2n7Z2jVQ7dOVbwbJ2iPx+iF+CHb5tuKfnqFEh3V/Hn26sOiBYMtLYJVuG/Rs4bxasp/9c9uY+7sJ0TaVb3s4wa+gyhxpIlSMofY0AWJepn6slA2B4AP5ECwJsMCp7S6xeo/HY1FNRRp2xLpdLBZxPgxXqITA38LWJonCO74Up8H9KI1mbqz+bqwZyIcykPigWHB6IFmGw0ysOBjQ9GCNMUvMh80T4OLQwYVhJHsLGMyQuL0dqI0to3WtIKxli94VF95W4OFmBKpJuHbCUBx3XSpPD476bqYYxTk377p547iyjpzJ0h2vvEnoB4Ejjoi/SW749hix2Y7k6kqexojT5GXrBLR4MYUU2C/CrhE/+cGI8Y2blWxOfD82EsexA6DcqohsZD+k1SR0xMK/Wr0REUbanRdnXyRMZKAzIotEawJIcaDg4HWCukFFep3cosy9Sd39cQ8Q3x/fZ3Q4HSlqAT5EbJDRRPpdq9UQpWmAWEd71t4sivnCdZwG2ehWXiwWoGIB1RqNRlDA5GaPNIAqhIADECsjLEP+xngFdvNsiYWDB83NkXLQoRtCkFqogV7wNHkDisQuNjrgUSIDyAXQQ3ZBMnAH1A7buqurK1hykc7Abr6rqysI9RaLReBQMG1oNBqw5CaazA53qkxOJpNXr159++23g8EARnD1en1/f39/f5+Nlny4ektm/okolt4viLk1ggNyCtJRhMuA1JHZgkeJ32WpACcchiGUW4GLkWhJIvbJyckPf/jDBw8eAOZ+/fp1r9dDb/7Dhw9hand5eQlt5X6/Px6P9/f3W61Wp9M5PT0F1qYZjh8kbobCL9J1msVPp9PBYDAejylvqtU5NaVLx52SNDniVhMSQmhbKpU4yLPZLJ7mYDBot9sY8IyB6LHObIpAs+d51WoVaq0o5yCNYcMyxi2fOKsv74QOs+t8tVqFy6W3WvlxbBgrM7jyfczl2WzGc6CYOF1cNE1VLxcWy8OC/tOnxH/ixCRIJClCsSRNCb1eD5IRaLR/9erVYDC4vLyEAR2ATiY5pVLp0aNHDx8+rNfrsHnEZ6JxlSIwjUaDQjRYWKiHjruNyg3bArhkMfP0fX8wGJyenhIgxvPlc3yn57UjpdGpCwcwBiEWMUAMqH5xmRJF2cYb6KtGsVSAlVomCGsCmidA9eUAYGYI2BTCGsViESLm0JCBogtVGkANw+eDgY6CDUZdrVaDcRPlJiwAiH6b+JV8Po+Lwj6CJw6gvNfrffHFF2EYNhoNNHBQNRuTEZUzluiAVmDqYaOZz+cUwcQAoOI28HHmqJlM5vDwEPobl5eXqGXi1uVyOZiLQoERCDL2HYB3aJGhbDSk4VkIQRkVGD1UbjTOxTKYTuw1xIMtCQ1G+kJYTr4b+Hu7sRpG4To0rsUR06AVBzCJz/pxaAjbajbnxNTGZbQixKapU1B6Hmrg2Gpq3gYupFmWotqqsCwTCtR4GZmMeLKIZ7AFL5fLTCYD7RFeLKvOaSX3jRTsbSAy7gnmWrVarVarpVK5WCoWCrl81qwlm8nnvJznxI4UjBRFKiKVRJlRRFYiy0RYc5zoNuZEIrNw/ItRNZi747730cHqoDkt5pdRvA5DLww9ERNFYRCsUcjv9XrY7lFVZXAiiXMGghAspJlMBi0F9Xqd3nTU5cAvsoYEEBlLlhUOkZOLEheHEMUcrjcX5bTxYVG2bW/Q2JkltGoBUtp/9W7fvhGOfM+P2sH7s6DkjYieJTVOJAi7LQct+0IwYTkdGJ5xKWBkQmzRUZ7D3OOw72BHY6yervRYN9+krIn1rNxhdLntfv6ejEDfq6SxaXHjjs8aKrXduWVw9UYueS3qvV4jBqDbLQJm/DoNKjklraUeS5+OJ/VY2liq3C3yQ6LMxhj4O5+INWKNMbC1XgXi+eJ5q0ZjkM2dPni4ymRKuVImV3Q9z0xm3pur/LfnxTcdJ1g4IiKZTUrE8SY94m1SD5QYTtvTOcqkLk7eE6U4xZrFjPUySCp/TmJSF4rkRJaJ+jz+FETWIqGYgjh58bLGc8GmDqNIouTJbKt2bNxnb7h536y5siMhCIJ1EARBYND2dAdgHdh3RiRIrlrjv7G6vVFyJ3Hf1ve48P1xDxDfH/8mAGLqFUqih0U8C4w/dK+fnp5CCrbVagFeYfqqa7+iiHs6FyJ8QPgVeEQcx1dXV6vVql6vP378GIKS3LNFKcohPhMRMjvQ8wWQAvkbkBqyD7TVCQKL8Xjc7XbH4zHkhulkAtIxAko2Hg6HQ/BYkWN3u114K9EnASxm4BQgfCF1B+qHjLrT6VxdXZ2enrbbbbLn5GbbncatoHQMxhYinnw+v7e3V6/XRYT2WQi2KJna7/dPT0/BzK3Vao8ePTo6OgJKCL8mLc+n1d+YPCMZhrUdsTyy3sbjMWl3rVaLhFaNuUCLDaYiOE+EaBB0A30bNx/7N1Dmw8PDR48e/dmf/dn+/j4g0bOzs7Ozs26322w2W60WpHhPTk4guQCoPY7jvb29Uqn0i1/84sWLF2COb0uA3ynmfVtwBjKoEHzNaGg2mwAKFTtA5CZD06qaaA8cwHCkUcB/A5Ex6JDz+RxQI5NS6q5g1hA7IHxZrVZxT3Bi4HUiT9bO0azr3F78zrqrlJFdd7vV+bwQx0YkhrdYHDvJNWKQ8HvJfSbnS0sHILW74eAXBFwELJbiNr6S5oBo+jCfAqVUqasAvjbQ4fPzc1CTABoCMMrn8yCaQcW70WgANEGvAxZP7XgDHIfPhSkrphLoXVZiT3uc1WqFJRdaAUCCQPNk4W2jzMgdAGLmQlg/kaFRTJnvZJWLVT1JPN9FBFAL6VFseQb0SbNNTYrURCpgMeRY0f8dySRWJEg9UPOdswAUWi3LSF0FlhVZldzADvF9Mo5RbqERKCUsMRkLhQJWs+l0mhZ4pVgzS5isg1K9V8uG6t52ZrAsHaHGBnwK18sJQp9JUbKwyL1R1aM8tKYNci7gJmhfPp0eaz8ATiU+UGwHWgCBVNNt6feHOgD8xnLNILYoYzoDJ6j3Vod9vWaTijapo34IMQsLNabJJHFzXZnDgyaWZCELO26IJilbhE3tiEi1LqsLHjVsDDZcMmoPcDLAo9cnYJ3Pd7ZRW8bxWLVKpVKtVgNAXC6Xi8VSvpDJ+yaI/Vwu5+U8ExspiJRESiLFJDGORFYiK5FQZC0yFlmLuNeZ9mrp9sal6Sg7n8SyHq7DyV5l6rrzIJwDkAnX4WK5nkzmo9G41+sNh0NaUHC+43lB6odEUay9rJIiRGGsQhUCcIcpUGvpDrHDgKCVKI1axpZQx6bEwfuH4t8ZqIvq3Ym2S3LvYAffPihKt/Js6+B5J9R4hwPbRv2QjdULS/hIg7+6csPbhfXKmqQbOyE04xXcC84jbamHWBeLJLdFXSdL4/Waof9OUuy7nSTTRd8/AkiceoExKmo2WGxJ1Sewi3uiBUOgp8/4kB0VKKVro058vsbrEZCke0es7ha9J25U99aRz8a7uk3ja4fVJ8ZMEg/A+TD2/VWpNKzWjJeZl4vVUqVQKrm+L/1hJuNXByPv4qog6N3KJ0oF2/i82yBOSx1e1CtaIN5L8E0NAUc3YWiNEeNkMomsvJO8GIqsRHJJdXCVmO9FEkcS5mQZmeHYDEbGd2InQe+N0iNOC4Ok16J06w9/hRbHtDlZLhYm2RbvRBFK7tg6USLOiKxF4oQv7CSEYnPz9kpSJb03qbs/7gHi++P7ixHr4pvePpkpUVsT3jXgZ3GltghEmgijSUlItpGJoUG4UqlUq1VI6y4Wi729vWazibAMnb90ebK4Zkh0R6MRgznIOKC3C6xJHQLqljGk+tTzBUu3VCpFUQTeLvV81+t1v9+/urqCR1+v1+t0OmCqwrACIA7b+sCkY7wCuz/AnWANg4hHQigjS6unjFAgnPEWi0W1Wm02m2ippsQzoITBYHBxcUFDvFKpdHx8XKvVHj58SE0JiyvBMFdjc7qEjjsAvCaXy4VhCFzYGAPHKhT5EdtpqThJpKgJ8ePmA0yE/AWUkRH85fP54+PjH//4x5988snR0VEcx99++y1uOB5opVJ5/Pjxw4cPoc68v78fRdEXX3zRbrcPDg6ePn3qOM7XX3/98uVL9FC/Z8+dgYWECiYcxzGJiAQuEFWBYrFYr9eLxWIURRBs5SWzXmIxCCSRqyNOQQoe2IhALQHf4FfIsyYVkU15jInZelwoFOr1erVaReWjXC4DkQT9nPR2rTQtSlmCiM9uHAHETOD44/E4are92ayeXOx6vXYTgJjMOMAxmKe5XA46BszuyLXBuGJ+TkFe3DHLcHxjepJGXdM+dXgdGrjdbvfi4uLFixdQH766ugIyWy6XqamSzWYrlUqlUkF6A748oXzd78xLBvKoV0iAywB3ZrPZaDQi9KObFYBKYAVAIzkeH+E/LVryniRi/UAxwUej0XA4LBaLxBY14GgRsdn93Wg0gOoif6PwJZ4pDYWQ4KHpGxoa7IAWkWw2C/3cRqPBxJIwJf4VeSZIheg2xVrNdcb3fQwYktMJaOqUD4ME7GA8LNKUIC1NMzd8+N7eHvWFkb6icqCLPeAtNhqNXC63Wq2wqUlKWJbdGNoJDbcaQhlYKtFvkc1mq9Uqim1QLKF9kybw4mc6nQLFHo1GKMJRLSqfz7PRBGuIpRGJcajTZsL0gLzxRdTb2djjfBdJn1sAxOE6EOPFseieYi04oA0/WUsjdqCnP1vRNWahC9hkupEsrBuQdcWLYL2lAmwpWlhAvEU3thJgFgkIECPU0UJbkug+oSYNtRA4JdIcwgqWLF3jbdiOJWiA5Q68dVQcS6VSsZDP5/ycZ1axn8lnvKxnxLnWlyiI+AosCG4CxOjVXYtEEk2d1cJZTdx4XMvIYRQtZ9NFPjt2Tc+YhZFotZLZPB6PF6PRrN8fTKaTxXyOahPPnOgwfDURLoJQj/4Dovz5fB4+DZyGqJji0evhxPUQJsxaX0iXykjOXa/X8XL5QQDibcCubDIL0fIL3HrSqs2at6FbsNPU4O8sHuwOCawPsT4w3dGlHepI/9eUeav2YylBi5IK4Var5y+tNbRaGhFDnR1Yl8CIBaNF05P5xNlaxF5DEB1Q1+fBOF9X4Lg3WbfCainYiL9vJECkobQ/KDi8ZaiwoRAAMTZNsvUxhhHhI4lAPEa9KVovMPxDI5GuxJOJzBnKTBPEFNJTmGSRPWDxuNPWedwHNaC/gzW87SHqogJP0nEcY1zfD/P5lZ+dlIpRqbSs1la1SqlSdjO+yWdzF5dezlTNIpapiHO9bF7DkaKQ4t0wMcFKLTGRZhATJnZu0oTTnGVJAcSBSPYmQBwkpcG8yOqaOwy4ee1Lb2K+eeHUfWd1FFXKcSYXua4RMXFscFN1lrptebGKsuloFrPv2nt5PndmsyiK3LuN70KCBesR7215M+Qm9FH4o5nU/d3f/d0dfusXv/jFf/pP/+keFrsHiO+P+8OO8zSVmF5M+XweEBViI8gjoONPr9eyheXHgA/wED62Xq9TVJf7aKvVWi6X33zzzXg8BkNWkhZm3c7MIADuUvV6HVAp0GFQKREjEn6iQBW+vVar8W04IOxbqVQAdqAtdzwet9ttCOZCVYDEK0AeQCXYujsYDHQosF6vB4MBFIGRwGezWXKasLfxzlh1USTzICZD1Xc8Hler1Y8++qjRaOB6EWOdnZ19+eWXl5eXnuf9+Mc/fvbs2d7eHpqOEfGQQKd7ndiRSpkLpBxIdwFOQT4Vesd4ZJTL7Pf7w+EQ4oC0N0QMBzohonZoXxJPPD09ffPmDYaNMaZUKn366aeffvrp559/Dk761dXVl19+iZsMJPrk5OSzzz779NNPC4UCxtV0Ov3nf/7n4XD4ox/96NmzZ8vl8vT0tNfrscdQMwrfFa0wN9FhETGO4ya0BXAY6YsFtBpWhBiilrqrTuowJIBKAGPVcmnQItDMd6uVkq3TuCLNv+CZQykFITgqH/gZZnHFYhGh+Xw+J1StG/E0GXlHpgF0td1uX15ezmYz0+vtLRYMIKMoMjfZatS1wNzE5WuZYGYUmIkAREA5R78/iSEbAWIGhfzYjY5GmiIEtRM0B7x58+Z3v/sdChLGmAcPHoAuB/SfNmjQBKeeODNShq1YkawnxSS2XC5XKhXUAHAClFkkZ59asVQXHQ6HgIbZPk9KLLOvO5RAeMJaaxJGmu12G+LIWKbG4zFk03GeOpuiqjLgbOrPIAcGUEtjNDwOC9TAr8xms/F47DhOo9GgWA2HDamaEF0BQrRcLtH/gQ5x/FdU2wpBPevadeEK04GjFHcec4oLGtaoWq2GgiieLPo5kMZohBSAFB4WTpsWdtyz8F+qGOEVrAksMeJCqtUqXhmPx1irQV7GBAEIiPMHKoodE3cYWhwUJQcWjwtEoU43xRNiwK0jBQ8QCRcNLCyQacIM1cMJhYHfE4k4CsMwDGLjm+i6959zRwPELEWgzEYSsW7s0JxrQL3abIodM0SBSXnj76JjiTxiLpV62adkqtVTQp7yRk85wv0Y/+wRASaFNR/Ylm6/QDW91WqxqEz3YG1+RfVkC5xKm2JxYLNCjLI92mUqlXKhkM/n3JxvluJnsxkv6zmRudaa9BMYwhfJ7wKIxZc4EgnNbJQ/HR1PF9mrjlRzg0r+he92HRMuV+58EU+ny9lsPpmMF4troTCWV8EUBjq8v79PgFhU5woeFoIZyFDwQTMowvQhEMz2CF1p0Agji7JkrJv5HA/obnCwtbemXbbSwIfu9tBeapzFrB+zEqxriulvuWlCuBnk/c5LsJxULVr9RhkrfRvJ1GYxXqsH4MLZFUR1bG3jqcWyNV9Vx4QUnLGECPghUO/RKi5YW1CoQ1kUf+XKABkWLYqKs8J+jXUDa3gURSymbgQWtcKPbBIATNd4NAb9h8eI41RtiegwSrCIS8nCAeyL7Yx2ysvlcjgcIqNE7oDHxzVKVzQtBXCOZ63Xh9CRv86KPpvnNIyrbS11FY3LIOKxjXDkNhfTtISIJgQ4jhvH4nnearXIBhKGURzHEjuxRHEMi7ogDgtxEMTL6FrMPRAJE4yYyg/RTpKvhRE7ihKr0WEv0Qj2EvQzvvmx8c3nTYDYJGv7OpFiiBRGzD9YO7MSxzIXeXVq/v9Dp/2t9/PPwh/9IH70JCrmnDh2wtBgt7SKWGlHXF3c2qjQzWAADIbJZOLMZmEYuneIT2KRnEiQkIVjkYxInDCI3eQ+iEgkklXOdbjboUj2j6Y18dd//df3oNb9cQ8Q3x8fgLYgKVklJmMkYuCdSD7JqNrBFNDcYVo5IW2uVCp7e3uVSmV/fx9ak8i+vvjiC8KOmjGHAFe7ChCZxR5Pnx+20IL6ijAOeRRFjbXeJdJgKNuCrEfyDjIHxqlaYZNtawhxkCETRkekG4bhcDgEBZhqpBSw470iQ0H3hJLQhBvY6/WARXqeN5lMQKwGpnNxcTEajQDgHh4eQonCKsOy09my4dZFdcDx+AH9pHThQKjN9mf25lMSlMwIZJWFQgGRHEq4w+Hw6urq8vKy1+tRczObzcKOD/rIfDOgYSBxBNoQX47HY1QFzs7OSqXSgwcPyuXyt99+C98knY2/V8vzTYz42rNXUcNEeQpZQKTm6ZCuYrmsMOjUz5rZDvh6WjSTTGEdGWv1PU5YEmrA0KdLDyavZkboVI0Iy7Z+uvQBiigyOoOzZSyqfl/Tfi2pTQIWJOaQy4knjqmqT9vqAt7Ib9JNuJZ5vSjpZM03BPoJxBDs+3q9jvFGdipF8TT4SICY0A9OD+sPlwUsnlj6SIumGgDVDLiqUAgY95mJLssGbIe8Tf/vxhtlqXBchwueh9UJjQhI20ajEQSadRKIdfLBgwcff/xxrVaDgxxWb/wihLmpqep5HqjQq9UKJT3wcIvFIuo9yAyn0ykUtFFhAuEaEA/gV0DVuDnr9Xo4HKKqB2DI4q5uG8acVhxaeBGepf1+n30bnU4nk8l89tlnP/3pT5vNJjseiBNZGSOtivS340Kw4ONxUyjfUkBGWothg+749Xr95s2bbre7Wq3gOYlBiPIGsWyrWYG2inh8g8EA3zIej6E+JJv0E6mEjqsANRXDnsMDYDF7hK0E+PemMhGvwzgIIideGzVtsS9TiRLnj3/ifq0bmzQyyKowBhhFJDRB+NqNLWl90AAx7doAdugdlise8SC9KVDQfwfuZukRa38CQk4Wtos2JuzIqCJYqrhg7hMv00CStYzovgQCxAk0XOGUzGadjG+yoed7vuu6jphrpUpNUvMT27qlyEKkkJi8Byo7iSSMvEm/shxnxuNFzb9sFN7k3NCYcB2ZIJivlvPVahmGa8cR173212VBsVKp1JOjUqnQsxGbKeIQQMPYDVGGEWXLjBI7etspKyxJl4yWkkj3A3G8yXwe3gYgvhlXfOdkSQsvaO481wruCxqisriQ/K8lmGuBXFpDhkr37yRnlNaf3UFuJTqMbAIxv37RAoh1XMRCC0cspycwYoqJa90A66o5r3VRhJGkDkVYAcUcxOrK32JBVJs9wDebNSEUvElz4ZpD7NJak/lfHbTrYMMaSNqx8A8vNLFRu5w6+3SDxCsIbFC/RJEDkT+eOMp1LAVpfQbeBwpeWaU1CiLp+hzddLRikmxxP7NgR9LDqRPFWy0p2eJ0+53WObGU0xHGzOe+6zqOcRwncN1AZBmuXd+X0cisVwvfmRdyy2k2EzomCk0cmGtlWycBZ0MFy0ZKDDfahOpatGINHBMvJkBstggcWxITXvKHsPJaxEukJ/BnlVQEY1lNzeWVLF64o/PYD02rEZ08iD03imInisRKiPQ2lyZxayqbtaRwC75eWBYLdz6/Y5MH3LdBCnaTy6Qpn6vuZ5xURkE3jpPbO7uXmLg/7gHi++N7jhHzB0uIANoCICFyzZXEmsPyldLVP72gZ7PZer1+cnKSzWbn8zls7qDm+fTp01arBYbaZDL59a9/3W63Yb8TBAFYPCQFkIJHUBXwLpr0+/0+aCDgk8LgXlezgVYQaEbOUCgUms1muVwGyol4RW468AIqRcYIhQo2/M7nc6A5oGtRBBCh7WQyAazJUEmUIxBdyFkGJysZKAxps0EQjEaj2Ww2mUyYshKnq9Vqz549e/LkySeffNJsNimLrKvlFANBoINci1kByBcU5QR9mDRPEB9QGEAoDAiDvV1WJoAvmk6nV1dXz58/b7fbL168oOESUtaDg4Nnz54dHh6iLy8IAjA6Hz58WC6XX7x4cXl5ORqNXr9+/fLly2fPnkEAcTgcPn/+/PLy8unTpx9//LHjOC9evLi6utLx+i0TsB0ZTvolwsEsDPR6PUSfGqtl1kEDdDy7+XwOYVnm/4ihdcWbCQ/FQImxkuMJ3CHd0M3YFGOVVBrd0m6FWfqK9INLuxtZN4QYKHAoX7M5MJySX4cIzLVU8XrNCwc8VygUgPRhSMN3HkovqBNQQIB0S90wvo3HwVzCSpZ4i6jdAeW7KIr29vaA/aGhgRwfir1q/h3KPCTiadVCXjWWCBqI4dMwhbWSJstO+XwepF1eI6b//v5+o9GgjjlZ0jyf96etpVv2OK7YyGxNJaxjqPBBEQIXQtiCfFKtVwvS0Gg0wvoGhRYRAS4wGo0WiwUEZ3QOTMokGZS87cTa5NbCMpodrxPCIAja7faXX355dnaG4dHtdi8vLwEiP3r0CNagLA7tSDYsWig6KtjwyMofWboUsIYpJdw7AcZhbT8/Px+Px/l8vtVqocygVf41vRGHZkHiEzAjZrMZXAf10LXgXV4g1zGuPDxt7vhpROP3AhDHsl6Hq1Xgxq4kiR/EdsidJHxGXEkbu+ntj/RhfWj8VzvX8Q2aGEgxd2sR0BCeJVOrHfBEqUykS8LWSsLBhlq4bpbXfEyspdpvzcI4sJhg8BCKIgKooQ19UViuIVsE9h9Qnmwum8m6WU+ya8/3fE9cExoJbqISsPfxEwujjEgukdH0kuwkFlmJLCSauatVdr3aXy8/DuaLrNM1EsZmZeTMSCjxxPdiz3M9L5vN5klLJECs9X94IehqhxgxLeyoy8EGDqDDmBpEWjl9NA9XzxS8gk9YLBbRbPZODOJ0FXaj0Vz6FQ2WUcGAeyKNgsnkYORAQG0j/1GvhxpE06DbDpjYOudtUgkWG1q3smGZwrbIBZkdABqg13ME56NZ/GmJCdpOWn6bmuasORMgDoOWQQFiRAtcQFCdwkKEO09NfGp/AQOl+SG2MLZ8wWYA3846kyUAwu1P+1tYTOE/newxvcnS8Ztq/pihZOqw4QO3lwWAjax5ltXlpjiJ3Gx64M9Uu2KtiFLjOj/lCW/UjtjIr9f/lAaItxkMspCTpNhuGEbGSMYH28Axju84qyjygpXjuTKZieOMm43+g+OccZ1RmJ2F/nohkjHX5TeTyAT7iYaDUagumbzhTS6wxn/1H1rVpQHieAvWbBJbNvyhbDH5yL5a/6Nr5DSay2xmVpfiLcz5cTwax+swNMYVNeotdY40mCBKTkdS7TskfzB8XQdBtF7HdwOIjZJjlgSXF3UHeFucxIVV3yvzx0SH/+Zv/ib94s9+9rP/8l/+y443DAaDe0DsHiC+P+6PW4WtyMegF1wulyeTCWhW3Fz1druxB0dEstlsq9Xa399HMoy+YDTpHxwcNBqN2WwGLSrwQ2ezGaI0QMCIokAGIYcROy5yGHQoZ7NZoKiQcQQTlnKBNGpjqAe2GjoQCQaxDwjRNure9MJm9gXcBAEuLqrb7UJiAuEpkliEkuwZxy8SoqXvE6FYcu5Ybyc1AAk/ZFJpAbFer2u12qeffvqzn/3s888/Pz4+BuiAEyNnwaKJ8T7gGtn7z7ZZpLIWasAXHcepVqvEoLVrEDiSCJQXi8X5+fnz5887nU6/32eYi3rD8fHx4eEhVS9FZDQa9fv9H/zgB5VK5ezsDPoeeOK4RYD+IVLx4MGDk5OTfr//5s2bwWCgOVPvQ6C41iDWtXZjXJU1IV2P4/ji4uLi4gI8a+QzfKwiArgHUrae54FqDSI58gFSJDRvVHu4Wew8Gumwb9GikzAVYXakoV6OInyylhfg5xMd2GFcjmGMWghIMc56LcrJWtuUDQaD09NTVE2QYkkiH0Ejr/F4TPAFpRog6ZhfmuMjqrswHc3zzDXPSMtcyE2fH7aRNhqNvb09tI2XSqW9vT0wJTeifjRM49dZZHycQKlU4oDEAyV6pXVCuGYih6G6NIC8vb29Z8+eHR0ddTqd3/zmNzo35lr0rr5DTLqsgJuAGj6cIJdmQeptQgvpAlhHhQ9rGlU4gOZgVe/3+2gprdVqAHRguRaG4fn5OSTU37x502w2yYv0fR/C4pB0AK2bIpKQin4nqQ12oWoeynw+v7y8/Jd/+Zd//Md/vLq6wqPv9/vdbhck0wcPHjQajUqlYtE8b/O9juPUajVgxCAqosAJHx5jzGg0AjgCxBPX5TgOJKHb7TbWt0wmM5lMqtUq1FRRvdMytVoz0dJbIOVNNrWNay9HVhCpOIxhsFqtsI2yqmEZN/1ej3UYB+swNoGEEXG9NEBMUqdGhy1QCfsdwV92Juk+JAqb8NAS0mQWawlpDRATvGMVGb9LnFFTOzWdTUu46CWOMASXVitV5kVxK9dPh05u5XKZnmxWWYgzQgPE+CtEfoGx5nI5P5PxfT/juxlf/MDzXN8JXROYayeiNE/NSbqY/USw0lHpNGSLCxIHbhhWZouPonnBi2ZGYsfrZ/1f5/2J73VcTxyTyWSLhUIJuvAEiFE2xjrD2wWSONYHVLKtchr7zCDGglmpJZu09K3VtsJXOMXCxSIMQ3mX6shG/e6NeKvV8pXGi/UOjgeN7QmCSBSL5xzfuCpuZFNyRuhYYmOcn8a1ubpag1kDxCybWRIfrE0SoJeburHU/tZy81o+mMJE/FmfgAa7tRQYzhNa+QCIebb0Qshms9CAwphhpyBEfshdxedozRNUiGksyTEMgotm7ltPf5sP4Z/IYVKEDL1UAiLnsqmnoRbL1uJmWrQX0SZmGTIpjklWyyzTOURcunKsPSEs5R/Z5FlniS/pi2LhxBJ2t4IBazZpa19O1TBcGyOZTMa93nGy8/nKGCdcu44j6zAq5ocPj30/47oZ73Wnvlq44cKNSWUlcLlO/ohaby1ysWySEjY3TdXMzVfi1J/0gzeKehwpjFgrVxAvjkRiiT0RI+tIFoEsgngZYgxIHDtx5MSxbPQS1NGUJfRvLV8cVFrlKcYEv9v4DkRckVVyCVGyc7mJNx3vlaveoCUmvD+axMTf//3fv+cb7o97gPj+uD9uxHkaWCFfEhgxKBhIU6FQCf6X3guJGnPt9jyv0WigdxvvBycFFA80FCOtms/ng8FgOBzCmgkIL6mswBSwSbDVlAbxYJ+1Wi10B89ms36/j7ZcwDo0mqA9LtNgdFKTVonQDRKu5XK5Xq+TjUUO6WQyAWsVfI3VagVRLdxGtK4jfCTxmb5Mmt+RJq6SuJHP5ymEqs0xwK+EuF42m3369Olf/dVf/fznPz8+Pi6VSkDPCV6zLK8DFI0La3opE1dQlbHFAs9ibzIeEwV/aW2EOwP1CdAlut0uRYcJDTuOg1LBwcEB+aGZTGY+n08mk0aj8fDhQ3wpjZsODw9h0Hd5efmrX/3qyy+/FBEYOr1+/fr09JTeNRsxzXc6oiiKb/66bgDEjQKdKpvNvnnz5vXr1xio9JUC7gPybLlcpoZAEheGTNqZyUtiHKf9TDSFRCtI4KGTfSzbddB0RmSBmFrVgV2QpF3wJCWldgfcCs3+4Mn6YejcFLU0IuswHAwGr1+/Pjs7w6UBGMVEaLfb0+kUrLdms8miAkwIYbInIhcXF+SM0JJRc7UsWQ/9vOSmCTUTAKuvH65ixIPK5fLDhw9LpRJaRClByHQFYK4FMmpAQZRoHYYxk3MQ8PlAKQ6O2wLtHUq4cMLC6BIiKsxGuEzJnZjy6RZIgIDwD8Q6o7s4rW/BwgJgZb1eAzzC8+VVU9tnuVy+efOm3W5DTpo2fefn56PRCGj7gwcP0P8xnU6/+eabXq93fHz87Nmz/f19z/MWiwXEtev1OgjLRNUtQdXbXLjlWTcej3/1q1/9wz/8w29+85uzszMs11EUQRcoCIJvv/32v//3/x5F0ccff/z48WOI59yew0V9EmMMVgM2FuBOonwShiGojo7jDAYD9E/APtFxnP39/Xq9vre3hwWTc5Pjgax5yjoPBgPwkQFkYCPYaKRmoagYn1CNZK0RGyJkf6BuoYf978OY7uaaLFEYh04kyp6Lxolp/y7Lm0svjJpUSOSLZTbtU5QWprREsdMCL5biPGYQAWJdWdHqOmk7L4sTpx3GSItL1yospic/k3aLIBFje7KCDWth0T376EQhvuN5rud5nu96vnE91zOOExtZO9dakxbXTG52MbuqGVkS4CArUhAJjKyy4fxgPm9IEJlI3FxXCvOM9zLn+BnfOK6bz+coBcYIDa1O2A2xsBMW5CWjIsuRzNAIVRlOEBbDrCVdq1dxR+bzXQVBtFpFt5b3SXdjWAuslpLg7LZqHro2rB8lNjWUAbgHYZpoQn26zLDNUFEbwW3kSGriPA+N1kFfLh1IsPLEOpYWU76B7ySS07pFjPORNpIcsZykxCg3msKJas9KV5gY8rHhCZx01BVyuRzkXJARkL1B9QNQBMh2RwJCt2FShlHGAIOEyKYo9zxLoGOjMdcO+uofMnO0li8+CGqmc4GyMHpRim18yhwAjDSoy0eRGW0dyYWX5GUGyRQWs0j0O6znrA4hvQhr+D4t223dCr0jaKyfiQC7/a4Xk1UQhZEY8byoUokbjbi1J5GbHwe5/jy7XLiSScRwTYIUBwogdpKlda1M7ag4Ed3kCMeb0GHtgBel6gDp+p/cRJZli36Flh7KiinEXiH2MpGYKAyjcC0ibhRH9KnTsY21KFltytpYWy/OlsqcuTNImxVZi2TkWtzDTWSFwdp2lbJHqNB5N8GOfZHRvcTE/XEPEN8f33NoWCPCVoEdKAZaDzKZzJMnTx49erRYLF6+fHl6ekpKo4UjMPeoVqsPHz5sNpvGmPF47Ps+WMNgBNPECfH6crlkZ1Y2m3306FG9Xl+v1+1222o0Y6yP3DWKIsB2zWaz1Wr1ej2o8gHVwgbMwAWqYVB+oFMct3zEozCqAkxZqVTAcQaMgm8HZoqYGAEu49F+vz+ZTIgOaA4Fbq/OHtl8qhGuQqFwcHDwySefHB0dUfiCKr0QmQV6fnx8/OTJk2azCRSSuSIoZizR6yeiiaLa8hXnA0wKEAmVHFerFeI8tIoDqsbNgfYo7gZkkcMwHI/HX3/99atXr0ajETE+2AM+e/asVqsB+Maznkwm7Xbb9/0f//jHhULhxYsX7Xa7UCh8/vnnn3zyyeHhIQjLr169+sd//Mdvv/324ODA87znz5//4he/OD09TYvq3hmw2G1PzMQJioeQV55Op5VKxUrArEySZQyOQNLBwIhhkq/RBy1nyXGCpJ1aDVocTUe3FjLCQcizsjq5dE2I2t/pbBCyDMyobde4hH8dhuFkMhkOhyDDopgED0OYjPV6vfF4jNsI/ZbhcNhqtYrFIqoLoJMzD8fppU3qLD8fJpOS8OVZvtIXjvlFCWDeItoZwVUG30jij8aaNQ2fD4sDhkUgAMRsRE1b+jDxQBe5NnBbrVadTgdyB5ibGy1A77zap30/qCeAU91IcKMdHxV1S6USikYAOsmmx93u9/sXFxeO4xwdHTUajVqtBuJ5r9d7+fJlEAT1ev3hw4cfffRREAQXFxdfffVVr9cbDoe4Y/V6vVqtktSMBSetgXvnYzQa/epXv/of/+N/TCYT4GhY4sizns1mL168AHx/dHQEMeV3utUYAyAjA+lGe8F1fcX3K5VKoVA4PDwsFAqQEzk7O/viiy8uLi5WqxWqJvv7+zDKQ0c27iE3CyqW4NzgIYl5qgFTC9fWgptclzRyQSADCJHWTtEr7UaM6UMGJ8ywbnIn9XSIU8eOushG/e60Sqls8enajcVYTcqakZo+N0shfcc5yyYTpDTTLV0BsqQDrIUd6x5DPgrpXKcQnmeDzmKMMY5xjCOOY4wYs41ilmacxSnaoVGMM8dI7EeRf81EjoIoKkjsizHGxI4j2o6CZOc0j9tyl2ItLd25bEEJaUfTjcCuBaryAd+hSmc9XD1UEKzidU2K17ZalLfS/EdrH+fEJ+/S6oinYA63HnIg5KZ2XFo4QpdDLIBYxyGWT4nmCGOz0L9r8aYtqia/HVcE0JZiUIygSPMH+sbxbIHU+pK5pyObsMQcMAWwRyNcoWQ/N3pERHQARqZAw0n0mbE/A5cDZgx0qLQ2gl43eNpac9ma4Omr++Meur/Nkq5K/1MaadWY71uhAOUMrI00qLKi++Sw21JrhaSZbeiwpV2wcfndtiBvqxZv1JLWI82qgsRxHEXxWqCvHedyUi7Pc4VZvb3I50JXxKwl1moSFv67+49Vt9vGCP7ONVxu/nqc2qpl++ckGhQmI14m9rzYMRFuhkgscRzHxtKV3ljX2ZipWe4j9lZ756mxEnFF1gn4HiopCYtB7CTmdQSLJVFk/lOZl/fH/XEPEN8f7wGNpTMWwojImX3fb7VaDx8+pKE8iH5gFelsjSYhDx8+PDg4cBwHHNtGowHbk3K5zIZB2JQBhG00GhAr8Dzv0aNHjx8/hkgcerh0VyZCLnacITqEumWr1er3+2ClgZ0KoWFoDbN3iawczcACBQDWeaATMqukiTYCNXJmAYTBL2W5XPb7fXCuGYJbeTUJlcxztFsXmLMPHz787LPPwAtGfInoE1wzHGwstXZHzVTSja4IiwEcUF4NfGfYGfG6yKwB3AOqIKBqRGx6z6ZAGMIdMASh6YnPxPipVCpPnjx5/PixZjbFcfz1119fXFz81V/91U9+8pPT01Mgy5VK5dGjRx9//PHe3l4mk5nNZs+fP//tb387m81+/vOf47d++9vfdrtdSTzffx8IhbnpNQFCKFgMOp/RelgwSwFHHgUDphnsWbaCZrLaca8AzdOhhS14+PzZbFar1cBP0cway8JFFG9OgwK6HLLRGngj7kDbRginsORgR4lxHMUxJwXetlqthsPhZDKBjkQul2s0GkBpkXTRdQpfmsvlYJOIiwXGqpttrYN578ZERaMzxETA1rS6VrEKYeZa1vDkMlsIC52pOMsIuLBdHYMThTRN09OuUNqrna3BUGeGqonGx9+HLrRDFsAq8ll+OJYlNxbV+XwO/Qfm1dqxczweYyWErESr1To4OMBNA/G/2+0Oh8NSqYQ6U71er9VqwE8vLy9xcyqVCv6VnpAfZLMDe/fs7Ozly5e9Xg8LKRBYLUUKvvPp6enBwcF4PG40Gnf4Lgvs4EP3fZ/SrplMBvR8qK6/fv16PB5Xq9VWq3V0dFSv19GkrKlJ2IwwnIIgoHMdOP4sKmyre228J4RCqKXOyaWVTHekar+P0ORto+gmIHjjsmCd5G3strZNq43uQxtv4O4z3HhY4i07JuZ74jU667awcg0apuGn9C/GEn8HDLEDg9jY12wxzkSMG7le5Hmx7xnPc7QWrnWSVl3W4n1bzDJJ8UZ3lBY2vr5Z5OEDscQsoWE8IMYA2ucA7H5SETWNF/spajk8T7Z5pQFfdndpwJThqDUF0mdLCgIP67lQ0UjfQK0gYcE6u9crXVIFDsgAmCoQVEujz+3Gtc7SOMZ/UW8T1Z8kKTEBBj90sVsul7Rcm8/n+CcW8hHqMGtghID1Fr4sLPlrsoh219Tcjo1Lli5g/4ngxTsClR27RjoQ3eipaC3LFqRuLRF/Iui5LmKl9Y7jWBSkGblu5LqR48Ri4l1ywLIJApbfG3E13la/3fJOveaLiBFjxDgiJlaFtfh9bunGvfge0rk/7o97gPj++L0gxXJTNYL264BNgewcHR0B6ByPx8B29YZdLBYPDg729vYODw8hwwoPejBzAXpaWquozzebTegzQHe4Xq+T/IjgWMegbCyikRGAabqND4fDfr9/dXU1nU5brRb6epBaE5DSHgJsLcelTadTYHw6TEdgl8vl0DkOLIxqxSSgUTmXusMIC+i/gaCQADehPfR1QkQvl8vl83m4JI1GoyAIyuUypPcAXjPhYS4B6Bm8S31poCVS942JE4gPICriutCYCZIsvTgQc4MHCmCXCQARIgTKk8mk0+m02+3FYkE6p+d5ADug4MYm0Pl8/uLFi8FgAFXiX/ziF2/evBmNRo7jAH6qVCrGmE6n8+rVq36/X6vVms3mZDJ59epVu92muO0HiQziOBbHuUEISoI53FjQ0jGKAIBibCC7wEVBlbXVakERBdiTFlTRXk+ELDGY0cQ9HA6piiiKJYHAN5fL7e/vo74CEWTN2eHkJSZCyVpRBGGqHDDG0hoUG+/MYrEYDocg/wLu9DzPiyIdnYVRNJvPB9PpYDAAl5wQLSDgTCZTrVahGE46GOcLzhwAcblcxj2HlZwlHieqW9ZSP7TuhmYasj8Awpq5XK5YLGpHO9RFNL1FJ2a6GAOQFBUU/BY+H9MW7Euwkokj5PN53BC2rDJjx4IA8B2p73Q6RfEDdSxdD8Oos0Rg33Xkk4OjHatYPeKFW/xQOqp1u90XL15EUXRycrK3t6f7EqgiDbqrMWaxWHS7XfpKgVpVKBTgTUdBj0Kh8PHHH0PSB/cQaxFaJbBfSNLm8j4pXxzH/X7/+fPnv/zlL8/Pz/lkeZmovWHuQPr822+/ff36davVgkbw7TNkfI4mZqL/A42l4/G41+thTkG55V//9V+fP3/e7XbRb7G/v99sNrEG8n6ycXs4HKJkBerxdDrF2wCLACoiZK85hmlTKd3NjV+PogjaJpDd4HL0h2xnjkXCMAzQxZ8I67NyhvPRLC1LkMECiN3UwXFrqTTohg++wdJj3TjvtNiFlpgAokf4j5+ZhqGtO6yZg7uBGIuXx/XcUl7W2IpmFqdLiZqM+bZJ3Dg3QN/ISJh0NIuyQrKQX9oZSdK/nNapzCQu8LG42SBbiMtlt1zIZr2CcQp+ppBL5JVwwjT90+rM0ObCQXEJEA5QX2EzFjoe+KTSDqjbJCa0cdZquYxV7f+dQusdGDFBVUuuRJS6AkM+3W+EfRnVO1yvHsncMtIDOLp56EJUugBjFaQJDfPMLYA1jZFpyvB3ovPWNNcSyRjVuDRSRxFlkTyRxhAxJDSHWqcS2AfTUDXvPISSCBCDN8Mgh64kq9UKn4YIDRaXDHJoq7BKDl6FnqGiuPAb+7r+1A5rIbJYz9o1EWmIJp4zFdIjyposupIhN7VoJSU1oNXhrYms4cUduO3uZpRbznf9i2kxInWxIS4ijuL12iyX8XIpy6UJVk4YmHj97mThbWDxhxpB5nbvseqCjhgj/D8xYsRsK0TtsDqwpolsct3Evmgc544k4kyiI6wlJvxkv6PEhNkiMeGlpPnvj/vjHiC+P77vALFec7FAA64FMiWJSy/wPghysW8dByhjkL0Do2E2mxUKhU8++eT4+BjordY6kMQDisV26JMOBgMoKhK2kETaDAgmcmAKiTIcQSYPIufFxQU4jIPB4OjoaH9/H+5JAE/ZVc3YEck5kXG2xtNPAxRp+hcD8uj3+4PBANFeNpvVLtJWqMHISRvsUmoZvVHT6bTT6eBFEM1KpRJwhPF4DHFkZEGajkqGL/kR+FmzKTWkhVYsmBDi6iD7xSAbJ6ORSmbpaHMGJAqwYzweQ3r45cuXQCuQxsBP5uTkpFqtAlYDqbBSqSyXy2Kx2Gg0Hj9+7LruaDRarVbFYrHX6/3qV7/62c9+Vi6Xl8vl8+fPz8/PS6XSkydPSqXSl19+CblS3WL5YSbATZZimEBdSCwJ67OQoMFNMGSLxWKpVIJaItSxK5VKo9GoVqsQVbAkXHCXoOkB/dDxeIwAmkkX8ltyZNrtNuoErVaLBRs+LFKSLf6aJFQUKk5oKGF34hpF0WQy6fV6g8EAmBTk/zLKYlFEgtWq3en0x+PxeEypCqRtAP5wQ4BukziP6UbxFhL5KTzHrkzrrCipTFKPnsU6Q6DLIgYtTqxer1cqFXqLo9hDqTssUOSWEslFQ8NkMrm4uODP+FhgoAcHB+S9IjnEmUAS3fM8SDDj0cO6DVRQEVkulySGA9Bha7/27rNqDO+54BPGQoEHGS+uSG5K7pL/1e/3V6sVLhwiPLrPl/WwQqEwnU6xMkwmE6yTWGCPj48fPXpEVeL1eo1bjcdRKBSq1SrEiAqFAllXAEqoh3C3Sw6C4NWrV//0T//0zTffTKdTwMFaphZVCg6t6XT65s2bL7/88uDgAIrJt8eI8cQt23TQ3PDJvV7viy+++PWvf93pdFar1eXlZb/fj+O42Wx+8sknn376ab1ex2ocx/F8PkdnDPSRBoMBimRoW1kul5VKZW9vr9ls4umg1ESTH6twQjljrF3A31GexFBvt9uO4zSbTYwHjaBZeim/P/LOarGYTKeO40gUgeDPJoY0yVGUwKXlxqbZhboJXSvw8kVqmGqnKf6iJR2rgSeNHmIB141HWj0Wqwo/iuPZWoSpq8B6cxptJITEwcbniwtBJYwCvlpkVne06FUFv6vL7dehgue6LjJuR2IjayNLkZXCiDUuoB3qsiJRIpeJFHolUhBZiAQiq+SPIxKLV5Rcxa/Uy81SI5dxxRQ9v5bPl0ulgut69DXF06T5niTi8pVKhWJBKLxhocYzwhqOV9gppU3q9O7MzUXjUxiHkPmW6TRUyvi3QdBusyCzD50EW9YV+LhF9XnwtzD8gIDjLtFwgtW1bd+bpr1/Z9PGbVjz+sI37s76/Vq8VdO95SZJ1up00XgxhwSvOn1vJWmlYuXM+nDij2l5BMwp1pVxIWgBkaQBEb9LeBqr/bbbSyGydBxrORLv2Hf+FHiyWgaaJnXMyySRn0Y/aL/fH41GWCFJpsY2RzkO9qyw/VEL4okShbBI8VoLm1UWS5IoLeaebuyQlNCKFrHZyE2xZJd09mQJXqN9k3lWEqMax5HFInKdYDJfT8fxfOwEUxOvE8Vhrq7rRAw3TCQOcAqW7oT+2dx8ZQfOa25izfr1+OYiT2CUisPOzT8mOT337R/jinGuZYvkmj29QXY/jRqnH8c27Jij0blzWWUp4imTOlzjMrkW+gjZAAEAAElEQVSKUN1PN9ndtMREIOLfS0zcH/cA8f3xb+Ww9jZNKgTWgwI7YAsoQoDfyuCVgQLQHyjnIqN7+PDhs2fPADHDpUrvymxeDsMQHBDkzIPBAJRSSZwcECsDokWskM/nNQkIJ4wED87vFxcX/X6/3W6PRqPz83NwYC2hWPwAKiiAm3K5DNIKcVW0kuFykGDAKQWMMNAPoZtJhTVLbRb5JygD9FJHuojrApO02+2+fPkSfceLxaJeryPkRayJ08hms8AiYeWnUwU0gCNVINbDiFPbyiHSZWI8Go06nQ6yQbwBFnydTgf4GiQp8OHZbBaCwnjDYDC4urp68+bNcDgkJyKfzz98+HB/f39vbw+ynpAuhQxxt9t9+vTpn/3Znz169Aggfj6ff/r06atXr+I4hnHW6enpP//zP4/H448//vjTTz9drVa/+tWvXrx4MRqNLJvvD1UgYVwUJrQ1Cl4j0wZcawElWtlDp9kA95Fpk/dEnQd8MgY5BhiGDdjE8EIBvoNSBLQ+yI2azWYQbAGbWOsLE9PnuVm6adt0ZtN3kkJ75LFSsPKtxp/Ier2eTia4BFq6Ie6HryCvDjcT0gGgFWMKX+PyYYhFg7Inae5MOojHLdVz2bJj0tJ1xEe0nR2idmJGdHTkrJnP56PRCH0JZ2dngG6JBEF8EEhroVDgnKVgIqjoeBFzH6LeKDURfYAUO0o7WGSg4oK3fag8cGP/O+4bVrwd6AbWqOFwiEFbLBZF0dAIOAJqFJHRaDSZTM7Pz0UEC3KpVCqVSphQ1Wo1iiIKUruuizeghQIPTp82YeI7WPSgGNDpdK6uriBbRGyOSBwmkeaoLhaLfr/f7Xbr9TrM4u6wq6YP3/fRWBCGYafTmU6n/X4fBlwnJydPnz49OTkBHq01STFK2SmCBQrVPpReAD1T4AVVN+vxbUzssffhB4wE7EcYkxpE2xY2fPCAZLFcjkcj4ziSUEFR2dXgjib7W1L7XOIwulCzSQPExFL1gV/hio1XCHZYY5KIBm30KOuvkUdLbdMSxk3jWXw01KixHoG2hLIAYklYwOhfQbWeA0mr3mvGn9a6xe9mk8P3fc91XC92PXFd140dZ23MwsgiRZXS6DDM6HKJjCP/C1x4KQLsA3+wNeV9J1f2svuZ3KhUKPt+xs8W8/lCPl9wXY93EhVZiLSwHwsFSNTOdVcTOlEwr+fJQTUGrXOq0SKtq6tr5KgmTiYTdzZb36Qe/+EpHRbfdrcS9+0n6bZ3pjm520Sxb0PA3AgDWconWgF522HZM25cnTaK9lrE6tuo0GxUObCuWpuepS0E0hIKu5/LH9eG7p3QYSybWGzpJUjNIszH8Xg8HA6pa4dFhi0OTFi0aIkoe0O2RXKdt5ondFmFsHIao7fmxUaNeOsCrYG0cSKwDMNKjz4lxKjoV9O+qQxFosj4nuMYZzFfrJdBHKxNGJvQxGuRVcJajROTuiDhtzrJ6xo4DlMUY+em+MO2ioPZ9DPN6yx1IEk+1km5kuK/OA3VL+L4xvXEdYxjTBQbC9rdJgllTSKtTp5edljLcX3fudvc8RPKcKSu0U8geN5J6hE7N++we88gvj/uAeL749/E8Z2EIKQ60+nUcRwk/JQARvKgG76An4JqAb5GoVD47LPP9vb28LFsGeZXAPcEbRZqj51O5/z8HDBZuVwm0w3hOzIioEiAVJBi6S5+VO9brRaUT9vtdrfbPTs7Q3ZBuJYQNg7HccClhZJDoVAARjCZTMbjMVgngIzjOEZOjm/P5/PgduVyObT9QpIsnc6Bf4rzzOfz9Xod8pGAdHFKECFFDtPv9wuFQq1WA2OUXOB2ux0Ewd7eHhQnEGqAeIitVFtOMa7Cz+hBpsQkHeqGwyHOk0kvYCDCJbxLAJG73S6SpdPTU+hFsJUeegtgbedyObBaKKCMVO3g4OBHP/pRqVT63e9+1+12S6USLJviON7b27u4uPjXf/3Xr7/+OpfLPXv27PDw8MWLF8+fPwd92IrIP3gMHcdxFMcEjAi/ankEi4agnXOYohNZsIJFHCyiAFbAD4SMqdaHmHK1WlWrVTIOMJw075UTRGtSk80tNzmhO1Ig/TqxDxIx3gocKy4nKT/MFqiyLYlsH/WvcT7FYhHucFp9jwmV3GyStc5cN+ul7YM0DYH4sn4EOriUTWQotgFy+gyHw06nA4C41+uBNKRb0UWEZpKYkqj9EGumPCJ/hS2TFrsEvCTY2kiiU5wWgb1b/U9uKuJJInVC0zMo20A7nm48+qOgktzpdLrdLiiuBC6xEBUKhWw2C+781dUVONfD4RA6QliyJpMJOMJoDYY4NTYU3CjrYeGO0Sz+bi23YEBDBQWfTFyJ6y3KgXiO+IrBYHB2dlar1aCO/f5LjeM4pVLp0aNH2WwWdYVOpwMVjsPDQ0juiAhOBjU5rAxkF3IIAVPOZrOVSgWbC7EzTLTxeGyhIdoHHMvFer0GfgpONwYeM3YAxBRyTbulvRP2dPv1FyUZfDr5uVyHtW8VZXNIp+VyAXahxSDW1DaWSC10GPUJOhCwad3SpdWVZt02ngaINZJl2WFZ81FvbVbjtkVI1ygDqyls/KJiFfuN0r+odXv51QilEKcllWzfdcV1Y8eNXcd1xDGBY5YiS5EgBRA7CRwA+nCgoGHs2+sEGl4nYHFwnbhEvr+KWpPlR8WMVy5d5YvrUsnL5zPZbMFxPMxIPFNMWzQZaO8yLB2Yy2hiwJBGnMmetul0OpvNCBDzzlhIk96YUDNGAX42m2USMuOHKktb2KWkhEfSSzH3KVSRddO9JsNuQ40tcFl3ZW38FY7J9Cywfn3jpiMpvzJGCJjCbEDREhBWCM1ij9bw0R2EO3ZAHVHwbClxgGiK9y2N/KYjJT0BuUIyLOGagP9S0AkNMdbuLzepqe9a/vzjAsSE5AgQkxNDJwbmgzjQiooqKSj/DBEt7X7LRxf3mfYz1mPSoLyl4m0BxJqwLymjdespb8uXt4nLaxNpS8CNdSYOSBoYrgPjOq6IswoWvjurFGbV0mKylGXshoETg6YaKYA4SGBKk6yrRIej5L9cosKbFGBH/aJevbVYkMU1jhQeTTg4uvmBnkKHveRDknqhyRgvazI5J5N1fN8EIHLEcLm2hY902cly49SF83Rg7Lqun8lkosjFPmvMO7uJWp5+2yz+ZCfh+o96PHny5MmTJ/zrz372M/7813/91/qdv/jFLwaDwT0Odg8Q3x/3x9Y4Ne17oAO1xWIBFYXJZLJYLBiTUUMKkTq2UoRE1GFoNpsPHz4EW4qajJoziMB9NBqBlyoikD2dzWYIBKk8RWCFHcHMG4FaMg3DDu37PpjOYK1eXl4i3UXUwgSY5hUkj0wmE1jbIVEHDIqOXYQUEMQgrVJ7aIgIeMQaLsQnI2BidIjOdAAupD1Cohewy3A4DIKgUCjgnGGDBhS41+v1+33EmsgAkRqBxQz8VxMZqGfHEBanBCCS4RdCNJ08ZDIZUU5reNaFQmE2m11eXuJu4PHRfw+K1ZVKBUxAfDgJPoDSGLSB6Tafz/f29j777LOjoyMRqdfrX3755a9+9avhcPjgwYOTkxPf96+urvr9Pm9UOg+5M07BDEy/xEQCJwxZAAw5QqLbvJvIO0PRwmqZpGY0sWAMeMhNYDC4rlsqlbQ0G7CqIAhA3IZqRyaTgTPV/v4+3VHkZo8kqQ1pIcLbcFUsR2nkOUBZeMla7REEUtoeMkYn3Kx9Wsit1iiz/itzsG0PzsrorKZpqwMdp4oLwbDHfyllwHkkyqJzPB6/efPm7OwM5bFerwckjj0EJLWBJAtUhdINaEoAO4ZO9BrG0pC3tirS3oZpzOIOg1zDAXgKOEAzxFoXRRFIvhcXFxZAzHV1NptdXV2dnp6CLk19T6wVGGbwoKtUKv1+//z8HF+ERBElLkpw4DZizBDgs4iWzBkwcu6QOYP7DBUXAGf4OmgiYXsCINvr9VD6wqwZjUZnZ2f7+/sfffTRu26p2/4VWDmw3aOjo36/jx0Hkh3L5fLFixeYdOAvo4JIbSK4/EHaG3ePcijAUDBf+v2+peVnAcRYzdCxAWlsin7gQ8jY3dii/vvzhIlFFovFeDIBX8pq+bf6zS3Ek/OXM1or6rJxh+0CZBDzn1jOseRHMP7T4BqbALDWUTjeUnzmwOYA1nBkGo3SsJElr6w9rDhrdMJsCRBTsF6ruFqQupY/1vcEGLLrGNeNXS92XMeJHaMlJqxRQKRAS0yECqQALrxUf4JrftZaMuPFnhO4EpRLxXK93isWV6Wi63pZ4A1YabPZbLFYrFQqVJlglQtRGWM2FHvI70O8R5kIiEfx5us7bKGTWL6A7Mzn88Vy6SSR0ruFGVuqKWlWbJoYa1VwiVkjLrVaHxB0WbLUGwFi3UKnB/mOgGqjoKpV5EgTLTlVWblhHYVoGhpKeD665kFSKnjx1OzikGAxfpvPqg7Iufvgr+SZckmUmzoGlHjCeKNvNnyksTSxH4jXwtVDRLDBkZNBWgB1BjTDQI+BP/38Ua+iwIjZp6XbScHZ5zBAmQe2EyIC4ft1SrZF20KybL9NVpupjSX1a7lTpqdk2tp0G7U87V2Zbme09ibte4yIWjteECD2fSeO/Th2XXdeK48enfRcz78aVNqL4nTpx6ERL8FbM0p3InH4vGbsWuhwnMI3LQqw7MSIRfGOneSfnJs05FjJzfMHAMSOYhBnxMmIn3fyRTebj13PiWLHOI4jRqPD21oGd9ROLP9V13Uzvh/FsRuG5taaYDcO0IcpMYELXCcXGCbKErjnkdKacNSvO3/MKfkf/+N//M//+T9v/Ke/+7u/03/9m7/5m7//+7+/B8HuAeL74/747pzWYqnQn7dSqYDqK4mGAzZRqmTC1gZEJOzK+Xz+5OTkk08+abVaaEZm/obNAHQtYqy+71erVXgfgdgLtVCUoNmPA4wJASKpMWjKBl8PkRzzLvS5A0idzWZw+EFgzQSYRBLQhIfDISrbAJEJFSFpB4UBoA/OAbk08BTyODTxFtdIIpIkTF4Ei4whwHc+PDwsFotUIJ3NZoAGwjAE0Qwg8mQyefPmzeXlJaR+kSxBPBEJIeBjNMKTTwrQk1w8cJ/xvHBRuIe6A1fLb0E6AJcARY52uz0cDskdrtfrOBmgRTT1gj8YfAt7vd5wOMzn8/1+v1Qqzefzcrl8eHj4s5/9DJId/X7/v/23//bLX/4SopylUqnb7b5+/RqjxZJh/TBCEymMmCKSIFdiSIgIBNRQHSERj/4k2nMcKAObtXmeCJdns1m73e71eshmO50OyNFgXwI/yuVykuh7jMdjNMhjnDSbTRh/VatVjHzS3lFT0Zw1HdRu49psTEXSzkt4Zyabzfg+7/9qtRqNx9PlMgxD6FcCscJ80Sk3GPpAhwuFgoZLOMUIJuLmk7WdDhkx7/AgmBzqVF9TD5DRwXIQoC0FNyGJQOSITwriGJeXl998883Z2Rl8KUFJA0KBe44PqdVqILXhqfGRAcvDRwH2JUDMVJYugr7vz2azi4sLLI+SuERaNYb3Z/1gVIC3DgfRXC4H/BRXB7kbsh01hhLH8Xg8Pjs7g7wphN2BYOIy5/M5+h5OTk4ODw8fPHhAxi41W3DhFPXWY3JbPy8Vpe+QNodhiGIM6oXVahVztlQqwQ6uXq/DFfPNmzfffvvtixcvoESxXC7hIyfvYlOzAyDWopbPnj178uQJnixG5sXFxS9/+cvnz5+DpT6fz0HWhhkdxg/emcvlaInJWYMFH9tK2gzKahLnVoW6I02EsEkBytGOTxu5wzuApPTic/sDYFwUx+7NGnZa/1ETEi0uoab4MTDAG4j5aqUFAqZEbbjU6A3dwiOoaqr/SqYwqn3gGBK/0HU7UuHSa691dVaolvbW42TR7GC2sGhOnK5UWW/QxeDkZjqOYxwndtzYAYM4NGZtJEjyZwtiIEzgJ+26FkC8EMkmf3yR3HWmvZ5nR9PWbFldTmvNqjk+iLN+P5cT47pR6IsYz3NR3aHEFlcSnD9tP8m71xsQRjjCTgLEmo1uFfX16kHx0GtOfRTFt1sL0kvZRhQ1XXpJL4BWQz1awabTKao7dGDjbquf+EZpYK2Owtqb3mi2mShasB0YDHrip4c0ayQUB0AzGQuWmtBgdYkRQiI1Xg9aXfCwVMit2IYkFV20RkqC1yGtpkmm1rPQqsHIPohtobRPV098FMVzEf3iJoBLwV+Hq62WMtjWa/8nDhDrUpwkAuuYj4idAKmjKzSXy6EzslQqMfDTSx9rHtpB0YJuLf9VMiG42PIHS+jDIrZbFQVLrciigFiKLvpnlrETzPdtxsfTYGmHIssIOz3XiaKsGK9cnu7vtytVt7m3/vYsWDz3510vWpprZVs3Ue8JbkK3/k2VCUuD2Krhafu4NEZs/TVKyMLagNRR0LN7Exf2kx+itwxi4xvjG+M5xnFFJBInNq7rOphb3IS3CdFY8aEF6KcdLMUYN0kV3/nIJpegD8oK+5sK2haVeHUvMXF/3APE98e/LXRYL7iIpZCjrtfr/f39VquFVlwElPRxgvThbDYrl8u1Wg0B0GKxePLkyeeff/7s2bODgwMIFuu2rDAMYbwTxzFajZrN5k9/+tO//Mu//Kd/+qerqyuo+sIJTeMLi8WCsSZ5NJBzBY+vVCqBeszYIpfLHR0dHR4e4ku73e7FxcXZ2RlgbmJMxhi6fEDADtEGAzhEe/hk4J6O4wASQnBTKpUQcwOBAsKIjIL9jyQqAmdhJo+PKpVKCJsmkwkQDeq6InuP4xjIVBiGcA/r9XqlUgkILFQIMplMpVKBNC3wbmhTUn0VqRGgZABhkDYG64T6y3iOJGgjZ9YJ2NXV1fPnzwEkZTKZRqPx9OlT3/cHg4GOj8PE0wzA6NnZWbvdfvToUaFQAOh5dHT08ccfP3nypFgsxnH8D//wD7/85S9/97vfPX36tFAorFarV69ePX/+HGwgzc/6IA3OGz4hjkURuBCqolRAowwLc7GS/7Q+nc462IyM9kPaSUGmudFooBMfTwe8J9d1wSBGnyy+F+8B4gyFE1EN+Om4Nq3b9U6o4lvvFIu7EUXrRIZCs2Z0Bx+ZHaDWUmvYwkSsYwf2xHZUzdSTm021aeE5NjyCxIFUE3G8Boh1V6N+UrpXVJtcgdZEzAKDH/RhoK6cvGmUh6eNWYZpAowML9Lp5UNxNvVDofx6LpeDELyW9UgPFf4uxi1o7DqRpvoB9ZfxjMiXwSKD24U6HOFyy19oh/z07Q+ynkH9hjdms9kEHIALz2Qy5XIZKg1aOwhPDWxEMHY/bMaum6yhLw9h7nq9Ph6PMeqKxSLqi2jlQaYdhiEoaWTB42nibFmX0svRNplFSwAUz4isYStz3mbR/sEDknUYBmARpmhEeuLfBlbbKD+qjRNuc+yoBKTFWDeKtKbfr901020x+udtafPG89wm1WoxsCzk0XKxu3nfCCXwPMxb9CGNL2jcwSgnJY0vpP8rEkcmDFyZm4WUlqtCGHnGGMcAG4qTMzCW+HJ6iFrMVkuKyupAt9ylNjYkEWC6/swwjKPolp3L1lzbTctNS5duKwaI4kRDnYxRsWWiaz3NdFhCkQoE0gRP0xNq4wlbHQbWQNI4DvcU7A7Ey2STwPHGIhBRSNaBtH2fbhuyRAP0OaB7htfIsJyfo0WftMWZdjph4xGnDwJj8rhRJOb9AceFkTxiD6LeSBbkXZSR/xQOndPRd0FrguEeIl9A5IymOtKJ8Ff9aEDW1jORw1jbLOtCIKe8VWbQeuLWjNa033SfDan0umK0ESO2hFysGJusIFEafXpfJnfEGLN2XeM4vh8UCotyaVivu9m8O13lvnnVdFaxLESiBHilxIRebC10OM0gTmsB3fYx31y9zc2VPFbqw+5NsBjn4ItkJfYliMxo7F5c+leXjiOGRgAi4jjmNiNtRy5g1XdjY9z1+o4FFiOSS4SPaEYHBrGGyyX5gQxiN3kQ+T8yg/hv//Zv//Zv/5Z//eu//msSh78XNaf74x4gvj/+RLd8a+XFFghJ3zAMu91uv98HvwlFe6TfIBqzyy8Mw3K5DGt1NmKTRwBUlLxdxHzFYhF2dr/5zW8QWumAj+pdWo8YpXiaraMYy6CTPGK8joo9qIsiwqtA/LGxX8lyMWLUCGRBR34MGihrqCXVeD6u69I4CMrOIClbBgiMgwEu436CMDKZTMAULhQKAOuheoyiNEBq5AngRYKnSdVm5gOs2NOMCP/KII/4CMjFeFG7gdNODecPKcxisUh6Ml2e8TmAzOgqDqwf9mWtVmtvbw9IDe4/CdpRFA0Gg3a7jR40TTH4kFudMfHN/n3eKFCNJKER6WFP/G6jr4IVyFIJcTabQReCbYaAe/DIqtUqbIVw/xl/l0qlVqvled54PB6Px71ebzKZlEqlIAhg/QcWZxRFkBnR0gTsy9NFoNuj5zpHvY7+o0j0QuE4vu/nHAc9+0DfMDhxAqSjglzMtQVEMC1KTv477ljaGCoNCdGgSTeha21fvZqh2AN8k1NSo72kvUwmk8FgMBwOUV8ZDodQdAWzG7IMoLNls9lqtQqVcFRWoGbQ6/U6nc5kMuFEw/RBvsSiFzIKJI2Hh4ew9aN+CyY4lqz3ROIsIhgzHHZaMAHDgARgaqXuPKbTabfbxfNi7y2EBSEuAQkFLO+UMsDAjqKo2Ww2m01IUWOl0nfjAxY+e73excXF+fn5xcUFxlulUsEiSelkJnXM2CuVCjH6Tqfz29/+9vHjxz/4wQ9QKdw9fXavS7qYoaEogNRQjTg8PBwOh+12u91uY16j0rBYLNrtNsjs1Wq1Wq26rjubzYhZoPSC4h9WLV6ddtrR040sJ2yOTKp1fmvl0taZ71463ufhbRy36b/uAIK3IchEfHZgytsInrePoHYX4zfiDrLd9iqdMKfPdkf5M92Wq7/IGtKbUOnrJT9m/TS6hTKj3GSrOZsw4pt0ttgYcYC7Xf+JREScHZC9xmXSo25b4XBbY/h3D2bc8HfE0Xb/EwmGmHdEtSQlRa3ppUS6EWsxtKacvXW92+pn3CU1HT5dTbHC1DTubKm+aFY7aftamEW33FmqFGmRFt0ooGeuZQawsYhlrRtUD5PEupadBHRqRb0NVQRR1pGaOqoLMFQ/06oCaAEUEfruAiDGvkndDBh30xhTtnQV3GG1+X0fWl+CwD0jT0ka4AAQI37WImDIniyxYEmJEOryeVqGRctz6WGsVSbSpW4N1KaXYi3ntZFBrPWOrTPn9GE3hj5JDnhGOxxgq1W4XK6D1UJknM06+Xw+6zfcaH0txRMnPRmWBjFW0SDBiC2Y2CiAOL5Zw7tlEsCrd9SKbVKvWz519NDzRXISZ2S+NKdv3F/6UjJO8KkcHpliSVzvRpfFtsm7e2nV6DCOSMRxXbmzSV2c/NckMLGvPOjilLxGnLxNlDDF/XF/3APE98e/jSMdJZMIVigUnj179hd/8RfdbhdYD8BNgIOM/OiNY4x5+PDhxx9/fHh4COECgJ7cjOHb3u/30TYLuBM4F3bufD4P+QJ0JGlEAxAPoEawiREZo/uMOphIcQFD41oACXmeB8mLcrn81Vdf4SrofQTERyuCYeMBSkvpMdd19/b2MpkMO6dw5kS6C4UCQFucYbFYPD4+LhQK6/Uaxim4EHBA0JU2HA7Pzs6azSY1NCqVSi6Xw2WCYoBGNkS0ABM9z4PtEnQbxuNxsVgEVgtFS9/3wf4GuQwnTLccoJN0n7MifohpsGUViQe6nk9PT8/Ozrrd7mw28zxvb2/v4cOHe3t7xhgguaCEt1otkKCBzoOUvb+/7zhOu93+n//zf4Iu/ZOf/OTx48ekLY/H41Kp9Mknn3z00Ufz+fz58+f/+q//OplMtqW+H2rw8whV6yWAzlwuB1Fgz/MwaOm5TBopIn4tz8dBy4Z6iNj2ej1kDnhPNpuloTOQR9IqJbF2dBxnb28P0sMQLB4Oh91uFyc5n88xpHu9HoRZWq0WFJ/5cDkB5RbOfoSctKEKTsnzPIE6LaJEY4ql0tOnT0PHAZcWpG8MSCDgcJPXiRMgVBDbCRnD4ozEDQDEVvteGhfAdRG+12NYs0g4f0H51+g5gWY+JkzGq6sriNL0+30wOlH0AqxZr9cbjQZgUNK9oSzx5s2b0WgESzTUujBgAOtDsoBPRFsLQocdau8wbNSZ8J3HfBoa00k4Vg/0T2AQoqKmk0C5KSkAELzT6QBKht8gGil4z8GYBuKprUEBRFarVVQLUATiikSI4f1TX5zD119//cUXX8CBE7UBYK+gS6PuQnUdzdA/ODgAZRgdo7/+9a8HgwGkXY6OjsDWf5+8ncNS60KgFFSv19ENUy6XR6MR1n/sFHDyBNgN6WTduCoi0KBfLpdYh9NGLlbXNvB9Kg45jkPZVqxX2OX5jKwP+T0pERsQbEVcJSyuyzmav4+GIeaHPE+KTli/a2X7WiN1m+ikNfviLQeRLw4D/YAYlvDryHpLT0yNQXzn3dZonVY6Tl+OJlvpnzdizRaJGP+NQxMsJZhJPN/eS2tucspEZdfepj/ylh9nMrGXDQulqFL2KtVsuSRhVFyvM2KM6zp41pboELcqMGoxUyxUiJ1SlInAqLb4EButyajfEiXEYWNM/I5r0W4eOiIfPkrMdypg8DHR4thSHUHEiH8CV4CdTxtPY+Mg11XVtLK/xdVIo9UaLWWTvnaM1Fre+hu3FYHSDTeasZsG9TbSO/T00VNDc+q1HgsdMqCbQeYEFQ80oVhj37T3pB8vxxh6PnDyeAM2Qd6rXC6HBjLaeHDR+85oTWsl/1EAYi0Bb8ma6RlHA0+ultPpFFsPbhEJQ7pHhPBuepmyklbeYe3lQHk0a3nf3U6nXUbTXThpu+mNxSd9cyynNV0GUB8rURQGQbBYLufzmeN4i/l8NQ/CZSSr+BpvXSbyuGuFwFKDOFDocHzzj3NTTdh5RyM1cxNZ1n0h8U3dCQ0Tg3qcESlIlJFJ33x15Uxfm9XAWQdRLi/FsoAsHkVbSzvfmaqk/Vpd13WQRHyQIQ6cPZsI7jsJiTi8ibDfI8L3xz1AfH/82zu2IS8ATSCK+uTJk48//hjsKrLMkD3GcQyrgWazeXx8jM31k08+efbs2d7eHiIAxr4IXkejUafT6ff77I8D7wzIUbFYPDk5OT09HY1GgH11FgdUBfk8JAsgkby3t0efLsQHBKQYN0NuAt5KEJ2EREOn04GyhGY6k1OGc0a8iPeUy+Xj4+NSqXR+fn55eYmOabSZ0yMOwMdisQBc++zZs0wmQ7wJoAOgRsDEs9kM94TSxrjVy+Wy0+kQjsRFwX8PuT009cChhuUdIB5AGAhJiZ7j9LLZLEr6WhtXm9fhIbJrjOJrkBO5vLx8+fLl5eVlv9+PoqhWqz158uTZs2eFQuHy8hL8iHK5XK/X8/k8Nm9wCReLBdiF2Wz222+//c1vfvPRRx8dHh4+fvx4b28PmdhwOOx0Otls9tmzZ48ePer3+7/73e+++eYb3NUPqCxhjXj983q9XiW2bBwPEAmhExHY67xXxCAY11oO6XAmgT0OgFFWLPDh1WpVV0pAJ6HyNUYvMCN0wTuOMxwOJ5PJq1evoE9drVYxwFqtFp+dZq9b1m27D60+zA4+ZlZRGDJVLuTzJycnokYLygaoQAAozOVyIN4SxGHKzRwY41OnoxabKb1w6RRUEmq5zmx1eq8Z3xiQSOHwT+DPAiLsdDqof2CxgkyE7/tQ0cFMbzQajUYDdmdomAU8AY7nJDnAoEfZo91uT6dTqFugumO1PfKGYyQEQYBOTI60Ow9+3uR0wrxcLgeDASpAGOQUC+ab8Vj1swBGjDUKwxgZIBZSCGED9ETBjM0BnufROBTDm10XTLzvpoKSPrB44jmi5QK6Pb1eD3LeH330ESorGN7AatHWUKlUUACAaNJgMIDg+9OnT6vV6m6A+Da7LUWuV6sVlPFRvfA8D4tzNput1+skT2Gguq47nU5pW6pNe1gHGo/Ho9EIYtkaQNT4o+4ORmHDdV0A6KggoqSBFYZtsB+8Mrc16zPXBjZuykqOU56MPwLElstNWmk3DRPrW7ERRN5RR7eQAstJSevR6256q0KwsS/eAoitwaMVmbmgsTWbusMkhmuJYdwQbVKXvmrLGY+YjHHEiIlCEy7Nem5kscmkTqPDXkKnwgdTK9N7a21//cdJvH18MZF4+bhQcivVTK2aLxWdYF1arX2Y1GWzGTQiWOfM1i6qD2vdfOp+ImLkezZqI2zcCt8aXu30er1zKUtLVCFm1goY+nHrXYxlG11+wzDDWrFx/HynakqaKWKVIqwawza1E6uDRzcF4q9pDrL+tO80yrPgYO0GZs01S1LGuhx6mRDqZY8Rcg2W34g2si2Dmyk2O4SIVIiGhB0ifFHeJJlMZjwek9eCYh7mKYB+S6th927yR+QRWw3++ky0gSdjMCqfYKNBlIhIDDdqmykcRriVnVlrr2bpcjUmaWmbXtY2+w1tNmj5jaft6TaOTEkpm6cXWxXXiUgcReF6vV4sA+OEs2m0mMXBwsSRkVgkTIjDWkRCFGoZ3QSFCVxaGhEW7PtOGLFsZxCbTW0ioNZmJXZlsTBXZ850LRXfPH5gfvB5JBI7DvpRzN2qa+kaz1stY/a8vOuxThjZmcTxzyS3WpTi8DpRotBSG3GiTXEv5HB/3APE98e/DXRYc0+sDQ/asoB6gfig2AveaLFYHAwGgHT/w3/4D3/+53+O2Kherz948ACeY47jIF+Fuw4AI9DWEKmj2RyGaVEU/ehHP8pkMr/+9a+/+uorkKcAlGhOJWKF+Xw+GAzCMGw0GohR0DtMtQfaJjCYxitIOH/605+CLfjixYurqyuk5ew9l6RHjPgRKJmFQuH4+Pjg4CCXy4GYhrvUarWePn0aBMHXX38Nnm+hUIAo8P7+/snJCWjXzWYTpMLlcnl+fg6vbXBsgarg/jB/A095MBiA8gbpyclk4jhOs9kEyZcSyZSlY683ZBxATsRNzufz5XKZdmHk4yDFAowFbWjcEEnIleBT9Hq9N2/efP3118PhcL1el0qlR48effLJJx9//DF+Fx8INerxeJzJZA4PD0UEFGB81/7+/mQyOTs7g04reVXT6fTVq1enp6fGGBi1vXz58vz8fDgcpk0UNyo23nkaECOOE89DYIL5fB4qAYB3oQoC9Q+NopL8qMkjGM/a9AyoMeVKWADHUEHpAtLbuCh252He4ZHR0qRcLne73cFg8Pr162q1CoFskFCAzuOdUCwB4nybeEsUIStIxIW1yKwkec41EOM4Od+XpCBBR0TGvsViETZojLmRXKW9QSDBAdQMWIYW9bMOTlItcUuFE0m1EhO+N+r8mdUA4oQAyNXVFWbcYrFAowPQYZD6oa5bq9Xq9TqTcDxxMMTRJQCW9GAwgIgtmP749mKxqF3LRUnoQH0CkyiOY8xZeNZ9KIc6K7XjopFun5SbPiEWBK9zHitb4xXBHQ6QN5dKoOoU4ANeD/chzXN/X+ZHFGEUgXe/XC77/T4g+36/DxGPUqn05MkTFhRxCWDOYmKiGINVC0TyfD7Pct17QkI0TQW1HPtgpVJBTwBRP1QIsCJBxrFUKlFWxcJxOBS1Ds82iU8St1erFdQ/9BijWncabdmYDH9IgNh1fc8TY7yE5owKE3cro5jFWNzSHuiWbqnGlzX7T7euW45tVtpvScmnBdPJWeONZamVPeYb/UI3UiY1H9/S0GCbhQXmEuRybx7auE/3g7MMnKaIpiyhRExsxLgifiyZ+IbL/WaA2E8Q5DDxMpJEonEhshSZJTn2WiRK/knEZFwvm8vkyvmCUyq5YVxYhxmcHZ+mttLFsq/rr9gruRGwBj+ZTIbD4Wg0mkwmlPZKRxEWckTsicjjO61RGyWqrTmrZX8pMYHowuqsT0ujWAiy9U+WeO5toO20WIe1a1hYTJp+ni6HaHs67vtpMRA9PTfe5zS8q+ejKLFX683kCFuPmFOD3XL4KJZvsS+zi8L6dgYhKBmiVIxFGLgzwnstpkHfNqQhVL0jkUVLLcu7CIL9SR0bEVVKdlA+i1V8LWatR4h2qNOseSqBbCsbbNOcucO0Te96tzHHTvvuah4JMfTkc3ibwvU6DoJ4FcSrlVmvnBgzKUoIwtFN/Fe2yMHLTiz4DkGWud17yCaOkldcEUeitaymJp5Lt+2MhnGwEoljlXi9V0xr8crjODaJkcw7HxmRQN1S7GXB9VW81SD21HamhYnDe1Tp/rgHiO+Pf3MYsRU7IgmBVkCxWAREhcgbIryQ3YTzT6vV+vzzz3/yk59QUxU0K3BO+/0+dFf7/f58PmdDKHJyjWH5vo/e7f39/W63CzkLknGsqA6RVhiG1MOFQARRMG0my45UZhRwlKrX64BTQStjfyLeBmYuIzkRASGO1WyEg0T94HoPyz4Qq8GlLRaL/ChYsY1Go3a7TfpDsVisVCrIJNFuxvtDYVOEqgBq5/M5vO9wUfgQqCqLCMgyxpj5fN5ut2ezGVzv9/b2qDwAUABRLL6LWqhANqEMgDGQzWZBiAbU1e12F4tFuVyG41O1Wm02m6SLFgoFkNGWyyU4cd1udzqdgpFXLBahgwGIRCNfYPyNRiOKZoLysw0i1GP4zlCFZry8DQ1V37GI0IEEfnE4N3LVNUDMuUPWKl8hmRe8SwjPodqBcQLPLqqy0mib+BrxTVjSUdF4NpuBhgwEk918utPzXXNaJEVU99ZIt6XRxhUkHbHpJkq0CDA9IF/YSuF03Izxv4NBvK25cmN2qmmwmnvFHwiVav9AFma0WitWAywIuD+6wZk0c+iBsAjE7Bds2bdty8m10N9SUmK1789Z00gTyxgYopjmruvCiRQDCZabG9Mh5sZAe+HOVyqVIPKLlgXkugBAAehgSSyVSqPRaDQakYmPSkytVjs8PKzVaszztQvNHa49DMPxeOz7frVaFRFImkCrZ39/v1qtnp6e9nq9drt9cHCAGU3SPV7HQjQejwuFwuHh4eHhoTEGhZy7pZr6zo9Go9evX2PH4WjEDYHgzGAwGI/HbEbGOoltq1wuY3ySY6g9AIkO88FpY09LQgpYIR4Z6l6kFZPPvsOl6vcUk7iel83lXM/zHQdrXaFQAA9dNzKTBG3hSqIo89hJM8mhOciSdL4TM9UAsWaNaVzAwqQs8hrGMwMV6n5gAdeUQz3CrTvMpmlrAloLrEa3WetCNKVbbjXzjqRFrmYbKdXaU94YI7FEkYShEZFCNtqrr4/2V4OWsyg5C8eJ0hgB6cOhyplBxQpFcjf/BAmOHIksJRaJPHe2Ko3Gjck0XyyYQjFrXNeIETFEv3UzBNZt1OHG47EmEXNaQUcesj9oI6CAw7aQID1/3/IZb70abzNQtXYxDXHq7njtasVNKi26zYVFEr5z2uNOVJf9DtHtbeAa79UOfQlrXqS1XC1Ke1rShMaD6fqxpFQC0iA+UUhLzZZ202yEshYK3W6ID2H3FXF5heXZowVkFMeR9dpP1BXeMrhxSjqyQp8KvWHBkmFgyRxkG/X1Typ53GGpt5sAbhm73b62vfGTdztV7H6DJT1hvXljQfR9GrnServGkJGroWKJEy9M6r/fAGrjFCnY4g5rk7oPBvzfFVOOJY4kiiSMJLrGuM2HlWZ4O0LeJzIBwO0lG5abWO1FSmWCl4YiqJPwjmFwN1WM4/vj/rgHiO+P7y80bG2lZOnGcdxoNH784x9/+umnq9XqzZs3ADTheFar1Z4+fep53vHxcSaTaTabCKdqtRrAL1TU0auFCGw0Gj1//nw4HC4WC9/3IZILwiB4XqAkz2az/f1913WLxeJXX33V7XYtaAMZI6Be9N6iVxfqClCBwA/EuRDAgSSIF0G3xIulUunBgwe1Wq1UKgHCBsAKGQEkeMBNIJOaz+epIQAcBNIQQHYKhcJf/uVfQnRYRNBDzSb9bDaL34U6RL/fB68QPBFoR06nU9AGEVzmcrlyuYxYczQaIelF/y9hO+YSkhTnoX8qIqS+IuWADgas7cCH1Q2DuDPVahXAJd0I4zju9/vn5+fffvvtxcWFiBwdHUEgotFoVCoVBN+TyQTqELVaDU8BMM3p6Ska0o+Pj9FSB7CmUCg8fvy4VCrhYV1eXv7yl78cDAZ7e3sYA+Bdyk4aTvwhatBvQwqVqgHLg1zaaDQC85GMWuqs6X5VTh9A8EhnmfYgJWg0GtRYABQOfA1jzHJ0xGgH/RZKuBg8GEv42MvLy9lsdnFxEQQBTNVQ89CQyjtFsRDM7ff7kBLGDMW48jzPLBbLBNaP43i1XIarlXuzB5AN4Bpnp+wpGNPNZpNqksaYXC63v78vIhAohzui5VOfLmuls1lLSwGnwbTQUn8j4xhcV8CCaNK/uLgAlABpYGD3APEBibKRfL1eA/QEhQ21tH6/f3V1NRwOUVXa398HcRgDA9AzwUFUU2DlB/3ZQqEAbBrrhsU4vhtArJt88Y0ignIFakhPnjxB9avRaJRKJZyArnAwiwbaW6/X9/f3G40G9ENwi4CbY45DcQIFIeg1Q0IBAA014lEUIQt7vV5jhFB3wsqmbkOCC4Lg6uoKevHAu8FlxqlGUfQP//AP33zzzatXrw4ODh48eED0EKDwcDh0Xffg4ADc4Xw+/8Mf/pDE/HfdZ3WSD1Xui4uLly9f9vt97C8A1qMoGo/H2Ney2ezFxQU6kbH1AMC1ml6BAIKLjR4dkNDTCJQluQgkEcUAFBqJmUJ4BE8Qm6B2qdJsx9/Tkc/lqrUaen+wZmJoEda06k8bab+iSFsaBbYAU42PY6GwgOZtoENaYoLFQlEKEiCnIyAhQZ6LD2sh1iqnW6R1hWYjkotllqscCcLkC/PhEisnFG4pL+sb+3bdiCVYx1EUi0ijEfzo86lpRdm96OXD7JusvxIn1tm1URixl3CH44SBFYqsRHIi2RRALCJricXMA//1m0pOvHWwDNbrTz6OS/nYcSSMHJHrZVCzRDHsKe+OEh3KdbjDWJ+h/o+SFUWKb492vb1FjuPsborejg3trt7pgfRW1OImi3zb6VGkQhvNsQhhYbjpwuptMGKNDluC4NYpcSJoYJTLi7awsyj/+Dp2CaQbAvRaZJ2qFp+1rlG7GmwtSim6Lus6DPaYC1iraJyAUZ4nnocPN3EcBysx4q/X2VWw8la+1vpI5FBWy+RAoIgQGhEmH/2fIH043oT4E9YnzM0nwjIwMylJ7Iix6qZHqbUipUkJloZ1ugYTb/I4tSSA05z69DIoW6TnLfGWbdN5d1SggzFVFHGi2ESxcZyoUFy0WhOJMlHohmICx1llvZVxo9BcI5LXQ+qmxAR/TpvUWX/M72d8WMB0/NbPzTjiZ8TPGMe1CdbvCWW8VU/yfS+KjOfdUWICZOFQ3TqT/NVJIb9afYLOde69xMT9cQ8Q3x//tg4djuDnZrP55MmT/f19sBRhnVSpVGazGex9ICmL3zo7O/vNb36DjHp/fx/RKoDIs7OzV69effXVV1988QUwlDiO6/U6QDE2ArdaLYAC1Wr1wYMHJycnxWLx//yf/wPsFfAcgjNAtHDpQc48Ho8BvgRBABAHYBalMNllz80b8CXSJMAinuc1Gg3gFMguqAmA4AZYhud5cMkTkWazCail3W6vVqtWq/XRRx999tlnrVaLXY1APYiDwKAMfejAbakmPBqNAIkCRwa8Alo0cHkgv6VSCRK0y+USODuBbHB4+V8QeAHK9Pt9AMS1Wi2Xy0EEGXAMQ2RglAC/JGmvA0L6+vXrr7/++vnz52EYfvrpp48fP378+HG1WgX43u/3u92uiBwcHDx69IitdsjKoOKK9ExEIDQcRdGDBw8+/fRTmhO+efPml7/8peu6P/jBD5rN5unp6dXVFe7zDibpBw9vgtUKDd2kiiPhbDQaEI/DeCC5mExbuSngaNlwo+YBbnVaUlATZ0gaQhqPWQZ1UTDlkVcAOEY2NR6PMQjhVQj4GMBTtVq1mq+/M5UFvokHB4sVnth6vTZBsA4CLhTT2WzW6+UrFXi16ZCapDlkO8AmqtUqigqoKzDCy2azR0dHpVKp1+sVCgVcYL1ex2d+Z5VrI6FYq09Y7A+cFXqTIfnS6XQuLy+h6HJ1dfXmzZvpdJrL5Y6Pj5vNJqSHgRTDcBIqK1jlut0uij2j0Qis4W63O5lMAMChjQDTdrVaDQaDs7MzzH1Nnx8Oh1CuAOkVSSld198/V9TJLRoFOFbJV4JPINYNSRnK87EWi8WDgwPUh2q1GrtiaekOtY0oiiCZAsgb2SAWRk4ZVBMh9TuZTDqdznq9bjQaENrG+ylQSL+77xzSFK/A9CkWi7Bfg6vearX68ssvgyC4vLw8Pz//5JNP4KKJNRYYLnYQgN2np6flcnm5XHLxfFdWlzbewfwl1RRTDJUhXh2+BRMQ4tekGBM+4L6GEU63H1YKmeVamiEaXMYNwV6J2iGqJrPZjHpHf0gKmzEmXyjUa7VsLucZA3wcg0TXurTf1EZ/OQJD7C4nXZqZOVsBtCzvDokJUQaeaQ1KLbSCOhBQYKAhOBntWcTqCwMbHYxtVLrU2LS2QtJlME2IxlXz/uCvLFimYTjdV6EB4ngtkRExcbMZZH8YVVdhVIuDB047561MKmfWJnVRIs6I3TuT+pNNEGQjEkq8NvOF+/K0NB3mFotlLjd/9HDezKw9V1aBE8aOY65bPdh7hPiKFSmMXviFwkMY2lngDkPSKh1LWHodO8DTdRy7H1SDeCNMrKGojfvdxs2OlNWNDfK3b0PZ7Ym6g0GswTs6jHFI64VITzQOftRUNgJ8GwFi/eHWTdvoq7nD5tGiEqN1z/M8sEBwIkYgmRonxHr875pj4LriOmIciWNxjCxXjuc5ruO+FUW9afiRAMHXuDZp4JYH2p8cr0hEjHFUdQpQrxb049OkLCF4Qvl8HpQFEAJQmLSkJzb2VWiRbmtesLq20TXOaomwJLMsyvDGhq2NWhlWR93GiSybdCoY0WkxFqUd7xlxwtBZryPXXdVrk48/7hy0/l/2/qxJlivLDsb2cfeY54iMnG7eGcAFqlBD19hdn2jsJqkmJTOayfSiB5npXU/6L/oBfJZoMtOTZPxMRhqNFK1ZYhcaXV1VKIz33pwz5nl096OHlb6w0z0ybwK4QAH1pVsakDcywsP9+Jn22muvtRZxlr7bn2e7i0Lfz62Wnk2piAUIpq9EiqlTTH85mtfFYP6vI3tAnNpe1WrwxHEBEIvjOWI08eu2PLaN0xE6IXrUcrk0jmOQnf0StxBEjOCUcgLkLRgFrNvor/pP9g4dvjvuAOK748/riK2CiBULhUI6nUa0jB1MpVIB+wmxKLbpxWLRdd3j4+PhcNhoNBzHAUKKcOvi4uLv/u7v/u7v/u7FixfAKLkfgu4BUAZo6UJzE1l0hPRHR0cvXrwAloHUNCJGY0y9Xkd5MsIDSruORiMoNtBDieRH7krJ6qW0Agr5Uc/L+Iq6CgA15vM5YOjpdAo9yr29Pc/zQPVCMTWYyCAkzufzy0UnCKDMC/nI4XDYarVmsxk05rC1wlcA9sX2BQAxmtdxHADKwC+IfQNkx2VDiQKAL3daoOaRnWetRTuXy2WQQ7X+F2l9QHnAuXMcp91uf/DBBx9//PFwOHz06NEvf/nL7e1tKiEEQXBycnJxcVEqlXZ2doAxSWTUDiViqJF0Oh1AnJ1OB/rFzWaThmzn5+fn5+fwrAMxttfrUaH4ayy105s8a5erFSSzgbkzogZSCZgpFkYyKkMv1SwtRLDaPogbVkAVMbYCXenA9mJNNJReIPExHA7R29PpdLVa8VJ2MZ+1O4N2qzsaj0NrAWVCH4Yl/7fcb2E4oPIRbGUwDdHTkuW3y8ViNB5LKpXL5cgZ0dpwpBzijqikEUM8wUuFTV+pVILTHe7ildyr2LY+Jl0nCXMwzWAFTxaYOMbsaDSCuLO1FtgcBHOAtoNACqwBYy0MQ1YuQ1EHGHE6nT44OEAiDZAriPmr1YqAEa8KD7RQKDSbTaDkEhWnu65Ln8+vCL0lkSxK7uARQAkERGCW2cawdeCS1WoVTwfzD2FKlNBy+ABPR+dBv6JCDjow+kMqlUIZ+GQyQfUJRsFyucSMAUkc1I7E+KQbbzaTydy7dw/rQhAEIC5heAIwwgVQkhiccSieA5rHvIQM0NnZ2WAwyOVy9+/f/+u//mum0G7oloxpRVXnUAq2WCzu7u6ORqPVatVqtdrtNi4SGRFMOCBlY8IfDoeQDNKqL+TOSCRdyr/Gxvt1pMgYE5kaR8Q35RZVul8OZrrhyGWzlUoll897xlCDWDNhJWFptZHJGPNQwmjCJCZRgQhUxWMM4mQ5c9Kq/oacJdMAaEZM9TFTL3StWP5AlwjEUAbdjDF6KeWz6HPlqQPZR86xSW+xjb0iIXlhQuM4JsyXba3k593wpJj+uBy4KTEmgTYY5WVPxcwwilFgTAdoOCOyiiJwVyQUu5C1cXrD1GzsZfPOG/3Q95euYzxPgtCEvoGOB8wVaAgG4jzImMjuYzLB8IeYFXZodCuNAUNcnZNs7tgCvQoCb702XzBd94WQ2S+RfEpW698Ahr7yVLFuf53CzHViFMkBEtPvprQaW5W4sP54TApDIpbxDcHLdfceu6+N1ZOyiftpjDiOOObSRsw1NrSCLm+sNWJhImZDE1gnlMsh7K+s9df4kBFrRHDd5nN11EuSpzGhMRYAMkDLrw29e20ZPDQfJhas/kyzASBm+SOdIWEkAx0qTEd0pqX6FpkTG6lLWjdJy6fEdn0xAFfLqSeTi7FkW4zUqkVskn37lQmejSi/rnrRiY2o2MUT4/q+cV3ruat6Y1wutyScuK4zmaUOzyvmVGad9HrhWojuUP3WjdDhdVST4V+1pwsUcKxx268eUdkEazjplSeqssQV4zquax1jLy8QJqg3Co7fMGFyHacoVmq5FBHX876qIPBKJC/ii6QjAWgvQpABJbsR3diNlJS8SML47rg77gDiu+M7DQrfsPPD2g+zMu6qqbc7n8+73S60HYB7zufzw8NDJPFmsxnkLLPZ7Onp6Xvvvff73/9+MBhgz0d1XcS9wJT1Lhwl2OAIw7yOddasu8/lcrVajSW6KDCEMxuCZIjnas8WXanNAyiw3ovgdRBpqf+7Xq/Pz8+Z9kd8ApkFbHfOzs4gl4Fic9d1gUGAGQdgCI1Dy2MSRRGgotlJKwaigb2O9pZB8ElneWy8ENijoUBZYnJVfxCx5WKxgAoBo0dC5PgrzkB3e2iJvnz5stVqFYvFe/fuPXr0CLgz2hm7wCAIgO/rLRHCe7Av0fJQsgb0BvgSvQ5sayD+OOdoNMI7k07Brzk1EosWIq8zHUmK8mUmBWAjRhzz00A0yz5AGAIoGGN4Mm0BSBHl4akon71eL/31fDETf+WbMPBCyXvFdDazygWz9Hg9n4XLxXw6ms+Gi/l4uciRUXj7BiH9B0BbOp0ulUrFYpGpjs838djaKtK0rihk48TKD7X9TowL4DhOqVQCXIghnHxbchOJS9VuQsgrsG6U4QH6ar/fB3wDvBjdHugbJh+OAlAOmb4CnIRcDtJduGvQLXHv4/EYYiAUo6BPJuWVY/EJqY7ISKEUANylL6offRt4LupIa9KECUBjxmg0Gvv7+/QMhGoB5QVwL/AIhUoG/foIEBtjcO+gTmPew6koXIC2BcPa9/1OpzMYDIwxzWaTetBwCwSJmNLVxWIRsLImoesRinbb3t6GmC+0dIDRh2E4HA4HgwH1diB/1G63z8/PDw8PDw8P1+v13t5erVZDEhQqQEdHRyjL+Ku/+is96pNYA4Ywe5GWOuH0mM1m8RXAvrGg4H6hOAza7O7ubiaTgWYlSJGYJIE88uToNoDJtG4pVzTNqNIEf0byWAiwoJCDmTQFpX7L1zQb48hms+VSKV8oOEqvPCZZrvHfGJCXdGKkzo9mEGsxcZ2Ki2VuYriDluy4jqqJZgeyz3QFMWiWYCcr6JODN4kOU9WUixQ1NPAE9RdpMEIinfekWHOsxfRTjv5kRMRznKwbZN3QT0mxIOlsFConAeIIC/gcJkgCxKkIIHYjLztfJCM2JYE1S9/M1u4ycMW4rhu4rriO4xuDzQ8AX1SPUbQHXRd6xKPRiFJFyLUDpdLWmrG7Bogf+5Mo6dvLApogSG+Csb4KM0OPLA1pyaYaeT5TakpoK9evQj5NAr6xU+HkVEnGqqGHjC7N0Yaxsd5LtYeYk54m4GuKsTb4ipk93nC1MQcIbYOWlBeIOd1FsJ24jqQ8yaRt4FvrWScMQ2PFGAltIIENAzcM/MDOZ+58nl2tUmHo2NBaWdlQZDVP2zArvhV/bQNrrXGMYx3XimvXrqw943uO77q+5/meh21SYCS0NvwWcodjWzWm3Dh/6p4Qk9LCHFgul2u1GkxTJLLs07LaMfF3rRwiSoRkY0Yw9uxEKZvFAkyOoBiSG1vKY0zhjZmGjTuumEI9W0zXfFDlTIPdnuca4wa+CTybyazz+Xmp1M/nJpm06Q0y4tjuIH8WBjLDGSNoEjBxWmR19ccoErF/lVn8utDhjWBxEjVWZSXGMY4jxjHGEYG0/Fe7DOwk9fjNLJdAGb68mzA0JdCkKZG5SArlpSKeyFLEEUlFckk2etvqDoS7O+4A4rvju38kZfJjCx4qgofDIeADEPqGw2G3210ul2dnZwBnfd9/+fIlAkvEKq7rvv/++3Rlmc/np6en3W4X3mvUAsPv4KyBoIeyVvwVbE1sGQeDAeptGexh+1iv109PT33f39raKpVKvV4PHnFAt9frdblcBnkN4RNXZW40CcISrdBFqdSHLRQKCNpZGgwhi5/85Cc///nPfd8vl8svX74EYwUebtlsFu8EuAwlWUQgNKlg/I9mRIOANJ3JZHZ2dnBt0+kUnDLoNmB3hfhTRKbTaSoib6J8krtzx3EWiwUd9ujlgqptoF1bW1tg4iC44n8lkmhcrVYnJye//e1vx+Px9vb29773vR/+8IflcpkCcwBEAOs0m02IUCOvAMUM4H1oJewaB4NBtVp999139/f3CVGdnJx0u11QX33fHwwGoBsD6Usqgr3eVMmVoaHKJ/Hg0I3h+xfzKtGoLsJ1oI3QgMYOGFgk43P0PZA0me0AgI6ewEAXESCQkUvagjGumxaTDU02MKH1FjPJfvjZg+EgUyx95Bbn6XAd+M7Sd6ZzmUyDbH65WCzDMOC29pV1puge6L0YNRwal1twrUPnOOl0Ol8oYLxjrgCBVKPShKIwkyBiB0IXo3WQW03DpZtDcR0h649g98+sEr4XIBrklQEuMCqAkCUlZRSn43OMmDI1EEOAxIREohwAl6FETJl18GcRRCFVQJv1JBeGaDVtajCQGcl8xc5P3IHl7SihhXp4tVqdz+edTge8nsePH1er1fF43G63Ly4uJpMJueFQ6f3000/BCWo0GvV6HaIQgG9yuRzIxdBTRn0DCsDRCJjHWBsIFV3UalD5Ee1A30vMnJjWuFJgbDIihdg6Vge6CBIgw3BDsIrbLxQK9Xp9d3cXSU1o6UAq5969e/l8fjAYoFzj3r17EMN5+PBhrVajCiqXPF0B0O12oSAEzJcKA47jQEOJOjAY+A8ePKhUKigfubi4ODk5KRaLJGhjGkevw+AiOoMpAhB2p9MB91lHy7Flnesa4X5tJ4V7ocUl/qlB5Fie6YbeyNA3acjz6l4qks5koEniRLMHay9E0dhjarmSEJTkZKvRYS25QOhZo8Mxd0QNKpE7tlFiQgN5rMPAi7gdqslz16GN7GOqqUnAS6eUSPSmGBFTj5SVSIoAxGDHmPevXGXLarzSGMcYca31jGNMaMWxoWtDs6Gi1lxlEFtlZ28jYeKUQopT0Z8cxSzOiyuSLkgmJ5msyWScVEqsmMBa37e+v57NFuPxZD6fofUw7WBIIgWI+Zk5PGx+mN+ivaEm9TNJEJMZIaSOTZdZrdJfXPDnOjaGrnknfqStUzUofBnmRbRNdACU8HOLS3b5xs6zERHWaT9dAxQ7Ce0utIhW0gJXr8gEiGOl/Unla2ZxuFGPAcR6CMfAfVGa3fqyeYMaUGY6NglHEg0MQxuGVoxxXUdSjuM4EpowEPGtY2GxFYZincAXu7YSGN/pDUrn541Op7JcpMNQ8vlJuXxaLC4Lbt9JhbIOjQmsFWONhKETBBJ4JkwbuzSydMzKdT3XDY1xjPHCcBUE0Mj+3L5soz3an8a8zlqJAjHOqFTOwXAjxx+LvrU2k8kUCgX4FqRSKe5tJCqU1I+Daf7YChVDeHWCMJkk0JNeUl9Cu5Vu3FlxIMRg4pvDkJh8GVXCJBK5xuZKrspcKNE51xjHimPEcV2by63r9Xm1ss5mxEuHp+fLXMp311bmIiZyTtMA8TL671JkHU3CmF0zVzHiL81TN9fjwjdQieXzRcG4Io5AsOV1QRnI9fKXle+bTIaK/1/sSIm4ItloIUMLi8p3OiIZhbfB0c5Vb0t/u1Qm3n///b/5m7+5g7zujjuA+O647ZSaFFmLrVXgWwH4WCwWZ2dnW1tbqA5G+TmgSZCqdFE5ttFafYznJ7OP20HXdeFHBC0LcG9BPcOGIAgC4Il6N4/vAjFttVodHByUSqWXL192Oh1UGiLUB2YN9h/vjrtMnJAKxcTCPgfjol0C/oRgHtK9juOUy+VHjx49efIEu4H/9t/+29nZGaiv4/EY+xvE8CzZBlcXRDCIJqPymuX8wEEmk0mr1Uqn03Bvw/6JlwdxCbb5bDYDDg5gHbIPwPig+gp8nOwwYDTY9wAZQRUztnTT6RTyoGg6oGl/+MMfPvnkk2q1+tZbb/34xz/e2dkh45hii8aYRqOxs7PDSp9erwcu3v3798vl8vHxseM4gEphckiZUTyaly9fttvtfD5fq9XCMOz1et1uF/qw3N59XayKaNN3uauJROYoCeo4DngQeEDkEVMVlJkDdG/t7kXSvebCUF8C8R6kvVFJTSntIAhQ709BWLGBsTIa53/9h/LRfGeZX8rucrLvfph+Mhlmt7Z3it7eqjNctW1nlO/8ceez5/WnT5xCfrG1Nfc8D413G/FWWoEjr8Bo8HOhZBWeZXO5VLmcKhSANiJe1TAW5PwodIsC/3Q6PRqNkDzgBhoVAJprfBtBDK1PRzyIm3vMOePxGBo4EIfRyir0pdHu4TwbK7UpGwLhFAQ/5HBBBmE2m7XbbYTrEFWHoDBqEfr9PsUHNYDO2ZhZBFwDnpSeiL56H79Ckoiq1JnhgJoQWh6echQCTqfToMSiZB5zBSYrwrgExTBq4NLJ+AoRI5AaHaJzgJALyTmBgRlwZEwd2vVR52mA2qOoHIgzViKcFs+IxpL0x8NjRW+hHDPWCJSuh2FYKBTu37//1ltv1Wo1+NRxyAOkhiwSHtZisYB4N9bK5XJJCjwKU/QagZOXSiWSiy8uLpB4wCuaAMusKhcXNDusKWGvqomEG3HAJNSomVn4RY8mMvu02MjXOBWLiDEuUc5NFy+bKsSvmyhivMsYZhqjJWo8TpKGVFFz3SZVo+clzfbduAHTNfU3THoxkWJdRs1+om9T4yk3q9Amm5cf1C3mhCHKgoPACQI3DJzNKINRMLFR7j3Oph9X4QhuFG+nxXVtpmBzeZvLSzZvUikrxviBXS6xPK2Xy+V8vggCn51WA5SYlMAa1tXcMUQy1hMIssfgJOZurbVuEDhfRNP/lf0k2VeTkrtJgBj7RkyJmtygMbVX7XdsjDaLpY3dFQuE3jCwfO1zPvUm1JvoHoVlk9IBnPy5+lMmJUbk58NiKQ8nf3bOmLmfXNUKZ3UON/OxERFTtr2cDI0Y44pJB2G4XGdWfrCy1rdOKGLFBjYIjIgXGmNWkhoE9aPhwcuz3dkkFwamVu8fZFyvNs/nR256bZyULAIJxBobhjY0srLphZ+ar73p0p3OjBUDZ771OjTGT6fX2ew6CHzXdWLZo5gewjePEdtoq8xVSadP8EDpv4JqSPowQzQJaysWr5jDAcsc9YFupnM5errb6GIXG7yxhETMaDG2ULKfoz4yRs9nD4nNJzF1F7rz6WwfxldsbG4sEXBcx3Ud1zWeazxPXM+4jjhirC+yEllEMKWJlIXdiDWsJSbcaAY2m+jDXxodNskOcQ1eLFcZxObSwM3wn68vgGOvwHbOWuulUl8SRUtHTSeRRod39Z+8qZTKfYJxbCNw+VtzDAaD//yf//Md6nV33AHEd8cX3pUmgyssUaBfsXAP3DcAVbAegpjDarXKZrOsCCbsosMhrtA6pAE0w/AMOnGz2Qyl99gNQ0sOWKeWE8Vnwf3hPwHyIiTA7hZBJsg7AGdJtGEohWVbuyvo4krWYl+WrmQyIoKLbDabqJv2PK9Wq21vb+/t7eGLSGZBfMh8NWKM8XgMBAHaWwSnWFaMhh2NRvhGALtcBWlnAVQXaAVuDewkwDd8GzdD2PSA0wQyss6+UpSZnhLz+RzKwqenp+l0+u2333727BnUgRGZkFFCfTGC4ACXIdms66CBXAdBUK1Wm80m4Gz86ezsbDKZlEqlUqm0Wq1obbcxRf+aweHIP+RyF7jJxAbtSYBeF0WCO6whPDQj6QPaj565bmDfeCWbzcLQDMOKrQT4CWqwxpGUZ/21dAf5//yb7Y+dtH0aypPA/4Ez+VEhDJxhupyaPJLTdfBczHsm9U+p4rn58Y/HP/zB8NlbM2vz0L4ztyiPZUgGdIPgxaXltGL1GmMy6bTkck4mwyCB/Z+wiO4ADDvB89KGUbu7u5h5bumLpaWf5WoVPAW18YDAzQSIhuFMzpEOaEXpVPBsWqCGF6bjcCCJoHD2+304PUKwuFQqlctlqjOjcYiHJrVTuMEF2YSRMN//pft/TFNSW+KgwgCTPEYcUj54FlDLrdfroLgi8Ybei3eixGE6nQLiJNGVwhSYJOn8htwe52EMH+A4kOPgdITzEGsgf5+Ng8bEnINEJgjCOiUJgHixWHzyySfD4RBgLhwFEaZCC6jf70O9AesIbEUB4NZqtYcPHz558gSfZQoNIW6hUABHGCA4JMIxfvnUKPGMd8LvDjNkGIbUncBUAEAZtwP5aSRluaKhxcCIBycaeLTuVEnnMR1/ok002siYFv2cYKUkjLBuAzzdBrq9fRL7lZjmKxHVG84Qo9DecC9fYmcVU6LcaCx23cdfeY/XkZe/FswIIpHGWGtsaK0j1l4/EdmrSLHGCGIgcvL1CFM2EH51LJzBJDQ4syrLthuBoaQGKIVBbqZKJDMESQFcx3HMl9L8uVlG/zbPNJbqwCTJraMmZHAR1KC5XtF0CoSrGLeX3MNz0xLTaqDWOSX4k4uyrq+P9cyYgZhcZRDHWPx8NORNQ4yeADHZD/TC1XxPgtRMu24c/oSYFUXGOo4TWnc6M4Oh2xl4i3VmGS5964NDEFg/cFcmszKpYBVmziY7p/2908nuPJWxgZk3sqntdWZ/vi7663lxMlgtFtYGYq0N1oFd2bmTXoUFf1ZZ9WqroJJLZx3HdRxTKHrNLeN561x+GYarMHStdajkcoOmzTcZPequyY5EaJ7VlsiPgh9AJQos3BJ58CatOGNYP5+aJgXHMjcb66u0Wk5SeohpIfa3WAfW0HPMADnGPY+tMjGzQQ5M7F6SvqNXBzukqHHNrrWuH3jrlec4sl57q6W7XrjrhbHajE6ugr/44SsmquEINxnHfb1phMS3bMSXXyvpDb3Lipjh8MtuPEQyIuuIEUx9YaDbvhLW96L2p9YHWjh951N3d9wBxHfHn+8BJVDoQgIOBnKHMN51XShL9no9xOfM+hIP2qhUqBdmbPhQbTSZTOggj2gfG4h2u93tdmkOhuAZb8AyDIj26Ojo5cuXgLA16w02a/V6ndtNohKUKMXFUxCKuKqI4J2UdADTE3ugarUK2jJPu729DflIRNfcAei6OXBLUUQMphuaOp1Og5tcKpVAUoNeJ7ADfAsFVbl50oqfKNvX3DqtfanpJ4yXwP6j/ChwNCioHh0dodT69PR0sVgUi8W33377nXfeqVarUI4mxYyCIYVCoVgskmsG2EhECoXCaDS6uLhg/eNgMEin0z/84Q9/8pOfNBoN4ubdbtdxHJj+nZ6eHh4eUrRaAw1fkUd5yyBfi9jSfR4bXK3vTFcuikIgZGKfkau+c+CqUxhX40eoIgf1FQ2I9+DMqZSb9lKeK4Oh9/Fn+aOLfLuakVDEE6mK1EWMLPzMop+RtchYpCjiyHThH3bs0dlyOjXFooiYMITg101Wu9hmgbDJgZPP50ulEpI3EgTIW8R227HgUE8IJPLo0mzcNRsK4wsleLrH3mZfqDliaGeNDiDbQe48VVYZOspV+UVeeUzUGGGDLkEgrAbVSwxqTEEoGoBUrud5AKaJdV6HVuDMgALxXyYkbkkKuw5rkKuMSM2UgapvOp3u9/vg+ADBx2wJY5lUKkX0czAYtFottCdhUETpmM+hEEoVC5C/oM++WCyAqFK4gzUfcNRkcTEfHB8HpjWmsgAQw8ZTaz5QrAOZAEzIg8HgD3/4w/HxMcwGkY/EF2H+bLfbvV5vOBzifqkjVCqVtre3Dw4OGo0GsoOtVgskaIx0FrmjNKTX64GqTOwGMwMSeOhCoFNBnxGlCdBUyWaz9XqdZHYoxWNOBrbO/obkCmYJ9D3OGDd0EuDC1G9hHgWTD4p40MORlN2oU/FK2PQ6A6gvFl0mvH1ilkRJSQRJSEy4Vw/Nsb2OXPZKKHyj2ukrV5N1dND6j7ULG0XGk9VXmm2XdEC6ARf+6qgxJ1UB3GatH6Wsro2xrwMCjPrhexzFL46IZqGR1dqMx85Fy82nbcqTpS/rdej7EgRWxEbWXlf43Ri2rJFKMvW4uFD9P8mVjglba0WFy99fb376aneK5Q5jaFQMGuPa9Pm1Rdxewr468alV2li2oosnkqX9saest2Rc3GN5IC3bnUzta/ewGEp73XjU3r+IEXD7eJG7a739YIKQNx5T/2cOAInwqw/Fuo4Va/212+lmnh+5L1qyMut1zg/SgXWsNTZMhTa3lrJvKqHvpc5yO+1SY7afW889CWRcLbf2d5xmUEzn/Ml43g9Wc2tDK76E88BOrDPzMn6mN8q3JoXTs1Lapo11XEcaO8FyGeZyYbm8CINMEIC2YmPYuihZkm8YI7YaJlbzIZO47JbcYumpeGMeK7a9SULGouxhNhZDXDcbb3yzXkG4KOg5VhdexKjuyc65scYlJl6vd6SvTLJiNCBRFgZuELpBKH7grtfuauGsFsYGiggck3QII0kfPi2TQGz/tPCl+Rov4MqD+HLjAn50KZFFJOIBgY6pSC5Cih2RpUhKZC2SjeB4aBPn7kzq7o47gPju+I4fybgiBhkUCoXlctnpdCA3AaXgIAgqlQqs3vE28D1ZX0+3KG38ujFzS/M0YKb5fB5139zfw8JuPp/n83mglo1GA7RT+uo8ePAgn89/8sknFxcXMDrf2tra3d19/PhxKpX6zW9+89vf/jaTydRqNeyloHepQVLsDgkBa6SJgQS2whAQBDd2b2/v3Xff3draokpAsVgEoIadKEU2gLUBDTHGAKf47LPPUHgFSKVWq9XrdWMMkAjwSWG6rWvhsQ8GsQ7QA6vpQeuj2DHw2fV6jW9ni6FUHKERQBPAOiAsAxT+6KOPPvzwQyBoDx8+3NnZuXfvHrSSdeChvUQqlQqELChVcXFx8fHHHw+Hw4cPH6ZSqcPDQ5JNXNf967/+65/+9Ke7u7vg0qJJZ7NZo9F46623xuPxe++997vf/a7b7ept4nWJ99e+ewnCcLlYzOdza225XB4MBuC0whoLqmosrwOGlUqlcLXD4RCwl4iAPQGqICAwDCvoVNA2EImBcrmM1kP/Af4FdZEwCFOpUrvdPD/L/ddfZ//D/y9/kU7LPZG6SEYpPKLorCZyIPIjkbT4D93nq+L/7f3UPC/v7Lv1ivv4QVirWBuJ2208oHyyt7eHhA1AbeSHLjW7W610vX5p426MuUq+IPbKjqrHAqYFaqFq2Wt08sVisbOzo4H4V6aydF1tbBeO8QJXOgC4oBJfXFyAvJlKper1OiRoMHf5vt/v9zHzgIw/m83A6kWtAGbCer0OO0rkt4bDIeicpVJpd3e3VCpVq9Xd3d29vb1yuQyaKsmwOlrW+QaiFcxLYYYk8HEDRnybcUFMSoviYRqB6G2/31+tVvV6vVarlctllhewQKFSqaBJgU7S1g9LwHQ6hbJ5LpcDoAm/O4oSgpiMGQnRPonkIpJRsnGaCMayD3BpYQmIJqpWq9lsFgMKaTb2HChOjEYjjMHz83Noas/n8+FwiLYtlUr4LB7Q6enper1uNps7OzvosdAJqVarq9Wq0+kATYYWOWpTQPmnPhK4w0iu4JbRi9Amvu9PJhMAMaPRqNvtwj1vPB5DLimXyzWbTdCZUWsCNJxlMeiNk8kkCAIkRy8uLjBOYwZBSTQBr6CVMMlwGIKMDDc8XZ6SLKdN4hRfEQvePAWRth+p/Whx0qTo8EbQQdMSsephFcZCzHxMTIA4mWiJZb90/J909NIABydANDVS0eiEOCFcfDExasQqiYDLVfMxwqBMcWl5hFiNVIwYG6PLXYcmx0BAa60RwZRtwnBmzMJxgkzGXreIagUJo3CKIJIh1krEfoRu4J85kbwEa+lPnT9+ls4b2yyHnmudVFjfWtYrfspbWru0dh2Gge8HjmOYj5nNZoPBALM93JUJX1J7FHbB9IRgO1ODeGM1OobtarUKjElF+aHbYxYbaeMx6QauWZo4GQPRYkuANs5lWhfaYjcQ2DW+HLPejRXQ3IBoa4XiGHi3EfLb6B4WI2nqW9aqr7hgJNIw1zGO4KPkE9EIuwaIsYqx4kRr2sbEzR3HptLWcay/9s4ucv/4h8L7z/PrYmiboVTRe21YspK20ghlx9qyM3uam02z/swVX0RklU51Co1pJpda79v+KuhLsLQSiKzEjq1tW3MmTt/1hp438lL9lLNwzNq4nr3/eGZkuN2c+buzMEz5PgwR3Y0ygH9SmM8kp1+5pmQklhuQTVZvN8Pcr0xxJTXobsnZjy1n11nPbeRDaOD4Nt91nYnipr9eQrlWxEL2WsRzJZ212Vy4CmzgmlCizb9N8ILtJp2Hb8Px7afWgpqdilj7qUi7A79Q6NmJXsQ/JSIRL0S8Owbx3XEHEN8d39kjaXSQLE8DexEWPYhwsOmEbc5sNjPGIDxG5A8EMCYpdd3KqtdIhNYQ9BTFiQBskcvlptMpcDcRKZfLxWKRW89SqeS6LkyBstksIFoRAXEPwb+mirA2TeuX6XA6VgfHCjVKgiLav3fvHvR2davO53MNT5AAqIM0UNWgqowtL2BrQPD1eh13xNpqlBKzsJ2sAWx8eXLw12A9l8vl+FmowVLOVd8gGhms2OVyeXJycnh42G63z8/Pe71eOp3e3d392c9+du/ePRrckRCqm4hAD6q85/M5lIuh2CsikHxFQDufzzOZzNbWVrPZ1Np2oL/BwqLf74PNBwv4ZFnuN5A7waX6vg/BO1oa5nK5bDYLziNaEg8C5fNIdSAERcdGzyHnGgXmQCiYmUin01tbW/fu3cPJdagThmE67eWy7tlp/n/+j4W//4fKy4535rr+PSNbIiURT1EJHJGsRAGMSEXsfTMdeu8N3dbf2+rIeXNP/te/cn78yD66L7n8tfl1KKUCqAJ4AcSBuIbN5UwqxU8jbDVBQD41BTcAZEBxGwgUycLMD1GTFzgd0K5bIk2xqEkPEE4RkFWBd9xkMul0Os+fP4c6NiQUer0eLoMILCilUL4DeRMAseM4tVoNIw4i2qDM5HK5RqMB8BTGj8VisVarQZkBw5k8L+alyKomRZ3648guMAlBAZ/XQp/fmBEEPoKMFAjFAFM0eUfHMOjJWsIYH5SIGo/UAuF7KglSQBNwDAXrJSoOiBEq8UR4ZiYDWD2qvwtjiiqTFJEAoxnyEXi+SNggkYYEG9USs9lssVjEnAnZRKg6QHqeVdvkTVMQAxrNmPZ1YAlACuOaes28MKDn5OnrkmcUkWA14WjCGYCzI/uiVVxeOU9qwhRBFrSqFqlg54wFrjow/vpmYPZ8VG2SWU+2oFavSpKLY6UzTDBwztFy8IRTYzZuyZ1S0gcpGe3r96BnwmAAzxEII1Zz5N1pXkc3TvbkmA6MFrTRiTdRPEr0Mc7Y2tdXqxPomonrcBC5SgO83DKF4dr3xffHjjN33VU+b8NQYpk8UoNZiqulJFCBq3/WikHsXzrUSVGCmRksnI9fpiYXTsGExpF8xX/77fWbj/1mYx6EizBY+f7a90MAxNgyTSYTuBcMh0PsOjjlsmQBKSWWo5EarLdqsfGCt136zRrjLJevl0fMaTaWh7gOIE5mJrSRnS6cjwkNS0J1N6YgkWQuJ0kkyQtL+ivGIDBOm8koQ9e1JMeXhun5V44UDiU8Pt1QyRbDLK1NzDbdyyX4mfLClGuNI7OZe9HKHR0Vw6qVdJTVSItkRVwrOZGKSF0CzwlD59K2UcQ6Zulk1iZlFkXrirhiV1aCCD9aiLRFQjEzY7rGnBqZi4TGdW0qY0ZvTP1V6IjvOL61yBNcQd5fbzbuy6F8jvJ7iBkVXseTtdcf9I3c6C+nV6vkFC3Xq+vckDuUTeT9JJlJ97rYypIcLzEqsc6dsO/pyTxWHZIckvh/EJowFMeRUinY210Px+vzdnoUmoUx4TqyRwuv/pBNbBJ4sf3T4cXmu4CchkpKwlc1LhKZAeJ3egO6ipdt1T/vjrvjDiC+O76Lx800NIgeAPGENCr22dBbBA5C1TOClTE7l+TCGVsFtUICVRqJJgCJbjab4N/N5/Nut+t53tbWVrlc1juGTCZTr9ehIwkwZTweHx4eep43GAwKhQIicL2V4docs4XhHhohNyBygBGEQiDLsLe3V61WgfRxLQcgCAyCTEmytFjtDsw9n8/j5Ij0oGBA2IgwBz4IHjFfJHFYG09fFVBzNJeTlcW4R7Q5qbvj8RiE3+Pj4yAISqXS1tZWJpPZ398/ODgol8uAfVngrLdQtM7TXBLA9KVSifFVrVZDWTTLqAGFMJBGUTbiZIR59By/Tb99LXiZ/hYA7qCOog1pgEADNGqSAMGBwol2pZBIOw8H3jyZTLRkAZ4p8FPUs8McTEQi2kjecVb/6T8W/sP/XPjsPLOuGftQpClSEclF8ljcoKQjB96CSF1kX8KxGZ2YDz4TM5APL+Sj/5f8vGz+z/9HeeNNMSlIOm5oENClY7thvc37fOcZhsvlcr1cphwHetMsPSYKBuicOR6Nk5LQZ4xB4f+XI4kzeSNKHZhyulRpBAoG4AD3iF66Wq2ALKAfMjIJgoCyA9BYQOYDPNnt7W3XdaHAW6lUELegIKBYLDYaDYjbANjV86F2jOTXYSiNx2O2QKVSAZjFuoqvDhDrYF7ztjDfFgqFyWSC+ZZxOCntPAMaBwLiwNaZjspkMqxvoPQw7QrBcQMfH1klZsLojwSSF2BWgDL0hyTjj4ghxIWttahgYB4LtGs6v6EHAi/GKMYV9vv96XQKAZDxeIzVJJ/PY5Uh9AbaGvuGJnVSeITq7Uglot0gII5DIoVuULaBsDMzsVgsqDkDarO1tt/vQ4ZYIgkgpN+QMqRuia4K50mS6RM+OBot6o6nU5IAnXH7SarXN3BAY9VLpZwwtCK4SEB7WCXZDzWIkHTB4v3GDs0P1T5LSex7o1xGEqpLIiA0EoRGCpYz/BN9mPOP7tu87Jj7kxbiRMYLqV+mdtjN8Fl0LXqKbgSIuWfTgAt3aBjU6BWf7yLC0FuvZb0ee94slfKvy+QZRR8WVeOCEFqjw5koFJeIupUTWYoUJbQyHZnjgdcZuc7CGpFi03EzUimtC7mFsYsgWIW+HwY2DIX2mNB46fV6ULPRJhDgzmOWg18CpQm4iCQFcHUDgv0dGGMXC/c18TeTzOLrut91OQn94DbiYrFPXVebv5H4ufHMr7wddjaNSktCaC4J2yWHUgxri4m6cgN8I+ZrkzmeBIz4OTSM/8IczhgJfGexcJcz12ZEVhFmFEQpDS/Ci1NJoMmEQO8yV/3E0oqf6IssRRYiSxErrmvnC89fOdZa44SOoGuTBWrw658QGmaTIQahsjBFP7SnriaMcxDFEh7a6SHJRmfSV676zm10zdF83hhZPilpHVssYh1VJ+pEucxpnZ+kG2QMd6YTD9FhaGThiMmD6FlIy6RYa8NA1mvxXNtsrp+9Nc/kZ6VD79ML05m4q4W5LNFIRcZ0fqR4QIVioxDk14gR203/jbGYk+iw+dbDxE7k+JeKRihGaxj911NAcEyJ2F6l7Nwdd8cdQHx3fBeP2GKml89UKoWaa7D5stnsaDSazWYPHz4EaFipVPr9PqIdLaV6s+plkoADGA5AAxyKGKmC7VWv17e3t7e2tgABiMhoNKpUKtVqVSIOrDGmXq/7vj8cDgEEr1ar09NTBAzQ810ul4idNHUIaBHiqNjeVJTCLPXLoK05nU7L5fLBwQFZZtxh0HUhloKmEx1ABPB24VsFriWM47TRFlR9gSL1er12uy0i1Wp1Z2cHDG4QjnBh+LiIQDtSRECWRLEzIAmyhuGM1Gq1aIWEsGo6nUJpend3d2dnB1hJGIZ40FqamZu5GAeE+D4udbVaDQYDoCFPnz4NggAgfrPZfPToEe3pfN/v9XovXryYzWa5XG48HkPAhPZ0SerEN5FFDkMoh5KgxxpMncPYGIDhd9ZEo7ocLUbjDhEhXw+6zBDUrlQqIFk7jpPPZ3O5/HSSOg9L//1/VF+20uu8sU2RukhJJBcVOtmrmzDvag1vRSQrNiO2Id2O/Pffmv4H8je/knxFclnJ56SQ3zw53KDwEFob+L4T3exyuZxNJhlrKV2qCzzR54fDIfonFRIBOAJaJbErBsDdfiojOkzKGxm72juF74TSbqPR2NraQi0/xAeQieFjBSyo5V+BnKJ4Apkq6CbPZjMSgRuNBhQboDObtB3XvFoSTDhRYLjRM1Pz/V/LENBDlTLBSM/s7e11u912uw2BGgxSLeAOtBRKDsj3VCoVz/OgyEH0ajKZQIXZGAM9BNwR0BkMB4nI9WhzRphASKHXgY6B2QyC7LQkZTcD+VdEarUaTgiIFkBwrVbzPA8fp6gIrgTCL0iVIRvEvrG3t7e3t4eui5wfefGwmAOchwoS8I6RC8HjRk92XZclLPCvo5sobrZQKKAoHk8cEzXI6alU6uzs7OLiggkn4LacQIALDwYDsvUZT24sYNe6t5heaA1PVzrM5OBB07o9SR/+JnR+HMd1HNDSrGJxoj8Q4dVm9DqS10AAdeT5Ni73G+EDe432sWziCG9kdOrtDR4Z1hHKIHCiAMiLbkPgm5kznSFOAsRM2eLNMYCYDGKSiDdKTOj5NiZ3gOWPJR2XSGsYplarcL0ee95c8QY2pRkVl8q5ChCnRFIKIF5H74TVz+pSYsKuxZ8YfynzgZGJiJWZCTvDcDxZLxarlLsMAz+0IZ4VDS2hx42EEJEmNFE+ny+Xy+VyuVQqUYsmhn6yffgsCBwDIHYcZxUEYSbjuG7M2/b1EjiSO+rYk4rZ1l0n7XqbdPhGXrxWUE2yHW9eXDZqAZM2kSRL3uAfuLGLJq+fFxmjS3OEcpu6iaRpRWA9aFzXiFjXlTB0Vis7nzmrlRNaMSmxKSWc4kRbr1fCbeEmZzATET+9aCysP5c3XQdmsXLnC+MHxktJyhPHxYMzYiUMbWh577Jx8H3dkaNRs3GMic/5ijpjFD9h1goLosaLCQTHUggciUkB7pj1XCyxFysxiSHCWlg8FrIlt6Ba1p+FpJgNGAjEgGlWeWK7on0y0FD4IlaNaFoP3RTZSf1ArBjHtdvbfqW6aOzMMsX0YOUNBs56bKwXYT8rkXX046vEm4lQ46RPnf1qWG0SHZZN6hY2ARDLtxgjTkcNaEQKIgsRR2QmkhWxIuuoqbPRgF1HAzmMPnsnMXF33AHEd8d3+kguafSIRyk91ksgKVgLfd8vFAoPHjx48OABVGvn8zkJlUnL4xuUngiOIA4BEoGACq/ANiefzz979gxSsLlc7uXLl0dHR2dnZwCI6YqQz+eh9QkAF8Xj4GFhOyKRV5LeAZAZijcwQqb6MBdvZn2BiWxvb9frdZDCeGt4A2XsCDNpSU1az+O76M/GV3C1AOiXy2W/3+90Oufn59DobLfbnU6nWCwizgHCC5oM5Q7Ap+v1etDTBAqZz+ettcPh8OTkpNvt9vt9IOPUT8jlck+fPs3lciCxQk95vV4Du9GhRcxrgjshvGexWIxGI1AFPc+DXObW1tYbb7yB29nZ2fnhD3/4gx/8gAzi9Xp9fn7+4sULRLydTufw8LDf72sewTcASSRHBzngeKZ4TMBriDhg4wudDUAPlEMlLgxMDQ2FkBt4AXoCWd5AIXG/6XTacdx0Klgu7PMXlV73wdmgGFRcKYtUREoi+YiHYtTOT++6HJGUSCGqiMyKNEU6Yo30P5X/9+/l92dS9uSXP5Rf/OQLt8xyvfYXC8/CX97OF4tOu52aTkHbRCthxuBAG41GenRQwZDCL/l8PpfLsdz7y4XTkhAu1CXzpEZCFAIywc1mU0QqlUqlUkHJAt9GSuZkMmm328vlslwuoydgc18ul2u1Wj6fB4hJuYlqtYrbIYylr5DxKkIslvYHQZBOp3d2dkqlEoiiJONrQ/nXlRok04cBmDFmb2+vWCwCZ2FvZPwD0ivl2pH7QbsBQkLJBSZhJKUwE4K6W61WIbNLhW4WhuPuSAMnU8x13XK5vIgEwelQx4unNDO+DrAaSMTA7oEcaaogUl+o8yD/lw3ium61WoXqOtRRGOYR3cjlcjAeZE5Cu67THZSzJfF9iejYGBoUIGL6AR9B/ftwOISIBNMG7OpoBKQuNIlpY4mrnkUBmoNVjZQGa024HFPcNukxRaedr53EYwxL/XX5PM0hNTqMuTdpVS9XVa00mqxhglfCatfBUsn5R4PFukugC1Hrif5aZBkvFgveFwcaU9cxnhozl+xFAF8oY0IVF61wFavavm5hxZUzFYEDi5SImCBIrdeyWk3S6Xmlsl6vwxt86kwEDcfwMldhxKnIFMhGFTAEjvmDV0KRlPXFXwWr1WrluH4YRpUQYplfAbcayl1kiyPdDuF45O2w84k5Oup8iZ4u2AF837dhOF+tfCUD9Vr24UnmrGbLaoCJqR2Oi5iOWVInTTZJdcfEgjWqyzICHDFjsZiJXCxfoksrdFZD9+FYXcJGUd2kmHhSIpxUd64CcpVury+P1nzUr7PWGvM5POd54rqC3FMYmsXMnJ2lDg/T7Za3XDmSV1l5oLpuhBHHbMFiCFqQSOGDogiRiqJIWWQa2V65EqScwTRzcp7f3g636l6jLumUNa6JDBzFhhKENgx0b/lGFdjEGDHGu5qXggaU9vXFNIXUL1SboNfEpCnNBjVTOLaRQ/eOrb8U6YqlvvTeJilVkfQvjeUFY6uGKFF4PVp1QISJPSafwhEd4yVwA6DT83r3Rdxcu0SGoQ18G4aSyYTV8jqbW9Qa88Ekn/vAOiuRedQvPJHMVYx4rQBiExGKw69NYsJeI2ShAWKWlfxJ1bNfccB9DlzgiUjmcmBeLl4ZkblISrGGV9HrC5GMiBVZ3DGI7447gPju+O5jxJKQpJSIKQbgFUu74zjlchlksXv37v3oRz9aLpeffvqpLg3WBLdkOpfp/VhxLqBbeNkfHh6GYQjHM4gae573ox/96N133200Grlc7te//vW/+3f/7ujo6M0339SmFgjagVO0Wi3wAbEFAXgH7Im8Vwa6MS4DoiAs0lq3F7gelEwhzhvDsIBQADcBxYlsYpxWS47CFG69XoPVgmAGryAyB67R6/V+97vfQfYBJe2oggeZGkXQQDpAPrLWQuwVpdOdTgenqtfr2Wx2vV4PBoNOpwNmDYqvwRdG1FSpVKiU2ul0sOfW1ABNddTl/BpHGI1G+F5jzIsXLw4PD3O53JMnT3Z3d8fjcalU+sUvfvGrX/0KwD2bDnAYwLKLi4t2uw2YeyMC+DWNgngYG9kMok48nU6Px+NOpwPMt1gsoqsAIAYyBZy9VqtlMhlI0EJmOuZcRKgIwBnAuOFwOBwOPc8DvzKVSrmul8vnMplcEJZct+rm08Yxko1EJEAKWIhMRLoiGZGcsv0xUSYcG526SFNkITIUqUsnLf/3fxTvTEqB/F/+T18AIMaN+L7f6/dlNCpYa0TCMBwNh5999pmbzWp1S5QXgB+H24RBH3osCaTQX0ZaolqtVqtV9OovGn6Tkszf6SkEFF4HvdZa6KjgyGQyQECA3YNlT5gbrkdnZ2etVqtUKk0mE8iGLpfLbDYL6eF6vQ5Ugtk1SEPg3kGABeSKa8AlZbNZTJ6I+VerVaFQePPNN2u12sXFxcuXLzk7acz6C6HAyb4dk31kGgy0xEKhUK1Wp9Pp4eEh4Xu2Hr4dHph4mkgyaVQFIwIudsidFItFSg9TVAHwN6s0AKriDblcDnoRqCPxPK9er6MLiSpWRWyJD3KuBoKPx0cBCky/xWIRJqv5fB7n73Q6sIPD3QGV293dffPNN58+fcoaCABkIO0SrQC+DPSWOsiO4+RyOTxx4N3EbuBeSFNWsJUxD6fTadbCo0t0u11rLRxEkakFcxmWiWh/IndcAeWq/ZTOcHAOR1FOtVpFppOrGHzwUEcSywgmZ4BvACD+nOqr8rWkxDKRoCFjrkob7YN0xXGMdybXeNzfcr2IlRtrVW5tkMWUs/5eUNQxxMgs01lJDWfHQAqAC9hsgJiP8YixxkxMLOXG1CaGkl6PeEmYunHMZjN0s0ukMgi81cqu18NMZlarrdfrmyi05ioWYCMGsa5xiWkQB1cx4pxIMVLVF3EroZv2A7v2/fVaQmvFcVwRE4QBNmCz2QxpV/g6oE1wv4VCoV6v1+v1crkM+rAuG48BT7FyeI152TDMrlbr1wcQS4KZzv6DaR8LBC1AOFnhgrHh5LMGJxEfTKqp6olay6axOgoZPjqOar0RDVLrupYYICtXq69o78FqlVgCQ4+IJM0zGaHo3aZmCuvcoQ5GWEOgaSLqLpgMsJ7rpjOmULCOI5OxOem5f/8P6X/8x8yHn2Q7Q8+WRKoiJZFM1G/TqnvfMCOaCA42UZX6WgRn8xVwNhVZiRWZZFKftcvOH1KB49erUi6ZvGvFCN0ejWuMCQOR0OKLQ2ud20xcrwsdptUjAWIKrzFJxg4chmE+n0cmvtlsbm1tFQoFVHlSNElzcZIov2YQa14wn6mWGNJ0HKYrNI4c2wi9coGL1dIlJSwkIY3Ct8V0F3ke3CaV4vlFGBfYXTC/EgSBH4QmNOm0yeT8SnXtpfxSMXQDG85FQpFAZCriieQigHgV/eJFs65JqE986TXc3A4m5j/DRGrE+XYTbG00VGE6t47kO0QkhTylKoWxSgM6Fb35jj58d9wBxHfHn80RWzgRdwH/KhQKpVJpNpvl83kED6VS6Qc/+MFkMhkOh91uV1O6rkMldFo1WYkPIh7KikejETzxuLRDyQGgDKi7R0dHgGmIL+jNJS2DSH9g6WVM3IpsC71/ZfSlE7+Autrtdrfb3d/f39raiu0tABbogJDRoJZkxe3U6/WLi4vVagVQDMXUQJ+xsUaQc3p6OhqNINqLTRhwCoRt4Jdp6iVAGVwqMCkRmUwms9kMCDLqwRuNBnQ28/n8zs5OuVwGAOr7PmyaNAFKB9I6Ak+KEYuq7gcuNhwOU6nU1tZWpVKB29u9e/cePXpUqVS0zRRYw9PpFBK0nU5nNBptNP/5JkdEGASAC8n1Bn98uVwCAQRTSRtkYchI5IcOQEqLRLODMUwiLgldUTxrSBYAbGo26w8fhvV6r/V/zZ3+fW41dy7pV2kRKzITWUWBQz4ipOSi2JvqE4HIWmR5WRIVZGSUE8mLhBKkv2CzhCGY1G6kPmmtnc9mrVbLyWRYBg56ab/fh4iq7/v1en1vb29nZ4fSKJwTstksolyUAEMd8ouGOuy0gF/BJwUPDqgBd+ScJUjZw3RHazuAwtTKWK1WFxcX3W4Xygmnp6c0MYMUAIYPKGkYFGT+Qh+m1+tNJhNAjZC+xfDUIr+4X9obgg+Fi9SysLcfBde9U1Or9GQI0Nb3/Wazube31+/38Qa0DL4dmBSwzr29vVQqhdchW4xyE7TJcrmEagrIbmhqJB1psQUQB/eLdAvzhcA4KD0M5Gs0Gi2XS+IL1GwBWx/sG8yHwLYwkWJahpIJlHPK5XK9Xk+n0+VyeTqdootC8AG1Dm+++eb29nY2mwUQA49NoP+iNNwBfwBrRq/DOoVqAM2lYpUGsF0snRSKBZmXQkAUO4bgKYNt3iDyi5iLGH/q/qN7spYeZl4wm83ieZHLjz6Py9Y12shrxmbjWzrUfRUju8uFxnGcqxKWOjeZrDXWpS3XdfsbWMa84CSxVAf2MThPrvrZajo5qygg65HNZpH/4/WTI0yQjt8IJQp94zG+Gz6u4WCMAgwQ+p0ST48BhRvt79AZsH/AJoR5CALE7nIp6/UkqqcJbwaITUKS0lUwgXtVqlhU3T3h48znxbxOxooT2jAIgsC6l5imOGL9S3cHXDCrB2q1GhRmWNgB8gG3Q0maKlubMiZ8pnhA61TK8zwbrSNfK0CsC3GIaWKLqIF+7d+Iy0YVhYbAMPxjmt30PCRnQkvZEJjTekfQ1eEkoxMhvBeKk9C5mjclkcEJgUWiZtpNMZbjJMLLvGDMsZnVJzFbRR3OsGIpunfrOMY4JpNOi6Ss9da+CQI3DIxjbK/vvjxMvf9P+X/8ffqs5U08126JlKNdlhNR4G9TS+7Q0S6iz4ciS5F69Fd0+JlIIDYw05V3Ms8tT9NOYf344aresG5WXMcRC1zNuq6FQpXrWBEs4vabdHHGJOIq6nqMZ6NTZdjgIcRDegYMYgQyWrxYlKgIp9CY87DWBdJAvx65MU0eUUamSbvFje6LNyxb/C5OmDHDT+1JI5uKUbTzCmYqhrqIIBD/arTd2tBaE4YmCGzgSxiKI5L1JJ2yS0eMsdYx1oj1xa5ElhE67IusFXsX6DC1JsKoN35RdDipIGyuwYhjmiqsKfmWaxB7Srs5iHSHCXOvryoRBxHqto40i907gPjuuAOI744/C0Q4BvmxChWCv8YYcPrOzs7AmNvb26vVam+88QbkNX/9618PBgNGqpSg3QgWc/fAbCoQhwcPHjx79qzRaDQaDYTE2Fxi1ws+Guphd3Z23n333cFg8PLly93d3Wq1it2JjgyxyjKep60NvzdmZpV0edbRGqAuiGmcn5+32+2dnZ16vR5b+GmzxuiL/jA02MHWOZvNNptNIAKu6zYaDQAKnU6n1WpxA40PIvADIjwej0lyxLYbEEOlUkFOXgsE44PAVoDFNJvN3d1dtAaQMnwFIV3cJsqxAeXQVy0ZeyddTcihBijW7XaNMU+fPn348GGj0VgsFgBf9vf3gaewSwwGg3/4h384OTl5++23Ly4u/vjHP7ZaLSLI13HSX2fCeJNwtlYkiLEAKFQikSs9o32o2a7Xayq0sA8A9WO0yd6FWDSbzdZqNRZg4vVcLl8ul/b2Cvt7qZR4MnAkI1IUGUeljmEEDYM7kI8y9tloH4Y0+FxkKrIQmYusLj9iyuI5ksp/4ba6bA0+emtn8/n5+bmTyYA6DVh8Pp/3er1+v48QF2X7+/v7mrcVs1ZHz6c05BeazRAbA+cCmMuBDPwdAhfEUNC98TQxyYDAjsgWQCRx/729vUKhMB6Ph8MhucDlcnk0GgEQxANF/9dRCvpDp9OBxC2Qa8TPIPKLCKnomPpw5YAsQQ2D/sxrFCDWyTwdt0BRodFoAFrCpQKspwkbJqVCofDs2bPHjx8Ph8Ozs7Pj42MUQ+TzeYxuFAQAwIJGPIQU4K7GEnutsqpje8CvyMGgfdLpdLVaJYpKSVAqMNAED5cKcV74gPHaIP0BIiHm5F6v12q1cE4oyz99+nR3d5eCsJwqRXHfIP4LV0nc42g0Go1GAGXA6GSAqpORi8Wi0+m02+3VakVBFfR5SMNj7OPakNtAzxmPx0Bvx+Nxq9XqdrugV+PrKAdBvzI0JqXn9Sy9WCxQaIKP42EBjmfGQqM5XNO/qBb8V+2uxjjGOFHwrAHipPmeXK0lTzrLxTDfZNB+M15ws0KxXBVdZRk7UUWs1Mi1U4BblLhtbDJEXor7GcrZa5yXRFfkqLCyAx8kW59Cxjr9n3Qw03LtmELRGzETItF+uQ4GgbtchqvVUsRfrYIgeAWDWMMHWolSFF7gKKlijR3HwOJLcDkUJxAJjITQIRFrQhMSl0RCCJRh8BbRJul0GtLDGNqx1IJEDL4kFV3rxYPQ4HqedV3zOrbfN0zR1J4iQExQGC7HvH4trs3sGsVeaf6sbyeZ6afqEb4Xuxr8vlgsCBAzrUVpmlhpC51pcWiAmNsbLMQ0CeSulfeY3G9gCFDKVoOSEhXsM4Rhck4ne7j/j3gboXGM5zmZtPU8z9rUcOgMB+nlwhWRQd/93R/Tv/849+IkNV2YsG6kIFKI9l3slu7tAGIvEqYII9ahH2mbUmhlAYBY1iNn3E0tFl6q4/3DC8cr+Bdj1wsd6xsJjeuZWt1ub4WlsvH+FExME2kQa9NvvWrESOVIVqH8tFQqoSYV72d5YqznU3iHDHQGbgRS2b05vXPbjI2fHmVJweLrXBnlqlLKxuVgoyCGlgDSWkNy1YZHlAgGxo6+L9bjJtc1xzFhKKuVWSwd33fyWTnYC8dPwslYrMgiMBNjpo4sl8bORbIRTOyqWXelmMVaktioyfmGaTwGBJtN/zSJ99ur/3S+9T51RulLeFFFyzK6eHTGMFqM1ldN6kxUKPBtFtC4O+4A4rvj7nhFBnhTUQzXJIS42A3X6/VGo/H3f//3R0dHhULhrbfeymazBwcHqVRqOBxOp9N/+qd/AuVT55Bjwv9y1byCiyK28o8ePfrVr35Vq9VyuRzCWvDmgJIArMSpGo3G//Q//U+dTuc//sf/2O12f/SjH8HJjdQDxEtQLaCYY8wGl+FuLNhjSKxrroH6ATydzWbAKVC3qJsU9Fu98WX5MPBWx3G4Yy4Wi41Go9PpTCYTgIPlchnV0NgVof4XTYHdNpACYLWpVKparUIaAjfIYkO0FbE2wMSgyJXL5UajQUKTRA5R8HQCBA84hqECdQA2pt8JhJEGC9befD7vdruTyeSdd975y7/8S6DDq9Vqa2trf3+f9eY4yXq9brfbn376KZ7XaDQ6PDwcDoeUrov122+SR8zugU6F/SiCE+LCzHOwsA44C8JUdCdE7/Q5jNVdcjOt4SSEQ9VqdWtrK5ut+n7mRz9Y/O73uZen3rrnhBlzyWTBNmUiMo42fASFta/xMtov+lGRY1psXhYr+ccP5D/8f+TggbzxSDJpNPKNwY4KrGNthVsjCbHf7x8dHeGxplIppDEYfiOiQ2JJlC8TMI4vQc5CzwRt+fz8HGfGRISxSXReCyNq0B94CnBeZGVoQoJrJuMJoCRrFCClB3R1vV5nMhkopDuOA8AChKzxeNztdiFEgJwNTd4Z88zn87Ozs3w+PxgMqEtL8PQ1yr/GgiWSbsi3BXOW3llULQBmKiK1Wq1cLsNQcTKZMCUGEh/otODVUmuCYRVaEo9bO4ARVWcLM/GG2BJKRJgGibriW0RkuVxC95mAjta8xmMqlUpgqWOKRrYP+tGgRe/u7mJN0Ysjvw4DU0RgcAewDxLbOAkuGyAyE64ANSg5Am449TGwzqbTaeDvaBlr7Wg0Ojk5AfGcplugPDMZqcUWsGpD4gZIH9A9nQ3FGSBuQ1oWM45cKJNw8O0TNq9rltbrzUYn+hhGrP8ai+djrPnroLqv6IaqHb20GDFBMXQD9Jmk3FZSClbXKceGLXEZAmdaazhJt4yx2+RqcTQvgMRV9BwClJx8TBhqHOiLNVSSd5ZECpwE10wDzY513NB1g5Tnu27EhxXXGF9XtbPBoVzEYjjkvWIcVQ0Ex/wVuEVkqdnlNSI/+sUZm6/0dktixLoojVfL3QjRTwKsSBcxyRRTEr/B5I04Fw4sl0iXcitIpQtK1lAEg92V6wgOAsSa/qkty8im1wCxtiohQIzddaFQgP1GjBESEwyJocyEjJmwD4LQcYxNO1ZCkcx0Zl8eeh/+MXt6nA58mc2dowvv8CI1CZ0gH7k+5CJRbCeS83Juga85kT4soCU/ev86QoczEQgViIRiSxJkTTg150b+/izd9d3Gh45ZODIz4ks6L289k5/+wLyRNU7uEquKOuM3BLkZxzFK6ImPjNIi6D/cWUHphbpbFJFI5tLkKn2eyR5+ERc7dh4m4Th+k0tYMrOYpC7pkFAn0WN7UU1d11LakqAMJ/WUcZ1Y9FkVxOkIQww7B7lashnNUWa9dnzfcV1nb1d+9tPgwcHKX5vlylx0nU8v3BctpzszgYikRQoiSxEnMluzIqsoEMBPNipDlEQCLz5BJDBicw1wvHHq1qaOsb9+a49CdNfQFE6rxrHqv5mofVAiwNdzdyTiu+MOIL47vuMwcWyl1AJP2HVhdd/a2iqVSs+fPyfPCNTXd9555/T0tNPpHB8fJwHEWA42tnxq25xarXb//n0oHTMoGo/HiFIQNlNt8NmzZ8+ePfv3//7fj8fjx48fo/qYGWbAstlsFuhGSlUCakc1sFO1fi51S9kCWMspfAlGz/b29s7ODmvJdbnQcrnURr2sEAcYyogLcAAQEwArQRDkcrmtrS1KpgJkGQ6HUOOlYBw4X6jy29nZQaOxSBBwMDfTrN4CggNYE7t5bu5Jj0U7MxYibhVjTunUOjYu2N7RHAZCGcPhMJ1Ov/vuu3/1V38VBAG6x8HBAcrP9fYdznXz+Ryc08FgAJ2Nb34wyCYesUQkX2hAoxHABcvlciClcktKEI1at3heKLJDYSapNzoCZD0yY3tEUJEHWsGK+dt/NTjrzP7H37nH/XK3Uw5DE4aOLCKagCuSF8mLwLYC0hOZiCmAF9eRnUJKpCjiyGwg/+k9efm+/PjH8n/438q7b0s+/+oZw/O8fC4XpFKXPQFSGNvbYQQ2QXCg3W63222U+lar1Xq9zlwOsiaol0cVP7GtfD6vy05vD+WjzVut1osXL05PTzVDisNqNBoNBoPhcLhYLHK5HCIQ/AlzApwwIT4ApA/8qXa7DX4obgTl+TA7gsALElr4rsVigSlLROC7CHRyNBqdn5+vVisSPEUZ1mHS6Pf7gFORRiqXy0jhAGX+QhITr4SGyYzT5DuKuZdKpXa73ev1HMcplUpIYoHgTIoZVgEg4y9evEBkSDwLiS6MZcdxptPpeDxG5TuSVbCqw+gg2wj4OyVZmajDs0CQCfyUgCbe7/t+qVTCVaXT6VqtBqAEOPV0OgUwCpwIebVcLvfs2bP5fA5HuGfPnn3/+98/ODhAyi2Ga5BbhxvE88rn87hTKstLRDTmfKuZa8hZ0hSOUsXwU6U0B3J1vV4P9qS0jEOzs6yVdeLAwqB73mg0wP5GN4NIkZ7QULwCgwFKTCALggvAPcb0kWJB7zeRqOO3JEQhrsvkfX2Y9caP3wC3xa5K4xe6BoVnIFFOtzBrd7Tnkr6SBIJwZd+lf7nZds9ePTTSHb8d/KBBvr4+EEMcPn/FiBExVoyN/noFYNYEBdIFMJNs1CHdmP6MMcqTaQmzKVFxm1TcF+pv5FFi2okh11o+QgvKY2bAFgI8Yu0dfcNYjokD6G6vdSowuRGNpY5KjHVBsD7m38UtBLgXyTvSNnS8Hu5pgQ5ba7EQcLLFU8bOKullh0mMGjvr9drzXBFUSzjLhdvrOZ2u97vfp379P3If/iHtr01oZRY6A8cEJZGSSF2kIJKNwFxHqXiJKth3NvVkJ4KSbcQ3pPRKViQXEZOXUWq/IbIldiTjhfOHWerFcze9MGZoZCyylmxJ/mJpvKLNFMxWxdjQuo5Jp0wmY1xXHOcbihyN6zpXafgU+AKqy0gHDGIWN5DPztw5GeiaQsQ9BhdxLNyU5MIT19p9PLQK8CUsomRJdFYspj+enBJjMawe0bGstp6cN5q0awYVF1zN38dtMiMSK3EAQByGJgjcQsHcP7DbzXUYhp5rRmPzx08c971Uf5rqDyQIo0BgFZFbAcguFYkYPOKNSsRaFMJuAjrN1Zk5luqLAcHh1b+a7whymlUKzhDi8KNygUCVvLhRGzrR25aRxN/dcXfcAcR3x3fxuM6bTi+BrAIGifjHP/4xlB9Ac1ssFsaYRqPx1ltvHR8ff/bZZ71ejyfH4hdbFJOrLGvWsNLTAgggGv24Nb8DaML+/v7jx48Hg0Gv14MCBjkOYI1tb28DLQJCoXf5MfFchPfcLhAxob6bRGZivV4vlUo9fvx4Z2dnPB4DTtJOa1BtI+5Md2mJGKYS0VhA18UOHuDUbDYDtRYQPFRTUfmLTS1EJLghhnBEq9UaDAbgpoHIFjN8BwTT6/Wm0ylJfCR7Amjgro5/1TZ0sdhA067RhiwnROUy+G7FYvHevXs//OEPnzx5Ak3her1+cHAQY15DfBNiyvl8fjKZdLtdkAF18KMT+19rpkQfaBYgvKlUCr7n8CsDEEMYCwhUkmfHRoZUK9RRK5UKVA74LTHwnRgxUX5jHJFwb8//X/3yrJpb/PaD5u+e35ssvPF5ZT1ISzUyLAZAXInijapINopb/Ig+vBaZRfpZWQmycjKW1gs5O5fdsuw1XwEQc9gWi8VVLsfdc6FY3N3ZCRwHzH1kOFar1XA4xHiE7gRyObA1w15f74MR/qFm/4tKTKB4fzabtVqtw8PDo6MjzUVCxIvq/sFg0G63J5MJLB8xRjCmMOjAMgPQls1m0cPL5TK8HzE8gfrlcrlGo4G0FoIQAKkY5ki64COatk+QFwESAmBSdNmAIlIoFLTkBaKp25vUfaHW05KXUOPd399/+fLlxcVFGIbZbLZSqeDRwNINI7fdbsP9EhA5Bbuplo4KSi2aiaauVqt7e3swz8RnNXZD3iv6CTAOAJer1Qr0Mc07QztjUoUStLUWOAK5/NpjE8O5VCohe5HL5fb39zudzrNnz955551qtUo5Tr1eYMyyvAMwOsR8MfNns1n0DY5uQNuLxWI6naIBJSp5xtNEIT+eNVaBfr/fbre1FjyDW5bUUOaCoWOxWAT3GTaPEI5AKTpnIcpHgJOFi+csRFI2ER/msWL53dvMw6+FRGyvgS91/jL24kZ94SRce/tVYCOKurEdYq9vVKLQ0pkaeqDWU4xbx4mFx0bxZUmIC2sJBa3aLAnpjJjcZ6xMIab9ItaaILC+H/q+73l+VAr9dWHEJo4+WGtWC286zYzHOZtdh9YaMY4DC684iJ8U00jWies2jLVYzJbjCunYGOd1K74mXZ21qyoAYg0cx7TR2PkxKLTchFYvSWrFaOavzkzov7JLaFajKMp8klKgYfpYx8PsirVsoyxs7Nq4p0WNBcYFIhFRxTfkQ8SEjPV+FVvuIMBACx1jA9/0+85kmj46zv7uD9kPP0kdHXmBb8QRm5NgS6QiUhWpRvThdIT2usrmwar6rY2AmpYqDpSOSj76yUYAMXZrc5GR+AMZ9Mxo5JqZyFTsVMxaXBG3K7UjIynZzooEppCVZsPsbEuhIOn01x89GiPGbBxZMZ0oRiu6GBHgL1bSWOoipuSjaRN80JrJrlWJb0jJaGPSG9J+sTrX26wXSa2eW2YZNVufYz+24MbSVBFA7FhrPM+USjaXC7MZSaVkNDKB8T45DnMZ64AOEkTJBl9J5fKH+hK3WYDtNUCwuWa63vi2pPrEt/wIr1KGRUHtBIW96G02sqoLI00PK3fH3XEHEN8d3+0juTPT2UtEp7lcbmdn51//63/9/e9//8WLF6lU6uLiYnt7u1arbW9v/+xnP3Mc5+XLl++//z6kIVhALVcrd2LrMXheKMBHZTexEmwBQbMFkERzCZztyZMn//bf/tv33nvv008/rVQq9GPBZgLUS9/3IY5MocaYGZ1EBDQIO9AeCnxDwLLIe08mkxcvXnzwwQe/+tWvfvaznx0cHJycnLBkHqeCch8RYdCH9TlZDYdrGAwGtVoN4pJQVABQxeo8oB7cFQFChaxeqVTa2dlZrVZnZ2fz+Xx/fx+UN0h8EsbF9YvIcDiczWalUgnOWkClAWrkcrnVajWdTvVmXbvixMIn2unIVaosKugvLi7Ozs4ymcz3v//9H/3oR7/61a+2t7dxRwcHB3t7e0ngbzwet9vtUqm0tbU1Go0uLi507XNy6/aNAcQ2ws11T+j1ep1Op9FoVKtVAFuAAslgRRU8LbMAzYC7Cio6zsM9H7ola+j0dpBl8q4rjuMsFu52Y/ru97uVamd35/nLs/T7n/y8e7YvdZGlyEIkFwHERIpz0WYljHaEvshMZCAyEVmJnYvviW+kdSKffiqjsVj76sJZx3Gy6XSqUMBbHWPyuVyj0Qgcx/f9QqHApgCeiKQOKqxB/KGtIjjvJFSyVvqVlKsYHI/cFVy2Op3Ohx9+CAd2zUT2fR8KwlBfxdBAUgo1B8aY6XSKaWEwGEwmE1TrA0CUSG+arFimhYir4jwcdyQuYaA1m83FYjEcDoH5jsdjEGMxaeBZ7+/v1+t1uKsR62Sk9LpkiHUzEhrA9AuF5WKx+ODBgz/+8Y+///3vgyDY3d1FeS9p0QAfwf1H0QCQ0PV6nU6ndX4FXCFYyZE42ev1zs7OisVioVCAdxxIRjqYp0whqPpo59lshrWAsyu+CDArpBgwxXFCA3nf9/1KpQJFbAzDfD4PZdJcLre7uzubzZrNZqVSQZYuCZNhhFJEpVAoFIvFMAwxu2JK5L1DtwdVIDALHY/HW1tb6XR6MBh0Oh10mOFw2Gq1FosFIOP5fA7lCswScIjN5XK4GMpo0B8PySckHSuVyvb2dqlUQl254zjlcrlarUK8GJMPGt91XSjhYlBoGUdWhGitg5jlzu3D4NfTRaOBpkuS9YqAa9akMNKfN+pOxAihG4P8JFqXrBfeCF4TvIvVTZMCibwCBwK3JbrZWalNRRdakHELlFym6Q5KTqVWbdbDSpuPsYoCgB2nYtKHOelhU2eCwFkuw+VyFoZLXOGXeNxJThngaydRj+woDqaIHzqDYe7kpO6t/J2aKRTn6UzouOKuLx8F4U4W4uAQJYpFIJUa6OwY9H7Q/YG1ZRpTdr4giVhvY65jc8dk36hSioPJ+5g8sVYjYUZfI2LsjaIUG7TsNSE2fqlOYOtuLNcQomMMSkK010FyScA6BhQmEToapeL98/mcxHBkeZFKjLnY6Y/jki69Fo14nqRTdj433W7q40/yn35W+ORlttV1V6GxRi6tgHMiRZFilHRPAsQmwnwp3rURIHYVuZjK2lAAI0C8ioCnQGRx+aVhWsJM9OaCSCDrtByL/OZM+kNTXoqZyc6W/PCZpFOSSkkqJd+MVZ19VRZNM3OTIPLNk2rsbLGwVNc/3TyIbpP5eyVZ6pZ0q5v/GsO+9aXenFm8OnsYlG0YI+m0FIs2k7GOI4GVcjnMZsV1zGUntAre1b/YTZoSye4qN0Kc9otP9fKdQoclGs5hNLpFJBNJdqQjlRhP6TgDL15G1GN7JzFxd9wBxHfHdxYXTnq5JgkvhMYKhUKtVnv48GGz2fz000/Pzs5KpZIxZnd3d2dn5wc/+MFbb7316aefDodDHWEmCR2xiksEPNCjJDrG/Ss29Pgr9wf4eKPR+OUvfzmbzd5///1+v08en946IKZCMXgsSozpSFAVi1oBlDBGCLFYLE5PT8/Pz2u12oMHDyqVCoh1sUAR8qNaChCtB8QBzUIccL1eN5tNGNNBaALYB9UAoWSKnTpMHnK5XK1Wu3fvXqPRuHfv3unpKaCuer1eLBZphs6nyfAASByuhE7fwOIBRUHhge2cBGSTmxsgVoCEgG5QEON73/veP//n//ztt9/e2toC+gZeG+K02IHryefz5XIZjG9cWOwuvvlDsyHotUVsHTcuEfmLET4Z8drrhvZ9mUyG4qEcAugwyJHE4jq60xhjgsBYcbyUaW4NxR4Ha+ejD+8Nx5713DCbt6ms5IzMI/MT/EJVLKtij5nIRGQSsYlXl8BxuBYbvqJBPo/Aw9D1PBP1DS+VymSzvqJCgIVaqVRA+WGRIARYMN4xOvL5PFpSm3p9iefFaQcyxK1Wi+3MNpxOp3h8IMDi+YL5K5EGHNocV7JaraCPAe0L5mDA7oQaAKB/ckgRqbJXEKoQERDPgWOKMl1hJzHG1Gq1R48ewWdPa7VrIOBrIUxE8Tmoyo7jIPGGrs7vpTYOwYvhcNjr9SaTCbAVPu6IqxUA2USDIMWFFoDiBLQRxuMxzM1hIocVBwkzPQwx1VCHHXqUeOKoaEE6EHcBSIWPA48SlHZRQvN4avV6HSkfqkLLVbIei0IA0a5WK0hYgCMM8QqJ1JlBZmddhVab8Tzv/Py80+kAsABQDqEJiZRS0GkhrByr5maNCwBitCrdUIGFYRWgoRbGGuYf3BecJFHlTVZ1TIs2Fp9/TeDvq6dga60ClYCLcbDoxDNvBFxLbclFcwJRmgx6W7KRYZqM8F8JZ/AK2WOZqEDqCKIxlUqFu50Yt24jJovRlASIdQUG8jcsv0CvBmRGDJr3S/onMruonGB1Ah1r8VckXZBjCMJQfN9dLMLVapzPTyYTUgG+DDSssWCJCnVj9nRuBNVZEStr67Za5WDgjLvZ1QO5f7+Tyc4zqWC9FkpmUWQMsw08KtGwJDMSO9Y7T8wqSZM0UhaulLx8cRvV68ZRkvCu69C1+A/5E9xP6kVBW3Fwx6tlXgnIinLj0DObTsNIgmiswwS2GFcoQsOaNBrTwZCrAgIadxZFL42Jbuslnms6FlxuolCJoju8HuBahkLEOo71PJvN2kxGFkvpdVN/+F3+jx/n2/303Lq2GnXCnJKVADScVsoSruq6YZSDd1+FkUn0WSuSEQmiM3sRg1hE1iLLCIn2RAoiZZF6tFUTGVv5oGOOupI6ExnJGw8l78ij+9Ko/SlpRht1FTb+M2kxqvuwBm2T+PIN2jgbM9/JRGDsqmJSErGII0bpfeVSeDM8vRHFTrrhbcxfRgP88o/WShAALzZBYFYr468k8MUGkQ2JhoZlE0xsN8HH5hb4r7n1VP9dxUdEMpFAxzySf1mKZESMyDoSmQEcHETEYUiKYx7I3gHEd8cdQHx3fDeP2MIZ28PpJZluEvAZgHPOp59++pvf/KbX6/3FX/wFKlt/+tOfnp+ff/jhh8PhEOEQC7H15k9rpaWjA/gmi860ERBrHmOrezabfeutt3q93n/6T/+p0+kAXADBjQdoXCCvgcgGmh720JpzoZkmiI6m0ynowKhfHgwGQRA8evToZz/72fb2diaTefPNNxGwMdACEACECOxI8L9QyDyfzwHm4i4AuL/77rvT6TSbzZ6dnekqYET1BwcH3/ve9/b390E74q4X4Y219vDw0PO8ra0tuEUBmgeaQ3FbnBCEzTAMoXC6Wq1oQghlVRLGNeEoZl1yXWyJpzYYDD777LPJZPL06dN/9a/+1b/4F/+iUqkEQTAejwHo5zeJF1hrgdnV6/VMJgNru+TuTW7HXPsq6JhsoroADcQtELgJwxBo1HA4pFe4NusDgREhFiVH8BE8IBbUM5xDQFsoFKDGAL3jGJxhjIShEwReEBhrZ8Z2G8X/R7ByVrYxaf90tfi+zaZtLifFlBSMZEXKkVWCTuAHInORscg0AogHYmaS9qSYk00A/uetAXUFdOP0aFSez/PWXlpIGZOK8hO0boMeK/otQnFyqzHwMQwhRoGPAFWMqWreJt7mrAWr+lqthtMCLiRcUiwWcReYnaD0Ci0X8MEhJALCr+/7wD37/b7neTs7O3goGB3T6bTVap2eng6HQ1w8OX24BuSKgOKBpw+3HzA3UWwBT87LldvzwKUtlUrU7WW4G3OKf70QHL1WoHKAZgFWAtEPyumSvQuAkszrdDp9//590GPH4zFxf5wNiuS5XG57exvlDuDhQmBhMpl88sknGEqwjysUCo1GA/RtlFyQ4YjZLJvN1mq1arUKTWS4fZbLZdQrYLRCY4HogLa/0wsTZkhASBi/7Fp482Qy6ff7s9kMZ57P5/1+PwzDer2OKQ5gtESGPIBXer0elCim02mn04EkUSaTWa/XFxcXo9EICwQaB3rB1WoVTOfpdHp6eoqPl0olyFtTkBHXLxG3GpMJRhZWH4kEbUmsozmqtTabzTYaDWhbY+ZH48znc7CMuUhJwvfpmzYIRdCq5NrJoyQETPArZnUlimbL7YR+PRaNX2dedB3GsVGil6KxmAY15R9lE6VSqVKp1Ot1rubk/OoTYpmYTCbwjNV8eZZEaOVWWi9i2uFMuNGTDf+lhyHFrDgouJ9BInkymfR6PZQIBL4vQeAsFuFqNSuVxqMRmPJfOPyOocNuBGq4EQCXigCydOTiZUSsBCun0y2Nl/lhJ59PTRv1yVZjkUpZR0KWXjGhXqlU0CbU4WX6Fpu0GDWBNpu6zoz71Styz47zzYT/wdVDlPREUllYV/5ph70kUzgm8su0qMaIY/4TMZBXp7Gvo+sSI46NHYqZJDE+XSizMWeDaZC+IMwJxaSH5aous+O4IsZxXGvFGOu6NpMJ8/kgl5Pp1C7m5vQ0dXaSXqxdKYgUIo4wEWFmLDbS20VBbLfv/zjc6CRBJGMqETE5jJL6buRxB95iIOu+DFoyeC7ymchQUkvpvi3+Ur6x6dm5SuZlm8fMOZP6D1oLiHUSWNEwh2/s0roSQp+NeTgaGGiQlztnreqjKwNixr8cGprgrBHtGNeYeUos+rE1ZaOmzXUmqMm8S7Je4SpYbIJAVitJeSadMeuVmU3NdCqLiYSzKPHApAV3/uHV1/njRFWGcqMWhLkqT/zK/F9CIOg7AxxnIoFmXyQlshJJRfkbJ/odGPEqekMY+UyKSFZkdKcycXfcAcR3x3cZI44te7FX8F/INYDzAmHHx48fW2tPT09PTk6stU+ePKnX648ePfrbv/3bWq32T//0T6ifBfGWdACAC1wjgRYBLnnw4EGz2QRoAuYsWVEkFSbBoFwu99Zbb/3lX/7lf/2v//X4+Bj4dTqS4AJ6C0Zbt9ttNptk42qtNGr8YZsLRAOUXuxIYBDU7XYzmczTp0+fPXsGkkKz2eQ+YzabnZ6efvjhh9CpwAcRnOOfCOqwDSJA3Gw2G43GT37yk3fffffs7AxALeI63Euj0djf3280Gq7rIooDct3v91er1Xg8Pj4+DoKgUqmsVis4EWmVSaBjRMNhJNXr9aB9DB0AvFk7C1PBjWAo90x6X0XeMQDi+Xx+dnbW7/e3trZ+9atf/dVf/dXu7q7rumDAITZm0aI+YGU2m822traWy+XZ2dl4PE7yEb4JYGKTSR1kQ8bjMS4e8CUIpKSFkiyMwIatOp1OJ5MJVHepcDKbzVarFTAvqlKA4g2PqVwuV6/Xod8C6IcYjXzO6/d8P+15693tf8ymW/1BNhj8wczetl5tbX4ZpN+QXFayIiUjuSiYSUehSCiyFJmKLCKpu7ZklvLkTfnZT6XRuKk+cblcdjodqJrk5/NHg0HOWiMSWrtaraazWeg4wLAkqrJHNoJiGsAsdCk0varJJ2KCBMTPL7DyeR7wynq9/uabbzYaDdDfwLoCIkAGKMSyQfBcLBYnJycUZoVLXqVSaTQa0JDp9/sYI7VazXXd8Xg8nU673e7Lly+Pj48nkwl1JMgKBPRA8zrARlRdJMEKNmIUxqnX67Vazfd9wDEsRQcKyTr615IdjMUkzAH0+/3T01NoFwyHQ4nqKtix0e1hOodEGujGzWazXC6Xy+Wzs7MwDHd3d0ulEhQYzs7OMGTAC0YupFqtAggbjUaHh4edTofJGPinFYtFNCOXAHQSoMP37t3b2dkpl8tBECCxBFEOaF5TvAVMTIzHbrfb6/VgDQcWecyAjhrKbPbFYtHtdpkGcF13Pp9jOdjZ2SkWizgbyJ70/MTjBgJ7fHz84sULLCiojAZYDOSOgC+uB8kDKKUAo4fpKIYJ+kAQBGRYIxMJF0HkCPHgsAJCOxuen6Qbb21tVSoVrIyr1Qr8SoKS2gkgVvD+jXKHRYBp2TC0EXrF2ZUAMXcI2l02pvCLyUSURa1co6wlikd/8/1ubJakygRLQJiEBq21WCwy/615wdx3QQCHmRitSq+nRO40kFkplUoEiDFOOc3G7pd2UpwAkeTQADG5w5gqoaPi+77j+7JYhL6/DMPZbLYGg/g2ykQxBMG5yhcmcKDpw/pHREIJfROu3GDiSpifTLNL37ViRcLQBv7aXy5XmEtRkFSpVJBqRaIOWTdMzpAgx15Oq5FQJh5TQZIwoY1Pw284X3KNAsN1ZOSbSSG3pI/E3h+jWMbaRK7qOCe1ODTTP0aN1NFBDFJM2lzHGM0kfHAq0MX7EtfuEGtNaE0YmjCUIDBBaALfXC4yziYg2GyCd2NN+OX6QlJoxV4FoPVA4Pc6Yk0E6lkJAvEDCULZaBv52gvwDJSFlb6NnlX0oYFaiupQJAQbP0xB9AnglB5TTdEYcSzZQDZGDBfWSC7rKjThPaYCRNA5KcW+kYvASVin2CklHHMK3WiFd52URAwaZgh5VTIIHfhSdCIMJFibYCV2FbFc8eNGvGBHZB2Zkawiw2r891LFKer/JqGUolWAkgPBJhBh3bHt1Vec74JbnR/pCzuRVV2ghGJo+mdFUhGhGFB7tE6JfwcQ3x13APHd8R08rouOmBTVW1IQjur1OiJb13Xh0nZ8fPy73/3u/fff/8Mf/vDGG288e/bsL//yL1mSPJvNsBcnN5AeOPhSSganUqn79+/v7OxkMhlE8kAQ8FeJCLMbCYPNZvOf/bN/9t57752cnJTLZZDOaJGHmPns7Kzdbu/v7wO9ZekxyFbYWSIkAIWq1+u1Wi3476XTaeAX/X5fRFj1LFct1Pr9/nvvvfdf/st/AdInIvgKxHXL5RKWGqzaA2KVzWaHw+GjR49++tOfgrgHkinCfoDCp6enn332WRiGz58/h3oDKD84z3g8xgYCddOABmq1GqB8lhaCCDmZTNrtdqvVchwHBmu9Xi+bzR4cHIDrB1yAcAnEPUn00GEAmUeAh3zf73Q6FxcXIFb//Oc/f/DgAdoBJJ0bGEaj0ej09BTaGmAqgTdHKsE3RIhwHOM4ctVuW4wBXALohzZcSHUAjsEji9VoI9JGXE3aLKBG7PBIs4U+KboNiMOZTAbSBzCewkCQq/WbrutkMqlKpbRcVlNeEPgX4+F/cJb/z2B23y5DKw2bbpicmKIxecekJBQTeo5Nm8vN4lpkLrIQCUSW4k2kWZFf/pX89d9IvX5T0LhYLHq93sXFxXQ6LcznjclkBwFbGE6n09bFRRgR9BCQw9APgDipFjFiEUUwWZeNwYvmim2yb57TCCtDB6bZbCJ1QciPUD5xSbiHdTqdo6Oj4XCI7AsqlHkSnBZ4MWaMbrcLNZXT01PA5cDjUN9NCzJAqBQnIdVFz4RUosAZ0AFGoxFkK+BaSSN72eSmLVeJLbcfMjEHIYkK5Pv9/uHh4WAwEJGjo6PpdJrP5xG/oSXpHj4ej/v9/vn5eSqVKpVKxC6z2Wyv11ssFvfu3SuXy7PZDNoOGBew+iRrHrI5BwcHnU6n3W6fnJz0+/1+v39xcYHJEMrpAPch6bter4vF4vn5+dbW1tbW1u7uLhSB+v3+YDBotVrAhra2tgAAIY/V6/VOT0/b7ba1djgcInnJZmRWLCY9jPKR8/NzMKMx9U0mk0ajMRwOi8UiijAAgsNgs1wuYzmbTqdnZ2cffPDBy5cvU6lUtVrFcoClBwsBVgcR6ff7nU5H80wxwyDyBEcYcyksAeHUhzQkmghl18C/sE4ZY0aj0WAwAGoGMnK9XnddF/oeLIBA3QmJipoSq2fvbxIj9kHoDgLX2jCSXsUgoswIS4U0RKVRAAx2EgkZaUvCdEFrLssmYcoYYy4Z28dAMT2+GOdjMqESCCWkNbsNd0cpYe6dOHPqb+T6AjCU+UiCF8kybRYYEZ3RxRZMb2BuhEEChHRm83kQBGa9NsulXa/XrrtcLv0vp4pOgMC9KjGhAWJ3A0CM360roZHAhn4Q+P6l+sxqtVqtlvTYrFQqENrGtM9HiaQLpgik8GP7YbS2dtDCRKEHxTryF/2a9ucxsbUYbEQsm89XY3Mx1Pi6pVNDbyQWmE3M0I32hrrDa4o6fteWcRtZn5+D7BEOyKWfjOCk6y9PxVwRm8WPDmLNMQDddV1rA5HQ981slrKSXS4zmbR0O5nROBM6jgNp0bQiC7PvaQaxuSqN/RVxLqu8sGI4Gnj0qYhBH0QMYjdymKiL9EVEbFHmRgZzGc7Ey4mNgGPoLOPndcLExriOw92sZuNqswSq9lFYDHMX8dxFdCBVCZhVlFZYjBcfM83W2lNUpWN/1oOa4kt656kV7fWij50q/snYJ2byqTHoWLUl5TKYqLhuzxbjVse4w5o6zXZmjvBzmDjqMp4r+bQtZmw6ZZfG2LVYqCKYCNy0kU7C6uovrnqDuZoXkQSY62x60dz4I9e//q09YvCuUWuTRLTiILqLMFKWuNMdvjvuAOK747t+JDdeMeNUVnRKRKYYj8fArSh112g0Go3GRx999PHHH/d6PQgdPHjw4OnTp0dHR5TpxP4bmzliJUBDsPPGbhKBMSIWLOd0C2FElJSjTaVSkEXGNUwmk3w+zzJP1HoDOwDZTURQaUuxXZL7ut0uCoHH4/FyuaQeAkCuyWQCljGFIHQ4cXZ29o//+I+ffPIJYm/ATzQRwi2wcB7NCy7wZDJBKAgsFYWQ6/UatkVnZ2fPnz8fjUZhGJ6dncHIjhsF8J1pncSYgRRFfCmwKgaBQK5xecARtOxmbNODpy/KMhjxNnC3+XyODT24ycaYe/fuvfHGG7u7u9QaZrSJZxrrh0EQ9Pt9aJKAiAecIlaT+M2MiA1RrrLhRgugxYAQQbWZ2QK9c8WdQgkXXDCAPhRYYDEs9DTYQ6B7IFHd8Xq9LpfLeJqi3Lo9z3PdVD5frNe3M5lCKl1KZwr93tlyESzXH4ROwc3WU3kvV80V6/lUNtvvF8+O67NRWjLWWhuurSyts3RNYDKe8+5P3H/2C/Ozv5RiUW5ueNbg00DpknZn7XgyOTo68o3hn4DAAhzURD+icth8k2hJMjVaAyMR7QCBlI0MdL29xhxCVy6J9D3RSzX9BDE20FhA8Cj2pyQCrrbb7fq+D2GKZXQApkQ6B/MV3k+pUNDzKUOsGXzEZbQcOaVIyPTH1CGqEpyTycaZ/EsvAdpoXodbSCkB98T70V1pK4prw21Sixy0XDR1Op0GfAyyPPi5sA1kQQmAdTyyRqMBPNfzPKjJo28A7r9//36pVGIOCdTvw8PD4+PjZrOJeo58Pj8ajT777LNer4cq/r29vWKxuLOzg2kcM/xoNMrlcsgFsitiwHL+1MgarfbW63W/3x+Px3joxphutwsl38ViMRgMXr58eX5+jo+At/vpp59Crx/pxr29PWRMkS/EqdDfaEUF1CmfzzebTWSGGGyjL0kkAYH10fO8crn84MGDcrncbrfb7TbQMfwpl8uhGAWaQpi+0JnRewGWMReoaVDJdPI3zCCmBLMb8WEZlmtBCQ5tnd3k46N/HQYaV9uN+XINsdmrk7/GwmJsNV4GlYKZeEazo1Ppk2ubOIpH87JxJXhY2BRhUYhNYkyxIMsCMJSCCTGzB94IK1dAEMa+CPaSmGH4V7CG+d/pdIqJy/F9Z7Gwvu/n877v21hW9fbQcFJigkF46upPOgproKGfExPYVHolzmK9ns3nMyOr+Ww+nc2wgDqOUywWkWJBrl1vbDCfVyoV1OjEFAlQq8H2YZvgF9ZOTafT2XTqr9dfesv9ypRnUptVbzOQaaCKEeftmLZvUnFb51Mx8LGOE5aKyQfHjF43JjxiLUwNYj0SY6AelzneIDVkmIzUqhqi5AtI5qDkGiWPMGNgCBB6RsxiTJjJiLWZ2czt9oqz2c56VXZdM52kztqF4ToTlhxxREoihQgLzojkIu9f/JKNlE+I4bqKR2m/FG3QRDVeTvRxKqtABHkpMotcJTAEKiIFkbRIQaQjs7J8tpb/8ol8PJZiXsQXuxSzlGxa9pry8EC2dyWXe334sAhUe/h8tVgEDibwPM+Dzh7oNeAZYJlDcQ+GG9N4+kHHxkLyoFWjBoIR9LHkMZaWS5o6xJSCEOTCvUbLYSdTNcmEIiswaCa5kd+gT6jzK5zeNYuCzAYubdrkxloTBOK4plaVN5+G/X5gxJwNzEDMcmokE8GXgInTIlmRefSTjf6U0o82ktjmnBGDjDeixuaaxIkT9VjnO4URm4hYHSiO8ELJNIOjnY34xdQdXoiIXBZu3h13xx1AfHf82aDGehuHAD6TyQwGgxcvXiAOBwCKYlg4HddqNcSlH3/8MfhN5XL50aNHruseHh4Oh0OGQNxuar8jBP+QpEQBMsszaRgSs36OuU9sb2/fv38fzOXBYAAuG4J2QjaA6k5PT6vVKmEjbE3gR79er0ejEaopO50ONi6IzdrtNrix77777l/8xV/U63VGWdgijMfjDz744JNPPoEWBxLj3BxDtJT0T+xisZEdDAa5XA4MNcRpQEh7vd7x8XGr1QL+C0RgPB4jhNNbCqhSDAYD+qHDAArwN0BhbN0AaELXeDAYLBYLKEeXy2XKaxBl0xQkcjG0nTd0MyeTCQjCo9HIcZxHjx798Ic/fOeddyqVCj/OmDyJDgOAOzo6AtJ6fn5+fHwMcrR+3N8Mj9haKwk2kFVlaBKZWUHEdjgcjsdjsPbwJ7Q5WhsDAQysdrtNpIayCQw40+k0hFapM0upWWhZBEHAGlgITbLjgXAaBMHBwWo4fNBqteazpR90HPe/pjO5fD5XqdUaW+Vstnh23vi9c78zyvmuv1otZpO5GClWimk3s7Nd+N//76r/m3+TzRekkJebd21UTXEcJ4gSSGi9+XzebrfXIovFAn0DVH1kIEgXQuCNWELH23gRkQP3xBj+2Wx2d3d3d3e3WCze/BAhR0CZUVTWIxTRKInWM2W2Y39/H30bwOh0Oj0/P4fyLHJOwAsgz0KmDMcLJIlhP+i6LsIhwDf4HZggIFewzjHoGGDQ1Q30ZKia6IGsZXOTbJSN+bNbzvkagNAWnZPJhAAiICSaoVFW9d69e4vF4uLigtx/VHLs7u5SnpgOlpjxYCUEty5cwHw+//DDD2k01Gg02ESlUglyKwCpM5lMrVaDVAtylq1W649//CNSgwgCkXMCv7tYLO7t7WWz2clk0mq1Li4uFosFSjcAeImSdNcLDYYnuiuGJHr4YDAgWe+jjz4aDod40His0M3I5XJHR0fPnz8/OzuDM142m93a2oIRIoJkPE0qUYgI0hXQjtjZ2Xnw4AFMEQFoshvjIrFOYUUIggAK2uPxuN1uB0EA5AtrLgBiyBSUSiVI/VxcXEhEpcRySUiFGUFNvnul5MLXMSNjQnBc11P+ctpGknuAmIQCV2euXDGOWEwgMsk31O93Iq4cOciEBnQFPfMiyDnhuQCCB0iNCSeGOGhwGSQ77pGCIMC+CIfeR/EWWDORy+VQvkAJXbnqfaTpyRogxrjGDEwwFFMiJqvhcIg83+cU4zC0YSgKUvky4bfGiF2FsskmBjF+sVF8kxaTtk4qCGS9Wi3ns7nY5Wx2SUWElA2ahbxF1mpADh666mgxwjoc1xyV8/mcw4GsQKb259OpHwRfQvb1ulKP6+yz+Fw0MkViJlmZmKlQJ0eryVh6gx2D9stchnTWQQPEsd07P463JXWuKW/CxSImn8JGJhAcs6CkVg9zxhLprhBWpkAQLowa0xR50zhdNpsVsdksAN1gPndb7cLpaaPf3xJx1itnskqNV9kgZyQrUojwHVckI5KPfnKRm1wqUnvQ/ZairkmM2NwCHabosChL4Xx0zrWyHQY7eCxSiC7vQiaBfLKQySdSOpa0J7ISGYmdSCUvP3hLPFeq9dcJEAsRTGVJwvmNSmvsoijlhJYRsuzwdEWnJY4fy4gkabk6YaCVtTlL09VGq1tgZ4WpAMtcTIA7vDqVcXokcUGD15KQEiYozHWTK6me4Tcm9fX4wtZRs4MdRdPGles3RJ8yvi+uI40t+d73Qtf1jSO//chddN3lLKLDhxFQu9z0gzeYSNvEi2SvdeaDM7NcA/Ka2/043xGMOBMN83nUDr5IXmSmXOkykUkdXOxsJEwsIquI7H933B13APHd8Z07rrN44uqFNRIaC71er9vtFgoF0DH4EdDoyuXyeDz+h3/4h8PDQ9TgFwqFZ8+eFYvFDz/8cDAYoGSbBUS0FLh3794vfvGLBw8ePHnyBCALQlYdm2mFMlapx1ChR48ePX36FKgl3e3Bd8MJIRN8fn4OkJS+8DCgB7u5Wq0+fvxYRE5OTlqtFn2HEH299dZb/+bf/Buin0Rq1uv1y5cvj46OqtXqwcEBYlrWx+GOqKGJTQBiDzizgYYGk6LpdIpIbDAYtNvtfr+P/RZ20tPplFZ7hHLoco59M5Cp+XyOCIFwG5yRIDdZr9dTqdR0Ot3d3W02myCuskRXb2WIg1OCg9t3CKRiO44K/Xq9/otf/OLtt99++PAhAEGeBEFvksOyXC4/++yzTz/9FDv7Tz75BPXstyHXfE0YsU3s6oFgIvKEcGQ+nwfHHHgQ0eFsNgtYDZkJ7DKxD0ZBN2B09D100Ww2W61W4c7HDonN6Hw+BxSVy+VgXYWeX6lUcrkc9BPBk8Xj293dPTh4sFotgmAu4nuuk0lnCgWvWJBUar1d7u/XV4NRMFtOB4NBu9USK/v7B5Vy5cGD3V/+4unubhNWXjfPGLlcrtlsLpfL4XDoi6QiLh5oWVvNZmAMhj+kh9E5WVpIoy3KJrDGGXdBiV6t5gZgvVqtFgqF6zqGzh5ls1nYSGJoc7ZhnamuVcf1TKdTCBdA/BfkZVStQgeWuDPwegiGLJdLeJSVy2XkYLrdLsosAC7g3oFEAAYFZo0Og3ENkpomPI7HY5QLbG9vQ/uF9P+k4uTtZSVfuRyQmYKno0mXk8lkMBiAjscCf3TUer2O+/3000/x6IFyNhqNSqUC8BQZIERioFfjVGTIEjcHfRis7Xv37iGw9DwPfoCLxaJUKlWrVVTWo21932+328PhsFQqQTM6DENQ/JCbOTo6grIQVisgcSgKwT+p+UNyHLsHHhBuHwoYEFlCfnEwGGAI12o1yMUAbG21Wi9evBgOh5SVwOoGLR2kMF3XRXEA1IFc193b2/v5z3/+xhtvQCipVqtRhQCXAWVVvNhqtT755JOzs7NOp9Ptdrvd7sHBARBwPDUGsWgl6NVsbW3lcrnpdNrr9ch2J/oskXI9+xIJUPKN04dFxF+vF4uFcZxUtIhQul1nSrTcpCYUJ4Xsk+hwDELVQCGhK5bM6/g81mf4vXQFxMfRweSqkI5W8NAYNKvyOQFqWFkDxBrLo4cwREtiYJ9uB42M4EEDAcEv9DDkso5pENLeVJb/HBwxBj82+uULA8TOVZjYRmQ0V6HG+ieMQApPrCvW2CAM1uvVYrkwZrlcLterpe+vqbWtHxaHNhB8okXMJspVL0S9MLEZmdrH9LKaz4Mvwp5OipZcN3tr/zce+iHGquYphIXniM+SF8yJnV+nK9u0jpPGjvUXYbIluIbhQAozWAIxfdiYrV8MIOYKohVg+aJGhwkg4h7hmkjkLjZBEe9j613VajaOI44jYegsl950mh0OCzZ0gsAsrLv2XJs2khXJiGSizkkmbyrKVSRViW2E4a4iOqGoSvzbwMQUWtHcBFGUZPhGLCLUKRTJi6RE3Ev1iXlfTsbSOREvFCcUuxTpifSlVhbPyBtPZbX6AiLhtxm+l3ORsiohn5cYMR69VgOHKwl5OURRkRonISZmTM0hQH2hmHU2U2U8dLSIeVULnmz02tHjFAUcGFC0jogNZO22x9hWh67aWS4GEGv7RKZSmKvWuZmYR19MdMJxHCsmDMV1bb0m2WxYKsp0YdoT53BoZWIEGLG9ChCvrv54CiB2Vd+ThKawvQYgtjeCxZIYMt9+iYlVxB3G7xmRlcgiUpYIFNOfCsVrxS/ORGD63XF33AHEd8d3Dh2+jk3DA4ux1lddLBb9fh9+RFiDRQSGaeVy+YMPPvjv//2/G2O2t7cfP3785MmTarXq+z5oVtxeMxAtFApvvPHG3/7t3+7t7UE4D5RkkGo38oWvu5fd3d033njj8PAQVe103ZGI9QmNi8ViQbQU3CvqHkC690c/+tH+/v7FxcV77713eHiYz+dBsy0Wi2+//fb3vve9g4ODmPuB7/vHx8dhGL777rsPHz58/vw5pDMlMnfG1mSxWLCpIcgwGo0QmXc6HewtEHigKHVra6tYLHa73YuLi8FgALpcjNtFqS8ELYCu2LzcpaVSKZDXQLIYjUYQS63X6yIyn8+p2KXdV3RpIS2nsWECYgKq4GQy+eyzz7rd7r/8l//yJz/5SbPZhJkhn851JmPgRR4eHh4dHUE68+zs7Pz8nIZmmtv4JzwQLSMmQZ4DG01KM5M4xtJU9C5umrW5NrAelgYXi8VarVatVlHoyqeGTaeuv+MuE2gjSvagLor6dN/3K5UKt9FhGLquk05nMum067mZvF/fGo/Ho+Fw2G130uZYjDx+vK7XGwcHJp9vTCb5dDqTy7k3DDcIwm5tbXmeN5lMJp6XjxBbx3Fq1eobT59az0M74LKJmcbCXUwmYLWDuYZtMdROEOtiXw5UCNHgK8NvdFScByRuTQ9BsxCt5l+R8Oh0OkjbECdCVAMsGHZGrFWkARqImZivgBfTsxE8fRRxIxBC8qBYLMKcDX+CzAKAV/yC6QJxPso1AFXQ5PP23LQvBO3FOIaYJcAEh2wuXZsYxqNLQB3i008/7ff7aJ9isQgBIrBlIRICud5qtQp0mErrSMIBo8dsuV6vkXHZ2dkplUqTyeT4+Pj4+Hi5XB4cHGxvb0OwYrlcAuiZTCb9fr/b7QZB8MYbbxAjRhJrNBqRrQYTQnC9if5ANIDTne6rwPWm0+lgMOj3+8jSYclAB4YWeaVSIczX7/dPTk46nQ5Eq4ESQpG81WphefI8r9FoQMUI/8xms2+//fY//+f//Mc//nGz2cxms1wBUUmAzBlWXhGBPj7waDCmc7kcdKu1zjXOgK5br9eRHcSwwtqHkYiJPWnxtBHJ+saOS22i1UoiQFavvFrQX8NbmJxjofhGtuYN6pDaZQ4dWOOtFIGNYc2Y51n6gP2MLp6gh+F16RlC9oQ/AB9QS4oayholpB9vDMJIyr9yUYspEmh2M6ZEbV5H/yhe7iXUZK356h3DXIUMYjKssR97pYTZhjYIwiAIAj8I/CAIQloDXpcJIASjgeOkDvtaHSTVavL1crXy1+swDL/Q/d+gDqxhfQ1UJfVYdUJCcx2QycaCgkulHBm5xkSmNAc/2Y31P9HHIObON1D9HPwJ1hUlkzGiSP36T/SUi2m+6/WFYgWa2A5NHmR/KR6loWpeCW82m83lctl0OuO6aWO8VMqUiuFWw0+nVkacxdIZrex64a2NE1oT75laOMIq+yn2Twq5uiILxcSUq334Boz4NngZePQEiG0ESQciS/FXEoxkNhVZiFmLLEXaIj1ZzaXTl9lcgtetlW2AVCpeeaAOigIjoIN/Jhc17GwxsmggTFGR5Iyt+0mMQMAoT8v7IPqj3BAdg3XuLZaJiaVtoDKxWq1oOqInwNjA5LZTA8e60EoDxFfyFdHlscfqf2rKDuerGDpsjGPEhKF4rs1kwkJB0mn74NDW/mA9ETMXmxLJRv2QpNdF9LO8qkEsCta0V/Mc5io1fiODOAYEJwFi2WR/9+083AjkzUZOdGgBgOlspZSIH7WSo5oiJZK50yO+O+4A4rvjO3gk/VWS1YhaZR/oBjDWTCZTrVbBeWw2m8aYs7Oz+/fvN5vNo6Ojdrvt+z7qgiuVyv379621kFBAuI541fO8ZrP5ve9978GDB/V6nQXXrErbeKnXSdPW6/UHDx70+32grr1er1wug20EATKmXrlLwIYjk8mAEWyMgWJdvV7P5XKLxQLv3N/fz+fzT58+3d/fp54A4z2YUJ2dneE9LAXCXaTTafDp+HWMvlCKvrW1FYZhv9/HdwF/0YpU+CDz2NhAcGui90DgiJFGBOYF6p0R8KRSqUqlgt02qrwRUYCsF7OvAXcS2xFN39C6w4Bgut3uZDIpFApPnjx5+PAhooXrQOFYjArRj16vB1IboCjNC9iYz/iTYMTkb6bTaYjh0lAFz05XZYL/C0wBQRRqWkGsRqjPUnQgXBhNZIIDjMaD04Win0/xnkf9XGCsgFm1/zJyIYCTVqvleBxO595ikV6ss+ug4DhmtcrN56nRKBwOF/n8HAThV2KImUwGaYBpEHiViokkmEul0v69e74IqJp4ghACJkUdsQEeJdIhwM40vLJer9vtNs7AnX1wjQ/SRnqgKBqUfjMCeyY8iMUDmWV5BIje3L5zWKFvo2wZ/6TGNzB6QPykBmu7zslkQnYMvxGjiSgSnh0mDZ0wQJC8voXYZRIIe+Wo2SgNiW9Ey4MXT/Ij3qaZOEAb9/b2vv/976N9KpUKePGoJ0X8Vq1W9/f3odsDhVysKShPLhQKW1tbOH+xWHz69OnTp0/7/T7OD9o1lT3QFET2OWTm83mr1drd3S2VSlrOCF/E2yQ7cjqd4rTolqjAIMFNJ8yABeMpU7ITcDOePvo5GFKtVmswGLiuW6vVstnsYDAYDAagIKVSqf39fQx25A/g4/fOO+/s7+8fHBw0m83BYICrZQjNqnYkWtB0EEIBUALkHdNItVrFOkXeE2wDgQu3Wi1cMIj2Wt9zI4bFaPn2OYbXOFGH0VffIGXA69SAVwxxi42OjRlxpiT1Rij21UnSsVwtN06CxbHzJBmj+iK1W33MdpK62DEGsWaWseIndtqbqy6uO2IOThwU8X7CCeRL4MLXfcZugs+MslEyYkTEGmusiBVrrFh7WQJkN95mjFKdfPqxnq95iwSVYhI0t3Wo2yQ/+soRpMvqCdwnO6QWXSFArCvttCqrTmxjPeJOcmNf1fAWM6M4MxZBCqpoCzJeJy4+Nkg5yijuEfsiTYCgoESMQYydA1PpGiCOJUvwdWiBXC6TzabT6Vw+71Sry8eP+64TpFLuYOg+P83//R9ri47rrxVC5IgESuSE1feaJrxWwHEYKb2uFbLmRV5z3iZZ0ldCSFYxlNcRNBwqDqO51Oy26UuuqMW3ZMXkIlkMV4x5rWiVMa4xUMMlCT2m5Y0ni/oVmGeCk8uOip0DGADamyE2UTPu0yorG5FWPHrkmNnrNLNYT616BMUmdsZ3zKwkxbJ158RHdNdF3ISESjL1rlnGqejQmhJaYnijCL7+J/qQ41jHFccJMxmTzUjKGGdlZC6SEslFnSRU6PAy+j0dAcTsrto10SpUN1QMWdmEC8dyIVqDWBKOjt9yEnFGQcMS6Tg7In5Esmb2yIsmiqx6nbrPd8fdcQcQ3x1/HnhxzEcbLDaYMo1GI9QLY3MJWhzscabTKWQTc7nc8fGxMQbAMWDWx48fA0hFYA8RSXAnHz9+nEqlAIcBtaQRDdZduSrnvzHUMcbUarW9vb0PP/wQ8FOv19vd3SUxFhAA9ijYJYBMAQZWsVgE7ziVSsGkDqt+o9HA/qZcLr/xxhswQdKIIUi7Z2dn/X4fvE44klH3ClAIwFZsOAAJgWOIrxaR4XCIrTbU01CR3e/3B4MBUAyQwij1RfFTEN9QsQ5sgkKNlUoFT2F7e3s0Gr148QLQzM7OTj6fpwcLtiM68mHMg7Jxfimz4uCSGGPOz88/+uijMAyfPHnyxhtvvPXWW2groP838Bxxqvl8DikP+FAB74A4g1yt4ZI/RXWzjlJB9gSWBwgMCteoKActHZwF/AnQOd3PgH9BiFZEALTF6lvBc0cABoI2BFJgAkZJaD4gjBF0Y8gQ6zCeEt5I7cxmszC0y+VquVjOF8vFYhkEQSqVTaczqVQ6DC3kL4wxhULxlvaAjuPkczk3l7vcHxpTyOe3m82VtdBqQKE6PZSAnBKc0lZgaC64NYJcD2s42GDCaP46gDiGpLD/awY6ZZ3pokbNFmpQQO4TYCjrZxEeoM8j+MTzjW3TgdHzynFObPrJpsF0AZIs3szIHDgjHiWUECQSskDghPwQWeRfMI57BYNY28IwFYF7AeK5t7eHDB8wbm18xH8aY6rV6jvvvNNoNNbrNXTe0bDj8ZhAarFYxNSBJ4LzEInGeIFo9f379wuFAuzdwNLFlUBmAZoM8DLF7M0yeWgvAIFltMbbxGVgHp5MJugMSNswp6KdynVegcw1ljjwhPgr+gkcvbAgQn0YPmPkGmNl7Pf7k8kEdPWnT58+efIEmUikE+DFB4khIkQoIqGgkOM4WDFxfkgBBEGAZY5IEGVekK0BeITHhxVHS+LqIPw12iF+6en3c5BOZViTK0LMKe7msbBxF5HkEcci843bpI1YM1d/DemS/6WpZxjRVoHgxGT1qTQTjcnj5P2SW7cx5R+rx9oIWOtXYlmBiDSN04oRcTzHMV6Ycf20s/S+FPhkNznd21ehZtE7rRErYeAjobV0nNVqtfIDPwhCrcOw8enEjo3guFbv3ejhacPwS+yxbzOBc/Sxq8TUGPQc5SgRWAqSEB3G+oWFjEgWFYSop0HCY2zLLVe1yDk5aBUyUiI0tz2Jp+t5eKNrImdU9nCdxNXcbaTbATXSXYAOnEzY6wRMxDD1InmodKlky+VZpWyzWbfd9rK/s58el87OrMyjnulGxnGu4jyShulG/0wrGJcA8SoC2oApZyL42Lumyt5syouQs0zximWksgKkby3iKzozDOtAacxcItduRVIlcTNiXiseR5tCV22Ekpxfjd3TdVl3VHYbALsaCN6YutuYotOpNXq4aYA4BrnqmVwP8JgkPb8dZ+aGTaKyQh0u6XBVz9WS0PbRCbyYAZ0okzq9kHEk6hKWmPK+mMsuFYZmtTSruQQzkUXUE9JRJ2GfWUc/fqSNICoD50U9VqJ+vtF90VyT50jqC2+kFX+bj3Q02NNRU1iRTGT0F0RtEkbvARZPgHh9hw7fHXcA8d3x54gRS0RzQ0DOfOzOzg7iT9iUQSbiRz/60dbWFnipjx49Oj8/n0wm0FgEnxeKk1yGi8Xi/v5+rVar1+ugPiHCR/KfsolJUvMNF5/P5wEkYcVFQS42HPjgfD4HZxM1uUDrQGrLZrO9Xu+jjz4ajUa9Xg95bKBytA7D/qDf74NxjMaBLObz58+hJokYnoXwTAVrZS4AYTCEKRQKzWYT14abXS6XlIqbTqf9fh816dwia7teYjQAKPP5PJAO4FNbW1sA1wiZSWRAh+psHWzznHpvRJARsS5+ZwWfMeb09PTk5GRvb+9nP/vZz3/+852dHaBsUAm4uaet1+tut3tycgKl1zAMAV4gttFbzD8VOqy3PeDrwSQQKGE2mx2PxxcXF9g10sgLlkRwXZNIvRrxjAaI0ZiUqgCcCnOqarW6Xq8BXcFysNFoZLNZDRBrtRato8IOTwbEfD6HtCtYxvP5fDIZTyZjRFnYjMJwD08caYbk49Oe0Z9bVE+nhQjLsCKO5xUKhZzrIgcDmBgxAOU7Rakf0qZmMBgcHR2dnJxQoBNRHDzHyAxKmhzeEFeLUpAAZgd8FsAcCNfI07BOAiYqmUwGyRhyW4Bxg5gPfE27S0NzAyeZzWaUmEBptpY5Bgm00+m0Wq2Y8wlGFioYIJ2MaRPmeFCioCfP17oEMMEAZi4KI8rl8vHx8UcffaRjJNY1E1zA9ZPP2+12Pc+jWDmDMQrpoPXYwux4s9ms1+uBSN5utzGRQnR7tVqNx2OY3QVBUKlUoKIO9QmUWQyHQwiDaCa7pgGi43FQJGV2NXLEXrpUh0RUenY5+jUhd4jhP5lMarVao9Go1+vj8bjX6+FBO44zmUyQvcNi98knn7x8+bJUKu3t7UH5Zzgcnp+f078OgjMw5UNL7u7uPnjwYHd3N5PJPH/+HBLJWIXRqrxZkKPDMERGBNxhLiJ4nUnH67Kw37RDXfSlSBqZqKiFOP51+O8NWwVdqHuDAQPexooHjtAYzxGXlzTvYg4VPQdJYihlI+1NazgC8cgvUi0q5lyHNUJDljG8m7jeK9fKjbKemprKIm4tUSUR0+2ykUQcN0g5QdoJpJp1SulVxpsZE34JEvFGrEFeRTGLXg+tXa6Wk8lkkB5k5vPxxJ9NpzE3vysYSgJIStZ96xvHeaguoouoLvmPaJEv2KW/0CdYRRTDiGPOojHyJvdOOpeZRMlj3UB3dT0iyJfUZW009hQlt8p9JnuarrvnehED42IAsT4VHhbPQFInCuA0QEwcHPRhrXehgOxUKpXK53Plcq5RT29tOY2GzedtJmtPzm3Otc5aZC7iKMJvqCSwnSi2DhRAzAJzqyRcNcXYi0RLwwhXIujmKsZlDBQWRRZeRXDwSiHRgPkCJQWQiqSTgUQvxYTiFMXNiZPaRF7+yntj9AbZJNSQaHlPpx+YCXOi+jP90G+/0FynlKjNGHUqIrlwJJVVkvxi/c+YxHCyCuE2WcnkSLw5f7lx6rj6O98jYSCLuVlMJZiLXSrWOdHM8OrvocKCzdV32qta2PJlp3izCUH+lh/gVoNtLSI5kYVcCjr7CfwXGPFKJCuyiFop9/oH3d1xd9wBxHfHN4V/qZ1icjUCzoU/wR79yZMnpIAh6+t53sHBARhMwB+LxSJc6UhfwiYPyCziaqCZCJwoRyVXFSRinshyjXAb34zVGlgDyFbwjkdBLmQcfN8n3gRuFyiNDMK1iTmgQGvtcDh0XRcRuDHmpz/9aaPRgG/SRx999MEHHwDpplSfTk1zX4tdPpjXk8kkDEPKLlO+A7ww4MggrBEzpSsOhSZEqWSyHgrWSUBkXNcF1AhMgW8DWECoMWZ+wrCEEgq4JJxQl7LiTre3t7///e9/73vfQ/vHlBCv2+jMZrPT09Pz83PUYc1mMwBSsRDlm0SHGa9cCaeNkYgvD8Yf5FPr9TpstchnAfkdI4Il8FolU5uzaSkxtAaeMoCtUqm0tbVF2gsr5iQSbgYjFZ8iTYM5EiDFIOaDVwh4FGATXOknk4njOFByKJVKvFQUxfPrdFMAUAM8dynHPBwejEZZa42IDcPJeNxttbKlEkBtAE/UYkY/BxwmIlAzHw6Ho9Ho7Ozs+fPnGFzFYnF7e/vhw4eAazGytre3oQN+8xacI4Ltg/kHJpC4+IuLi06nA0FwMLsxlIDZ4WlC5oJIKHE0aALExEapfEeZGhC6qQsBPxYQcpFRKxaLYLBSwxenevTo0f7+vog8f/5c53IAEJNc/3oBOG3YosN4QgAQrp3NZtDAQfIsBh/gySJLAaliYLXMMoJODuASDQLKbblcxpdiqkSzI/E2Go1OT08vLi5QhIGGAhW90+kMBgMkYKy1mUymWCxC0APaL0hLYMRhYtTa3Do5QW1rhpSxMFXLbhCgjBEP0VDMHaIiFZwppHwgis3ED1KP9+7dg+bPdDo9OjparVYoUkEaCSU7gG5RnCtKZRvk+gcPHjx+/BhJhZOTE8z86Db6EdM3FcNWz8+62UmGSmJYt5eYeM1d1NoAjEgFEGsI9bqpgECVJuESP8IitdETjICgZlLHADi8h2sotDuIdwAd5hIZBEGtVsPgZZIYDgSYTCg9CUI3sGkCzXid7OMk7Ze98bp20JlFPbqTGsTUR6akDG3rcBmO6xrjGBEvDDNhJpcWqTdMuTLNZh3ny0b8ZpP6sCRsjli8HNK/zoSrYDabdXtdf3WedqfzhR0Mlpjb+aw1MkXdbST8tO8ona8wY3MvpxGi9XrNZ4d6uOwtsd4vigpfzcpw9SQkSoBYcwl1fktv1QiwcpWPaXlrvXK8qBW32R+wdZGonF8ix78Yu5MTSzKyuE5xOCYdoDMZrNKQq6RLfSOxZAkB8ZgCrDKQzOXz+Vw+n8vlstl0NutkMm7KS5vQlaWRhYgrkot6GmrMl5HKRFqhxubq7ybSHhURP4rCTeRqZVWVuiiSJqmdNiF2HEQ/K0X25Ht8RfAkEp1SyHJaJCNORkxaHO/rguTM9R42SQT2OsH3WJLj5l36zWhssmIggaWajfqKSQaxXj6YL0zCuLFv3CgynnyDXCNYFAt4vwBWHv0/tMZaYyNGsZWrXSuJ89pNwhEbJqP/pTHmRJYiIpKO0jPAi9dR0YBRuRk/mij8KHWk+f53x91xBxDfHd/JafBqopW4IVAS1LQul8uXL1/2+/1Hjx5VKhXsU4FkAWdhDbjruiA8oh4ZHDEw6UQENECceTqdArrFvjOmO8zdpGZEAnej6J5c9athLS2Ct16vl8/nER6AvLlcLvv9fqFQMMaA6jscDg8PD+nQAnlZwiKI9kej0Xg8Pj8/hyRCt9s1xvzqV78qFou9Xu+999777W9/+zd/8zfAixlR0GBaIklWYCLj8RhCyTTHA0MQ0QgIR7ClApAHgJ5F7mDvAowIguD4+BjgLw3NUJOOywZUgdao1WrgP0JfFfANd9Lco2urbjQLasCBLOBB4+sQEj98+PAnP/nJ22+/vbu7iwA4hjdtPMBP/PjjjzudDm7k6Ojo9PQUFeI3mAt/3QCxXAWIdRCO4BDIO5CgQqHQ6/Xm8zmQKTIKWb4NeQcceAPaBxRUUNSZiYEoAXoChETBB9eaEjgD/LXgL48Ojy+FzVc+ny+VSgCaMSgojgEu4SQ68Nl8Pr+1tQUMGhX0G23Zgfb2er1utwt2p4ikRqPqdNpE8GntaDR6eXhYaTQODg5wQkiUoGMg8IZmC15ptVpHR0ewYWy1WtCUKJfLDx8+fPvttzEQwLze29vb2toCLnldwMAZA+zdfr/f6XSQ+wGJdb1eDwaDk5OTk5OT5XKZz+ebzWatVqNAOT4OPj5lHzHXAWocDAZJpywqm8OZjYgzpZNJU6VcHdJCIoL+QCnYnZ2dt956azqdXlxckM4GQi6w5i8xHF75kRhGjOG/Xq+R9qhUKmDydrtdmGROp1PcGhlb9CunHTlQTqAtVCvWMjXkS0InIZ/PW2vPz8/7/X42m93a2gKfemtr6/T09PT0tFqtUuYyn8/XajXKQXS73dFoVCqVHj16BE0GgNRIPWrIGy2JC4DEDTo8VPV5nZhg8XS0YQ7l7AlboJ9wEEHmSET29/exut27dw+Kw/guVHm3Wi3IrVAfA6kCz/Mqlcp0Ov3ggw+AGmO52dragpozmPUgKbOmYTKZZDKZUqn08OFDERkMBgDFKFQCyioNTrV/Gu6C1GxoHOuC7hiI881vTlzXdSLCr1ZD1huDWJzPgmKqOgLcRK/QKjEaKbtOkYAqVVq8Un+1rqbHyovsGtYC9HCOeizKqGOgQyCWbPyTX0erPZRV4Zr5QJnTTSrh0j0vRjdmxpebJW0Eit+ps489CRJssA/lguV5rmOME4jnS8pk14WdiffAMdUvE3S4V119NuLCksCITWQu71rfBuPJyCxbo96R6479tbtcOX4QcgZggQKJiuwMINpjIOD20Zha4ha1PsyyQIhpMBgQ3M/lct6r6lr0RHx7lFiTFWKSvrTg26i9xv0nudKAU5muiG372Yt0IT9zZhxuWuAInRObUqaok9eQpFgyORHTVIktVdh2ar0UPf8wcSJXHQh0wZkeEVzaXNc1BorMXjqd8byslXxo02Ho+L6zXmVXc89fmkuirq9QN7ySEklF2hGiAGKJ6MZAkFeq9jyGIkkEOkuEIpkEYJd0w/MjLFjrDodX2aASjQ43+l6ynj1xU5JOyy1sQb7MplmuSVzprWPM8JPUBxZjJVeZpCx+TJg4pkR3m11Q8gpjchNJdbukCE8M802i3jpVE+uK1x2adqMHznWg+TUlPpexizFSKNrtbdu8Z5eOzFNm7Yj1lclnrPMkPRivA5S/6BYg2as3/vPbeaSi/2pjurTSeHGuNouJRihzQs6dysTdcQcQ3x3ffYx445LD8HKxWAALA4yVy+WAebVaLcT2ugSS2AHczxCsIv7EZ6E4gXgDW3CcVtOHGQQmL5ICCCwkFBGaHuAXEQHXAzEAAAXEzNPpNCagyX0woY1ms7m3t5dKpfr9Pr4I0APqxyEzmsvlQAfL5/O4EdhtEWigvxMCQvjLQ1my1+tZa0ejEdimoHdhC16v18EszmQye3t7aHzsmEulUrPZLBQK8GLq9Xrj8RixJSI6UGNwEkRHdLQjRw9ACUWfuT/TD50O5lA3dl13tVqRkYEDtdtPnjz5/ve/v7e3h+8lAHozHQDoTLvdBlAyHA673S5qxkmU/tNAEtfYoDFGQsCM4BNUetjNlctlBlEMXcjXXkUHBW2BfhLI0E73FMxlMI8uCnhxMpm02+1pdNC4DB3JcRwafKMGEzXpiHVHo1Gr1Wq329DKoET4YrEolUrQP9UUeL3Fn81m6LdEpUXEhqHWYQyt9aOb1QQ9BJzIEnmeB6wKshIXFxeLxYLOXdDIrtfrwFUxGBuNRqlUeqW+BDoVpikkQkajERAQyFsT4AYYpwVniIrSvQejEo3JABgDSq5W9ZLViAcNyRQdewBZYAaIQANSaGRp4eFeXFz0ej1omoOWzs6gA+mvb2iw36JTUaxAC9Mz0gOGlYyCONugMZH/wLqAxsS6gBcxBJDT6na7e3t7jUZje3ubWudYHbBeQMynUCg8ffoUQr3IeO3u7gKAa7fbq9UKNG2MOOb/tEABAWIsahvdw2K1paTz6ypp/DWTydTr9e3tbZCCrbUg2mO9o61fuVyezWYXFxfL5XJrawsWc5PJBMz0TCYDLz5KKsPZFdUq1KqGvtN8Pr+4uBCRbrcLlPn09BS5JaLbxF9wTgiGANwnbEpeLd7ASezmQPobytiJZNLpQj7vplIpx9EuQxsvJsYTJPEWWWraS7LGJUYH06RjnlDX3WuAmB0GY4TAFjE4DeHpMyAzN5lM8AiossILptAHZrx8Ps+KkxgNTateaB4xwVDeDrsBS1tor6TnLiz6BIjpfIDylGKxmM1mMhnPdSVcuf4ot5jWptN74/GT1bweBt4Xfrobf+Sa33WRsiPiinXEil2slu5yujIDIyORdCg5z0ul02ks0JheSLAlQIyDmDtme7QSxOK5ZPM5IkOMKqJLBfBstuy66VRKjJGvWfnnOgAuhnxtFFy+GVdKfst1+mBEbNmjYrDdRiQrJoTN1EVS/DoGq113GddxLfX6qCU4Ek3Eq7okpVtxrHWCwPhrJwzMJfpjN+FcMWzLXlODH4ON7NU3ky8cJrIj9hp87QboTa4ZMupPriueJ657C5boF2RUJIVNYjo8MeVu9BlteKglRHSPiumhX6c4f13+Us+NG3dNG3MPejrd+KV0ziA3n7t9TeTnKxwpscvQFR5UvKGmihZN1pLESew4Xm0ZijXiOrLdtG8/C4YLyVXdo770fLNeRHhlTICYP1b1HDfSRdFJjjDRgZNTegwU1sMk3DQQvs0wsRf9zCMdZ18kq6RdAkoQimRErMgqgolTl76RdwDx3XEHEN8d3+EjxlKMbcvgwAOEF4QXlM3CZgcqk6CmAo0lqQqbAHDrUFbc6XRQoQ+qHSk2CFp0MJZcxRlNaYBYUwwQ/NDMB2cGoRJRca1Wm8/nIIxoOh7pVIjzK5VKvV7f3d2t1Woo66Z0Qy6Xq9VqDP9wnmKx+MYbbxBc476W5ecsKUVkCEgCRFFUnSMywT4AX4RrLpfL5XIZVGK8s1wug/A4mUyOjo5evHhhjEH1MWQNWRheKpUA+QF1gi5nsVhsNpvADQHusNJWq0aARAPs21qLOIqpfrwf9w5N6r29PdSAA2GPcVuuizRQYk95aHxdUurxltKKrysMuyEUAc+XORIaHuKyAf2gA2CYACtH1E2cF2MB7OBSqQS6OlEP4u8M5gktIYIFlnRxcQHgEsRYnBlddz6fg+UNsWwRAX8W8OjZ2dnJyclkMgHugKGKPomuzoLiWDv4vg9wudfroQPjPZmIhvz5/jBSQUFP4HCG/O5sNjs/P4fIL3tssVisVCrVahV5EYxWNhdSNSgFuDnlsFwu2+328+fP0eExxjG9nJ+fn56ego8P4VqIV+zs7AB9A+KGFAX6NgYpxizzZKvVCg8LT01TRbQIaQxLAkhKDWgInUP0A30J85jv+3iyFxcXw+EQvFHmqLTe9Nd9sKIZs2Kj0UA/f/78eSz3Q883DacyGoQmwGKxQB4LHZLEYbQk8QIMlul0KiLFYjGfzw8Gg8FgQF45DEIBLmN+Q4ELZvVisZhOp6vVKhJOoAfivzrtofEyrmuctLUgO0PBmKsMZnXWsuB1RndMF8HyEY8Y2DQyo8aYwWCAmdNxnNPT07OzM5CLwS+Gyj8VNpFlZC0C8ERe//n5+WAwgIVsr9dLpVKolUnWcTMDijkHZGTMAEBUCR3KVYrWN9brNm5NMtlsqVTy0mkvMju6bh6ggCnWNWDBGiDmToDZuJilm2yihunYXmvO6C+luA0SIcBB+B5I1mBDQkkTFAahO4FBT5EiCmhQioeEffTJjaTLWEG0Rsz1oAannrK25Idi0saIwD8xf0qkG4NigkIhn8+5qZQsZ+nBstbrHnSmDy8uHk9HlSDwrP0iVnXXAcT2xr9qCMyRUEI/CJb+0rcLY+eOI24q7bpZrbPEhL0oiQn8SUvNECAmq5pbSq4vWHaxoGez2WyxWE2lUgk5pm94937di7E/3b4O4Pbj/ToP4Y15lxhWi1koqVksVwv8X3k9MRVaUeoWuh1ivrKO4xrjiBhrDYTEPE+y2SCTDVdrJ3DM52RANwFpJXHh5E94VZg4vP6DciPifN333nJ8OWJF1oHMFzKbS84TK+K44rniOK+h722s7Yj5EDIHQ+8KPH3skylhJ9qSVJ0qidJq5ZMYrCwJ/m8ynIyBy7GenLRV1FaN+mKw1uB2EHaRFs1rYDisX9SxttYoo1sM0lf0SSZMrMsCkhSc0Br0WMeV3T358Y9tumjzlXDxT87kTNYzc5kQWUU/S5Fl5GLnivhKMsWJ6Od+BCs7V0Fhm8CFkwmMjT0//I6gw6JUv91I70VEptEt56P5wUTtmYsaahFpU8zvJCbujjuA+O74sziSbBe8QlDMGAOvJDCVisUiNsqwvgF1DuXSIC3SroellyBC4sDqqHO2Mf8Z5p9j+0X+VSeKp9PpcDjE/oNRELxEgERfDoyIE6erqim2WyqVoCxhre31erCTWi6XwEEQdqLEmDGVMQY4DoNDBHiIQoHroX1Az4HyJgikVGemvGahULh//36lUgGlCOWlvM5cLgfoClzsra0twNb5fH65XF5cXGCHAXom1YqBj8zn80qlQqkNRNp4v/bFBk1mOBxOp1OUTiOOchwH7UaJRrQYpAySG6mbe9pqter3+/gKAOWQbkjWjn1j6LAoxeH4hjL6K2A+IF8gERcKBcoTI4AEiIN9IVpjtVrRu5mIQLVaBdbPgjuSKUgoFmVAtFgsOp0ONBO63S4oqO12ezAYoLfncrmtrS1kLCjGisvG0Oj1eqenp8jQFItFvg3QFajuGujULe/7/ng8RmntcDjs9/uAxYvL5dPJ5PLpRNtrxNjYKBObwDzQ7XZnsxnuKJ1OVyoVQMPb29v1eh1EeMIf2Wy20WhsbW1BwvVm9hNMDs/Pzw8PDyeTCStq8dUvXrwAcJzL5WDtBcCxXq83m00M3l6vh1GDDomJDrMWwAIoP5DcgWQYHhCL2Yl7xvx28HEkijqdDtRmgMUDS8VH8L2wGiPBMxkCfX39n+dHRAcEH89oOp3mcrnpdKq1nmPBOcO22EBmjBSb/GNRn5ZTB14PujqTZzrloANR4Pv4XqxKwAGRLPE8DzUlXFnYPUgSxMXzdX5LjCkcq/rk7xQHwCSAb2R+ApkejDJIfhcKhXv37llrO50OMjQgGne7XeDIyPlJ5H0niqMEQjf0Z+giiwQk1gI2o47bMfMAhkaLYf6npSojWA3u3KY89ms9MplMvlBIZzJuZDOgibS672naGg0D8WaaTHIJYxrgZnBNtwDH4Eb1SXQbYpHMLiDLhX3OYrEAqZy5Kzxf/AnbKkzm/EZ0JILdBDRjlDS5qqEcg7mJSjDpyEywnlj4BrxOEXaK9hYKhVKpUCy66bSZudlRqzmZ3m9PHvfau8HYtf6XApw2Mh/NNSCyqP9eVu/iXkIb+BIGrhc4nriOE1Oa1lhh0ryOtqsEiCkrhJmf6WHs32AkkMlkioVCKZNJ3VJi4ivAcNr8LdY/tY6E5hjGsCRRThh6aMf865Lc3uvAZc3x3FjvpYW/Y3501O1hcZuGz2L0go1k0uS8pFtJt4Dml2CPDfuTTCaTSnmO49jQBL5xHCmXg4P7q27XPT1PjdfuemE+R4ezSg7Yj2RGyaPUjEL+4lwlVLqKcmjVf4NIy8K56gwmESYVJhzG5HqIzSgZAVckLdYT30p/LC9OpJ6VXlGMI7mCbDWkmP9qGHHExNY5SE5NtLbGAGQOBlkBZpRjlNukZWLMEY59VfvN6hSmLpXABMskNJfs6zIWOthMzquxdAgXEaz7iIZoDMP343XcL1/n9bAmCT2TNBG8wgVLa6lrdDiGZVsroRFHjGNsc0sKRSlWwmVoPjqW42MxE7GAffMiC5F59JMVSUeJEPTDTPRPV8201H+3imtsXoUO200dOEioW3w7j1TUCOtIdxjej36k/QI9Gb55JRJGQzstEkQNe3fcHXcA8d3x3QWFr3sRAcl4PA6CoFqtrtfrP/zhD/v7+1AwqFQq29vbWAULhQKLE0FBHY/HgBg6nU6/3zfGQLQB4CYAx2KxCGQnlUoVCgXuIQgxkKmKnGpsl4xdO4Dg3/zmN7/+9a+Pj48B0ZLahr2g53mAj4EKgatFYBrXXC6Xt7e3a7XaarV6/vx5t9vt9/tQychmsxTBwGcR9oNjWK/XGVDRiAyYYL/fn81mwJpRZo5LKhaLOAMgQjgOoZS+VCqh2WmvBHIloC5QQY0x7777bj6f73a77XbbGAM+HWDo9Xp9enqKRsPtYwsFS0AkvTUdGGQ01leen593u11rbbVaZcEyoRZsX3CnACUBX8KWR2404WXvGgwGn332GTIKnU7n6OgI2Jxcre36E6hMbKoVZWejLjNVodElYjFMzBtdW9IhSgEGhB0hmX0AjvG82NW5DUVPI60VSogA2fGNQPbBuKTOCTAvqENA/rJcLu/s7AAjzufzjBjRMbRco35ehPYWi8VgMADQbIypBsFsOk1SPIA+JB8i4zQQ+iDbWi6Xq9UqlGowsqBLWygUarXabbjDxKBHoxHgVxC3EeovFouzs7PRaGStzWazyACBcAolSiBuRLGB8WFEYIMObp3v+xRfBgKFFubUBNRbw1JUtkVGBHIfQF3ZLEg2YAJErgWiH3w0xPvYpF/fQhBTkwR2CdIuBjivASEfzd9iSAE1W13XrVar1HmAsAY+iEAd7cMWdl0Xz4tq8sDuXdfd399niIiiivV6fXZ2Bh32vb29R48eQf4eHwTkWqlUCL0RCCY6jKG0WCy0uA0dq7gIasMrjnfmAMBzf/r0KRRL0uk0vg5C2HzEkEs+OjoyxkBAw/f9er2O3B6Ea+Be+OLFCwCCEtFIMUK1kBGGPOWM0+k0SnOQlSSnCfld1IJou0tMSiSrYpjwnzEk9E/GIFZ0KjeBzsfgqqRzPdFkFu1yycMEfh38rYUa9MxDXnASSeeZk0X96D8YQZgoSLpHyzMFRdF/fly/rr0WNwLEklAYiKXQtOSrRlV0yocoj55wIqQvlUmnsxkvk5FgmTFSXK5q00l1NcnYL+fGc12d8kZxCU0xNiKGidswtKEEoVgxoRUrkkCBk5i+RljYMhq4jOn5EHXCE8HJU6lUBjk8Y76mbTlh1hhDXF+/xo80J5G/YwHlLeiR4qqDt69xVW1kF1Ox0I55se7Ebo/NjC6w0PBu8uNJODiWEWEXvU7QQEPkuuKQxtSo/UIJo+elQuv6vqTTcu/e+hc/m+Ry63/6oPDpi1yv5YZBpCWajvSFUXpvIkFSoGZBwqTORviRibzjCOx6SlDbiwAyOtcFCiAOFSq9VjC0/muo0DonujyOnZxIKItADi/k//sbOfxQikbSOdl9IL/8mTx7JOnUV+q5JoKJCcti80nok2sQC4kwq2B/haGkaUCxI4YO6/Qe+0xMkB2ladhx4dEjIaql5GPoamw6lauuPLEpVE+YclXIgmQOvZviBj6WBaEotpZExzjFkkdBJI4ghhvaOSaWWRGR0BjPc3JZyeXF9eTlqS1lrbt2ZBp1uZxISiQtkhPJRDBoEPVMJ6LKoi85SjJbi07cPJPH5IzDhPBxoH7/9oIjSt17HeWEwghg89Ute1dBczdqxv+l2frdHXcA8d3x54cRbwwqqPALtVO4nH3yyScPHz58/Pgx7HQ6nU6lUkmn03t7e+VyGeqiqElEPIOq4VarBYox1rwHDx7AaQeU5FarVSwWHz58CN1GHSaBLQtwNp/PA3xhbTJ14o6Pj99//30UaENcFUculwP6OZvNWq2W4zjQWAAVF3tlyF8gTkOVN+iWwHG41SYxGR8BGoXa/OVySTlaAMSIA/E7WqnVauF+wWrRlGQY4jUaDUT4xClEFTUzmsUlURlgNpshfgZWS23Nly9fQt0VYX+pVLp37169XgfHjdlybFCAs4PgPBwOW60WRDxR/A6JWB1j4/3W2mazub+/j7Lu2/e32Wz24sWLw8NDcN+63W6n0wFdjlHun8oWySZ3iopQAx4oaJ7A8tCSsDubzWaQAIY/FTdwAJuwyUOZM9i7GnDHowezmC5nAHrA3m2328PhELTKo6OjdrsNBLPRaCBbg4fS7Xa73W6pVGo0GsViEdfTarVarRYgtp2dne3tbW3LRiVN2IIVi0VSO+VqlSg78+HhIZCvWhiiXv5zeF0ErEYdy6GePZfLoXy+Vqth18sRDTY9vgtUtWazCeAYTMmbpy/AW4PB4Pj4+KOPPsLAhCsdIhNMIPV6/eHDh/fv38c9AoPGaII8MQjagMkA37PUAGoGYRj2+33gzlTpJZcWmRJdQqgRc+jJYshjcsBYLhaL29vbmJSA7unwG09/PB7T51M22XC/jszIhqpkdHg8TcxC5ObwYtCBCbKQnsZwHcC37/uQbgfBlqgBQHlMNZD4bLVah4eHIA63Wi0g1MPhEN+INF4mkwElH7RulIlgWKH/AHCH3AQcQRnBMqQE9x/lC+ghbFsycOkbg5TGdDrFxcul5ZFByyDv0mw2t7e3XdcdDodApc/OzgaDAUTwS6XSYDA4Pz/HWOj1euDI12q1Z8+eYaRQyAWTNstxkKeEq+rR0ZHjOFtbW1gFBoMBKkKq1Sq87LTBFCZwDEACScSdGb6yZeRGi54/VZgW26ts7L1JocYY7zK2yfmi93Ud8BqDg2NfkSSjUSmCOHVSMTZpfJ+8ko16mreBHWPqnPaaQ65ajbmu6zjRvVgjVkSsI9aY8CYq2dfVD0SsWFHP1nGMFccxjmMcBQ1v7MDJGvPrZE+175nGqq6QH7/OAZJkL8YAbmwpWZAeE6rWmekYyiyKlakLdGKjfhNR8YqVsYaJY3X6lJqNecrFhFliBGQCfwTvkq6MmvweQ9Jj7GmOMibmwZOA8IvjONaKH4jn2e1t//vvrr3Ueh3a8Uwmg+x66RjHWjHh0rFu1PFMxO0loJaKWJbUb6UIKYHgIEJ1NUCcUtjZRoA4vEpb9iO6sVX8YjKUAeFB9tS7PKc1spzI2VDmXfloId5csiV58paUy1IvSbMhKQ8Y71eIHqOHwqeJxRF7AIYzqGLEO1FNhWVXy/jGNv960KGkkuUvmjusC5UAECO04WVgI6dzuprAIVd1gXVuUvdJSehRxPjOorRNNCVZrkpn8EU9tWpyhqMKIPAiiyG0BjEvILYWOA4I5MaIccQ41sjafK4ynBFZiGQjfQkKTTiRxIQb9cx1lORg8kPTfl8JqoY3qq9s1Ff5th0rESuyjrJE64jyz8ICSA/jlXUkT+xEY9ZGbX533B13APHd8WcAE8fCD7wCehfWrcFg0Gq16vU6RBIBeQDbotEQyUoSiVTCJwoE3nK5jOAWm4bhcHh+fl6v1+/du0fUFSCviEwmk9lsBklTplLxXdCsBKfj+fPnFxcXJDli+Sf2BKuuXq+Ha0aGlpZrAKdwm8CAcA30pGKhN8AmfoRLNS6DxVNAflEjPJ1OYb8GCAOv4yNhGAIdpsImJWgl4ZzAxDKgRigM9Pt9x3FAiMjlcvV6vVwue54HIdpUKgVwBHoge3t7pVJJG6lxt4QtONRRQXlmmj2Ww2dQhC0aTeHBXLtlT1ssFt1uFxqdwGgAYVCN9MsF8F/fwOD2GWDNcDikejKK7rHzA+G61+shYQCVSTQj9qwgsLDCkQSBarWKz2pKMri0yAFg0AF1arfbJycn/X4fvMWDgwNI9IKeeXp6ivcPh0PSIQFhF4vFg4OD/f39crlMGVb2AbDaIUKiAWIdJWqXc1zeNNqOX+4MI90VqMoAU0ZXh3B5JpPZ3d2FNAqiRyI4mF5wJVB+iOpAUzfPWuQO9/t9LbiRy+UwZsG8hvQzCMuYQMrlcqlUcl0XqRGIZmCEYkyB90cEbTKZOI7T6/XwFSSk4LLJLgTQhrkCRQNgfaKfaN9I4vJANtfr9cXFBfQxQPHGHEI7u1h0/RoHSCxHSP4LihKA3QPVolC1nkDwNMke0tEdni9LL+nxSCnYmOw4APFWq4VFZDqdFovFarWKHAB0G8C4gYgK2XyY+ZGc48jC9AgsAA9Fs4MBdpNprsvtk2JHVAmMMUZF1YTmcjnMwLgq5PCGwyFbFUI06ADr9RpoBRY1oMPtdhsEYWheo3MOh0MMZzwOFNkg+cFnhAWoVCppUImVLrx+SmHopCPBfdlkJf+nnYe5FobRIphMZhDHRK4UTx83S/pYrDDi5vu67k9MGCSL3GPF/qTf6gPTSzab1f0tJnegK+WTHFidsdh4IxsdwzbSipM8TV2pQFkSdJto65VygLiJFbGOE7qu73iBuFacL4swJRUkqEF8u085ruN5rmc8sa6XSmXS6Ux0wbFWjYEypCLG7lpzqFkwRAgMetbgQKSiCeFr3ZYnszW6w3BoU1UZSeX1eo3cP6ZfshTZHyiGFkOdZJOwNa+HOSSmMDVUx8yoZuhzABJcZv3NFX+tBC6vu2VMiS42XWsoPIa78WIQpGAPRufV6BvFdcNi0R7cW/r+qjv02931cpJeL4w1zkwyIz/vT1y7jKRFYwBxOoJ3JdJ22AgQ2wggZi2/H9Wkh9GL4TUAsdavsIl3GoUOWyWanBJxJFjLaCLTrjgdkbGkijII5WBfKgV5+lC2alIqied9tT4aIZW6hEi7EdIHEp0TRS3cSMimco1YTZ7Of7C/0RSU0zK+CGs3h7k2ldWlHrG177qMYAzq3QgTa8MJnlmuyqRwyx3jXnDVIECc1B3W6c+YrEdM5iv63YgY3zeLhZnPzHohFh1mGUnr+irxsI44sBJ1XSqlhCqfkVSEMNf8/kpo+DZY85/8MBGevhTJRIMUbYV5IK1M/1JRS/KzuWhQ3x13xx1AfHf8+SHF3BRiOQdT7OTkpFKpbG1tgbIK4huXZ9CdsH0Etlsul5vNJrBgKPYSHgLH6o9//GOz2SyVSvP5vN1uY/dAPTgATHRUk6jgkXBVEASoKwfZDbsQag2zvrvb7YL1PJ1OsZnG7dC8CKgfKn8RBmCPC0SVWDn++/LlS4hI1Go1wN80msfCv1wu+/0+uJau6zYaDZ6N6DC2qti26ix6bMcsSlgQwScuD0RIEM1IBMYOqVKpPH78GNzqk5MTMpG5w8b+A9DYarVqtVr9fh9wvEZpsSOBITh32wBrAKjJJtHqm0Om5XKJWjNQ7VDiHdtOfTuHBtjo6GZgvzYaDSA45+fnjx8/RsE4RQOwc3UcB/xoEaGmAba8gNcrlQrSAwCtiNrP5/Nutwt46OLigtx2Sr5sb283m010A/J0IChxdnYGqLpYLD569OjBgwdQbOB36Y1yOp2G8AJYvTEkJRZiIcEDoD8bAeV46yXv0nEwfunR5/s+wvVCoQBrPgoyACgEPRMDloCp1qe7+aHArw/JqqdPn1LFAiN0OBweHx/3er1MJoPeC5IpBAHokJlKpWq1GrI7tVoNCtGgcEJ6cjQardfrYrFIXy82IAmneIhaRRcP8eLiAmBlqVTCOOU8RtvM5XI5mUyQ9Wk2m0jC4auJwn9j8z/BXKTrGHvEXbMj3GSjuykDJ+CYyBNYa2lPGgQBhoCIMKmAZBXKTfCYRARixJCHxvWs12uoLtTrdYCwSFOhJeHbBio6iLdwIIyloFiHsVwuaasoqp6arusYX5i+WITBam5Mv7T1o6UqtIOQ4GS1AXoXPPcAeeOXwWAAHWGI4KNXBEHQ7XZd10VGbbValctlXAZI1uAgY+FD5Q2+GssrhiEWXKBmTENSPBHJDyzWyeL6Py1S7Kpa8ZhwRAxRpUQPPd/oaEcmI0lhryRHJ3Xwdd190q0BDQ6WN4F7Udw0dCFkO9hLyW7TTGeiaSzZiWHEySUyVqSfhDl0VbVcwxrGeISwFd6GPVKhUKhUqtVqpVQqQk7ZcULXc13PcTwxnr0Ewr5KHG6u6g7LjUITTlTna8S4JpVO5bx8yuYdCbxUIV+s1Ov1arWKBBtBFjQpcjkUAsKCy+mXqBMMtZbRwdcxyWBdKBaLhXI5b63j3hYG+BJQMouQgIUlAWI8JsqVgo1Ba2WYGGs9N2DEmGP5oLVNsSTkSvhdSb/KWP+JnYEGDDGaPPE+/mmjb1jSqSyWwIvpWuhsSowZjQlZe39plzNrxXHEMSabtbXa8sHBbDzqV3KBvwqX63R7UPv4ZK8/zAcz9xIekggSMpHrl0SwVxDRDFMRPOQq3dIgKtsncOxHVEQv+qC9CgGHkeBpqJiJ5qrEhET6EqnoG4PoPSJ2LkFKAiPGEXFl5ctRS/7uf8hyIj/+vvzoe/LmUykWv1IO7+ZJVSu0sAgJCU4mXW4YGtpeUmOvMd66VrUWJe+QrN6IkXBvkOWRayqrNiYa9XoUkypOLijJIXbdcV35S9KXL4Gwi+/LYi6LmfiLiMMOO7UgofkQqlxFUh34NmLBr9wdhFff9p2g1i4jmHgZjVMbZWLcCCbORCLFEuHITqTyHNzhSXfHHUB8d/x5AcRa8IsWQKPRCLH6Z599VigUnj171vz/s/cny5Kd15UwuE/nfe9+2+iBIFpSAFN/KUtKsxRkVfOUxjUQ+AKV1BMgWS/A1KxmpJ5AlOUDkBzIUiUlpRA7kSCA6G/nfd+dpgYrzsL277h73IgAEQHQj4WF3fDw636ar9l77bXX2ttLp9O6oRWYCMLQ5XI5GAx830dL+3Q6PT8/R2qEqDGTyTSbzXv37v385z8H1jyZTFqtFvIrTU9gAgbiAyBgIlZRFKGvHxKfBFOoPAXlhMFg4Hke3ul5XqFQYL8SsKr5fN7r9YB3IxwREeQJIIUh60ulUhBJAABRrVZB2NRsx9FoBCXNx48fu6578+bNYrEIhiOQDnYEU3GCLDycuVat0tQh5vaFQgGgLVMdKhTDqezw8BBt8miKHwwG0Mdk8imxgsd4PD45Oen3+4wz2NaE94N0SYoZZHBnsxnoz7xqJgnbFWMBhCGMA3ADg6lkfv5qlJEtDQpQGxpob6VS6ff7rVar0+lcvXoV9FugjexY15Eo+UeiFBi06Ac0BxBWAmRELx6gw2azORqNJBbUQ10BwxIjtlKplEolSKBgmFWr1YODg0ajgbQWmS2gIpYloHGRz+c3Sc0QDiNTMpfLWZblLZefR8BATOJihm4UZQ5AUBXJIXSQgQ4Xi0XcmbU6yNvXK9JG8vl8uVwGBM/lolwugyhKphieAvEySKiXSiVMMdd1q9Vqo9HAZYIQDUNFUHqRe9BUROftOHNK0+D9UEhYLBb4FfA9jaZ4/GKxWMQ6o+lgWoHx91FBMRrhufKDszwcDmGKKCLwNtStl3zEfKykpcuqZiuKfOVyGestPh9TKZ1Ogz8LjBjDDFx7AGS4h5SSv7i4gG4DPAwBo+NXcHuhzFupVG7dunV8fOx5HjB6NKbQNgdrERQ8oKKu9z6+h+VGlAxx2hqDSKfTWH4nkwn9UTFCQMlHjQQzApAxONHj8ZjFBoC5jUaDtGLUNrrd7tnZGeqmGD+oHkFzI5/P1+t113UfPnx479499sdw8wIArVt0tc06nhQLqHzoSYr6S1mQLZFUKpXLZtOZjLPaxUIGqFY7RXMGDw0/GaTRpJrkWmg42XT8BLZ2HEnw7lFv5kENcVpZoroGWB9lCQD6VCqXz9V+VwBiQzdTT0C+wnjJmNSyKhNkBHgaIjGgOnxvoVAolUqVChovMo4jruu7TrD0PMd1xbajJ3ITX9DzthIYscaFE6ix5VjpTDrv5DNSdizLTRULxSrsHGCfSxFeNLTRAwCBDXsIUPAmEAxcGJ1hKNIQ7sHmAhHbbLFYWC5d17WeJZB4pgVZOx9oYR/jSZHljRMej8fsyMFiBaCfFAeU5KEdJKo13oDD1uJZsk6zRVN99VVQa4uevdwcDX9XTUqQVRmlLeZ4RiFEEvZ9ugtEg4xaTkfECkNrETqLhW1JUC2PX7sxblRGYRBMJtmHp7PhLOvPrMk0FYUS+VY4t8PQFjx2SyQVc4oDBRBTv9WKG/YDBQRTYgJoXVpJGxtN+knlVsZbvqKChquTyI5RY3xLRqQgUSCSlSiU2UL+4z9k2JPlQmoluX71hQDi7cDupgGzFuJ8quq91qBbi5xq0DZcPbZXBNe2ZG1PZIyTTxY2jBqGIUBsrTPE1oP5qaD5U6u2USS2JZ4rnieu9wTcDG2J4LQSroo8JOFgvv7iPRLRV9CuDRNHxKyAOqu7lRtz9kWJEWMCZnYmdbtjBxDvjq8+KKzZoEYjDJlW+Xw+iiJwGEG1YwCKaBsHslBkxYvFAhkswGVomNZqNQTr0+m00+m02+0gCO7evQuwjCGdYbGNRJ1VYkTAAKZJ0mFQCAALyBHORFuNIXPmBVJrQmLhV9A/SaMD2MfqNMDfbrd7eHh4cHCAvJqJXBAEo9Go0+k0m80wDKE+adv2aDQCRwxQHXXQDNNbNg3xwpnW6rAYZ0uGEZALKHIOh8ODgwOoFgDUAL6PB4FLBmAxn88BQYJywkSUAgjUwEITNE4PsDKc8fb29kBRuQyOAHoLmtZ93wf0iafDLOUVEb5cCbJU7EhWO7W2IWnHp4AMBFwV1jnwlOkLzxGI6gX9D4H8or4C9ivqE2Bb6EHOrtJ0Og1EGJMUss7ZbBbPGkqmxWIR8FClUmk0GpVKBTkz8meJnaC2cCiQgpKZ+HkjJ6JY/CL63WK8Q2IjLAK+FHAoFovAhQEQU6MGkK5O6i6ZhxD75j3nN+KJAK9n8g88MZvNFotFCF8AXQLoZts21CcwC6ALAUo4uKi6h1E3PEqsQqMBOAJDgD5JLdQr1Y0bN4rFYrPZhMKA5oJRScBAfJ411Xnq+m9o8NFeZjAY3Lt37/r1657nXblypdPpoIpWKBQIk1FdfdNX40XcZ1wXW0Nwz8F643tyuVylUgF9G2cCgAMyvuPxuNvtAujBYrtYLCBv7XnecDhstVpYxDCVwjDc398vlUqfy6HEF4s1E8AuEQ3Co9SjoGgSZQFxziKCjWYymZydnS2XS4C/urPb87xyuQxev8QMRBEB7R0gbyaTgfALrhSa5nt7e7iW3/72t7/4xS8Wi0U2m4UqNIYxqO6QL282m1S1BiN7NBo1m03oLwMsM7YVTE/8PJlMhsMhjaqIJyYt0b7k4lwun6/Vatlczl7d4rUDlTb/BPanKaKyKkYhCR0G43+NjSxJztIcMQ3RarkG+igwukBQgUqYxOZgCEvY7mD0+xMs1gDxWo6nDiGMszWYaMYezbuHrQQMaDqwQYenXC6XyyW4elpW6DhL1/GXqZRje0Hk+r4dLawn0qjPDQonhSasDdxh+3OswbLFdu2Mkymmi3m34liOlyoWSyDoV7GAEx3G+MdqjBuO+48YFSstojutVK5xJdpkpdNpVHEy+XxuuXQv059vWdZWSGhtQK470w0dDA2QaRdNQN4Iz7D4sIOH7h34QL2PG/0fxvdiYTcALK3nIMpNTqcSCEqpMkdEmCGBIX+8FvtLTs+ktPfa+61Nw3Q5R7e2xJNXosgKAmuxsMNQ0ullvT4uFQZRtJxMZpbjtjpFJ5oNh45vR7O0NwmLs1neD1NP9BxSMckXiC0a+b1VgBiN6pkEgxj0w3Ss/RqtQsCGzddagHiu9GSX8QkQYvZjSmNKJC+SEllI0JdOS4KpXN+XXk98/wWiY4WViup35HDCyMTyghqGrGrfM9jYJIOu4X76FWsBK3bJMOZklZrBBrZLBLEU9pF1FOAtWDDnIL6UVGgsHUaQhumAOIfv0druBvd5U2Fmkzvlpt0q/rRIJHJsq1CUq1ekfSGDvIjIMiXjtEw9WQYS+aq6EK66gBpgsfx+JINfcRJxWiQTa7Y4sa63o3QkUvEsS6vZKvF0s3YA8e7YAcS74+uCEev4zCjnwvAdfDqYdGHbA8zHZj1kFAgCoJ7Z6XSq1SrEUtPpNBzJUqnU48ePReTk5OTi4gIM37t374L/yLSKOy55fwhwgbaICBT9sPVSXQF+PlB+QPMsVG5JD9HWPcgf2CFOaTbGr0Du8DfbFaGGyTtAsAAoCf4JDBGBEYjDp6enuFe1Wu3w8LBarTJY4SPQATdQCTIxKaPJ6EcHTwSqQNwOw/DatWsgteF8zs7O8vk8QjGQIoGUgTuDr8aHg2QKFC+bzepYinZbw+EQMiNx3mja7Kw9giBoNpvn5+eQXOj1emjb16HeJkWwlzYpVlE5NN0PBgNkzkCyKpUKRGbz+TwYhYAgyf1B+WQ0GqE8ALMUcFrh00XfQlRNIEHLAUYOI70fwa8EJoJ2WpQBWq0W3d4AOaGlvVarFYtF6P8CP6ID21rqkJHEuq4LeA61gXw+PxwOl8ul47q8P2EUTafTfq8X2jZgX64eLAAQ6SA5TuvYcIBxRhiWO2sPsLpKpVK1WsV49jyvWCwWCgWw3R3HgUg3xCLAGGWxB20QEAEHvw8LCwNxLXyRy+XA+yNuqxdJcEIhd8NOc/COS6USxrkWKMAX7e/v3759O5vNgmUsImDtoRQB3b0m5AABAABJREFUAWX9RU8FIr5AeWI8u4uLi0ePHqHmBDYuqn1J5k4SfmJmRUtM4mthGALRQFMFioho4KAEEHtN0ul0o9HY29sDlxlsOOh1AK8Hu5aoLvWC8b20Q9T24lgz+aQMEqVuo+HJE90geIRdSUSGwyHWNFwFlWSAdwPsxkQGMA1JB4pUQACBdTK+WCqVjo6Ozs7OIGuD6hqKRngnzp8mn5hldI2HZoUk/NYNPUR5rv733+/aKyIipVIp2t/P5fP2qvO7FpqgggRxYa4zycGpEYGk8OWGZHtNmOQkhAWIsnHZp24StVOA/rMhg91LFNjReC4uhML0a6unvCdaBECjw4ZQAC+ZWkaszxWLRay9gLbxvWgaiDWmPMsKXdd2HWeRSruplGU7kVhfjJSkBojtBGt4A47sOE4mmykWCuV0xbVd1yvmCxXsntiDcIHYKDFmUEekmClpDVhGJBaRZ7lI1xop5kCuOnocnqv2YV0mIDcMuHhuSc867qfYm3Ah0GoHaV0T3pP6p0btxICkOaE4frStlrGesGRCHWecjMSmYVqdiWhdkmqa1LgwBrxBPTbm79r/TZZaAd3jX7jZjh1m0qH7REE3bNQmN6+d5zOt4dCf+n5nXmyOjv3RcTDzotB6AvIGMTgLRvBcOdcRCIYhmGYQ8/VUDBxrME5Dchom5voYxIoB2nDM0ClexMAxXgRs60s4laUts6ksly9qshipioIWW2eOhk4srCQUCSS6ClcVXWCThEUkV3iIU2k+jXYJpiqxJtfrgUT2Bjs2nlr+NFj8xHkReCCHYjSoNbjZ2UaGh8EbYNuHbmdJSkxoMWKWRY2an3zuGxGJREEQ+r5lWZbrRfsNee9bUszJuCdhJIOl3O3Jo6H0FxJNlR7xUklMLBPMdGurZLC1mSBsCBCH68b2KwsTe7GeuBtz/wORVAwQ23FRZx672NFt0lF/747dsQOId8fXCSOWVek6wI69Xg94UxRFUNe9ceNGoVBAlgsYC2zKwWDwySef/OY3v7m4uDg/Pwcy9frrr9+6davf7zebzSAI/vf//t/1ev3i4qLdbiNeB3cYsQICAu0jj5Se1q6GfwXycIT7gG4nkwlCh+Fw2O12AURCQHY2mwGG4N5M2UqgWqlUqlgsAsCFxz1wDSA1+Mzlcol6OP2I4CkEDiMonAA48H7AapA9rdfrFA4GlYN2IlSCI2bKCJuIuShaEIN1hGW0AgOQN5vNut0uXh8MBp999lmr1apWq/l8HmAioBlcFC4H4TvyK8iD0rFaYlG5ZrM5Ho/feuutvb09jaQYlA3jCMNwNBrdvXv34cOHIA6fnJy0221kqmvpAy/hsKy18TInRRiG4/EYhocADavVKsobrVYLLx4eHp6cnMAADQNSYmmOVquFPneMc45DbYNDNjfCa7DXC4UCBjYmAg0bSZfA6MrlckgIgT4DGqvVavV6HQAoImySBI2MUTawclCVgfSwiIB17vu+PZ3ajFDDsNvt/vrXv85XKsBbMVoGgwHkUzG5AAgCE9cMLywCJEMhMweSvsWnDlfBUYoKFhBhmEGNRiMYVIKpCkpmOp0GgxvCr0g8KP6g7aFBFiPWAL1XTElwTg0/d3g8AudNpvS4b5PJROJm22w2e3x8DF3j8Xi8XC6hW5LP51FyoACLwf7bNEFecOIwt8f5Iy05PT3913/919u3bx8eHmJtwZCmNR/XKPysfbT0HWCeg8YFyNTgYWFw1mo1jA0AUsCF4Z3oeV69Xj88PHRd97333vvkk09+/vOfg0vrui5M/FAawT0sl8sA2SF5pDlxxIAk9qmjjDJRP2Z6nCwQc+j1eplMBgQ97BeQDAZ07vv+6elpqVQ6PDys1+tHR0fQUSmXyyLS7XYhI87mboqlsppCwtFoNPrFL34xHA6B3H3rW9/CJUDufDgc9nq9KIoGg8F0OoV2P3FnEpxR3qPeAiAkUWQ6bWIJ9Q8Q/Qxtx5cVkFiWVa1U8sfHhWLRUk+EA4nDVZv5JN2E1gLEBvC0FpUzRFfXShLr+4lvz+VytGySWK2FcCSbn/L5PG4+C37YcIEU43Ua7tE/gPgdITANFqy1ziPcjCHKWQA1dm0UiUIgAGKuwCxGep5n21bKC1w3lCBVrWaODty2Y/l70bJgLWx55rpu9IwAgaVc7CKRSBzXyeVztVqtlttPuXnbyWdyVew+4JKjVQuKELgo1ooM4JVrAmXHse9w98G2S3WmdDqdLxRKQeB6nvx+iit60LIbKdkvTyBbi+fgb/ZqcE3g/zJ0JJWYSx9XBgLEsqoyz8Yg/YuGHyM/jc1PEgs74Hz4uyRnJIeuhsw07AvMmg9R1rEvCRQaYJ+BHauv5t9OGHi+nwmjwLKcfMG/cf2iUZ2OJ8PhePngbH85TQ1ne/N+DBilY64uRCQkdrLSDOJFzPY1JCbAIE4CxLKOyBmu/i++bhGjwxoL5q8sRGbqf8PP32C74jri2C8cLsT3lkAtDcBFJBYxL4PUz1IBeoYwIFkcNcQZuNwhsUJIoAk0mtWrKf/aHVHX72lBwY69LbUEjQ5zHnEGoX4PgJjmt1oInmsL+cVra/l6tOs2RF2QZr8gjTcN+RS1MUVRFPo+9sTQc62rV6L/+mfy3ruynEsYyqML+fHPZPgbGTYlhLZJNmbCOrHbof2Eaf4EKbZjoDNYBxMb5qKbcOFw3T/DV5tEPFfcf4n/9mN0GP51uNiZuhsZkSkpUTtUaXfsAOLd8fXCiI0QDTs3uHjokRyNRp999tnVq1evXbtmWRYasWlC1W63f/3rX//qV7+yLKvdbj969Oidd9557bXXvvWtb929e/fk5CSXy3388cdUN0YQD/SKrgU6RadOnyGlRwssYGGZTAYt9oPBYLFYNBoNmMWNx2PgZfgZWC3BNSoG4quRTlSr1Xq9TuASPmMoBQPoQecdoGrg4/P5HKKZcE8qFoulUgntz3CnAZ4ImyZWxSnMatC7jNAEiYqGXylGyegZdwm50Hg8BmgCWiJCpYuLi9PT06Ojo9u3b5dKJRCBR6MRLgFIByInqrjywxGRE+ALw/Dg4KBWqwFZW9ulmwSIh8Ph48ePYZ42mUw6nc5oNGLxnxrHLxeSkA098pwIaOGEt56IYPSi9XuxWMDcDBqpYPWCvQ4QH4AOvdpIa8L4JFkY9Ha2/RLlyWQyNPQjiwG09Gw2W61WUbDhWIWHYaPRKJfL9Bjkr5NHqWf62oY7Vk1A+uh0OrlcbjQaiesyyI1EsCx4uRykG8BVxwlXKhUSPCG9qn2lKZCqWVrpdLpcLmtp7+0YMRQzCURiycJlYj4Cb51MJqVSidqInU6Hv4JYX98BCHDDCRA6ALxjOFvUeGjKh7yUXY34exofVDPA5MUjLhaL8F6DYjsu3LIs0P+JWbNu9Exr+PNNAQ51JDbtdhuNCKDKkqFsqBDQuR6jXVPSNGpAzaJ+vz8cDmu12vHxMVq2n/A2PA9VLqBjKG/Qg75cLtfr9SiK/uM//gNS5riZs9lsNBph5AOiLZfLvu+fnJygtof5RdyEdHWtMar5ZZrEBDmdw8NDEnK1SR0WzGq1iqTx0aNHAL5LpRJqgYACu91uLpd7+PDh+fn5dDotFotXr17d39/H9oETQ5EAhb179+6NRqNqtXr79u13330XWsadTse27cFg4Louyh5QKl8sFqjdYu8D/rK3t6dFrgE74gHxSWHA454DmE7iKS9tNRYpFApWvV4sleyEZetayVRtbLUWNjJcrQyWMVfIpMhjElnWqlyiuI3ARBAbEArRay/aQQjUInQhlEnlH2zKVCjWfdyEGwyR5eQjI9cSJ8a4graKmpgGLWxKJ1O7A6hoJpPxPDeVEteJPNu9djXnL530MMxdDc8O7QvPWm7J96PEo93kdC+b/2sVd7BCsW0nn81Wq7X98iTtTcTKOF4xl8uDJgxouxAfmAiAh5JyK2we146+fIhJgDibzRbK5XK8Kr4YvCZrcUzjFcOubW0ZQC/IXPE0fKY/xKgu6ImT/EYdeyd9tJJisrIKHRqt90kQMMn3/1zJahUgJka2STR2LcveeNHglooQ5LfD0A5Cd7FMRVEoIqlUWKuOi/nudNrp9RaDoZ11ZrYfPTGhCuOE24lB3kXMuCRAHCk6fKgAYvrLAe2116nBJhE3UQDxMgbyFqvETzKI+aKvnO5CEUccT1KeOPbzVzew7ujby64abYCM5A79dmh8wb6DGBWQsY5O145SzSA2hqge6uzb0Ioi7LDBz1gctO83pd6TFQUE/PgErI0sI2FaJSuRRoWS2ZnGo/GlLM8YcvMaIE6tHtqnnT1SSX9g3w9d13LcqFGXWjUKAyuKJAzlk7vyuwfy81+L1RNJixRECjFAjPGJkZxWI8pJAMQGNGwn0GGJh1+4yn8PExjxK42GxCZ1qVjRBT/7SkYGc3kRCxMvRWZxEWi5k5jYHTuAeHd8jQ5D5M4oyAMVRbcsiIGLxQLNRDrT6Pf7Jycn4/EYaqewj/M87/XXX3/ttdcuLi5gJAWKKyq6AAiIeOo9Xveg6TYiTYjgrsnuITpjUBwKlD32BBGXZJQM4kwmkwH3BGQ0qs1C4JVUIJZwDbN7CtJBXRQ8SsBqyLVoskdBCeNW6zSVB7+UOYC+ISAlsfgM5vJ4PAZgAWQfhEpAUaPRaG9vr1arXVxcTCYTgHTgVII+jBxVu4sYllnUHDAkJrbjVtPptNvtAqyh/YvBN3npIcFTcTc2l2H4EXyBbgkYrKCW43USKhkZgxwKNgSfFx40wFAmSBQ81Y4uJCawuxzCFGCkAmDluAXWtlanMgkmble2Zb8zwLtsNhvE1A/8chCGk8nE8n1Q+NlDx6KIdktnAM10EbeOgB2wlacOCQ4ejlhRcuG4gYTaof4xmUzoYoevw4cAINbJML31cM8B1uAhclYyhdCadFijFuoAdgk8DncS6hO4OdRYZ7mISgKXVx/+ogqEHK4s4AVB0Ol07t+/P5lMUBPSZEZCXRom5nmysETaGhaZfr8/mUyOjo6uXbsGcvr5+TnVrtnaHEURUMswDE9PT6H5+9lnn52cnJyfn0NNAkVKENVFZG9vb39/H9o+7XYbQLBRiNIUWm43OEmMDYrJYo0ChAoxX90fDTC3UCgcHx8Xi8UwDM/Ozn73u99lMplr16594xvfAH0YtQE8euxB169fPzo6opYIxiEGAPbEarWKEbtYLNBpsVwu4XSKLNfzPNClscvgxIAXAxejPjKWKb3AkvmuuVGSsGL/YhVLniMc8VIpL5vN5XK2Ys6uRZTI2OKzXitlbnSXJ/VPZVWb2LAeEiVMofW4DLSOapuYyMZIw/DmAkh+HKj0HGAIGLQegi4NalROI2hrIzoiLLwWLCx46BIz7Ngbrr31iFOA0+95jutY2ZSTdzKNqnMlCAuN5b9d8/ppZykJ+EBvq9EqOhxu+CMJQCHZpAycK7Ic28qks6VisVarZtLZIEyFkkmn0gBTUJIvFAq4sdTBx07BpZ6XzwUKN59cRU4ZSqmiDF8sl0u+n/K8xZdL4Ni+aycN3PSs2fQhl6wabpk+Rml500nqoasLh9v5/mvftgVw39Jhsz1YxQIQRVYUWWFoYVbZdug4gessXcd37NCWcA010hCC2FLwkK1VkMsDxNEGqma4+fNjVO5zWY3nRodFbIRzqlSWLFxpZ2NsWHqV1nCwMSoMJ1UDzef7WR5j9UsPG61cjLUOOaAWdMIZstZrmHlqFRqNCOsyEmUutE+jVuU2JqDWDWeDiFZdYyqdxIh52snajBr5VhRJFIljietGlMAJIymXJeOKTEX6IhmRSaxPYsUMYlfEU5LWQbwgW7EHo65qWKsDwlodnPrncHUufFUwYlfJs3hxrSV8Yvf3xJFSFLvfil+Hwoz/yl/g7tgBxLtjdzzfwf2erWFASbDNw34HWxqxlfF4/PjxYzR0Y4OEcxpw4T/+4z8WEST86XT64uIiDEOkshQ1k7jNDTsfqbJUWmAmzxZvAARIeLLZLJiD8EMDuY+7PpQZS6USuvsl7nhCgo1cArrGrVYLarPL5RL20MSz0DhMI2ygeyADZrNZoN5kEkHPAXxe7SfODJNgMWButjlTJZDGDoRTidsyA2TPFD27EK9ks1lYAgKTQpNXt9uFVHS5XMbvMrhBBgX0QWLPa0pn4inYts2+byhTgwm7PbGBCC8cDoGQaihQLmFh/OWM+KdmSvB06na7uASki9VqdTQanZychGHYaDRw99A7TAlsjArLsobDYbPZRGM4U1Y0FANOIliczWYpFgEe+nQ67ff7oGAPh0OUVTAZMap1/yy75kFhI2ldEjb3Buyy1popk8mARAxVcdu257F/45OnHIaL5TIMApYlMJFLpRLHOcahJvoxYaC0KMYbLbM2jSjD+RoXCOgW4wrJvIhUKhWsOfgViBuADUoABeAaJSY4lQDxQFsWasIY6uACExJlPwSBNqiRgGwOJXSISzD6r1Qq4JACp4uiCEQbSOvS09JQOv5yJoiuWgGowr3VtB0jM9EVCM0aY0mAPZggtlcqlVarRRAWkiPgybKegX6F8XjMhsrZbAb0tlgsgsWPzBPlGTx0MDH5UPhpWsgPp0FMkKufJrUZBDcMXZA9eY14pvl8vtfrAUSGBBNqciA7w4sP7HUIxYgIoEDNOsdBhLFYLBKQgqD/bDZDFwjvLZAvCu9STJ/prqwymLS9lc6BUVA0qPqXlL3+fY/DJ7yqOOFfS6XU/byMEwwwVxJCzGsb25MsXUkY0OvlMalZrN1KqcECIB7LuHYoIrqBYgAKb2yWYh0rSjhBGQt4Ui5DnzxZ5KyR4BxQyKQxnZ4RevJy70inM57nOY7lpu1szksd2UepYFIKTgrOxynbsqzI2gAmRRvqsZuAtk1/Vt9gie15XjaTzeXzubTrB+4y8DjL2ZaOe5s0LtO3iCuA4QeVHIpAlCB/lPd9x/0is60ttH299mqNEUl4bSX1ebXeEQucxga69us0VqvHxiYKs6a0G1dEB2wWU5PkSlE+KBy3hnqycUrGVScRbb3Iy9PVn1ewWABtvm8vl8584S4WwdL3w2hk2z3LTVlPGJfwMXYkTEWB+4SrS+TIjpG1IC5s2PH/+iJO/F/WBmUJ2ewYFmydI8ZU0tcXSORL4EsQSBA+P4RlmGpqBrG2ieOkoywDm6KS9ptJ3rrR0mQshmzCIBtDVzL4uyQXI2ZbLBZkAGCh0CpnRtFR14k1b52u6cabkxeiX9SLCVZ+tIloRW+yibW2PowZOB02CXAb1VPLEsuKvzR6InztWWKL2L5Ec4mmsceaG+ObWl9iqYBgXw3jcMOYlHVr+FPbQV5dxpxIFIsOOzFW7se6MVp3WJc/A/Xm3bE7dgDx7vh6HNpBWJTUHXY+bK5g4SHR1bxIMOaQ0oP6hx0dPuypVOrGjRvImWHiBJgVggxstIFMHj85KSwlMZeZWn7UupJYsxW4LU4YgCZYZlEUQdlA67HiPVEUYZ8GKoo4BtgEIFRu/8vlEkgrmHSgg0VRBGM35PMUIQVMBtiCRWMCr8jTDKlHDQGTOqpBPf1oqA6MX8dVA2rEL0LsmP1QtBNst9uQ6oOUKlAw2kqAKckHQcARXLNMJrO/v7+/v4/HB1D+qZUGqmdOp1O4F+Kr1zYAvlIzQla1WYEKAeddLBagKTUajV6vd3JyQkEPiZvlARDjiaOoALgHpQtEmfV6nWK7jJUxQTC5ECCCZYY+9Mlk0u/3CRCnUqnRaATOvk71DcFBSsQSbdFEti3pE4VHUAQCnDRZLD7nj0NMM5uV2BoIJ4ZBrvn+fOIgYlNYg7gqSPegUhquMmtBTAPI1hwN3IRGo4FxizkLu0iYJQKSA6pIiA2jGtOHMhfQDwEet1wuoSeLx40aiYhMp1Mm4dBfHg6HUIpACY2C4/P5/Pj4+Jvf/Obh4eHvfve7bre7WCzAUUUFDjqzlOP4kmeHzmfS6XSlUtnf3z84ONDGLJoVrtEuzbzjXCBsh/egcFWr1cbj8aNHj3DtAFUxxXCjcEtRLOHKiRX++vXrcB3c29srl8uPHz9ut9uanU21brxN6xRh7BHxwcdS+DuZhbLAhjmIvQN2oBDqwdje29s7ODiAVMhyuXz8+PFisYBXJHjrmDiZTObg4ODo6AjUbO6VRncthWWwK2Hmgl5KTQlIWGDcYhvCuoFkkiaoxCU1D0vTrDBcKdRoMJ5eOkas/9YtOwbjTAsFJBnETwW7n0Yt3ChtbOTnWiiZdUGjK1+/mUCJqw6+bhSSNXXOoMttAYj1PNXLrKEshPcYOJr+3s9P1baLKbucj3KF8CAXFpzItl6gnXYLarD2lfh1Syzbth3XTXleKhWJ7wTiWLIiR7BWsdp4fJrfrUFGPYSMSuSTBQGfdrk6ynb66vbiHxsaNLrK+keyJZ8nzzZ5YnMSS8NrAmZSOMUoBBps36RLnjb008isUXLDikT9NEMNVn+gBh8NZxTDIs8o/unf0trcGuC+XPUrQmO+71uzuT2dOpOptZiPouhxyk2lM2cSiHihuEFkOWFQChb7gTTE9iSMHa6oNRyq1Fyb1JGb6So9iigxO2Qddqyd8QjnkeYZxdgW9SWCWLbYj33qZhL4EoXPuy6v1qWMdVgrULGAB60tbL7YkrRlXLJv1ajfgDRjrMNIA9FJg8/UDqLoXuLg191O2FWpzGP4JRobDeJnI+Y0Ck5rK5dJ5Rb9CWRY01NEe+2gZIjA1XB13oQR6wYpy7KiaGVdtm2pluTqoXS7MpjKJBB/IuKKRLGUBBjEmVh7NxVXL7Th4TJ2bwuUpEm4OszCzV6LXyF0eB7XeKJYQDwds6pxc+z4h1Apukj8d2onMbE7dgDx7vh6HXoP1sVbpMEIBOHvNJlMmHlCixPvoXETsEjEo0AbAXxMJhNQqHK5nLHjMlhnqzW+FJATmGJAQpGxJy3OUL7GmyHIWCwWoU0M7ic6gvH5aP2GvDI+XENagI9BwOS3AxIC+wbKDIA2kKgzjJhOp71ebzAYgJXM1mxKK8iq4icDKWLuOHn8k2i44fsBah6wJwBbJALjpuEVICCe51WrVdu27969e3Fxkc1mwzDsdrs4N+AgrGbzlHCjkGYsl8tCoXB0dNRoNCqViialbomyAag9fvwYl4wxABidD/2VxYjXpmqskRAIFpHRaOR53nQ6BVCLIQp8B/ATIkI8QUqgAiAmj1iLowESguIH5h0VKiGFPJlMQINllzqjcw1DyCr1ZjWCjNbyhZNrAlAn3/dLpRJIwU6pxLZlSySdTjcaDTe2WoIC+GQy4epB4BUjFngZpgxuIM9HZ5WXR3N4URiTVMErFou1Wg0jHFpyWMFarVa73QbRHsoqmE2z2Ww+n3ueV6vVcL24duQ2kJZutVqtVguswFKpBMoq8G48X2iP0onFaPSGCu2VK1fS6XS328UiCT0QnCTs7MAf/3KkV4xalCHWkcvlDg4O4PmmSUAElTRArHN+LFZalgffhbLKxx9/3G63Hz9+fPXq1Rs3bmCJQ02O9BnNEqKC6rVr16IoGg6HBwcHt2/fbjQa//iP/wjL09FodHp6Chx/Op12Op1WqwU1BtrL4Pyxs1DkAXsZmbyaR4xUFs8OEDkwWVC8B4PBxcVFsVg8ODjwfb/T6WCxpYY4fms+n+/v77/33nvXrl2rVqvIXQ3rUYn5sKgn6bzRdd1qtbpYLHBF+DoIO0LuCZxQ5pPaLRBADIldhhw5IHu25hhcrVehRGeAlcmq6otb6q1F6HQj8yU/fEtBS/Mr10rBGn9r/MXo8X9eSMdai8Fhburhoc/ZgN5s27Fty7Zty7Zsx3JssWSdynAS/10Le23CwvRHWRvfaVmWWIIztizhvwzoM/lAt9wZ2dBDoz/2yVIWhtazDuJVJvumarQx5hmOYk/RolUa9096CTBcRI0K/RmAxsji1EROjXYRkia3gJCcARxz+UJwwgIG6oL60vCBaAQxAh59k5PosN5fWAMzPBhp6sjrYnlPszGMxoItkyW++dFiEU1nMpn6vt90rV4x/alb8CQKxfYja+6Lt1henS/fX0zfC2YHko57zGlSlxbJiGQSAHFKJKNM6qwNU8NKiLfQpE5jxH5Cg9gXmYhMYrwvit+J+kokL1rWWRUCJqmF8w6BEMYtmghRREd3HbZyZBzsJkxOPQZUWtaPEQtkjkHQwW5rhDEIs+EGAYw4CUDTaHftxGfxQxckuClrOeC1JUOjH8WoupHCrJUSETmAeaCV6I0P0VUiDnUDw48ikIgty5J8Xt55Sxa+1Bvyy9/Jpz0ZDSTCQErFxQxHDUs7HrGe4hd78eOHQSIBYu2U6Cdg4nC1yLFWjOiVOtIxDp6ONYgDkUksSeyIzOL3GCZ1E5G0iC8y20lM7I4dQLw7vo6Hzot4MHlmPzV2OLJQKekAPFFEAMTk8/lareZ5XrfbHY1G8Beq1WqAWbE9I8VlIzO+ndRX0AwZiPBbqCgHXAxkQDrLoXF7f38f0SqYm2BgUVCYEb/E3ApdqtUdPaiB064E/GI6n/C0cRWj0Wg4HMKOBixFbYu3tsVPQ2NGg1Iy7hcRbW6u22/JNcMt1c/R87xKpXJxcQEjNZzecrmkcxqfJmJuUcxZ3HbP84CPEzHZfiC3AZsSr9C67eVrSjwXVIGbCeUQMB8JZiFLKZfLsMaC+jZa4CUmv2MgEStkFz+heQ4/rfxL1hL79bT5jO4r13xnnXHpEFPLLBqx+HakGE8/n8/P5/MwlyODGJDf9Rs30vk8kjQgaBArp1UI8eL5fA72JRRXwZfU9ZLnGBWELGW1STyTyaCY4ft+oVCo1WrQ4uBDxILAnJZ8UmqD5PP5VCoFZDAMQ0xtqMoCndeLFaYPsT+uYEZ7cqFQmM/np6enZ2dnFCjgfKRmsWxQdfzSULnxeNxutxuNRhRFGOFGHzpXyGRmxfuQlADGc/E8D9rB0EwHNYyS8aDGY/ogj8JNxuoE9R4ICtXr9UKh0Gw2B4PB6ekpHB3Rv9LpdKbTKTr3SZzEM4JfjX5wsurfaJiAYb2F9BBcEA1NEggcnZycQM8dk5qySKlUClLFkB1nrqtbsInWGdOZ9w2DZzqdImmUuH9WYjVbYsqy2nRiaCAYfa+o/egt75VYlplgKz6XBqeMipcGy54RtVv5QlHSKMZt3KRubKDM+jy1mK82nOQTJ2XMQOuMU1oLVl6GC6nHPHEEeuVxvKGUpS3FeOZQEU2n017Ksy3Hsy3LtUNx/aWzcOzgCdaknIus2NrI2oAIPFWDNXoKfZh3HDcoFJFIbNt2bIdTT2t0JDVquS3SwlHXTvSIYt2RnD5WXMJnD6q3DJst8heIkBFjcweX2EmPWBUhXUbFiKg1fqeDRk1vX8sg1uKq/F98uNZm1doXuiZtyDtoBrQe7ckqr6FTwZHMZg7Kc5OJyQGMYFuX3Iy5c/lqyhMAMRTft4IgsmWU8aalnJ9xMVMWQTBeLL3p4jzy3SAshwtb5mK5kThRZFliuZGTklRG0o6krTUAcToG3ex1YJmVqJFogFiTiAPlRCeK1DkTmYpMReYioVi+OJZki7K3J3t1KeRFIYrPvjKHYahiURYX2alGbhAq5Qi0kIZgeODBYYtcy0sQJRHO1MyYkk/0XvJ5CrgbCQjtJcH4SQpBbBKs1+UKDT0bAHESvdWH/jpD3IncZNbODXEJ1Dy0eoYRM8gqIz45lfSZFAvy5puSL0i5LMO5nI5kMpIgjEnEVmy/Nov/eDFAHMTmddAstmOAeBEr7UYJaNjQl5BXnjJsHIiGPIV0a0niKEaNJX49FZOI3bg8s0OHd8cOIN4dXzNc2OAZMasHdwwcBFpgAzPVkrh6EyVU1Ol0Hjx4kMlk0JoNBhbNQ/AhkIOgq4DEsgZs/SNVWbMqRIQ8Ys/z0K0PpjC4vY1G47XXXgMmBe7bdDpFwy9OFaxMYEakJ4sIiWaMxcfjcafTgcleJpMBzRDfC2gVJw8jOICwCErwCYiKJG64xqXptFCH48Zmj6vWDC+AJsl+YdCZDbgNiQR76q9fvw46XqlUgi5zLper1Wr5fJ6yFcDsROlXIv6GWDMjvKdG27jzw+EQ6Px4PB6NRkhyeG4v3Z7u8qiZZdsSFxuarRb0RrLZbLVanc1myEyKxWK1Wu31eoAgK9XqeDRaLpeL5RIxsR8ETkydEBEj7XwyvyAeEjtpPEnk4vj4c+9jhU1LQmZUI8XkgNPAjVybz9PdMGRalny+lgikq+uNhoikRyMMGHxLuVy+efNmKpfD2ADKmU6nocoK2QRw28Eh6nQ6g8EgCAJYzEPCguiV7pW7NI4UGesYMTXg2hjzEMmpVqsQCuh0OrPZDOsPZhbycIgII5sF4j8YDMAmRokLBQ/XdUFJ1h0JgMLBREZSxAQjm81euXIln89fuXJlMpncu3fv/v378I2ERs10OoWxp1Y03gJpfeErv045HMdZLpf9fh96Gqh/bHKQN5rWDVskWSXOYN2uVCpYx4DeUpICqxDKjaTQ4mcttuv7frPZ/OSTT7DilUql+XwOkW7HcSB6HoYhzOWwmKfT6XK5jK+j1C+reknyGm8LAGV8C24LUl+ulhBQwpDAHgfyFCVcQHSicjGLK0mJCeSHOuWjGCLgHswUrOfYTfBciA4zsyXyJQmnNSwj2KCHwyEFQJJP7WUtuLoMtlZ9OIn3bVdWXYsSGvawopzK9LjVQU4yG9/EdCZHjDx0XYrgMwLMgYoF9XaSXSAGzrUWYlsLczBU0JAx6tZaf8CQfaf2BSY+ZTpdy/Ic23Ydy3Zl4UhgfY5M2fEfJ8a8jFNz4le2KFRukh5OuIFZluXYtm05jm1HjiOOl/KemMjBUgIVGkNalD06tLNDNY7hGfcOAsRYulFHL5fLuVzO9TyZTiPo1P7+Y3JCq4gncWJYOYmZwq4W70FnDNv+8Bw1g8EQZzAAYlmnesxhz/42HBgYDFwNqTpJkKPxBoo+G9KuyVqLniyGaKx+EQ8RB4errnUZdEujAJMsvXx+yWJbtus4Xjpt5fNzxx4tl4soDMJo4S9Gk4mEfuSH+WCZFr8pvlhuIE4YRXYkpcg+DJzDyCtJylkBiEnVBAznxDUVHW9ZiXKLARADFCZAHK4CxEEMEAP188W2pJCVm4dy+3V55x05OJBLcDy2rc9hrOBh7GKMObUVKnuPGC8RXWUtfK20LlMeY4UnnZwQcFKRjybqeLNe5ahNnBycsiqyrE3kNEDMCbhW3DwpycIdh1ubJgLrUOrzCD8hfGG4OBq6Lmu110TEsiSTkaNDyeclFPnX30j6d2LBYXOpuO1LxUzXGsR8nSx1jkCipQZxWDaDpJa8EH39ywGIoS8xi3+wFfILMXH8nBZZxqD5UmHKu2N37ADi3fH1w4h1TVUnDIA8APoA3IQWqogUCgXE4mxyQRtRsVhEMNrpdFKpVKvVAuwCUBi2acACxuMxEt1isQi0C68DOKZtBSMDdsKyrw3t3qVSqdlsnp+fz2azXC5XLpcPDw/DMGy32+12G+5SgIQQVbM9TeIOdAiSIhYh5wLyyt1ul6RRsjJ1tAr8AlBys9lEQzpQKhBvwUP0fX8ymQBWAEas4W/NLyb3R5v/IrIBKGCUqRErE2pE7IWTFBFw7q5fv+553qeffhpFUS6XG41GSJOAJpCRCpYlWSE4gVKpBHBNLkHUwq9T0Bl42WQyYT/XK0sftkX2RW4iyY0iEqHgEBxGUWk0KpyfZy2rvFjkcjkvkzkoleaLRaHZrNXre3t7A9tOh2EuCI5zuYnIYDCYzeeW74Oxk42iXBg+QQyXy8p0mrWsXBBk5/P0eJxaLq3BILJta7HwptN8r+f3+6nx2BoMat1uejLJZrONKDpYLqvTaSaKSq6bOTkJxmPf85xMxspkLKAbMcEqiCIoF+PmRyKu46TTacd1s5kMxQ1s27Ygqoi2NDGNru0oyi2Xe8NhajodzmaFuMfWsu1MNlsoFCw1hEh/JrAFUQ6kCiCVY3ig6kCVWPKVtpsfGnUI9A+KMtFm7QHJMxsSR6NRv99H3rK/v4++XZzhfD5vNpvtdhszpd/vowwG1K9SqeRyOUwEqHwANsXUBlgMgjyuDgrUmIBIb3K53Ntvvw1B9l6v9/Dhw263S5ILVg/8LrHFL3nlTwJJJFZD5ASpHd9A7Mm47bq5RLMp9UOB0oKIoFKooS7yrynvQ0NRnA9W79FodP/+fRQqqtVqv98fjUaTySQIAljDYWhlMhm0reARVCoVfAsvh1g8V2NCwxTSgQj43t5etVqF+geERFiWgzj7N77xjXa7DQET7JiwkaxUKigrQpsen0zuFXlSHMOGpTtOknAwGHNUwDD4p/wEbI6kDBPs5sVCaGg4HKKmyF/X6vYv6whjcy1rFSBe6y9H9Ce5dBiN6rLKytd9OXpgG4RKQxfCmDibJCAweDDMoIit7RwJEGsnIkZQBkbGp2Ooxz61ipYUWyCkyOFHhSLNIKaAr25esSzLtsS1LMe2nMh2po41smQislTUSI156fZ5QmPWBpct2exZF63+EIkl2GJS6XQqnRY38iLJZrNP+s3hsoAq7FoonyZR+Xxeg5sUAdPAjed5/FhUlSLHCcIwUka7svUZyCpsurbGthZj0l38mrFLdV12IME6AmsOTTiIx9H3FasWdeS5hms1eQ3UJgFi3CWu2FhkWNvYhDsn4ddkK4DWKzBk2VkRoWyr3npAxcBIhnwBi4t6JibzmrUridExYNuO56KKkwnDjOcsfd8KwyAM7fnU9/35fDHwrE99mUn4G/HFinzLX0TihuFVP/yjMMqKU4g858mkEAUQQ48Crf1OIga1Vv/WmFqgJF+X67A5AMSKEGotxElLqSHvflP+8/8lb78lV69KOv280YIKGtai7Ro15tA1lL4N6vqmnCIZQiQr01TCSUK0ugPVWPPXahPp9TypxrPp9SQyuwkg1tvrJnLMph6RtaX3LXXQ1c1IUikpl6Rek2xObFssvbrK1uLcU1/ZIi5sJYofr/6BWzhXkw4ocDqeeqkYPl6I2CKLeM4GqlC6O3bHDiDeHV9XpNjYtpHc4ud2u91sNhlZotUaACuzeoCMehNFiotkGEQ5JLoIapH5A05F/yNiXAS4RISNai3BCJwJaapQOk6lUoB0s9msFhcmsRfBNJBogN21Wq1QKOAb0fvMOButykQukHtQvBLBELmZOLHxeHx6egpO5d7eHnIS3dWOHmptLCYJcxidwNCMSMcKBNPJyENWo92EPc8Dq25/f79YLAI0n81mCLh1/yDjG1wRAn2Ed/l8vlqtkq/6VAFielOAkT2dTnHDk1nQyw8JLItsoKLI/1vk/wVEePWSEEc5w6E7m6XOzuiLiBBYRHJ372bSaT8I5rMZnnIQhv5yGcRXbVmWNRxCytF13dT9+06scYZI03HdJ96AYRhGUeD7AYJs0JDD0HEcL5VKxVYttuO4jgN+sRMTjS1acceRaAF2zIwXLcuybQeJk+NYa3NUIxyPopRILQzLQeDPZs7FhR0ja8gFRYnSct1A1grwlBIKINpjCAFL1ZICNHq65EoFGZPZbCYioONBVlWbawODzmQy/X4fJSuACLqdfDab3b17N4oikECxmMAwEJeAQgvObTqdnp+fh2FYqVTQ5LhYLED+pcscWbFYGCuVyp/92Z+99957o9Hon/7pn4BTA2LGCeNCoMXxIpKjz7HaM2EjUgD2NJFN9B9o6hnWCnI8k9kL0nJDw4ErWKlUwjqWz+cNGxaKS2qQmuvecrlMpVJHR0eVSgWca3ZhD4dD9laD8AvK8GKxGI/H3W53Op3CDBDK1+SdadEbGtZhPwKXJ5fLoQ8DI4G2Nrrr+eDgoFwuQ2IbaHWv12s2m+PxuFAoQHmGiDPVLTSVOIhRUVYoRbH5gDOi64W4NpsAdErJh0JKvtFXK0r4mO2ummv80tfkMIqgy2Ov6pKvNbbCDdE7yyZKl950Nl2j1hih5tLa26KbrpLgMu4wGMRrlXMAEBPC07MPY17zMRO4lb2WubYddkySrzVR1GArJxGcJ7mzJZZEji/O0LL6YrVFJrFapW6cdxMd9G6MHZPkGChrIwLEQeK/AvO/bLFSqXQ+ny+WFvncMgxTlp3PFwrFYhEMYi23knzomEpoCOBmAehT33aWUvCx6POIomgyn89ns+ByALGBjyalrp8K9BgMTU2l1JwAGCRgn6VIEe4DS0To+aOt5VriYbJAYoBcaALD8CCxQDsooAdCY3ZavnktZE8uKlZykD2p2sScAkkERWn5gBCBY/Gncg4799mksn2maHULBsOu66RScEIrRFFk26kgWIZh5PvLKCo4055tTyzrvmPdl9CWMLKjpWVNI0n7/rvhImsFr0USiOM9Gfwsk7irALG9KiXhxm9zEgCxMXeWCXMwaxUghgxxIGJLLiPvflP+65/LzWuSzYnnfQFhs5EnJhdJQ2Cdq/RaReAtX6HLn5ukUXQFdO2Sm1yokwusgQVvAWqNvqhk7rzlpvEE2DiVZCUnlei31JMuEebBd1HCQEJforWEX6OZw1rX4RFdAhfWxYSvHKM2LVJI1kNiprCo7UziW2QpwrWIjHYmdbtjBxDvjq8XKCyKtmAQT9DAi6z19PT0t7/97Y0bN6rVKv4L7nO9Xg8yFMQOAEFWKpV0Ot3pdLitTiaT09NT4EEQ95RYoBbADfzfEQhSkJFUKSTk3MXBIAAEABSA3hoAYbUfEYkYRKuHwyFAK9u2J5MJiLegZpBcVi6XkSfQ/4fMICACkOmEL9b+/j4YuPAyunv3brfb7fV6lUqF7U64z3Ab0z5IOpHQbEp6x7FFi6kp7htYfrhYHSrhMjOZzGKxwMmgAbPVak0mk2q1Si4G4WBAWtreF/kq7gmN0XQ39NrhBFXQ6XQKFBUXSw0NrUz6qq2ht0RubUMvQpnPJdbKWDnG41c25vlCDiemv6y86DiFQsFOpzGLdeZMoI2+JUDZsFCwWx/zWqt+X4aiTrFjDGYAxKVSqdFoUIuQFR0sBWj2B96XzIfxvxjbGvphjkr/sXw+n81m+/1+p9MZDoeZTIY1LcDBWEK5opLID2HfZrM5m83wIZBzQTWFAiw6lfoyyyRMfjThUYu/G+lKEkfgwkuY0oBFeDPxjKjHvTZXZ7pu5HggkaH5A2zu8Xjc6/WIu4HxB3s6fXvDMERhAF3YuiVWu+ppvioJ0fgKVjuYatJclCWKSqWyWCzAYr64uNBXQbzbANaTRGwsyAbgblCc1mIcRieKTmsNsFgSmpvyvDrgv4+ARG8QBhHYuGSJyWJrHcCM8bMWOdWHfl6G6NZajJVyBMbalbQwMtBkOiDpCWj40Wu0Wla5nM9TB038zLaApN7xlocjEslCZGRJR2QY7zFpkVxsc+St2nBJguQYroK/kYKDA5My/PnfgVih2Jad8tL5XL5UCgp5Pww9sfP5fAGiT2jI2IKPk0EP+ReONFIdjeI6anhYbWaz2XQ2m47HpVi5+5I42nPX/KINh1Gr0xUm7UTHsisYElq9JKl2nRylWoBIlEaELg2yO0GPUk2uNHiXyRnEeSRKWEDvIBKrD0E0gJgyPpBuzJp9/KyuBpvkXGKOqus4nm2nwtC2rMiynEjCKPKCMAjDQRROJQqtKLIktKxQxLaCRuSPo2UYEfPVALGnWvWdVTjJiWstlgKeLPXPcMOfSGFVUayLOhcJJBIJAwlDKZZkf1+KJbHtF12cjVuUtEvh+GRiIsrRhEsf+xSN7ckoLXBGU7WPdWUjj1gr+CurSkR6cTaGpZ04kiUNw1NhU0lykzowl3ReAl6Bj84TzfdYdW2t7/Rahv5Tn5rvy3Qik5HMRhKOY63qIGa/BqtrbxAPV19pSmiJiaTyT7hBZeKrpclrx5WbeawaISIpkenqPM2JLON6px3fRhFZiuR2APHu2AHEu+NreiT3GwgjAJZFnnxwcKAxZeCPkIDElrZYLPr9PlRZoeQwHo/JOAYECVQF3wXIhrqQAJIoJMpEncJnovpnZ7MZ2orZDQ0UYLFYUDoTwSV9qMhNBmUPoC30QwEcALxAQIM2Q5ghSMxl063loA8DLy6Xy9j1R6MRiLrtdnu5XPZ6PeBBpVIJUTtx2Pl8ziY4LdPGJmKDQIRQGI8GsBTOVhtJaX8D3lXoQReLxcPDQ/gEDgYDtCgSiE9GeBI3Rsk62tQWgPjs7AwIOFh1uFFGuPMqjPbdlH/+aMq2S6XS9Rs3nHTa930MdQxITjqa+4GAiVIBRixITxK7MGN2s191y+haLBbwwTs/Pz8/P5/P55gp5XJ5uVxWKhWKM2q/uFwu12g00PuP0cgUwrbtQqGAohe6EAw9OLQRVCoVYM2YFCALg/UJXXKgkExRQIYqFot7e3vL5fLBgwf379//7LPPlstlo9FAzzIc87rdLmDuLby/3yseZ9Cs2N4BuEFTTZnAS0zGMZI0bVlj4F9M+byYwkQDdA0o6NRI5/zwPefPxWIRy3UQBNyA0OsA2jjaU9grTeccqiJq+0eu9kRjSTlElWsymbBXBmMGUiq05cEvYvfBOp/P5yFG4cWsf6LnRkLL9dbordb+pcTuDdFY4znSd04/Gv2ZBMGT5qiGuv3LQYdXM6ztTlNJjHst7LXpEwzHheSM20T/1MZcSYhfVgUuZFUNQyMRxt2mKI3xmQZW/oXvgM/2sfAmGol0RPoikUhWJCOyiH9Ix6gBScShIkJqarDBIDaUJTQYEf9siZ1OZwrFQrliF/JBGLhiZ7PZPPrG1jabG5UqFKgQ4GmJA40nst0BamAIXGez2WQ8no7HS993X3aUkoSHtqhjy/NyD7eQALhu6C3PQLE3zU1JaKrqmtnarpTkpRnnoIUptKjOC95zyxKF7DkiINDY2KUs27ZssaInQ9ayokhCsSLLCsQKn6xlSUA2KTSsXw/j+WKbdRmz2V+/KKuKAfL5r1u2uJ64rjj2C6FXEZ/XukUvqY2D+hNNI+lJjtiAVT29Ahs9lIzB2HyDKUnd9mRNVA8PbUWuyb/YWLnkGluwljTcriOxqaiQ7IEz9hFQnYgRg0OQz+dLpRIyTTKijN3HCJYuv3RHoSyXspjIciTRWMQSmceCCWFsPYc/85i9DiO7uTKps5QrXRTL7/rrVm/ZQC7+CuVbuujixD8HqxNNEjj4zqRud+wA4t3xNQOFN2VcJFgRKUAXGC2Y0EoMMQEAsgBnx+MxFHj1PodfIY0XNGFszPpFwEm63wcIrAFi4v2QMgA/gvYjEH8ACJs0BSLiiaweOoz0A5HYy0tiDgKZy4RHCSuQ6qu9BUA8AT86iqLhcAg+da1WI4GRIQtAB958DZAxuDE4HZSiw7cT8tYCmhqRQYPeyckJjOn29vay2eyjR4/G4zGIkzpZNQIRIj4YA4D2tre44qJGoxHCQS1AvJaN9fLH/24JeN77lslkKuWynU5j2upKA8zxgDYCF0aOjamNH6BdAylk2DezP2DLgfpTq9U6PT09OTkBDTmVSoHOP5vNUInBOkBiIMTKMSVBdsaJYRXKZrOFQgF4Lv3WNcsDTn1YHHzfByIJ9UNSlYFI4vzxdzabPTw8vH79umVZFxcXDx48OD8/t227Wq0Wi0XobHQ6HXQ/rDXOin7/bkiaAqbRbTb8Guk9rhq3gsuO/psNwslLMHBPILygBWksgzgmv5TVMqoS0240n8/btt1ut8MwLBQKkJIwRhF2LgwzmlOxUoiL0hkp2x2omGTQkZjjASDmtXOzQG4MQWrKuYoSdpAEc1NfMr4amy8xbondtAwCIPc43Z3NDFwzbbUJm/4hadrz8hKzGCNYvT+bdCo1Wz9pCrQlzmG0o1mQsqFT2IiL2E7EB6fDFf0rawFi7SCnH64eAwYQsNby66VlzkuRsUhPpCsiIjOR/CrXjJxHAsRsmY82axCvhYnV+6PQsiw7nUrl84ViwS3kwyB0xEqn09lkcTEZyq69sQZMqe82m9iwWYC4MJvNwiC4vEndWgHry0fmSSVf43+TnEcGbFrYeq2yxLPqIydVcfSwx5rDXjTdrc/ihyQ0iLUXn17r1u59BnCsdxwemtNKaQ7ZqumxliiqpySYrLyoVMpLpdPpTDYIfMsSf7kIw9AS37J8Wxw7cmx34UQDKxpF7tLyIOwlYovliHiWpC0rZVmeWK5luZZlQa1agsj2AycM7ChYtXy0FfIbKvqndgzj3AzECsXxxCuJ54sdSSYvjbqkUxJFifrbcyzOqyNn01JJnzcmEXjEeGSksxj0YV0J43ZM+osBEOs0JPkDHR2NjTVJLja+0WhjMq7R0D5mxGvUtpOC+FraAh2Z2nGRwugwTjd86ja1zjy1kKODddsSz5aULY4lQSDRLB5gIK0TCPZiYjvEgmIx6ydDcRm7I5Korl3sDPEK2apB8WoeocgMLIn4lUAkE8PEE2Qg8TuTx3yHEe+OHUC8O752RxKYYODILuPpdHp2dnb16tW9vT1EolDeBJMO+yV8gdDxDQXGcrkM4hVCbQBD2hMWxFjgO/P5HHgi9MV0Sw6pNIAJwAUDEKl1EoBBg6hI92fuo2Aoo8dZW/0g2MXv4lp0SxRiFEoty6qAIyIeSE9Qp7hQKAABwRWBIQiCs9aZYn86NViJStMpizCB1s3UfDGelah2Kn6L67qQvwCpuVarHR4eDgYDwFJa1s0o7xNbAc8R0F7qaRbIfIgAYj43SVt1bHhFJCaWIv8fkf/vhszBYN/gebmOU63Vbt68uddoeKnUZDw+Oz9vtVr5fL5er9+4caNYLF5cXHQ6nX6vN55MIGayWCwQXmNE1et1kJ4ATSJ9mk6n49FoMp2ORiMghp97GYM4mUrlc7lMNovhUSgUarUaMLJKpVIsFHL5fDabBYQ6m80o7gH573a7DcZ6rVY7ODhAjy0+XFZFZj3XLVcqe3t7UH0x4LblYjFfLOZhODk8nI9G1mRCfUPOiNlsNplMAByjxx+YIyYaFgFMUpAuoSCpPRjXx29hOJvNut1uu93udrvNZnMwGMCFDGhvt9tFMaZWq8GIj1IGqVQK1F3Af/P5/OTkBNrEeFsul8vn86PRiMkJlqzFYpFOp4vFIqDM+Xx+dHSUzWYHg0Gz2ex2u2zvZU6eSqUKhUKj0fjP//k/v//++8PhEAxiuN5Vq9VcLtfr9UCC7nQ6c6Vb8mUSOY0MRPcvw6LTKIlxHdaiBCxNGXkXCcI65XYch4KSuGNsy9CTjsKsZHkja6JCCPB37ES3bt3CvWUOTyVflivAYHJdFxaC1PAF75u4Kr+dPeYQrMDpcT5CUAKtGHRVxZqGTcfzvP39fbTXoCFGIxc0WTWWF5prse6oWdssuhhdqNQC0oxvLcqpU1ndhG4Ysr10+jBGFEBTUdLDSZyU56wBoKRLwXb5UQPnTZIWk1rAmu0rq7KSybqpoVWyFpjTpVlilJrIxjq9rGNMf7kwcSQSSSQyFemJXIici1gieZGCSElkJlKI82dYvdtxl7212rYcrmoQ+wkBYt3vHH0OPTtiZ7O5csktVwqFvAShiLiO4xoop35exm1MumsmkWI9SDDBJ5PJeDwej8ez6dQPgtSz4WkmuHlZWGf1WjTGpKtZ8JMg7oaoGIQGXQMTpbKqPQ+NsZeE+TihdKUNpV8igIS9dJs8Z5luoUiyfWlkwihRz3rt14farQ7GkjORNWbcAdZj1j6apNGZEUjjonAnua5mMhnPc3PZ7GRSnk6n0+lksVgE/kxkEYkTBJ7rNdP+zwNraHuek7Jt2xZLLEcc13FSjptz3YznpVwn46ZSnutZriNBYPWG2WarPOhkl1NXROkUW6uasBojXiqAOJ5Tjiv1Pbl5TY5qknUlnZMr1+XqsTiOfCFLuxVHiQaeq3s98cTBEUHghx4yWrZQJV+zdphVERpG5yUGNnt0aES5Vg5C72va+VBXuJPtAjx5g0GsR45Baqbhud4g9FabRJ8JK2uMm3OHrW+GjkRyHXjWR+bYUsjJ9SN585Z8FkprJPOeRAMRWyQj4ovYsSiQxMaJnkioHEf9+O9ZvCZHinS8iEWxw4Rs8VeLj5MVmcaCekuRTKzlzSMdT0BIT0jsYjcTye1wuN2xA4h3x9cOGtYhrCHqxDq8iEwmkwcPHrzxxhuI6qA4MZlMGEVNp9Nut9toNN59993r16/v7e2JyO3btxuNBqyZDMNlUPPg0QQQDYgqsnds5IgSaNFDHYZ+vz8YDEAGhF0bAtbhcNhut9FiDMFT7vHYjwFMgCbGTigAo1CK0Jk2+o7BCBuPx9PptFAogJPLPB9xLQCmyWSCnBOw1xPUbzxGhHRycoJPKxaLAJQRHGsFLsANCCM6nQ5DcKItFIVA6gLcFukB3TmYP+O/stnsjRs3CoUCxJorlUq5XMb3Uu7ZQFUozQmwT4tvPnU4gReJPm5w6LTriKyjabyske+L/GRTHBxFUYLFE1mW6ziH2ez7h4e3bt3K5nKDfv8z1723WORyuasHB//p7bcPj45OT0/v3r378MGDwWAQRtFFEEyBAgBKs+2rhUK5UiG2a9v2crEYDAatMOwvlwPbntm247qApZbLpb9c2o6T9rxCOp3PZBzHyWSz+/v7r732WrFYrFQqB4eHjXq9XC4HxeJsPm83m6PRqNvrjUYjS8QPgk6nc+/u3W6v5zjOlePj27dvV2s1kjecOCLG5Ep53tHxceH27XS16tq22Dad66IwnI1G/cEAtpB+p0NEWFY1pokOMzHQaSHnF5J2jurLPDU9SjHjRCSfz9MZT7PvNbMMnFNc62w2y2QyEJQwDE80gsPTJqTIlkCQkbFwoUDF63Jdt1wuHxwcHB4eFovFVqs1HA5xqkwMgKpT8eAlToQkhQoPEQuRIQHBkl7S3sqAxozSIwXuNXwsyhiTb2PmT9VLjdtqrWSsXZCfBnavl1NeiCaXyQZ5WUP/neoiFD00hIDZHIMbhaFrOIwBHKGX6VpEnrmoYQ3K2wWwHrOJEIlOenk/+WmcZUkHdkN0Qr/4ikQjUQwQUylyE4C7tlNY5+RbADv9IOgKu6lwvgWcTfrdr8UZt/xguDwZ1kxaHFmjZvKyJJIiEV9kKjKKNYjDmGDlxMzHRQwKE10JYmZxskFe1IestUVSPGJb7JTn5bJuJhOl0iCaw4Up1Nh9UgZUU8WNCGStZig3GhSWcDzxW750ICQJrfbLA8TG0qSpkRqoolUmNh0UqAAQkzCRRPFktUtMlGqKFpxBtClK/YxeoKj9JwFigHdAafkJhL00ywHfgtCdmyAWVYqkaZIpl1aN3WOpJPsYuDBOiXJzSUanKEF8tgrR7YPAOhSEYFVN8BpBSz6fn8THcDiaTieLxSwIFiJ2FDm+3wrDX4p14qRSTsp1bNuyLdu2XM9NpVOZfDadSaez6Uw2k81nMhkr5cli4ZyclZ1RtPBdf+BEoSXZWL/YXinQrCERR5/LsFiRpIty9UD+5NvyzTelWhHblVJZbt6QbEZefMGwVjn4HCpstyLKqflAKMpihyLX24gGjcoEPseLj+RY0hNB89Z5JhwYOlbBnkihJ8MJQI8WfjJPDO1BwHZRlYFGnwEQ665Zo9jA8cZbxNM2BC6SG9aLLPiOI+WyvPOWTKeSy8ivPpHTU/FBIs6KpERyIhORTLyMWyK+iKXcR+0YIJ6rIbeM//jrRLG/ilzaRbxb4Sq03Qyw8mU8Exci6XgCLuI3B7I7dscOIN4dX0+k2CCqMC6cTCZw9oBGJ8UfAarCmP7i4uL8/NyyrP/yX/7Ln/zJn8CuBwzBXq/X7XYRHJydnT1+/DidTt+4ccNxnPl83ul0gLBQoZiWdOD0wYFEp/Tz+bzZbLZaLXDQwAsGUwyEPryIoNNQyUBBGxk1+A74dYLFooR3sZ3P5/PBYHBxcbFcLmu1GohjOsalWjFCIkLGJEejxX48HqMzHdbYqVQK0TawZkRCgANAWgHVGggFzicTHwC4QWrG51CFA3fJUBa2LKtarU6n03a7DardcrlEBLxW2YqiH7CEyuVy+NLLjCLYBjJXwcPVaY/Gbl7+sL/E68hELZEwiiLfH08mvcFgPJ166bTtuvlCIZXJdHq9bD7f7ffr+/u1en00Hnd7vcFo5C8WVgywWjG4M53PnfF46fuzxWI6m4F7PhwO+/3+fD5PZzKlSiWXy2XS6eVyCTo2BvBsPp/O5xJF+Xw+l88HYWjZtgUCeBSFUSS27aVSuUIhFJnO58sgiKLIi6JyGJar1el8HgSBH4bz5dIPgic+KJYltr30/cVi4QeBRFEmkylNJoPh0E2lctksGPdM5AejUbPVAkBMkE4XJDS/nhUaozVeG9FgjFHwcfvzoo4tBFLgU4fTgGUcZwEmERRpCfYlfXiM5lwCmpRTADmaZveyKmkHVgvqZ0xCLMu6cuXKH/3RHx0fH89ms/v379+7d6/b7WLBBA96NBphOfVXXY8MOb8voTqobxqLQxRtZzKm8xnDVstYagwxQQORMbJxMmR144JhOKOHEx8NqnRYbDEeOPyYzgFrwHpOFSMehAVJcMOnURGYwxvEZ4wHbH8YhJQolVWDQe4jOElDrpHQpwZrkGZTzoLzhYIb2Llw6yQhsyiKGEjZE841LbWsGdn8lk3+71/yUswqmqxyP7dXtZ+aQicR1eTj2LQf8Unp9xuKTFvYypeUfyUurH+Lk+hFlGR/XxjxIs6f0aS8WAWtKKUqG6hkz7dJW+I6tuuJ4z6x20qq1m55EGuHTbK6sFJCVgIIT8LIZ19jn+OpGQqtevfULfwIDsFgwCoBBjEsVSHfpGvz+m/dRqCXaG7NfANfJA47nU4JhPGjUqnUZDIx2ufZgUdLTw3YcUGmPg8ROo2d6cIwD0LV2nSURVzyP3AmAPKSADEp2KwEg0TClhFE2npthJbRE1nqyQQsmdlsGscGbhjOwvCxbTc9z/PiK3Ic2/W8dCaTz+ey2Uwmm8vlsvl8Npu1U6losXBywWzZcaetlDOOosCSVBS5EjlRZEWYAlEQhVEYRpGEkSXy5B55lliWFVlP6MO2Xdt333zN+r/et//421KvWyLiuJLLSuaFAWIGPaJkfFjgx1ZIdWC2Hg6HQ/TD0W3C4IYbSyVJMNheNaOW8CsRVTw7KjjpMI8ZJZWySErAK4YZgFHq47dzHKJPFKRmTC58ta4g8vSMvUYD2TqgWluyWhv+sUb+rOuJZYnjSLUm3/ojKZQkk5NZJMO+9CdiWSKRRL7IXKKpyCSu8EFNworRYQLEgchcQcB+DBAbtYooLibon62vgpwflJf9+IcgboLRDpCuMpmUuDbjfBHb3O7YHTuAeHd8JQ5mIyALACUkAxfoLQi/sIy/uLiYTCavv/76m2+++fbbb4dh2Ol0aPuDqBFY88cff5zP5w8ODjKZTLvdHo/HiNIQ/6E8i804n8+j8VzztsDpgEgCIkLdcAqIud/vA64l64GuWcRVQU8W5ZKsm4M0Tj2dTlut1sXFhVZVJt2MEEYqlSqVSjCpwz8RKONCAJVOJpNOpwMTv2w2SwcG/IAW+9lsNhgMoJEaRRECESTz+LSkwqaR5+ieRKIwkHIGMoXMB75bqs7sMAonBgHrp0qlks/nk516aw/cTASIoA8nixBfxfIJw+LJZNJqtfb39/F8C4VCqVRqt9udTufRo0e1Wu3WrVuQWzk9PUWfPsYthxYGAxrY3ViiNJ1Ol8tly7JACoamAbwQ5/M5yKq9Xg+/C8kXcmk1doARwpwH3N5cLlepVEjohiUj5iaG5XA4HAwG+PZSqQSjRQySarUKt0NRkiOYgCgCoXhA3JPlFiSulF8gOIX6hAbyisUiSibbdTZpQw8uf7VabbVaqMEApKtUKqjfzGYzdLzm808sjAAoA+ymhCLmHdJp6G/o6sh0Oh0MBvP5HN6SdG9DUor0g+xRcl3xHG/evPnWW2/l8/lWq/Xpp5/evXtXRA4ODiBzvFwuMWBGo5FmEG8y5/l91wV1lYgA8WKxIKRu0GTYXmDkM4QMDF9yQ5KVPapEezE7tGC9xHQtvEdPH1GsT7wHC6PEcocYk8jliDuj8EYtUYCtLGwYbmDEhghbQG2fpRptuEd/Qr6ThnIUTSbwsdb3jzmqRnA0mAunRG4outGVshucUIQ5uEFokYowDDE10KbzJY+3S660zxexPHXpvuSvbHnP76+uqcGCV9pANZIolDCMCVNBQjhYWxVZlyjGinqbxhQ2vM2yPv/P32uZeQte8yLP9zJv0Oq6usEiaY2oFyJqYtByOQk36xDR0CkmCqxFz3ShgkUvbXfB9c11XQDEpF5Sxp1VLt1IJEqkiHgcO/dF9eZryqouv+laGsFBYsr4an47gWbGz1rKgPsREgr8L6sCSfUkrO3wPIDHdeAHIlEYBWG4iMKlbc9c1/c8/wm4aTuu52fSUS5vZzNROi3ZTJjL+em07XnRcuksau74IOvPvV5+GvlWmAoDOwzCIJIwkigKI3/pL+aL5WLp+4Ft2SnHS3np1BOrVdsKLUecVMo7vJL71rvpt95IXb9u5/MWHjiUjq0XEyAOoyiMh6NBBNYSCpTyG4/HQIehGUhiOKu2STfCtRgxiw0cCRxvVDXBe3TVlmQgah+TzcMEcAtAzDyUADHGSS6X0wCxJgsTxU7KXmto2OhR07orRq5kopfrmpAuc9iO5PJy/boUSrIMpT+R8VBaBbFsWaZk5MkkkuVEQjcu+EGDWGKdk1TcDgJHOy7v/ipGrNHhaINK7yuOEePCg1gZKVQSSYuYPuwqhQ0K67uxCsfO02Z37ADi3fG1R4c1TQx7LQAgFMyRo1JQqVwuNxqNxWLx5ptv7u/vw1ke/lGQ7wQ6uVgs4NOKVp1isej7fqfTwW6HfBXvBB6NJFZjoGBysXVdlGkMI2lwKAaDAaNk7r54J6ABhpgG6+pzsmQcFA6Hw0ePHg2Hw2KxiJhAs+fwgZZl5fP5RqMxnU7v379P1qGI5PN5XDWAdRHp9/vD4XA+n2ezWUBayP/BxYYgKcQfSB8GhwVQF3A33dZnK10wTW9EaAIIQ0TwFWEYdrvdXq/n+369XtdkQEZ7TwKLOJ5L+j6tPejflc1moSuns5RXCoZ4bugBcgoQ60ABA+rDrVZrOp1++umn9Xr9j/7oj/b29vr9/r/92791u91SqYRkg4yJ4XAYhmG9Xt/f39/b20OYS58roKWg/xDfGY1G5+fnJycnrVYLOrna10WPWwjgYtJFUdRqtfClwMuQAYKfDuprr9e7f/9+s9lE3eK1115zXXc6nXY6Hbps1Wo1ozwQBMFgMOh0OhBsoebJfD4fDocSU0VIwKF2IUsyxNRyuVyxWMQwNvLAJDqD9QTaLJhx0AdvNpvT6fTo6KhQKODrSF9CdQqiwPV6nSiw4zi5XA5Yc6VSsSyrVCq1Wi3A8RBxRo2EKwyePoA2MJTxKDUOXi6Xr169enh4mM/noXR8enra6XRqtVq9Xi8Wi4PBAPh7v9+fTqdJjODLnyYGgkDQlmrmhkUbEjzd/q/ZxFoRYq2BjDbSlJipxzHDFEtWO6M1ARZ5I+88K4UEZA0GEActRg6amg0uuf46DkJXKb0ActVpqpaDB9DPoaKBGHKBsXfQQJUWWPgirXHBPYsUe3icavyd5qgcpaS8aeayBoDwgdg1KNOvvexe4hJt6VZfxRnftCAbbzAkX41XksIjlyTkapVtWRW6lQ2udGth5ad+11oq2XZ68ktBh8NA/KUEM4mmcfKRWYWJtQGdpf5pb3hPqH49KTERKeA4kiiSKDT7e14Eol1b6DJ6IFiPCdTS9Bzo8FOfo26/YJGJpUeuePwo9sLrS9D9+wYUq5G4JINYfxFtmRFVcrRTONgY1ckWe1EaxPqm6X2BYgLpdBqlXJTBkg6QmoqRpFdjYQcWSVwbLBOgk9TbkVVxcBSMscDy0hBXI4JFDRibu97g+IzAJl4ul0EAUoUfhrMwnEkUOA59z2zHtl3PS6fSmScMa9dzXc9zHRsAolWtzG+/1mk05rNZOvIltPy5v1gs5kEQRhIFYTgej0eD4Wg8XiyWnufks/lSsVQoFJ8g4GKnvFSxVDy+Wnvzzcr1a4VsNmPblqrMvBCHMxIJfH+xXPpxeZhbHrMz1v4R1SDOQSSG8rzu0aRylLFmaq1eHlojmBUR1ICRWyFLIkDMmj2bR3XRBQ80+e1atgLoMDlDZBADGkbKpsvn+hOMvUBWlYiMpSYZI63V7JJVo6BnrHGK64ibE8+T998Tx5WjugxaEop0pvLLh/LphbSGEi5FQpF0LDQRxD84MXM2jNm1UVwapFPiUunLWwm9oK9K2heKTGLtb0oPG8IRkOZIi0xF0vGFz0UskewOIN4dO4B4d3xNQWFDDk/ilhbyuYbD4f37969fv06MMpfL7e3tvf3229evX/c876233qrVaoPBAA3Xs9kMep1gNVqWVa/Xv/GNb7iuWygUgE91u91Wq8WSMoKJarUKhIvKj8R5fd/v9/vwpAIsRbwJ4SOEJgiYaoBYAx8EFKhaRRgCHwKxiNlsdnZ29tvf/tZxnHfeeSeXy7HPjr3z4/FYRK5du/bOO+8gkkBghBilVCoBI4bg8rVr1x4+fAjHMHwU5ClAGrVtG+Za4/G4Wq0eHR0FQdBsNvH+YrGIGAjgoOu6+Xwe+CPulaY8EC8gppDP569du1ar1R4/fgyl4G63S4MpQo1aAM5omt5yQCThwYMHzWYTxmuIm3UB/5XSIH6Rw48PNqGj/gH4iT3v4L8jP6FDlMakyNQG3EbER1bpS6zE0OZYEi4cBl1Ic2owJBi/EiYDbI1qCvRMGP6yZAImCLi3LBgweqbAC2jIeNYke7L/Xdu8kKqvOwe39PkmlylNFMKdx7nhosiLZD5AjWBI5eg+Vt0SSDFuIt3IfzRSgCeohSl1Nq6f7Gw2g2DIcDiEDjjYrKRoEQqUl0EcTqIkHD86CUfazCVFw7vaJsgAcPE5vJ9oOsG3YPCIcpNLghek0vCeGzVLJqIA6/GxhK1BowNewBqhhnR1g4VelzRpTuL+Ys1gws9ahASXCfKyRlj0F+k7rBnW3LA0oZjcPWxSpP1CYV83r/CJ4J0UISWuoVtk8It4J7aJyWTC/02Cmy9rHGJOuq5rX0JUQbeiP7Wsokf4iqz8Bj3f7XCz1rPWmb8eGJvy/8uUIZPNQEld75cDD0fiz2U+kqBjSUtERJYitkhOJB/TrPCHcpZ2zDUTJUPhx1iDrHOoM+BmX/0i/AsjPppQL9FrcVj9zyS5b9Mg0dsoyIPzIIjQ4/JcN/+ZHpkGsxDocu/W0ts86DzBNTzpxGX8FpYLTa7kPxneGO6deqIZZWmu1QwA+Do6irgpaNwNv4XqFzICxEsc8FqkaK2NAXnQmuHBTRZxMmrYerflOCF+zcsH3ppKpdBlgr+xAmuRd94NYNBBEIQhZn0Qhn4Y+lGE+2MTPHRd23XdlJdyHNexbduxI8sKIoHEVCpj1/dn1foyiuwoDJe+P5vPAHlLFPlBMBgOupnuoD+YzWfpVKpYLNXqtUqlkk6nPde1bTudyVars+Nj+/DQcz0vCGzHcaHTjU3gBRnEQRAsF4ul46D6qCNPQ1QaniUQzQf1B2qBiM0QkpHfs3ZJNyK0pOA76eGk+krcYaY3SmPt1ZKDOmzT3VEUr8BH6VCWssiG0LAhrpXcj3SVMQn+GnYOa3e9LSHi5RcW15V6Vf7oXbmyL/OZBL48OpfFP0p7IN2e+EuRtEgU6+0CJMUfV5mLhqwYfC5+bTaOGH+s1T+v7JEVmcWYL3C1tMhYvQEmdcsYPp6JRCIwLV2ITDbwpnfH7tgBxLvjK30YgbWRFBEIGwwGvV4POCba1eHIBLJwqVSazWbo+waneDqdojEHcRU4tp7nHR4eWpY1m808z6vX67Ztt9ttSJsVCoVyuQzKrc7kEVsMBgMKjzLpJcSDjR9NdqRcIc0GMmWkbUR8EIUTHur3+ycnJ51OhzHu/v4+cChAuuhkRwCEfvZKpXJ8fFwoFHzfHw6Hv/rVr0C1BiUBFGN0oBeLRfAHgSNPp1N82nw+hzgAAmXf97PZLO4wAqDBYACgGWeO2JrAE9EZ0l4Q+7Jajtdzudzrr79eLBYvLi5s24ZaAoEPraEhinr2VMgA9xP0bfCIAVVoj6lkDvbqTwpZtQbCXMAgRDLTaDSq1WqlUoFe8KNHjx48eHDz5s29vb1vf/vb2Wz29PR0PB5DsgADD6N0PB6fn5+LCJ54sVjEsCf5URuv5/N5Sr6ICIJv2KRks1l0zWNYMgfGfEQ4jrdlMpnlctnv9x8/ftztdkEovri4aLVaqVTq+Pj4xo0bBwcHGOcYNq1YbrhWq5VKpWw2Wy6XgUbhcmBN2W63T09PIWwNBjRmHwBZaCN2u11wZn3fRzaIUwIv/pJICii6GK6Q3XBdF50Np6enEB32fR8KNnhkmNog/Ha7XUzAarWq+yLR0wANGfCmoygqFAoHBwfoY8BKMp1Oe71eq9UaDAb9fr/f70NigomN53mwp8tkMoPB4Pz8/OOPP57NZoeHh41GA4Tlbrc7HA6HwyF7dTfhUHpyGUSbL3buaFM+3C5Us5ALQQcDKTQLVEieceuANRjcW/2Z4MwC5aQyJq1aSJWl1gTWWCzXGPCG2B/yz16vB4WiarUKAloul1ssFu12u9frXVxcDIdDrJ8EJgziJ1YnvE65CeaflmXh6SOrpKUb1YpzuVy5XMZcQNJr2CJpLIPrHtX2tRIxHBepc63pxslVFJVLDEjueuyrxe3C5AJ6Qv9SnABWZvZxG5PuJS7LpH7biQR77YjVdy8p2mjEMwaSaMCFBiye/F39pUmM2AALDArwJTP5tRgxGYu6jPFSq6NizSQcSQSTOkckIzIUScdSlSkRJ3aus+MOXBLQFgpHpioFzY5027Ifv8dXGHFC6tEwF5UNYtOyahm3dsAne95FBKXZMAyXYWjlcu7lhLa2DMVLRh1rAWKuw9r5igVj+r4m1V2N2hiJmVygDGKs/mpdMjRurMGdNBzMDGCOUTqrbix76859Kk0Znfi8NH2xutKjtXoA6bJiZ0BvevUgvM4SJs4QntWoMoLMoQ1XtUaQgcWH4eceaOo+QGU+1qK17M8rDZGIFVlW5NiBbftihWEQgIeb9iBtHPm+L9HAX/QCv+84s7SXKhajUtEtlZxMZoE4P5PxKxWvVCpkMvkwTM/nlu+n4pq657r2i6wbEaWKlMSEHhh4vtgZZ7MZsjBs63jK+Xwe3S1g3myJQ9Y+LP2/ui6iSRXaX06r/RrkJ06TpGaLVvdm1VlWzSENy5bkyW9SEF4L/hp2lMlP/gK3Y8uSbFYOPWnUJQolCqXySH7xqeR+K7YfL85eLJXgr3KEyRomQByutnrosWLHP0iMCH8lNIiXCuNOxQZ0XnxFi/g+AEBfxJAxb463YxDvjh1AvDv+MGBihpgAWLHTo7caOCa2ecR2eMV1XcArLN0vFgvUXQHmQqAzlUqVy2WEEcCaU6kUxYgptmg4wiPygFgqm5s0v490RW7YTLPpuWREnEj7EQpjawfuBrzp9PQ0CIJbt24dHh4CONPqpaRdIBKigW+9Xq/VagB8AXPPZjPGK67rVioVGnN1Oh06J0AFFSEIYC/IwlqWValUPM9rNpsA5aF0gXtOyS1Rqp28ITSAFsUWyefzx8fHuOcQUANqQy6GTrR0g+1TRw4jdUBINCQxcravEH04eTeAOTabTfwX0MabN28Wi8VHjx6dnJz8r//1v65fv358fFwqld544w3A5eDLg/b4JBpZLgeDgYjk83nbtiE2giOTyRQKBWRKpPMA7kGNAYoKzWYTjyabzYrIeDwej8elUgm/CzCuWCxCYARa0o7jTKfT8/Pzhw8f4oqgnb23t3fjxo2joyOcDGAsTIdOp9PpdMrlMkogtVrt6OgIIhgXFxcYpVAuhnAKVDJc1y2VSmC4wLrw7Oys3W7zbpRKpVKpVK/XIbJxST1Qx3GgOoe+Qgg627Y9HA6bzWan04FM8/n5OXBqyLYQagEKvLe3h1gfYjXw2gZyDTGKIAjG4/HHH398enoKhjKqMrCahLIeFVSwCLiuu7+/f3Bw8Md//Mf/6T/9J8dxzs/PgSPn8/n9/f1KpWLb9unp6cOHD2HeooUItmtzbwfLvqhBjkcAOBKCkrDroUEfGVtYWOCwh/YI4Ag0fweXB9AqpX5zuRxgetwuluuQWGp6LOn2uiqTpGQCekZpBKiobduTyeTevXufffbZfD7H2IbAPbM7vTVgZskqhwgrOWYfMAtcFEBVfCnKYIPBYDgctlqt2WxWq9W++c1vohRq5KJECrBTAG6g0j0mCN88HA4XiwXLFew054aIDQuayETz8ZhAXec9B7pN1QvDGVKnsq+INLyLpgfXtVYbyWWDaIPG/rZjxIaCiqzr59XcQANA5C9q5uNa2leSxLp2ZdvEXN70iiY/vrznY9lWVMlZN2vy9lUZ2RKJLLMyTslwIbOuREAZnBhKoN+RiNginoivWGlzBTHMY+B4vvqzHwtf8o+/jaW15VbL01Sqk7AO8Zon25PjuOWym0o9R4H5kg/OWPEoHU5uI7UOtE4rucAS8zqNij5XNiwLXKi1er6GcRkbU4JGEhx8QzOdzRZJ4zvK+iNeRdxLqiY9kEkFpVitMQfZEWicKiejbnPBjdK6XmuhxqTPJ9BG8j8gf4F2Ip01aE18vUZhIY8i0UxnIx/RTmsKUgpEFmL5UYhV2oqiWDk4ErFsy3IscW3bdWzXdlzbdi3LEbGiyML1haH4frBYLKfTuePMw9CxbT8WErENxafnCxLCVR53UplKi37w2lmJT0pIXSbk2wIlG5aGBois77MBEOtyiDHZ8Vta/lgDxPzATTXLTSX8TWHb2h1ni2Pqi5ZgLbE9od14qSyZjLiOWGFC2CdSmvJ0HDUkI7TWPM3cjMLCVyXVc5T4MgBi4MUEiCmpb8eQmxX/L47UDiDeHTuAeHd8fdFhWdVBY6hKXBi5ca/XA1iMVF87BUMwAYAs+Q4gNiLBLhaLCAdBKGPGzpCXnAWjgXSxWHS73U6nA/qwoU3GYJHNR3iFbc4QxtI9y8BwkYQTvIP26HA49Dzv6tWrxWLx1q1b6XQanEeSv3BPgCix2RmRKOAkIBcUcZO45xpnCBwBKB6IeCR/ISgH7DsYDPAUGo3G3t6evlEAyED21I55JKYx9NdQC+9YPp/n3QBVEP/UTghMvHnHtoycyWRycnJydnYGprbEOgzJzPwrLS7B4A/is5lM5uDggKaL8/n8k08++T//5/88fPjwzTffvHXrFu8PcEaAbkiWgPiMRiPMOAz+Jwt6rC4N7hK69pD2VCoVYEPj8bjT6eCTgYJNp1NwisvlMvSm0dwHsVGIvViWBfnpTqcDeb7r169fvXp1b28PFFdt8YGSDCDgXq/X7XajKALwSsoGSLtQ0ya7FmlVqVRqNBqokWQyGTBxcKWoKuXz+VqtVq1WeeGXxIgdxymVSqDqgync7XYhnDIej3u93uPHj4F64wSY++HkAV5DyAV3EqzewWDgeV61WkUP/sXFxdnZGVkqTABwZ7RpD8ik169ff/vtt//0T//0rbfe+uyzz6DiAuiwXq/Dzabb7TabTQwD+f3QgV9w8afoPJBiriRGKiVxuwCk1aFZScFKGm/qZAwgJvEIUaLneqkXRbzldyUxNS6nIMjjFbSYPHr0qNPpEIlAq4ph47lWLjDZc6o1TCguhAV/NBrBcfTu3btBELz22mtvvPFGUqSSjc9sVaHqBYEeiTtCUJIBL5ijXat/sIkbb4NMNmYT3fxoewhlbf4ubqnhtL5F3/DLX1uflFEdx05Ijm4CCDR0lWz4MGrMBrF3LRHM4BuudffSv5hULbik3PDlAd/L4MhfzuE51lFdvv2GZF0ZdyQUGfhyvyu/bcm8JxEw32yMETsxE81R5u9zkVmM9oZxk7KGhpfqjwaIl6sKmBtwmS2MB13rNab82siEA+wJTmTbbrGY8rzlC7AuLokOG/OdAgiEO7kP6sVzHXHVSvIutbAvV6FkGRJbm4beNrEdKQtL0qUxBzVADLUlYoVUdNXXoiG/5Mq8ydwsKbJhMKmfiuvxSWm7M8LrXGCTqiarRQibVy0buh9IFrEsOz5hPwzF9+0g8BeLaOlHS99b+kEQILz3gyAdRJkwWkRiRZIKw4wfpJYL17LcMEQK5kyn1ngsqVTour7I0nFCegN+kYHCVj0EPjs9DOgBo4Hjpy56yVaAJL94DYqt3N60Ca2scvOTCzunA0oaWudEhzHckTfVk9aSiLVLrSQ6VJ665q+V3X+BnZYVBfF9WS4l9Ffx32iVIxzGpOBQ1efChHB8EjiWr4gSsSWSEskr1nOkwGINs1mKLywKQRaR7g5D2h07gHh3fH0BYm6l5ClIbCI0nU6x7XU6HbbGI4oiIwCYb6lUopUc0TEAWACI0VQ+nU7xi8BKiPkixSWPgC26oExCjVfnh+SdYduG7RUSZhB7oRHR7/cXiwUFGegbhrZWvGc4HI5Go/F4PJ/Pr169+uabb7755pthGH7yySciAoAY6T3wX6BOIB2DpykiFKAAKkECHbAGfDtiYpwnW9ohHIkQBIgbZCgKhUKpVDo6OgJFFOkKO981b5pJNd7Dlm08GoltoHAt6XR6Op0OBgNkGniz0XdMMGJ7XBKGYbPZvHPnzieffAKvs/F4DNYhweVNPJ2vyrww4IPlcjkej0EhbDQa+XweygmpVAoMdNjToS5CWRIgy+yax23XXiiIoclSAcUGZEZMLkw3ML4xGIrF4mQygYA1zb7wjUaEjcZJ8gqRnpXLZchHoKaisz4S6vGDZVndbncymYAxCoQXIySVShWLRXAk6dCoAT4Mfmhc4NpxIcVikZzlZ0Xq8etgTZbL5Xq93u/3cYc7nc5gMEClB/RqjHlAfliacEsBL/Z6Pbwf9xP5A2tRhDux4jFb0E6VjuMcHBxA4zsIgkePHn366acnJyfL5RLTHP2VsAekyY+sEtxe4tTg89KNtNwCNIFX9/VjiaPtJ8YJHjdoyKjDQUuHCyCXLF05W4uSaF0FjXEQdV0sFijVABVFi8l0OmWtUStLJGEONhczLUQNg1sPlmKUaiQWeAE4DoUTMOJR2EMJhDIvRiasCVYGMoV/8hNYQKL8MbmEWCiwVYH8jmsHRC6x1+tkMgmC4ODgQA8zCp1jD9Knpw33XqYGMXPg1aw42d7OUXEZHDYJDxk471pmMXmFBg3wJXJ4nwmG/n18v+PK0b64tty6KsuZSCSnXfnn/5DWQJrtuCF3JpKJQWErNnxfxoZ1SyUiQQDCaGdeFR2mD1K4kNCXSNZjDXqbXjsMNrUxJQC+lTdweU/ZtpvPu88OED/T891ko2dQ6Q0tdQOMjhIej8mfNQFzk/hGclKsvatr0WeNx2lglLIYBsb9VOwvOf3XPtm14N1aoM24ruTHakkBOgRqk9W1Me0mdRpZJwatLtYOQ0ckCsMoDJ0gcMLQiSI7DF2RKAwljNwockXcSNxI3DBywtAJQjsM7TC0RawgsH3fAuSHylpyl3lRXHgVGtZAsL5pCHTRBopdFf4QWptCNosaJccqA4DkYDM+hBLDGohfa2dq3BbDXIElDa1HZGgiJ0sUxn8ly5mbqpKirAI2LUTyRXuWBoFMpzIZyWwkwUTEjhdnFva07M+T30kAxNGqy6j2Jo02/Hk1j0ysjJQSma5CwzjSIpYyr9NoeCZulNkdu2MHEO+Or+VhaH4Ze5VueQMLUpdMsROjWXs0GmGTRjc9GrXgUwcAF/AWLdSA1wCLQV8b25k1QAwoBzqPErvJaxUF9hFD1wx5O4v/cE5Am/naaJKwL9iaV65c+bM/+7Nvf/vbP/vZz/75n/9Z4s41ie1xSVgGcKDNQxBWMt/WLliO4yBUwskQvUKqz861TCZTqVS63e54PEbfdKfToSESxS6Z9ied1rURh07+SYvDtYC/TOM76IToDPwyBX9qCJydnYVhWCgUSKBYW06XV0Bo4vInoCUg+QoeFkb7YrEgJRxjG6rBe3t7tm0/fvx4NpuhlZLYPcebiEyn03a7DdovwDXMAkqIpNNpwEAQAwEym06nB4MBZKm73S7GPD4BHysiwImAKGHCcoKgsZ1awHjupMpSMRAzbjKZoMt+NBr1+306yRCV5jxltym+gqIuGLrgrUNGplKp1Go1CGtsx3cMlQ8+Pm1UAhkHEEhd14Vyy2w2Oz8/xzk4jlOr1RqNhmGrQsc5oPO6W59riOu60L0BOrxcLinGAo42uMlYAHu93mw2++STT+7duzedTqH4gSoR0XNZlWTZRGH70qBhA27j8AZCKjFpmh731O3BSIMWM0YmRgJrXcArQUIfj8ee58GzlDeTazKVFjQLTJ+YsT1hhRkOh+fn5xi3+CLcZAq1a7IwV0KWBtE8zvZhuhtR9p0VFAhto0oKSjK6TLCthGHY6/XOzs5oTak3JtxDrezJ9Ye7BkZOq9XqdrugsaOIwqSXpqmg86PrmZg765FHR0dhGJ6fn0+n09dee42zBhs3KrWoSyW7gC/J7fqS8dC1BExD81c2CEpojmTSU0vzx7dQC9eCjC94ozZJTDwTRvylo/fiOFKvSLUoYSgSSRjJ/RNpD+WffyPWIvZzX8aQLn7JiSEGR0HAgRIUDjd40xFQCER8CRcyn4m/lCgwM/fkVq4r3JvAO73WcRZswm5s23Yty7Jtx7blS3wEyUb15OUk8S8DU05OqE2kxeTnGL9ovHOTErHByX0q8rtFuZulO+NF41eSv3uZqNXonNhUKtD0Tw1Z6n0qOcZoi6LR5wQu/PnvxQCsvqgnJ4V/8YNVK/ta869na1C4/FDUc4k9cLpgzDo6hFnoIoBNmYofBIiTRQsDTjV+SB7GkMAOS7lqvfuvHaKGuDwVnGJpDvOUknCzATGvrVElTz5ZvyGjX4Paxuzb0vLyfM80DGQ5leVYwqGIKzKLFeSDWE1+GisneDHsSw3iJNE4UGIUBmq8Tj7+1TpYsCTUixrnXCQVb2FWfCsWsUhxGEsnfYXbYnfHDiDeHbvjkkHAOq9VEMHATISOJEBM7GpoRhYR0m8RAYCrCMrefD7vdDrL5bLRaHieBziYeo4Q96QHPRu3qV8BuAcfbnT9iNJGoNhlrVZDC7DneTDXorEPwAhm6VoiDaZwURSVSqXbt2+/+eabx8fHP/3pTx88eID/ovGF67qFQkGUMYLuOQU5FCdcKpUymYxlWcCedFjPxivcSVALgdvatl2v1zOZzPHxMT7n4cOHYRjS0UtW+XoMFMjd0LxgHd2SvgFOKyzL4FNHuWSADhSPBiUNQP+mrDWbzTYaDZjvEQ0xGq7XmsB8JQ5OCp1UhGHY7Xbv378PvQIRKRaLEGpwHCefz7/++uv1ej2Xy/3Lv/yLbdtXr16Fv+LJyQkGP9sV8cNyuYTfHcYPqRBQfiiXyzgZDIDFYvHpp59iYIzH48ePHzcajaOjo1qtNpvNiBzxtlM7G0BtqVQSkXK5DJM9enxBKwAAHyof7Xb7wYMHk8lkf39/Pp8Xi8XpdFoul/f39+GqF0URQCuUbSCOARSb7tKQHcekCMOwXC7fvHmz0WhcvXoV6szGQWNJ3CU6LtIAHcMe9wp3Q0T29vZms9nVq1chGXF+fn5+fg5NGNwQzG58uMRWYAAB4b8H0BkTrd/vQ/Kb8s2QntB8FiCe2WwWiN5yuex2u7PZ7Je//OVnn31Wr9dv3LgBq8DhcHh6egplD1mlwzw3zeeLUqhY66NFAzesrnwcyHDm8/l4PIbAzuPHj8vlMpRGMBdwo9AqAQl1uPZ1Op1ms4nmiVqtBlQX9CJA7Zr2ztRd55Na4AIrkud5aOwA1k9neXZ7oFxBGBqjGiskyLnYsHClHCHg7+OsisUiro6gOXuiIfONF1utVrlcRumC5ClQ7+nFJ4q2DOEmPEHIUuPvXC6Hua+t6nq9HowNUeyp1Wrc77B042cMNswIo/yJRQw3QRMkkyoirw40/CJomoHnJsGILViSQSp8RTSaX/5zEXFscWwuEVIqSDEvniMWHe1pcB8mqGSSsDMyH2HinZFIJFYkUSSLhQS+hNHvJe59Kshiw2js94YOGzC3lqlhhUkT/7VPHWUcdJtC0qJju7mWAZxxxWA8qWNdsmt5GqiOGyKtrLqRJLEJhTe0ejVwJrF8kCGAy3gs2RxwycdEHoOsdrnxq9kwhAI54ijP87TQRLKuZvTz6ZVEi2kkh5+2GdTXq70HoyjiVRpQI9/J8Nu4OS8UA0dRqHwCNUAsq82L2F+YO1CiUMvxb4FZkxxh/aIWcea+hk+mmwsO7c79BPFTpnaG5JThNZqk+m5n7ssqBzl5XXzoWuJJd6vQR1efoQExbwrVnrt26NpSzEqtIM2cTH3xpxKipOeoCp8lEoi4IvYqyButLtpc5+0YZjUaQcJXGyMGJu7HP2DDt9XfQXxD+GIUCxP7MaC8O3bHDiDeHV9vjDjp34KkerFYeJ4HP6j9/f1qtcrIAMgp7Kfq9TpIr6ANgkQG7hXoYzSCn0wmkP4ENsr4UhKGs2jnJ3gqq91btDnCecIFCJtxsVh8/fXXXdd99OhRu92GYibkYoFHEC/AJ4NTWalUINgKYBqoNOBpwnbZbNZwtyeQge0fPcjQHyCz0oiN8Oug1DmOg8ZhxDfZbPbKlSuHh4f9fh/2dHAqo48HedNURNWgubaME2VhjzsMgio4p/1+n/gdYHQw4JAJDIdDYF5bokxcOxmdVDJdS8L6Sk8NWRW8m0wmZ2dn1WoVwimZTKZerx8eHs7nc8BhtVrtnXfemc/ngHEty6pWq51OZzweE4HFvYLjHAQogGelUiloW1OKoVwu46nBdwtFl36/f3Jycnp6WqlUzs7ODg4OgMfhlFA80M7O9OACnFQqlaA3AuQIIxk8x8ViMZ1Oe73evXv3Wq1Wu93O5XJXrlzB8wWoCiCYlQOkUjSc0eEsPhyndHR09Oabb6Jyk+RcABHr9/tQD4ArI8iP+DoKBeIaybMeDAaLxaJSqUBc4uHDhyLSarXA+dWke8B/wP7q9TpfxAzCHM9kMrjhhULBcRyikKzugCcOA7r9/f3r169XKpXZbPbgwYNWqwUOcrFYFBGg1ScnJ1jEDOrii0yNL5CJbzCqkkLwmpWD4QeBoNFopCWGqGCAewWVBixcANCpw4v7ANLudDqF2AhVbgw/OvZJYHgAeMUn49Ow3SDdAvMdewfV3sl852qvhey5SHKQ4GcMZqze0A5C8QyjznGcQqGA5R20YigC6RoeuT+aqMhCBWEgTeY1XNcg09FqtSTWx8S4ok40yNo4MaztmnOn+2R1dm2sZmvBjpe10m45jU0A0FPh4GQivYleytvy1bJUfQml00h8X8KlREsFB8sqzru2vzgpWBklkOJQJBLLFiclri2ViuRy4jpfPIX3qcPpy6yLGHQNagFjsSVBAa8g6MKehYCQQud4hYu20R2vOyo07qbjRvhh6N+lZjpLtjjYM4T1X89inrPE0lIEyJI8UEMWQJ+zVidA2IywPEn7XQueJl3vZLMrBn6XahhsEDQ4qqJcAZNLiiH+y+49th9h2+LCS4AYD047iBhuIpZlqksz/mdHFHZhFv/YDPScC7JItIJQf641zNFipB5ank7fn03rcFL5xFAsMQaMzn0MZ0WUnJGs6eGBcY7dPDk8DNR+0y6jMWv9BkMmxRgMPHNWl/WmDFCYJo1aPFCUuoUGjtcm6c+EEVuWZDJy/Yq8+6bIUh43peXLYiCRFdNjSUz3RbwYEjUKhlZiPcfbfNUs4r/y6DCOdKy27MQeqlMlK8ErncUv4pV5/EN6Z1K3O3YA8e742gf9cepOaICNw67rDofDdrvd7XaPj48ZzzFIKpfLe3t7ruu2223LsgDCYpMGBMkebUhGzudz4FCkg2k9Sm2TBRgCfDHthsTggBbz3W4Xop9hGFYqlddff933/fPzc7AXe70eAFnY+wC8Jk2AeFO/32+1Wnt7e9BQdhxnNBqxoVi3oiPaQFwiirEFqjVyeG3lxw2e1A9CM5BaHg6H8/m8VCpVq1XQUYExjUYjidkcYAGzbZmRDQIm2lVr3EGHSmBQptPpw8PD0WikiRhoB2PAMRwO+/2+1gldO2AwKsCvTCq0SkJL66Vn3c93AoZ/EZ5Xp9MZDodAP3O53MHBwenp6enp6a9+9SsRee+99959991er3fnzh2MrnQ6DXcvHSYul8t2u+37PjSF6fqF5BC1mVwuB13jIAgqlcrVq1fz+bzjOI8ePYLcBBrhDw4OwGUGf5m8FZ0TUg6CQaemnPPAGEZ5BggsmJuYtlSiSIqv6QGg0UaAvFB70GIvSYAYCDumGwQ08H5iygCdJfbABEUF6ZzneVAhHwwGUIsmpYUsGyw1y+WyXC4ztcC8gBCtZVnFYhH6G71ebzQaUWmBF5vL5fb29g4PD69evQo3y/Pz81arFQRBqVTC04FibLfbxclIwg7oSx7D2z9Ha/lBb4e4A9MtSmPTnBPjAb6aAI5RbQKGi0cG/1J8OMBW1OfQuIBnXSgU8JjoDofKGXFh5NWz2YxmoZAnwl4DrBZLOldFjH88bnLqdTalE12DHKTNlzCoiHRQJYMA9HK5bDabpEJreXEMP9YRKZrExBK8eww8lFGZFhL8xeegAtfv99l5zaqh5qYZFHW6yAI8wj8JcySB0ZeMDW/ojl+buusNThJMQN1fbKzhxocn1R4lIeK5Ft34SilFfKHPSmS5kMlQZgORYdyQ6ysqsZ2QjwhWxYUl0YwcKvO6pUgoriOVfdnLy+1vyNWrksuLLilux3bXMsQ19L8WBkruZU8+50vBiPUwBsSGRQYAMc2QuazRrgOrB3ZnHIiBWfvUjApdh6NiO5sbKLZDIi3lp/BdrDHjwLYO52QNEOuuO1EUTk0oXiv/QoiWIvLaWwzXyNIaPgr3gVVq/UUGFGigw0laK0MarNu8dfib4jya25ssbq0FiJkuIRLAlopchogqAWL8gLcZ6r2s81HTnwMG8ChzDYRPtAR47mX5CVlntZApSiuJQDbO2RDlx6Pk3vdUmem1GiY642B5FaOUXHUCxOzI1N/IYDhJIl4LECdbaQ2ceq2Tnj5PjSCToqF/l5MC0Q5qz7hp/DpMc4QcGiPerFjy9I3GtqVQkDffEBEp5uXOr2T8O1mOJIpE0vHqbceAbypmzhrosK1ItVH8c6Tow/6qxMSrjBFPlCa+LZIRmYik45NPqe0J4huZWEw/K7IUme6EJnbHDiDeHV/HwxDsN17UOCzwXHQQi2o1YgcWZHOBJkdRBKyWFDMEuIhdwOrKZDLAKElPw+dgfx2NRmi8BazMLzV2R80Fm81m3W4XCXAul8vn88PhkFEdrZkBgwZBADonlEYRS/X7/XQ63e/3+/0++s1xRRohIvCticaitCOoOEkihsYWGYMyKESqn8lk0NuOe4X7BqSJQSTAEUbDWrxYk6eSTkQ6iMHrEEgFxMBPQ2c9W/u1hPSmKASc2el0CswuyUQzfJ+/inNkbSYJ3AqwKVryIdQwn8/Pzs4KhcK1a9cqlUqj0QCyAwYi0HY9dCUmleDRs8OdDH0oq9L4O51OwyMOOsjMmgaDAYoouMlAloFyiuKBavhMDwktTkqdB5JAkWMQ8zVWD8PdW9t/a/IpxGq3DCctDYxvASMGCwjNQ3RxBVIPsJ4bj8dP9sVYSRYTVrN12JKvNSskljvEnAWOiawG+baoVkqcGADi4+Pj4+NjqHbgEQDIRg0JuQr4LAZC8bLqHJvyMX4aMNZWq4WpjQoQaOl4pqVSqdFoXFxcYDkdDodRFNVqNdQ5ABngJmPwo98ilUqhwkFQFQ8apo6DwQCaIVQKKhQK5XIZ/od8LqhgwQcVuufz+TybzRYKBZwepLcxZij1wHFFrQwOYOwUsuqnxJoZycJQmgbGioFBLz5sEHBHhEoPrh3VTaz/RLphLscFnz5IcEckF48TExtTqVRCJcPzvPl8fnJygjwTavW1Wq3X63FrM/ZHnaDivuGqMchZ5tEN1y8LcIxWEZYtKa6xjxjCoAbyu30lN7Qm9HQwNJHW9hc/60T+eqDDeGDBUvypLIcS9kRSImORmcgi7lMGvgCTOifOvelTh9kWrBoiETtePDELSufk1i1573X55tvy1ttSqQipkARGkg/UAIiTKrpbBlISOw7DEO+zvsQwgygYXSu5dmmUUNsGYAqjrMvCf6AOiRXJqI3LSA9oMqms2kRUF89ob0uAGKxMdFCxFC0x51czcA2J1S3CF7wVFMvSxUuwSfBdpFdjgZXYwBarKFbpTeKwydGyVql8S0HXQIc3AcQGN4ImK7LaK0l6MnMH3SZImwfySck2FcXbJXpO0SSUWnXw9nyRRlLhxADZNW6LvY9NRXgWvDTDHdQQcFgrrm2cBu+MXr2ZcJHfwJ81Y3fT5rhWpD6JDmtxle2rutbW0w9uLYMYIxYHmjg5zRGEwGJEp3668ynplfK0KpoUCvLGG1KtSSYn/Yn89lOxxgohdUU8ES9WJXZW0WE7lpi3Y4DYil1JJVHwe/XRYRGxRdIxzhvGVnXz+H9n6urm8d+WSFZk/lW4ut2xA4h3x+54EayBzbCa92dQaebz+enpaT6f/8Y3vgHXKXa0LZdLSCUi+qzVakinx+PxaDQCQECHHAQN6M5GRzmjYVbXl8tlv98fj8eAX+mPh2AUEQD5UFRjnM/n4C8Dm+52u91u13Gcer1OphV6xhF1AfphxIZefs/zLi4u0Nt748YNwKZAtxH0AEcj/fni4uLhw4elUgnXOxwOcc69Xg/9+JVKRRSVkmG3VhxzXbder0NrgmA02b7FYhGniqgIUQVuFLkeVOaSWGJV4hq1FjUjPI2+b1AC0+k04AxKS4PTVygUAI5v0SBm9ZtRmiGC9lTWwKs/OzT3RHfid7vdu3fvjkaja9euFQqF4+Njz/NOTk7Ozs76/X42m/2TP/mTP/3TP3377bc//fTTf/zHf4ROK/RVtHgclENbrRZkeeFEh6QL02c2m5XL5VQqBcXbTCYzm80gbjAajcAgBnw2Go1OTk7AIy4UCvv7+4CZMDhp9kgxQdA2QRrFLBuPx71er9lsQke7UqkcHh7i0oBWAzfU5RDOXwbchUKhUqkAikLaABWOg4MDZDVr7zMMuzqdTrfbxTiH4i08wQDLgjIM8RNMnHQ6fXBw4Pt+oVBot9tYhWq1GupPRu/heDzudrvA8akaAa/FXq/X7/chmE71bc47JNi49v39/W9961t/+qd/enx8nMlkAFb+6le/Ojk5qVaruPNBEDx+/Pj09LTb7U4mE10jSWaPr0L9Q0tYQguFGr6lUgmdqjTYhJZCGIaTyQQyONVqFQW2drsNxncul8PIKRQKwBTYJsyElsu77/uAkkGSTaVSGHilUgkrPBL+drv9ySefnJ2dAY0tFosQl0BtAGsvOMWlUoni9UjM8vn8eDyeTqew1GMiTe0goPw4SbSMsP2TLqNkUU2n036/jzdgQ2k2m0EQdDodKM+Aao1xhRUVGSz6V7Bg4p5D84Ra8BqwDsOwWCzeuHED6zP+BgyEXRVS1ycnJw8fPsRco+ASprkWtSTFDFNSf5HRaPIlr7BPcJAg4JTYxOEyenjXuvpsh3oNXnAS9l3b+PJUu60/uNzDkXJODsvysCjTQJYzCfoirupK9mOgASn0TGQuMo17eCVmCs9F5iIL9WcqMhSxJFuSt9+R/+d/lT95TyplyeVE9cpbtm1tYnmz4K113rUBL99j2KmJ6qD//DM3FBsuH1rLuiG96b+0cwBhKQbA7GJZqzOAljvHcbB8aXyWqCKnPD4NKvDYCrWULY1ANFhMvVT+k26x7JDToBuJycb00XI3BLKxKPGKcKUaj+YSigYX+nDg2wkQ5/N56MXh9eQ6oJ9+8ongY2Vdr4DmAms2qA53jQY+A6bHc2QJHDkIxXNx84l1EvSnLhOFwjRAzNGOEiC2VyKzZKQmm70uO4YBDSduoIbIeYFIzYDPAt/HA9LPd0ut+jKziRIf+slytBNhJ0as675J/Fe70q2VKBHF2E0SkGWDcpGu0OB3tQg1hxNm5WKxgF4WKys022DkiedoXMvz0W4sS1Ip2d+XckVGE/k/PxfLjy1GAQenFQvYWgVALYULR/ErmkGsQeFQve3Vrnc+QcYpu7wUiUQ8xYD2FKGYtcwo3ux2x+7YAcS742uPFCdfIVkPhksnJyePHj3KZDLACBjNYPvHVgcbIrDP4GgEoAH793Q6hWYo/M3wW1StwmYPqAv8O0ofkBE5mUxoOo9PZlcvmo5B4hsOh5PJBLLCIAtTWQybMaI6IsWZTObKlSu1Wu3k5OTXv/41tmrgVsTCCBEC3bBt+/z8/JNPPikWi7Ztw6sNeAeuMQzDg4MDorTaXIixJn5GRAuUhFociCd01M4WPFFd/KI4rSRZaE6HYVhEXz6cA/B0+gfSsAuE4i1xG9FqJB6I0rR9s8Q2I7q/+yvHIzYIhnxxMpk8fvx4sVjAryyfz2OOtNvt0Wj08ccf7+3tFYvFK1euhGF4fn4OSqlm82n+yGQy6XQ6IoJ2+0KhAIwJUCbmC/IfYFXlcrlWqwEtGsTHeDxGEzrnLMYS6RWySpogLMjUBQoP/X4f11UqlQ4PD2u1GrmNmiajCUqivF+y2Wy9XscNoYEJLkc2MAQx0SBNPh6PtbYJWPyYI7Ztj0aj8/Nz5EKu65ZKJdyrQqGA75rP5+jWR+qLW4RCyHg8Pj8/J18eU3UymVxcXJyfnwNPnM/nVAKRuLGUmKbneVeuXPnmN7/5xhtvZLPZi4uLX/3qVw8ePDg5ORGR/f39er1uWVa32724uLi4uAAov8l7/VUofhgDmzeHkuLGr2A0YsFEDQDrZzabBYcXGQ6UsgHgkgJDjzjmuhgzQHhJfcKTnUwm0LkGjBuGIWTZgcxC1Rq4J5Jz7AtUG5RY6ZtkfK38YDDL9OrKkgAxGpytznK5L2DdTqfT6HrBllQqlTDUp9PpdDrF7sMkX+e63BSY7evqLNZP7HF4HNlsdj6fk4idTqdrtRpI31Duppcpp5huUtaVwiSN6yUusJ9LbSoUb0vnL+/k2lx9E50qqT26XWrAkDHdocNPnosl2YxcOZT33pbFUh415SKSwSDOSNIiTgwKZ+KfCQTTNT6M/7mIO3aXMaF4ISLiRFKuyJUrcnQgnidJJugm+nBys147GIzRpaHMlarJFxpdbzFqM4ilXKYoLkyChdaIR8BGVYHpdIodkBEjdWyI2BJdImeCSK6skh+NmbJWUUq76vFFTThNlmH0XGbTEtm1DHHxT3I7sLiRaKnF4nli+C/E/5qtuWnv06xtredgdFToli9GvFou1livdC2KZVEKIJBxwohdm61hRyOCjP9FwcCwItSRNpvDCOiHYYh7RTL1Cy1fz+uN9lSFn6dO6uSQSwZRa0es5nRrqsoWgQh9l5IK1wbfJTmjjUmkmdf6Fw27cv1AtUSb4Tn5hXICUGQT1xPXVc/WMBeNlCGbKLT3MucS/2706rNsLZGFiBs3uzgxMu7EznUS/yzxdobqJt6zCwp2xw4g3h1/CACxYUSgUzhsVIPB4OHDh0Bq0OqON1BpAdoFouzRCW8hYe73+91uF/Kg5XIZcIwo6gSELCaTCaAxHEih0TBF1AZAJ3Bqluipzoa230aj4Xne48ePB4OB9ohDh5rmXziOc+XKlXK5/C//8i//+q//evPmzevXr8OeiPE6QQ2qYQwGg8ePH0NJoN1uj8djxG0I8gCgsMdKG0CR5MsqMa4OaDhOzzDe1bEIXkeIKco2OpvN4vLx+TpSx3vY6A34jAKXuHvor4fwJSUytuWKcV2dePRTQ5mvtP+PvpkgzmOkAQsG5bZQKPT7/fv378PP7fbt29ls9lvf+hb8ykjpRcioNdRgVdfr9YB7Ag4ul8t4w3g8BnmzWCwWi0UUUWazGd4DviRc0ZbLZbFYBGyqYT7d7MaCDc4EwBk+E5oh0OCGVEuhUKARDVEn7YdDExu2rsOoTWsOYspoHr1xY1HgATmIJ4YxhrkGaiqQdCZRvV4vm81Wq1WwhufzOfv1PM8DPguoET9QAZZdma1W6+zsrN1uo+ozGo30yNc2NeAoHR0dXbt2rV6vQ1fhl7/85cOHD23bBjqczWaxyoHOjEt+JvDiy5wsa425tQ8PUxeK8ObzeRST6Ey4WCz29vbg01iv14vFouM45+fn3W73/PwchG5InZB0xtGFBgsonqP4AQ4XeMHwZFsul3jokAACBI/dhNoLoIHDjBTfhWycc5aCMECfOfvY/KuzfYxnctBw2hzzFCFB9QXEf2T+3W43n88Xi0U8dxYhKAEMXrYWR8I4JPOLooSEcrAg4+Rd10WDDjpPHcdpNBqWZV1cXAwGA9KidQWIIFE+n8/n89iMuBfIqrfbS1xXwzCUKJK4a1776a0dt2slAp4a3mgcIanOlIQqdujwWnwhl5Nbt2ThSzYvP/u1zB7KYBjrS4QirkgkkhGZxxn1QoG/YczV0hIT/ipMLGIF4oh4ntiObNIJMKQknrp4rl1LLylI8mXOBRbmUU7WBnRs+ENVHsEbNjvsiYgKeLHskyAzUffaGw51Rps/WZC6GKObYFiB1ouJAY0ZTFtDco3gJiF7/E2FCq1ZjEId/K5xi7BQ87Sp2arD0bViBSQp80JI5tXCzRolZKALyothesY7mbTcoErSLD4IEFN32CjVw1kBQRFiM5TJsamBccKHQtU7WnZT1IiC/ps6ty6F8j2jd+gWUN5o6Vj7i8n5mPQYNBj3ydltENj50LfUKtbi12s18fXoTeLFlB/UYhFJ9vFaEWEtmszaNisEuquAbI8XEJgWy5JcVspVGfclCiVMySItviUR6napeEk3xoS1ihRbG71Go1BCX1Y5Bq/ekRGZxnsQbOhcETc2qUuL2LHuhKV+wPVOY+B4d+yOHUC8O/4QMGKjjkoeMRi1nU6n1WpVKhUkqEhlB4PBbDajFQOIDHTIISwLiTTQ04C9UjABeyHwYoRHsmq/zsiPhhgwW8tms51OB6EzkVPgy+Sp0SaIoBiSbe2eLCJIocfj8enpab1eZ9xGVzrDCB4o4Xg87nQ6qVQKvEsGMezrJ4WWMQRjFy3Vio0fLlu6kmw06GnlL51RMJLQVI5kEMNHjMgV941iFHinBp23jxawPmezGWoGm0oOX5Q910uHhmWVOIC8AhE/YHeoK/i+3+/3T05OHj9+XC6XS6XS0dFRqVR6/PgxIC3N5eHjo3YK7iQAUFAIWWNwXRdwLd5AyBVJSzqdBppGMT7CXrp7jlxg9vuTyIwEhgmbIRqodZPDhL21McYMO3JcnTZsNA4NwJE3QVLMeDwGdEiFYkCHZLAiEZJVS3RMQ8q24CZj3rEWBSdM3Hl0LWA6aFYUzgfPFx6SSN5Go1Gz2Wy3241GA8ICbDvAqNiUBb0iE8HIlLQaNTJPUSQvvFIoFGiLlMlkUJw4ODh4/fXX0+k0NBwcx/nlL3/5T//0T81mE/IOXLpJDAevXGKmHoQ4CBA7joPNAksoih9RFFWrVRCc2+12r9cDIgzIYDabeZ6HygoKCWi4xqVhnsI7lENaK70wbcPfIKOBGgzLHXZpAE0GzgvKMMsb5O/j0jDmud7i2zGpoe6CMY9x6LpupVJhSq+ribgEQO17e3uWZU2n03w+n8vljo6OKpUKBuFwOCQrUI86bCvov6F6qaySFl/uaIyiKIwiiSJRYiybVB22M4U3Ld2Xv8AkmXR3rNx/W7K5J8ZxTkq6Y/nsQqyORFZs6e6KhCIZkewqg3geM4jBU1vGshLzVR6xLyISLWU5k/lEovBSi9jaIlxSSdZY8S6zNkbPtaI+3wrPlZbd8SgOYZtLp9NsP8fSBKgIRpdUkkEtiuApfT61h5te7gx1DizRlHGn3oUGf/GLRhStAwDu0Ro2TSJxhMC0VgM2Gjriau4n2A+G5LqhBqD1K5JFAkY7GgU29I5IztWnzeI6Wv0AynNxpjy9UdnSKr264ZLy9zpcpzwCMiA+TeppjEYjRETa8Q9K0LjtdLFGiRT3cLlcsgPseTDiWGIiSSpPZhYG8GqwxQ0+7Nr3G+PE2KSSsnXaM5CbJsdwEkfebnyqSx2SYJrLKineeNCGhj4HM7umjAYFFonplqw7Y9gnyrTacN/FMDDMJ59lqZJsWo4O5Jvvyl5FwkBmIudjuRjJYiwSxeiw8ZF2vKRL7GhHfQlRpONAxJcoksVclotXGCOOYpM6gsWzGCzGMVdv9mI9imxsZLd8/m9+//33//Iv//LP//zPReTOnTs//elPf/SjHz3H59y8efPDDz987733KpXKvXv3/v3f//1HP/rRvXv3LvnVP/3pT+/cubP9q/Hm999/H+//0Y9+dOfOnV0gtAOId8cfEDSsA2sdSWNzWiwWwF96vd7Z2dn+/v7e3h7SUahzQhoMHEZQvYBqIVWexAfgGHwsnOjYzoywmMZfAIXBsUXGvre3B58rhFme55XL5W984xvn5+fIz1FXXywWJycnuVyuVquBWQlwB5ETTpUkYoj8ghFAfV5cqZZ60E5xCCUZirXb7QcPHliW9fjx49lsxggmiqJer/fo0aNKpQICGg/tCMwIHq/zkg2UzYD56HQMSIVu0bTCIJtAi2lorIFSGwAstPuEoZi8acyEYTgYDOAWlcvlLtMP9dXlDq9NLDEUoZwLZZVisXh0dATwaDgc3rt3r1AoXL9+/ebNm6+//jpEWobDYT6fBzDE1m88UBQzmIbB+oz9lciXfN8HZOw4TqFQYO887UowvwAJIcrUdCGDzsABSYQaE1Bi7TMyZUhpxxjDOwm8atVySr7oCxmPx5CtgBGHjt055MCgAVaIKgWSLmRiFObDl+IzgyAAIIiaE+6qtn33fb/T6eDDIVODF/v9PspavV5vMBj0ej2yodmgQO4zGiZqtdqVK1du3769WCz+4z/+o9vtfvLJJ5BxhJkYOgaGwyFUkpmgrq3TPNOy/HutCOoRzpKDJqBp7T/NGU+lUoApy+Vyo9Go1+t03B4MBr/4xS9OT08hegNoA4izNm3v9XoYRXiFpF3CpsvlEiUoggh6oGq5XgDW4LyDI0xXHCyYXGNJJpJVpzKqfOJU0Y2BwcZEDueG3Y0ZOGYoZisKD5CeyOfz7JjGbqj9GzH7sLcOh0NI82vcAV+qV+BcLnf9+vVyuQxLWNzz+Xxeq9XQTKN5RhqbYArK2UdqvLxs/zRrHX63HcXbcsIaqtCLknbc2vQ5rAevZdbvDlVykEJBPE9uDmWvKmkRGYhEImmRUMSLm3ZTsRLlVBnZsYt5KTKL/0zjP4sYIJ5JMJPFTPxAUpcDZNf+bxID1djoUzf9J0PoMiMh/o4vBCNmDEZUEfsyQjJqkmI1xv+ivst4D2sp3ok30JAZ9VF+hY5nsOZzbcRWzvWEGwGjUxTAkgAxFxaNFOv8Qpu+GncRMS0DG8SuRMp0rK45wsauSkCN8K621CYzl5EP5ICwR6wZAPFYwi1FyVAv1ECNcW66AUITRYmGM2I3VjmSV6g7gQeHyAdfpPk3SJGADmvcHLdrER+MhZ67dBeuPlNDulfzBvR7GHMimeJmxL/1mqxh/bXoM91N1v6Xljsjjfqpwika0tWMDaNSqJk9SahXx3hrMXRDelivD9p2jyYB5KQjcELGisEmsayK5oaj2GwsaE/dvGxLGg35kz+W/YZMxhL6ctGRf/mF/P9+Lo8eSjCOlXbTCv8FFuzFmry0qqMwsR9rGQcigUSWhIFE4SusMZERKarTs2MUeP0ti3cuW6QoYoukRPLPrDJRqVQ++uij7373u3zlgw8++O53v/uTn/zkO9/5znZs1/icH/zgB3/5l39pvP7973//e9/73v/4H//jMr/ywQcfiMi9e/f+6q/+Kgn73rx58wc/+AHew/d/9NFH//N//s/vfe97vV5vFwvtAOLd8YcCEBt9qfp/kZOj1R0qq6hX+76PXDqXy0FiGIyDYrFYrVaxT8/VMR6PB4MBNnKww9AQxw4y5PY0KWZk43lepVIpFovo4EYY1O120XIFHhn32ul0ihIrzpkbP6VyEXdysweyAPYflTHAj9Bu7wzW8etg3UITwLKsVquljYwQ5sIrD070iP8Yf/NtOmDCZq+79oy2JirToYBMFCDpvKzjEu3nKwl9LiOmoTUT5C+3DBvthbIWckqKnH7NZs1iseh0Ou12G35c2Wx2b28vnU6DW3p2dra3t7e/v398fPzee+8BFIM0NpMT1i3A7sG9AisWBQxMEOR7oLiiPR9kSdKE5/M5gGOgxiA5cgZpET3tKkPtM4bafKAQdWEMSrAYw5jkFN2SSa1evAGfgyIN6jQYkIbtoR6KRHgnkwkunyLmzDZx30Dgnc/nkOyArgWYpLhLWIhQwkFLAdBkuIENh0Ok3MBzIV+OVQWlFxKCwJOtVqvVavX4+LharUJYBvrj8KKs1WqFQgHC6+12G/o2skojetU0iNcm1ViZ2bbMBlj9HnKaOGBooQMDN1TRMplMsVgk6krKDEWxAdBTwhjkepQA4UaISh62DObMGCFoWKEiJEAKEruwpBeLReTPZMNR5lKUkgaVdkANxv/icnBF7Ow2clq2AAP4huwD2NBhGGIykgusZzc197Fu426jf0WXiHQrK0Zmu90+Pz9H6ojPx5ZKxpnuIOEjxkxE2XVLnvzSBuEXquOnJVBlg1LEFn+wJLi8O7YGABIuJJhKNI3bclNx1+1cZLbKICZALCJhbFK3UGLEYBMHIiLRUqKFRMFzggvJR5yUm7jM87VegEH83AtyMjwjnMrKvSgRCfbVsVVOVG87+QesthLSSk58Q1/OOJnk65rhm/wV/Zmahpy8Os351QbOWmzXYFAmmZvG3NfYrjEGSOmlsAPhVO05kSw28J7j07hZINIwisFJfDAJoBvMj7XBOZt4cJ76M8EpMQjRxt14/gaRuKvDkA3hU2D5U+Pgeq/HWE2mk/qhGy/i0ZCbosdDUjNEGwMa5JvkPU/eDc1oSd4ig8isr8sgO8s6BnHS8m5tMxlzUmTKfCd2ecTYYCHwBLD7I9pBJwHrOkk3zk2H40ipKLduyH5DglDCUM7PJRTp9WUxkHZPFoMYIHYVQpoSSYukY5iYGLETs2sXIr7Ytrg5ybrSaEipJK73qm5gdnx1boIObKkXaVKnf/F5cbjvf//7H374oYj0er07d+70er3333//5s2bH3zwwd///d//xV/8xWWA10ql8uMf/xis3nvxgQ8RkY8++ujGjRvf+c53Nv0KvvrOnTsffPABvv3HP/7xX/zFX2iMuFKp/P3f/z2/4s6dO5VK5f33369UKt/97ncrlYrx+btjBxDvjq/5sSnApdyY7/uQjISwABJvJMCe581ms36/j5ALkCuCMEA2qNID1qFvA8rjSO+JBIG0ZUSuAMWKxSJq5r7vd7vdzz77DDkw/d90xKYd2w2bAlatuRkTZgIhC5EN6WNMvw1rDlxyFEWj0QjbPLUjce1ghyGIAd2MwK62P9a1cSb5CI8MfaukBhbhsyQBis1KhDmoSkkzEO2/p/WLL9Nma0TeXwM1iWfMkEOgjWiuR+9nLpdD4zkc0gDd3rhxA+oljx49ws2HCgFpiYBEMZWQqBDtQpgIcJapESYI2DSkSwDPJQdfEtJsJAIb6aiW0mNkz7STbGIyiDUDXcuhEP9i3gWzSqweQNMMPovRh4hlYTQaAd3G4kCnOM0DAvQMrI3DG3cSkBmGNwpRWHBwcyCyDFwPTFUgwpTTIYYIc7yDg4NSqYR5hJpWt9ttNputVgv04VKp5HneaDTq9/u9Xg++ZEwPtiQhrwJGzJPkEgdoHoJC9Xpd+8uBtYTRGwQBDP3q9TryFhHp9/tgZ0MOBYNBYjIyQAo8LIgIh2GYz+cPDg4wZjA1MHJQbhwMBs1mE6agIoLX8Sg1HZ6YLC4qlUpVq1Vgr/g64NqaNMc9iM5vBIjBCMMWBggbKIwmmWrLPsdxMAbAek6n00EQAClmBYg3EHOBzdRgtYOEjlYMilRyAYdozHA4/O1vf3t6eloqla5cuVIqldCIgxulV3LcEGoHYcPV4jav8hL9IqCG5jkm2aPbd7SnqirtjtWYUGYTmY5lMRKZiKRigQi0Jy9j2FdWtYZpUsdXgvgH4MWRiEiwEH8uYfCc5DMDIH6RcW69JCOiTeUcvWMySFvbnqJ3Hw2Qrb1Rss5JLAl+GaRdWRWV2g7BP7W3TPfcJPVqk4oERgjKCH/TF21CDEN1bD/JcPVgbpIMpS5ZLUheSLKobICniBgRYGxH8L+wgpuqTzB7otAzo0SjTU3Do5pivBarZdxIDg1/hV2kdFs17hKjUEPuTFY5T4wnkzuFrBKB9dUzEvbiQzdWJkUw9OtJp8TkkGBXE33aCRCTAA4/Gw0Qo+Sj7daN/c5wUFw38CSVetIL8gQQLMtgKMOBOEv59W/lcUv8sYgT+46CPpwTySspCXdVp3gpMhcrkGxWGlfkuC7ffFeuXZV8Tl7pYiuIw0u13EMony+6q+iw/sVnvK4PP/wQ6PCdO3c0FvyDH/zgww8/fP/997///e9fBnj97ne/C+j2hz/8oX7/+++//+Mf/7hSqXz44Yd/93d/95Of/IT/9dFHH/FX/uZv/oZf/eGHH/7gBz+oVCrf//73/+Iv/kID2cmvIMr84Ycf/vSnP/3hD3+4C4R2APHu+MPCiJMBHzYw8BkHg0G1Wr169SpQVJAiAQG3223oMEJfOJvNos0WSSy4df1+H+8HgoPvyuVyYOeNx+Ner4c9DzAZkdxSqXRwcBCGITyLYBD/m9/8RhMZ0ul0qVRClzF2XOTnMJ2HFBcZlMCFCa02m81UKlWpVN566y2ABVQrA96EHRooA9ExeFVNJpNWq4U2doAsuHzf9y8uLkDnpIAGJAi0TBXdhylzyZvPpm9cCPv98b+IIRCQQUkNyBdjRzbBGRA5mv0lFnUl/IG/J5NJr9eDyxZlQ5OhI9nZhpqzrOOebI/dX/FjSy82SI69Xg9jBtBSqVTK5XLT6fTRo0eFQuFnP/sZ6h9Xrlw5PT1tNpu41Wz2BDYHFAywFMiYnU4HEihAzcIwzOVykG0BlkpBOhQhNBtdx69UsZBYFtCg81BhFvq52iNbFJtYM4hxPlrd2zB4AXqOyQ58ip6Nmt2j3WxEqXuzjcCAvdiluFgs+v0+Tgma5uAL9/t9sCYZeUN5g4R9XDWAP5yYYSNJAJ0azalUqlwul8tly7I6nc6jR4+gbFOtViHIHoYhvOnw7WtX1FdtSDPJ1NOWTJzpdNrr9Y6Ojki8pQhjOp3udrvtdns2m9VqtevXr0MpGIRZlDS63e5gMECxTTfkYpHc399PpVKtVms8HpdKJUDMVIGksxzrEACXCTRjaAHJZSMI1SdwaSjVgHevmz90gQSTwuCyoVQASi/WVd/34T5HHpPENCWkcPgnoHOMKFQUuFBjcBrpNCs9mUwGrpIYn1RuYVGHhn7j8fjXv/71bDa7fft2KpW6ceMGtTiovcjsGuiz7/vA8angoVtYDNrdy6lJv1hX/hY867nX+T+E6uYL32dZzGU+lcVUsYPDuBWXWsMS/zNa90fiH3wRX6yYT+4vZAHxyt1z2FA1WQuSyqrVBOXOwV0wRMOSUirJ3oIkoKbBXPInNAGWf5NymwTI1lIsZTOp3+Asa4s5bcthWFBKQsNK++tqdziut5dRSNP6GFqxDfReHdXz60hxNVirDJxIl8Hf7AjhhgjEkIoNuHtU1YPqBcm8PMNNUh7POvZ4/kSBUetFzgXYlCVJw147idUmnynvAJMXcncIN0tCgH6t9egaHE8pfiQpLGstXvTvYmMFRmxMIuN3jaGe5BqvzY/YTagxbowZUjF4P3Woz7HBerCGiZ/KI7YscRwhklwoyBvfEMeRclEcSyb/R9pNERHJiqSeMIUj/h3FGhRevNSLyEJkIvZCCkV544r88TvyJ/9J3viGlEqvNkAciEzinx2RrMhQJFQvTlW1UFTTUy5h4ve046OPPhKRXq9nMIW/853vgP/74Ycffu9733uq0MR//+//HSizgSbfuXPnr/7qr3784x+LyF//9V8TIL558yZELSBkoX/lhz/84V//9V9/8MEHH3zwQaVSwVlB2jj5fpz53bt3IZSxA4h3APHu+AOKQfkDtzftt4uNfzKZPHz48N69e/V6vVqtajYf4pXlcgnjuGKxmEqlRqNRp9PBTgmuJTqLAUIVCoV8Pv/WW2+98847qVTq7t27IgJBYUCx4IWBPry/vy8ikPgEUkw0Adsk1DBpuUYdUtp/Yacn/gXkAjTDk5MTABylUonfTliBdtJU0hARSkcNBoPhcAiWJbAtQM/z+fzi4iKdTjcaDSp1DIdDeDThPezSAuTH6AFfQURPN1Kxl4pqrQTrl8slvJ7BAZSYTw14hVRBxHkER4iYAPI4Pz+v1+uDwWBLZElQGGEixUn1WNIl/Vck936RE2CtXk8WyIx88skno9Ho5s2bx8fHxWLx+Ph4Nps9evTo3r178HX8sz/7s/39/evXr9u2/etf/7rdbqPiglifMqZ4Fngc0M8F1sw+9PF4zG5HDBh2HYIwS68S4sIUzsZ/pdNpahNL3L0OMzG4PpJIy6yJHEbMTaiHg0sLciKHLpMuRLfD4bDX64Gxi08ADojhqoNsuoSjxAKAUmLNNQwtXDWuaDqddrvdhw8fzmazdDoN774oisbjcbfbHQ6H1HfG3UCeTGoG1x/G6DTGZLiPSYSTeeutt95///1SqYSuhU8++aTf7zcajStXrlQqlUwmMx6PHz58eP/+fYhX6KzsFUSH12bgokhSHNv6zrBMhaeGp0DvIKr32rY9m80AShaLxWKxiMqcKEe4SqVSqVQcx2m1WgBG8R6KIUjM4M7n83hqIBdjf2k2mxcXF6DoTiYTDB7oVDAD12oSTLZRLSD/TqeIhsYi1f1oIFMqlSj0SbVi7Au4cM5crMA4VehdcIRz5DMBRkmPloAELPS+hsoTNheUTCDoPxgM0JTD3VmvtLoTWVPaJVYlSq5mLw0jvpwv3Fqvod9fILQ7tj01EdeVTFaKJXGLEmUksGKwIFQYsZV4RdTPoUggViSWI3Za7IxYvohIviD5vLiufDV0PhKM0S1r/tp6+SZ4SzfR6/WK9hUaj8OKzfUZvAR4eGKPNhY6o1LFeqE+JaMGrIM67vJGR7+oXiXCVVoPWrNNjXa3tfKyTEmImm2qBhFYNJR/WXVGFyPjFq1KzM6ntSsMy5AIm5lcUPMNv47gihE7BY5hkUpsmmA0Eg10ocELYTAYaJM6/CL7sWazGYt8yF8oZqWjcVJYtJKGbdvWs45qyxLIEMfPGgwSJBTY6xGzIfjUozGJ/ouSANJyYaz34+q0Ywo+jUMlicZyAKxVwU5WJtbCxwa1JYnzMjrVctuiNKaTacVap77krVhbAWIdmveKMQMyBW23zqnB2cSgfdOFr33RdeX4SKoVqZRkMZNeXz6zJfTFKj5RIg4jmUUyi2Q5lnAhkhZJxVoTuCUjkb5YS8lX5LXb8n//M/m/fVtq1WdbxjdxzI2beRkZjacfsFHFcpKJ21nGW9+P96REpiKTWE/pcscHH3xw8+ZNYLJJHYm//du/hUDEhx9+uFZBWH8O6AJ/93d/l/zfn/zkJ1puQgPKIvK9730v+St88ebNm1CZADqMszLe3Ov1fvjDH373u9/FV2iS8u7YAcS74w8FLNbdxwykEJJCVwGSSdrNDGArOMUII6DXeXp6ms/nS6USRb5of+R5XrVavXHjxu3bt8G3RQiCWEpEqEOKv3HQphb9uaRS5nK5QqEgsX2HrJrnauCDDVP4KEiasj2fIg/choF/sXKraYxoUkYtHXESXTUgrIFglO354/EYeBxt6BCj4JPJAmCgQJ1iUbK/2uYe50OgVuKGaDYhanIZ4T9Z1QtjhoC27l6vB2bcloPAkIggtt60bTN++qrn3klXdBCuHz16BKSyXC6XSqVKpXLlyhWM4eFw+LOf/SyXy928eRPuju+9997p6emnn36KT4PcKgYY5g4HG+BUwFWlUok+jaD06tNgMkaUCtIuIO+Px2MRgYUXoCvtsAzKJBrzYYsB2q/Gf3Fu+CjAUhjbbLFn0IkKCtCx4XAIwBQD0o8Phrw6+MOZAEErlUpagEXHi7hdg8Gg2+2en59D3VhbjSMxhgIsJh1VCIbDISYsKkyknZKIwQvJZDKNRgN3+9atW++9995bb70lIufn51Abz2QyBwcHBwcH2Wx2Op22Wq3Hjx83m00uXIQ4X9m+9U2sGZw2uPCgKRF/tCwLzR/Xrl177bXXwNRGxwaW6Ol0+vjxYyzjV65c2d/fz+VyxB34KPF0qtUqRxcGOa01+RQgKITCBrWwl8slOlEmkwkG2HA4RLWM5qKAAyzLAo4MajzIWUZGp3nTGlTF2zDsJ5NJLpcTpfmAxB53QytWAymA7aGIoAOgVCphYGtHR21Bzm1F0/ANZUn8s9Fo7O/vF4vF0Wj04MGD0WiE5hVqNBlzil6LsqoLb+RdL2tltm3bwUmqLSkJKxhwwKZ2eFFqoc8BImvJpl0Q+LQHJ/mCXL8mb78tU5FuIANXlguJfBFHuRVFsbKEr5Qcw/h/F0+6knNZqRal6khaxBKp7cnNG1Iuy/PhAC9hPF8OHd6E0RhtHJLQV6XcvyjDN8Rg7HxnfIjLxz5YLpclltMhNZUBqmZEJgWCGatzeUxOQC3MqqFhBBX4FoajOHmtm5zUTNN+ITxVrUWrF3BDN4NfYXwI3rNYLGCHgLiFADFEePQdTj4jXhRhX33JjuNMp1NowmIv0OgnSMGIprTSMTYp6Mij4QYAMd6gkWsWOKfTqe4OTKfToBVjZ8TpYYei3x37UZ4ZU1ulbYM+zHiGOwsTFq7bhpK1JAjdybK0ZmHTGxwxG6X89cK+VjKYIeVT7bKTkaeh2icJuzw9IxgeGO4vm4yIk/UPQyxYC6QYYRjyPl2k5ydwNcAMJaSunWm0mvP2WpRlieeJ48iN6/L+e9Lry+GBhEux8iIpsWyZzeXRuZw0pTuQcCqSiTFiN9YgHokMxQrFi6RclMMDqVYknX5mdBhpNYeuxvFZjdDtWc9/aI37cLWvxRUJYhEJX70/Lmp+/ivPAhDjh3/4h39I/u+PfvQj/PDnf/7n2z8Hyg8ikrSVwwGAGGA0DhjT3blzZy2e+5Of/MR4nefAs9LHP/zDP4CPvAOIdwDx7vhDQYT1FqKNI/Aid18gU0CIuEUhNqKmPji2QEhPT09PTk5AfkTzNbEAdCXXajW0GEO/EvRhxkDAwuA1BFwJzD5aNHD71M5CYLGx+RfajqlUSssHM+gk1CuKbmY4EdFKGIV9w+CCLDAWwLlzA9JCvE7Wp+7a1ii2DrK147PeKXXjGO6PZjeI8gpLUjOMvn7DipenBFEOqEUblmJGBGM4FydR1E2vvFxc7EVIxEmvCdAYW61WpVI5ODgA4b1Wq2GC9Hq909PTu3fvQlr31q1bN2/eBBtxOp0CxtVDDvAlxw85j4vFIp1Ow+COCq14j5YjxCscupAAhsAxJF9A1SQLib/OLIJukJjjSDOgXoIUC/kVZrrv+xQQIMMUzQSohWC0a/dzo6Vdpwq4dZ7n1Wo1fBRBXobLOJnxeIxLA6MT0SRg9Gq1ure3BzQcn4a72mw2IQHBlk8mJ1hqkLLi50KhAIC4WCy+8847169fD8Ow1Wr97ne/Ozs7w4M4ODgoFAq2bUNvAZ6Za7P9lzJWn+O72NCAtbRYLKKlYLFY4EGA3+267s2bN2/dujWfz9HzMRqNUPe6uLj43e9+12w28/n8tWvXIMrBoaXFji3Lymaz5XIZHw6mWzKn5cpPBeRyuby/v48tYDQatdvtwWAAm47ZbAZcm8q/gIZR9BoMBuPxGI+M2xkHAJFZoyCBkxkOh0hOcrkc1I0vLi7G4zGkS2TVqH0wGGCSohgDdXIIVoAdpp3fSd+jc512w9MMKUxquOGJyNnZGWjUcG3F7KbKsN5KNHCT5OAQcXgpazGlSywlZW5wCZOYgiSYXwY6rPX6Lz/+NeFxe3VwhyA7rtRq8tZbEtjiFuRXj+RuW5bj2Od9JjKP05R5rC+8XNUgnotMRcbi2lKtydtX5Vs3pZwX25ZcQd56S+r1CA/kuatfL7gCP8dT3jSV9JR8agXaoGWwiY2GH4ThsP8ClzSUXhFCYAkCoEmSLCeIJkVqCMxogcehFwpDyELjUGzZoXsB5Qi4CpEZamhTGBjx2u4WvULqfheNu2mAlb8CZ1SUzHULEXYK3GFevvGYmFxQa8togaJPgwaICdkjTUBox29B0oFIBgAxOixJ99YMEqre86rZ+4VyPpvJqLBPUYvPn/hzjOZV2eW1TPa1SrvGSp4cOUnBX+3jzS2Sl8ANywggtRiF7hkyyopbGP2822tXe1ZTkMQlt861oZqRFq3dqkQZHurBrL86CRxTe02Uuzvvj3a4Ydvc2tYEWeObJ7YtxZK8+aaIJd98VyJfLEDAlvQH8i//JvOxDC5kORHJiuRigBj3YywykiiSaCZ2IK4llv3MLSAYY9P4IEUa6wYYA5AO+wL2sEXc4xLFcvk8UiJzES8GiK14I+MvPvvx3nvvEZBd+4af/OQnkHrY/jm9Xg+fsEmJgs5y+GelUgFYrIFpfMumM8EnbDnPS2LZu2MHEO+Orw9GbIRoohrKaPsGA67BYNBut2u1GoV9s9ksIBvqSLRareVyeXp62m63R6NRr9dDtOo4DqRUQbq8fv36wcFBp9P5+c9//vHHHw8GA21HiwS7Xq+Dgeg4TqVSKZfLoE0lcza8HxxDdB8DJwLKAOiK8BBCNFIAGAOBtonCNRAx3/fxIWjvha8RWozpwoTokPEZOYyQwiiXy5BjBvxKJhqNlYymP5KIgUfzKRhUEQAlWlZSYvN6iZUxAb1p21ydSGt4GiLOmUxmOp3ev3//9ddfx1Wv3chBw5SYXkFcUoPdTEVekUb7L+Qc1sJ2sEfD2MhmsyDDFovFMAwx/rvdLkYyaKcgFYK0rlvVNH+QOQxwZAwk9peRG8u+Qsr1ss0Q9HZov2B8MqY3yOM6EcKgolQf80NNZWL6ITFtmZLfmBHIi5IzNCm/oKkZDATz+TzujOafarIJ7wAvJ5VKoYcAQuQ4UNCCeeZoNALSh5tDAQomGMzKGIzu7e0dHBzYtn1xcQERicFgQFELrCqg9vBirS9IU9Uo5/y+0WGJ7d0QfyMER7UP9wpjo1AoYBT1er1er9ftdjEwxuPx1atXwbAOggAWplhUWcRi/QzcdonlrdEXwvZh0H4hyIORBuM7rGbFYhFVFri6FQoFELrH4/HZ2Rn2FNjEcVwh5aBfIpZlnf5hPGBZTkLVKM+gnFkul69du3Z8fHz//v1ms/n48WOQ7lEb0M3aWHLH4zFJ+uT60QGV/eCaQ2RU9fDOVCoFifDBYHB2dgZTPsoiY/9lb43h1Q5YgTRD2eCo/rLKdTq3N0a+rEp464ViU7nOqHc+0/i/DPX4+bjJX0OA2JFqVd56U2oN8V3p+nLSFLsnAYhXWZFM7PkzFYFO8VIxiJci07grOS2lY3nrtvw//qscNMS2xfOkVI5Kpci2JYqeeXxuovJ9afHzc3xpEsfR3AUNX2qDZa6ftLTVMjLsLWMPDakGGuMjvGtYn1FoWO/1hhywrkkzEsBOkclkstksNOj5FXoj0DWeZOEn2aGfRPR0CqAJCohYwNvFvgwmLwBiiLYTNoVwEDBiahMbiCfCJ25VGvLmRREd1lI/ovoODYAYESO8bfv9PqrpbGo0ONoMCLUcMFMMzbCmn9sXpedu4PLal9gY+YZTn36UxketnaoEoPmGTeaBhrKEHlRJgNggkm9KBzZ9BcNatIcaZHkqJq+9dUZNxRjM+F8SIIxho2/LWtCekTkYSMTTuT6wsm54PG7Z9GFed3ws5ZLM5xKFIrZYtoglzZb02vLJb8SZiPTjml86ARCLLIcyG8lsKmHwPKMOKx5CROSYnF8IJr/IJR2iw+OEDR0EiAP1tlT8ohXLED/jWUAXIikuoZHfy3zOD3/4wy3ivx9++CG+iDAuGcdgFn/00UdUkBCRO3fu/O3f/q3xgZc5Vbxnd+wA4t3xB3QkbWdZu7ZtGwl2Op3u9Xr3799PpVKHh4fEdACaAFa4uLggToSSO9JXRAAwNYJgbrlc9jyv3W4/fPiw2WxS4YvGWY1G4+joCIiDVockexf4FxiOk8kEJ4B+Ot1yjl2T7XLEL/AGFOHBmANAjMALwAEuH6EbuWmiGnkYKACQnc1m+NhKpTIcDmezWS6XKxaLACAIkedyOfDLDDMNBhC695n3REMbhIwJN4hqmuadJCqBz2csBewAyLvEZHC0lnc6nYcPH5ZKpVKpBMTwMrmNDve1JNbXr45iQAa+73e73QcPHszn89dee61cLoMGm81mgUtCMBeJE8BKZAgQSQALAI+AWQruIZ4RPNkePXo0GAwqlUq1WsVAWiwWECnW7X6A78FsxUQAnITBRraLzqlYgAGu6rouwG700buui0mB2QFWMuE8yG3jhPEV+CetHQ3hFNpuMD3DFGMwDbkYdgYwO4L0KkSQMXnxHmTIYKSWSiVcGoQIkCiCx40Fh4A4LWVIvyKzybKser1+69atN9544/XXX+/1enfv3n3w4EGr1SoWiwcHB3t7e4VCAaj9xcUFdCe+2FrIlwNtGLgGmdRYY3XzBJYRLA69Xu/evXvn5+eO4+zv76PoRWYWWyVoxmh0LWAJRZNsNpsF1I5ZQJUGXe1AoQ4PCM99NpthXcK+ALou1H6RtsE5EOcvcZM1OO+SaB+W2PWRciuafkWUBKt9oVA4ODiYTqdgWJOqBt1q4AgEqdEUzNNgLUczhrSyAa+XF0L+FOZsEASoMmKucY4Q08ekYNqZzMYNFdSXrg7/JOTYsL8Yp7fdFJ5gxHPrSzz1F3foMKGETEZSKSmW5d6ZFP5doqFETZFlbHDvxen0LAEQRysAcZAVJ5D9mrz9luw1xLaeGCjZtlj0rXux9W0tyfELXEM31duebywx8KYCEupVDAVZUIH2Dg6sD4Sl0LEElBYbNFUmJKbZSuxRQRRJw8caEATwJIrRz/XQKO2QLwJmBqrgWoTK4EBoWoMmSVD4FWumZhxrhE4vC1w8sR+hYE9JB9wQ8m0ZwCNrIGMxWdUmQRg1Y+h0sd6G/8XGgYV37WOlVB0eAR8QW1vQmqNL+Bp0Jr5PajDfgLhOU8htdazctBfonCMun0Rat4vIX3JFNTjjBpc2+eF6kTfoDkYL1yYPOkO9em1gn7RbTBosJ3ectSLIhhiFHsZJ6ae1p5rsw9NgsSEOronekhCVuszC/jkAaomIuLZUS+KKWEuRQGQqEojMYoA4EhmLLCSyZTmW6VhmM3nWzM/ogGRBSyPpbJr8YpbuQKHDOZFZAinm22bxrciKTEXSSnricgdIu5t0IUTk3//936EF8dzSDR988MH3v/99/ExlYSK5lUrl3/7t3wxg9/333//BD37w3/7bf/urv/orfZ44n01fdOfOncuQnXfHDiDeHV9DjFjzCvVehSDVsqzZbNZut8vlMhAZz/PAcgJfQGJVX5CbAA1DwxHVe8hNAC+ez+f9fr/X641GI8RtbOSBEmi9XgcERpldNo4RvGBwDMVJ6opq2iy5DCz8AsJGREUjPm1wLKo5CGE6++gpfIxLgxcT/wt908Vi0fO8VqsFvBg6G9C7QOgMYEti0WQNE+udXquwJblRLHFr7oOuorP0zbK21tkUVe7m3UBADKQbNz/p2gGAkiS4TYhwMrD7emDEhnZnGIbdbhdCBLA1q9frtVqt3+87jvPpp58OBgNo5p6enoKx3uv1cPcAaALAQqZHDiOyDsCdvV4PBMlsNlsoFMBQ3tvbg08a+t8Bt0HL+NGjR48ePfJ9v1Kp1Ov1vb09kC7BNsIkpaIf4zOym9EKgIM4L4zgOp0OvBYp6oJqf7fbXSwWh4eHuCLDhQZkByB9xARBFuj3+wD+NBBJUgnqMdPpFDReKM8CtqZAcz6f523s9/sAy8bjMdrwkR7rWF8zdIjQ7e/vv/baa/V6vVwuv/vuu1euXMnlcmdnZ//6r//6u9/9bjgcBkFw48YNvD6fzx8+fNhqtR48eHB2dgaJgK/c8DaYqkxBKWWo8w26/J2dnaHb4+bNmwcHB1jhx+MxRDxQ2MNiqw24tUIlsAl6r3NJwQNCho+sHt9OAhc0HBaLBT4HLSxA6sntAjAN2h0GOfqLu93u4eFhtVoluQbvZ9KOk4QMtxaqBpsYAwzb3NWrV7/97W/3er1Op4MSRaFQKBQKAKkty8LXgXSMuyGxAb1Gbwm1kA6m01qyw1zXxXzHieFkdFs3JzXBZa7w2GJ6vR5A87WGOS8TaHza+EyqGMlWpeDnzh6fljlbmwQc/zABYrQkZ0RyaXFDkanIXOxAoqFIQaKciC1ix1ISBkDsi0xExmLNxbLEWUrakWJe8rnPR6VIFIbyIvf8WWt1L/JkDTjm+b43GSwxEtD1JGJhpOsCSaQKLSI3vAGRtpYhNtRUtIhB0hjKMBYzJFkNyRos7whR0AyOgrHWGjbsKAykTFb10wkQE+s0cEAD9yeuhK4ObP0UjiNNmPE2G4CgkkTsWJ+evijcVVwFzX4ZWmuWBg+D4ctHiVgIPg2z2QzlUoQxuFKkTkxbaM1CNjcpHQjqdLil0eGkKPDvIx6+/IC//CxLujgm1clklY9i8HYNYHQtg3iTJozxRUm16+QZGgWep64/BrfmMncmec6auK3zPv3tz7SKoj5nQk7uE5FiyxbbjrtD7PiPiDgisaaEFa/gzzGWDEkTZrUs2BvY94sezFYX8RmnYol8/AxBpGj1bf4GKPklHZVK5aOPPoI0sIh85zvfocQEGcQfffRRpVL5yU9+8rd/+7d37typVCrvv//+Rx99dPPmzb/8y7/8/ve//zd/8ze7wGYHEO+O3fGUNZqa94aZj4ZsxuMxJIPht4a4ExKNy+WS1EUtlcB2V+S0YCnevXt3MBhcXFwARUVYgy/N5/P1ej2bzYK2nMvlOp3OxcVFu90GGRMQs+d5lUql8v9v70+aJbmuM210e/R9dyLitJl5EshMtKRA9UapSmRZWQ3KagDZ9wNIDGtwTeIvEPkLJN3Z903EmlyzO/kEmdXg2jWTCXVNJorFBkkCJAhkIpF5+uh79+j9Dp6MhZ0e5yQSPRJnvQZLO4jwcN/uvvd23+9617sKBcgCWCfeC6EzpOKzuBvL26G82oqwwk7P56XN933eC21JBWJeziKfzz/77LNXr16dz+fvvvvuycmJ5JEhCEUoiuEAAlJJDJTKRbbjsC0NltdlXvFF6itv59walgqiL5BcQinfZ28sOlM7Rc5e24TD4Z2dnZ2dnUwm85iArS35hOt5zPvTV8Rl4jNk1ux3QbpQp9MhFT2bzRYKBcrKQdx0Op1Go9FoNOr1eiqV2tjY2N7evnHjxmw2q9Vqp6enttOrGJvajD9KWzoDoiEIo+l0ms/nY7EYPQSu9uTk5OzsjCyhbDabSqWkUhbsm9hh22tOKX1DX0LhgkhZ0vAppeL7PvEPfi4aUjTyMGKEECS2NBgMQqGQ67qQ4CJ04oeEdmzLNpFQIfxptVoHBwdotBl95XJZNJsyybiuK+OFiQVqWIwRJfRlS7GQrz733HPf/e53b9y4kclkON/Dw8Of/exnv/zlL3HIuX79+u7ubrFYXC6XjUbjgw8+wFRhOByul4n/9B3+CZVonxWjIUwo7+Ksz+XCipqVPjYYDMirIFg4Go3S6fTh4WG9Xr969WqpVCJquL62F2GsvWwL6N+ZAwkesKrHsyWZTHKLWVHb+mLmYWri8ejBqxqXavpts9nEK5lZXeTSZIrQkXzfpzdSgM6scpYZnlIFaGdnJxwONxqN9957LxwO46SP7J01P6YT2Wy2WCwyi0qxU2KZEoaEj45EIvDLkipu257Q2nQ6XSgUxKuRyJ9IyWx/CTvVl4sPNy0BoYD47kubmdcW+R9Jn32JJg9PXQRonY+7iJv4FIcwjm/yCVMpmWXPLOdmmTezuJn5Zj42vjFmbMzYmOlqae2vFMRjE/JNPGFyBbORN4mYWSwwlHjILXzKKx0Q6Z/rhXruNfmwRiUk7Mdsxye7mI9xvg5Uh7N/Ii/MtmKUbyVTmzCYvBOKFtg8VqEZaNjjNZIBPwQR/8obsrHsd84l0c6NV9mlzwLlK9cbHKDmJQdf3CQkzHmutbGkmNiFeYX/lQQvpvF1Dwfb2eMi9ei6nYKw9jzgRKpsE8SQv0z1dm6NTO/i6XxuT37EpuPj9GSfG/Go08JFPTPwev/4SdK/QHEvSgvporarhu2WYEc4zl1f2NFE2794vQ9fND2uU89cZFkNBSo0XjQ6HlNtNeCkbNdFMI+qdh4zJ5zbn6Xny8uVjItARcGPM0OZZNKUK6ZUNbG4CSeMSRkTf8gLG98Y1/h9EzZmZ89slE0iYULOx5uu5Z0N+zJeokQsH4/HpU4DRmeRSMQJh50VQf0JiTQhf+dW1zfn/S2hTdk49CnzWz4bfP/734fnNcZ0u93XXnvt3OJyhULhxz/+8WuvvSaf3L59+/XXX3/zzTf39/f/+q//+u///u8v8jVWKEGsUGo4uLA058VI4YkGg0G9Xsf8QaqiIaSNRCK1Wo2XLVkJw1VJnJwDeZ73zjvvmFWRH8rv8IQjPV+Kv5Ow1u/37927d3x8TM0u8pETicTOzk61Wo1EIlBa5K2L8gLJGM7Iwp/aZ2rXquLdGgZNluuxWIw6XayxoZPQRMPoVavVP//zP49Go1hhikiBFzuKKfGajoyLl79EImGMQbks5AuKDxg0+/3YrDSYMCm2oYRZVScQGSAabUR5juPgbiHel/ZboxDZIqnjOmxubu7s7EC4rL8aTiaTwWDAXRMJG6K2c9+Vv2bssL3UCSwPxuPx8fFxqVTa3t6uVqu8308mk0KhgK/uvXv3HMcpl8t/+Id/+Mwzz8xms3/7t39rt9u+72MzigODWRUQl+tGp4JggjlqNpt0HjqSMabX6zEEiKOgHxTAE4mFX4AhEqtxs3IwFIKY91dkmL1eDy9yUuylnzNGCB3RZ6QgHsd1XdcODsESQv8FRIJ2lWek061W6/T09ODgoNFoYHGbzWb39vZyuRykMzXiGD6cGnOUMQbb9MAqkUUshCAfJhKJ559//tvf/vaNGzd833/zzTcPDg7eeuutN9988/T0NJVK5fN50Z9OJpNms4mCWOw1pDN8Jg6Agdrfn2uEw85htJ03WI4ixaU3crtRbdMxuA7RaHRzc7NWq/X7fYIEMreYNb02qyyx0jZr5dRYkHNfJExCP2GfUgvILtrJwlIMiG3LbEhtrB75OYYqxOrE5C4Wi9GFIIilGKmYSEp97Wg0urGxUa1WyRsQjTApAo1Gg6qVhADZvx29M5Y3IpQ3R5eZX2xD7fU502wqlRJPcNsE3F6vSrhCHF3kjtiJIwE3yS+NIIaJuJhf++qIdp8i+TCMUiAl3CbZA+r+T3L3jFkak02Zm9eM+03TrJjF3Hhx01yas4npeWY+MWZm/eev1tgzE5qZZMTsVM21ffONF81W1UBh0RDfN5+gqtaTUFe2MG2dy3uEgY1EnMUiPZ9/6bfyorpej6eQzGNz588VVJ7bVR5T4Ouib9d1keuW4naw51yy1Zzn3PrkjzNzcUm0c7lOeY7YDhvrBcQCjf9YT+fHXLFzrXsDNsSiVrYTQZ7ANMD5xN3OXDB7iPGRTccH+PeLTnad2bcDMzzE5QQnk4nYA9pufvZrg4S35boFck3WvY/XCeLHhEDk0BJOfhKC+NzQlC0gCAh0xEXBPFqm0t5bYAYT6lxktrZLsphN2bYnNtl9kR3K+ZRT2FSr5hsvm1jceEMTihuTWPlLsI+xMSMTdszmprlxwxQKJhL+GOOCMg+9Xq/T6ZyennY6HXzkeNWRAhidTqdYLBaLRbIGo/F4aLlMfmIbQ8TCtqewY8zsQ078kb9961/zsQliLIAfY92bz+dlyyfc5yuvvPK3f/u3YvXw+uuvv/baaxd5B3e73XWNcLfb/dGPfvQP//APxphXX3317/7u7+To0p5zueaP1U6FEsSKrwlHbL8VrVsjoe1CXtfr9TCaECWs5Lul02nYWAR99jObSmgcAl0h6i1mfCrgsaYlrzwaje7s7GSzWd/3B4MBvqJC8UgeLpXiifAPBgO7npU8LMWb2C5ShxiNzew3MFoFh5XJZBzHwfxRiFRYhlAodHZ29otf/GJvb29/f19y4nDDEJ6l1+vhKSHvOmZNXACvHSgcZx6VRQi5gJrYtscSlplloVRk4oEqFgH2itF++ZAgNs3o9XqNRgNaM2AxwY2gnKAU9gnkLX7cvLOvwaiRkTKbzXAeIBaysbEBQT+fz3Evhck9OTlBM1goFHZ3d8XkRPwQzEqBHqiYYZfwJiCBaUkul4O7FBpLiGa7mLhd5kUK0EGQoS+W6nbT6RSd7HA45LeTyQQ5P6/LUuYFYi4UClEOjrFcKBQk1G+/WNNFpevaUlBZt5N3iW3FyckJ/Q3lpqTbQwXyZinjWgxhxW3W5sFFASoEHMMhlUrt7u5evXo1Ho9TOubs7KxWq3U6Hd/3cecolUq5XA5hMqkMgXI3T87JPmGn+rxHkL16t9P6HMfJ5/PZbPbu3buj0ahYLNoDPBwOZzKZfD7fbrcbjQYsJDnFyWSyXC4jLbf7hl1s0F5NiTJLZEGi2OJmicUEviKStyGlO2VKnE6nnU5nPp+XSiUxI6Y7oZQXZYrruoVCAacITCpEsxyNRiGI7Yxjoc4Xi0Wr1bpz5w68zOnp6a9//WvCIe12m+4kTsf5fF7q3eG/ZCdHG0seRbwwlUrh1GFbstile4h54P3NZM4wt+tPyjLYfoohuOYpJlGidT/EL2eupjPQCZ+Aywhkf3+OxrJPf/ySuVEUkfZDStwepaLDJ7uAjjGRsNm/ahIx880XzcQz/tKc9szP75p/+63x7ptFx/jLVVU6IYinxkxNyJhc2fzhH5o//3Pz0stmb9dkMuI4Qns+4Z0NECt25Sv+l3FtG/2f24v8cDjc7YYnE/MxScBP2RXP5Tdts9GAYWvgvjPPSDCJoqME82Sw2xVZL+LHBbbprV0z1vYMZecBp+D1NJqAqasdpRCpQWwFeUzbz6lzDXCNVcNWrH5FCGwzdDIo7AQOiVLzCCDUZ/OzMlJ4pkhpa1FdSKKMpP0FWijHRRQpxlmE7rhZ6XRapmgeghgHyXUwq2wtO/IqOWf2XZC/P425BP3sXDGslH8QgYvt2h/Yif2CFOC1AxYlsnhhG/EAlOnL9mi29y/Pu0CHeUykJEDCXhQ5sF9LApUJA4l3gTFr36ZA/5dntLxQiTTHNk4JWH7JG6y82dKk8XgceG2gp/FWIGoSe4jR3+jVTyglTibNSy+Y8ob59p+a+cw4YWPCK6MJaNOFMXPjGJNMmcqG2dw0keiTznWoQE5PT09OTo6Pjw8ODtrt9nA4FO2FFDoqFAqlUqlarW5tbW1ubqYymehkcmW1XPrYcFeEb3LFBSeMGRjjrArTeSzDVkXqksZMjYH4nnw8owkIYjF8OJft/VgE8V//9V+L4/Abb7zxox/96Fzn4jfeeONv/uZv+ONc7vj111+HIP6Lv/gLmyD+yKYqQawEseKScsT2q1XgESIvVeFwuNVq7e3tlUolY0yj0eDNWzKCpW4vr3283LD8lqUyL1XZbBY3Cdd12Q+VuKBmKpXKfD5vtVqtVgtPCTueDzUgiWy8qbDk5s1J7EftIsW8c8AuSekPsyrYJa+nnG86nY7H46PRSMhraT8Ct8lkcu/ePc/z+v0+b2xS/A0B42AwQB8t++RNKGAAx2pf2IGA1wc/4W+oc5sX4LiQAul0ejKZtNvtfr/f7XaxVbUj6ubRgoTGyrhHQI1/CC8Tsob8MPIai4miUBYPQF4cJZH56ycfvmhFx1WaTqenp6fGmGazWalUXnnllVKpBE0Pbdput3u93rvvvut53vb2djab/f3f//3t7W3yqu7fvw8vKe57skILqAOMMa7rHh8fdzodm5ClXhaWJowLAiHEJ9Ch43wCD4tBNl7Gk8kE24Rer4fjcL/fpxBKsViEWUMtLu4oTAXpdHo4HJ6cnDx48AC2q1AowBWKQ6u4JQpVTZemnwj/NRgMjo+Pu92umCDT5a5evVosFunzDAE4MikOI3SY7NMu7CNae47OSMnlcpubm9vb2y+//PKNGzdc12232ycnJ//+7/9+dHTU7Xbj8fj+/j4sfzabbTQa1GfjW1sDa54gufJjkXFfWJ26AAfB9cQGmpUzL+hMMiwIs9kslCsbYwQMTYyZCfvh7rCkkfWVbYYuCzwJX4lUhxlbZkvmXuwaWGbbVTfpP5Ct+GhT0g0maDabMTPXarVer1epVOiT9tqSrF5KG1E7CB5BJszlctnv9w8ODuhXx8fHrVaLqzQYDFjwC2kSIAvsgnuBSlD0bbgAxpQwoesJpLQnnU5Ho1HXdaHmieHJDbWtPLiDtpmMPMS/EpG8tfo8H9lRz1U9Kzt87uWSGLlYewm7wXNBZsVPjJBjSkWTyZj9a8ZfGt+Yg5rpLcxvD0x4YYy7og8mqxJAKIgXxomYWMTs7ZlvftO89JJJpUw0+slJ4fVOYo8dW94IeyJlUR9zLD8cDrvuuqvskwgszg0NnjurX+THJeSX1KkTtsieOc2a5Nas/JTgHNPpNA/H8XgsgWeb3groVdeZTWPlKIijLv+KIoS5jjdS6F0Rfq5z0MJNixmFtAEaCC2FvN8K/XpuVo3EvCW2zTuDHRoR7li+lXwUkuGoUEfaU4DmFvsjXpUnkwkvVEIQS44LFVwD1Kf4V/C6RT063nx4dKZSKf7lHYlQonDl8lywS6cGTl/Ia5unth+jn2YSsQ9ky3VtgliKKAYsRM7NIPxIBbHshMCwPZB585S3R2OZ0cujPBBRuGgZe1GN0/XxGLDqXi8qe+7Ea3vmXiQUkAiN9O0AQRyIiNiVJANVCuQuC60sXhM2fWxW2VdcTHtN4Tz2WRyNmmrFFItmPrfEtrKh/6EbQyhkolETjZrH9DvbShgZWaPRODw8vH///oMHDw4PDwnkEyGQKQvlWT6f39zcpGpRJpeLT6fVR3P4nhQJY3JWqBM6O2RMfu1D+Vv+NcbEjYl9DHsLoVP39/fPpVbxiHhC1vUf/uEfvv/977P9j370ox//+Mcf+ZOLis4JayzqZrhs2nNRO5UgVoJYoWuMRx7qwoqK8LbZbHY6nVKphHSXxw/OWcLD9vt9CZBKWjEPJ141MplMuVze2tpCZclbVLFYzOfz29vb1MFrtVr37t07PT0dDAZ2AWKOIvm/MLZQ0mgMMZT0fV90AcjTZMnE09R+wZKCD3ZaNAyaVD2yqV5e6U5PT6lHzIsdr4D4/1KMgtdo7IB5w5bXaGFSxDBOeJnA01pkoZLpzMOe3/JSyGtlJBLpdDq1Wm02m7XbbVLjbVlBQPcqCwZJ/Beby/UlDd6vsmIhW1/yqQOKV5sK+XqHVeTv0WjEW87m5ma5XIYFLhaL1Jer1+t37typ1+usYW7dunXjxo1bt27xK5SzSH6EOKPjBXLr4I4Js2P8kk6ns9lsLpcjJIDdCn4IkUgkl8sVCoXJZIKPcK1Ww/s7Go0Wi8XNzU3iChDEyPBR9Mfj8Uwmc+XKFShmUayIShFD7XQ6PZ1OT05OGB10EgbUxsbG1tZWJpMpFAr5fJ6llIj66djkB4zHY0jYfr+P80OhUMjlcuVyGU9nsb8YjUasUTGiYeCTlWbOExtKvS825ribm5t/+qd/euPGjWvXrqVSqaOjo9PT03v37v30pz89PT3N5XI3b968cuUKutTJZHJycvLuu+82m03MN85Ns/jSOd+Pyz4HUkdZ0EqyCJOSLEVw44U0/93vfnd8fIz3NHY0cMRExQhgSMZGYAZgERvgOOzS9tFoFHaD+ZBOIr72gZxfgljiFy/VGnEWIp2FiGav15tMJmwgDwJbhEvNIilSZyw3hsViMRwOm82mMQZDcCkA5XkexkG2+2GgnriYO4uCzzY8kQQOc0ERNnstJ1VMOShsuG0DSlcX0xjhlC+SNX1p+KT1xz7XyktPO2zmws5Bvsgs9VNU9ntIBwimxhQLJhE3IbhgZ6Uanqz0VsuH1JPjm3TalMumkDdO6HOc32T8SgwMVmu90Nkje1gufeKXn/RN4KJWBZLNz222XZSCpyTgNVvSxQI0mT158h5O9hsEMY9I2z5OFMcBQ2r5X3qO+NEHNkY9wFOeQBcvn0AiwYGeaRcsZQ8SS5Nm480lbKmQaBdJQXmFlnoGxImlFgjvDESgMdCX4nVM3XJVhZuWcKa86kjIU0zAJOlE2FKx1ZLT5PZxUBYIkq0IH42WJZPJUCtCRJ1yfeQaBmTj8odNxMOjCbNsJ2994snZvg7iwicBWtwF7SjURSPxosCJzfvbjyfb/MqOXkt/k38DVRMD/VkeuIHBHoiO2LVY1uOmASuJx2TeyHM/UFctsJoO7Cqg87UjH/ZVDVRpWyeI7TnBHuOBx0GgII1tZX5RR4jHTTz+GczMMogYNeTXnp6e3r9///333z88PDw7OxsOhzI/ByTkmUym3+8zxjO5XGI2e9nzPsnTI7TSAgcQfuKff5xRJfzsd77znXU+VwjZc1XAAXz/+9+HHX7jjTf+8i//8iJPCSA7/L3f+71zN7B5Yf64ffv2/grrLLA4Wvyv//W/9EVLCWLF5WKEJYx5bgIa62HolVgs1u/3G41GsVjMZrNSj8IYgz+prMB5IPGWhu0jL0ZwkfF4vFwuF4tFYoZUFmJNu7W1hYVFo9E4OjqCuvJ9v1AowAv7vk+hZAhoiWPzLzJJSFVxopCXCbtQsv1WZ8tjUTRAKFSrVewXUECj05Ti0Z1ORyS3nJqkDyNYcF2XpGZ5WlP+y9Yj81yXZHnRDpiV/k4MB0T+LEpnmDupDZJMJre3t/v9fqfTaTabm5ubyWQykM9l1mL7kqY0n895yzz3HUjefeHIJM1ZiniYNU3lU1fh5xMvyOXm9nq9cDh8fHz80ksvUUGL+maO4+Cr22634/F4pVK5du3a9vY2N/G3v/1trVYTlaXNPNr1SWzNO2wRZJwUtsYjmzFCej6BCgp2kdKFhW40Gu12u6PRiCpbLGMk5CCJ81KAO0DqCQGBeNMY43keB5WzaDQa3W43m82Wy2VcCNCHChMH58vKrd1ud7tdnL4zmUy1Wi0Wi1De4p5hjBGL8OFwyH5oodiw2mXWgSwtZCBUq9UXX3zx5s2bKKCPj4+Pjo4ePHhAib98Pk8qQyaTCYVCrVarVqs1Go3BYCC1757evi1ZC/YItZPTjWXAJxP4bDbLZrO7u7u+7zebTWpywvUzFbNAZSUgltCyugusiKQl3FPhRDguNdxxDbJdSoSwZrEhnj/iO880i3M9FLPUMBT5mES/bEtWe/ViF3hhS6FcCfXRTrMS5CLblz2YlbpKzlqCkdJ48Syyl5cywO07ImQWjINNLtMqe7Fnl7njJpLIHKAFbXvNL7EXfuYhOoU94gK3OGAjZlee+AyOu1KSLZfGXxh/8VBo5oRNKGYcvlsYf/5QaBaJmNDnXOpnnVML4DEF4p68cwbqOX9kaPBJrGyZCSWcySNY/GECcssA1SUeBRKyomKHZNpx62WmPVdfaU/dgYpekhcv8lWidCIflgp1gfeisAV5WEireOekPocIDoxlUn9RbS5mRc/zRqORuAPJdEeeE8WiqaPgeR6XTmzouFzIeHmQ2a8KPMsgoG3PFjzBmOSJlAe4SIhpUlJoGE86DodZFrlW6XSa4wYcYx/DtwaseM2qygshQ4l6fuLCiSYUch4VJtteELx20iHFa8tcXNHuMQeys17W+UQ8PexpzV7yBOqpyGZ2XMEWy9vEsV1WUUjSc90nzMVeNOvhKHviDbgzn8M0rp27TeayALQnKymxwPrLLjlgLO8X25TGpp7lNUxe/2wflc877MqtoRgdfWY6nTabTZwlWOP3ej3Oy+a4oREwy2IJMB6Pk5lMcj73PC/9lX/9fv3113GE+N73vrdOEEP4PgnrWigU2M/t27c/kh2WQ7/66qvf+c53CoXC+vavvvpqgML+p3/6Jz78/ve//8Mf/jCw/fe+970A9axQglhxSZcZ9h/2k5jJHZPQ4XCImyrTPYJE3Dx5N0KOyvqclypjDCwqIkGqbPF6Jya/vD9FIhHXdWu12tnZGaJCspjZGBZJrCQhCyioxVTY7/cpDobHBS8WQh8LuwqFzUshj2TeNqB0h8NhKpXa2NiYTqeDwaDdbss1wU9ZbE9FrxGg9rgyaDx5HbEzBANJhbJaE1GY/ZbDY5Inveu64mLGD0UFHIvFyuUyFpkU7Mrn80IZ2O/6UnHCZn55EpPKLYy/nA5CDHkpDISgbWr46y0cDoyUQFie+oTvvfdesVjc3d2tVCrFYrFarSaTSd7tMCt46623JpPJ/v5+sViczWblcnlnZ6der/f7fVtwhHEYL3ysMbj+rEyEcWMdUqvVSqVSqVSCsTXGDAaDbreLechwOJSwDYat0+m0Xq/zts0gIpmrWCzSzUQ5wgoEnbskwTEJxGKxSqUyGAxwg6Vnsv/xeHxyciKcL/MDek8Wcrzj0n8KhcL29rZYxNK9sVeGpBMXFxTH+AXD2Mr6ihO0F+GcHcmh6XQa0vnFF1/c3t6Ox+Pdbvd3v/vdu+++W6vV2u12pVLZ2dnZ29vb2dnB+qbb7f72t7+9e/fuYDCwjaGfUrvt9So3YvoBHzFfVWeyCQJmTn6C/p1lLVQs3sSIVcWrx9a2iB8I85XNdLA9P+HySgCPrxCPS8otkxUuEEITc9OHw2G5XI7H4+jle70elRWpoNjpdDqdDuNCjA7lt71ejyiFjClbWBSw8JMacZLwYbMtPBf6/T40N8dCl02KieTTSM1G51HFVoBAFw9NHqA00hYTBSYiWXxCl2SzWcnwCHAQn0lZxS+gx9oF2den34uymB+3pA/4vZ5LWDuOY4wTCsm9ecIHwSd+gnwyDtSmw2bT6Xg8HgyHeCk8tIGC7ln1lofR9MVisRIbfgbsgG/ckRn0zbBnZn1jRsaETCRrSlumUjKJmPGXxkzMcmzCYXPlqtncNJGw8ZfGCX+W/UTsrYTMms9mvu8vff9hPvxs9qGCeI3jfnhNw+HldLpYLEKfw6vCk9DNwoxMp9PJeDyZTKaTyWw6DTmO5GTYE/J6lNoxJhIOR5l8plNCZb7vLxeLyXQaEEkIbWQPsQ936/uL+XzKJ8bIU1hS/s1KUCySiw9dDhyHBj3koWKxeCwWWbHJNqkaWVljR1Zc1bmP18Uqkf6hysGY6WQyHo9dz3NHo4fyYb71fWeVq4TfWq/X6/d6ructl0vGQigcxnEon88Tvebdg7N2QiHf9+ezmTceU+PUc93xfL6Yz80qQolq5OGzKRQyFr0u0u/5fL6Yz50VZUktFpK6isViKpmMJxIxznpNL2ybDtvv4czwkXA4vFIKI3DJZDLpdDqZSKwruD/eOAqFwqv7yGP34XIJsbAx4XB4tlKuPLzaF5tZnztOJVQQj8dj0Wh4tSILSOwdY+azGTVaZrNZeOW2HI/H/eVyuWpbOBKxMyNDQp4a40QiS7vAWCjkh0KOMaHV4iUiDLjjSIcLDoRHT0AeIo8QxHYYY7lc+v6CarfWxvzAVvtyRpwte3CMCZO8FQoxBpa8gK2qrIsf8Xw+Z4iJqbHIpOwni11nXmhr8a02qyp5n2uc9eFLUa/XareRoUwnk0azef/+/aOjo3q9Puj3WTvYtawXiwXO4rP5nHeq5WIxGo0isVhysfA8L/2Vf9++f//+G2+88Z3vfOc73/nOq6+++vrrr8tX+/v7f/VXf8U2NndcKBRw++12u7dv3xYqGc3vE7LDxpj/8T/+x6uvvgqz/NprrwXoZhyKu92uHBouu1Ao/NVf/dWPf/xjW0QM0WyMCXyuUIJY8fXHuQZMdh0AeX7AIUYikV6v12w2IQKEK8zlcuj7cBNmVcxrBA8tdIuitYQLIwGWFxE0aMPhkLB/u90ejUbpdLpUKpXLZWPMe++9hwoAjRipXq7rQhnYUWLeKliWy0KavDB4W3lRlkZCkSAfxkEf4juXy6GVlhimMcYu/jMajSSULaoKluiIneEdAqtcCQjbBd9sY2IRx5mVtwYvZBRf4iKINbMUuI9Go/l8ngsyGAxarVahUCgUCmwAZWYT02blDABtBxuIoDuTyditRYhna1Vsw7hApP3ylKqzBxH3zvO8o6MjY0yxWNzZ2Xn++edv3LgRj8f39vbokLVabTQa/eY3vzk5OcF0u1KppFKpg4OD+/fvi1xFAhgiKJBcM9uUU4xWWO/h5SK5irxbm9U6TZZnosQUwS+yo83NzWvXri0Wi3a7PZlMxCYvlUqRiS+Cjk6nY4zZ2NjI5XK7u7v4j+MtXigUotFos9kkc58RCkEmDLJZqYdYbeJgLg56MihsUUa/3z88PGw2mzLq17kku/a3OMn6vp9Op6vVaqlUunnz5vXr1+fz+cnJydnZ2S9/+cujoyOmpuvXrxeLRRj2s7Oz4+NjjEHOzs7EvDKg5Xnquvq6nyMc7txee6/kMExl6XRa8hONMWhmmdlECWUrVW0n90C5bVvAKIobVnlwxBKsoiX0WFsPBXUC8yu3mLABy/VUKlUulymmR8Sr1+udnZ1VKhVjDLkpaFWQXE0mk3q93mq1MCAWqbIIi6IWqYFmn0NjqcSgkFxsRH+u67Iki0Qiw+GQIWmMIUDCznlG2MkB6+kXdhCOgQxBL5fUXpPKskrIaNd1ZaCZC4xQv/je68diJhy+gGm0mme387xh5q/9JNjVVymhKw2rWa4KmD/cg+MscBU4TzUWchwSUuXfc0nD5aP2jM4FLfTXPvTX2mmfuGNt4zx6QWQ/M2NmjjNfLuEdxvP5cDzuDAaT8VgcsUJ0YylwtFwmHSfpOMlIJBGNJh0n+jE8FS+80POImThmODPziTFTYyImkTU3XzJ//C1TLJrlwvhz409NyDHFDXPjmyZV+vRHDfbkEAF4Y5ah0GS59KbTyWq2mS2Xo+XSWy6nFKmzXlY+pIQYR4tFdDqdLZeRx46LxWM7XoD9P19cfMGZ8NV8uRwuFpHFIrZYRBeLsDEz33/YmR1nEQpNIpFpJDKLRmfR6HyxcEIhEwqZ5dLMZonZLLRYpEMhE4+HslmJS00mk/lwOJ1OJ+HwLBabLZfTxWI6ny8Xi4fdjHaGQiYUcsJhE40uHWe8WDjEccPhaCiUchwnEnGiUT8aDUHJRaOzWGwej89jsVksForFwvF4OBZzIhEucigcjsRi8Xg8mUrFLEOKSDjs8LCGlAyHHWMW1lB0ArWyHWe6XI4to4PpbDaezdzp1J3NvPl8vHKff+gjt1iMPa81GnVdt+d5o+nUwzzEcaLRaCqRCOdyiUIhVSqly+VUNhugVv3lcrZYmMnETyYn4fAsGg257hInK2N4Xi5nM384DK1KbvpiZrJY+Kscu4e8cyjkOE4ykUjl8+lCIZ3PJ3K5SCwWikZNJAJr6a964HK59JfLhZWzZRdwdHj5XhlK8BCMxWLpXC6Zz0dTqbBNEGMHE36iUAz2MMtQaBIOTyOReSy2iMf9cHjpOMtweOY4znJpHCfi+8ZxluHw3PfH4bAXCs1DoVg4PIlEZtGoE43OjJlGIvw3Doc9x/GMWTAWQqEQPGA87ieToXQ6mkwmVifiy3BeLY6Wy+XUcRbGhBaLEDJ234+Fw/FQKOY4EceJhsMxxwk/GvMOGTMzJmJMxJiQ70tB1JAxEWPCjhM2Juz7bMDcbh7VZYssP+w4ZkXfG2uGD6QaOKvuaheP4c2VzZar13fJAOC55lvs8MO3o+XS4b9V1zeLhVksnNmMd6llKDRftdIYE3acZThsQiETiTjh8HIVngnUcgyFw34kEopGwyIwj0SW8biJRMznnIXjO87YcfqLRdN1e73edD6fjsfNbvdsMGiMRt3pdLRc+uFwKBwmwcQJhej/i1BoGQ4v53N/uVw4zmw6Hfb7JhRKLRaTlZThK47XXnvtzTffLBQK//iP/4hxcLfbffXVV2FjjTE/+MEP7O1feeWVf/mXfzHGvPHGG9/97nf58C/+4i/4g8pyj4H85PXXX4eb/v73v7+/v//3f//3r7/+eqFQePXVV//mb/4Ga4sf/OAHQjd3u93XXnvtH//xHwuFwptvvvmDH/yA7b///e8Lm/yjH/1I6TIliBWXFOtiHFvMyOKcRXij0QiFQoPBAItVDCgR0lJyAY51Op1iJDocDuGbSCJzHAeBMN5hnudBaUlBLTJQFosFGfpbW1u5XO7g4GCxgkiryKBnJ6QAY2RxcnJCoJX3M8Ro4p+LCBcbUxhkpL54LIjDL2Q05YBgB4iFit8xDPVoNJKcO/gpeIrBYDAYDEjhD9TXFlZabH8fxoRX9BaUmTirimJOStsjzEReynFhk0OhUCaTwUYWreV0Os3n87gwy6uJHWeORCLFYhGPJ9/3EZBK8SjpCZCJiURCfJMlJTAgY7kk7PBFgDN68ODB8fHx4eFhp9MZjUbYLFy7di2dTtdqtZOTk8PDw9/85jfz+fyFF1744z/+42vXrlGN7d69e5BKxioXA/uzLmI1qwoVEHC9Xm+xWDAEuDWxWCyfz1erVbHqhqKlz0OKCe+MiLhSqRAmYWCWSiXMFobDIRECdiVRilwuVyqVKPYlI4juQcebz+fJZLJcLhNWwSjczuwTMtE8qhnEZ6DT6VAhs9vt1mq1wWDANSGeJG6AQudJnXEINd/3U6nU1atXX3jhhUqlcvXqVcdx3n///VarBQvMWC6VSvv7+yQH1Ov1t956C09khKjmyZKIn7rZ3jY9kHxVO5GZm8icxjRYKBSazSYJDalUCu0wxkFmpTcPVN8OZHrKZChJhXaipchkxPbBVgoj3UKfZSyj/OFw2O12Y7EYZSGz2WwikaCiILHGs7Mz3/fJC2G8oIAej8etVov6J+KwYSeiYo4k/4sdCh8iM0drj/KFPEpmgE6ng65Hnj7FYlGilVII1E7lXq9WT7aNVJjEm8WslRm0izLB3WcyGXJ3zFquw2fbaT8e0ez74VYrdHho0un13vhQzHtuVq9s8OivLjoZqAJ/xbgtfX+xXC6WS+jUDz8kc1ykXo9S8yj1IqGQHwpFWFRbTMGHPXl1uIeMjMSQbFmZ/cnq34e0heMsHSe0YjE+TBw+l0ZcXRFeJmbz+XQ2g08Zj8fj4XDc6UwmEx+pvlVoi1NahsNOPO4kk04qFUomY8nkpy1pZYwxJlY3pba5NjbTpRkbE3HMbtL8WcV89xlTKZvlwvi+8Re+MSaeMOWIybUdZ/CZxr3sp+90uvS8hevOPI/rvJjNfM8z47GZTgMd6RFjV9/3Hccfjcxo5Dz2QHFjSsZcebIO/7jWXkAch4yJzWbZ8bg0HBai0cKqSIYd0ktMJonFouA403DYh0Ebj+O+n4tGs76fnU4j4XBhsVgsl77vL5ZLbzYbTKeD6XQym00Xi+lyOTFm7DjzwBPB9x9qSI1xFgsHSp0H7nKZCodTkUjccSK+z4Qe9v2U5xWHw7TvJ6ZTqtmSbCH5/jw4krNZLBqNxGKxlYUxBPGHQ17ChzZB7DgOL67z+XwycVzXzOfG981y6cznockkMh5Hx+PleGwmk9BKRWGMCS2XS89L9XqLfj/kuin8snw/HA7HHSe9XBZ8v+D7+cWiNJ0mPS86n0NSfyjgWC55hUjP58Plcuz7M983fE7Zw8lktnr9QKvOkIz4PuuLdDqdj8fjxvCKHPf9zGKRnU4zrpsikorT3WreWNpzOhSh40gew8PpIhTiIku9BycUikYi6cUiNZk8LB4o02YoZGo147pPSDGUjNnz/fRyWVgssrNZcjq1y64+3CwSSft+Et2P50Wn0/l8nh2PK4NBKRqNxmKz+TzuuvHRKOp5kckkulgMfX/h+47vx5bL1HKZWixSi0V6uUwvFinfTzlODNPn1Qn6vj83hgDGYrEQde1DyXk0Go3Qj6IxNMiPrkFCoVA4EiEPSOh7Z/Vkf/hwt+TDHxah4ykfCvEO+qEBhbyfrCbhhyEli1m2LS1Yzck7rb8KHiyXS2GN7eDfwyfCo2U2Hw523/dXFurSt+07Eg6HY6s3/mg8HolGJWvkw6ekMeFQKByPhxOJcDL5UHjOswDHn89VQbxc+sPh8uxseXq67HYXs9lyOg31eqlardTvO543ZZnjOOH5PIx+fxUjWRizcJyl4yx935nNzGy28P3EYhFhEvjK4/79+z/4wQ8gdv/mb/4GslXw4x//2JYVXwQ0xcbyAn4S/OVf/uW//Mu/vPLKK0iYA9/+3d/9XcD14vXXX//xj3+MWvkf/uEfAmT0D37wA5UPK0GsuIy8cKAe3blrP3HXCofDo9EIVR0PaZ5SqL1yuRwUMGWCUDa1Wi34HXLVYWNFtEXWiXjpSmI7wjSyhmFFJ6vSpWTd8sh0Xbfdbi8Wi3K5TC2seDx+dnYmFe1QLIp3FTQri3ZRWbK0lvdvQBJZOp2GvBZ6WpRcOPyKxaTUHYaqjkajkNdi+ilcjBAxYkBhVllCxrKWE1tkISCkOoddp15Kh5Gng1qNC97r9bD1QOK3WL3u23c2HA7ncjmYlOl0ynun2H7Z3E0ymSwWi1R/4l5w1+zl+qWiiddLAMvlldrZED1Xr15NJBKbm5uYG9A3Dg8Pa7VaPp9fLBb5fD4UCvX7/dPTUxSIko8vXcK+wranmNBDlJEUq8HlcplMJnO5HCYAuOlx14wxKN/XORZ8YDOZjFgbo+6k94pQUTLayJ3kZVoYZ+yPRZgsjgTJZLJQKMAqSqlJ8VYz1ks8EZput3v//n0k7dDEdtHqQDEQSV1E78+e6bc7Ozs3b97c2NhIp9N4n9VqtVar5fv+9vY21hPVajUej/d6vUaj8f777x8fH9tFM869+1+DTi5uD+ZRU1fR8KZSKdznCQghgxXb30CJc9v87hFyyhLXSJxM7Bdk2rdzacWCE2WulSY+sydSYwwMtRSmI3LGvBRIB2biolcwQBD8IsO3ff1kLNjGlORh4LQjdfwkdIdZP48GihSZVXnP2WyG0Up0VdtLvCzstIBAcoAoiCORiOd5g8GA56/t0xdw5+QuQF7bpFJgjvrM++2TjoXFIvt//9/h27dDsdg6iebIHlZLengTNFaO7zvrQY7HEsSiPg7BKC2X4UcttFiI+oHXHqvLPmIWaa26hQh2fD8sj9SVHOzD0/F92m/zknaEL1Cy6cO/HeeR87WJaa6J70fm8+RiEV8RKKn5PDebbUwmIqJ8mOZvXUyZXSFZotFoCPXZpyAIHN+UR+Y/nJkrh6Y1MDPfhBemWDN7/26uHJtk0vjLD98rQ44JR00kbJyQ81naEK+uVXi5TMzn4dksNZ/PViSCFKkTQZ/NxtrhB9+Y0Hyef/BgtgoknEvg7hvz//D90adIzHYukhXTK5bLqOfF5vPYcBir1xOxWIj6acJoL5eT2Wy6KhIgPwyFQolWK76iDu3ONp/NKHi3XCwexktWz3S7c6JcCM1mwt5KR42Ew5HBQLJ8RGgfXtnviNGwHRGEioqsbNMDnjz2isM3j2buS79d0WdzbqLvm5Vq3j6Lhw+F1bfynsxTZrka6Uy8WF7EV8xagAe0ok8+qe6z+XzBoY2BCBa5STBi5/uOlbAlXDmTSTQSicZikUgEAfWHA18sDmRy4DqsvWEax4lYns7yqOW158NbwwQVCplu17zzzkcPIGPyvv9/LBaveF5yPo95XrTVOtetAj6adZOs8qL1evr0NBGPh8Jhie/yBJeUOMdxQrNZ1PPoRdGVr0igqp7jOMzM8pT/0Hl5NT8GfITFz8QO8Zl18fVKrv5wJ8Y48n6yet4zbT50qICdX4sLXqSpCllU/iMsr3C+qxjAuQPf/jdwjMCzPvDkXfdTXpd52c4eD4ORqwvo8JLwOXHEvh9aLtOTyc5olB+NptMpL38oq1zXnU4mi7XCIRfZx3Otwsvl7nw+f4I0jmCs7r33zD//86c6neNjM51+rF/8+Mc/vn379t/+7d/aLC3E8To73O128fkVfwk2/gTkbLfb/da3vvXDH/7we9/7HpJhcPv27R/96EfnEtOvvfbaP/3TP/3t3/6tvf0bb7zxgx/8wG6PQglixaXjiAM1NOznnxQ+ltxhksdZi8rbofiRQQRjswBJlMlkxGtYKAb4UxwYSIWDL+atDm0ggt/RaFSv10XkKx67vKWxXEdQDH2Athc6LBaLwT3BeCJShpgwxkAiwyKZlccl249Go6OjI2oQwZFJsSDayU94T4IgIB+ZRPtyuTyZTAaDQa/XE0bMrCSfwrKJHyVqO8mp99eSnkRojJKUMw2YV0hRPkgTFNaQ6ZLLvF5Wm/czqHZqi3HRhBzBJfbatWto8ebzOR6X66n3doj7a88R25c9UBRIKN12u/3OO+80Go3pdPrKK69sbW1tb28nEgmuXqFQmE6n77777mKxQCz/7LPP4otK5qC4iDC+OJBQpbZdHb3L8zw4L8lAxMWbAAlGdVRZGQwGmF2Iq2A4HO71eicnJ7QKftCIpePK+8x13cFgIM1LJBKo7OHOqB1HtxcLi8lkQkVHwiGwZiJ7Zyyw2MA+ot/vM64piYkvtqhcxaxWBJiyOuKayxC+devW5ubm1tbWtWvXEokEpDx1k13XjcVi169f39/fR+nseV673T4+Pn7nnXfq9Tozw7ls2udBsX3x/dY2l3/oejmZiKGBXQ8nYCwjnY0bJ/4SzqOJjXRa9iMzHnQtcxel5Akw2A6/s9mM5BIpPcecKf4JEsAjYpFKpTCRpOViY4ICdzabdTqdk5MTfPMxS8F1JJvN8ibNrmTntvmybeYQDodx3uepxFNG5m2z0g0ZK0uDa8J1s9fAkBfMrrYpR9hKBxZfDk4Tvwg7WGgXdbFJ53O9iT+nfvuEOxwbMzJmuVwmfvpT89OfmidJ0v9Ilu28RftFW4afuFb5x2qS89gNnM+6GJttTBH5jFYFn75DpI25Zcwt+f+5MXVj6sbc/hwPetGNjhoT/dT7aRozPu/zujETYzaM+T/Mp6i1+JE/XC7NdGqmUzMa6fJE8elH9NyY2WMn57oxzxrzp8vln2rH0w7zWc/JCWMSxmx8prs9NWbysX6wWJj/8/80/9f/9Slfd8zHL7Fz+/bt7373u+Iv/BjCly0DH65/8uT44Q9/+MMf/nB/fx/O9/bt2493MX799ddff/31J99eoQSx4vKyxvwdKCvMUpbqwLlcDsoAy1q4XVnDw4FGo9FCoUAG+nw+x0EY0gcKiUUvtomNRoMlPcSW1DxttVqQsFAJkEd2UdfhcIhrsFRGxiNC2EyIA1b1lHSTcvO2rgGWijJE+AOwNygJGiz1kdkeIZjI1rgafNhsNuv1OgLnYrFojMEgQqTBwgLYkjRbIMllhzSxtWawYLGVFEvYAXgZcv/5Va1Wk51za9i5kMXc6OFweHR0FI1Gx+Px9vZ2Pp+3S34nEolisVgsFnGu4GJCyqxXxF7XKV+GkWKz5HI1xuMx1efgkl544YVyuZxOp59//vlMJnN6enp2dtZut3/9618Xi0Wkvjs7O7FYDFtV4YnYJ3eQUAQfCnXLrbeDB/F4nAEiNc3z+Xw+n8/lcmyfy+UIt0h1iEgkglZXxAh0M8/zaA9/LxYLaO50Ok0FcGkPg5QwCZn19CJJqCeuwxDGoZgGQxdSarLVaolvhoh0pK6x1A2z3YqFOObDRCJRqVT+/M///MqVK9lsFvfYdrt99+7dZrM5m83S6fTm5uatW7dI/O/1eu+8806z2azVaoeHh6Q1XMSFPdVdOlAKxlawEgkThtQe1HxLMdJMJoMVe0BLbtfhNJbk9sNcS9+H+Z2swByYTqcLhQI/p4MR1hI+mgic1BTlcHQYOiGGP1I3KZlMIqFlpm00GphLMIPRD6lfH4lECF2QQYLKWHzzhSCWckCQ0f1+n8cEfLcMFpnJE4kEUzTPAlJbIIKZeJHPQzoTPjSr4B87Eb0P9wIr8F6vJ5E5jGL8NW+E1WpoEXA3tjf7gvuwb8yZMf9vY+4YE/mcl6MKxafHwJh/O+/z/48xfWNyeoEUTxUmxvz/jJlfMDkfGPP/NGbXmLBOzoqnBF1j/vWxYY9z8KWWTxd18BePj6tB/mSaZYUSxIqvLcllrx5t+kDkY+IWykJ9uVy2Wq10Os1yPZlMisqPukYQCsYYSIfhcIhHKpIxISBIRYdqdF230+nMZjP0fSiF2+12rVbr9/vsSmwNyF2C1YIRg8yCceCgfIICS4wjU6mUWSUm+6tCrkJkQBYgkPQ8DxYY3wx0jvxBC6kMjvcxBDELcv6XJP2Tk5OjoyN4c0gESG3aAKsOB8FVFWpMmkdlOTlfgOIPWmRdRxyPx7GDGI1G9+/fD4fD+XweAamUvDOPijHRV2IREIvFNjc3bRIBWfTGxkar1YLiQT2KUi9QE2y98uElGT7rqfpm5Yhy//79yWTSaDR2d3dv3ry5u7v73HPPbW5unp2d3bt3r9vtQhZjWi3ODFIaEWKIOys5ZdKFRGkomm5hmoyVgdhutyH6Ifez2SyRDBER4yKSz+fpitIPJa+fHpjNZnO5HGwXfCsbQC6LswR+r5JvSFfHRJhwS6/XG41GKEylTPN4PEY9ahdvlJbY5KMk6YtlNhwcnf/FF1/85je/WSgUFovFycnJ6elpo9FoNBrJZHJ/f79QKGBK0+12u93uycnJr371q2azORqNYMBt/ax5+lXDj++9kpYo1ucCcYrg1uMQUq/XxXVEkm1tullIVanZIjpx0k5RmnPXpGQczg+TyYQoGjdUyrLJfReFvqSnyCwkpYFwxqdtnU6n3W7HYjHSU6LRKHR2r9eLRqP9fh/dPfOeTQ2bVU6GVGTFdMV1XaZQKW1q27WLZJgBAlsdqLZnP15ttbXNp9vGMpwmoRSOe+59tCOIxnIrshnkL6Unt4z5/xrzr5+1olah+DywMOZc39b/bczbuhhTPG1YGjO6mCCuG/P/Miamk7PiaXllXU3RC70WCoW+kyi+MJJr3R2MpTgrfNacpLsOh8PRaATZBLOJPAqymKp0LFOpZ+W6LmSZ5L9DViJHNcZQVwdygfzfVqv14MEDmGWRX7HYxnKXY8EOoENE5oZpg+iLRWwYjUZTqRRMBFrjSCQCicyH+FRAOmAfAbfLlrQN7bPrupTzymazOCYLmYJkEqLNdd16vd5utzmuOFFwIsK8QHwjrhRBH1QI11CykiGFuXSis+MnovLmHuHsUavV4IWh121DKzEfgKlvNpvcx0KhsLe3l8vlxEAtGo2WSqWrV6+Sr93tdpGw4bY8mUwCCeaO41zCsWMjQNmPx+Ojo6NOp/PBBx/0er1IJPLMM8/kcjkucqvVajQaJycnJycns9kM29zr16/j54CiFtZMUtrpvYji7aR1SZAXW1jGLEOSmAG6xUKhgAAzlUrl8/l4PJ5Opzc2NpAY4xVuVlXy6CdSH7LT6UBbN5vNRqPR7/elH0YikVwuhwELvRTFvdBhdiEyhqFIlSVuJGJ8kQ+blUMxh6AzM+qRakLeGWOSyeSNGzdeeumlTCYzmUx6vd79+/fff/99bAFu3rx569atbDbrOM7BwcGvfvWr4+NjtMMi0v8as8MB54GAmvjDsi2Ws4Q4URDzozOLobDAVnzLNC626dIhpT6bXGEhhZmKpRqnWRnySD+xew59gImafQrwvE4mk4RVJLQ5GAyk4qgxhoEAYY3ZBbuSs+AQiJEfvodFIvwv/VkCM2SlSNTNGMN8Ds1tR/vYiTzC4HyNMfDj/ETsg2Sw0LZUKtXv9223PmNx2bbLPMMnYBslgZYv3v9nbkzfmL6+ZimeZoyM0dx7xdcMM2PaehUUCoXi6YQSxIovjUSwhXuSSAtXRc10KrlBs7KithOExT/BcRxYJ5H+SSYsNAEMMit88oJrtRq0FxwljCQ6r/l8ns/nKfIOlQBtkUwmKUmPU6rdcruelc3iSVm56XTa6/VYQou3MtyByMSkOoRUqE+lUvhmyCIczpdlf7lcxj1jMBjAYXE9YZztVG7h38U6wNaCcdZSTw8d3GQyEabMWFWe4AhIBu/3+61WC+Gn6O9EEg7xh6VGu92GzkNnWigUpNoJlP329na9Xn/33XfhcYwxEDHuqlCyuPFKlrq5NDriddC7hGvDpXc+nx8eHu7u7pZKpUqlkk6nt7e3STN3XbfX60Fp4R8Ce2uMcV0X4Tb0GdERum6gb0ssRJohaeYEJIR0I2yDXl5qJNLhGd30fHbIyIXqwrcEsW2j0ajX64PBAAKL7T3PQ0QsFSCFgxNdpFnJM+2qFCIplePKEDCWW6s4njPWmEYoBbaxsVEqlQhvYIvRarVw+fB9v1QqVavVUqkUi8X6/f7R0dH9+/fPzs7Qltq37OvXaekhkjEQMBpmMkmn08hjZWaA9KfOW7/fR/lLCI1EDbskUeBYwudSZpCnALUKI5EIrvQSfcSuodfrYWLDUWgnBLFoijkEWmbxGpaKo8TYisViqVTCsYTIimhviQ2IXzAPDjoPDt0iIo6uKqSTbsKzKZPJ0JcmVkEwidBQR44+SRYLVvgk1uRyOQ4h3LrU4qN7S2hEfLSJf/Boo06gWcVsZKYVQycqpkoCzfLRnEqblL/kM7NCoVAoFAqFQvFUQwlixRfNbRlLWSY0E6tx3FGj0Wiz2UylUpS98jwvHo+Xy2VbriuFjDCRGI1GqE0lmRep73g8hvE0q6Tmfr8PXwzZWiwW7fRnx3GQGPf7/VAohFQWKlNWy1LVl6xzuAyqYOG+KotkdoseLZ/Pj0YjHCpJYSYTWeyPhdWCjIZDYeku4izoMDiXSCSSz+eNMdhlTKdT9LxmpYiU4mOIfFn5i7es1CjDuAO6AVIDTgQuHhMMoZVhGSDuOQV0xOVymXaK0zHnlU6nW61Ws9k8ODgYDofdbjccDu/s7OAkILwSxffC4TAFxzAkTafT4mQf8Cr5GifmPwkZJ3+LrBtzkrt3787n83q9vr+/Xy6Xq9VqoVAolUrlcvnq1atnZ2fNZnM4HN67d+/atWvxeHxzcxNTXRg6qC52Pp/PcV+xy0jaqeVSNUs8GYS8o1Ak7hbk+IvX6sOi29EosQfGCBEgmGLqekHqMRjpxrKBEJFSgxE2TQp2oeund2FHK0URpc3MIWZFJQd8h4Ugo+X5fP6ZZ5555ZVXcrnccrms1WoHBwewjaFQaG9vD3/nbDZ7dnbW7XaPj49/8pOfnJycQHwHCFNjacC/Tn3YrgrN/eLWkI6QTqchgqmCKJMeUzRuP2ROwHJC04vXsG0JArtKt6F6IU8BiM5CoRCJRJjNyMNIp9N0J2zQ0adLN2ZaY6IjzCYiWRhSSWKgm9EfeHZgJQ/dLJwpvReHejoAZ5FMJmHG6f9C+4qemogg3ZLNeKbY6R2DwWA4HGJez8ZcHKKn0WgUVxY+kVidOHUw4dspO5PJpNvtEtSxY7T2TMvTmTavbyDDSgjlJ+zV9lhTKBQKhUKhUCgUXwUoQaz44nCugM4Wuso6tt1ux+Nx/EbH43E+n7drSYlUjYWrMUZScW0FK66joVBIBJKSNo6ei4Ja4XCY6kAIfhOJRL/f73Q62WwWVS9rYLKPSeOVQj1CobJ/YyXOo45EsJlMJjOZDEQtylxjDCpdcpOpYoSqzlgOsOLLbIzBmBICYjQaIQKlOhOnKfpHTlDSiuHIhD6zTZ/hoJGV8QkXWepEQc+JHygXRNgHpJTtdpvLxVkIeScsz3w+HwwG9Xo9Eok0Gg14E+GVpBkw4PDjwryb8+hgVaitYz6f93q9u3fvdrvdBw8e3Lx58z/8h/+ArJVKhkgs8T2YTCb5fL5ard64cSMajY5GIySWg8EAerfdbmPjS0cKaPzF6prOJuEWKDlUw2jthcWWoWFW5sUyTOjSuK+KbJn4B1EH/LulcBmdULoWA5l9ypRiVqnxQmEH6m6JcwvxHtuyQESg+Xy+VCo9//zz3/zmN8vl8ng8Pjk5uXPnzvHxMfXo9vf3qVaXz+cbjcZvfvObg4ODWq32wQcfoNM0a7GNr6uPNvygXW5U7pddrU44enF2pjBpu90m6MXEmEqlJH7AxhKiEFkx3zJvM+PhSsRXGPjgZg5zyqERw0pgQLouhu/4C2McLG3GrYiDYpfMfMWzgGYTCGGWlueFWAxxEdiGoKCE6/ibB4Gkp4gbvjzCGGichXDQUrzODs/IbMlOhKkXhh3Cmqs6n8+Hw6EUAzRrllC26J7HmVmrKGD3AZ2ZFQqFQqFQKBSKpxdKECu+IPrArkRvUwnCDksmO1Li4+PjxWJRrVaFo0TkKAwRP4RMFMdJmCPybaXCFVI12iD8aTabLRaLOzs7vV6vXq/3ej0sjLGDmEwmW1tb5XI5kUhQXYrse+TGciJS14s1vPBQcB8QBLYBhRAcYi4BO5BMJiHFyC9Op9OYA0haus2zeJ7X7XZ932ebdDotThowF2ZFEMMjAByKodtsrR/ZzbhVSM09YwxVkjhr8QMVUw4hNVzXbbVaBwcHlUqlWq1Kg4UgNsZgrJlIJKbTaavVQt8XIBrw0+AmckFgdiTlWWHDNhIVZS6l2Gq1WrfbnUwmOzs7WDxjAYw1KhUaT05O2u22MQahMVJEvB3G43Gz2bx3755YmogPuFSrE89rqRVGCjzSxXg8DjvGEDCPCo3RfmJAISpR9m8XRYzFYnB24lwBpQUfJ9wiEwL7ET21dG/x45ZIgzRGwg8A7hIBJj/MZrPVanVvb+/555/f2dk5Ojo6WcFxnFwut729/eyzz+7s7CD2PDo6euutt46OjsbjsRjUXjQZfi07pIT6hKCXcJRMU8TqJI+BSQnvaYITFJrDWkciE/ZFE3IzkUjkcjmci+FMmUKTyST9VqYRpn3SFAaDARbYHBpxMV4QElzkuDC50icZaEiSCTq2Wq3BYIBK3S7hCITUBsxsDJCACbVdTG82m/E3gRb5LaFNCorieswnZHWIMYV51IRHnlAMLhkdPJUYwoyp6XQKKW8sLbD97Ea/zyECN8U2ovlYJio6sSsUCoVCoVAoFF8pKEGs+IIgBFCAJWE1K7wMn1B+Ci4gn8+jmWV1yppWtkyn06VSqdFosFaPxWLZbBaTXCgeHu8AAFLxSURBVOGtsM3lDzigbDa7tbW1u7ubzWYfPHjQaDQghSk9v1gstre3X3zxxatXr56enrJ+xtoyoEMU+gC7CSRpUgUOQhYGBJ2vWD3AR8COGWPi8bgQCovFAhMGz/OkzZLea4zB/1coMMwZzs7O8KyAiIGt4woII8BRxI5Wjp5Op4XdyGazyWSSqzQej0XWx7kg6EM6Op/Pc7ncdDr1PO/w8HA2m6VSqXQ6LUaWcHyLxeLk5CQUCnEf7969e+/evZdffhljWWExcrlcqVQSShG+mBx/UeGtG01c2tFkn7vNh9J/ptNps9l8++23u93u7u7u3t5eKpXCBoSoQywW8zyv0+m8//77w+GwWCxubGxsbm5ms9nlctnv96vVarlcprpav9/v9XoQUggk7QR8YaAY42wDQWzzsIg6JWNdmio0opgI879Ua6S/RSIROhL9FmqP6IVkFQgvRneFzrMpYNtMmWElI1HGl7gwZzKZzc3NjY2NeDyOL8fx8XGn05lMJtlsdnNzE849mUwy7Zyenr733ntIs6Xu2WPu2lew637KMRX4eaDQHKU1ZYLNZrPC5xJOIL4FAcpEgejVtkSQWyaEbyKRKJVKELXMcmYlJSbWlclkmLhwP4da5ZbB1ZIXgluFMQb+Vx4W2DjYxDe5IETmRqMR1kZE7Dg1hPBMpxhT0CRxvhYJMA9EEjIYRKJ3xqo+l8sxo0Ksj0ajbreLy9ByuRRrCAhigpFM+xI9lWnBDsVJOT6iIKlUCnJZfDzMo35KcmHFCSrw7P5k7LBqjRUKhUKhUCgUiq8alCBWfDn0li3LslezwkJGIhH8UtPpNG6McI6VSsUYg1OEWXHEW1tbmUwG9krqDuXzeda0mUymUqlABCwWi0wms7W1hfqM8j6JROLOnTtHR0ftdjsUCt26des//sf/+NJLLzmO02q1xJwUglWIKskFpjEiDYOZFY4AuVmn0xkOh6jP4F4pxMf5Yvi7WCxSqdT169e/9a1vNZvN09NT6AOS/aXuPDWIMEfO5XLFYjGRSNTrdXwnhKqD0UM7LFn/XBlhEFjth8NhCgB6nkdFqWw2C2uA9QROGlhAiPQvn8/zQ7j10WjUaDSoE0UjYX/C4fBwOKRyWrfbPTs7+/nPf/77v//72WwWfbGokmH9bOGeKEPtDqPMgnA9MnBsLR5Ef71e/9nPfvbOO+9sbW0999xzL7/88t7eXqlU2tra2tzcrFQqzWYTe+hms5lMJnd2dp577jlEu2jnX3nlFXbYaDQODw/xnZBIDOXXbP2yMWaxWPT7fQnkpNNpqF5JjZfuJ/pfSF4RbNLDRRBqVmJ8vCYk5EC3QfxuLCthszIflyCNTWbZf4sBgjRPxKGRSKRSqWxvb0cikfF4/O677zJao9FooVC4evXqtWvXEonEcrk8PT09OjrqdDoffPDBgwcPut0uRJuxqtI9LaTYp2ybuCrbvgRm5TUxHo/j8fhoNKLOp11C0xjDBF6r1ShVJ9OmdG9oXHqIFBuE/4XnNcaMRiNJoWACgXilP5iVcpxgJOFGEd33+/12u+37frVazWQyhUIBixsmPdhqpmL2aYwh1hKPxwnjTSYTMbwm0QSSmgECQRzQ3UNho3E2xlCvr9PpnJ6ezudzRMQMIvJLJpPJcDjElZjADLOrxP8WiwUuGVJVT/Jy7G4Po43AP5/PF4tFyo2KuRA/4fpI4ISTYoSKVFkygTRip1AoFAqFQqFQfA2gBLHiy+Qj1is4mVWdd3hVPHaxjCAVt1wuQ1yy6kYJVSgUUPOxhBYfCSkll8lkYJxTqdTu7u7Ozg41f5CDse6FOJjP5xsbG/v7+xCaaCFtXtWu3iP0pRB2ouGyRVXIIeF5EclKyrwQW7AYpVLpxRdffO6559BsiiZLpHNCkkp7otEolfogDuDH4d1gvuRXgcx3OBTSsWE0qK00mUwwmoABFP9KkWRilwxnx3WgSl6v1xMrD5uR4cbl83lsi1utVqvVgvSxpW0Ik+3rLES2bKMD5/Gknp2J32632+02RHCn03nxxRe3traKxeLe3l6hUOj3+ycnJ/fu3cOSgkKCm5ubmUymXC4/88wzV69ezefz1PjCGGQ4HDabzU6n02w2P/jgg2azCZ0nKmDMpqkvh/pS3KiNMVCxUmWO7iTWJfRP8VExK6pX+r+UNLRrLQbIL2ORv3ZGghgOCPtMwCkSiZCCkMlkEIealeFJOByu1WqDwQCl/LPPPltcgXhPvV7/7W9/iwS70+lIxkPAa/hydsvAdWAOl5CAWVkfSPpFPp/P5XLtdlvUtbIr6dJiOiGzgQQP8EgR9a50PPm5mCosVmDeEz27BDAQIJPBEI1GobPNo568YkBPJEwCeNKrRaUucUR5LthewMy6CJlpEk4OJNCwH6ZixsJkMsHABC0z++R05LKI4zZjJyD45RA8JmCTIbLPtZUIRJ5E4x+4LwERsVGmWKFQKBQKhUKheDqhBLHiS2MQzEqFJDSQsSwUIW1ZlMJMsZCG1WVxLppExFaLxYI8XEq9yxIaeRfL5lKpRHYw62rXdTFVeP7556vV6v7+fr/fv3Lliuu69+7dg/RJp9PY5ooejVbBZRir+hb8gqy3aR4Le1b1CMFQ0kFqpFKpUqnkOA6HQNKFFTLF3HB+FJNZyGU8lAuFAnWNCoUCVpvD4RAnWWFnkDPj2yAJwqLxTCQSoqRLpVJ8NRwOkbBBcEDrSMa3eBzDHUgSd7PZPDs7293dFX9Y7mkul9va2trY2Mjn86ihXdc9PT2lzJdZuQFEIpFqtbq5uck55nK5XC5HPUBhXmzOQgTFl3wQ2eYMwtdwuaBuh8Ph/fv3XdftdrtXr1594YUXvvGNb1y9ehWjFWNMLBY7PT19991333vvvVQqlclkdnd3Pc/j4sdiMe6FVLXq9/uHh4c/+9nP3n///X6/T5a9MYb4CuEQaV46nUaMySj2PM9uvJRSNKtqWiL2lBJbZuUgLNJFu2CdGIKLQ0uAnBIKMplMonlHMQqZyOh7+eWXt7e3iSox6Hzfr9frrVZrNBptbGw888wzf/Inf7KxsRGLxYbD4c9+9rODg4ODg4M7d+7UajXp6jZ3aU9xcspf+z4Z4IXlIvR6PWNMt9sdj8d49RgreLZYLLLZ7P7+fjabZYPhcIibsETaJMNASE/hQFETw/4j0aXrSrFNORZl1ugPMu2Q6GCMofuRnGFW8Qnsie1aizRAjoKqnTgKA4QD0XLbVtt+wMEOE5OIRCKDwYCniejZCZUxGXIKYsYt5hXIgcfjcSqVYtYVgbPEbMTURYhdDiRJG9EVbNm+XUXQZsMDtLuQ3UYr1CkUCoVCoVAoFE8/lCBWfGn0Fn9AFthraSmqzhrVGAN5ig3CyckJicAs6cVxkgxZdI7wCzZPenJyArlJAS4Wz7FYLJ/P5/N5LIk3NzdLpVK/318ul+Q7U9ItGo2S2E57IFs5Og1j8YxxBCa8tiesnefe7/fD4TCy6Gg06nleIpHIZDLxeBzH1XA4/ODBg/F43Ol0qBiGSM3Oyl8ul7BduVyu0Wi4rougLBQKjUajXq9XKBREQ0eaMJ6bQrRBw0niM42ExTPGuK7b7/cxbkZzR+I/fAEiPtgZY0w8HsdJgNJn3W7XZnai0ejW1hb2x+RKQ2E/ePDAdV08QDhoOBze3Nzc2dnBzYAKVIlEQk5faPeApviSOxGvK1VtSl0ooV6v9+DBA8/zMB69ceNGLBaDC04mkxBzYjzabrfff//9SCRyenparVZ3d3dR6BcKhVKplM/nUZfn8/ler9dsNrE3EZsUcc3mX7Nib/GtFm6XT6SWo/Qxs5KTU6dL0t7tf40VIZCBCYRZkwHI/uG8MApHOOz7fjabvX79+v7+frFYnE6njUaj1Wqx8WQyIVpDMbpKpZJIJEaj0eHh4W9/+9vj42OMywkCSfzm3JtyGbpoQDUst4bLTh5Gt9uV4By9VLwRcrnc9evXr127Np1Of/Ob3wyHw8ViUSwWU6kUMxVUpi0qNyuHHGY/PhQzdwk9ihrdrDhWeheRM1sqK24/OIpIN4BKZrcYQVCck5mQWbFUKiUSCdd16YrofCXlwva55if0QxjqRCJB3Txq9BFuEbtwrqdkhNh8N08cJlJxbjErpnvdjYdJGxdjcViORCL0806nwyQgEzItfPimuBpcMr5sC/5AgESZYoVCoVAoFAqF4mmEEsSKL5RE4I8AgWLXr2O1yUpYSC5YQkpgjcdjz/M2NzdZ5LNkZa0uK95+v++6LunhsoiFqoAsgG1kFQ1xvLW1df369c3NTbPSiOFW0W63h8NhKBTKZDJieYFATNwtoUJkb6TumpUrsfhguK57eHjIeh5KDkUbYmdKw3W73Z/+9KeUaaLy0nK5FA2msRKr4Vslax55HeI7RMcI3KRQkgjExBMAqg7hG0oxiDOz8v0cj8fJZNImC8Qx1qx009y7jY0N3/ep2kRdMgjrWCyG7pIrwHV+8ODB6elpr9ejCJicFyQyPrY0I5lMYl0akMcqAXHusAoEXWzZ9WQygdBst9udTqff72PDfe3atWvXrrXb7Y2NDf7wPA/3idFolEwmU6nU/v7+s88+WygUNjY2KpVKMpmMxWK///u///LLLyMGf+edd6hSOJ1O2+12r9dDBwofbYyBO4YXo88zcBKJBEQYfZLuhwyToW1WJRnH4zECSZxnhP8l+x7hM7YnDASot2w2S9TEdV3MypPJJNRzNpsV7WcoFOp2u91u9969e2dnZ8aYUqlEmcp8Pp/JZLLZLGri4+Pj27dv/+IXv0BlL7GiwLS2rim+DJCBTK+TSEA8Hs/n88wY5lH7AqYmegLMI0rzt99+u9frMb8ZS5gcqFQpwljb/92shOdiqgO/zHyFGJYYhuu6CITpXXRFVL00lXQNyZ8gYkGQQ9x44/F4pVLZ2NgoFovxeFw8LlzXNStimsfTZDLBU5hu7zjOaDTioDgOE2Ybj8dCDYunCufCxC6zqzhoi+6eH9oia/Fj4UHgum6j0cBNO5fLsfN8Pl+pVLCSl+qONttr16nDiDlQni5wj3SKVigUCoVCoVAonkYoQaz4osksoWvtukY2xSArUuEaWHzitzCZTJCXykIUG0c2ZtGbz+exs4TBESYCdkDkYIjaYJwhT7HfpTwRRxwOh4PBANbAdd1er4cwWYTDLKdhuEQ1yVFole/7eBkPBgOokEqlksvlut2ubcYKzYHwGY9IqFuoDcnEF2ZEfstpiikHDbBVjXhiiEqO/Yj0UjL0Re/M4WyNmO3nYDeDo8/nc3TQhUIBImMymYjiD6kasrhEIlEqlZrNJnxlpVIRSTLUQzwe53QQD+L+EegwNm2hA+rciyAXR/6ASCK8gcy8Uqlcv379+eef39nZ2drayufzV69ehQZttVr1er3X63W73ZOTk3q9fnZ2ls1mU6kUuvVSqfTMM8+Uy+VCoZBOp7e3t7vdbr/fHwwGZ2dnjClcerHSZnAR2LBFwWJvwrcI+TF+hblDU48Zi8jhEdFDN9PBpLAYgQ3CEqVSCV5b9KRIiSH4ZHR0Op3Dw0PauVwuNzY2MpnMlStXnnnmGerU9fv9Dz744K233qrX681m8+TkhMKVcvFtXuyS90YJ6RlLyZ5IJAqFwnQ6Jeoj3gtsJj0B3S7RNTSzIv4VxlnihbZDkT29C8yjQmZpG/ObWZHI+P8wQzJjZ7NZbIgkH4Wp2BiDvF18KujY5FgYY1KplMQ1xedB/F5kiqMsquM4eFlAi5sVnS023Paz0i79x0WTc+Ts5NHD88524xHdMePOdd1Wq1WpVNLpdCaTYUBJGT3fgrHKxtrifU6HgbxubmPUKV6hUCgUCoVCoXhqoQSx4sthtcQ91lYKB5aX4mcq+jKx9O33+2yZSqVyuRyaL9RqqVRquVyWy+VyuYxwVRbViUSCtTSiLWMMZBlKsel0eu/ePZbxhUIhm806jlMqlVjPs4wPtC2gn4LXGI1GqJKxtnRdt9PpzOdzyYM2xmSzWVRsZqX8YoWfTCar1Wqn06nVaqTAIzGG9oIUFgYBxm04HMKGC6khtpXSTuHIYNbsavVi1sk2whdIYrWdaGxWam44aLPyNUZJd+XKlVarNRwOuTKlUskYA01MDb1wOAzPeHh4+E//9E+1Wu3P/uzPtre36QDFYvHatWtvv/12s9msVqvVajUSiUBT2ryJ0BDrOdSXdjStf7jO5kP3TKfTer2Oicevf/3r3/zmN/v7+zDFL7/8cigU8jyvVqsdHR212+3RaHR2dnbv3r1f/vKXDD1y4Tc2Np577rmbN29ub2/v7u6+/PLLL7zwAsEJwhvD4fDu3btvvvnmnTt3er1ep9OZTCbFYjGfz1PUi0GHMD+bzcJk4WIRCoX6/T69mlJd0WgUu2SEkLlcLhKJVCoVrCEoI5bL5SCsM5lMKpUiYrG1tVUul5Hz12q1X/ziF2dnZ51O5+zs7OTkhDp18Xi8XC7v7Owkk8nd3V24M6SgBwcHuDP/5je/OT09hbMWttEm7M4ttmkuWa79uiG4VP7EpSeZTJI2MZvNUONyrWaz2dHR0dnZWSKR2NjYEHsEIS6JIUk6iDC8AEG6fMWEI2U8JSWFA2ErT3TQdV3XdTGIN5bVtVk5KtDUwWDAlM6tJ5oosz1jqtfr2fYOs9lsMpmIWpmegEgZAT4Tdb/fr9fr2GIsl8t6vY5XvrTftrO3HzS29QTdkm8ZU+LUvO5ELM4t8/kcUyMc5KF6MaAQcyfJsxG9P24hnLUYQHHFhD7WOVmhUCgUCoVCoXhKoQSx4kvgs9Ylw7LCFFGSrcsjm1tkwoPBgCU65o+SnwsdTKZ5KpUKh8OTyQSL1WQyiTdur9fr9XowU5lMhqJbSLcajcbx8TFq3/F4TA2rdDqNMNbzPIhUiFp0iIFTkzJ0w+GQJTTGC9QgwplXTFepRGezG/wknU6T8ixGrlgtm0ddHUTJNZvNOBx0gJQ5CvCnwhgGymfJdRbnSvgRKGCSjlFVQ8rIPqXZ/G84HC4WixQig22HtoAd9jwPWgGFYK/X+/Wvf51KpV544YXNzU1uejab3dzcpNzTdDpFJ14qlWD8OSlj6eNUqvbkCAj9oIfIlEcOSUAlm83CjaIBh65qtVrYqkwmE9TBDEDXdZvNpuu61Wq1UqmkUqlUKlUoFHzfZ/tGozEej3O5XDweHw6HpVKpWCwaY/BvpUtw040xEGpIyBluvV7Pdd1EIsEYxFzCGIMly+7u7q1btwqFAlXycrnc9vZ2pVIpFov0XoI0dK3pdNrpdB48eMAAr9frx8fHNGN3d3d7e/vKlSuZTKZarXIgz/Majca9e/cePHjwu9/97v79+1J5z1g62QD/bk9xl7anib2J5HxQoQ4ThmazyQSVTqchT5mp2u12q9XK5XLRaJQZT9S+UnpOghwB/+J1hyJ5mshm4lAECZtMJjHmZp5naiJfBBcgBsJwOKzX651OZzqd4oAPIStRNEZQNBplP7QQz3e4V05BSjJyyhLpxA6IZBRCfcYYklfE1UFsu23dvZw1RDNCZiFz7emdBsi/DBMqkRpj0uk04RbJgxEvF3mCzFdgSpfPL6q/p3E7hUKhUCgUCoXiKYUSxIovE+vJs+d6d4pVLuQgafJSkCqdTlPGnWXzfD6XkuvL5ZK8eOyJM5kM7JgxBvIR3pZlLfYUoVCoVqv1ej1MS8vlcjweR+SVSqUoCoTeVggRu7XYRECtQk4hUkOYLOXsIOCEz5WqTcYYyhZJq2xONnCt5EJBcAhxYKxyTKjGzEq1zWYQwTA4wrfaxhQASgX+wlgqVLMS8MLIsyu470wmI0nW+ANA8cBIQtMj9x4MBq1Wy/M8ER5iMrCxsREOh3u9HlcS2hHhoSrUPhnWOwz9YTqdtlot6GDooevXr+MEfe3atcFgwC1bLBbVahUpKEbGdPujo6NOp9PpdBaLRa1WKxaLWIjg6lAoFF566aWdnR0I5eFwiIwUGq7RaPT7/dFohJ8DsRzxxcbOZTAYkArwB3/wBy+//HIqlUJQjAi9WCxms9lutzscDvG2rlQq8M7dbhf/cdd1IXYnk8nR0dGvf/3rbrdL57x+/Tp82bVr11544QVMcsfj8f3790ejEaUs33vvvVarRdk6ewBKsUQ7Gd+e0y5zN5Oil2IHjEQX8axY9zI/S2U//uDe0RMgUoUmlsnfPGoxYdsQwWba9ejkX6bryWTS6XRwgccanlwHJmcm7VqtNhqNstkstC8e9MyxzGnyE44oRvC2da9N0dqPCTkXzpoHAZM29sHYJdsl6ZiWbWcMplNIaiGjbVtnMaAwllMzVwkPjX6/zyHYP3Jp+4LYjkbsFmqYZxkX2XbhVygUCoVCoVAoFF8DKEGs+BJwUbU6+TYgULJ5GeFAYTmloBlpyFCZLMhR++LkAD8lVr8IjcV+gWxZyu/k8/lkMnl2djYcDnFLmE6nfLi9vZ3JZE5PT/v9vlnVXGKFLA2maB4aZM/zfN/v9/uTyYT9i2IObaYwICz1aTk6Shwthc/lrG3dIp/TBogzoarFfZLGJBIJKQJmm1oaKyt8ndWC2BVeBt4BXljuiHguC1NWKBSSySQ2F+PxGGIdRqPf78fj8a2trWKxuLW11Wq1JpMJVdHgzalTd+3atXfffZf6ZtAZGxsbGBfYkm2VD3/kEAtcIptbF35qNpv1er16vY7v8HPPPVepVJ555pmdnR18YyuVSqVS6ff75Npj0eB5XqfTgUE+OTmZTqfvvPMOcvvd3d0rV65QsCsUCuXz+UKhsLOzY4yh5B3Vunq93mAwkC6BrJ6+tFwue70ewsZ6vX7lypVvf/vbf/Znf5bP53EpoR7dfD4/PT09PDwcj8dU2SoUCv1+/+zs7P79+/QrWktoAV8a3/cLhcLe3t7+/j7yyXw+H41Gh8Nhr9e7e/fu8fFxv99vtVrHx8etVsv2NjGPmjubp8EI+wsOqNh+u2bFTkqJNmE8JRZFtIxqgRCyzJwQymITwVTDBEg2g8S0RPwrs5AQ08KBiisCMTPoTh4HTFAyRzEihHJlDudv26hHJk9JjxCxM1eAx5B8Ig8vO3tDAnVsT5eWPQPhlAmFivmGGOxIzE+mZYh12+JZckdE/EsJUwKrPJXEUIINuGI8MuTOyrOAJwu/Ep8lm7L/yC6ncT6FQqFQKBQKheIrCCWIFV8agWUzWcI/rn8r62FJuWVpyuJ/Op2enJycnp6yIC+VSru7uxS5isfjuVxOGMxwOCy6Y+TGzWZzOp2ySE4mk7lcrlKpXLly5cqVK3fu3HnnnXcajcbZ2Vm73c7lcpubm1tbW1ROOzo6ajQaUjte1tVkDfu+D63A4hmqVBiNRCKRSCRYgeNHmU6ncc8wxvBD7BqoKUQSMR9ChcMs9Pt9WIPZbHZyclIoFKLRaDqdhmsWVouEZSRjQoUIIRvQuNkqZqEGoJ4hC/gbVaZtIep5HmrfQqFgjOGikalNG8bjcaPRoDF7e3vRaPT+/fvj8fjnP/95Pp//gz/4AywsEonEN77xjdPT0//5P//nfD7f2dm5evWqaPd6vZ5NsiiefIgJL2MPK2GpZrPZe++9d3h4+O///u/FYvHWrVvf+ta3bt26lcvlCoXC7/3e70kye7vdJuDR6XR6vd5oNOLDZrN5eHi4XC5//vOfw+ynUql4PE4puUQikUqlbt26de3aNYp0IerHzwGPYLp3JpOJRCKu647H42az6ThOKpVqtVpvvfUWtuDZbLbVao3H45OTkzfffBNz5CtXrty8eTObzbbb7ePj40ajgTJdaoul0+m9vb1qtZpMJkul0vb2NlUue73e+++/f/v27cPDw3a7fXJywg+ZaoTHNI9GUGyvg6elD3wxsGuyCR2JYLbX60m8TeZkpjgcpZfLZbfbpRBot9uNRqPVahXG0xiDLQ90s1QQZWYQQwbZLXJXDsTsRLCQ6oVYjrAl1UdzuRxKeeJ53W7X8zwmbT7HJkhc14UYFSue5XLJlmZVOA7iFVKV6V2KlwqFzW8xxEc4zPOCRxt5J/F4HPpYgnN2aUcRCMvsLfsXdbZcK+GdyRjwfZ8xyDVMJBJcKNEvszeeMjw1stkspe3MKj4a8PfQWVehUCgUCoVCoXh6oQSx4svnL2yjiQBxTGkgSRa2N2btGgqFxuMx8lJW46VSCQoA5WAmk6HGHaaTiHNZ2CNqQ4/GwphlcLVaZR2ey+WQEnc6ndls1ul0YrFYtVolt911XfSMJLOjQWs2m6PRCItk6tSxnEaAhq8u5K/4P8DG4jiB9paU53g8zipdPHmh0sRkgzxocv8LhUI6nYZKtnXBthbbNogQEwm5qvKVVKUTjZvNPsC70UJYXbgYKBg743g8HksmMmQNe0OLbYyp1Wqnp6f3799/6aWXYEAwENjb27t37969e/f+y3/5L7u7u88++6zruo1GA/LdWD4kqkR78oEmWee2DNa208XMt9PpQPgeHx9vb2/fvHmzXC5Xq1Uy0Mvl8nA4xISh2+3yE1TGvV4P0e6dO3fa7bYxJhaLlcvlXC6HM/Xzzz+P5XSlUpESYeFwGOdZSnihDu52uz/72c9+9atf1Wq1UCj029/+tlgslsvla9eubW9ve56HScXdu3fv3LmzXC7Pzs4ODg5isZiwe8aYRCJRrVbL5TJBnd3d3atXr0pNS0rn3blz5yc/+ckvfvEL4S7Nyh7Bjletk1/a686FMJLC2IrfuhjgwJ+K4znY2NhIpVLtdpvAQ6PRYAI3xkiRN8hTsjeYLsxKxiupGJLZIFkXmOfCUzN7L5dL3LH5LS2RCnKlUokHiuu6SM7H4zHOxXhfiAjXWCSveC7bFr3i7ctkDiELawzLzPzPRCphS1yA4/G40OtSZI+rIW4SZsVWi0xbfDbMisDl6nE1bAaZqnqJRKJcLkNtU1JVrIc4QayWSXwZjUbUtRM/aDbjQLY99BM+9xUKhUKhUCgUCsVXCkoQK740rOuFA2vIwOeScsuyX+gAlseszKfTKdalaLhms1m3243H44VCgTRnDDFhM0VoLHsW5VQqldrd3cU0E59WyF/KLoXDYbKh0ayJswSJ0saY4XAoa3Kbg6PZNIwTYR0OQTybzagUb4zp9/tyXpL4LPm8vu8Ph0My9MXFUuom2RWNzIoOFt9h27hDaijZIlPb7zLgRGke9S6wfwhDATcRCoWSyaSUNoLHp7gfP4GbiEajkOl2TjT2tYVCgXpWmH5sbGyk02miBQEtp46jJ0Tgxq1/LlGB0WhUq9Wi0Sh64cViIdRqoVDIZDLT6bRUKvX7fZjfdruNVTR3s9vtSg266XRKdUff98/OzhaLxfHxcblcppAjin78KKgtyfDp9/t3794dDodQbPP5HEeLdrt9cHAgqmfKhUEa4twNhYcwP5lMlsvl69evU3quVCpVKhVCR8fHx3fu3Gm1WgcHB0dHR6PRCPEm3d6xYF8ulUl+gomdiSi8gvgY2LMNG+TzeTaQBAuyFpgD7QgihK9dztSuemqLl0VaK04LVDSNxWISspJKoRw9lUphpD4YDET2OxwOiX4xtRpLOWt7BMtUb+tqzYpm5THBUeR0+EqK1/EIo/dKREemYg4t5KzsnCeFPGXkW45oe0dI70VYzaNQHOSNVTDWvkHsmVQY3D/sjTWlQ6FQKBQKhUKh+HpACWLFV4KxMo+KWO01qnnU2lKsJKEj0V5Fo1HRpvV6PdKWka0ZY7LZrCywoQZY5SIilgRe8VJA2LWxsZFIJEKhUKFQGI/HqCZd1x0Ohyy5YcGazSbZxBCgFCziFBKJBCW5ICAikcjW1tbm5ibSYDFBhjXmBG11M6eACs913Xg8jmSYxTlWyJlMZjAYoFCTr+DBk8kkzgwixLYJYqkTJTxOgAUTVbVwAUKjSwkjoV3EsJj9kNQvOsH5fI6EM5fLSb1BspsHg8HR0dGvfvWrK1eubG1tQWdsbGx8+9vffvvtt+EQs9lspVLZ29vjFoxGI6GBpESV0nZPMtzMxa7fxlJkixA+kUi899577777Lu7b1Wp1f3+/VCpR7zEejxeLxUwmk06nNzY2xuPxeDy+fv36Cy+8MBqNMAqYTCb0E4IxKJQZDp7njUYjY8xwOKQOZCKRoCsiO6VwHNQVJsK9Xm8+nycSCTpYJpPJZDII1ZPJZCKRoEtns9lcLpdIJCqVytbWFkURZ7PZvXv3kB4/ePDgzp07lM6DAV+/OPb8E/hKO9tjOpixHGZFUuo4DiE65hMZuVzV8Xg8n8+vXr1aKpWoizgcDs/OzsiNEHtcqSYnWleZf2SekZnBLu8mxdwGg0EymaTfEiogpGGMYU7mgQIl3e/3e72eOFfI7Boo5kl7mH5l5ucERdvLBkITc5XEejiTyRQKBR5kw+EQB2Qpymos0lY01/yvPBqY8BkXsgGHsK2Z5Rkqxi/kuMB9kw4iPsg21W5Wzvgi3LYZf/OJzLg1+UOhUCgUCoVCofiqQQlixVeCUzCWRtXmqmwpX0A5ZVbuilK9DQJiNBqxLId+hUVi4c0iXEwecXXodrvj8bjb7bLgxwsVltYYk0qlxGyxWCySU+95HvyypDxnMhnhDqA4c7mc7/uDwWAwGCAKKxQKL7300tbWVrPZ7PV6oiC2bRyi0SgJvwhsoVyxf3VdV2TCxhjKfOXz+WKxuLm5mc1mqZUEywZlwBVjGQ/LZiz+nStAs20Jnu1OK0ptuVmiAhZPTPsOctHgf1Fbz+fz8XicSCT29vYwDyVJOZfLGWNarRZa0T/5kz/5T//pP3HKGxsb/+2//beNjY2333672WzmcrlyuXzjxg0awO0LuJ3a9esUTzLcAkSelL3iQ4rXcYUPDg5yuRwyfGoM5vP5Z5999plnnqlUKtFotFQqXblyJRaLLRYLOH2q2NVqtXa7TaUvzB/ok+Ksgm2F3D66FrLHRCIBoWxWjthIhhOJBBUjc7kchRzR8htjoOpSqVS1WsVuOJ/P48fS7/cfPHjw5ptv1mq1er1eq9W63a5d2ivQf9a5TpUPP3kfk1QD23Mgm81GIpHhcAhBLA5ChNkmk0mhUHjuuecikUg+n/c876233losFu12G82vLQeWo9B5xDaX2J6ww3J/CQ+I9zGO2ETgiCbaMmeZHj3PIyAhXDMRO6l0SvsxpuB/bVEzX8ERx+NxEiDsIGgikcCxPZVK5fP5TCaTz+fj8Xg+n2+1Wt1ul7OTHZpHA6UERSRqaFbexDKBczvsR6pQuvDCmHqn0+lEIgEDvlwuXdfl0SMOEiCgphdbD7Omr9eRolAoFAqFQqFQPKVQgljxZcLWqwZYBlEq2UtQO3nWrFjOxWIBZwplgEoLEaLjOMlkMpVKkUsLJ8VqnzReFFjo1NgJFgeSI0/ueSqVKpVKOzs7MMIYE2PLiLhYBLaTySSXy+3s7GxtbfV6vfF4TPvz+fz169efe+65WCzWarVsplukYVJ6CHEZrWVVzzZ2DaJUKgXFcOPGjeeee45yW8vlMpPJoJLGCkM0dEIQi5WwXEm7nJGwGChJET4bq/wUP1/n7pHaCYWB4YbjOMPh0HVdGGFEzfwWw9lcLvfgwYNarVYul7/97W/DsyeTyVdeecVxnAcPHtTr9Z2dnUQisb29jdUAjh82eSfXTQfUk/B3xtLDygCUKItsJon5GI86jtNoNI6OjqBo6/V6r9fb29vLZDLlcnl3dzebzYol93Q6HQ6H5XIZR+Ber9dsNvF+MatyiIg6oXeR3lNikRuKVUWv1/N9H9qXu5xKpbCkSCaTdCfiNEQd8KkoFotIMsPh8Onp6fHxcb1ev3v37s9+9rN6vY6i3+a5bKGrWSOFA5dO8ZEdTFwd7HkbglVEuHC1kUgkmUwSQqAuHBPaH//xHxtj3n333X6/z+2WvAfP89iV9FKx05H92wkQ4vYutiTIbHkEhMNh+ifRNZlpCY/xCGDPkiDCDiFVpc/YJj9mFXJjGrd9kIRrJoQmMTZ2mMlkstlstVo9Pj6+d+9ev98X3yR+AuPMsTY2NjY2NrLZbKFQSKVS4pUhZhdcAaksKlO3MUYIYjyU5KLJQ9NxHHyNxHaJy8JotSuF2gPnYw0THU0KhUKhUCgUCsVXDUoQK740rGe728I9/hBXBP6QD0UybFYEq2yD6JUVdSQSmU6nvV5PzEypTRSJRDAwhRpOpVLpdJq04uFw6DgOXBWCVt/3E4lEOp1OpVKLxSKdTlM9CTtjzHZJokeSTIEj1tKia0un09SL5ys5i8AyG55aWF3hdkXaJszylStXbt26RSo9OddwGXBkiEChYGzylB2KUJQNxDtYZKSizBVbZBogHLHN/phHFd9yN6kKxTWxqznxv/wNLYLkGccMceTM5/OFQqFerwt3gxg8FouNRiNRKUqHUcbhySm8wBUTol+S2QMRBQonwjShoB+PxwcHB5lMJpVKYfV7/fr1bDYLbwWBe/Xq1b29PcSYqOYDek86mPQ96Vr0kL29PRkIIvLNZDKlUgm2jiAEIR9JjZ/NZviWeJ53eHj41ltvnZ2d4QzTarWIYcipGUvoKtfHrvFoXzTtYB+rgwUuL84J1DSzvYkhPT3P63a73W6XSYObi0eQTFnSDRCMi2G09GHZ0jxqy2BWLsCBm45BBJ2HcJocGnksgnfxgpCWQxkTmTDG4L2AjNfuxuJrzIkzfGSqxOcBYhc2Vro0phMcwvM8OQv5Ceksu7u7pVIJBxXXdUmFsW0upNyiWVHYEhdkmpXrKeNRFNNcFqTEZsXp2zO8reb+ZByxQqFQKBQKhUKh+EpBCWLFV4JHMBeXqjMrWhNxk8jTRPBoZzTzLXwW1oqTyYQ6dUilRMQqxFO1WuUr5MZ4ULKeZ+XMriiYBv26XC7T6fRgMCDjOBqN9vt9NmBhT4m5UCgkVX3K5fLm5mYoFIKDlsZL2SVOJBaL8RUkqXhoBIrR0+yXX345kUgcHBwcHBxwyvP5fDgckpEN74APshhxQIJQ745ztHkWUeRxtaEthGoXiwlaBacgd8dmikX9jUzbrDSh6AQ5IpcOf+HFYtFoNO7fv48gjitTLpdffvnlk5OTu3fvbm5uZjKZjY2Nq1evnp2d4RwqJZuMxVDrsPoEQy/QAYQ+CzBB6AqhnPr9/tHREVLxbDZbLpe3trYgiyuVSjqdzmazpVKpWCym02l+Ui6XRekPSyt1C0WGCREmPY3OJl3RGINxRCgUwkAWyxfIX/5ut9tIhsfjMZLn0WgkTqz26Zg1G4THz0KKJ+xa6xP7bDbDewRLcXHXkXqVg8Hg4OAgnU7PZjNqCfJDOolQqzJZiZvNegcO1PM0VmKElDdElsukzeQWjUZjsRi1FpmaMLjAhli8hslNoTcyqWJPZIwhdsWkTfrFaDSaTqfsXAJvPBcWiwWhSnhb1Mr4PPi+n0wmNzY2cFAZjUbRaNR1XeHZ2YzzRaqPAYuQv+KpTQCGT0RnLWprmGjaZoxJJBLoo0WLbfPLcqeIFwopbBtrGHViUSgUCoVCoVAonmYoQaz4qrMMkocrpYoC+a1C+vA51CG/EvMEkeKyJBbFFiaMJBpDH+fz+cVigc4X519YLbSukMXFYhECC9oCKdlgMJjP5+yfdXs8Hic7OJ1Ok/buOA68gMjNZBlvmymbVfI7nC+aaJFecmi2xAGg0WhIabvxeAyDZhNh8jdKOlgGKZQnvpZQCXDNYpphLIUpf0uu9DrJKEpnsxLToSBG3YzmGtIH4Rtmst1uF44PUSENTqfTt27dun379k9+8hNjTD6fT6fT29vblUrl7OzMLkIlVIVyEx9riJk15fW6den6NgElu+M4OEg8ePAAx4B0Oo0pBAbZjC+KYtE94NqwqigWixSXk/qHtiMKHR4j7/F4jEAeSWan06nX641Ggz7f6/UgiAeDQbvdHgwG9GSGm4ypgEOrLYEMdB6NN3xcyFwh/2uXxHRdl5sIQSwW57agmxlVJOrGGFIQbDMZmR/sg0qASmIJEKPCI8uEhgkDu8XDV+xu6LHpdFr0wt1ut9Fo9Pt9qinSsSGFqeKIw8l4PB4MBsYYKpTaSRtY9CSTSTGg4HRohm1AL6FELJKLxWI0GsUoGWWxGF9AgjebTQo24tHMNeSsGWKSBcIPA74fSJVTqRSxT7zvmdgZZTISJTq7bivEmD23xqNCoVAoFAqFQqF46qAEseIpo7TMo2pHSdo1Ft9q1/aBSEWiC20qDCnGlMvlMh6PYwpZqVRY8WIfjOQtEomQbIu5RCqVMiumtVAowFiJXhgVMEQYB81msxhBkC9MlSTaIDpNYbSlfr2c8tKCLNFhtJvNJlYYVPTCEBkfZITSjgWzVpje/hymwy6aB9MhLRR2PnA7RD5ss7Q2X8/OxXaWFmYyGbgMvIk3NjZGo1G/3+90OiiIG40Giuxr1679y7/8S7PZxO42n89vbW0dHR1RAFCICZvCNkoTf/wxtX7FbF7VtqsWSk4+F7l64HZEVpD+gxgT6WI6na5Wqzs7O/l8nj1DGTOUhAgm/tFsNj3Poz2e541Go3q9Xq/X2+22pNKL/l36npQLk3NcZ7Iu6irahT5BXwpQhMIhiuuC3Yvkdog+Nx6PM4vCyZLSQSzNPGoiEbC44XNjSWWFDxV3YGMMCSVEL3K5nAS6YrEYZeJwL6Er8jjA5abRaHieh2c6el7XdTudjpwIe+ZBACWNlNhYhsvwtolEgmsFCUt3hRZnPzaPbE+zcNbMycPhsNFotNvtRCIhheYIxcnO5cFkHk2w4DIizyf6woQvLky01p7PjWWUf+4kYIdYdOAoFAqFQqFQKBRPKZQgVnxFEdCjCekjGa8BFtIuMCWLVVnNsmj3fV8KyrGN67rtdhuJViKRqNVqInCTZb/v++PxOBaLlUolcbRkwZ/L5cim39zcPDo6unfv3mAwSCQSxWJxsVhgqru5uQmnjEJ2NBrhWem6rhhWioAOFoMTYa3O4ebzObyzsew1J5NJOp0mhf/w8JBs6EKhYIusbWZZPGSRMIsMWQrcCxNNFjO+HEIQy2Wxs/L5rRA0NA+ZGwy1uH9ClEDNI9DGoKBarSaTyUajcXh4+K//+q+hUGhra+uf//mfG43GN77xjZs3b77yyisPHjy4f/++7/vZbHZ/f7/X6x0eHn7wwQfiPCtnZzPUOog+EwQ8GdbHqX0L5N9A7rl4m4bD4clkQmdjA3FcIcdfKnoxbLGI6fV6iPEho8fj8XA4ZGyaVd1FYYTlQ8jBi85Le8hnjnPdh8WjRowL2EBIT/rAwcGBMWZvb293d1fiDbaOW3qXLfeWCV/cFcyjInd5QMgcKDZBzEUys5EFQguTyaSYwhPNgr+WaZNZDiEw9hRMoZwmkx4HlQil2BzTHuyzEVZ7nsf5YmqE1cNsNuPxREFU9sk1zGQyeBMTtsxms8yxfMjzwjavF3sNqZuHzLnRaHS7XY44m83S6XQkEhkOh4RLOV8xA6EB8PX2Y1curw4ohUKhUCgUCoXiqYYSxIqvLtdwbpa3OBsIM2VTkzZ3IESq/YktdzKW6y5U1Gg0ajQaaLsAQmAsIKvVaiwWwzICIRilgXzfz+Vy169fXy6XJycni8UC+8jZbFYul/P5PMQoykfXdcm4F40bvq7oy5BbsoAXF0uhP8yKrXMcp9Vq/e53v4vFYo1GwxiD+E5EmrClsBJcJfb8cNiv2Dd0YWJwDEkRi8VskkXUZGJqwSfxeJx7IWnI9rcBeaAxptfrocuGFvE8j+RunJ2Xy+Vbb731wQcf4I9x9+7d3/3ud9ls9j//5//83//7f//Hf/zHN9544+Dg4JVXXtnc3Hz55ZdzuVyr1fI871y2yKgb5mfB9AWMXMSbWAhZe0wJO28bUssotvXIMF+hUKher9+/f1+S2c2jWQLyQwlyiCaUbjmdTglF0HvPba3yVl8k5NZLL5KKZ9DEouaGbTSrwmuDweD09BSpuDFmMBhMp1MMZ2x/A0hP2zCHeUxUw/QHmQCZSMWuhykdaS2RBvohtC/RO+ZA3IRSqRTGu7lcDtK23+93u93BYNBqtXA65mGBXQO6Y7F3EEeg+XyOJhqNPFwzfuuDwWA2m52dnWGpwWkSd2T2RjifSCRoJBcEPhrNslC0hDO5btFolIKfZhV3tAu3EoOZz+ftdvu9997r9Xr5fP769eulUqnVatXrdSTS6XQaH38h62HVbaOPddm4zroKhUKhUCgUCsVTCiWIFU8HV2UsV9BzVcPnLk0fX3LKNq5l8SzV5+FtWfzPZjNMJ/v9PpYO0JqRSMR13dPT09lstrOzUyqVSqVSrVZD9osqGU9J9hMOh3u9HgQxPBcsMAeVsvLG8nzwPI8Fv1l5Mcu51+v1k5OTWCzmeV4ymaxWq5Rd8n2faniiGoMiCdhNAJtYAVwHvrXr1CNME/me2A2vk3EBc1uOyKlJIrbruuLgaZcHnM/njUZjOBzu7e2NRiN4me3t7T/8wz/83//7f9+9e/fKlSt7e3tbW1vz+Tyfz9fr9fl8bgurAy7Vik8z4s41d5a4i/TVgGOJhHBs7l6sSKDz1ul7+5PAsLVtbe07K2Tx+h4ec17rmymf9ZnAdgo2luMEVL5t8iO+CsL7x+PxZ599FvL0+Pj49u3bx8fHV65cqVar8Xgc655AFEFU6iJFt3XrwoGKaYNMsL7v4yxPNbxYLJbNZhOJxHA4PDs7I1djsVgMh0Nsr40xMMX4pHe7XSTtYigBh4ugGDMi2oAc2BgzGAzi8Ti7ghre3t4ulUrM/8vlcjAYdLtdmbSHw+HGxoYQ6JFIJJFIiMyZ9hQKBbmwrutKuVTs71EZM/FSdM5YSTlY/SQSCYoHHhwcYPEhvvCVSiWfz/Nb1Ny0bTQaeZ6HYloMkQLpIzqaFAqFQqFQKBSKpxRKECu+ulgncQJc8LpGeP3nttbMnMcOS335gFemWTFQwmeJKQTFiGxfXdd1S6VSLpdLpVIs2vGXdF0X6hNrYMTCLPVhbwOCO9sOQrgVO01e1HCTyYSDbm9vRyKR6XSKa6fo42yvYfv0A1nb5DVzXKGGhfWzWyU/EZrYWNYfot4Vp2NJ96bBiUQikUggi+t0OriLcmhMP0ulEinV7Xb7T/7kT27evFmpVMh6fuaZZ/7oj/6IS93tdguFQqlU2tnZqdVq7XZbOCnxntax89mOwXMHV6BWpE3jBkaoWStgtU4Nm4+yAw6w1TbDaC6uKfd4eaN2lS+mC0lmg8wSAtH/lsvlnZ2dxWLxwQcfnJyc1Ov1q1ev4p8TsDIQl3mZkeRA61pju2MQiKIZSIPRL+MIPxwOB4MB4lypIGdWFC0RvlgslsvlCCV6njccDkWzzKQH/Sr6aKY+fkh7+GQ2m3W7XTteImJn4otyuWQuFZcekjyY522SHbJ7Npt5ngdbLSkp5tG4CKcm8zPJLv1+n/kftyVMjcWznninGGjYd9a2/NYBpVAoFAqFQqFQPL1QgljxlBENgURys8YNCXEgxG7gq4vkxjbRLHyE7GS5XFIpC+UvSi68Go0xKIVJRj47OxuNRul0erlcep43mUyi0ehgMBgMBngZY86A3ExMOW3vC5HCmVV1IJuAg/vApCKfzz/77LPz+fzOnTuTySSfz5dKJThfu7iTWYmFUewK48D6X+rF2Wt+MbIMlKeTonPSYDG7NCsy2ubvOAsokkwms1wuKTtGOjbyNIoybWxsUPrp/ffff+GFF65fv07xQMdxtre3/+t//a/lcvmXv/zl/fv3b968mc1mb9261e125UraDLitX1bO4tOPu4s+Cai2zSrkEPg2MGZtKtkm/sx5cSDzKMl7kTD8Is34ejxJ8cXAvun2XYAStW8lc0K322V+6HQ6/X5/PB7bUnSZTMRaWkJlQq2alU8OBGhAMM70nk6ni8ViKpWaz+dohOfzued5tVqt3+9Pp9NKpcJuxXiXNiDUdRynWq1Go9Hd3d1Go1Gv15HrptPpZDKJYTERQdhn5s9YLJZOpxER4/zT6/U6nQ4kNQ8UHCow2+EnnOlkMkEHDdXLrItmGbMISU8R5wfoackIMY+GHiXzQyr40c7xeIxLMkrhfD6fSCSEII5Go6VSCU7cnmkvuvU61hQKhUKhUCgUiqcOShArnjI8xjUioMa1P1+vVRVgneBh7RRmqa5mjFksFrhk5vN5lLZwl4vFIplMJpNJSAcUavAdwrfy72Aw6HQ6QgRgtoAyi/1PJpNEImH7NkilI1bysqqHFEin00i9SAQW+gPzSn7L3ti/XadOCBTsMo0xeFOimxOiXNK314keoYk5EPuxbQRsolZknvF4nKuExyXiaLRs6LKr1erZ2dkHH3zw9ttvv/jii5ubm7Q/mUx+85vfLBQK9Xr9Jz/5ST6f39/fv379erfbhdzp9XoBd+lzb7riMxl968PNVgGfS+9KF7W5e7NmIPORvNJF7hPnIlCyUm/fF4CAiY3kMTDSJ5NJPB63o1/MTt1udzQasfGDBw+Wy2U2myXDwM6HYM8SMJMamGaVI8IG5HDIzCbzElME/rwyJ0N6NhoN2oZRgxxFbBbG43GtVhsOh/l8Pp1Ob25u3rhxo9/vUxo0kUgwITMDJxIJhMn0QJ4X+D/0er16vf7BBx+02+1yucyzQDw3oIY55clkQtIJLRGnCEkrSSaTdg06YwxBSp5Bcr7Gio6wPTvkuI7j4Cwxn89hwI0xUOeZTEbuYCqV2t7ens1mrVYLZ3xh+dXsW6FQKBQKhUKh+HpACWLF001G2GRTwOXArGkYzZpE0XY1ta1+jeVaAFmwWCxGoxF2kKlUSowvMW3M5/PZbNZxnI2NjXq9LqWEsGtkzc/fVCiKRCIUWIOWZYUfiUQwXoB7ZftIJGJbcCKX830fV0p2FQ6H8/n8crlEd4Z8GM4XfZmww7aHBh+SqkzucKD4GMpiWBLOwiaaxeCS7GPbo0N0xDZDIZ/Aa7iuOxwOOU0OnclkoMjb7fbvfvc7CjpB1nBDd3Z2fu/3fu/OnTvUu9vc3Nzf38dYw3XdyWRi1phKo8zgZ42AQ/HjjR0CXGFgqJ57g+yxCc+1bjW+fqBzjSOUGv6CZ2PbfMAuJcccNRgMJpMJbCkSV4nMMbVSu/Ls7Gxra6tYLG5sbEynU5mQbQqSqYYpDtGrFGqDhp7NZky2Mm0yjTcajcPDQyS98/m8Xq+PRqNQKJTP52lYuVwms2E0Gvm+T0BrsVj0er1ms1mr1RaLRTabfeGFF/7oj/7oG9/4hjEGSwcoYAjiSCQixu54AXmeR/234+Pjbrdbq9V4asTj8eFw6HkeDg8wy0x6YlUEq2sz4LPZjKQNHhzxFXjQJJNJY4ztuSw3ghkb42PU07FYDIflUChEQVQsoW3BMlcGQbFY27MTO2xpnjjMo1AoFAqFQqFQKL6CUIJY8fXBRd4R5rzidetyY2OZ2AqnYKxa7dAfuFUaY6LRqJQGEqvHTCaTy+WQxArxysKe1GM4X3heNkOJbFYsqqzq+RsWwFi+E3wLs8zewuFwuVwWclbOTkhhqdqEUox/RZXGT6S2HnyELdkTT0/aKVyw1D6y7TKFjLANQIUyhmGPRCK1Wi0UCu3t7W1ubnIpoKErlQpuHnfv3q1Wq1euXInFYsIK3bp161vf+tbPf/7zBw8ekC1+69Yt6JtOpyNVoYwSxF/UiPvIYoABDveiSnFmjXG2xb+Pp5I/crwrvgDYRuS2PbQ9EQnsvsFkSJQI5rFQKORyOfwW1osQBqTrtmZZXOOZfJgb7V43n897vd5sNmM2Ho/HkLB4BIv3LhFBseURPnQ2m1GoLZfLXblyJZPJpNNpAoEQsjIhcwVwDR4MBs1ms9Pp1Gq109PT8Xg8mUzS6bQ8XPi5uGRwDTmizOqBESRE7WQyEXGxbRAUMOy2rxXzPzJk5n/Ck5wgQTsebevXWR5A8ljUsaZQKBQKhUKhUHw9oASx4inGYxSCATbhXGpJZK02o2pvLwwp20ynU3whyBQWOiCTyYzH47OzMwrQj0YjytYhrcX2t1arQYJ4nsdSfDAYwIoKlzqZTEajEfqv4XCIug013Gw2w5/X8zykXuPxmKX+2dlZJBIZjUaz2YwW4qqJaSYeFJyFEMRsieoNNTS8KhvYlDHsAyoz+BpbyxygIcyj9J+QRGIYyqVrt9uj0aher08mk2Kx6Hke1DMMy2w2a7fbp6enZ2dn7Xb7+vXrlUqFHYZCIc/zHMfpdDoPHjzwPK9UKkm9qWg0ajsR6+j4IsfguaMvsMG5VHKghthF+wnUwXvM8Ndb/6XgonEnnC9GvcwzsJBmRRzHYrFsNjsajRqNBrpdW6lqJ4XI5+JlLDbB4k1s2x3YvDPfMleIgYOYLXiet1wu+YrMjFwuh1CXsm+TyUTMjheLxcnJyU9+8pN79+5VKpWNjY2NjY1MJkOxO2TLzLHM20dHRycnJ71ebzAY4HTMEZntw+HwxsYGnvUQyvzQtg8OkO8ywfIgQHEcYMPlmtiGHvZvuQUknVDRzhiDd4Tw7HYiCKVEiXHyXDBr2Tk6+hQKhUKhUCgUiqcXShArvuZ4zJJVzBbszaTKlhSXF+5jMBiQ8iyCOJHxUoCIpTWpu6K6ZeE9Go3ggm2jTJF6cUQ8hdGCTafT4XAoNpTL5bLVag2HQxF8iUTu6OiIgnLiKSnSYATItl5PCt/DrUAHi8dxQN8n5aTkTAOUUMBvdN3fI6BoMysDTdd1R6NRr9dzXffXv/41hAVsDhcQ44hf/vKX+Xye7G85Sq/Xe//99weDwdHRUTabjcViw+Gw3W57nifEk1IVXxbsinN2x1jvLecOz4u0wAEJ5EX3V2/6V6EDmJU/j7HqyyGSxS2HOc2sXEcIpBFUm0wmUp5OVLQE0iSWxjRiVvJbu3KdWVkrSBv4FlZXarIlEgksbmR+Y/bDDiIWiyWTyUKhsFwuSU0YDof44YjIt9vttlqtd999N5fLbW1t7e/vb29vY/tD/xQC2vO8RqPR6/X4xHVdyuglEgm43VgsRv0313UHgwGeyLPZTPzl7VimeD7IhMx5idWyVKuzt7dl3bbuXuraCQdN+HC+gqSSyB0RFl4oZo3JKRQKhUKhUCgUXw8oQaz4euLx69XHmFGwEl6nPOAFxuPxuV8FTI0D23zkJ+s7NGss52w2syvI29s/4Q7PvQL2Dj/SLuAzvDscsdvtrmeO29o029hUvoXdbrVadh08JSm+akPPlv3absLn9tJ1OfC6MtGufPiJx77i8777DFibyofTTCaT1DcjhCa9gvJo8/k8k8kkk0nyJDzPSyaTSHGRskIQB0IF9pwg3vHCq85mM7sZRKcQ8KILlrpw7MTzPGakcDicy+WQ1g4Gg3a77bqu/yjwKYZBbrfb29vbyIE5kMiTyc+A7IYE53+5Dsh+Mbjv9/v9fp8EFGNMLBZj9rPZcLGkIPjHvzRYLo5tKyRhP35IIFAumhhocFnIYrGfgHKyi8UCo+Rutyul84R9Vo5YoVAoFAqFQqH4GkAJYoXioymPT/DVF9OYp31Nvk7Hfyb3RfHVGSzrnsLrOJfztR1gZDOzkp2ax8ZFFF/W3bdDZZI0AJmYSqXi8fhoNIIkhbXkX6xjCoWCMabZbGI3EYvFCoWCnZRg28HbQnIhUkUASwxpOp2alR+6lIyjptxkMoEaDq8gnK80CeOgdrvd7/exmxC3HGNMKpUyqxqe0+m01WqRSkIKCIS1JJqIFJpmmFXAD0sHWoUhsjGGWp3ooO15UhyZcQ3irOGIZTjgTQEjL8NHmFxJMcGegmQU9ux5njGGD6WuoKiSl8vlaDSSBtve0DoVKxQKhUKhUCgUXw8oQaxQKBSKLxOfmGBSjvgrC9sPBIFqPB6PxWI4zMxmM9yBhecdj8fdbhebHWzKM5lMNpu1K22uH0VcJsRvAR/22Wwm5d0gfyGFh8Oh53lQnPF4PJPJYMIr/CkmGK7rLpfLbrfb6/XwrjHGiNAY9hk6GLcHvOZnsxnnCFstmt/FCri648jM+ULpQg2LL5BtDSTUti2ihwfnCnBlMHzArR7WGLciPrSvnjg4j8djmkc9QBhqvOCFNLfdKsSIWb4yj3qJ6EhUKBQKhUKhUCieaihBrFAoFIqvFkQ0em4VRKCE1FcHUjzNrhpnVo7AwlRCI6LwlYpqEKmz2WwwGMRiMbuumlmZCNueEqIgtg8tlrgcUfoGbCY62dlsRtlPMYhPJBLJZBKCle2n0ynqWohdKYDJeVE+bjKZ2Na9dsE9IU+lnh4CYYwy4IjF25eWGGPkrKWqntipi0OF7V9PrVR+Jd4RYvvgOE4ymRRbfLmYcLtmpcHn21AoVCqV5vN5q9WiPp5kdUAlC4kvHveBgSkMtdxKHQ4KhUKhUCgUCsXTCCWIFQqFQvGVw2PcKhRf2VtmF6iEmkRpi4nteDyG+hSzCLPiK6XM5nQ6jUQisVgMKa6xqokGSEkpqilCXal6Z9PKZmVOImYX4hQc2AYiezKZYNGQTqdpuZhX0P75fI6PBA02K88H2/hC+irMuC0BFi4Vn41YLEZ1O7YJuEnQSPG1YAO2DNhH4FwBqb3uem8T2VxANoNNhgdH3w05LoS77Q5vlzmVFgb4YoVCoVAoFAqFQvGUQglihUKhUHy1oFzw04X1YpLmUTKU+m+9Xg+bXdkA/hFmFosDCOJkMgnrKmSrSGVFFSscNH9wFOwpjDG4PQh5in45mUzi8AtNHIvFMAimbl4kEoEhxe1BfH5FHG2M4VeUhhOJbjwe53Qo+CYWEwh7hcmVUo3CDot7hk3y2pfOdhPm3AO6YPMoRSu8eeC+2G2wS+2xcSKRKJVK6XR6PB53Oh2xjxDjDo6Ln4Yoi83K48VmkHXwKhQKhUKhUCgUTymUIFYoFAqFQvHJYRORxionCDM7mUxGo9Fiseh2u8vlEhcFm3U1xuCKi9i2UCjk8/lEIgHHKlSskKRm5R0hHsRSSK1erw8Gg0QiUalU4IJhaRHGplKpZDIZi8WgYguFQiKRcF0XW+TxeDwajbD3ZZ80lT1QdC6ZTEL+AponbZtMJvg2iOeDyJ8Dklt+a4xhG2mhXEkk1bYwWcyIheR1HMem0dFcC7GLp0SAR7alx0I0JxKJarWaTqebzSbl+zh3s5JdY5GBuzHNtn0/RJW87gOjUCgUCoVCoVAonhYoQaxQKBQKheKTQ/hKs6IOxfwBbtE2I8Z1AXLT9/3hcHh8fDwcDhOJBNXq0ul0oVCIRqP8NhwO26YKwm/CnMZiMfEIjsVi1LWLRqPJZBIVsDDRELWJRCKTyfDzbDZLUTjHcabTqed5HIjth8Mhbr8gGo1yLMdxEDvLmZoV/yskbzwet80rpNYcx02lUtTHQ4k8nU6poScl5uLxeDabFRWzCHVpj7heyMUXg2B+ImS9sLoitTYrM41IJAIjn06nqUEn5LhtOsxpTiaTTqczHA5FPixqaNsl/MlL1dmuFwqFQqFQKBQKheKrACWIFQqFQqFQfCoIM2h7DoBQKBSPx1Gk2u4EYuCAPlcExZC26HDPtdOVP4T25RMIYrPS/wqvKpypGPgaY7AbhgPlcKFQyPM8fmhWIl9Iahht6NcAFW5W4lz5CcfC5JezEzWxFMdLpVIQxJg2RKPRcDjseR5MdDweT6fTKILtK4NaWdhkKWEXuOBC0MsfKKn5A8qYo0tdO3sPdsU5ZMjz+Ry6XG6xXZLuY1HD6x1GoVAoFAqFQqFQfBWgBLFCoVAoFIpPBXhGY7GlQhqGQiGsfvH5pR5aJBLBJiKVShWLRSnOlkgkZAMhN0VLa1Y16KA+2YZDxGKxdDqNLQOaZT63i7PNZrPhcCjEdK/XQ9JLY0KhUCaTwbw4kUhMp9PBYOC6bq/Xc10X4hhalpaj4RWe2mZjaZgUo4MgRjsciUQymUwul0skEtFoNJPJZDKZ6XTa6XTa7bbrurQHApcz5VxisVgymcSMwvM87JLNiqfmJzDdUMy0gSKBbCPuELFYbLlcolyGtk4kEp7n2epj4bJ93x+NRqPRyPd9lNF2YUCbWbY9Qz4SShArFAqFQqFQKBRfKShBrFAoFAqF4pNDNLnGKm4mClzP83q93ng87vV66XQavwL4VmhWiEVIz2QyOZ1O+/0+tsIQrxCyD99aIhH4Yv4XKll42OFw6LouGlvP80KhEObC+CCPRiPXdYfDIebC4/EYjjW2AgQoh8MH2XXdSCQSj8exGKacHY3HJEGsh+WHAZ9fz/PYIBwO47Nh63Phi7lu7ISznkwm4jIsPLh4IsfjcS7IZDJxXZdt2L84BYtYmF/BLHMIyHpsJeQadjodCPFYLNbv99kD163dbne73XQ6nU6njTFSgi8QFVB2WKFQKBQKhUKheHqhBLFCoVAoFIpPBaH8hPrkj/l8PhqNWq0WZg6xWKzVauGKa1aaU9d1YYd9308kEr1eD82sWcmQEdLa5hJyXFv0KjSxeCOIJ4MUW5OvIGSl8hu8NsQrjHAikWAblLaQznCs4lNs12qzG2N/KxX2pOJct9ttNpvYSkSjUQ40nU5d18XFmHMJEO52tToON5/Pp9PpeDweDAaiuRZLDbtJtimE/IH3RSQS+eCDD5LJ5GQy6Xa7/Fur1dgbFD8MezweR4yMW7HQ9+d2A4VCoVAoFAqFQvF0QQlihUKhUCgUnxnEXELce4fDoXzb6XQu2t4YMxqN1jf4uEc3jzpdmIuJS/vQjuO4rsvfQrCaR+2VH2+2G2BLA00KbGPTyoGWnHuIcw0c+MTzPLNGnX/kJbLNoO2zQ/Ed+BDBtbgzf+SFVSgUCoVCoVAoFE8XlCBWKBQKhULxuWCdUZWychfhIzf4Apr6ydrwJGzp58Gofrb7vGhvX9Z9USgUCoVCoVAoFF8AQnoJFAqFQqFQKBQKhUKhUCgUCoXickIJYoVCoVAoFAqFQqFQKBQKhUKhuKRQglihUCgUCoVCoVAoFAqFQqFQKC4plCBWKBQKhUKhUCgUCoVCoVAoFIpLCiWIFQqFQqFQKBQKhUKhUCgUCoXikkIJYoVCoVAoFAqFQqFQKBQKhUKhuKRQglihUCgUCoVCoVAoFAqFQqFQKC4plCBWKBQKhUKhUCgUCoVCoVAoFIpLCiWIFQqFQqFQKBQKhUKhUCgUCoXikkIJYoVCoVAoFAqFQqFQKBQKhUKhuKRQglihUCgUCoVCoVAoFAqFQqFQKC4plCBWKBQKhUKhUCgUCoVCoVAoFIpLCiWIFQqFQqFQKBQKhUKhUCgUCoXikkIJYoVCoVAoFAqFQqFQKBQKhUKhuKRQglihUCgUCoVCoVAoFAqFQqFQKC4plCBWKBQKhUKhUCgUCoVCoVAoFIpLCiWIFQqFQqFQKBQKhUKhUCgUCoXikkIJYoVCoVAoFAqFQqFQKBQKhUKhuKRQglihUCgUCoVCoVAoFAqFQqFQKC4plCBWKBQKhUKhUCgUCoVCoVAoFIpLCiWIFQqFQqFQKBQKhUKhUCgUCoXikkIJYoVCoVAoFAqFQqFQKBQKhUKhuKRQglihUCgUCoVCoVAoFAqFQqFQKC4plCBWKBQKhUKhUCgUCoVCoVAoFIpLCiWIFQqFQqFQKBQKhUKhUCgUCoXikkIJYoVCoVAoFAqFQqFQKBQKhUKhuKRQglihUCgUCoVCoVAoFAqFQqFQKC4plCBWKBQKhUKhUCgUCoVCoVAoFIpLCiWIFQqFQqFQKBQKhUKhUCgUCoXikkIJYoVCoVAoFAqFQqFQKBQKhUKhuKRQglihUCgUCoVCoVAoFAqFQqFQKC4plCBWKBQKhUKhUCgUCoVCoVAoFIpLCiWIFQqFQqFQKBQKhUKhUCgUCoXikkIJYoVCoVAoFAqFQqFQKBQKhUKhuKRQglihUCgUCoVCoVAoFAqFQqFQKC4plCBWKBQKhUKhUCgUCoVCoVAoFIpLCiWIFQqFQqFQKBQKhUKhUCgUCoXikkIJYoVCoVAoFAqFQqFQKBQKhUKhuKRQglihUCgUCoVCoVAoFAqFQqFQKC4plCBWKBQKhUKhUCgUCoVCoVAoFIpLCiWIFQqFQqFQKBQKhUKhUCgUCoXikkIJYoVCoVAoFAqFQqFQKBQKhUKhuKRQglihUCgUCoVCoVAoFAqFQqFQKC4plCBWKBQKhUKhUCgUCoVCoVAoFIpLCiWIFQqFQqFQKBQKhUKhUCgUCoXikkIJYoVCoVAoFAqFQqFQKBQKhUKhuKRQglihUCgUCoVCoVAoFAqFQqFQKC4plCBWKBQKhUKhUCgUCoVCoVAoFIpLCiWIFQqFQqFQKBQKhUKhUCgUCoXikkIJYoVCoVAoFAqFQqFQKBQKhUKhuKRQglihUCgUCoVCoVAoFAqFQqFQKC4p/v98hPSF+tk+3wAAAABJRU5ErkJggg==)
Figure 1. A paediatric MEG system: a Experimental setup for three participants age 2- (left), 5- (centre) and 24-years (right). OPMs, housed in a modified bike helmet, measured the MEG signal. b Time-frequency spectra from a single (synthesised gradiometer) channel. Changes in neural oscillations are shown; blue indicates a reduction in oscillatory amplitude relative to baseline; yellow indicates an increase. Note reduction in beta (13–30 Hz) and mu (8–13 Hz) amplitude. c The spatial signature of beta modulation during the period of tactile stimulation (0 s < t < 2 s) (blue overlay)
How do EEG/MEG and fMRI relate?

- BOLD fMRI likely reflects presynaptic input to area
- EEG/MEG likely reflects postsynaptic response to those inputs
- (Logothetis et al., 2001) and (Logothetis & Wandell, 2004)
Manipulating the brain
- Interfering with it
- Stimulating it
Interfering with the brain
- Nature’s“experiments”
- Stroke, head injury, tumor
- Neuropsychology
Phineas Gage

Evaluating neuropsychological methods
- Logic: IF damage to area X impairs performance, THEN region critical for behavior Y
- Double dissociation: Damage to area Z leaves behavior Y intact
- Weak spatial/temporal resolution
Stimulating the brain
- Electrical (Direct Current Stimulation - DCS)
- Pharmacological
- Magnetic (Transcranial magnetic stimulation - TMS)
- Spatial/temporal resolution?
- Assume stimulation mimics natural activity?
Deep brain stimulation as therapy
- Depression
- Epilepsy
- Parkinson’s Disease

Optogenetics
- Gene splicing techniques insert light-sensitive molecules into neuronal membranes
- Application of light at specific wavelengths alters neuronal function
- Cell-type specific and temporally precise control
- Mimics brain activity
Simulating the brain
- Computer/mathematical models of brain function
- Example: neural networks
- Cheap, noninvasive, can be stimulated or “lesioned”

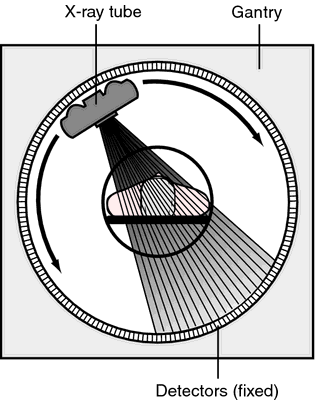
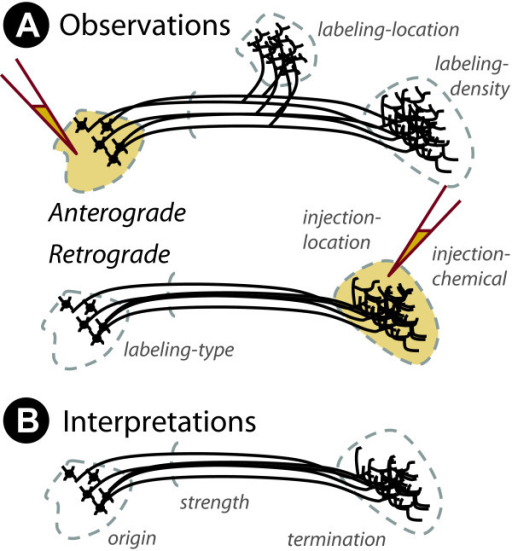
References
Amo, C., De Santiago, L., Zarza Luciáñez, D., León Alonso-Cortés, J. M., Alonso-Alonso, M., Barea, R., & Boquete, L. (2017). Induced gamma band activity from EEG as a possible index of training-related brain plasticity in motor tasks. PloS One, 12(10), e0186008. https://doi.org/10.1371/journal.pone.0186008
Hill, R. M., Boto, E., Holmes, N., Hartley, C., Seedat, Z. A., Leggett, J., … Brookes, M. J. (2019). A tool for functional brain imaging with lifespan compliance. Nature Communications, 10(1), 4785. https://doi.org/10.1038/s41467-019-12486-x
Hobson, H. M., & Bishop, D. V. M. (2017). The interpretation of mu suppression as an index of mirror neuron activity: Past, present and future. Royal Society Open Science, 4(3), 160662. https://doi.org/10.1098/rsos.160662
Lichtman, J. W., Livet, J., & Sanes, J. R. (2008). A technicolour approach to the connectome. Nature Reviews Neuroscience, 9(6), 417–422. https://doi.org/10.1038/nrn2391
Logothetis, N. K., Pauls, J., Augath, M., Trinath, T., & Oeltermann, A. (2001). Neurophysiological investigation of the basis of the fMRI signal. Nature, 412(6843), 150–157. https://doi.org/10.1038/35084005
Logothetis, N. K., & Wandell, B. A. (2004). Interpreting the BOLD signal. Annu. Rev. Physiol., 66(1), 735–769. https://doi.org/10.1146/annurev.physiol.66.082602.092845
Pomarol-Clotet, E., Canales-Rodrı́guez, E. J., Salvador, R., Sarró, S., Gomar, J. J., Vila, F., … McKenna, P. J. (2010). Medial prefrontal cortex pathology in schizophrenia as revealed by convergent findings from multimodal imaging. Mol. Psychiatry, 15(8), 823–830. https://doi.org/10.1038/mp.2009.146
Sejnowski, T. J., Churchland, P. S., & Movshon, J. A. (2014). Putting big data to good use in neuroscience. Nat. Neurosci., 17(11), 1440–1441. https://doi.org/10.1038/nn.3839
Sladky, R., Baldinger, P., Kranz, G. S., Tröstl, J., Höflich, A., Lanzenberger, R., … Windischberger, C. (2013). High-resolution functional MRI of the human amygdala at 7 T. European Journal of Radiology, 82(5), 728–733. https://doi.org/10.1016/j.ejrad.2011.09.025