511-cognition-language
Rick Gilmore
2021-11-05 13:30:56
The emergence of complex behavior
Cambrian Explosion
Sparked by behavioral imperatives? (Fox, 2016)
- Behavior requires energy
- Behavior requires perception at a distance
- Behavior requires action
- Actions require
- Problem solving, (sequence) planning
- Current + stored information (memory)
Behaviors realized through…
- Perception at a distance of what/where
- Locomotion
- Approach/avoid/explore
- Object manipulation/consumption
- Signaling/communication
- Physiological regulation
Complex behavior ~ Nervous systems
Cognition
Combines…
- Perception
- Attention
- Imagery
- Learning and conditioning
- Memory
- Problem-solving
- Language
Cognition and the cerebral cortex
Macrostructure
- Areas
- Unimodal sensory
- Polymodal association
- Motor
- Connections
- Association
- Commissural
Microstructure
- Columnar structure
- Cytoarchitectonic differerences (e.g. Brodmann)
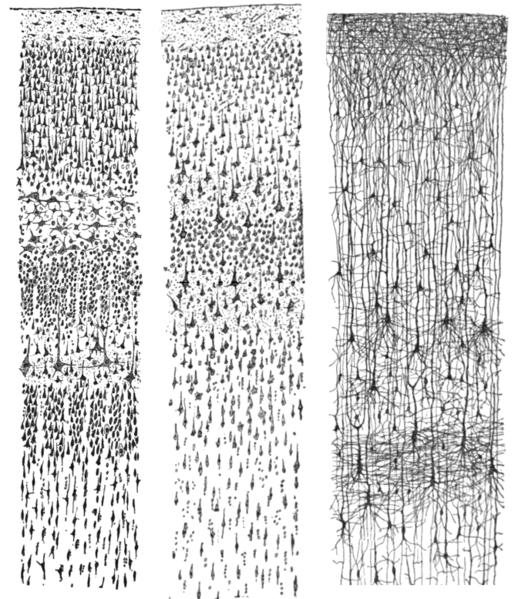
Wikipedia
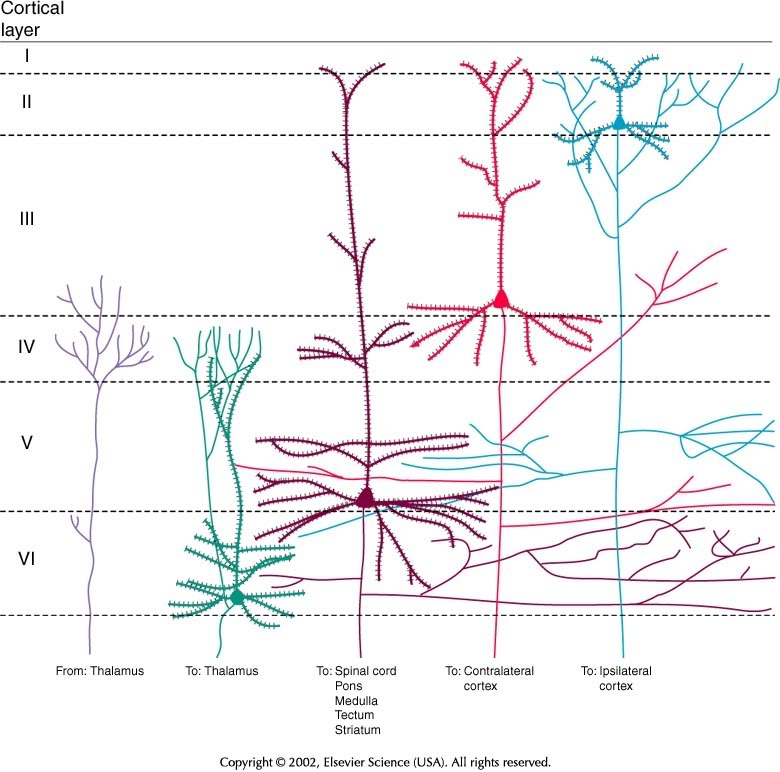
| Layer | Connection type | Comments |
|---|---|---|
| I | Few cell bodies | |
| II | Efferent | Ipsilateral association via large pyramidal cells |
| III | Efferent | Contralateral commissural |
| IV | Afferent | from thalamus; small stellate & granual cells; V1 has sublayers |
| V | Efferent | Superficial -> Basal ganglia; Deep -> brainstem, spinal cord; pyramidal cells |
| VI | Efferent | Thalamus |
Processing networks
(Bressler & Menon, 2010)“Although it has long been assumed that cognitive functions are attributable to the isolated operations of single brain areas, we demonstrate that the weight of evidence has now shifted in support of the view that cognition results from the dynamic interactions of distributed brain areas operating in large-scale networks….”
Data-driven dynamics
- Cortical states have high dimensionality
- Is there a lower-dimensional space that maps onto behavior?
(Shine et al., 2019)
- Data from \(n=200\) adult participants in Human Connectome Project (HCP)
- 7 cognitive tasks
- Dimension reduction via principal components analysis (PCA)
Fig. 1: Spatiotemporal PCA across multiple cognitive tasks. a, Spatial maps for the first five principal components (colored according to spatial weight; thresholded for visualization). b, Line plot representing the percentage of variance explained by first ten principal components; bar plot depicting the percentage (single value per component) of false nearest neighbors for first ten principal components. FNN, false nearest neighbors. c, Correspondence between convolved, concatenated task block regressor (gray) and the time course of the first five tPCs (black); color intensities of the blocks reflect the Pearson’s correlation between tPC1−5 and each of the unique task blocks (n = 100 subjects). d, Mean spatial loading of first five PCs, organized according to a set of predefined networks. DAN, dorsal attention; Vis, visual; FPN, frontoparietal; SN, salience; CO, cingulo-opercular; VAN, ventral attention; SM, somatomotor; RSp, retrosplenial; FTP, frontotemporal; DN, default mode; Aud, auditory.
- Map PCAs to time series…
Fig. 2: The low-dimensional signature across cognitive tasks. a, The procedure used to partition tPC1 into unique phases: low (blue), rise (red), high (orange), and fall (light blue). b, Scatter plot comparing the loading of tPC1 (colored according to the partition defined in a) with a temporal stability measure (defined by the similarity of the BOLD response at adjacent time points); we observed a significant positive Pearson’s correlation (r = 0.58) between |tPC1| and temporal stability (n=1,939 time points), providing heuristic evidence for attractor basins at the extremes of tPC1 engagement. c, A three-dimensional scatter plot comparing the first three tPCs; each node represents one time point (colored according to the phase of tPC1), with time implicitly unfolding across the embedding space (contiguous points connected by black line). d, The low-dimensional manifold traversed by the global brain state across the first three dimensions, with arrows depicting the direction of flow along the manifold.
- How do these brain states map to cognition?
- Explore overlap with NeuroSynth ‘topic families’
Fig. 3: The cognitive relevance of the low-dimensional embedding space. a, Four NeuroSynth ‘topic families’: motor (red), cognition (yellow), language (green), and memory (blue). b, Bar plot demonstrating loading (single-value) of topic families onto top five principal components. c, Scatter plot of time points of the first two tPCs, colored according to their loading onto each of the four NeuroSynth topic families. d, Mean value (resampled 100 times) of tPC1−2 for each topic family compared with a block resampled null distribution (5,000 iterations). e, Temporal conjunction between the topic families and the four phases of the tPC1 manifold; bar plots designate a single value (%) and asterisks denote P < 0.01 (block resampled null model; n=5,000 iterations).
The results of our multimodal analysis revealed that the neural activity required for the execution of cognitive tasks corresponds to flow within a low-dimensional state space43. Across multiple, diverse cognitive tasks, the dynamics of large-scale brain activity engage an integrative core of brain regions that maximizes information-processing complexity and facilitates cognitive performance; only to then dissipate as the tasks conclude, flowing towards a more segregated architecture…Across multiple cognitive tasks with markedly different behavioral requirements, the dynamics of human brain activity were found to occupy a low-dimensional state space embedding that may form the functional backbone of cognition in the human brain.
Summing up
- Cognition involves
- Do what, where, when, and how
- The “cognitive” cortex
- Processing networks
- Functional specialization
- Dynamic interaction
- Low dimensional dynamics
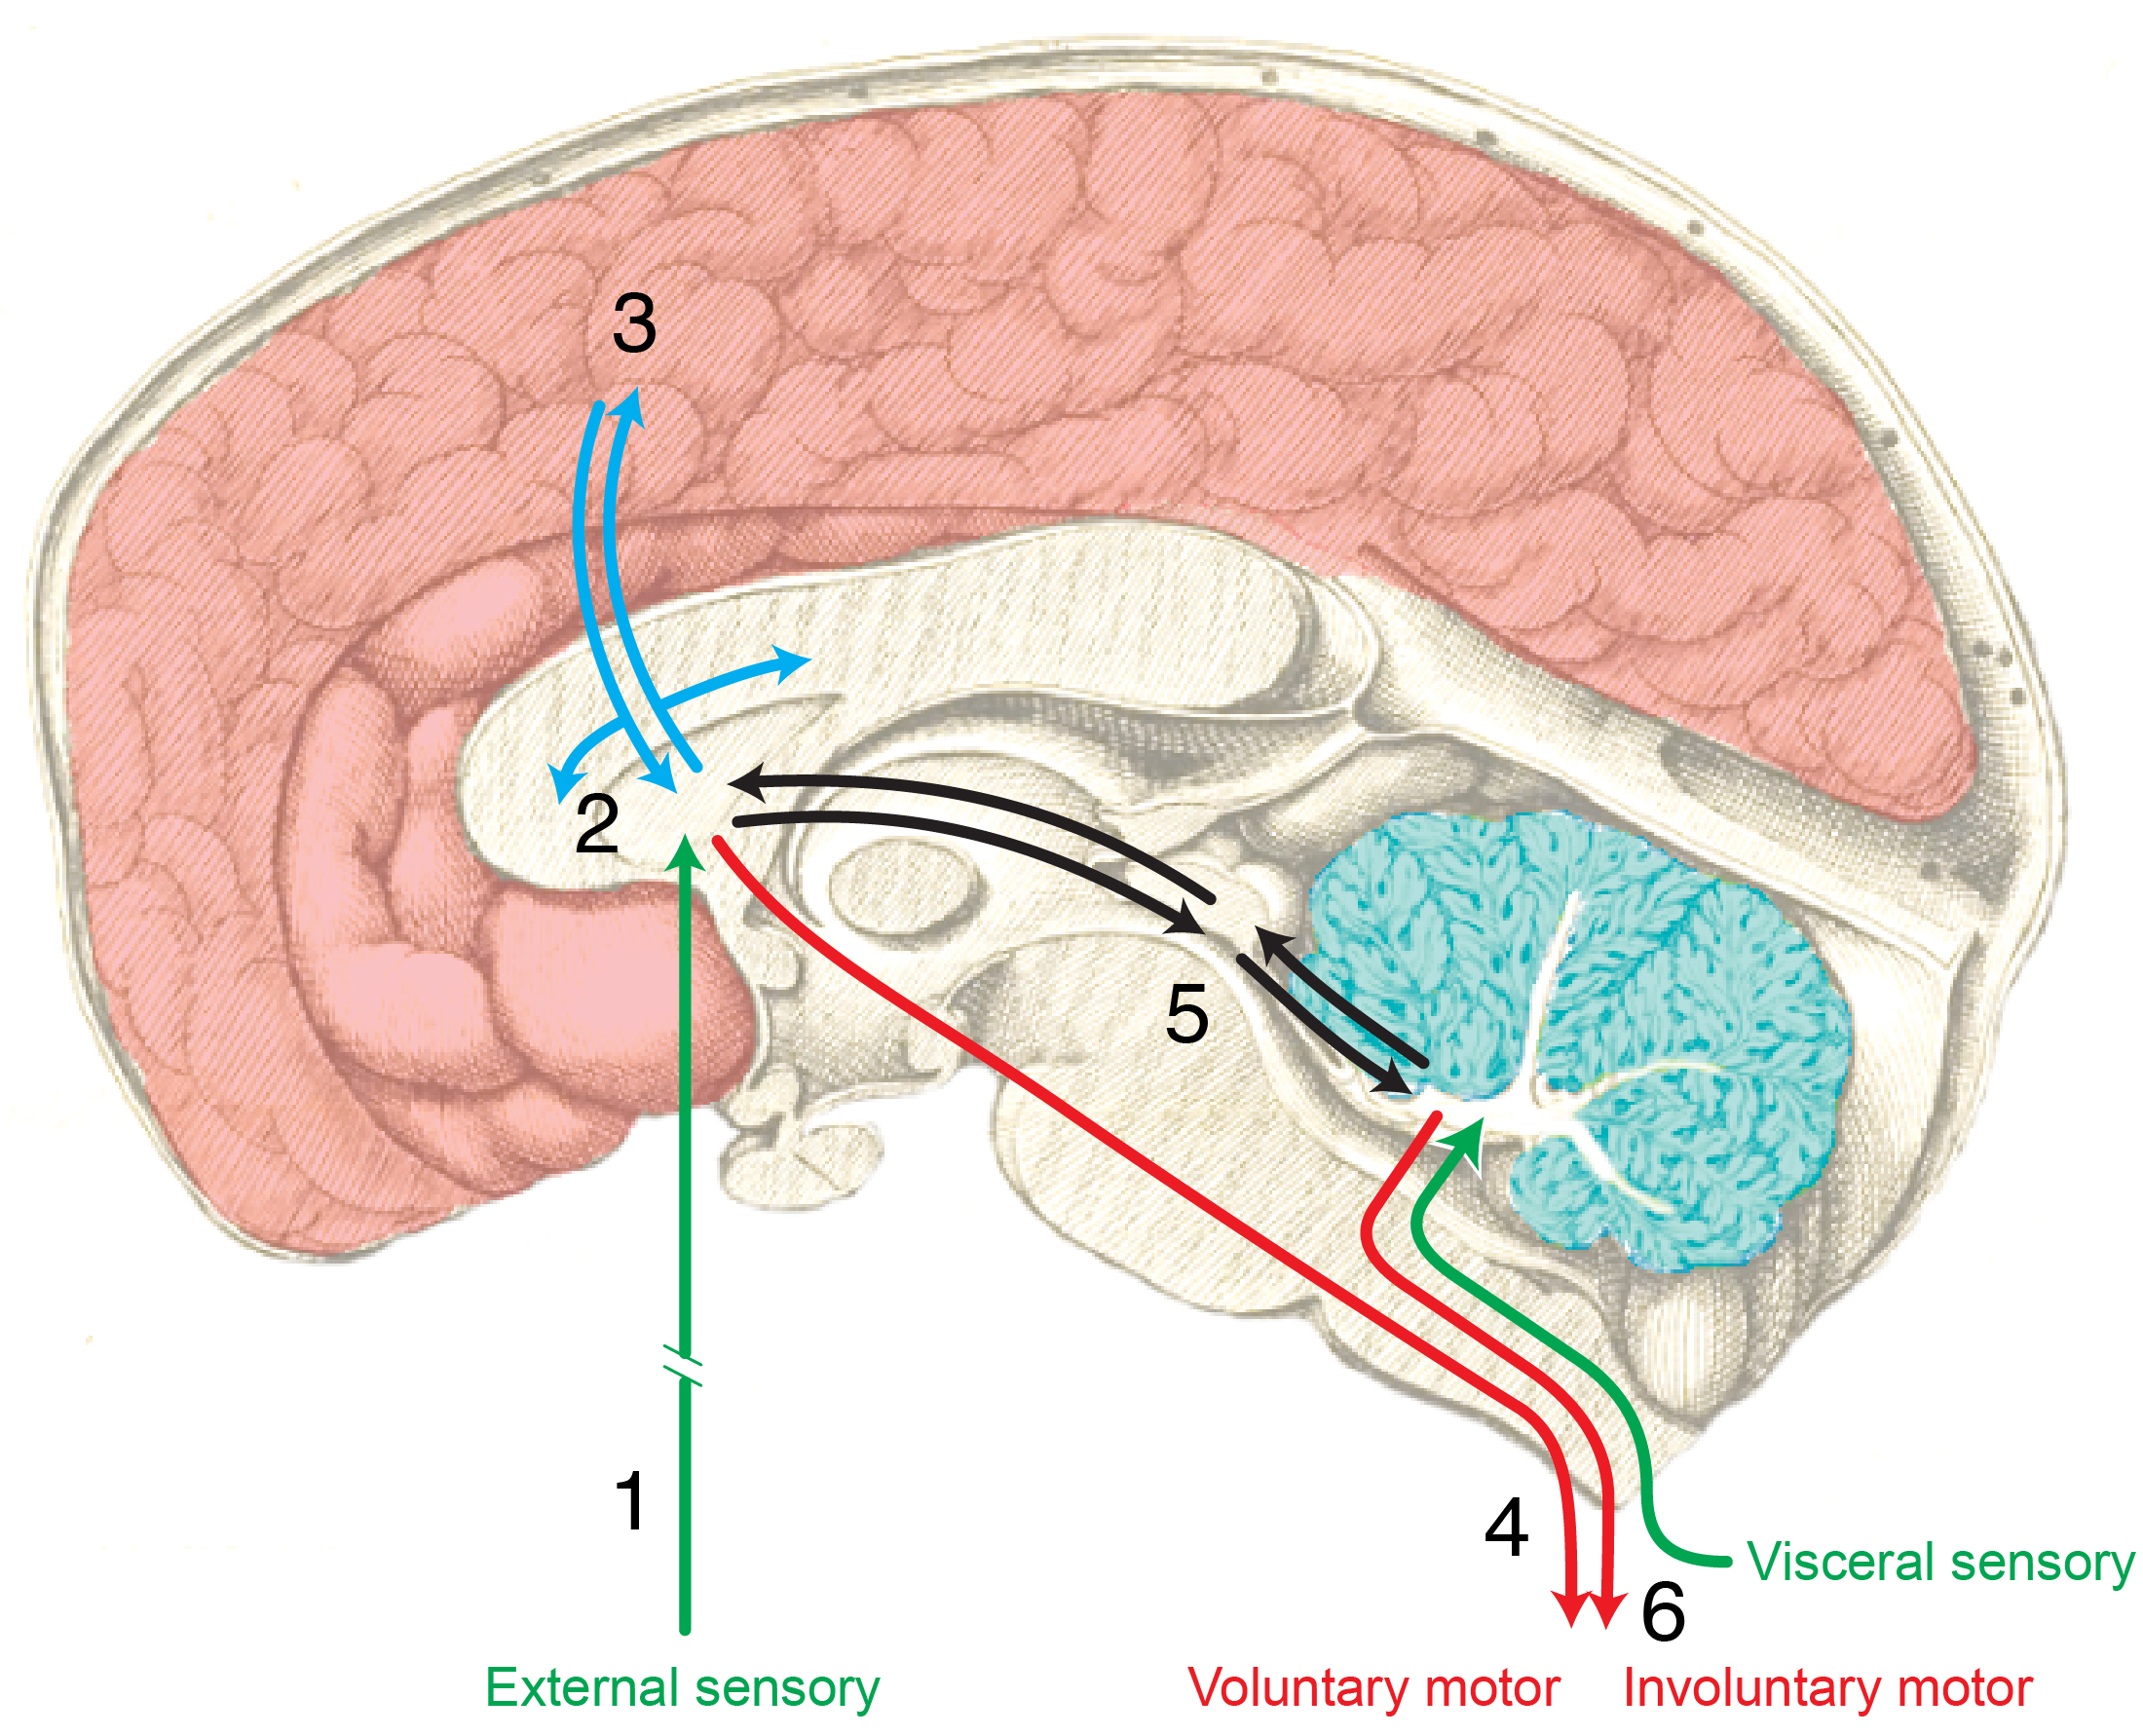
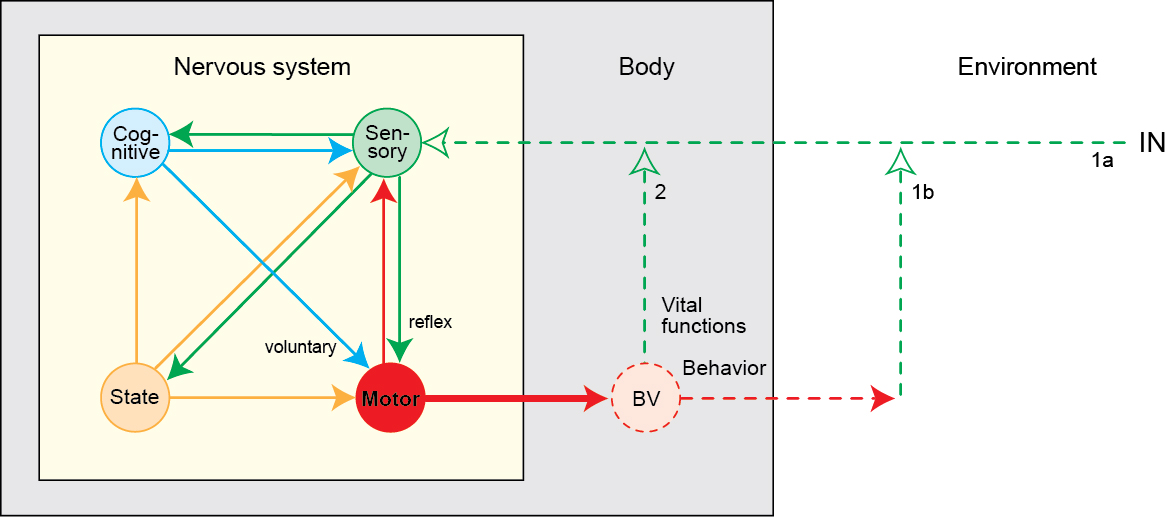
- Nested feedback control loops
![[@Powers1973-zn]](img/powers-5.2.png)
(Powers, 1973)
![[@Powers1973-zn]](img/powers-6.1.png)
(Powers, 1973)
- What do we want to know?
- What parts of the nervous system are evoked by cognitive process X? (localization)
- How does neural data support/undermine theory X of cognition?
- “…our survey nevertheless still makes it clear that very few resources are currently being devoted to using neuroimaging data to test theories about cognition.” (Tressoldi, Sella, Coltheart, & Umiltà, 2012)
- Also (Coltheart, 2013)
- Neuroscience can constrain models of cognition (White & Poldrack, 2013)
- One process or two
- Serial vs. parallel processing
- Show me your (cognitive) model…
Fig. 1. Illustration showing the durations of the four stages associated with problem solving. In the four example problems, the arrows denote new mathematical operators that participants had learned. In each stage, the axial slice (x = 0 mm, y = 0 mm, z = 28 mm in Talairach space) highlights brain regions in which activation in that stage was significantly greater than the average activation during problem solving. Brain images are displayed with the left hemisphere on the right-hand side.
Fig. 4. The four brain signatures placed in a 3-D space where the activity of a stage is a sum of the activity of the signature in the solving stage plus a sum of the three vectors weighted by their coordinates in the space. The heat maps illustrate the proportion of change in activation relative to baseline. The coordinates of the stages are as follows (in Talairach space)—encoding: x = 1.61, y = 0.37, z = 0.58; planning: x = 0.58, y = 0.28, z = 1.38; solving: x = 0, y = 0, z = 0; and responding: x = 0.37, y = 1.78, z = 0.28. Brain images are displayed with the left hemisphere on the right-hand side.
![[[@swanson2005anatomy]](http://dx.doi.org10.1002/cne.20733)](img/swanson-2005-fig-1.jpg)
![[[@swanson2005anatomy]](http://dx.doi.org10.1002/cne.20733)](img/swanson-2005-fig-8.jpg)
![[[@swanson2012brain]](https://books.google.com/books?hl=en&lr=&id=tAk8Rr00kykC&oi=fnd&pg=PP2&dq=larry+swanson+book&ots=5F7nEnts45&sig=DJLKh5BF_8aVqpOdK28Qmh1wr5Q#v=onepage&q=larry%20swanson%20book&f=false)](img/swanson-book-eye-limb.jpg)
![[[@swanson2012brain]](https://books.google.com/books?hl=en&lr=&id=tAk8Rr00kykC&oi=fnd&pg=PP2&dq=larry+swanson+book&ots=5F7nEnts45&sig=DJLKh5BF_8aVqpOdK28Qmh1wr5Q#v=onepage&q=larry%20swanson%20book&f=false)](img/swanson-book-rat-human-cortex.jpg)
![[[@swanson2012brain]](https://books.google.com/books?hl=en&lr=&id=tAk8Rr00kykC&oi=fnd&pg=PP2&dq=larry+swanson+book&ots=5F7nEnts45&sig=DJLKh5BF_8aVqpOdK28Qmh1wr5Q#v=onepage&q=larry%20swanson%20book&f=false)](img/swanson-book-fig-10.5.jpg)
![[[@swanson2012brain]](https://books.google.com/books?hl=en&lr=&id=tAk8Rr00kykC&oi=fnd&pg=PP2&dq=larry+swanson+book&ots=5F7nEnts45&sig=DJLKh5BF_8aVqpOdK28Qmh1wr5Q#v=onepage&q=larry%20swanson%20book&f=false)](img/swanson-book-fig-10.12.jpg)
![[[@swanson2012brain]](https://books.google.com/books?hl=en&lr=&id=tAk8Rr00kykC&oi=fnd&pg=PP2&dq=larry+swanson+book&ots=5F7nEnts45&sig=DJLKh5BF_8aVqpOdK28Qmh1wr5Q#v=onepage&q=larry%20swanson%20book&f=false)](img/swanson-2005-fig-3.jpg)
![[[@swanson2005anatomy]](http://dx.doi.org10.1002/cne.20733)](img/swanson-2005-fig-x.jpg)
![[[@swanson2005anatomy]](http://dx.doi.org10.1002/cne.20733)](img/swanson-2005-fig-y.jpg)
![[[@swanson2005anatomy]](http://dx.doi.org10.1002/cne.20733)](img/swanson-2005-fig-z.jpg)
![[[@swanson2005anatomy]](http://dx.doi.org10.1002/cne.20733)](img/swanson-2005-fig-a.jpg)
![[[@bressler2010large]](http://dx.doi.org/10.1016/j.tics.2010.04.004)](img/bressler-2010-fig-a.jpg)
![[[@bressler2010large]](http://dx.doi.org/10.1016/j.tics.2010.04.004)](img/bressler-2010-fig-2.jpg)
![[[@bressler2010large]](http://dx.doi.org/10.1016/j.tics.2010.04.004)](img/bressler-2010-fig-5.jpg)
![[[@bressler2010large]](http://dx.doi.org/10.1016/j.tics.2010.04.004)](img/bressler-2010-fig-6.jpg)
![[[@Shine2019-lh]](http://dx.doi.org/10.1038/s41593-018-0312-0)](https://media.springernature.com/lw685/springer-static/image/art%3A10.1038%2Fs41593-018-0312-0/MediaObjects/41593_2018_312_Fig1_HTML.png?as=webp)
![[[@Shine2019-lh]](http://dx.doi.org/10.1038/s41593-018-0312-0)](https://media.springernature.com/lw685/springer-static/image/art%3A10.1038%2Fs41593-018-0312-0/MediaObjects/41593_2018_312_Fig2_HTML.png?as=webp)
![[[@Shine2019-lh]](http://dx.doi.org/10.1038/s41593-018-0312-0)](https://media.springernature.com/lw685/springer-static/image/art%3A10.1038%2Fs41593-018-0312-0/MediaObjects/41593_2018_312_Fig3_HTML.png?as=webp)
![[[@Anderson2016-bx]](http://dx.doi.org/10.1177/0956797616654912)](https://journals.sagepub.com/na101/home/literatum/publisher/sage/journals/content/pssa/2016/pssa_27_9/0956797616654912/20180821/images/large/10.1177_0956797616654912-fig1.jpeg)
![[[@Anderson2016-bx]](http://dx.doi.org/10.1177/0956797616654912)](https://journals.sagepub.com/na101/home/literatum/publisher/sage/journals/content/pssa/2016/pssa_27_9/0956797616654912/20180821/images/large/10.1177_0956797616654912-fig4.jpeg)


![[[@Hickok2007-rc]](http://doi.org/10.1038/nrn2113)](img/hickock-poeppel-2007.jpg)
![[[@Hagoort2014-au]](http://doi.org/10.1146/annurev-neuro-071013-013847)](img/hagoort-indefrey-fig1a.jpg)
![[[@Hagoort2014-au]](http://doi.org/10.1146/annurev-neuro-071013-013847)](img/hagoort-indefrey-fig1b.jpg)
![[[@Hagoort2014-au]](http://doi.org/10.1146/annurev-neuro-071013-013847)](img/hagoort-indefrey-fig1c.jpg)
![[[@Hagoort2014-au]](http://doi.org/10.1146/annurev-neuro-071013-013847)](https://www.annualreviews.org/na101/home/literatum/publisher/ar/journals/content/neuro/2014/neuro.2014.37.issue-1/annurev-neuro-071013-013847/20140711/images/large/ne370347.f2.jpeg)
![[[@Hagoort2014-au]](http://doi.org10.1146/annurev-neuro-071013-013847)](img/hagoort-indefrey-fig2a.jpg)