Bipolar Disorder & Schizophrenia

PSY 511.001 Spr 2026

Rick Gilmore

Department of Psychology

Preliminaries

Figure 1: MariahCareyVEVO (2010)

Announcements

Today’s topics

  • Warm-up
  • Bipolar disorder
  • Schizophrenia

Warm-up

Which neurotransmitter undergirds most excitatory neurotransmission in the CNS?

  • A. GABA
  • B. ACh
  • C. DA
  • D. Glu

Answer

  • A. GABA
  • B. ACh
  • C. DA
  • D. Glu

Which neurotransmitter plays a modulatory role in the CNS, and an excitatory role in the PNS?

  • A. GABA
  • B. ACh
  • C. DA
  • D. Glu

Answer

  • A. GABA
  • B. ACh
  • C. DA
  • D. Glu

NTs that play modulatory roles most often act via this type of receptor.

  • A. Ionotropic
  • B. Voltage-gated
  • C. Transporter
  • D. Metabotropic

Answer

  • A. Ionotropic
  • B. Voltage-gated
  • C. Transporter
  • D. Metabotropic

Bipolar (BP) disorder

Background on BP

  • Formerly “manic depression” or “manic depressive disorder”
  • Alternating mood states
    • Mania or hypomania (milder form)
    • Depression

Background on BP

Source: NIMH

Source: NIMH

Background on BP

  • 1-3% lifetime prevalence, subthreshold affects another ~2% (Merikangas et al., 2007)
  • Subtypes
    • Bipolar I: manic episodes, possible depressive ones
    • Bipolar II: no manic episodes but hypomania (disinhibition, irritability/agitation) + depression

Background on BP

  • Psychosis (hallucinations or delusions)
  • Anxiety, attention-deficit hyperactivity disorder (ADHD)
  • Substance abuse

(Neuro)biology of BP

Figure 2: Bourque et al. (2024)

Genetics of BP

  • 40-70% concordance (higher in some samples)
  • Polygenic (many risk alleles)
  • BP and schizophrenia overlap (Craddock & Sklar, 2013)
Figure 3: Pettersson et al. (2019) Figure 1

Genetics of BP

  • Genes for voltage-gated Ca++ channels
    • Regulate NT, hormone release
    • Gene expression, cell metabolism
  • Craddock & Sklar (2013); Cross-Disorder Group of the Psychiatric Genomics Consortium (2013)

Brain activation changes

  • Areas linked to…
    • cognitive control \(\downarrow\)
    • emotion regulation \(\uparrow\)
Figure 4: Maletic & Raison (2014) Figure 2

Brain structure

  • Volume
    • Amygdala, hippocampus, thalamus \(\downarrow\)
    • ventricles \(\uparrow\)
Figure 5: Ching et al. (2022) Figure 4a
Figure 6: Ching et al. (2022) Figure 5
  • Cerebral cortex thinner
    • BP vs. healthy controls (a)
    • BP on anti-convulsant (c)
  • But, thicker for BP on Li (b)

Brain structure

  • White matter altered
Figure 7: Ching et al. (2022) Figure 7

Toward a unified model

Figure 8: Magioncalda & Martino (2022) Figure 2.

Therapies for BP

  • Psychotherapy
  • Electroconvulsive Therapy (ECT)
  • Sleep medications
  • Drugs

Drugs

  • Anti-depressants not especially effective (Gitlin, 2018; Sidor & MacQueen, 2012)
    • May destablize mood
  • Anticonvulsants
    • Typically used to treat epilepsy
    • Usually GABA-A receptor agonists
    • e.g. lamotrigine (Lamictal)
  • Atypical antipsychotics

Drugs

  • Mood stabilizers

Lithium (Li)

  • “Discovered” accidentally in 1948
  • John Cade
    • Injected manic patients’ urine with a lithium compound (chemical stabilizer) into guinea pig test animals
    • Had calming effect
  • Earliest effective medication for treating mental illness

Wikipedia

Wikipedia

Li effects

  • Malhi, Tanious, Das, Coulston, & Berk (2013)
    • Reduces mania, minimal effects on depressive states
    • Preserves volume of prefrontal cortex (PFC), hippocampus, amygdala
    • downregulates DA, glutamate; upregulates GABA
  • levels can be tested/monitored via blood test

Systematic Treatment Enhancement Program for Bipolar Disorder (STEP-BD) cohort

Systematic Treatment Enhancement Program for Bipolar Disorder (STEP-BD) cohort

ENIGMA BD working group

Figure 9: Bi, Che, & Bai (2022) Figure 11

BP summed-up

  • Changes in mood, but ≠ major depressive disorder
  • Genetic + environmental risk
  • Changes in emotion processing, cognition, size of hippocampus
  • Heterogeneous
  • No simple link to a specific NT system

From a neurobiological perspective there is no such thing as bipolar disorder. Rather, it is almost certainly the case that many somewhat similar, but subtly different, pathological conditions produce a disease state that we currently diagnose as bipolarity…

Maletic & Raison (2014)

From a neurobiological perspective there is no such thing as bipolar disorder. Rather, it is almost certainly the case that many somewhat similar, but subtly different, pathological conditions produce a disease state that we currently diagnose as bipolarity

Maletic & Raison (2014)

This heterogeneity – reflected in the lack of synergy between our current diagnostic schema and our rapidly advancing scientific understanding of the condition – limits attempts to articulate an integrated perspective on bipolar disorder.

Maletic & Raison (2014)

Schizophrenia (SCZ)

Figure 10: Neuroslicer (2007)
Figure 11: TheMentallight (2010)

Background on SCZ

  • Lifetime prevalence ~ 0.3-0.7%
    • Broader definitions suggest 2-3 or 3-5%
  • ~1/3 chronic & severe
  • Onset post-puberty, early adulthood

Background on SCZ

  • Males: Earlier onset & greater severity
  • Pervasive disturbance in mood, thinking, movement, action, memory, perception
  • Increased (early) mortality

“Positive” symptoms

  • “Additions” to behavior
  • Disordered thought
  • Delusions of grandeur, persecution
  • Hallucinations (usually auditory)
  • Bizarre behavior

“Negative” symptoms

  • “Reductions” in behavior
  • Poverty of speech
  • Flat affect
  • Social withdrawal
  • Anhedonia (loss of pleasure)
  • Catatonia (reduced movement)

Cognitive symptoms

  • Memory
  • Attention
  • Planning, decision-making
  • Social cognition
  • Movement

Affective dysregulation

  • Depressive, manic states
Figure 12: Os & Kapur (2009) Figure 12
Figure 13: Os & Kapur (2009) Figure 23

Biological bases

  • Genetic predisposition
  • Brain abnormalities
  • Neurochemical factors
  • Developmental origins

Genetic predisposition

  • Heritability >50%
Figure 14: Pettersson et al. (2019) Figure 1

Genetic risk

Figure 15: Johnson et al. (2017)

Ventricles larger, esp in males

Suddath, Christison, Torrey, Casanova, & Weinberger (1990) Figure 2

Suddath et al. (1990) Figure 24

Enlargement increases across time

Figure 16: Davis et al. (1998) Figure 2
Figure 17: Davis et al. (1998) Figure 3

Enlargement precedes diagnosis?

Kempton, Stahl, Williams, & DeLisi (2010)

Kempton et al. (2010)

Kempton et al. (2010)

Kempton et al. (2010)

Brain structure

  • Hippocampus, amygdala, thalamus, nucleus accumbens (NAc; ventral striatum) smaller
  • Related to ventricular enlargement?
  • Early disturbance in brain development?
Figure 18: Erp et al. (2015) Figure 1

White matter disruption

Figure 19: Kelly et al. (2017)

White matter loss over age

Figure 20: Kochunov et al. (2016) Figure 2

Disruptions heterogenous

Compared to the healthy comparison group, the schizophrenia group showed widespread reductions in FA and CT, involving virtually all white matter tracts and cortical regions. Paradoxically, however, no more than 15–20% of patients deviated from the normative range for any single tract or region…Thus, while infra-normal deviations were common among patients, their anatomical loci were highly inconsistent between individuals.

Lv et al. (2021)

Disconnectivity in cortical networks

Figure 21: Uhlhaas (2013)

Connectivity findings inconsistent

  • Fornito & Bullmore (2015)
  • Reduced structural connectivity vs.
    • Synaptic, dendritic, axonal connections b/w regions
    • Usually measured via DTI or related diffusion-based MRI technique
  • Increased functional connectivity
    • BOLD, EEG, or MEG covariance
    • Task-free ‘resting’ state or task-based
Figure 22: Fornito & Bullmore (2015) Figure 15

Global signal variations

Figure 23: Yang et al. (2014) Figure 16
Figure 24: Yang et al. (2014) Figure 27

Disconnectivity b/w ‘hubs’

  • But higher functional connectivity overall
Figure 25: Fornito & Bullmore (2015)

Comparing neural measures

Figure 26: Porter et al. (2023) Figure 28.

Figure 27: Porter et al. (2023) Figure 39.
Figure 28: Porter et al. (2023) Figure 510

Interestingly, at present most modalities perform similarly in the classification of psychosis, with slight advantages for rs-FC relative to structural modalities in some specific cases. Notably, results differed substantially across studies, with suggestions of biased effect sizes, particularly highlighting the need for more studies using external prediction and large sample sizes.

Porter et al. (2023)

Neurochemical factors

  • Dopamine (DA) hypothesis
  • Glutamate (Glu) hypothesis

Dopamine (DA) hypothesis

Evidence for…

  • DA (\(D_2\) receptor) antagonists (e.g. chlorpromazine)
    • improve positive symptoms
  • Typical antipsychotics are DA \(D_2\) antagonists
  • DA agonists
    • amphetamine, cocaine, L-DOPA
    • mimic or exacerbate symptoms

Evidence against…

  • Newer, atypical antipsychotics
    • (e.g. Clozapine) increase DA in frontal cortex, affect 5-HT
  • Mixed evidence for high DA metabolite levels in CSF
  • Some DA neurons may release 5-HT, cannabinoids, glutamate (Seutin, 2005)

Glutamate/ketamine hypothesis

  • Psychomimetic drugs induce schizophrenia-like states
    • Phencyclidine (PCP), ketamine
    • NMDA-R (receptor) antagonists

Ketamine

  • dissociative (secondary) anesthetic
  • side effects
    • hallucinations, blurred vision, delirium, floating sensations, vivid dreams
Figure 29: Sleigh, Harvey, Voss, & Denny (2014)

Ketamine

Sleigh et al. (2014)

Sleigh et al. (2014)

Glutamate hypothesis

  • Schizophrenia \(\rightarrow\) underactivation of NMDA receptors?
    • Recall: NMDA-R role in learning, plasticity
  • NMDA-R antagonists \(\rightarrow\) neurodegeneration, excitotoxicity, & apoptosis

DA -> Glu -> GABA networks

  • Howes, Bukala, & Beck (2023)
  • DA dysfunction in striatum coupled to cortical Glu + GABA levels
  • Cortical disinhibition of striatum

The data show that the disorder is characterized by lower levels of glutamate, GABA and dopamine in the frontal cortex, and potentially other cortical regions; higher levels of glutamate in the basal ganglia and thalamus; and greater dopamine synthesis and release capacity in the basal ganglia relative to healthy individuals. Moreover, connections among some of these alterations indicate a key role for fronto-thalamo-striatal–midbrain circuits in the pathophysiology of the disorder.

Howes et al. (2023)

Developmental origins

  • Gray matter loss in adolescence
  • Early life stress

Developmental origins

  • Rapid gray matter loss in adolescents in adolescents with early onset SCZ

Thompson et al. (2001)

Thompson et al. (2001)

Early life stressors

Early life stress

  • Levine, Levav, Pugachova, Yoffe, & Becher (2016)
    • Children (N=51,233) of parents who born during Nazi era (1922-1945)
    • Emigrated before (indirect exposure) or after (direct exposure) Nazi era
    • Children exposed to direct stress in utero or postnatally
      • Did not differ in rates of schizophrenia, but
      • Had higher re-hospitalization rates

Early life stress

  • Danish cohort (n=1,141,447), Debost et al. (2015)
    • Exposure to early life stress
      • in utero did not increase risk of schizophrenia, but
      • stress during 0-2 years increased risk
    • Increased risk associated with cortisol-related (CORT) gene

Summing up SCZ

  • Wide-ranging disturbance of mood, thought, action, perception
  • Broad changes in brain structure, function, chemistry, linked to development
  • (Simplistic) dopamine hypothesis giving way to signalling network (DA + Glu + GABA) models
  • Genetic (polygenic = multiple genes) risk + environmental factors
Figure 30: Howes et al. (2023) Figure 4
Figure 31: Howes et al. (2023) Figure 2

Prospects

Outcomes following hospitalization

Figure 32: Os & Kapur (2009) Figure 312

Biomarkers

Figure 33: Kraguljac et al. (2021) Table 1

Novel therapies

VR-assisted therapy

Short-term findings showed that both interventions produced significant improvements in AVH severity and depressive symptoms. Although results did not show a statistically significant superiority of VRT over CBT for AVH, VRT did achieve larger effects particularly on overall AVH (d = 1.080 for VRT and d = 0.555 for CBT). Furthermore, results suggested a superiority of VRT over CBT on affective symptoms.

Dellazizzo et al. (2021)

VRT also showed significant results on persecutory beliefs and quality of life. Effects were maintained up to the 1-year follow-up. VRT highlights the future of patient-tailored approaches that may show benefits over generic CBT for voices. A fully powered single-blind randomized controlled trial comparing VRT to CBT is underway.

Dellazizzo et al. (2021)

AI and Machine Learning

  • Deep Neural Network used to identify functional brain signatures in a genetic disorder (DiGeorge syndrome; 22q11.2 deletion syndrome) linked to psychotic symptoms (Supekar et al., 2024)

The future of psychiatric research

Figure 34: Tamminga et al. (2014) Figure 113

Wrap-up

Main points

  • BP and SCZ separable, but related
  • Reduced brain volume, thickness, connectivity
  • Mood stabilizers (e.g., Li) + psychotherapy often effective BP treatments
  • Can measure Li via blood test, but not Glu, DA, GABA
  • DA hypothesis of SCZ \(\rightarrow\) glutamate hypothesis

Next time

  • Disorder & disease II

Resources

About

This talk was produced using Quarto, using the RStudio Integrated Development Environment (IDE), version 2026.1.0.392.

The source files are in R and R Markdown, then rendered to HTML using the revealJS framework. The HTML slides are hosted in a GitHub repo and served by GitHub pages: https://psu-psychology.github.io/psy-511-scan-fdns-2026-spring/

References

Baldessarini, R. J., Pompili, M., & Tondo, L. (2006). Suicide in Bipolar Disorder: Risks and Management. CNS Spectrums, 11(06), 465–471. https://doi.org/10.1017/S1092852900014681
Bi, B., Che, D., & Bai, Y. (2022). Neural network of bipolar disorder: Toward integration of neuroimaging and neurocircuit-based treatment strategies. Translational Psychiatry, 12(1), 143. https://doi.org/10.1038/s41398-022-01917-x
Bisso, E., Signorelli, M. S., Milazzo, M., Maglia, M., Polosa, R., Aguglia, E., & Caponnetto, P. (2020). Immersive virtual reality applications in schizophrenia spectrum therapy: A systematic review. International Journal of Environmental Research and Public Health, 17(17). https://doi.org/10.3390/ijerph17176111
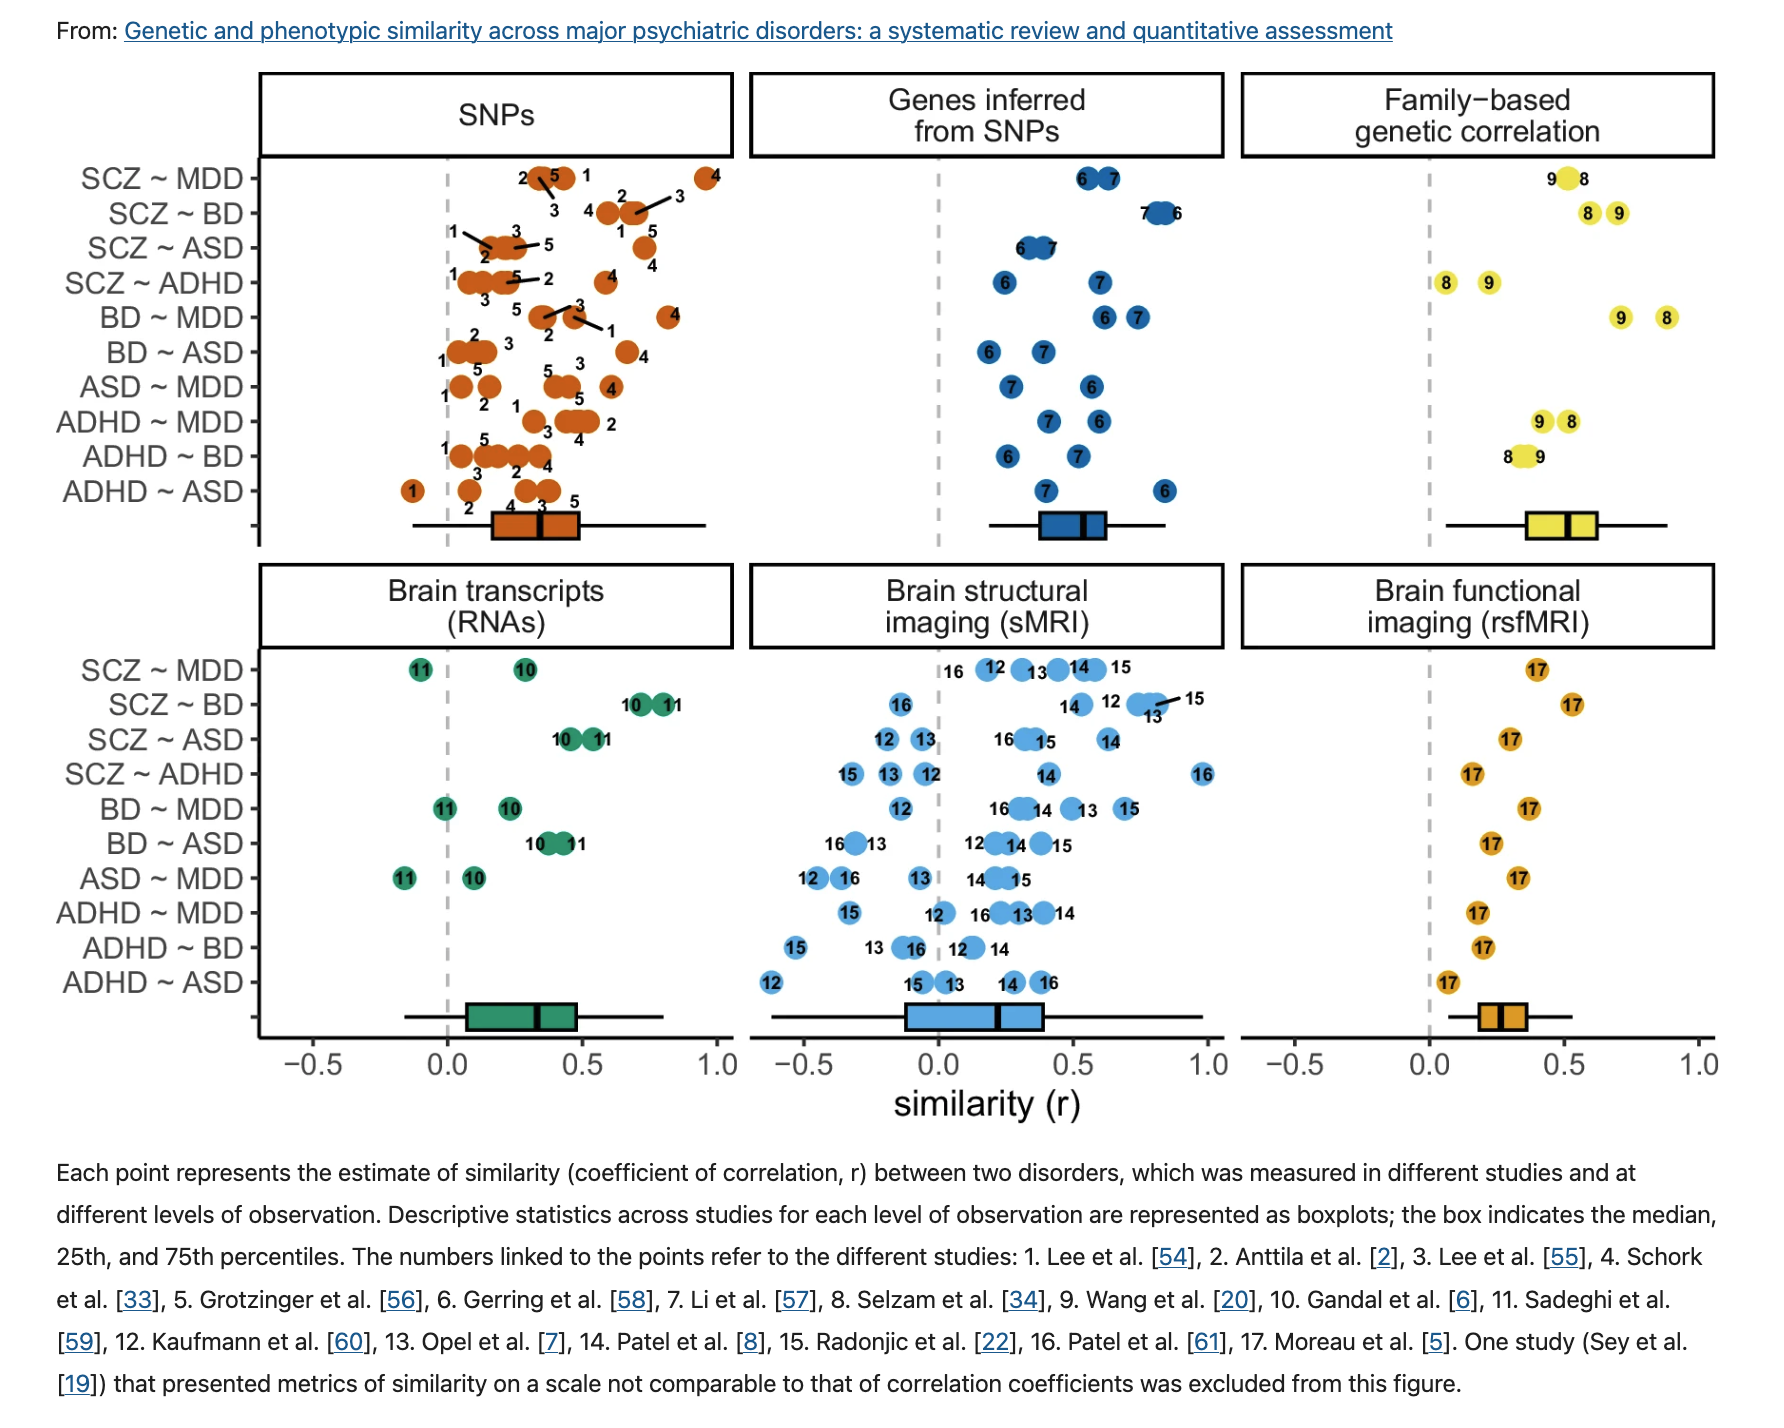
Bourque, V.-R., Poulain, C., Proulx, C., Moreau, C. A., Joober, R., Forgeot d’Arc, B., … Jacquemont, S. (2024). Genetic and phenotypic similarity across major psychiatric disorders: A systematic review and quantitative assessment. Translational Psychiatry, 14, 171. https://doi.org/10.1038/s41398-024-02866-3
Brown, A. S., & Derkits, E. J. (2010). Prenatal infection and schizophrenia: A review of epidemiologic and translational studies. The American Journal of Psychiatry, 167, 261–280. https://doi.org/10.1176/appi.ajp.2009.09030361
Cantor-Graae, E., & Selten, J.-P. (2005). Schizophrenia and migration: A meta-analysis and review. The American Journal of Psychiatry, 162(1), 12–24. https://doi.org/10.1176/appi.ajp.162.1.12
Ching, C. R. K., Hibar, D. P., Gurholt, T. P., Nunes, A., Thomopoulos, S. I., Abé, C., … ENIGMA Bipolar Disorder Working Group. (2022). What we learn about bipolar disorder from large-scale neuroimaging: Findings and future directions from the ENIGMA bipolar disorder working group. Human Brain Mapping, 43(1), 56–82. https://doi.org/10.1002/hbm.25098
Craddock, N., & Sklar, P. (2013). Genetics of bipolar disorder. The Lancet, 381(9878), 1654–1662. https://doi.org/10.1016/S0140-6736(13)60855-7
Cross-Disorder Group of the Psychiatric Genomics Consortium. (2013). Identification of risk loci with shared effects on five major psychiatric disorders: A genome-wide analysis. The Lancet, 381(9875), 1371–1379. https://doi.org/10.1016/S0140-6736(12)62129-1
Davis, K. L., Buchsbaum, M. S., Shihabuddin, L., Spiegel-Cohen, J., Metzger, M., Frecska, E., … Powchik, P. (1998). Ventricular enlargement in poor-outcome schizophrenia. Biological Psychiatry, 43(11), 783–793. https://doi.org/10.1016/s0006-3223(97)00553-2
Debost, J.-C., Petersen, L., Grove, J., Hedemand, A., Khashan, A., Henriksen, T., … Mortensen, P. B. (2015). Investigating interactions between early life stress and two single nucleotide polymorphisms in HSD11B2 on the risk of schizophrenia. Psychoneuroendocrinology, 60, 18–27. https://doi.org/10.1016/j.psyneuen.2015.05.013
Dellazizzo, L., Potvin, S., Phraxayavong, K., & Dumais, A. (2021). One-year randomized trial comparing virtual reality-assisted therapy to cognitive-behavioral therapy for patients with treatment-resistant schizophrenia. NPJ Schizophrenia, 7(1), 9. https://doi.org/10.1038/s41537-021-00139-2
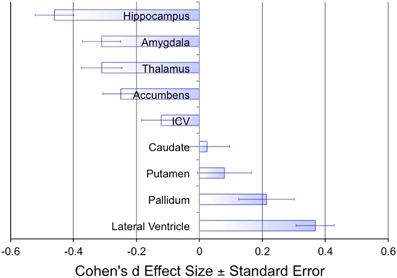
Erp, T. G. M. van, Hibar, D. P., Rasmussen, J. M., Glahn, D. C., Pearlson, G. D., Andreassen, O. A., … Turner, J. A. (2015). Subcortical brain volume abnormalities in 2028 individuals with schizophrenia and 2540 healthy controls via the ENIGMA consortium. Mol. Psychiatry. https://doi.org/10.1038/mp.2015.63
Fornito, A., & Bullmore, E. T. (2015). Reconciling abnormalities of brain network structure and function in schizophrenia. Curr. Opin. Neurobiol., 30, 44–50. https://doi.org/10.1016/j.conb.2014.08.006
Forte, M. F., Oliva, V., De Prisco, M., Garriga, M., Bitanihirwe, B., Alameda, L., … Garcia-Rizo, C. (2024). Obstetric complications and psychopathology in schizophrenia: A systematic review and meta-analysis. Neuroscience and Biobehavioral Reviews, 167, 105913. https://doi.org/10.1016/j.neubiorev.2024.105913
Geddes, J. R., & Miklowitz, D. J. (2013). Treatment of bipolar disorder. The Lancet, 381(9878), 1672–1682. https://doi.org/10.1016/S0140-6736(13)60857-0
Gitlin, M. J. (2018). Antidepressants in bipolar depression: An enduring controversy. International Journal of Bipolar Disorders, 6(1), 25. https://doi.org/10.1186/s40345-018-0133-9
Howes, O. D., Bukala, B. R., & Beck, K. (2023). Schizophrenia: From neurochemistry to circuits, symptoms and treatments. Nature Reviews. Neurology. https://doi.org/10.1038/s41582-023-00904-0
Johnson, E. C., Border, R., Melroy-Greif, W. E., Leeuw, C. A. de, Ehringer, M. A., & Keller, M. C. (2017). No evidence that schizophrenia candidate genes are more associated with schizophrenia than noncandidate genes. Biol. Psychiatry, 82(10), 702–708. https://doi.org/10.1016/j.biopsych.2017.06.033
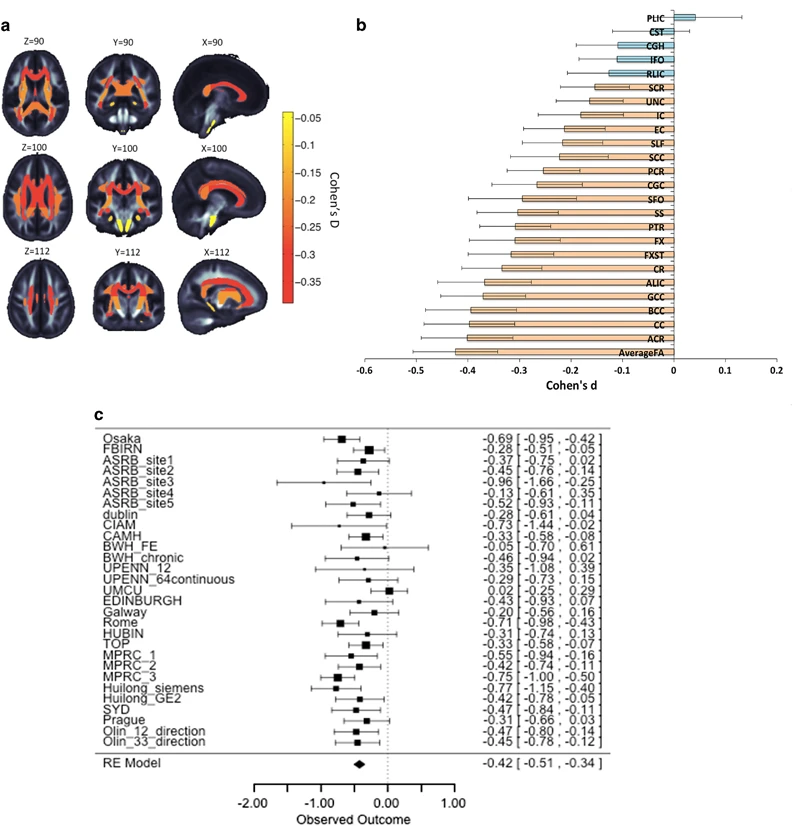
Kelly, S., Jahanshad, N., Zalesky, A., Kochunov, P., Agartz, I., Alloza, C., … Donohoe, G. (2017). Widespread white matter microstructural differences in schizophrenia across 4322 individuals: Results from the ENIGMA schizophrenia DTI working group. Mol. Psychiatry. https://doi.org/10.1038/mp.2017.170
Kempton, M. J., Stahl, D., Williams, S. C. R., & DeLisi, L. E. (2010). Progressive lateral ventricular enlargement in schizophrenia: A meta-analysis of longitudinal MRI studies. Schizophr. Res., 120(1-3), 54–62. https://doi.org/10.1016/j.schres.2010.03.036
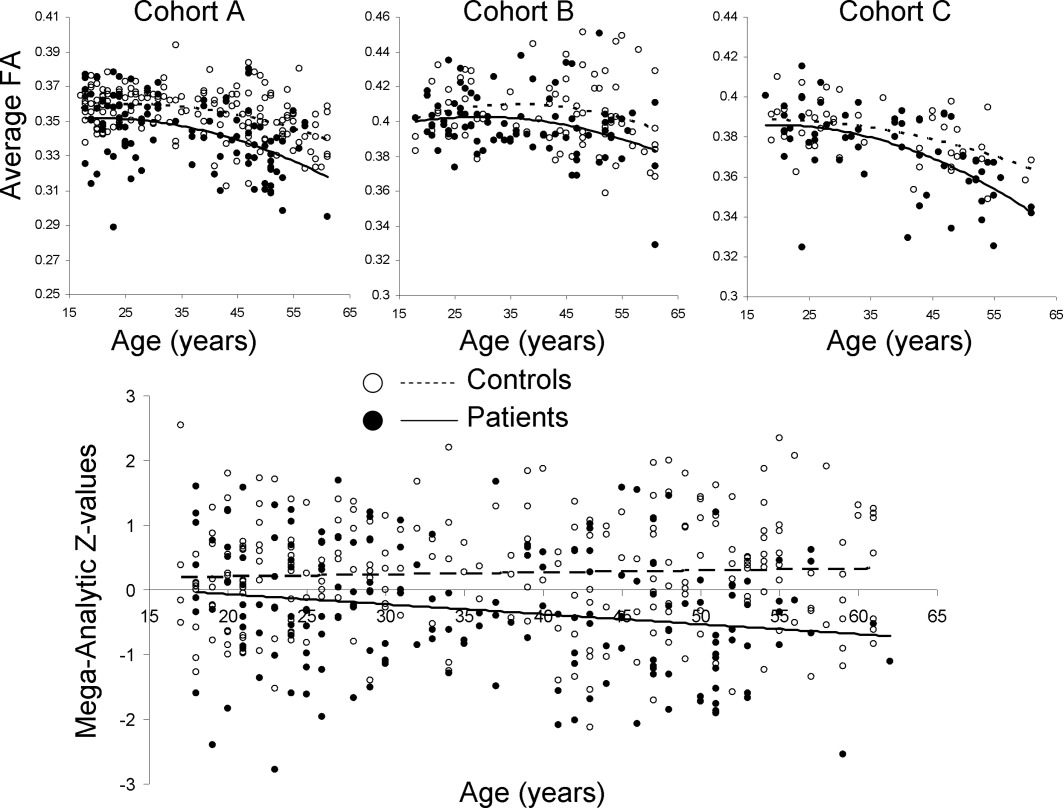
Kochunov, P., Ganjgahi, H., Winkler, A., Kelly, S., Shukla, D. K., Du, X., … Hong, L. E. (2016). Heterochronicity of white matter development and aging explains regional patient control differences in schizophrenia. Hum. Brain Mapp., 37(12), 4673–4688. https://doi.org/10.1002/hbm.23336
Kraguljac, N. V., McDonald, W. M., Widge, A. S., Rodriguez, C. I., Tohen, M., & Nemeroff, C. B. (2021). Neuroimaging biomarkers in schizophrenia. The American Journal of Psychiatry, 178(6), 509–521. https://doi.org/10.1176/appi.ajp.2020.20030340
Levine, S. Z., Levav, I., Pugachova, I., Yoffe, R., & Becher, Y. (2016). Transgenerational effects of genocide exposure on the risk and course of schizophrenia: A population-based study. Schizophrenia Research, 176(2), 540–545. https://doi.org/10.1016/j.schres.2016.06.019
Lv, J., Di Biase, M., Cash, R. F. H., Cocchi, L., Cropley, V. L., Klauser, P., … Zalesky, A. (2021). Individual deviations from normative models of brain structure in a large cross-sectional schizophrenia cohort. Molecular Psychiatry, 26(7), 3512–3523. https://doi.org/10.1038/s41380-020-00882-5
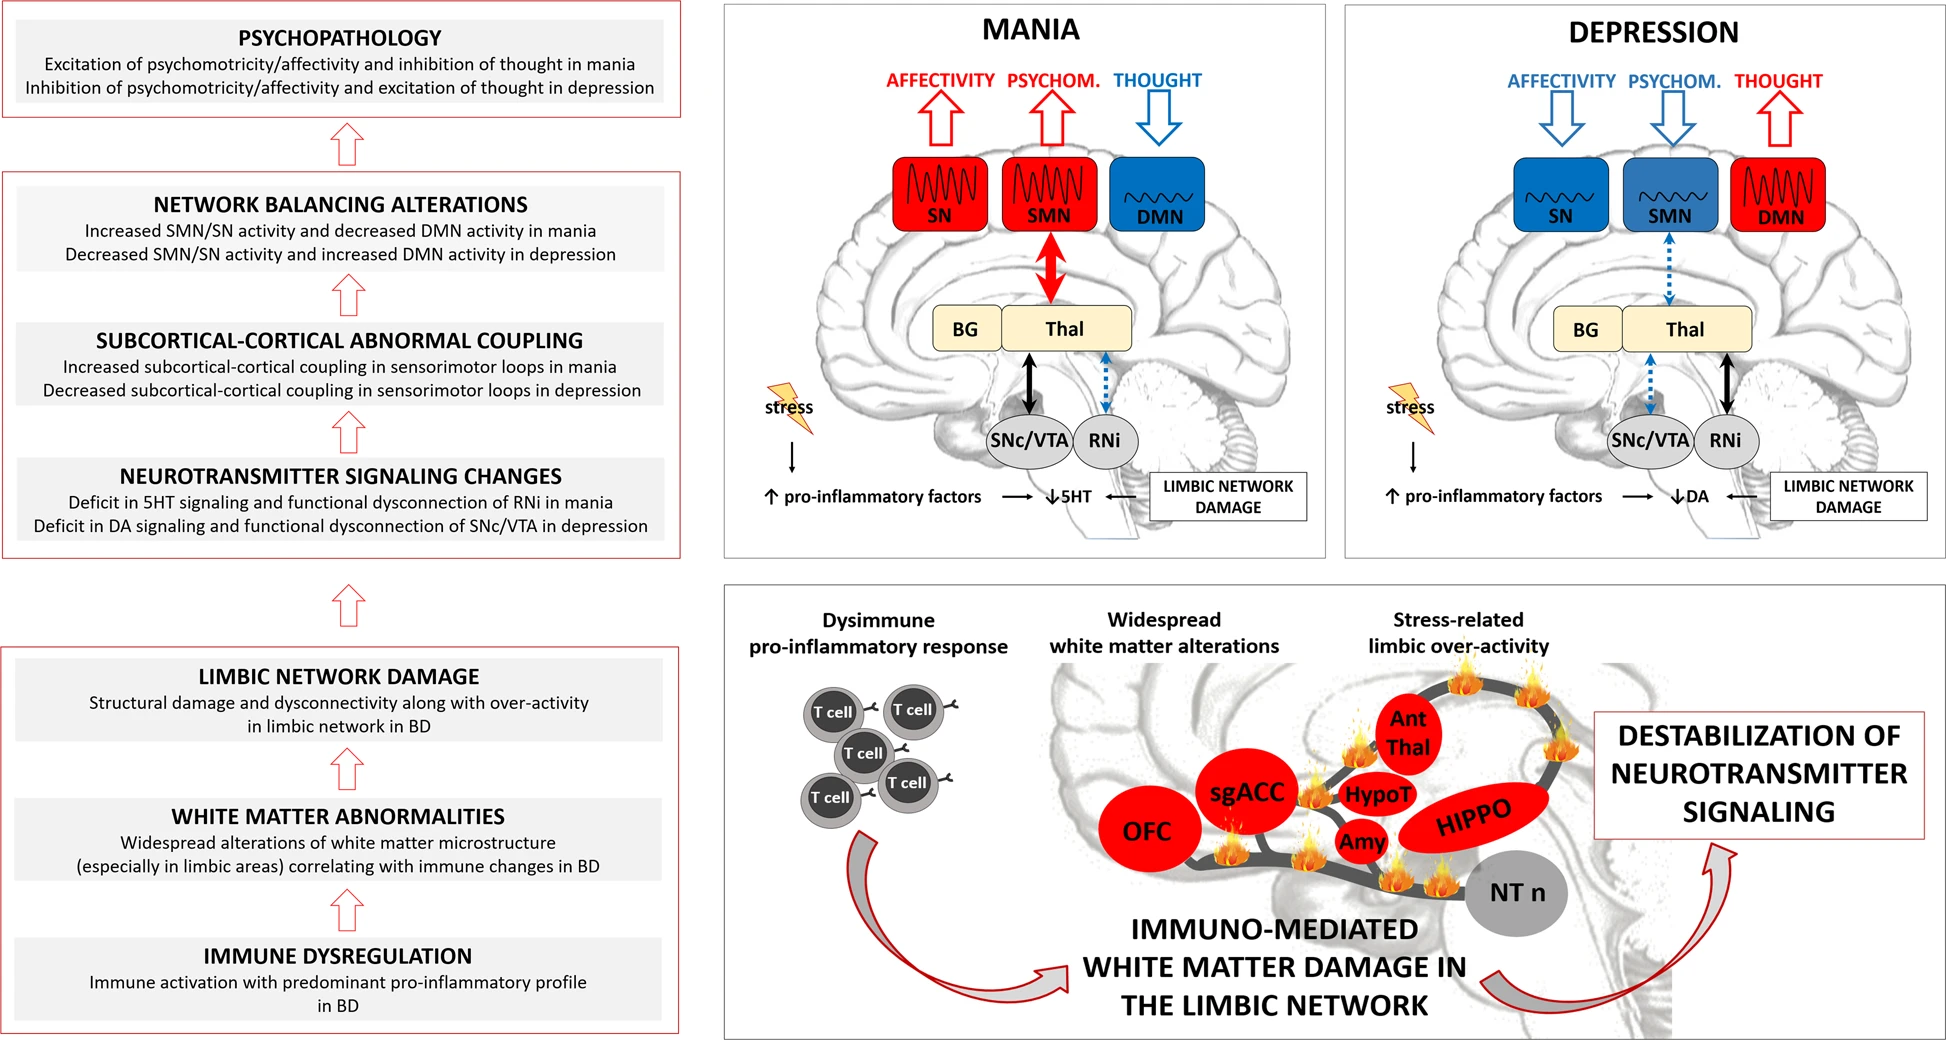
Magioncalda, P., & Martino, M. (2022). A unified model of the pathophysiology of bipolar disorder. Molecular Psychiatry, 27(1), 202–211. https://doi.org/10.1038/s41380-021-01091-4
Maletic, V., & Raison, C. (2014). Integrated neurobiology of bipolar disorder. Frontiers in Psychiatry / Frontiers Research Foundation, 5, 98. https://doi.org/10.3389/fpsyt.2014.00098
Malhi, G. S., Tanious, M., Das, P., Coulston, C. M., & Berk, M. (2013). Potential Mechanisms of Action of Lithium in Bipolar Disorder. CNS Drugs, 27(2), 135–153. https://doi.org/10.1007/s40263-013-0039-0
MariahCareyVEVO. (2010). Mariah carey - I’ll be there (MTV unplugged - HD video). YouTube. Retrieved from https://www.youtube.com/watch?v=UIt3dx4an9c&list=RDUIt3dx4an9c&start_radio=1
Merikangas, K. R., Akiskal, H. S., Angst, J., Greenberg, P. E., Hirschfeld, R. M. A., Petukhova, M., & Kessler, R. C. (2007). Lifetime and 12-month prevalence of bipolar spectrum disorder in the national comorbidity survey replication. Archives of General Psychiatry, 64(5), 543–552. https://doi.org/10.1001/archpsyc.64.5.543
Neuroslicer. (2007). Schizophrenia: Gerald, part 1. YouTube. Retrieved from https://www.youtube.com/watch?v=gGnl8dqEoPQ
Os, J. van, & Kapur, S. (2009). Schizophrenia. The Lancet, 374(9690), 635–645. https://doi.org/10.1016/S0140-6736(09)60995-8
Pettersson, E., Lichtenstein, P., Larsson, H., Song, J., Attention Deficit/Hyperactivity Disorder Working Group of the iPSYCH-Broad-PGC Consortium, Autism Spectrum Disorder Working Group of the iPSYCH-Broad-PGC Consortium, Bipolar Disorder Working Group of the PGC, Eating Disorder Working Group of the PGC, Major Depressive Disorder Working Group of the PGC, Obsessive Compulsive Disorders and Tourette Syndrome Working Group of the PGC, Schizophrenia CLOZUK, Substance Use Disorder Working Group of the PGC, Agrawal, A., … Polderman, T. J. C. (2019). Genetic influences on eight psychiatric disorders based on family data of 4 408 646 full and half-siblings, and genetic data of 333 748 cases and controls. Psychological Medicine, 49, 1166–1173. https://doi.org/10.1017/S0033291718002039
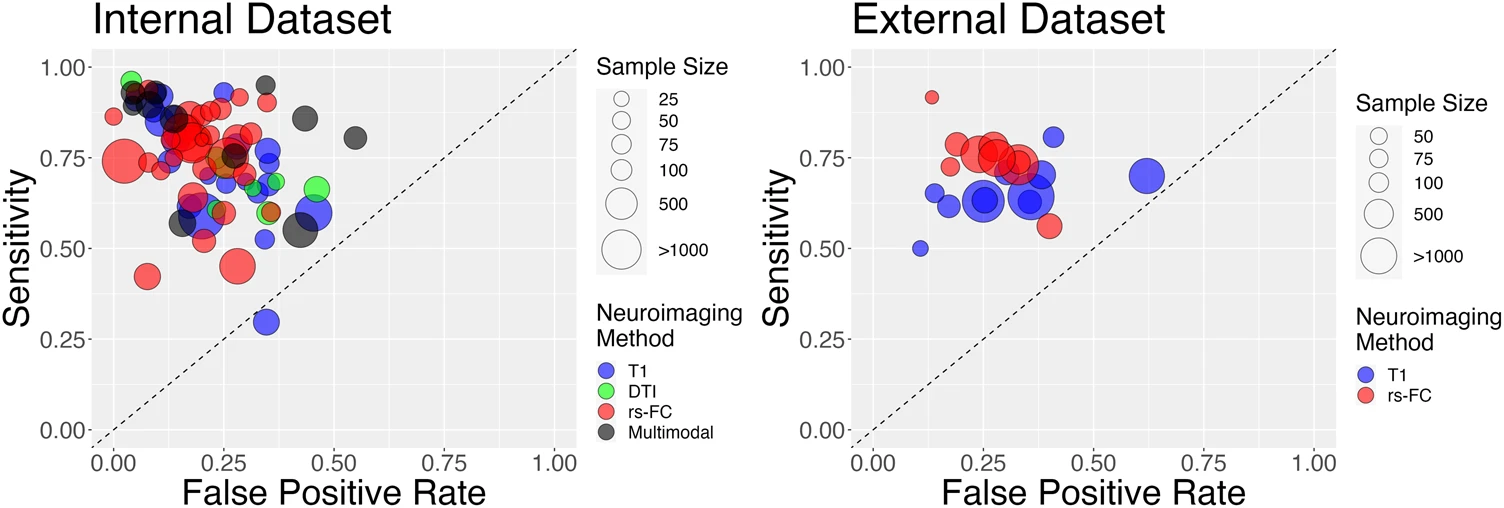
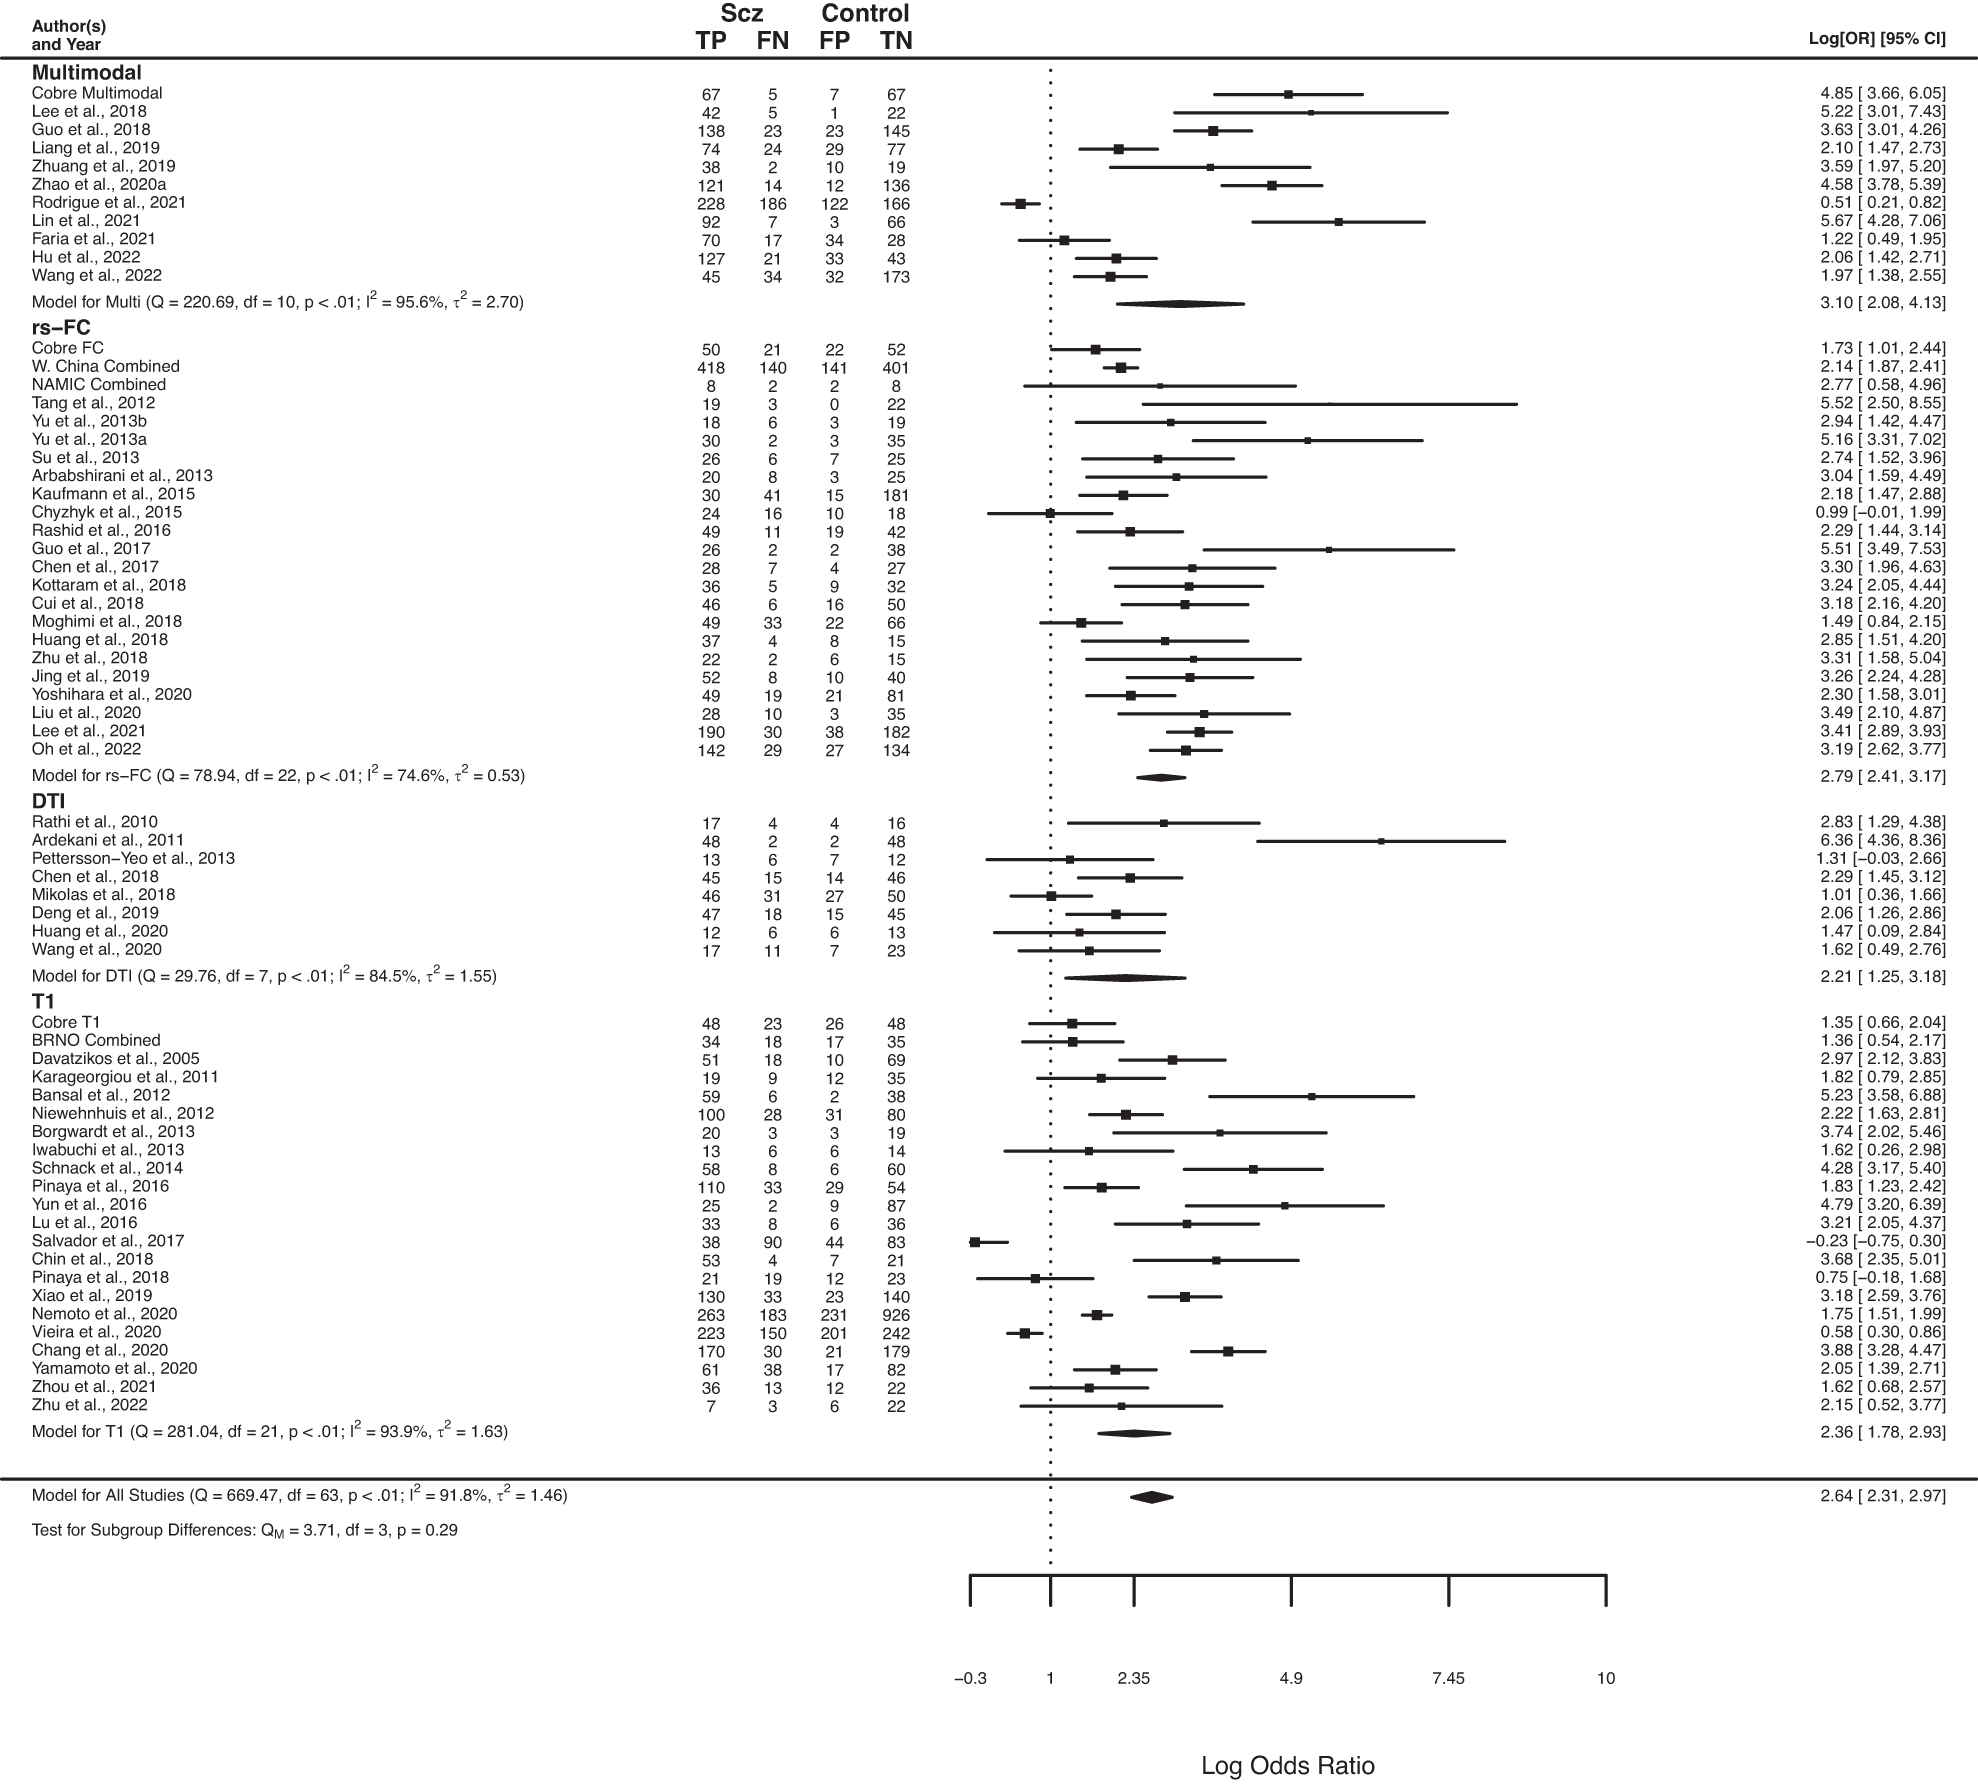
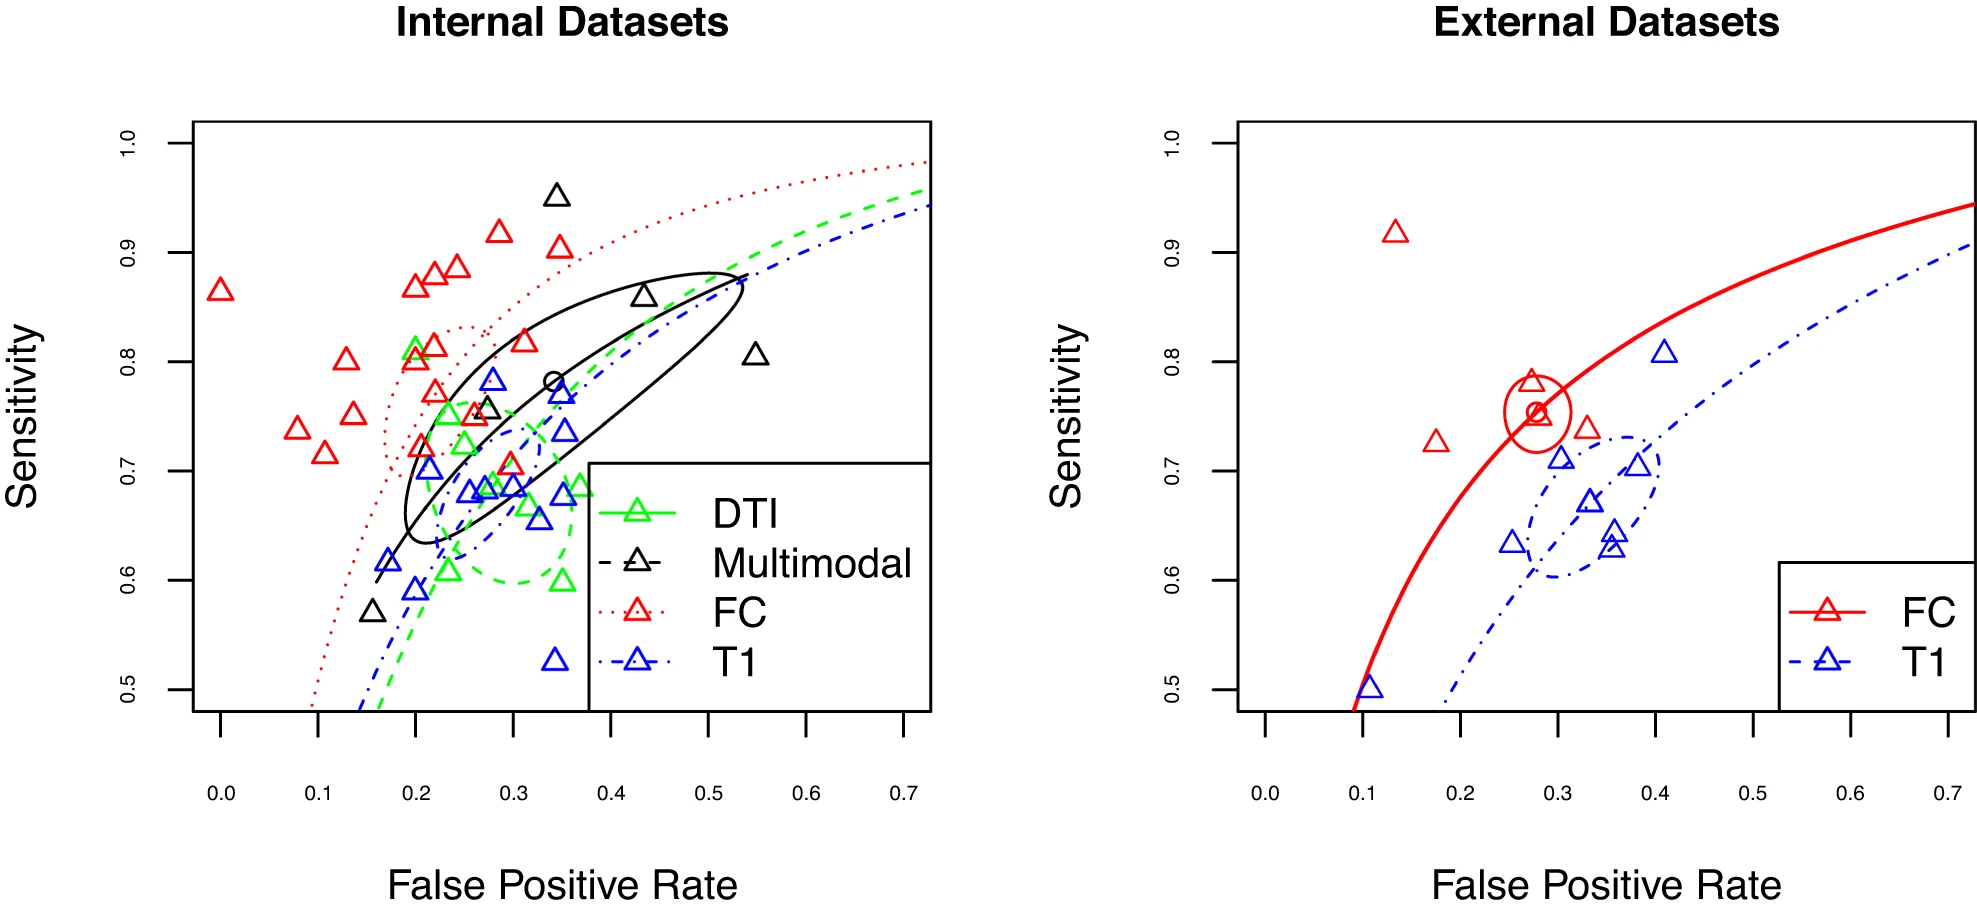
Porter, A., Fei, S., Damme, K. S. F., Nusslock, R., Gratton, C., & Mittal, V. A. (2023). A meta-analysis and systematic review of single vs. Multimodal neuroimaging techniques in the classification of psychosis. Molecular Psychiatry, 28(8), 3278–3292. https://doi.org/10.1038/s41380-023-02195-9
Seutin, V. (2005). Dopaminergic neurones: Much more than dopamine? Br. J. Pharmacol., 146(2), 167–169. https://doi.org/10.1038/sj.bjp.0706328
Sidor, M. M., & MacQueen, G. M. (2012). An update on antidepressant use in bipolar depression. Current Psychiatry Reports, 14(6), 696–704. https://doi.org/10.1007/s11920-012-0323-6
Sleigh, J., Harvey, M., Voss, L., & Denny, B. (2014). Ketamine – more mechanisms of action than just NMDA blockade. Trends in Anaesthesia and Critical Care, 4, 76–81. https://doi.org/10.1016/j.tacc.2014.03.002
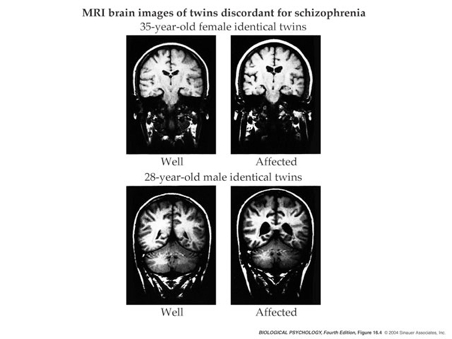
Suddath, R. L., Christison, G. W., Torrey, E. F., Casanova, M. F., & Weinberger, D. R. (1990). Anatomical abnormalities in the brains of monozygotic twins discordant for schizophrenia. The New England Journal of Medicine, 322(12), 789–794. https://doi.org/10.1056/NEJM199003223221201
Supekar, K., Los Angeles, C. de, Ryali, S., Kushan, L., Schleifer, C., Repetto, G., … Menon, V. (2024). Robust and replicable functional brain signatures of 22q11.2 deletion syndrome and associated psychosis: A deep neural network-based multi-cohort study. Molecular Psychiatry. https://doi.org/10.1038/s41380-024-02495-8
Tamminga, C. A., Pearlson, G., Keshavan, M., Sweeney, J., Clementz, B., & Thaker, G. (2014). Bipolar and schizophrenia network for intermediate phenotypes: Outcomes across the psychosis continuum. Schizophrenia Bulletin, 40 Suppl 2(Suppl 2), S131–7. https://doi.org/10.1093/schbul/sbt179
TheMentallight. (2010). Schizophrenia ABC 20-20 documentary part 2. YouTube. Retrieved from https://www.youtube.com/watch?v=YXimT5CHCDE
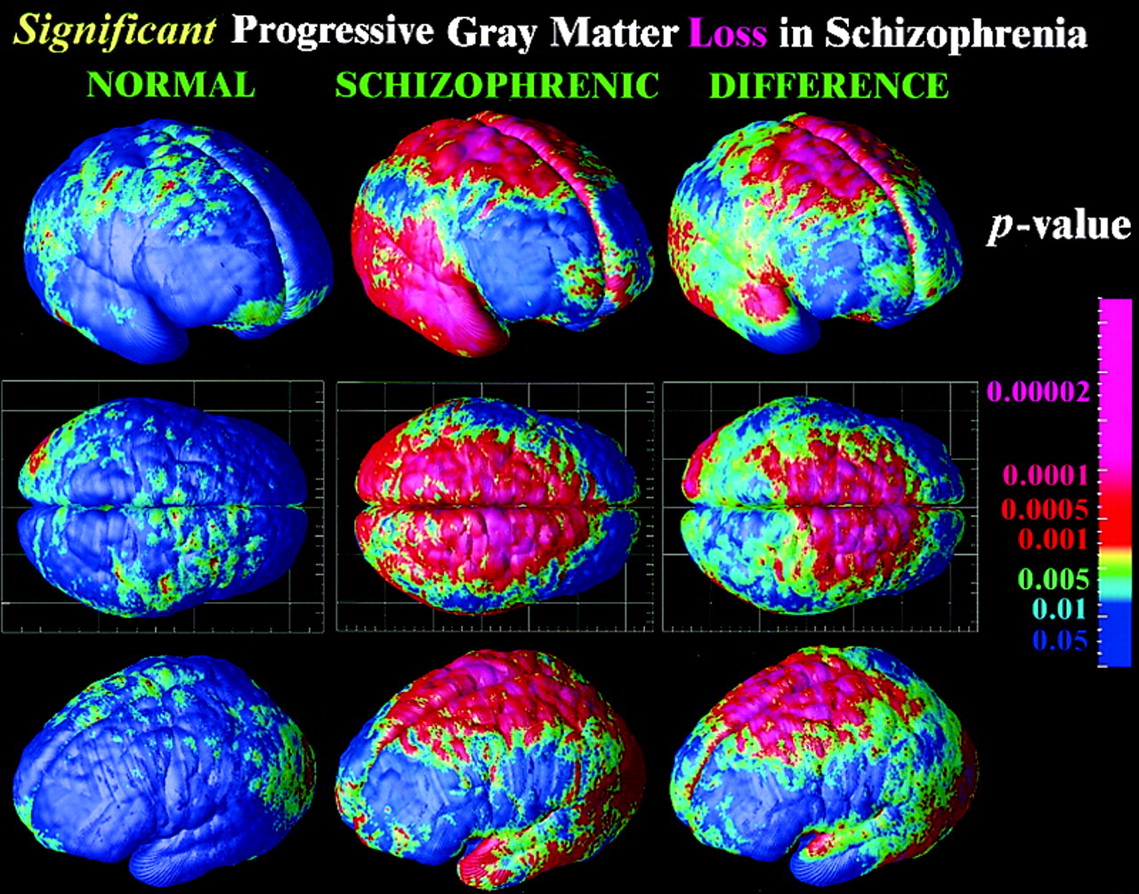
Thompson, P. M., Vidal, C., Giedd, J. N., Gochman, P., Blumenthal, J., Nicolson, R., … Rapoport, J. L. (2001). Mapping adolescent brain change reveals dynamic wave of accelerated gray matter loss in very early-onset schizophrenia. Proceedings of the National Academy of Sciences, 98(20), 11650–11655. https://doi.org/10.1073/pnas.201243998
Uhlhaas, P. J. (2013). Dysconnectivity, large-scale networks and neuronal dynamics in schizophrenia. Curr. Opin. Neurobiol., 23(2), 283–290. https://doi.org/10.1016/j.conb.2012.11.004
Vassos, E., Pedersen, C. B., Murray, R. M., Collier, D. A., & Lewis, C. M. (2012). Meta-analysis of the association of urbanicity with schizophrenia. Schizophrenia Bulletin, 38, 1118–1123. https://doi.org/10.1093/schbul/sbs096
Yang, G. J., Murray, J. D., Repovs, G., Cole, M. W., Savic, A., Glasser, M. F., … Anticevic, A. (2014). Altered global brain signal in schizophrenia. Proc. Natl. Acad. Sci. U. S. A., 111(20), 7438–7443. https://doi.org/10.1073/pnas.1405289111
Zhang, Y., Ye, F., Zhang, T., Lv, S., Zhou, L., Du, D., … Zhu, S. (2021). Structural basis of ketamine action on human NMDA receptors. Nature, 596, 301–305. https://doi.org/10.1038/s41586-021-03769-9

Footnotes

  1. “Major challenges facing neuroimaging studies of BD and how the ENIGMA BD Working Group meets these challenges”

  2. “Principles underlying the main distinction between affective psychosis (eg, bipolar disorder and psychotic depression) and non-affective psychosis (eg, schizophrenia and schizophreniform disorder).”

  3. “Three hypothetical typical patients diagnosed with a combination of categorical and dimensional representations of psychopathology. Categorical diagnoses of schizophrenia (blue), bipolar disorder (green), and schizoaffective disorder (violet) are accompanied by a patient’s quantitative scores (connected by red lines) on five main dimensions of psychopathology.”

  4. “MRI Coronal Views from Two Sets of Monozygotic Twins Discordant for Schizophrenia Showing Subtle Enlargement of the Lateral Ventricles in the Affected Twins (Panels B and D) as Compared with the Unaffected Twins (Panels A and C), Even When the Affected Twin Had Small Ventricles.”

  5. “De-coupling of network structure and function in schizophrenia. (a) Shows an example of a brain-wide map of structural connectivity deficits in patients with schizophrenia, highlighting a relatively diffuse impairment that particularly affects fronto-posterior anatomical connectivity. In this whole-brain analysis, no increases of structural connectivity were found. Letters denote different regions (see below for key). (b) Illustrates frontal regions showing decreased and increased functional connectivity with seed regions in the dorsal (top) and ventral (bottom) caudate nucleus, respectively, in patients with schizophrenia (yellow, blue) and their unaffected, first-degree relatives (magenta, green). Thus, despite a fairly global impairment of structural connectivity (depicted in (a)), systems-specific increases in functional connectivity can be observed (b). (c,d) Brain-wide alterations of structural (c) and functional (d) connectivity in the same sample of patients with schizophrenia. Blue and green depict links where anatomical and functional connectivity, respectively, were reduced in patients; red depicts links where functional connectivity was increased in the patient group. (a) reproduced from [24•], (b) from [18•], and (c,d) from [23••] with permission. Regional abbreviations in (a) are as follow: A. Left Superior Frontal, B. Right Superior Frontal, C. Left Supplementary Motor Area, D. Left Superior Medial Frontal, E. Right Supplementary Motor Area, F. Right Superior Medial Frontal, G. Right Superior Parietal, H. Right Superior Occipital, I. Left Cuneus, J. Left Superior Occipital, K. Left Precuneus, L. Right Precuneus, M. Left Middle Temporal, N. Left Middle Occipital, O. Left Inferior Temporal, P. Left Fusiform, Q. Right Cuneus, R. Left Hippocampus, S. Left Middle Cingulum.”

  6. “Power and variance of CGm signal in SCZ and BD. (A) Power of CGm signal in 90 SCZ patients (red) relative to 90 HCS (black) (see SI Appendix, Table S1 for demographics). (B) Mean power across all frequencies before and after GSR indicating an increase in SCZ [F(1, 178) = 7.42, P < 0.01], and attenuation by GSR [F(1, 178) = 5.37, P < 0.025]. (C) CGm variance also showed increases in SCZ [F(1, 178) = 7.25, P < 0.01] and GSR-induced reduction in SCZ [F(1, 178) = 5.25, P < 0.025]. (D–F) Independent SCZ sample (see SI Appendix, Table S2 for demographics), confirming increased CGm power [F(1, 143) = 9.2, P < 0.01] and variance [F(1, 143) = 9.25, P < 0.01] effects, but also the attenuating impact of GSR on power [F(1, 143) = 7.75, P < 0.01] and variance [F(1, 143) = 8.1, P < 0.01]. (G–I) Results for BD patients (n = 73) relative to matched HCS (see SI Appendix, Table S3 for demographics) did not reveal GSR effects observed in SCZ samples [F(1, 127) = 2.89, P = 0.092, n.s.] and no evidence for increase in CGm power or variance. All effects remained when examining all gray matter voxels (SI Appendix, Fig. S1). Error bars mark ± 1 SEM. ***P < 0.001 level of significance. n.s., not significant.”

  7. “Relationship between SCZ symptoms and CGm BOLD signal power. We extracted average CGm power for each patient with available symptom ratings (n = 153). (A) Significant positive relationship between CGm power and symptom ratings in SCZ (r = 0.18, P < 0.03), verified using Spearman’s ρ given somewhat nonnormally distributed data (ρ = 0.2, P < 0.015). (B and C) Results held across SCZ samples, increasing confidence in the effect (i.e., joint probability of independent effects P < 0.002, marked in blue boxes). All identified relationships held when examining Gm variance (SI Appendix, Fig. S4). Notably, all effects were no longer significant after GSR, suggesting GS carries clinically meaningful information. The shaded area marks the 95% confidence interval around the best-fit line.”

  8. “Sensitivity and specificity scores were derived using data from the classifier in each manuscript. All manuscripts were able to reliably differentiate participants with psychosis from healthy controls independent of neuroimaging type aside from [169]. The size of points is scaled according to sample size and modality of analysis is shown in various colors.”

  9. “Summary forest plot for log diagnostic odds ratio for all imaging modalities presented at the bottom of the plot. Multimodal: classification that used at least two of the following: rs-FC, T1, and/or DTI as features. RS-FC: resting state functional connectivity. DTI: diffusion tensor imaging. T1: T1 weighted imaging. The point size of squares and polygons are a function of the precision of the estimates.”

  10. “Colors represent different imaging modalities; estimated summary receiver operating curves are shown overlaid for each of the imaging modalities with respective confidence interval regions surrounding mean sensitivity and specificity values. No significant differences were found for classification of internal datasets . When external datasets were used for classification, rs-FC studies (red) have a significant advantage in classification relative to T1 studies (blue).”

  11. Blocks an open ion channel (Sleigh et al., 2014; Zhang et al., 2021).

  12. “Outcome heterogeneity in schizophrenia. Summary of 18 prospectively designed outcome studies of first admission and first diagnosis of schizophrenia with follow-up of more than 1 year with variably defined good and poor outcomes, showing balanced proportions of good and poor outcomes across studies. Studies 1 to 18 are 76, 77, 78, 79, 80, 81, 82, 83, 84, 85, 86, 87, 88, 89, 90, 91, 92, 93. Examples of good outcomes: symptomatic recovery with no social or intellectual deficit throughout follow-up (study 2, reference 77); full recovery over follow-up (study 12, reference 87); complete remission and never readmitted (study 16, reference 91). Examples of poor outcome definition: severe chronic social or intellectual deficit (study 2, reference 77); moderate-to-severe symptoms at time of follow-up (study 12, reference 87); chronic continuous psychotic symptoms over full follow up time (study 16, reference 91). For full description of all outcome definitions see reference 94.”

  13. “Multiple illustrative data from bipolar and schizophrenia network for intermediate phenotyping (BSNIP) study. (a) Social function quantified with the Birchwood Social Function Scale in the BSNIP sample. Details in reference 13. Schizophrenia (SZ) and schizoaffective disorder (SAD) groups were almost identical, while bipolar disorder (BDP) showed slightly higher scores. Relatives of all groups were modestly impaired. The patterns of impairment were similar across diagnostic groups. (b) The Schizo-Bipolar scale was developed from the SCID diagnostic criteria for these psychotic diagnoses.12 There was almost continuous overlap between these diagnoses with no point of rarity over this spectrum, lacking support for distinct illness groups based on phenomenology. (c) Cognition was measured with the BACS.14 Group scores are depicted for the diagnostic subgroups, showing the greatest impairment in the SZ group and the least in the BDP group with SAD in between, separated by severity; however groups did not show distinctive qualitative cognitive alterations from each other, except for the severity. (d) In the evoked potential auditory oddball paradigm, the patient groups (SZ and BDP) resembled each other rather broadly, with minimal, distinctive differences, discussed in reference 15. (e) The antisaccade error rates were increased in all patient groups, highest in SZ and lower in BDP, without any differences across relatives.16 Again, while severity differences were present, no other distinctions existed across diagnostic groups. (f) Differences between SZ and BPP groups are present after a pair auditory stimulus, including differences in both patient groups in baseline levels, especially before S2.17 (g) Using VBM analysis to determine grey matter volume,21 a distinctive difference between SZ/SAD, on the one hand and BDP on the other, emerged; specifically, SA and SAD groups demonstrated significant and widespread grey matter volume reduction, while the BDP showed very little grey matter reduction in any area. This would represent a difference between diagnostic groups of a qualitative as well as quantitative nature. (h) FreeSurfer showed a similar outcome, with grey matter reductions widespread in all cortical regions in SZ and SAD, while no distinctive reductions in BDP. (i). Resting state fMRI analysis shows a number of distinctive cerebral networks based on ICA, that were distinctive in some or all of the diagnostic groups.18 In general, these networks were different between all probands and all healthy controls.”