![[[@munafo_manifesto_2017]](https://doi.org/10.1038/s41562-016-0021)](https://www.nature.com/article-assets/npg/nathumbehav/2017/s41562-016-0021/images_hires/w926/s41562-016-0021-f1.jpg)
- Think like a computer!
- Plan your work; work your plan
- Consistency, standard formats
- Tidy data
- Haven’t said anything about “openness”…yet
2020-02-27 12:28:12
Preliminaries
“The first principle is that you must not fool yourself and you are the easiest person to fool.”
Announcements
- Center for Social Data Analytics (C-SODA) “Research Roundup”, Friday, January 31, 2020, 12:00-1:30 pm, B001 Sparks (Databasement)
- Institute for Computational and Data Science (ICDS) events
- “The Data Deluge”, ICDS Symposium, March 16-17, 2020, NLI.
Today’s agenda
- A manifesto for reproducible science
- Reproducible workflows
A manifesto for reproducible science
Discussion of
Munafò, M. R., Nosek, B. A., Bishop, D. V. M., Button, K. S., Chambers, C. D., Sert, N. P. du, … Ioannidis, J. P. A. (2017). A manifesto for reproducible science. Nature Human Behaviour, 1, 0021. https://doi.org/10.1038/s41562-016-0021.
Steps in scientific method (and weaknesses)
- Generate and specify hypothesis
- Design study
- Conduct study and collect data
- Analyze data and test hypothesis
- Interpret results
- Publish and/or conduct next study
Failure to control for bias
- Apophenia
- Mistaking connections and meaning between unrelated things
- Confirmation bias
- Hindsight bias
- (Kahneman, 2013)
Low statistical power
Poor quality control
Methods reproducibility
“…the ability to implement, as exactly as possible, the experimental and computational procedures, with the same data and tools, to obtain the same results.”
p-Hacking
- (Simonsohn, Nelson, & Simmons, 2014)
- If an effect is true, the distribution of reported p values should be right-skewed (long right tail)
- https://www.p-curve.com/
HARKing: hypothesizing after the results are known
- (Kerr, 1998)
- Find an effect in data analysis
- Present effect as if it had been hypothesized
- Why is this problematic?
Publication bias
- Results vs. null findings
- Novel results vs. replications
- Counter-intuitive (sexy) findings
- File drawer effect
- How many unpublished failures to replicate sit in file drawers?
Overcoming these weaknesses
Performing research
- Protecting against cognitive biases
- Improving methodological training
- Implementing independent methological support
- Encouraging collaboration and team science
- Collect bigger samples
Reporting on research
- Promoting study pre-registration
- Registered reports (Munafò et al., 2017), Box 3
- Improving the quality of reporting
Reporting on research
“We find that about 40% of studies fail to fully report all experimental conditions and about 70% of studies do not report all outcome variables included in the questionnaire. Reported effect sizes are about twice as large as unreported effect sizes and are about 3 times more likely to be statistically significant.”
Reporting on research
- Publish replications
- Teach with replications
Verifying research
- Promoting transparency and open science
- Open methods, materials, code sharing, data sharing
Changing Incentives
- (Higginson & Munafò, 2016)
- Claim that current publication incentive structure reinforces current practices
- OSF badge system
- Other incentives/disincentives
Status report/recommendations by stakeholder group
Questions for discussion
- Which of the manifesto provisions would you disagree with?
- Do you agree with the assessment about progress (Table 1)
- What steps could you take?
Reproducible workflows
One step forward
- Capturing workflows and improving methods reproducibility (Goodman et al., 2016)
Workflows
Typical workflows in experimental psychology
- Idea/question/hypotheses
- Design study
- Seek ethics board permission
- Build/borrow/buy data collection instruments
- Run study
- Analyze results
- Write-up results for presentation and/or publication
Design study
- Participants
- Number, characteristics
- Setting(s)
- Lab, classroom, home
- Measures or tasks
- Self/other report
- Observations/video or audio recording
- Physiological measures (MRI, EEG, ECG)
- Computer-based tasks
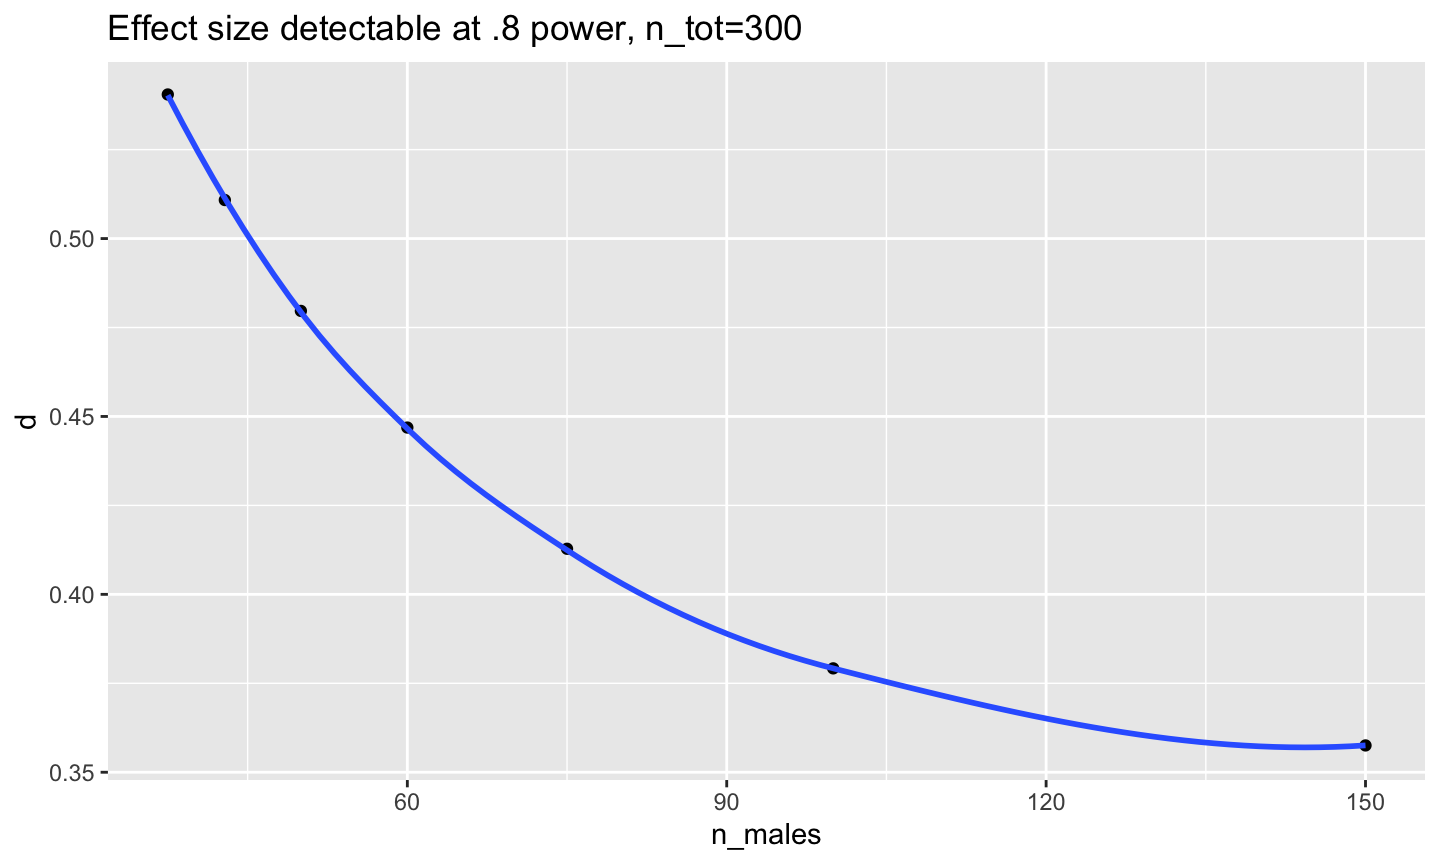
Power analysis
Data collection instruments
- Surveys
- Video/audio
- MRI, EEG, ECG
- Computer-generated data files
Run study
done_collecting_data = FALSE
while (!done_collecting_data) {
  Collect_sample()
  if (collected_sample_n >= planned_sample_n) {
    done_collecting_data = TRUE
  } else {
    done_collecting_data = FALSE
  }
}
Analyze results
- Clean/check data
- Merge, combine, munge data
Prepare presentation/publication
- Intro
- Methods
- Results
- Stats
- Plots
- Conclusions
- References
- Data?
Behavioral study summary
Imaging example
Threats to methods reproducibility
- Idea/question/hypotheses
- Design study
- Seek ethics board permission
- Build/borrow/buy data collection instruments
- Run study
- Analyze results
- Write-up results for presentation and/or publication
What are the threats?
- Data collection instruments
- Running study
- Data analysis
- Study write-up
Mitigating the threats
- Maximize consistency, methods reproducibility (Goodman et al., 2016)
- Design/consistent adhere to detailed experimental protocols
- Make workflows consistent, transparent
- Organize data, metadata in consistent, transparent ways
- Minimize human/hand data entry
- Automate as much as possible
How detailed is your (internal) protocol?
- Play & Learning Across a Year (PLAY) project wiki
- Sex differences in visual perception master protocol, testing protocol
Questions to consider
- What data and metadata am I collecting?
- How does it get collected?
- Where does it go after it’s collected?
- How does my non-electronic data get transferred to an electronic form?
- How do my electronic data files get cleaned, merged, munged?
Reproducible workflow aspirations
- “Chain of custody” from raw data to finished results and figures
- Single command to regenerate all results and figures from raw data
https://datasci.kitzes.com/lessons/python/reproducible_workflow.html
Reproducible workflow recommendations
- Create consistent structure for projects
- Use file name conventions
- Use machine-readable file types
- comma-separated value (.csv) vs. .xlsx
- Automate as much as possible
- Use version control
Lots of ways to organize electronic data…
study-1/
  sub-001/
    sub-001-measure-a.txt
    sub-001-image.jpg
    sub-001-demo.csv
    sub-001-measure-b.txt
  sub-002/
    sub-002-measure-a.txt
    sub-002-image.jpg
    sub-002-demo.csv
    sub-002-measure-b.txt
  ...
  sub-00n/
    ...
study-1/
  measure-a/
    sub-001-measure-a.txt
    ...
  measure-b/
    sub-001-measure-b.txt
    ...
  image/
    sub-001-image.jpg
    sub-002-image.jpg
    ...
  demo/
    sub-001-demo.csv
    sub-002-demo.csv
    ...
study-1/
  analysis/
    data/
      sessions/
        2017-01-09-sub-001/
        ...
      aggregate/
        study-1-demo-aggregate.csv
        study-1-measure-a-aggregate.csv
        ...
    R/
    img/
    reports/
  protocol/
    code/
      my-experiment.m
    materials/
      stim-1.jpg
      stim-2.jpg
      ...
  pubs/
    presentations/
    papers/
  refs/
  grants/
    2016/
    2017/
  irb/
  mtgs/
Databrary’s volume, session/materials model
ProjectTemplate
- Automates some of the project management involved in data analysis
- Hat Tip (HT): Michael Hallquist
- Gilmore says: Use what you like
Can automate project creation, too
## Create project directory
proj_name = "tmp_proj"
if (!exists(proj_name)) {
  dir.create(path = proj_name, recursive = TRUE)
}
# Create sessions directory
sessions_dir = paste(proj_name, "analysis/sessions", sep="/")
if (!exists(sessions_dir)) {
  dir.create(path = sessions_dir, recursive = TRUE) # creates intermediate dirs
}
# Aggregate data file directory
agg_dir = paste(proj_name, "analysis/aggregate", sep="/")
if (!exists(agg_dir)) {
  dir.create(path = agg_dir, recursive = TRUE)
}
Words to the wise
- Use consistent file/directory names
lowerCamelCaseIsGood.txtso isUpperCamelCase.txtunderscores_between_words.txtworksdashes-between.txtworks for file names, but…- Doesn’t work for objects in
R file-name.txtinterpreted asfileminusname.txt
- Doesn’t work for objects in
- avoid
spaces in your file names.txt; these are not always reliably readable by all computers.
- Choose good, descriptive names
Consider seriously Karl Broman’s guides
- Be consistent
- Write dates as YYYY-MM-DD.
- Fill-in all cells
- One thing in a cell
- Make your data a rectangle
- Create a data dictionary
- No calculations in raw data files
- No font or color to highlight data
- Make back-ups
- Validate data to avoid data entry errors
- Save data in plain text files (comma or tab-delimited)
Why?
- Data scientists (that’s you!) spend a lot of time just cleaning data
- https://www.infoworld.com/article/3047584/big-data/hottest-job-data-scientists-say-theyre-still-mostly-digital-janitors.html
Easy to merge data sets if they contain a linking variable (like subID)
- study-1-demo-agg.csv contains
- subID, sex, ageYrs, favColor
- study-1-rt-agg.csv contains
- subID, condition, rt
subID,sex,ageYrs,favColor
001,m,53,green
002,f,51,blue
003,f,23,red
004,m,25,aqua
Don’t put spaces between variables in comma-separated value (.csv) files. Also, make sure to add a final line feed/enter character.
subID,condition,rt
001,upright,250
001,inverted,300
002,upright,225
002,inverted,290
003,upright,270
003,inverted,230
004,upright,210
004,inverted,240
# read data files, first row (header) contains variable names
demo <- read.csv(file = "csv/study-1-demo-agg.csv", header = TRUE)
rt <- read.csv(file = "csv/study-1-rt-agg.csv", header = TRUE)

# merge and print
merged <- merge(demo, rt, by = "subID")
merged
##   subID sex ageYrs favColor condition  rt
## 1     1   m     53    green   upright 250
## 2     1   m     53    green  inverted 300
## 3     2   f     51     blue   upright 225
## 4     2   f     51     blue  inverted 290
## 5     3   f     23      red   upright 270
## 6     3   f     23      red  inverted 230
## 7     4   m     25     aqua   upright 210
## 8     4   m     25     aqua  inverted 240
A final word about tidy data (Wickham, 2014)
- Variables in columns
- Observations in rows
Ok/better to repeat values in columns- subID,trial,rt
- 001,1,300
- 001,2,345
- 002,2,327
Reproducible workflows allow on-line QA
- QA = quality assurance
- Example 1: QA on PLAY project (Rick use local copies)
- Example 2: QA report on sex differences project
- Example 3: Individual plots from sex differences project (Rick use local copies)
Main points
- (Methods) reproducible workflows are much easier to share
More resources
- Data Carpentry, https://www.datacarpentry.org/
- Software Carpentry, https://software-carpentry.org/
- Open Science Framework (OSF), https://osf.io
- R for Data Science, https://r4ds.had.co.nz/
Next time
- Preregistration & registered reports
- Introduction to R and RMarkdown
Resources
Software
This talk was produced on 2020-02-27 in RStudio using R Markdown. The code and materials used to generate the slides may be found at https://github.com/psu-psychology/psy-525-reproducible-research-2020. Information about the R Session that produced the code is as follows:
## R version 3.6.2 (2019-12-12)
## Platform: x86_64-apple-darwin15.6.0 (64-bit)
## Running under: macOS Mojave 10.14.6
##
## Matrix products: default
## BLAS:   /System/Library/Frameworks/Accelerate.framework/Versions/A/Frameworks/vecLib.framework/Versions/A/libBLAS.dylib
## LAPACK: /Library/Frameworks/R.framework/Versions/3.6/Resources/lib/libRlapack.dylib
##
## locale:
## [1] en_US.UTF-8/en_US.UTF-8/en_US.UTF-8/C/en_US.UTF-8/en_US.UTF-8
##
## attached base packages:
## [1] stats     graphics  grDevices utils     datasets
## [6] methods   base
##
## other attached packages:
##  [1] DiagrammeR_1.0.5 forcats_0.4.0    stringr_1.4.0
##  [4] dplyr_0.8.3      purrr_0.3.3      readr_1.3.1
##  [7] tidyr_1.0.0      tibble_2.1.3     ggplot2_3.2.1
## [10] tidyverse_1.3.0  seriation_1.2-8
##
## loaded via a namespace (and not attached):
##  [1] viridis_0.5.1      httr_1.4.1
##  [3] tufte_0.5          jsonlite_1.6
##  [5] viridisLite_0.3.0  foreach_1.4.8
##  [7] modelr_0.1.5       gtools_3.8.1
##  [9] assertthat_0.2.1   highr_0.8
## [11] cellranger_1.1.0   yaml_2.2.0
## [13] pillar_1.4.3       backports_1.1.5
## [15] lattice_0.20-38    glue_1.3.1
## [17] digest_0.6.23      RColorBrewer_1.1-2
## [19] rvest_0.3.5        colorspace_1.4-1
## [21] htmltools_0.4.0    pkgconfig_2.0.3
## [23] broom_0.5.3        haven_2.2.0
## [25] scales_1.1.0       gdata_2.18.0
## [27] farver_2.0.3       generics_0.0.2
## [29] withr_2.1.2        lazyeval_0.2.2
## [31] cli_2.0.1          magrittr_1.5
## [33] crayon_1.3.4       readxl_1.3.1
## [35] evaluate_0.14      fs_1.3.1
## [37] fansi_0.4.1        nlme_3.1-142
## [39] MASS_7.3-51.5      gplots_3.0.1.2
## [41] xml2_1.2.2         tools_3.6.2
## [43] registry_0.5-1     hms_0.5.3
## [45] lifecycle_0.1.0    munsell_0.5.0
## [47] reprex_0.3.0       cluster_2.1.0
## [49] packrat_0.5.0      compiler_3.6.2
## [51] caTools_1.18.0     rlang_0.4.4
## [53] grid_3.6.2         iterators_1.0.12
## [55] rstudioapi_0.10    visNetwork_2.0.9
## [57] htmlwidgets_1.5.1  labeling_0.3
## [59] bitops_1.0-6       rmarkdown_2.1
## [61] gtable_0.3.0       codetools_0.2-16
## [63] DBI_1.1.0          TSP_1.1-8
## [65] R6_2.4.1           gridExtra_2.3
## [67] lubridate_1.7.4    knitr_1.27
## [69] pwr_1.2-2          utf8_1.1.4
## [71] KernSmooth_2.23-16 dendextend_1.13.3
## [73] stringi_1.4.5      Rcpp_1.0.3
## [75] vctrs_0.2.2        gclus_1.3.2
## [77] dbplyr_1.4.2       tidyselect_1.0.0
## [79] xfun_0.12
References
Button, K. S., Ioannidis, J. P. A., Mokrysz, C., Nosek, B. A., Flint, J., Robinson, E. S. J., & Munafò, M. R. (2013). Power failure: Why small sample size undermines the reliability of neuroscience. Nat. Rev. Neurosci., 14(5), 365–376. https://doi.org/10.1038/nrn3475
Franco, A., Malhotra, N., & Simonovits, G. (2016). Underreporting in psychology experiments: Evidence from a study registry. Social Psychological and Personality Science, 7(1), 8–12. https://doi.org/10.1177/1948550615598377
Frank, M. C., & Saxe, R. (2012). Teaching replication. Perspectives on Psychological Science: A Journal of the Association for Psychological Science, 7(6), 600–604. https://doi.org/10.1177/1745691612460686
Goodman, S. N., Fanelli, D., & Ioannidis, J. P. A. (2016). What does research reproducibility mean? Science Translational Medicine, 8(341), 341ps12–341ps12. https://doi.org/10.1126/scitranslmed.aaf5027
Higginson, A. D., & Munafò, M. R. (2016). Current Incentives for Scientists Lead to Underpowered Studies with Erroneous Conclusions. PLOS Biology, 14(11), e2000995. https://doi.org/10.1371/journal.pbio.2000995
Ioannidis, J. P. A. (2005). Why Most Published Research Findings Are False. PLoS Med, 2(8), e124. https://doi.org/10.1371/journal.pmed.0020124
Kahneman, D. (2013). Thinking, fast and slow (1st edition). Farrar, Straus; Giroux. Retrieved from https://www.amazon.com/Thinking-Fast-Slow-Daniel-Kahneman/dp/0374533555
Kerr, N. L. (1998). HARKing: Hypothesizing after the results are known. Personality and Social Psychology Review: An Official Journal of the Society for Personality and Social Psychology, Inc, 2(3), 196–217. https://doi.org/10.1207/s15327957pspr0203\_4
Munafò, M. R., Nosek, B. A., Bishop, D. V. M., Button, K. S., Chambers, C. D., Sert, N. P. du, … Ioannidis, J. P. A. (2017). A manifesto for reproducible science. Nature Human Behaviour, 1, 0021. https://doi.org/10.1038/s41562-016-0021
Simonsohn, U., Nelson, L. D., & Simmons, J. P. (2014). P-curve: A key to the file-drawer. Journal of Experimental Psychology. General, 143(2), 534–547. https://doi.org/10.1037/a0033242
Szucs, D., & Ioannidis, J. P. A. (2017). Empirical assessment of published effect sizes and power in the recent cognitive neuroscience and psychology literature. PLoS Biology, 15(3), e2000797. https://doi.org/10.1371/journal.pbio.2000797
Wickham, H. (2014). Tidy Data. Journal of Statistical Software, 59(10). https://doi.org/10.18637/jss.v059.i10