Prevalence of QRPs
2023-10-09 Mon
Overview
Announcements
- Due Friday
- Final project proposal
Today
Prevalence of QRPs
- Read & Discuss
- Discuss results from
John, L. K., Loewenstein, G. & Prelec, D. (2012). Measuring the prevalence of questionable research practices with incentives for truth telling. Psychological Science, 23(5), 524–532. https://doi.org/10.1177/0956797611430953
Cases of clear scientific misconduct have received significant media attention recently, but less flagrantly questionable research practices may be more prevalent and, ultimately, more damaging to the academic enterprise. Using an anonymous elicitation format supplemented by incentives for honest reporting, we surveyed over 2,000 psychologists about their involvement in questionable research practices.
The impact of truth-telling incentives on self-admissions of questionable research practices was positive, and this impact was greater for practices that respondents judged to be less defensible. Combining three different estimation methods, we found that the percentage of respondents who have engaged in questionable practices was surprisingly high. This finding suggests that some questionable practices may constitute the prevailing research norm.
Accessibility/openness notes
- Paper not openly accessible.
- Paper was accessible via authenticated access to PSU library.
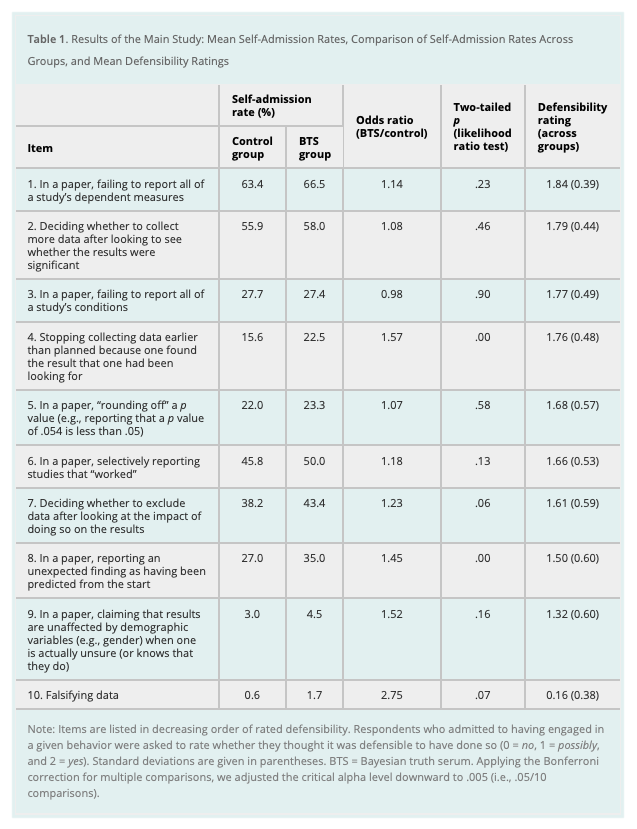
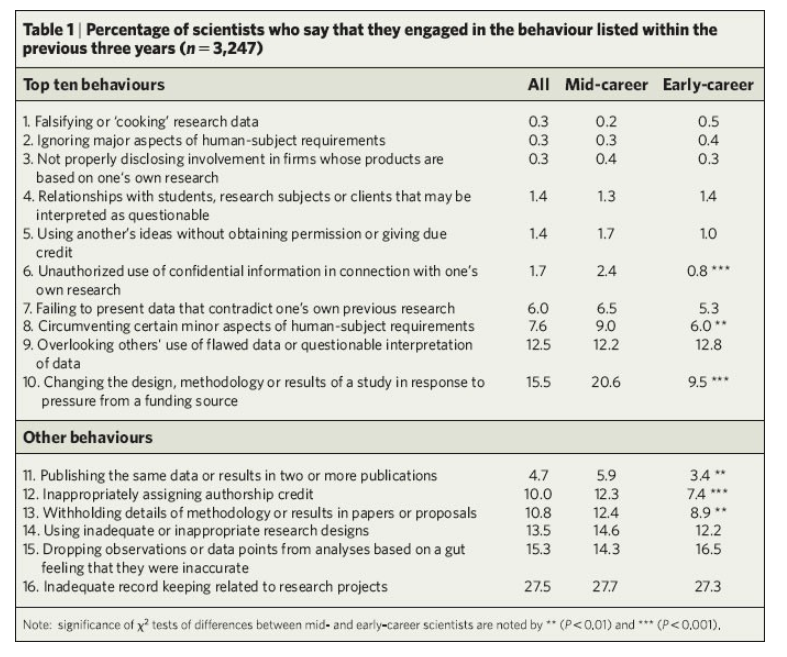
Table 1 from (John et al., 2012)
The two versions of the survey differed in the incentives they offered to respondents. In the Bayesian-truth-serum (BTS) condition, a scoring algorithm developed by one of the authors (Prelec, 2004) was used to provide incentives for truth telling. This algorithm uses respondents’ answers about their own…
…behavior and their estimates of the sample distribution of answers as inputs in a truth-rewarding scoring formula. Because the survey was anonymous, compensation could not be directly linked to individual scores.
Instead, respondents were told that we would make a donation to a charity of their choice, selected from five options, and that the size of this donation would depend on the truthfulness of their responses, as determined by the BTS scoring system. By inducing a (correct) belief that dishonesty would reduce donations, we hoped to amplify the moral stakes riding on each answer (for details on the donations, see Supplementary Results in the Supplemental Material).
Respondents were not given the details of the scoring system but were told that it was based on an algorithm published in Science and were given a link to the article. There was no deception: Respondents’ BTS scores determined our contributions to the five charities.
Respondents in the control condition were simply told that a charitable donation would be made on behalf of each respondent. (For details on the effect of the size of the incentive on response rates, see Participation Incentive Survey in the Supplemental Material.)
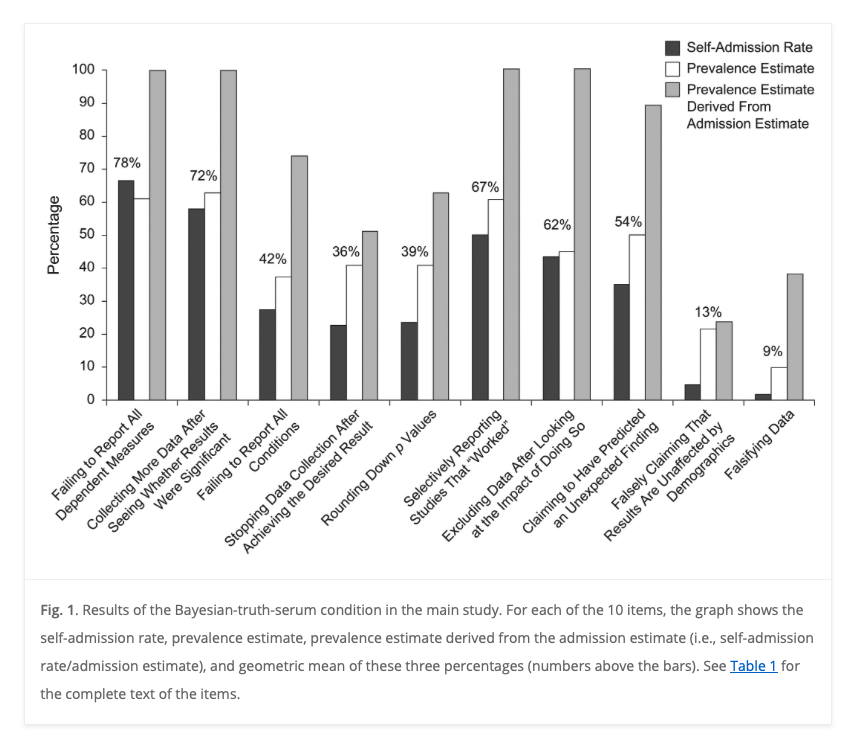
Figure 1 from John et al. (2012)
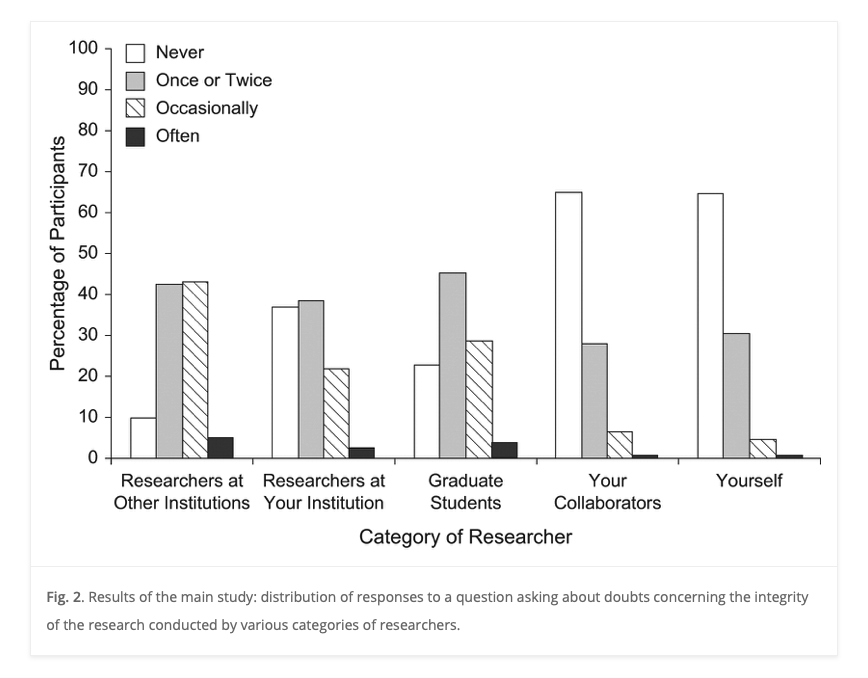
Figure 2 from John et al. (2012)
Note
What do you think about the “truth serum” manipulation?
Do the data persuade you that it made respondents more honest?
Reproducibility notes for (John et al., 2012)
Supplemental Material Additional supporting information may be found at http://pss.sagepub.com/content/by/supplemental-data
- Visiting this URL (http://pss.sagepub.com/content/by/supplemental-data) takes one to the following:
- I went to the journal page and searched for the article title.
- Since the article is behind a paywall, I wasn’t able to access the supplemental materials that way.
- After authenticating to the PSU library, I was able to find a PDF of the supplementary material. It and the original paper are on Canvas.
- I was unable to find the raw data, but I found the questions on p. 5 of the supplementary material.
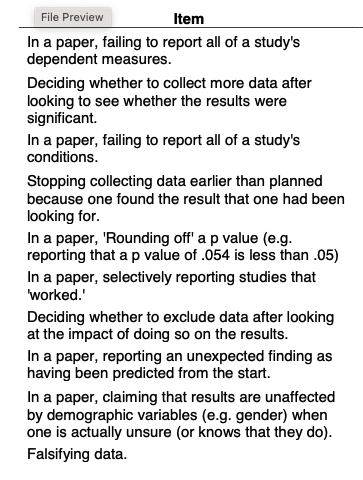
Supplementary material for (John et al., 2012)
More evidence about prevalance of QRPs
Survey of \(n=3,247\) NIH-funded scientists
Meta-analysis (Xie, Wang, & Kong, 2021)
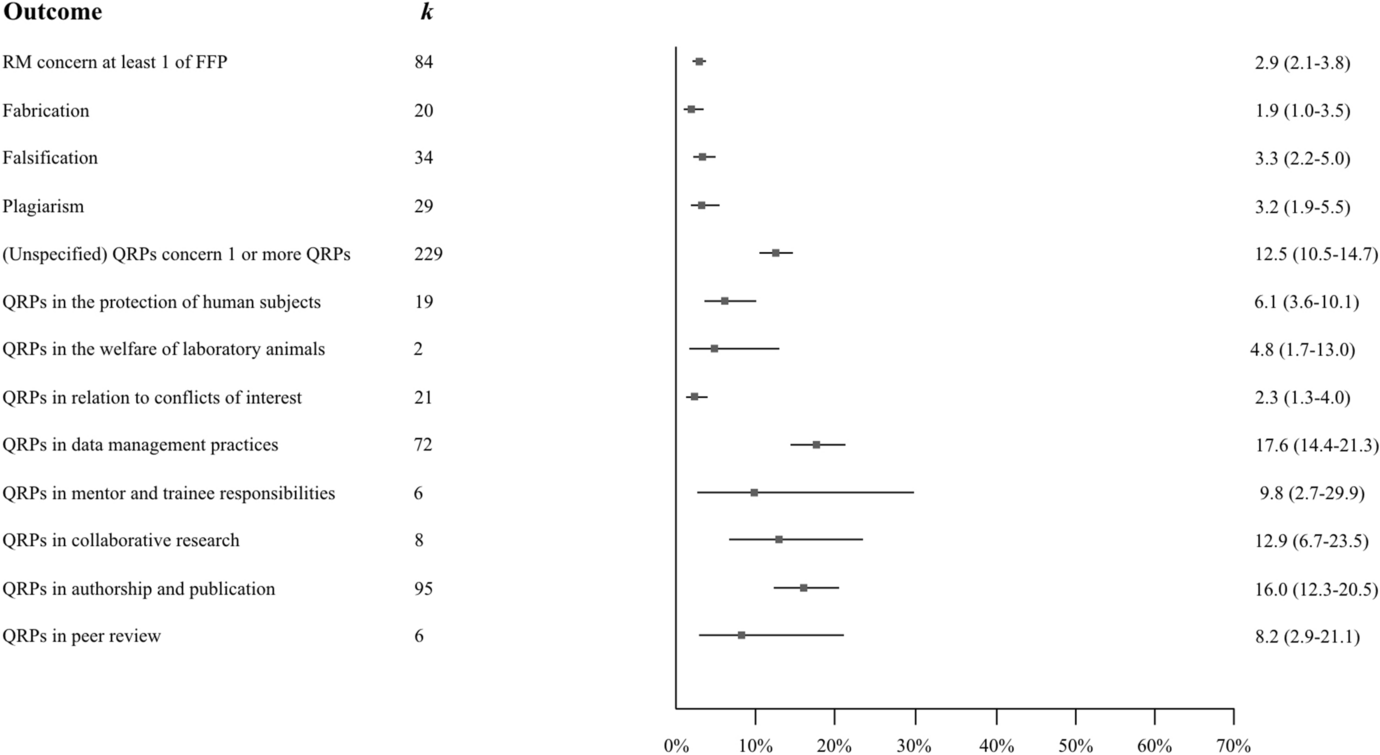
Self-reported prevalence; Figure 2 from Xie et al. (2021)
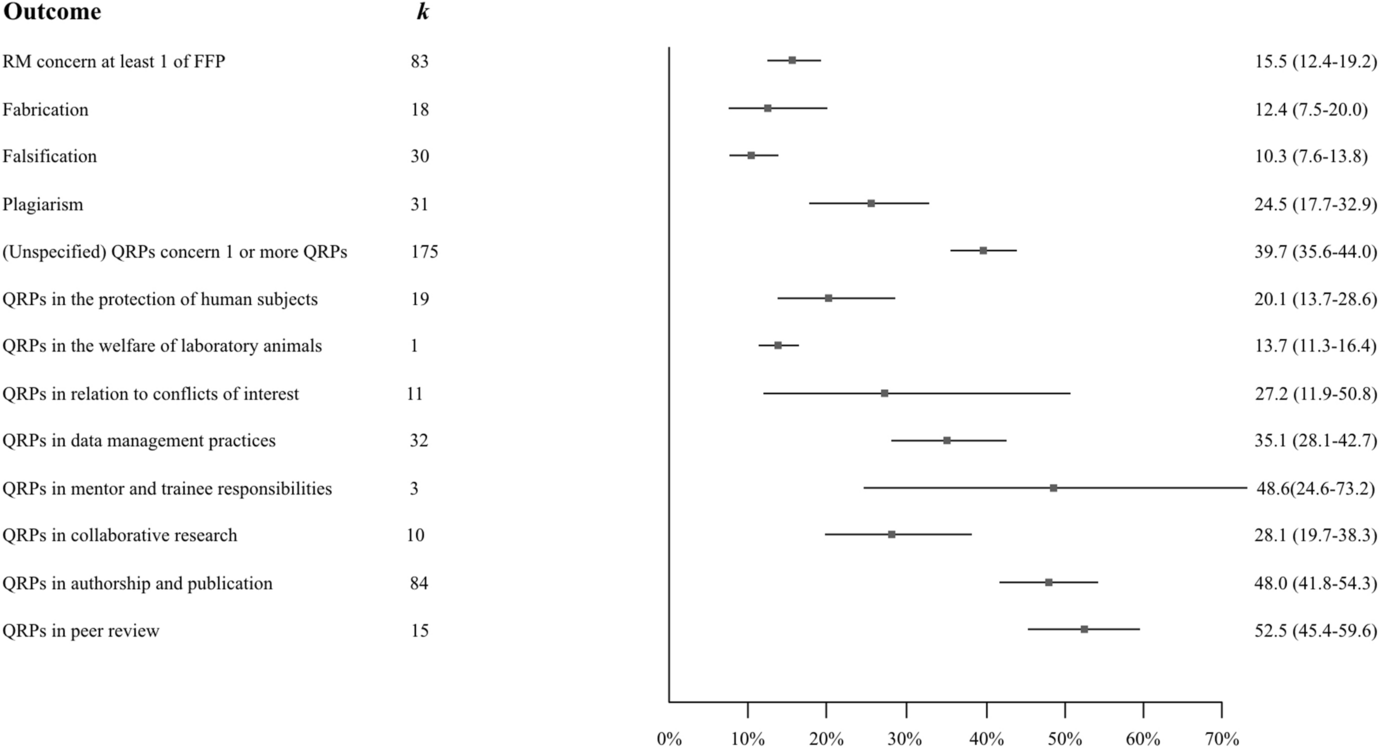
Observed prevalence; Figure 3 from Xie et al. (2021)
Evaluating p-hacking
Our results
- Who got a “significant” result?
- How many different analyses did you try?
- Who changed their analysis after finding a significant result?
- Did anyone try another analysis–after you got a significant result–and keep the non-significant result?
- Visualizations of the data
- Do we have good evidence about which party harms or helps the economy?
- Why or why not?
- What is p-hacking?
- Did you p-hack? Did another classmate? Why do you think so?

You are entitled to your own opinion, but you are not entitled to your own facts.
Next time
File drawer effect
Resources
References
PSYCH 490.009: 2023-10-09 Mon