File Drawer Effect

2023-10-11 Wed

Rick Gilmore

Overview

Announcements

Last time…

  • What is p-hacking?
  • How many different combinations of variables were there in Exercise 04?
  • What would we need to do to determine which party and which measures of political power impact the economy one way or the other?

Today

File drawer effect

File drawer effect

Source: https://www.craigmarker.com/wp-content/uploads/2006/12/filedrawer1-1002x675.jpg

Related to the notion of ‘negative data’.

(Hypothesis, 2021)

Simulating the file drawer effect

  • How many times out of \(n\) experiments do we get…
    • a significant result
    • a non-significant result

Simulation app: https://rogilmore.shinyapps.io/PSYCH490-2023-APES/

https://rogilmore.shinyapps.io/PSYCH490-2023-APES/

Your turn

  • Pick samples of \(n=30\) for n_A and n_B (green boxes).
  • Pick small effect size \(d=0.30\) (magenta box).
  • Note (and keep track of) whether your significance test (Sig?) is TRUE (aqua box).

  • Replicate the study multiple times by pressing the Regenerate button (dark blue box).
  • Record the number of successes and failures.

Discussing your results

  • Is this a replication study? Why or why not?
  • Is there a true effect to find?
  • Did we find it reliably? Why or why not?

Discuss

Rosenthal, R. (1979). The file drawer problem and tolerance for null results. Psychological Bulletin, 86(3), 638–641. https://doi.org/10.1037/0033-2909.86.3.638

Abstract

For any given research area, one cannot tell how many studies have been conducted but never reported. The extreme view of the “file drawer problem” is that journals are filled with the 5% of the studies that show Type I errors, while the file drawers are filled with the 95% of the studies that show nonsignificant results.

(Rosenthal, 1979)

Quantitative procedures for computing the tolerance for filed and future null results are reported and illustrated, and the implications are discussed.

(Rosenthal, 1979)

Unpacking (Rosenthal, 1979)

  • Why might journals be filled with studies that have Type I (false positive) errors?
    • If there are no effects at all, what would the false positive rate be?
  • Why might file drawers be filled with studies that have Type II (false negative) errors?
    • If there really is an effect to be found for every study, what would the false negative rate be?
  • If every study conducted on question X were published or findable somehow, what impact would that have?

Visualization

Rosenthal’s illustration relies on the standard normal deviate or \(Z\), which is the value on a standard normal distribution (with mean \(\mu=0\) and standard deviation \(\sigma=1\)) that one would need to observe for a given p value.

Illustration of \(Z\) discussed in (Rosenthal, 1979)

Findings

If the overall level of significance of the research review will be brought down to the level of just significant by the addition of just a few more null results, the finding is not resistant to the file drawer threat.

(Rosenthal, 1979)

  • In other words, the finding is not robust.

There is both a sobering and a cheering lesson to be learned from careful study of Equation 3. The sobering lesson is that small numbers of studies that are not very significant, even when their combined p is significant, may well be misleading in that only a few studies filed away could change the combined significant result to a nonsignificant one…

(Rosenthal, 1979)

  • In other words, small numbers of studies with weak evidence for a claim might be misleading if there are a large number of studies in “file drawers”

The cheering lesson is that when the number of studies available grows large or the mean directional Z grows large, the file drawer hypothesis as a plausible rival hypothesis can be safely ruled out.

(Rosenthal, 1979)

  • In other words, larger numbers of studies for a claim bolster it.

Discuss

Franco, A., Malhotra, N. & Simonovits, G. (2014). Social science. Publication bias in the social sciences: unlocking the file drawer. Science, 345(6203), 1502–1505. https://doi.org/10.1126/science.1255484

Abstract

We studied publication bias in the social sciences by analyzing a known population of conducted studies—221 in total—in which there is a full accounting of what is published and unpublished.

(Franco et al., 2014a)

We leveraged Time-sharing Experiments in the Social Sciences (TESS), a National Science Foundation–sponsored program in which researchers propose survey-based experiments to be run on representative samples of American adults.

(Franco et al., 2014a)

Because TESS proposals undergo rigorous peer review, the studies in the sample all exceed a substantial quality threshold. Strong results are 40 percentage points more likely to be published than are null results and 60 percentage points more likely to be written up.

(Franco et al., 2014a)

We provide direct evidence of publication bias and identify the stage of research production at which publication bias occurs: Authors do not write up and submit null findings.

(Franco et al., 2014a)

Findings

Table 3 from Franco et al. (2014a)

Solutions

How can the social science community combat publication bias of this sort? On the basis of communications with the authors of many experiments that resulted in null findings, we found that some researchers anticipate the rejection of such papers but also that many of them simply lose interest in “unsuccessful” projects.

These findings show that a vital part of developing institutional solutions to improve scientific transparency would be to understand better the motivations of researchers who choose to pursue projects as a function of results.

Few null findings ever make it to the review process. Hence, proposed solutions such as two-stage review (the first stage for the design and the second for the results), pre-analysis plans (41), and requirements to preregister studies (16) should be complemented by incentives not to bury statistically insignificant results in file drawers. Creating high-status publication outlets for these studies could provide such incentives.

The movement toward open-access journals may provide space for such articles. Further, the pre-analysis plans and registries themselves will increase researcher access to null results. Alternatively, funding agencies could impose costs on investigators who do not write up the results of funded studies.

Last, resources should be deployed for replications of published studies if they are unrepresentative of conducted studies and more likely to report large effects.

(Franco et al., 2014a)

Replication notes

(Franco, Malhotra, & Simonovits, 2014b)

 [1] "id"                   "author1field"         "author2field"        
 [4] "author3field"         "discipline"           "discipline2"         
 [7] "POL"                  "PSY"                  "SOC"                 
[10] "OTHER"                "year"                 "fieldingperiod1stday"
[13] "age_months"           "age_day"              "age_year"            
[16] "timetopublish"        "iv_coder1"            "iv_coder2"           
[19] "disagreement"         "IV_all"               "IV"                  
[22] "strong"               "mixed"                "null"                
[25] "DV"                   "DV_all"               "DV_tri"              
[28] "DV_book_separate"     "DV_book_unpub"        "DV_book_nontop"      
[31] "DV_book_top"          "journal"              "journal_field"       
[34] "insample"             "pubyear"              "pub"                 
[37] "anyresults"           "written"              "max_h_current"       
[40] "max_pub_attime"       "why_excluded"        

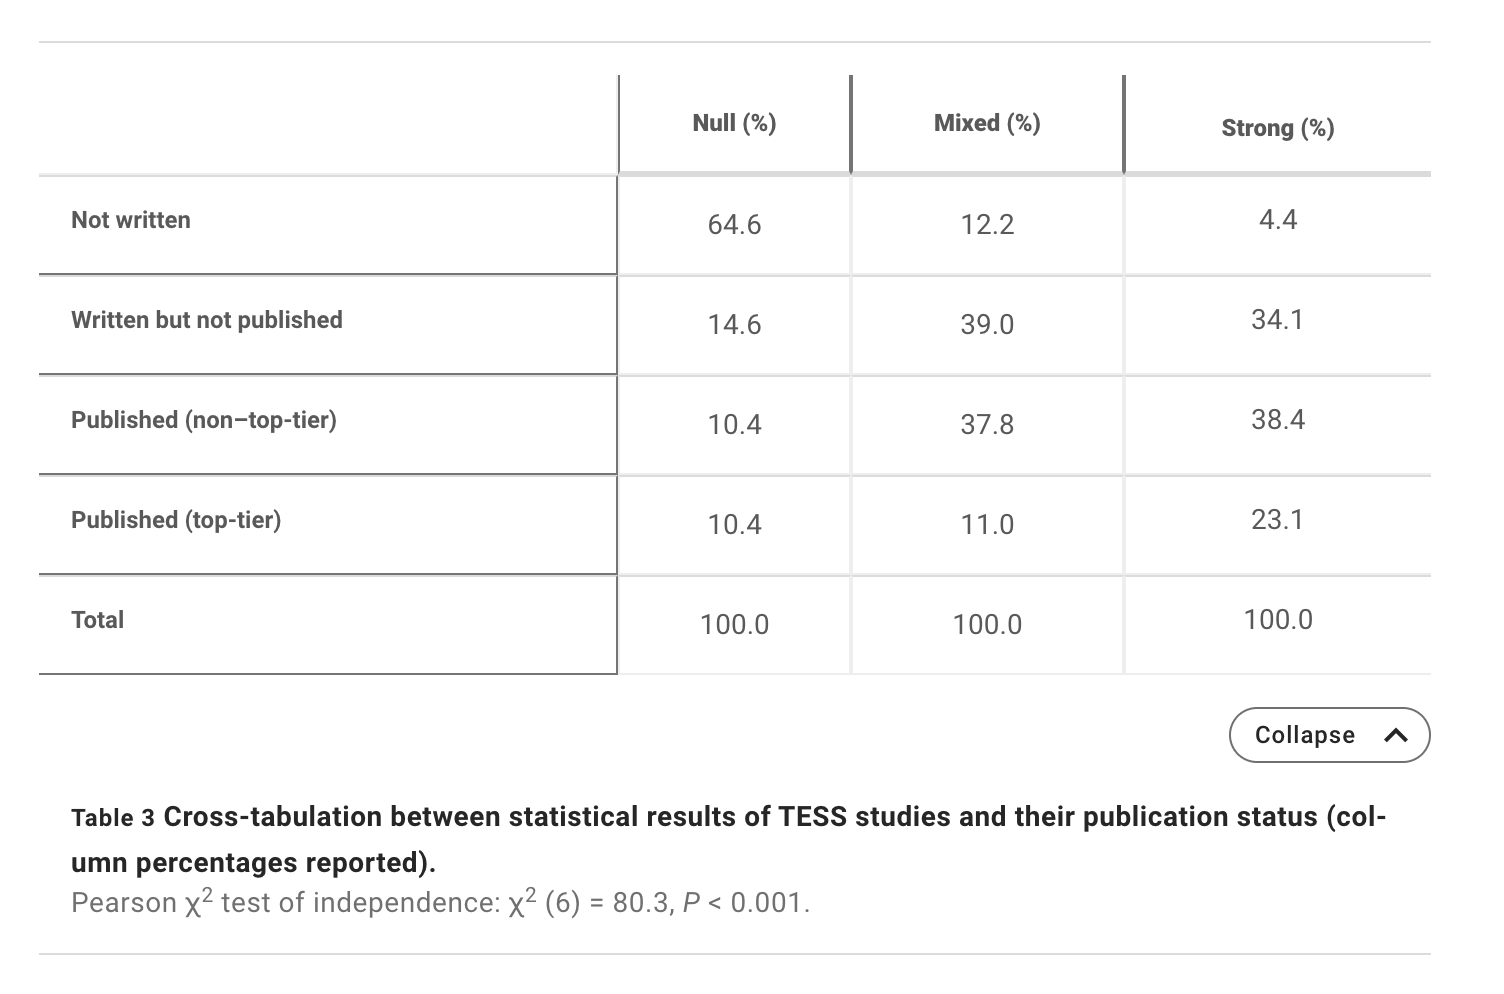
    Pearson's Chi-squared test with Yates' continuity correction

data:  bounds
X-squared = 70.503, df = 1, p-value < 2.2e-16
quartz_off_screen 
                2 

Figure generated from code in (Franco et al., 2014b), shared as materials from (Franco et al., 2014a).

Note

More could be done with these data. This could be a final project for someone.

Next time

NO CLASS MEETING

Resources

References

Franco, A., Malhotra, N., & Simonovits, G. (2014a). Social science. Publication bias in the social sciences: Unlocking the file drawer. Science, 345(6203), 1502–1505. https://doi.org/10.1126/science.1255484
Franco, A., Malhotra, N., & Simonovits, G. (2014b, August). FileDrawer. https://doi.org/10.5281/zenodo.11300
Hypothesis, B. A. S. (2021, February). 13. “Negative data” and the file drawer problem. Youtube. Retrieved from https://www.youtube.com/watch?v=9I1qR8PTr54
Rosenthal, R. (1979). The file drawer problem and tolerance for null results. Psychological Bulletin, 86(3), 638–641. https://doi.org/10.1037/0033-2909.86.3.638