2023-11-01 Wed
Meta-analysis & many analysts
Overview
Prelude
Today
Meta-analysis & many analysts
- Discuss
Meta-analysis
- Multiple studies, ideally published and unpublished (why?)
- What is the distribution of effect sizes?
- Related to Cochrane Systematic Reviews
Example
van Agteren, J., Iasiello, M., Lo, L., Bartholomaeus, J., Kopsaftis, Z., Carey, M. & Kyrios, M. (2021). A systematic review and meta-analysis of psychological interventions to improve mental wellbeing. Nature Human Behaviour. https://doi.org/10.1038/s41562-021-01093-w.
Our current understanding of the efficacy of psychological interventions in improving mental states of wellbeing is incomplete. This study aimed to overcome limitations of previous reviews by examining the efficacy of distinct types of psychological interventions, irrespective of their theoretical underpinning, and the impact of various moderators, in a unified systematic review and meta-analysis.
Four-hundred-and-nineteen randomized controlled trials from clinical and non-clinical populations (n = 53,288) were identified for inclusion. Mindfulness-based and multi-component positive psychological interventions demonstrated the greatest efficacy in both clinical and non-clinical populations.
Meta-analyses also found that singular positive psychological interventions, cognitive and behavioural therapy-based, acceptance and commitment therapy-based, and reminiscence interventions were impactful.
Effect sizes were moderate at best, but differed according to target population and moderator, most notably intervention intensity. The evidence quality was generally low to moderate. While the evidence requires further advancement, the review provides insight into how psychological interventions can be designed to improve mental wellbeing.
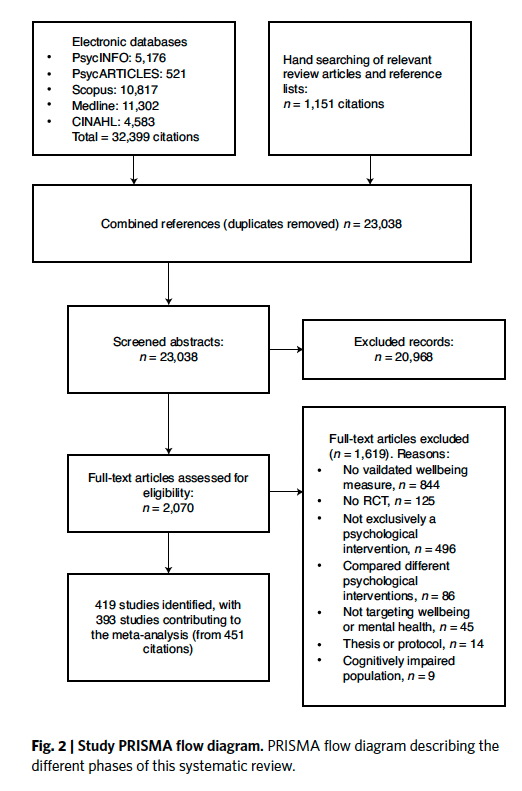
Figure 2 from Agteren et al. (2021)
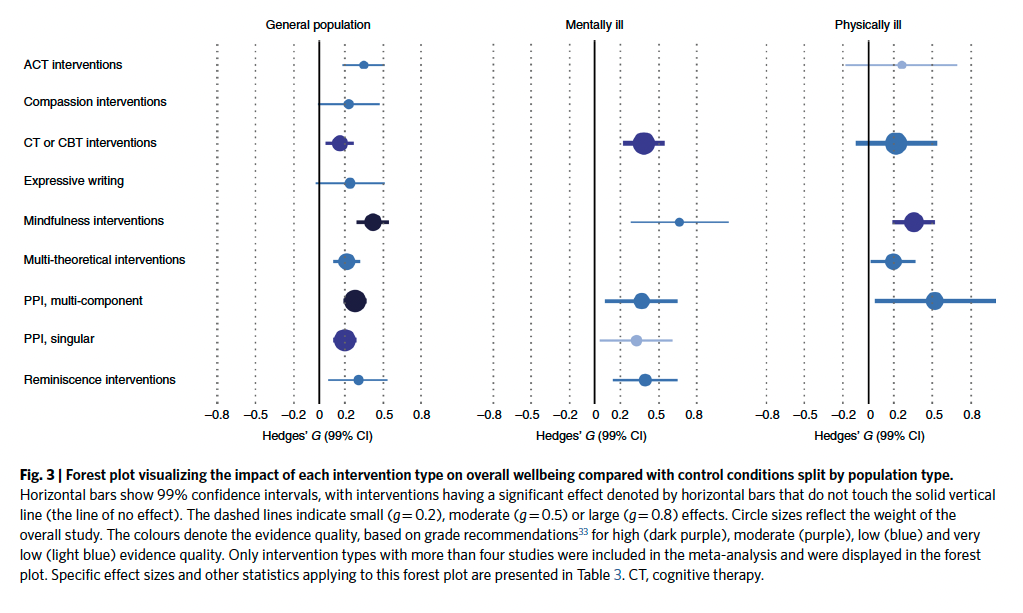
Figure 3 from Agteren et al. (2021)
Flaws with meta-analysis
- Garbage-in, garbage-out?
- What about publication bias?
Policy Points:
- Currently, there is massive production of unnecessary, misleading, and conflicted systematic reviews and meta-analyses. Instead of promoting evidence-based medicine and health care, these instruments often serve mostly as easily produced publishable units or marketing tools.
- Suboptimal systematic reviews and meta-analyses can be harmful given the major prestige and influence these types of studies have acquired.
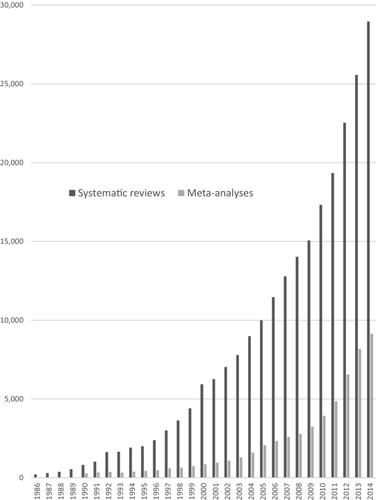
Figure 1 from (Ioannidis, 2016). Number of PubMed-Indexed Articles Published Each Year Between 1986 and 2014 That Carry the Tag “Systematic Review” or “Meta-analysis” for Type of Publication
Conclusions
The production of systematic reviews and meta-analyses has reached epidemic proportions. Possibly, the large majority of produced systematic reviews and meta-analyses are unnecessary, misleading, and/or conflicted.
Publication bias poses a challenge for accurately synthesizing research findings using meta-analysis. A number of statistical methods have been developed to combat this problem by adjusting the meta-analytic estimates…
Many-analysts
Silberzahn, R., Uhlmann, E. L., Martin, D. P., Anselmi, P., Aust, F., Awtrey, E., Bahník, Š., Bai, F., Bannard, C., Bonnier, E., Carlsson, R., Cheung, F., Christensen, G., Clay, R., Craig, M. A., Dalla Rosa, A., Dam, L., Evans, M. H., Flores Cervantes, I., … Nosek, B. A. (2018). Many analysts, one data set: Making transparent how variations in analytic choices affect results. Advances in Methods and Practices in Psychological Science, 1(3), 337–356. https://doi.org/10.1177/2515245917747646
What if scientific results are highly contingent on subjective decisions at the analysis stage? In that case, the process of certifying a particular result on the basis of an idiosyncratic analytic strategy might be fraught with unrecognized uncertainty (Gelman & Loken, 2014), and research findings might be less trustworthy than they at first appear to be (Cumming, 2014). Had the authors made different assumptions, an entirely different result might have been observed (Babtie, Kirk, & Stumpf, 2014).
Abstract
Twenty-nine teams involving 61 analysts used the same data set to address the same research question: whether soccer referees are more likely to give red cards to dark-skin-toned players than to light-skin-toned players.
Analytic approaches varied widely across the teams, and the estimated effect sizes ranged from 0.89 to 2.93 (Mdn = 1.31) in odds-ratio units. Twenty teams (69%) found a statistically significant positive effect, and 9 teams (31%) did not observe a significant relationship.
Tip
Odds ratios (OR) (Szumilas, 2010):
- OR < 1: Outcome less likely than comparison
- OR = 1: Outcome and comparison equally likely
- OR > 1: Outcome more likely than comparison
Wikipedia also has a thorough discussion.
Overall, the 29 different analyses used 21 unique combinations of covariates.
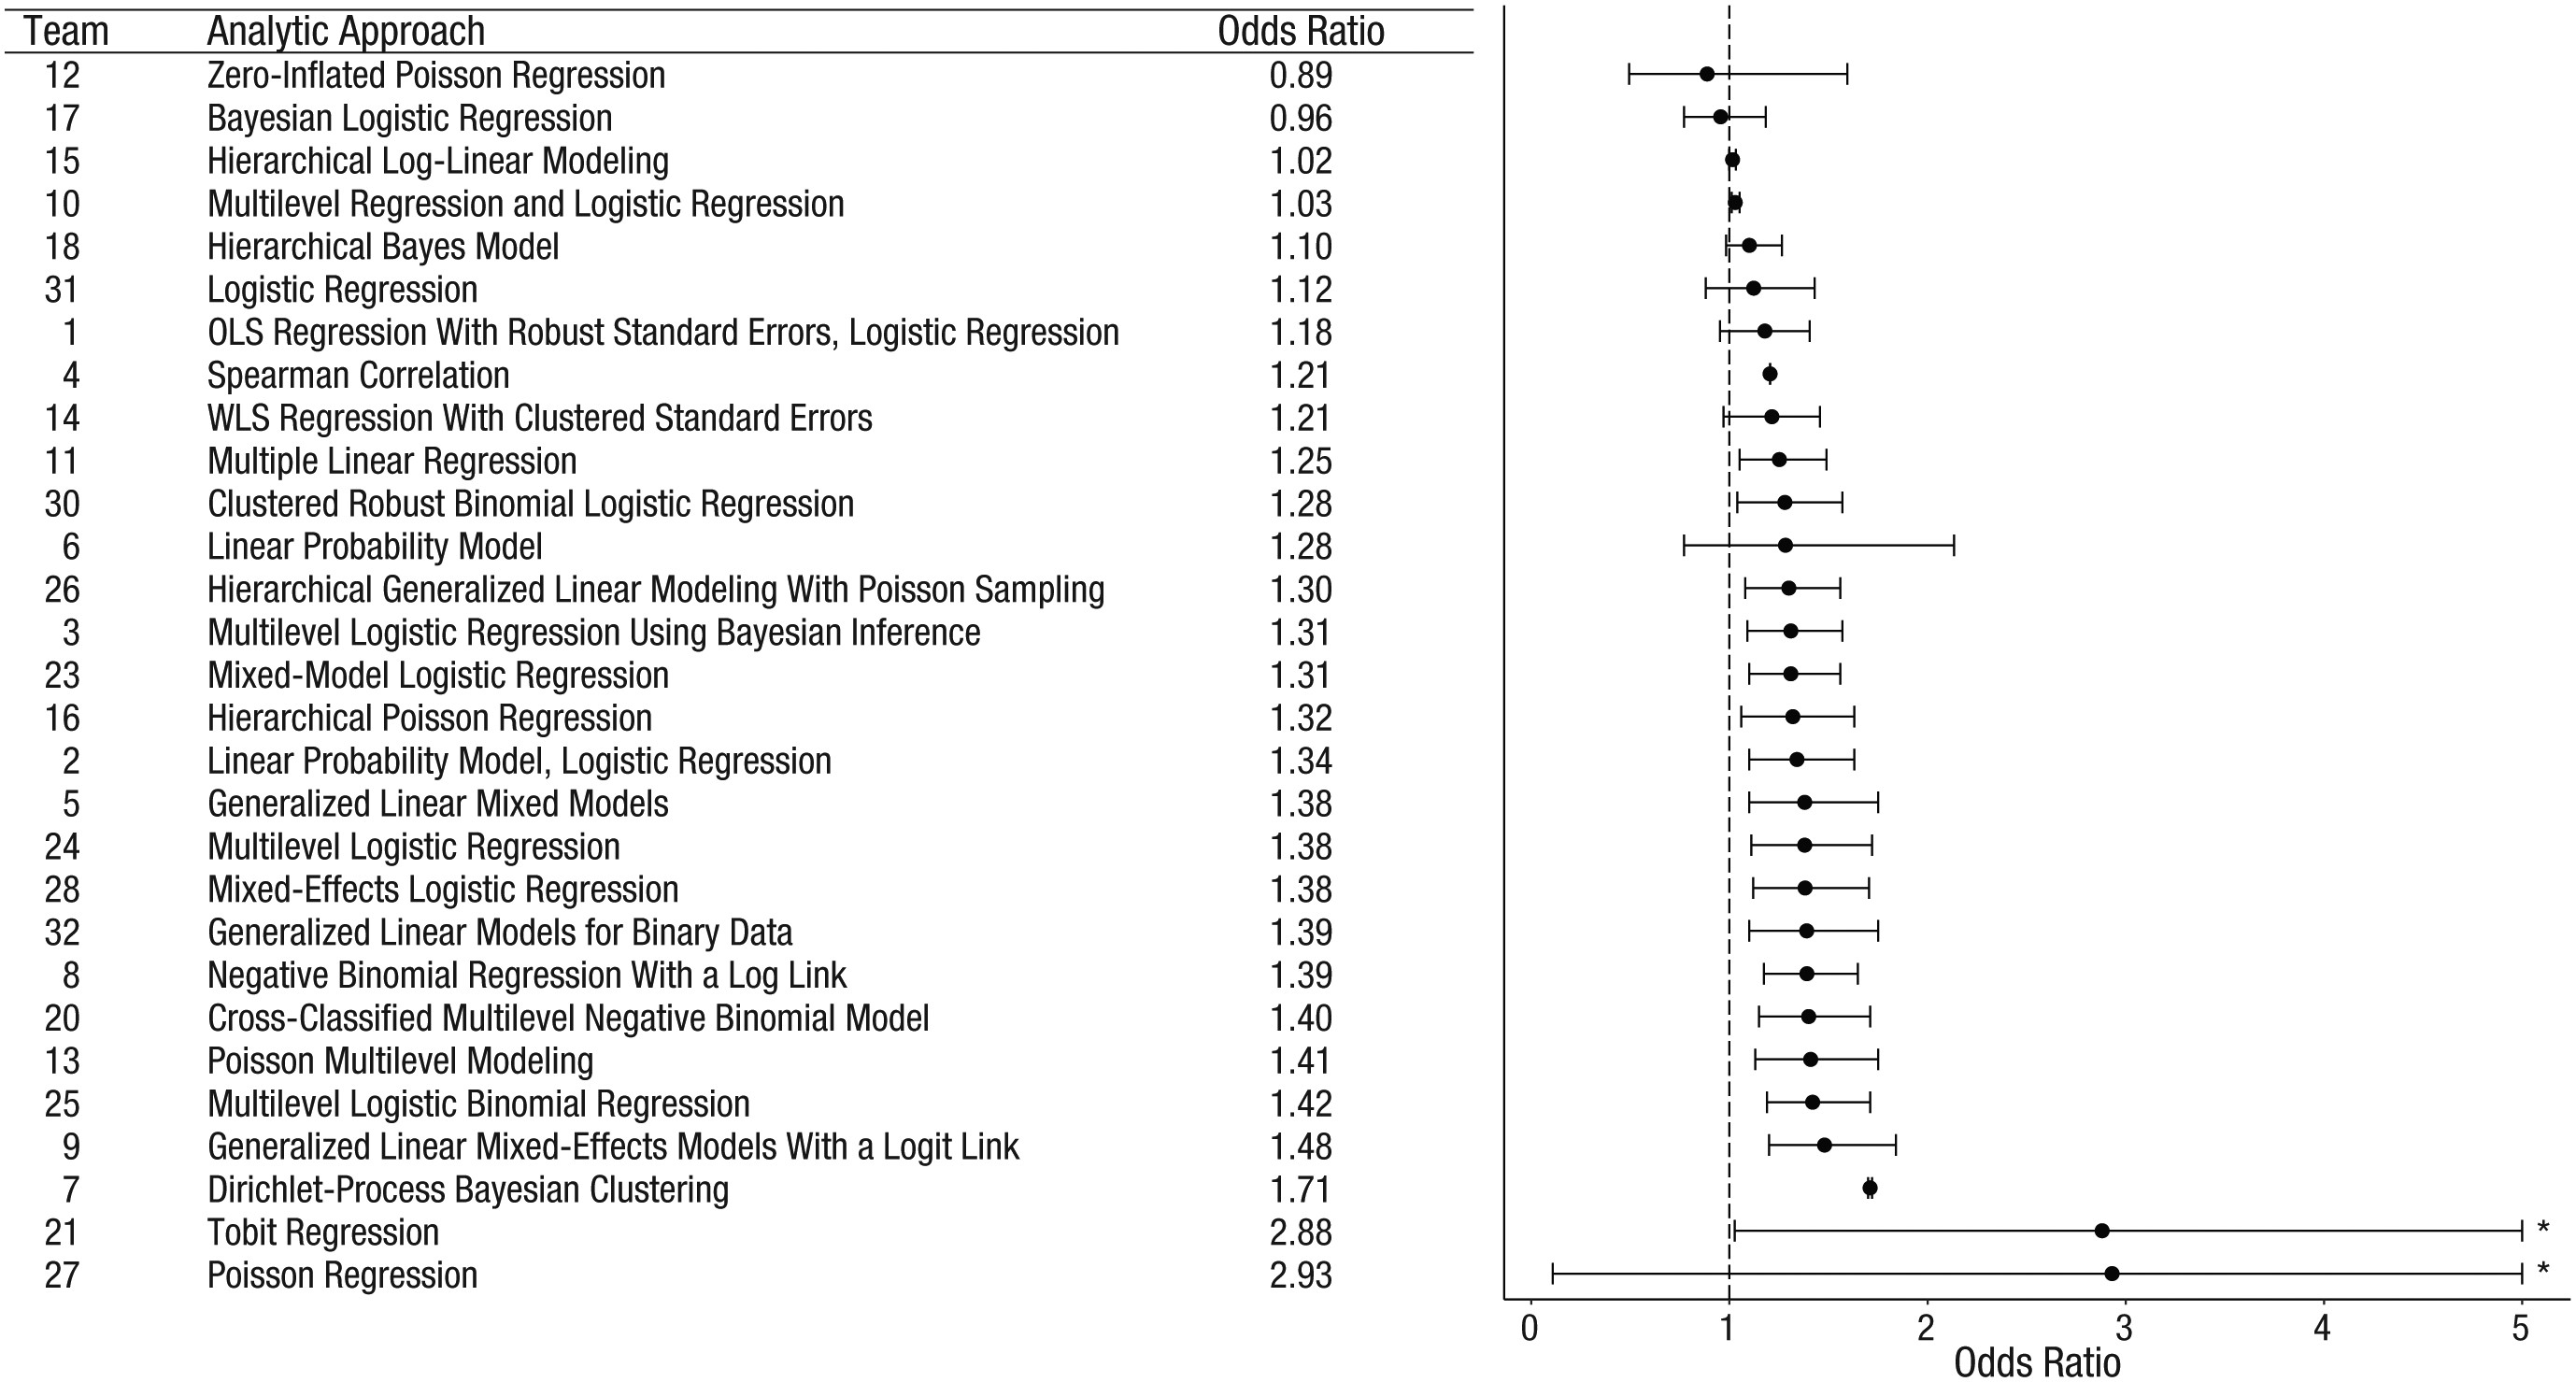
Figure 2 from (Silberzahn et al., 2018)
Point estimates (in order of magnitude) and 95% confidence intervals for the effect of soccer players’ skin tone on the number of red cards awarded by referees. Reported results, along with the analytic approach taken, are shown for each of the 29 analytic teams. The teams are ordered so that the smallest reported effect size is at the top and the largest is at the bottom…
…The asterisks indicate upper bounds that have been truncated to increase the interpretability of the plot; the actual upper bounds of the confidence intervals were 11.47 for Team 21 and 78.66 for Team 27. OLS = ordinary least squares; WLS = weighted least squares.
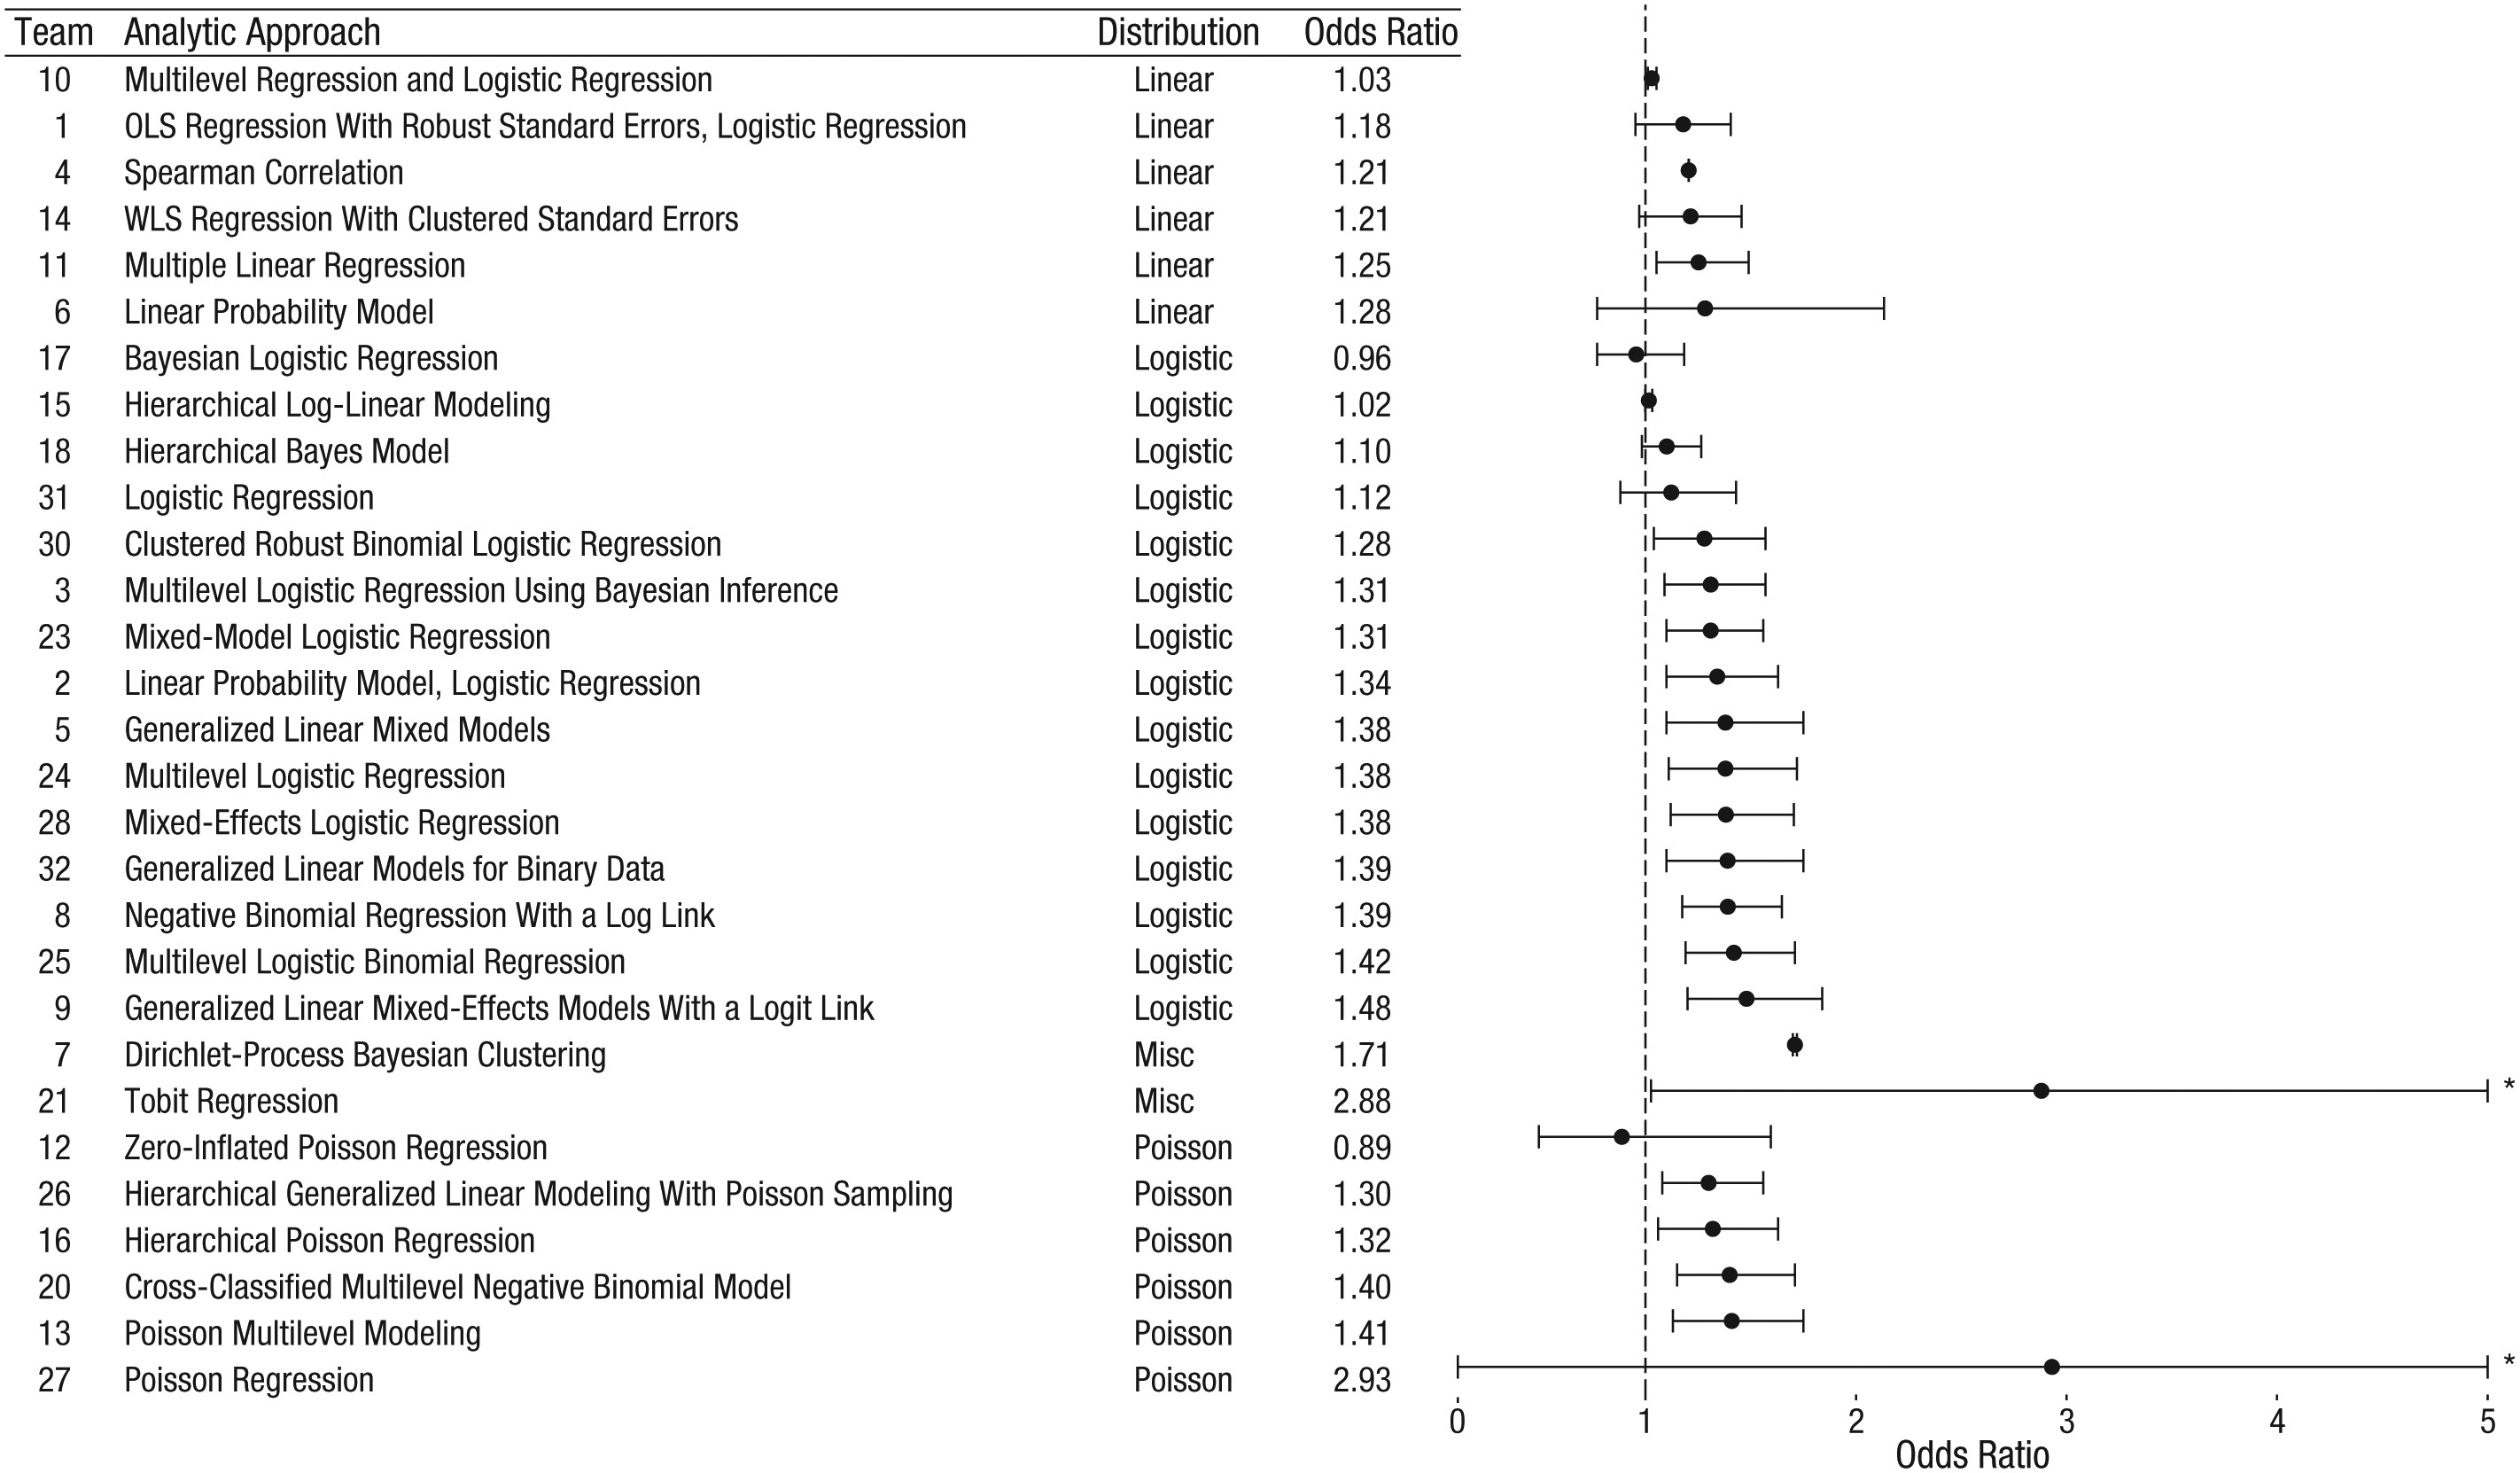
Figure 3 from (Silberzahn et al., 2018)
Point estimates (clustered by analytic approach) and 95% confidence intervals for the effect of soccer players’ skin tone on the number of red cards awarded by referees. Reported results, along with the analytic approach taken, are shown for each of the 29 analytic teams…
…The teams are clustered according to the distribution used in their analyses; within each cluster, the teams are listed in order of the magnitude of the reported effect size, from smallest at the top to largest at the bottom. The asterisks indicate upper bounds that have been truncated to increase the interpretability of the plot (see Fig. 2). OLS = ordinary least squares; WLS = weighted least squares; Misc = miscellaneous.

Figure 4 from (Silberzahn et al., 2018)
Fig. 4. The teams’ subjective beliefs about the primary research question across time. For each of the four subjective-beliefs surveys, the plot on the left shows each team leader’s response to the question asking whether players’ skin tone predicts how many red cards they receive. The heavy black line represents the mean response at each time point…
Each individual trajectory is jittered slightly to increase the interpretability of the plot. The plot on the right shows the number of team leaders who endorsed each response option at each time point.
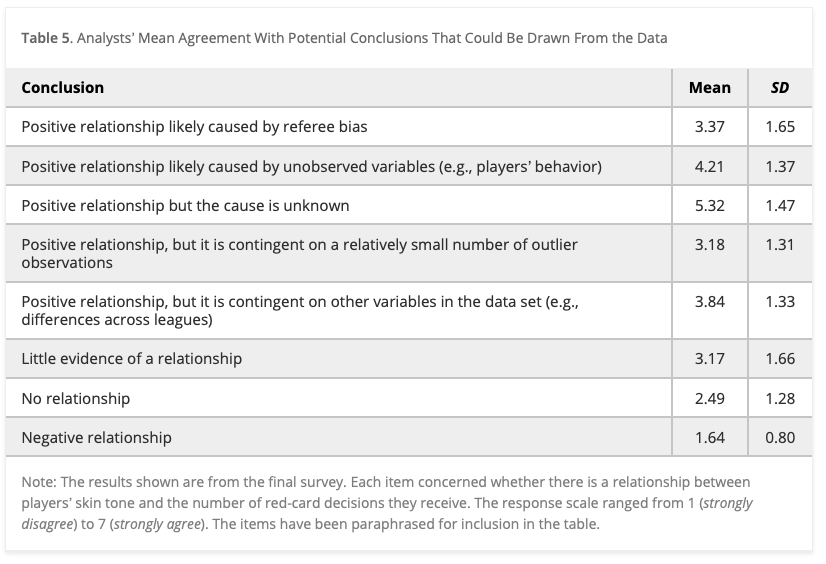
Table 5 from (Silberzahn et al., 2018). Analysts’ Mean Agreement With Potential Conclusions That Could Be Drawn From the Data
Note: The results shown are from the final survey. Each item concerned whether there is a relationship between players’ skin tone and the number of red-card decisions they receive. The response scale ranged from 1 (strongly disagree) to 7 (strongly agree). The items have been paraphrased for inclusion in the table.
Neither analysts’ prior beliefs about the effect of interest nor their level of expertise readily explained the variation in the outcomes of the analyses. Peer ratings of the quality of the analyses also did not account for the variability.
These findings suggest that significant variation in the results of analyses of complex data may be difficult to avoid, even by experts with honest intentions. Crowdsourcing data analysis, a strategy in which numerous research teams are recruited to simultaneously investigate the same research question, makes transparent how defensible, yet subjective, analytic choices influence research results.
Your turn
::: {.callout-note title = “Your thoughts?”}
- So, are soccer referees more likely to give red cards to dark-skin-toned players?
- How is this approach related to p-hacking?
- How does the many analysts approach conflict with current practice?
- When does this approach make sense and when doesn’t it make sense?
:::
Other examples of “many-analysts” or “multiverse” approaches
- (Gould et al., 2023) in ecology
- (Botvinik-Nezer et al., 2020) in cognitive neuroscience

Figure from (Gould et al., 2023)
…Here we assess the effect of this flexibility on the results of functional magnetic resonance imaging by asking 70 independent teams to analyse the same dataset, testing the same 9 ex-ante hypotheses. The flexibility of analytical approaches is exemplified by the fact that no two teams chose identical workflows to analyse the data.
This flexibility resulted in sizeable variation in the results of hypothesis tests, even for teams whose statistical maps were highly correlated at intermediate stages of the analysis pipeline.
Our findings show that analytical flexibility can have substantial effects on scientific conclusions, and identify factors that may be related to variability in the analysis of functional magnetic resonance imaging. The results emphasize the importance of validating and sharing complex analysis workflows, and demonstrate the need for performing and reporting multiple analyses of the same data.
Next time
Final project work day
- Optional Extra Credit Assignment
- For 5 extra credit points, write a paragraph that summarizes the main findings of (Camerer et al., 2018).
Resources
References
PSYCH 490.009: 2023-11-01 Wed