Questionable research practices
2023-10-11 Fri
Prelude
singalong (2015)
Overview
In the news…
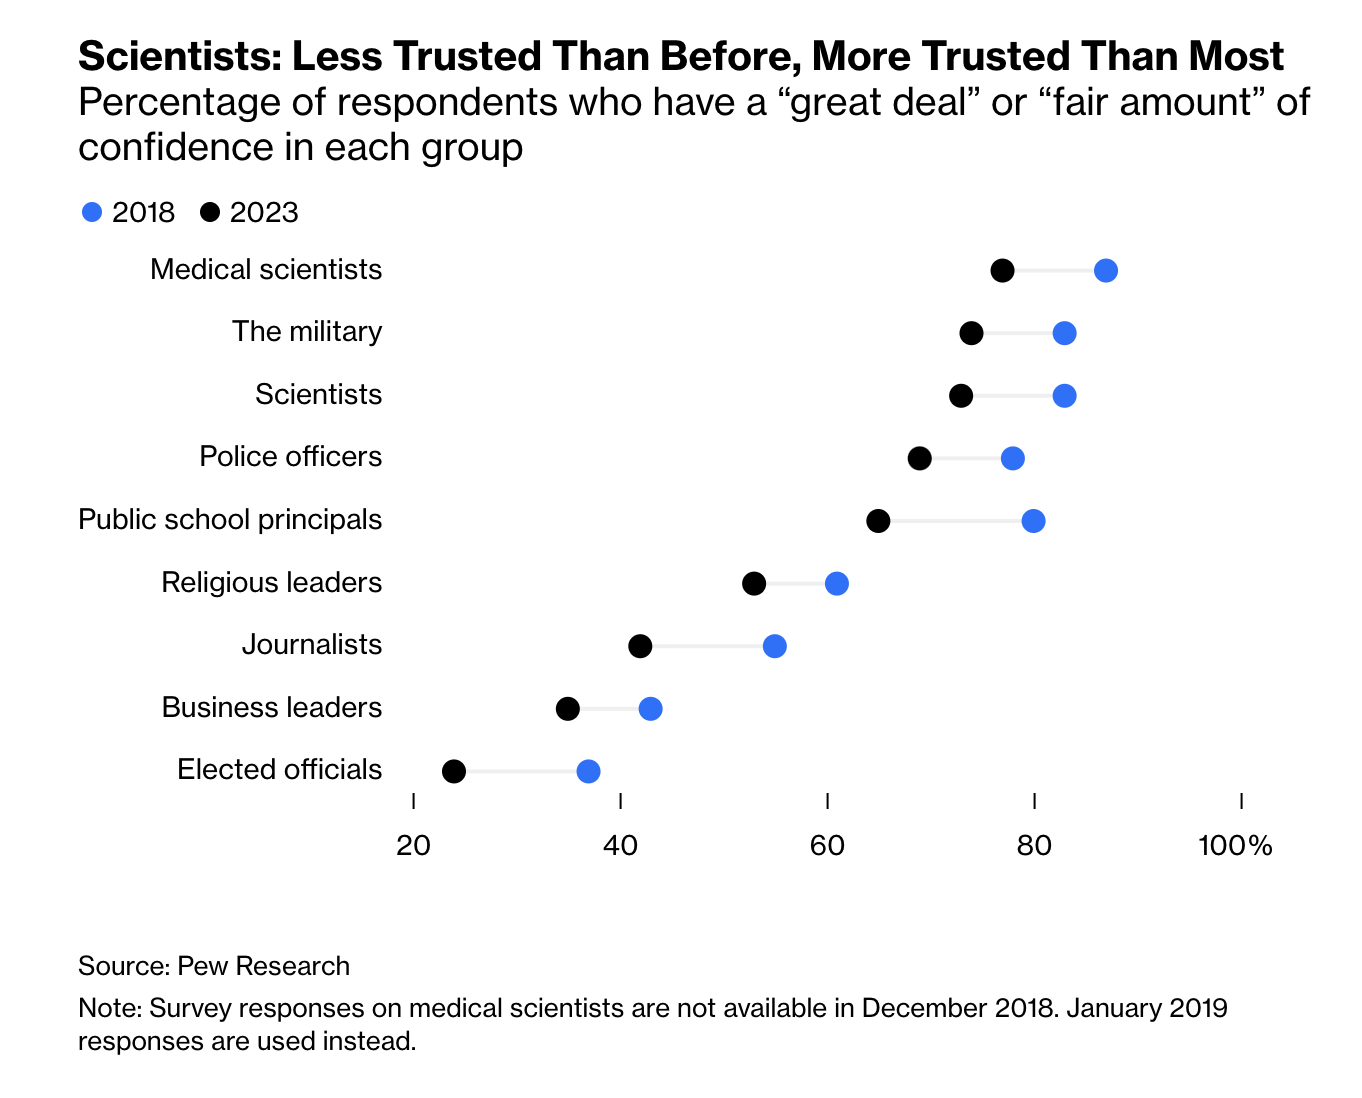
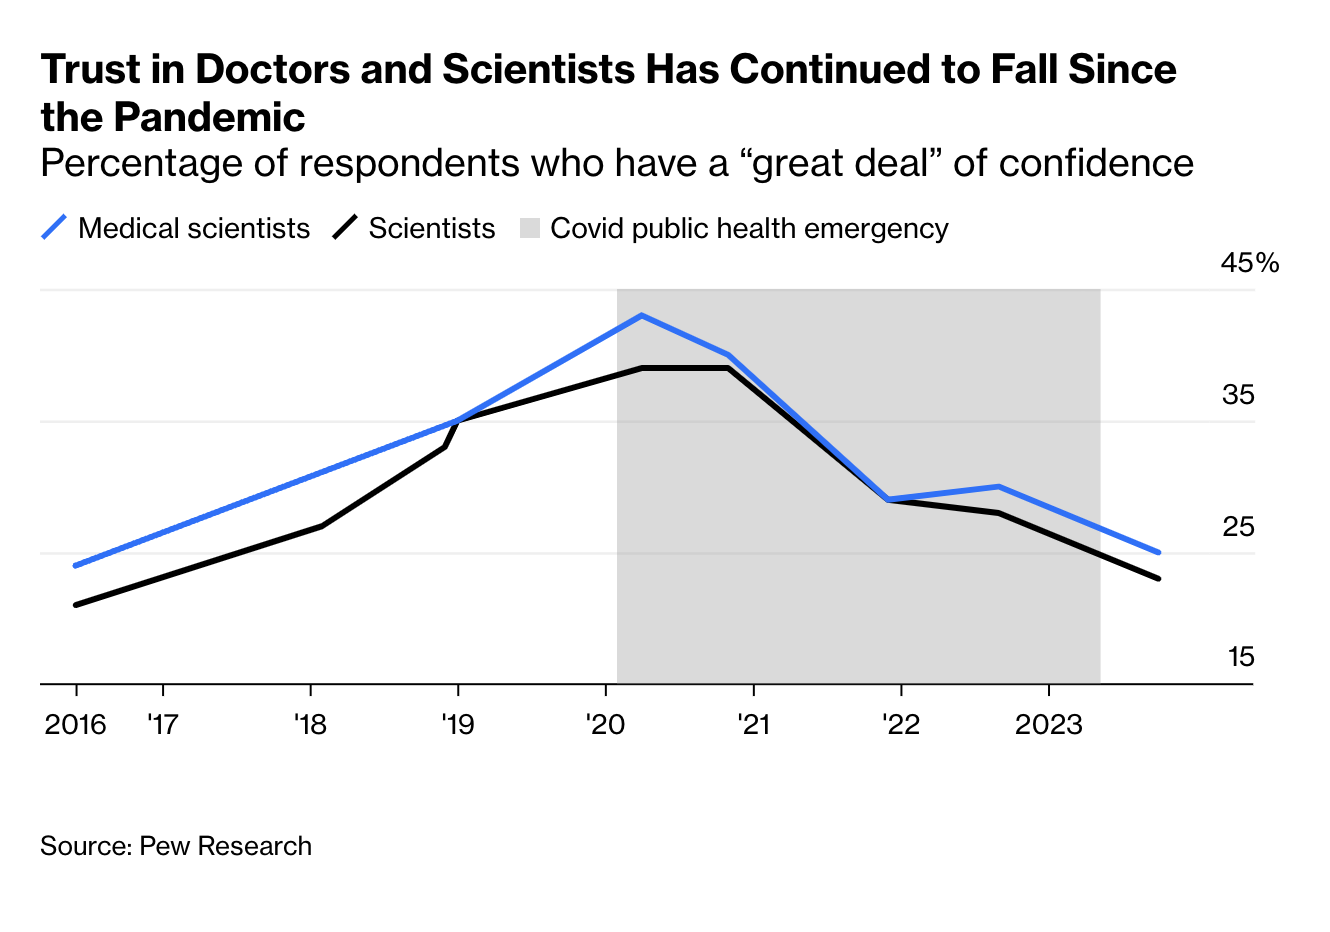
Flam (2024)
Flam (2024) recommendations
Treat everyone with respect—even the doubters
Practice what you preach — and don’t preach what you can’t practice
Admit what you don’t know
Recognize your mistakes
Flam (2024)
Announcements
- Due Monday
- Due next Friday
- Final project proposal
Last time…
Retraction and scientific integrity
Today
Questionable research practices
- Discuss
- Simmons, Nelson, & Simonsohn (2011)
- Bring
- Draft Exercise 05: P-hack your way to scientific glory for discussion.
Set-up for group discussion…
- Enter (anonymized) data into a spreadsheet
https://docs.google.com/spreadsheets/d/1NXcBrI_bMP_wFi1BurCS5WGppr9HWBiF5ulh7ch61MU/edit?usp=sharing
- Choose a student_id (integer) for yourself (not your PSU ID or phone number)
On questionable research practices
Simmons, J. P., Nelson, L. D. & Simonsohn, U. (2011). False-positive psychology: Undisclosed flexibility in data collection and analysis allows presenting anything as significant. Psychological Science, 22(11), 1359–1366. https://doi.org/10.1177/0956797611417632
Central questions
- What are researcher ‘degrees of freedom’?
- Why should we care about them?
- What are questionable research practices?
- Why should we care about them?
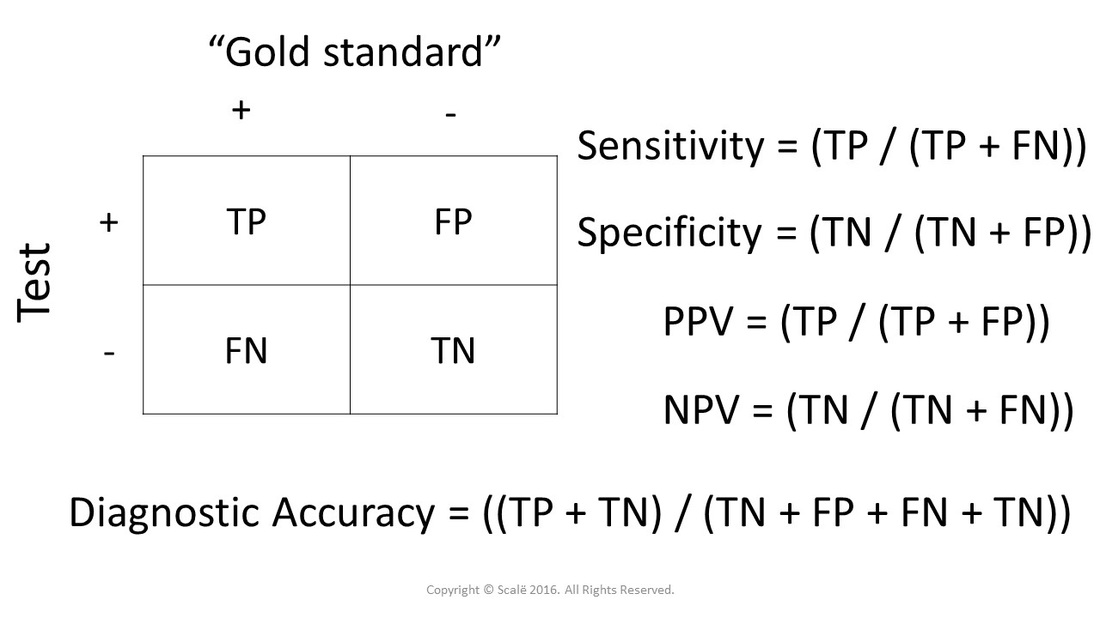
False positives vs. false negatives
- Null hypothesis: There is no effect (or no difference between observation and reference)
- Positive: What’s actually true, a true fact
- Negative: What’s actually untrue, a false fact
- What does our evidence say?
Decision matrix
| Evidence says | True fact | False fact |
|---|---|---|
| True | True positive | False positive (Type I) |
| False | False negative (Type II) | True negative |
Decision matrix
| Evidence says | True fact | False fact |
|---|---|---|
| True | True positive | False positive (Type I) |
| False | False negative (Type II) | True negative |
Goals
- Minimize false positives (Type I errors) or maximize specificity
- Minimize false negatives (Type II errors) or maximize sensitivity
What we do and don’t control
- What we control
- How to decide based on evidence
- What we don’t control
- What’s true or false (\(p(True fact)\))
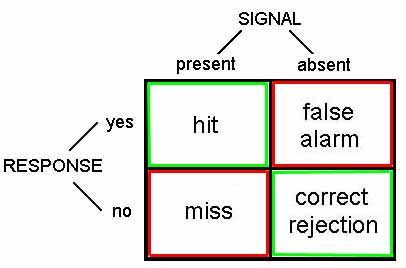
Biostatistics version
Signal Detection Theory
Practices
- Control alpha (\(\alpha\))
- a probability or p value
- to make false positive decisions very rarely
- Control beta (\(\beta\))
- to make false negative decisions very rarely
- statistical ‘power’ is \(1-\beta\).
Note
\(\alpha\), \(\beta\), \(\gamma\), \(\delta\)…
are letters from the Greek alphabet.
| Evidence says | True fact | False fact |
|---|---|---|
| True | \(1-\beta\) | \(\alpha\) |
| False | \(\beta\) | \(1-\alpha\) |
- If a fact is truly true, then our evidence should say so \(1-\beta\) of the time.
- If a fact is truly false, our evidence should say so \(1-\alpha\) of the time.
Questions for understanding
- Why do researchers prefer a small (\(<0.05\)) \(\alpha\)?
- Why do researchers prefer a small \(\beta\)?
- Hint: Why do researchers call \(1-\beta\) ‘power’?
Defensible choice or questionable practice?
- In a paper, failing to report all of a study’s dependent measures
- Deciding whether to collect more data after looking to see whether the results were significant
- In a paper, failing to report all of a study’s conditions
- Stopping collecting data earlier than planned because one found the result that one had been looking for
- In a paper, “rounding off” a p value (e.g., reporting that a p value of .054 is less than .05)
- In a paper, selectively reporting studies that “worked”
- Deciding whether to exclude data after looking at the impact of doing so on the results
- In a paper, reporting an unexpected finding as having been predicted from the start
- In a paper, claiming that results are unaffected by demographic variables (e.g., gender) when one is actually unsure (or knows that they do)
- Falsifying data
Note
Why might a researcher do these things?
Why might such choices be questionable?
Researcher ‘degrees of freedom’
The culprit is a construct we refer to as researcher degrees of freedom. In the course of collecting and analyzing data, researchers have many decisions to make: Should more data be collected? Should some observations be excluded? Which conditions should be combined and which ones compared? Which control variables should be considered? Should specific measures be combined or transformed or both?
Note
What’s a ‘degree of freedom’?
What does it mean in this context?
See this supplemental page for more info.
It is rare, and sometimes impractical, for researchers to make all these decisions beforehand. Rather, it is common (and accepted practice) for researchers to explore various analytic alternatives, to search for a combination that yields “statistical significance,” and to then report only what “worked.”
Note
- Why is it rare for researchers to make these decisions beforehand?
- Why is it impractical?
- What (relatively new) practice involves making many of these decisions in advance? Hint.
The problem, of course, is that the likelihood of at least one (of many) analyses producing a falsely positive finding at the 5% level is necessarily greater than 5%.
Simmons et al. (2011)
This exploratory behavior is not the by-product of malicious intent, but rather the result of two factors: (a) ambiguity in how best to make these decisions and (b) the researcher’s desire to find a statistically significant result.
Simmons et al. (2011)
Choices to be made…
- Choosing dependent measure or measures
- Choosing sample size
- Stopping early
- Choosing covariates
- Reporting subsets of conditions
- Trimming data (e.g., how to treat outliers)
What’s “too fast” for reaction time?
In a perusal of roughly 30 Psychological Science articles, we discovered considerable inconsistency in, and hence considerable ambiguity about, this decision. Most (but not all) researchers excluded some responses for being too fast, but what constituted “too fast” varied enormously: the fastest 2.5%, or faster than 2 standard deviations from the mean, or faster than 100 or 150 or 200 or 300 ms.
Similarly, what constituted “too slow” varied enormously: the slowest 2.5% or 10%, or 2 or 2.5 or 3 standard deviations slower than the mean, or 1.5 standard deviations slower from that condition’s mean, or slower than 1,000 or 1,200 or 1,500 or 2,000 or 3,000 or 5,000 ms. None of these decisions is necessarily incorrect, but that fact makes any of them justifiable and hence potential fodder for self-serving justifications.
Simmons et al. (2011)
Note
When we “trim outliers” from our data what assumption(s) are we making?
When are those assumptions justified and when might they not be?
Study 1: Simmons et al. (2011)
we investigated whether listening to a children’s song induces an age contrast, making people feel older.
In exchange for payment, 30 University of Pennsylvania undergraduates sat at computer terminals, donned headphones, and were randomly assigned to listen to either a control song (“Kalimba,” an instrumental song by Mr. Scruff that comes free with the Windows 7 operating system) or a children’s song (“Hot Potato,” performed by The Wiggles).
After listening to part of the song, participants completed an ostensibly unrelated survey: They answered the question “How old do you feel right now?” by choosing among five options (very young, young, neither young nor old, old, and very old). They also reported their father’s age, allowing us to control for variation in baseline age across participants.
An analysis of covariance (ANCOVA) revealed the predicted effect: People felt older after listening to “Hot Potato” (adjusted M = 2.54 years) than after listening to the control song (adjusted M = 2.06 years), F(1, 27) = 5.06, p = .033.
Note
An analysis of covariance (ANCOVA) is a tool for asking whether there is some difference between groups (here the song listened to) when we account for a third variable, like father’s age.
Link to supplemental illustration of ANCOVA
Study 2
we sought to conceptually replicate and extend Study 1. Having demonstrated that listening to a children’s song makes people feel older, Study 2 investigated whether listening to a song about older age makes people actually younger.
…we asked 20 University of Pennsylvania undergraduates to listen to either “When I’m Sixty-Four” by The Beatles or “Kalimba.” Then, in an ostensibly unrelated task, they indicated their birth date (mm/dd/yyyy) and their father’s age. We used father’s age to control for variation in baseline age across participants.
…An ANCOVA revealed the predicted effect: According to their birth dates, people were nearly a year-and-a-half younger after listening to “When I’m Sixty-Four” (adjusted M = 20.1 years) rather than to “Kalimba” (adjusted M = 21.5 years), F(1, 17) = 4.92, p = .040.
Wait a minute…
- What did they say?
- How is that even possible?
Illustration
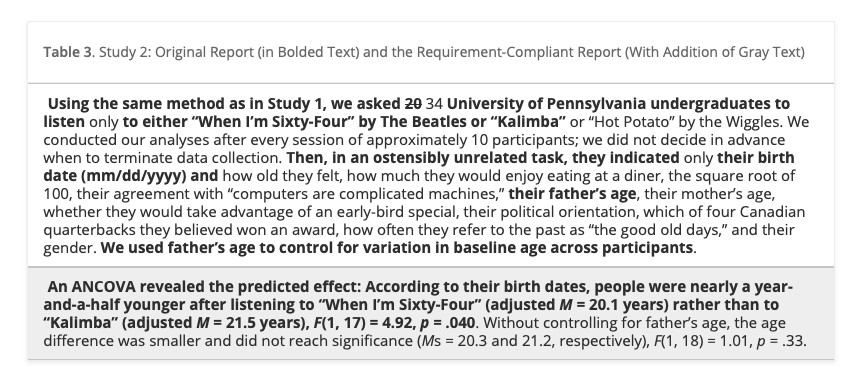
Table 3 from Simmons et al. (2011)
First, notice that in our original report, we redacted the many measures other than father’s age that we collected (including the dependent variable from Study 1: feelings of oldness). A reviewer would hence have been unable to assess the flexibility involved in selecting father’s age as a control.
Second, by reporting only results that included the covariate, we made it impossible for readers to discover its critical role in achieving a significant result. Seeing the full list of variables now disclosed, reviewers would have an easy time asking for robustness checks, such as “Are the results from Study 1 replicated in Study 2?” They are not: People felt older rather than younger after listening to “When I’m Sixty-Four,” though not significantly so, F(1, 17) = 2.07, p=.168.
Finally, notice that we did not determine the study’s termination rule in advance; instead, we monitored statistical significance approximately every 10 observations. Moreover, our sample size did not reach the 20-observation threshold set by our requirements.
The redacted version of the study we reported in this article fully adheres to currently acceptable reporting standards and is, not coincidentally, deceptively persuasive. The requirement-compliant version reported in Table 3 would be—appropriately—all but impossible to publish.
Simulations
These simulations assessed the impact of four common degrees of freedom: flexibility in (a) choosing among dependent variables, (b) choosing sample size, (c) using covariates, and (d) reporting subsets of experimental conditions. We also investigated various combinations of these degrees of freedom.
We generated random samples with each observation independently drawn from a normal distribution, performed sets of analyses on each sample, and observed how often at least one of the resulting p values in each sample was below standard significance levels. For example, imagine a researcher who collects two dependent variables, say liking and willingness to pay. The researcher can test whether the manipulation affected liking, whether the manipulation affected willingness to pay, and whether the manipulation affected a combination of these two variables. The likelihood that one of these tests produces a significant result is at least somewhat higher than .05. We conducted 15,000 simulations of this scenario (and other scenarios) to estimate the size of “somewhat”.
Findings

Table 1 from Simmons et al. (2011)
- Researcher choices inflate false positive rates.
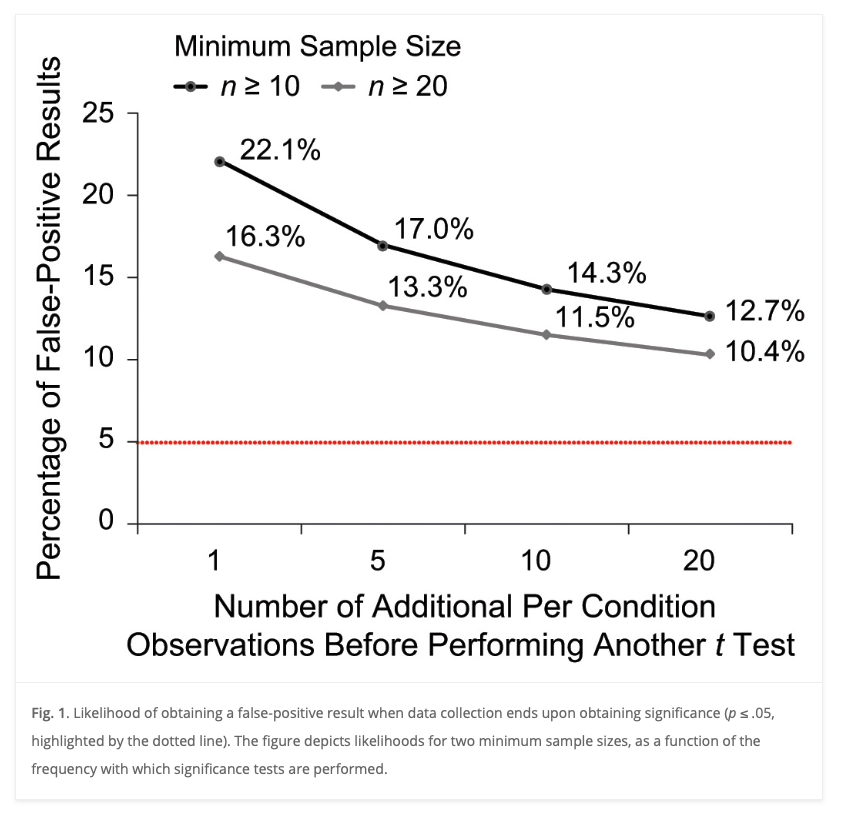
Figure 1 from Simmons et al. (2011)
- Collecting more data after analyzing a small initial sample inflates the false positive rate.
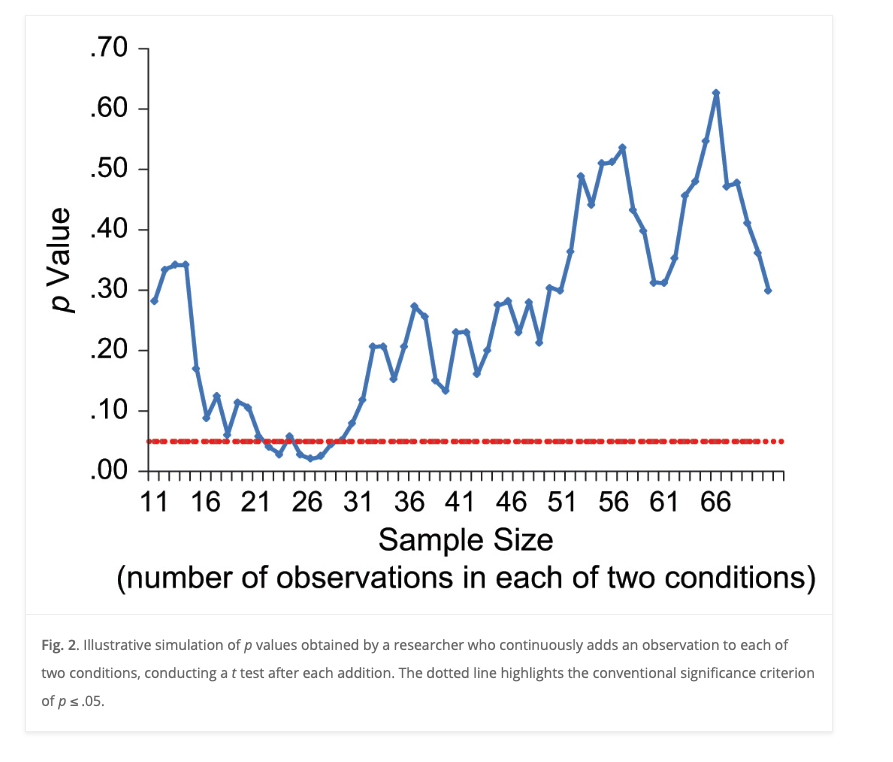
Figure 2 from Simmons et al. (2011)
- Just because a statistical test met the criterion threshold with a small sample doesn’t mean it will do so with larger samples.
Recommendations
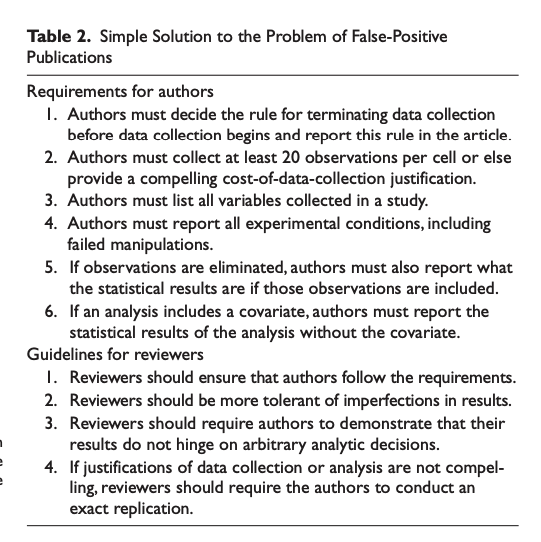
Table 2 from Simmons et al. (2011)
Your thoughts?
- Are these recommendations reasonable?
- Are they feasible?
- Do you think authors and reviewers will comply? Why or why not?
Reproducibility notes
- Simmons et al. (2011) do not appear to have shared data or any supplementary materials along with the article.
Next time
Work Session: P-hacking and Final Project Proposals
- Due
- Work session
- Final project proposals, due Friday, October 18.