Negligence
2024-10-21 Mon
Prelude
Thought question
- What would happen to the ‘file drawer effect’ if we simulated a large effect size with the same small sample size (n)?

https://www.outsideonline.com/culture/love-humor/excellent-advice-for-living-kevin-kelly/

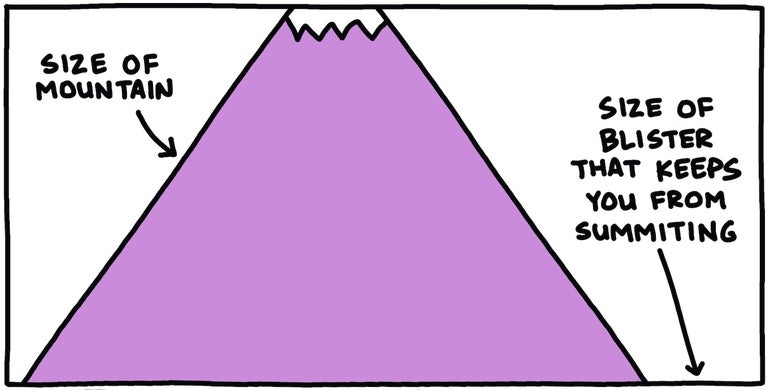
Tend to the small things. More people are defeated by blisters than by mountains.
You choose to be lucky by believing that any setbacks are just temporary.
Kelly (2023), reviewed in
https://www.outsideonline.com/culture/love-humor/excellent-advice-for-living-kevin-kelly/
Overview
Announcements
- Discuss draft Friday, October 25
- Final version due Wednesday, October 30
Last time…
File drawer effect
Important
What is the file drawer effect?
Is the file drawer effect a problem? Why or why not?
If it’s a problem, what’s a solution?
Today
Negligence
Types of negligence
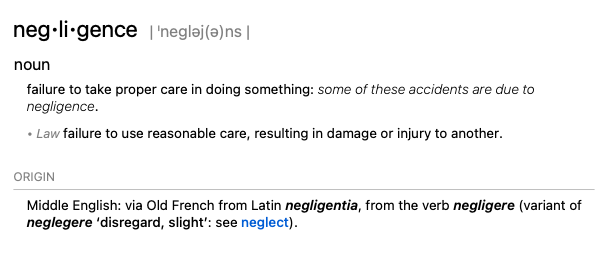
Definitions of

negligence from Mac OS dictionary app
Data mistakes
- e.g., Reinhart & Rogoff spreadsheet error (Alexander, 2013).

Alexander (2013)
Statistical reporting errors
This study documents reporting errors in a sample of over 250,000 p-values reported in eight major psychology journals from 1985 until 2013, using the new R package “statcheck.” statcheck retrieved null-hypothesis significance testing (NHST) results from over half of the articles from this period.
Nuijten et al. (2015)
In line with earlier research, we found that half of all published psychology papers that use NHST contained at least one p-value that was inconsistent with its test statistic and degrees of freedom.
Nuijten et al. (2015)
One in eight papers contained a grossly inconsistent p-value that may have affected the statistical conclusion. In contrast to earlier findings, we found that the average prevalence of inconsistent p-values has been stable over the years or has declined.
Nuijten et al. (2015)
The prevalence of gross inconsistencies was higher in p-values reported as significant than in p-values reported as nonsignificant. This could indicate a systematic bias in favor of significant results.
Nuijten et al. (2015)
Possible solutions for the high prevalence of reporting inconsistencies could be to encourage sharing data, to let co-authors check results in a so-called “co-pilot model,” and to use statcheck to flag possible inconsistencies in one’s own manuscript or during the review process.*”
Nuijten et al. (2015)
statcheck
https://michelenuijten.shinyapps.io/statcheck-web/
Granularity-Related Inconsistency of Means (GRIM)
We present a simple mathematical technique that we call granularity-related inconsistency of means (GRIM) for verifying the summary statistics of research reports in psychology. This technique evaluates whether the reported means of integer data such as Likert-type scales are consistent with the given sample size and number of items.
Brown & Heathers (2017)
How it works
- n=10 people fill out a Likert scale survey question with permissible values of 1, 2, or 3.
- Is a mean score of 2.10 possible?
- How about 2.15? Why?
We tested this technique with a sample of 260 recent empirical articles in leading journals. Of the articles that we could test with the GRIM technique (N = 71), around half (N = 36) appeared to contain at least one inconsistent mean, and more than 20% (N = 16) contained multiple such inconsistencies.
Brown & Heathers (2017)
We requested the data sets corresponding to 21 of these articles, receiving positive responses in 9 cases. We confirmed the presence of at least one reporting error in all cases, with three articles requiring extensive corrections. The implications for the reliability and replicability of empirical psychology are discussed.
Brown & Heathers (2017)
Non-random sampling, blinding and related issues
- e.g., Carlisle (2017)
- “Fraud, unintentional error, correlation, stratified allocation and poor methodology might have contributed to the excess of randomised, controlled trials with similar or dissimilar means, a pattern that was common to all the surveyed journals.”
- but see Kharasch & Houle (2018)
- and reply Carlisle (2018)
Inadequate power
- Power: If there is an effect, what’s the probability my test/decision procedure will detect it (avoid a false negative).
- If \(\beta\) is \(p\)(false negative), then power is \(1-\beta\).
- Sample size and alpha (\(\alpha\)) or \(p\)(false positive) affect power, as does the actual (unknown in advance) effect size (\(d\)).
- Conventions for categorizing effect sizes: small (\(d\) = 0.2), medium (\(d\) = 0.5), and large (\(d\) = 0.8).
We have empirically assessed the distribution of published effect sizes and estimated power by analyzing 26,841 statistical records from 3,801 cognitive neuroscience and psychology papers published recently. The reported median effect size was D = 0.93 (interquartile range: 0.64–1.46) for nominally statistically significant results and D = 0.24 (0.11–0.42) for nonsignificant results.
Szucs & Ioannidis (2017)
Median power to detect small, medium, and large effects was 0.12, 0.44, and 0.73, reflecting no improvement through the past half-century. This is so because sample sizes have remained small. Assuming similar true effect sizes in both disciplines, power was lower in cognitive neuroscience than in psychology.
Szucs & Ioannidis (2017)
d vs. observed power (Szucs & Ioannidis, 2017)
| Effect size | d | Median observed power | \(\beta\) |
|---|---|---|---|
| Small | 0.2 | 0.12 | 0.88 |
| Medium | 0.5 | 0.44 | 0.56 |
| Large | 0.8 | 0.73 | 0.27 |
Important
Remember \(\beta\): p(false negative)
Journal impact factors negatively correlated with power. Assuming a realistic range of prior probabilities for null hypotheses, false report probability is likely to exceed 50% for the whole literature. In light of our findings, the recently reported low replication success in psychology is realistic, and worse performance may be expected for cognitive neuroscience.”
Szucs & Ioannidis (2017)
Figure 3 from Szucs & Ioannidis (2017)
Reading (Figure 3 from Szucs & Ioannidis, 2017)
- Horizontal axis: Fraction of studies, so median can be found at 0.5 (half above/half below).
- Vertical axis: A. Degrees of freedom (~ sample size); B. Power (1-\(\beta\))
Note
Why do so many studies have such low power?
If power is low, what should researchers do going forward to increase it? Why might increasing power be difficult?
A new mantra
- Plan your study (to have adequate power)!
- Plot your data!
- Script your analyses!
- Publish your results, especially null findings!
Next time
Hype
- Read
- Carney, Cuddy, & Yap (2010), file on Canvas
- (Optional) Ranehill et al. (2015), file on Canvas
