Human brain development
Timeline of milestones

- CNS among earliest-developing, last to finish organ systems
- Prolonged developmental period…makes CNS vulnerable
- CNS especially open to external influences
- ~ 86 billion neurons in adult CNS
- similar # of glia
- about 16 (14-32) billion neurons, 80/20% Glu/GABA
- 7-80K synapses/cortical neuron
- 164 trillion synapses in cerebral cortex, (DeFelipe, Alonso-Nanclares, & Arellano, 2002)
- \(10^{15}\) (quadrillion) synapses in CNS
- 145-175 km (90-109 mi) of myelinated axons, (Marner, Nyengaard, Tang, & Pakkenberg, 2003)
- brain ~ 2.5% of body mass, but consumes 18% of \(O_2\) at rest, (Kety & Schmidt, 1948), and has been estimated to consume about 20 W.
- millions of neurons generated per hour
Summaries by phase
Prenatal period
Summary
- ~38 weeks from conception/fertilization on average
- Embryonic period (weeks 1-8), fetal period (weeks 9-)
- Three 12-13 week trimesters
Insemination
- Can occur 3-4 days before or up to 1-2 days after…
- Ovulation
Fertilization
- Within ~ 24 hrs of ovulation
Implantation
- ~ 6 days after fertilization
Early embryogenesis
Formation of neural tube (neurulation)
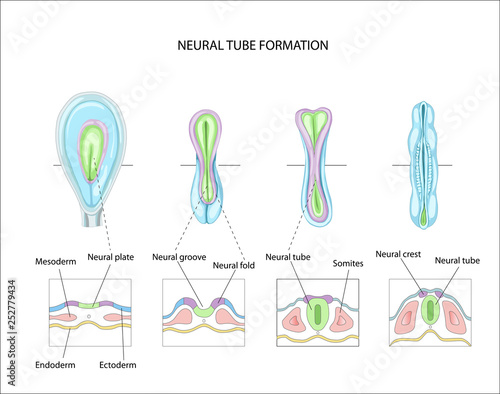
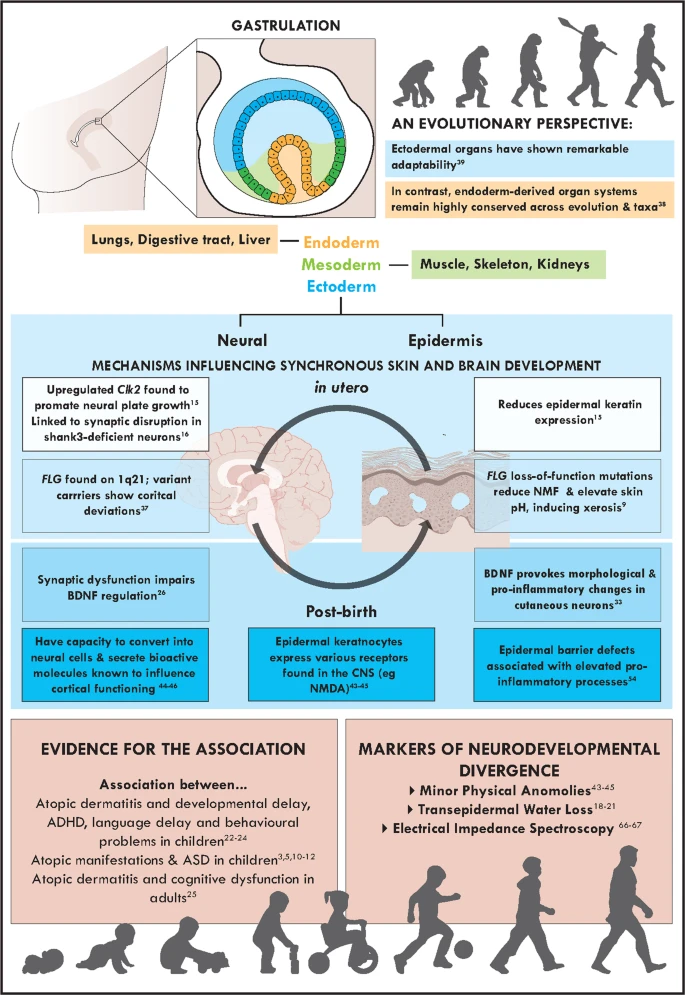
- Embryonic layers: ectoderm, mesoderm, endoderm
- Neural tube forms ~ 23 pcd (postconceptual days) from dorsal ectoderm
- “Skin-brain” axis (Jameson, Boulton, Silove, Nanan, & Guastella, 2023).
- Neural tube closes in middle, moves toward rostral & caudal ends, closing by 29 - 30 pcd.
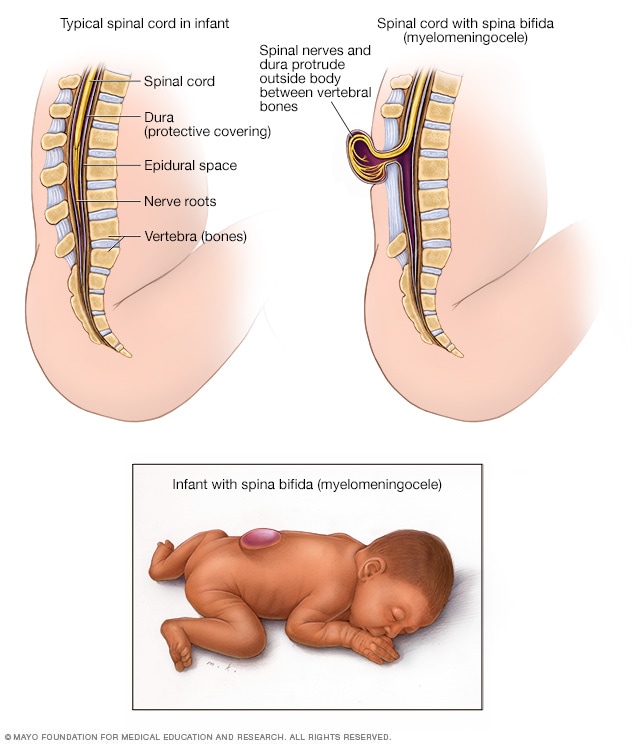
- Failures of neural tube closure
- Anencephaly (rostral neuraxis)
- Spina bifida (caudal neuraxis)
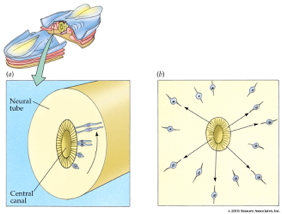
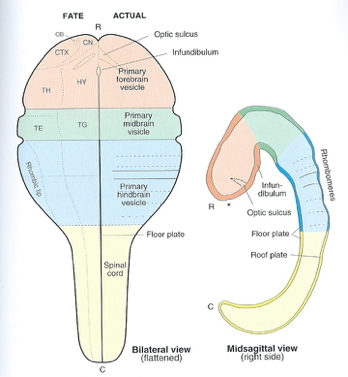
- Neural tube becomes
- Ventricles & cerebral aqueduct
- Central canal of spinal cord

- Rostro-caudal patterning via differential growth into vesicles
- Forebrain (prosencephalon)
- Midbrain (mesencephalone)
- Hindbrain (rhomencephalon)
Neurogenesis and gliogenesis
- Neuroepithelium cell layer lines neural tube creating ventricular zone (VZ) and subventricular zone (SVZ)
- Peri-ventricular regions home to pluripotent stem and progenitor cells that produce new neurons & glia
- Neurogenesis (of excitatory Glu neurons) observed by 27 pcd (7 pcw; post-conceptual week)
- complete by 191 pcd (27 pcw), Silbereis et al. (2016)
- Most cortical and striatal neurons generated prenatally, but
- Cerebellum continues to ~ 18 mos
- Areas in adult human brain that generate new neurons
- hippocampus
- striatum
- olfactory bulb (minimally)
- weak evidence for substantial neurogenesis in adult cerebral cortex
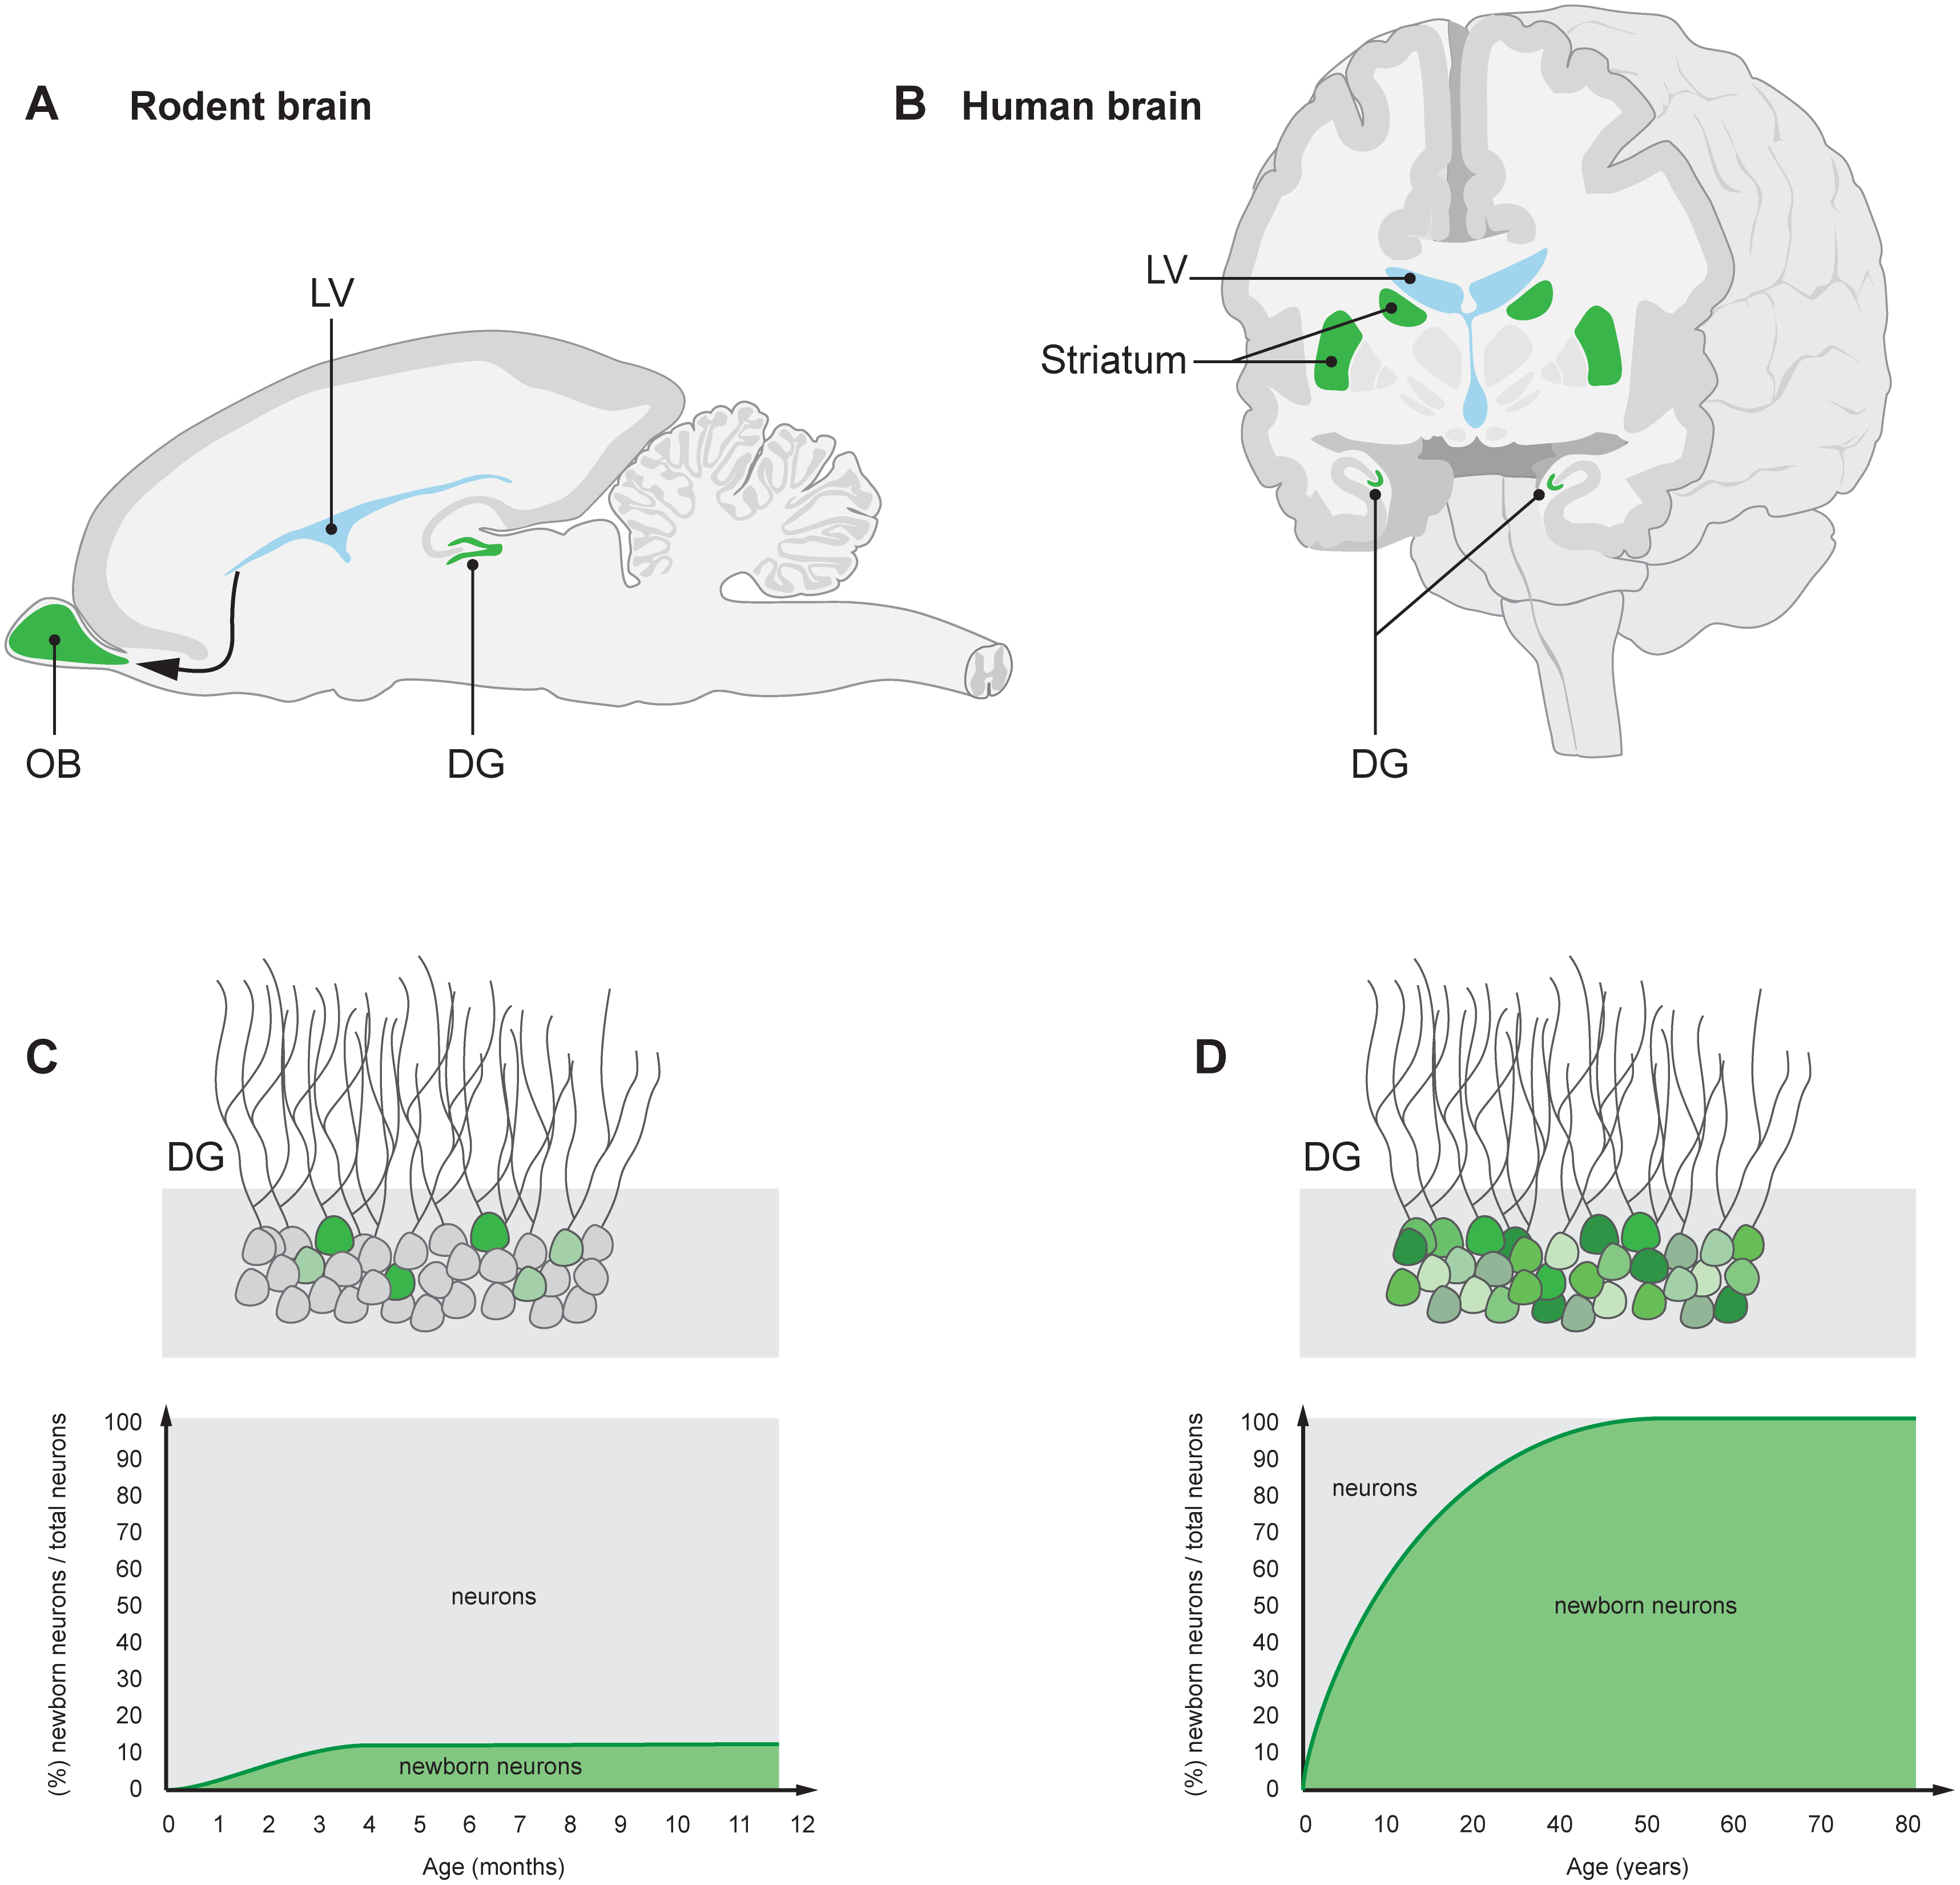
New neurons are indicated in green. (A) Neuroblasts that are generated in the subventricular zone lining the lateral ventricle (LV) in rodents migrate to the OB, a structure crucial for olfaction, where they integrate as interneurons. (B) Neuroblasts are present in the subventricular zone also in humans, and new neurons integrate in the adjacent striatum, which plays an essential role in movement coordination, procedural learning, and memory, as well as motivational and emotional control. New neurons are continuously generated in the DG of the hippocampus—a brain structure essential for memory and mood control—in both rodents and humans (A, B). A limited subpopulation of DG neurons are subject to exchange in rodents (C), whereas the majority turn over in humans (D) [4–6]. The neurons within the turning over population are continuously exchanged. A value of 100% on the y-axis means that all neurons have been replaced since the individual’s birth. Ernst & Frisén (2015)
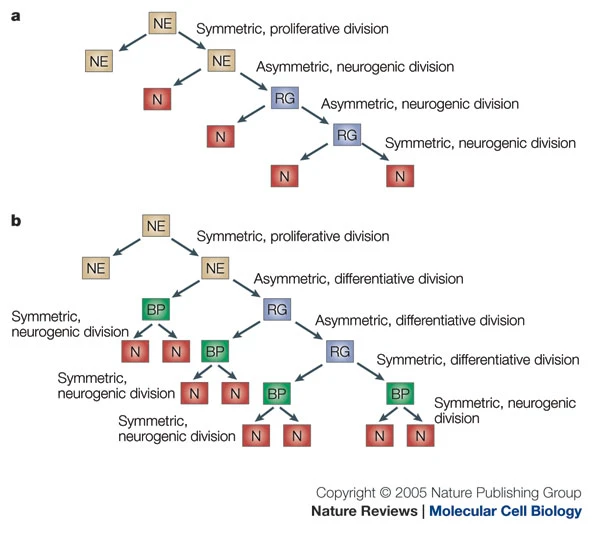
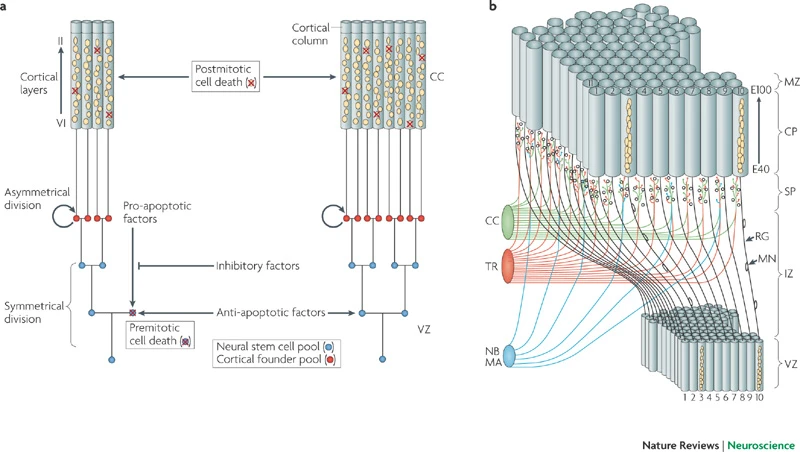
- Neural stem cells
- Undergo symmetric & asymmetric cell division
- Generate glia, neurons, and basal progenitor cells
Radial glia and cell migration
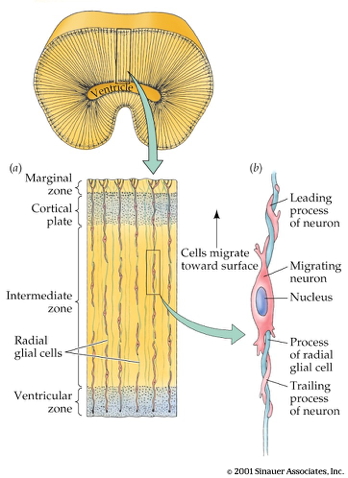
Radial unit hypothesis
Axon growth cone
- Chemoattractants
- e.g., Nerve Growth Factor (NGF)
- Chemorepellents
- Receptors in growth cone detect chemical gradients
Glia migrate, too

Differentiation
- Neuron vs. glial cell
- Cell type
- myelin-producing vs. astrocyte vs. microglia
- pyramidal cell vs. stellate vs. Purkinje vs. …
- NTs released
- Where to connect
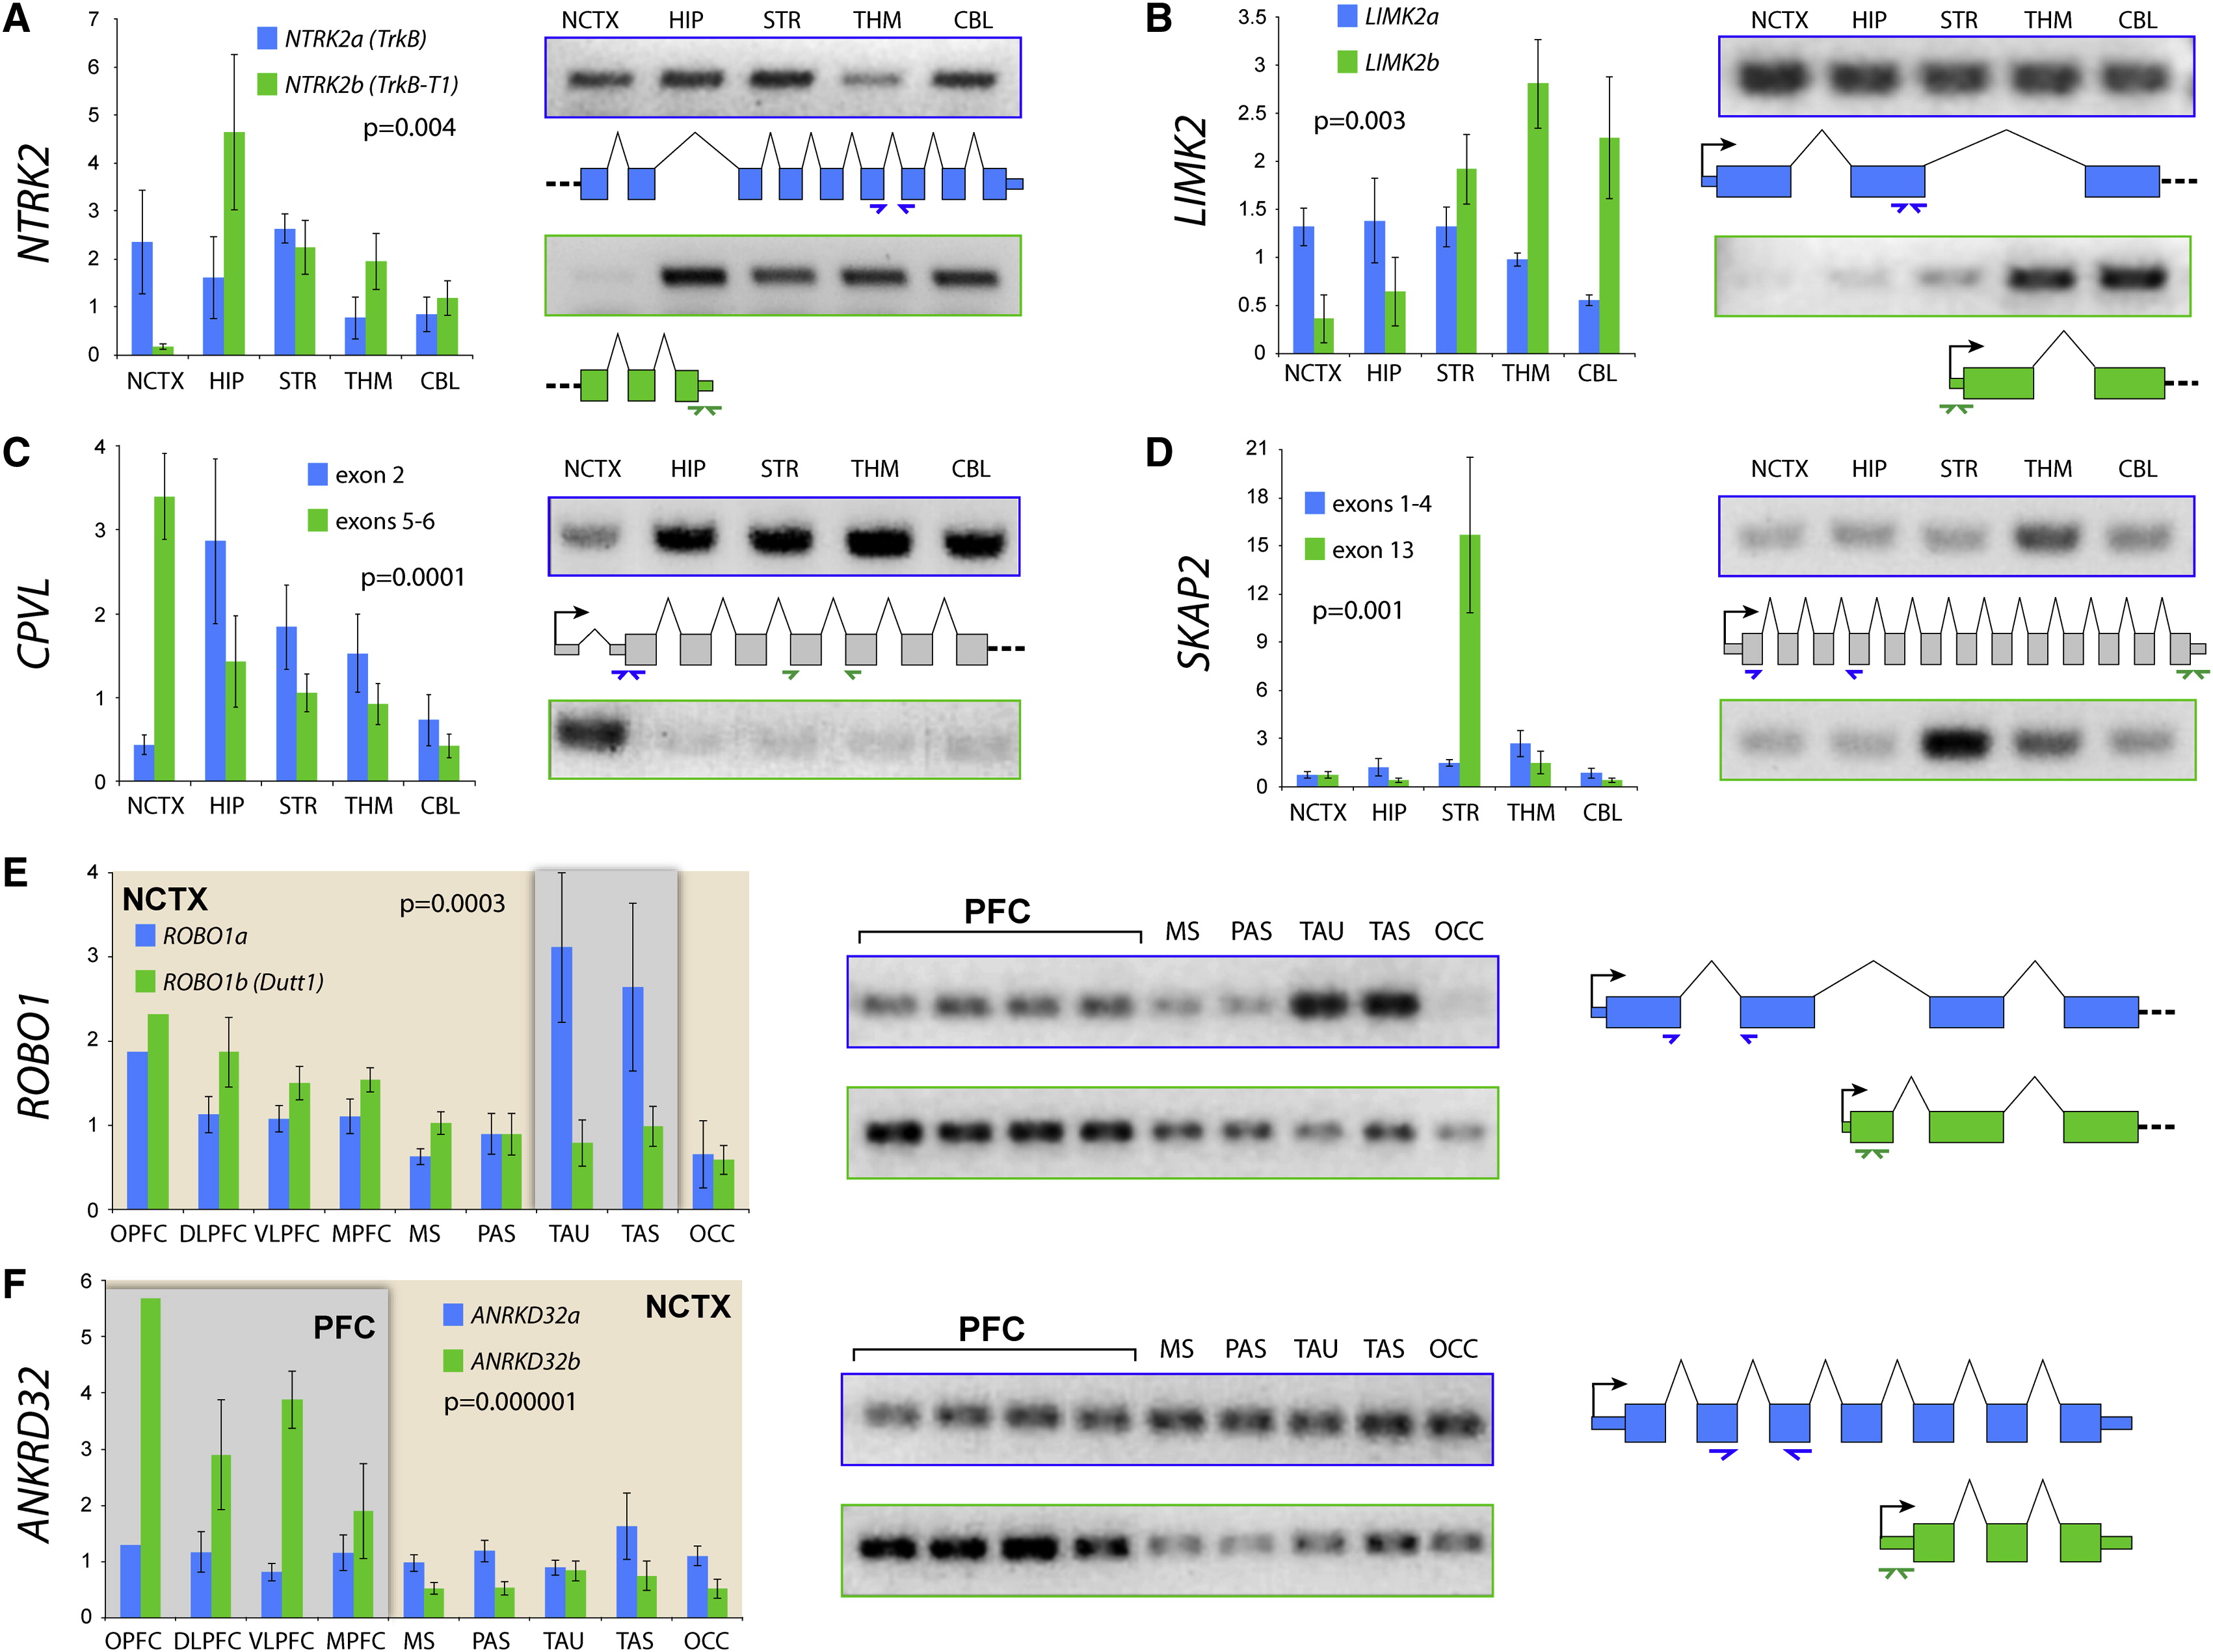
Differential gene expression in PFC vs. other
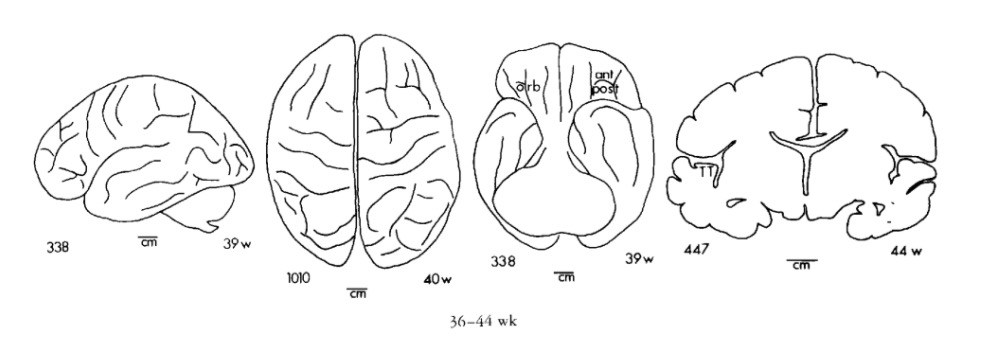
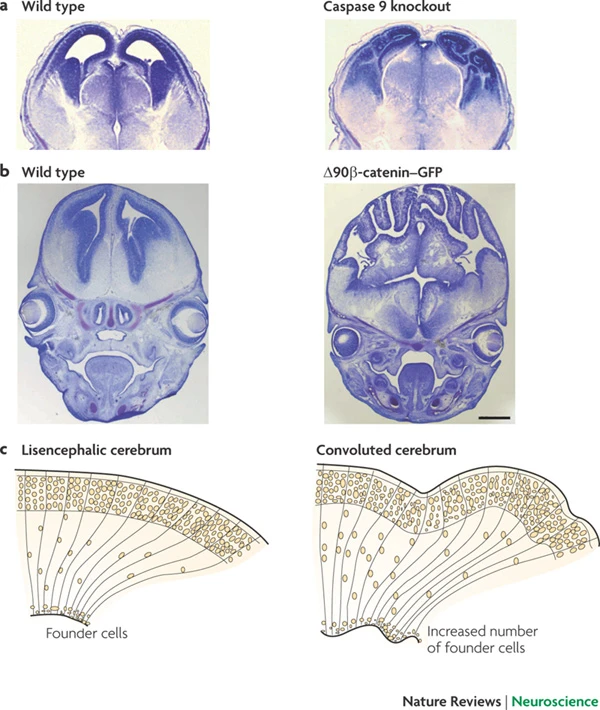
Gyral development
Infancy & Early Childhood
Synaptogenesis
- Begins prenatally (~ 18 pcw)
- Peak density ~ 15 mos postnatal
- Spine density in DLPFC ~ 7 yrs postnatal
- 700K synapses/s on average
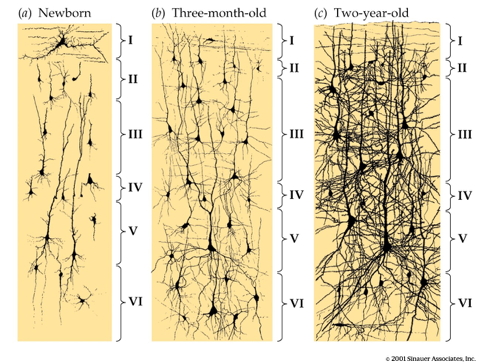
Proliferation, pruning
- Early proliferation
- Later pruning
- Rates, peaks differ by area
Apoptosis
- Programmed cell death
- 20-80%, varies by area
- Spinal cord >> cortex
- Quantity of nerve growth factors (NGF) influences
Synaptic rearrangement
- Progressive phase: growth rate >> loss rate
- Regressive phase: growth rate << loss rate
Myelination

- Neonatal brain largely unmyelinated
- Gradual myelination, peaks in mid-20s
- Non-uniform pattern
- Spinal cord before brain
- Sensory before motor
Structural/morphometric development

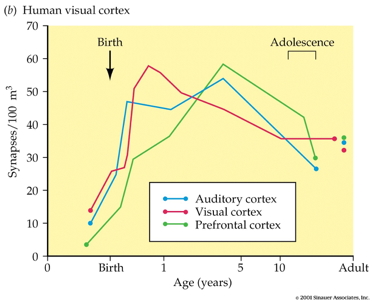
Synaptogenesis
Myelination across human development

Networks in the brain
- Some networks more susceptible to lesioning/injury.
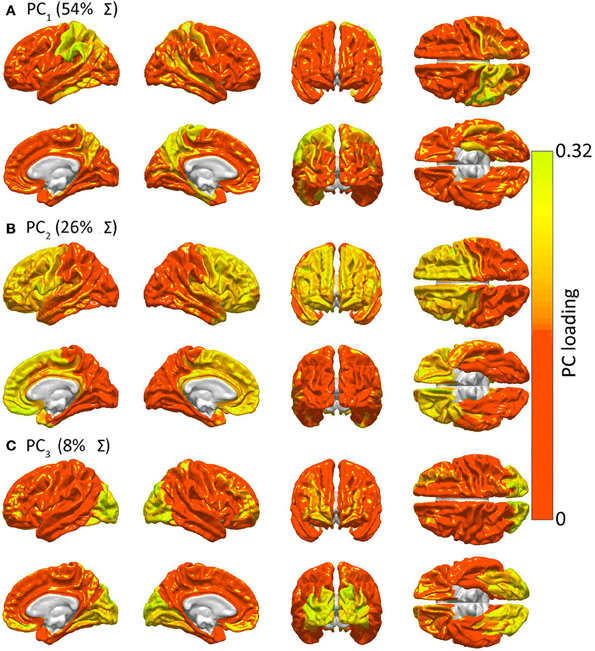
SIMILARITIES IN GM LESION EFFECTS UPON NETWORK TOPOLOGY AS REVEALED BY PCA. Shown are lateral, medial, dorsal, ventral, anterior and posterior views of each hemisphere for the first three PCs—i.e. PC1 in (A), PC2 in (B) and PC3 in (C)—mapped on the cortex, demonstrating the anatomical similarity pattern associated with the extent to which the removal of different regions affects the network in a similar way. For each PC, color varies from the minimum to the maximum value of the PC factor loadings. PC1 (54% of the variance Σ in the data) exhibits greater hemispheric asymmetry than the following two PCs and covers the entire left parietal lobe and, to a smaller extent, the left temporal lobe. PC2 (26% of Σ) is—by comparison to PC1—highly symmetric, and includes the entire frontal lobe of both hemispheres, whereas PC3 (8% of Σ) is again symmetric and includes the occipital lobes of both hemispheres.
Irimia & Van Horn (2014)
- And develop (across) age with differing profiles:
Our results revealed three distinguishable profiles, whose expression strengthened with increasing age and which characterized developmental differences in connectivity within the ten systems, between networks thought to underlie cognitive control and non-control systems, and among the non-control networks.
Petrican, Taylor, & Grady (2017)

“Control” networks

non-“control” networks

The “development” of developmental connectomics
Myelination changes “network” properties

Synaptic rearrangment, myelination change cortical thickness
- Cortical thickness changes Gogtay et al. (2004)


Video depictions
Right hemisphere
Superior
Inferior
Changes in brain energetics (glucose utilization)

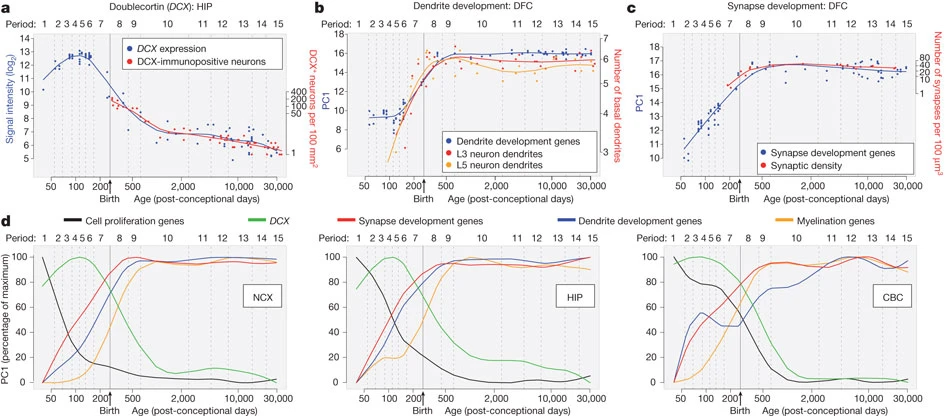
Gene expression across development
Summary of developmental milestones
Prenatal
- Neuro- and gliogenesis
- Migration
- Synaptogenesis begins
- Differentiation
- Apoptosis
- Myelination begins
- Infant gene expression ≠ Adult
Postnatal
- Synaptogenesis
- Cortical expansion, activity-dependent change
- Then cubic, quadratic, or linear declines in cortical thickness
- Myelination
- Connectivity changes (esp within networks)
- Prolonged period of postnatal/pre-reproductive development Konner (2011)
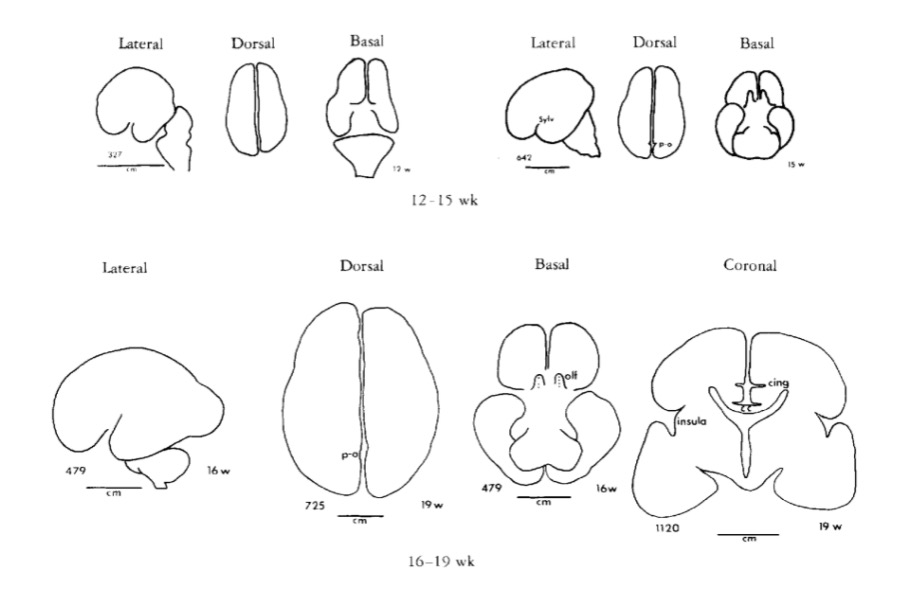
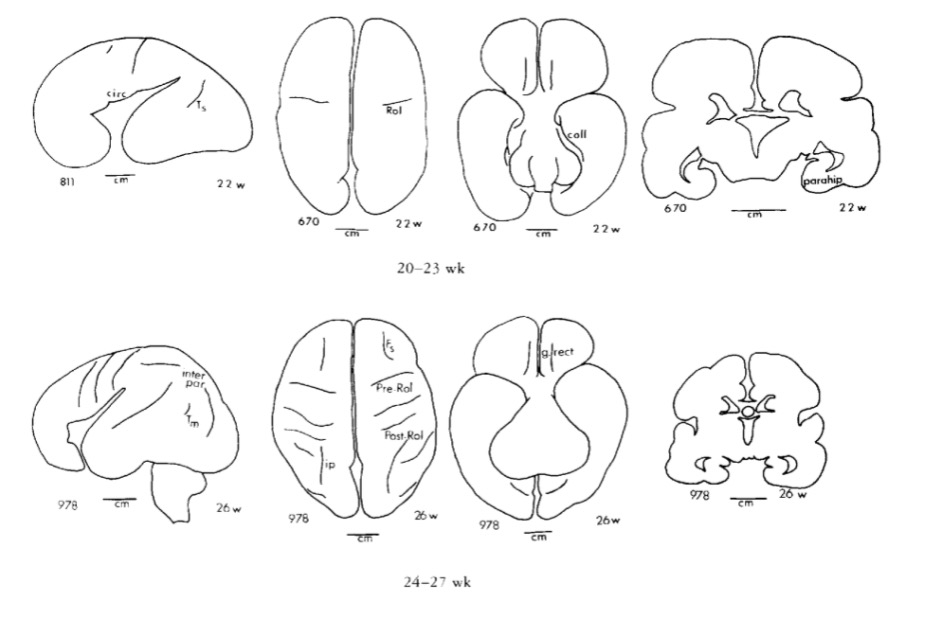
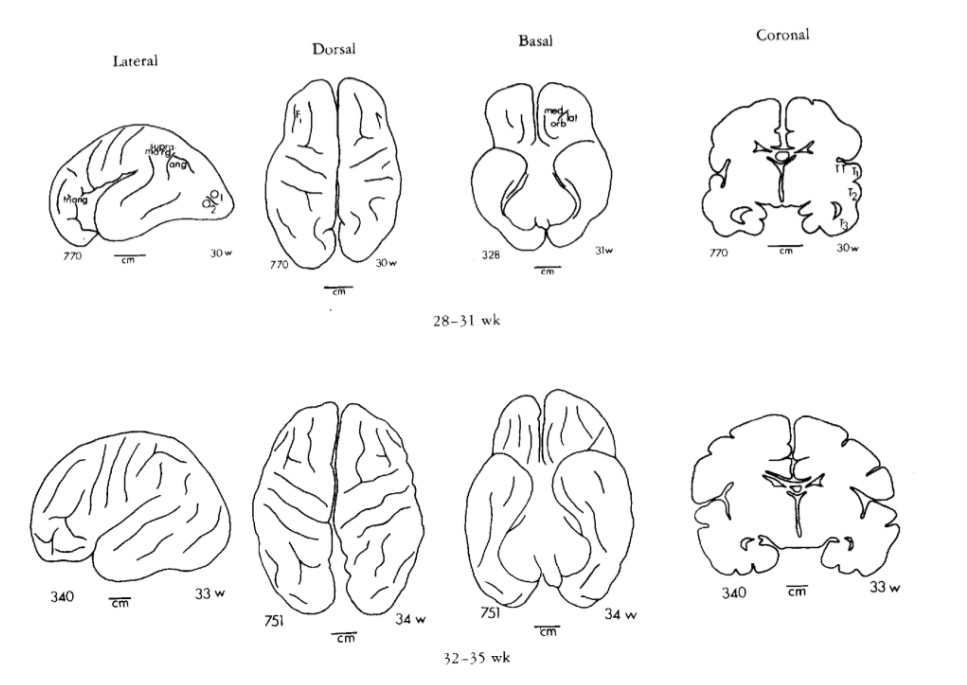
How brain development clarifies anatomical structure
3-4 weeks
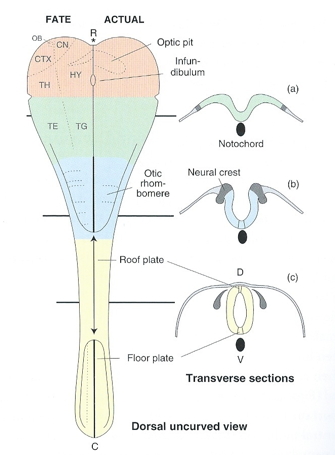
4 weeks

~4 weeks
6 weeks

Beyond 6+ weeks
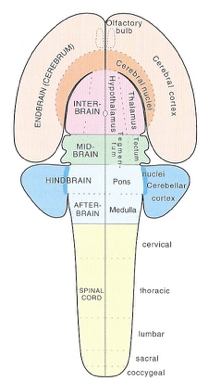
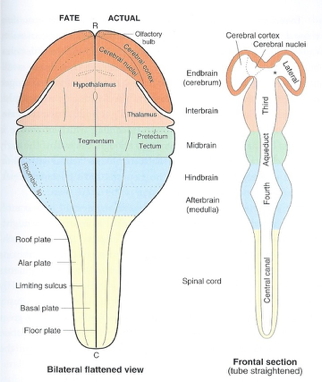
Organization of the brain
| Major division | Ventricular Landmark | Embryonic Division | Structure |
|---|---|---|---|
| Forebrain | Lateral | Telencephalon | Cerebral cortex |
| Basal ganglia | |||
| Hippocampus, amygdala | |||
| Third | Diencephalon | Thalamus | |
| Hypothalamus | |||
| Midbrain | Cerebral Aqueduct | Mesencephalon | Tectum, tegmentum |
| Hindbrain | 4th | Metencephalon | Cerebellum, pons |
| – | Mylencephalon | Medulla oblongata |
From structural development to functional development
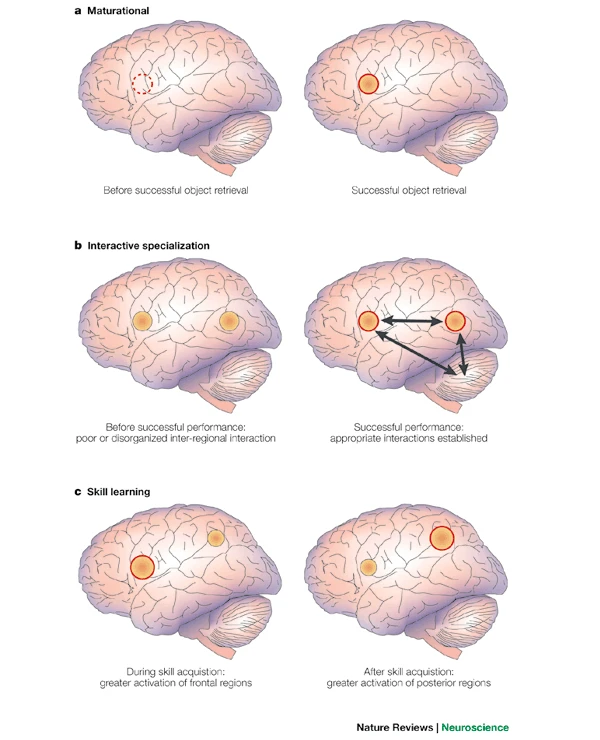
Different hardware = different computations?
Researchers routinely use motor behaviors (e.g., eye, face, and limb movements) to index cognition in the human neonate.
When developmental researchers use infant movements to index cognition, they often assume that the cortex is involved in producing the behavior.
However, cortical control of movement is absent at birth, emerging gradually over the first several postnatal months and beyond; before cortical outflow emerges, brainstem networks produce complex motor behavior.
Thus, cortical control of the motor behaviors used to infer cognition in neonates is not neurobiologically plausible.
Researchers should be cautious when making claims about developmental continuity between newborn and adult cognition (i.e., ‘core knowledge’) and its supporting neural architecture.


Sensory origins of primary motor cortex (M1). (A) Boundaries of primary cortical areas in rats: primary somatosensory cortex (S1, red) and M1 (blue), and primary auditory (A1) and visual (V1) cortex. (B) Enlargements of red and blue regions in (A) show the somatotopic organization of S1 and M1. Adapted, with permission, from [92]. (C) Peri-event histogram showing sensory responsiveness of an individual neuron in the forelimb region of M1 at P20. The neuron’s firing rate is shown in relation to movement onset (vertical broken line) for twitches (red) and wake movements (black). This neuron is representative of all M1 neurons recorded at this age. Neurons fire above baseline (0 on the y-axis) after – not before – movement onset during both sleep and wake, indicative of sensory responding. Adapted, with permission, from [9].

Protracted development of motor maps in M1. (A) Representative motor maps in rat pups at postnatal day (P) 25 and P30 and in adult rats at P60. Each map was produced using intracortical microstimulation in the forelimb region of M1 in anesthetized animals. The legends indicate the simple (i.e., single joint) and complex (i.e., multijoint) movements evoked at each stimulation site. Rectangles around the maps demarcate identical cortical surface areas. Adapted, with permission, from [17]. (B) Representative motor maps in kittens at P63 and P86 and in adult cats. Each map was produced using intracortical microstimulation in the forelimb region of M1 in anesthetized animals. The legend indicates the single-joint forelimb movements (shoulder, elbow, wrist) and multijoint movements evoked at each stimulation site. Movements of the digits occurred with movements of other joints. Colors denote the threshold electric current for movement production as indicated by the color bar at right. The black lines show the location of the cruciate sulcus. Adapted, with permission, from [24]. Both figure parts are used with permission of the American Physiological Society; permission conveyed through Copyright Clearance, Inc.