Evolution & development of the brain

PSY 511.001 Spr 2026

Rick Gilmore

Department of Psychology

Overview

Prelude

Figure 1: acapellascience (2017)
Figure 2: twoodburn (2008)

Announcements

Today’s topics

  • Public acceptance of evolution
  • Evolution of nervous systems
  • Development of the human brain

Warm-up

You observe high amplitude, low frequency (delta) wave activity in a sleeping person’s EEG. What state are they most likely in?

  • A. REM
  • B. NREM (N3)
  • C. Pre-REM
  • D. Awake but meditating

You observe high amplitude, low frequency (delta) wave activity in a sleeping person’s EEG. What state are they most likely in?

  • A. REM
  • B. NREM (N3)
  • C. Pre-REM
  • D. Awake but meditating

Sleep atonia is most likely to be experienced in what sleep stage?

  • A. REM
  • B. NREM (N3)
  • C. Pre-REM
  • D. Awake but meditating

Sleep atonia is most likely to be experienced in what sleep stage?

  • A. REM
  • B. NREM (N3)
  • C. Pre-REM
  • D. Awake but meditating

Public acceptance of evolution

Miller, Scott, & Okamoto (2006). Public acceptance of evolution in 34 countries, 2005.

Miller et al. (2006). Public acceptance of evolution in 34 countries, 2005.

More recent data

  • In U.S., majority now “accept”
  • Increase over last decade
  • Miller et al. (2021)

Miller et al. (2021) Figure 1

Miller et al. (2021) Figure 11

Types of evidence

  • Fossil
    • Fossil dating
  • Geological
    • Where fossils are found relative to one another
    • Laminar patterns; How long it takes to form layers

Types of evidence

  • Genetic
    • Rates of mutation
  • Anatomical
    • Homologous structures across existing species

Explanatory power

Wikipedia contributors (2026)

Wikipedia contributors (2026)2

Seen in the light of evolution, biology is, perhaps, intellectually the most satisfying and inspiring science. Without that light, it becomes a pile of sundry facts some of them interesting or curious, but making no meaningful picture as a whole.

Dobzhansky (1973)

Why Gilmore thinks the theory so controversial (in the U.S.)

  • Contradicts verbatim/non-metaphorical reading of some religious texts
  • Makes humans seem less special
  • Time scales involved beyond human experience
  • Scientific method vs. other ways of knowing
  • Found in nature ≠ good for human society

Why Gilmore thinks the theory so controversial (in the U.S.)

  • Few negative consequences of ‘disbelief’
  • U.S. culture individualistic, skeptical, anti-elitist, anti-intellectual
  • Lower levels of religious belief among U.S. scientists
  • Politics
  • A minority of citizens support teaching evolution-only
  • Majority of classroom teachers aren’t strong advocates

A structural equation model indicates that increasing enrollment in baccalaureate-level programs, exposure to college-level science courses, a declining level of religious fundamentalism, and a rising level of civic scientific literacy are responsible for the increased level of public acceptance.

Miller et al. (2021)

Evolution and development

Where do we come from?

Figure 3: Rick Gilmore’s family tree

Ontogenesis and phylogenesis

  • Ontogenesis
    • Development within lifetimes, history of individuals
  • Phylogenesis
    • Change across lifetimes, history of species

Does ontogeny recapitulate phyologeny?

  • Haeckel (2001)
  • Is evolution cumulative?
Figure 4: Haeckel (2001)3

Complex multicellular life emerged “recently”

Figure 5

Figure 6: https://www.britannica.com/science/evolution-scientific-theory

Biological computation

  • Ingestion
  • Defense
  • Reproduction
Figure 7: Adapted from Swanson (2012)

Information processing universals

  • Sense/detect via sensors
    • Specialize by information source/type
    • Specialize by target location
      • Interoceptive
      • Exteroceptive

Information processing universals

  • Analyze, evaluate, decide
    • Current state
      • World
      • Organism
    • Current goals
    • Past state(s)

Information processing universals

  • Act
    • Move body
      • Approach/avoid
      • Manipulate
      • Ingest
      • Signal
    • Change physiological state

Nervous system architectures

  • Single cells communicate via chemical diffusion
  • Neurons and nervous systems 520-570 M years old
  • Multi-cellular organisms with cells specialized for point-to-point communication

https://www.britannica.com/science/evolution-scientific-theory

https://www.britannica.com/science/evolution-scientific-theory

Nervous system architectures

  • Body symmetry
    • radial
    • bilateral
  • Body \(\leftrightarrow\) nervous system symmetry
Figure 8: Arendt, Tosches, & Marlow (2016) Figure 14

Example: Hydra

  • Radially symmetric bodies often non-centralized nervous systems
    • Neural net
  • Bilaterality
Figure 9: Park (2009)

Nervous system architectures

  • Segmentation
  • Cephalization (concentration of sensory & neural structures in anterior portion of body)
  • Encasement in bone (vertebrates)

  • Diverse nervous systems show developmental similarities at molecular level
Figure 10: Arendt et al. (2016) Figure 25

Vertebrate CNS organization

Figure 1 from Northcutt (2002)

Figure 1 from Northcutt (2002)

Brain/Body Sizes

Figure 2 from Northcutt (2002)

Figure 2 from Northcutt (2002)

Cerebral cortex a target of selection

Figure 11: Hofman (2014) Figure 16
Structural measure Non-human comparison Human
Cortical gray matter %/tot brain vol insectivores 25% 50%
Cortical gray + white mice 40% 80%
Cerebellar mass primates, mammals 10-15% 10-15%
  • Evidence for greater gray and white matter (relative to total brain volume) in human cerebral cortex

Old story

  • (log) brain mass scales with (log) body mass
  • Brain masses (more or less) scale with animal class
Figure 14: Figure 2 from Northcutt (2002)

Old story

  • Within mammals, human brains bigger than expected
    • Higher encephalization quotient – deviation from species-typical norm
  • Humans have larger cerebral cortical gray + white matter than comparable mammals

Figure 2 from Northcutt (2002)

Figure 2 from Northcutt (2002)

New story

  • Does brain size/mass matter (that much)?
  • “Size matters” (brain mass) presumes similarity among brains at micro-level
  • Big (large mass) brains arise in multiple mammalian lineages
  • Body sizes tend to increase over evolutionary time

Venditti, Baker, & Barton (2024)

Despite decades of comparative studies, puzzling aspects of the relationship between mammalian brain and body mass continue to defy satisfactory explanation. Here we show that several such aspects arise from routinely fitting log-linear models to the data: the correlated evolution of brain and body mass is in fact log-curvilinear [emphasis added].

Venditti et al. (2024)

…we document dramatically varying rates of relative brain mass evolution across the mammalian phylogeny, and we resolve the question of whether there is an overall trend for brain mass to increase through time.

Venditti et al. (2024)

Figure 15: Venditti et al. (2024) Figure 1

Venditti et al. (2024)

We find a trend in only three mammalian orders, which is by far the strongest in primates, setting the stage for the uniquely rapid directional increase ultimately producing the computational powers of the human brain.

  • # of cortical neurons possibly more important difference than brain mass
  • The primate advantage
    • more cortical neurons
      • but not larger neurons
      • not more neurons in cerebellum
  • Human brain scaled up (non-ape) primate brain
Figure 16: Herculano-Houzel (2016)

Figure 17: Herculano-Houzel (2012) Figure 17

Figure 18: Herculano-Houzel (2012) Figure 38

  • Primate body sizes grew relatively less than brain sizes
Figure 19: Venditti et al. (2024) Figure 4

Does neuron # predict cognition?

Figure 20: Herculano-Houzel (2017) Figure 3

Selection pressures

  • Brain
    • More neurons in cerebral cortex than other mammals
  • Behavior
    • Predator/prey interactions (Wooster et al., 2026)
    • Less time spent foraging
    • Higher quality/more energetically dense food
    • Higher food availability
    • Less metabolic energy devoted to digestion

Selection pressures

A further human advantage

  • Human childhood lengthy, costly
  • Childhood adaptive

Konner (2011)

Konner (2011)

What cortical areas were selected?

Although intense research effort is seeking to address which brain areas fire and connect to each other to produce complex behaviors in a few living primates, little is known about their evolution, and which brain areas or facets of cognition were favored by natural selection.

Melchionna et al. (2025)

Figure 21: Melchionna et al. (2025) Figure 19

Figure 22: Melchionna et al. (2025) Figure 210

Figure 23: Melchionna et al. (2025) Figure 3

By developing statistical tools to study the evolution of the brain cortex at the fine scale, we found that rapid cortical expansion in the prefrontal region took place early on during the evolution of primates. In anthropoids, fast-expanding cortical areas extended to the posterior parietal cortex. In Homo, further expansion affected the medial temporal lobe and the posteroinferior region of the parietal lobe.

Melchionna et al. (2025)

Development of the human brain

Timeline

  • CNS among earliest-developing, last to finish organ systems
    • Prolonged developmental period…makes CNS vulnerable
    • CNS especially open to external influences

By the numbers

  • ~ 86 billion neurons in adult CNS
    • similar # of glia
    • about 16 (14-32) billion neurons in cerebral cortex, 80/20% Glu/GABA
  • 7-80K synapses/cortical neuron

By the numbers

Summaries by phase

Prenatal period

  • ~38 weeks from conception/fertilization on average
  • Embryonic period (weeks 1-8), fetal period (weeks 9-)
  • Three 12-13 week trimesters

Earliest steps

  • Insemination
    • Can occur 3-4 days before or up to 1-2 days after…
      • Ovulation
  • Fertilization
    • Within ~ 24 hrs of ovulation
  • Implantation
    • ~ 6 days after fertilization

Early embryogenesis

Figure 25

Formation of neural tube12

Figure 26

Neural tube closure

  • Neural tube closes in middle, moves toward rostral & caudal ends, closing by 29 - 30 pcd.
  • Failures of neural tube closure
    • Anencephaly (rostral neuraxis)
    • Spina bifida (caudal neuraxis)

Neural tube becomes

  • Ventricles & cerebral aqueduct
  • Central canal of spinal cord
  • Rostro-caudal patterning via differential growth into vesicles
    • Forebrain (prosencephalon)
    • Midbrain (mesencephalone)
    • Hindbrain (rhomencephalon)

Figure 29: Embryonic human brain from Wikipedia
Figure 30: Cross section of embryonic brain from Wikipedia

Neurogenesis and gliogenesis

  • Neuroepithelium cell layer lines neural tube creating ventricular zone (VZ) and subventricular zone (SVZ)
    • Peri-ventricular regions home to pluripotent stem and progenitor cells that produce new neurons & glia
  • Neurogenesis (of excitatory Glu neurons) observed by 27 pcd (4 pcw; post-conceptual week)

By the numbers

  • 85 billion cells in ~24 wks
    • 60 sec/min * 60 min/hour * 24 hrs/day * 7 days/wk * 24 = 604,800
    • ~140,500/sec

Neurogenesis and gliogenesis

  • Most cortical and striatal neurons generated prenatally, but
    • Cerebellum continues to ~ 18 mos

Old brains, new neurons?

  • Some areas in adult human brain generate new neurons
    • hippocampus
    • striatum
    • olfactory bulb (minimally)
    • weak evidence for substantial neurogenesis in adult cerebral cortex

…We identified a distinct profile of neurogenesis in SuperAgers that may reflect a ‘resilience signature’…our study points to a multiomic molecular signature of the hippocampus that distinguishes cognitive resilience and deterioration with ageing.

Figure 33: Disouky et al. (2026)

Neural stem cells

  • Undergo symmetric & asymmetric cell division
  • Generate glia, neurons, and basal progenitor cells

Radial glia and cell migration

Figure 34
Figure 35

Radial unit hypothesis

Figure 36: Rakic (2009) Figure 2

Neural migration

Axon growth cone

  • Chemoattractants
    • e.g., Nerve Growth Factor (NGF)
  • Chemorepellents
  • Receptor molecules in growth cone detect chemical gradients

Glia migrate, too

Differentiation

  • Neuron
    • pyramidal cell vs. stellate vs. Purkinje vs. …
    • NTs released
  • vs. glial cell
    • myelin-producing vs. astrocyte vs. microglia
  • Where to connect

Differential gene expression

Figure 38: M. B. Johnson et al. (2009)

Gyral development

16-19 wk

Chi, Dooling, & Gilles (1977)

Chi et al. (1977)

24-27 wk

Chi et al. (1977)

Chi et al. (1977)

Gyral development

28-31 wk

Chi et al. (1977)

Chi et al. (1977)

36-44 wk

Chi et al. (1977)

Chi et al. (1977)

Infancy & Early Childhood

Synaptogenesis

  • Begins prenatally (~ 18 pcw)
  • Peak density ~ 15 mos postnatal
  • Spine density in DLPFC ~ 7 yrs postnatal
  • 700K synapses/s on average

Proliferation, pruning

  • Early proliferation (synapse formation)
  • Later pruning (synapse removal)
  • Rates, peaks differ by area

Apoptosis

  • Programmed cell death
  • 20-80%, varies by area
  • Spinal cord >> cortex
  • Quantity of nerve growth factors (NGF) influences

Mr Riddz Science (2015)

Figure 40: Rakic (2009) Figure 3

Synaptic rearrangement

Figure 41: Huttenlocher
  • Progressive phase: growth rate >> loss rate
  • Regressive phase: growth rate << loss rate

Myelination

  • Neonatal brain largely unmyelinated
  • Gradual myelination, peaks in mid-20s
  • Non-uniform pattern
    • Spinal cord before brain
    • Sensory before motor

Baumann & Pham-Dinh (2001) Figure 6

Baumann & Pham-Dinh (2001) Figure 618

Structural development

Figure 42: Knickmeyer et al. (2008)

Structural development

Synaptogenesis

Figure 43

Myelination

Figure 44: Hagmann et al. (2010) Figure 1

Networks in the brain

  • Some more susceptible to lesioning/injury.
Figure 45: Irimia & Van Horn (2014) Figure 419

Develop (across) age with differing profiles:

Our results revealed three distinguishable profiles, whose expression strengthened with increasing age and which characterized developmental differences in connectivity within the ten systems, between networks thought to underlie cognitive control and non-control systems, and among the non-control networks.

Petrican, Taylor, & Grady (2017)

Sensory/Attention Networks

Figure 46: Petrican et al. (2017) Figure 2a

“Control” networks

Figure 47: Petrican et al. (2017) Figure 2b

Non-“control” networks

Figure 48: Petrican et al. (2017) Figure 2c

Developmental connectomics

Figure 49: Cao, Huang, & He (2017)20

Myelination changes “network” properties

Figure 50: Hagmann et al. (2010) Figure 221

Cortical thickness changes

Figure 51: Shaw et al. (2008) Figure 1

Figure 52: Shaw et al. (2008) Figure 2
Figure 53: Shaw et al. (2008) Figure 3

Figure 54: Shaw et al. (2008) Figure 4

Changes in brain energetics (glucose utilization)

Figure 55: Kuzawa et al. (2014) Figure 1

Gene expression across development

Figure 56: Kang et al. (2011) Figure 522

Summary of prenatal milestones

  • Neuro- and gliogenesis
  • Migration
  • Synaptogenesis begins
  • Differentiation
  • Apoptosis
  • Myelination begins
  • Infant gene expression ≠ Adult

Summary of postnatal milestones

  • Synaptogenesis
  • Cortical expansion, activity-dependent change
  • Then cubic, quadratic, or linear declines in cortical thickness
  • Myelination
  • Connectivity changes (esp within networks)
  • Prolonged period of postnatal/pre-reproductive development (Konner, 2011)

How brain development clarifies anatomical structure

3-4 weeks

Figure 57: Swanson (2012)

4 weeks

Figure 58: https://upload.wikimedia.org/wikipedia/commons/4/4c/4_week_embryo_brain.jpg

~4 weeks

Figure 59: Swanson (2012)

6 weeks

Figure 60: https://upload.wikimedia.org/wikipedia/commons/thumb/3/33/6_week_human_embryo_nervous_system.svg/500px-6_week_human_embryo_nervous_system.svg.png
Figure 61: Swanson (2012)

Beyond 6 weeks

Figure 62: Swanson (2012)

Organization of the brain

Major division Ventricular Landmark Embryonic Division Structure
Forebrain Lateral Telencephalon Cerebral cortex
Basal ganglia
Hippocampus, amygdala
Third Diencephalon Thalamus
Hypothalamus

Organization of the brain

Major division Ventricular Landmark Embryonic Division Structure
Midbrain Cerebral Aqueduct Mesencephalon Tectum, tegmentum
Hindbrain 4th Metencephalon Cerebellum, pons
Mylencephalon Medulla oblongata

From structural development to functional development

Figure 63: M. H. Johnson (2001) Figure 323

Different hardware = different computations?

Researchers routinely use motor behaviors (e.g., eye, face, and limb movements) to index cognition in the human neonate.

When developmental researchers use infant movements to index cognition, they often assume that the cortex is involved in producing the behavior.

Blumberg & Adolph (2023a)

Blumberg & Adolph (2023a)

However, cortical control of movement is absent at birth, emerging gradually over the first several postnatal months and beyond; before cortical outflow emerges, brainstem networks produce complex motor behavior.

Thus, cortical control of the motor behaviors used to infer cognition in neonates is not neurobiologically plausible.

Blumberg & Adolph (2023a)

Researchers should be cautious when making claims about developmental continuity between newborn and adult cognition (i.e., ‘core knowledge’) and its supporting neural architecture.

Figure 64: Blumberg & Adolph (2023b) Figure 124

Figure 65: Blumberg & Adolph (2023b) Figure 225

Blumberg & Adolph (2023a)

Figure 66: Blumberg & Adolph (2023a) Figure 126

Blumberg & Adolph (2023a)

With regard to the developmental continuity of core knowledge, Pinker famously argued that ‘…the null hypothesis in developmental psychology is that the cognitive mechanisms of children and adults are identical; hence it is a hypothesis that should not be rejected until the data leave us no other choice’ [10]…

Blumberg & Adolph (2023a)

Regardless, given developmental discontinuities in the brain mechanisms upon which the expression of infant cognition relies, why assume developmental continuity between infant and adult minds? The available evidence leaves us no choice but to reject Pinker’s null hypothesis.

Wrap-up

Main points

  • How life emerged on Earth is not known
  • Life on Earth has 3.7-4.2 billion year history
  • Bilateral, segmented, centralized, vertebrate nervous systems emerged ~500 M years ago
  • Biologically modern humans emerged ~200,000 years ago (~4,000 generations)

Main points

  • Human brains have more cortical neurons than other primates
  • Selection pressures on cerebral cortex, especially frontal and parietal
  • Evolution shapes human brain development

Main points

  • Human nervous system development can be divided into prenatal, postnatal stages
  • Development has progressive and regressive processes (More not always better)
  • Most neurons in cerebral cortex are generated by the end of the second trimester

Main points

  • Synapse genesis, pruning, alteration dominate postnatal development
  • Myelination continues into the third decade
  • Human brain & behavioral development (childhood) prolonged

Next time

  • Cellular neuroscience I

Resources

About

This talk was produced using Quarto, using the RStudio Integrated Development Environment (IDE), version 2026.1.0.392.

The source files are in R and R Markdown, then rendered to HTML using the revealJS framework. The HTML slides are hosted in a GitHub repo and served by GitHub pages: https://psu-psychology.github.io/psy-511-scan-fdns-2026-spring/

References

acapellascience. (2017, September). Evo-Devo (despacito biology parody) | a capella science. Youtube. Retrieved from https://www.youtube.com/watch?v=ydqReeTV_vk
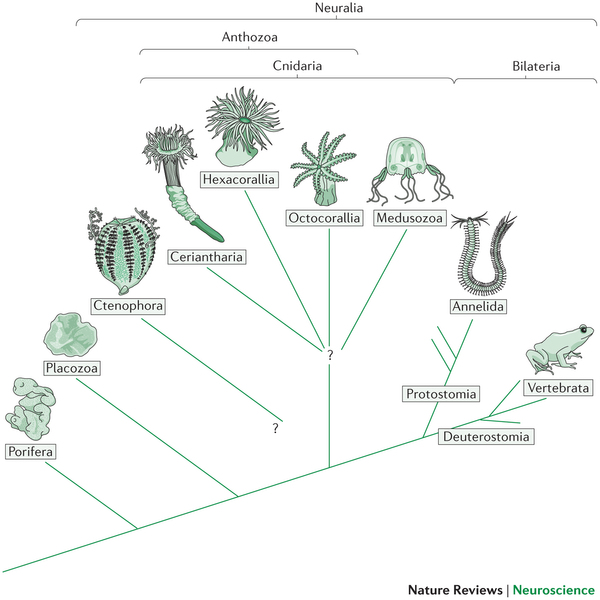
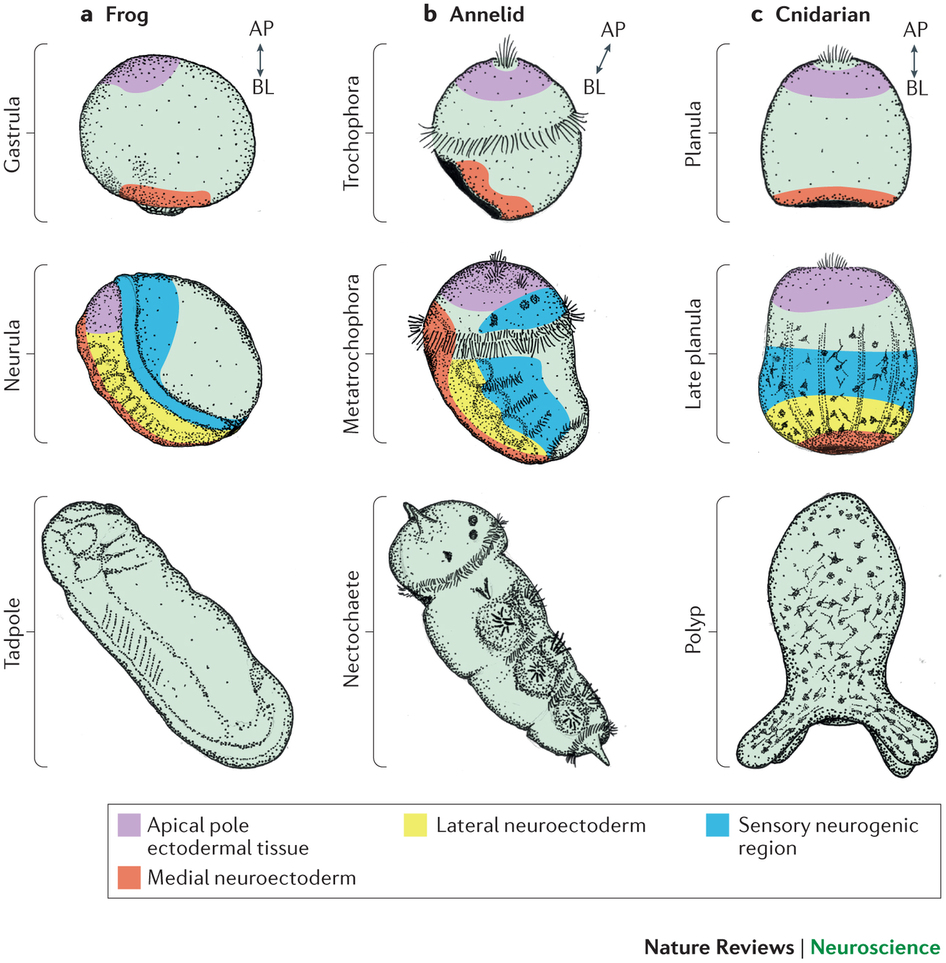
Arendt, D., Tosches, M. A., & Marlow, H. (2016). From nerve net to nerve ring, nerve cord and brain — evolution of the nervous system. Nature Reviews Neuroscience, 17(1), 61–72. https://doi.org/10.1038/nrn.2015.15
Baumann, N., & Pham-Dinh, D. (2001). Biology of oligodendrocyte and myelin in the mammalian central nervous system. Physiological Reviews, 81(2), 871–927. https://doi.org/10.1152/physrev.2001.81.2.871
Blumberg, M. S., & Adolph, K. E. (2023a). Infant action and cognition: What’s at stake? Trends in Cognitive Sciences, 27(8), 696–698. https://doi.org/10.1016/j.tics.2023.05.008
Blumberg, M. S., & Adolph, K. E. (2023b). Protracted development of motor cortex constrains rich interpretations of infant cognition. Trends in Cognitive Sciences, 27(3), 233–245. https://doi.org/10.1016/j.tics.2022.12.014
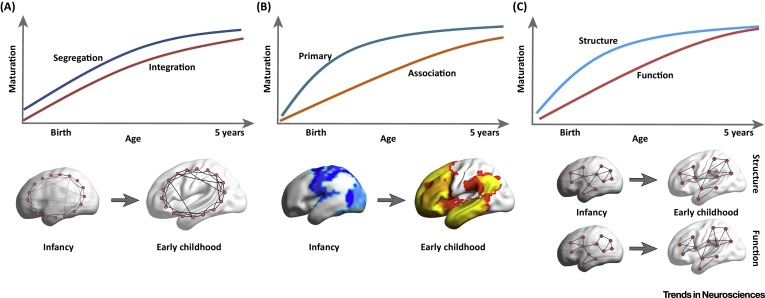
Cao, M., Huang, H., & He, Y. (2017). Developmental connectomics from infancy through early childhood. Trends in Neuroscience, 40(8), 494–506. https://doi.org/10.1016/j.tins.2017.06.003
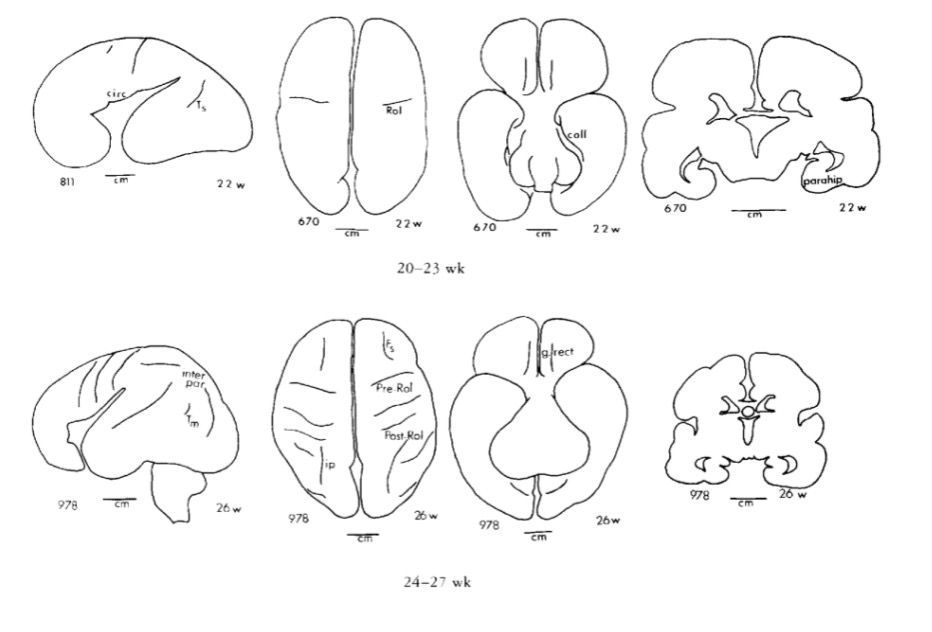
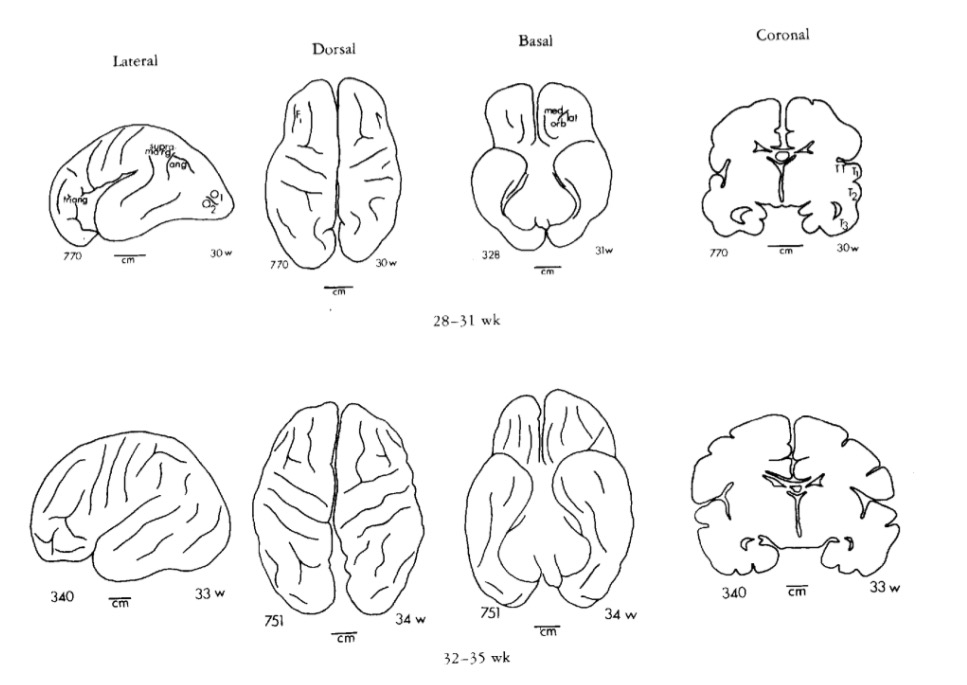
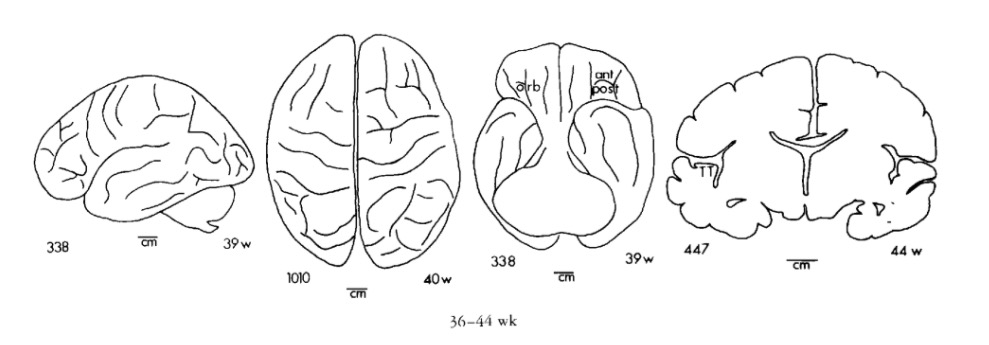
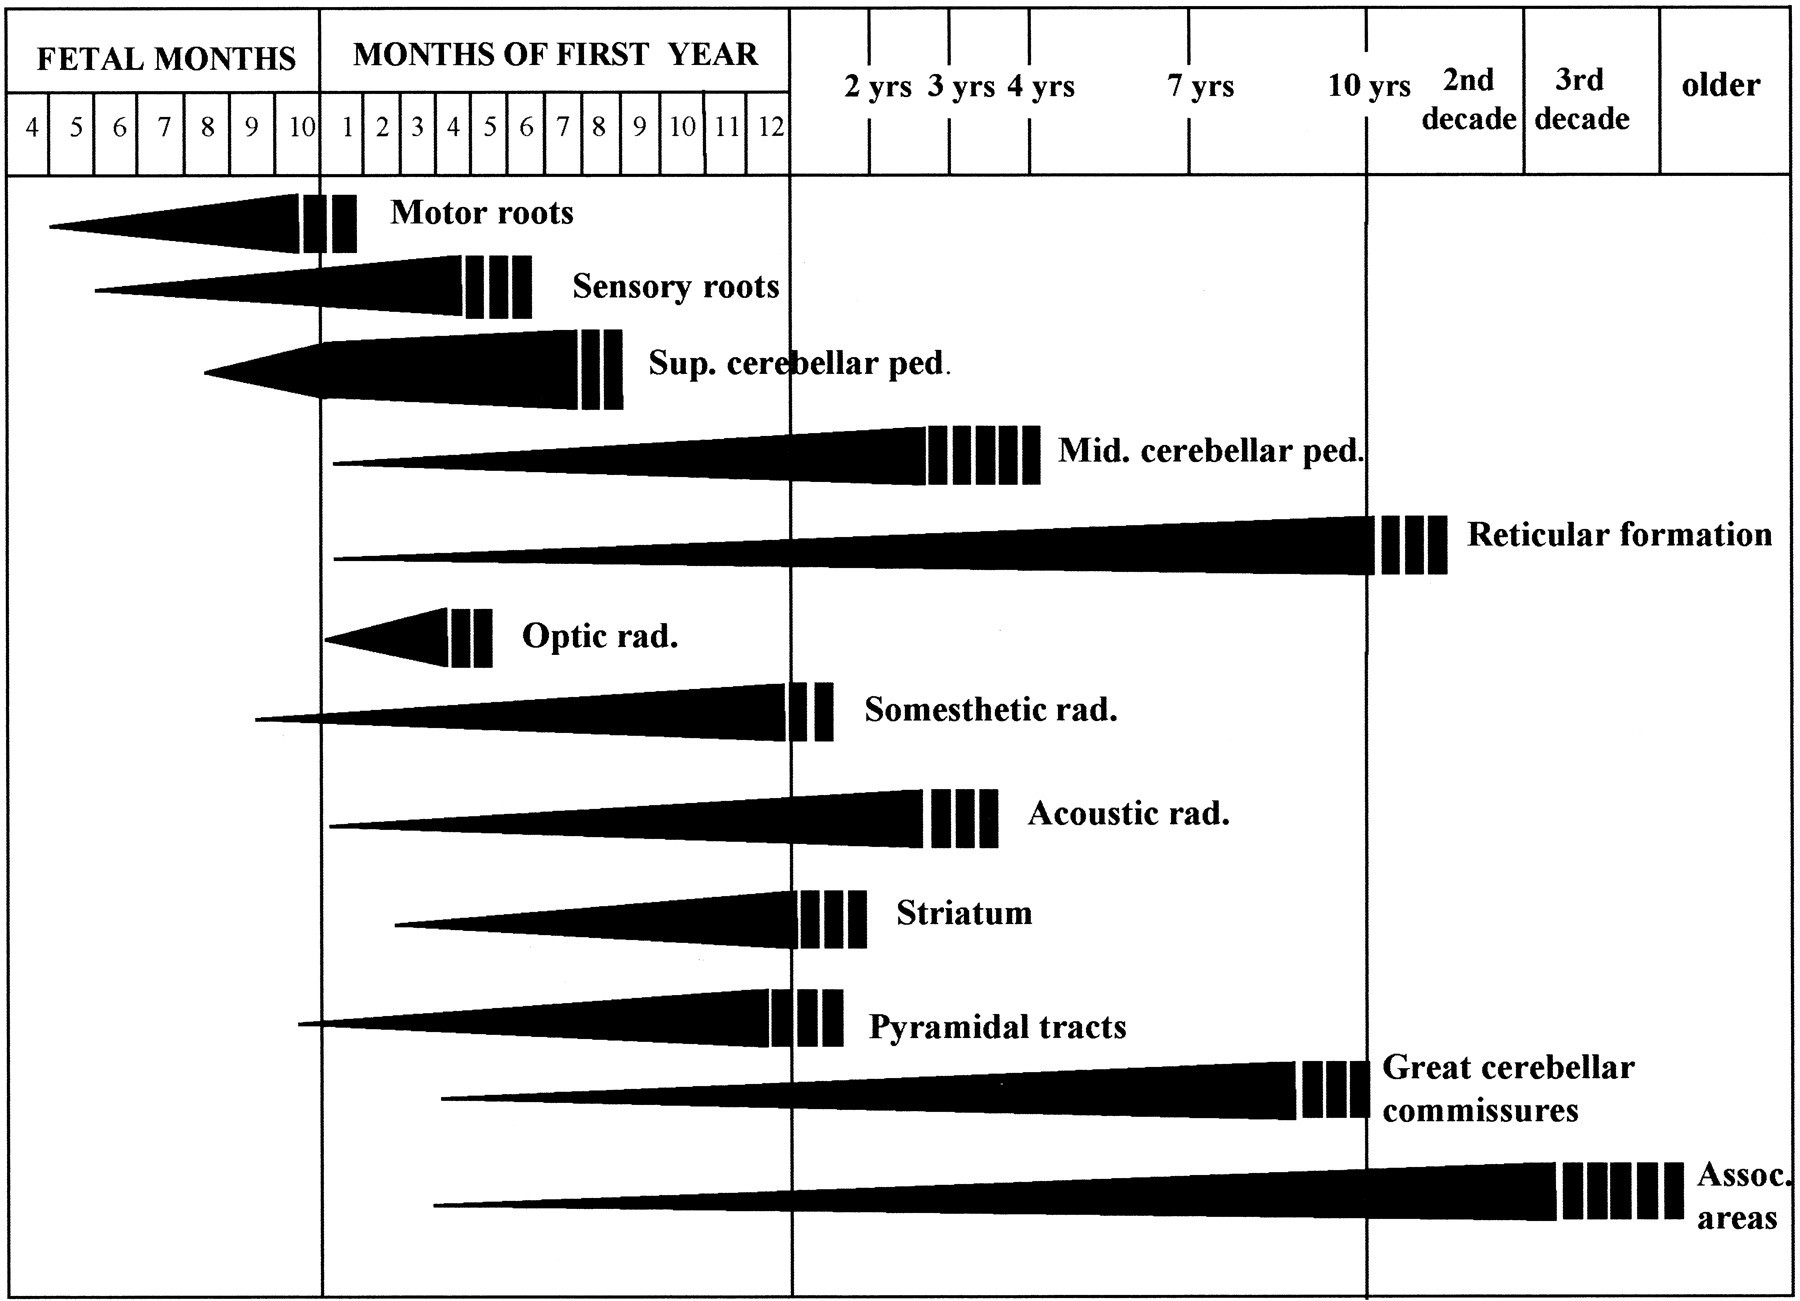
Chi, J. G., Dooling, E. C., & Gilles, F. H. (1977). Gyral development of the human brain. Ann. Neurol., 1(1), 86–93. https://doi.org/10.1002/ana.410010109
DeFelipe, J., Alonso-Nanclares, L., & Arellano, J. I. (2002). Microstructure of the neocortex: Comparative aspects. Journal of Neurocytology, 31(3-5), 299–316. https://doi.org/10.1023/a:1024130211265
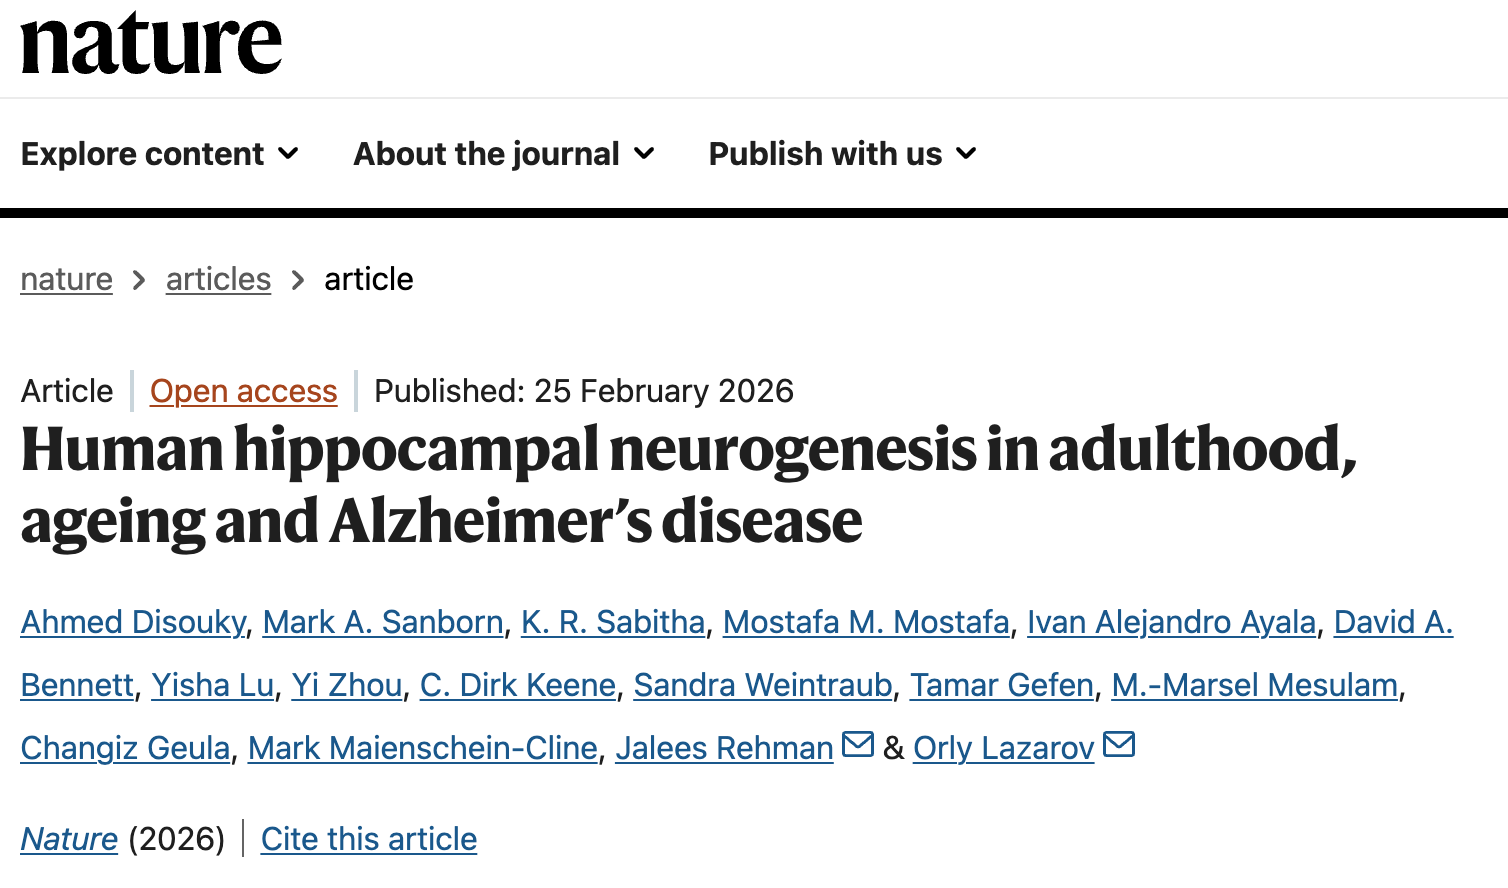
Disouky, A., Sanborn, M. A., Sabitha, K. R., Mostafa, M. M., Ayala, I. A., Bennett, D. A., … Lazarov, O. (2026). Human hippocampal neurogenesis in adulthood, ageing and alzheimer’s disease. Nature, 1–10. https://doi.org/10.1038/s41586-026-10169-4
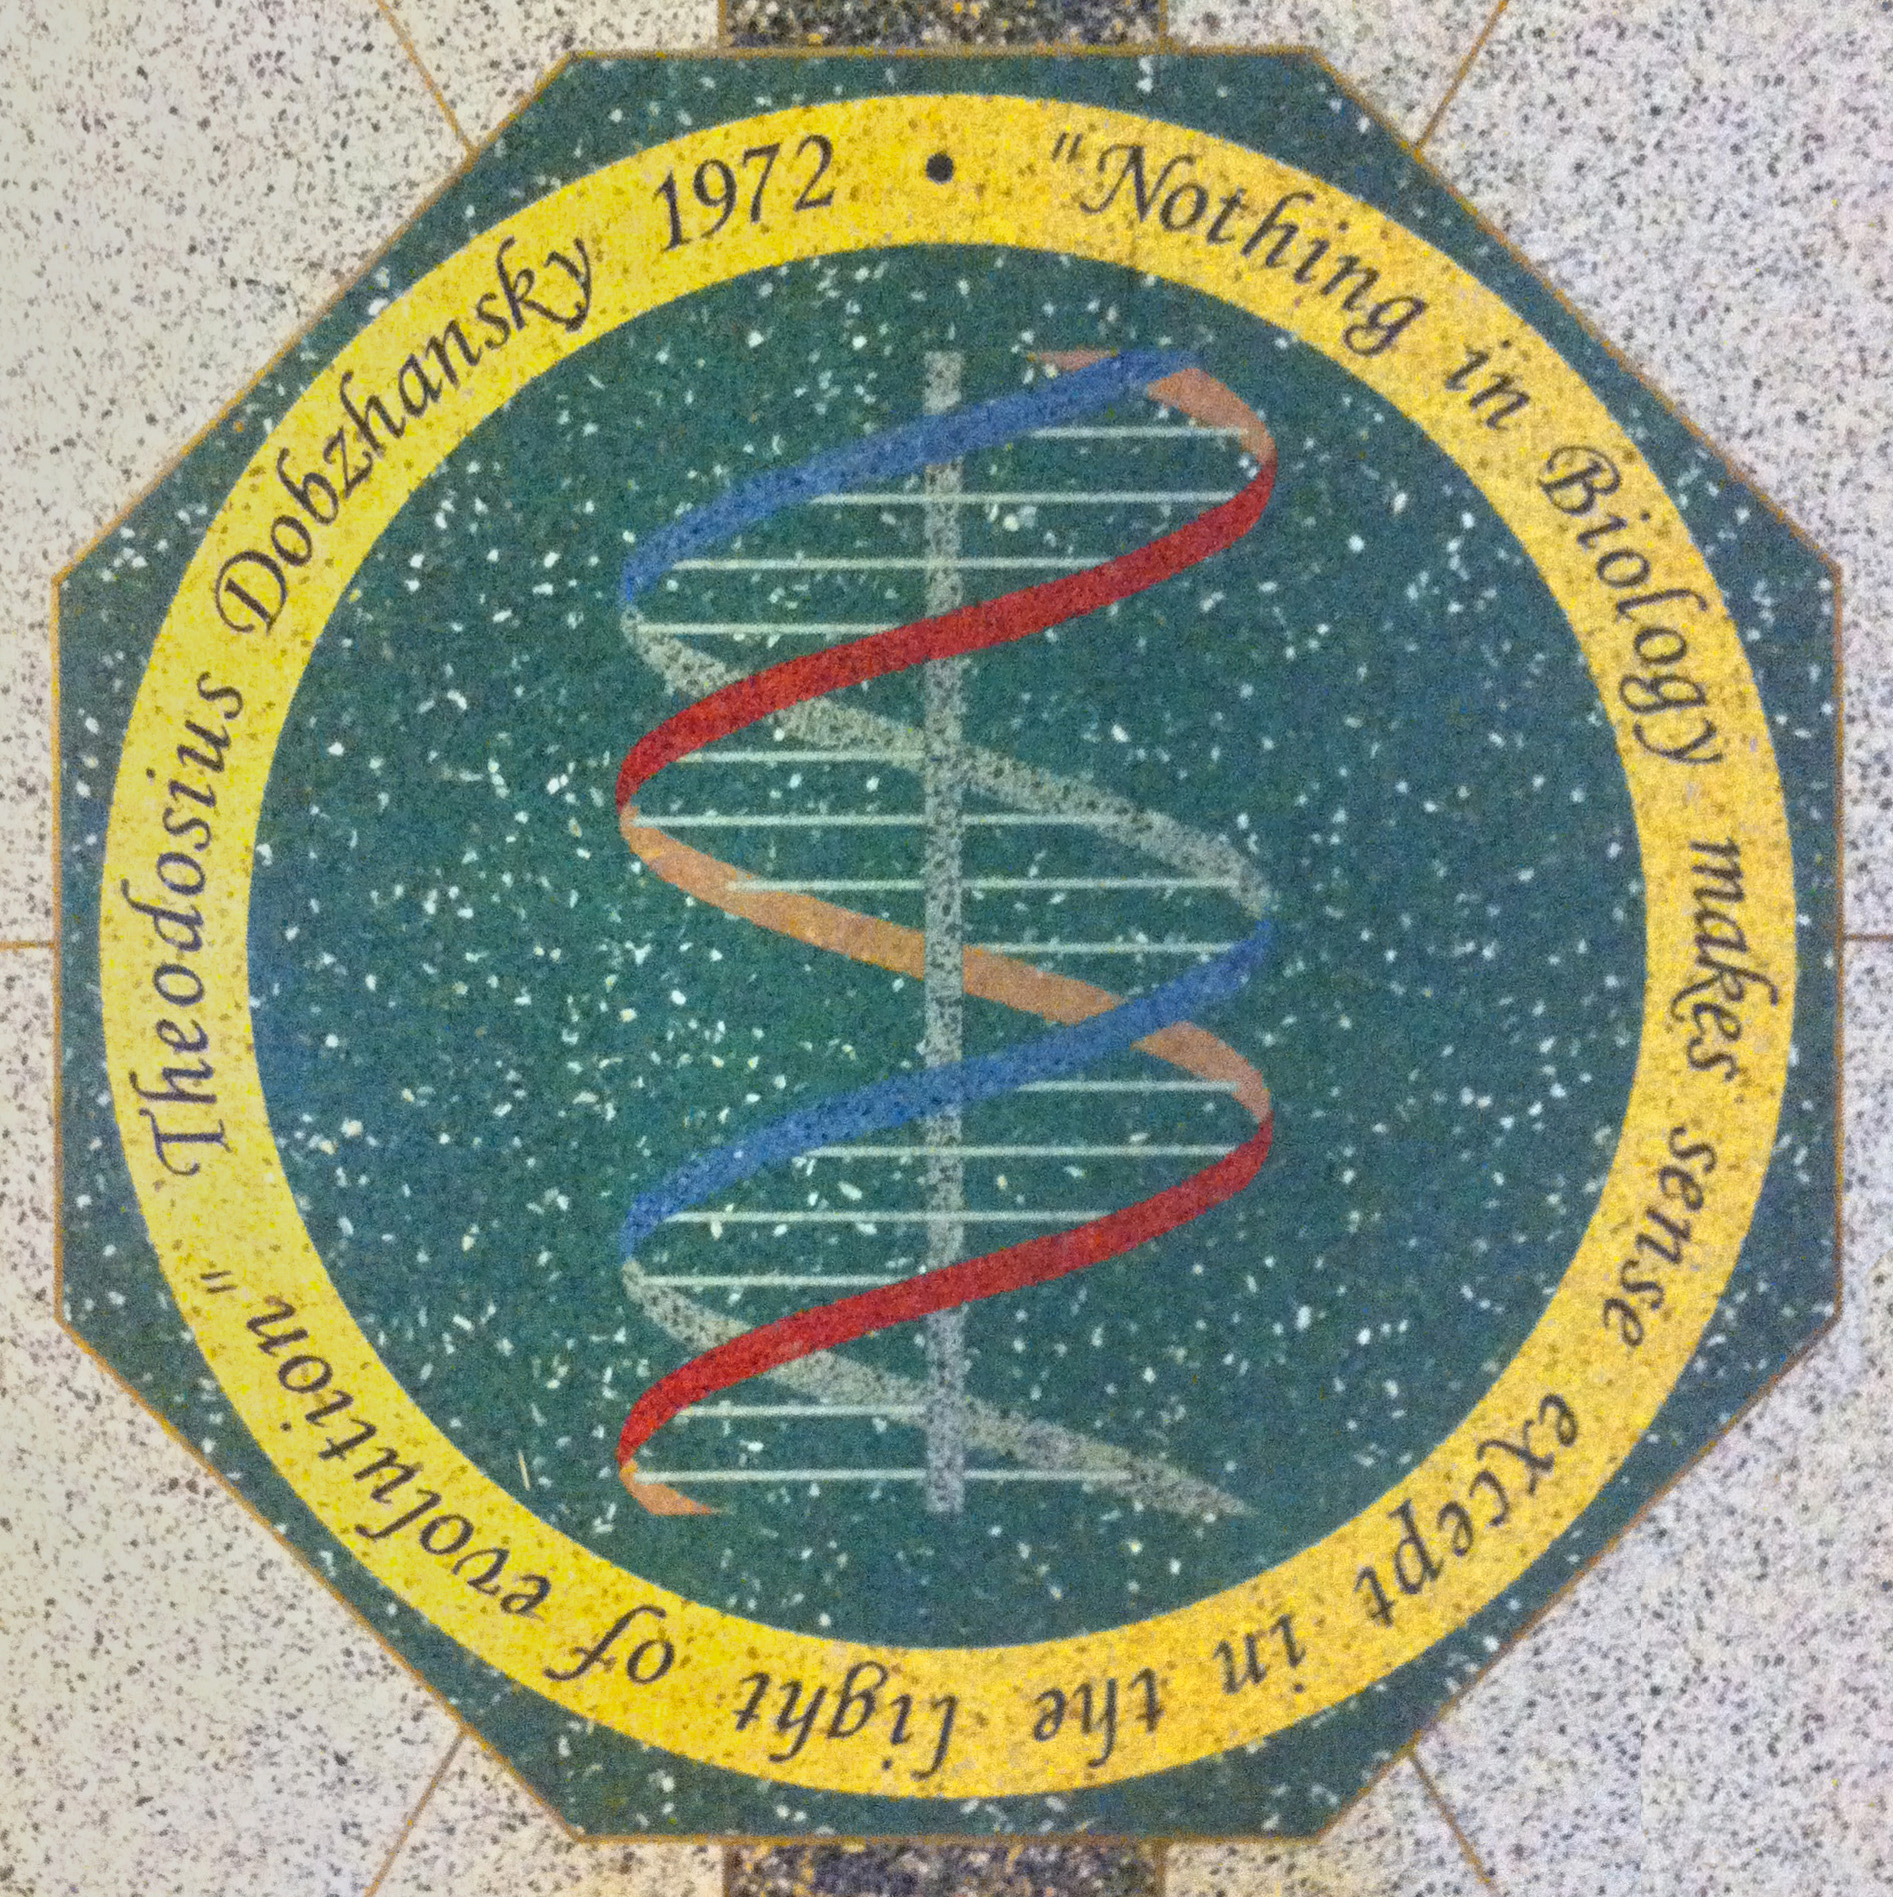
Dobzhansky, T. (1973). Nothing in biology makes sense except in the light of evolution. The American Biology Teacher, 35(3), pp. 125–129. Retrieved from http://www.jstor.org/stable/4444260
Dunbar, R. I. M. (1998). The social brain hypothesis. Evolutionary Anthropology, 6, 178–190. https://doi.org/10.1002/(sici)1520-6505(1998)6:5<178::aid-evan5>3.0.co;2-8
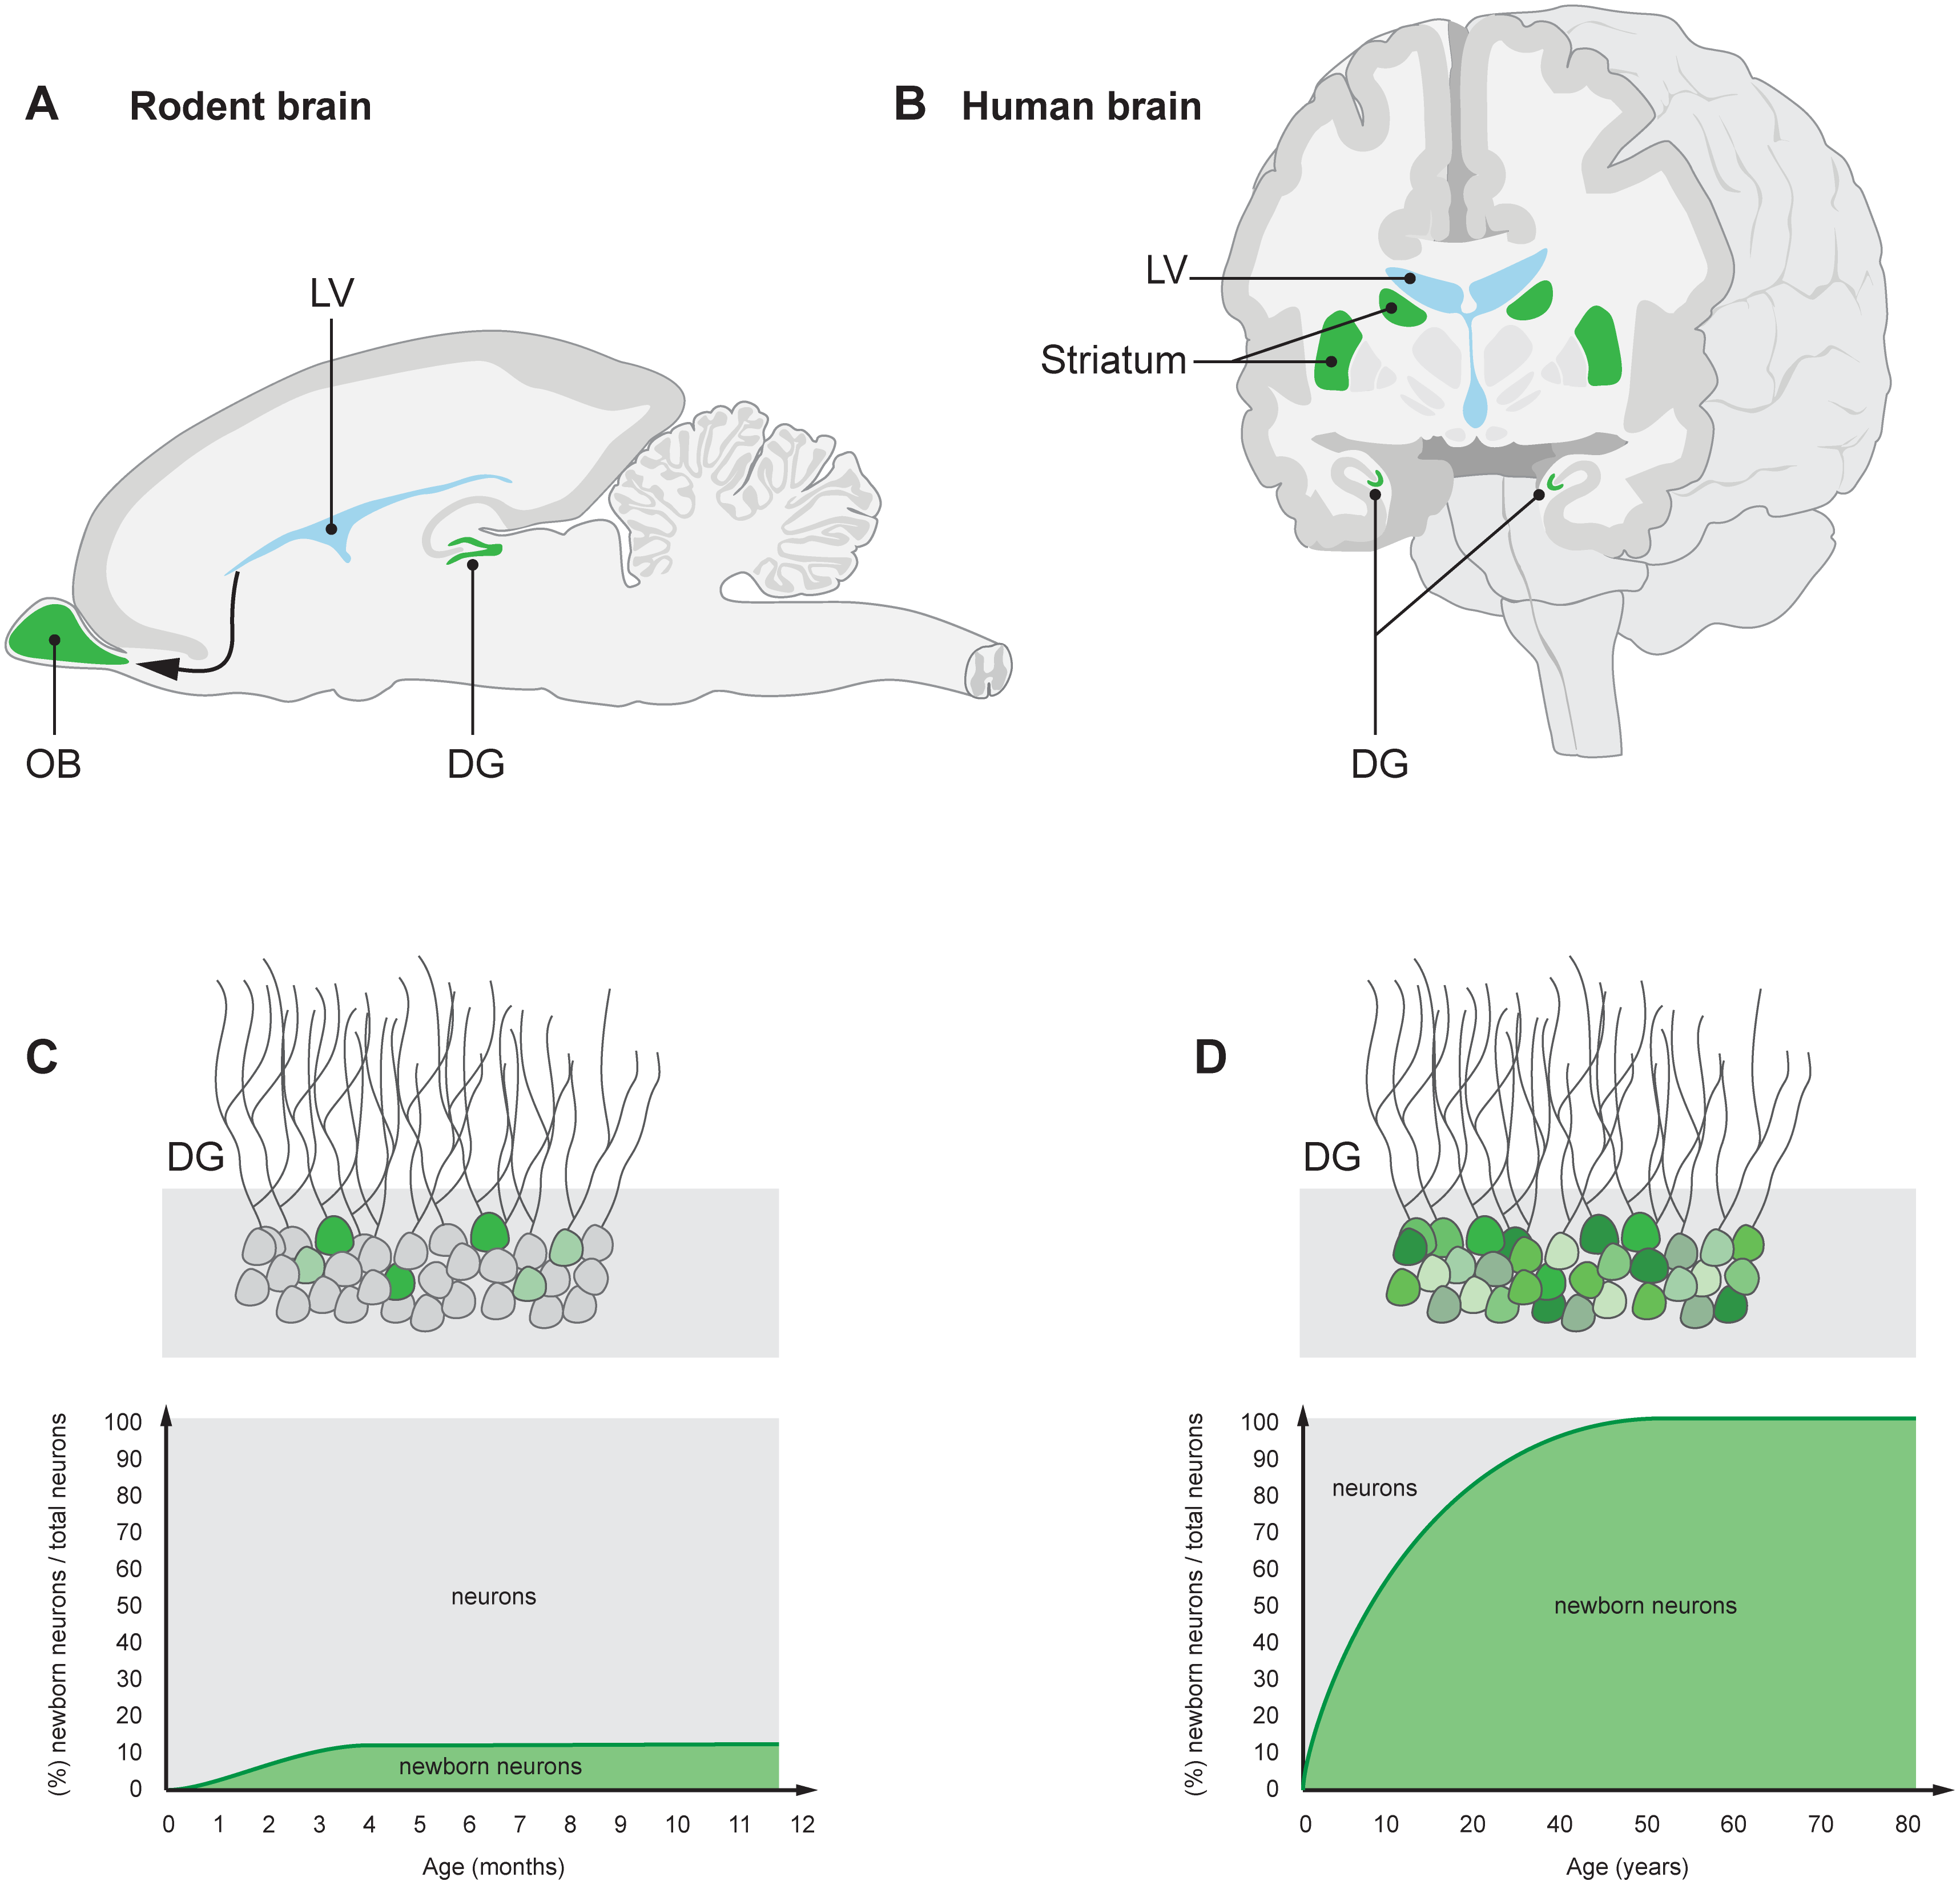
Ernst, A., & Frisén, J. (2015). Adult neurogenesis in humans- common and unique traits in mammals. PLoS Biology, 13(1), e1002045. https://doi.org/10.1371/journal.pbio.1002045
Gogtay, N., Giedd, J. N., Lusk, L., Hayashi, K. M., Greenstein, D., Vaituzis, A. C., … Thompson, P. M. (2004). Dynamic mapping of human cortical development during childhood through early adulthood. Proc. Natl. Acad. Sci. U. S. A., 101(21), 8174–8179. https://doi.org/10.1073/pnas.0402680101
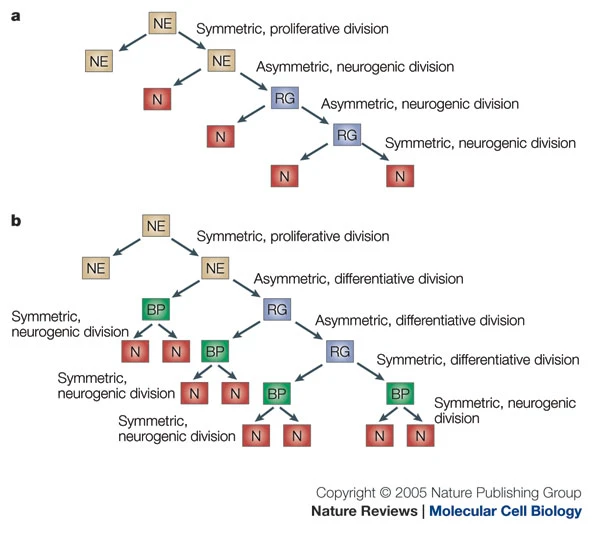
Götz, M., & Huttner, W. B. (2005). The cell biology of neurogenesis. Nat. Rev. Mol. Cell Biol., 6(10), 777–788. https://doi.org/10.1038/nrm1739
Haeckel, W. by E. (2001, August 12). Ernst Haeckel. Retrieved March 18, 2026, from https://en.wikipedia.org/wiki/Ernst_Haeckel
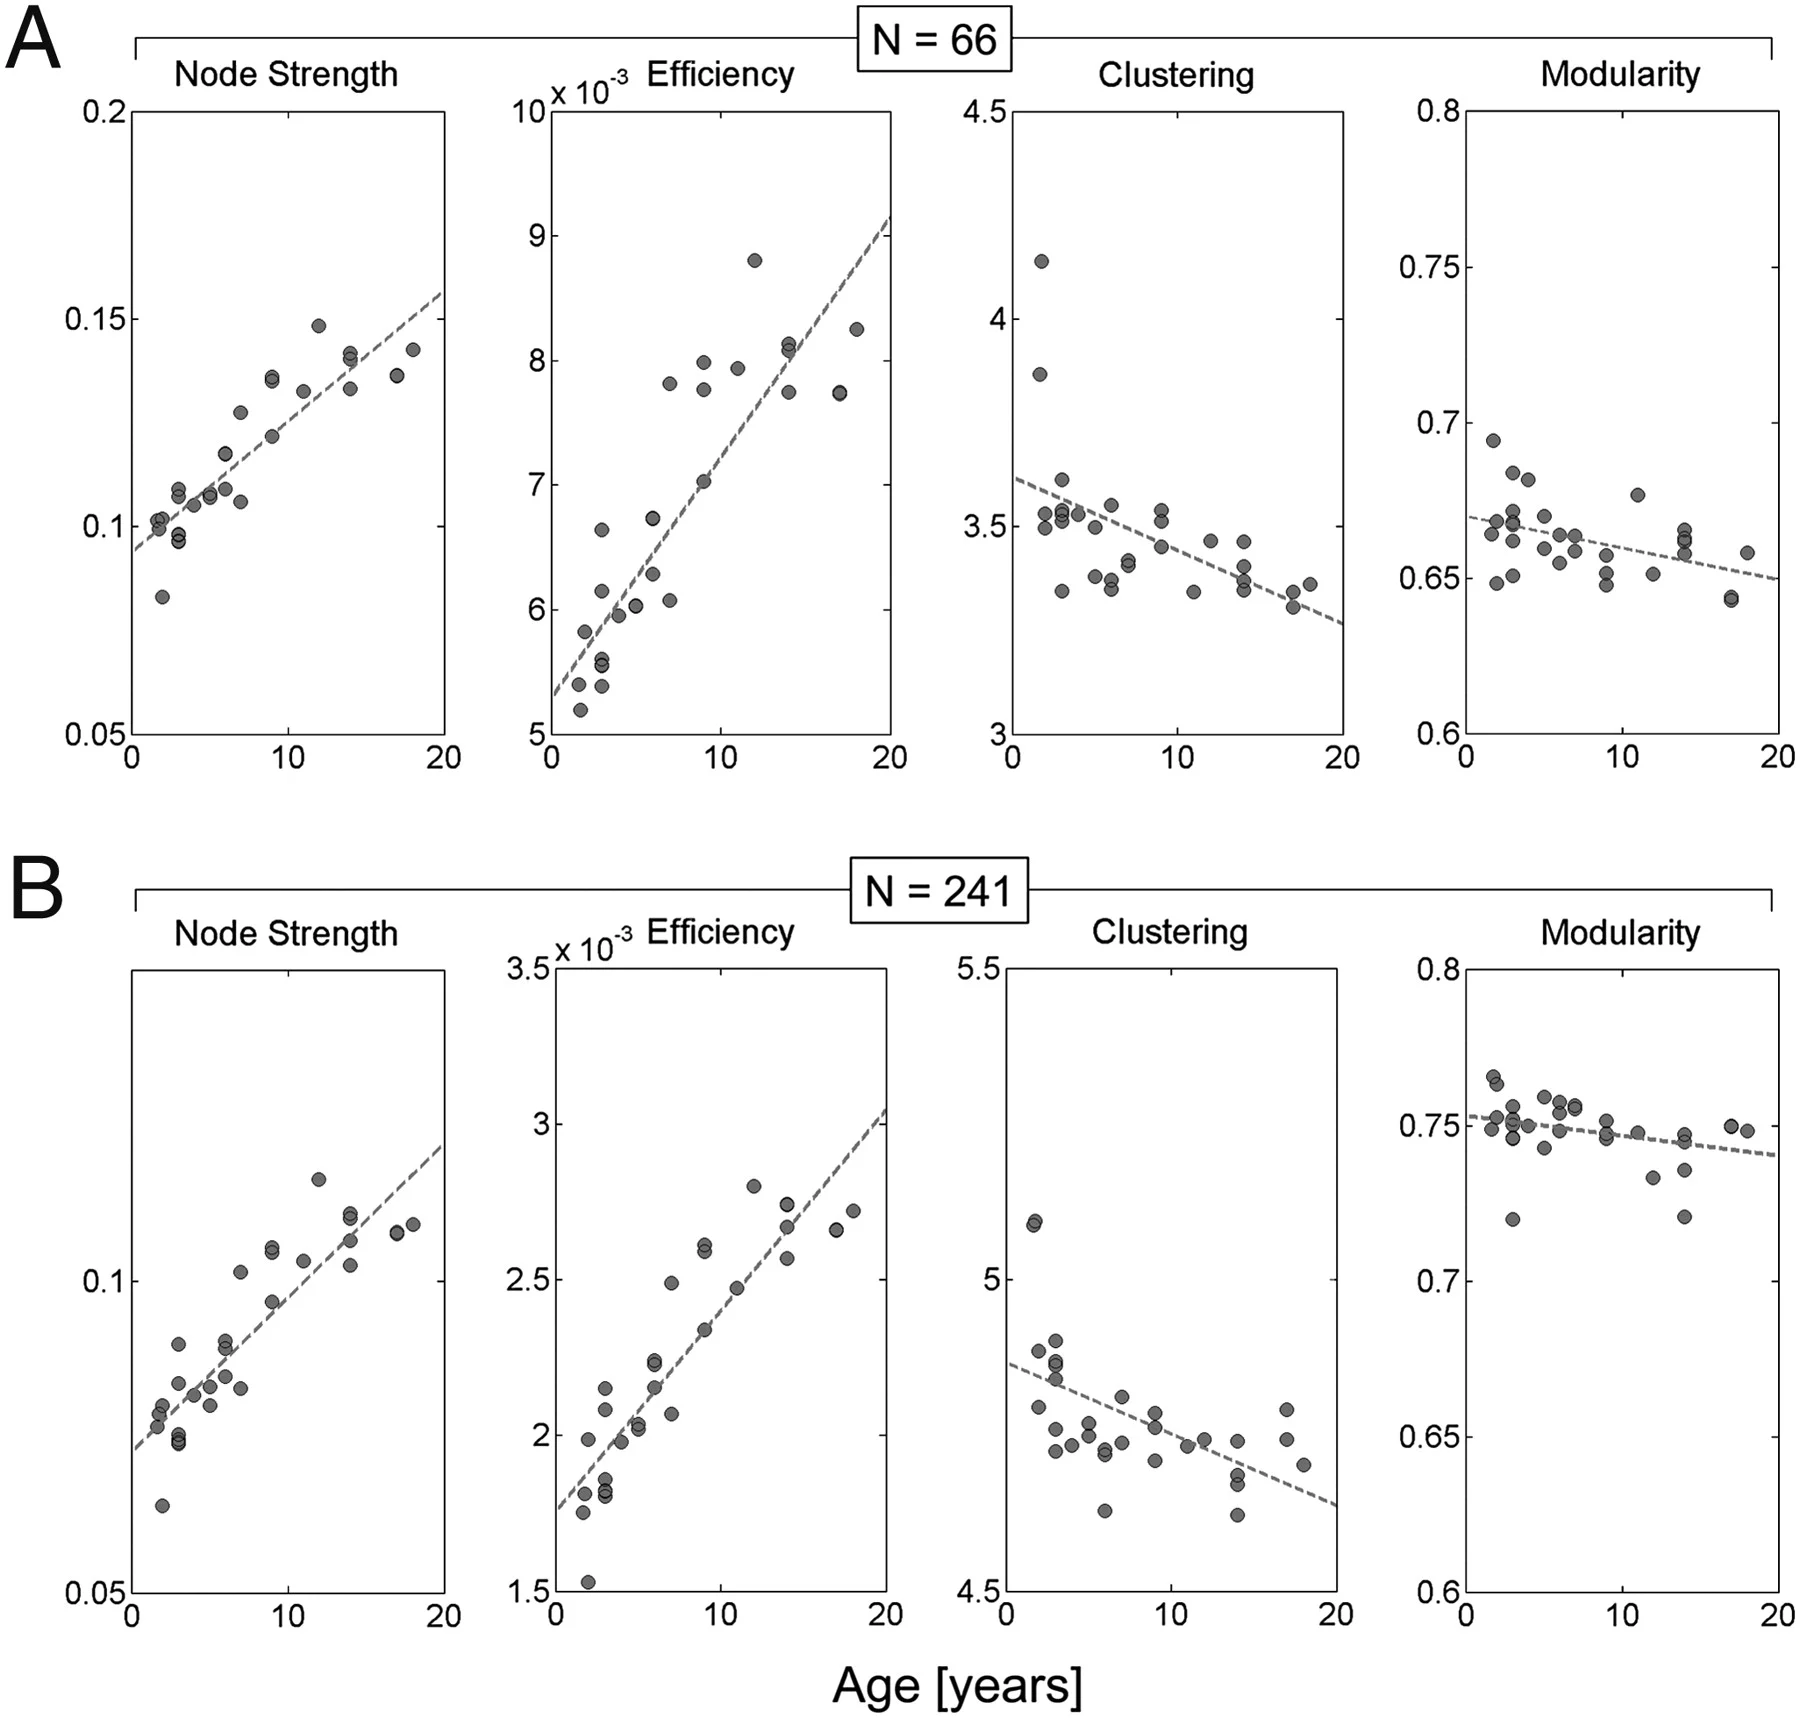
Hagmann, P., Sporns, O., Madan, N., Cammoun, L., Pienaar, R., Wedeen, V. J., … Grant, P. E. (2010). White matter maturation reshapes structural connectivity in the late developing human brain. Proceedings of the National Academy of Sciences, 107(44), 19067–19072. https://doi.org/10.1073/pnas.1009073107
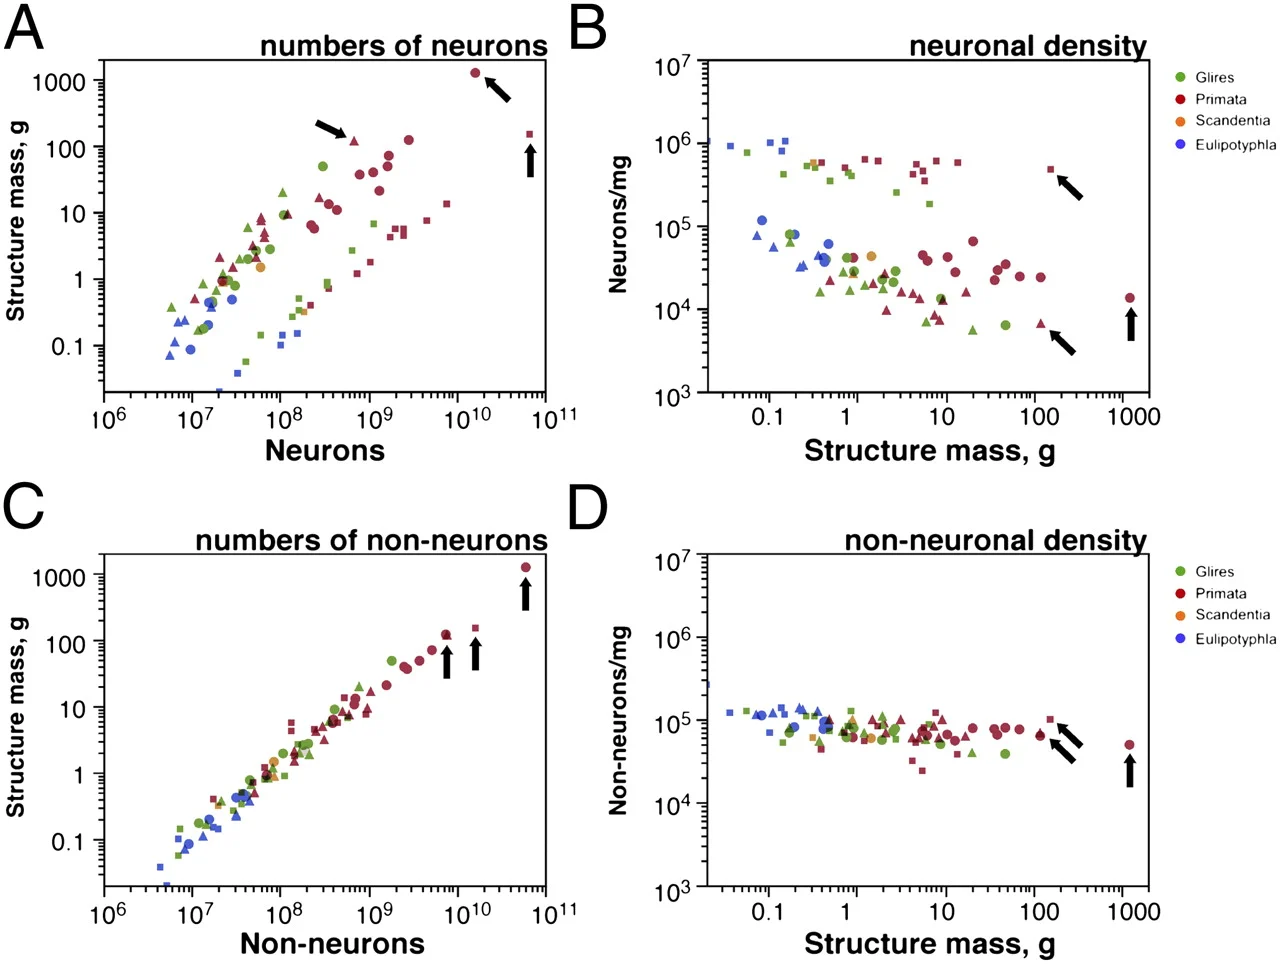
Herculano-Houzel, S. (2012). The remarkable, yet not extraordinary, human brain as a scaled-up primate brain and its associated cost. Proceedings of the National Academy of Sciences of the United States of America, 109 Suppl 1, 10661–10668. https://doi.org/10.1073/pnas.1201895109
Herculano-Houzel, S. (2016). The human advantage: A new understanding of how our brain became remarkable. MIT Press. Retrieved from https://market.android.com/details?id=book-DMqpCwAAQBAJ
Herculano-Houzel, S. (2017). Numbers of neurons as biological correlates of cognitive capability. Current Opinion in Behavioral Sciences, 16(Supplement C), 1–7. https://doi.org/10.1016/j.cobeha.2017.02.004
Hofman, M. A. (2014). Evolution of the human brain: When bigger is better. Frontiers in Neuroanatomy, 8. https://doi.org/10.3389/fnana.2014.00015
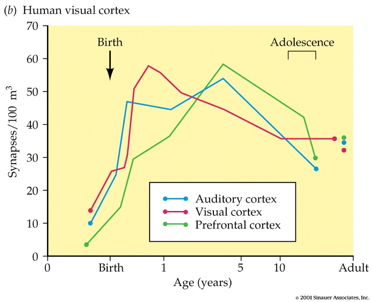
Huttenlocher, P. R. (2009). Neural plasticity: The effects of environment on the development of the cerebral cortex. Harvard University Press. Retrieved from https://play.google.com/store/books/details?id=2uhP2CBnaGwC
Irimia, A., & Van Horn, J. (2014). Systematic network lesioning reveals the core white matter scaffold of the human brain. Frontiers in Human Neuroscience, 8, 51. https://doi.org/10.3389/fnhum.2014.00051
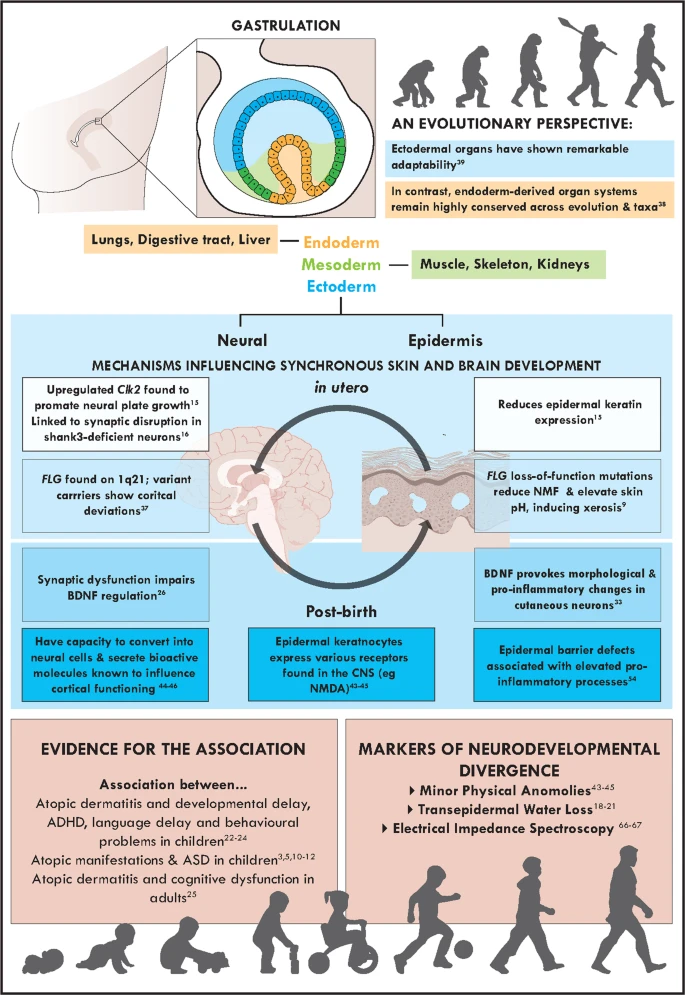
Jameson, C., Boulton, K. A., Silove, N., Nanan, R., & Guastella, A. J. (2023). Ectodermal origins of the skin-brain axis: A novel model for the developing brain, inflammation, and neurodevelopmental conditions. Molecular Psychiatry, 28(1), 108–117. https://doi.org/10.1038/s41380-022-01829-8
Johnson, M. B., Kawasawa, Y. I., Mason, C. E., Krsnik, Ž., Coppola, G., Bogdanović, D., … Šestan, N. (2009). Functional and evolutionary insights into human brain development through global transcriptome analysis. Neuron, 62(4), 494–509.
Johnson, M. H. (2001). Functional brain development in humans. Nat. Rev. Neurosci., 2(7), 475–483. https://doi.org/10.1038/35081509
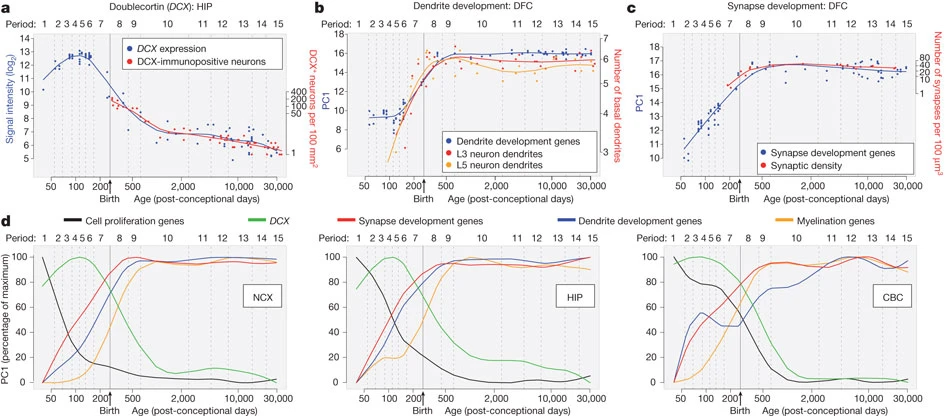
Kang, H. J., Kawasawa, Y. I., Cheng, F., Zhu, Y., Xu, X., Li, M., … Šestan, N. (2011). Spatio-temporal transcriptome of the human brain. Nature, 478(7370), 483–489. https://doi.org/10.1038/nature10523
Kety, S. S., & Schmidt, C. F. (1948). The Nitrous OXIDE METHOD FOR THE QUANTITATIVE DETERMINATION OF CEREBRAL BLOOD FLOW IN MAN: THEORY, PROCEDURE AND NORMAL VALUES. The Journal of Clinical Investigation, 27(4), 476–483. https://doi.org/10.1172/JCI101994
Knickmeyer, R. C., Gouttard, S., Kang, C., Evans, D., Wilber, K., Smith, J. K., … Gilmore, J. H. (2008). A structural MRI study of human brain development from birth to 2 years. J. Neurosci., 28(47), 12176–12182. https://doi.org/10.1523/JNEUROSCI.3479-08.2008
Konner, M. (2011). The Evolution of Childhood. Belknap Press of Harvard University Press. Retrieved from http://www.hup.harvard.edu/catalog.php?isbn=9780674062016
Kuzawa, C. W., Chugani, H. T., Grossman, L. I., Lipovich, L., Muzik, O., Hof, P. R., … Lange, N. (2014). Metabolic costs and evolutionary implications of human brain development. Proc. Natl. Acad. Sci. U. S. A., 111(36), 13010–13015. https://doi.org/10.1073/pnas.1323099111
Marner, L., Nyengaard, J. R., Tang, Y., & Pakkenberg, B. (2003). Marked loss of myelinated nerve fibers in the human brain with age. The Journal of Comparative Neurology, 462(2), 144–152. https://doi.org/10.1002/cne.10714
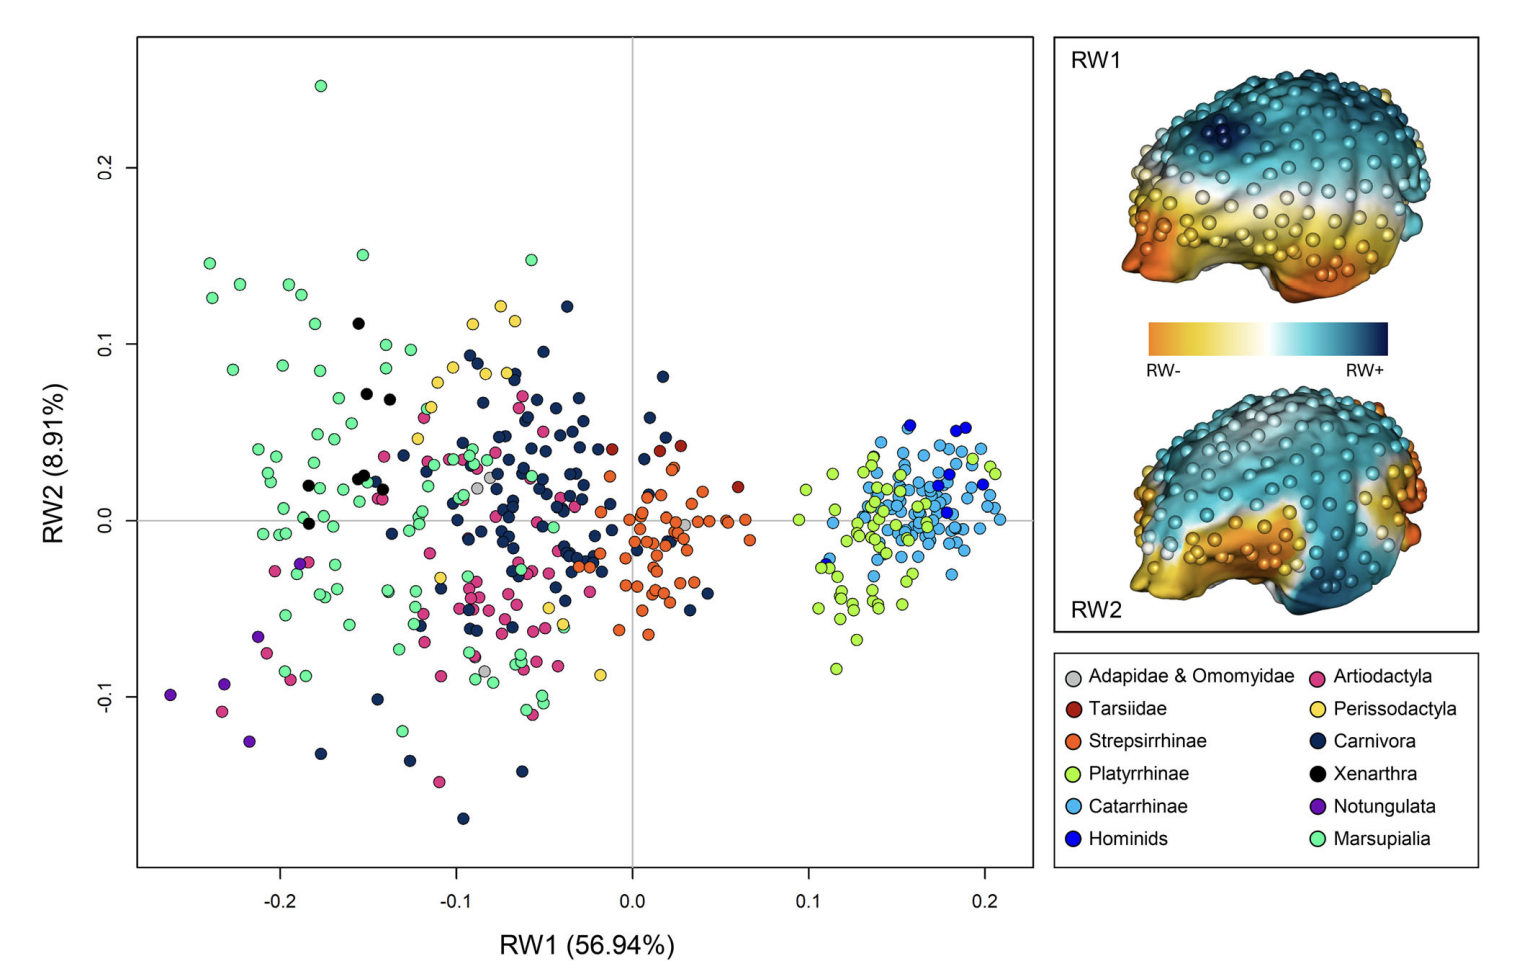
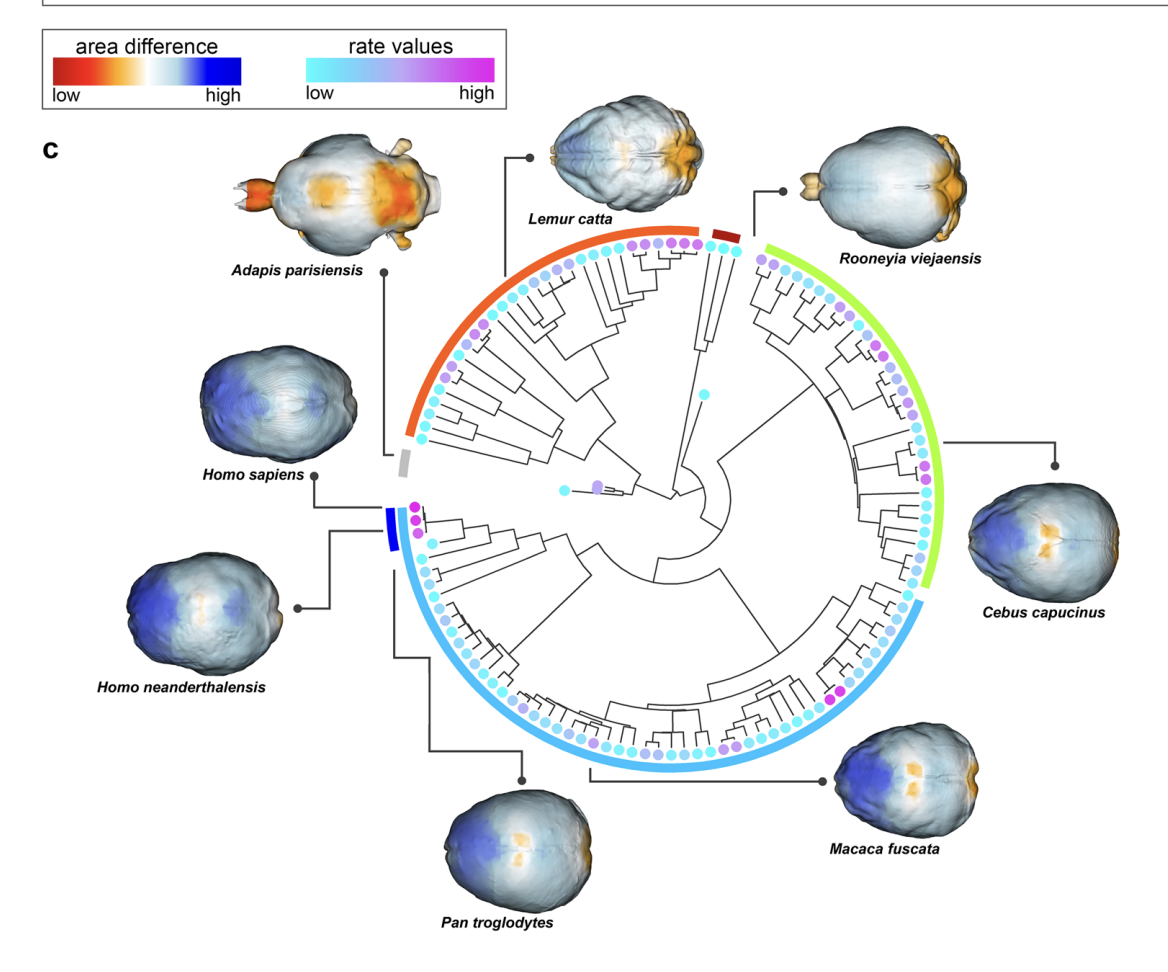
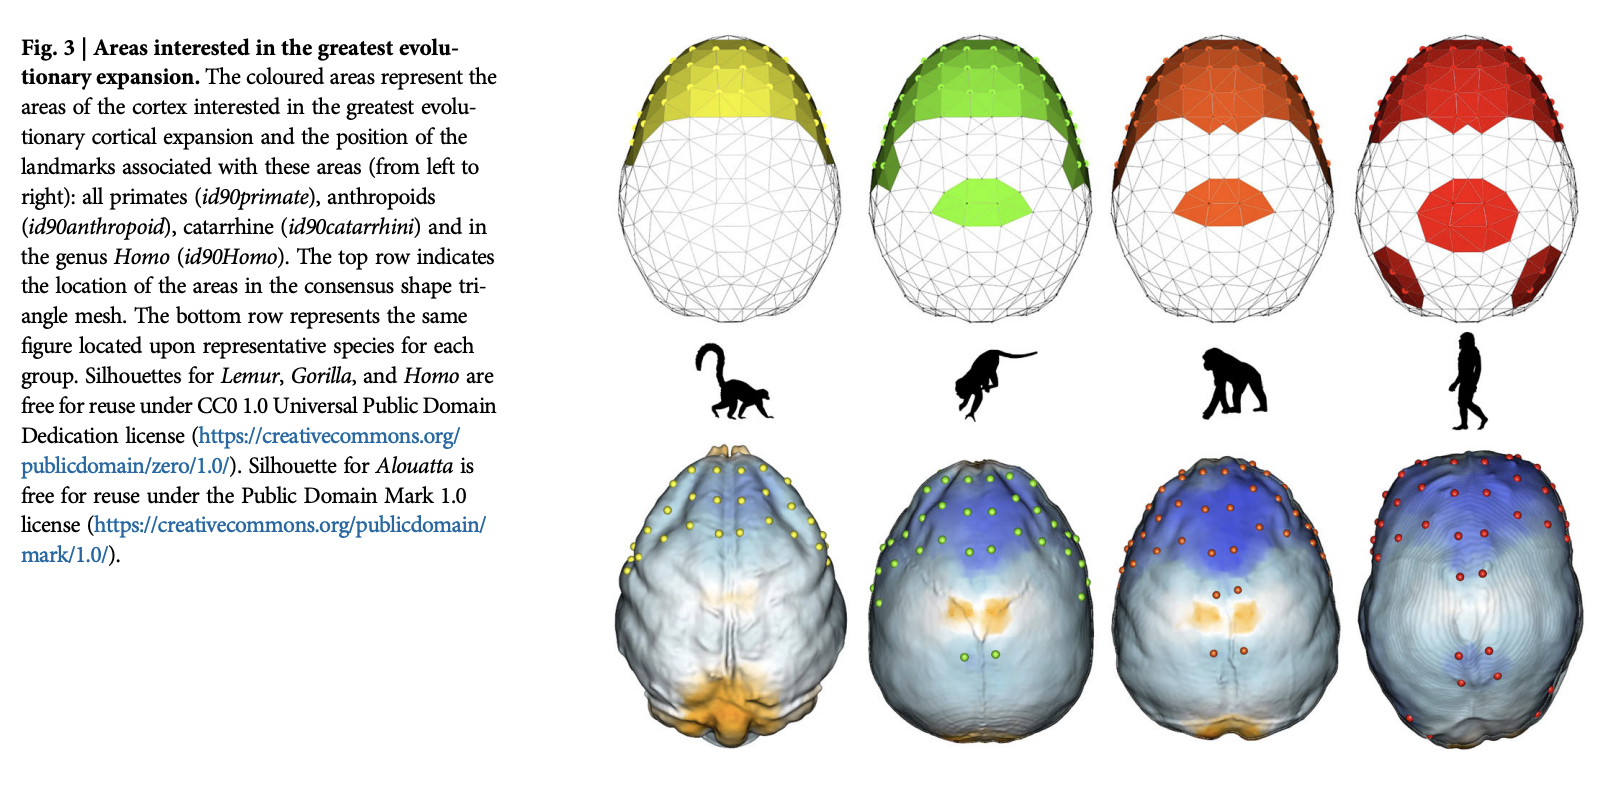
Melchionna, M., Castiglione, S., Girardi, G., Profico, A., Mondanaro, A., Sansalone, G., … Raia, P. (2025). Cortical areas associated to higher cognition drove primate brain evolution. Communications Biology, 8, 80. https://doi.org/10.1038/s42003-025-07505-1
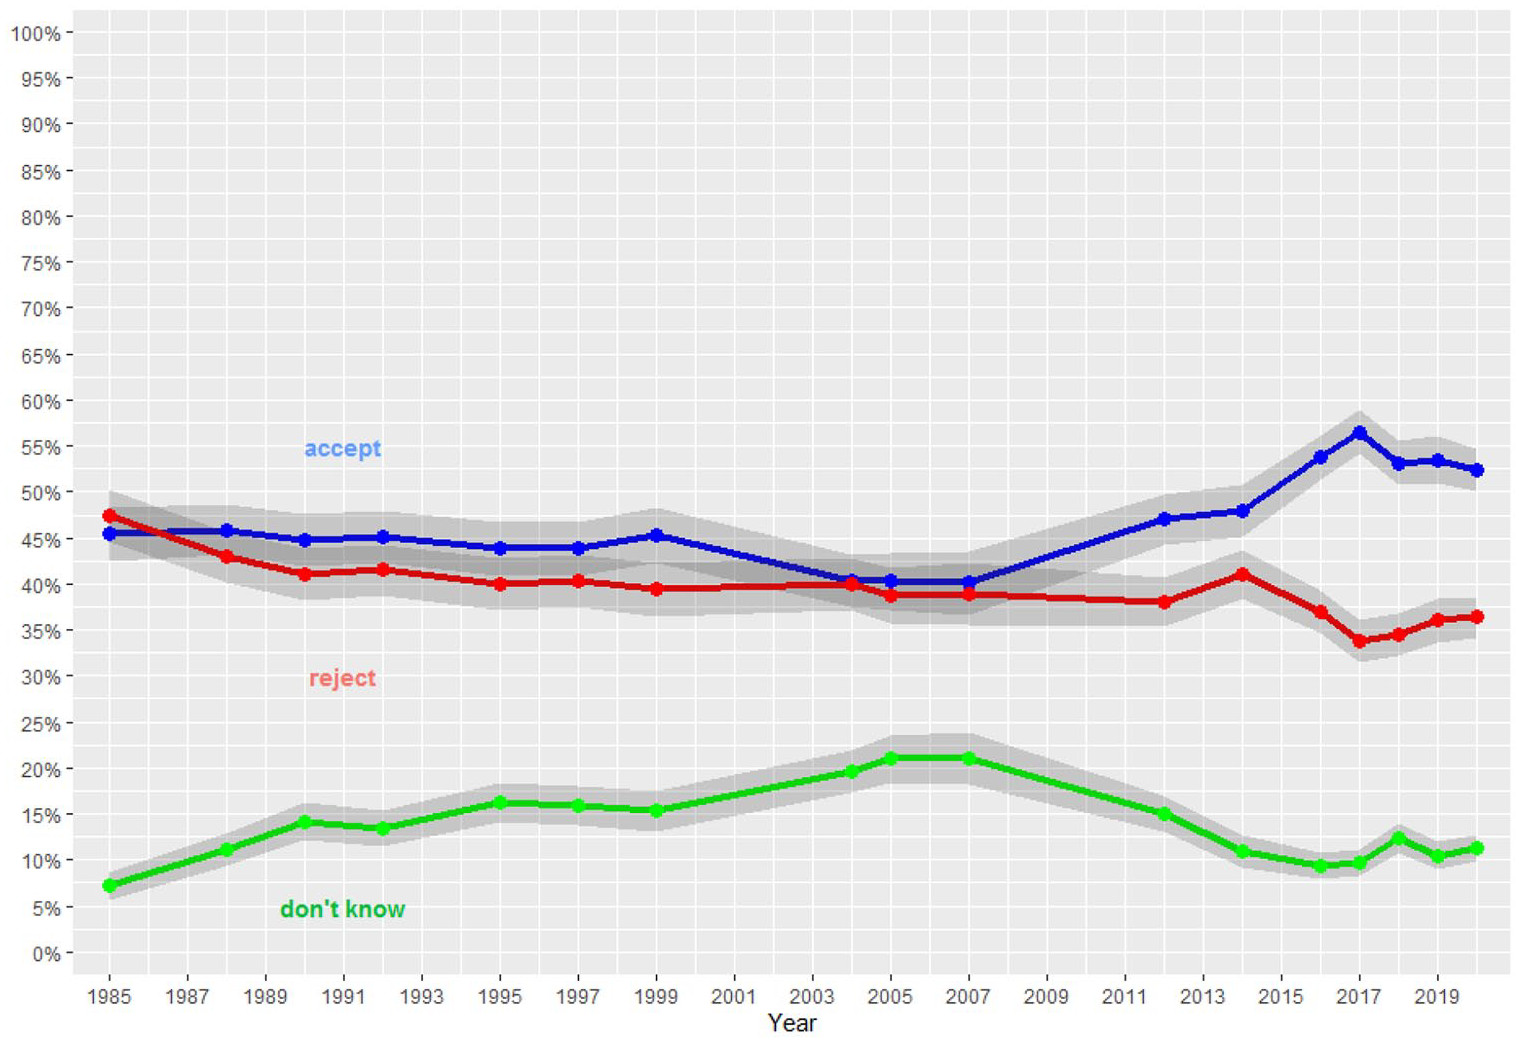
Miller, J. D., Scott, E. C., Ackerman, M. S., Laspra, B., Branch, G., Polino, C., & Huffaker, J. S. (2021). Public acceptance of evolution in the united states, 1985-2020. Public Understanding of Science, 9636625211035919. https://doi.org/10.1177/09636625211035919
Miller, J. D., Scott, E. C., & Okamoto, S. (2006). Public acceptance of evolution. SCIENCE-NEW YORK THEN WASHINGTON-, 313(5788), 765. https://doi.org/10.1126/science.1126746
Mr Riddz Science. (2015, September). Apoptosis - programmed cell death. Youtube. Retrieved from https://www.youtube.com/watch?v=ukxNXSPckjQ
Northcutt, R. G. (2002). Understanding vertebrate brain evolution. Integr. Comp. Biol., 42(4), 743–756. https://doi.org/10.1093/icb/42.4.743
Park, S. (2009). Hydra movement. Youtube. Retrieved from https://www.youtube.com/watch?v=-UI531GMRTM
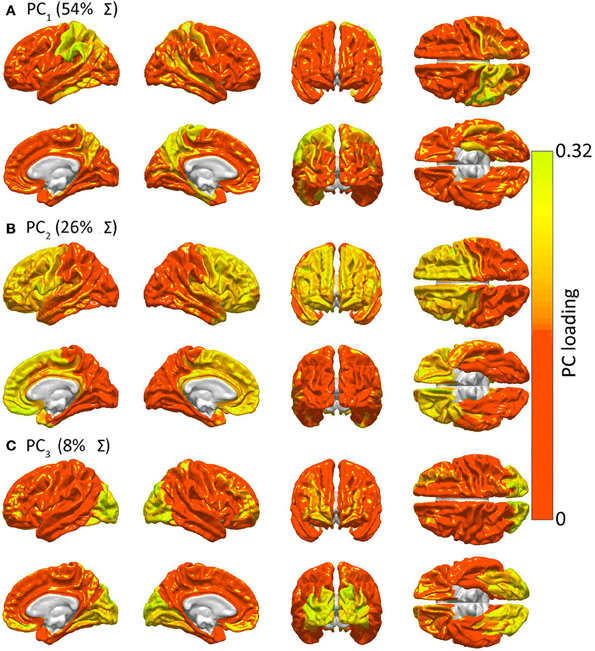
Petrican, R., Taylor, M. J., & Grady, C. L. (2017). Trajectories of brain system maturation from childhood to older adulthood: Implications for lifespan cognitive functioning. Neuroimage. https://doi.org/10.1016/j.neuroimage.2017.09.025
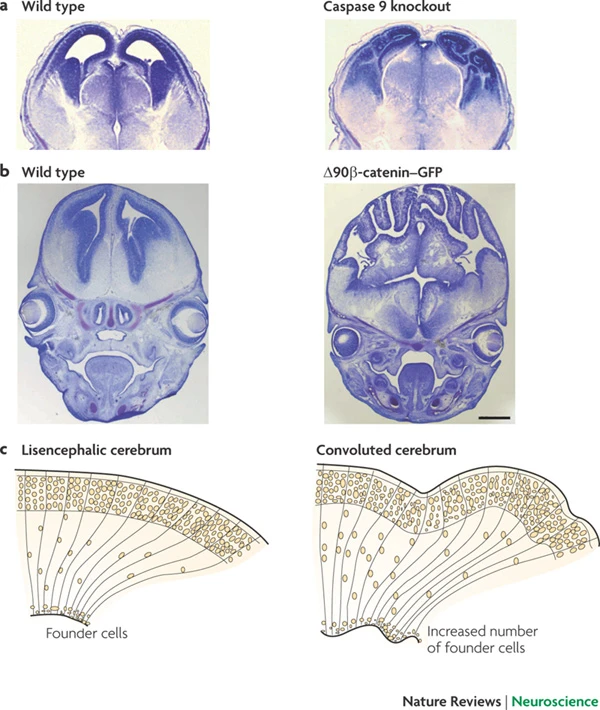
Rakic, P. (2009). Evolution of the neocortex: A perspective from developmental biology. Nature Reviews. Neuroscience, 10(10), 724–735. https://doi.org/10.1038/nrn2719
Shaw, P., Kabani, N. J., Lerch, J. P., Eckstrand, K., Lenroot, R., Gogtay, N., … Others. (2008). Neurodevelopmental trajectories of the human cerebral cortex. Journal of Neuroscience, 28(14), 3586–3594. https://doi.org/10.1523/JNEUROSCI.5309-07.2008
Silbereis, J. C., Pochareddy, S., Zhu, Y., Li, M., & Sestan, N. (2016). The cellular and molecular landscapes of the developing human central nervous system. Neuron, 89(2), 248–268. https://doi.org/10.1016/j.neuron.2015.12.008
Swanson, L. W. (2012). Brain architecture: Understanding the basic plan. Oxford University Press.
twoodburn. (2008). "Gentle arms of eden", by dave carter and tracy grammer. YouTube. Retrieved from https://www.youtube.com/watch?v=bAGMATHlSK4&list=RDbAGMATHlSK4&start_radio=1
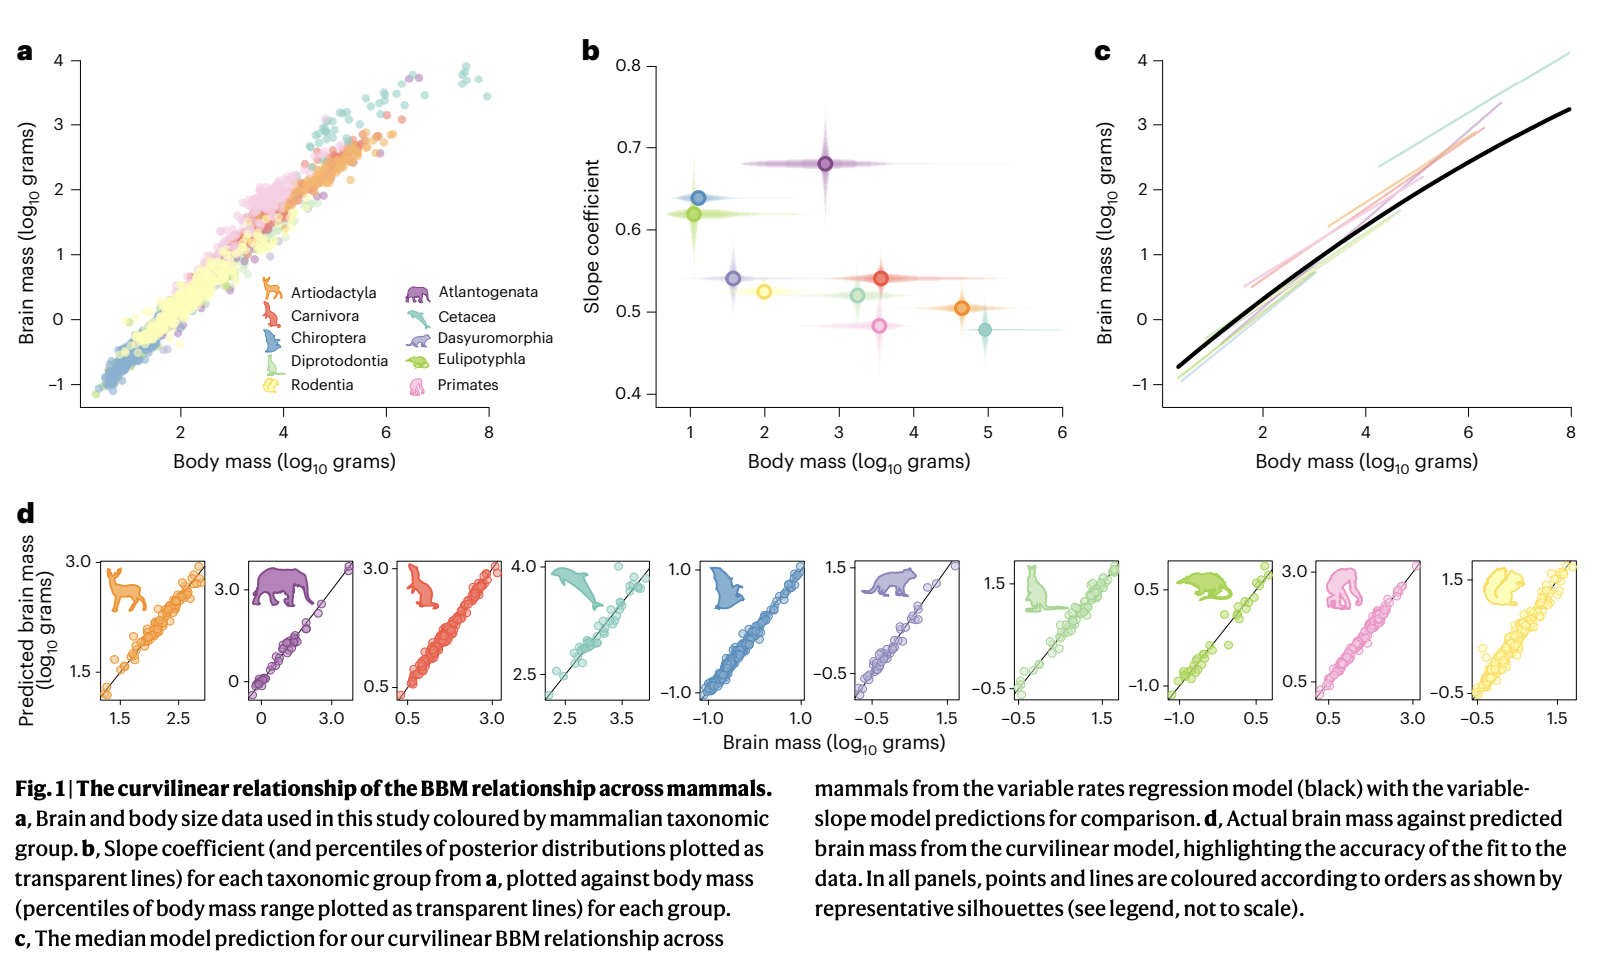
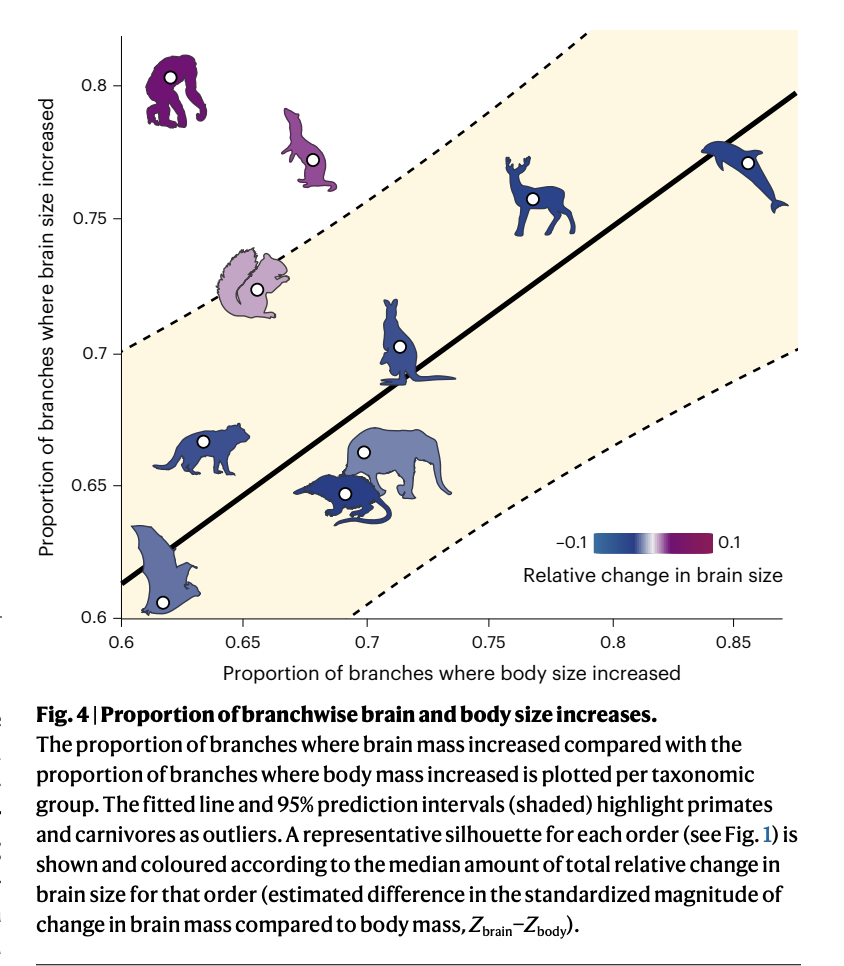
Venditti, C., Baker, J., & Barton, R. A. (2024). Co-evolutionary dynamics of mammalian brain and body size. Nature Ecology & Evolution, 8, 1534–1542. https://doi.org/10.1038/s41559-024-02451-3
Wikipedia contributors. (2026, March 14). Nothing in biology makes sense except in the light of evolution. Retrieved from https://en.wikipedia.org/wiki/Nothing_in_Biology_Makes_Sense_Except_in_the_Light_of_Evolution
Wooster, E. I. F., Whiting, M. J., Nimmo, D. G., Sayol, F., Carthey, A. J. R., Stanton, L. A., & Ashton, B. J. (2026). Predator–prey interactions as drivers of cognitive evolution. Nature Reviews Biodiversity, 1–9. https://doi.org/10.1038/s44358-026-00141-5
Wrangham, R. (2009). Catching fire: How cooking made us human. Basic Books. Retrieved from https://market.android.com/details?id=book-ebEOupKz-rMC

Footnotes

  1. “Figure 1. Public acceptance and rejection of evolution in the United States, 1985–2020. The following question was used in all of the years in this analysis:”For each statement below, please indicate if you think that it is definitely true, probably true, probably false, or definitely false. If you don’t know or aren’t sure, please check the ‘not sure’ box. ‘Human beings, as we know them today, developed from earlier species of animals.’ The number of respondents in each year and the confidence intervals are provided in the Supplemental Material in SI Table 1.”

  2. “Mosaic medallion in the floor of the main hall of the Jordan Hall of Science, University of Notre Dame. By SteveMcCluskey - Own work, CC BY-SA 3.0, https://commons.wikimedia.org/w/index.php?curid=25369137.”

  3. “1874 illustration from Anthropogenie showing”very early”, “somewhat later” and “still later” stages of embryos of fish (F), salamander (A), turtle (T), chick (H), pig (S), cow (R), rabbit (K), and human (M). By Lithograph by J. G. Bach of Leipzig after drawings by Haeckel, from Anthropogenie published by Engelmann - Nick Hopwood. “Pictures of Evolution and Charges of Fraud:: Ernst Haeckel’s Embryological Illustrations”, Isis 97 (2006), 260-301 pdf, Public Domain, https://commons.wikimedia.org/w/index.php?curid=8007834”

  4. “Animal phylogeny. A simplified animal phylogenetic tree (showing the evolutionary history of animals), in which lines represent evolutionary diversification. The lengths of the lines are arbitrary, as they do not indicate evolutionary distance. For a brief characterization of the Anthozoa, Bilateria, Ceriantharia, Cnidaria, Ctenophora, Medusozoa and Neuralia, see the glossary. The phylogenetic position of the Ctenophora is not settled, as indicated by a question mark. The Ctenophora image is adapted with permission from Ref. 43, Wiley. The Porifera and Placozoa images are reprinted with permission from Ref. 139 (Nielsen, C. Animal Evolution: Interrelationships of the Living Phyla p31 and p39 (2012)) by the permission of Oxford University Press. The Annelida image is adapted with permission from Ref. 140, Schweizerbart Science Publishers (www.schweizerbart.de).”

  5. “Comparison of neurodevelopment in the frog, annelid and sea anemone. The frog Xenopus laevis (part a), the annelid Platynereis dumerilii (part b) and the cnidarian Nematostella vectensis (part c) are depicted in their gastrula-like stages (gastrula, trochophora and planula, respectively; upper panels), intermediate developmental (neurula, metatrochophora and late planula, respectively; middle panels) and juvenile stages (tadpole, nectochaete and polyp, respectively; lower panels). Colours demarcate developmental neurogenic regions, and double-headed arrows show the apical (AP)–blastoporal (BL) axis. All views in parts a–c are lateral. At gastrula stages (upper panels), blastoporal ectodermal tissue (around the closing blastopore; red) and apical pole ectodermal tissue (violet) can be distinguished. At subsequent stages, a large part of the ectoderm — incluing the former apical and blastoporal regions — gives rise to neurogenic tissue. The neurogenic tissue comprises regions of distinct molecular identity (indicated by different colours), which will give rise to different parts of the nervous system. In the frog (part a), the neural plate (violet, red and yellow) comprises future forebrain tissue, as well as medial and lateral neural tube tissue; it is laterally bounded by developing peripheral nervous system components (blue). Similar regions are apparent in the annelid (part b), and these give rise to the brain, medial and lateral nerve cord and peripheral nervous system. As reasoned in this article, these regions also exist in the cnidarian (part c). In the frog and annelid worm, these regions are further subdivided into specific subregions by the activity of molecular organizing signals”

  6. “Lateral views of the brains of some mammals to show the evolutionary development of the neocortex (gray). In the hedgehog almost the entire neocortex is occupied by sensory and motor areas. In the prosimian Galago the sensory cortical areas are separated by an area occupied by association cortex (AS). A second area of association cortex is found in front of the motor cortex. In man these anterior and posterior association areas are strongly developed. A, primary auditory cortex; AS, association cortex; Ent, entorhinal cortex; I, insula; M, primary motor cortex; PF, prefrontal cortex; PM, premotor cortex; S, primary somatosensory cortex; V, primary visual cortex. Modified with permission from Nieuwenhuys (1994).”

  7. “Large brains appear several times in the mammalian radiation. Example species are illustrated for each major mammalian group. The mammalian radiation is based on the findings of Murphy et al. (18) and Kaas (19). Brain images are from the University of Wisconsin and Michigan State Comparative Mammalian Brain Collections (www.brainmuseum.org).”

  8. “Shared nonneuronal scaling rules and structure- and order-specific neuronal scaling rules for mammalian brains. Each point represents the average values for one species (insectivores, blue; rodents, green; primates, red; Scandentia, orange). Arrows point to human data points, circles represent the cerebral cortex, squares represent the cerebellum, and triangles represent the rest of the brain (excluding the olfactory bulb). (A) Clade- and structure-specific scaling of brain structure mass as a function of numbers of neurons. Allometric exponents: cerebral cortex: 1.699 (Glires), 1.598 (insectivores), 1.087 or linear (primates); cerebellum: 1.305 (Glires), 1.028 or linear (insectivores), 0.976 or linear (primates); rest of the brain: 1.568 (Glires), 1.297 (insectivores), 1.198 (or 1.4 when corrected for phylogenetic relatedness in the dataset, primates). (B) Neuronal cell densities scale differently across structures and orders but are always larger in primates than in Glires. Allometric exponents: cerebral cortex: −0.424 (Glires), −0.569 (insectivores), −0.168 (primates); cerebellum: −0.271 (Glires), not significant (insectivores and primates); rest of the brain: −0.467 (Glires), not significant (insectivores), −0.220 (primates). (C) Mass of the cerebral cortex, cerebellum, and rest of the brain varies as a similar function of their respective numbers of nonneuronal cells. Allometric exponents: cerebral cortex: 1.132 (Glires), 1.143 (insectivores), 1.036 (primates); cerebellum: 1.002 (Glires), 1.094 (insectivores), 0.873 (primates); rest of the brain: 1.073 (Glires), 0.926 (insectivores), 1.065 (primates). (D) Average density of nonneuronal cells in each structure does not vary systematically with structure mass across species. Power functions are not plotted so as not to obscure the data points. Allometric exponents are from a study by Herculano-Houzel (20); data are from studies by Herculano-Houzel and her colleagues (22–27).”

  9. “Fig. 1: Relative warp analysis (RWA) plot showing the distribution of mammalian endocast diversity…The two meshes to the right (in latero-frontal view) show the relative importance of each landmark (their loadings) on the extreme values of first and on the second Relative Warp (RW) axes, respectively.”

  10. “a Evolutionary rate values related to the node correspond to the positive and significant shift. b The phylogenetic tree of mammals. The light blue circle indicates the positive shift in Catarrhine. The light red circles indicate the negative shift pertaining to Ferungulata and Marsupialia. The circle size is proportional to the intensity of rate change. c The phylogenetic tree of the Primates (extracted from the tree in b) shows the location of principal primate clades and representative shapes of their respective endocasts. The color gradient represents the map of the evolutionary changes in shape of the endocast from the mammal tree root, in terms of cortical area expansion (blue) and contraction (red). Multivariate rates of brain evolution of individual species are indicated by the colored dots next to the tree tips in both b and c. Brain endocasts of the different species are not to scale. Silhouettes for Homo, Carlito, Lemur, Bradypus, Macropus, Canis, Panthera, and Capreolus are free for reuse under CC0 1.0 Universal Public Domain Dedication license (https://creativecommons.org/publicdomain/zero/1.0/). Silhouettes for Cebus (credits to Sarah Werning) and Ceratotherium (credits to Jan A. Venter, Herbert H. T. Prins, David A. Balfour and Rob Slotow) are free for reuse under the Attribution 3.0 Unported license (https://creativecommons.org/licenses/by/3.0/). Silhouette for Macaca is free for reuse under the Public Domain Mark 1.0 license (https://creativecommons.org/publicdomain/mark/1.0/).”

  11. “Timeline of Key Human Neurodevelopmental Processes and Functional Milestones.”

  12. Neurulation

  13. post conceptual days

  14. “The ectoderm and neurodevelopmental divergence. This figure describes the evolutionary and developmental skin-brain connection, common molecular factors that underpin this relationship in utero and post-birth, the existing evidence for associations between atopic disease and neurodevelopmental delay, and potential early life markers that could identify neurodevelopmental divergence.”

  15. “The lineage trees shown provide a simplified view of the relationship between neuroepithelial cells (NE), radial glial cells (RG) and neurons (N), without (a) and with (b) basal progenitors (BP) as cellular intermediates in the generation of neurons. They also show the types of cell division involved.”

  16. “New neurons are indicated in green. (A) Neuroblasts that are generated in the subventricular zone lining the lateral ventricle (LV) in rodents migrate to the OB, a structure crucial for olfaction, where they integrate as interneurons. (B) Neuroblasts are present in the subventricular zone also in humans, and new neurons integrate in the adjacent striatum, which plays an essential role in movement coordination, procedural learning, and memory, as well as motivational and emotional control. New neurons are continuously generated in the DG of the hippocampus—a brain structure essential for memory and mood control—in both rodents and humans (A, B). A limited subpopulation of DG neurons are subject to exchange in rodents (C), whereas the majority turn over in humans (D) [4–6]. The neurons within the turning over population are continuously exchanged. A value of 100% on the y-axis means that all neurons have been replaced since the individual’s birth.”

  17. “Fig. 4. A: migration and differentiation of cells of astrocyte and oligodendrocyte lineages, and multifocal pattern of development of glial rows in the fimbria between embryonic day 15 (E15) and postnatal day 60 (P60). (Lower surface, ependyma; upper surface, pia.) There is a relatively small increase in the thickness of the fimbria. The multicellular ventricular layer (small open circles at lower surface at E15 and P0) becomes reduced to a unicellular adult ependyma (triangles on ependymal surface). Cells migrating into the body of the fimbria, and supplemented by division of precursors there, become arranged in progressively longer interfascicular glial rows. The astrocytes (large, pale circles) change from predominantly radial processes to predominantly longitudinal. Oligodendrocytes are represented by small, black, filled contiguous circles. Myelination (not represented) largely occurs between P10 and P60. Axons (not represented) are present from the earliest developmental stage. [From Suzuki and Raisman (596). Copyright 1992, reprinted by permission of Wiley-Liss, Inc., a subsidiary of John Wiley & Sons, Inc.]B: organization of the glial framework of central white matter tracts. Arrangement of radial and longitudinal processes of oligodendrocytes (Og) and astrocytes (As) forming a continuous meshwork of processes intermingled within the axonal tracts in the fimbria. Astrocytes are linked with each other by gap junctions, and also form gap junctions with oligodendrocytes, thus providing an indication for a functional as well as an anatomical functional syncytium. Myelination occurs on an asynchronous mode, with individual oligodendrocytes maturing independently within a cluster of adjacent oligodendrocytes, suggesting an interaction between axon maturation and oligodendrocyte differentiation. [From Raisman (492).]”

  18. “Fig. 6. Cycles of myelination in the CNS during development. The width and the length of graphs indicate progression in the intensity of staining corresponding to the density of myelinated fibers; the vertical stripes at the end of the graphs indicate approximate age range of termination of myelination estimated from comparison of the fetal and postnatal tissue with tissue from adults in the third and later decades of life. Adapted from Yakovlev and Lecours (677).”

  19. “SIMILARITIES IN GM LESION EFFECTS UPON NETWORK TOPOLOGY AS REVEALED BY PCA. Shown are lateral, medial, dorsal, ventral, anterior and posterior views of each hemisphere for the first three PCs—i.e. PC1 in (A), PC2 in (B) and PC3 in (C)—mapped on the cortex, demonstrating the anatomical similarity pattern associated with the extent to which the removal of different regions affects the network in a similar way. For each PC, color varies from the minimum to the maximum value of the PC factor loadings. PC1 (54% of the variance Σ in the data) exhibits greater hemispheric asymmetry than the following two PCs and covers the entire left parietal lobe and, to a smaller extent, the left temporal lobe. PC2 (26% of Σ) is—by comparison to PC1—highly symmetric, and includes the entire frontal lobe of both hemispheres, whereas PC3 (8% of Σ) is again symmetric and includes the occipital lobes of both hemispheres.”

  20. “Hypothetical Models of Brain Connectome Development from Infancy to Early Childhood (A) A hypothetical developmental model of information segregation and integration in the brain networks. (C) A hypothetical developmental model from primary regions to higher-order association regions. (C) A hypothetical developmental model of structural and functional brain connectomes.”

  21. “Relationship of network metrics and developmental age. Results shown are for cerebral cortex at two spatial resolutions: (A) n = 66 and (B) n = 241 nodes. For whole-brain data (cortex and deep gray structures) see Fig. S2. Scatter plots show node strength, global efficiency, clustering coefficient, and modularity (left to right). All measures are computed from the weighted SC matrices of individual subjects. Values for clustering coefficient and small-world index are scaled relative to populations of 100 random networks with preserved degree and weight distributions. For R and P values, see Table 1.”

  22. “a, Comparison between DCX expression in HIP and the density of DCX-immunopositive cells in the human dentate gyrus36. b, Comparison between transcriptome-based dendrite development trajectory in DFC and Golgi-method-based growth of basal dendrites of layer 3 (L3) and 5 (L5) pyramidal neurons in the human DFC41. c, Comparison between transcriptome-based synapse development trajectory in DFC and density of DFC synapses calculated using electron microscopy42. For b and c, PC1 for gene expression was plotted against age to represent the developmental trajectory of genes associated with dendrite (b) or synapse (c) development. Independent data sets were centred, scaled and plotted on a logarithmic scale. d, PC1 value for the indicated sets of genes (expressed as percentage of maximum) plotted against age to represent general trends and regional differences in several neurodevelopmental processes in NCX, HIP and CBC.”

  23. “Three accounts of the neural basis of an advance in behavioural abilities in infants. a | A maturational view in which the neuroanatomical maturation of one region, in this case the dorsolateral prefrontal cortex (DLPC), allows new behavioural abilities to emerge. Specifically, maturation of DLPC has been associated with successful performance in the object retrieval task (Fig. 1a)50. Note that although the task itself involves activity in several regions, it is thought to be maturation of only one of these, the DLPC, that results in changed behaviour. b | An interactive specialization view in which the onset of a new behavioural ability is due to changes in the interactions between several regions that were already partially active. In this hypothetical illustration, it is suggested that changes in the interactions between DLPC, parietal cortex and cerebellum might give rise to successful performance in the object retrieval paradigm. In contrast to the maturational view, it is refinement of the connectivity between regions, rather than within a single region, that is important. According to this view, regions adjust their functionality together to allow new computations. c | A skill-learning model, in which the pattern of activation of cortical regions changes during the acquisition of new skills throughout the lifespan. In the example illustrated there is decreasing activation of DLPC and medial frontal cortex (pre-supplementary motor area), accompanied by increasing activation of more posterior regions (such as intraparietal sulcus), as human adults perform a visuomotor sequence learning task77. It is suggested that similar changes might occur during the acquisition of new skills by infants. These three accounts are not necessarily mutually exclusive.”

  24. “Sensory origins of primary motor cortex (M1). (A) Boundaries of primary cortical areas in rats: primary somatosensory cortex (S1, red) and M1 (blue), and primary auditory (A1) and visual (V1) cortex. (B) Enlargements of red and blue regions in (A) show the somatotopic organization of S1 and M1. Adapted, with permission, from [92]. (C) Peri-event histogram showing sensory responsiveness of an individual neuron in the forelimb region of M1 at P20. The neuron’s firing rate is shown in relation to movement onset (vertical broken line) for twitches (red) and wake movements (black). This neuron is representative of all M1 neurons recorded at this age. Neurons fire above baseline (0 on the y-axis) after – not before – movement onset during both sleep and wake, indicative of sensory responding. Adapted, with permission, from [9].”

  25. “Protracted development of motor maps in M1. (A) Representative motor maps in rat pups at postnatal day (P) 25 and P30 and in adult rats at P60. Each map was produced using intracortical microstimulation in the forelimb region of M1 in anesthetized animals. The legends indicate the simple (i.e., single joint) and complex (i.e., multijoint) movements evoked at each stimulation site. Rectangles around the maps demarcate identical cortical surface areas. Adapted, with permission, from [17]. (B) Representative motor maps in kittens at P63 and P86 and in adult cats. Each map was produced using intracortical microstimulation in the forelimb region of M1 in anesthetized animals. The legend indicates the single-joint forelimb movements (shoulder, elbow, wrist) and multijoint movements evoked at each stimulation site. Movements of the digits occurred with movements of other joints. Colors denote the threshold electric current for movement production as indicated by the color bar at right. The black lines show the location of the cruciate sulcus. Adapted, with permission, from [24]. Both figure parts are used with permission of the American Physiological Society; permission conveyed through Copyright Clearance, Inc.”

  26. “Figure I. Estimating the onset of M1 motor outflow in early human development. Estimated days postconception plotted against event scale for humans, macaques, cats, and rats (data from translatingtime.org). Red-shaded region denotes 95% confidence intervals for human data. Three additional events are shown: birth (vertical bars), estimated onset of cortical delta rhythm (gray circles), and estimated onset of M1 motor outflow based on cortical stimulation studies (gray squares). Based on M1 onset in the non-human species, five possible onsets in humans are represented (arrows a–e). Inset: semi-log replotting of the data shown with four events from the visual system. Abbreviations: dLGN, dorsal lateral geniculate nucleus; SC, superior colliculus; V1, primary visual cortex; VEP, visual evoked potential.”