flowchart LR
  A[World] --> B[You]
Semiotics of data visualization
2025-01-16
Rick Gilmore
Prelude
William Playfair
- “engineer, political economist, and scoundrel” (Spence & Wainer, 2017)
- Founder of graphical methods of statistics
- Introduced line, area, and bar chart
- Likely published first pie chart and circle graphs

Denton, Asphaug, Emsenhuber, & Melikyan (2025)
Overview
Announcements
- Free access to newspapers
 ## Announcements
- May change class location
Last time…
- Course introduction
Today
- Visualization in psychological science
- Semiotics of data visualization
Visualization in psychological science
Resources
- Assignment
- Google Sheet for capturing & sharing data
Measures in \(\Psi\) science
- Internal states (thoughts, feelings, memories, opinions, decisions, judgments…)
- Physiological states
- Individual characteristics
- Environmental characteristics
Questions
- Are there common types of visualizations in psychological science?
- What (types) messages are conveyed?
- How clearly are they conveyed?
- How are the following depicted?
- Responses to surveys
- Performance on tasks/tests
- Brain structure or activity
Semiotics of data visualization
Semi-whatics?
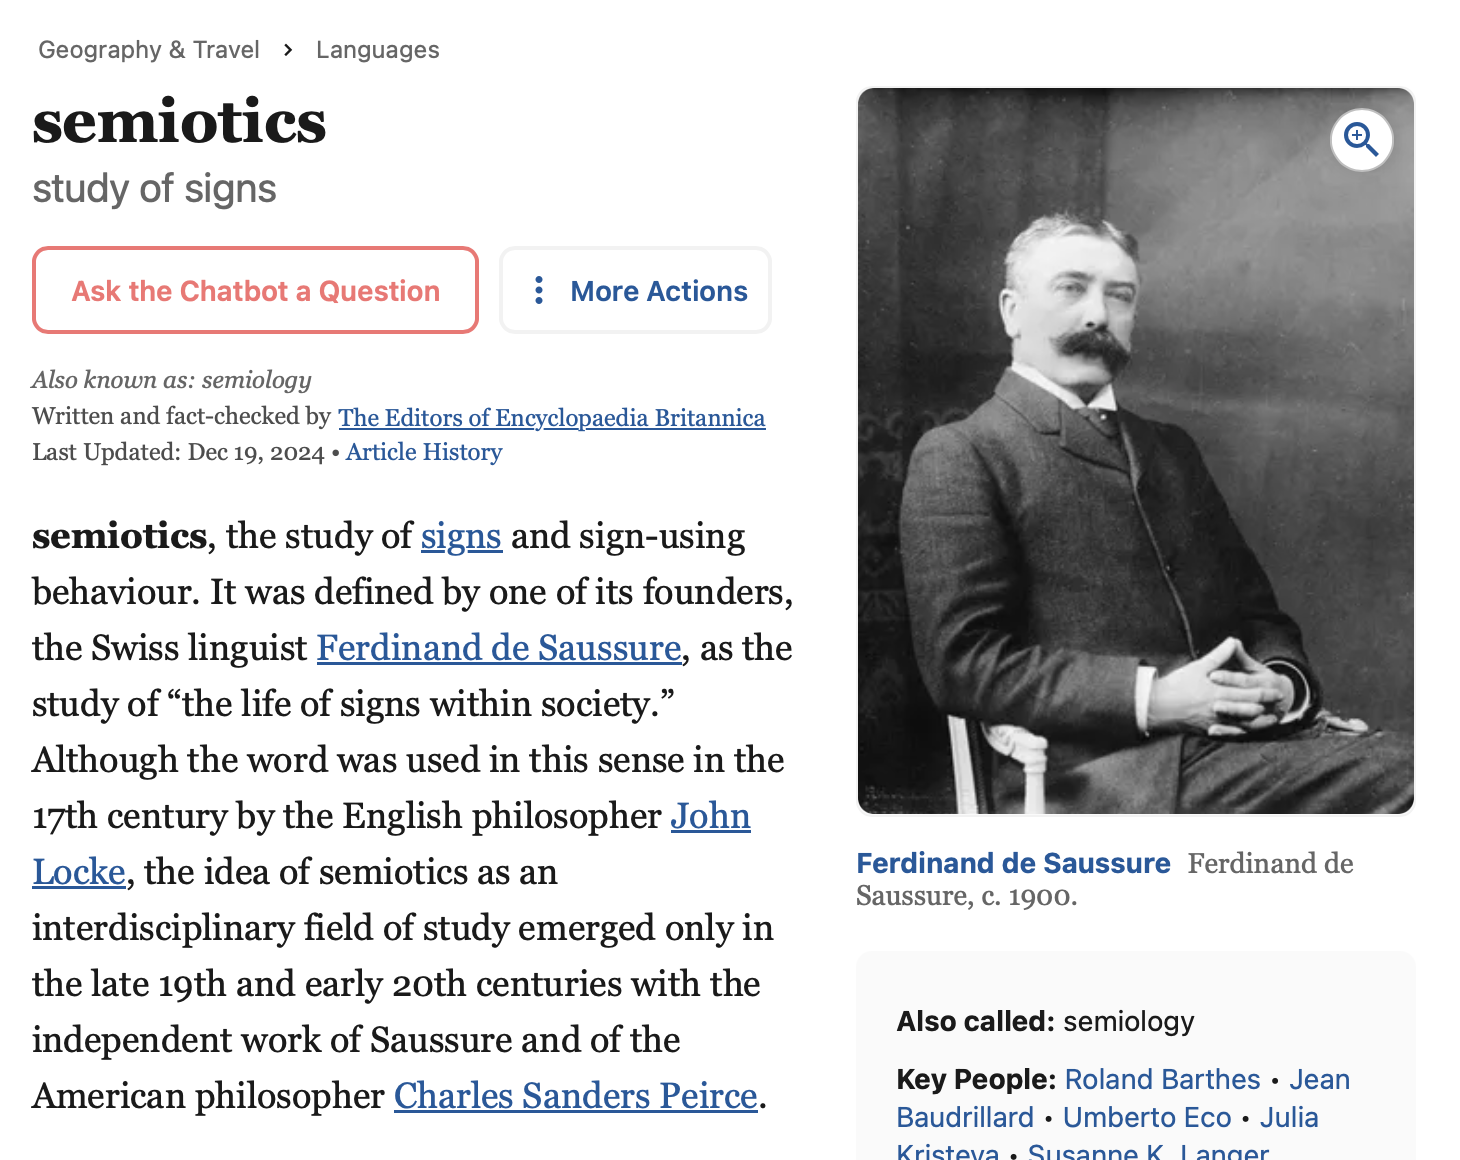
The Editors of Encyclopedia Britannica (2024)
The symbolic animal
Cassirer argues that the classic Aristotelian definition of the human being as a rational animal is wrong, or at least incomplete. Instead we should think of ourselves as “symbolic animals,” since ratiocination is only one expression of the human instinct to think in symbols. Kirsch (2021)
The communicating animal
- Communication as transmission of information
- From world
Communication
- From others (direct)
flowchart LR
  A[Me] --> B[You]
- From others (via some medium)
flowchart LR
  A[Me] --> B((Medium))
  B --> C[You]
Media
- Source of signs1
- Sign relation
- Sign (as a thing) –> Meaning
- Relation is arbitrary, defined by social convention (Sausurre)

“Font style interpolation with diffusion models” (n.d.)
Core qualities of sign systems
- Semantics
- Relations between signs –> meaning
- Syntax (grammar)
- Rules/conventions for arranging signs
Multiple input channels
- Acoustic
- Tactile
- Olfactory
- Visual
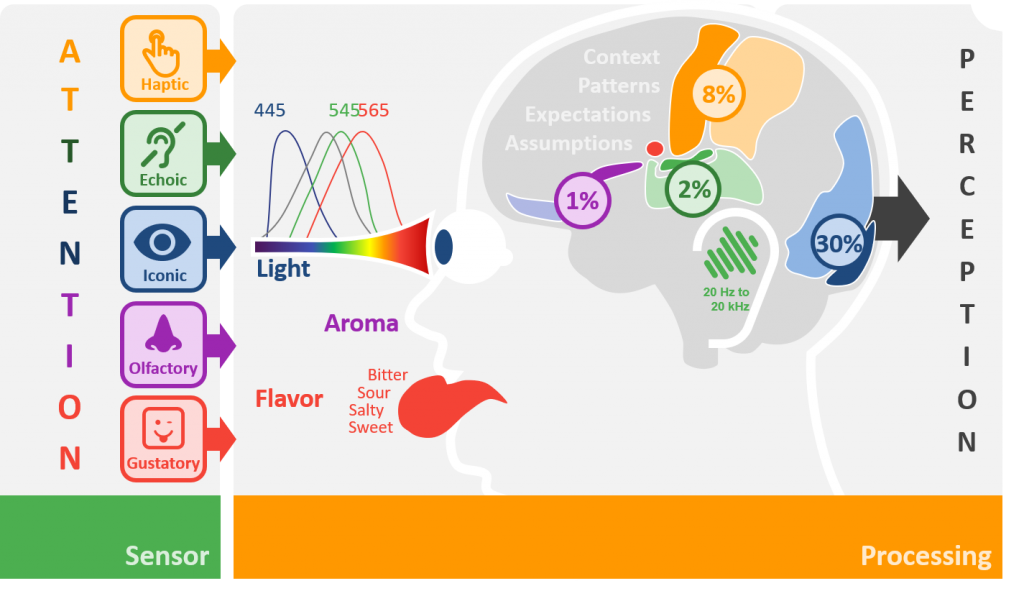
Vary in ‘meaningfulness’


Communication between minds
- Via signs and symbols
- Based on shared social conventions
- About sign relations (what signs “mean” or convey)
- Open vs. closed symbol systems
Sign systems can unite/inform or divide/confuse

Steiner (1998)
Sign system grammars
- \(2+2*3=4\) vs. \(2+(2*3)=4\)
- “Up with you I will not put.” vs. “I will not put up with you.”

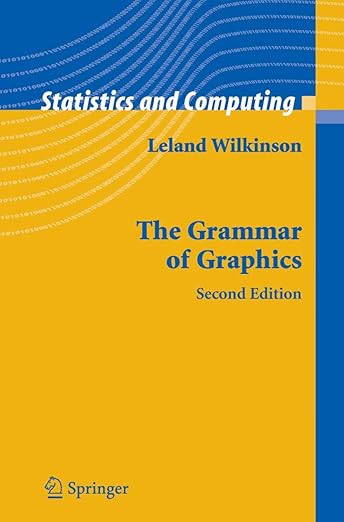
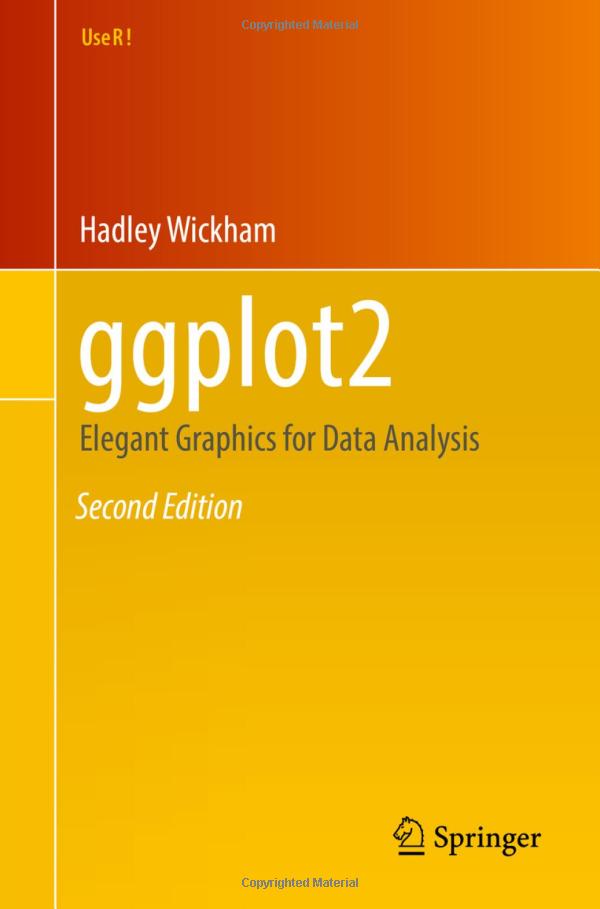
Grammar of Graphics
How scientists communicate (formally)
- Papers
- Posters
- Textbooks
- Websites
- Talks
Components of a scientific papers
- Text
- Explanation/argument
- Evidence (statistical summaries)
- Figures
- Tables
- Evidence (statistical summaries)
- References
- Data, materials
Questions about scientific communication
- What do the words mean?
- What do the numbers/statistics mean?
- What do the figures mean?
- Does the evidence (+ argument) persuade?
Semiotics/Semiology of Graphics

Bertin (2010)
Semiotics of data visualization
- What do the components mean?
- What message is the visualization creator trying to convey?
flowchart LR
  A((Person)) ---> B[Measure]
  F((Researcher)) ---> B
  F ---> A
  B ---> G(Text)
  B ---> C(Data)
  C ---> D[Statistics]
  C ---> E[Visualization]
flowchart LR
  C(Data) -.-> D[Statistics]
  C -.-> F
  C -.-> E[Visualization]
  E ---> A((Student))
  D ---> A
  A ---> A
  F[Text] ---> A
Warning
A semiotic perspective can be infectious and addictive.
Signs and sign systems are everywhere!
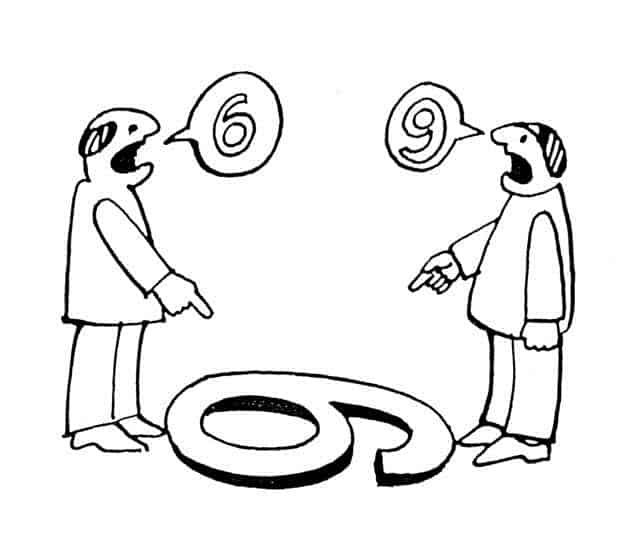
Semiotics of data visualization
- Semiotics: study of signs and symbols
- What meanings do the visual elements of data graphics convey?
- How do data visualizations relate to other communicative elements?
Visualization in psychological science
- Conventions (common patterns) in data visualization
- Different viz types for different psychological measures?
Next time
Visualization in government & business
Resources
References
Bertin, J. (2010). Semiology of graphics: Diagrams, networks, maps. Redlands, CA: ESRI Press.
Denton, C. A., Asphaug, E., Emsenhuber, A., & Melikyan, R. (2025). Capture of an ancient charon around pluto. Nature Geoscience, 18, 37–43. https://doi.org/10.1038/s41561-024-01612-0
Font style interpolation with diffusion models. (n.d.). Retrieved January 10, 2025, from https://arxiv.org/html/2402.14311v1
Kirsch, A. (2021, March 18). The symbolic animal. Retrieved January 10, 2025, from https://www.nybooks.com/articles/2021/04/08/ernst-cassirer-symbolic-animal/
Spence, I., & Wainer, H. (2017). William Playfair and the invention of statistical graphs. In Information design (1st Edition, pp. 59–76). Routledge. https://doi.org/10.4324/9781315585680-10
Steiner, G. (1998). After babel: Aspects of language and translation (3rd ed.). London, England: Oxford University Press. Retrieved from https://www.amazon.com/After-Babel-Aspects-Language-Translation/dp/0192880934
The Editors of Encyclopedia Britannica. (2024, December 19). Semiotics. In Encyclopedia britannica. Retrieved from https://www.britannica.com/science/semiotics
Wickham, H., Navarro, D., & Pedersen, T. L. (n.d.). ggplot2: Elegant graphics for data analysis (3e). Retrieved January 12, 2025, from https://ggplot2-book.org/
Wilkinson, L., Wills, D., Rope, D., Norton, A., & Dubbs, R. (2005). The grammar of graphics (statistics and computing) (2nd edition). Springer. Retrieved from https://www.amazon.com/Grammar-Graphics-Statistics-Computing/dp/0387245448
