From sensation to perception
2025-02-13
Wade (2015)
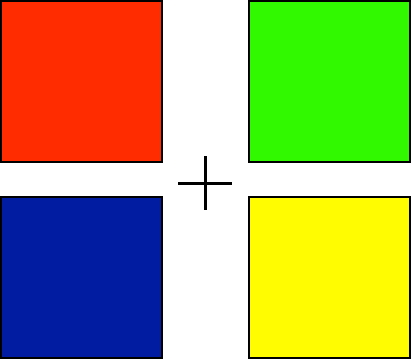
Color perception
- Perceived color a function of activity in “R”, “G”, and “B” photoreceptors

Source: Wikipedia
Wavelengths are continuous, but are perceived colors?
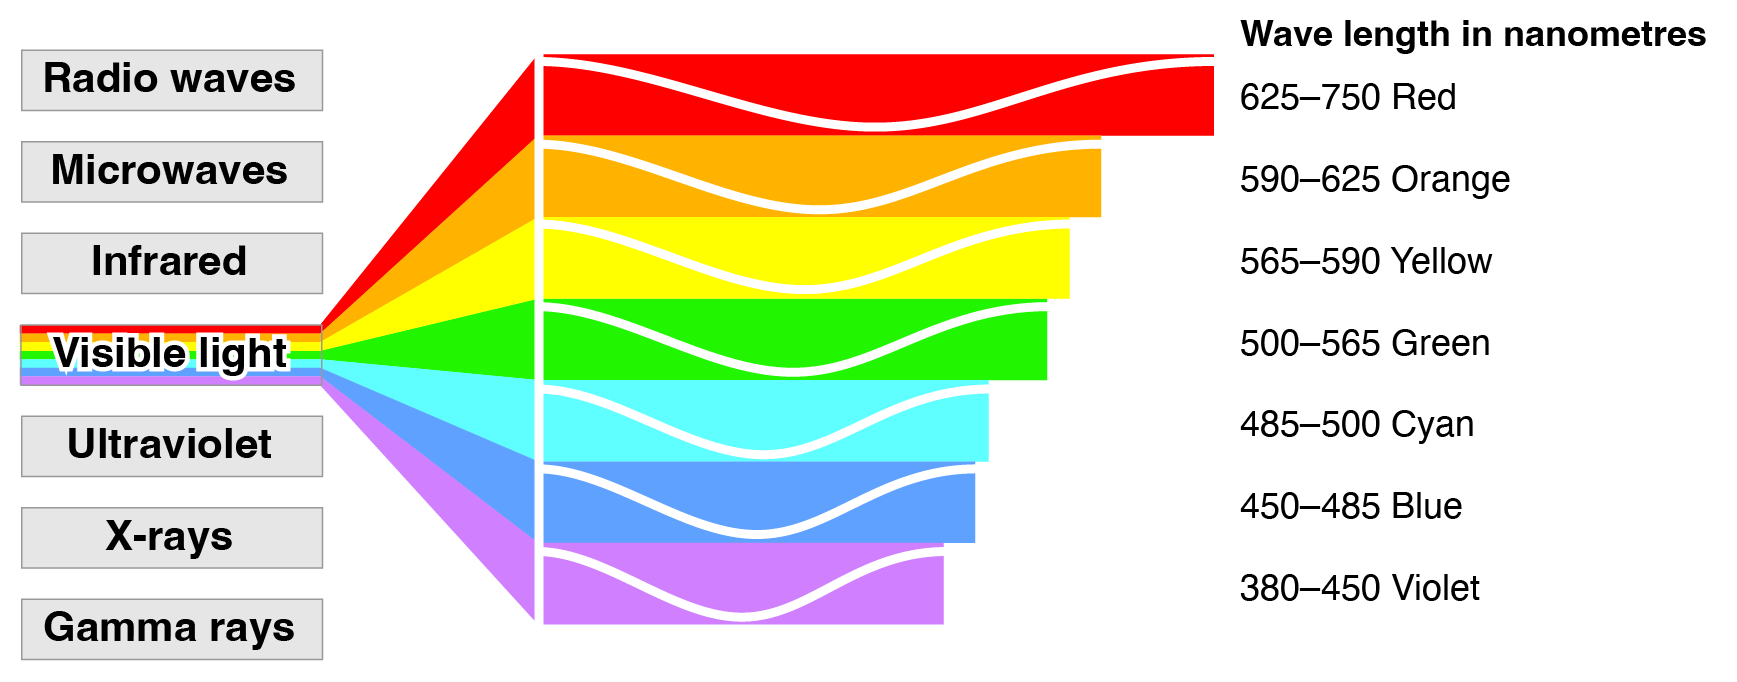
https://rmit.pressbooks.pub/colourtheory1/part/2-colour-theory-the-visible-spectrum/
Perceived colors seem ordinal, but…

- Color is a neuropsychological construct
What’s a reddish-green look like?
Explanation
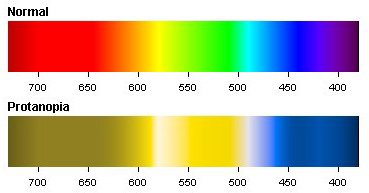
Color vision anomalies
- Absence of or anomalies in photoreceptors
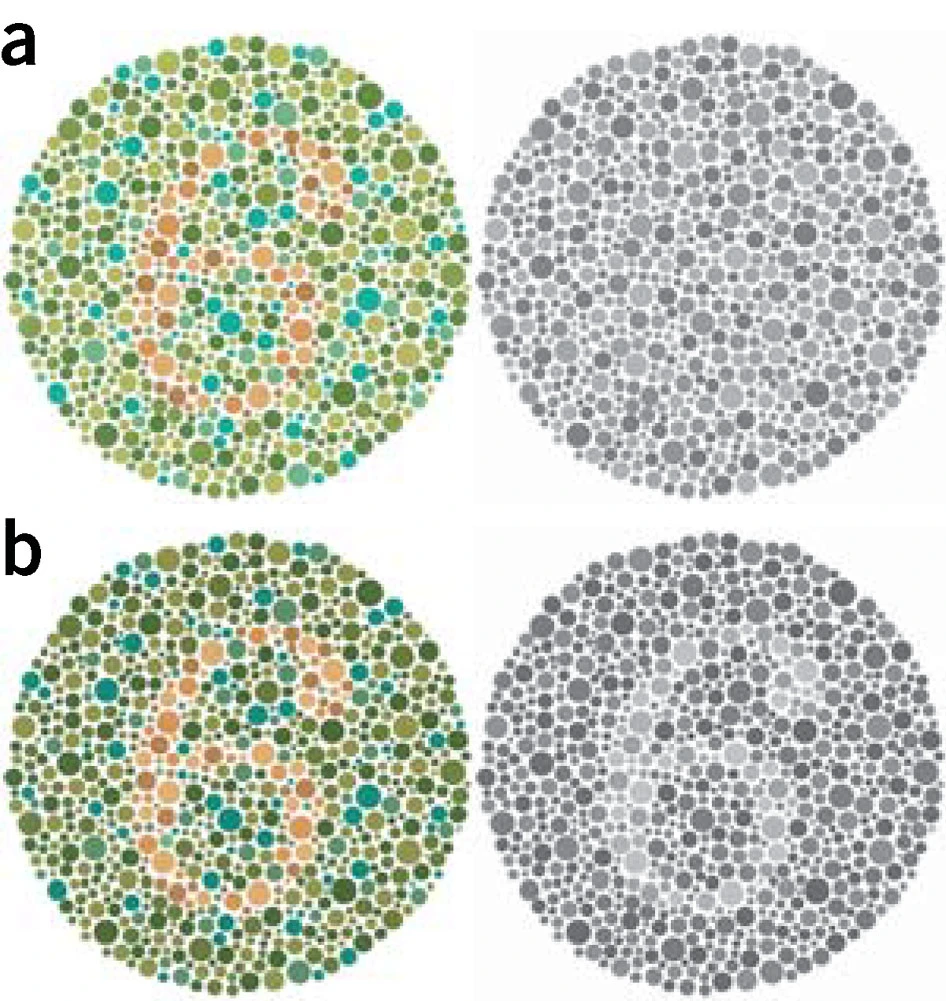
Wong (2011) Figure 1
Types
- Protanopia (impaired R/long wavelength)
- Deuteranopia (impaired G/medium wavelength)
- Tritanopia (impaired B/short wavelength)
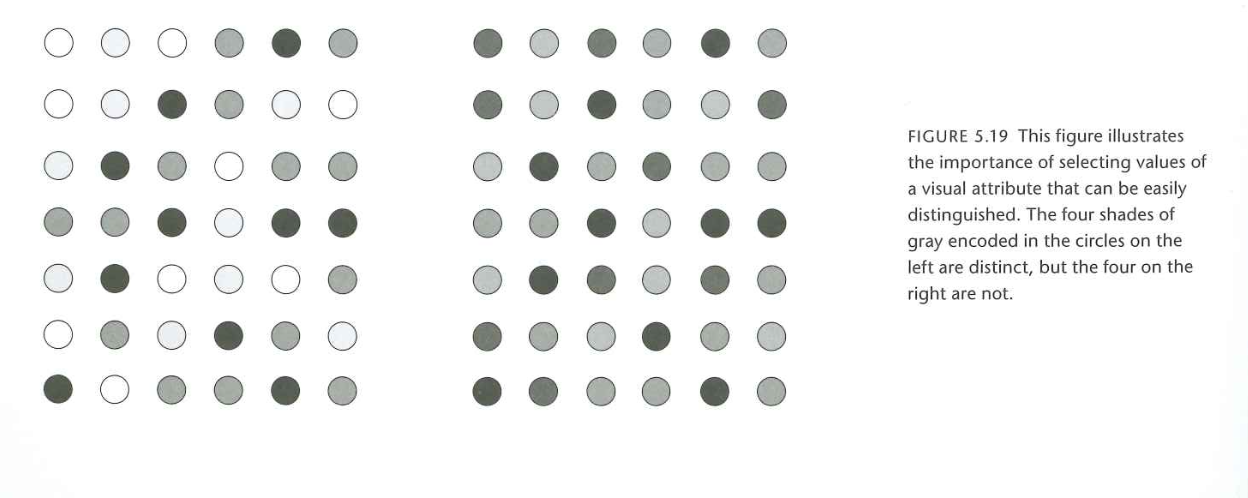
Color palettes
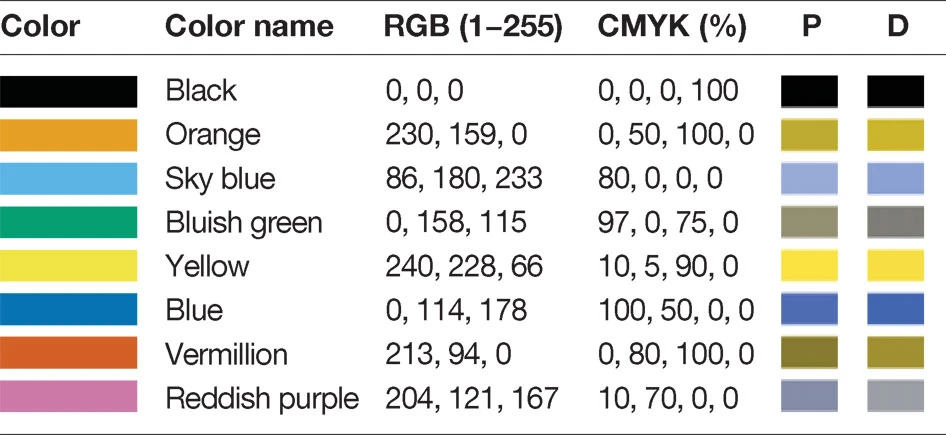
Wong (2011) Figure 2
Visual brains love differences
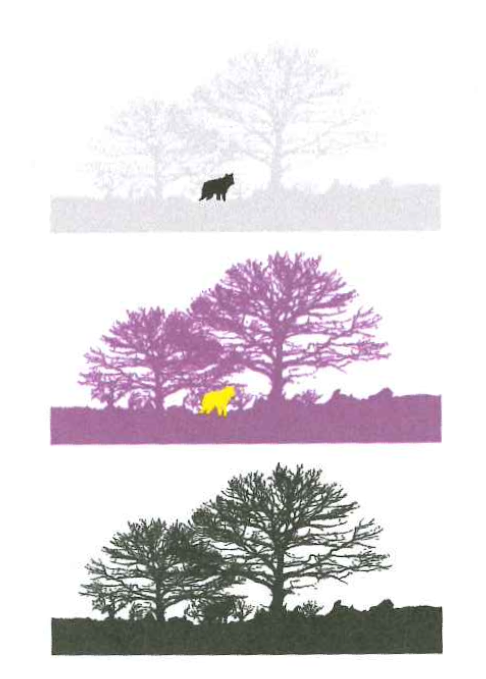
Figure 6.1 Cairo (2013)

Kahneman (2013)
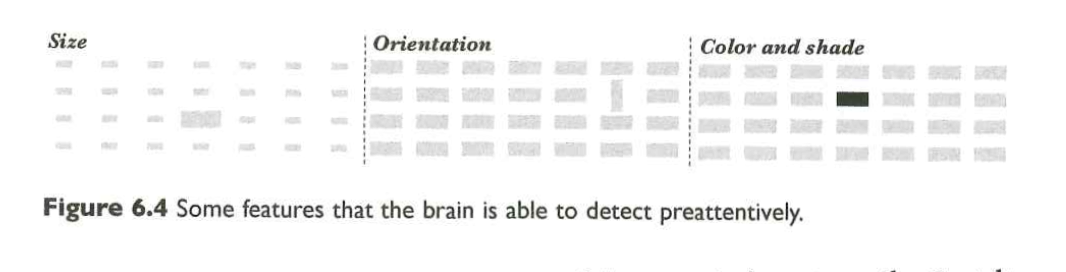
Figure 6.4 Cairo (2013)
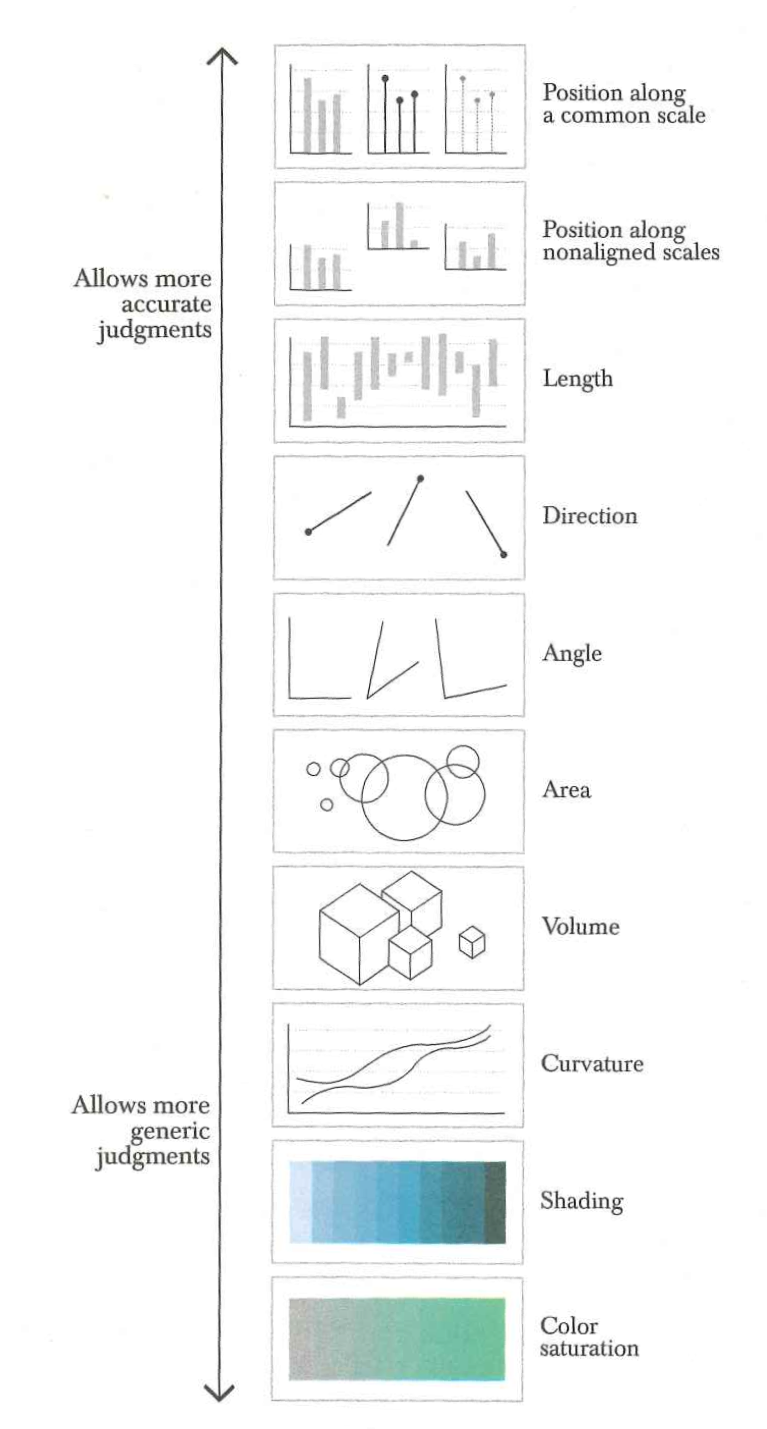
Some features easier/faster to judge
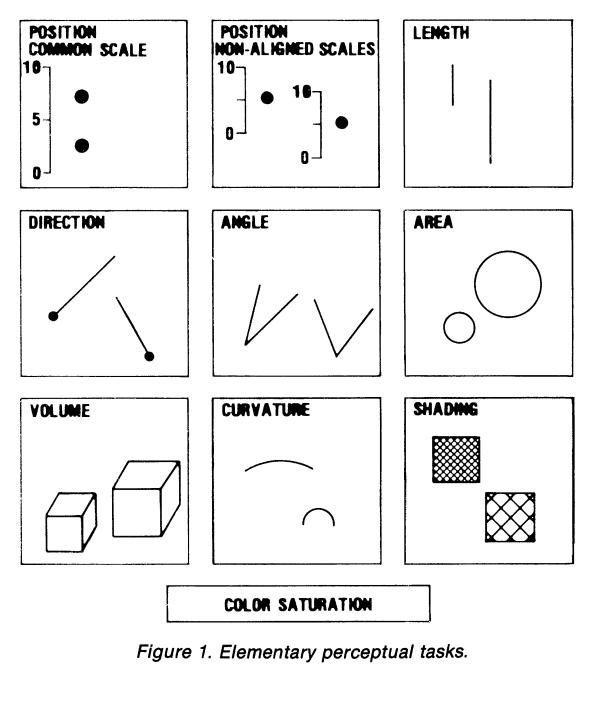
Figure 1 Cleveland & McGill (1984)
Reification
- Perception is constructive

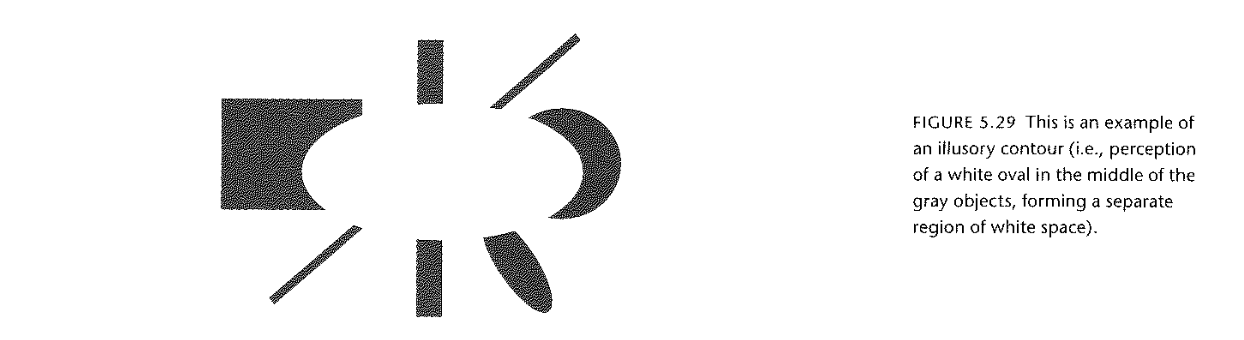
Figure 5.29 Few (2004)
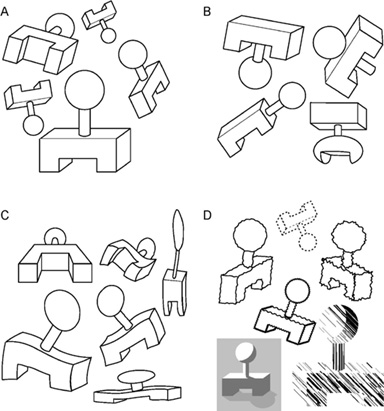
Multistability
- Perception is multistable

Invariance
- And yet…
- Perception is invariant
Proximity

https://en.wikipedia.org/wiki/Gestalt_psychology
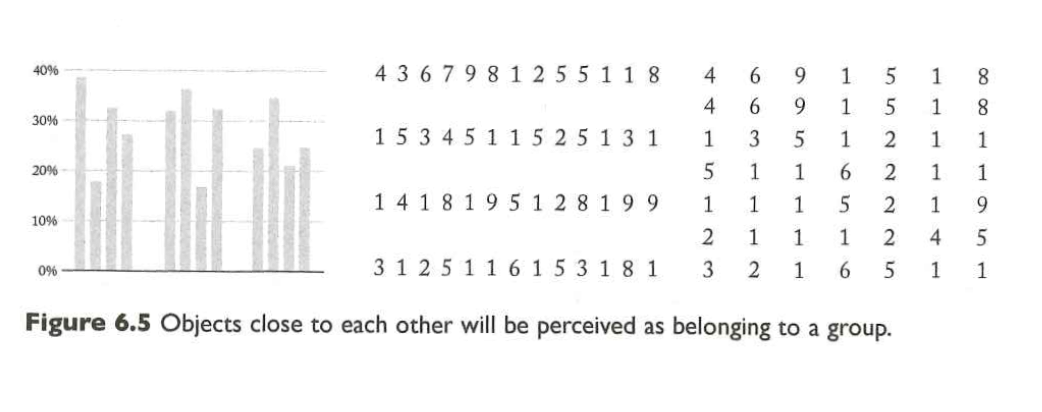
Figure 6.5 Cairo (2013)
Similarity

https://en.wikipedia.org/wiki/Gestalt_psychology
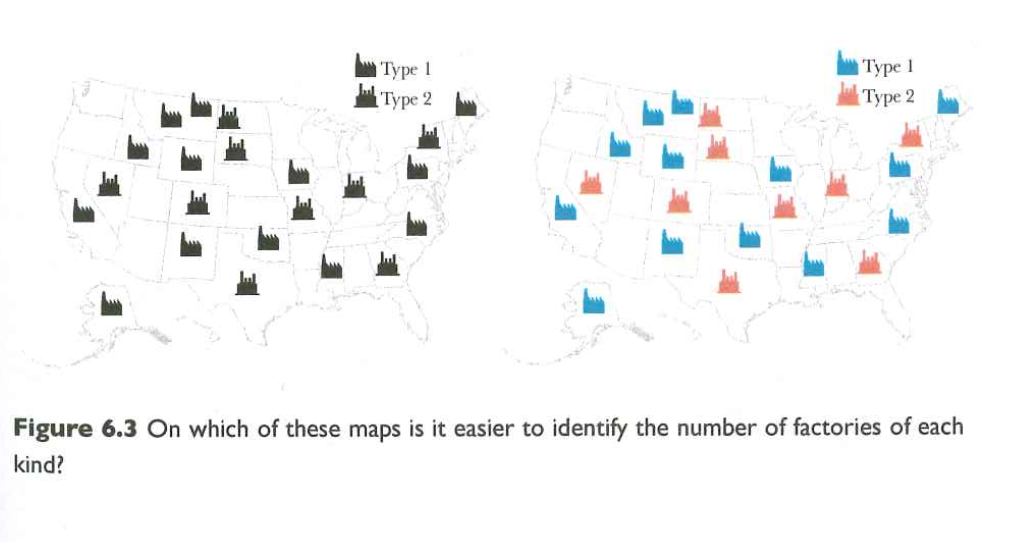
Figure 6.3 Cairo (2013)
Similar but not too similar
Closure

https://en.wikipedia.org/wiki/Gestalt_psychology
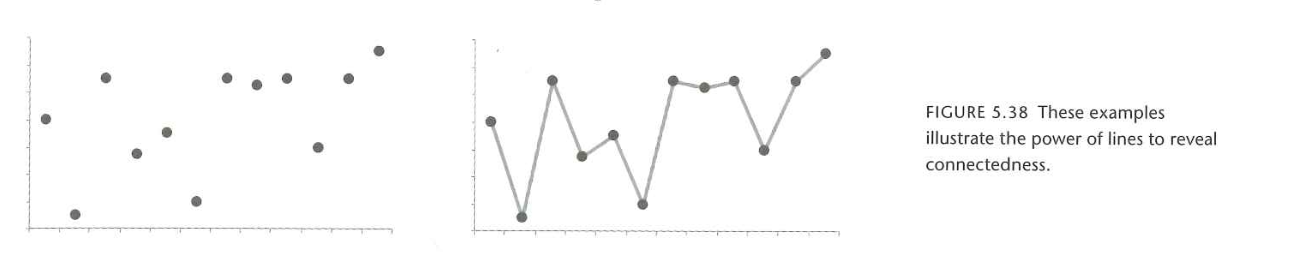
Continuity

https://en.wikipedia.org/wiki/Gestalt_psychology
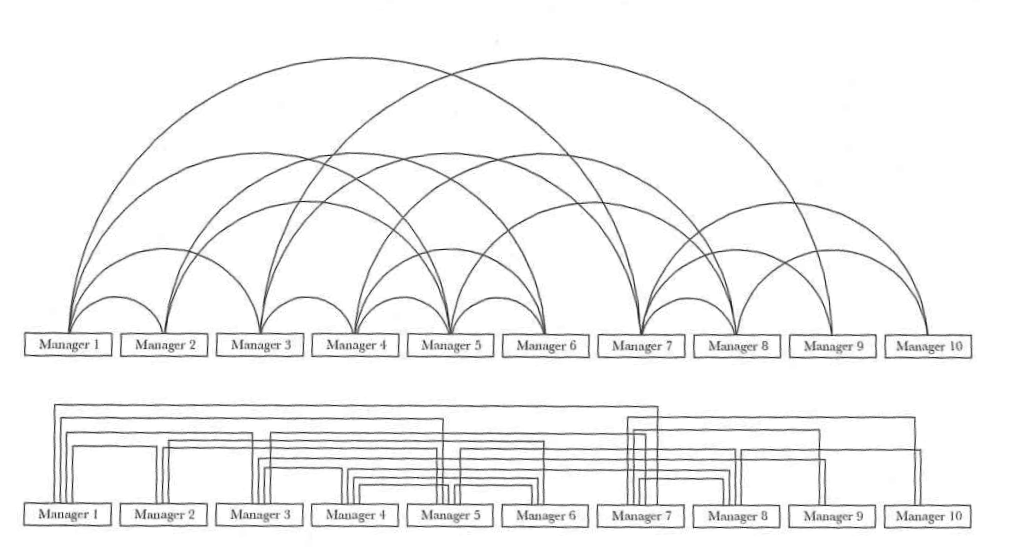
Figure 6.9 Cairo (2013)
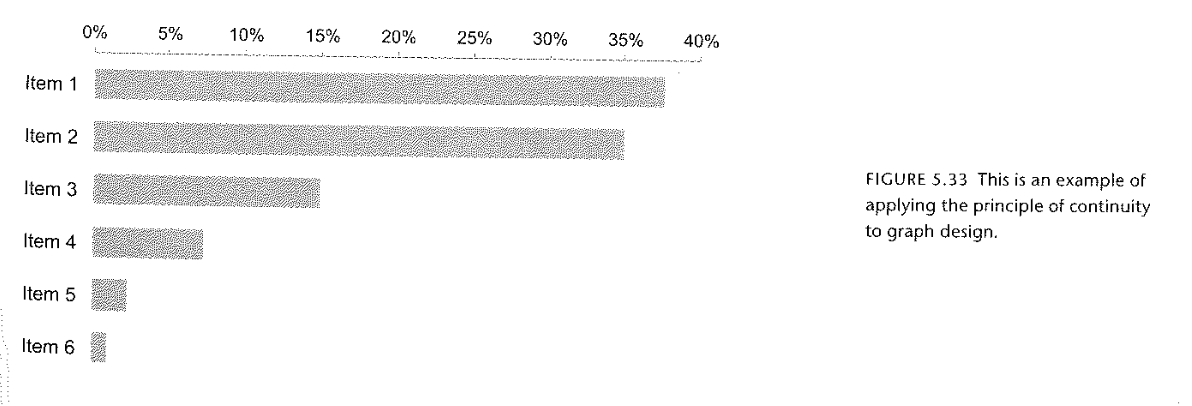
Figure 5.33 Few (2004)
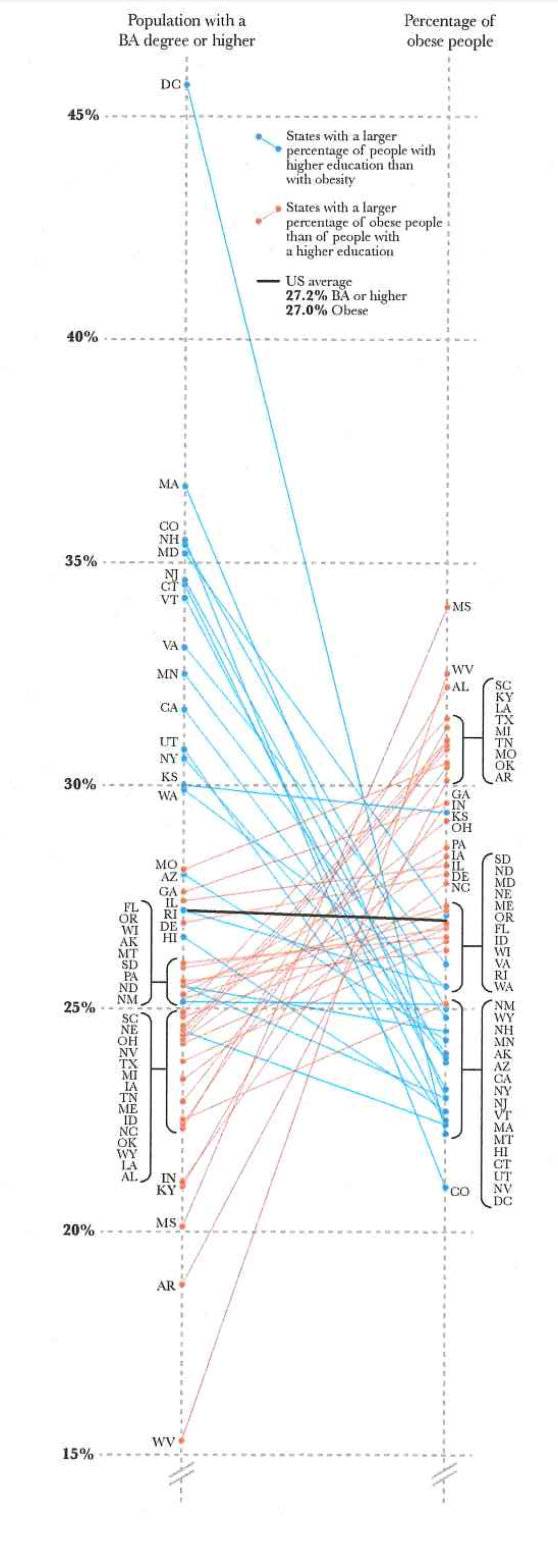
Connectedness
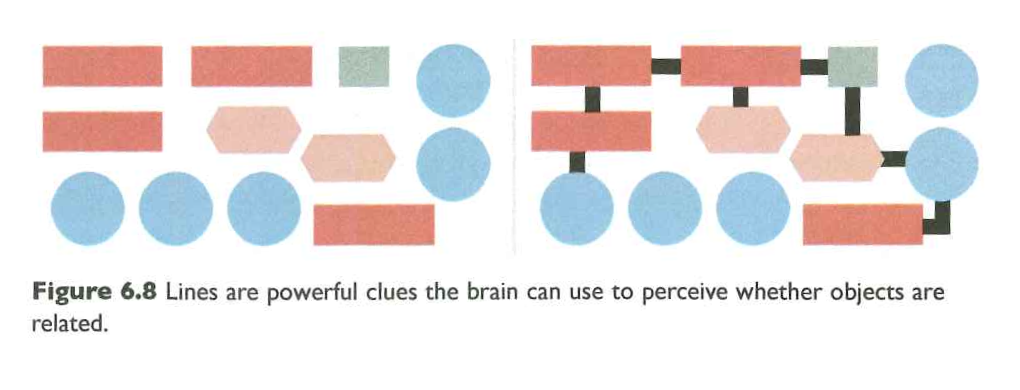
Figure 6.8 Cairo (2013)
Few (2004)
Symmetry
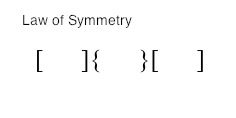
https://en.wikipedia.org/wiki/Gestalt_psychology
Putting it all together