From cognition to understanding
2025-02-18
From specific to general
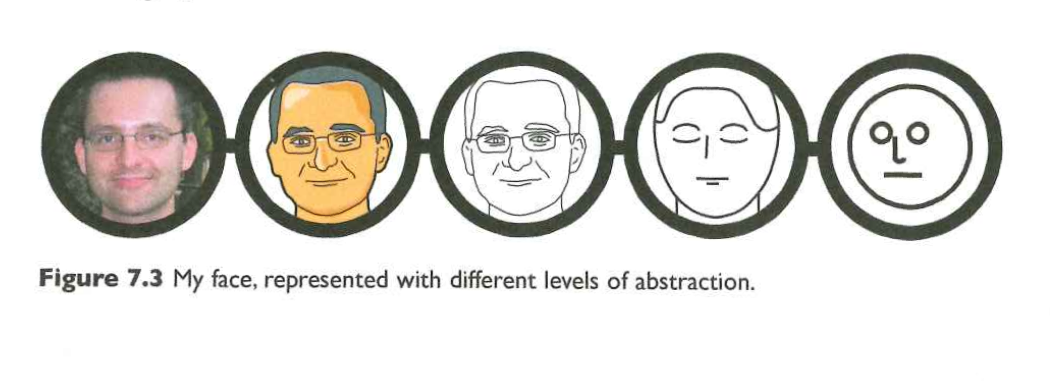
Figure 7.3 from Cairo (2013)
Bottom-up and top-down
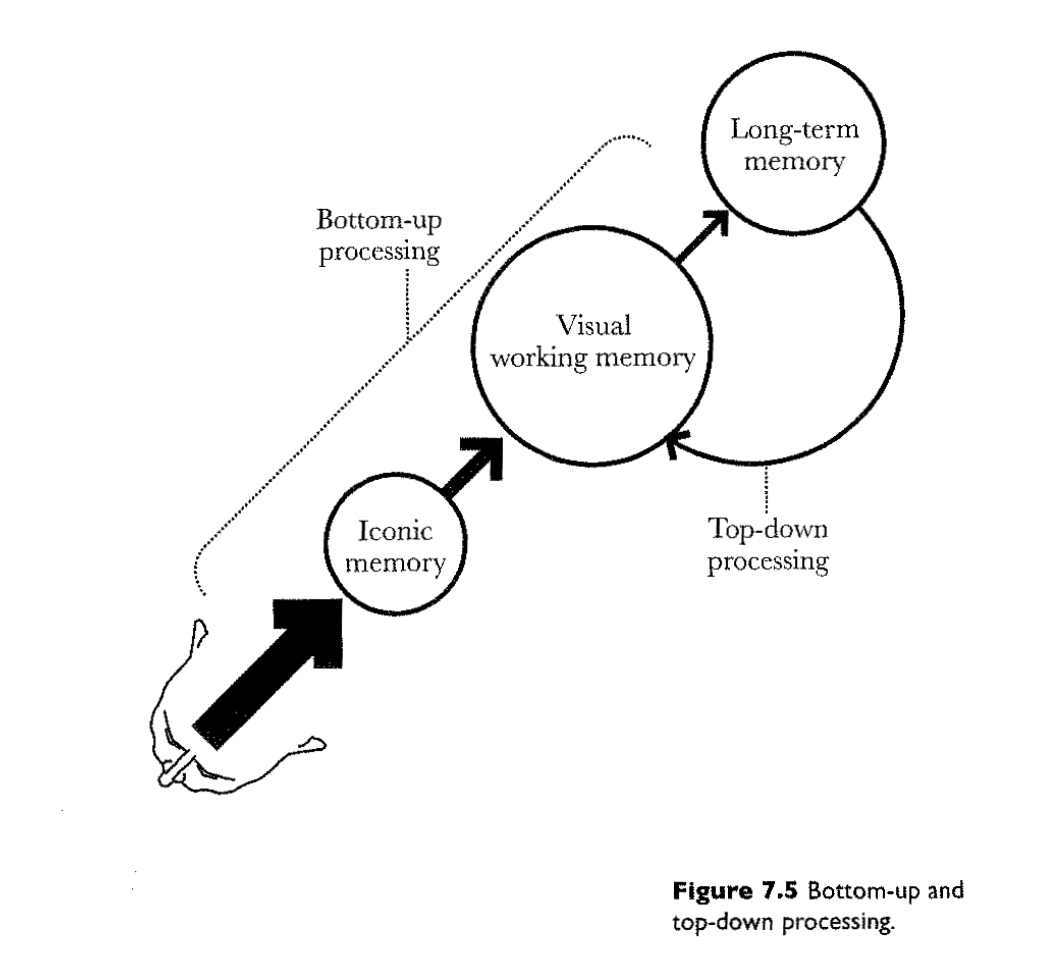
Figure 7.5 from Cairo (2013)
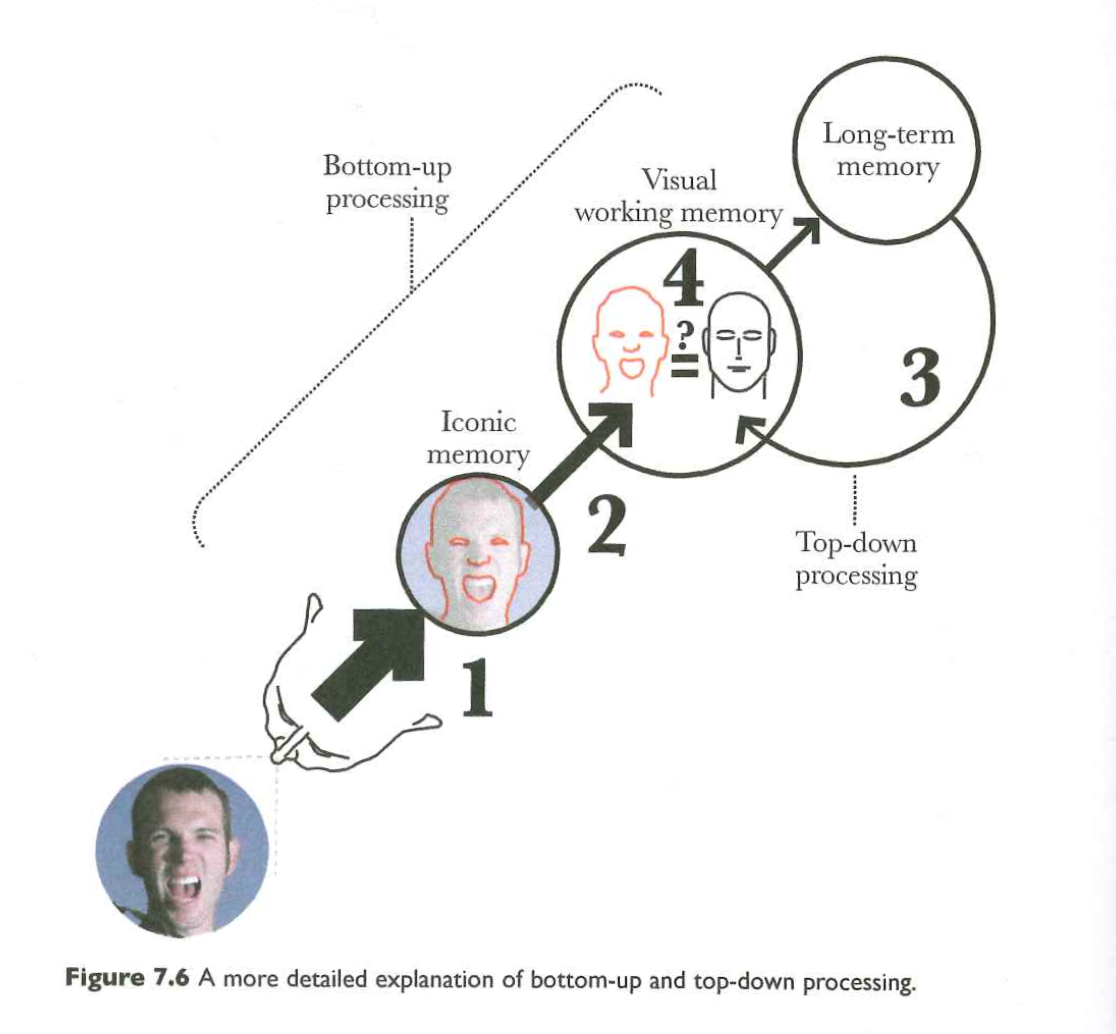
Figure 7.6 from Cairo (2013)

How large is the memory bank?
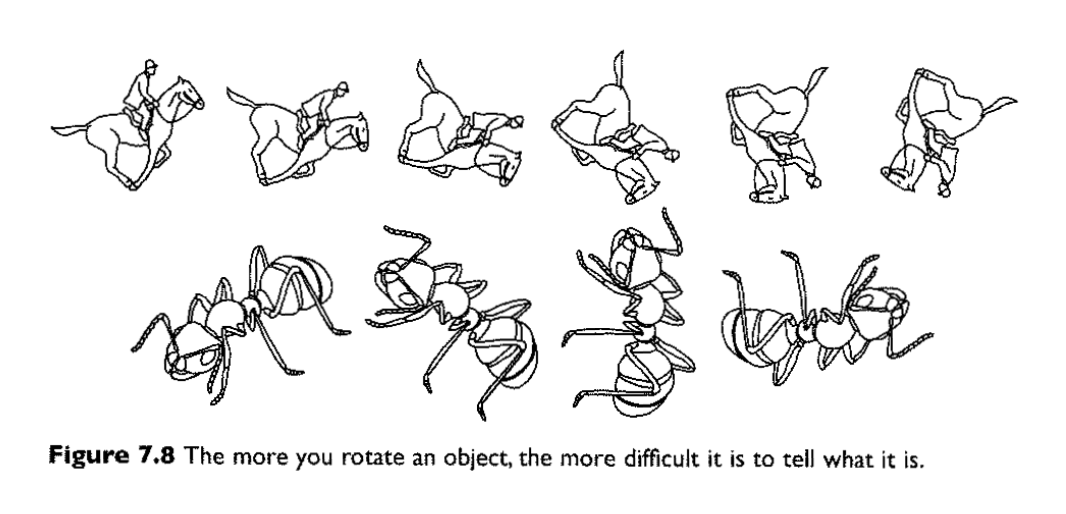
Figure 7.8 from Cairo (2013)
When less detail > more
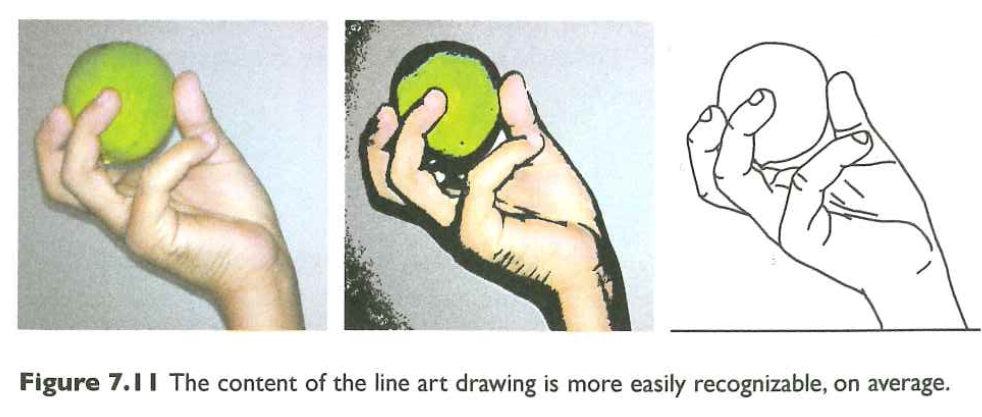
Figure 7.11 from Cairo (2013)
Abstraction to the rescue
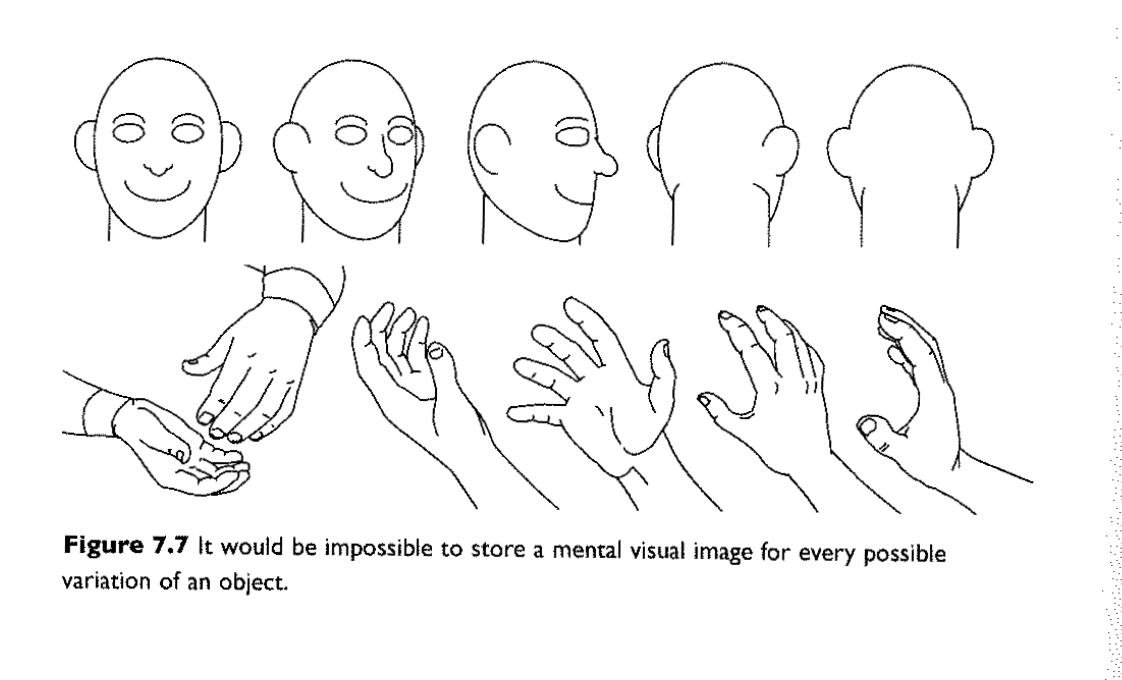
Figure 7.7 from Cairo (2013)
Some parts > others
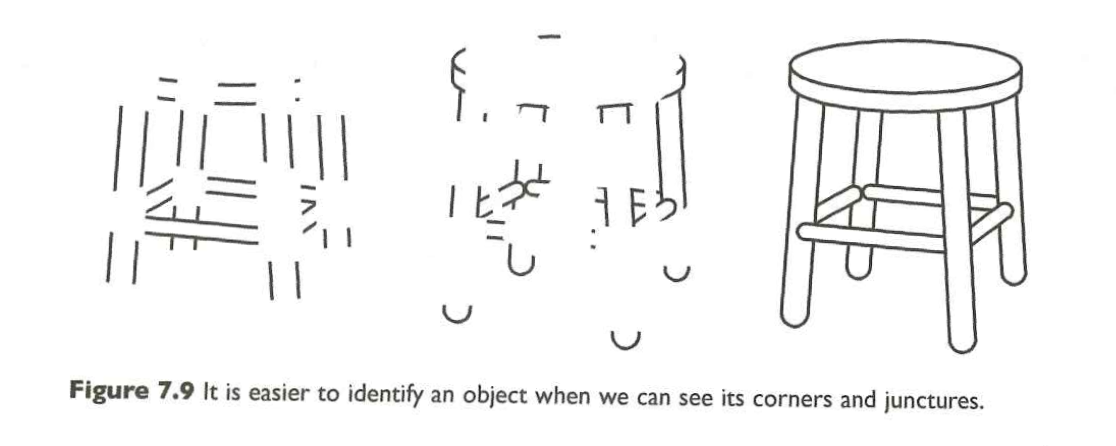
Figure 7.9 from Cairo (2013)

“The Datasaurus dozen - same stats, different graphs | Autodesk Research” (n.d.); Matejka & Fitzmaurice (2017)
“The Datasaurus dozen - same stats, different graphs | Autodesk Research” (n.d.); Matejka & Fitzmaurice (2017)

Figure 2 from Franconeri et al. (2021)

Figure 3 from Franconeri et al. (2021)

Scientific norms (Merton, 1973)
- Communalism (common ownership)
- Universalism (independent validity)
- Disinterestedness (public benefit)
- Organized skepticism (scrutinize everything)
Merton (1973)
The mores of science possess a methodologic rationale…They are procedurally efficent…

Discover more, faster…
Feynman (1974)
“The first principle is that you must not fool yourself—and you are the easiest person to fool. So you have to be very careful about that…”


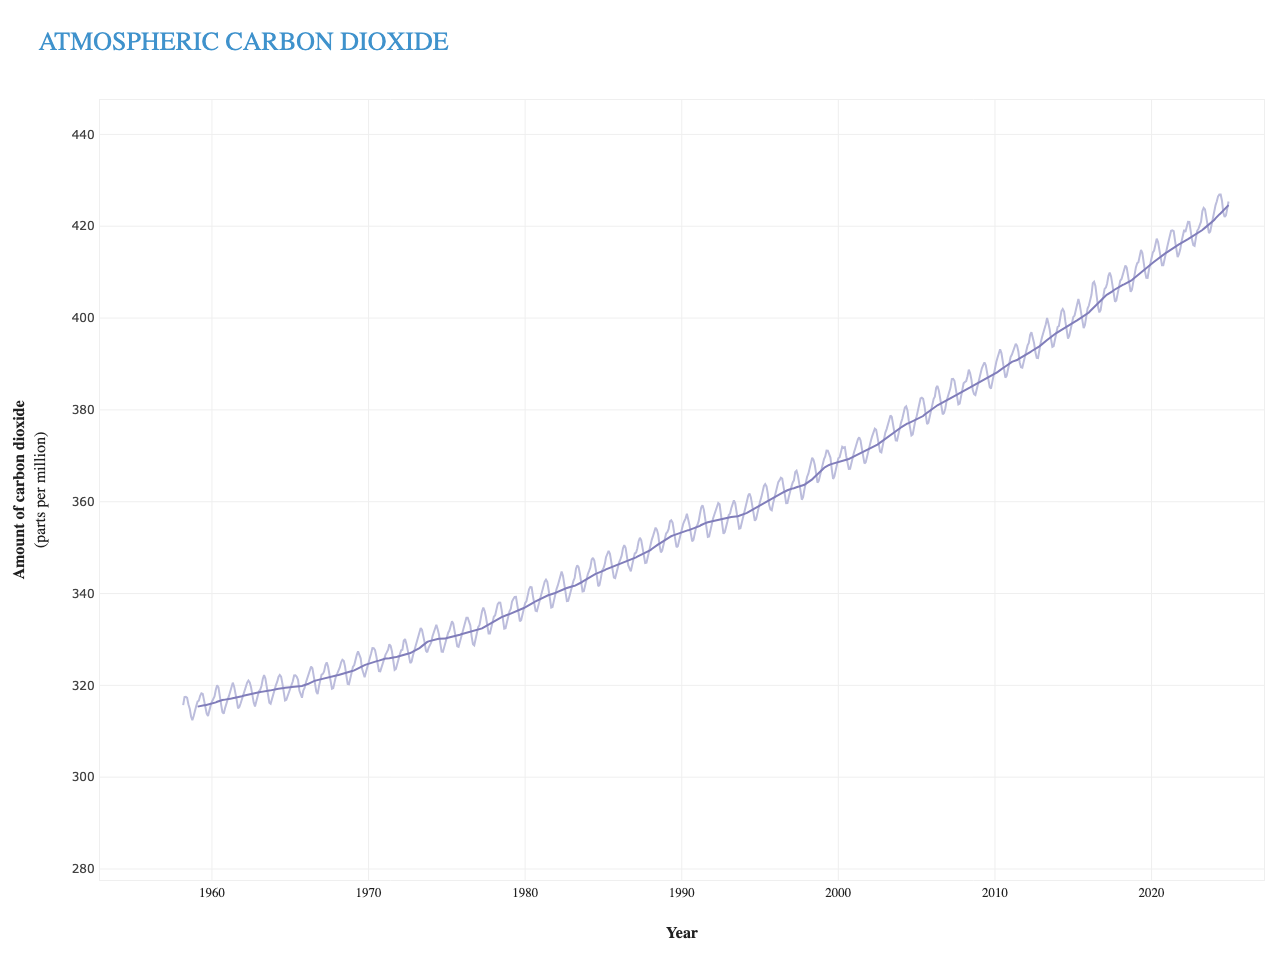
Lindsey (2024)
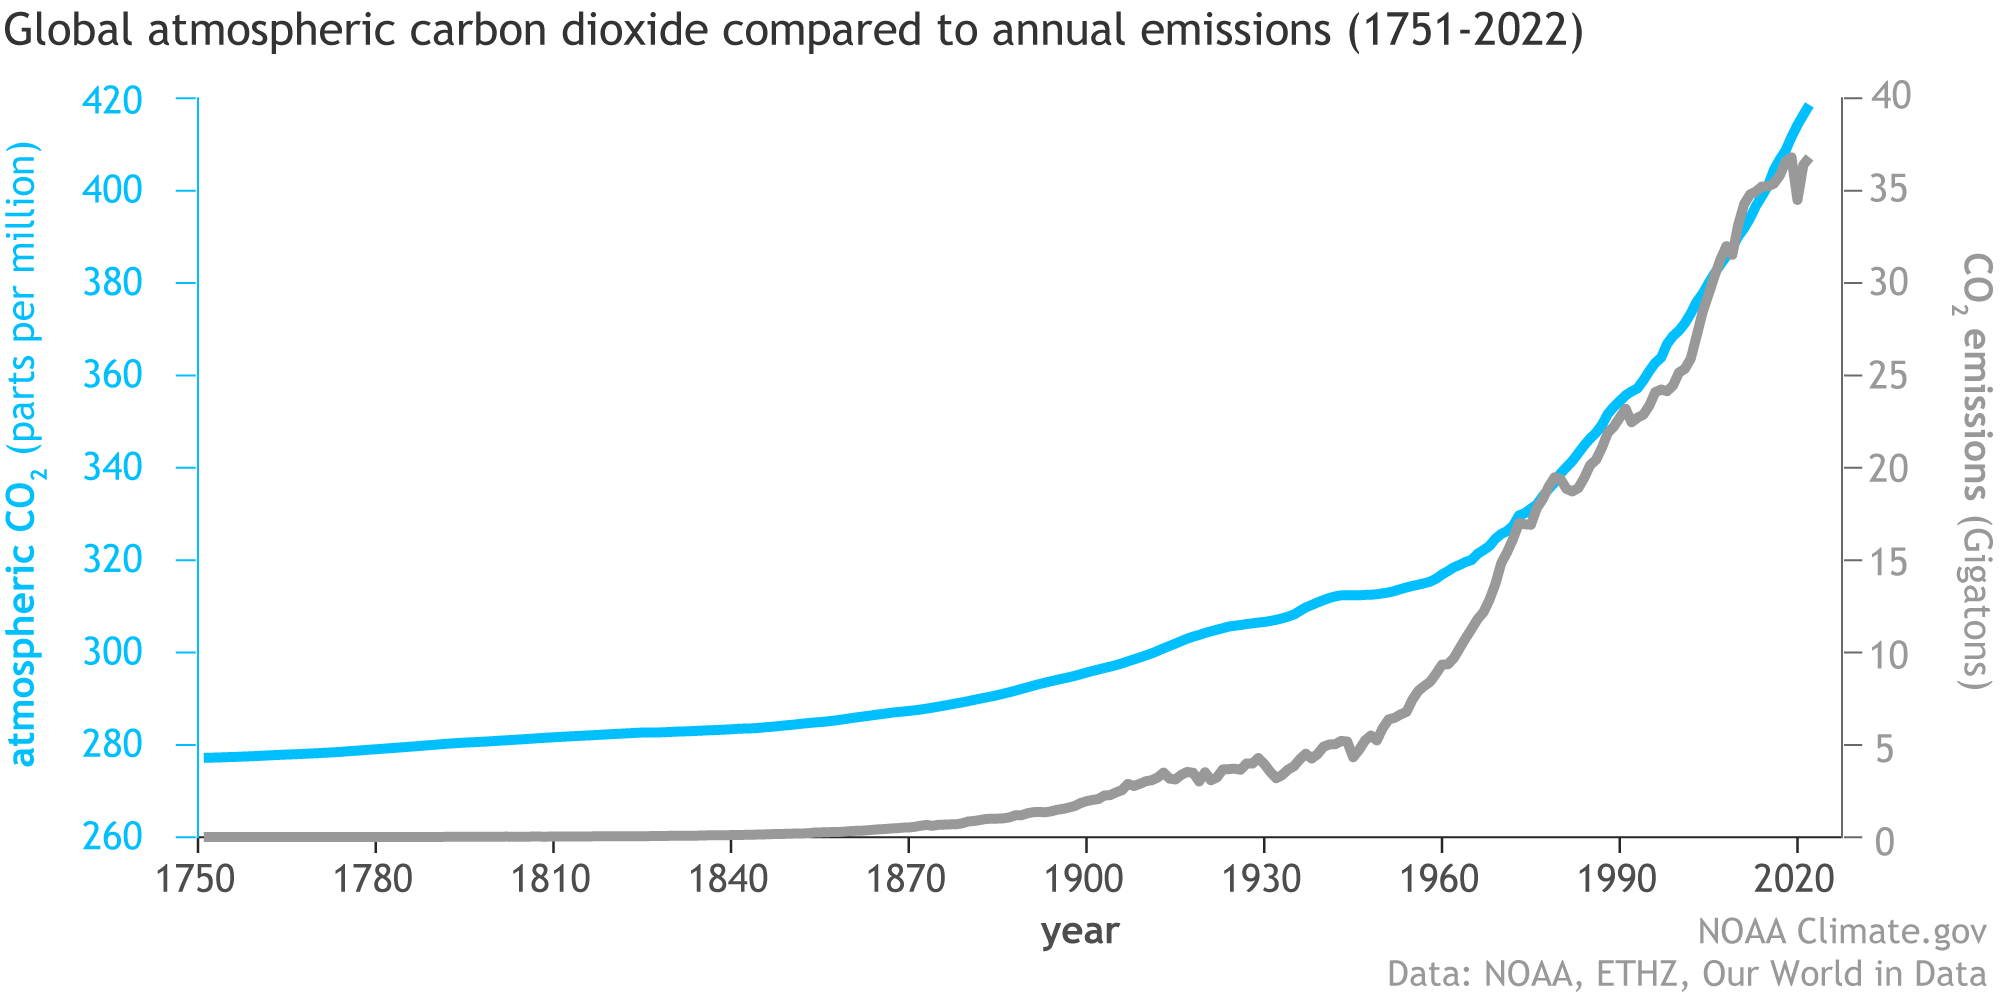
Lindsey (2024)
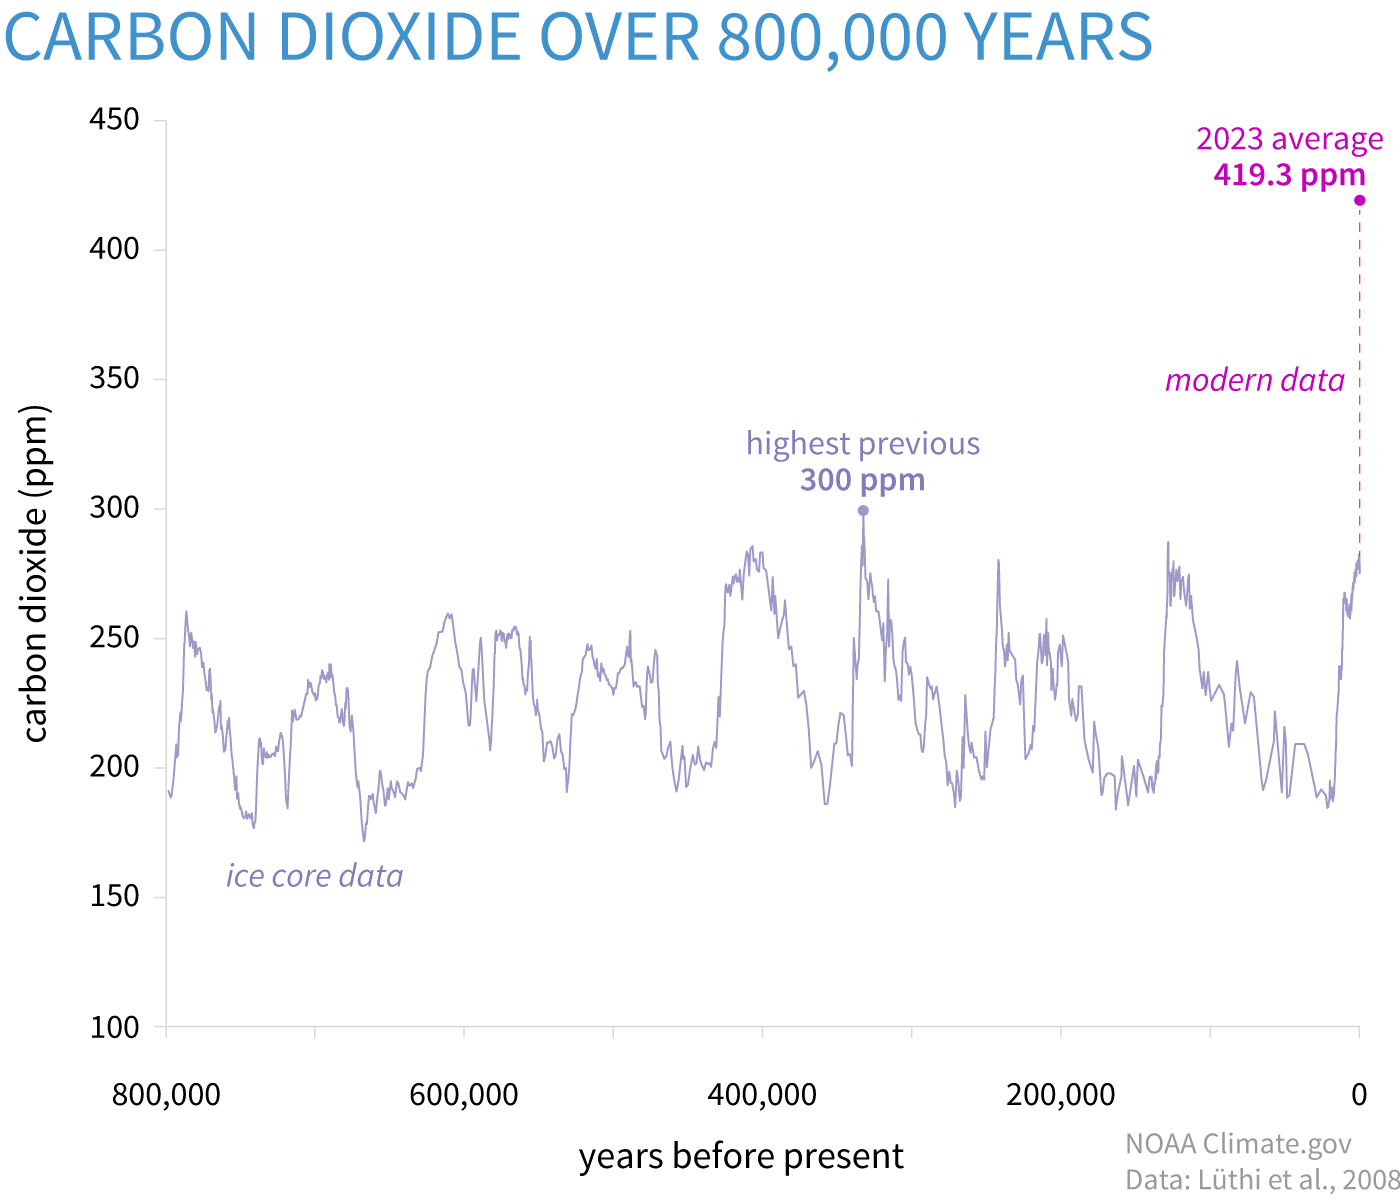
Lindsey (2024)
Lindsey (2024)
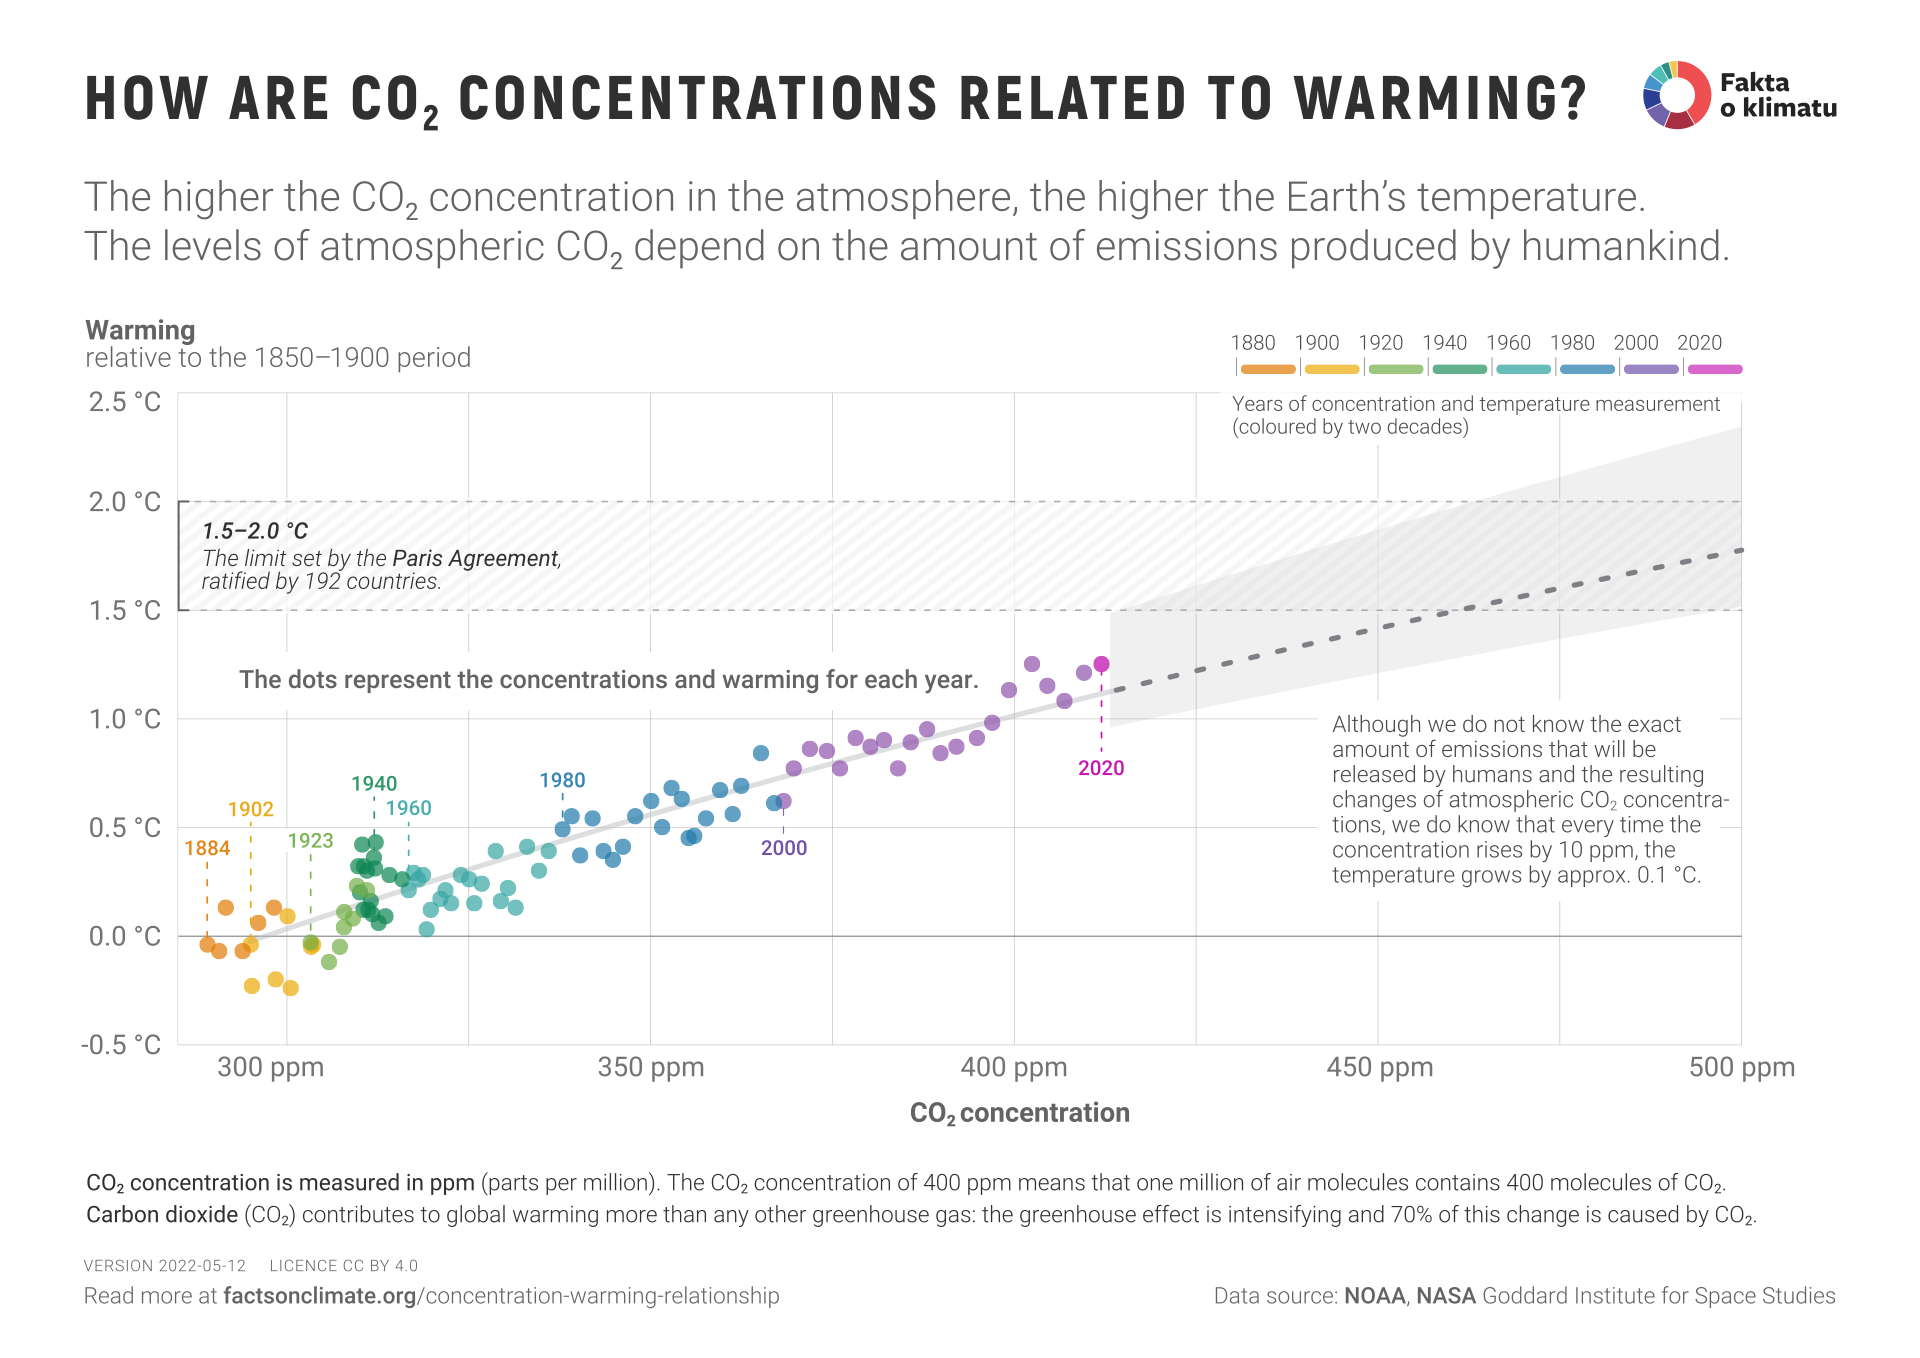
How are CO₂ concentrations related to warming? infographic by Fakta o klimatu, licensed under CC BY 4.0.
The U.S. is only one country
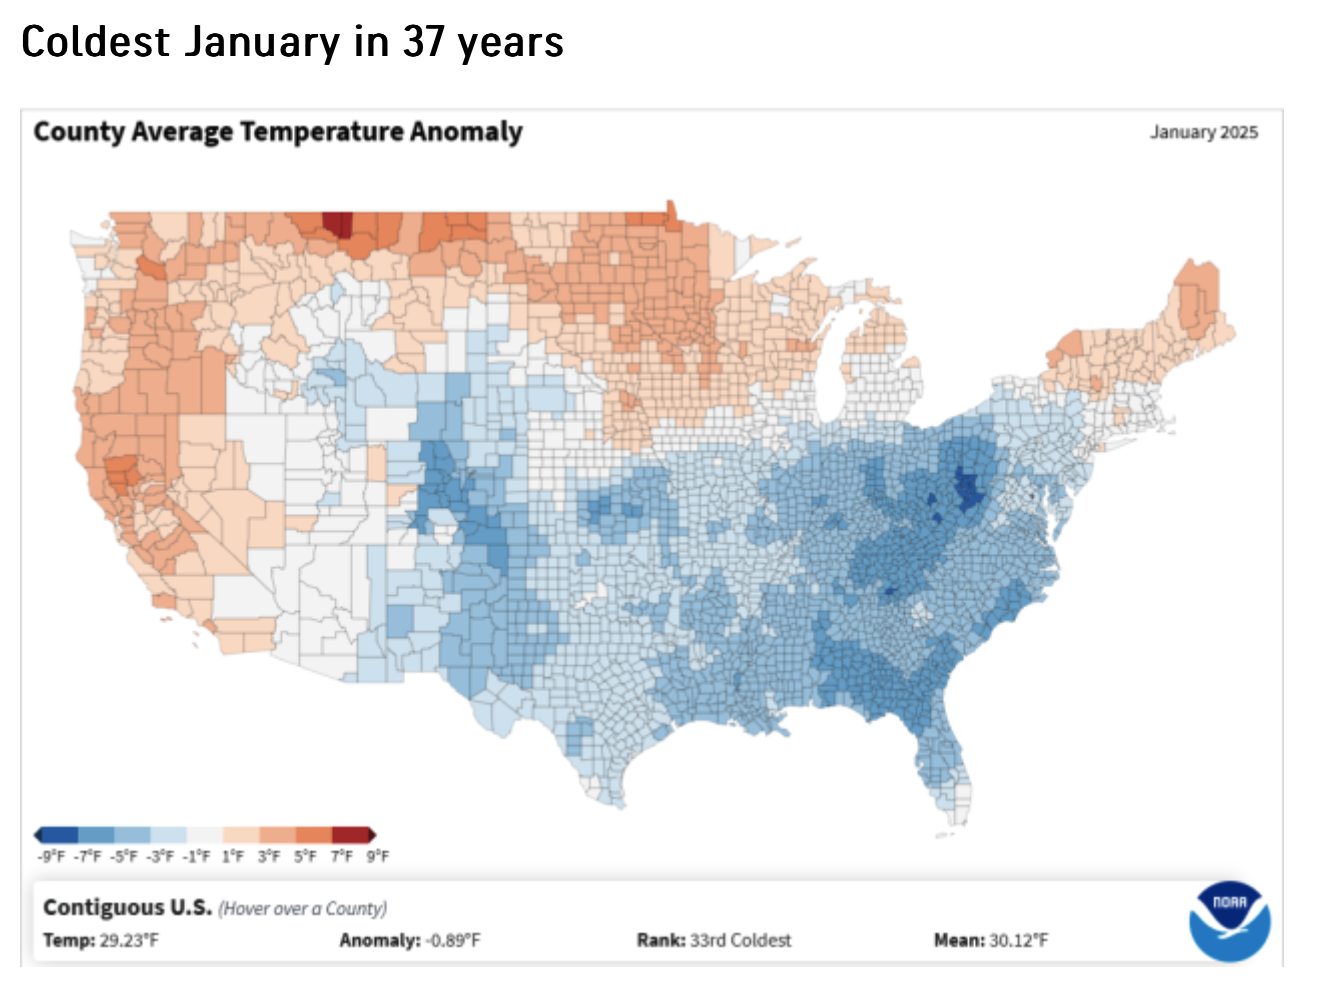
Ferrell (2025)
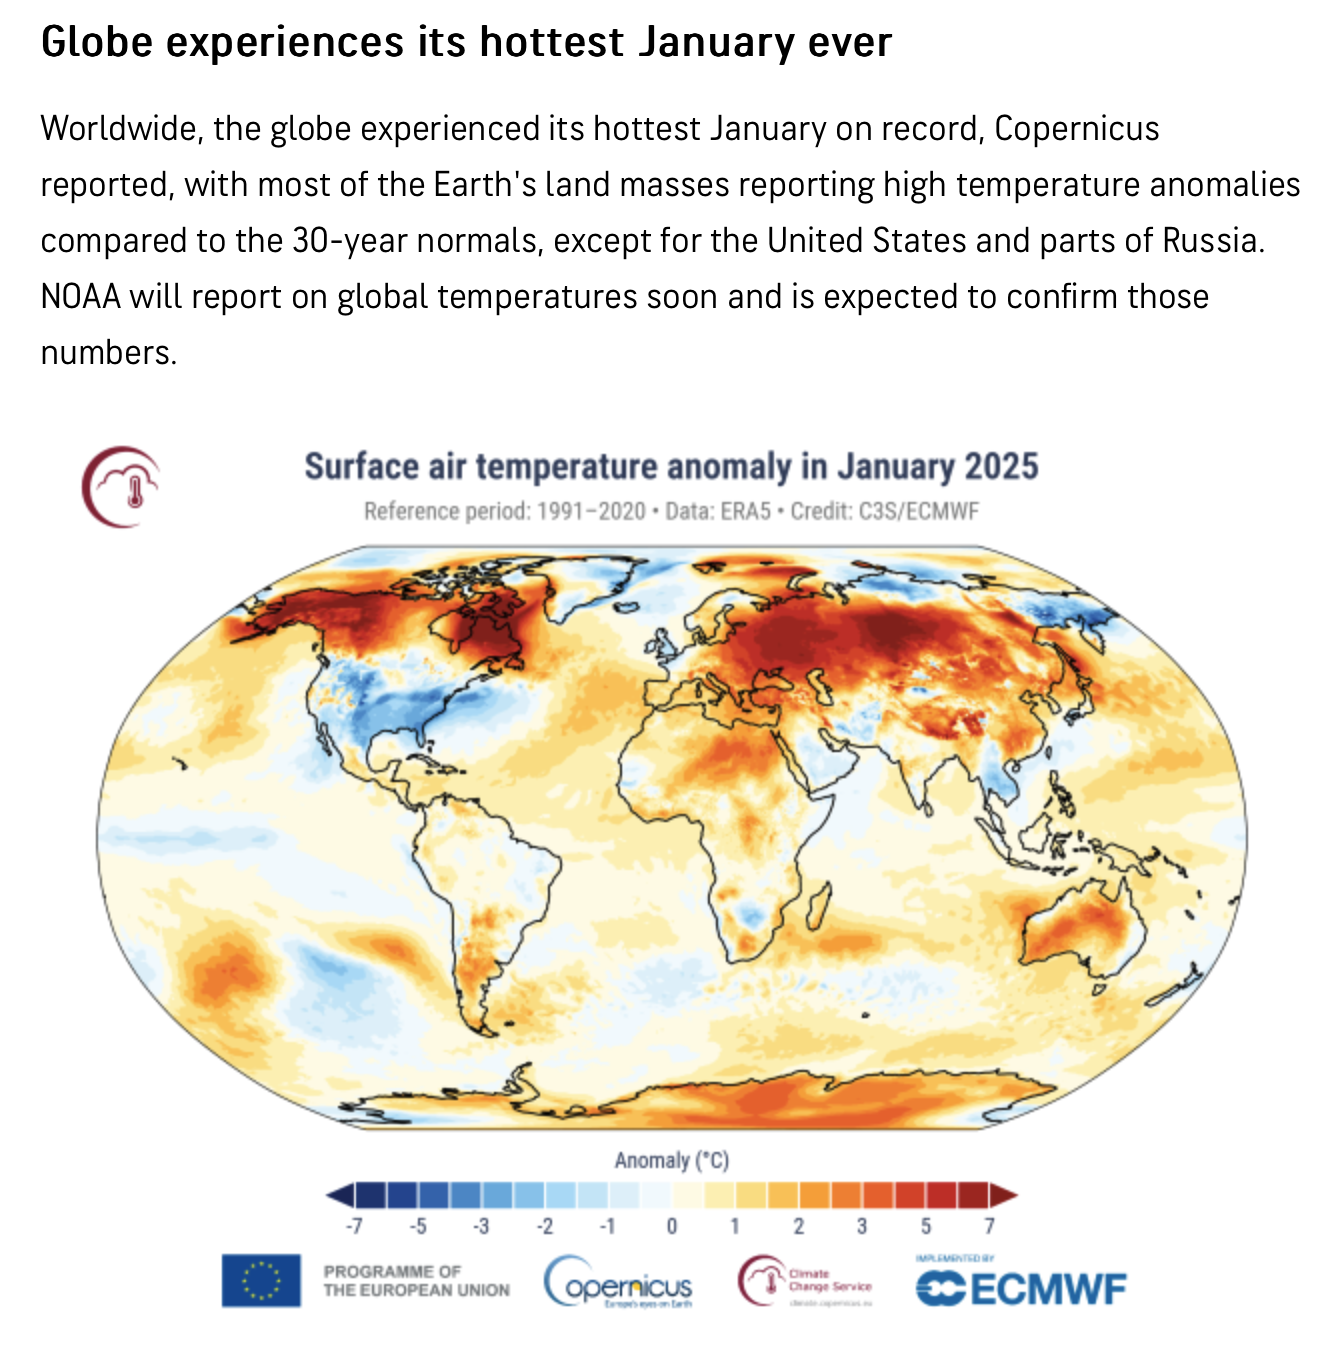
Ferrell (2025)
\(CO_2\) emissions (per capita) by rich countries
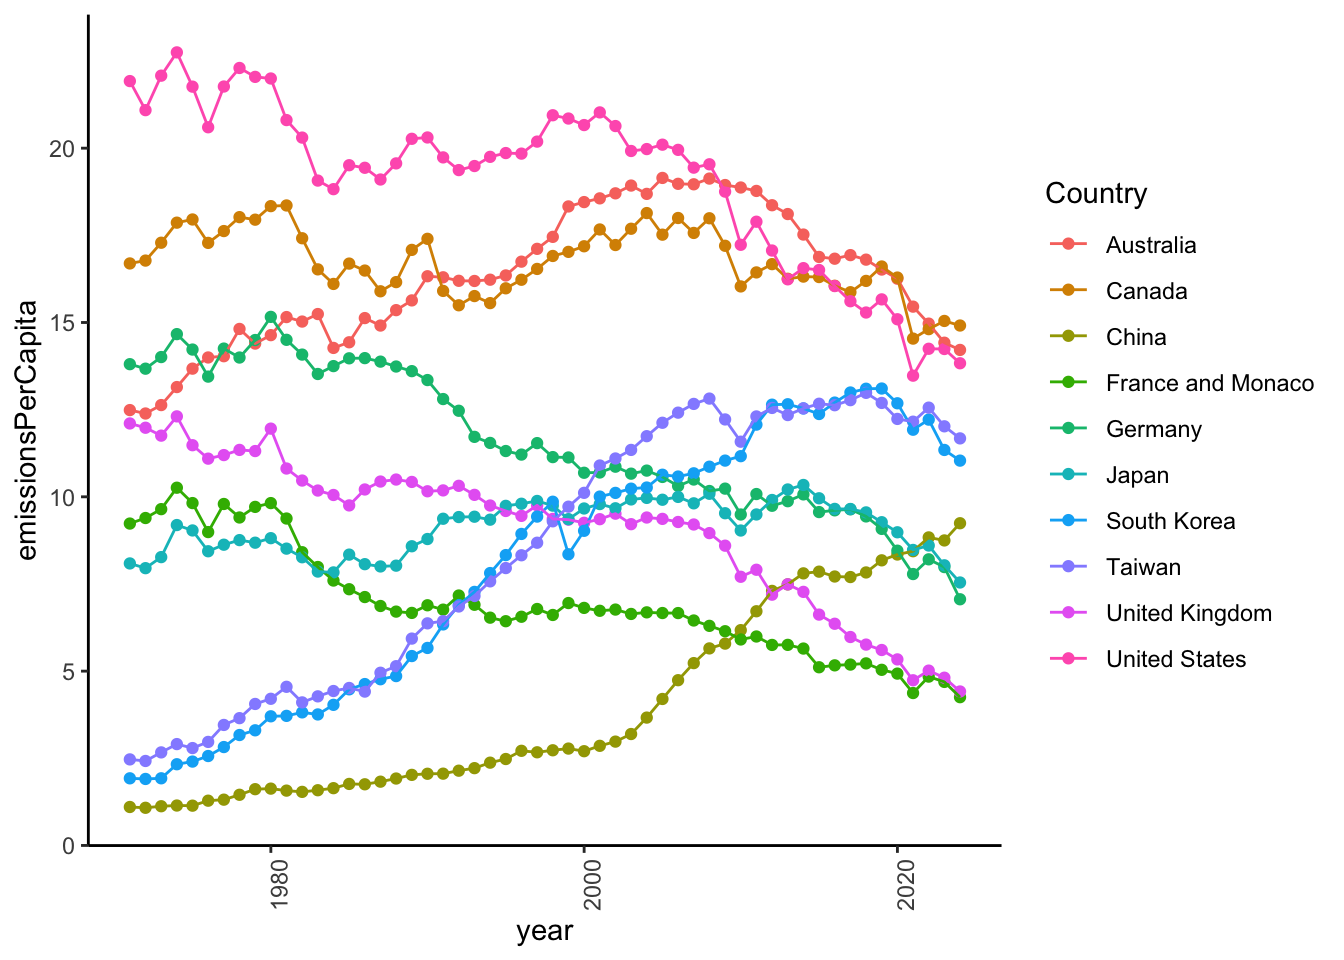
https://rick-gilmore.com/posts/data-stories-climate-change/
\(CO_2\) emissions (per GDP) by rich countries
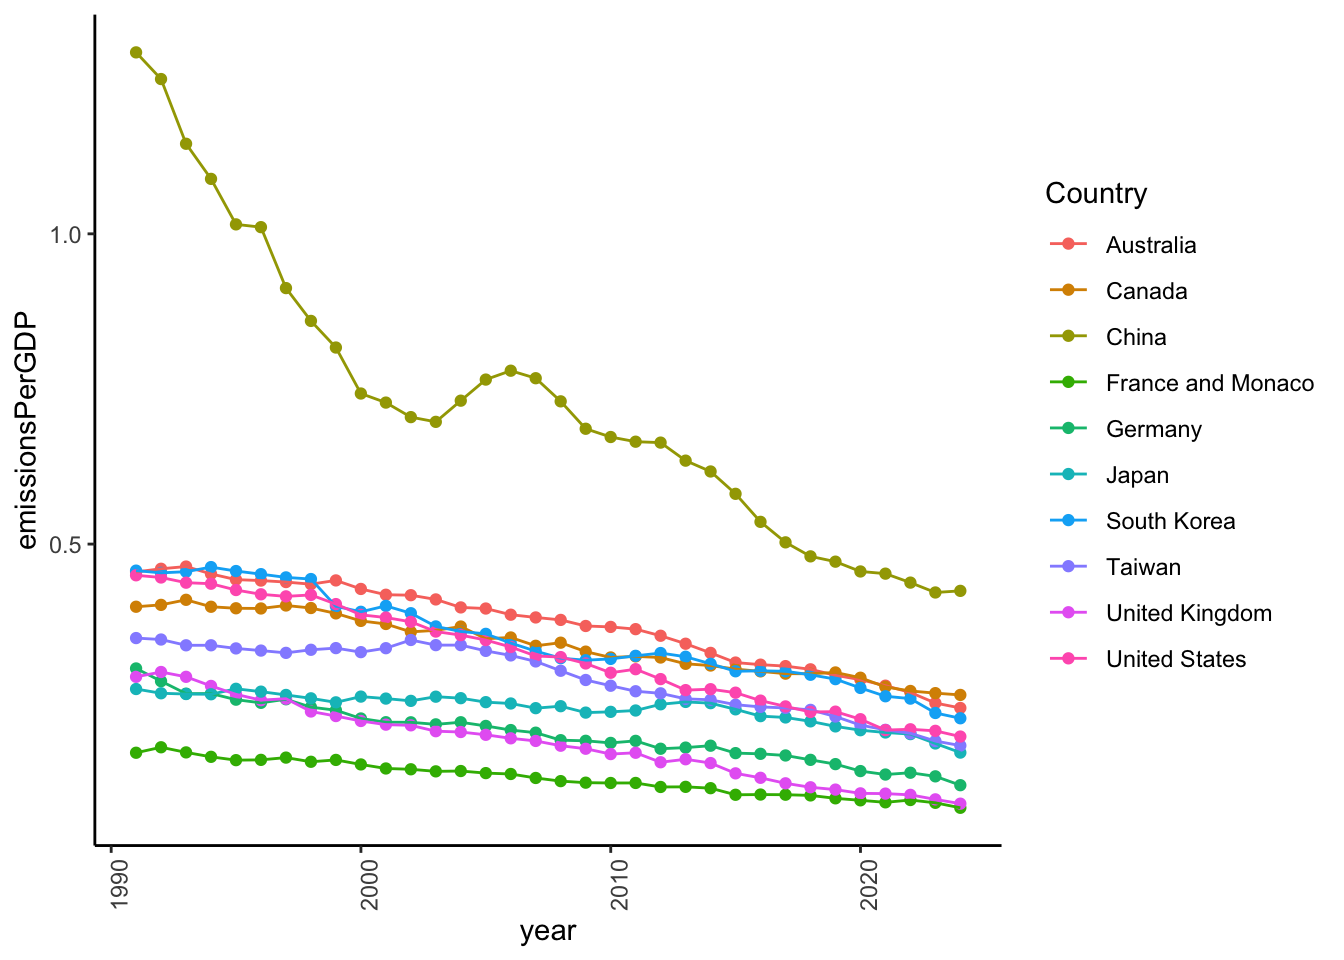
https://rick-gilmore.com/posts/data-stories-climate-change-II/