Designing efficient & understandable visualizations

2025-02-20

Rick Gilmore

Prelude

Galileo’s head was on the block. His crime was looking up for truth…

IndigoGirlsVEVO (2009)

Overview

Announcements

In the news…

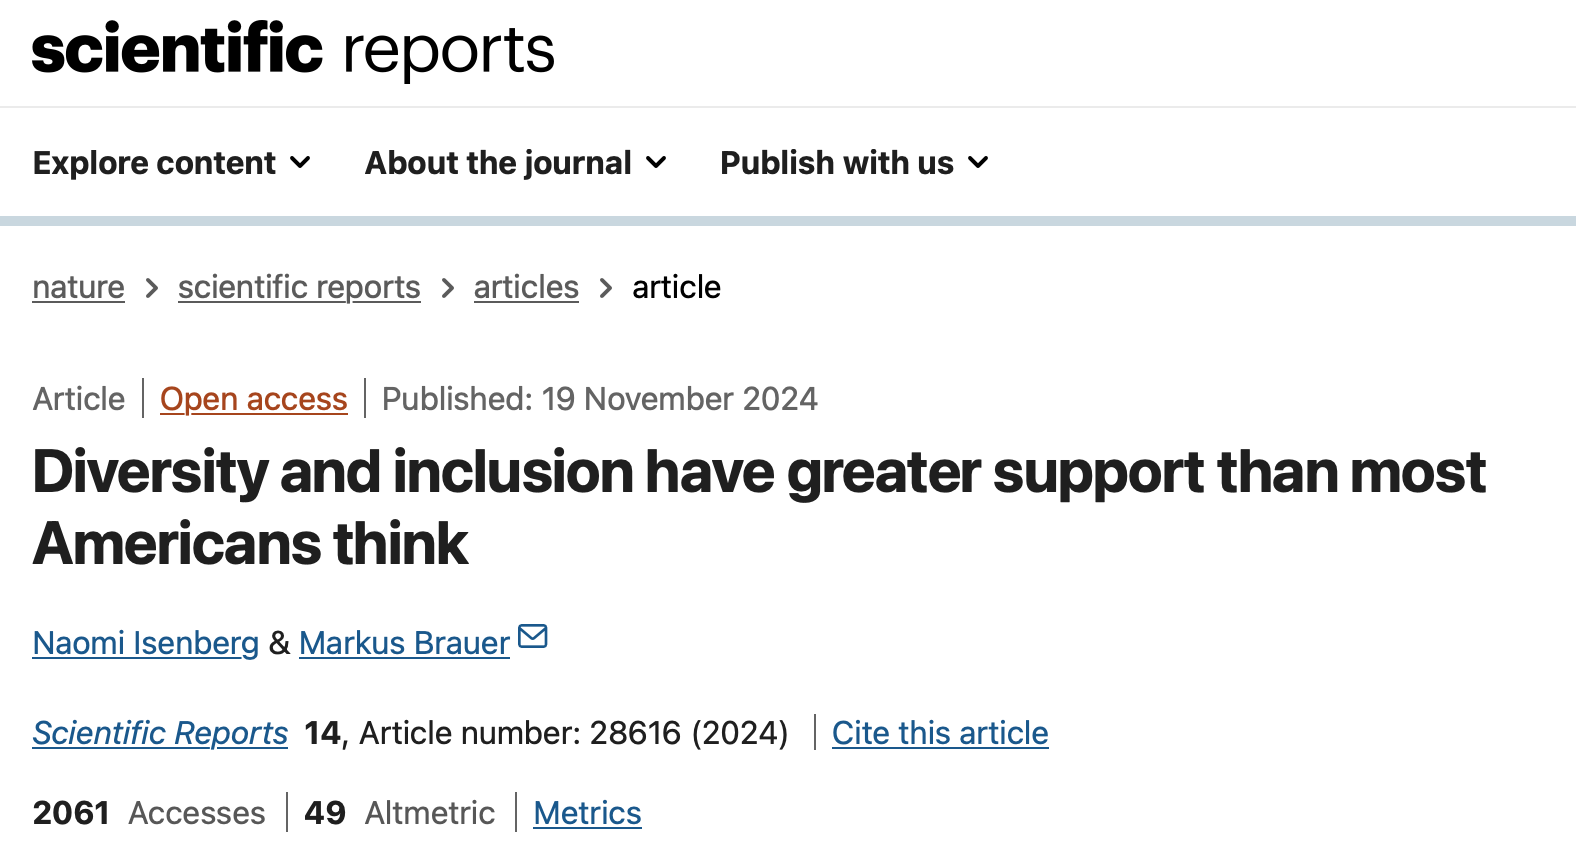
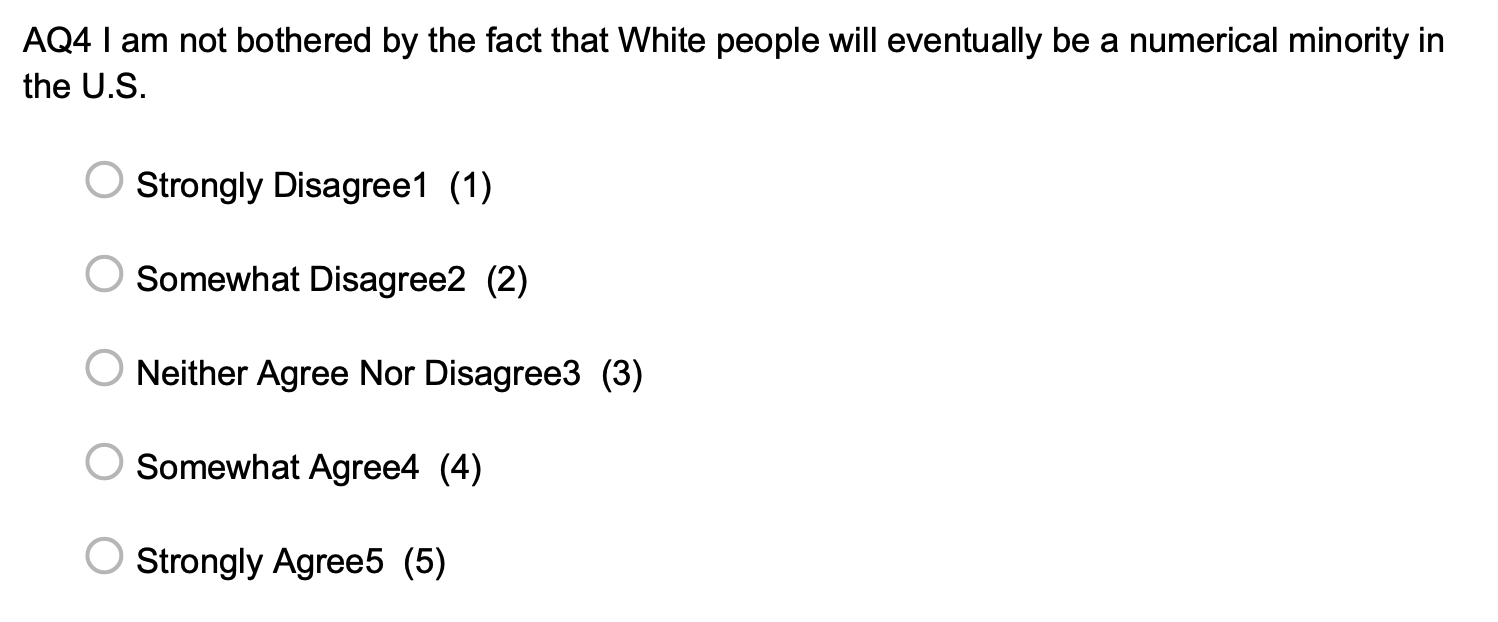
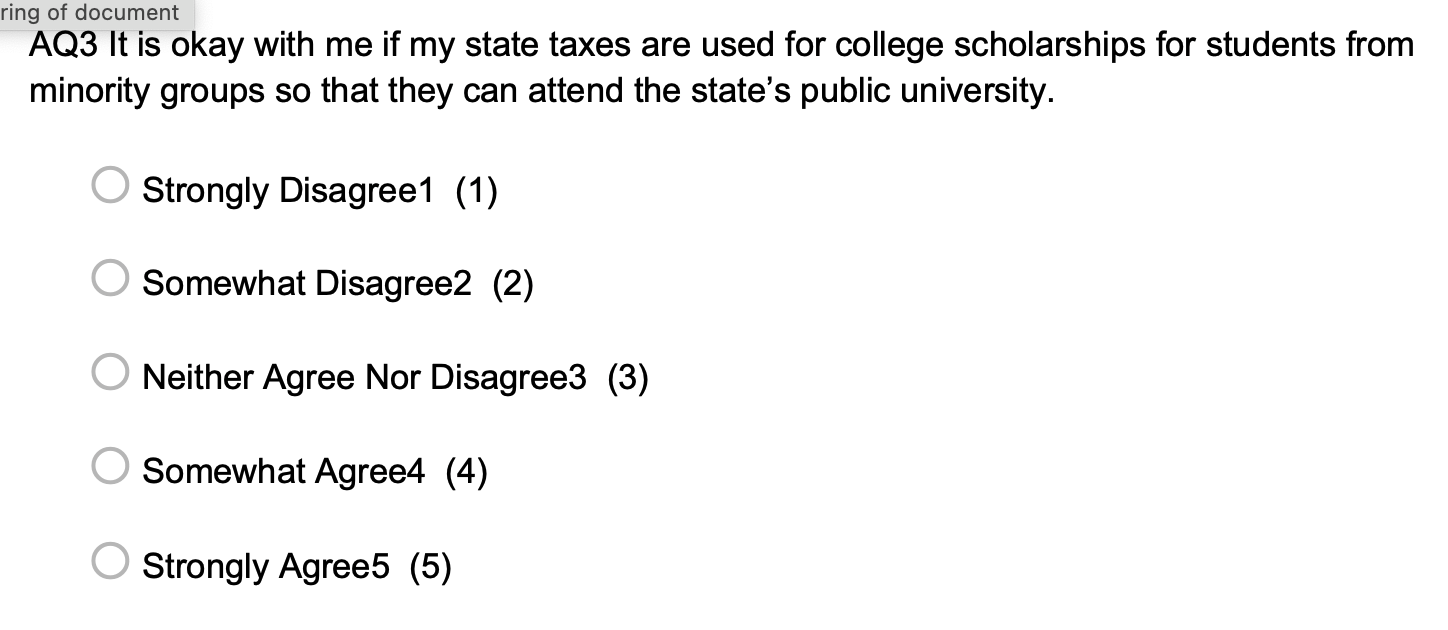
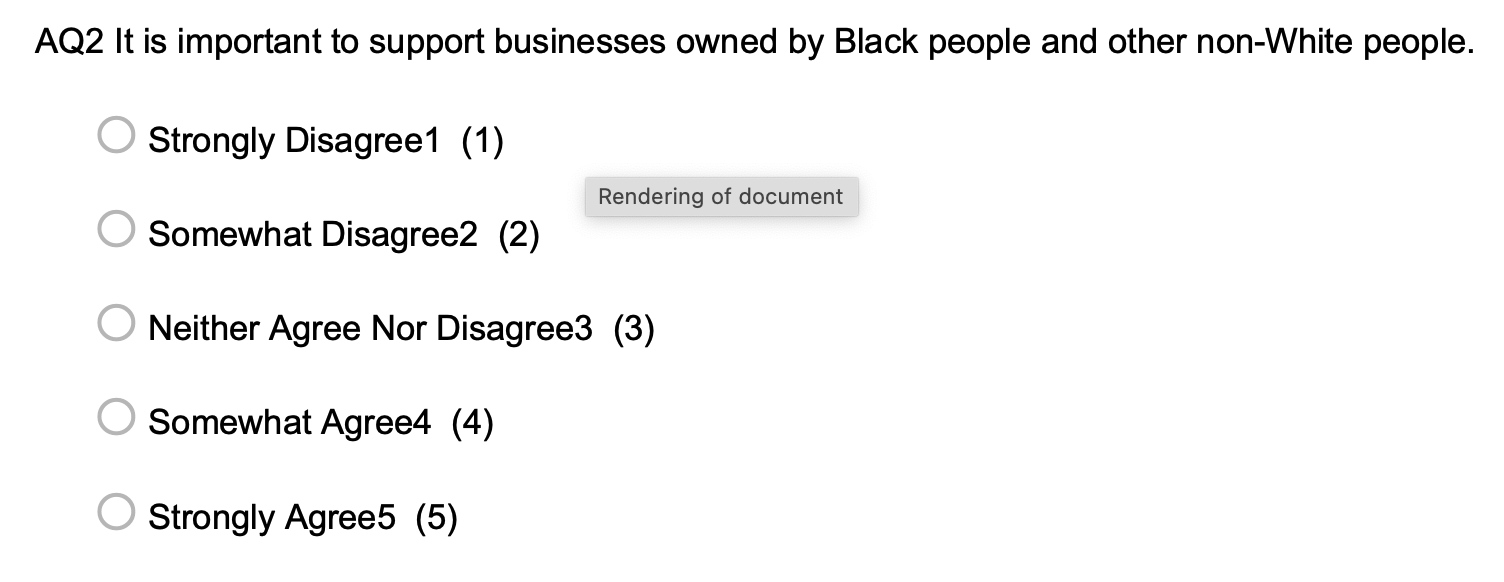
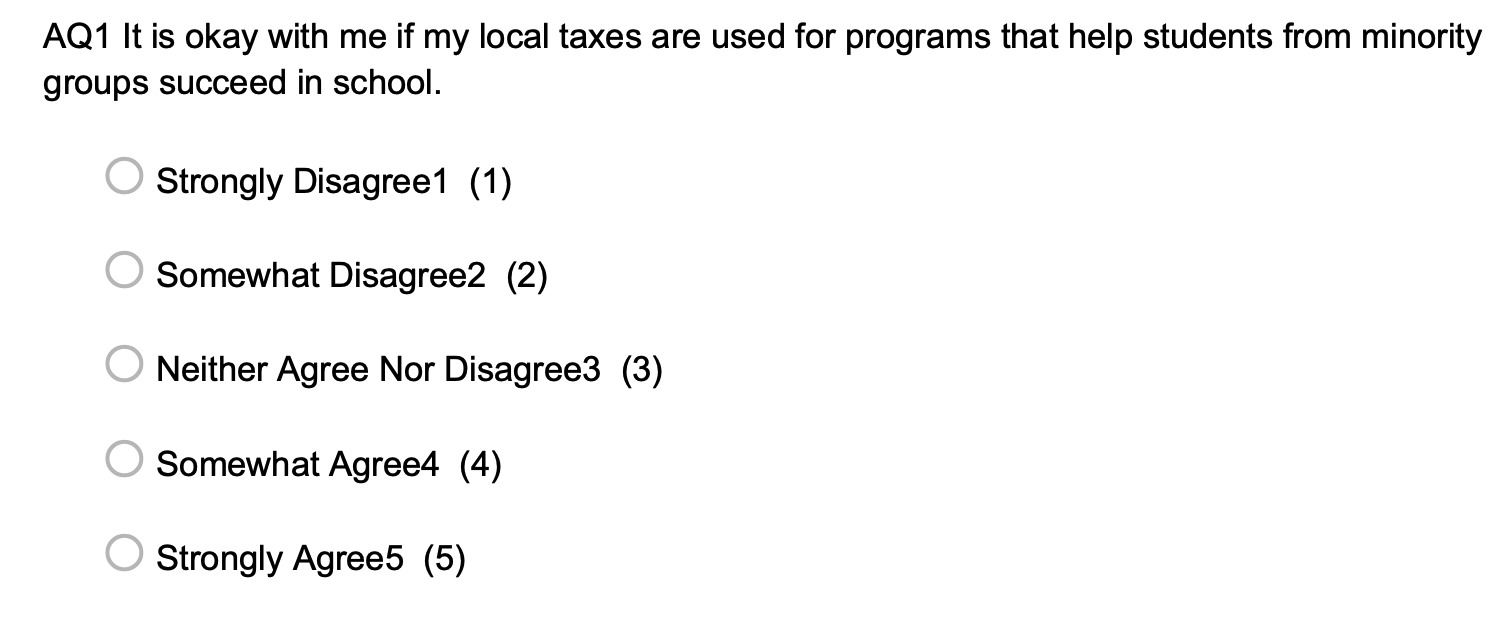
Isenberg & Brauer (2024); Isenberg & Brauer (2023)

Isenberg & Brauer (2024); Isenberg & Brauer (2023)

Isenberg & Brauer (2024); Isenberg & Brauer (2023)

Isenberg & Brauer (2024); Isenberg & Brauer (2023)

Isenberg & Brauer (2024); Isenberg & Brauer (2023)

Isenberg & Brauer (2024); Isenberg & Brauer (2023)

Isenberg & Brauer (2024); Isenberg & Brauer (2023) Isenberg & Brauer (2024); Isenberg & Brauer (2023)

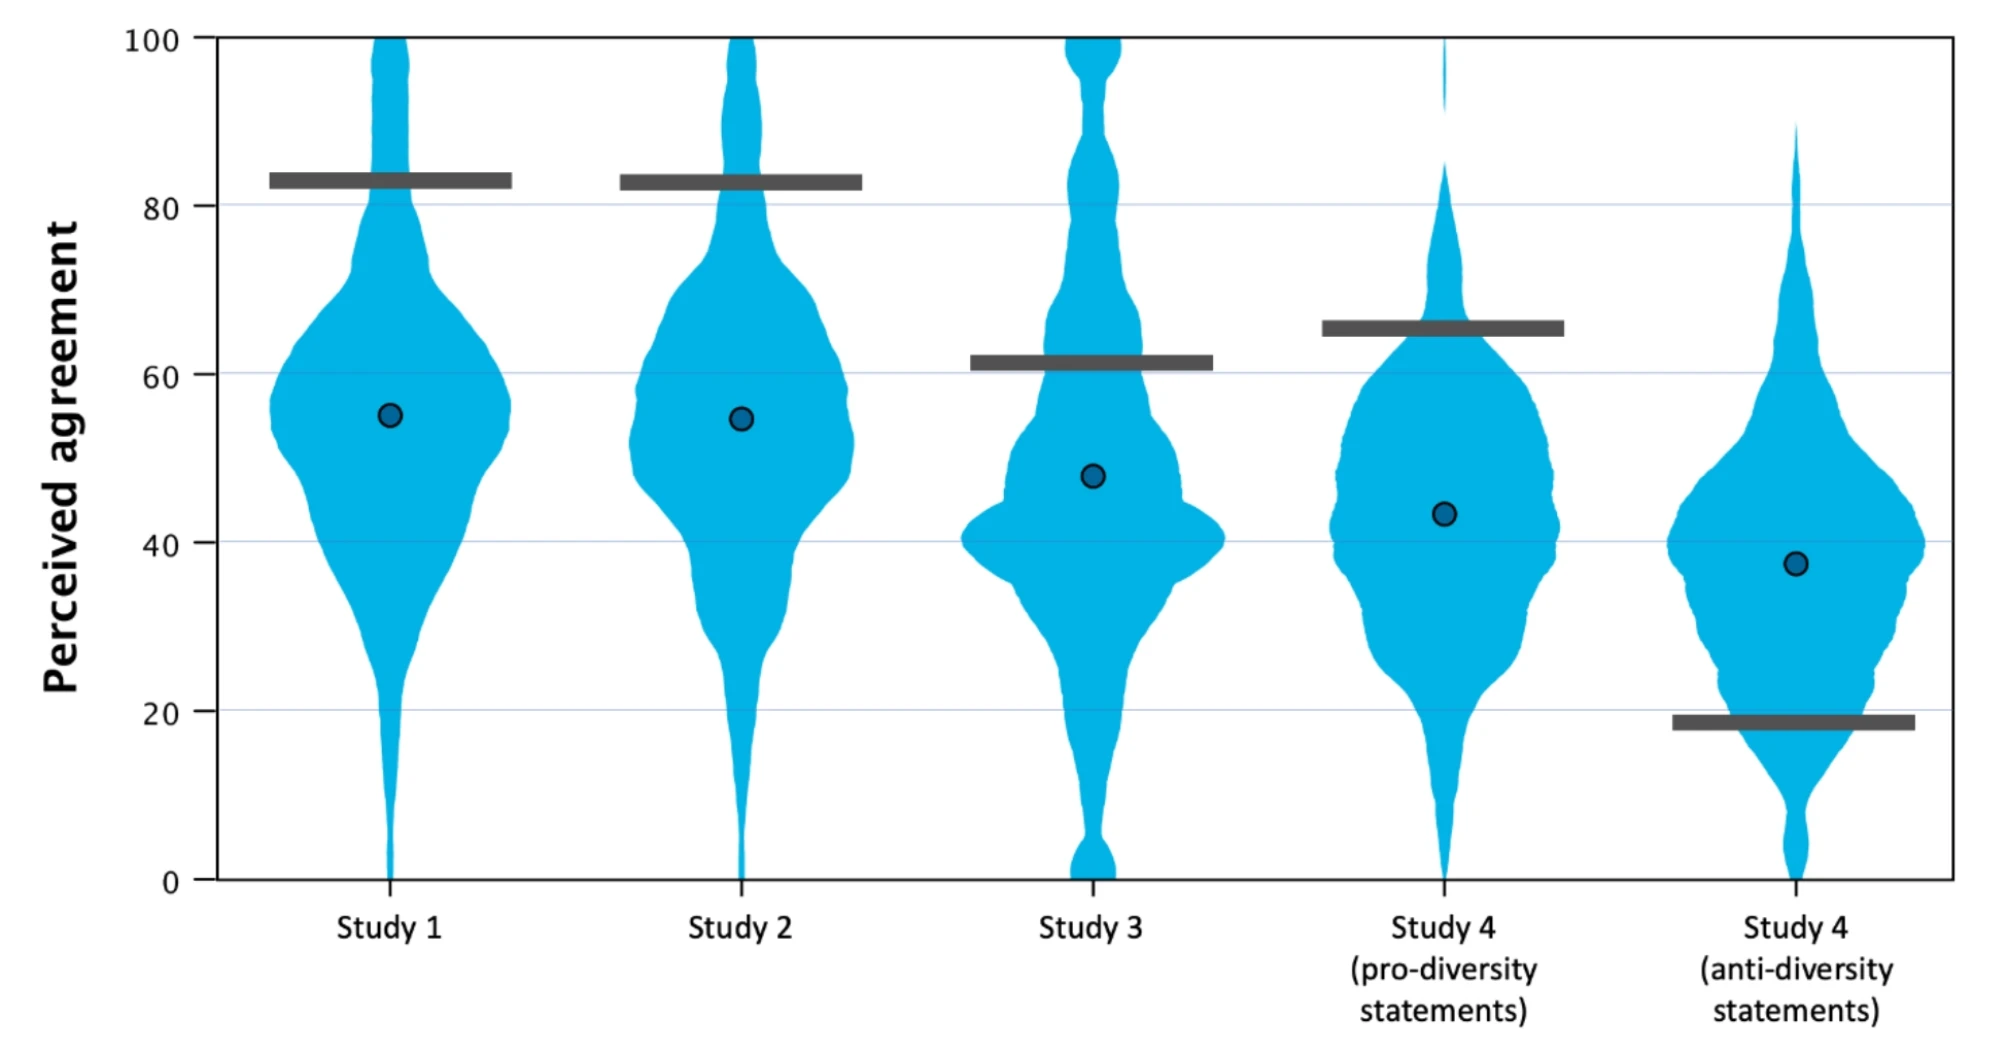
Figure 1 from Isenberg & Brauer (2024)

In a series of large-scale studies (N=5,448) we show that Americans across many different demographic categories vastly underestimate their fellow Americans’ support for diversity and inclusion…

Isenberg & Brauer (2024)

Possible final project topic

  • Many more findings & nuances than discussed here
  • Data are shared, see Isenberg & Brauer (2023)

Last time…

Top-down processing
Today

  • Designing efficient & understandable visualizations
  • Final project check-ins

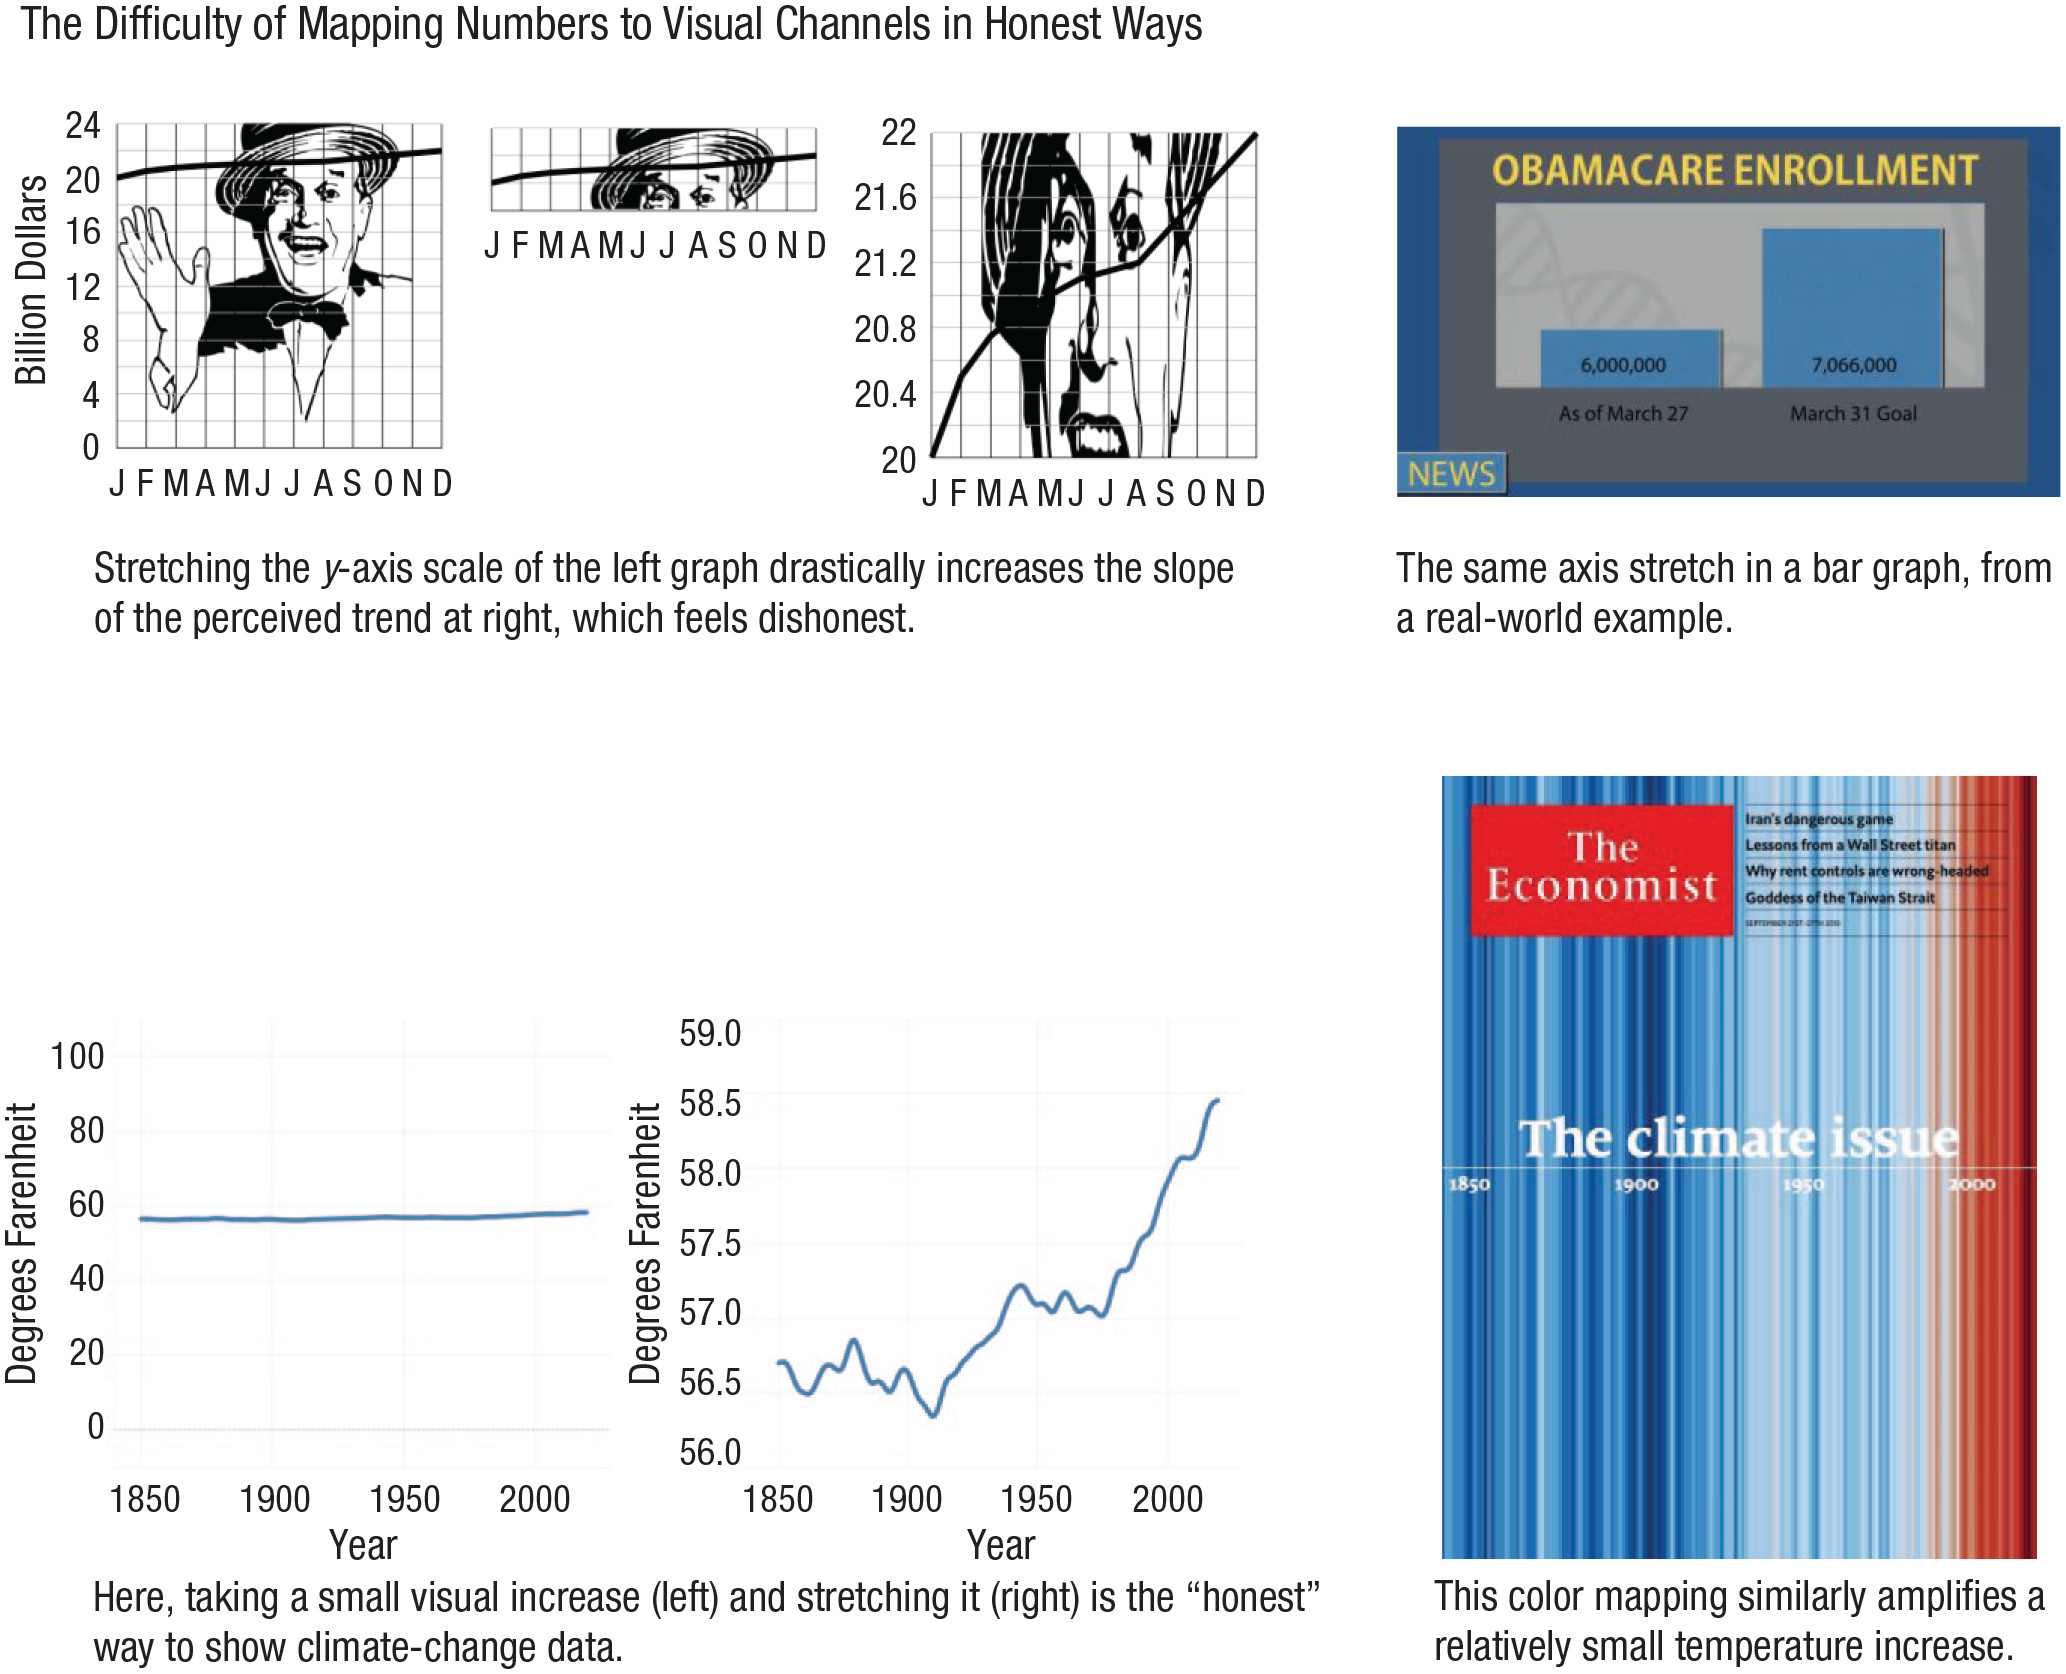
Figure 2 from Franconeri, Padilla, Shah, Zacks, & Hullman (2021)

Franconeri et al. (2021). Fig. 3. Deceptive axis manipulations across a line graph (top left) and a bar graph (top right). So, should data always be plotted relative to zero? The graph on the bottom left depicts climate change by plotting temperature data from a baseline of 0 °F, yet most would agree that graph is less informative than the version to its right, which allows the differences in temperatures to be seen. At the bottom right of the figure, a cover of The Economist from September 2019 maps the same restricted range of data to the full range of a blue-to-red color scale. The graphs at top left are inspired by Huff (1954); those at bottom left are inspired by Correll et al. (2020). The magazine cover at bottom right is reprinted, with permission, from The Economist (September 19, 2019).

Franconeri et al. (2021). Fig. 3. Deceptive axis manipulations across a line graph (top left) and a bar graph (top right). So, should data always be plotted relative to zero? The graph on the bottom left depicts climate change by plotting temperature data from a baseline of 0 °F, yet most would agree that graph is less informative than the version to its right, which allows the differences in temperatures to be seen. At the bottom right of the figure, a cover of The Economist from September 2019 maps the same restricted range of data to the full range of a blue-to-red color scale. The graphs at top left are inspired by Huff (1954); those at bottom left are inspired by Correll et al. (2020). The magazine cover at bottom right is reprinted, with permission, from The Economist (September 19, 2019).

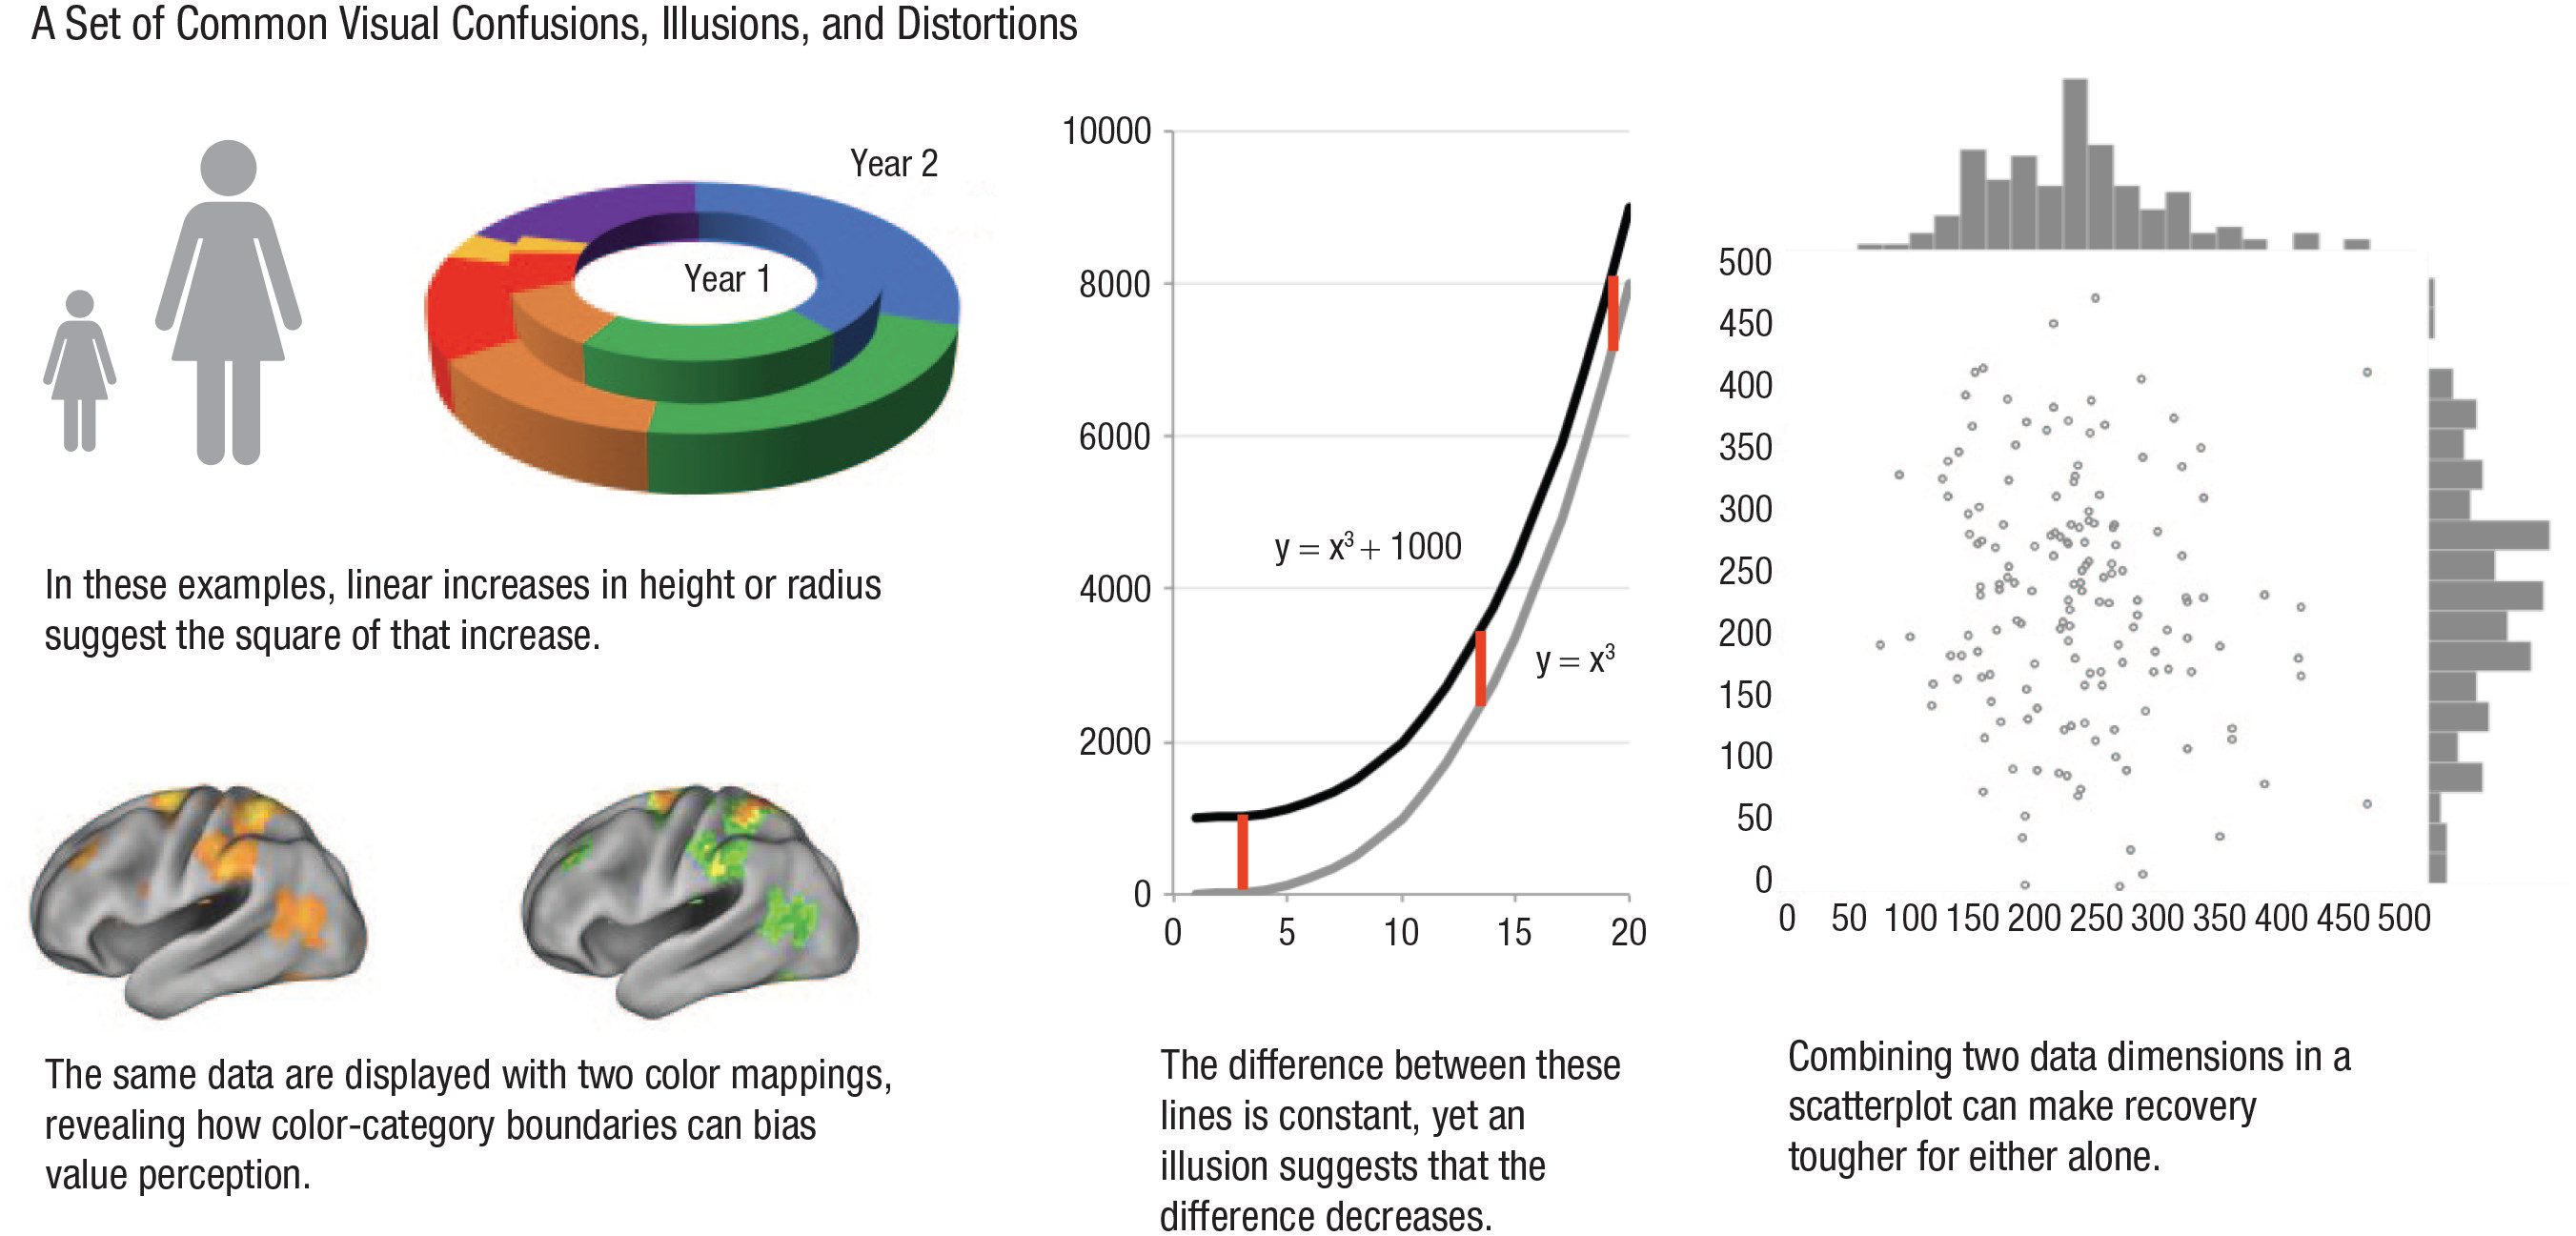
Franconeri et al. (2021). Fig. 4. A set of common visual confusions, illusions, and distortions. At upper left, the two human icons represent vastly different ratios depending on whether the data are represented by their one-dimensional heights, their two-dimensional areas, or their three-dimensional volumes. The donut graph to their right shows that three-dimensional depictions can artificially inflate data values in the two-dimensional plane. At bottom left, the same fMRI data are plotted with two color mappings. The brain image on the left produces less of a spurious categorical boundary effect, whereas the image on the right shows a common red-to-green color map that makes continuous variation appear exaggerated when it maps onto transitions from one color category to another. At center, an illusion prohibits the accurate recovery of differences between values in a line graph. At right, correlation is easier to detect from the scatterplot, but individual histograms for each dimension are easier to see when plotted separately.

Franconeri et al. (2021). Fig. 4. A set of common visual confusions, illusions, and distortions. At upper left, the two human icons represent vastly different ratios depending on whether the data are represented by their one-dimensional heights, their two-dimensional areas, or their three-dimensional volumes. The donut graph to their right shows that three-dimensional depictions can artificially inflate data values in the two-dimensional plane. At bottom left, the same fMRI data are plotted with two color mappings. The brain image on the left produces less of a spurious categorical boundary effect, whereas the image on the right shows a common red-to-green color map that makes continuous variation appear exaggerated when it maps onto transitions from one color category to another. At center, an illusion prohibits the accurate recovery of differences between values in a line graph. At right, correlation is easier to detect from the scatterplot, but individual histograms for each dimension are easier to see when plotted separately.

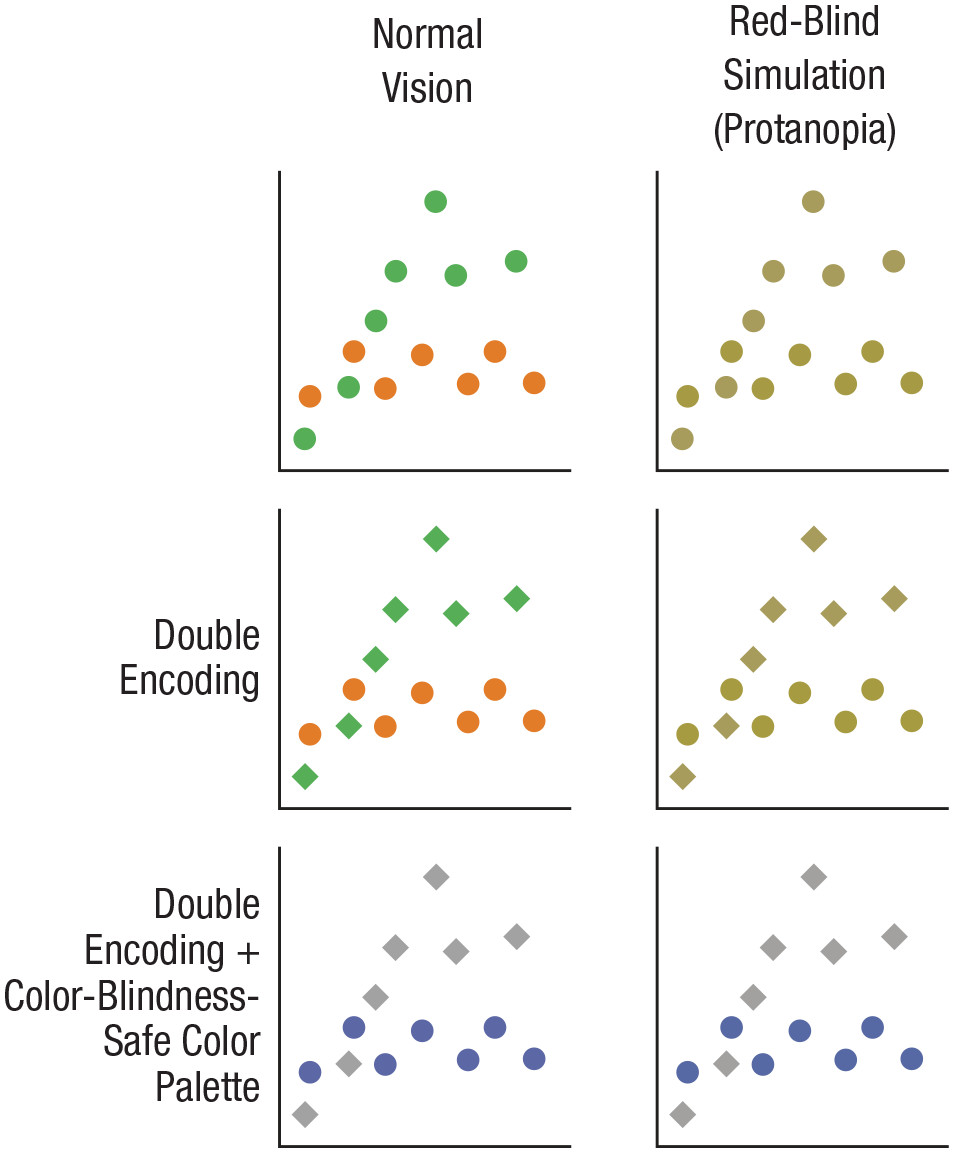
Franconeri et al. (2021). Fig. 5. Three ways to encode data for two groups in a scatterplot, as seen by observers with typical color perception and those with protanopia, a form of color blindness. Protanopia was simulated in Photoshop.

Franconeri et al. (2021). Fig. 5. Three ways to encode data for two groups in a scatterplot, as seen by observers with typical color perception and those with protanopia, a form of color blindness. Protanopia was simulated in Photoshop.

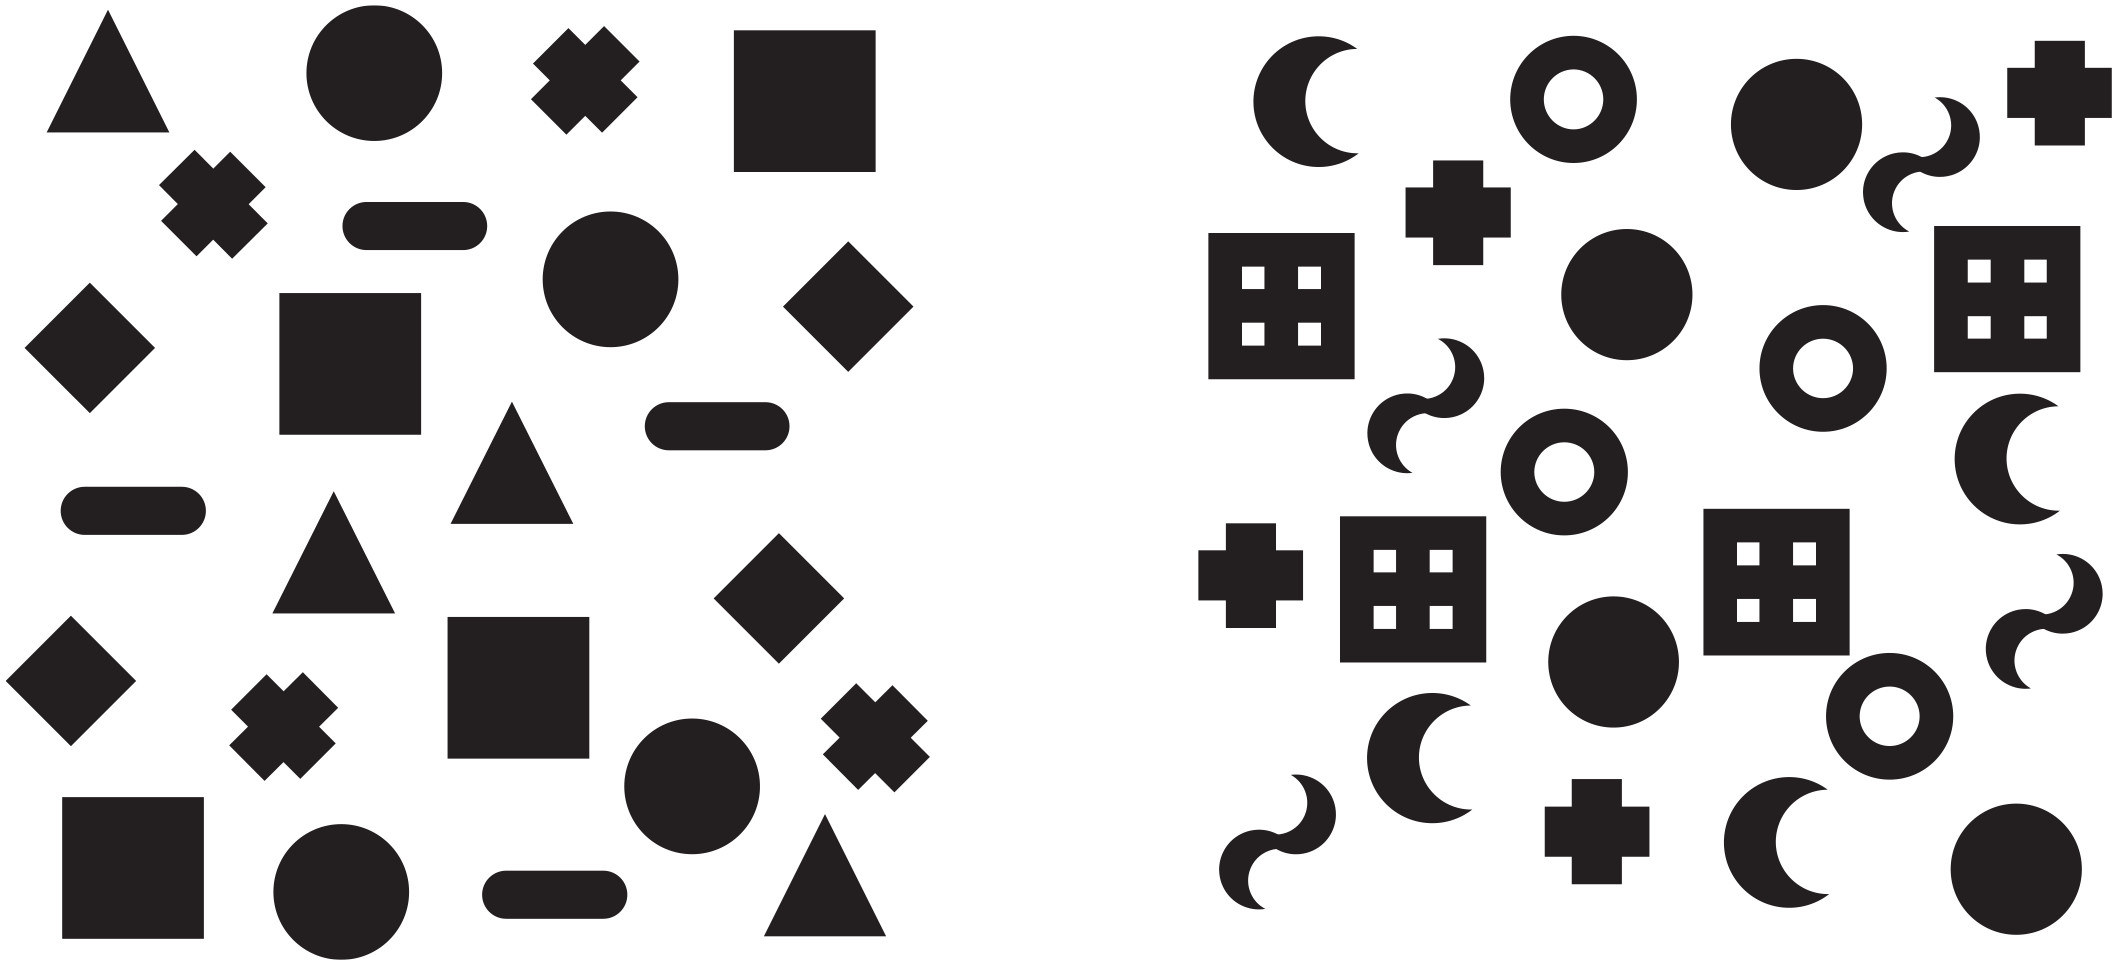
Franconeri et al. (2021). Fig. 6. The standard shape set for Microsoft Excel (left) compared with a perceptually spaced set (right; inspired by Huang, 2020). Try to pick out the four instances of each shape in each display—you should find that task easier on the right side.

Franconeri et al. (2021). Fig. 6. The standard shape set for Microsoft Excel (left) compared with a perceptually spaced set (right; inspired by Huang, 2020). Try to pick out the four instances of each shape in each display—you should find that task easier on the right side.

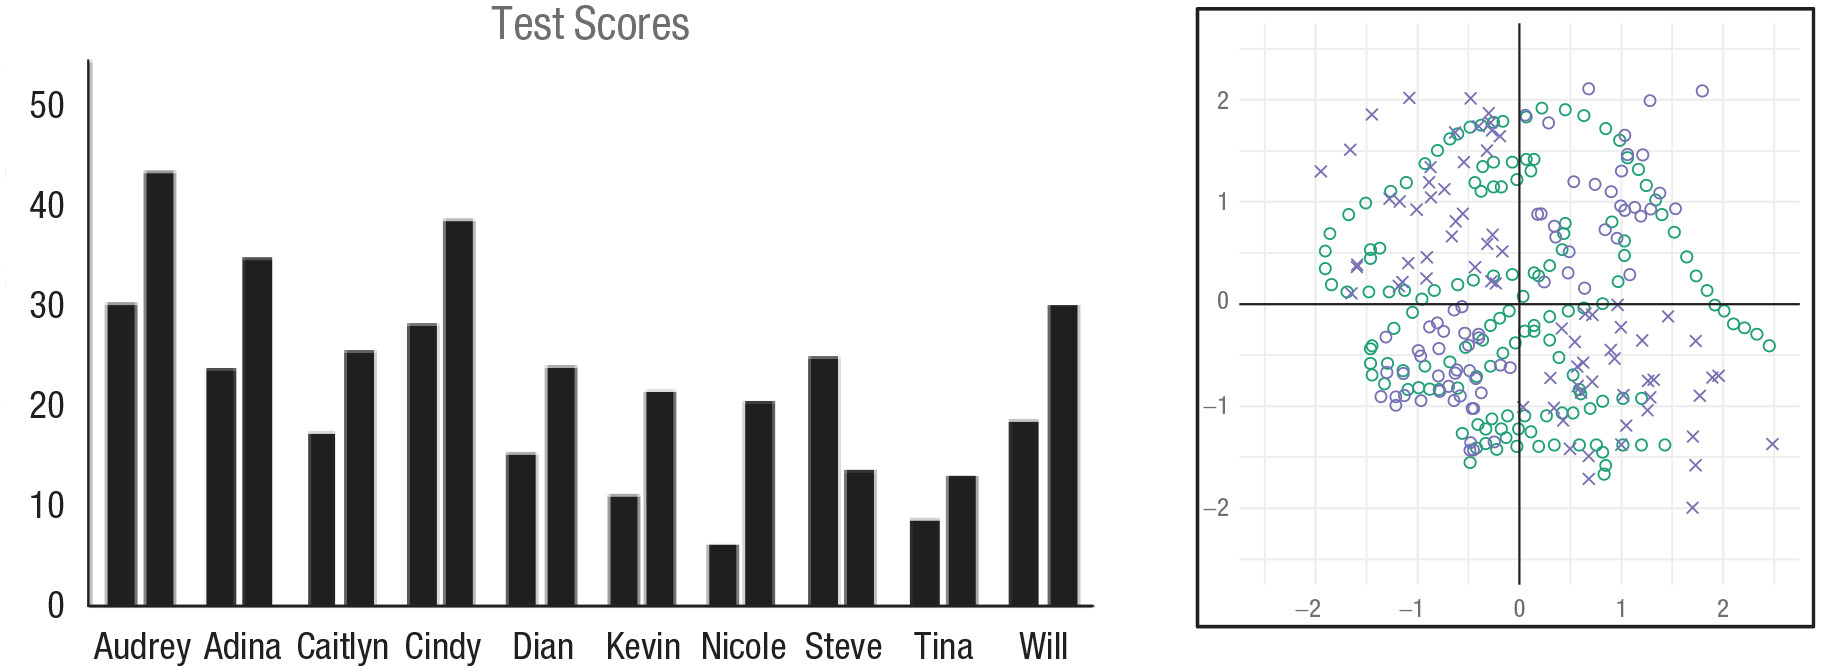
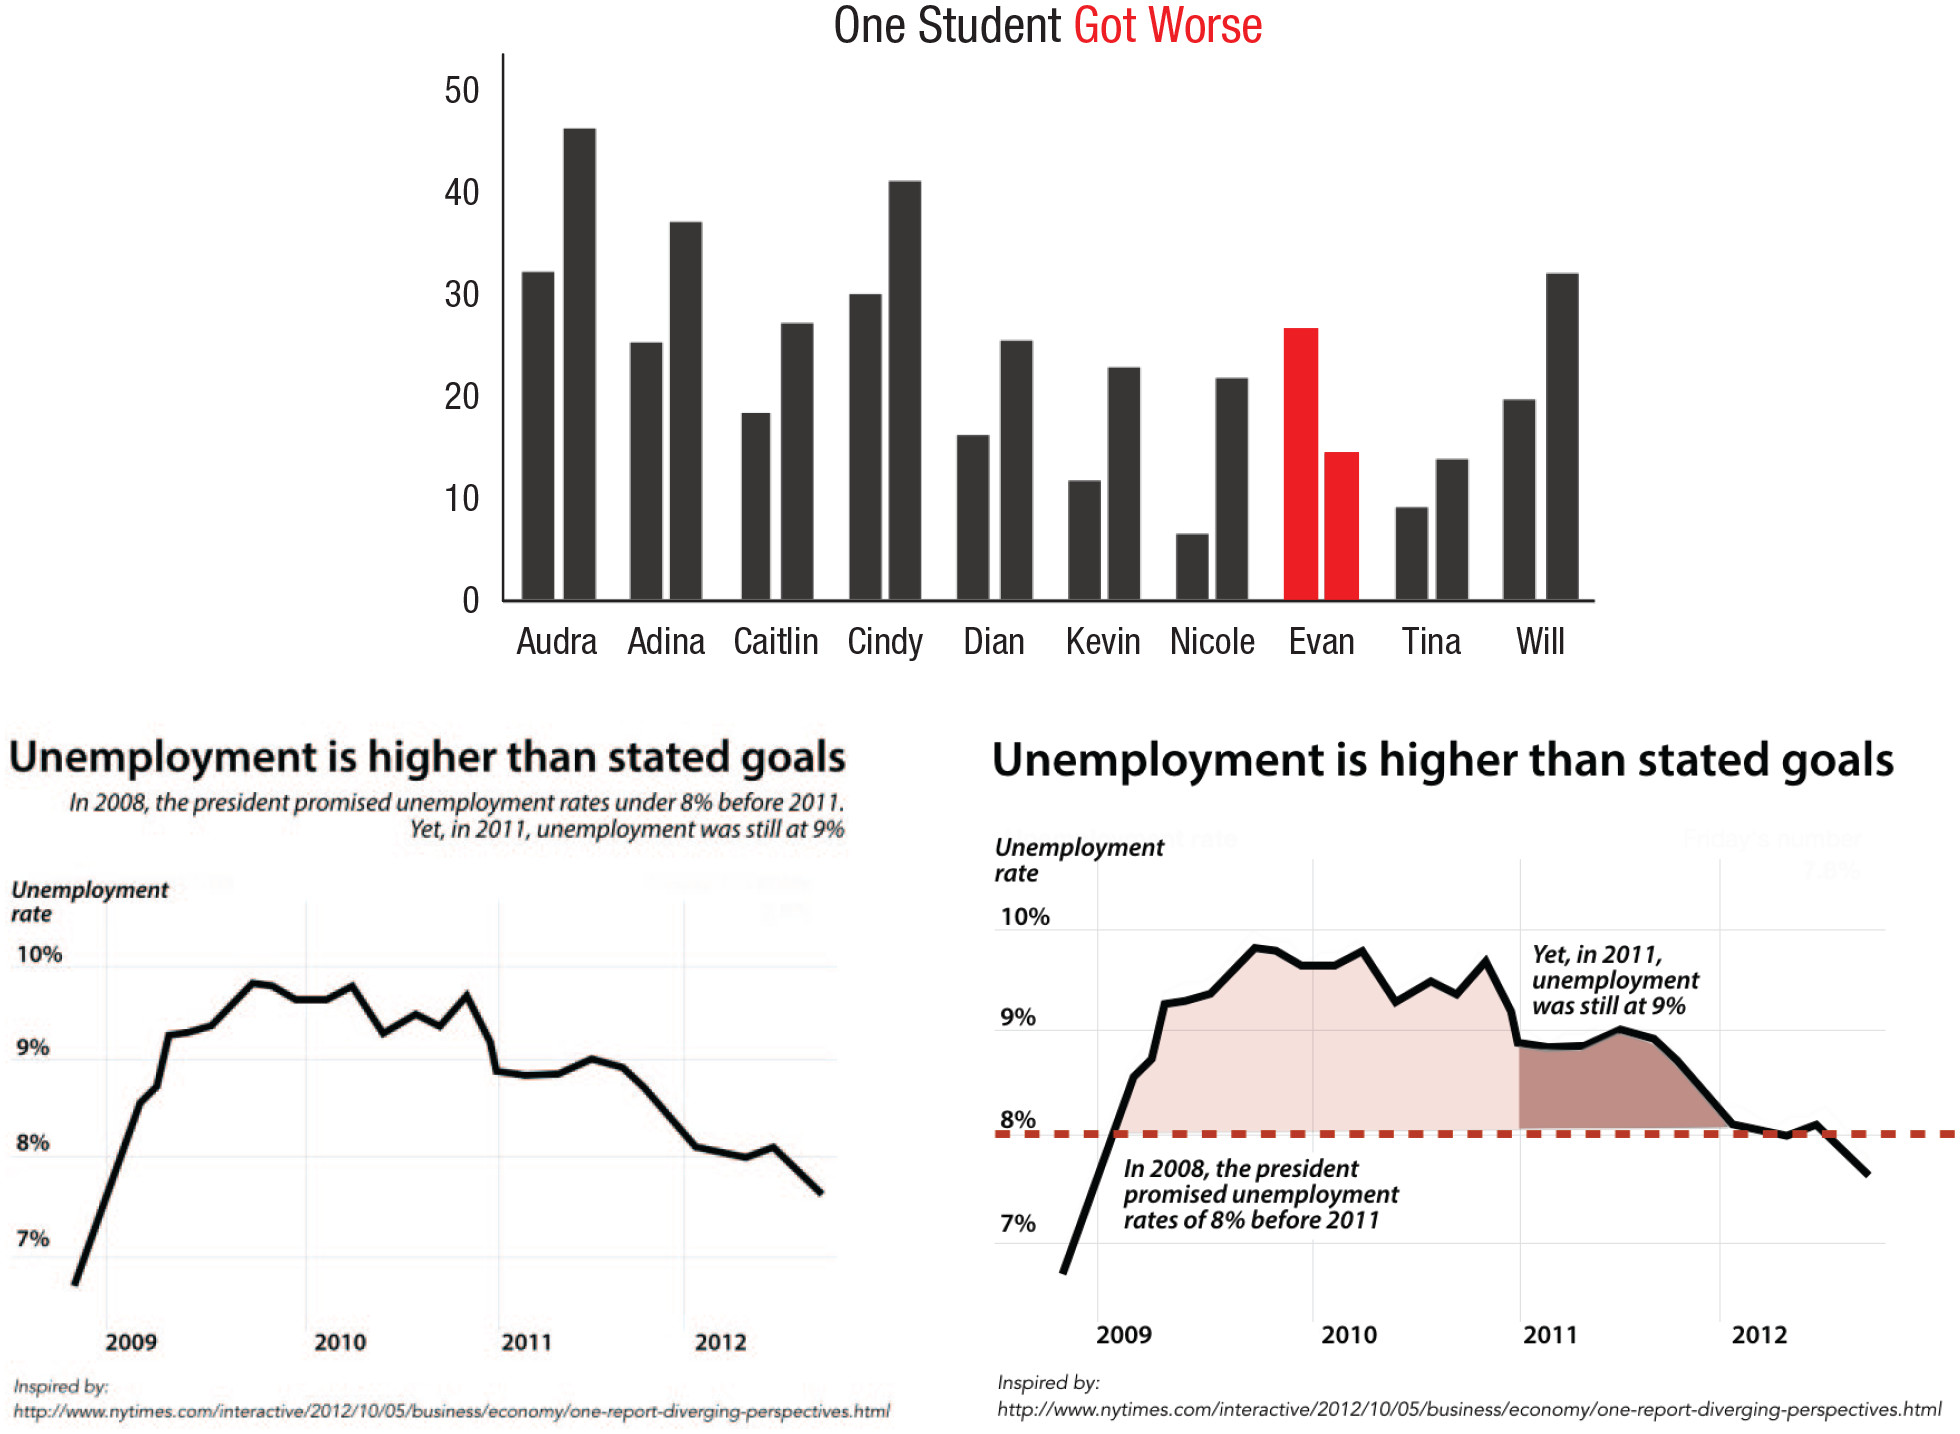
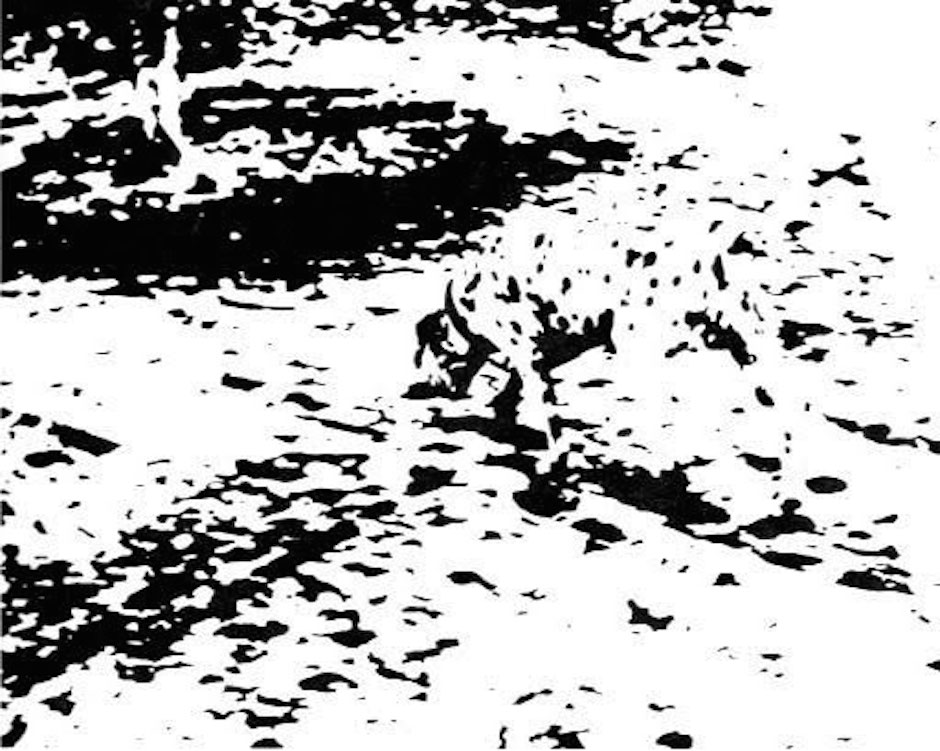
Franconeri et al. (2021). Fig. 7. Visual comparison as a serial process. In the bar graph on the left, which student has a second bar that is lower than the first? To find the answer, the viewer needs to process each set of bars individually, rather than all at once. On the right, viewers tasked with processing the blue set of marks failed to notice the dinosaur shape created by the green set of marks. The image on the right is reprinted from Boger et al. (2021).

Franconeri et al. (2021). Fig. 7. Visual comparison as a serial process. In the bar graph on the left, which student has a second bar that is lower than the first? To find the answer, the viewer needs to process each set of bars individually, rather than all at once. On the right, viewers tasked with processing the blue set of marks failed to notice the dinosaur shape created by the green set of marks. The image on the right is reprinted from Boger et al. (2021).

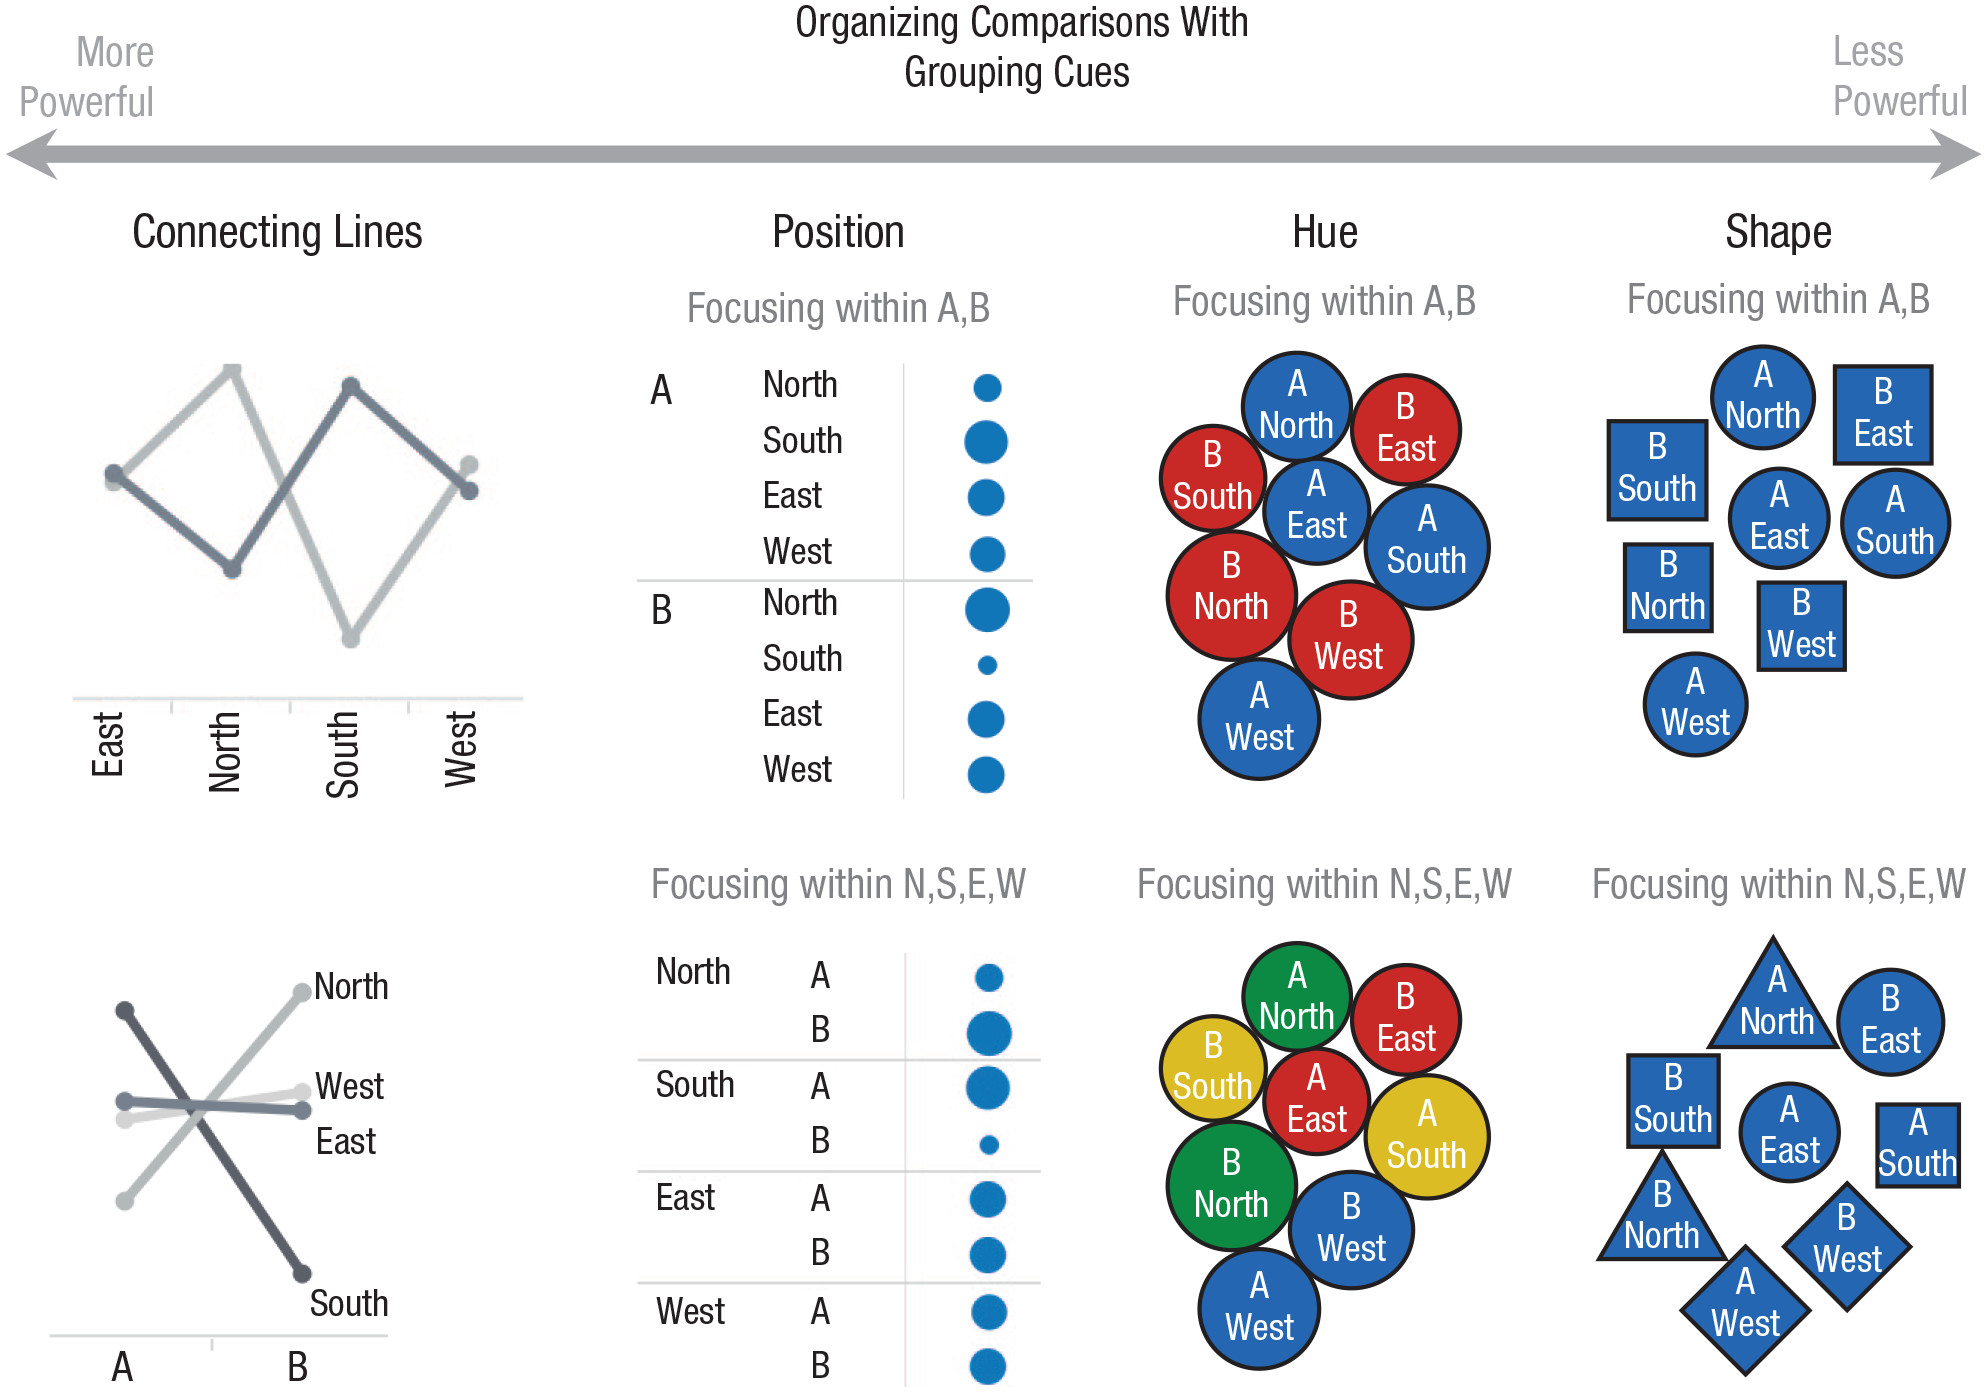
Franconeri et al. (2021). Fig. 8. Several grouping cues that can control how data values are compared. Connecting lines are particularly powerful cues, followed by proximity, color, and shape (Brooks, 2015).

Franconeri et al. (2021). Fig. 8. Several grouping cues that can control how data values are compared. Connecting lines are particularly powerful cues, followed by proximity, color, and shape (Brooks, 2015).

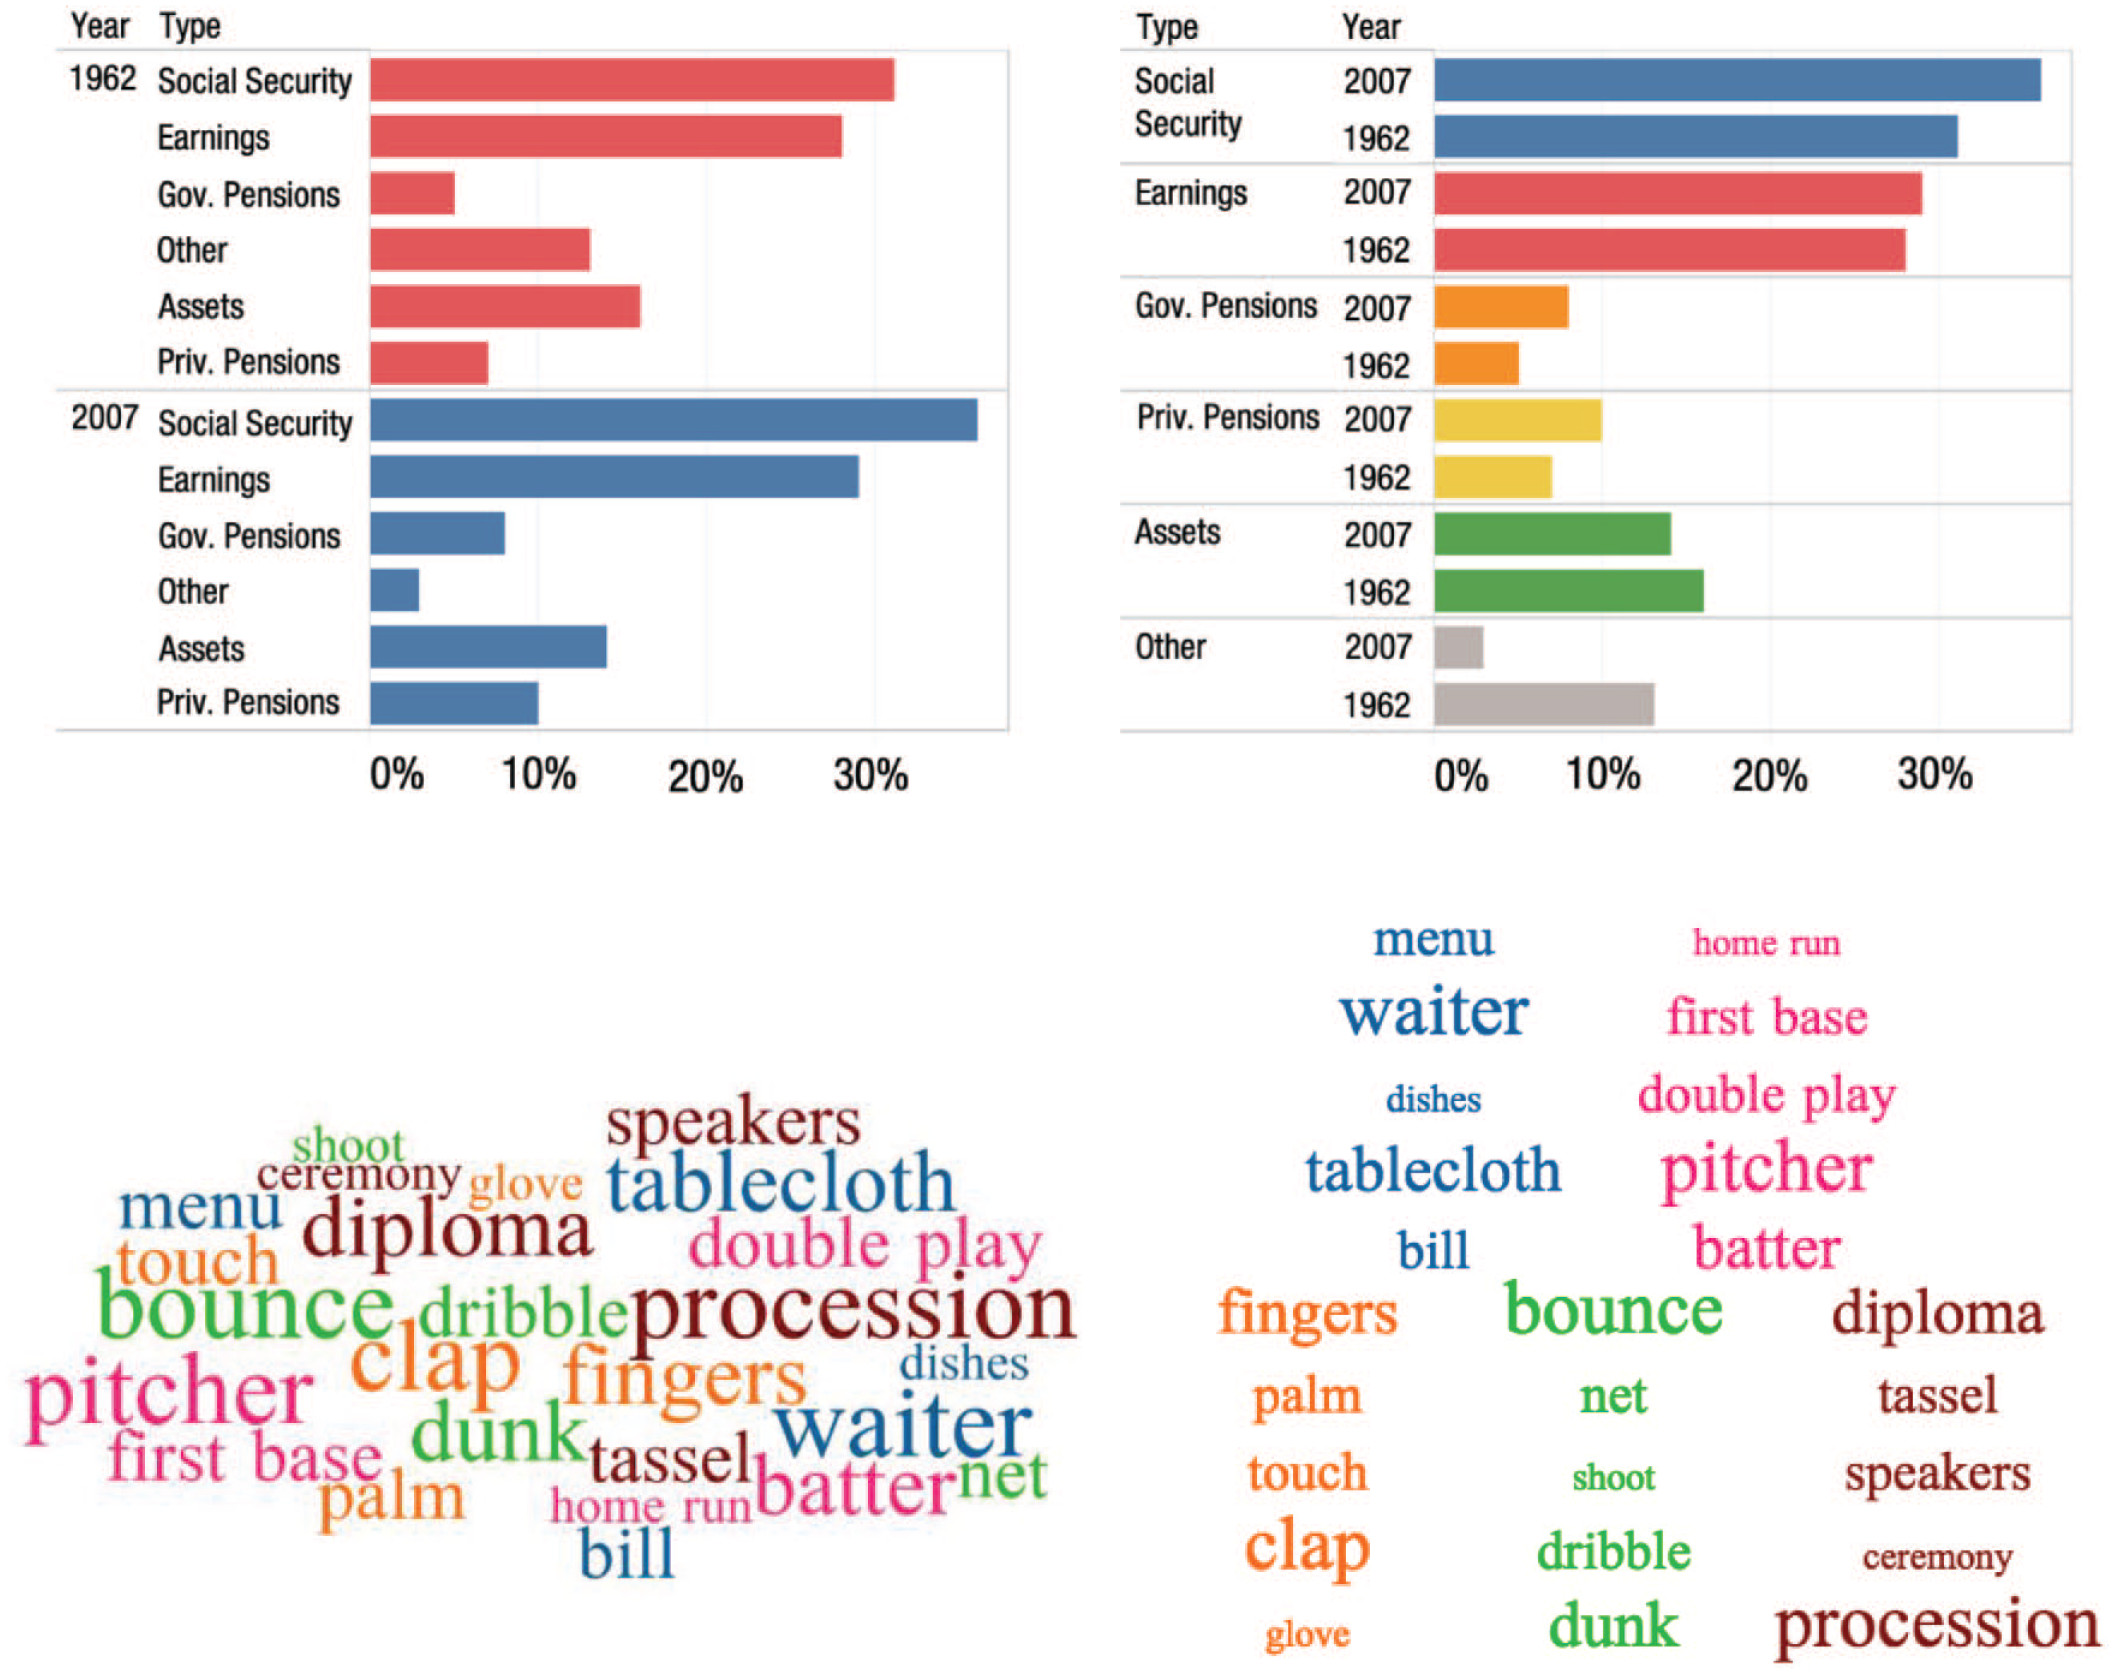
Franconeri et al. (2021). Fig. 9. How visual grouping cues can control visual comparison. At top, a combination of color and proximity grouping lead the viewer to different visual comparisons across the two bar graphs. At the bottom, comparisons in a word cloud are weakly controlled by color grouping, and more strongly controlled with proximity grouping.

Franconeri et al. (2021). Fig. 9. How visual grouping cues can control visual comparison. At top, a combination of color and proximity grouping lead the viewer to different visual comparisons across the two bar graphs. At the bottom, comparisons in a word cloud are weakly controlled by color grouping, and more strongly controlled with proximity grouping.

Franconeri et al. (2021). Fig. 10. Color highlighting and direct annotation to help viewers make the right comparison first and know what conclusion is supported by that pattern in the data. The graphic at the top illustrates a color-highlighting technique suggested in business-oriented practitioner guides (e.g., Knaflic, 2015). The graphs at the bottom (inspired by Bostock et al., 2012) are an adaptation of a graph by data journalists using grouping, highlighting, and verbal annotation.

Franconeri et al. (2021). Fig. 10. Color highlighting and direct annotation to help viewers make the right comparison first and know what conclusion is supported by that pattern in the data. The graphic at the top illustrates a color-highlighting technique suggested in business-oriented practitioner guides (e.g., Knaflic, 2015). The graphs at the bottom (inspired by Bostock et al., 2012) are an adaptation of a graph by data journalists using grouping, highlighting, and verbal annotation.

If we knew what we were doing, we wouldn’t call it research.

Attributed to Einstein, but see Hirschman (2010).

The more you know, the more you know you don’t know.

Attributed to Aristotle, but see “Did aristotle say "the more you know..."” (n.d.).

Final project check-ins

Next time

Communicating uncertainty and risk

Resources

References

Did aristotle say "the more you know...". (n.d.). Retrieved February 19, 2025, from https://philosophy.stackexchange.com/questions/46282/did-aristotle-say-the-more-you-know
Franconeri, S. L., Padilla, L. M., Shah, P., Zacks, J. M., & Hullman, J. (2021). The science of visual data communication: What works. Psychological Science in the Public Interest: A Journal of the American Psychological Society, 22(3), 110–161. https://doi.org/10.1177/15291006211051956
Hirschman, D. (2010, September 4). Adventures in fact-checking: Einstein quote edition. Retrieved February 19, 2025, from https://asociologist.com/2010/09/04/adventures-in-fact-checking-einstein-quote-edition/
IndigoGirlsVEVO. (2009). Indigo girls - galileo (official video). Youtube. Retrieved from https://www.youtube.com/watch?v=dI1keSSwdcI
Isenberg, N., & Brauer, M. (2023). Pluralistic ignorance about DEI. Retrieved from https://osf.io/ncd29/?view_only=fa3b86146da6440c85a2ca1f39dac247
Isenberg, N., & Brauer, M. (2024). Diversity and inclusion have greater support than most americans think. Scientific Reports, 14, 28616. https://doi.org/10.1038/s41598-024-76761-8