Using virtual environment 'myenv' ...Exploring data with Python
2025-04-08
Last time…
import matplotlib.pyplot as plt
rand_x = np.random.normal(0, 1, 100)
rand_y = np.random.normal(0, 1, 100)
data = {'x': rand_x, 'y': rand_y}
df = pd.DataFrame(data)
df.plot(x = 'x', y = 'y', kind = 'scatter')
plt.show()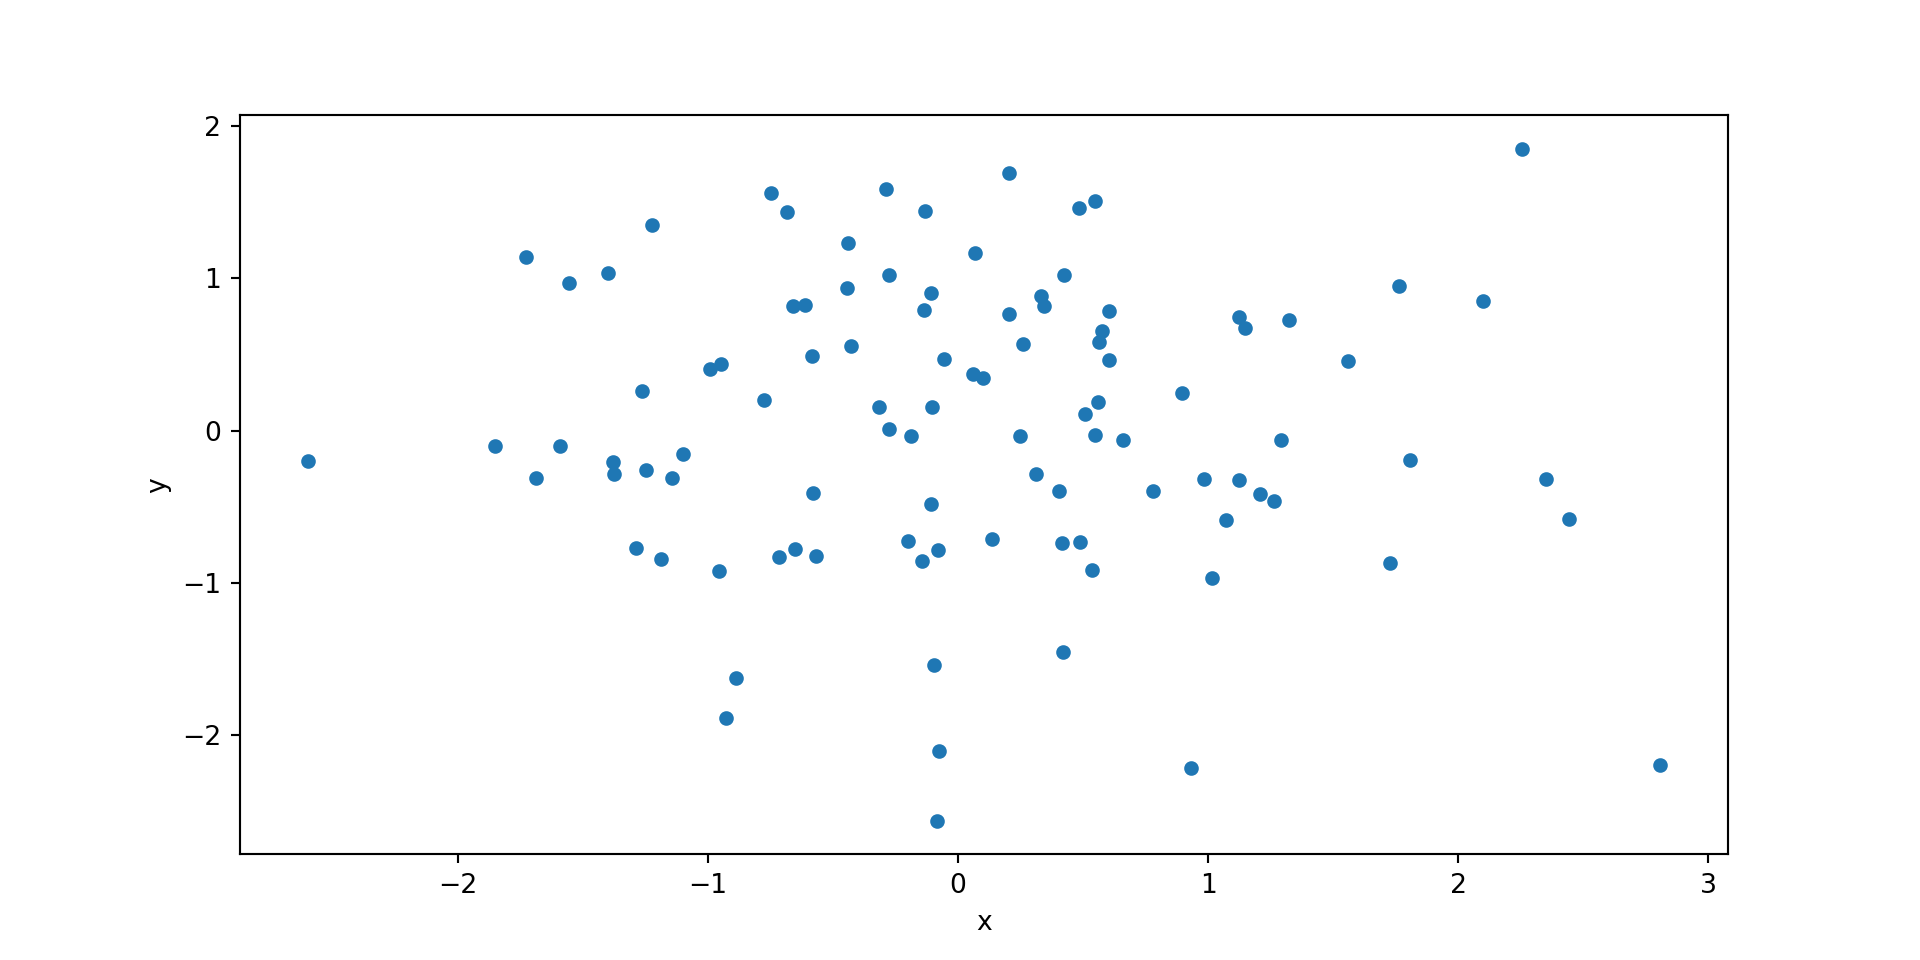

Dollar Street

Important
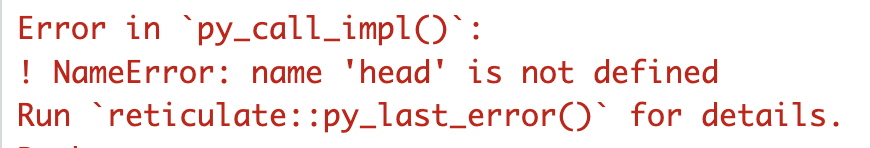
Python has special functions that work with specific types of data elements like a pandas data frame. These functions are called ‘methods.’ So, gapminder.head() tells Python to apply the head method to the data frame.
I use R more than Python, so this syntax sometimes confuses me. In fact, this won’t work:
Life expectancy by continent - 3
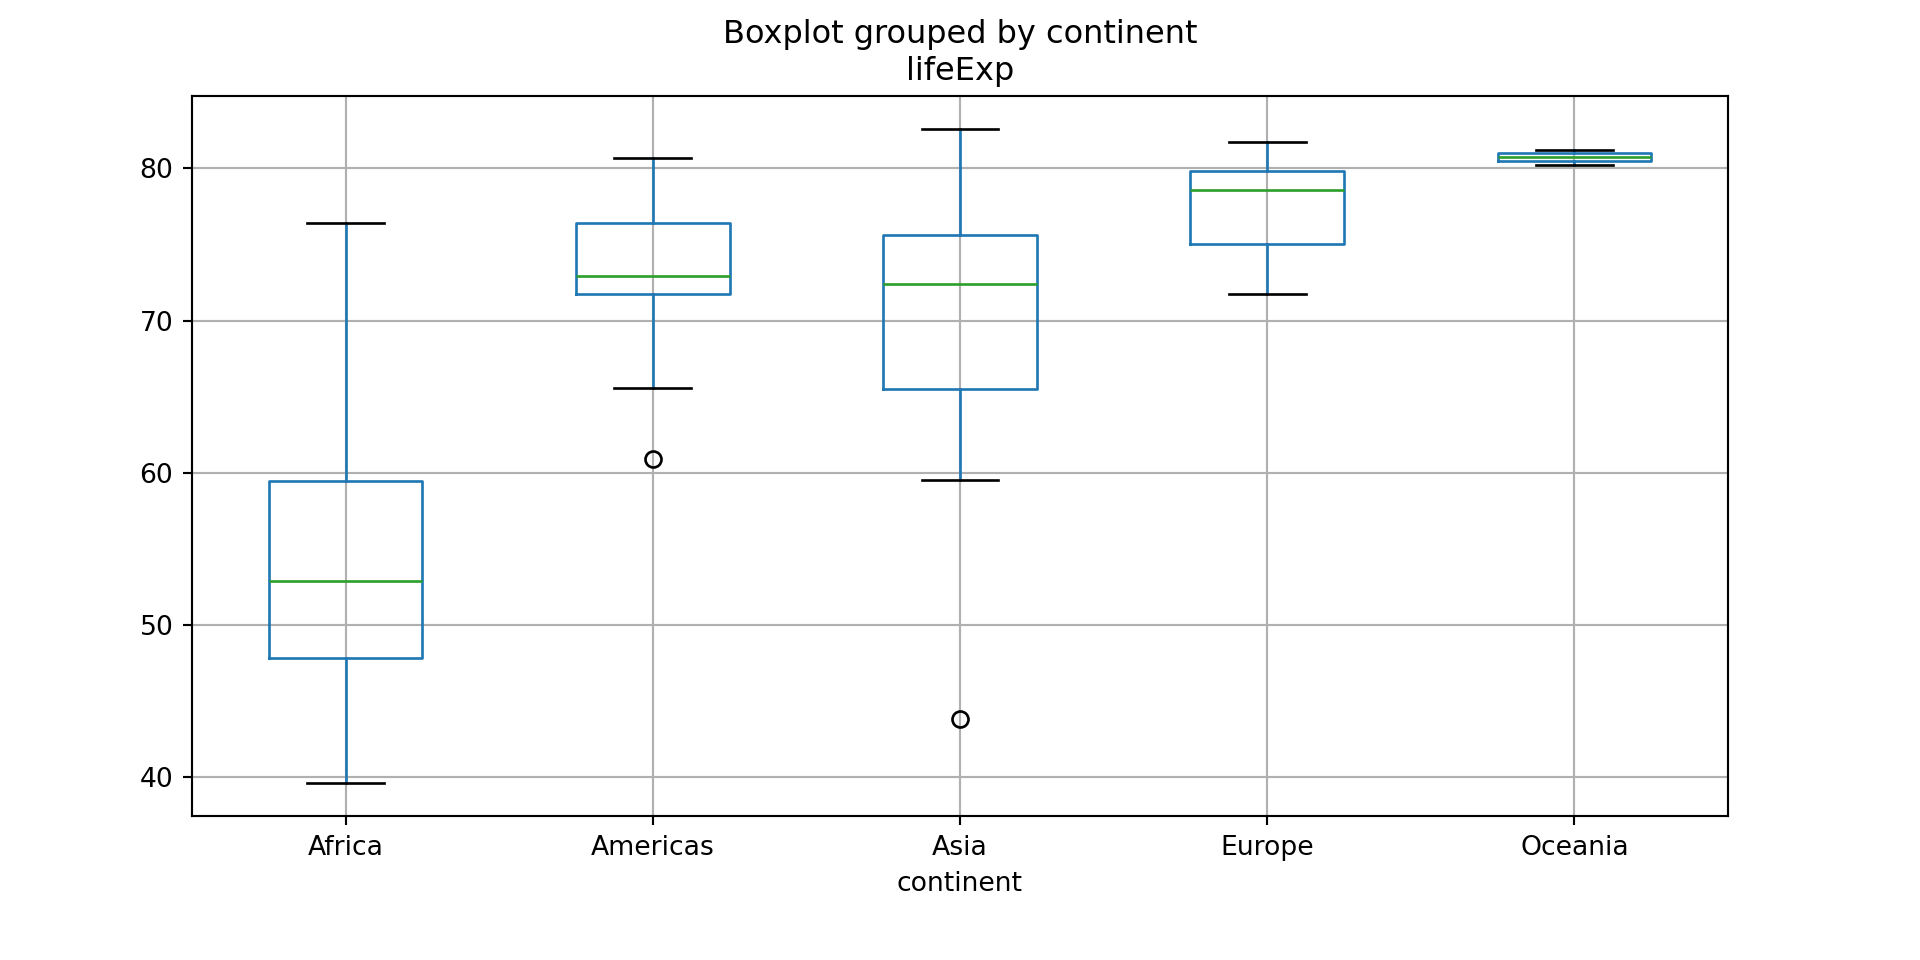
Life expectancy by continent - 3b
array([[<Axes: title={'center': 'Africa'}>,
        <Axes: title={'center': 'Americas'}>],
       [<Axes: title={'center': 'Asia'}>,
        <Axes: title={'center': 'Europe'}>],
       [<Axes: title={'center': 'Oceania'}>, <Axes: >]], dtype=object)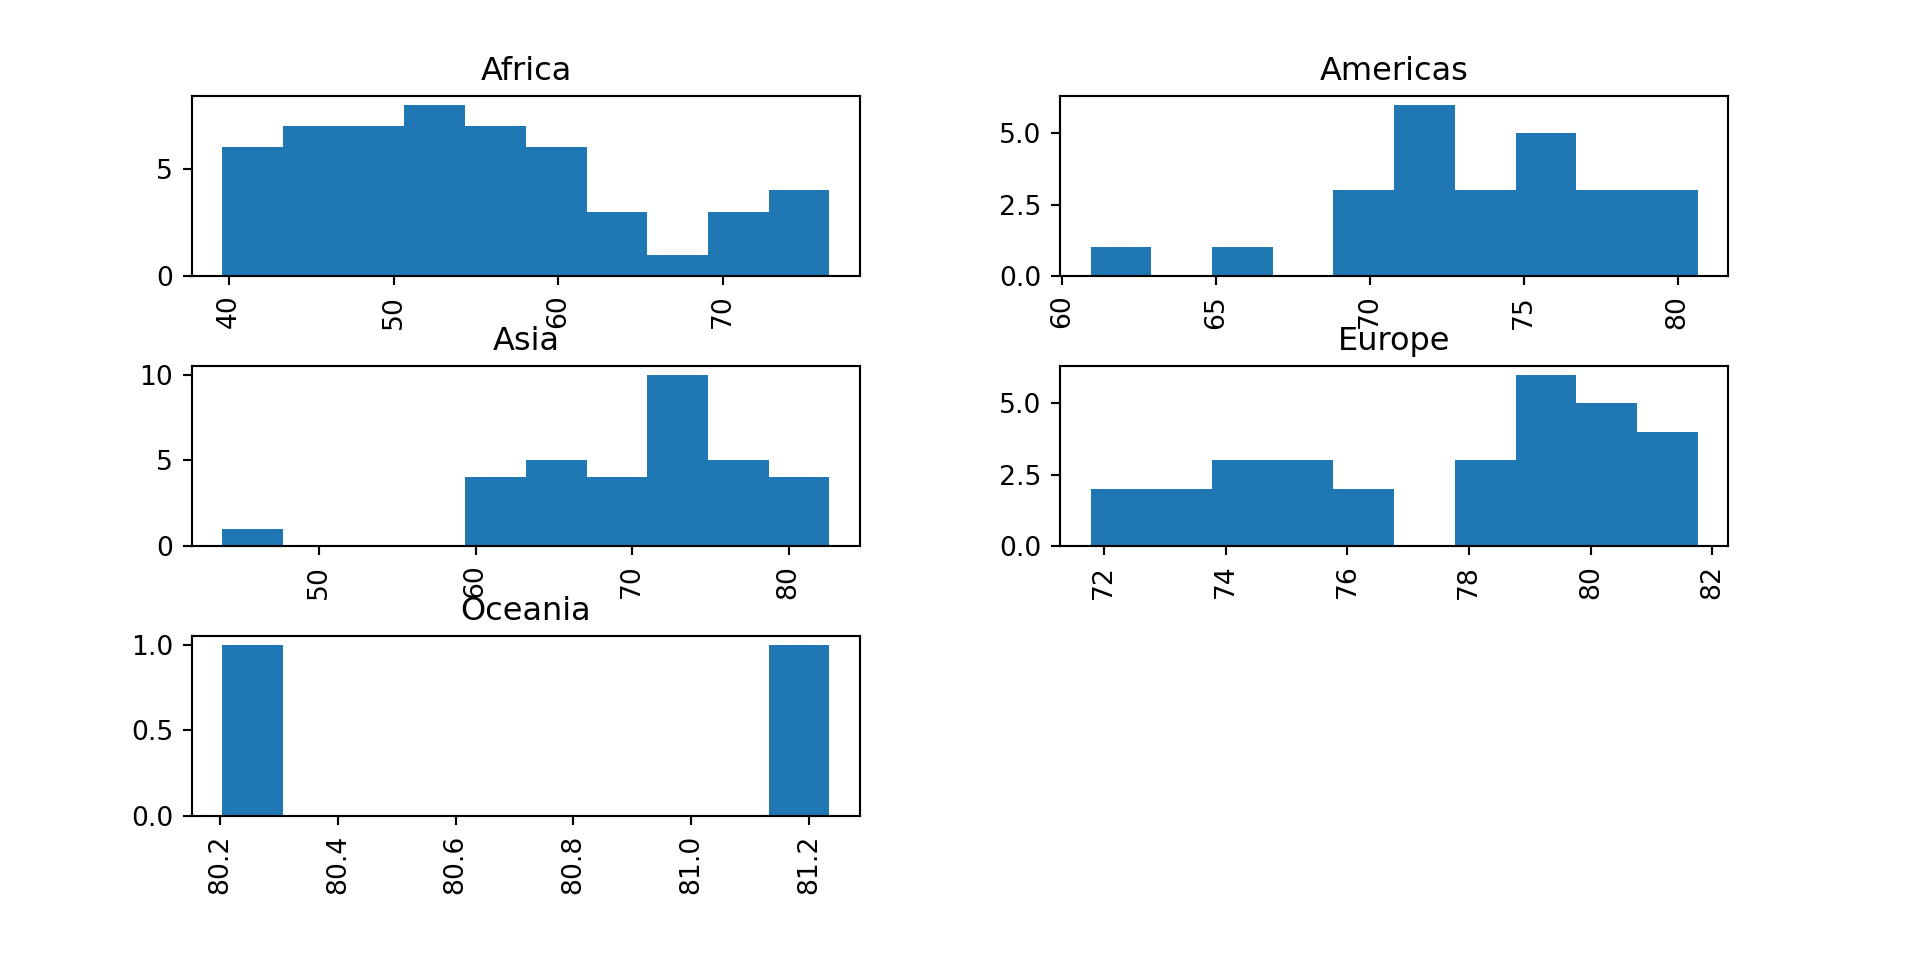
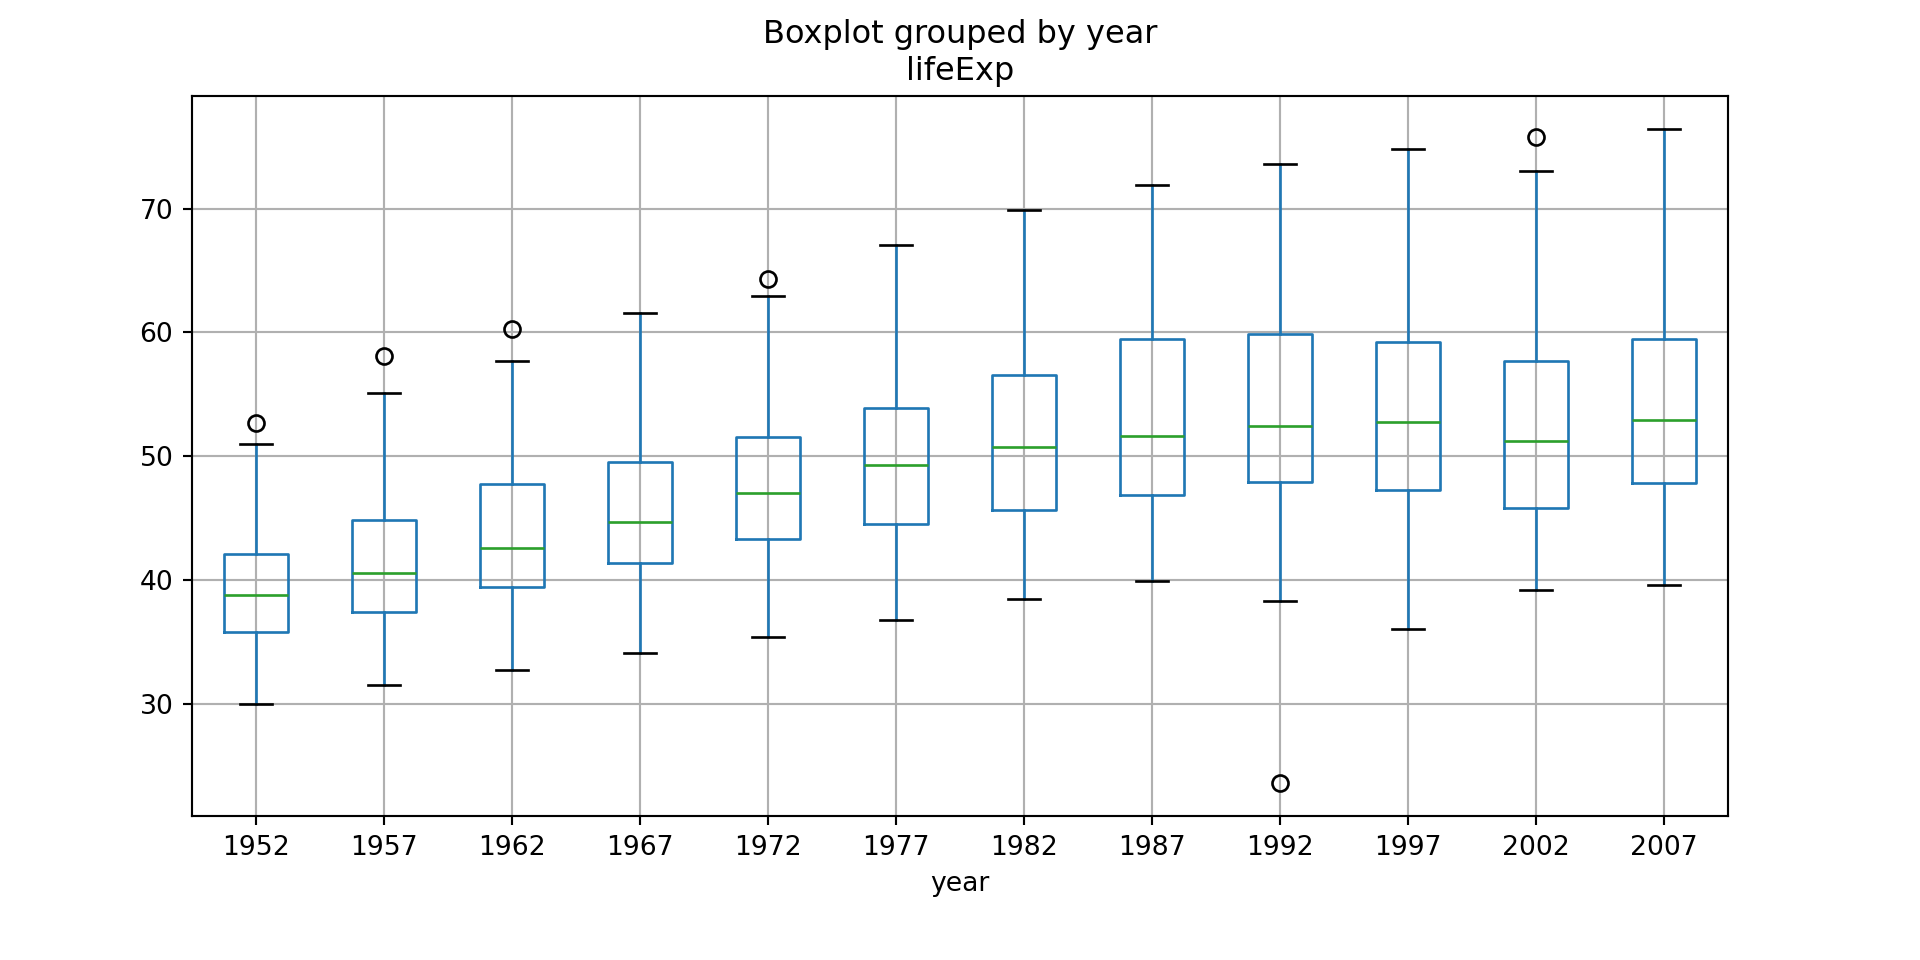
Life expectancy over time – 3
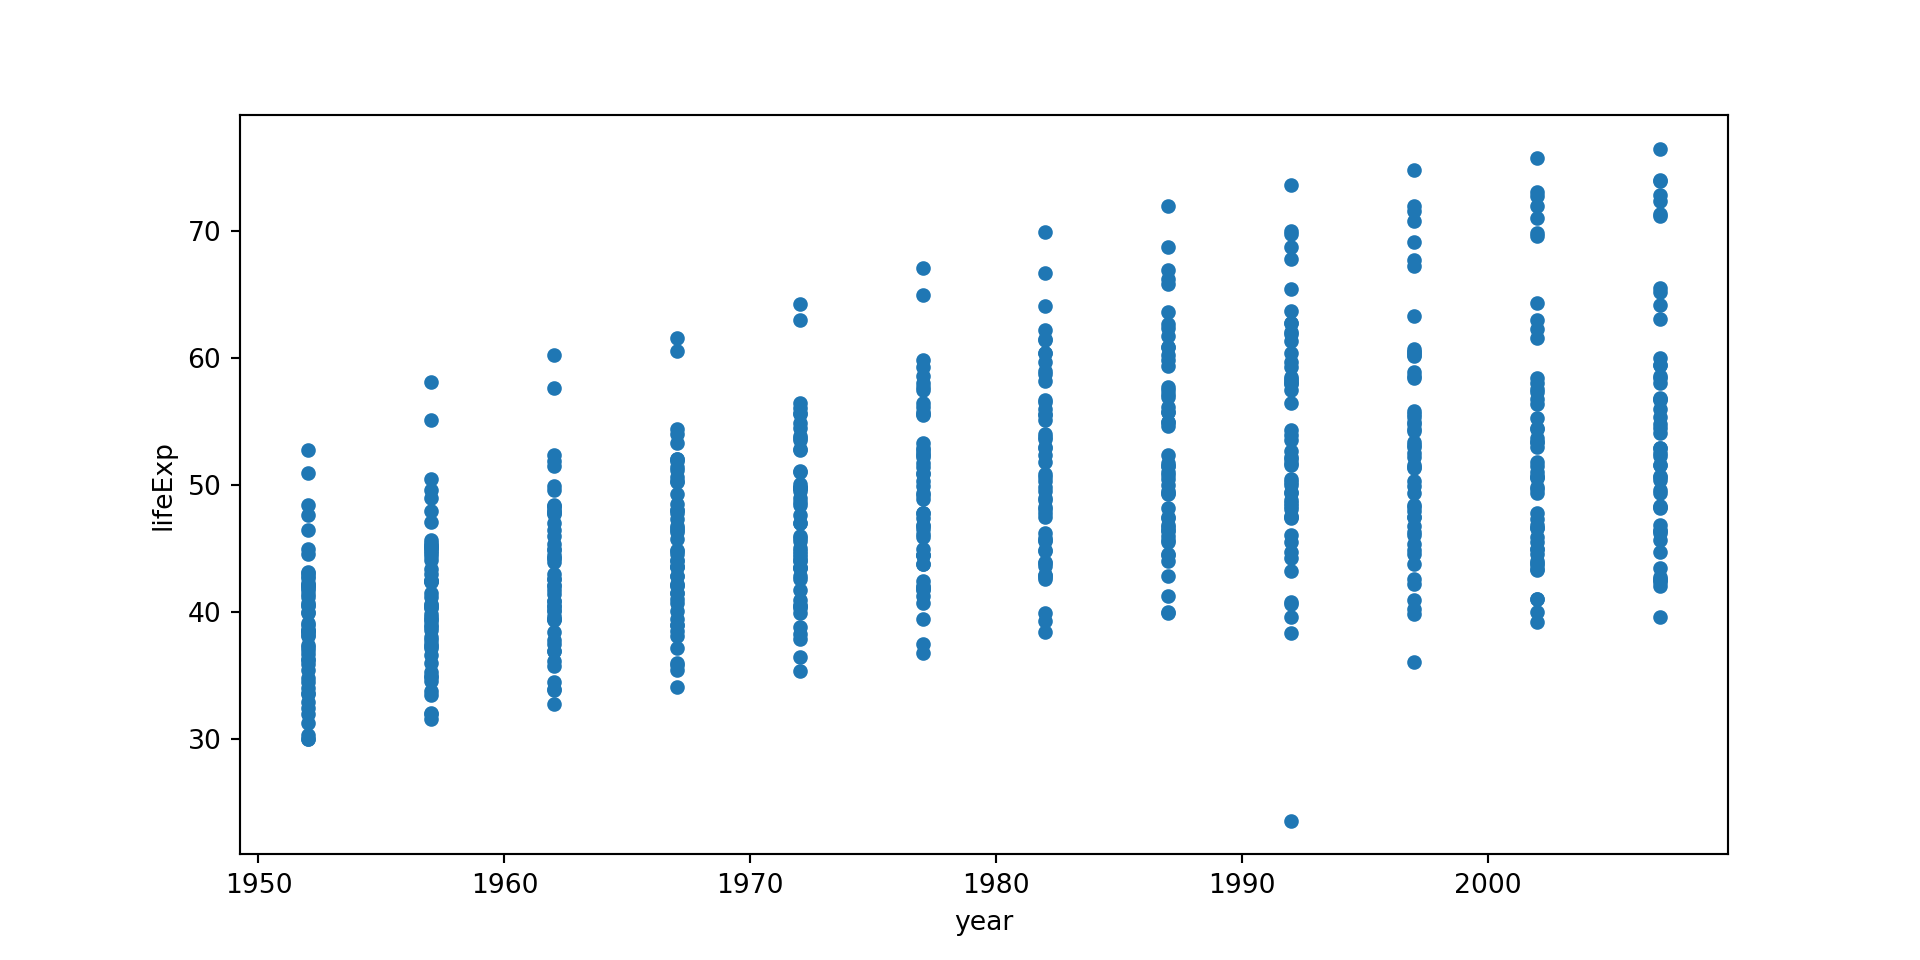
Life expectancy over time – 3b
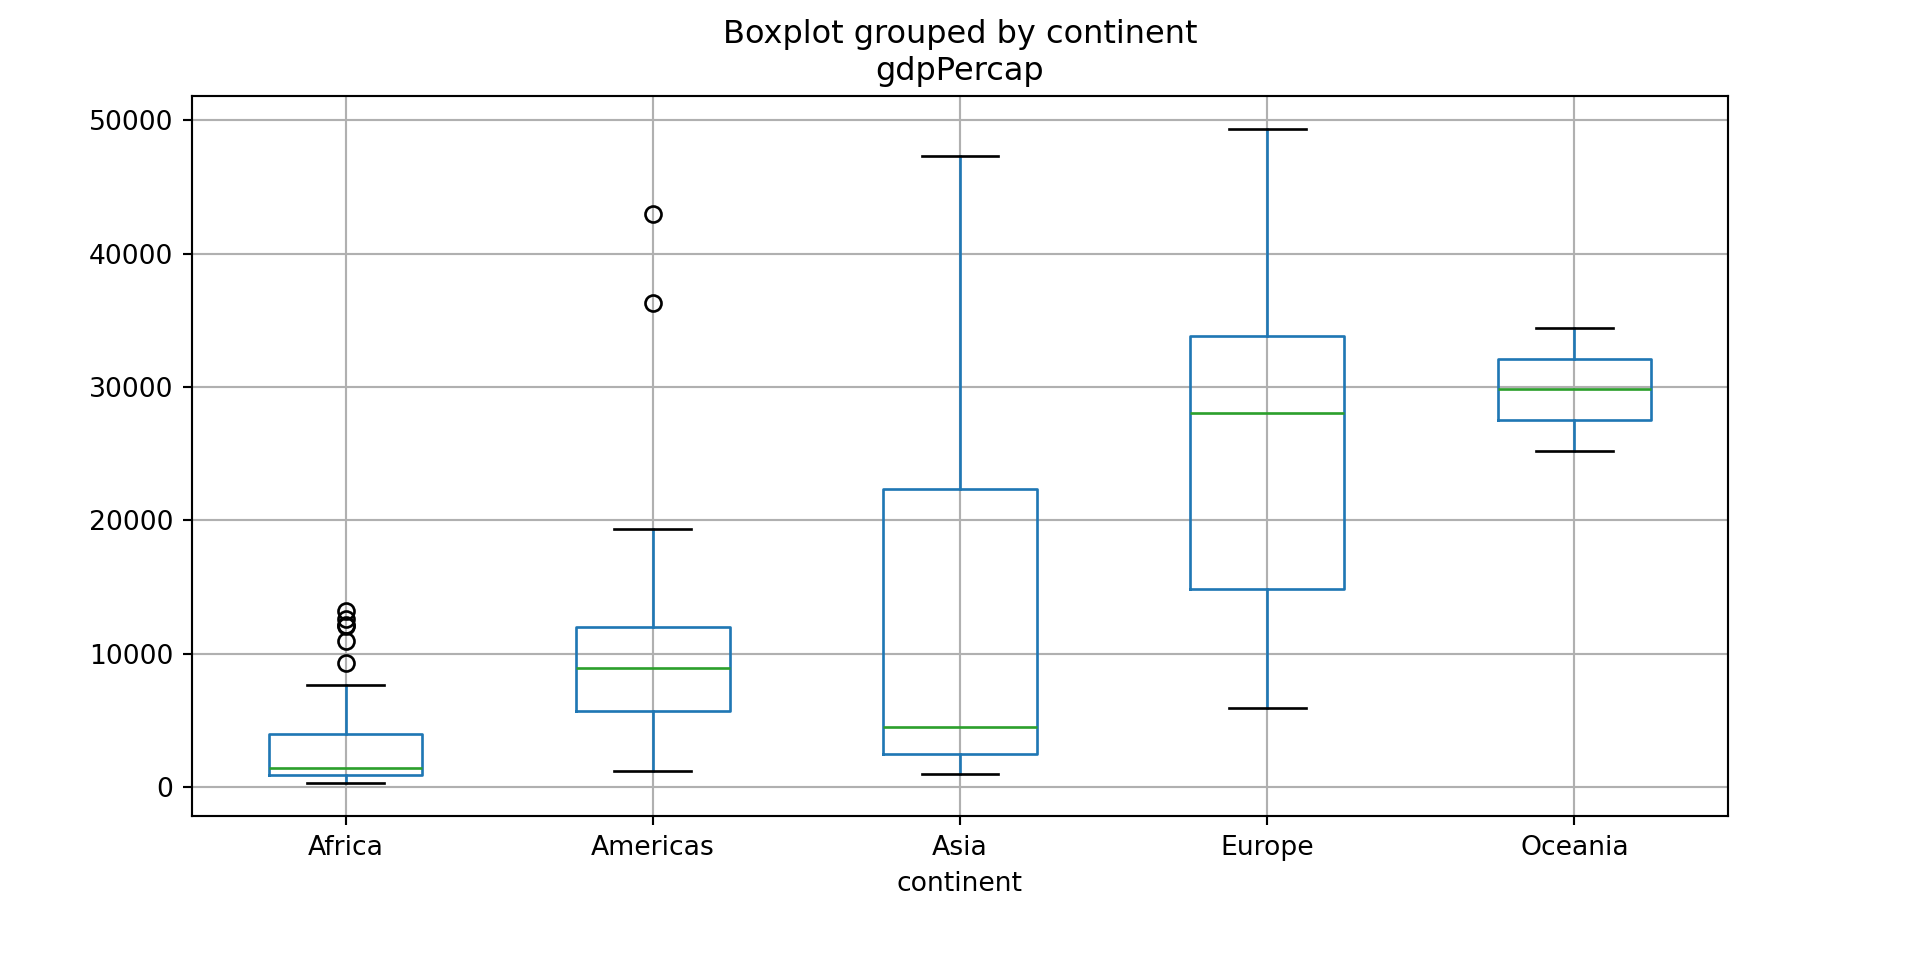
Wealth by continent
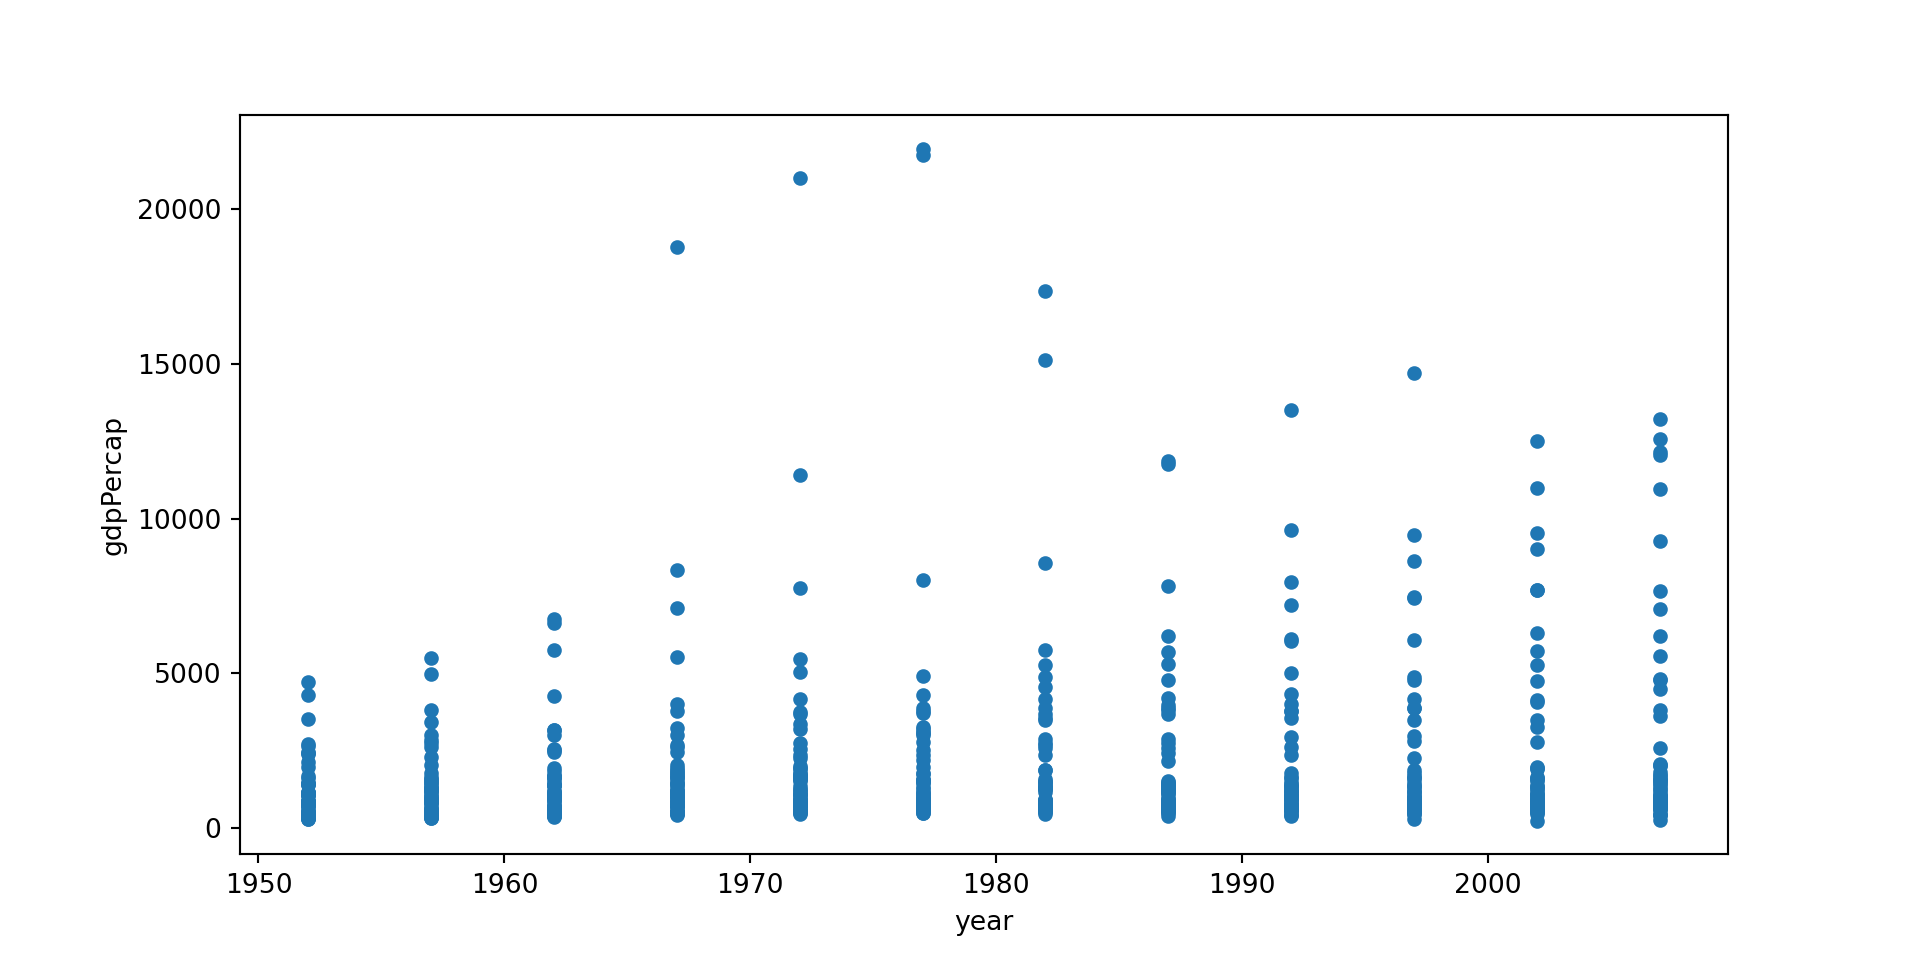
Wealth over time (Africa)
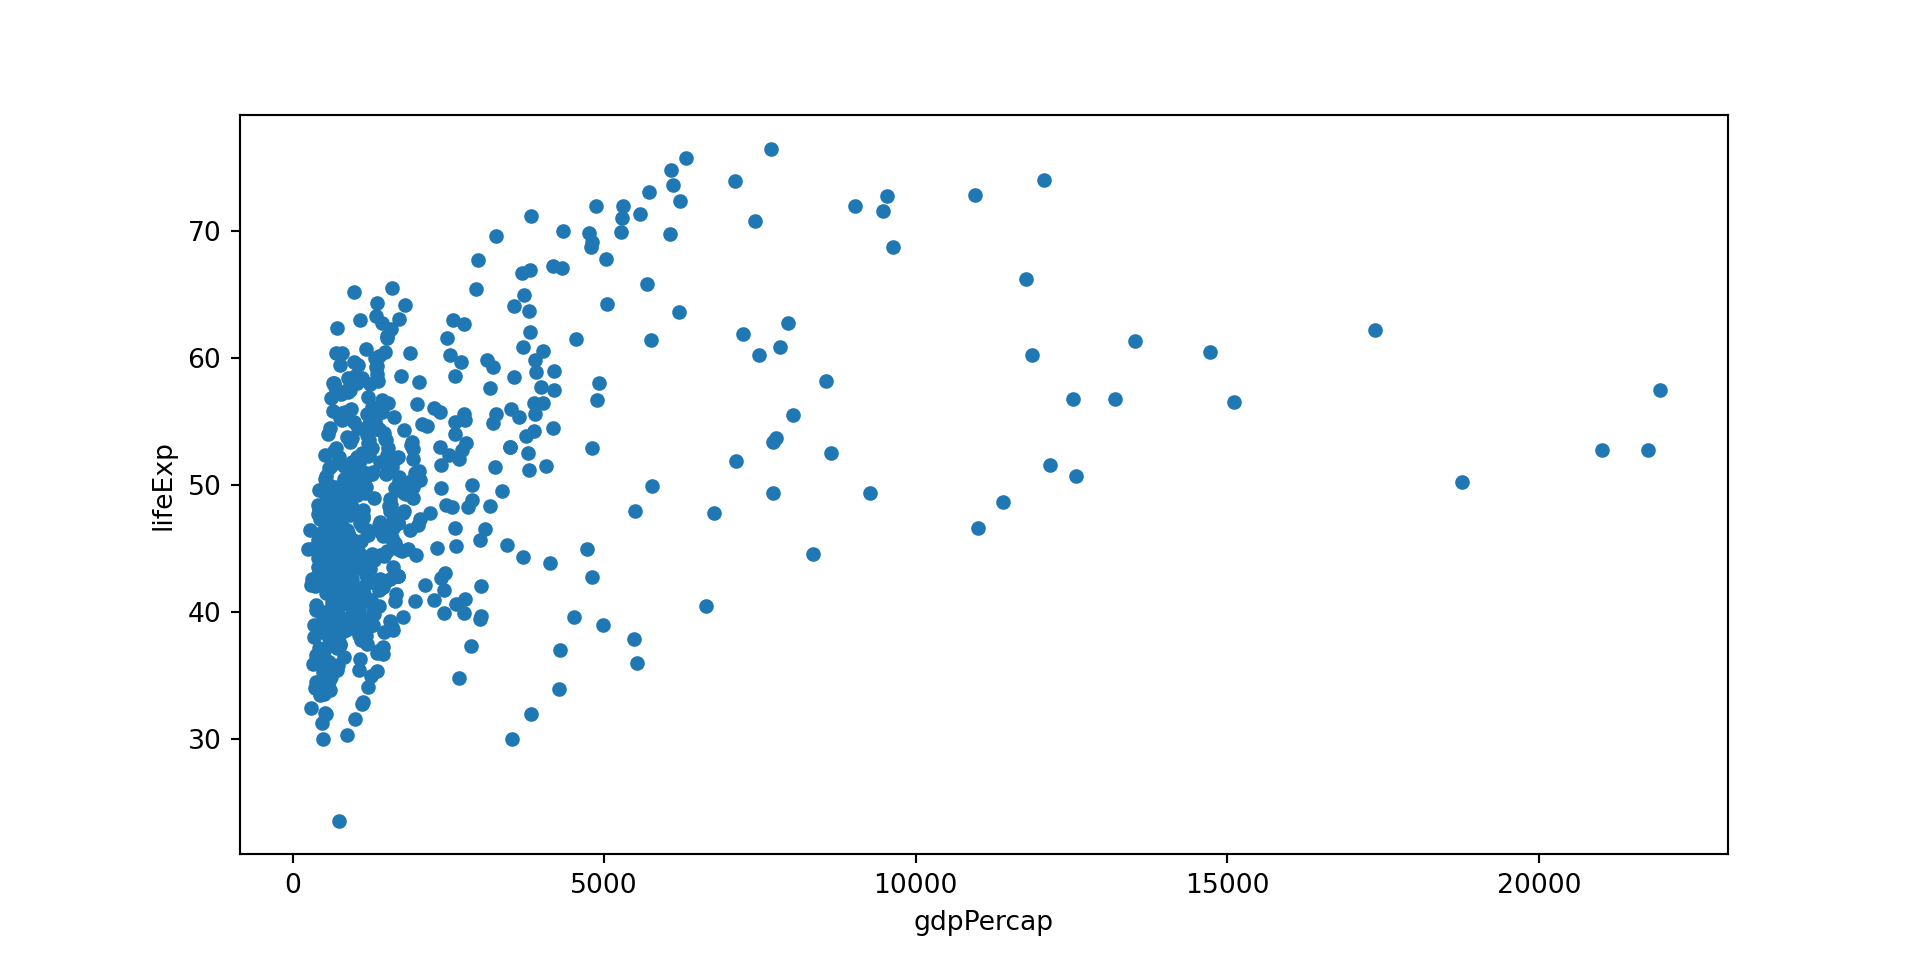
Life expectancy by wealth (Africa)