flowchart LR
  A[Question] --> B[Study_1]
  A --> C[Study_2]
  A --> D[Study_3]
  B --> E[Meta-analysis]
  C --> E
  D --> E
2024-11-06 Wed
Many analysts
Overview
Prelude
Records (2013)
Hd (2024)
Announcements
- Due this Friday
Last time…
- Revisiting the meta-analysis simulation
- How was this like a meta-analysis?
- What are the pros of meta-analysis?
- What are some cons?
Today
Many analysts
- Discuss
- Silberzahn et al. (2018)
Comparing approaches
flowchart LR
  A[Dataset] --> B[Question]
  B --> C[Analysis_1]
  B --> D[Analysis_2]
  B --> E[Analysis_3]
  C --> F[Multiverse]
  D --> F
  E --> F
Empirical research inevitably includes constructing a data set by processing raw data into a form ready for statistical analysis. Data processing often involves choices among several reasonable options for excluding, transforming, and coding data. We suggest that instead of performing only one analysis, researchers could perform a multiverse analysis, which involves performing all analyses across the whole set of alternatively processed data sets corresponding to a large set of reasonable scenarios.
Steegen et al. (2016)
Using an example focusing on the effect of fertility on religiosity and political attitudes, we show that analyzing a single data set can be misleading and propose a multiverse analysis as an alternative practice. A multiverse analysis offers an idea of how much the conclusions change because of arbitrary choices in data construction and gives pointers as to which choices are most consequential in the fragility of the result.
Steegen et al. (2016)
Many-analysts
Silberzahn, R., Uhlmann, E. L., Martin, D. P., Anselmi, P., Aust, F., Awtrey, E., Bahník, Š., Bai, F., Bannard, C., Bonnier, E., Carlsson, R., Cheung, F., Christensen, G., Clay, R., Craig, M. A., Dalla Rosa, A., Dam, L., Evans, M. H., Flores Cervantes, I., … Nosek, B. A. (2018). Many analysts, one data set: Making transparent how variations in analytic choices affect results. Advances in Methods and Practices in Psychological Science, 1(3), 337–356. https://doi.org/10.1177/2515245917747646
What if scientific results are highly contingent on subjective decisions at the analysis stage? In that case, the process of certifying a particular result on the basis of an idiosyncratic analytic strategy might be fraught with unrecognized uncertainty (Gelman & Loken, 2014), and research findings might be less trustworthy than they at first appear to be (Cumming, 2014). Had the authors made different assumptions, an entirely different result might have been observed (Babtie, Kirk, & Stumpf, 2014).
Silberzahn et al. (2018)
Abstract
Twenty-nine teams involving 61 analysts used the same data set to address the same research question: whether soccer referees are more likely to give red cards to dark-skin-toned players than to light-skin-toned players.
Silberzahn et al. (2018)
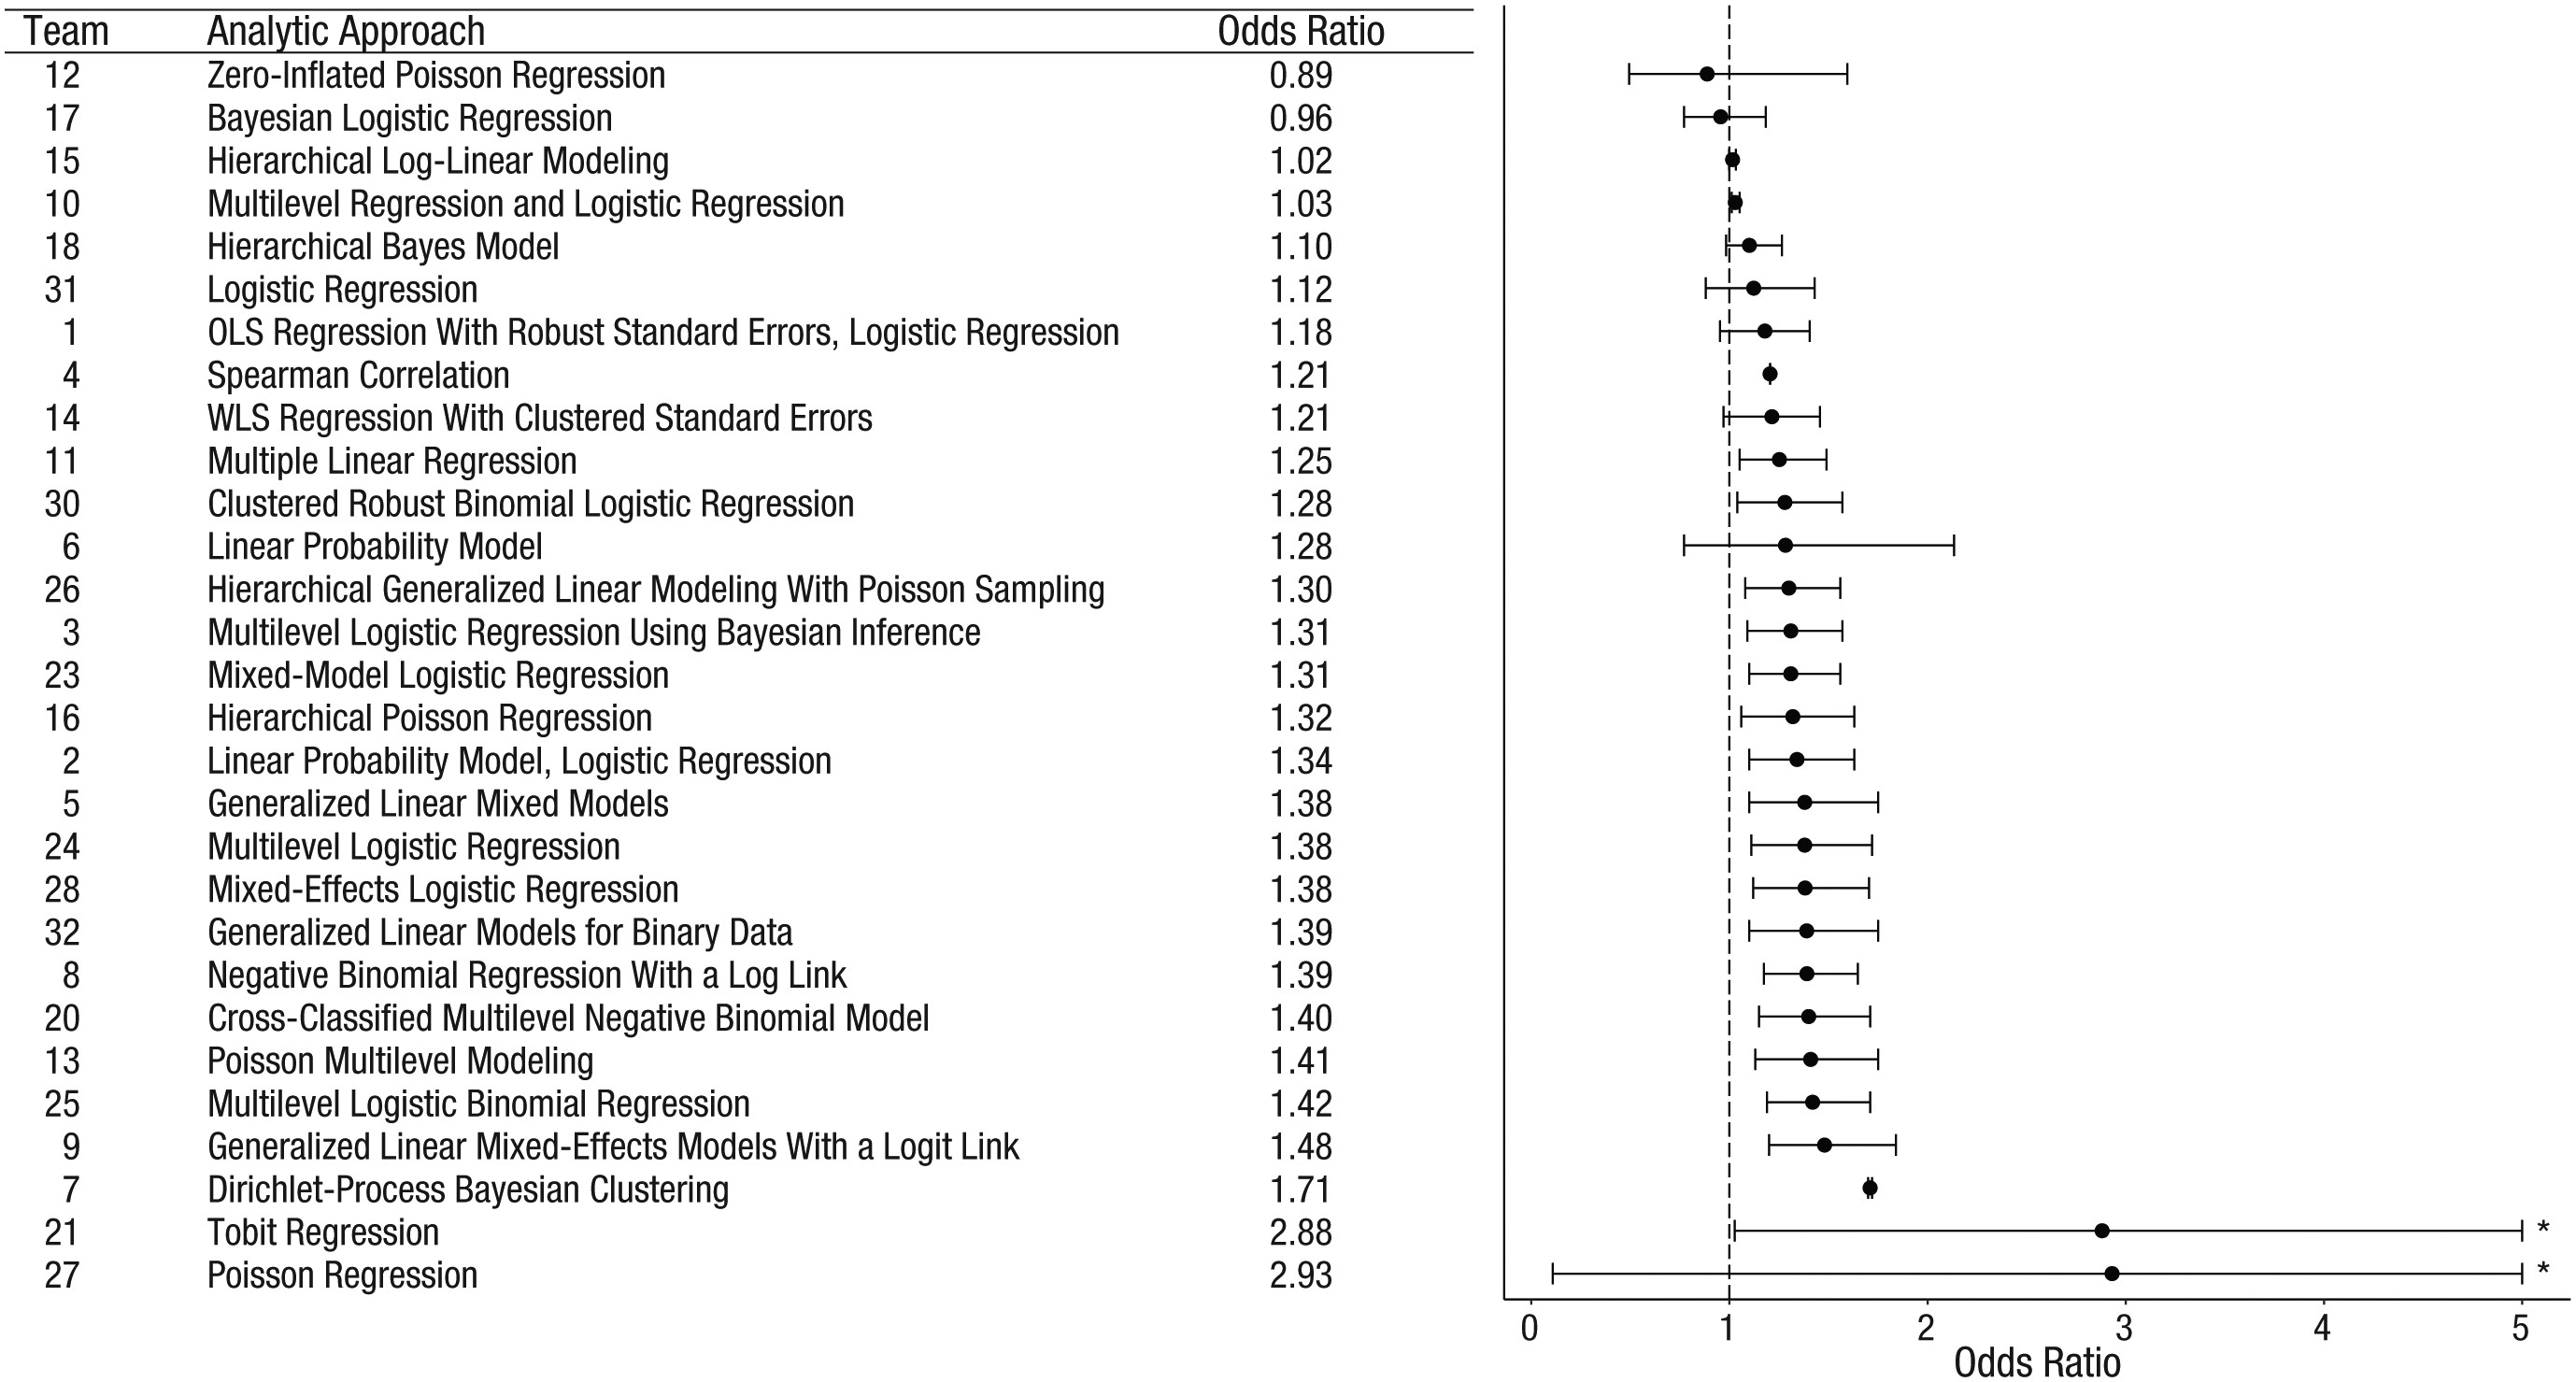
Analytic approaches varied widely across the teams, and the estimated effect sizes ranged from 0.89 to 2.93 (Mdn = 1.31) in odds-ratio units. Twenty teams (69%) found a statistically significant positive effect, and 9 teams (31%) did not observe a significant relationship.
Silberzahn et al. (2018)
Tip
Odds ratios (OR) (Szumilas, 2010):
- OR < 1: Outcome less likely than comparison
- OR = 1: Outcome and comparison equally likely
- OR > 1: Outcome more likely than comparison
Wikipedia also has a thorough discussion.
Overall, the 29 different analyses used 21 unique combinations of covariates.

Figure 2 from Silberzahn et al. (2018)
Point estimates (in order of magnitude) and 95% confidence intervals for the effect of soccer players’ skin tone on the number of red cards awarded by referees. Reported results, along with the analytic approach taken, are shown for each of the 29 analytic teams. The teams are ordered so that the smallest reported effect size is at the top and the largest is at the bottom…
Silberzahn et al. (2018)
…The asterisks indicate upper bounds that have been truncated to increase the interpretability of the plot; the actual upper bounds of the confidence intervals were 11.47 for Team 21 and 78.66 for Team 27. OLS = ordinary least squares; WLS = weighted least squares.
Silberzahn et al. (2018)

Figure 4 from Silberzahn et al. (2018)
Fig. 4. The teams’ subjective beliefs about the primary research question across time. For each of the four subjective-beliefs surveys, the plot on the left shows each team leader’s response to the question asking whether players’ skin tone predicts how many red cards they receive. The heavy black line represents the mean response at each time point…
Silberzahn et al. (2018)
Each individual trajectory is jittered slightly to increase the interpretability of the plot. The plot on the right shows the number of team leaders who endorsed each response option at each time point.
Silberzahn et al. (2018)

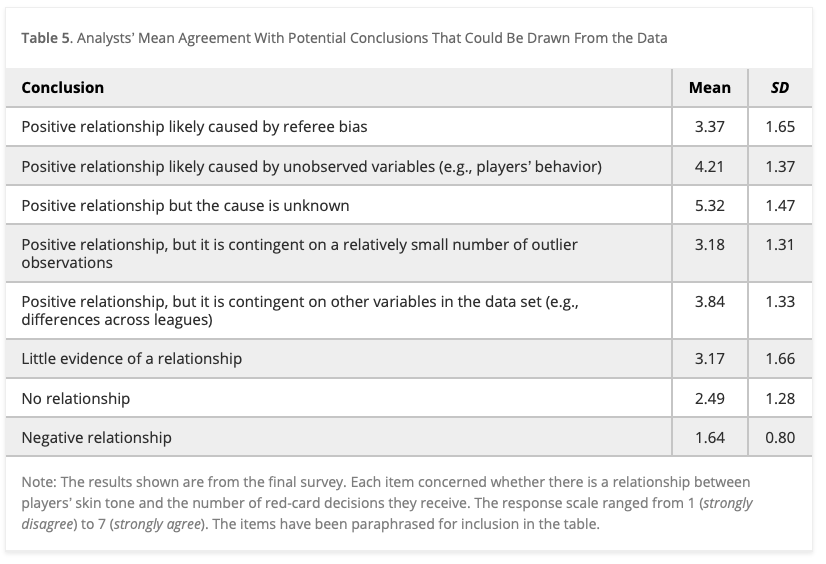
Table 5 from Silberzahn et al. (2018). Analysts’ Mean Agreement With Potential Conclusions That Could Be Drawn From the Data
Note: The results shown are from the final survey. Each item concerned whether there is a relationship between players’ skin tone and the number of red-card decisions they receive. The response scale ranged from 1 (strongly disagree) to 7 (strongly agree). The items have been paraphrased for inclusion in the table.

These findings suggest that significant variation in the results of analyses of complex data may be difficult to avoid, even by experts with honest intentions. Crowdsourcing data analysis, a strategy in which numerous research teams are recruited to simultaneously investigate the same research question, makes transparent how defensible, yet subjective, analytic choices influence research results.
Silberzahn et al. (2018)
Why the inconsistency?
Our conjecture is that it was the unclear research question given to the teams.
Recall the research task that was set in the CSI: to find out whether players with dark skin tone are more likely to receive red cards than players with light skin tone. How would you interpret this research task? In our opinion, this verbal statement of the research question is quite diffuse.
What’s your question? What’s your model?

Figure 1 from Auspurg & Brüderl (2021).
Your turn
Your thoughts?
- So, are soccer referees more likely to give red cards to dark-skin-toned players?
- How is this approach related to p-hacking?
- How does the many analysts approach conflict with current practice?
- When does this approach make sense and when doesn’t it make sense?
- What about visualizing the data? Gilmore failed to see the effect, despite trying.
Conclusion from Auspurg & Brüderl (2021)
Applying sensitivity analyses to the result obtained with the CSI data, we demonstrated that the result of a modest racial bias in the likelihood of receiving a red card is quite sensitive to unobserved mediators. This indicates that this estimate, although consistent across many different model specifications, is probably not a true causal effect in itself.
Other examples of “many-analysts” or “multiverse” approaches

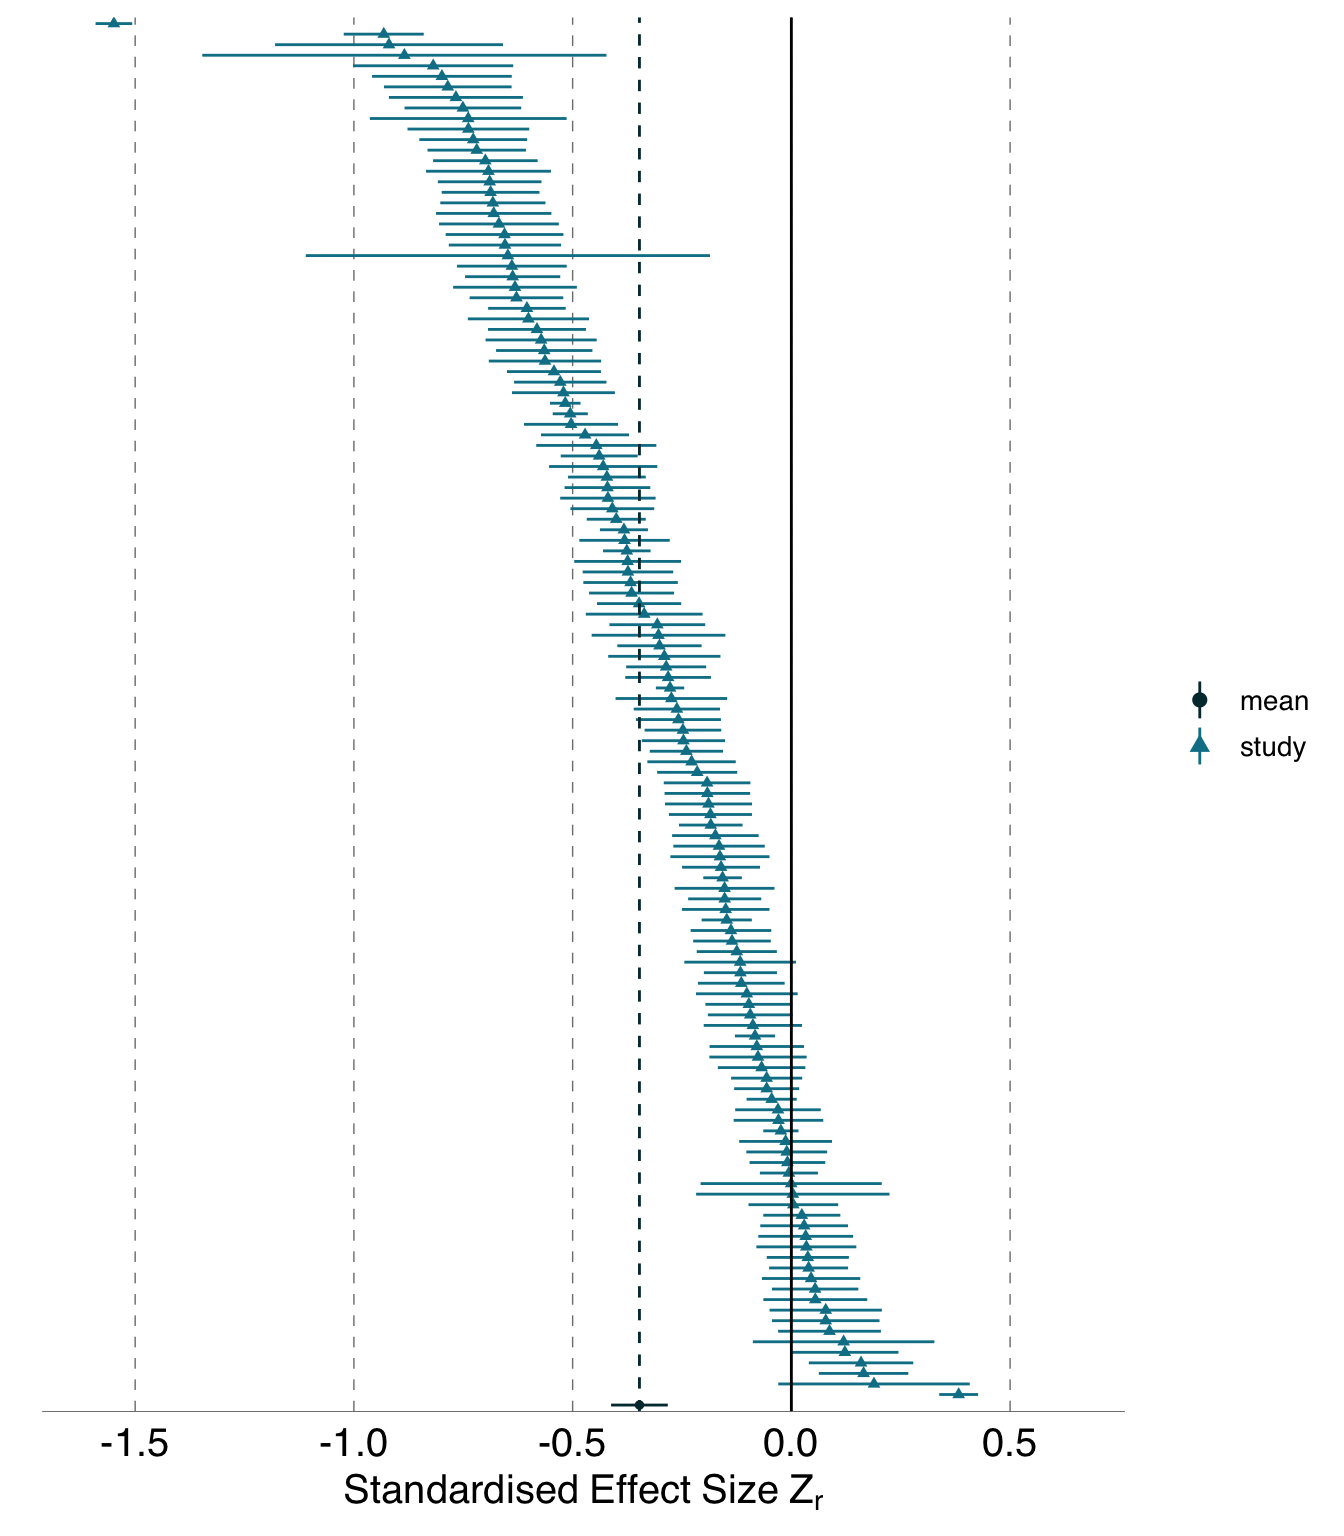
Figure 3.1 from Gould et al. (2023)
analyses with results that were far from the mean were no more or less likely to have dissimilar variable sets, use random effects in their models, or receive poor peer reviews than those analyses that found results that were close to the mean. The existence of substantial variability among analysis outcomes raises important questions about how ecologists and evolutionary biologists should interpret published results, and how they should conduct analyses in the future.
Gould et al. (2023)
…Here we assess the effect of this flexibility on the results of functional magnetic resonance imaging by asking 70 independent teams to analyse the same dataset, testing the same 9 ex-ante hypotheses. The flexibility of analytical approaches is exemplified by the fact that no two teams chose identical workflows to analyse the data.
Botvinik-Nezer et al. (2020)
This flexibility resulted in sizeable variation in the results of hypothesis tests, even for teams whose statistical maps were highly correlated at intermediate stages of the analysis pipeline.
Botvinik-Nezer et al. (2020)
Our findings show that analytical flexibility can have substantial effects on scientific conclusions, and identify factors that may be related to variability in the analysis of functional magnetic resonance imaging. The results emphasize the importance of validating and sharing complex analysis workflows, and demonstrate the need for performing and reporting multiple analyses of the same data.
Botvinik-Nezer et al. (2020)
Next time
Work Session: Final Projects
