Figure components
2025-02-04
In the news
“State of the nation project” (n.d.)
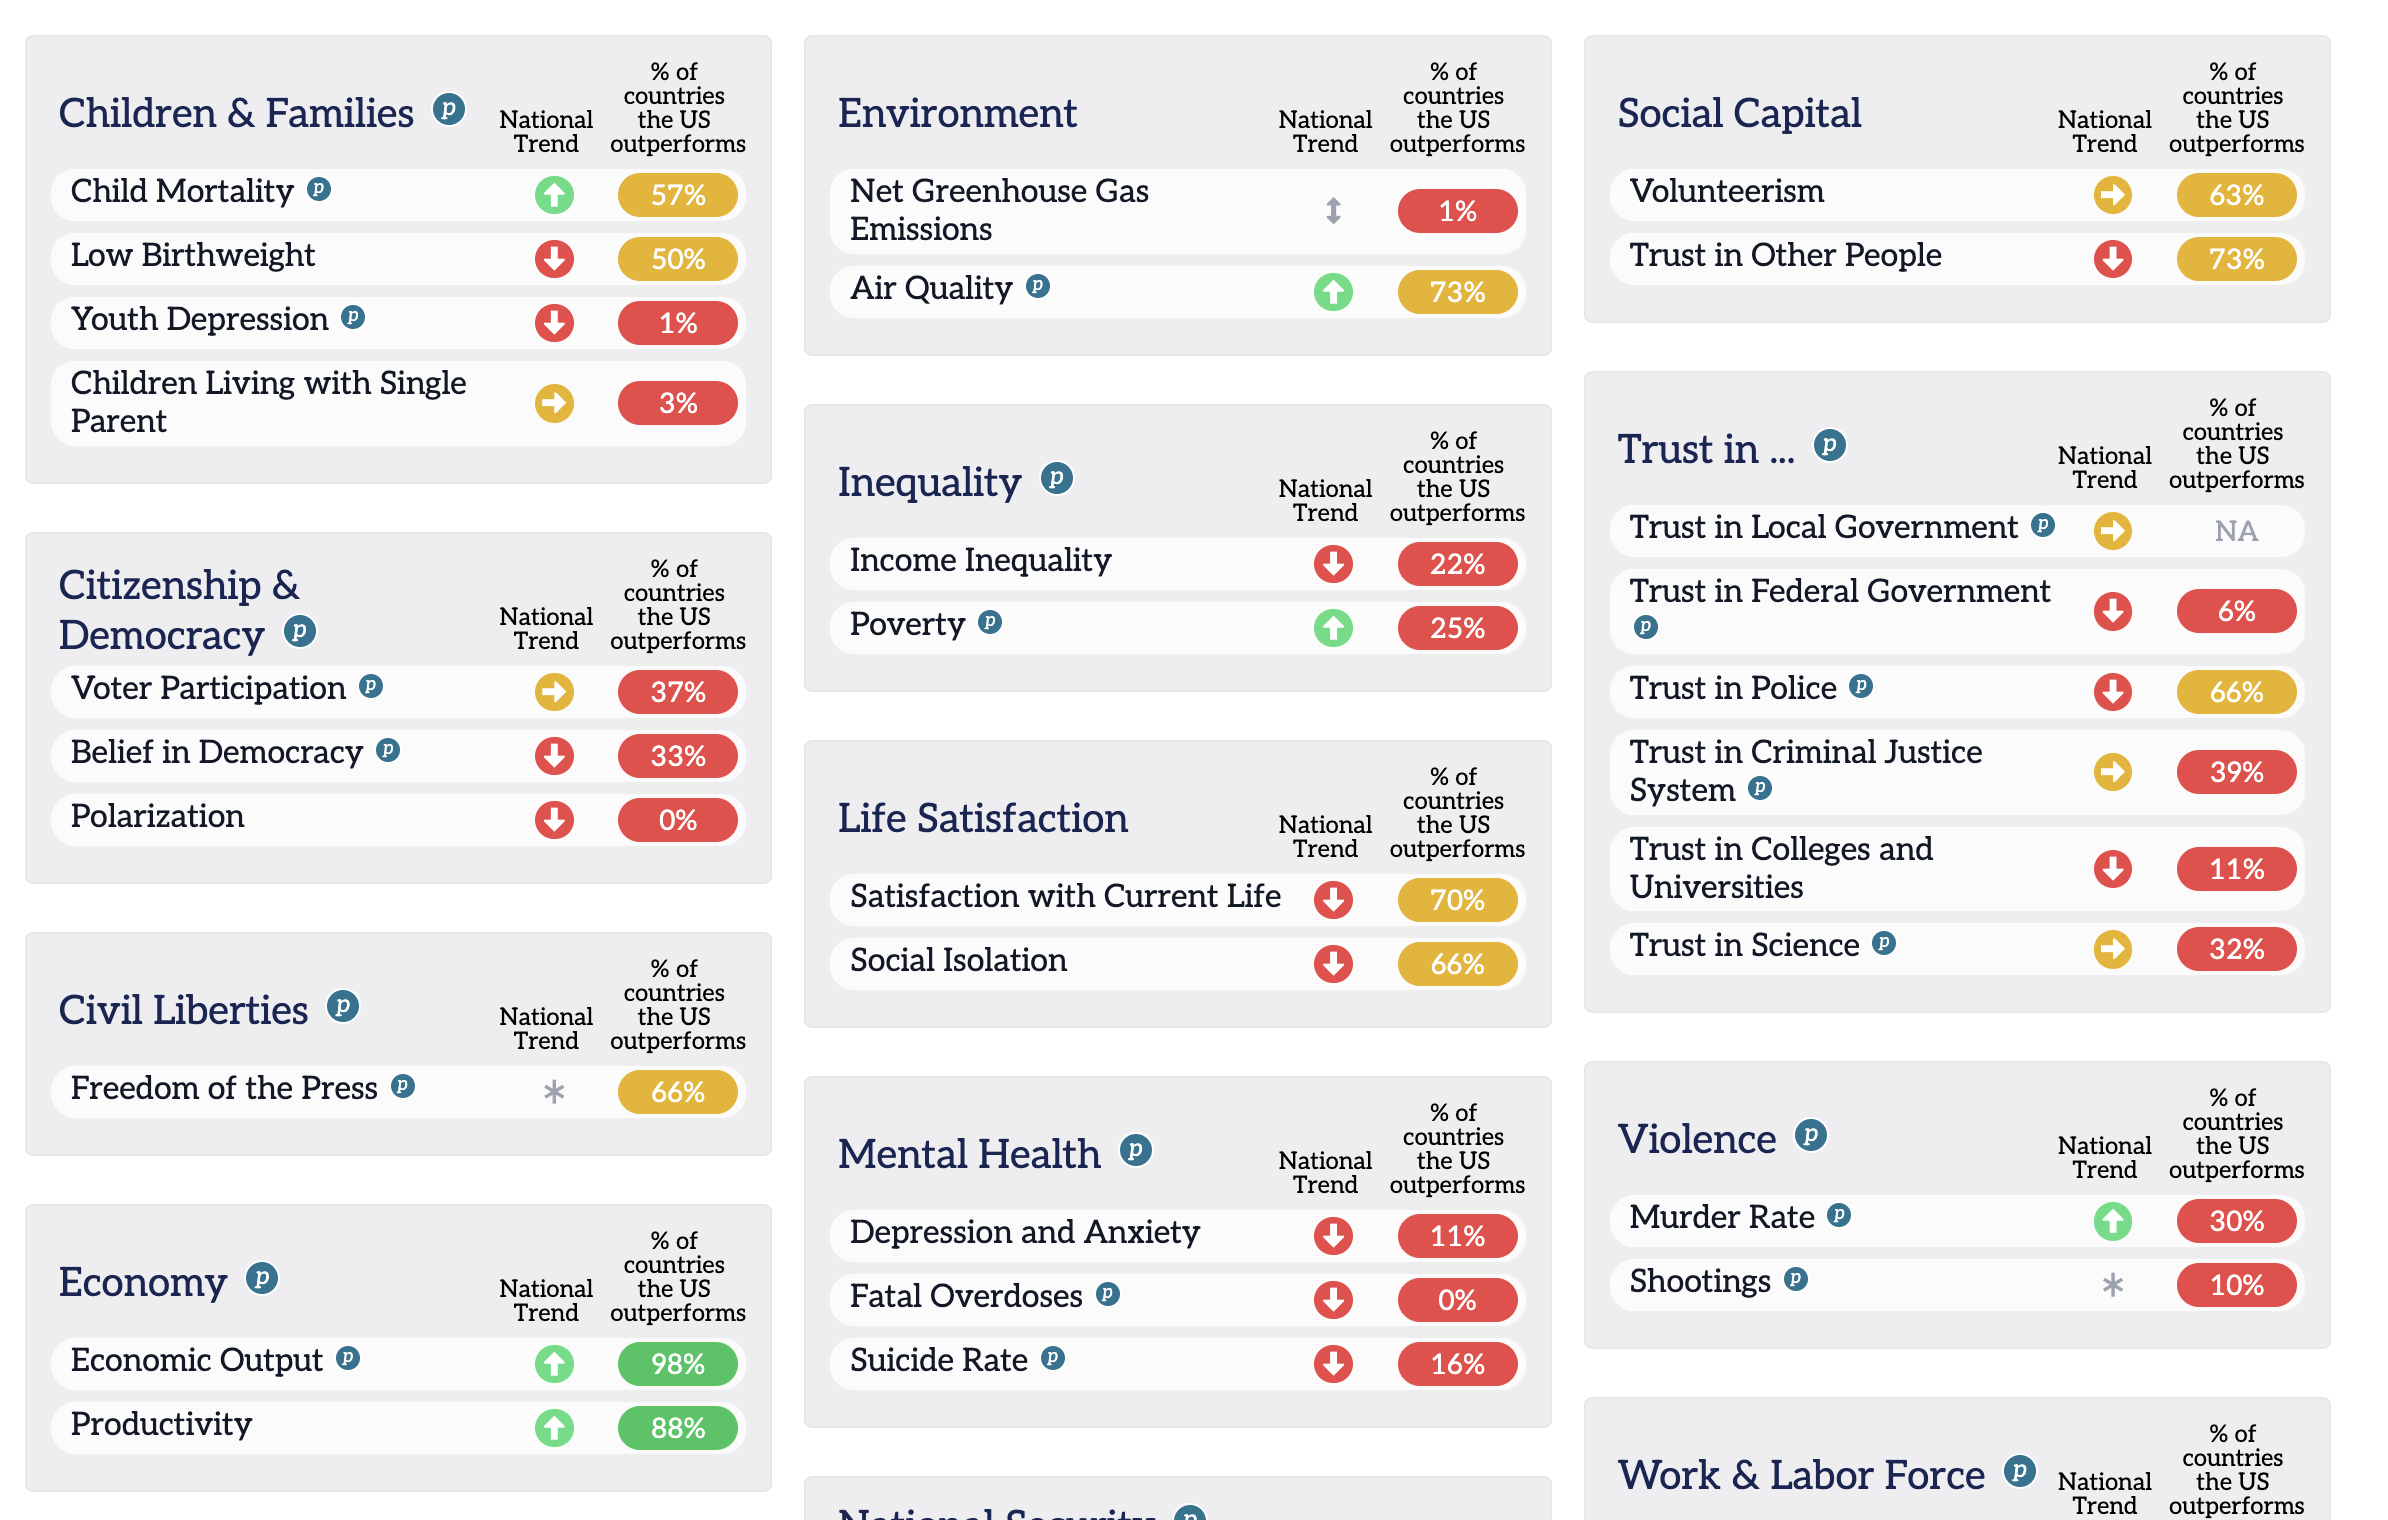
“State of the nation project” (n.d.)
Announcements
- No deadlines this week
- Please complete your classmates’ surveys:

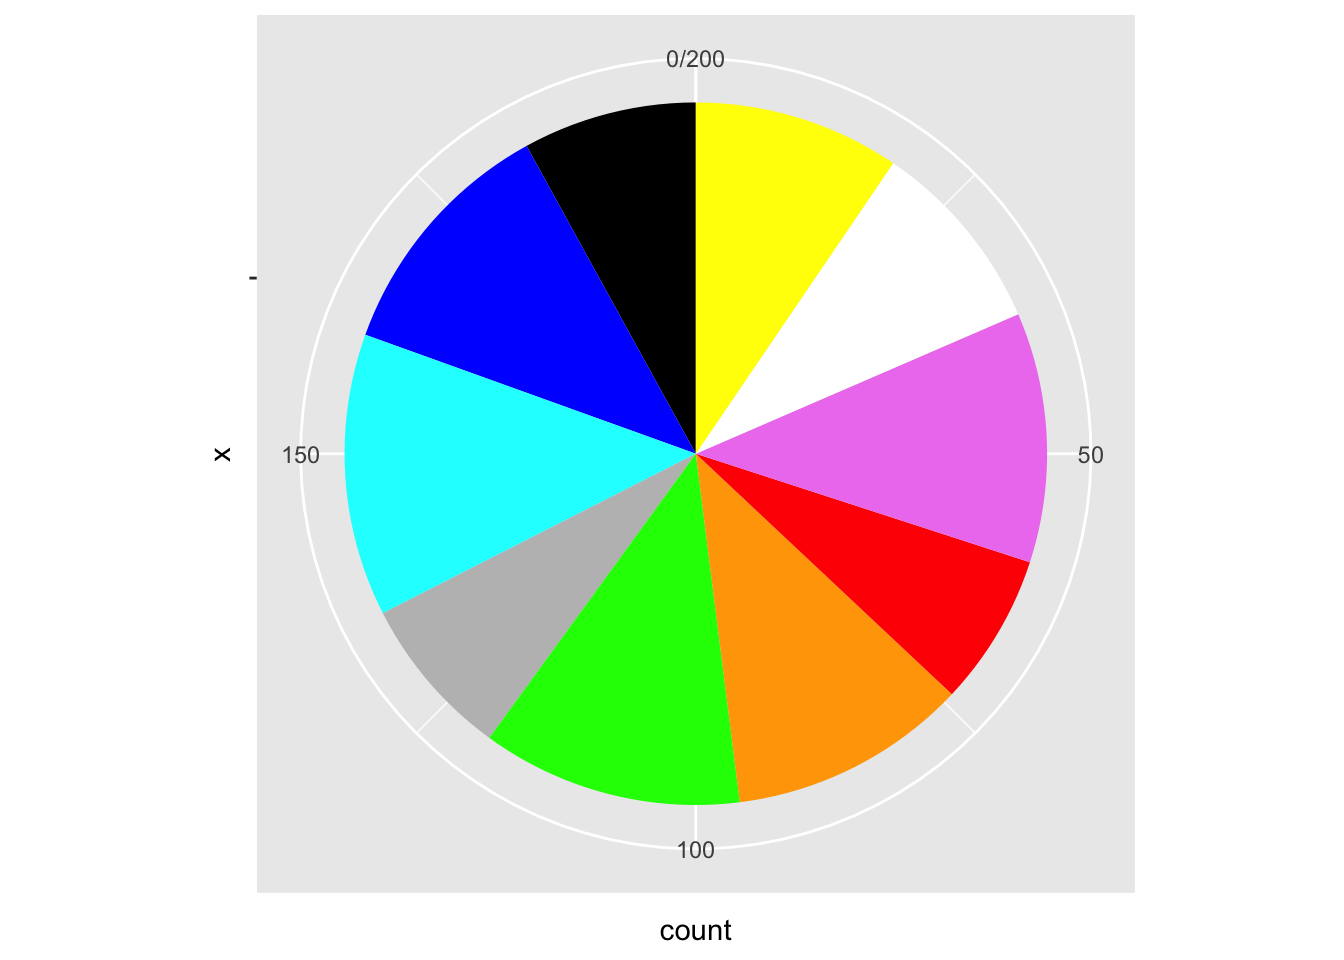
Pie charts
Ring charts

Mosaic chart

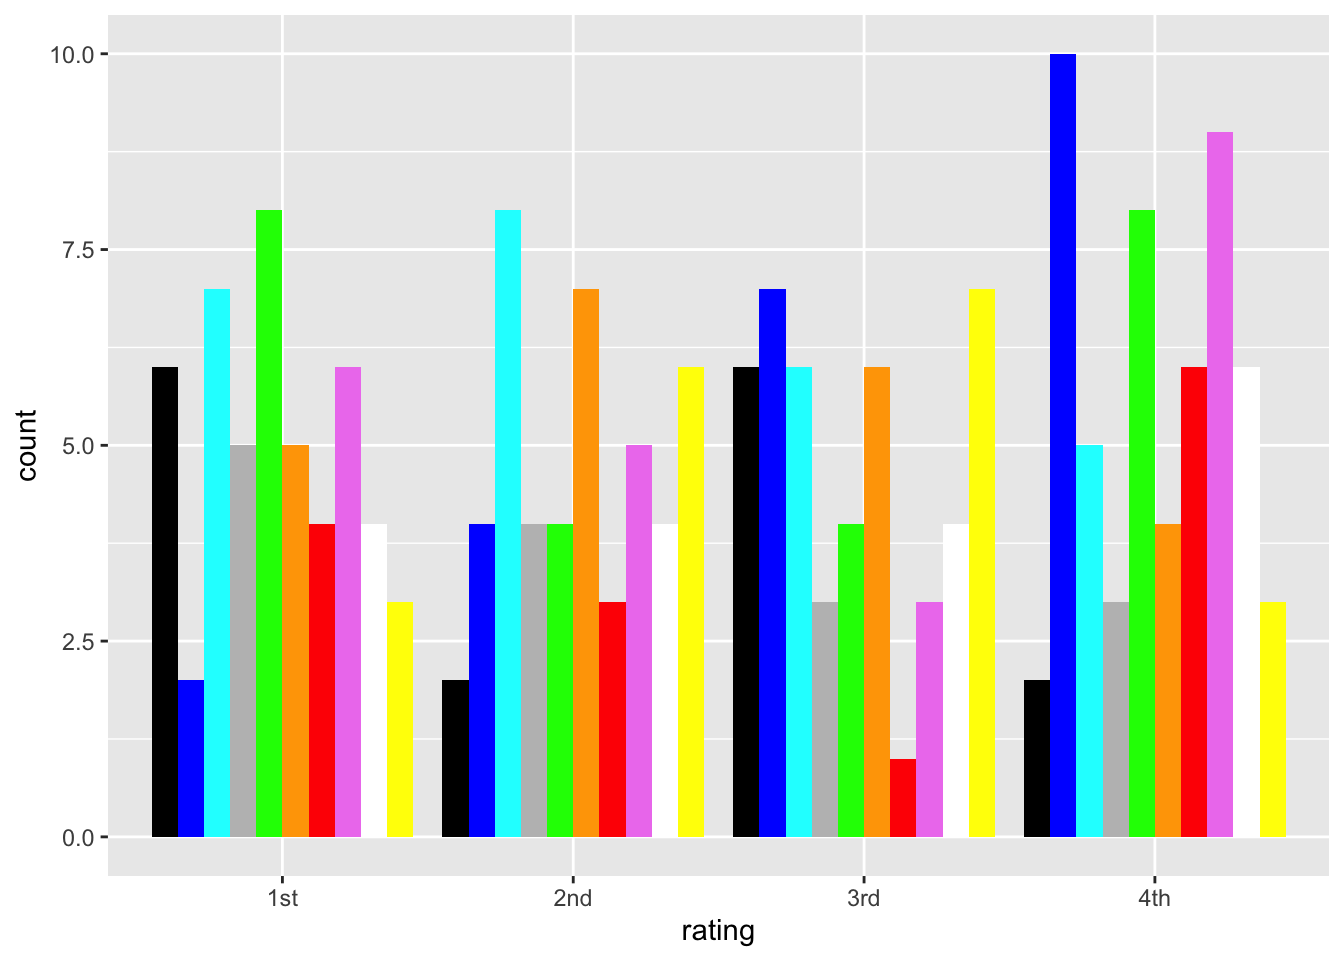
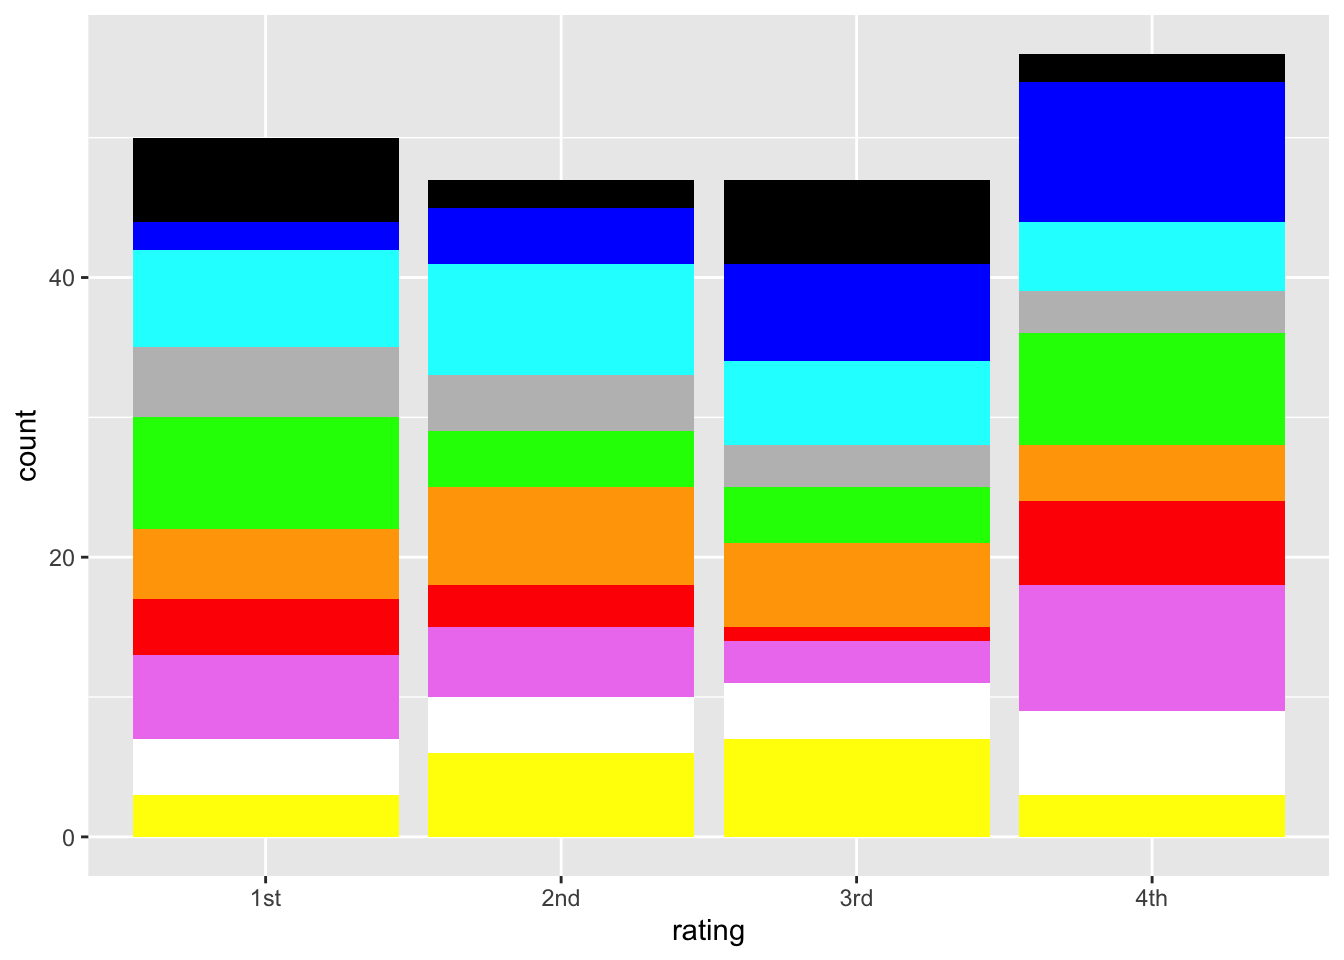
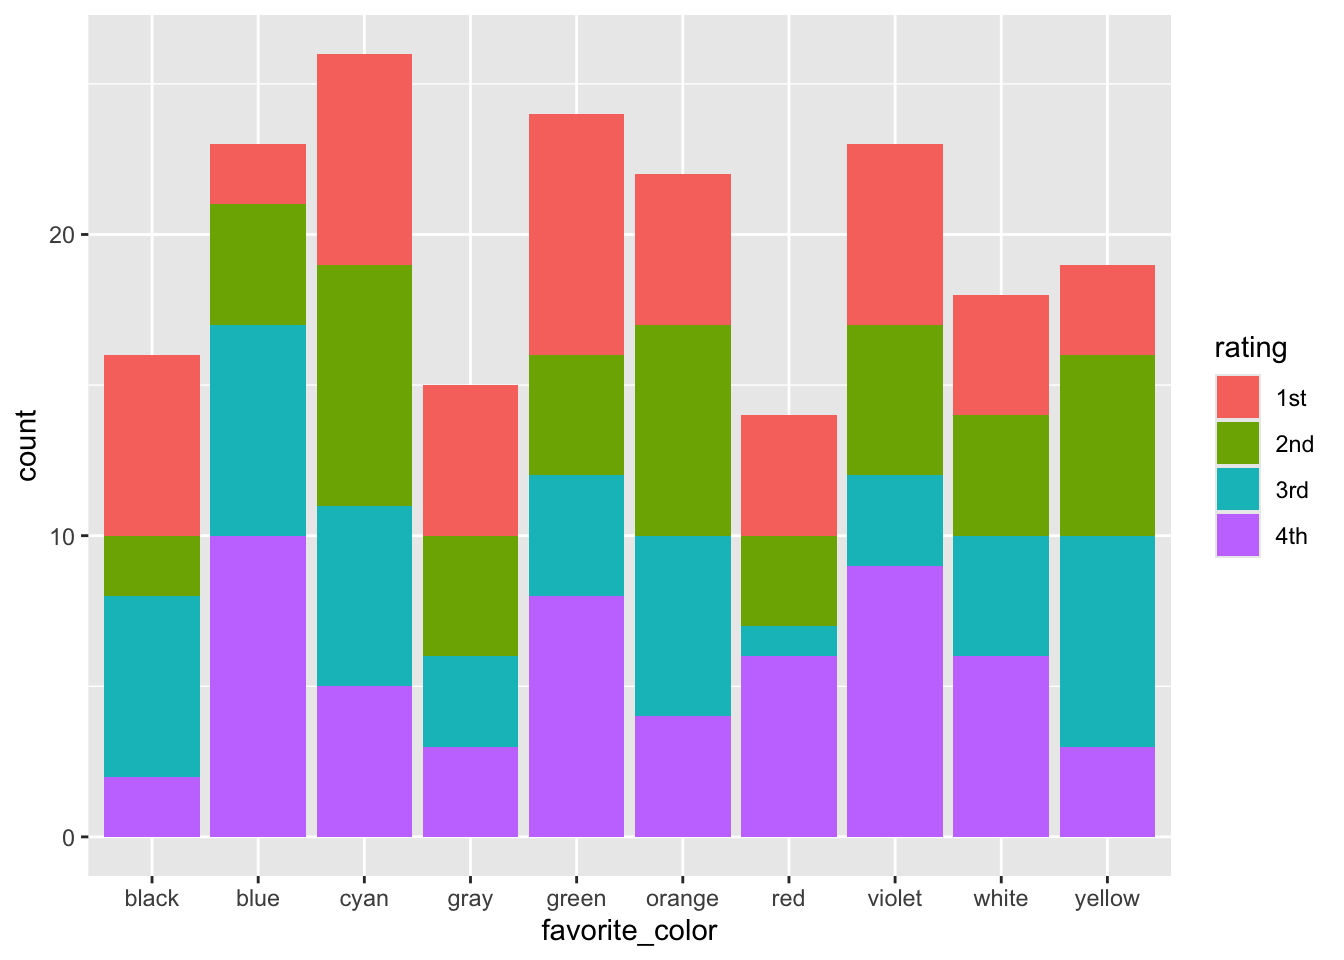
Ordinal data
A cautionary tale

“The Datasaurus dozen - same stats, different graphs | Autodesk Research” (n.d.); Matejka & Fitzmaurice (2017)
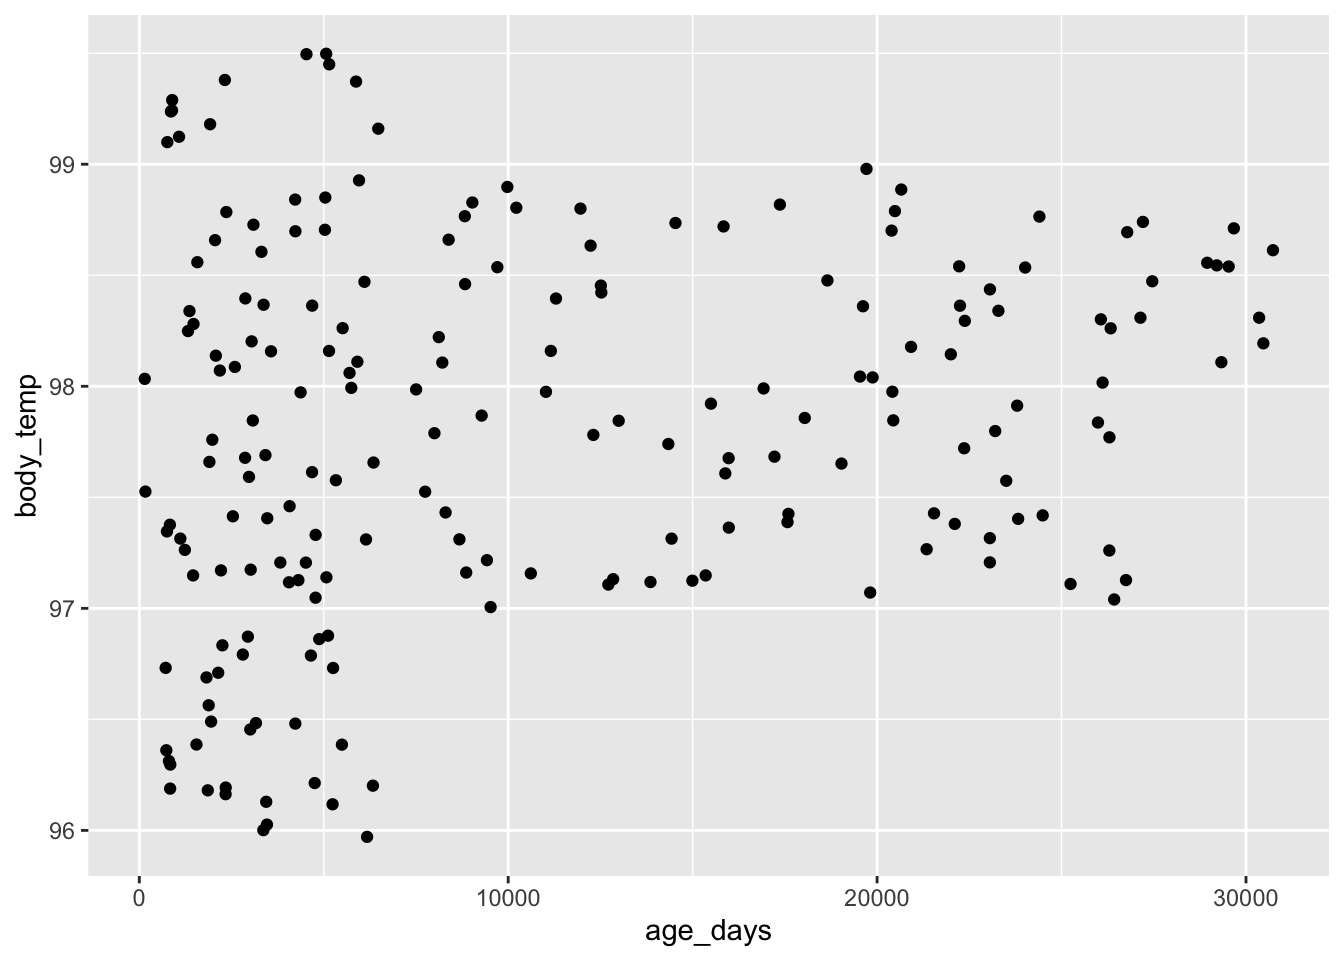
Scatterplot
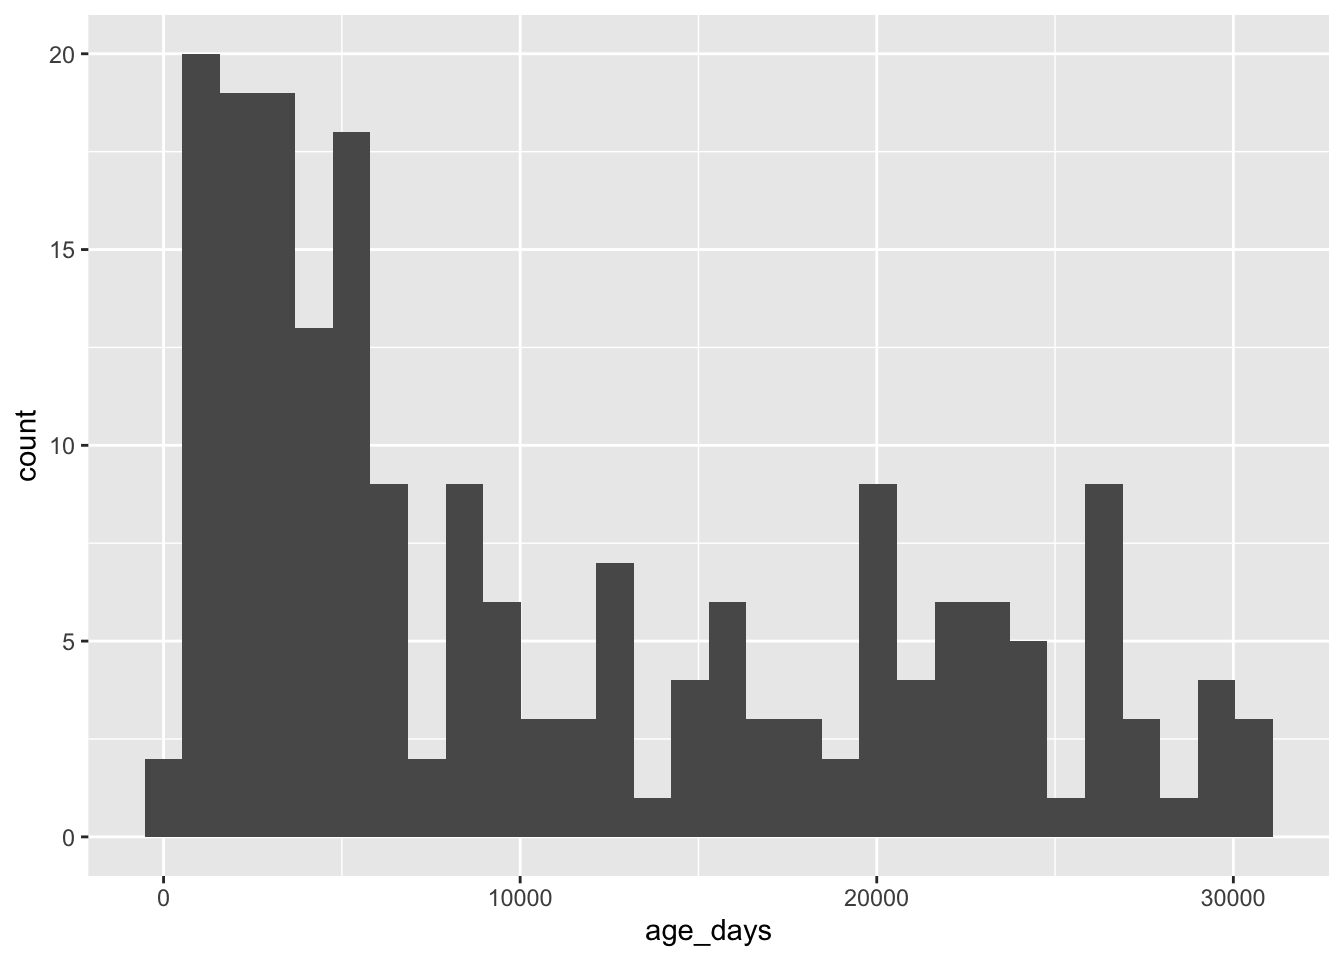
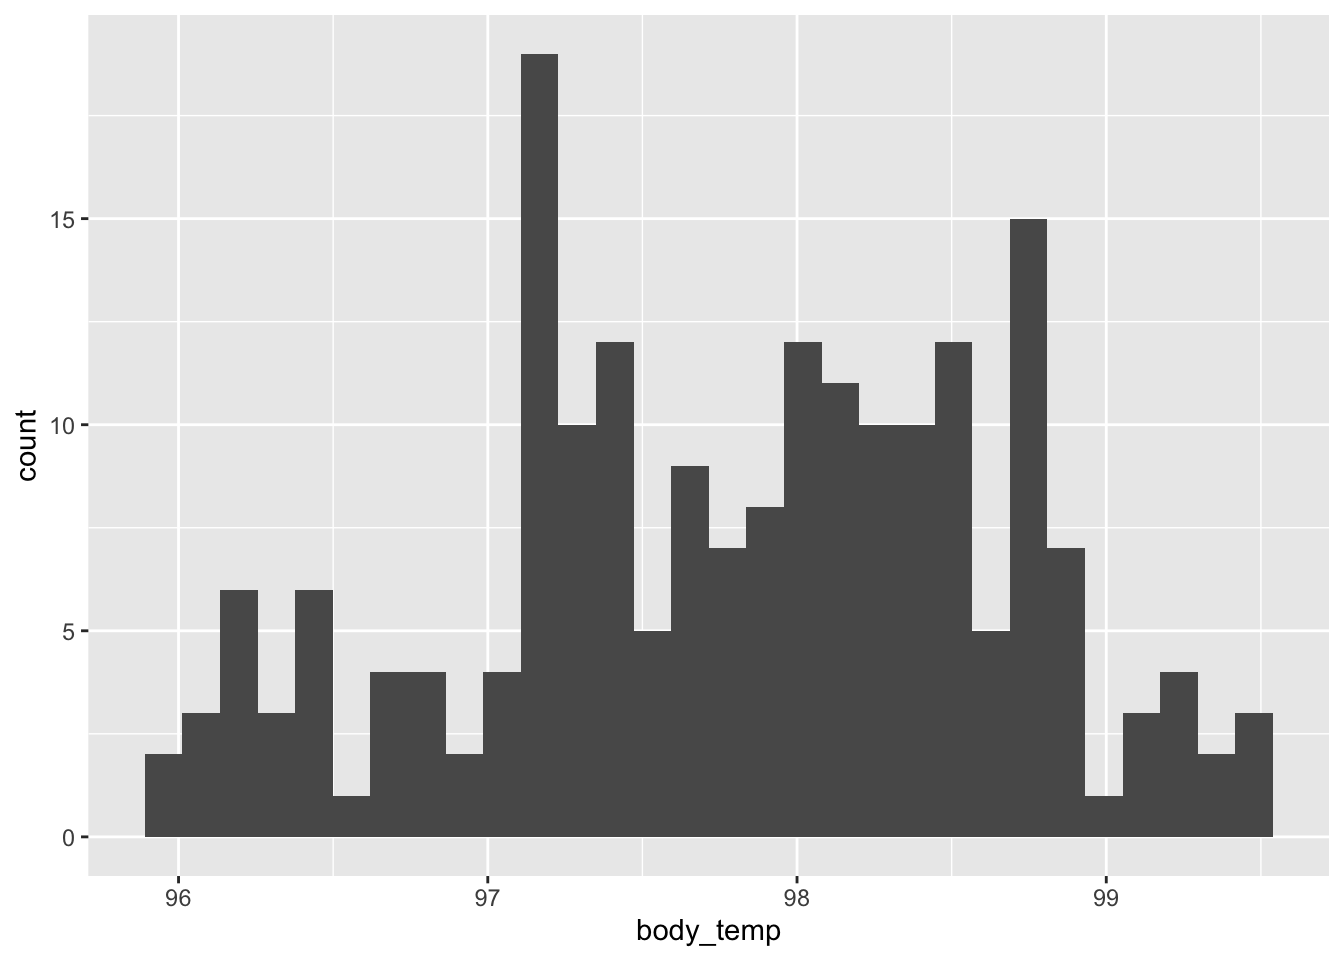
Histogram
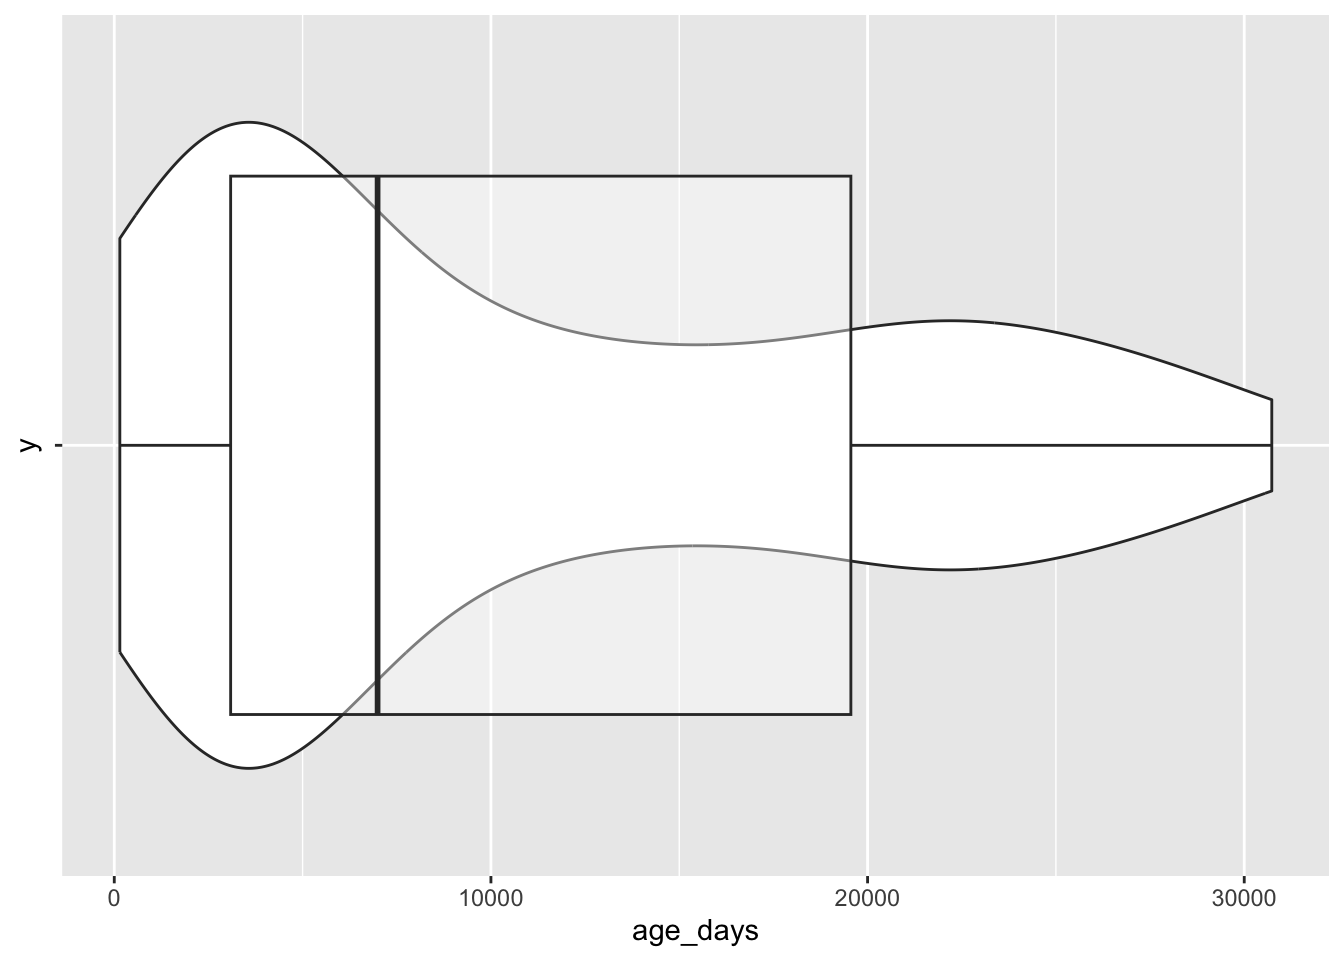
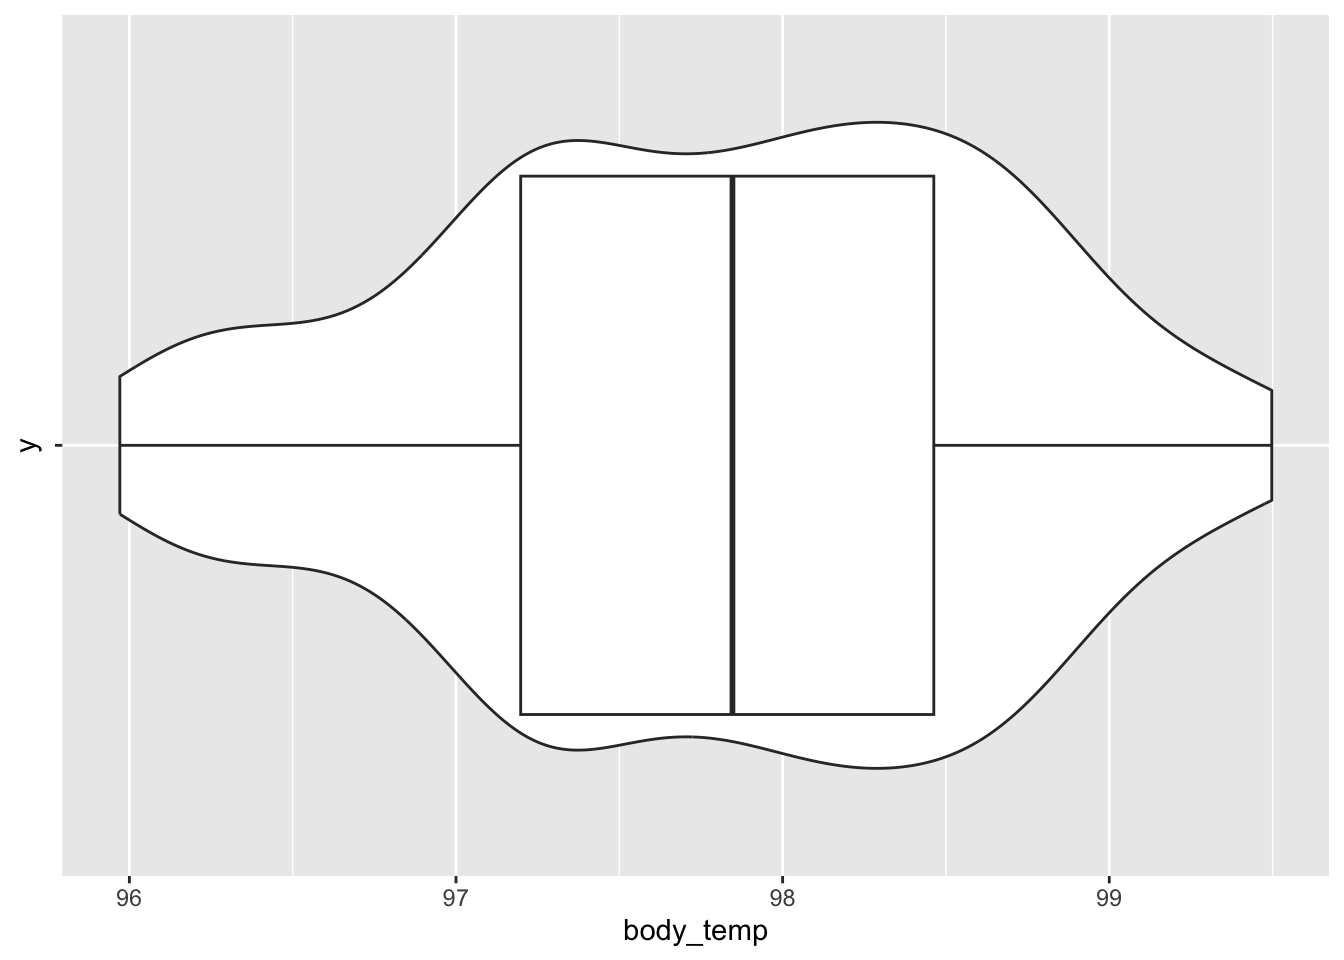
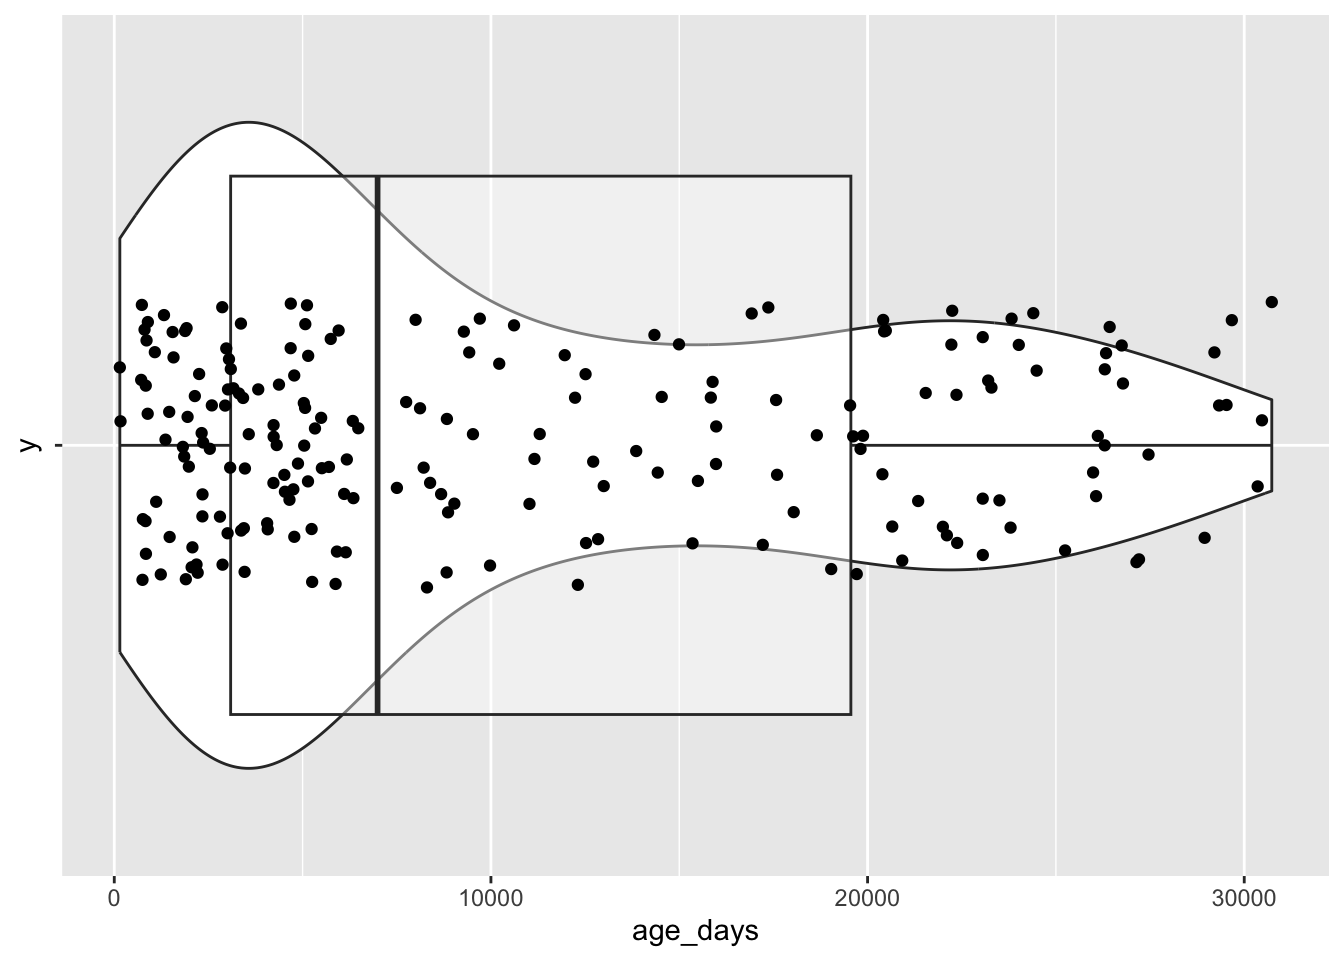
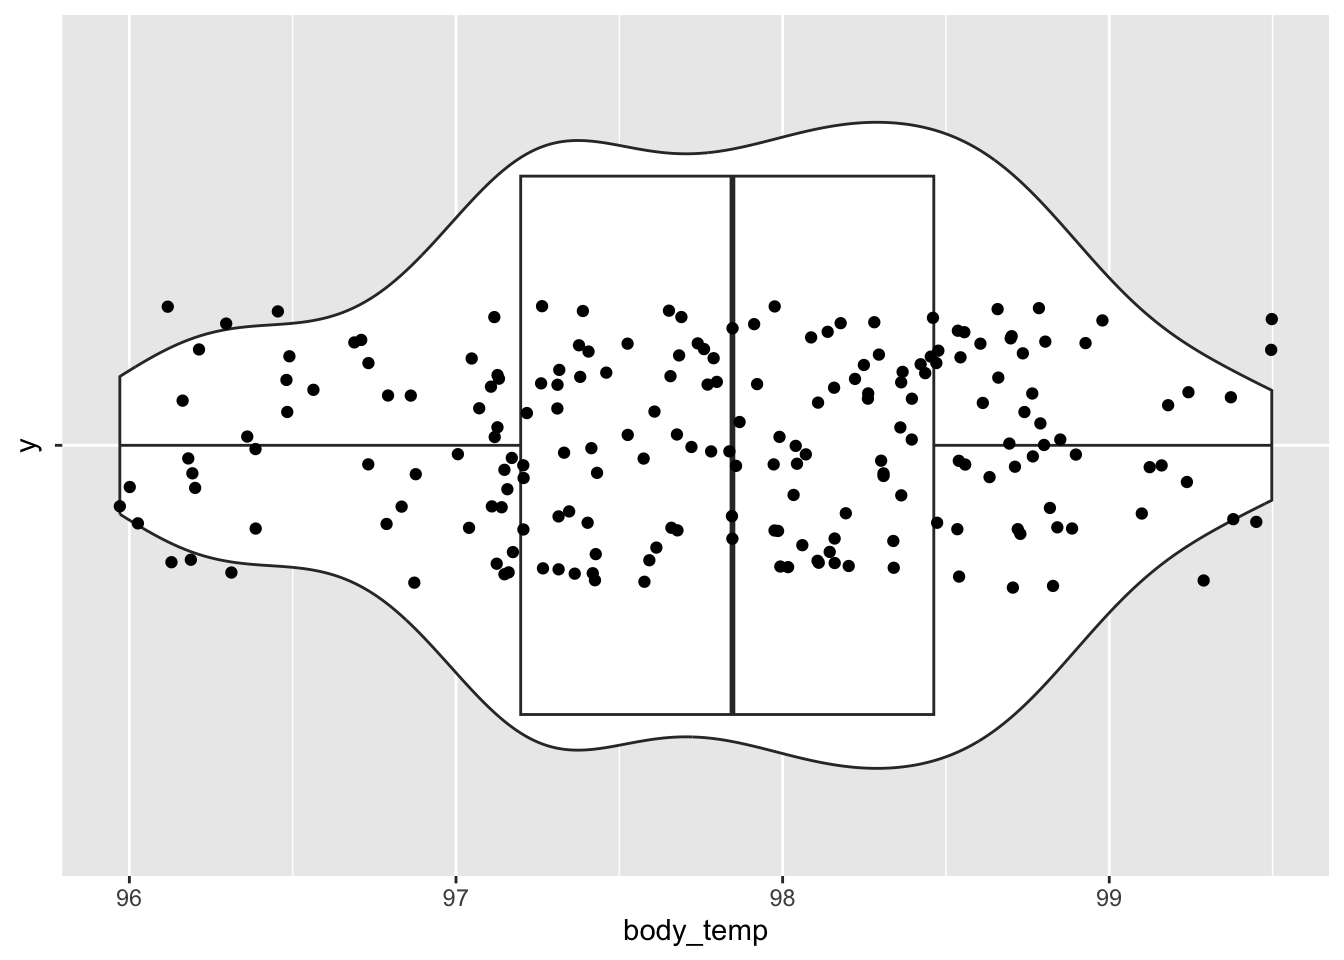
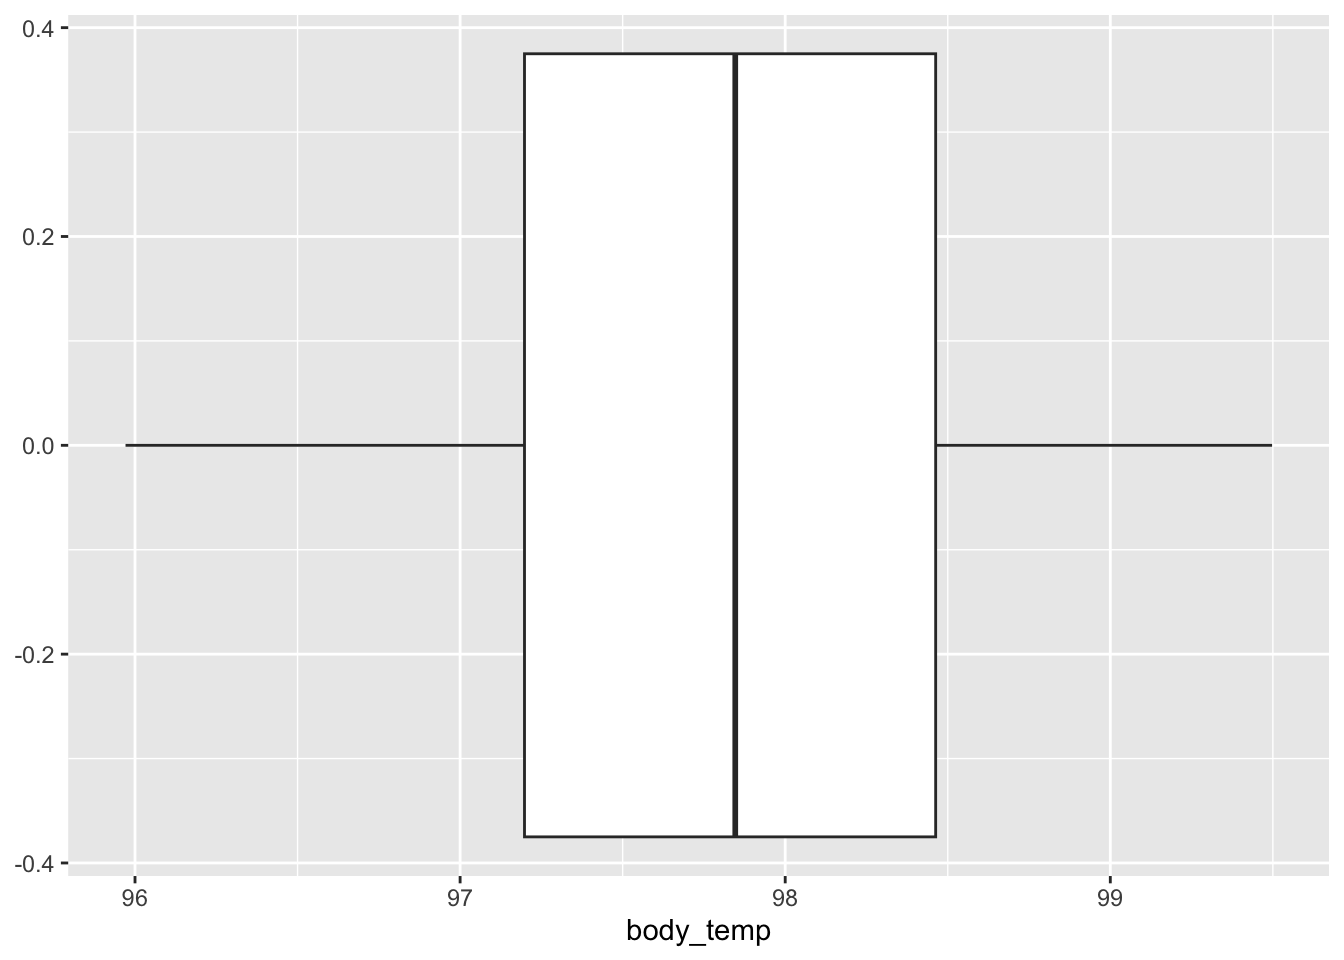
Boxplot
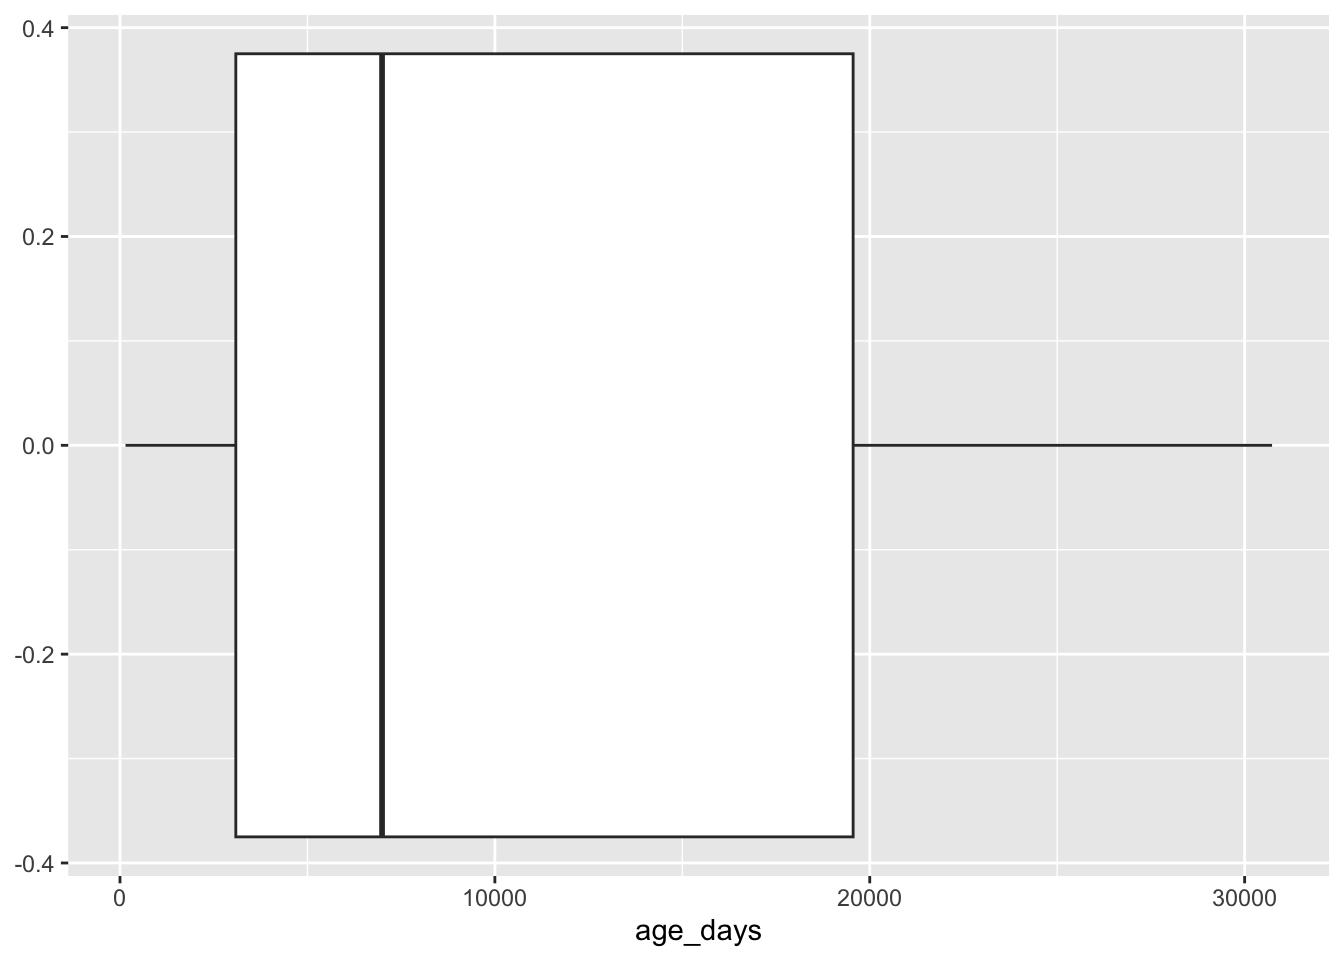
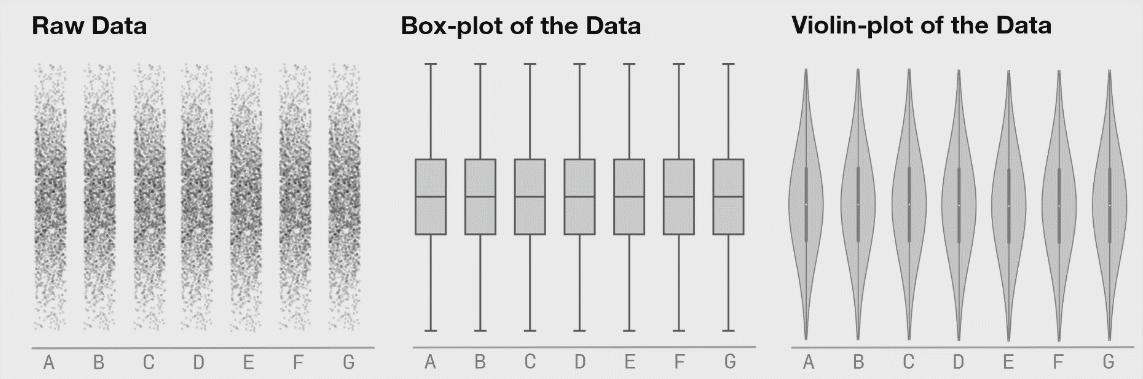
Boxplot limitations
“The Datasaurus dozen - same stats, different graphs | Autodesk Research” (n.d.); Matejka & Fitzmaurice (2017)