Code
suppressPackageStartupMessages(library(ggplot2))
suppressPackageStartupMessages(library(dplyr))This page generates data visualizations related to the Elkind (1961) study. In the original paper, the data were presented in tabular form.
suppressPackageStartupMessages(library(ggplot2))
suppressPackageStartupMessages(library(dplyr))age_yrs <- c(5, 6, 7, 8, 9, 10, 11)
quantity_type <- c("mass", "weight", "volume")
age <- rep(age_yrs, length(quantity_type))
conservation_type <- rep(quantity_type, each = length(age_yrs))
pct <- c(19, 51, 70, 72, 86, 94, 92,
21, 52, 51, 44, 73, 89, 78,
0, 4, 0, 4, 4, 19, 25)
conservation <- data.frame(age = age, type = conservation_type, pct = pct)conservation |>
ggplot() +
geom_point(aes(x = age, y = pct, color = type)) +
geom_line(aes(x = age, y = pct, color = type, group = type)) +
guides(color = guide_legend("Judgment type")) +
ylim(0, 100)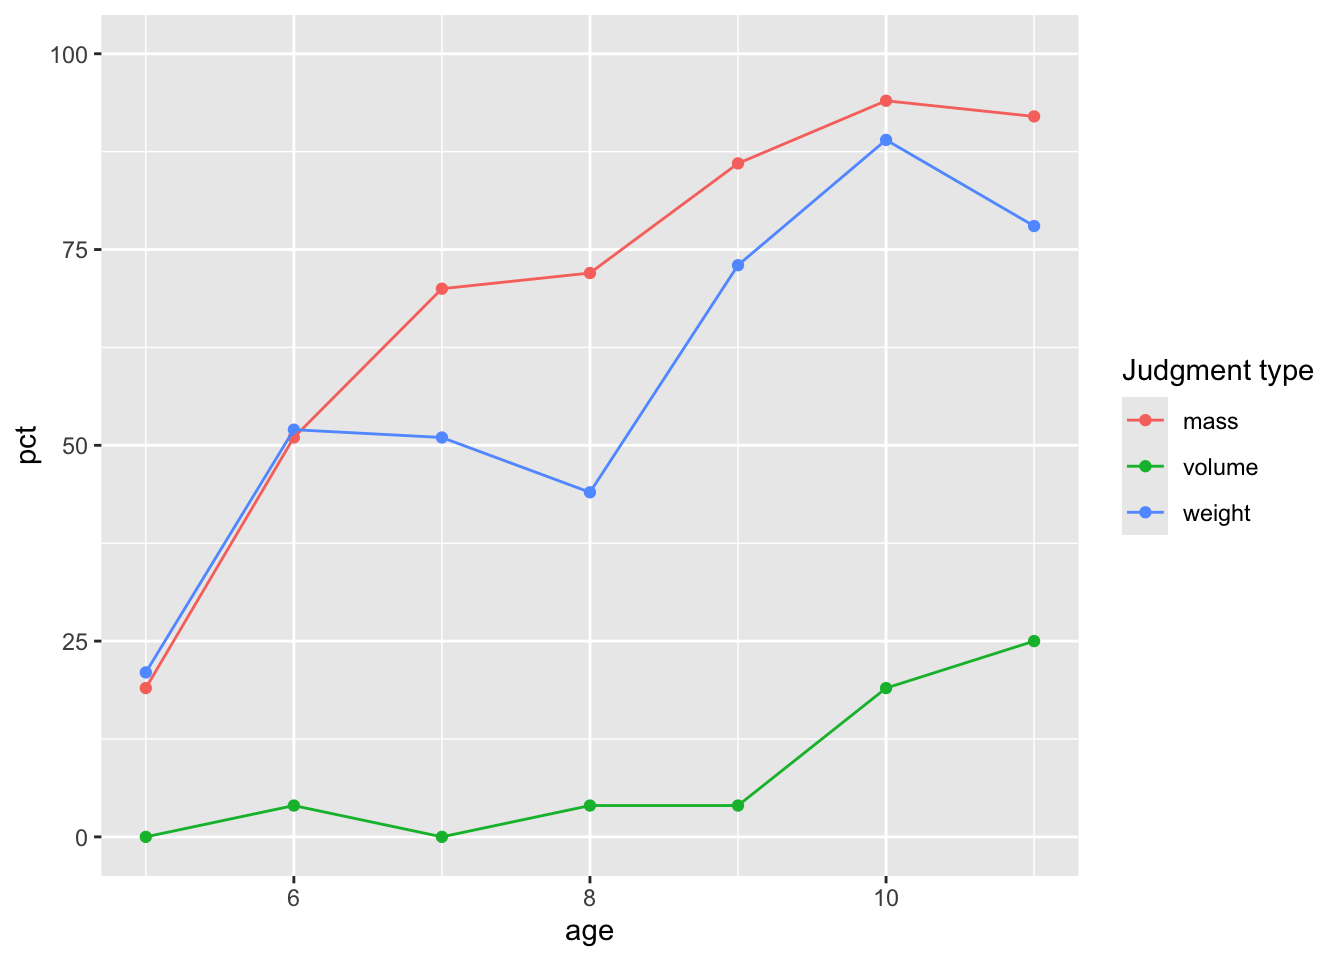
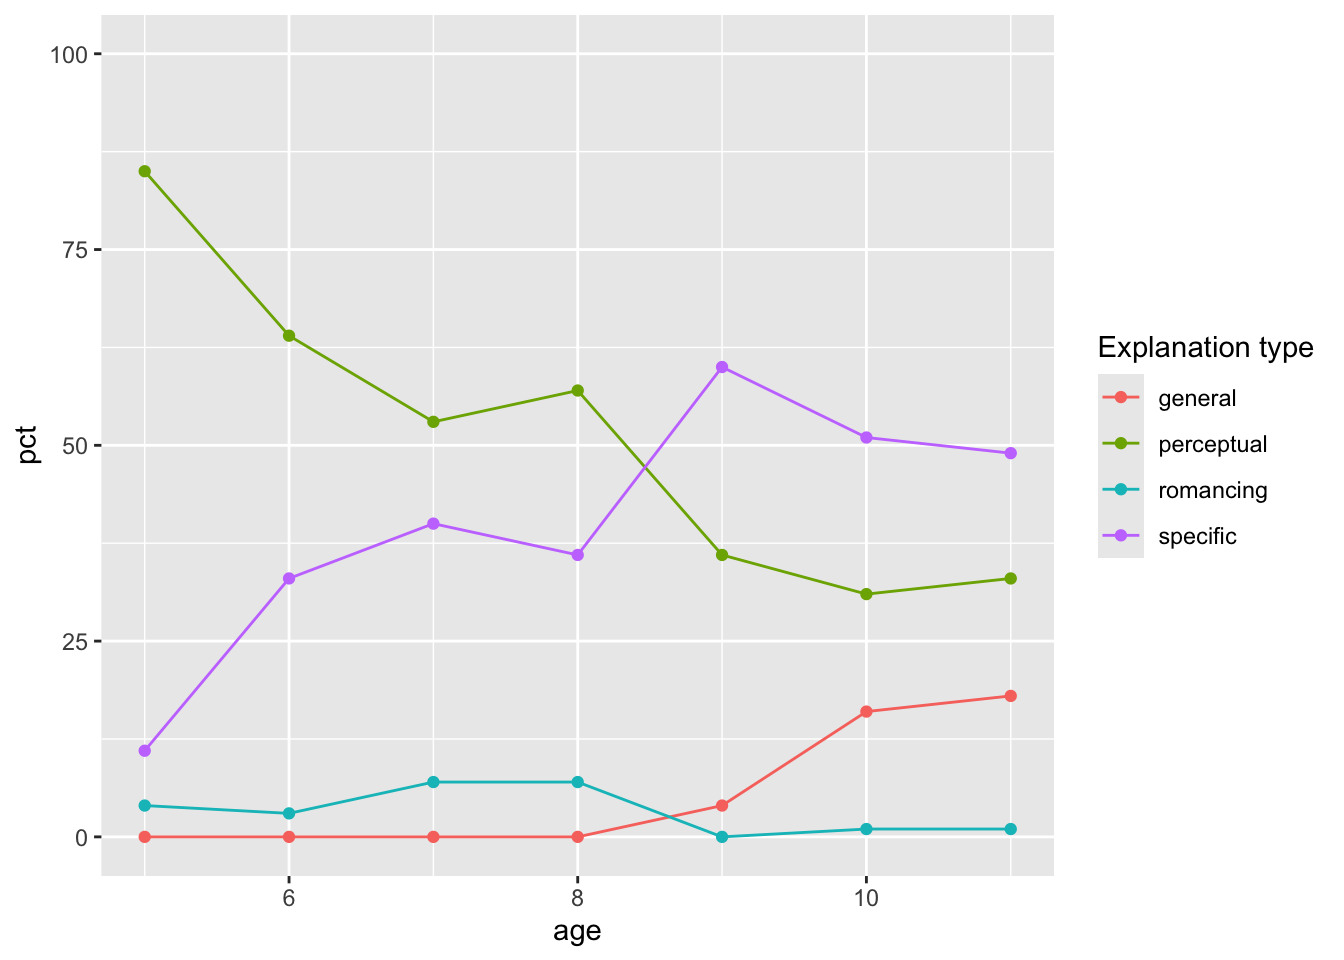
age_yrs <- c(5, 6, 7, 8, 9, 10, 11)
explanation_type <- c("romancing", "perceptual", "specific", "general")
age <- rep(age_yrs, length(explanation_type))
explanation <- rep(explanation_type, each = length(age_yrs))

pct <- c(4, 3, 7, 7, 0, 1, 1,
         85, 64, 53, 57, 36, 31, 33,
         11, 33, 40, 36, 60, 51, 49,
         0, 0, 0, 0, 4, 16, 18)

explanations <- data.frame(age = age, type = explanation, pct = pct)explanations |>
ggplot() +
geom_point(aes(x = age, y = pct, color = type)) +
geom_line(aes(x = age, y = pct, color = type, group = type)) +
guides(color = guide_legend("Explanation type")) +
ylim(0, 100)