Survey 02

Scientific norms and counternorms

Modified

September 16, 2024

Purpose

This page documents the data processing steps involved with Survey 02 in PSYCH 490.012.

The survey questions were adapted from those discussed in (Kardash & Edwards, 2012).

Survey

Link: https://forms.gle/ZuVcUXu6z3uWLb3f9

Preparation

First, we load the external packages (groups of R commands) that we will be using.

Gathering

Next, we download the data from the Google Sheet where it is collected. Dr. Gilmore has stored his Google account credentials in a special environment file that can be accessed by the R command Sys.getenv("GMAIL_SURVEY").

Tip

It’s vital to be very careful when creating and sharing code like this that involves sensitive information like login credentials.

Gilmore likes to put credentials in an .Renviron file that lives in his home directory. This is a recommended practice. On Mac OS and Linux, that’s ~/.Renviron. You can use the usethis::edit_r_profile() command at the R console (not the Terminal) to open your own .Renviron file. In Gilmore’s case, he has added the following line to that file:

GMAIL_SURVEY="<my-google-account>"

Where he has substituted his Google account with credentials/access to the required files for <my-google-account>. Then, when the R code below calls `Sys.getenv(“GMAIL_SURVEY”), the value of those credentials is returned.

Make sure to close and save the .Renviron file and restart your R session before testing this yourself.

Code
if (!dir.exists('csv')) {
  message("Creating missing `csv/`.")
  dir.create("csv")
}

if (params$update_data) {
  options(gargle_oauth_email = Sys.getenv("GMAIL_SURVEY"))
  googledrive::drive_auth()
  
  googledrive::drive_download(
    "PSYCH 490.012: Survey 02: Scientific Values Survey (Responses)",
    path = file.path("csv", params$fn),
    type = "csv",
    overwrite = TRUE
  )
  
  message("Data updated.")
} else {
  message("Using stored data.")
}

The data file has been saved as a comma-separated value (CSV) format data file in a special directory called csv/.

Note

Because these data might contain sensitive or identifiable information, we only keep a local copy and do not share it publicly via GitHub. This is achieved by adding the name of the data directory to a special .gitignore file.

Cleaning

Next we load the data file.

Code
survey_02_norms <-
  readr::read_csv(file.path("csv", params$fn), show_col_types = FALSE)

We have n=15 responses as of 2024-10-17 11:04:35.183305. Note: Two of these are “test” responses by Dr. Gilmore.

Here are the column “names”:

Code
# Google Forms puts the full question in the top row of the data file.
# We use the names() function to extract and print the original questions.
survey_02_norms_qs <- names(survey_02_norms)
survey_02_norms_qs
 [1] "Timestamp"                                                                                                                                                                                                                             
 [2] "Scientists are generally motivated by the desire for knowledge and discovery, and not by the possibility of personal gain....2"                                                                                                        
 [3] "Scientists make an attempt to consider all new evidence, hypotheses, theories, and innovations, even those that challenge or contradict their own work....3"                                                                           
 [4] "Scientists generally assess new knowledge and its applications based on the reputation and past productivity of the individual or research group....4"                                                                                 
 [5] "Scientists openly share new findings with all colleagues....5"                                                                                                                                                                         
 [6] "Scientists generally invest their careers in promoting their own most important findings, theories, or innovations....6"                                                                                                               
 [7] "Scientists compete with others in the same field for funding and recognition of their achievements....7"                                                                                                                               
 [8] "Scientists generally evaluate research only on its merit (i.e., according to accepted standards of the field)....8"                                                                                                                    
 [9] "Scientists emphasize the protection of their newest findings to ensure priority in publishing, patenting, or applications....9"                                                                                                        
[10] "Scientists are generally motivated by the desire for knowledge and discovery, and not by the possibility of personal gain....10"                                                                                                       
[11] "Scientists make an attempt to consider all new evidence, hypotheses, theories, and innovations, even those that challenge or contradict their own work....11"                                                                          
[12] "Scientists generally assess new knowledge and its applications based on the reputation and past productivity of the individual or research group....12"                                                                                
[13] "Scientists openly share new findings with all colleagues....13"                                                                                                                                                                        
[14] "Scientists generally invest their careers in promoting their own most important findings, theories, or innovations....14"                                                                                                              
[15] "Scientists compete with others in the same field for funding and recognition of their achievements....15"                                                                                                                              
[16] "Scientists generally evaluate research only on its merit (i.e., according to accepted standards of the field)....16"                                                                                                                   
[17] "Scientists emphasize the protection of their newest findings to ensure priority in publishing, patenting, or applications....17"                                                                                                       
[18] "If you wish to comment about the questions in this survey, you may do so here. You are not required to comment. However, if you want extra credit points for completing the survey, put a code phrase here and tell the TA what it is."

We see that these are the full text of the questions asked.

Clean/shorten names

For plotting and analyses, it’s usually easier to shorten the questions by creating a short name that reflects the underlying idea or construct. We’ll use the rename() function from the dplyr package for this.

Code
new_names <-
  c(
    "timestamp",
    "Disinterestedness_should",
    "Organized Skepticism_should",
    "Particularism_should",
    "Communality_should",
    "Organized Dogmatism_should",
    "Self-interestedness_should",
    "Universalism_should",
    "Solitariness_should",
    "Disinterestedness_actually",
    "Organized Skepticism_actually",
    "Particularism_actually",
    "Communality_actually",
    "Organized Dogmatism_actually",
    "Self-interestedness_actually",
    "Universalism_actually",
    "Solitariness_actually",
    "comments"
  )

# These data are ‘wide’, meaning that there are multiple variables for each respondent. The data will be easier to visualize and analyze if we make the data ‘longer’.

# Swap out old (long) names for new (short) names
long_names <- names(survey_02_norms)
names(survey_02_norms) <- new_names

Next, let’s drop Dr. Gilmore’s “test” responses.

Code
survey_02_norms <- survey_02_norms %>%
  dplyr::filter(!stringr::str_detect(comments, "test"))

Assign a unique code to each respondent’s responses:

Code
# Use stringr::str_pad() to 'pad' numbers so that all of them are 2 characters
# wide.

survey_02_norms <- survey_02_norms |>
  dplyr::mutate(sub_id = paste0("s_", stringr::str_pad(seq_along(comments), 
                                                       width = 2,
                                                       pad = 0)))

Create a “longer” table with each row representing a single question rating from a single respondent.

Code
survey_02_norms_long <- survey_02_norms |>
  tidyr::pivot_longer(!c('timestamp', 'comments', 'sub_id'),
                      names_to = "norm_counternorm",
                      values_to = "rating")

We move the ’_should’ and ’_actually’ from the question to a separate variable called ‘resp_frame’ for response frame. Then we create a variable that indicates whether the statements are norms or counternorms.

Code
survey_02_norms_long <- survey_02_norms_long |>
  dplyr::mutate(resp_frame = stringr::str_extract(norm_counternorm, "should|actually")) |>
  dplyr::mutate(norm_counternorm = stringr::str_remove_all(norm_counternorm, "_[a-z]+"))

# We should indicate whether these are norms or counternorms.
survey_02_norms_long <- survey_02_norms_long |>
  dplyr::mutate(type = if_else(
    norm_counternorm %in% c(
      "Disinterestedness",
      "Organized Skepticism",
      "Communality",
      "Universalism"
    ),
    "norm",
    # Changed to shorter 'counter' on 2024-09-16
    "counter"
  )) 

Now, let’s look at the names to confirm that they all got changed.

Code
names(survey_02_norms_long)
[1] "timestamp"        "comments"         "sub_id"           "norm_counternorm"
[5] "rating"           "resp_frame"       "type"            

Data dictionary

We’ll pause here to start building a data dictionary, a file that explains the origin, format, and usage of our dataset.

Code
# Make new data frame with long and short names for reference
survey_02_norms_data_dictionary <-
  tibble::tibble(q_long = long_names, q_short = new_names)

survey_02_norms_data_dictionary <- survey_02_norms_data_dictionary |>
  dplyr::mutate(norm_type = if_else(
    stringr::str_detect(
      q_short,
      "Disinterestedness|Skepticism|Communality|Universalism"),
      "norm",
      "counter"
  )) |>
  dplyr::mutate(resp_frame = if_else(
    stringr::str_detect(
      q_short,
      "should"),
      "should_do",
      "actually_do"
  ))

# The `norm_type` and `resp_frame` variables have no meaning for the timestamp or comments.
survey_02_norms_data_dictionary$norm_type[1] <- NA
survey_02_norms_data_dictionary$norm_type[18] <- NA
survey_02_norms_data_dictionary$resp_frame [1] <- NA
survey_02_norms_data_dictionary$resp_frame [18] <- NA

We’ll add other items to the data dictionary later.
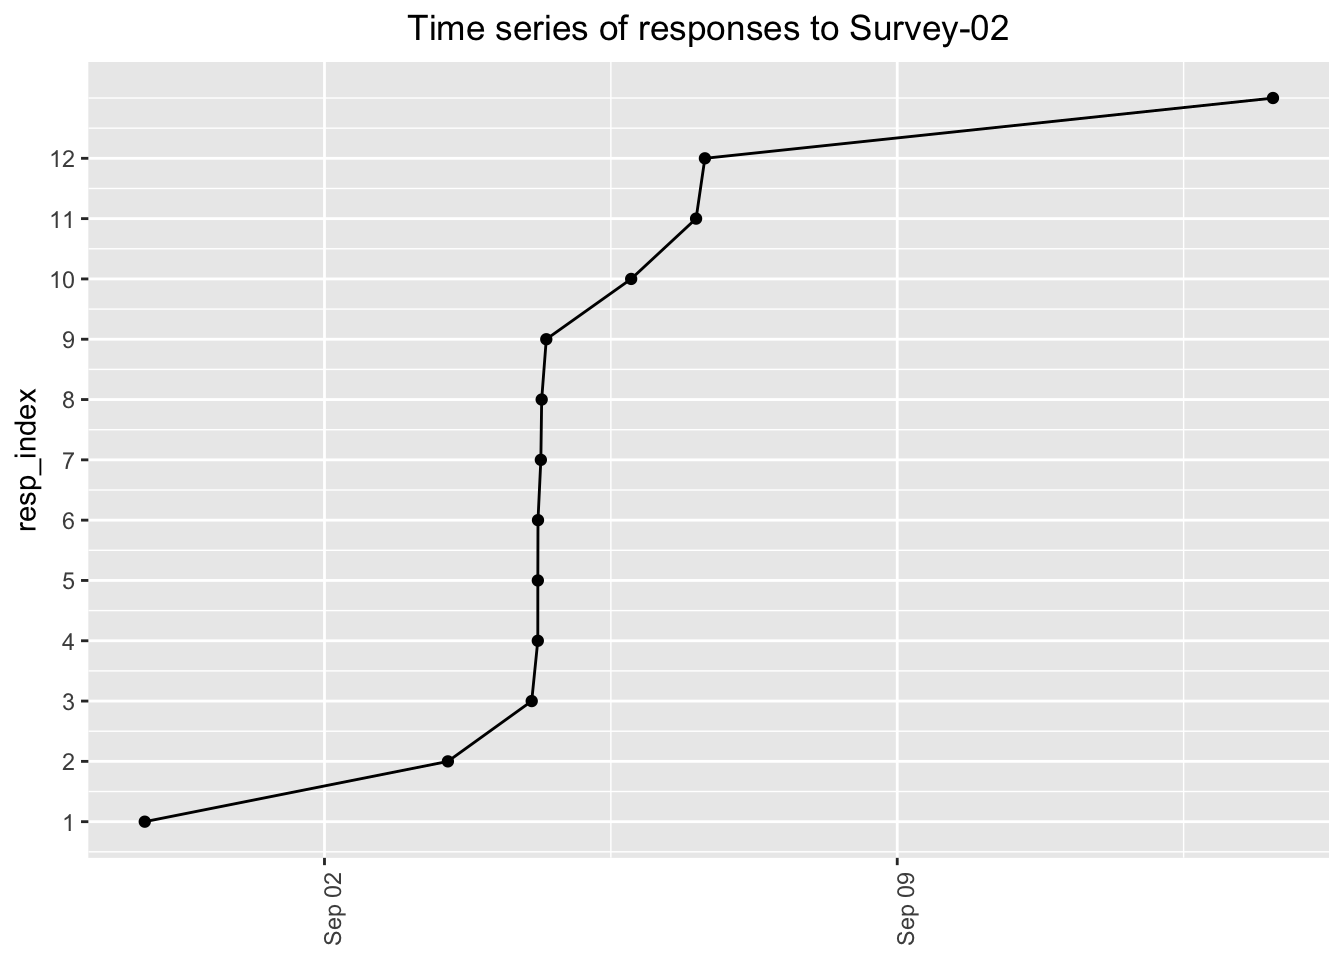
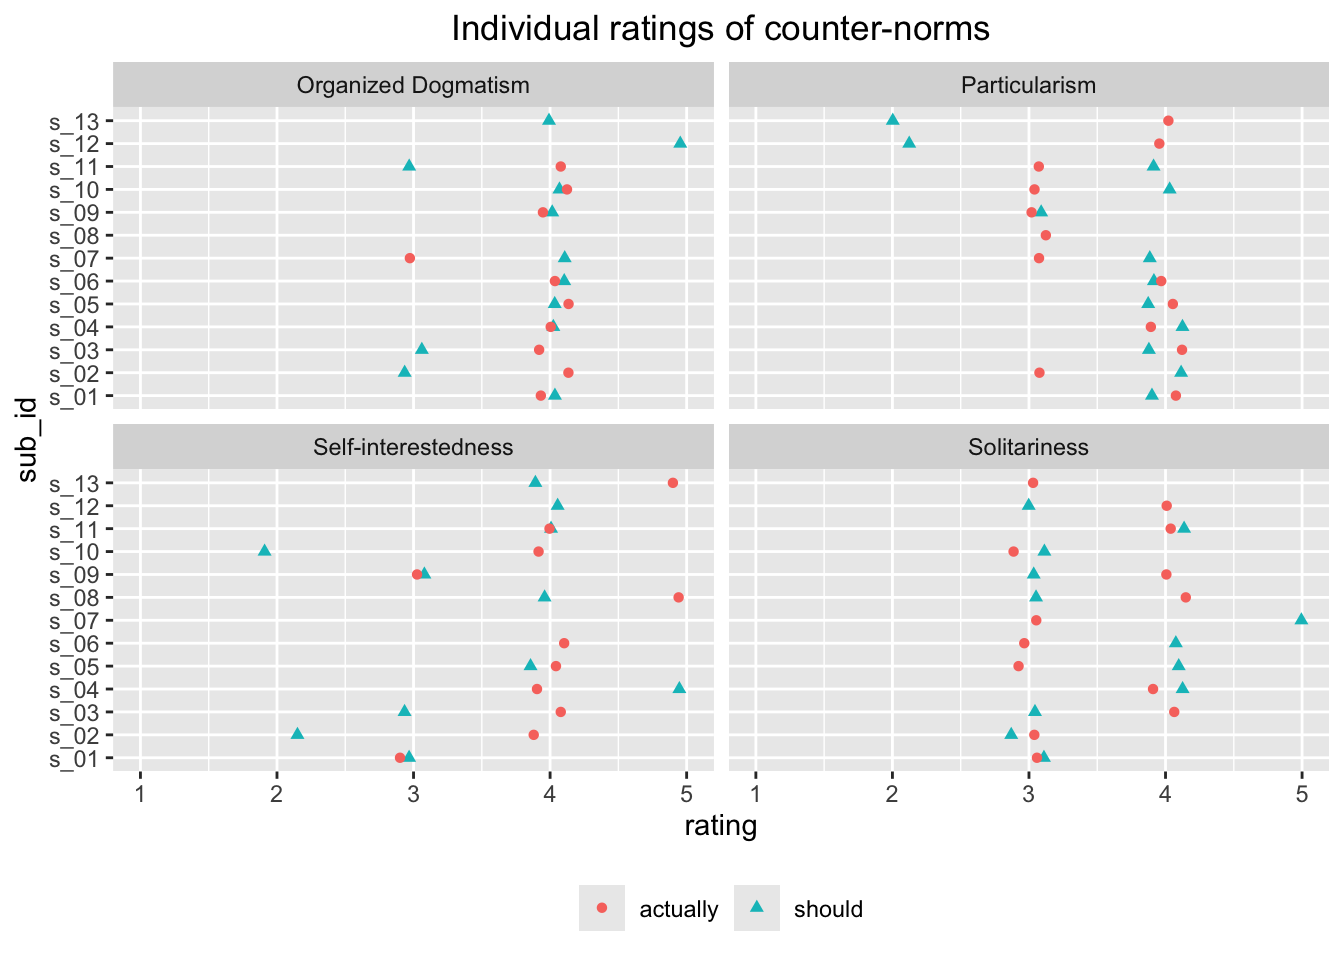
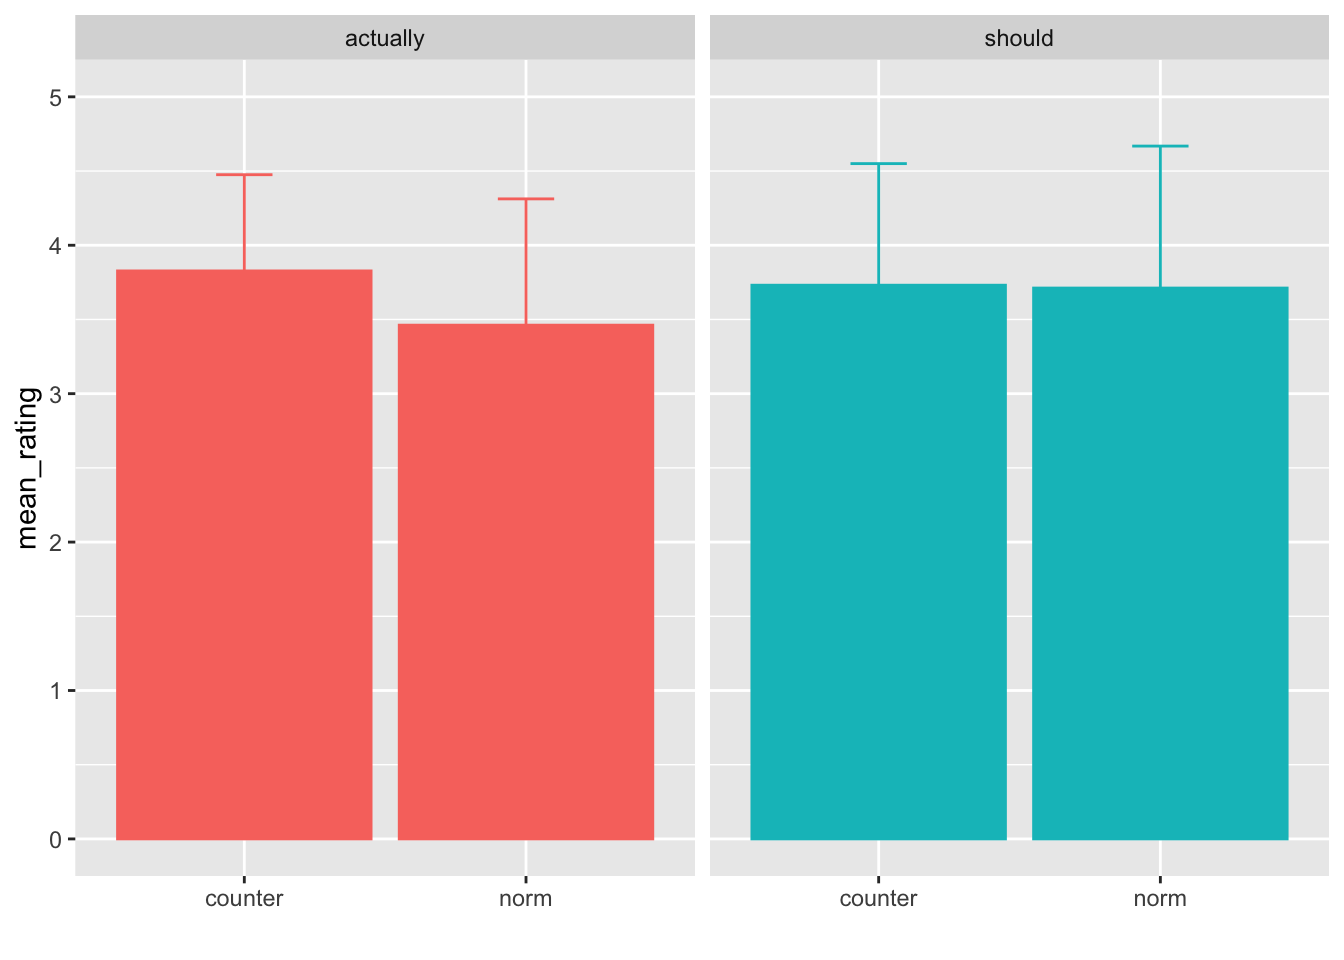
Visualizations

Code
n_responses <- dim(survey_02_norms)[1] # number of rows in original

if (n_responses < 1) {
  message("Insufficient responses to plot.")
} else {
  survey_02_norms |>
    dplyr::mutate(resp_index = 1:n_responses) |>
    dplyr::mutate(timestamp = lubridate::mdy_hms(timestamp)) |>
    ggplot() +
    aes(x = timestamp, resp_index) +
    geom_point() +
    geom_line() +
    ggtitle("Time series of responses to Survey-02") +
    scale_y_continuous(breaks = 1:12) +
    theme(
      axis.text.x = element_text(angle = 90),
      axis.title.x = element_blank(),
      plot.title = element_text(hjust = 0.5)
    )
}
Figure 1: Time series of responses to Survey-02

Survey 02 response options

Survey 02 response options

Summary dotplot

Code
survey_02_norms_long |>
  ggplot() +
  aes(rating, color = type, fill = type) +
  geom_dotplot(dotsize = .4) +
  xlim(1, 5) +
  theme(axis.title.y = element_blank()) +
  theme(axis.text.y = element_blank()) +
  theme(axis.ticks = element_blank()) +
  facet_grid(rows = vars(norm_counternorm),
             cols = vars(resp_frame)) +
  theme(
    legend.position = "bottom",
    legend.title = element_blank(),
    strip.text.y = element_text(angle = 0)
  )
Bin width defaults to 1/30 of the range of the data. Pick better value with
`binwidth`.
Figure 2: Dotplot showing ratings of what scientists should do vs. actually do by norm type. PSYCH 490.012 Fall 2024.

Data dictionary

Code
survey_02_norms_data_dictionary |>
  dplyr::filter(q_short != "timestamp", q_short != "comments") |>
  dplyr::mutate(q_short = stringr::str_remove_all(q_short, "_should|_actually")) |>
  dplyr::mutate(q_long = stringr::str_remove_all(q_long, "....[0-9]+")) |>
  dplyr::select(q_short, q_long, norm_type) |>
  dplyr::arrange(desc(norm_type)) |>
  knitr::kable(format = "html") |>
  kableExtra::kable_classic()
q_short q_long norm_type
Disinterestedness Scientists are generally motivated by the desire for knowledge and discovery, and not by the possibility of personal gain norm
Organized Skepticism Scientists make an attempt to consider all new evidence, hypotheses, theories, and innovations, even those that challenge or contradict their own work norm
Communality Scientists openly share new findings with all colleagues norm
Universalism Scientists generally evaluate research only on its merit (i.e., according to accepted standards of the field) norm
Particularism Scientists generally assess new knowledge and its applications based on the reputation and past productivity of the individual or research group counter
Organized Dogmatism Scientists generally invest their careers in promoting their own most important findings, theories, or innovations counter
Self-interestedness Scientists compete with others in the same field for funding and recognition of their achievements counter
Solitariness Scientists emphasize the protection of their newest findings to ensure priority in publishing, patenting, or applications counter
Code
survey_02_norms_long |>
  ggplot() +
  aes(norm_counternorm, rating) +
  geom_violin() +
  geom_dotplot(
    binaxis = 'y',
    stackdir = 'center',
    dotsize = .7,
    aes(fill = type)
  ) +
  facet_grid(cols = vars(resp_frame)) +
  scale_y_continuous(
    breaks = c(1, 2, 3, 4, 5),
    labels = c("1" = "not at all", "2", "3", "4", "5" = "a great deal")
  ) +
  theme(
    axis.text.x = element_text(angle = 90),
    axis.title.x = element_blank(),
    legend.title = element_blank(),
    legend.position = "top"
  )
Bin width defaults to 1/30 of the range of the data. Pick better value with
`binwidth`.
Figure 3: Adherence to norms and counternorms by what scientists should do vs. actually do. PSYCH 490.012 Fall 2024.

Norms

Code
survey_02_norms_long |>
  dplyr::filter(type == "norm") |>
  ggplot() +
  aes(
    x = rating,
    y = sub_id,
    color = resp_frame,
    fill = resp_frame,
    shape = resp_frame
  ) +
  geom_jitter(height = 0, width = .12) +
  xlim(1, 5) +
  ggtitle("Individual ratings of norms") +
  facet_wrap(vars(norm_counternorm)) +
  theme(
    legend.title = element_blank(),
    legend.position = "bottom",
    plot.title = element_text(hjust = 0.5)
  )
Warning: Removed 9 rows containing missing values or values outside the scale range
(`geom_point()`).
Figure 4: Individual ratings of each norm based on what respondents think scientists actually do (red) vs. should do (aqua)

Counter-norms

Code
survey_02_norms_long |>
  dplyr::filter(type == "counter") |>
  ggplot() +
  aes(
    x = rating,
    y = sub_id,
    color = resp_frame,
    fill = resp_frame,
    shape = resp_frame
  ) +
  geom_jitter(height = 0, width = .15) +
  xlim(1, 5) +
  ggtitle("Individual ratings of counter-norms") +
  facet_wrap(vars(norm_counternorm)) +
  theme(
    legend.title = element_blank(),
    legend.position = "bottom",
    plot.title = element_text(hjust = 0.5)
  )
Warning: Removed 10 rows containing missing values or values outside the scale range
(`geom_point()`).
Figure 5: Individual ratings of each counter-norm based on what respondents think scientists actually do (red) vs. should do (aqua)

Student predictions

See assignment from 2024-09-11 notes and discussion on 2024-09-13.

Norms vs. counter-norms aggregated

Code
ratings_by_type <- survey_02_norms_long |>
  dplyr::group_by(type) |>
  dplyr::summarise(mean_rating = mean(rating, na.rm = TRUE),
                   sd_rating = sd(rating, na.rm = TRUE)) |>
  dplyr::select(mean_rating, type, sd_rating)

ratings_by_type |>
  ggplot() +
  aes(
    x = type,
    y = mean_rating
  ) +
  geom_col() +
  geom_errorbar(
    aes(ymin = mean_rating - sd_rating, ymax = mean_rating + sd_rating),
    width = .2,
    position = position_dodge(.9)
  ) +
  ylim(NA, 5)

Norm/counter-norm by should/actually

Code
ratings_by_type_by_resp_frame <- survey_02_norms_long |>
  dplyr::group_by(type, resp_frame) |>
  dplyr::summarise(
    mean_rating = mean(rating, na.rm = TRUE),
    sd_rating = sd(rating, na.rm = TRUE)
  ) |>
  dplyr::select(type, resp_frame, mean_rating, sd_rating) 

ratings_by_type_by_resp_frame |>
  ggplot() +
  aes(
    x = type,
    y = mean_rating,
    color = resp_frame,
    fill = resp_frame,
  ) +
  geom_col() +
  geom_errorbar(
    aes(ymin = mean_rating - sd_rating, ymax = mean_rating + sd_rating),
    width = .2,
    position = position_dodge(.9)
  ) +
facet_grid(cols = vars(resp_frame)) +
  ylim(NA, 5)

type_by_resp_frame |>
  kableExtra::kable(format='html') |>
  kableExtra::kable_classic()

Norms by should/actually

Code
ratings_by_norm_by_resp_frame <- survey_02_norms_long |>
  dplyr::group_by(norm_counternorm, resp_frame) |>
  dplyr::summarise(
    mean_rating = mean(rating, na.rm = TRUE),
    sd_rating = sd(rating, na.rm = TRUE)
  ) |>
  dplyr::select(norm_counternorm, resp_frame, mean_rating, sd_rating) 

ratings_by_norm_by_resp_frame |>
  ggplot() +
  aes(
    x = norm_counternorm,
    y = mean_rating,
    color = resp_frame,
    fill = resp_frame,
  ) +
  geom_col() +
  geom_errorbar(
    aes(ymin = mean_rating - sd_rating, ymax = mean_rating + sd_rating),
    width = .2,
    position = position_dodge(.9)
  ) +
  theme(axis.text.x = element_text(angle = 90)) +
facet_grid(cols = vars(resp_frame)) +
  ylim(NA, 5)

ratings_by_norm_by_resp_frame |>
  kableExtra::kable(format='html') |>
  kableExtra::kable_classic()

All items: Norms by should/actually

Code
ratings_by_norm_by_resp_frame <- survey_02_norms_long |>
  dplyr::group_by(resp_frame, type) |>
  dplyr::summarise(
    mean_rating = mean(rating, na.rm = TRUE),
    sd_rating = sd(rating, na.rm = TRUE)
  ) |>
  dplyr::select(resp_frame, type, mean_rating, sd_rating) 
`summarise()` has grouped output by 'resp_frame'. You can override using the
`.groups` argument.
Code
ratings_by_norm_by_resp_frame |>
  ggplot() +
  aes(
    x = type,
    y = mean_rating,
    color = resp_frame,
    fill = resp_frame,
  ) +
  geom_col() +
  geom_errorbar(
    aes(ymin = mean_rating - sd_rating, ymax = mean_rating + sd_rating),
    width = .2,
    position = position_dodge(.9)
  ) +
  facet_grid(cols = vars(resp_frame)) +
  xlab("") +
  ylim(NA, 5) +
  theme(legend.title = element_blank(), legend.position = "none")
Figure 6: Mean responses (+SD) across items
Code
ratings_by_norm_by_resp_frame |>
  kableExtra::kable(format='html') |>
  kableExtra::kable_classic()
Table 1: Mean ratings across items
resp_frame type mean_rating sd_rating
actually counter 3.826923 0.6484114
actually norm 3.461539 0.8508713
should counter 3.730769 0.8192628
should norm 3.711539 0.9566391

References

Kardash, C. M., & Edwards, O. V. (2012). Thinking and behaving like scientists: Perceptions of undergraduate science interns and their faculty mentors. Instructional Science, 40(6), 875–899. https://doi.org/10.1007/s11251-011-9195-0