Evolution

PSY 511.003

Published

February 29, 2024

Evolution of Nervous Systems

(acapellascience, 2017)

Public acceptance of evolution

(Miller, Scott, & Okamoto, 2006). Public acceptance of evolution in 34 countries, 2005.

(Miller et al., 2006). Public acceptance of evolution in 34 countries, 2005.
  • In U.S., majority now “accept”
  • Increase over last decade

(Miller et al., 2021). Figure 1. Public acceptance and rejection of evolution in the United States, 1985–2020. The following question was used in all of the years in this analysis: “For each statement below, please indicate if you think that it is definitely true, probably true, probably false, or definitely false. If you don’t know or aren’t sure, please check the ‘not sure’ box. ‘Human beings, as we know them today, developed from earlier species of animals.’ The number of respondents in each year and the confidence intervals are provided in the Supplemental Material in SI Table 1.

Types of evidence

  • Fossil
    • Fossil dating
  • Geological
    • Where fossils are found relative to one another
    • How long it takes to form layers
  • Genetic
    • Rates of mutation
  • Anatomical
    • Homologous structures across species

Nothing in Biology Makes Sense except in the Light of Evolution

“Seen in the light of evolution, biology is, perhaps, intellectually the most satisfying and inspiring science. Without that light, it becomes a pile of sundry facts some of them interesting or curious, but making no meaningful picture as a whole.”

(Dobzhansky, 1973)

Why Gilmore thinks the theory so controversial (in the U.S.)

  • Contradicts verbatim/non-metaphorical reading of some religious texts
  • Makes humans seem less special
  • Time scales involved beyond human experience
  • Scientific method vs. other ways of knowing
  • Found in nature ≠ good for human society
  • Few negative consequences of ‘disbelief’
  • U.S. culture individualistic, skeptical, anti-elitist, anti-intellectual
  • Lower levels of religious belief among U.S. scientists
  • Politics
  • A minority of citizens support teaching evolution-only
  • Majority of classroom teachers aren’t strong advocates

A structural equation model indicates that increasing enrollment in baccalaureate-level programs, exposure to college-level science courses, a declining level of religious fundamentalism, and a rising level of civic scientific literacy are responsible for the increased level of public acceptance.

(Miller et al., 2021)

Evolution and development

Ontogenesis and phylogenesis

  • Ontogenesis
    • Development within lifetimes, history of individuals
  • Phylogenesis
    • Change across lifestimes, history of species

Ontogeny does not recapitulate phylogeny (Haeckel), but…

Source: Wikipedia

Source: Wikipedia

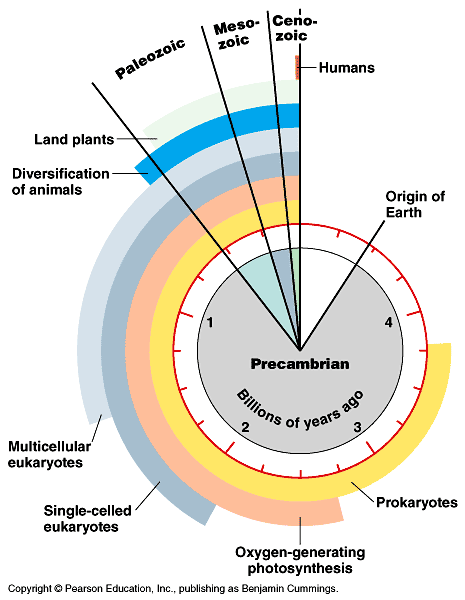
Complex multicellular life emerged “recently”

Nervous system architectures

How nervous systems differ

  • Body symmetry
    • radial
    • bilateral

An animal with a nerve “net”

  • Segmentation
  • Cephalization (concentration of sensory & neural structures in anterior portion of body)
  • Encasement in bone (vertebrates)
  • Centralized vs. distributed function

Cephalopods have “intelligent arms”

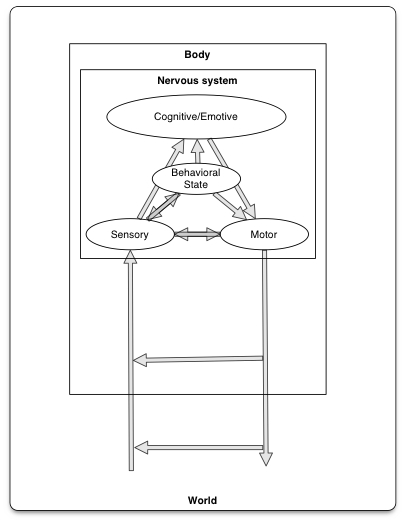
The essentials of biological computation

  • Ingestion
  • Defense
  • Reproduction

Adapted from (Swanson, 2012)

Information processing universals

  • Sense/detect via sensors
    • Specialize by information source/type
    • Specialize by target location
      • Interoceptive
      • Exteroceptive
  • Analyze, evaluate, decide
    • Current state
      • World
      • Organism
    • Current goals
    • Past state(s)
  • Act
    • Move body
      • Approach/avoid
      • Manipulate
      • Ingest
      • Signal
    • Change physiological state

From nerve net to nerve ring, nerve cord, and brain
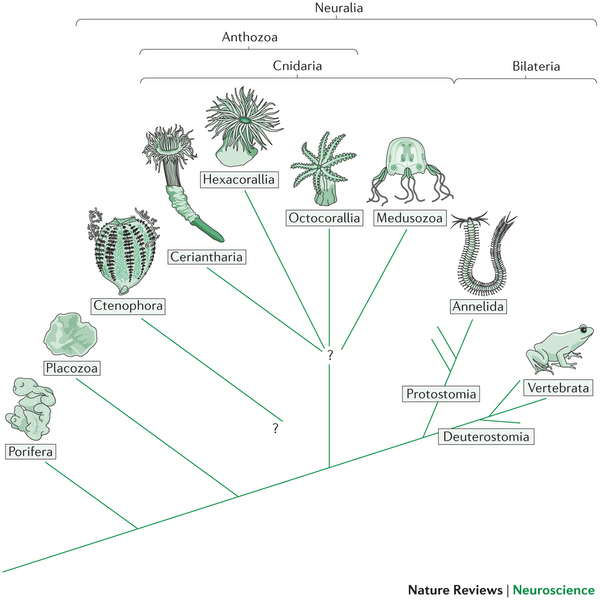
(Figure 1 from Arendt, Tosches, & Marlow, 2016). Animal phylogeny. A simplified animal phylogenetic tree (showing the evolutionary history of animals), in which lines represent evolutionary diversification. The lengths of the lines are arbitrary, as they do not indicate evolutionary distance. For a brief characterization of the Anthozoa, Bilateria, Ceriantharia, Cnidaria, Ctenophora, Medusozoa and Neuralia, see the glossary. The phylogenetic position of the Ctenophora is not settled, as indicated by a question mark. The Ctenophora image is adapted with permission from Ref. 43, Wiley. The Porifera and Placozoa images are reprinted with permission from Ref. 139 (Nielsen, C. Animal Evolution: Interrelationships of the Living Phyla p31 and p39 (2012)) by the permission of Oxford University Press. The Annelida image is adapted with permission from Ref. 140, Schweizerbart Science Publishers (www.schweizerbart.de).

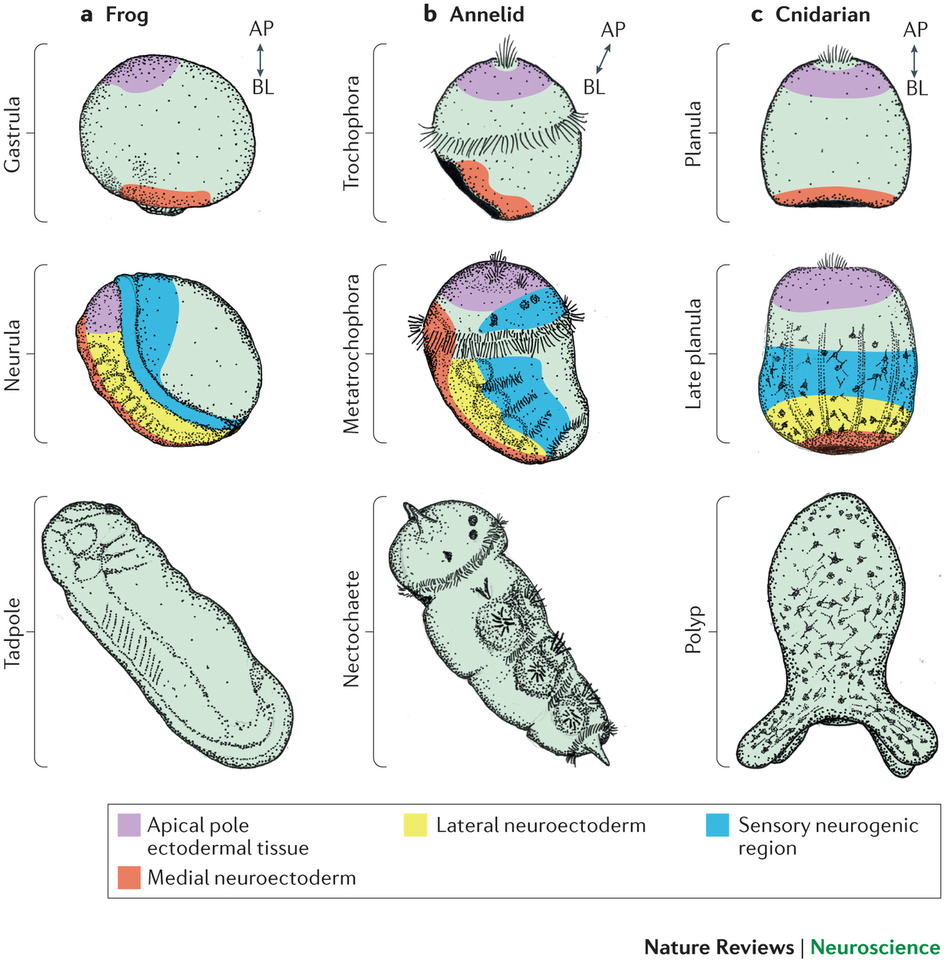
(Figure 2 from Arendt et al., 2016). Comparison of neurodevelopment in the frog, annelid and sea anemone. The frog Xenopus laevis (part a), the annelid Platynereis dumerilii (part b) and the cnidarian Nematostella vectensis (part c) are depicted in their gastrula-like stages (gastrula, trochophora and planula, respectively; upper panels), intermediate developmental (neurula, metatrochophora and late planula, respectively; middle panels) and juvenile stages (tadpole, nectochaete and polyp, respectively; lower panels). Colours demarcate developmental neurogenic regions, and double-headed arrows show the apical (AP)–blastoporal (BL) axis. All views in parts a–c are lateral. At gastrula stages (upper panels), blastoporal ectodermal tissue (around the closing blastopore; red) and apical pole ectodermal tissue (violet) can be distinguished. At subsequent stages, a large part of the ectoderm — incluing the former apical and blastoporal regions — gives rise to neurogenic tissue. The neurogenic tissue comprises regions of distinct molecular identity (indicated by different colours), which will give rise to different parts of the nervous system. In the frog (part a), the neural plate (violet, red and yellow) comprises future forebrain tissue, as well as medial and lateral neural tube tissue; it is laterally bounded by developing peripheral nervous system components (blue). Similar regions are apparent in the annelid (part b), and these give rise to the brain, medial and lateral nerve cord and peripheral nervous system. As reasoned in this article, these regions also exist in the cnidarian (part c). In the frog and annelid worm, these regions are further subdivided into specific subregions by the activity of molecular organizing signals
  • Neurons and nervous systems 520-570 M years old
  • Diverse nervous systems show developmental similarities at molecular level

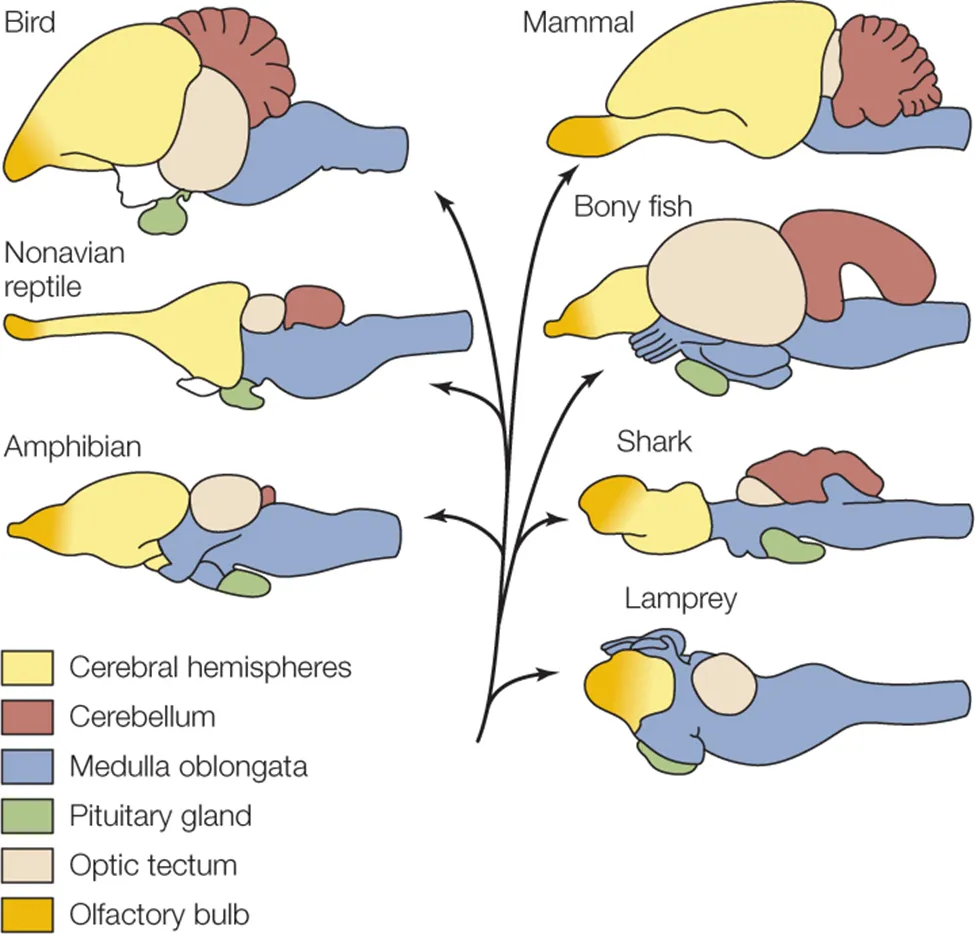
Vertebrate CNS organization

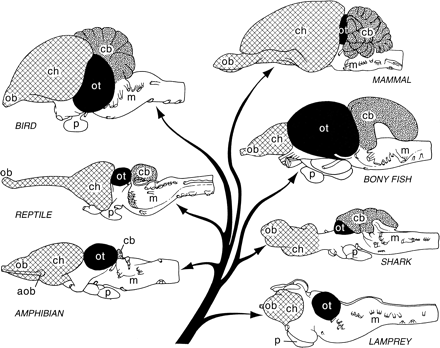
(Figure 1 from Northcutt, 2002)

(Figure 1 from Northcutt, 2002)

(Figure 2 from Northcutt, 2002)

(Figure 2 from Northcutt, 2002)
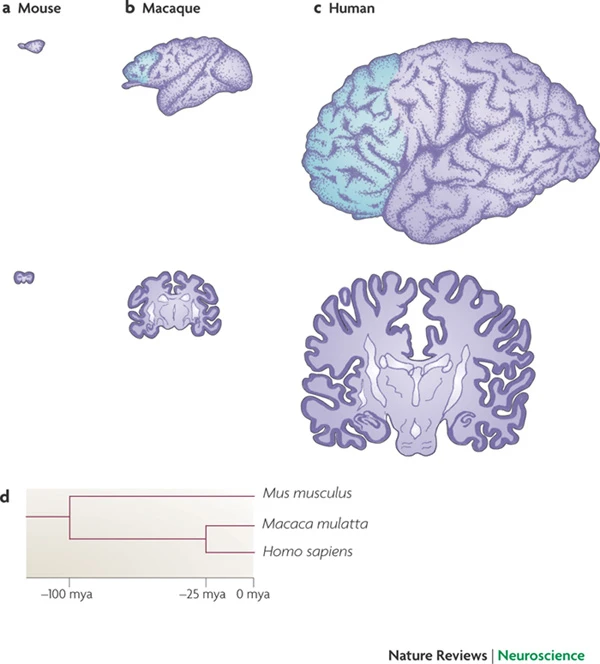
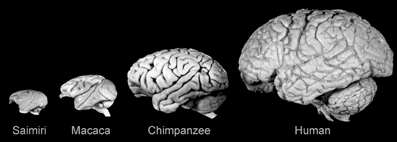
  • Differences in size of the cerebral cortex
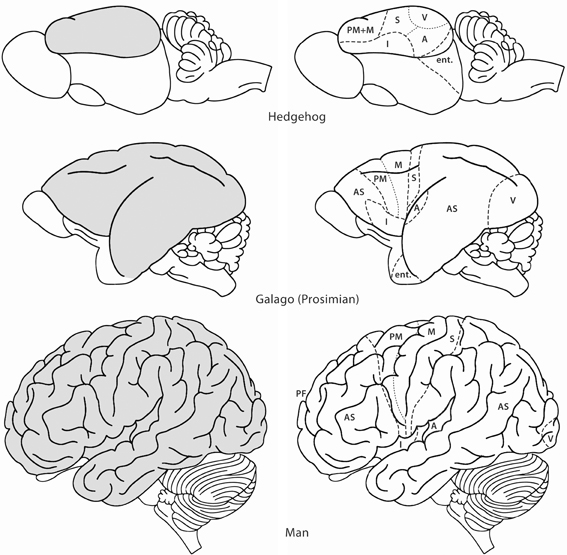
(Figure 1 from Hofman, 2014). Lateral views of the brains of some mammals to show the evolutionary development of the neocortex (gray). In the hedgehog almost the entire neocortex is occupied by sensory and motor areas. In the prosimian Galago the sensory cortical areas are separated by an area occupied by association cortex (AS). A second area of association cortex is found in front of the motor cortex. In man these anterior and posterior association areas are strongly developed. A, primary auditory cortex; AS, association cortex; Ent, entorhinal cortex; I, insula; M, primary motor cortex; PF, prefrontal cortex; PM, premotor cortex; S, primary somatosensory cortex; V, primary visual cortex. Modified with permission from Nieuwenhuys (1994).
Structural measure Non-human comparison Human
Cortical gray matter %/tot brain vol insectivores 25% 50%
Cortical gray + white mice 40% 80%
Cerebellar mass primates, mammals 10-15% 10-15%
  • Evidence for greater gray and white matter (relative to total brain volume) in human cerebral cortex

(Figure 1 from Rakic, 2009)

(Figure 1 from Rakic, 2009)

(Figure 2 from Hofman, 2014)

(Figure 2 from Hofman, 2014)

Take homes

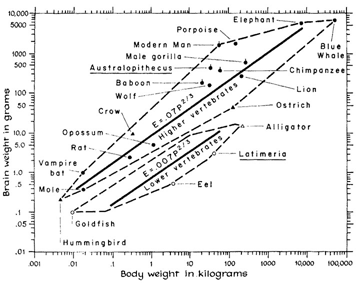
  • Brain sizes scale with body size
  • Brain sizes (more or less) scale with animal class (more or less)

Old story

  • Within mammals, human brains bigger than expected
    • Higher encephalization quotient – deviation from species-typical norm
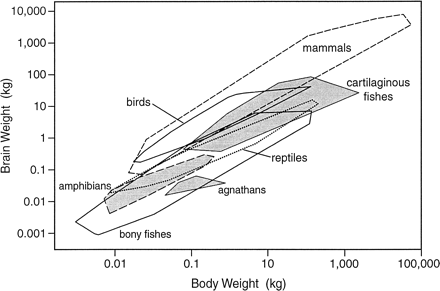
(Figure 2 from Northcutt, 2002)
  • Humans have larger cerebral cortical gray + white matter than comparable mammals

vs. New story

  • Does brain size/mass matter (that much)?
  • “Size matters” (brain mass) presumes similarity among brains at micro-level
  • Big (large mass) brains arise in multiple mammalian lineages

(Figure 1 from Herculano-Houzel, 2012). Large brains appear several times in the mammalian radiation. Example species are illustrated for each major mammalian group. The mammalian radiation is based on the findings of Murphy et al. (18) and Kaas (19). Brain images are from the University of Wisconsin and Michigan State Comparative Mammalian Brain Collections (www.brainmuseum.org).
  • # of cortical neurons more important difference than brain mass
  • The primate advantage -> more cortical neurons, but not larger neurons & not more neurons in cerebellum
  • Human brain just scaled up (non-ape) primate brain

(Figure 3 from Herculano-Houzel, 2012). Shared nonneuronal scaling rules and structure- and order-specific neuronal scaling rules for mammalian brains. Each point represents the average values for one species (insectivores, blue; rodents, green; primates, red; Scandentia, orange). Arrows point to human data points, circles represent the cerebral cortex, squares represent the cerebellum, and triangles represent the rest of the brain (excluding the olfactory bulb). (A) Clade- and structure-specific scaling of brain structure mass as a function of numbers of neurons. Allometric exponents: cerebral cortex: 1.699 (Glires), 1.598 (insectivores), 1.087 or linear (primates); cerebellum: 1.305 (Glires), 1.028 or linear (insectivores), 0.976 or linear (primates); rest of the brain: 1.568 (Glires), 1.297 (insectivores), 1.198 (or 1.4 when corrected for phylogenetic relatedness in the dataset, primates). (B) Neuronal cell densities scale differently across structures and orders but are always larger in primates than in Glires. Allometric exponents: cerebral cortex: −0.424 (Glires), −0.569 (insectivores), −0.168 (primates); cerebellum: −0.271 (Glires), not significant (insectivores and primates); rest of the brain: −0.467 (Glires), not significant (insectivores), −0.220 (primates). (C) Mass of the cerebral cortex, cerebellum, and rest of the brain varies as a similar function of their respective numbers of nonneuronal cells. Allometric exponents: cerebral cortex: 1.132 (Glires), 1.143 (insectivores), 1.036 (primates); cerebellum: 1.002 (Glires), 1.094 (insectivores), 0.873 (primates); rest of the brain: 1.073 (Glires), 0.926 (insectivores), 1.065 (primates). (D) Average density of nonneuronal cells in each structure does not vary systematically with structure mass across species. Power functions are not plotted so as not to obscure the data points. Allometric exponents are from a study by Herculano-Houzel (20); data are from studies by Herculano-Houzel and her colleagues (22–27).

# of cortical (or in birds, pallidum) neurons predicts “cognition”?

(Figure 3 from Herculano-Houzel, 2017)

The Human Advantage (Herculano-Houzel, 2016)

  • Brain
    • More neurons in cerebral cortex than other mammals
  • Behavior
    • Less time spent foraging
      • Higher quality/more energetically dense food
      • Higher food availability
    • Cultural factors (agriculture + cooking), see also (Wrangham, 2009)

A further human advantage

References

acapellascience. (2017, September). Evo-Devo (despacito biology parody) | a capella science. Youtube. Retrieved from https://www.youtube.com/watch?v=ydqReeTV_vk
Arendt, D., Tosches, M. A., & Marlow, H. (2016). From nerve net to nerve ring, nerve cord and brain — evolution of the nervous system. Nature Reviews Neuroscience, 17(1), 61–72. https://doi.org/10.1038/nrn.2015.15
Dobzhansky, T. (1973). Nothing in biology makes sense except in the light of evolution. The American Biology Teacher, 35(3), pp. 125–129. Retrieved from http://www.jstor.org/stable/4444260
Herculano-Houzel, S. (2012). The remarkable, yet not extraordinary, human brain as a scaled-up primate brain and its associated cost. Proceedings of the National Academy of Sciences of the United States of America, 109 Suppl 1, 10661–10668. https://doi.org/10.1073/pnas.1201895109
Herculano-Houzel, S. (2016). The human advantage: A new understanding of how our brain became remarkable. MIT Press. Retrieved from https://market.android.com/details?id=book-DMqpCwAAQBAJ
Herculano-Houzel, S. (2017). Numbers of neurons as biological correlates of cognitive capability. Current Opinion in Behavioral Sciences, 16(Supplement C), 1–7. https://doi.org/10.1016/j.cobeha.2017.02.004
Hofman, M. A. (2014). Evolution of the human brain: When bigger is better. Frontiers in Neuroanatomy, 8. https://doi.org/10.3389/fnana.2014.00015
Miller, J. D., Scott, E. C., Ackerman, M. S., Laspra, B., Branch, G., Polino, C., & Huffaker, J. S. (2021). Public acceptance of evolution in the united states, 1985-2020. Public Understanding of Science, 9636625211035919. https://doi.org/10.1177/09636625211035919
Miller, J. D., Scott, E. C., & Okamoto, S. (2006). Public acceptance of evolution. SCIENCE-NEW YORK THEN WASHINGTON-, 313(5788), 765. https://doi.org/10.1126/science.1126746
Northcutt, R. G. (2002). Understanding vertebrate brain evolution. Integr. Comp. Biol., 42(4), 743–756. https://doi.org/10.1093/icb/42.4.743
Rakic, P. (2009). Evolution of the neocortex: A perspective from developmental biology. Nature Reviews. Neuroscience, 10(10), 724–735. https://doi.org/10.1038/nrn2719
Swanson, L. W. (2012). Brain architecture: Understanding the basic plan. Oxford University Press.
Wrangham, R. (2009). Catching fire: How cooking made us human. Basic Books. Retrieved from https://market.android.com/details?id=book-ebEOupKz-rMC