Fear, stress, pleasure, & reward

PSY 511.003

Published

April 25, 2024

The biological bases of emotion

Are there physiological signatures of emotions?

Autonomic Nervous System (ANS)

This meta-analytic investigation demonstrates that there is no 1-to-1 mapping between an emotion category and a specific autonomic nervous system response pattern. In addition, we observed substantial variability in autonomic nervous system changes during instances of the same emotion category that was not accounted for by experimental moderators (such as the way the emotion was induced). These findings suggest that autonomic nervous system changes during emotion are less like a bodily fingerprint and more like a population of variable, context sensitive instances. (Siegel et al., 2018)

Body ‘location’ of experienced emotions

(Nummenmaa, Glerean, Hari, & Hietanen, 2014). The emBODY tool. Participants colored the initially blank body regions (A) whose activity they felt increasing (left body) and decreasing (right body) during emotions. Subjectwise activation–deactivation data (B) were stored as integers, with the whole body being represented by 50,364 data points. Activation and deactivation maps were subsequently combined (C) for statistical analysis.

(Nummenmaa et al., 2014). Bodily topography of basic (Upper) and nonbasic (Lower) emotions associated with words. The body maps show regions whose activation increased (warm colors) or decreased (cool colors) when feeling each emotion. (P < 0.05 FDR corrected; t > 1.94). The colorbar indicates the t-statistic range.

(Nummenmaa et al., 2014). Hierarchical structure of the similarity between bodily topographies associated with emotion words in experiment 1 (Upper) and basic emotions across experiments with word (W), story (S), movie (M), and Face (F) stimuli (Lower).

Where in the brain is emotion processed?
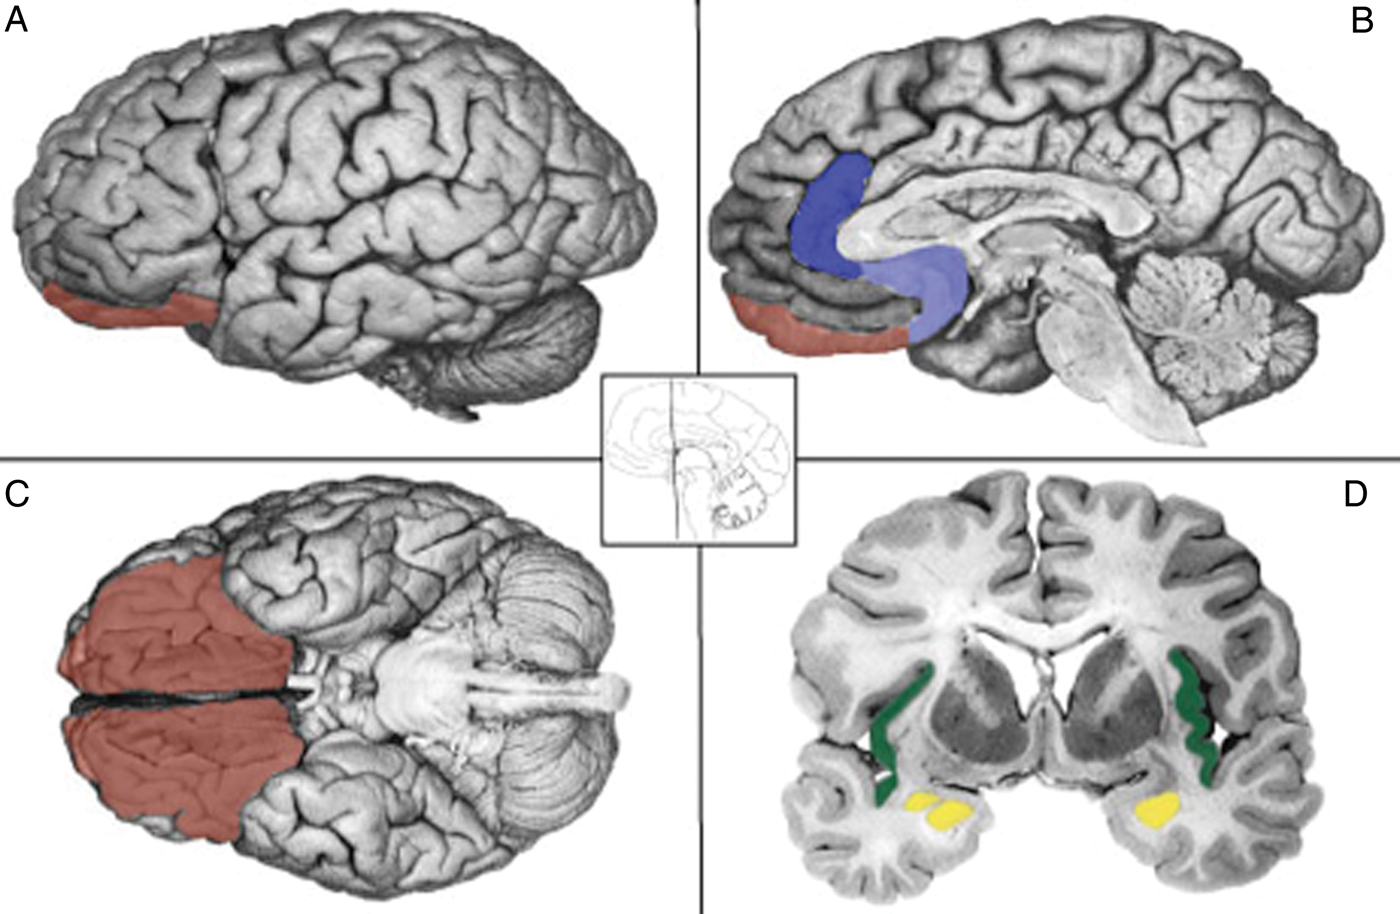
Lindquist, Wager, Kober, Bliss-Moreau, & Barrett (2012)

Locationist account

  • Where in the brain is emotion processed?

(Lindquist et al., 2012). Figure 1. Locationist Hypotheses of Brain–Emotion Correspondence. A: Lateral view. B: Sagital view at the midline. C: Ventral view. D: Coronal view. Brain regions hypothesized to be associated with emotion categories are depicted. Here we depict the most popular locationist hypotheses, although other locationist hypotheses of brain–emotion correspondence exist (e.g., Panksepp, Reference Panksepp1998). Fear: amygdala (yellow); Disgust: insula (green); Anger: OFC (rust); Sadness: ACC (blue). A color version of this image can be viewed in the online version of this target article at http://www.journals.cambridge.org/bbs.

Constructionist account

A psychological constructionist account of emotion assumes that emotions are psychological events that emerge out of more basic psychological operations that are not specific to emotion. In this view, mental categories such as anger, sadness, fear, et cetera, are not respected by the brain (nor are emotion, perception, or cognition, for that matter.

…emotions emerge when people make meaning out of sensory input from the body and from the world using knowledge of prior experiences. Emotions are “situated conceptualizations” (cf. Barsalou 2003) because the emerging meaning is tailored to the immediate environment and prepares the person to respond to sensory input in a way that is tailored to the situation
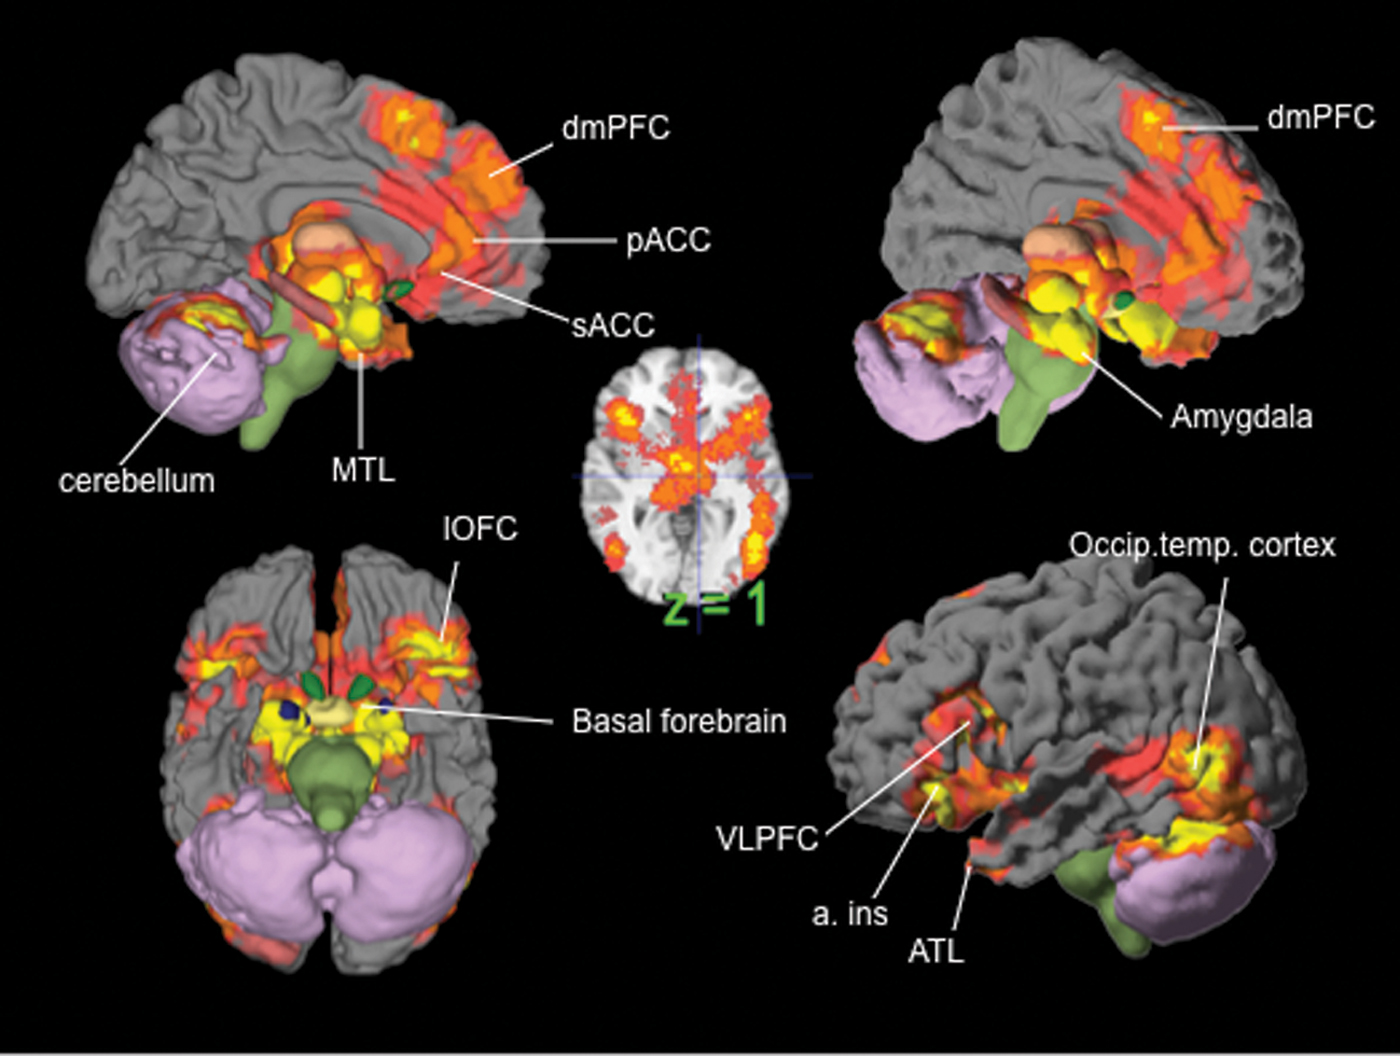
(Lindquist et al., 2012). Figure 4. The Neural Reference Space for Discrete Emotion. The neural reference space (phrase coined by Edelman [1989]) is the set of brain regions consistently activated across all studies assessing the experience or perception of anger, disgust, fear, happiness and sadness (i.e. the superordinate category emotion). Brain regions in yellow exceeded the height threshold (\(p<.05\)) and regions in orange exceeded the most stringent extent-based threshold (\(p<.001\)). Regions in pink and magenta correspond to lesser extent-based thresholds and are not discussed in this article. Cortex is grey, the brainstem and nucleus accumbens are green, the amygdala is blue and the cerebellum is purple. A color version of this image can be viewed in the online version of this target article at http://www.journals.cambridge.org/bbs.

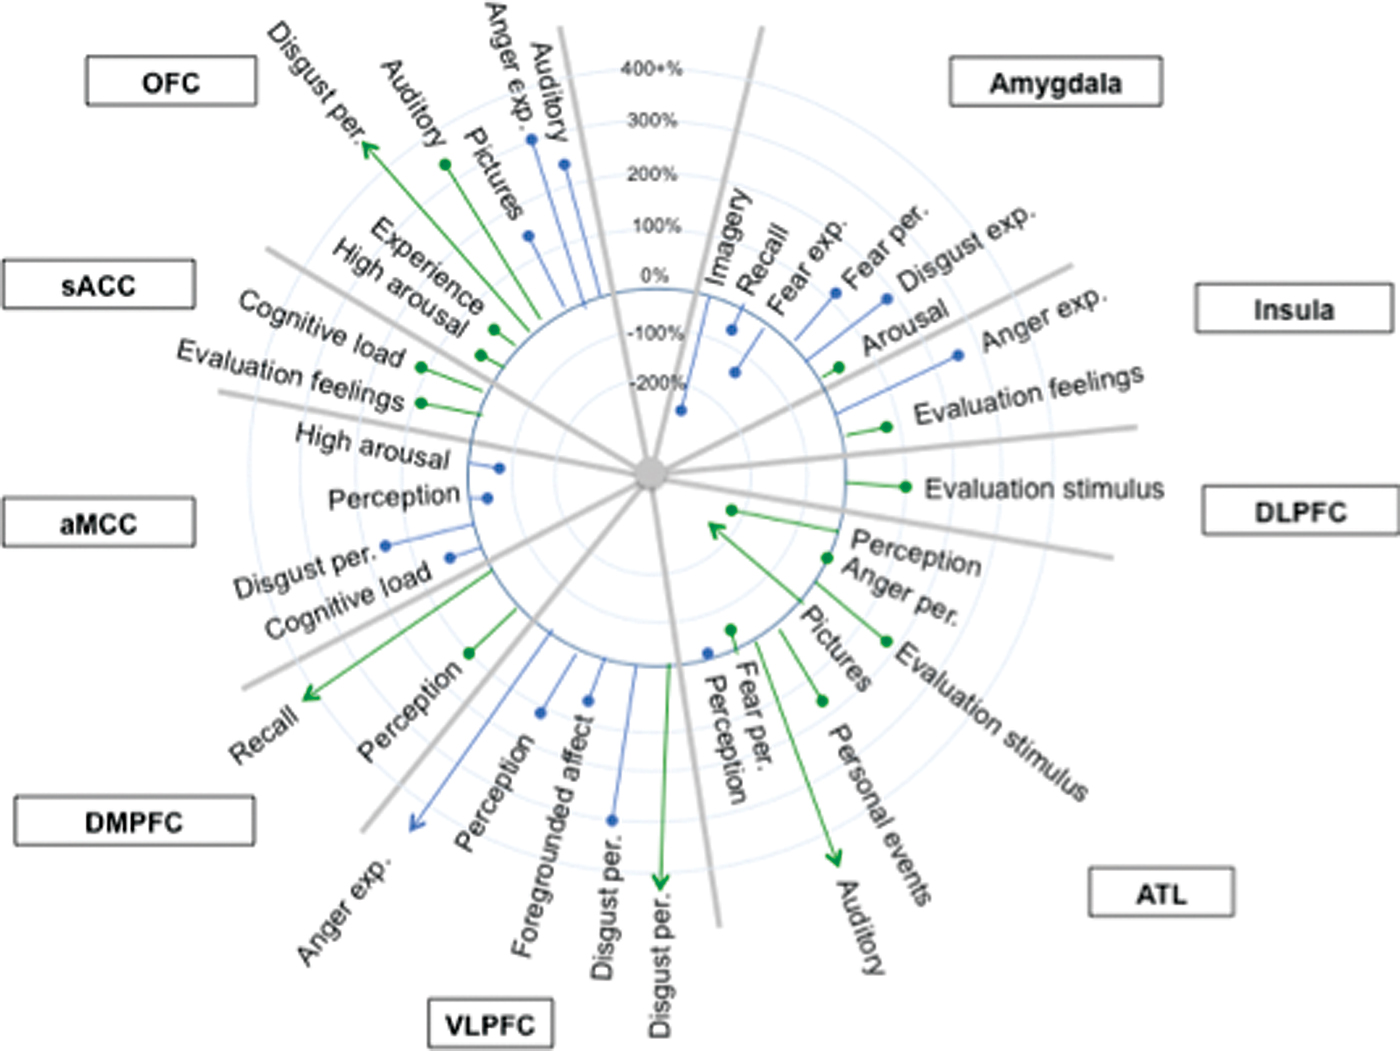
(Lindquist et al., 2012). Figure 5. Logistic Regression Findings. Selected results from the logistic regressions are presented (for additional findings, see Table S6 in supplementary materials). Circles with positive values represent a 100% increase in the odds that a variable predicted an increase in activity in that brain area. Circles with negative values represent a 100% increase in the odds that a variable predicted there would not be an increase in activity in that brain area. Legend: Blue lines: left hemisphere; Green lines: right hemisphere. Arrowheads: % change in odds is greater than values represented in this figure. Abbreviations: OFC: orbitofrontal cortex; DLPFC: dorsolateral prefrontal cortex; ATL: anterior temporal lobe; VLPFC: ventrolateral prefrontal cortex; DMPFC: dorsomedial prefrontal cortex; aMCC: anterior mid-cingulate cortex; sAAC: subgenual ACC. A color version of this image can be viewed in the online version of this target article at http://www.journals.cambridge.org/bbs.

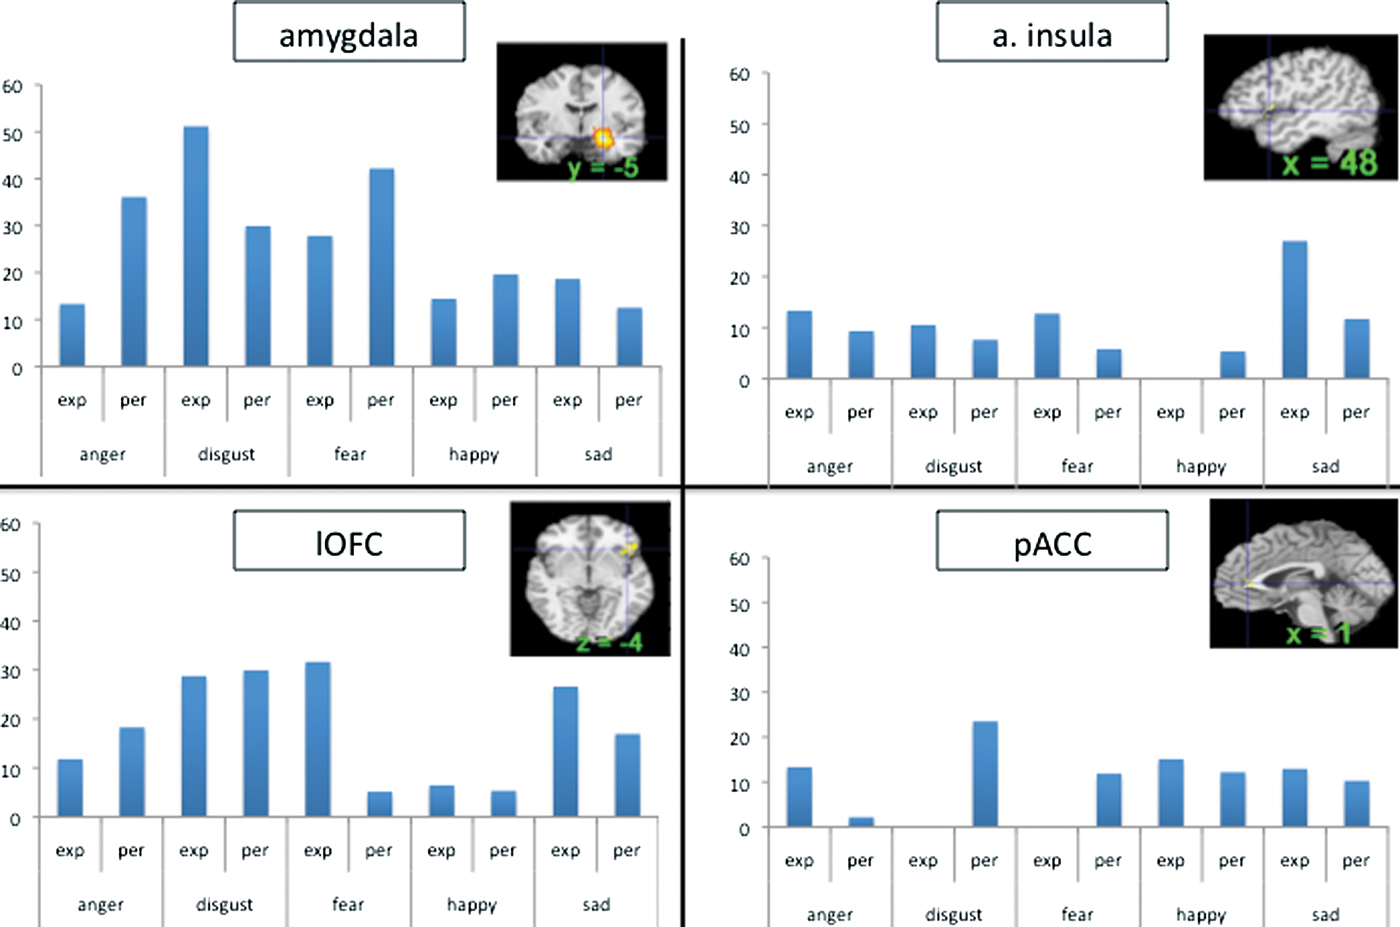
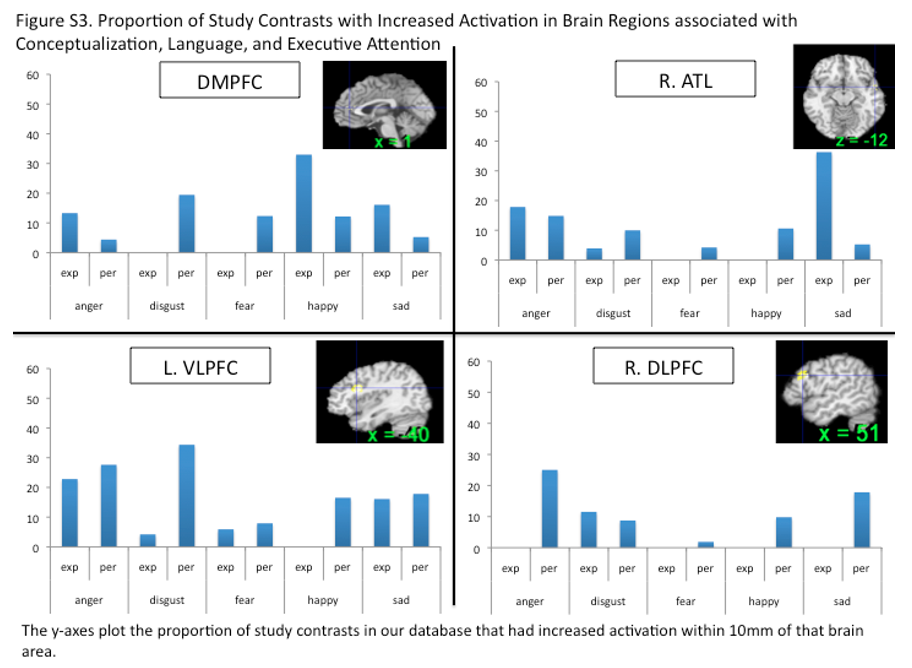
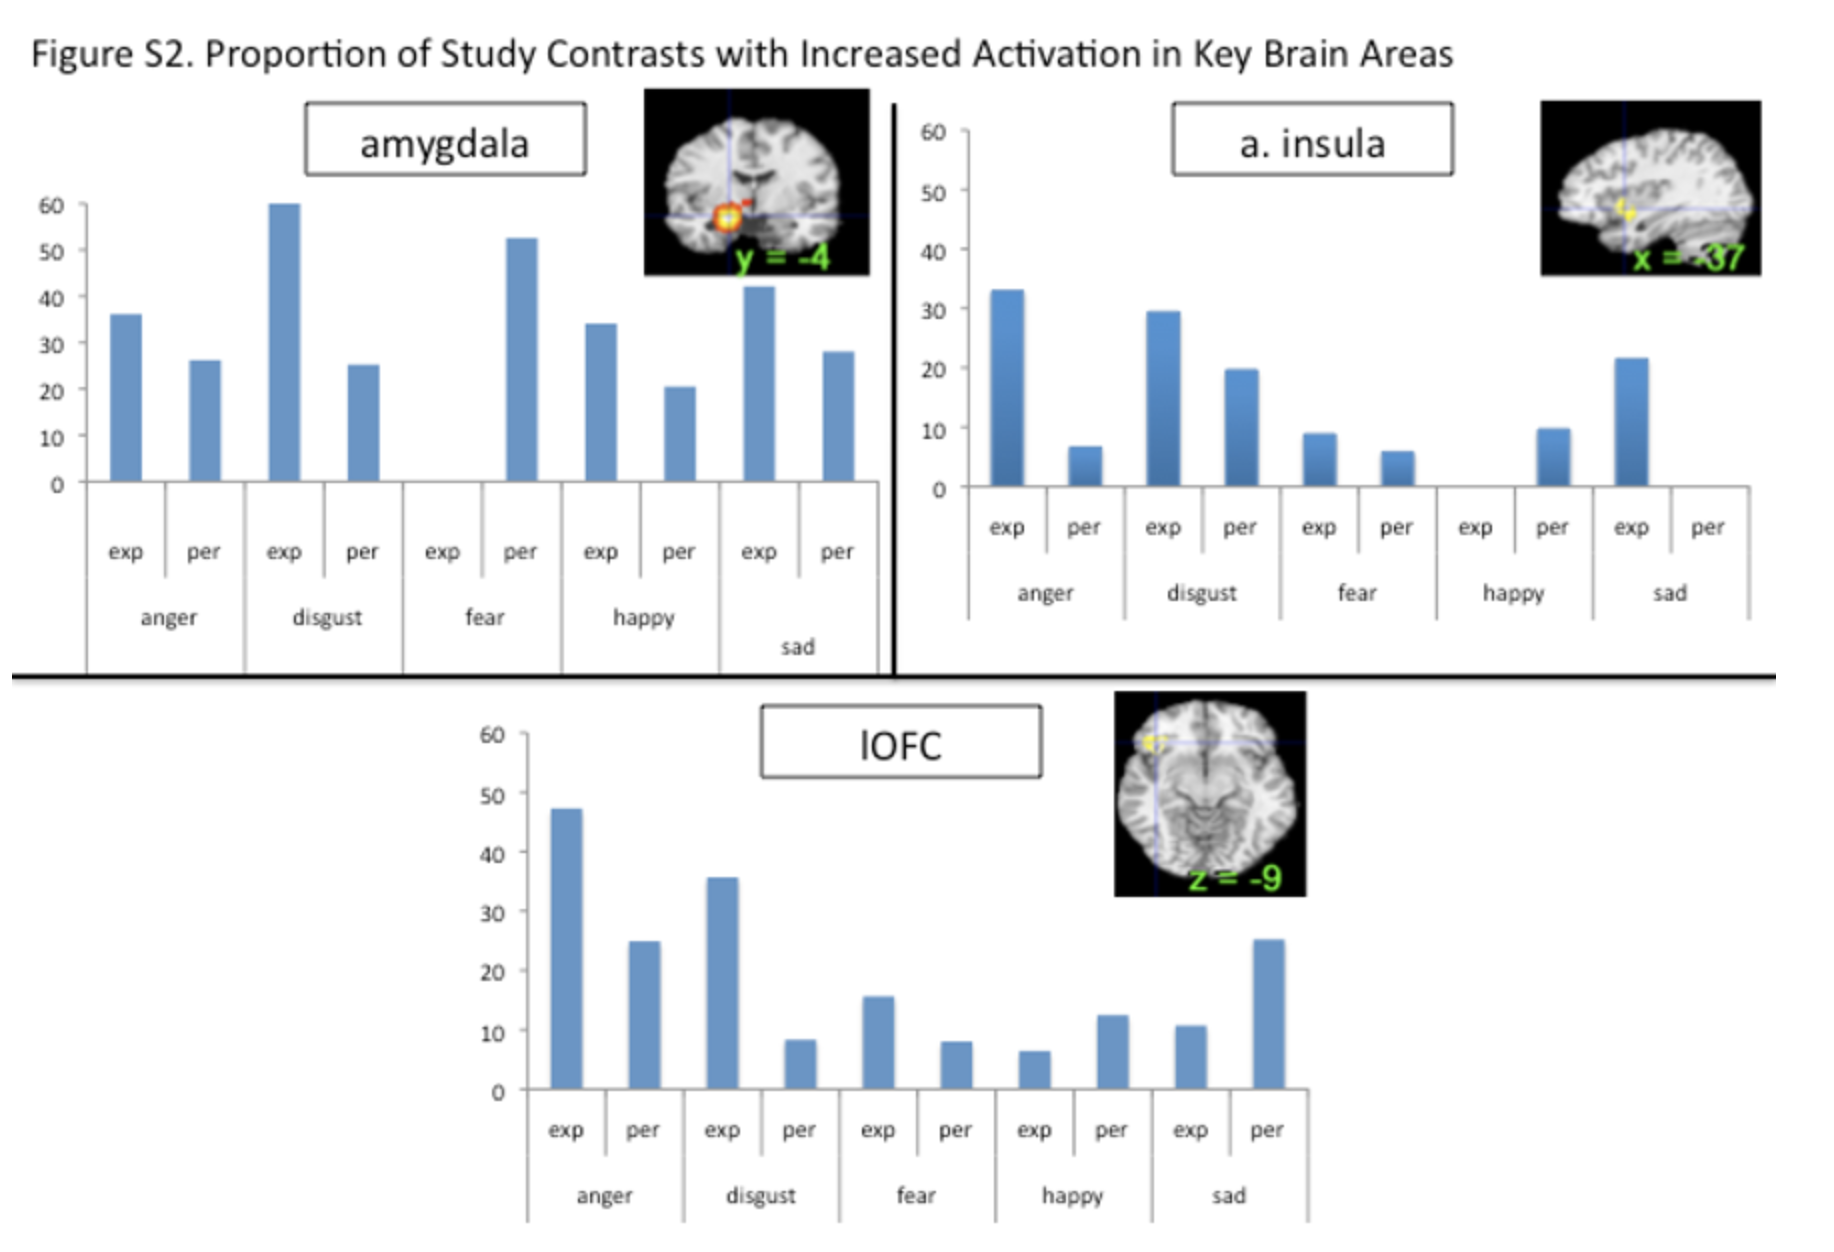
(Lindquist et al., 2012). Figure 6. Proportion of Study Contrasts with Increased Activation in Four Key Brain Areas. The y-axes plot the proportion of study contrasts in our database that had increased activation within 10mm of that brain area. The x-axes denote the contrast type separated by experience (exp) and perception (per). All brain regions depicted are in the right hemisphere. See Figures S2 and S3 in supplementary materials, available at http://www.journals.cambridge.org/bbs2012008, for additional regions. A color version of this image can be viewed in the online version of this target article at http://www.journals.cambridge.org/bbs.

Amygdala as a ‘hub’ for fear

Our meta-analytic findings were inconsistent with a locationist hypothesis of amygdala function but were more consistent with the psychological constructionist hypothesis. Our density analyses revealed that, as compared to other brain regions, voxels within both amygdalae had more consistent increases in activation during instances of fear perception than during the perception of any other emotion category (Table 1). These voxels were not functionally specific for instances of perceiving fear, however. (Lindquist et al., 2012)

Anterior insula as ‘hub’ for disgust

Our meta-analytic findings were inconsistent with the locationist account that the anterior insula is the brain seat of disgust but were more consistent with the psychological constructionist account that insula activity is correlated with interoception and the awareness of affective feelings. (Lindquist et al., 2012)

Orbitofrontal cortex (OFC) as ‘hub’ for anger

Our meta-analytic findings were inconsistent with the locationist hypothesis that the OFC is the brain seat of anger. As compared to voxels within other brain regions, voxels within the OFC did not have more consistent increases during instances of anger experience or perception than during any other emotion category. Rather, as compared to voxels within other brain regions, voxels within the left lOFC had more consistent increases in activation during instances of disgust experience than during the experience of other emotion categories. (Lindquist et al., 2012)

Anterior cingulate cortex as ‘hub’ for sadness

Our meta-analytic evidence is inconsistent with the locationist account that the ACC is the brain basis of sadness, but more consistent with a psychological constructionist hypothesis of ACC function. As compared to voxels within other brain regions, voxels within the sACC, pACC and aMCC did not have more consistent increases when participants were experiencing or perceiving instances of sadness than during any other emotion category (Fig. 6). (Lindquist et al., 2012)

The biology of fear

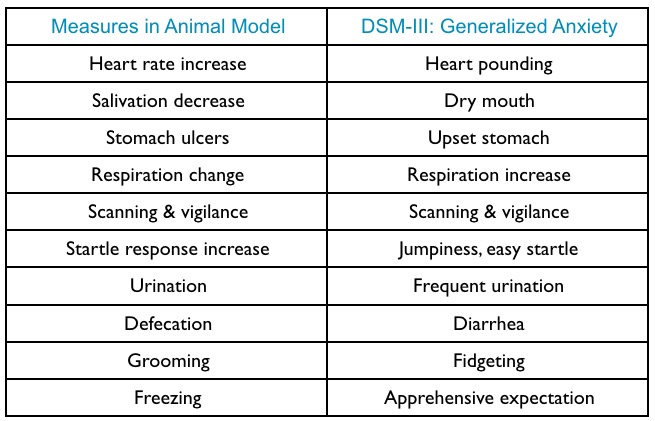
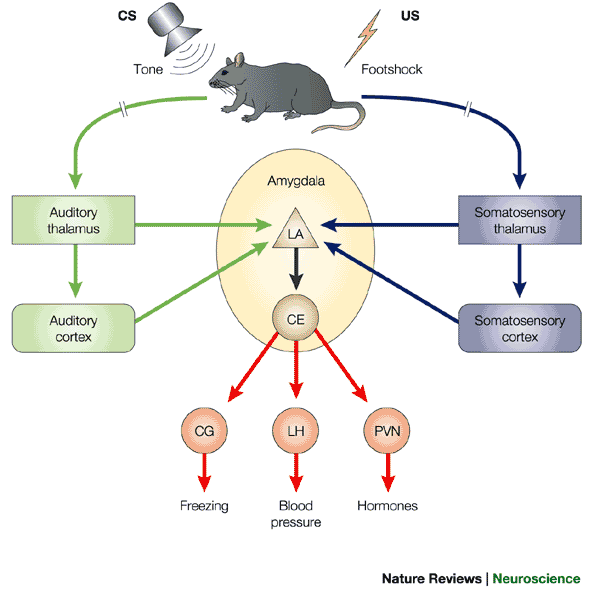
Animal models
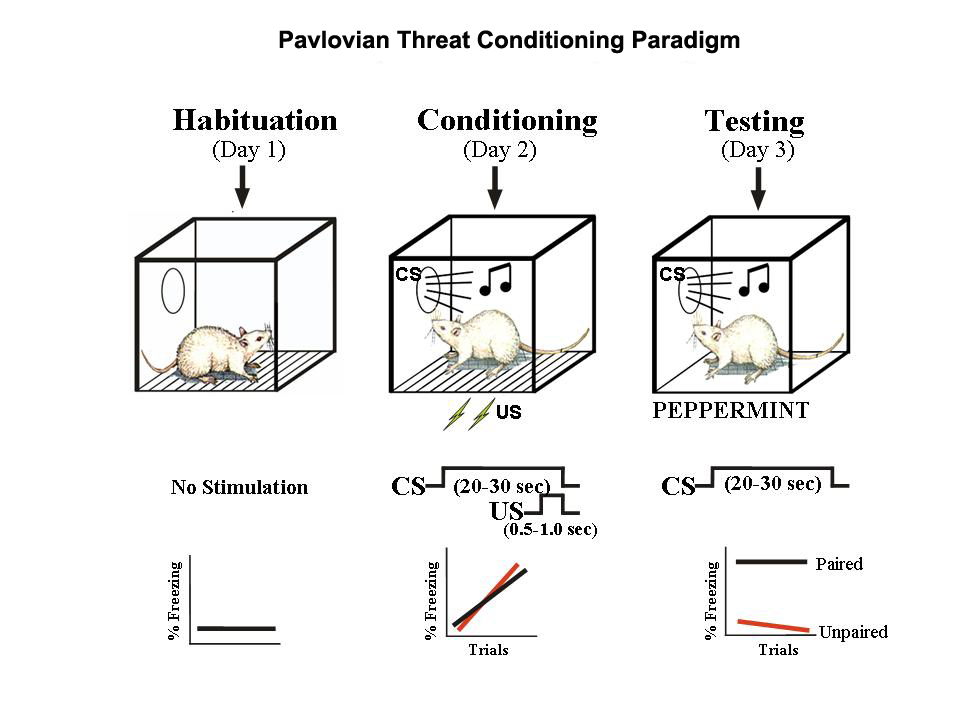
http://www.cns.nyu.edu/labs/ledouxlab/images/image_research/fear_conditioning.jpg

(daleswartzentruber, 2007)

Amygdala circuits

  • Direct (fast) pathways via thalamus
  • Indirect (slower) pathways via cortex
  • Input and output (behavior, physiology) specificity

Specificity of learning stimulus/response mappings

  • Specific stimulus/response, \(S \rightarrow R\), patterns
  • Visual OR Auditory \(\rightarrow\) pain
  • Taste \(\rightarrow\) nausea

Circuitry

  • BLA, basolateral complex of the amygdala
  • CEA, central nucleus of the amygdala
  • ITC, intercalated cells of the amygdala
  • PL, prelimbic cortex
  • IL, infralimbic cortex
  • HPC, hippocampus
  • Thal, thalamus
  • PAG, periaqueductal gray
  • PBN, parabrachial nucleus

Stress

Types

  • Acute stress
    • Short duration
  • Brain detects threat
  • Mobilizes physiological, behavioral responses
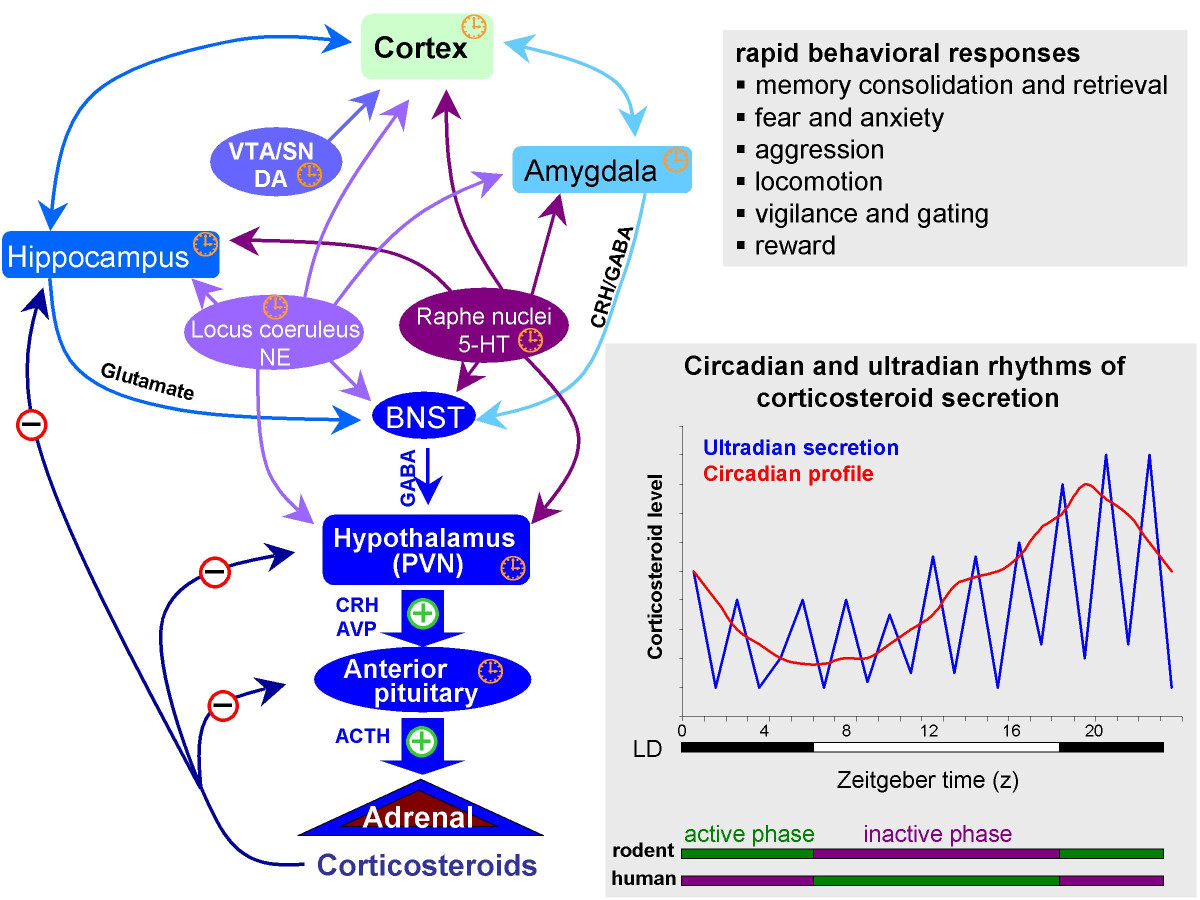
    • HPA (Cortisol), SAM (NE/Epi) axes
  • vs. Chronic or stress
    • Long duration, persistent

Glucocorticoids

Note
  • Hypothalamus: CRH \(\rightarrow\) anterior pituitary
  • Anterior pituitary: ACTH \(\rightarrow\) bloodstream
  • Adrenal cortex: Corticosteroids \(\rightarrow\) bloodstream

See resources/neurochemistry.

  • Cortisol (hydrocortisone/CORT)
    • Increases blood glucose levels
    • Suppresses immune system
    • Reduces inflammation
    • Aids in metabolism
  • Cortisol receptors in body and brain
  • Multiple feedback loops

http://www.molecularbrain.com/content/figures/1756-6606-3-2-1-l.jpg

Impacts of acute stress

Changes in neural architecture

  • Hippocampus (rich in CORT receptors)
  • Prefrontal cortex

Neurochemical factors

  • Cortisol enhances glutamate release
  • Corticosteroid antagonists block this
  • Ketamine (NMDA receptor antagonist) may act via similar mechanisms

Pleasure/reward

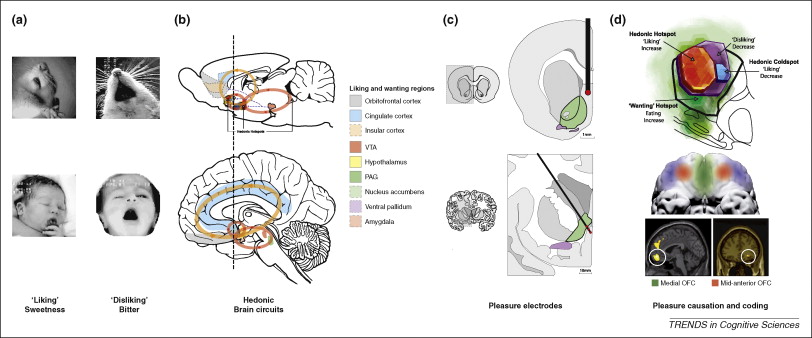
Evolutionary/comparative perspective

Reward

  • A reward reinforces (makes more prevalent/probable) some behavior
  • Milner and Olds (Milner, 1989) discovered ‘rewarding’ power of electrical self-stimulation
  • (Heath, 1963) studied effects in human patients.

(ashikkerib, 2007)

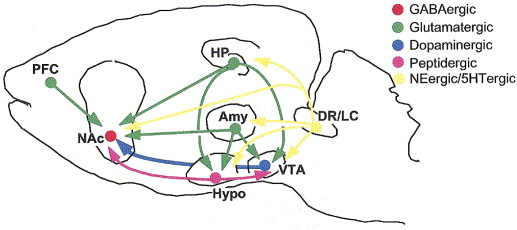
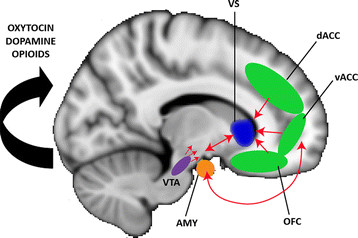
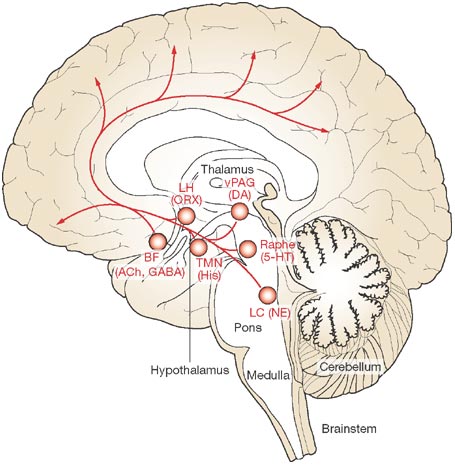
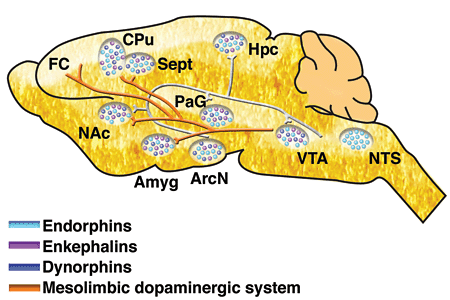
“Reward” circuitry in the brain

  • Lateral Hypothalamus (Hyp)
  • Medial forebrain bundle (MFB)
  • Ventral tegmental area (VTA) in midbrain
  • Nucleus accumbens (nAcc)
  • Dorsal Raphe Nucleus/Locus Coeruleus (DR/LC)
  • Amygdala (Amy)
  • Hippocampus (HP)
  • Prefrontal cortex (PFC)

What does DA signal?

  • Hedonia and anhedonia
  • Incentive salience
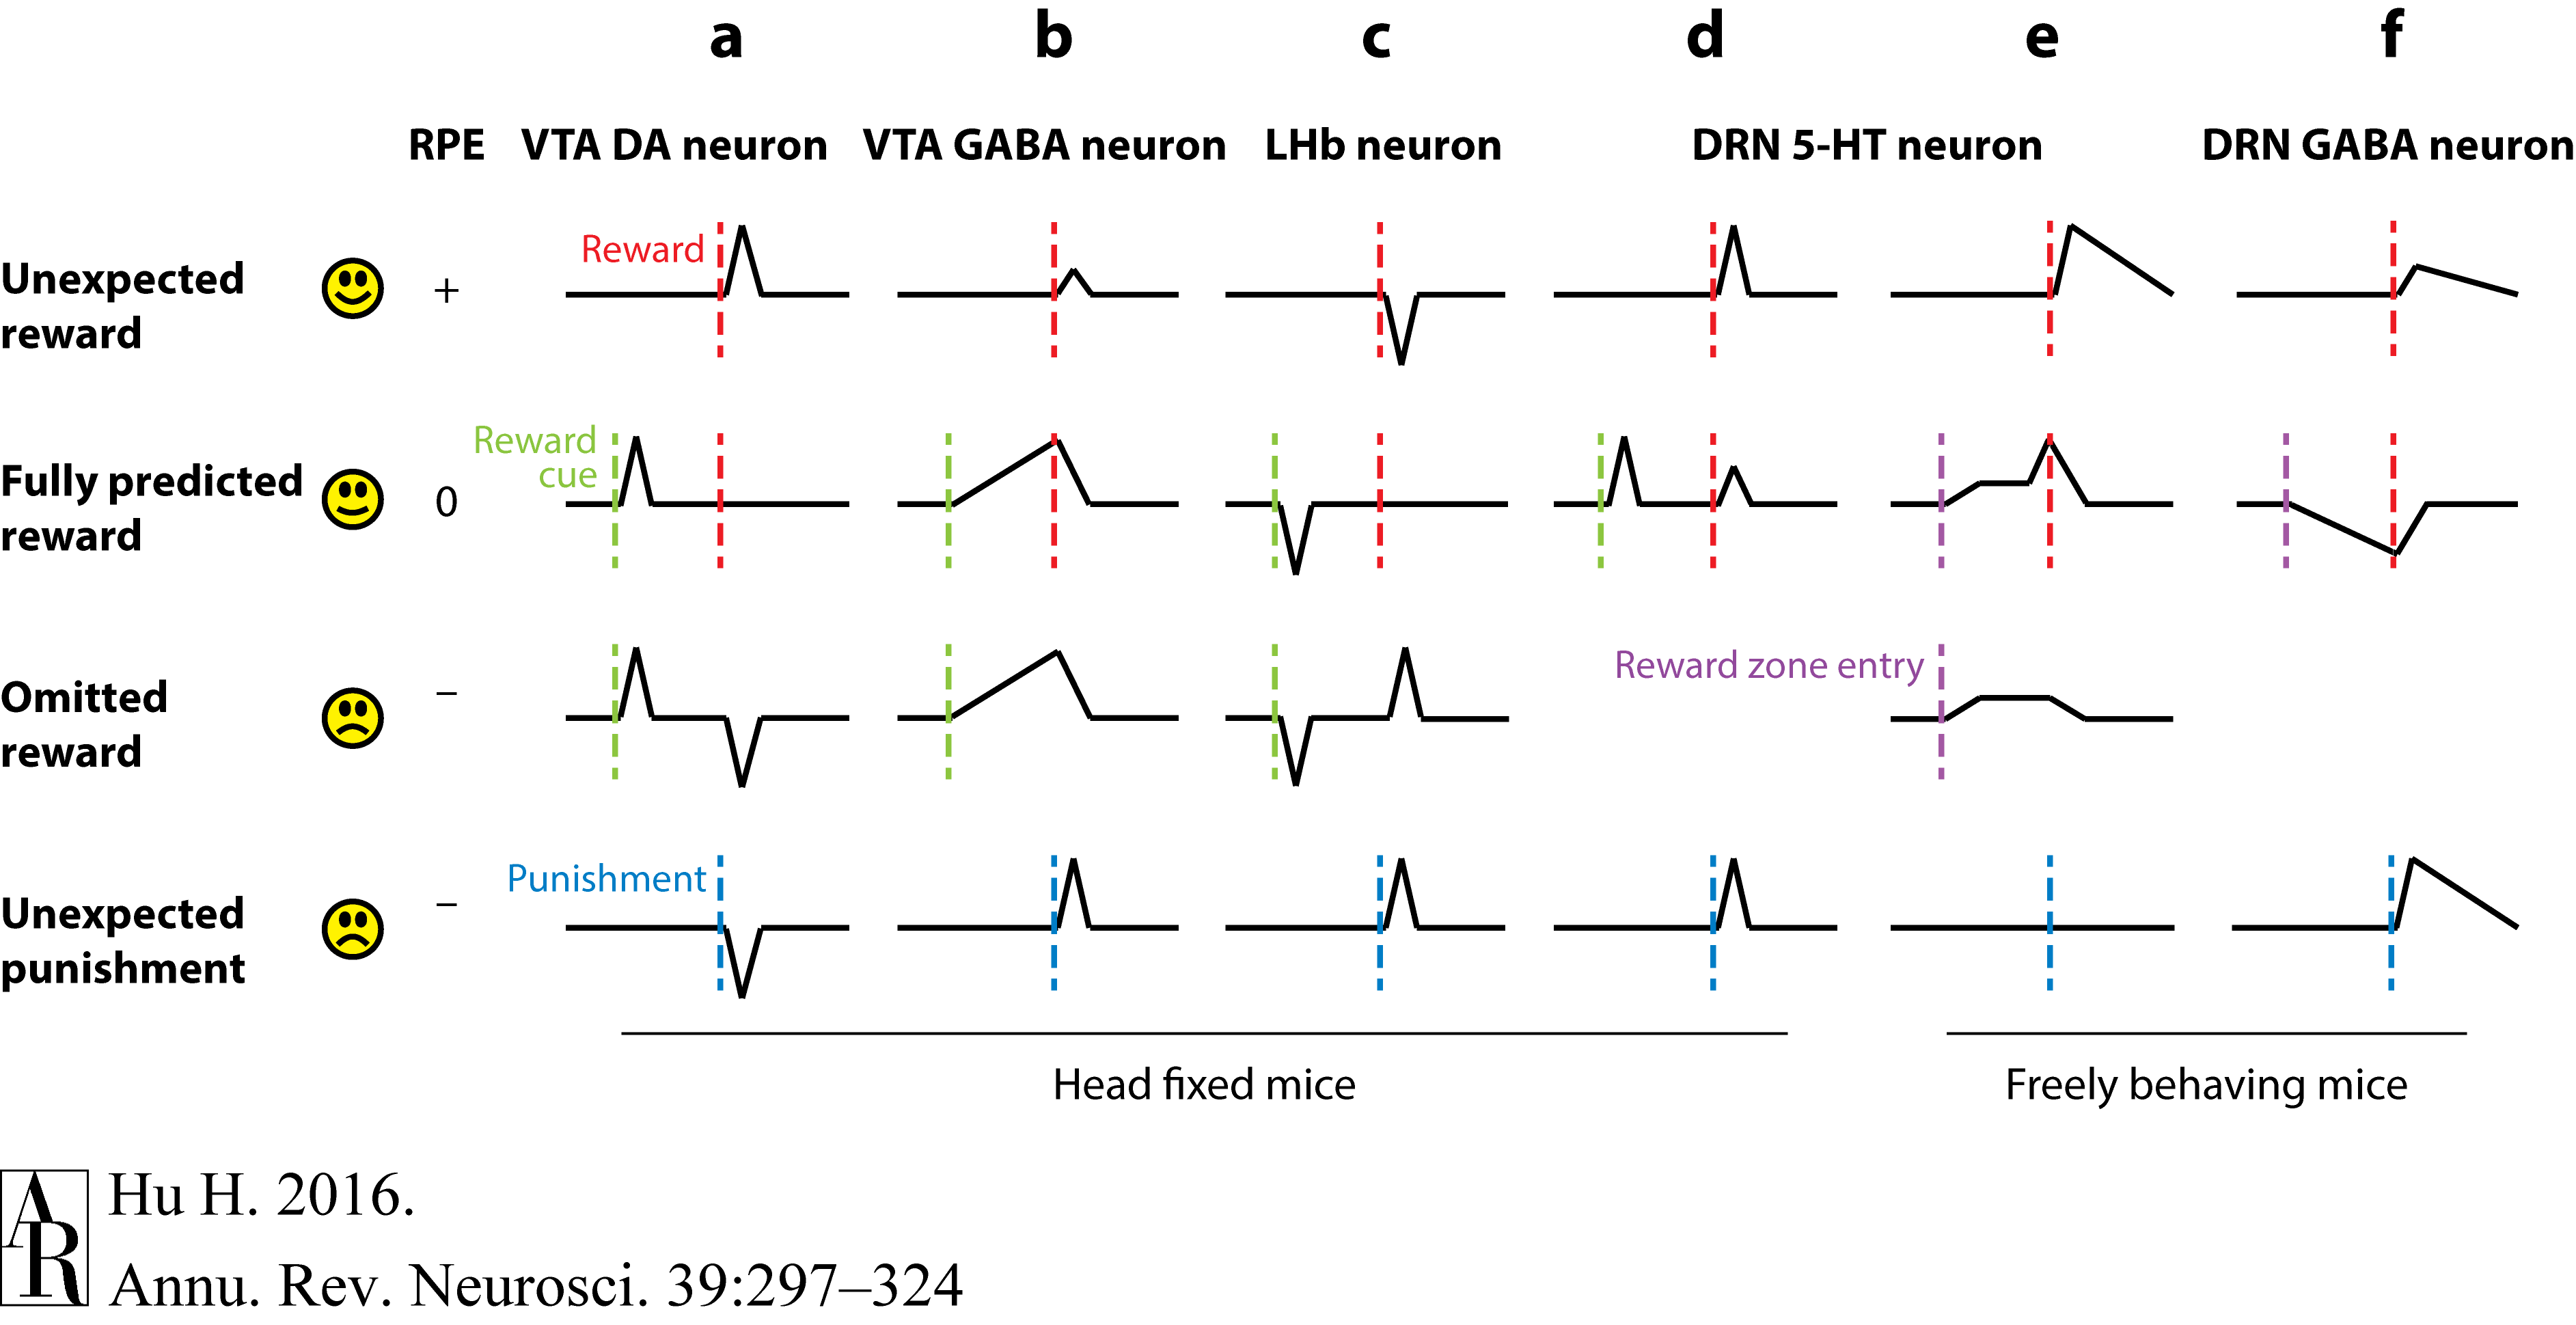
  • Reward prediction error (RPE)

(Hu, 2016). Figure 1. Characteristic response to reward and punishment by different neurons. (a) Ventral tegmental area (VTA) dopamine (DA) neurons encode reward prediction error (RPE) signals, showing excitatory responses only when the reward is not fully predicted (Cohen et al. 2012, Schultz 1998). (b) VTA GABA neurons encode reward expectation, contributing to RPE calculation by serving as a source of subtraction (Eshel et al. 2015). (c) Lateral habenula (LHb) neurons show mirror-inverted phasic responses to DA neurons, potentially providing a source of negative RPE signals (Matsumoto & Hikosaka 2009a). (d,e) Recordings from dorsal raphe nucleus (DRN) serotonergic (5-HT) neurons reveal diverse responses to reward and punishment, with a substantial subset showing excitatory responses to reward even when reward is predicted (Cohen et al. 2015, Li et al. 2016, Liu et al. 2014). (f) DRN GABA neurons are inhibited by reward seeking and activated by aversive stimuli. Green, red, and blue dashed lines indicate the timing of reward cue, reward delivery, and punishment delivery, respectively. Purple dashed lines indicate entry into a reward zone in a sucrose-foraging task. The responses of DRN 5-HT and GABA neurons to unexpected reward and punishment are derived from calcium-imaging fiber photometry experiments. All others are from single-unit electrophysiological recordings.

DA and GABA signaling

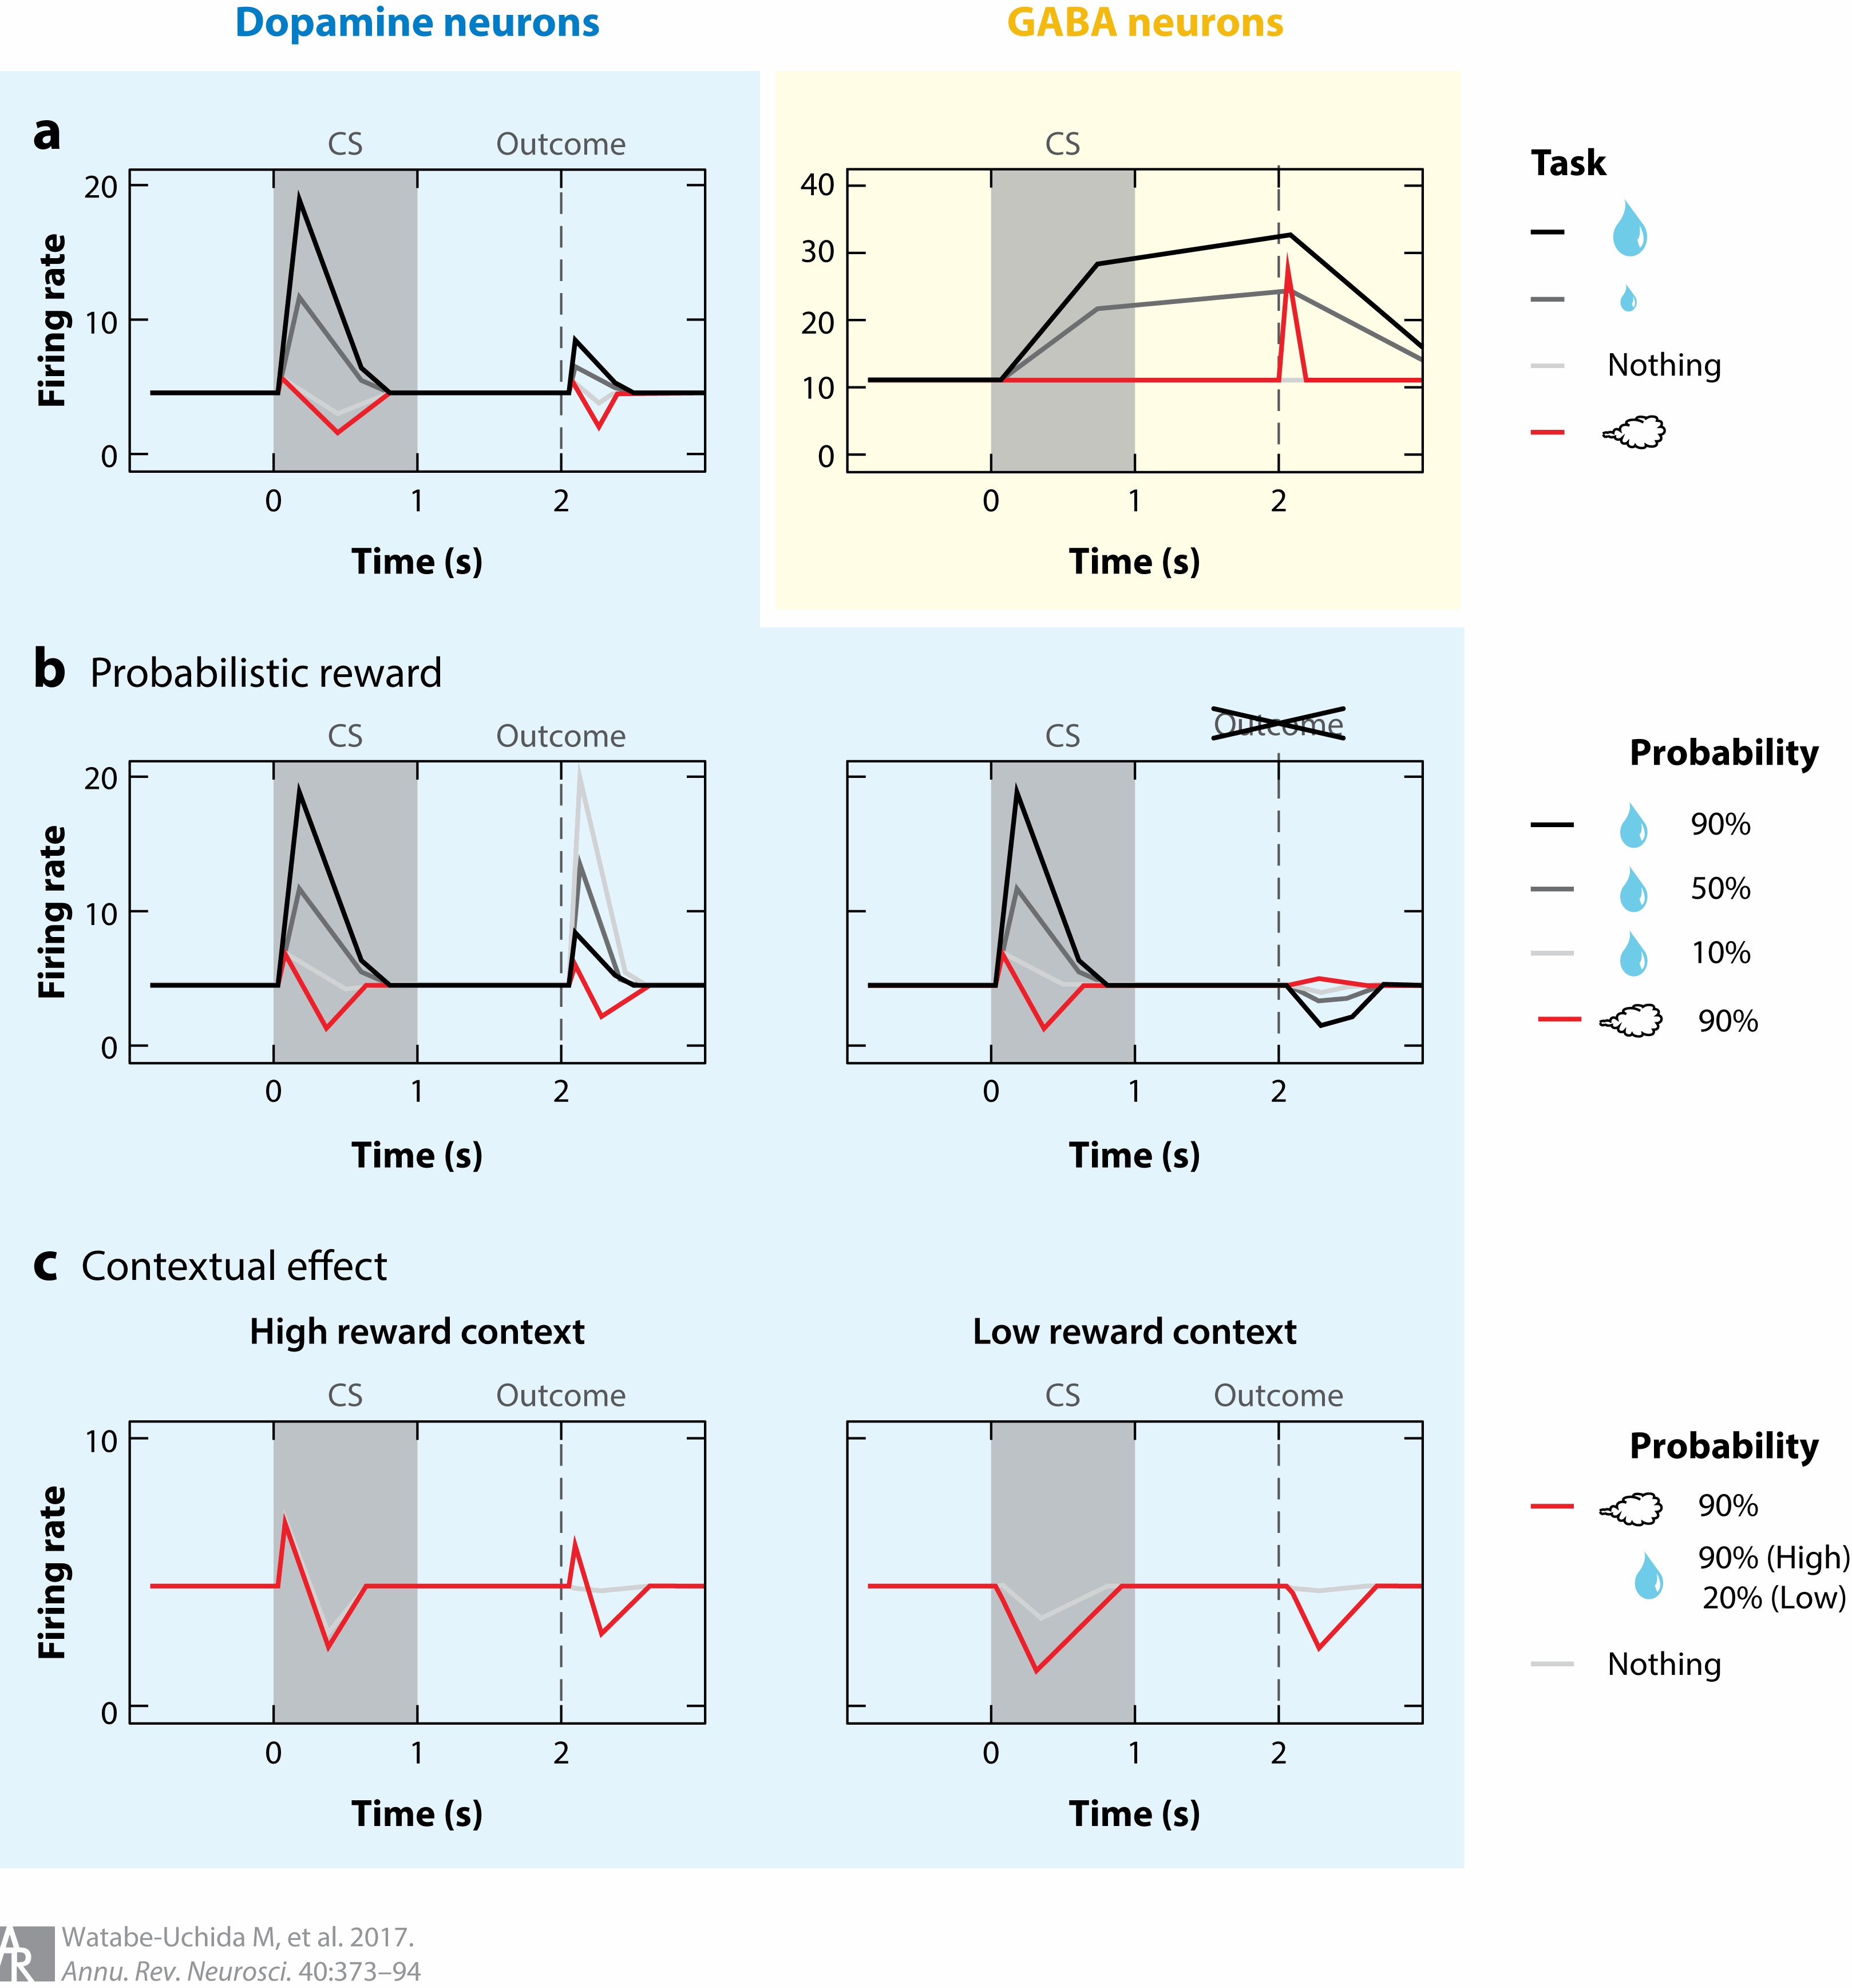
(Watabe-Uchida, Eshel, & Uchida, 2017). Firing patterns of identified dopamine and GABA neurons in VTA. (a) VTA neurons were recorded while mice performed an odor-outcome association task in which different odors predicted different outcomes (see legend on right). Odors were presented for 1 s (gray shading), and outcomes were presented after a 1-s delay. Neuron types were identified based on their optogenetic responses. Dopamine neurons (left) showed phasic excitations to reward-predictive cues and reward. GABA neurons (right) showed sustained activation during the delay. Data from Cohen et al. (2012). (b) Reward expectation modulates dopamine neuron firing. The plot on the left shows when outcome was presented, and the right-hand plot shows when outcome was omitted. Different odors predicted reward with different probabilities. Higher reward probability increased cue responses but suppressed reward responses. Data from Tian & Uchida (2015). Also see Fiorillo et al. (2003) and Matsumoto & Hikosaka (2009a,b). (c) Reward context-dependent modulation of dopamine responses to air puff–predictive cues and air puff. The task conditions during recording differed only in the probability of reward. Dopamine neurons showed both excitation and inhibition in high-reward contexts (left) but only inhibition in low-reward contexts (right). The response in reward trials is not shown. Data from Matsumoto et al. (2016). Abbreviations: CS, conditioned stimulus; VTA, ventral tegmental area.

Expectation modulates DA signaling

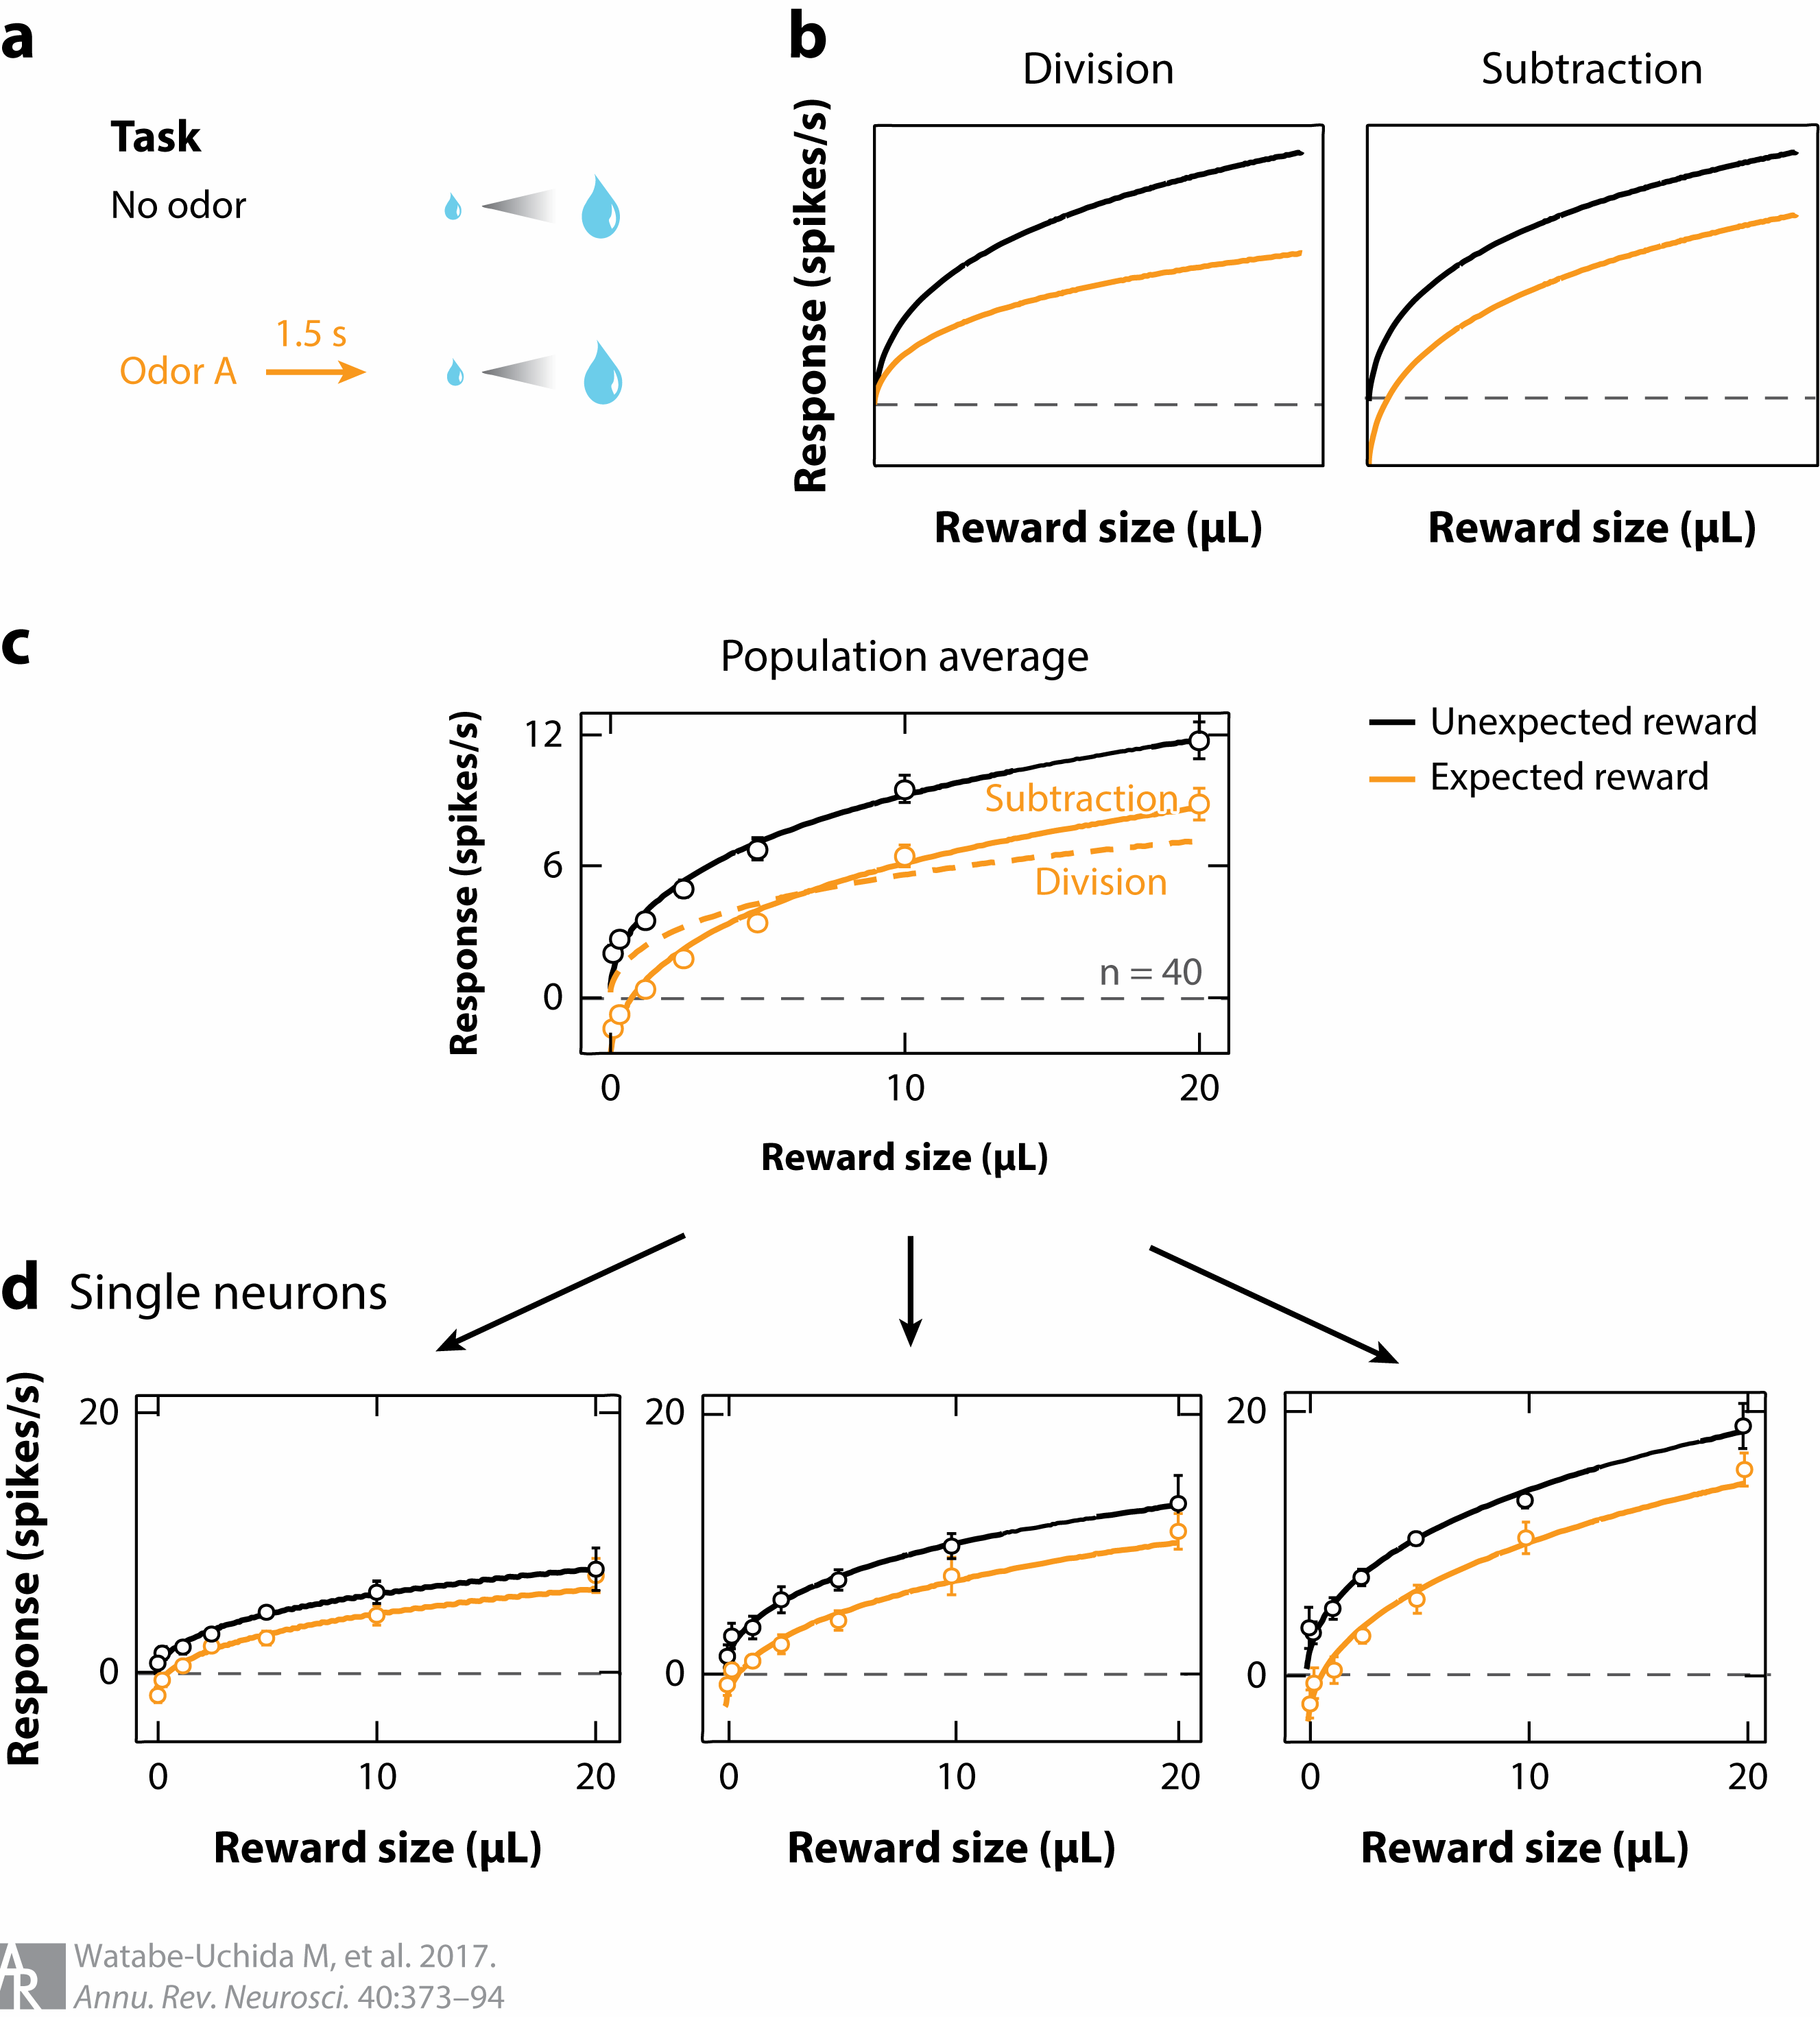
(Watabe-Uchida et al., 2017). Figure 2. Subtractive computation in dopamine neurons. (a) In one task condition (no odor, black), different amounts of reward were presented without any predictive cue. In another condition (odor A, orange), the timing of reward was predicted by an odor. (b) Prediction. Division should change the slope of the curve, whereas subtraction should cause a downward shift. (c) Average response of 40 optogenetically identified dopamine neurons. Prediction caused a subtractive shift. Data from Eshel et al. (2015). (d) Three example neurons. Although individual neurons exhibited diversity with respect to response magnitudes, their response functions were scaled versions of one another. Data from Eshel et al. (2016).

DA network

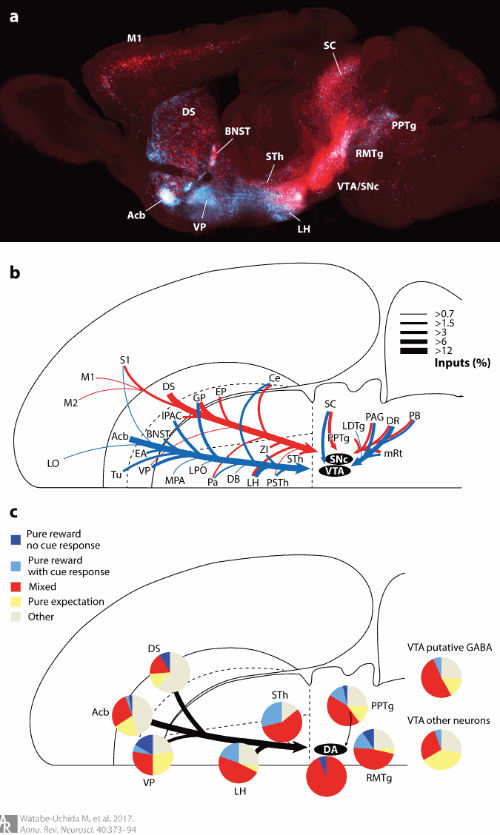
(Watabe-Uchida et al., 2017). Figure 4. Monosynaptic input to dopamine neurons. (a) Monosynaptic inputs to VTA and SNc dopamine neurons (blue and red, respectively). Inputs were labeled through transsynaptic retrograde tracing using rabies virus. Data from Watabe-Uchida et al. (2012). (b) Schematic summary of panel a. The thickness of each line indicates the extent of inputs from each area (percentage of total inputs). (c) Firing patterns of monosynaptic inputs in a classical conditioning paradigm. Monosynaptic inputs to dopamine neurons were labeled by channelrhodopsin-2 using rabies virus. Optogenetics were used to identify these inputs in seven brain areas while mice performed a task. Data from Tian et al. (2016). Abbreviations: Acb, nucleus accumbens; BNST, bed nucleus of stria terminalis; Ce, central amygdala; DA, dopamine; DB, diagonal band of Broca; DR, dorsal raphe; DS, dorsal striatum; EA, extended amygdala; EP, entopeduncular nucleus (internal segment of the globus pallidus); GP, globus pallidus (external segment of the globus pallidus); IPAC, interstitial nucleus of the posterior limb of the anterior commissure; LDTg, laterodorsal tegmental nucleus; LH, lateral hypothalamus; LO, lateral orbitofrontal cortex; LPO, lateral preoptic area; M1, primary motor cortex; M2, secondary motor cortex; MPA, medial preoptic area; mRt, reticular formation; Pa, paraventricular hypothalamic nucleus; PAG, periaqueductal gray; PB, parabrachial nucleus; PPTg, pedunculopontine tegmental nucleus; PSTh, parasubthalamic nucleus; RMTg, rostromedial tegmental nucleus; S1, primary somatosensory cortex; SC, superior colliculus; SNc, substantia nigra pars compacta; STh, subthalamic nucleus; Tu, olfactory tubercle; VP, ventral pallidum; VTA, ventral tegmental area; ZI, zona incerta.

Reward & Aversion Networks

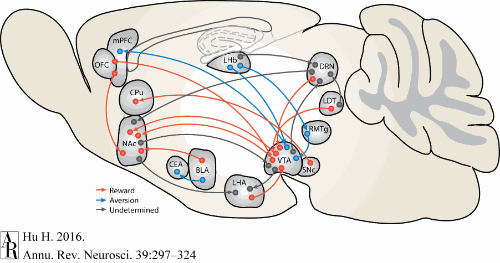
(Hu, 2016). A simplified schematic summarizing the reward-mediating (red) and aversion-mediating (blue) neural pathways that have been verified by recent optogenetics-based behavioral studies. Prominent pathways that are implicated but unverified in reward and aversion are also delineated (gray) (Beier et al. 2015; Britt et al. 2012; Humphries & Prescott 2010; Kirouac et al. 2004; Lammel et al. 2012; Lerner et al. 2015; Liu et al. 2014; Luo et al. 2015; McDevitt et al. 2014; Namburi et al. 2015a,b; Nieh et al. 2015; Qi et al. 2014; Sesack & Grace 2010; Stuber & Wise 2016; Stuber et al. 2011). Abbreviations: BLA, basolateral amygdala; CEA, central amygdala; CPu, caudate putamen; DRN, dorsal raphe nucleus; LDT, laterodorsal tegmental nucleus; LHA, lateral hypothalamus; LHb, lateral habenula; mPFC, medial prefrontal cortex; NAc, nucleus accumbens; OFC, orbitofrontal cortex; RMTg, rostromedial tegmental nucleus; SNc, substantia nigra pars compacta; VTA, ventral tegmental area.

Psychopharmacology

  • Dopamine (DA)
  • Serotonin (5-HT), Norepinephrine (NE/NA)
  • Acetylcholine (ACh)
Note

Motor neurons release ACh onto muscle fibers in the PNS. Here, their role is as neuromodulator in the CNS.

  • Opioids, endogenous morphine-like NTs (endorphins)
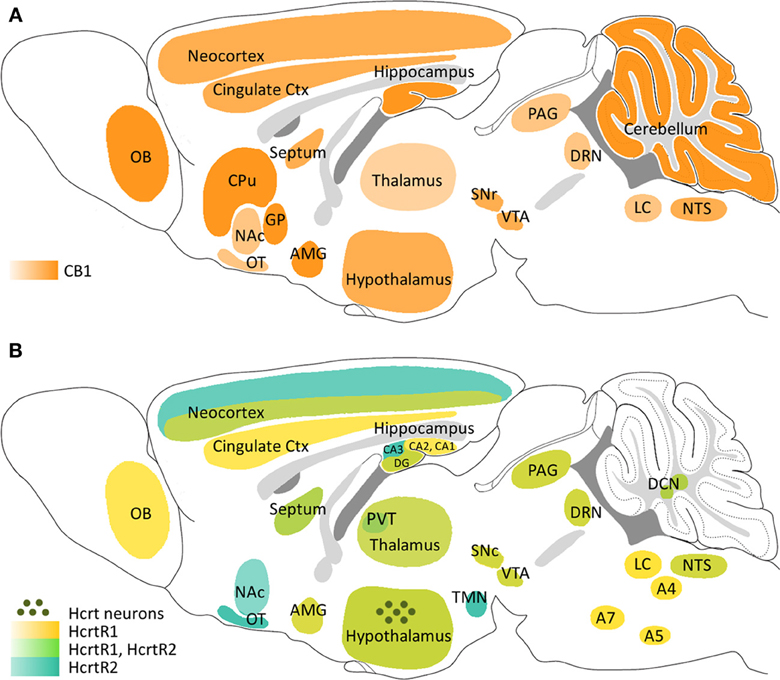
  • Cannabinoids = psychoactive compounds found in cannibis
  • Endocannabinoids (endogenous cannabinoid system)
    • Cannabinoid CB1 receptors in CNS; CB2 in body, immune system
References

ashikkerib. (2007, December). Brain mechanisms of pleasure and addiction. Youtube. Retrieved from https://www.youtube.com/watch?v=de_b7k9kQp0
Brandão, M. L., Zanoveli, J. M., Ruiz-Martinez, R. C., Oliveira, L. C., & Landeira-Fernandez, J. (2008). Different patterns of freezing behavior organized in the periaqueductal gray of rats: Association with different types of anxiety. Behavioural Brain Research, 188(1), 1–13. https://doi.org/10.1016/j.bbr.2007.10.018
Clapp, P., Bhave, S. V., & Hoffman, P. L. (n.d.). How Adaptation of the Brain to Alcohol Leads to Dependence. Retrieved from http://pubs.niaaa.nih.gov/publications/arh314/310-339.htm
Cock, V. C. D., Vidailhet, M., & Arnulf, I. (2008). Sleep disturbances in patients with parkinsonism. Nature Clinical Practice Neurology, 4(5), 254–266. https://doi.org/10.1038/ncpneuro0775
daleswartzentruber. (2007, October). Conditioned suppression of a rat’s lever pressing. Youtube. Retrieved from https://www.youtube.com/watch?v=ZlZekx1P1g4
Davis, M. (1992). The role of the amygdala in fear-potentiated startle: Implications for animal models of anxiety. Trends in Pharmacological Sciences, 13, 35–41. https://doi.org/10.1016/0165-6147(92)90014-W
Flores, Á., Maldonado, R., & Berrendero, F. (2013). Cannabinoid-hypocretin cross-talk in the central nervous system: What we know so far. Neuropharmacology, 7, 256. https://doi.org/10.3389/fnins.2013.00256
Heath, R. G. (1963). Electrical self-stimulation of the brain in man. American Journal of Psychiatry, 120(6), 571–577. https://doi.org/10.1176/ajp.120.6.571
Hu, H. (2016). Reward and aversion. Annual Review of Neuroscience, 39, 297–324. https://doi.org/10.1146/annurev-neuro-070815-014106
Kadmiel, M., & Cidlowski, J. A. (2013). Glucocorticoid receptor signaling in health and disease. Trends in Pharmacological Sciences, 34(9), 518–530. https://doi.org/10.1016/j.tips.2013.07.003
Kohls, G., Chevallier, C., Troiani, V., & Schultz, R. T. (2012). Social ‘wanting’dysfunction in autism: Neurobiological underpinnings and treatment implications. Journal of Neurodevelopmental Disorders, 4(10), 1–20. https://doi.org/10.1186/1866-1955-4-10
Kringelbach, M. L., & Berridge, K. C. (2009). Towards a functional neuroanatomy of pleasure and happiness. Trends in Cognitive Sciences, 13(11), 479–487.
Lindquist, K. A., Wager, T. D., Kober, H., Bliss-Moreau, E., & Barrett, L. F. (2012). The brain basis of emotion: A meta-analytic review. Behav. Brain Sci., 35(3), 121–143. https://doi.org/10.1017/S0140525X11000446
Medina, J. F., Repa, J. C., Mauk, M. D., & LeDoux, J. E. (2002). Parallels between cerebellum-and amygdala-dependent conditioning. Nature Reviews Neuroscience, 3(2), 122–131. https://doi.org/10.1038/nrn728
Milner, P. M. (1989). The discovery of self-stimulation and other stories. Neuroscience & Biobehavioral Reviews, 13(2–3), 61–67. https://doi.org/10.1016/S0149-7634(89)80013-2
Musazzi, L., Tornese, P., Sala, N., & Popoli, M. (2017). Acute or chronic? A stressful question. Trends in Neurosciences. https://doi.org/10.1016/j.tins.2017.07.002
Nestler, E. J., & Carlezon, W. A. (2006). The mesolimbic dopamine reward circuit in depression. Biological Psychiatry, 59(12), 1151–1159. https://doi.org/10.1016/j.biopsych.2005.09.018
Nummenmaa, L., Glerean, E., Hari, R., & Hietanen, J. K. (2014). Bodily maps of emotions. Proceedings of the National Academy of Sciences of the United States of America, 111(2), 646–651. https://doi.org/10.1073/pnas.1321664111
Pellman, B. A., & Kim, J. J. (2016). What can ethobehavioral studies tell us about the brain’s fear system? Trends in Neurosciences, 39(6), 420–431. https://doi.org/10.1016/j.tins.2016.04.001
Siegel, E. H., Sands, M. K., Van den Noortgate, W., Condon, P., Chang, Y., Dy, J., … Barrett, L. F. (2018). Emotion fingerprints or emotion populations? A meta-analytic investigation of autonomic features of emotion categories. Psychological Bulletin, 144(4), 343–393. https://doi.org/10.1037/bul0000128
Watabe-Uchida, M., Eshel, N., & Uchida, N. (2017). Neural circuitry of reward prediction error. Annual Review of Neuroscience, 40, 373–394. https://doi.org/10.1146/annurev-neuro-072116-031109