Findings: Data viz in psych sci

Published

January 21, 2025

Modified

January 21, 2025

About

This page extracts information about the data visualizations we explored in Exercise-01 from the shared Google Sheet.

Survey

Direct link: https://docs.google.com/spreadsheets/d/1X-3kWpGAACdkAJ8-AeqYiu5TS6tRzpfdgXBYyPooCPo/edit?gid=0#gid=0

Preparation

First, we load the external packages (groups of R commands) that we will be using.

Important

The code uses the quietly() function from the purrr package to suppress most of the feedback.

Code
library('ggplot2')
library('dplyr')

r_functions <- list.files(file.path(here::here(), "src", "R"), "\\.R$", full.names = TRUE)

purrr::map(r_functions, source) |>
  purrr::quietly()
function (...) 
capture_output(.f(...))
<bytecode: 0x10e74a4e8>
<environment: 0x10e74a210>

Gathering

Next, we download the data from the Google Sheet where it is collected. Dr. Gilmore has stored his Google account credentials in a special environment file that can be accessed by the R command Sys.getenv("GMAIL_SURVEY").

Tip

It’s vital to be very careful when creating and sharing code like this that involves sensitive information like login credentials.

Gilmore likes to put credentials in an .Renviron file that lives in his home directory. This is a recommended practice. On Mac OS and Linux, that’s ~/.Renviron. You can use the usethis::edit_r_profile() command at the R console (not the Terminal) to open your own .Renviron file. In Gilmore’s case, he has added the following line to that file:

GMAIL_SURVEY="<my-google-account>"

Here, he has substituted his Google account with credentials/access to the required files for <my-google-account>. Then, when the R code below calls Sys.getenv("GMAIL_SURVEY"), the value of those credentials is returned as a text string.

Make sure to close and save the .Renviron file and restart your R session before testing this yourself.
Code
if (!dir.exists('csv')) {
  message("Creating missing `csv/`.")
  dir.create("csv")
}

if (params$update_data) {
  options(gargle_oauth_email = Sys.getenv("GMAIL_SURVEY"))
  googledrive::drive_auth()

  googledrive::drive_download(
    "PSYCH-490.003-Spr-2025-Psych-Viz",
    path = file.path("csv", params$fn),
    type = "csv",
    overwrite = TRUE
  )
  message("Data updated.")
} else {
  message("Using stored data.")
}

The data file has been saved as a comma-separated value (CSV) format data file in a special directory called csv/.

Note

Because these data might contain sensitive or identifiable information, we only keep a local copy and do not share it publicly via GitHub. This is achieved by adding the name of the data directory to a special .gitignore file.

Cleaning

Next we load the saved data file, and then proceed to clean it.

Code
ex01 <-
  readr::read_csv(file.path("csv", params$fn), show_col_types = FALSE)

There are 81 responses.

These are the column/variable names.

Code
# Google Forms puts the full question in the top row of the data file.
# We use the names() function to extract and print the original questions.
ex01_qs <- names(ex01)
ex01_qs
[1] "identifier"    "source_type"   "url_to_src"    "why_selected" 
[5] "comment"       "url_to_figure"

For simplicity, we visualize below only those with non-empty URLs to the specific figure.

Summary data

Code
figs_w_urls <- ex01 |>
  filter(!is.na(url_to_figure))

There were n=22 unique respondents.

Of the 81 responses from these individuals or teams, n=56 had URLs we could link to directly.

Figures found

Code
these_figs <- ex01 |>
  filter(!is.na(url_to_figure))

res <- invisible(lapply(1:dim(these_figs)[1], return_img_chunk, df = these_figs))
cat(unlist(res), sep = "\n")

Figure 1

https://www.psychologicalscience.org/observer/teaching-current-directions-in-psychological-science-27#lives

Analyst Source Type Why Selected
rog1 web_site NA
Comments
NA

Figure 2

https://journals.sagepub.com/doi/full/10.1177/21677026241301298

Analyst Source Type Why Selected
rog1 article ROC figures are used only in specialized contexts
Comments
More info about sensitivity and specificity: https://en.wikipedia.org/wiki/Sensitivity_and_specificity

Figure 3

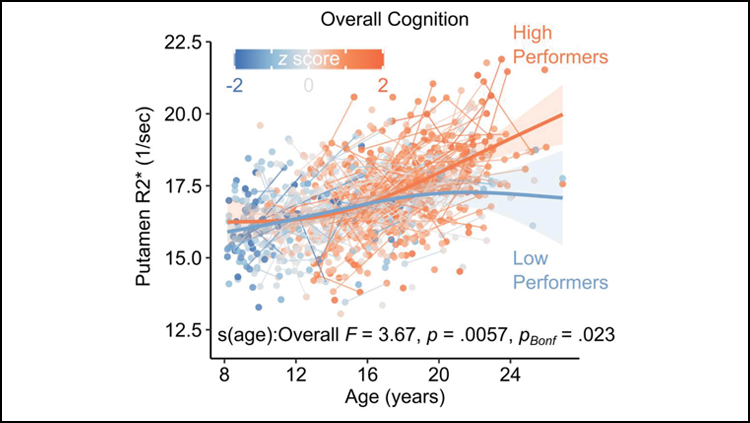
https://www.sfn.org/publications/latest-news/2020/01/27/the-brain-may-need-iron-for-healthy-cognitive-development

Analyst Source Type Why Selected
bre1 article I was drawn in to the topic examining the impact of iron on cognitive development and found the scatterplot to be very informative, however a bit difficult to interpret at first glance.
Comments
NA

Figure 4

https://psycnet.apa.org/fulltext/2025-31206-001.pdf?auth_token=7fcec614b0825ba1032680320e7e094213c3f483

Analyst Source Type Why Selected
bre1 article I enjoyed the mindmap used within the article, I felt it was very digestible to the public eye and conveyed the meaning and significance of the topic.
Comments
NA

Figure 5

https://psycnet.apa.org/doiLanding?doi=10.1037%2Fdev0001841

Analyst Source Type Why Selected
bre1 article The conceptual diagram caught my eye as it provided a great visual of the upward incline and the severity of this effect.
Comments
NA

Figure 6

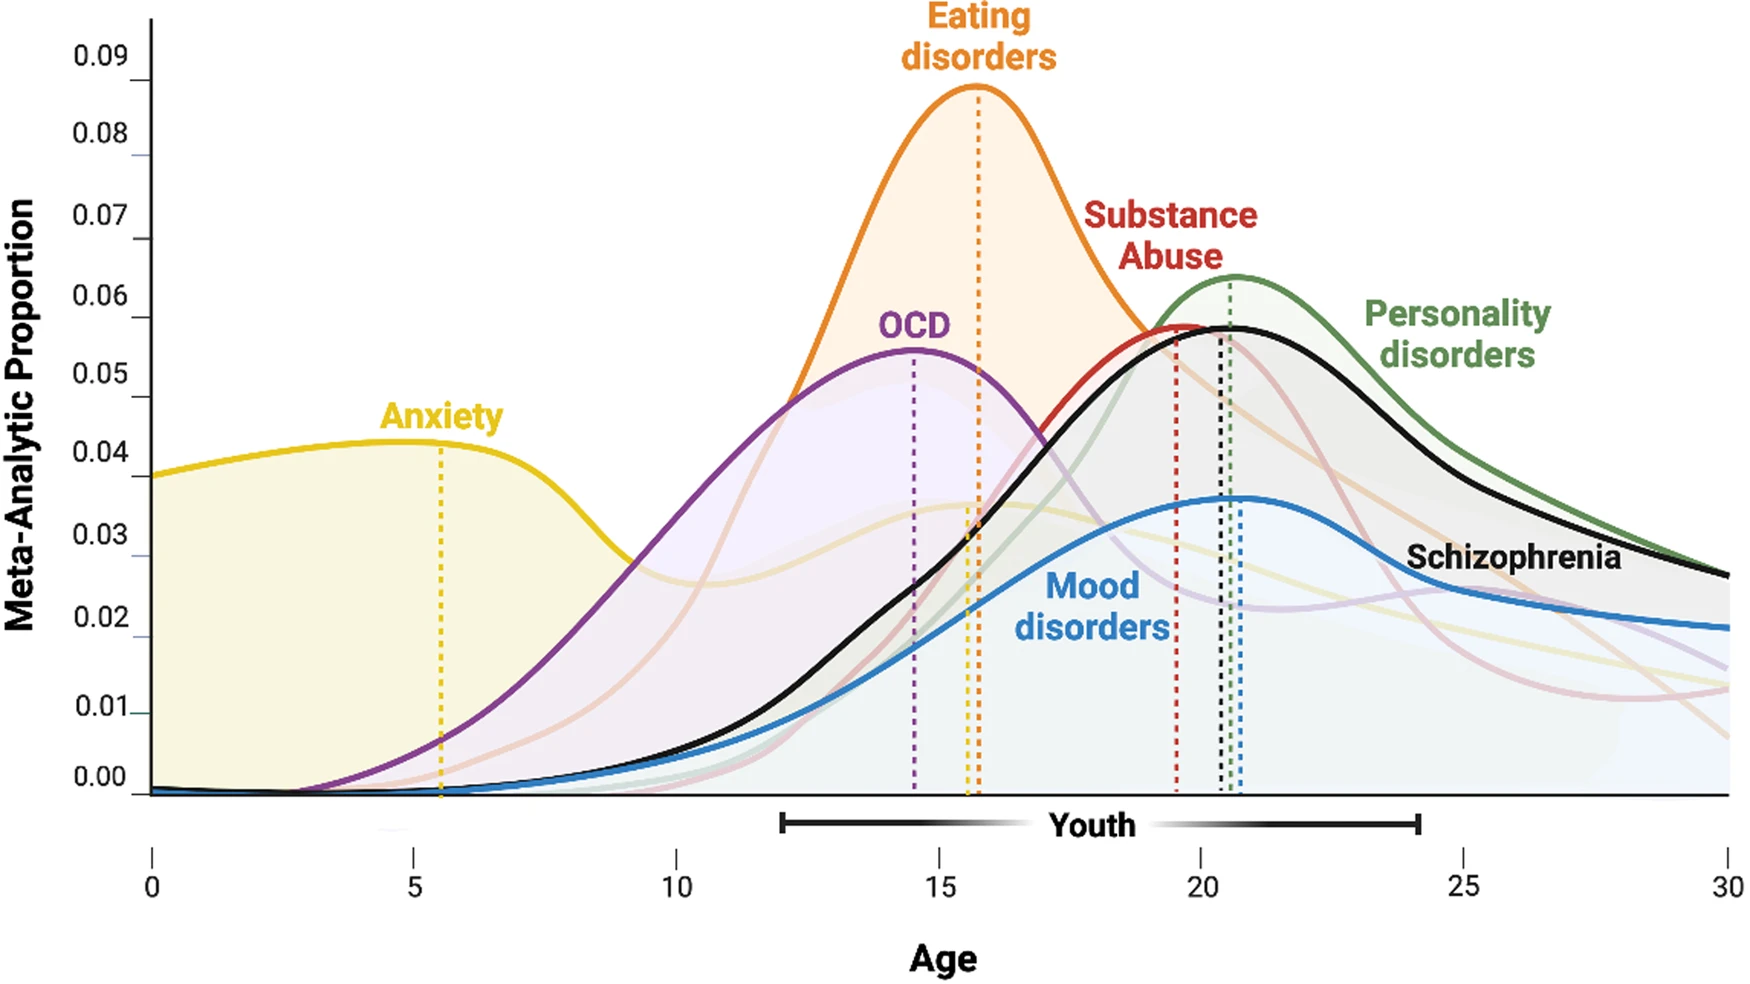
https://www.nature.com/articles/s41380-023-02202-z/figures/1

Analyst Source Type Why Selected
tjd1 article I thought this visualization was about an interesting topic, and also enjoyed exploring story it tells - the ages of onset for various mental illnesses in young people.
Comments
NA

Figure 7

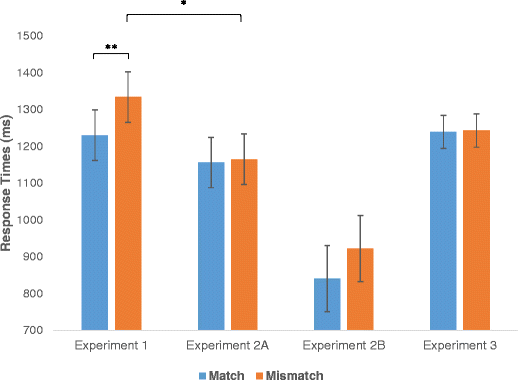
https://www.eneuro.org/content/11/10/ENEURO.0210-24.2024/tab-figures-data

Analyst Source Type Why Selected
ilw 1 article Illusionism and visual processing.
Comments
NA

Figure 8

https://journals.sagepub.com/cms/10.1177/0956797618761373/asset/images/large/10.1177_0956797618761373-fig2.jpeg

Analyst Source Type Why Selected
ilw 1 article Children Cognitive ability in relation to parents’ judgement
Comments
NA

Figure 9

https://srcd.onlinelibrary.wiley.com/cms/asset/907c790a-fabe-474b-b142-3b4799f38ce3/cdev14156-fig-0002-m.png

Analyst Source Type Why Selected
ilw 1 article It’s interesting to see whether people get more enjoyment out of receiving gifts vs giving gifts
Comments
NA

Figure 10

https://journals.sagepub.com/doi/full/10.1177/19485506231204463

Analyst Source Type Why Selected
ayc 1 article Network and mediation/moderation example
Comments
NA

Figure 11

https://www.jneurosci.org/content/44/44/e0231242024/tab-figures-data

Analyst Source Type Why Selected
ayc 1 article Extremely complex and dense visualization
Comments
NA

Figure 12

https://www.jneurosci.org/content/44/37/e2236232024/tab-figures-data

Analyst Source Type Why Selected
ayc 1 article Example of neuroimaging, BOLD signal visualization
Comments
NA

Figure 13

https://journals.sagepub.com/doi/full/10.1177/19485506231211628

Analyst Source Type Why Selected
ayc 1 article Simple comparative visualization
Comments
NA

Figure 14

https://www.apa.org/pubs/reports/stress-in-america/2024/postelection-stress-coping-during-holidays

Analyst Source Type Why Selected
ses1 article I thought the small pictures next to each item was a unique feature that I have not seen on many other graphics of that nature
Comments
NA

Figure 15

https://journals.sagepub.com/doi/10.1177/09567976241286865

Analyst Source Type Why Selected
ses1 article I have never seen this type of visualization with areas of colors surrounding the lines showing the range of values. I think the differences in colors greatly help to distinguish data and show how they may interact
Comments
Figure 5

Figure 16

https://journals.sagepub.com/doi/10.1177/15291006231221978

Analyst Source Type Why Selected
ses1 article I found the separate graph breakdown of number of studies to be very thorough and the differing graphs with different colors ensured that the data could be visualized appropriately based on the category
Comments
Figure 2

Figure 17

https://www.proquest.com/psycarticles/docview/3156133891/B9D8033C647D446CPQ/11?accountid=13158&sourcetype=Scholarly%20Journals

Analyst Source Type Why Selected
ses1 article I appreciate the overlap in the data being shown directly on the same graph to better understand differences in data
Comments
Figure 3

Figure 18

https://www.proquest.com/psycarticles/docview/3108366413/902261B578114B8FPQ/1?accountid=13158&sourcetype=Scholarly%20Journals

Analyst Source Type Why Selected
ses1 article I have never seen this type of visualization with the length of vector used to symbolize data.
Comments
Figure 1

Figure 19

https://www.proquest.com/psycarticles/docview/3156133920/B9D8033C647D446CPQ/13?accountid=13158&sourcetype=Scholarly%20Journals

Analyst Source Type Why Selected
ses1 article This graph distinguishes data by total and direct effect to understand variable significance and I have never seen a graph of this nature.
Comments
Figure 4

Figure 20

https://www.proquest.com/psycarticles/docview/3156133916/B33C55DC844C41DEPQ/1?accountid=13158&sourcetype=Scholarly%20Journals

Analyst Source Type Why Selected
ses1 article I appreciate the distinguishing of demographic by color to quickly identify varying categories of interaction
Comments
Figure 2

Figure 21

https://www.proquest.com/psycarticles/docview/3154909502/298FE26D70EF4859PQ/14?accountid=13158&sourcetype=Scholarly%20Journals

Analyst Source Type Why Selected
ses1 article I think this study researching the differences in number of words men and women speak each day is insightful and I appreciate the further breakdown by age group
Comments
Figures 3-4

Figure 22

https://www.proquest.com/psycarticles/docview/1539480322/FDF2333734CC41FBPQ/9?accountid=13158&sourcetype=Scholarly%20Journals

Analyst Source Type Why Selected
ses1 article I am interested in the relationship between life satisfaction regarding the workplace and I feel this graph concisely presents the data related to life satiafaction in couples after an unemployment event
Comments
Figure 2

Figure 23

https://www.sciencedirect.com/science/article/abs/pii/S0022399923002945?via%3Dihub

Analyst Source Type Why Selected
rta5133 (Rand) article I selected this because it particularly visualizes cross-lagged variables which I thought is interesting. It also has signs such as epsilons to denote residuals and a lot of arrows which I thought merit a second peek.
Comments
NA

Figure 24

https://srcd.onlinelibrary.wiley.com/doi/10.1111/cdev.14152

Analyst Source Type Why Selected
Apf1 article I liked the topic of study and how the data was displayed
Comments
NA

Figure 25

https://link.springer.com/article/10.3758/s13421-017-0708-1?fromPaywallRec=false

Analyst Source Type Why Selected
jxu5065 article NA
Comments
NA

Figure 26

https://www.science.org/doi/10.1126/scirobotics.adn3802

Analyst Source Type Why Selected
jxu5065 article NA
Comments
NA

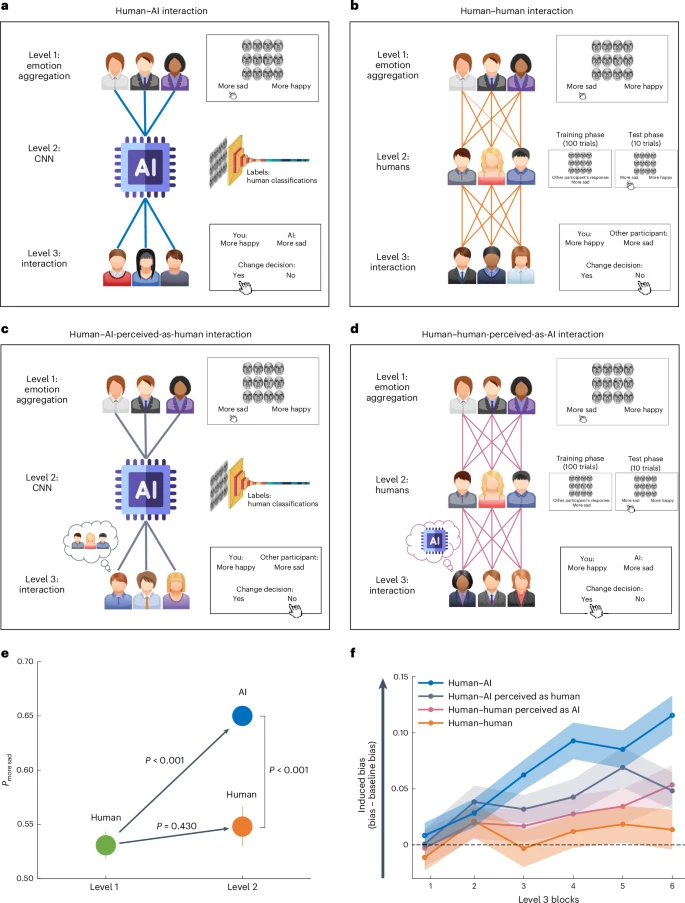
Figure 27

https://www.nature.com/articles/s41562-024-02077-2

Analyst Source Type Why Selected
NMSL article The relation between AI and human communication is clearly showed.
Comments
NA

Figure 28

https://www.nature.com/articles/s41598-024-75262-y?fromPaywallRec=false

Analyst Source Type Why Selected
NMSL article NA
Comments
NA

Figure 29

https://journals.sagepub.com/doi/epub/10.1177/21677026221121762

Analyst Source Type Why Selected
ssw, hrq, tjd Journal NA
Comments
Figure 1

Figure 30

https://journals.sagepub.com/stoken/default+domain/10.1177%2F15291006211051956-FREE/pdf

Analyst Source Type Why Selected
ssw,hrq, tjd website This journal explains what creating effective visuals for data communication and research.
Comments
figure 1: This is useful to understanding how visuals affect the growth of data.

Figure 31

https://www.nature.com/articles/s41380-023-02202-z/figures/1

Analyst Source Type Why Selected
ssw,hrq, tjd article I thought this visualization was about an interesting topic, and also enjoyed exploring story it tells - the ages of onset for various mental illnesses in young people.
Comments
From Society of Research on Adolesence

Figure 32

https://www.tandfonline.com/doi/full/10.1080/15622975.2022.2112074#d1e584

Analyst Source Type Why Selected
Kmm article The flow chart shows the conceptual steps that a “lifestyle-based” mental health care provider would use
Comments
APA

Figure 33

https://www.nature.com/articles/s41586-024-08359-z

Analyst Source Type Why Selected
Kmm article This chart clearly shows the comparison of errors between languages that the program was created to know
Comments
Nature (Journal)

Figure 34

https://www.nature.com/articles/s41586-024-08423-8

Analyst Source Type Why Selected
Kmm article This “Image” shows 8 different graphs and charts that help to paint the whole picture of the validation of MAVs and PVVs in regards to the prolonged persistence of mutagenic DNA lesions in somatic cells
Comments
Nature (Journal)

Figure 35

https://www.nature.com/articles/s41562-024-02077-2

Analyst Source Type Why Selected
Kmm article This image shows the interaction between AI and humans through flow charts and points plotted on a graph
Comments
Nature Human Behavior (Journal)

Figure 36

https://www.nature.com/articles/s41562-024-02061-w

Analyst Source Type Why Selected
Kmm article This image shows 3 different types of visualizations of the data regarding reporting-error-adjusted participation weights
Comments
Nature Human Behavior (Journal)

Figure 37

https://iovs.arvojournals.org/article.aspx?articleid=2793527

Analyst Source Type Why Selected
mec article This figure shows an easy to understand representation for the experiment taking place of a drug injection into the eye with results of leakage
Comments
Figure 1

Figure 38

https://www.apa.org/news/press/releases/stress/2023/collective-trauma-recovery

Analyst Source Type Why Selected
mec article Figure clearly puts data into seperate visual categories to make their point on stress levels pre pandemic vs post pandemic by age specifically
Comments
Figure 2

Figure 39

https://www.tandfonline.com/doi/full/10.1080/00221325.2024.2400362#d1e771

Analyst Source Type Why Selected
abc article This figure is interesting because it shows the association between teacher-student relationship quality and maternal depressive symptoms and children’t externalizing behavior problem. This shows the importance of maternal depressive symptom to teacher-student relationship.
Comments
Figure 4

Figure 40

https://onlinelibrary-wiley-com.ezaccess.libraries.psu.edu/doi/10.1002/dys.1790

Analyst Source Type Why Selected
abc article This figure shows an word cloud of 25 interviews on raising awareness of dyslexia, it shows a simple photo that has the result of 25 interviews
Comments
Figure 1

Figure 41

https://onlinelibrary.wiley.com/doi/full/10.1111/jora.13045

Analyst Source Type Why Selected
abc article This figure shows how adolescent with elevated depression before and during the COVID-19 will more likely to be in the high risk profile.
Comments
Figure 3

Figure 42

https://onlinelibrary.wiley.com/doi/full/10.1111/jora.13052

Analyst Source Type Why Selected
abc article This figure shows the correlation of LGBTQ+ state policies and mental health symptomology with other factors like school safety, peer victimization, and others.
Comments
Figure 1

Figure 43

https://myscp-onlinelibrary-wiley-com.ezaccess.libraries.psu.edu/doi/10.1002/jcpy.1446

Analyst Source Type Why Selected
abc article This figure shows the anticipated negative impact on the relationship between gift given on time and late, from gift recipient and gift giver.
Comments
Figure 2

Figure 44

https://journals-sagepub-com.ezaccess.libraries.psu.edu/doi/10.1177/1077801212440017

Analyst Source Type Why Selected
abc article This figure shows the rate of reports and arrest for forcible rape per 100,000 U.S. inhabitants. It shows how there is a large amount of reported rape compared to a small amount of arrest
Comments
Figure 2

Figure 45

https://www.apa.org/pubs/reports/practitioner/2024

Analyst Source Type Why Selected
zw website The graph is about the frequency of AI usage for psychologists at different career stage and I find that interesting
Comments
NA

Figure 46

https://www.apa.org/monitor/2024/01/trends-pathways-access-mental-health-care

Analyst Source Type Why Selected
zw website The figure shows 90% of the public believe there’s a mental health crisis in the US but a lot of the people I know dont even believe in mental health issues
Comments
NA

Figure 47

<Self‐reported alcohol consumption during participation in a text messaging‐based online drinking moderation platform - Vadhan - 2024 - Alcohol, Clinical and Experimental Research - Wiley Online Library>

Analyst Source Type Why Selected
zw article I am working on a lab projject that is related to drinking
Comments
NA

Figure 48

https://journals.sagepub.com/doi/10.1177/1077801212440017

Analyst Source Type Why Selected
zw article This figure is about reports of forcible rape to law enforcement and the number of arrests resulted, as a woman I care about this kind of issue
Comments
Figure 2

Figure 49

https://featuredcontent.psychonomic.org/color-me-impressed-psychology-research-links-colors-and-emotions-for-over-a-century/

Analyst Source Type Why Selected
Rta5133(Rand) News article I thought they very intellignetly modeled the participants connection of color and emotion
Comments
NA

Figure 50

https://featuredcontent.psychonomic.org/neural-processing-of-sarcasm-hows-that-for-a-great-title/

Analyst Source Type Why Selected
Rta5133 (Rand) News article I thought they did a very good job to represent the brain activity results in an intuitive manner
Comments
NA

Figure 51

https://featuredcontent.psychonomic.org/neural-processing-of-sarcasm-hows-that-for-a-great-title/

Analyst Source Type Why Selected
abc article The information shown on the figure is interesting because it shows the weighted mean of trust in scientist across countries and religion
Comments
Figure 1

Figure 52

https://www.nature.com/articles/s41562-024-02071-8

Analyst Source Type Why Selected
abc article This figure shows the nut-cracking efficiency of the chimpanzees.
Comments
Figure 3

Figure 53

https://www.nature.com/articles/s41586-024-08375-z

Analyst Source Type Why Selected
abc article This figure shows the pattern of extinction risk in tetrapods and freshwater species
Comments
Figure 1

Figure 54

https://www.nature.com/articles/s41586-024-08448-z

Analyst Source Type Why Selected
abc article This figure shows the percentage of catch with different levels of rights devolution in formally governed SSF
Comments
Figure 3

Figure 55

https://www.cell.com/trends/cognitive-sciences/fulltext/S1364-6613(21)00051-6

Analyst Source Type Why Selected
abc article This figure shows the percentage of “yes” response of whether the headline were accurate or whether they consider sharing to true and false headlines
Comments
Figure 2a

Figure 56

https://www.cell.com/trends/cognitive-sciences/fulltext/S1364-6613(24)00269-9

Analyst Source Type Why Selected
abc article This figure shows the memory decay in animals studied
Comments
Figure 1c